UNITED STATES
SECURITIES AND EXCHANGE COMMISSION
Washington, D.C. 20549
____________________________
FORM 10-Q
| | | | | |
| ☒ | Quarterly Report pursuant to Section 13 or 15(d) of the Securities Exchange Act of 1934 |
| For the quarterly period ended September 30, 20222023 |
OR
| | | | | |
| ☐ | Transition Report pursuant to Section 13 or 15(d) of the Securities Exchange Act of 1934 |
Commission File Number: 1-11859
____________________________
PEGASYSTEMS INC.
(Exact name of Registrant as specified in its charter)
____________________________ | | | | | |
| Massachusetts | 04-2787865 |
| (State or other jurisdiction of incorporation or organization) | (IRS Employer Identification No.) |
One Main Street, Cambridge, MA 02142
(Address of principal executive offices, including zip code)
(617) 374-9600
(Registrant’s telephone number, including area code)
____________________________
Securities registered pursuant to Section 12(b) of the Act: | | | | | | | | |
| Title of each class | Trading symbol(s) | Name of each exchange on which registered |
| Common Stock, $.01 par value per share | PEGA | NASDAQ Global Select Market |
Indicate by check mark whether the Registrant (1) has filed all reports required to be filed by Section 13 or 15(d) of the Securities Exchange Act of 1934 during the preceding 12 months (or for such shorter period that the Registrant was required to file such reports), and (2) has been subject to such filing requirements for the past 90 days. Yes x No ¨
Indicate by check mark whether the Registrant has submitted electronically every Interactive Data File required to be submitted pursuant to Rule 405 of Regulation S-T during the preceding 12 months (or for such shorter period that the Registrant was required to submit such files). Yes x No ¨
Indicate by check mark whether the Registrant is a large accelerated filer, an accelerated filer, a non-accelerated filer, a smaller reporting company, or an emerging growth company. See the definitions of “large accelerated filer,” “accelerated filer,” “smaller reporting company,” and “emerging growth company” in Rule 12b-2 of the Exchange Act. | | | | | | | | | | | | | | | | | | | | | | | | | | | | | |
| Large accelerated filer | x | Accelerated filer | ☐ | Non-accelerated filer | ☐ | Smaller reporting company | ☐ | Emerging growth company | ☐ |
If an emerging growth company, indicate by check mark if the Registrant has elected not to use the extended transition period for complying with any new or revised financial accounting standards provided pursuant to Section 13(a) of the Exchange Act. ☐
Indicate by check mark whether the Registrant is a shell company (as defined in Rule 12b-2 of the Exchange Act). Yes ☐ No ☒
There were 82,190,95783,555,919 shares of the Registrant’s common stock, $0.01 par value per share, outstanding on October 19, 2022.17, 2023.
PEGASYSTEMS INC.
QUARTERLY REPORT ON FORM 10-Q
TABLE OF CONTENTS
| | | | | |
| Page |
| PART I - FINANCIAL INFORMATION |
| |
| Item 1. Financial Statements | |
Unaudited Condensed Consolidated Balance Sheets as of September 30, 20222023 and December 31, 20212022 | |
Unaudited Condensed Consolidated Statements of Operations for the three and nine months ended September 30, 20222023 and 20212022 | |
Unaudited Condensed Consolidated Statements of Comprehensive (Loss) for the three and nine months ended September 30, 20222023 and 20212022 | |
Unaudited Condensed Consolidated Statements of Stockholders’ Equity for the nine months ended September 30, 20222023 and 20212022 | |
Unaudited Condensed Consolidated Statements of Cash Flows for the nine months ended September 30, 20222023 and 20212022 | |
| Notes to Unaudited Condensed Consolidated Financial Statements | |
| Item 2. Management’s Discussion and Analysis of Financial Condition and Results of Operations | |
| Item 3. Quantitative and Qualitative Disclosures About Market Risk | |
| Item 4. Controls and Procedures | |
| |
| PART II - OTHER INFORMATION |
| |
| Item 1. Legal Proceedings | |
| Item 1A. Risk Factors | |
| Item 2. Unregistered Sales of Equity Securities and Use of Proceeds | |
| Item 5. Other Information | |
| Item 6. Exhibits | |
| |
| Signature | |
PART I - FINANCIAL INFORMATION
ITEM 1. FINANCIAL STATEMENTS
| PEGASYSTEMS INC. UNAUDITED CONDENSED CONSOLIDATED BALANCE SHEETS (in thousands) | PEGASYSTEMS INC. UNAUDITED CONDENSED CONSOLIDATED BALANCE SHEETS (in thousands) | PEGASYSTEMS INC. UNAUDITED CONDENSED CONSOLIDATED BALANCE SHEETS (in thousands) |
| | September 30, 2022 | | December 31, 2021 | | September 30, 2023 | | December 31, 2022 |
| Assets | Assets | | | | Assets | | | |
| Current assets: | Current assets: | | Current assets: | |
| Cash and cash equivalents | Cash and cash equivalents | $ | 107,626 | | | $ | 159,965 | | Cash and cash equivalents | $ | 169,023 | | | $ | 145,054 | |
| Marketable securities | Marketable securities | 168,085 | | | 202,814 | | Marketable securities | 167,286 | | | 152,167 | |
| Total cash, cash equivalents, and marketable securities | Total cash, cash equivalents, and marketable securities | 275,711 | | | 362,779 | | Total cash, cash equivalents, and marketable securities | 336,309 | | | 297,221 | |
| Accounts receivable | 139,670 | | | 182,717 | | |
| Unbilled receivables | 182,403 | | | 226,714 | | |
| Accounts receivable, net | | Accounts receivable, net | 168,795 | | | 255,150 | |
| Unbilled receivables, net | | Unbilled receivables, net | 199,948 | | | 213,719 | |
| Other current assets | Other current assets | 62,457 | | | 68,008 | | Other current assets | 71,438 | | | 80,388 | |
| Total current assets | Total current assets | 660,241 | | | 840,218 | | Total current assets | 776,490 | | | 846,478 | |
| Unbilled receivables | 108,285 | | | 129,789 | | |
| Unbilled receivables, net | | Unbilled receivables, net | 73,795 | | | 95,806 | |
| Goodwill | Goodwill | 81,201 | | | 81,923 | | Goodwill | 81,437 | | | 81,399 | |
| Other long-term assets | Other long-term assets | 316,731 | | | 541,601 | | Other long-term assets | 290,807 | | | 333,989 | |
| Total assets | Total assets | $ | 1,166,458 | | | $ | 1,593,531 | | Total assets | $ | 1,222,529 | | | $ | 1,357,672 | |
| Liabilities and stockholders’ equity | Liabilities and stockholders’ equity | | | | Liabilities and stockholders’ equity | | | |
| Current liabilities: | Current liabilities: | | Current liabilities: | |
| Accounts payable | Accounts payable | $ | 13,562 | | | $ | 15,281 | | Accounts payable | $ | 20,541 | | | $ | 18,195 | |
| Accrued expenses | Accrued expenses | 61,012 | | | 63,890 | | Accrued expenses | 43,624 | | | 50,355 | |
| Accrued compensation and related expenses | Accrued compensation and related expenses | 85,999 | | | 120,946 | | Accrued compensation and related expenses | 93,511 | | | 127,728 | |
| Deferred revenue | Deferred revenue | 245,146 | | | 275,844 | | Deferred revenue | 297,067 | | | 325,212 | |
| Other current liabilities | Other current liabilities | 8,253 | | | 9,443 | | Other current liabilities | 18,038 | | | 17,450 | |
| Total current liabilities | Total current liabilities | 413,972 | | | 485,404 | | Total current liabilities | 472,781 | | | 538,940 | |
| Convertible senior notes, net | Convertible senior notes, net | 592,884 | | | 590,722 | | Convertible senior notes, net | 498,753 | | | 593,609 | |
| Operating lease liabilities | Operating lease liabilities | 82,705 | | | 87,818 | | Operating lease liabilities | 68,874 | | | 79,152 | |
| Other long-term liabilities | Other long-term liabilities | 11,936 | | | 13,499 | | Other long-term liabilities | 14,485 | | | 15,128 | |
| Total liabilities | Total liabilities | 1,101,497 | | | 1,177,443 | | Total liabilities | 1,054,893 | | | 1,226,829 | |
| Commitments and contingencies (Note 14) | | |
| Commitments and contingencies (Note 15) | | Commitments and contingencies (Note 15) | |
| Stockholders’ equity: | Stockholders’ equity: | | Stockholders’ equity: | |
| Preferred stock, 1,000 shares authorized; none issued | Preferred stock, 1,000 shares authorized; none issued | — | | | — | | Preferred stock, 1,000 shares authorized; none issued | — | | | — | |
Common stock, 200,000 shares authorized; 82,164 and 81,712 shares issued and outstanding at September 30, 2022 and December 31, 2021, respectively | 822 | | | 817 | | |
Common stock, 200,000 shares authorized; 83,523 and 82,436 shares issued and outstanding at September 30, 2023 and December 31, 2022, respectively | | Common stock, 200,000 shares authorized; 83,523 and 82,436 shares issued and outstanding at September 30, 2023 and December 31, 2022, respectively | 835 | | | 824 | |
| Additional paid-in capital | Additional paid-in capital | 204,189 | | | 145,810 | | Additional paid-in capital | 343,259 | | | 229,602 | |
| (Accumulated deficit) retained earnings | (111,126) | | | 276,449 | | |
| Accumulated deficit | | Accumulated deficit | (151,370) | | | (76,513) | |
| Accumulated other comprehensive (loss) | Accumulated other comprehensive (loss) | (28,924) | | | (6,988) | | Accumulated other comprehensive (loss) | (25,088) | | | (23,070) | |
| Total stockholders’ equity | Total stockholders’ equity | 64,961 | | | 416,088 | | Total stockholders’ equity | 167,636 | | | 130,843 | |
| Total liabilities and stockholders’ equity | Total liabilities and stockholders’ equity | $ | 1,166,458 | | | $ | 1,593,531 | | Total liabilities and stockholders’ equity | $ | 1,222,529 | | | $ | 1,357,672 | |
See notes to unaudited condensed consolidated financial statements.
| PEGASYSTEMS INC. UNAUDITED CONDENSED CONSOLIDATED STATEMENTS OF OPERATIONS (in thousands, except per share amounts) | PEGASYSTEMS INC. UNAUDITED CONDENSED CONSOLIDATED STATEMENTS OF OPERATIONS (in thousands, except per share amounts) | PEGASYSTEMS INC. UNAUDITED CONDENSED CONSOLIDATED STATEMENTS OF OPERATIONS (in thousands, except per share amounts) |
| | Three Months Ended
September 30, | | Nine Months Ended
September 30, | | Three Months Ended
September 30, | | Nine Months Ended
September 30, |
| | 2022 | | 2021 | | 2022 | | 2021 | | 2023 | | 2022 | | 2023 | | 2022 |
| Revenue | Revenue | | | | | | | | Revenue | | | | | | | |
| Subscription services | Subscription services | $ | 174,885 | | | $ | 161,557 | | | $ | 516,750 | | | $ | 457,051 | | Subscription services | $ | 201,578 | | | $ | 174,885 | | | $ | 586,192 | | | $ | 516,750 | |
| Subscription license | Subscription license | 31,112 | | | 35,421 | | | 210,245 | | | 251,226 | | Subscription license | 74,342 | | | 31,112 | | | 200,066 | | | 210,245 | |
| Consulting | | Consulting | 55,976 | | | 55,511 | | | 167,396 | | | 175,451 | |
| Perpetual license | Perpetual license | 9,223 | | | 2,874 | | | 18,929 | | | 20,922 | | Perpetual license | 2,747 | | | 9,223 | | | 4,729 | | | 18,929 | |
| Consulting | 55,511 | | | 56,416 | | | 175,451 | | | 166,270 | | |
| Total revenue | Total revenue | 270,731 | | | 256,268 | | | 921,375 | | | 895,469 | | Total revenue | 334,643 | | | 270,731 | | | 958,383 | | | 921,375 | |
| Cost of revenue | Cost of revenue | | Cost of revenue | |
| Subscription services | Subscription services | 34,541 | | | 30,817 | | | 103,104 | | | 88,206 | | Subscription services | 35,906 | | | 34,541 | | | 109,553 | | | 103,104 | |
| Subscription license | Subscription license | 628 | | | 606 | | | 1,923 | | | 1,811 | | Subscription license | 629 | | | 628 | | | 1,971 | | | 1,923 | |
| Consulting | | Consulting | 57,204 | | | 57,778 | | | 176,262 | | | 171,162 | |
| Perpetual license | Perpetual license | 103 | | | 50 | | | 173 | | | 151 | | Perpetual license | 24 | | | 103 | | | 51 | | | 173 | |
| Consulting | 57,778 | | | 52,749 | | | 171,162 | | | 161,032 | | |
| Total cost of revenue | Total cost of revenue | 93,050 | | | 84,222 | | | 276,362 | | | 251,200 | | Total cost of revenue | 93,763 | | | 93,050 | | | 287,837 | | | 276,362 | |
| Gross profit | Gross profit | 177,681 | | | 172,046 | | | 645,013 | | | 644,269 | | Gross profit | 240,880 | | | 177,681 | | | 670,546 | | | 645,013 | |
| Operating expenses | Operating expenses | | Operating expenses | |
| Selling and marketing | Selling and marketing | 153,517 | | | 152,479 | | | 472,951 | | | 457,641 | | Selling and marketing | 131,598 | | | 153,517 | | | 425,253 | | | 472,951 | |
| Research and development | Research and development | 75,342 | | | 64,728 | | | 221,173 | | | 191,565 | | Research and development | 74,955 | | | 75,342 | | | 224,262 | | | 221,173 | |
| General and administrative | General and administrative | 26,043 | | | 20,176 | | | 94,530 | | | 57,607 | | General and administrative | 27,321 | | | 26,043 | | | 73,893 | | | 94,530 | |
| Restructuring | | Restructuring | 17,822 | | | — | | | 21,450 | | | — | |
| Total operating expenses | Total operating expenses | 254,902 | | | 237,383 | | | 788,654 | | | 706,813 | | Total operating expenses | 251,696 | | | 254,902 | | | 744,858 | | | 788,654 | |
| (Loss) from operations | (Loss) from operations | (77,221) | | | (65,337) | | | (143,641) | | | (62,544) | | (Loss) from operations | (10,816) | | | (77,221) | | | (74,312) | | | (143,641) | |
| Foreign currency transaction gain (loss) | Foreign currency transaction gain (loss) | 3,826 | | | 518 | | | 8,415 | | | (4,983) | | Foreign currency transaction gain (loss) | 1,994 | | | 3,826 | | | (3,971) | | | 8,415 | |
| Interest income | Interest income | 520 | | | 166 | | | 1,036 | | | 555 | | Interest income | 2,532 | | | 520 | | | 5,831 | | | 1,036 | |
| Interest expense | Interest expense | (1,992) | | | (1,908) | | | (5,882) | | | (5,747) | | Interest expense | (1,533) | | | (1,992) | | | (5,229) | | | (5,882) | |
| (Loss) on capped call transactions | (Loss) on capped call transactions | (6,876) | | | (14,735) | | | (56,381) | | | (7,543) | | (Loss) on capped call transactions | (2,294) | | | (6,876) | | | (449) | | | (56,381) | |
| Other (loss) income, net | (29) | | | 2 | | | 6,497 | | | 108 | | |
| (Loss) before provision for (benefit from) income taxes | (81,772) | | | (81,294) | | | (189,956) | | | (80,154) | | |
| Provision for (benefit from) income taxes | 11,748 | | | (24,826) | | | 190,239 | | | (54,360) | | |
| Other income (loss), net | | Other income (loss), net | 6,383 | | | (29) | | | 18,668 | | | 6,497 | |
| (Loss) before provision for income taxes | | (Loss) before provision for income taxes | (3,734) | | | (81,772) | | | (59,462) | | | (189,956) | |
| Provision for income taxes | | Provision for income taxes | 3,545 | | | 11,748 | | | 15,395 | | | 190,239 | |
| Net (loss) | Net (loss) | $ | (93,520) | | | $ | (56,468) | | | $ | (380,195) | | | $ | (25,794) | | Net (loss) | $ | (7,279) | | | $ | (93,520) | | | $ | (74,857) | | | $ | (380,195) | |
| (Loss) per share | (Loss) per share | | | | | | | | (Loss) per share | | | | | | | |
| Basic | Basic | $ | (1.14) | | | $ | (0.69) | | | $ | (4.65) | | | $ | (0.32) | | Basic | $ | (0.09) | | | $ | (1.14) | | | $ | (0.90) | | | $ | (4.65) | |
| Diluted | Diluted | $ | (1.14) | | | $ | (0.69) | | | $ | (4.65) | | | $ | (0.32) | | Diluted | $ | (0.09) | | | $ | (1.14) | | | $ | (0.90) | | | $ | (4.65) | |
| Weighted-average number of common shares outstanding | Weighted-average number of common shares outstanding | | Weighted-average number of common shares outstanding | |
| Basic | Basic | 81,996 | | | 81,526 | | | 81,842 | | | 81,284 | | Basic | 83,336 | | | 81,996 | | | 82,996 | | | 81,842 | |
| Diluted | Diluted | 81,996 | | | 81,526 | | | 81,842 | | | 81,284 | | Diluted | 83,336 | | | 81,996 | | | 82,996 | | | 81,842 | |
See notes to unaudited condensed consolidated financial statements.
| PEGASYSTEMS INC. UNAUDITED CONDENSED CONSOLIDATED STATEMENTS OF COMPREHENSIVE (LOSS) (in thousands) | PEGASYSTEMS INC. UNAUDITED CONDENSED CONSOLIDATED STATEMENTS OF COMPREHENSIVE (LOSS) (in thousands) | PEGASYSTEMS INC. UNAUDITED CONDENSED CONSOLIDATED STATEMENTS OF COMPREHENSIVE (LOSS) (in thousands) |
| | Three Months Ended
September 30, | | Nine Months Ended
September 30, | | Three Months Ended
September 30, | | Nine Months Ended
September 30, |
| | 2022 | | 2021 | | 2022 | | 2021 | | 2023 | | 2022 | | 2023 | | 2022 |
| Net (loss) | Net (loss) | $ | (93,520) | | | $ | (56,468) | | | $ | (380,195) | | | $ | (25,794) | | Net (loss) | $ | (7,279) | | | $ | (93,520) | | | $ | (74,857) | | | $ | (380,195) | |
| Other comprehensive (loss), net of tax | Other comprehensive (loss), net of tax | | Other comprehensive (loss), net of tax | |
| Unrealized (loss) gain on available-for-sale securities | (73) | | | 53 | | | (1,000) | | | 1,184 | | |
| Unrealized (loss) on available-for-sale securities | | Unrealized (loss) on available-for-sale securities | (40) | | | (73) | | | (281) | | | (1,000) | |
| Foreign currency translation adjustments | Foreign currency translation adjustments | (6,700) | | | (4,400) | | | (20,936) | | | (3,669) | | Foreign currency translation adjustments | (3,687) | | | (6,700) | | | (1,737) | | | (20,936) | |
| Total other comprehensive (loss), net of tax | Total other comprehensive (loss), net of tax | $ | (6,773) | | | $ | (4,347) | | | $ | (21,936) | | | $ | (2,485) | | Total other comprehensive (loss), net of tax | (3,727) | | | (6,773) | | | (2,018) | | | (21,936) | |
| Comprehensive (loss) | Comprehensive (loss) | $ | (100,293) | | | $ | (60,815) | | | $ | (402,131) | | | $ | (28,279) | | Comprehensive (loss) | $ | (11,006) | | | $ | (100,293) | | | $ | (76,875) | | | $ | (402,131) | |
See notes to unaudited condensed consolidated financial statements.
| PEGASYSTEMS INC.
UNAUDITED CONDENSED CONSOLIDATED STATEMENTS OF STOCKHOLDERS’ EQUITY
(in thousands, except per share amounts) | PEGASYSTEMS INC.
UNAUDITED CONDENSED CONSOLIDATED STATEMENTS OF STOCKHOLDERS’ EQUITY
(in thousands, except per share amounts) | PEGASYSTEMS INC.
UNAUDITED CONDENSED CONSOLIDATED STATEMENTS OF STOCKHOLDERS’ EQUITY
(in thousands, except per share amounts) |
| | Common Stock | | Additional
Paid-In Capital | | Retained Earnings (Accumulated Deficit) | | Accumulated Other Comprehensive (Loss) | | Total
Stockholders’ Equity | | Common Stock | | Additional
Paid-In Capital | | Retained Earnings (Accumulated Deficit) | | Accumulated Other Comprehensive (Loss) | | Total
Stockholders’ Equity |
| | Number
of Shares | | Amount | | | Number
of Shares | | Amount | |
| December 31, 2020 | 80,890 | | | $ | 809 | | | $ | 204,432 | | | $ | 339,879 | | | $ | (2,948) | | | $ | 542,172 | | |
Cumulative-effect adjustment from adoption of ASU 2020-06, net | — | | | — | | | (61,604) | | | 9,399 | | | — | | | (52,205) | | |
| Repurchase of common stock | (70) | | | (1) | | | (9,145) | | | — | | | — | | | (9,146) | | |
| Issuance of common stock for stock compensation plans | 402 | | | 4 | | | (25,513) | | | — | | | — | | | (25,509) | | |
| Issuance of common stock under the employee stock purchase plan | 24 | | | — | | | 2,288 | | | — | | | — | | | 2,288 | | |
| Stock-based compensation | — | | | — | | | 30,100 | | | — | | | — | | | 30,100 | | |
| Cash dividends declared ($0.03 per share) | — | | | — | | | — | | | (2,438) | | | — | | | (2,438) | | |
| Other comprehensive income | — | | | — | | | — | | | — | | | 280 | | | 280 | | |
| Net (loss) | — | | | — | | | — | | | (6,617) | | | — | | | (6,617) | | |
| March 31, 2021 | 81,246 | | | $ | 812 | | | $ | 140,558 | | | $ | 340,223 | | | $ | (2,668) | | | $ | 478,925 | | |
| Repurchase of common stock | (81) | | | (1) | | | (10,245) | | | — | | | — | | | (10,246) | | |
| Issuance of common stock for stock compensation plans | 267 | | | 3 | | | (16,199) | | | — | | | — | | | (16,196) | | |
| Issuance of common stock under the employee stock purchase plan | 24 | | | 1 | | | 2,858 | | | — | | | — | | | 2,859 | | |
| Stock-based compensation | — | | | — | | | 30,698 | | | — | | | — | | | 30,698 | | |
| Cash dividends declared ($0.03 per share) | — | | | — | | | — | | | (2,445) | | | — | | | (2,445) | | |
| Other comprehensive income | — | | | — | | | — | | | — | | | 1,582 | | | 1,582 | | |
| Net income | — | | | — | | | — | | | 37,291 | | | — | | | 37,291 | | |
| June 30, 2021 | 81,456 | | | $ | 815 | | | $ | 147,670 | | | $ | 375,069 | | | $ | (1,086) | | | $ | 522,468 | | |
| December 31, 2021 | | December 31, 2021 | 81,712 | | | $ | 817 | | | $ | 145,810 | | | $ | 276,449 | | | $ | (6,988) | | | $ | 416,088 | |
| Repurchase of common stock | Repurchase of common stock | (96) | | | (1) | | | (12,795) | | | — | | | — | | | (12,796) | | Repurchase of common stock | (242) | | | (2) | | | (22,581) | | | — | | | — | | | (22,583) | |
| Issuance of common stock for stock compensation plans | Issuance of common stock for stock compensation plans | 286 | | | 3 | | | (18,117) | | | — | | | — | | | (18,114) | | Issuance of common stock for stock compensation plans | 297 | | | 3 | | | (12,131) | | | — | | | — | | | (12,128) | |
| Issuance of common stock under the employee stock purchase plan | Issuance of common stock under the employee stock purchase plan | 24 | | | — | | | 2,639 | | | — | | | — | | | 2,639 | | Issuance of common stock under the employee stock purchase plan | 35 | | | — | | | 2,446 | | | — | | | — | | | 2,446 | |
| Stock-based compensation | Stock-based compensation | — | | | — | | | 28,701 | | | — | | | — | | | 28,701 | | Stock-based compensation | — | | | — | | | 28,227 | | | — | | | — | | | 28,227 | |
| Cash dividends declared ($0.03 per share) | Cash dividends declared ($0.03 per share) | — | | | — | | | — | | | (2,451) | | | — | | | (2,451) | | Cash dividends declared ($0.03 per share) | — | | | — | | | — | | | (2,455) | | | — | | | (2,455) | |
| Other comprehensive (loss) | Other comprehensive (loss) | — | | | — | | | — | | | — | | | (4,347) | | | (4,347) | | Other comprehensive (loss) | — | | | — | | | — | | | — | | | (2,548) | | | (2,548) | |
| Net (loss) | Net (loss) | — | | | — | | | — | | | (56,468) | | | — | | | (56,468) | | Net (loss) | — | | | — | | | — | | | (379) | | | — | | | (379) | |
| September 30, 2021 | 81,670 | | | $ | 817 | | | $ | 148,098 | | | $ | 316,150 | | | $ | (5,433) | | | $ | 459,632 | | |
| March 31, 2022 | | March 31, 2022 | 81,802 | | | $ | 818 | | | $ | 141,771 | | | $ | 273,615 | | | $ | (9,536) | | | $ | 406,668 | |
| Repurchase of common stock | | Repurchase of common stock | (38) | | | — | | | (1,925) | | | — | | | — | | | (1,925) | |
| Issuance of common stock for stock compensation plans | | Issuance of common stock for stock compensation plans | 117 | | | 1 | | | (3,252) | | | — | | | — | | | (3,251) | |
| Issuance of common stock under the employee stock purchase plan | | Issuance of common stock under the employee stock purchase plan | 59 | | | — | | | 2,357 | | | — | | | — | | | 2,357 | |
| Stock-based compensation | | Stock-based compensation | — | | | — | | | 31,300 | | | — | | | — | | | 31,300 | |
| Cash dividends declared ($0.03 per share) | | Cash dividends declared ($0.03 per share) | — | | | — | | | — | | | (2,459) | | | — | | | (2,459) | |
| Other comprehensive (loss) | | Other comprehensive (loss) | — | | | — | | | — | | | — | | | (12,615) | | | (12,615) | |
| Net (loss) | | Net (loss) | — | | | — | | | — | | | (286,296) | | | — | | | (286,296) | |
| June 30, 2022 | | June 30, 2022 | 81,940 | | | $ | 819 | | | $ | 170,251 | | | $ | (15,140) | | | $ | (22,151) | | | $ | 133,779 | |
| | Issuance of common stock for stock compensation plans | | Issuance of common stock for stock compensation plans | 138 | | | 2 | | | (2,198) | | | — | | | — | | | (2,196) | |
| Issuance of common stock under the employee stock purchase plan | | Issuance of common stock under the employee stock purchase plan | 86 | | | 1 | | | 2,362 | | | — | | | — | | | 2,363 | |
| Stock-based compensation | | Stock-based compensation | — | | | — | | | 33,774 | | | — | | | — | | | 33,774 | |
| Cash dividends declared ($0.03 per share) | | Cash dividends declared ($0.03 per share) | — | | | — | | | — | | | (2,466) | | | — | | | (2,466) | |
| Other comprehensive (loss) | | Other comprehensive (loss) | — | | | — | | | — | | | — | | | (6,773) | | | (6,773) | |
| Net (loss) | | Net (loss) | — | | | — | | | — | | | (93,520) | | | — | | | (93,520) | |
| September 30, 2022 | | September 30, 2022 | 82,164 | | | $ | 822 | | | $ | 204,189 | | | $ | (111,126) | | | $ | (28,924) | | | $ | 64,961 | |
|
| PEGASYSTEMS INC.
UNAUDITED CONDENSED CONSOLIDATED STATEMENTS OF STOCKHOLDERS’ EQUITY
(in thousands, except per share amounts) | PEGASYSTEMS INC.
UNAUDITED CONDENSED CONSOLIDATED STATEMENTS OF STOCKHOLDERS’ EQUITY
(in thousands, except per share amounts) | PEGASYSTEMS INC.
UNAUDITED CONDENSED CONSOLIDATED STATEMENTS OF STOCKHOLDERS’ EQUITY
(in thousands, except per share amounts) |
| | Common Stock | | Additional
Paid-In Capital | | Retained Earnings (Accumulated Deficit) | | Accumulated Other Comprehensive (Loss) | | Total
Stockholders’ Equity | | Common Stock | | Additional
Paid-In Capital | | Retained Earnings (Accumulated Deficit) | | Accumulated Other Comprehensive (Loss) | | Total
Stockholders’ Equity |
| | Number
of Shares | | Amount | | | Number
of Shares | | Amount | |
| December 31, 2022 | | December 31, 2022 | 82,436 | | | $ | 824 | | | $ | 229,602 | | | $ | (76,513) | | | $ | (23,070) | | | $ | 130,843 | |
| | December 31, 2021 | 81,712 | | | $ | 817 | | | $ | 145,810 | | | $ | 276,449 | | | $ | (6,988) | | | $ | 416,088 | | |
| Repurchase of common stock | (242) | | | (2) | | | (22,581) | | | — | | | — | | | (22,583) | | |
| Issuance of common stock for stock compensation plans | Issuance of common stock for stock compensation plans | 297 | | | 3 | | | (12,131) | | | — | | | — | | | (12,128) | | Issuance of common stock for stock compensation plans | 452 | | | 4 | | | 668 | | | — | | | — | | | 672 | |
| Issuance of common stock under the employee stock purchase plan | Issuance of common stock under the employee stock purchase plan | 35 | | | — | | | 2,446 | | | — | | | — | | | 2,446 | | Issuance of common stock under the employee stock purchase plan | 52 | | | 1 | | | 2,142 | | | — | | | — | | | 2,143 | |
| Stock-based compensation | Stock-based compensation | — | | | — | | | 28,227 | | | — | | | — | | | 28,227 | | Stock-based compensation | — | | | — | | | 42,557 | | | — | | | — | | | 42,557 | |
| Cash dividends declared ($0.03 per share) | Cash dividends declared ($0.03 per share) | — | | | — | | | — | | | (2,455) | | | — | | | (2,455) | | Cash dividends declared ($0.03 per share) | — | | | — | | | (2,488) | | | — | | | — | | | (2,488) | |
| Other comprehensive (loss) | — | | | — | | | — | | | — | | | (2,548) | | | (2,548) | | |
| Other comprehensive income | | Other comprehensive income | — | | | — | | | — | | | — | | | 1,543 | | | 1,543 | |
| Net (loss) | Net (loss) | — | | | — | | | — | | | (379) | | | — | | | (379) | | Net (loss) | — | | | — | | | — | | | (20,774) | | | — | | | (20,774) | |
| March 31, 2022 | 81,802 | | | $ | 818 | | | $ | 141,771 | | | $ | 273,615 | | | $ | (9,536) | | | $ | 406,668 | | |
| Repurchase of common stock | (38) | | | — | | | (1,925) | | | — | | | — | | | (1,925) | | |
| March 31, 2023 | | March 31, 2023 | 82,940 | | | $ | 829 | | | $ | 272,481 | | | $ | (97,287) | | | $ | (21,527) | | | $ | 154,496 | |
| | Issuance of common stock for stock compensation plans | Issuance of common stock for stock compensation plans | 117 | | | 1 | | | (3,252) | | | — | | | — | | | (3,251) | | Issuance of common stock for stock compensation plans | 225 | | | 2 | | | 1,824 | | | — | | | — | | | 1,826 | |
| Issuance of common stock under the employee stock purchase plan | Issuance of common stock under the employee stock purchase plan | 59 | | | — | | | 2,357 | | | — | | | — | | | 2,357 | | Issuance of common stock under the employee stock purchase plan | 47 | | | 1 | | | 1,980 | | | — | | | — | | | 1,981 | |
| Stock-based compensation | Stock-based compensation | — | | | — | | | 31,300 | | | — | | | — | | | 31,300 | | Stock-based compensation | — | | | — | | | 36,227 | | | — | | | — | | | 36,227 | |
| Cash dividends declared ($0.03 per share) | Cash dividends declared ($0.03 per share) | — | | | — | | | — | | | (2,459) | | | — | | | (2,459) | | Cash dividends declared ($0.03 per share) | — | | | — | | | (2,496) | | | — | | | — | | | (2,496) | |
| Other comprehensive (loss) | — | | | — | | | — | | | — | | | (12,615) | | | (12,615) | | |
| Other comprehensive income | | Other comprehensive income | — | | | — | | | — | | | — | | | 166 | | | 166 | |
| Net (loss) | Net (loss) | — | | | — | | | — | | | (286,296) | | | — | | | (286,296) | | Net (loss) | — | | | — | | | — | | | (46,804) | | | — | | | (46,804) | |
| June 30, 2022 | 81,940 | | | $ | 819 | | | $ | 170,251 | | | $ | (15,140) | | | $ | (22,151) | | | $ | 133,779 | | |
| June 30, 2023 | | June 30, 2023 | 83,212 | | | $ | 832 | | | $ | 310,016 | | | $ | (144,091) | | | $ | (21,361) | | | $ | 145,396 | |
| | Issuance of common stock for stock compensation plans | Issuance of common stock for stock compensation plans | 138 | | | 2 | | | (2,198) | | | — | | | — | | | (2,196) | | Issuance of common stock for stock compensation plans | 257 | | | 3 | | | 2,447 | | | — | | | — | | | 2,450 | |
| Issuance of common stock under the employee stock purchase plan | Issuance of common stock under the employee stock purchase plan | 86 | | | 1 | | | 2,362 | | | — | | | — | | | 2,363 | | Issuance of common stock under the employee stock purchase plan | 54 | | | — | | | 2,003 | | | — | | | — | | | 2,003 | |
| Stock-based compensation | Stock-based compensation | — | | | — | | | 33,774 | | | — | | | — | | | 33,774 | | Stock-based compensation | — | | | — | | | 31,299 | | | — | | | — | | | 31,299 | |
| Cash dividends declared ($0.03 per share) | Cash dividends declared ($0.03 per share) | — | | | — | | | — | | | (2,466) | | | — | | | (2,466) | | Cash dividends declared ($0.03 per share) | — | | | — | | | (2,506) | | | — | | | — | | | (2,506) | |
| Other comprehensive (loss) | Other comprehensive (loss) | — | | | — | | | — | | | — | | | (6,773) | | | (6,773) | | Other comprehensive (loss) | — | | | — | | | — | | | — | | | (3,727) | | | (3,727) | |
| Net (loss) | Net (loss) | — | | | — | | | — | | | (93,520) | | | — | | | (93,520) | | Net (loss) | — | | | — | | | — | | | (7,279) | | | — | | | (7,279) | |
| September 30, 2022 | 82,164 | | | $ | 822 | | | $ | 204,189 | | | $ | (111,126) | | | $ | (28,924) | | | $ | 64,961 | | |
| September 30, 2023 | | September 30, 2023 | 83,523 | | | $ | 835 | | | $ | 343,259 | | | $ | (151,370) | | | $ | (25,088) | | | $ | 167,636 | |
See notes to unaudited condensed consolidated financial statements.
| PEGASYSTEMS INC. UNAUDITED CONDENSED CONSOLIDATED STATEMENTS OF CASH FLOWS (in thousands) | PEGASYSTEMS INC. UNAUDITED CONDENSED CONSOLIDATED STATEMENTS OF CASH FLOWS (in thousands) | PEGASYSTEMS INC. UNAUDITED CONDENSED CONSOLIDATED STATEMENTS OF CASH FLOWS (in thousands) |
| | Nine Months Ended
September 30, | | Nine Months Ended
September 30, |
| | 2022 | | 2021 | | 2023 | | 2022 |
| Operating activities | Operating activities | | | | Operating activities | | | |
| Net (loss) | Net (loss) | $ | (380,195) | | | $ | (25,794) | | Net (loss) | $ | (74,857) | | | $ | (380,195) | |
| Adjustments to reconcile net (loss) to cash (used in) operating activities | | |
| Adjustments to reconcile net (loss) to cash provided by (used in) operating activities | | Adjustments to reconcile net (loss) to cash provided by (used in) operating activities | |
| Stock-based compensation | Stock-based compensation | 93,301 | | | 89,483 | | Stock-based compensation | 110,083 | | | 93,301 | |
| Deferred income taxes | Deferred income taxes | 169,489 | | | (53,638) | | Deferred income taxes | (188) | | | 169,489 | |
| Loss on capped call transactions | Loss on capped call transactions | 56,381 | | | 7,543 | | Loss on capped call transactions | 449 | | | 56,381 | |
| Amortization of deferred commissions | Amortization of deferred commissions | 39,752 | | | 31,388 | | Amortization of deferred commissions | 43,974 | | | 39,752 | |
| Lease expense | Lease expense | 11,500 | | | 9,274 | | Lease expense | 12,018 | | | 11,500 | |
| Amortization of intangible assets and depreciation | Amortization of intangible assets and depreciation | 12,381 | | | 24,030 | | Amortization of intangible assets and depreciation | 14,181 | | | 12,381 | |
| Foreign currency transaction (gain) loss | (8,415) | | | 4,983 | | |
| Foreign currency transaction loss (gain) | | Foreign currency transaction loss (gain) | 3,971 | | | (8,415) | |
| Other non-cash | Other non-cash | (1,705) | | | 5,246 | | Other non-cash | (16,487) | | | (1,705) | |
| Change in operating assets and liabilities, net | Change in operating assets and liabilities, net | (5,935) | | | (97,836) | | Change in operating assets and liabilities, net | 44,776 | | | (5,935) | |
| Cash (used in) operating activities | (13,446) | | | (5,321) | | |
| Cash provided by (used in) operating activities | | Cash provided by (used in) operating activities | 137,920 | | | (13,446) | |
| Investing activities | Investing activities | | Investing activities | |
| Purchases of investments | Purchases of investments | (39,056) | | | (67,170) | | Purchases of investments | (190,466) | | | (39,056) | |
| Proceeds from maturities and called investments | Proceeds from maturities and called investments | 53,952 | | | 96,859 | | Proceeds from maturities and called investments | 169,836 | | | 53,952 | |
| Sales of investments | Sales of investments | 18,415 | | | 25,123 | | Sales of investments | 10,725 | | | 18,415 | |
| Payments for acquisitions, net of cash acquired | Payments for acquisitions, net of cash acquired | (922) | | | (4,993) | | Payments for acquisitions, net of cash acquired | — | | | (922) | |
| Investment in property and equipment | Investment in property and equipment | (22,285) | | | (7,089) | | Investment in property and equipment | (14,271) | | | (22,285) | |
| Cash provided by investing activities | 10,104 | | | 42,730 | | |
| Cash (used in) provided by investing activities | | Cash (used in) provided by investing activities | (24,176) | | | 10,104 | |
| Financing activities | Financing activities | | Financing activities | |
| Repurchases of convertible senior notes | | Repurchases of convertible senior notes | (88,989) | | | — | |
| | Dividend payments to stockholders | | Dividend payments to stockholders | (7,458) | | | (7,368) | |
| Proceeds from employee stock purchase plan | Proceeds from employee stock purchase plan | 7,166 | | | 7,786 | | Proceeds from employee stock purchase plan | 6,127 | | | 7,166 | |
| Dividend payments to stockholders | (7,368) | | | (7,310) | | |
| | Proceeds from stock option exercises | | Proceeds from stock option exercises | 6,602 | | | — | |
| | Common stock repurchases | Common stock repurchases | (43,282) | | | (91,907) | | Common stock repurchases | (1,654) | | | (43,282) | |
| Other | | Other | 341 | | | — | |
| Cash (used in) financing activities | Cash (used in) financing activities | (43,484) | | | (91,431) | | Cash (used in) financing activities | (85,031) | | | (43,484) | |
| Effect of exchange rate changes on cash and cash equivalents | (5,513) | | | (1,466) | | |
| Net (decrease) in cash and cash equivalents | (52,339) | | | (55,488) | | |
| Cash and cash equivalents, beginning of period | 159,965 | | | 171,899 | | |
| Cash and cash equivalents, end of period | $ | 107,626 | | | $ | 116,411 | | |
| Effect of exchange rate changes on cash, cash equivalents, and restricted cash | | Effect of exchange rate changes on cash, cash equivalents, and restricted cash | (1,621) | | | (5,513) | |
| Net increase (decrease) in cash, cash equivalents, and restricted cash | | Net increase (decrease) in cash, cash equivalents, and restricted cash | 27,092 | | | (52,339) | |
| Cash, cash equivalents, and restricted cash, beginning of period | | Cash, cash equivalents, and restricted cash, beginning of period | 145,054 | | | 159,965 | |
| Cash, cash equivalents, and restricted cash, end of period | | Cash, cash equivalents, and restricted cash, end of period | $ | 172,146 | | | $ | 107,626 | |
| | Cash and cash equivalents | | Cash and cash equivalents | $ | 169,023 | | | $ | 107,626 | |
| Restricted cash included in other long-term assets | | Restricted cash included in other long-term assets | 3,123 | | | — | |
| Total cash, cash equivalents, and restricted cash | | Total cash, cash equivalents, and restricted cash | $ | 172,146 | | | $ | 107,626 | |
See notes to unaudited condensed consolidated financial statements.
PEGASYSTEMS INC.
NOTES TO UNAUDITED CONDENSED CONSOLIDATED FINANCIAL STATEMENTS
NOTE 1. BASIS OF PRESENTATION
Pegasystems Inc. (together with its subsidiaries, “the Company”) has prepared the accompanying unaudited condensed consolidated financial statements pursuant to the rules and regulations of the U.S. Securities and Exchange Commission (“SEC”) regarding interim financial reporting. Accordingly, they do not include all the information required by accounting principles generally accepted in the United States of America (“U.S.”) for complete financial statements and should be read in conjunction with the Company’s audited financial statements included in the Annual Report on Form 10-K for the year ended December 31, 2021.2022.
In the opinion of management, the Company has prepared the accompanying unaudited condensed consolidated financial statements on the same basis as its audited financial statements, and these financial statements include all adjustments, consisting only of normal recurring adjustments, necessary for a fair presentation of the results of the interim periods presented.
All intercompany transactions and balances were eliminated in consolidation. The operating results for the interim periods presented do not necessarily indicate the expected results for the full year 2022.
Certain prior period amounts reported in our condensed consolidated financial statements and notes thereto have been reclassified to conform to the current year’s presentation. Such reclassifications did not affect total revenues, operating income, or net income.2023.
NOTE 2. MARKETABLE SECURITIES | | | September 30, 2022 | | December 31, 2021 | | September 30, 2023 | | December 31, 2022 |
| (in thousands) | (in thousands) | Amortized Cost | | Unrealized Gains | | Unrealized Losses | | Fair Value | | Amortized Cost | | Unrealized Gains | | Unrealized Losses | | Fair Value | (in thousands) | Amortized Cost | | Unrealized Gains | | Unrealized Losses | | Fair Value | | Amortized Cost | | Unrealized Gains | | Unrealized Losses | | Fair Value |
| Government debt | Government debt | $ | 2,992 | | | $ | — | | | $ | (67) | | | $ | 2,925 | | | $ | 2,000 | | | $ | — | | | $ | (10) | | | $ | 1,990 | | Government debt | $ | 17,931 | | | $ | — | | | $ | (18) | | | $ | 17,913 | | | $ | 2,960 | | | $ | — | | | $ | (52) | | | $ | 2,908 | |
| Corporate debt | Corporate debt | 168,894 | | | — | | | (3,734) | | | 165,160 | | | 201,659 | | | 2 | | | (837) | | | 200,824 | | Corporate debt | 149,927 | | | — | | | (554) | | | 149,373 | | | 151,906 | | | — | | | (2,647) | | | 149,259 | |
| | $ | 171,886 | | | $ | — | | | $ | (3,801) | | | $ | 168,085 | | | $ | 203,659 | | | $ | 2 | | | $ | (847) | | | $ | 202,814 | | | $ | 167,858 | | | $ | — | | | $ | (572) | | | $ | 167,286 | | | $ | 154,866 | | | $ | — | | | $ | (2,699) | | | $ | 152,167 | |
As of September 30, 2022,2023, marketable securities’ maturities ranged from November 2022October 2023 to November 2024,January 2026, with a weighted-averageweighted average remaining maturity of 0.70.5 years.
NOTE 3. RECEIVABLES, CONTRACT ASSETS, AND DEFERRED REVENUE
Receivables | | | | | | | | | | | |
| (in thousands) | September 30, 2022 | | December 31, 2021 |
| Accounts receivable | $ | 139,670 | | | $ | 182,717 | |
| Unbilled receivables | 182,403 | | | 226,714 | |
| Long-term unbilled receivables | 108,285 | | | 129,789 | |
| $ | 430,358 | | | $ | 539,220 | |
| | | | | | | | | | | |
| (in thousands) | September 30, 2023 | | December 31, 2022 |
| Accounts receivable, net | $ | 168,795 | | | $ | 255,150 | |
| Unbilled receivables, net | 199,948 | | | 213,719 | |
| Long-term unbilled receivables, net | 73,795 | | | 95,806 | |
| $ | 442,538 | | | $ | 564,675 | |
Unbilled receivables
Unbilled receivables are client-committed amounts for which revenue recognition precedes billing, and billingbilling. Billing is solely subject to the passage of time.
Unbilled receivables by expected billingcollection date: | | (Dollars in thousands) | (Dollars in thousands) | September 30, 2022 | (Dollars in thousands) | September 30, 2023 |
| 1 year or less | 1 year or less | $ | 182,403 | | 63 | % | 1 year or less | $ | 199,948 | | 73 | % |
| 1-2 years | 1-2 years | 78,893 | | 27 | % | 1-2 years | 58,604 | | 21 | % |
| 2-5 years | 2-5 years | 29,392 | | 10 | % | 2-5 years | 15,191 | | 6 | % |
| | $ | 290,688 | | 100 | % | | $ | 273,743 | | 100 | % |
Unbilled receivables by contract effective date: | | (Dollars in thousands) | (Dollars in thousands) | September 30, 2022 | (Dollars in thousands) | September 30, 2023 |
| 2023 | | 2023 | $ | 90,227 | | 33 | % |
| 2022 | 2022 | $ | 87,874 | | 30 | % | 2022 | 92,065 | | 34 | % |
| 2021 | 2021 | 130,196 | | 45 | % | 2021 | 62,729 | | 23 | % |
| 2020 | 2020 | 45,589 | | 16 | % | 2020 | 19,820 | | 7 | % |
| 2019 | 15,747 | | 5 | % | |
| 2018 and prior | 11,282 | | 4 | % | |
| 2019 and prior | | 2019 and prior | 8,902 | | 3 | % |
| | $ | 290,688 | | 100 | % | | $ | 273,743 | | 100 | % |
PEGASYSTEMS INC.
NOTES TO UNAUDITED CONDENSED CONSOLIDATED FINANCIAL STATEMENTS (continued)
Major clients
Clients accounting for 10% or more of the Company’s total receivables:
| | | | | | | | | | | |
| September 30, 2022 | | December 31, 2021 |
Client A | | | |
Accounts receivable | * | | 1 | % |
Unbilled receivables | * | | 15 | % |
Total receivables | * | | 10 | % |
* Client accounted for less than 10% of receivables.
Contract assets
Contract assets are client-committed amounts for which revenue recognized exceeds the amount billed to the client, and billing is subject to conditions other than the passage of time, such as the completion of a related performance obligation. | | (in thousands) | (in thousands) | September 30, 2022 | | December 31, 2021 | (in thousands) | September 30, 2023 | | December 31, 2022 |
Contract assets (1) | Contract assets (1) | $ | 12,429 | | | $ | 12,530 | | Contract assets (1) | $ | 13,263 | | | $ | 17,546 | |
Long-term contract assets (2) | Long-term contract assets (2) | 10,541 | | | 10,643 | | Long-term contract assets (2) | 10,732 | | | 16,470 | |
| | $ | 22,970 | | | $ | 23,173 | | | $ | 23,995 | | | $ | 34,016 | |
(1) Included in other current assets.
(2) Included in other long-term assets.
Deferred revenue
Deferred revenue consists of billings and payments received in advance of revenue recognition. | | (in thousands) | (in thousands) | September 30, 2022 | | December 31, 2021 | (in thousands) | September 30, 2023 | | December 31, 2022 |
| Deferred revenue | Deferred revenue | $ | 245,146 | | | $ | 275,844 | | Deferred revenue | $ | 297,067 | | | $ | 325,212 | |
Long-term deferred revenue (1) | Long-term deferred revenue (1) | 3,949 | | | 5,655 | | Long-term deferred revenue (1) | 2,605 | | | 3,552 | |
| | $ | 249,095 | | | $ | 281,499 | | | $ | 299,672 | | | $ | 328,764 | |
(1) Included in other long-term liabilities.
The change in deferredDeferred revenue decreased in the nine months ended September 30, 2022 was2023, primarily due to new billings in advance of revenue recognition offset by $252.8$292.3 million of revenue recognized during the period that was included in deferred revenue as of December 31, 2021.2022 exceeded new billings in advance of revenue recognition.
NOTE 4. DEFERRED COMMISSIONS | | (in thousands) | (in thousands) | September 30, 2022 | | December 31, 2021 | (in thousands) | September 30, 2023 | | December 31, 2022 |
Deferred commissions (1) | Deferred commissions (1) | $ | 122,673 | | | $ | 135,911 | | Deferred commissions (1) | $ | 107,399 | | | $ | 130,195 | |
(1) Included in other long-term assets.
| | | Three Months Ended
September 30, | | Nine Months Ended
September 30, | | Three Months Ended
September 30, | | Nine Months Ended
September 30, |
| (in thousands) | (in thousands) | 2022 | | 2021 | | 2022 | | 2021 | (in thousands) | 2023 | | 2022 | | 2023 | | 2022 |
Amortization of deferred commissions (1) | Amortization of deferred commissions (1) | $ | 11,597 | | | $ | 10,186 | | | $ | 39,752 | | | $ | 31,388 | | Amortization of deferred commissions (1) | $ | 14,947 | | | $ | 11,597 | | | $ | 43,974 | | | $ | 39,752 | |
(1) Included in selling and marketing expense.
PEGASYSTEMS INC.
NOTES TO UNAUDITED CONDENSED CONSOLIDATED FINANCIAL STATEMENTS (continued)
NOTE 5. GOODWILL AND OTHER INTANGIBLES
Goodwill
Change in goodwill: | | | Nine Months Ended
September 30, | | Nine Months Ended
September 30, |
| (in thousands) | (in thousands) | 2022 | | 2021 | (in thousands) | 2023 | | 2022 |
| January 1, | January 1, | $ | 81,923 | | | $ | 79,231 | | January 1, | $ | 81,399 | | | $ | 81,923 | |
| Acquisition | — | | | 2,701 | | |
| | Currency translation adjustments | Currency translation adjustments | (722) | | | 22 | | Currency translation adjustments | 38 | | | (722) | |
| September 30, | September 30, | $ | 81,201 | | | $ | 81,954 | | September 30, | $ | 81,437 | | | $ | 81,201 | |
Intangibles
Intangible assets are recorded at cost and amortized using the straight-line method over their estimated useful lives. | | | September 30, 2022 | | September 30, 2023 |
| (in thousands) | (in thousands) | Useful Lives | | Cost | | Accumulated Amortization | | Net Book Value (1) | (in thousands) | Useful Lives | | Cost | | Accumulated Amortization | | Net Book Value (1) |
| Client-related | Client-related | 4-10 years | | $ | 63,007 | | | $ | (58,211) | | | $ | 4,796 | | Client-related | 4-10 years | | $ | 63,086 | | | $ | (59,661) | | | $ | 3,425 | |
| Technology | Technology | 2-10 years | | 68,038 | | | (60,913) | | | 7,125 | | Technology | 2-10 years | | 68,103 | | | (63,579) | | | 4,524 | |
| Other | Other | 1-5 years | | 5,361 | | | (5,361) | | | — | | Other | 1-5 years | | 5,361 | | | (5,361) | | | — | |
| | $ | 136,406 | | | $ | (124,485) | | | $ | 11,921 | | | $ | 136,550 | | | $ | (128,601) | | | $ | 7,949 | |
(1) Included in other long-term assets.
| | | | | | | | | | | | | | | | | | | | | | | |
| | | December 31, 2021 |
| (in thousands) | Useful Lives | | Cost | | Accumulated Amortization | | Net Book Value (1) |
| Client-related | 4-10 years | | $ | 63,165 | | | $ | (57,342) | | | $ | 5,823 | |
| Technology | 2-10 years | | 67,142 | | | (58,902) | | | 8,240 | |
| Other | 1-5 years | | 5,361 | | | (5,361) | | | — | |
| | | $ | 135,668 | | | $ | (121,605) | | | $ | 14,063 | |
PEGASYSTEMS INC.
NOTES TO UNAUDITED CONDENSED CONSOLIDATED FINANCIAL STATEMENTS (continued)
| | | | | | | | | | | | | | | | | | | | | | | |
| | | December 31, 2022 |
| (in thousands) | Useful Lives | | Cost | | Accumulated Amortization | | Net Book Value (1) |
| Client-related | 4-10 years | | $ | 63,076 | | | $ | (58,623) | | | $ | 4,453 | |
| Technology | 2-10 years | | 68,056 | | | (61,621) | | | 6,435 | |
| Other | 1-5 years | | 5,361 | | | (5,361) | | | — | |
| | | $ | 136,493 | | | $ | (125,605) | | | $ | 10,888 | |
(1) Included in other long-term assets.
Amortization of intangible assets:
| | | | | | | | | | | | | | | | | | | |
| Three Months Ended
September 30, | | Nine Months Ended
September 30, |
| (in thousands) | 2022 | | 2021 | | 2022 | | 2021 |
| Cost of revenue | $ | 705 | | | $ | 629 | | | $ | 2,017 | | | $ | 1,887 | |
| Selling and marketing | 343 | | | 373 | | | 1,028 | | | 1,119 | |
| | | | | | | |
| $ | 1,048 | | | $ | 1,002 | | | $ | 3,045 | | | $ | 3,006 | |
Future estimated intangibles assets amortization: | | (in thousands) | (in thousands) | September 30, 2022 | (in thousands) | September 30, 2023 |
| Remainder of 2022 | $ | 1,048 | | |
| 2023 | 3,917 | | |
| Remainder of 2023 | | Remainder of 2023 | $ | 964 | |
| 2024 | 2024 | 3,147 | | 2024 | 3,169 | |
| 2025 | 2025 | 2,608 | | 2025 | 2,615 | |
| 2026 | 2026 | 874 | | 2026 | 874 | |
| 2027 | 2027 | 327 | | 2027 | 327 | |
| | $ | 11,921 | | |
| | | $ | 7,949 | |
| | | | | | | | | | | | | | | | | | | | | | | |
| Three Months Ended
September 30, | | Nine Months Ended
September 30, |
| (in thousands) | 2023 | | 2022 | | 2023 | | 2022 |
| Cost of revenue | $ | 622 | | | $ | 705 | | | $ | 1,949 | | | $ | 2,017 | |
| Selling and marketing | 343 | | | 343 | | | 1,028 | | | 1,028 | |
| | | | | | | |
| $ | 965 | | | $ | 1,048 | | | $ | 2,977 | | | $ | 3,045 | |
NOTE 6. OTHER ASSETS AND LIABILITIES
Other current assets
| | (in thousands) | (in thousands) | September 30, 2022 | | December 31, 2021 | (in thousands) | September 30, 2023 | | December 31, 2022 |
| Income tax receivables | Income tax receivables | $ | 11,948 | | | $ | 25,691 | | Income tax receivables | $ | 19,663 | | | $ | 25,354 | |
| Contract assets | Contract assets | 12,429 | | | 12,530 | | Contract assets | 13,263 | | | 17,546 | |
| Other | Other | 38,080 | | | 29,787 | | Other | 38,512 | | | 37,488 | |
| | $ | 62,457 | | | $ | 68,008 | | | $ | 71,438 | | | $ | 80,388 | |
Other long-term assets
| | | | | | | | | | | |
| (in thousands) | September 30, 2023 | | December 31, 2022 |
| Deferred commissions | $ | 107,399 | | | $ | 130,195 | |
| Right of use assets | 65,871 | | | 76,114 | |
| Property and equipment | 49,481 | | | 55,056 | |
| Venture investments | 19,348 | | | 13,069 | |
| Contract assets | 10,732 | | | 16,470 | |
| Intangible assets | 7,949 | | | 10,888 | |
| Capped call transactions | 1,792 | | | 2,582 | |
| Deferred income taxes | 5,046 | | | 4,795 | |
| Restricted cash | 3,123 | | | — | |
| Other | 20,066 | | | 24,820 | |
| $ | 290,807 | | | $ | 333,989 | |
Other current liabilities
| | | | | | | | | | | |
| (in thousands) | September 30, 2023 | | December 31, 2022 |
| Operating lease liabilities | $ | 15,532 | | | $ | 14,976 | |
| Dividends payable | 2,506 | | | 2,474 | |
| $ | 18,038 | | | $ | 17,450 | |
PEGASYSTEMS INC.
NOTES TO UNAUDITED CONDENSED CONSOLIDATED FINANCIAL STATEMENTS (continued)
Other long-term assets
| | | | | | | | | | | |
| (in thousands) | September 30, 2022 | | December 31, 2021 |
| Deferred income taxes | $ | 6,041 | | | $ | 180,656 | |
| Deferred commissions | 122,673 | | | 135,911 | |
| Right of use assets | 80,163 | | | 87,521 | |
| Capped call transactions | 3,583 | | | 59,964 | |
| Property and equipment | 45,350 | | | 26,837 | |
| Venture investments | 11,910 | | | 7,648 | |
| Intangible assets | 11,921 | | | 14,063 | |
| Contract assets | 10,541 | | | 10,643 | |
| Other | 24,549 | | | 18,358 | |
| $ | 316,731 | | | $ | 541,601 | |
Other current liabilities
| | | | | | | | | | | |
| (in thousands) | September 30, 2022 | | December 31, 2021 |
| Operating lease liabilities | $ | 5,787 | | | $ | 6,989 | |
| Dividends payable | 2,466 | | | 2,454 | |
| $ | 8,253 | | | $ | 9,443 | |
Other long-term liabilities
| | (in thousands) | (in thousands) | September 30, 2022 | | December 31, 2021 | (in thousands) | September 30, 2023 | | December 31, 2022 |
| Deferred revenue | Deferred revenue | $ | 3,949 | | | $ | 5,655 | | Deferred revenue | $ | 2,605 | | | $ | 3,552 | |
| Income taxes payable | | Income taxes payable | 2,017 | | | 3,207 | |
| Other | Other | 7,987 | | | 7,844 | | Other | 9,863 | | | 8,369 | |
| | $ | 11,936 | | | $ | 13,499 | | | $ | 14,485 | | | $ | 15,128 | |
NOTE 7. LEASES
Corporate headquarters
In February 2021, the Company agreed to accelerate its exit from its previous corporate headquarters to October 1, 2021, in exchange for a one-time payment from its landlord of $18 million, which was amortized over the remaining lease term. The exit accelerated depreciation on the related leasehold improvements and reduced the Company’s future lease liabilities by $21.1 million and right of use assets by $20.3 million. On March 31, 2021, the Company leased office space at One Main Street, Cambridge, Massachusetts, to serve as its corporate headquarters. The 4.5 year lease includes a base rent of $2 million per year.
New Waltham office
On July 6, 2021, the Company entered into an office space lease for 131 thousand square feet in Waltham, Massachusetts. The lease term of 11 years began on August 1, 2021. The annual rent equals the base rent plus a portion of building operating costs and real estate taxes. Rent first became payable on August 1, 2022. Base rent for the first year is approximately $6 million and will increase by 3% annually. In addition, the Company will receive an improvement allowance from the landlord of up to $11.8 million. This lease increased the Company’s lease liabilities and lease-related right of use assets by $42.1 million on August 1, 2021.
Expense
| | | | | | | | | | | | | | | | | | | |
| Three Months Ended
September 30, | | Nine Months Ended
September 30, |
| (in thousands) | 2022 | | 2021 | | 2022 | | 2021 |
Fixed lease costs (1) | $ | 4,688 | | | $ | (3,108) | | | $ | 14,747 | | | $ | (6,780) | |
| Short-term lease costs | 916 | | | 542 | | | 2,510 | | | 1,516 | |
| Variable lease costs | 905 | | | 1,099 | | | 2,395 | | | 3,826 | |
| $ | 6,509 | | | $ | (1,467) | | | $ | 19,652 | | | $ | (1,438) | |
(1) The lower fixed lease costs in the nine months ended September 30, 2021 was due to the modification of the corporate headquarters lease.
PEGASYSTEMS INC.
NOTES TO UNAUDITED CONDENSED CONSOLIDATED FINANCIAL STATEMENTS (continued)
| | | | | | | | | | | | | | | | | | | | | | | |
| Three Months Ended
September 30, | | Nine Months Ended
September 30, |
| (in thousands) | 2023 | | 2022 | | 2023 | | 2022 |
| Fixed lease costs | $ | 4,718 | | | $ | 4,688 | | | $ | 14,979 | | | $ | 14,747 | |
| Short-term lease costs | 660 | | | 916 | | | 2,137 | | | 2,510 | |
| Variable lease costs | 2,254 | | | 905 | | | 6,414 | | | 2,395 | |
| $ | 7,632 | | | $ | 6,509 | | | $ | 23,530 | | | $ | 19,652 | |
Right of use assets and lease liabilities | | (in thousands) | (in thousands) | September 30, 2022 | | December 31, 2021 | (in thousands) | September 30, 2023 | | December 31, 2022 |
Right of use assets (1) | Right of use assets (1) | $ | 80,163 | | | $ | 87,521 | | Right of use assets (1) | $ | 65,871 | | | $ | 76,114 | |
Operating lease liabilities (2) | Operating lease liabilities (2) | $ | 5,787 | | | $ | 6,989 | | Operating lease liabilities (2) | $ | 15,532 | | | $ | 14,976 | |
| Long-term operating lease liabilities | Long-term operating lease liabilities | $ | 82,705 | | | $ | 87,818 | | Long-term operating lease liabilities | $ | 68,874 | | | $ | 79,152 | |
(1) Represents the Company’s right to use the leased asset during the lease term. Included in other long-term assets.
(2) Included in other current liabilities.
Weighted-average remaining lease term and discount rate for the Company’s leases were: | | | September 30, 2022 | | December 31, 2021 | | September 30, 2023 | | December 31, 2022 |
| Weighted-average remaining lease term | Weighted-average remaining lease term | 7.4 years | | 7.7 years | Weighted-average remaining lease term | 7.0 years | | 7.5 years |
Weighted-average discount rate (1) | Weighted-average discount rate (1) | 4.2 | % | | 4.4 | % | Weighted-average discount rate (1) | 4.0 | % | | 4.1 | % |
(1) The rates implicit in most of the Company’s leases are not readily determinable. Therefore, the Company uses its incremental borrowing rate as the discount rate when measuring operating lease liabilities. The incremental borrowing rate represents an estimate of the interest rate the Company would incur to borrow an amount equal to the lease payments on a collateralized basis over the lease term in a similar economic environment.
Maturities of lease liabilities: | | (in thousands) | (in thousands) | September 30, 2022 | (in thousands) | September 30, 2023 |
| Remainder of 2022 | $ | (4,717) | | |
| 2023 | 18,804 | | |
| Remainder of 2023 | | Remainder of 2023 | $ | 4,775 | |
| 2024 | 2024 | 16,841 | | 2024 | 17,976 | |
| 2025 | 2025 | 14,778 | | 2025 | 14,870 | |
| 2026 | 2026 | 11,257 | | 2026 | 10,853 | |
| 2027 and thereafter | 48,397 | | |
| 2027 | | 2027 | 9,808 | |
| 2028 | | 2028 | 9,245 | |
| Thereafter | | Thereafter | 30,054 | |
| Total lease payments | Total lease payments | 105,360 | | Total lease payments | 97,581 | |
Less: imputed interest (1) | Less: imputed interest (1) | (16,868) | | Less: imputed interest (1) | (13,175) | |
| | $ | 88,492 | | | $ | 84,406 | |
(1) Lease liabilities are measured at the present value of the remaining lease payments using a discount rate determined at lease commencement unless the discount rate is updated due to a lease reassessment event.
Cash flow information | | | Nine Months Ended
September 30, | | Nine Months Ended
September 30, |
| (in thousands) | (in thousands) | 2022 | | 2021 | (in thousands) | 2023 | | 2022 |
| Cash paid for leases | $ | 11,628 | | | $ | 14,403 | | |
| Cash paid for operating leases, net of tenant improvement allowances | | Cash paid for operating leases, net of tenant improvement allowances | $ | 14,378 | | | $ | 11,628 | |
| Right of use assets recognized for new leases and amendments (non-cash) | Right of use assets recognized for new leases and amendments (non-cash) | $ | 6,618 | | | $ | 54,716 | | Right of use assets recognized for new leases and amendments (non-cash) | $ | 1,782 | | | $ | 6,618 | |
PEGASYSTEMS INC.
NOTES TO UNAUDITED CONDENSED CONSOLIDATED FINANCIAL STATEMENTS (continued)
NOTE 8. DEBT
Convertible senior notes and capped calls
Convertible senior notes
In February 2020, the Company issued Convertible Senior Notes (the "Notes") with an aggregate principal of $600 million, due March 1, 2025, in a private placement. No principal payments are due before maturity. The Notes accrue interest at an annual rate of 0.75%, payable semi-annually in arrears on March 1 and September 1, beginning on September 1, 2020.
In the nine months ended September 30, 2023, the Company recognized a gain of $7.9 million in other income (loss), net from repurchases of Notes representing $97.7 million in aggregate principal amount.
Conversion rights
The conversion rate is 7.4045 shares of common stock per $1,000 principal amount of the Notes, representing an initial conversion price of $135.05 per share of common stock. The conversion rate will be adjusted upon certain events, including spin-offs, tender offers, exchange offers, and certain stockholder distributions. The Company will settle conversions by paying or delivering cash, shares of its common stock, or a combination of cash and shares of its common stock, at the Company’s election, based on the applicable conversion rate. The conversion rate will be adjusted upon certain events, including spin-offs, tender offers, exchange offers, and certain stockholder distributions.
Beginning on September 1, 2024, noteholders may convert their Notes at any time at their election.
Before September 1, 2024, noteholders may convert their Notes in the following circumstances:
•During any calendar quarter beginning after June 30, 2020 (and only during such calendar quarter), if the last reported sale price per share of the Company’s common stock exceeds 130% of the conversion price for each of at least 20 trading days (whether or not consecutive) during the 30 consecutive trading days ending on, and including, the last trading day of the immediately preceding calendar quarter.
PEGASYSTEMS INC.
NOTES TO UNAUDITED CONDENSED CONSOLIDATED FINANCIAL STATEMENTS (continued)
•During the five consecutive business days immediately after any five consecutive trading day period (the “Measurement Period”), if the trading price per $1,000 principal amount of Notes for each trading day of the Measurement Period was less than 98% of the product of the last reported sale price per share of common stock on such trading day and the conversion rate on such trading day.
•Upon certain corporate events or distributions or if the Company calls any Notes for redemption, noteholders may convert before the close of business on the business day immediately before the related redemption date (or, if the Company fails to pay the redemption price in full on the redemption date until the Company pays the redemption price).
As of September 30, 2022,2023, the Notes were not eligible for conversion.
Repurchase rights
On or after March 1, 2023 and on or before the 40th scheduled trading day immediately before the maturity date, the Company may redeem for cash all or part of the Notes at a repurchase price equal to 100% of the principal amount, plus accrued and unpaid interest, if the last reported sale price of the Company’s common stock exceeded 130% of the conversion price then in effect for at least 20 trading days (whether or not consecutive) during any 30 consecutive trading day period ending on, and including, the trading day immediately preceding the date on which the Company provides a redemption notice.
If certain corporate events that constitute a “Fundamental Change” occur, each noteholder will have the right to require the Company to repurchase for cash all of such noteholder’s Notes, or any portion of the principal thereof that is equal to $1,000 or a multiple of $1,000, at a repurchase price equal to 100% of the principal amount thereof, plus accrued and unpaid interest. A Fundamental Change relates to mergers, changes in control of the Company, liquidation/dissolution of the Company, or the delisting of the Company’s common stock.
Carrying value of the Notes: | | (in thousands) | (in thousands) | September 30, 2022 | | December 31, 2021 | (in thousands) | September 30, 2023 | | December 31, 2022 |
| Principal | Principal | $ | 600,000 | | | $ | 600,000 | | Principal | $ | 502,270 | | | $ | 600,000 | |
| Unamortized issuance costs | Unamortized issuance costs | (7,116) | | | (9,278) | | Unamortized issuance costs | (3,517) | | | (6,391) | |
| Convertible senior notes, net | Convertible senior notes, net | $ | 592,884 | | | $ | 590,722 | | Convertible senior notes, net | $ | 498,753 | | | $ | 593,609 | |
Interest expense related to the Notes: | | | Three Months Ended
September 30, | | Nine Months Ended
September 30, | | Three Months Ended
September 30, | | Nine Months Ended
September 30, |
| (in thousands) | (in thousands) | 2022 | | 2021 | | 2022 | | 2021 | (in thousands) | 2023 | | 2022 | | 2023 | | 2022 |
| Contractual interest expense (0.75% coupon) | Contractual interest expense (0.75% coupon) | $ | 1,125 | | | $ | 1,125 | | | $ | 3,375 | | | $ | 3,375 | | Contractual interest expense (0.75% coupon) | $ | 827 | | | $ | 1,125 | | | $ | 2,949 | | | $ | 3,375 | |
| Amortization of issuance costs | Amortization of issuance costs | 724 | | | 677 | | | 2,163 | | | 2,025 | | Amortization of issuance costs | 613 | | | 724 | | | 1,988 | | | 2,163 | |
| | $ | 1,849 | | | $ | 1,802 | | | $ | 5,538 | | | $ | 5,400 | | | $ | 1,440 | | | $ | 1,849 | | | $ | 4,937 | | | $ | 5,538 | |
PEGASYSTEMS INC.
NOTES TO UNAUDITED CONDENSED CONSOLIDATED FINANCIAL STATEMENTS (continued)
The
effectiveaverage interest rate
foron the
Notes: | | | | | | | | | | | |
| Nine Months Ended
September 30, |
| 2022 | | 2021 |
| Weighted-average effective interest rate | 1.2 | % | | 1.2 | % |
Future payments of principal and contractual interest:payments: | | | September 30, 2022 | | September 30, 2023 |
| (in thousands) | (in thousands) | Principal | | Interest | | Total | (in thousands) | Principal | | Interest | | Total |
| | 2023 | $ | — | | | $ | 4,500 | | | $ | 4,500 | | |
| 2024 | 2024 | — | | | 4,500 | | | 4,500 | | 2024 | $ | — | | | $ | 3,767 | | | $ | 3,767 | |
| 2025 | 2025 | 600,000 | | | 2,250 | | | 602,250 | | 2025 | 502,270 | | | 1,884 | | | 504,154 | |
| | $ | 600,000 | | | $ | 11,250 | | | $ | 611,250 | | | $ | 502,270 | | | $ | 5,651 | | | $ | 507,921 | |
Capped call transactions
In February 2020, the Company entered into privately negotiated capped call transactions (the “Capped Call Transactions”) with certain financial institutions. The Capped Call Transactions covercovered approximately 4.4 million shares (representing the number of shares for which the Notes arewere initially convertible) of the Company’s common stock.
In the nine months ended September 30, 2023, Capped Call Transactions covering approximately 0.7 million shares were settled for proceeds of $0.3 million. As of September 30, 2023, Capped Call Transactions covering approximately 3.7 million shares were outstanding.
The Capped Call Transactions are expected to reduce common stock dilution and/or offset any potential cash payments the Company must make, other than for principal and interest, upon conversion of the Notes, with such reduction and/or offset subject to a cap of $196.44. The cap price of the Capped Call Transactions is subject to adjustment upon specified extraordinary events affecting the Company, including mergers and tender offers.
PEGASYSTEMS INC.
NOTES TO UNAUDITED CONDENSED CONSOLIDATED FINANCIAL STATEMENTS (continued)
The Capped Call Transactions are accounted for as derivative instruments and do not qualify for the Company’s own equity scope exception in ASC 815 since, in some cases of early settlement, the settlement value of the Capped Call Transactions, calculated following the governing documents may not represent a fair value measurement. The Capped Call Transactions are classified as other long-term assets and remeasured to fair value each reporting period, resulting in a non-operating gain or loss.
Change in capped call transactions: | | | Nine Months Ended
September 30, | | Nine Months Ended
September 30, |
| (in thousands) | (in thousands) | 2022 | | 2021 | (in thousands) | 2023 | | 2022 |
| January 1, | January 1, | $ | 59,964 | | | $ | 83,597 | | January 1, | $ | 2,582 | | | $ | 59,964 | |
| Settlements | | Settlements | (341) | | | — | |
| Fair value adjustment | Fair value adjustment | (56,381) | | | (7,543) | | Fair value adjustment | (449) | | | (56,381) | |
| September 30, | September 30, | $ | 3,583 | | | $ | 76,054 | | September 30, | $ | 1,792 | | | $ | 3,583 | |
Credit facility
In November 2019, and as since amended, the Company entered into a five-year $100 million senior secured revolving credit agreement (the “Credit Facility”) with PNC Bank, National Association. The Company may use borrowings for general corporate purposes and to finance working capital needs. Subject to specific conditions and the Credit Facility allowsagreement of the Company to increasefinancial institutions lending the additional amount, the aggregate commitment may be increased to $200 million. The commitments expire on November 4, 2024, and any outstanding loans will be payable on such date. The Credit Facility, as amended, contains customary covenants, including, but not limited to, those relating to additional indebtedness, liens, asset divestitures, and affiliate transactions.
The Company is required to comply with financial covenants, including:
•Beginning with the fiscal quarter ended March 31, 2022 and ending with the fiscal quarter endedThrough December 31, 2022, Pegasystems Inc.2023, the parent company must maintain at least $200 million in cash, investments, and availability under the Revolving Credit Loan.Facility and the Company must maintain:
| | | | | | | | | | | | | | | | | | | | | | | |
| Year to Date |
| (in thousands) | March 31, 2023 | | June 30, 2023 | | September 30, 2023 | | December 31, 2023 |
| Minimum Consolidated EBITDA (as defined in the Credit Facility) | $ | 38,862 | | | $ | 59,894 | | | $ | 95,597 | | | $ | 214,590 | |
•Beginning with the fiscal quarter ended March 31, 2023,2024, a maximum net consolidated leverage ratio of 3.5 to 1.0 (with a step-up for certain acquisitions) and a minimum consolidated interest coverage ratio of 3.5 to 1.0.
As of September 30, 20222023 and December 31, 2021, the Company had no outstanding cash borrowings under the Credit Facility.
As of September 30, 2022, the Company had $27.3 million in outstanding letters of credit, which reducereduced the Company’s available borrowing capacity under the Credit Facility and no outstanding cash borrowings under the Credit Facility.
PEGASYSTEMS INC.
NOTES TO UNAUDITED CONDENSED CONSOLIDATED FINANCIAL STATEMENTS (continued)
NOTE 9. RESTRUCTURING
The Company has undertaken the following restructuring activities as it optimizes its go-to-market strategy and reassesses its office space needs:
| | | | | | | | | | | |
| Three months ended | | Expense |
| Employee severance and related benefits and closure of a US office | December 31, 2022 | | $ | 21,743 | |
| Office space reduction | March 31, 2023 | | $ | 1,241 | |
| Employee severance and related benefits | June 30, 2023 | | $ | 1,581 | |
| Employee severance and related benefits and closure of a foreign office | September 30, 2023 | | $ | 17,236 | |
Accrued employee severance and related benefits:
Change for all restructuring actions:
| | | | | |
| Nine Months Ended
September 30, |
| (in thousands) | 2023 |
| January 1, | $ | 18,573 | |
| Costs incurred | 19,921 | |
| Cash disbursements | (21,576) | |
| Currency translation adjustments | (203) | |
| September 30, | $ | 16,715 | |
Note: Accrued employee severance and related benefits is included in accrued compensation and related expenses.
NOTE 9.10. FAIR VALUE MEASUREMENTS
Assets and liabilities measured at fair value on a recurring basis
The Company records its cash equivalents, marketable securities, Capped Call Transactions, and venture investments at fair value on a recurring basis. Fair value is an exit price, representing the amount that would be received from the sale of an asset or paid to transfer a liability in an orderly transaction between market participants based on assumptions that market participants would use in pricing an asset or liability.
As a basis for classifying the fair value measurements, a three-tier fair value hierarchy, which classifies the fair value measurements based on the inputs used in measuring fair value, was established as follows:
•Level 1 - observable inputs, such as quoted prices in active markets for identical assets or liabilities;
•Level 2 - significant other inputs that are observable either directly or indirectly; and
•Level 3 - significant unobservable inputs on which there iswith little or no market data, which require the Company to develop its own assumptions.
This hierarchy requires the Company to use observable market data when available and minimize unobservable inputs when determining fair value.
The fair value of the Capped Call Transactions at the end of each reporting period is determined using a Black-Scholes option-pricing model. The valuation model uses various market-based inputs, including stock price, remaining contractual term, expected volatility, risk-free interest rate, and expected dividend yield. The Company applies judgment when determining expected volatility. The Company considers boththe underlying equity security’s historical and implied volatility levels of the underlying equity security.levels. The Company’s venture investments are recorded at fair value based on multiple valuation methods, including observable public companies and transaction prices and unobservable inputs, including the volatility, rights, and obligations of the securities the Company holds.
Assets and liabilities measured at fair value on a recurring basis: | | | | | | | | | | | | | | | | | | | | | | | | | | | | | | | | | | | | | | | | | | | | | | | |
| September 30, 2023 | | December 31, 2022 |
| (in thousands) | Level 1 | | Level 2 | | Level 3 | | Total | | Level 1 | | Level 2 | | Level 3 | | Total |
| Cash equivalents | $ | 22,686 | | | $ | — | | | $ | — | | | $ | 22,686 | | | $ | 2,526 | | | $ | — | | | $ | — | | | $ | 2,526 | |
| Marketable securities | $ | — | | | $ | 167,286 | | | $ | — | | | $ | 167,286 | | | $ | — | | | $ | 152,167 | | | $ | — | | | $ | 152,167 | |
Capped Call Transactions (1) | $ | — | | | $ | 1,792 | | | $ | — | | | $ | 1,792 | | | $ | — | | | $ | 2,582 | | | $ | — | | | $ | 2,582 | |
Venture investments (1) (2) | $ | — | | | $ | — | | | $ | 19,348 | | | $ | 19,348 | | | $ | — | | | $ | — | | | $ | 13,069 | | | $ | 13,069 | |
(1) Included in other long-term assets.
(2) Investments in privately-held companies.
PEGASYSTEMS INC.
NOTES TO UNAUDITED CONDENSED CONSOLIDATED FINANCIAL STATEMENTS (continued)
Assets and liabilities measured at fair value on a recurring basis: | | | | | | | | | | | | | | | | | | | | | | | | | | | | | | | | | | | | | | | | | | | | | | | |
| September 30, 2022 | | December 31, 2021 |
| (in thousands) | Level 1 | | Level 2 | | Level 3 | | Total | | Level 1 | | Level 2 | | Level 3 | | Total |
| Cash equivalents | $ | 20,899 | | | $ | — | | | $ | — | | | $ | 20,899 | | | $ | 3,216 | | | $ | — | | | $ | — | | | $ | 3,216 | |
| Marketable securities | $ | — | | | $ | 168,085 | | | $ | — | | | $ | 168,085 | | | $ | — | | | $ | 202,814 | | | $ | — | | | $ | 202,814 | |
Capped Call Transactions (1) | $ | — | | | $ | 3,583 | | | $ | — | | | $ | 3,583 | | | $ | — | | | $ | 59,964 | | | $ | — | | | $ | 59,964 | |
Venture investments (1) (2) | $ | — | | | $ | — | | | $ | 11,910 | | | $ | 11,910 | | | $ | — | | | $ | — | | | $ | 7,648 | | | $ | 7,648 | |
(1) Included in other long-term assets. (2) Investments in privately-held companies.
Changes in venture investments: | | | Nine Months Ended
September 30, | | Nine Months Ended
September 30, |
| (in thousands) | (in thousands) | 2022 | | 2021 | (in thousands) | 2023 | | 2022 |
| January 1, | January 1, | $ | 7,648 | | | $ | 8,345 | | January 1, | $ | 13,069 | | | $ | 7,648 | |
| New investments | New investments | 400 | | | 500 | | New investments | 400 | | | 400 | |
| Sales of investments | Sales of investments | (3,954) | | | (400) | | Sales of investments | (2,773) | | | (3,954) | |
| Changes in foreign exchange rates | Changes in foreign exchange rates | (675) | | | (52) | | Changes in foreign exchange rates | 27 | | | (675) | |
| Changes in fair value: | Changes in fair value: | | Changes in fair value: | |
| included in other income | 5,989 | | | 100 | | |
| included in other comprehensive income | 2,502 | | | 1,220 | | |
| included in other income (loss), net | | included in other income (loss), net | 10,886 | | | 5,989 | |
| included in other comprehensive (loss) | | included in other comprehensive (loss) | (2,261) | | | 2,502 | |
| September 30, | September 30, | $ | 11,910 | | | $ | 9,713 | | September 30, | $ | 19,348 | | | $ | 11,910 | |
The carrying value of certain other financial instruments, including receivables and accounts payable, approximates fair value due to these items’their short maturities.
Fair value of the Notes
The Notes’ fair value of the Notes outstanding (including the embedded conversion feature embedded in the Notes)feature) was $488.3$460.3 million as of September 30, 20222023 and $642.0$521.1 million as of December 31, 2021. 2022. In the nine months ended September 30, 2023 the Company repurchased Notes representing $97.7 million in aggregate principal amount.
The fair value was determined based on the Notes’ quoted price in an over-the-counter market on the last trading day of the reporting period and classified within Level 2 in the fair value hierarchy.
NOTE 10.11. REVENUE
Geographic revenue | | | Three Months Ended
September 30, | | Nine Months Ended
September 30, | | Three Months Ended
September 30, | | Nine Months Ended
September 30, |
| (Dollars in thousands) | (Dollars in thousands) | 2022 | | 2021 | | 2022 | | 2021 | (Dollars in thousands) | 2023 | | 2022 | | 2023 | | 2022 |
| U.S. | U.S. | $ | 148,200 | | 55 | % | | $ | 132,016 | | 52 | % | | $ | 513,197 | | 56 | % | | $ | 515,881 | | 58 | % | U.S. | $ | 154,741 | | 47 | % | | $ | 148,200 | | 55 | % | | $ | 489,645 | | 51 | % | | $ | 513,197 | | 56 | % |
| Other Americas | Other Americas | 18,546 | | 7 | % | | 17,510 | | 7 | % | | 80,558 | | 9 | % | | 43,469 | | 5 | % | Other Americas | 23,497 | | 7 | % | | 18,546 | | 7 | % | | 58,013 | | 6 | % | | 80,558 | | 9 | % |
| United Kingdom (“U.K.”) | United Kingdom (“U.K.”) | 24,074 | | 9 | % | | 25,982 | | 10 | % | | 83,837 | | 9 | % | | 86,747 | | 10 | % | United Kingdom (“U.K.”) | 41,622 | | 12 | % | | 24,074 | | 9 | % | | 112,751 | | 12 | % | | 83,837 | | 9 | % |
| Europe (excluding U.K.), Middle East, and Africa | Europe (excluding U.K.), Middle East, and Africa | 46,212 | | 17 | % | | 46,306 | | 18 | % | | 140,586 | | 15 | % | | 143,763 | | 15 | % | Europe (excluding U.K.), Middle East, and Africa | 67,880 | | 20 | % | | 46,212 | | 17 | % | | 173,551 | | 18 | % | | 140,586 | | 15 | % |
| Asia-Pacific | Asia-Pacific | 33,699 | | 12 | % | | 34,454 | | 13 | % | | 103,197 | | 11 | % | | 105,609 | | 12 | % | Asia-Pacific | 46,903 | | 14 | % | | 33,699 | | 12 | % | | 124,423 | | 13 | % | | 103,197 | | 11 | % |
| | $ | 270,731 | | 100 | % | | $ | 256,268 | | 100 | % | | $ | 921,375 | | 100 | % | | $ | 895,469 | | 100 | % | | $ | 334,643 | | 100 | % | | $ | 270,731 | | 100 | % | | $ | 958,383 | | 100 | % | | $ | 921,375 | | 100 | % |
Revenue streams
| | | Three Months Ended
September 30, | | Nine Months Ended
September 30, | | Three Months Ended
September 30, | | Nine Months Ended
September 30, |
| (in thousands) | (in thousands) | 2022 | | 2021 | | 2022 | | 2021 | (in thousands) | 2023 | | 2022 | | 2023 | | 2022 |
| Perpetual license | Perpetual license | $ | 9,223 | | | $ | 2,874 | | | $ | 18,929 | | | $ | 20,922 | | Perpetual license | $ | 2,747 | | | $ | 9,223 | | | $ | 4,729 | | | $ | 18,929 | |
| Subscription license | Subscription license | 31,112 | | | 35,421 | | | 210,245 | | | 251,226 | | Subscription license | 74,342 | | | 31,112 | | | 200,066 | | | 210,245 | |
| Revenue recognized at a point in time | Revenue recognized at a point in time | 40,335 | | | 38,295 | | | 229,174 | | | 272,148 | | Revenue recognized at a point in time | 77,089 | | | 40,335 | | | 204,795 | | | 229,174 | |
| Maintenance | Maintenance | 77,526 | | | 83,188 | | | 235,568 | | | 237,531 | | Maintenance | 83,538 | | | 77,526 | | | 245,210 | | | 235,568 | |
| Pega Cloud | Pega Cloud | 97,359 | | | 78,369 | | | 281,182 | | | 219,520 | | Pega Cloud | 118,040 | | | 97,359 | | | 340,982 | | | 281,182 | |
| Consulting | Consulting | 55,511 | | | 56,416 | | | 175,451 | | | 166,270 | | Consulting | 55,976 | | | 55,511 | | | 167,396 | | | 175,451 | |
| Revenue recognized over time | Revenue recognized over time | 230,396 | | | 217,973 | | | 692,201 | | | 623,321 | | Revenue recognized over time | 257,554 | | | 230,396 | | | 753,588 | | | 692,201 | |
| Total revenue | Total revenue | $ | 270,731 | | | $ | 256,268 | | | $ | 921,375 | | | $ | 895,469 | | Total revenue | $ | 334,643 | | | $ | 270,731 | | | $ | 958,383 | | | $ | 921,375 | |
PEGASYSTEMS INC.
NOTES TO UNAUDITED CONDENSED CONSOLIDATED FINANCIAL STATEMENTS (continued)
| | | Three Months Ended
September 30, | | Nine Months Ended
September 30, | | Three Months Ended
September 30, | | Nine Months Ended
September 30, |
| (in thousands) | (in thousands) | 2022 | | 2021 | | 2022 | | 2021 | (in thousands) | 2023 | | 2022 | | 2023 | | 2022 |
| Pega Cloud | Pega Cloud | $ | 97,359 | | | $ | 78,369 | | | $ | 281,182 | | | $ | 219,520 | | Pega Cloud | $ | 118,040 | | | $ | 97,359 | | | $ | 340,982 | | | $ | 281,182 | |
| Maintenance | Maintenance | 77,526 | | | 83,188 | | | 235,568 | | | 237,531 | | Maintenance | 83,538 | | | 77,526 | | | 245,210 | | | 235,568 | |
| Subscription services | Subscription services | 174,885 | | | 161,557 | | | 516,750 | | | 457,051 | | Subscription services | 201,578 | | | 174,885 | | | 586,192 | | | 516,750 | |
| Subscription license | Subscription license | 31,112 | | | 35,421 | | | 210,245 | | | 251,226 | | Subscription license | 74,342 | | | 31,112 | | | 200,066 | | | 210,245 | |
| Subscription | Subscription | 205,997 | | | 196,978 | | | 726,995 | | | 708,277 | | Subscription | 275,920 | | | 205,997 | | | 786,258 | | | 726,995 | |
| Consulting | | Consulting | 55,976 | | | 55,511 | | | 167,396 | | | 175,451 | |
| Perpetual license | Perpetual license | 9,223 | | | 2,874 | | | 18,929 | | | 20,922 | | Perpetual license | 2,747 | | | 9,223 | | | 4,729 | | | 18,929 | |
| Consulting | 55,511 | | | 56,416 | | | 175,451 | | | 166,270 | | |
| | $ | 270,731 | | | $ | 256,268 | | | $ | 921,375 | | | $ | 895,469 | | | $ | 334,643 | | | $ | 270,731 | | | $ | 958,383 | | | $ | 921,375 | |
Remaining performance obligations ("Backlog")
Expected future revenue from existing non-cancellable contracts:
As of September 30, 2022:2023: | | (Dollars in thousands) | (Dollars in thousands) | Subscription services | | Subscription license | | Perpetual license | | Consulting | | Total | (Dollars in thousands) | Subscription services | | Subscription license | | Perpetual license | | Consulting | | Total |
| Maintenance | | Pega Cloud | | Maintenance | | Pega Cloud | |
| 1 year or less | 1 year or less | $ | 191,045 | | | $ | 328,111 | | | $ | 69,753 | | | $ | 814 | | | $ | 27,968 | | | $ | 617,691 | | 53 | % | 1 year or less | $ | 202,610 | | | $ | 391,324 | | | $ | 48,427 | | | $ | 4,567 | | | $ | 39,335 | | | $ | 686,263 | | 54 | % |
| 1-2 years | 1-2 years | 55,141 | | | 213,304 | | | 4,113 | | | 4,505 | | | 6,699 | | | 283,762 | | 25 | % | 1-2 years | 58,610 | | | 239,787 | | | 4,356 | | | 2,696 | | | 3,662 | | | 309,111 | | 24 | % |
| 2-3 years | 2-3 years | 24,496 | | | 115,416 | | | 1,420 | | | 2,252 | | | 1,648 | | | 145,232 | | 13 | % | 2-3 years | 28,585 | | | 121,778 | | | 8,518 | | | — | | | 1,100 | | | 159,981 | | 13 | % |
| Greater than 3 years | Greater than 3 years | 16,198 | | | 82,807 | | | 1,734 | | | — | | | 508 | | | 101,247 | | 9 | % | Greater than 3 years | 17,478 | | | 89,870 | | | 2,664 | | | — | | | — | | | 110,012 | | 9 | % |
| | $ | 286,880 | | | $ | 739,638 | | | $ | 77,020 | | | $ | 7,571 | | | $ | 36,823 | | | $ | 1,147,932 | | 100 | % | | $ | 307,283 | | | $ | 842,759 | | | $ | 63,965 | | | $ | 7,263 | | | $ | 44,097 | | | $ | 1,265,367 | | 100 | % |
As of September 30, 2021:2022:
| | (Dollars in thousands) | (Dollars in thousands) | Subscription services | | Subscription license | | Perpetual license | | Consulting | | Total | (Dollars in thousands) | Subscription services | | Subscription license | | Perpetual license | | Consulting | | Total |
| Maintenance | | Pega Cloud | | Maintenance | | Pega Cloud | |
| 1 year or less | 1 year or less | $ | 196,667 | | | $ | 284,359 | | | $ | 49,265 | | | $ | 15,686 | | | $ | 31,673 | | | $ | 577,650 | | 56 | % | 1 year or less | $ | 191,045 | | | $ | 328,111 | | | $ | 69,753 | | | $ | 814 | | | $ | 27,968 | | | $ | 617,691 | | 53 | % |
| 1-2 years | 1-2 years | 59,360 | | | 177,214 | | | 16,872 | | | 1,064 | | | 6,561 | | | 261,071 | | 25 | % | 1-2 years | 55,141 | | | 213,304 | | | 4,113 | | | 4,505 | | | 6,699 | | | 283,762 | | 25 | % |
| 2-3 years | 2-3 years | 37,734 | | | 79,775 | | | 420 | | | 4,094 | | | 5,165 | | | 127,188 | | 12 | % | 2-3 years | 24,496 | | | 115,416 | | | 1,420 | | | 2,252 | | | 1,648 | | | 145,232 | | 13 | % |
| Greater than 3 years | Greater than 3 years | 33,935 | | | 30,113 | | | 245 | | | 2,127 | | | 1,697 | | | 68,117 | | 7 | % | Greater than 3 years | 16,198 | | | 82,807 | | | 1,734 | | | — | | | 508 | | | 101,247 | | 9 | % |
| | $ | 327,696 | | | $ | 571,461 | | | $ | 66,802 | | | $ | 22,971 | | | $ | 45,096 | | | $ | 1,034,026 | | 100 | % | | $ | 286,880 | | | $ | 739,638 | | | $ | 77,020 | | | $ | 7,571 | | | $ | 36,823 | | | $ | 1,147,932 | | 100 | % |
NOTE 11.12. STOCK-BASED COMPENSATION
Expense
| | | Three Months Ended
September 30, | | Nine Months Ended
September 30, | | Three Months Ended
September 30, | | Nine Months Ended
September 30, |
| (in thousands) | (in thousands) | 2022 | | 2021 | | 2022 | | 2021 | (in thousands) | 2023 | | 2022 | | 2023 | | 2022 |
| Cost of revenue | Cost of revenue | $ | 6,797 | | | $ | 5,114 | | | $ | 19,754 | | | $ | 16,889 | | Cost of revenue | $ | 6,410 | | | $ | 6,797 | | | $ | 22,497 | | | $ | 19,754 | |
| Selling and marketing | Selling and marketing | 12,933 | | | 13,376 | | | 36,524 | | | 41,844 | | Selling and marketing | 10,401 | | | 12,933 | | | 43,410 | | | 36,524 | |
| Research and development | Research and development | 7,724 | | | 6,231 | | | 22,425 | | | 19,343 | | Research and development | 7,375 | | | 7,724 | | | 24,286 | | | 22,425 | |
| General and administrative | General and administrative | 6,320 | | | 3,974 | | | 14,598 | | | 11,407 | | General and administrative | 7,113 | | | 6,320 | | | 19,890 | | | 14,598 | |
| | $ | 33,774 | | | $ | 28,695 | | | $ | 93,301 | | | $ | 89,483 | | | $ | 31,299 | | | $ | 33,774 | | | $ | 110,083 | | | $ | 93,301 | |
| Income tax benefit | Income tax benefit | $ | (600) | | | $ | (5,845) | | | $ | (1,505) | | | $ | (18,028) | | Income tax benefit | $ | (316) | | | $ | (600) | | | $ | (1,569) | | | $ | (1,505) | |
As of September 30, 2022,2023, the Company had $161.0$137.5 million of unrecognized stock-based compensation expense, net of estimated forfeitures, which is expected to be recognized over a weighted-average period of 2.11.8 years.
Grants | | | | | | | | | | | |
| Nine Months Ended
September 30, 2022 |
| (in thousands) | Shares | | Total Fair Value |
| Restricted stock units | 1,436 | | | $ | 112,303 | |
| Non-qualified stock options | 4,529 | | | $ | 102,332 | |
| Common stock | 14 | | | $ | 600 | |
| | | |
PEGASYSTEMS INC.
NOTES TO UNAUDITED CONDENSED CONSOLIDATED FINANCIAL STATEMENTS (continued)
Grants | | | | | | | | | | | |
| Nine Months Ended
September 30, 2023 |
| (in thousands) | Shares | | Total Fair Value |
| Restricted stock units | 1,514 | | | $ | 70,962 | |
| Non-qualified stock options | 911 | | | $ | 19,142 | |
Performance stock options (1) | 906 | | | $ | 18,265 | |
| Common stock | 13 | | | $ | 600 | |
(1) Performance stock options allow the holder to purchase a specified number of common stock shares at an exercise price equal to or greater than the shares' fair market value at the grant date. The options usually vest over two years and expire ten years from the grant date, subject to specific performance conditions.
NOTE 12.13. INCOME TAXES
Effective income tax rate
| | | | | | | | | | | | | | | | | | | | | | | |
| Three Months Ended
September 30, | | Nine Months Ended
September 30, |
| (Dollars in thousands) | 2022 | | 2021 | | 2022 | | 2021 |
| Provision for (benefit from) income taxes | $ | 11,748 | | | $ | (24,826) | | | $ | 190,239 | | | $ | (54,360) | |
| Effective income tax rate (benefit rate) | | | | | 100 | % | | (68) | % |
| | | | | | | | | | | | | | | | | | | | | | | |
| Three Months Ended
September 30, | | Nine Months Ended
September 30, |
| (Dollars in thousands) | 2023 | | 2022 | | 2023 | | 2022 |
| Provision for income taxes | $ | 3,545 | | | $ | 11,748 | | | $ | 15,395 | | | $ | 190,239 | |
| Effective income tax rate | | | | | (26) | % | | (100) | % |
The change in theCompany’s effective income tax rate (benefit rate) in the nine months ended September 30, 20222023 was primarily due todriven by the recognition of a $191.9 million valuation allowance recognized at June 30, 2022, on the Company’s deferred tax assets in the U.S. and U.K deferredU.K. and projected taxable income in the U.S., partially offset by available tax assets. As a result of recordingcredits and losses in the valuation allowance, the Company is no longer recording any income tax benefit on its U.S and U.K losses. The $11.7 million provision for (benefit from) income taxes for the three months ended September 30, 2022 primarily represents non-U.K. foreign income taxes.U.S.
The Company recognizes deferred tax assets to the extent that it believes that these assets are more likely than not to be realized. Future realization of deferred tax assets ultimately depends on sufficient taxable income within the available carryback or carryforward periods. The Company’sA deferred tax valuation allowance requires significant judgment and uncertainties, including assumptions about future taxable income based on historical and projected information. On a quarterly basis,income. Quarterly, the Company reassesses the need for a valuation allowance on its existing net deferred tax assets by tax-paying jurisdiction, weighing positive and negative evidence to assess its recoverability. In making such a determination, the Company considersweighting all available and objectively verifiable negative and positive evidence, including projected future reversals of existing taxable temporary differences, committed contractual backlog (“Backlog”), projected future taxable income, inclusive ofincluding the impact of enacted legislation, tax-planning strategies, and results of recent operations. operating results.
The weight givenCompany intends to the potential effect of negative and positive evidence is commensurate with the extent to which it can be objectively verified.
As of June 30, 2022, the Company’s Backlog balance was not sufficient to recover our net deferred tax assets. The Backlog balance and other unsettled circumstances, impacting the Company’s operations, reduced the Backlog’s weight as objectively verifiable positive evidence to generate sufficient taxable income to recover its net deferred tax assets. These unsettled circumstances include growing and extended geopolitical turmoil, increasing inflation, and an uncertain global economic outlook.
As of June 30, 2022, the combination of the above factors caused the Company to conclude there is not sufficient objectively verifiable positive evidence to support that it is more likely than not the Company will generate sufficient future taxable income to recovermaintain a valuation allowance on the Company’s U.S. and U.K. net deferred tax assets. Accordingly, the Company recorded a valuation allowance of $191.9 million in income tax expense during the three months ended June 30, 2022.
The Company intends to continue maintaining a full valuation allowance on our U.S and U.K deferred tax assets until there is sufficient evidence exists to support the realization of these deferred tax assets.
NOTE 13.14. (LOSS) PER SHARE
Basic (loss) per share is calculated using the weighted-average number of common shares outstanding during the period. Diluted (loss) per share is calculated using the weighted-average number of common shares outstanding during the period, plus the dilutive effect of outstanding stock options, RSUs, and convertible senior notes.
Calculation of (loss) per share: | | | Three Months Ended
September 30, | | Nine Months Ended
September 30, | | Three Months Ended
September 30, | | Nine Months Ended
September 30, |
| (in thousands, except per share amounts) | (in thousands, except per share amounts) | 2022 | | 2021 | | 2022 | | 2021 | (in thousands, except per share amounts) | 2023 | | 2022 | | 2023 | | 2022 |
| Net (loss) | Net (loss) | $ | (93,520) | | | $ | (56,468) | | | $ | (380,195) | | | $ | (25,794) | | Net (loss) | $ | (7,279) | | | $ | (93,520) | | | $ | (74,857) | | | $ | (380,195) | |
| Weighted-average common shares outstanding | Weighted-average common shares outstanding | 81,996 | | | 81,526 | | | 81,842 | | | 81,284 | | Weighted-average common shares outstanding | 83,336 | | | 81,996 | | | 82,996 | | | 81,842 | |
| (Loss) per share, basic | (Loss) per share, basic | $ | (1.14) | | | $ | (0.69) | | | $ | (4.65) | | | $ | (0.32) | | (Loss) per share, basic | $ | (0.09) | | | $ | (1.14) | | | $ | (0.90) | | | $ | (4.65) | |
| | Net (loss) | Net (loss) | $ | (93,520) | | | $ | (56,468) | | | $ | (380,195) | | | $ | (25,794) | | Net (loss) | $ | (7,279) | | | $ | (93,520) | | | $ | (74,857) | | | $ | (380,195) | |
| Weighted-average common shares outstanding, assuming dilution (1) (2) (3) | Weighted-average common shares outstanding, assuming dilution (1) (2) (3) | 81,996 | | | 81,526 | | | 81,842 | | | 81,284 | | Weighted-average common shares outstanding, assuming dilution (1) (2) (3) | 83,336 | | | 81,996 | | | 82,996 | | | 81,842 | |
| (Loss) per share, diluted | (Loss) per share, diluted | $ | (1.14) | | | $ | (0.69) | | | $ | (4.65) | | | $ | (0.32) | | (Loss) per share, diluted | $ | (0.09) | | | $ | (1.14) | | | $ | (0.90) | | | $ | (4.65) | |
| Outstanding anti-dilutive stock options and RSUs (4) | Outstanding anti-dilutive stock options and RSUs (4) | 3,019 | | | 5,815 | | | 3,589 | | | 6,136 | | Outstanding anti-dilutive stock options and RSUs (4) | 2,255 | | | 3,019 | | | 1,652 | | | 3,589 | |
(1) In periods of loss, allAll dilutive securities are excluded in periods of loss as their inclusion would be anti-dilutive.
(2) The shares underlying the conversion options in the Company’s Notes are included using the if-converted method, if dilutive in the period. If the outstanding conversion options were fully exercised, the Company would issue an additional approximately 4.43.7 million shares.
PEGASYSTEMS INC.
NOTES TO UNAUDITED CONDENSED CONSOLIDATED FINANCIAL STATEMENTS (continued)
shares as of September 30, 2023.(3) The Company’s Capped Call Transactions represent the equivalent of approximately 4.43.7 million shares of the Company’s common stock (representing the number of shares for which the Notes are initially convertible). as of September 30, 2023. The Capped Call Transactions are expected to reduce common stock dilution and/or offset any potential cash payments the Company must make, other than for principal and interest, upon conversion of the Notes, with such reduction and/or offset subject to a cap of $196.44. The Capped Call Transactions are excluded from weighted-average common shares outstanding, assuming dilution, in all periods as their effect would be anti-dilutive.
PEGASYSTEMS INC.
NOTES TO UNAUDITED CONDENSED CONSOLIDATED FINANCIAL STATEMENTS (continued)
(4) Outstanding stock options and RSUs that were anti-dilutive under the treasury stock method in the period were excluded from the computation of diluted (loss) per share. These awards may be dilutive in the future.
NOTE 14.15. COMMITMENTS AND CONTINGENCIES
Commitments
See "Note 7. Leases" for additional information.
Legal proceedings
In addition to the matters below, the Company is or may become involved in a variety of claims, demands, suits, investigations, and proceedings that arise from time to time relating to matters incidental to the ordinary course of the Company’s business, including actions concerning contracts, intellectual property, employment, benefits, and securities matters. Regardless of the outcome, legal disputes can have a material effect on the Company because of defense and settlement costs, diversion of management resources, and other factors.
In addition, as the Company is a party to ongoing litigation, it is at least reasonably possible that ourthe Company’s estimates will change in the near term, and the effect may be material.
As of September 30, 2022 and December 31, 2021, theThe Company hashad no accrued losses for litigation.
Pegasystems Inc. v. Appian Corp. & Business Process Management Inc.
On July 3, 2019, the Company filed suit in Massachusetts federal court against Appian Corp. (“Appian”) and Business Process Management, Inc. (“BPM”) relating to a BPM “Market Report” that Appian had used to promote itself against the Company. Pegasystems Inc. v. Appian Corp. & Business Process Management Inc., No. 1:19-cv-11461 (D. Mass). On April 15, 2022, eachlitigation as of the parties filed motions for summary judgment with the court. On September 30, 2022, the court entered an order allowing in part2023 and denying in part each party’s motion for summary judgment, thereby narrowing the potential issues for trial. On October 24, 2022, the court entered an order setting a trial date of January 3, 2023. The Company continues to believe the counterclaims brought by Appian against the Company are without merit, and the Company intends to vigorously pursue its claims against Appian and defend against the counterclaims brought against the Company in this matter. The Company is unable to reasonably estimate possible damages or a range of possible damages in this matter given the Company’s belief that the damages claimed by Appian fail to satisfy the required legal standard, the status of the proceeding, and due to the uncertainty as to how a jury may rule if this ultimately proceeds to trial.December 31, 2022.
Appian Corp. v. Pegasystems Inc. & Youyong Zou
As previously reported, the Company is a defendant in litigation brought by Appian in the Circuit Court of Fairfax County, Virginia (the “Court”) titled Appian Corp. v. Pegasystems Inc. & Youyong Zou, No. 2020-07216 (Fairfax Cty. Ct.). On May 9, 2022, the jury rendered its verdict finding that the Company had misappropriated one or more of Appian’s trade secrets, that the Company had violated the Virginia Computer Crimes Act, and that the trade secret misappropriation was willful and malicious. The jury awarded damages in the amount of $2,036,860,045 for trade secret misappropriation and $1.00 for the violation ofviolating the Virginia Computer Crimes Act. On September 15, 2022, the circuit court of Fairfax County entered judgment in the amount of $2,060,479,287, consisting of the damages previously awarded by the jury plus attorneys’ fees and costs, and stating that the judgment is subject to post-judgment interest at a rate of 6.0% per annum, from the date of the jury verdict (May 9, 2022) as to the amount of the jury verdict and from September 15, 2022 as to the amount of the award of attorneys’ fees and costs. On September 15, 2022, the Company filed a notice of appeal from the judgment. On September 29, 2022, the circuit court of Fairfax County approved a $25,000,000 letter of credit obtained by the Company to secure the judgment and entered an order suspending the judgment during the pendency of the Company’s appeal. ThisAppellate briefing in the Court of Appeals of Virginia is completed. The Court of Appeals of Virginia has set November 15, 2023 as the date for oral arguments in the appeal. Although it is not possible to predict timing, this appeals process could potentially take years to complete. The Company continues to believe that it did not misappropriate any alleged trade secrets and that its sales of the Company’s products at issue were not caused by, or the result of, any alleged misappropriation of trade secrets. The Company is unable to reasonably estimate possible damages because of, among other things, uncertainty as to the outcome of appellate proceedings and/or any potential new trial resulting from the appellate proceedings.
PEGASYSTEMS INC.
NOTES TO UNAUDITED CONDENSED CONSOLIDATED FINANCIAL STATEMENTS (continued)
City of Fort Lauderdale Police and Firefighters’ Retirement System, Individually and on Behalf of All Others Similarly Situated v. Pegasystems Inc., Alan Trefler, and Kenneth Stillwell
On May 19, 2022, a lawsuit was filed against the Company, the Company’s chief executive officer and the Company’s chief operating and financial officer in the United States District Court for the Eastern District of Virginia Alexandria Division, captioned City of Fort Lauderdale Police and Firefighters’ Retirement System, Individually and on Behalf of All Others Similarly Situated v. Pegasystems Inc., Alan Trefler, and Kenneth Stillwell (Case 1:22-cv-00578-LMB-IDD). The complaint generally alleges, among other things, that the defendants violated Section 10(b) of the Securities Exchange Act of 1934, as amended (the “Exchange Act”) and Rule 10b-5 promulgated thereunder and that the individual defendants violated Section 20(a) of the Exchange Act, in each case by allegedly making materially false and/or misleading statements, as well as allegedly failing to disclose material adverse facts about the Company’s business, operations, and prospects, which caused the Company’s securities to trade at artificially inflated prices. The complaint seeks unspecified damages on behalf of a class of purchasers of the Company’s securities between May 29, 2020 and May 9, 2022. The litigation has since been transferred to the United States District Court for the District of Massachusetts (Case 1:22-cv-11220-WGY), and lead plaintiff class representatives—Central Pennsylvania Teamsters Pension Fund - Defined Benefit Plan, Central Pennsylvania Teamsters Pension Fund - Retirement Income Plan 1987, and Construction Industry Laborers Pension Fund—have been appointed. On October 18, 2022, a consolidated amended complaint was filed that does not add any new parties or legal claims, is based upon the same general factual allegations as the original complaint, and now seeks unspecified damages on behalf of a class of purchasers of the Company’s securities between June 16, 2020 and May 9, 2022. The Company moved to dismiss the consolidated amended complaint on December 19, 2022. The hearing on the Company’s motion to dismiss took place on May 17, 2023. After hearing argument from both sides, the Court denied the Company’s motion from the bench and stated that a written opinion would follow. On June 30, 2023, the Company filed its Answer to the complaint. On July 24, 2023, the Court issued its written opinion denying the motion to dismiss as to the Company and Defendant Trefler but granting the motion without prejudice as to Mr. Stillwell. The Company believes it has strong defenses to the claims brought against the defendants are without merit, and intends to vigorously defend against these claims.claims vigorously. The Company is unable to reasonably estimate possible damages or a range of possible damages in this matter given the stage of the lawsuit, the Company’s belief that it has strong defenses to the claims are without merit,asserted, its intent to defend against these claims, and there being no specified quantum of damages sought in the complaint.
PEGASYSTEMS INC.
NOTES TO UNAUDITED CONDENSED CONSOLIDATED FINANCIAL STATEMENTS (continued)
In re Pegasystems Inc., Derivative Litigation
On November 21, 2022, a lawsuit was filed against the members of the Company’s board of directors, the Company’s chief operating and financial officer and the Company in the United States District Court for the District of Massachusetts, captioned Mary Larkin, derivatively on behalf of nominal defendant Pegasystems Inc. v. Peter Gyenes, Richard Jones, Christopher Lafond, Dianne Ledingham, Sharon Rowlands, Alan Trefler, Larry Weber, and Kenneth Stillwell, defendants, and Pegasystems Inc., nominal defendant (Case 1:22-cv-11985). The complaint generally alleges the defendants sold shares of the Company while in possession of material nonpublic information relating to (i) the litigation brought by Appian in the Circuit Court of Fairfax County, Virginia, described above, and (ii) alleged misconduct by Company employees alleged in that litigation. On April 28, 2023, a lawsuit was filed in the United States District Court for the District of Massachusetts by Dag Sagfors, derivatively on behalf of nominal defendant Pegasystems Inc. asserting breach of fiduciary duty and related claims relating to the Virginia Appian litigation against the same defendants as the Larkin lawsuit. On May 17, 2023, the Larkin and Sagfors cases were consolidated and a joint motion to stay the consolidated case is pending before the Court. The Company also has received confidential demand letters raising substantially the same allegations set forth in the foregoing derivative complaints. On April 12, 2023, the Company’s board of directors (other than Mr. Trefler, who recused himself), formed a committee consisting solely of independent directors, to review, analyze, and investigate the matters raised in the demands and to determine in good faith what actions (if any) are reasonably believed to be appropriate under similar circumstances and reasonably believed to be in the best interests of the Company in response to the demand letters. The Company is unable to reasonably estimate possible damages or a range of possible damages in this matter given the stage of the lawsuit and there being no specified quantum of damages sought in the complaint.
SEC Inquiry
Beginning in March 2023, the U.S. Securities and Exchange Commission (“SEC”) has requested certain information relating to, among other things, the accounting treatment of the Company’s above-described litigation with Appian Corporation. The Company is fully cooperating with the SEC’s requests.
ITEM 2. MANAGEMENT’S DISCUSSION AND ANALYSIS OF FINANCIAL CONDITION AND RESULTS OF OPERATIONS
FORWARD-LOOKING STATEMENTS
This Quarterly Report on Form 10-Q (“Quarterly Report”) contains or incorporates forward-looking statements within the meaning of the Private Securities Litigation Reform Act of 1995.
Words such as expects, anticipates, intends, plans, believes, will, could, should, estimates, may, targets, strategies, intends to, projects, forecasts, guidance, likely, and usually or variations of such words and other similar expressions identify forward-looking statements, which speak only as of the date the statement was made and are based on current expectations and assumptions.
Forward-looking statements deal with future events and are subject to risks and uncertainties that are difficult to predict, including, but not limited to:
•our future financial performance and business plans;
•the adequacy of our liquidity and capital resources;
•the continued payment of our quarterly dividends;
•the timing of revenue recognition;
•management of our transition to a more subscription-based business model;
•variation in demand for our products and services, including among clients in the public sector;
•reliance on key personnel;
•global economic and political conditions and uncertainty, including continued impacts from the ongoing COVID-19 pandemicpublic health emergencies and the war in Ukraine;
•reliance on third-party service providers, including hosting providers;
•compliance with our debt obligations and covenants;
•the potential impact of our convertible senior notes and Capped Call Transactions;
•foreign currency exchange rates;
•the potential legal and financial liabilities and damage to our reputation due to cyber-attacks;
•security breaches and security flaws;
•our ability to protect our intellectual property rights, costs associated with defending such rights, intellectual property rights claims, and other related claims by third parties against us, including related costs, damages, and other relief that may be granted against us;
•our ongoing litigation with Appian Corp.;
•our client retention rate; and
•management of our growth.
These risks and others that may cause actual results to differ materially from those expressed in such forward-looking statements are described further in Part I of our Annual Report on Form 10-K for the year ended December 31, 2021,2022, Part II of this Quarterly Report on Form 10-Q, and other filings we make with the U.S. Securities and Exchange Commission (“SEC”).
ExceptInvestors are cautioned not to place undue reliance on such forward-looking statements, and there are no assurances that the results included in such statements will be achieved. Although subsequent events may cause our view to change, except as required by applicable law, we do not undertake and expressly disclaim any obligation to publicly update or revise these forward-looking statements publicly, whether due toas the result of new information, future events, or otherwise.
The forward-looking statements in this Quarterly Report represent our views as of October 26, 2022.25, 2023.
NON-GAAP MEASURES
Our non-GAAP financial measures should only be read in conjunction with our consolidated financial statements prepared in accordance with GAAP. We believe that these measures help investors understand our core operating results and prospects, consistent with how management measures and forecasts our performance without the effect of often one-time charges and other items outside our normal operations. They are not a substitute for financial measures prepared under U.S. GAAP. A reconciliation of GAAP and non-GAAP measures is located with each non-GAAP measure.
BUSINESS OVERVIEW
We develop, market, license, host, and support enterprise software that helps organizations build agility into their business so they can adapt to change. Our powerful low-code platform for workflow automation and AI-poweredartificial intelligence-powered decisioning enables the world’s leading brands and government agencies to hyper-personalize customer experiences, streamline customer service, and automate mission-critical business processes and workflows. With Pega, our clients can leverage our intelligent technology and scalable architecture to accelerate their digital transformation. In addition, our client success teams, world-class partners, and clients themselves leverage our Pega Express™ methodology to design and deploy mission-critical applications quickly and collaboratively.
Our target clients are Global 2000 organizations and government agencies that require solutions to distinguish themselves in the markets they serve. Our solutions achieve and facilitate differentiation by increasing business agility, driving growth, improving productivity, attracting and retaining customers, and reducing risk. Along with our partners, we deliver solutions tailored to our clients’the specific industry needs.
Subscription transition
We are transitioning our business to sell software primarily through subscription arrangements. Until we fully complete our subscription transition, which we expect will occur in 2023, our operating results may be impacted. Operating performance and the actual mix of revenue and new arrangements in each period can fluctuate based on client preferences for our perpetual and subscription offerings. See the “Risk Factors” sectionneeds of our Annual Report on Form 10-K for the year ended December 31, 2021 for additional information.
Coronavirus (“COVID-19”)
As of September 30, 2022, COVID-19 has not had a material impact on our results of operations or financial condition. See “Actual or threatened public health emergencies could harm our business” in the “Risk Factors” section of our Annual Report on Form 10-K for the year ended December 31, 2021 for additional information.
Ukraine
Our direct financial exposure to Ukraine, Russia, and Belarus is not material.
In 2021, before Russia's invasion of Ukraine, we made a business decision to stop pursuing new clients in Russia and closed our local office. For the year ended December 31, 2021, total revenue from clients located in Ukraine, Russia, and Belarus was less than $4.0 million. However, the ultimate impact of Russia’s invasion of Ukraine on our business will depend on future developments, including the duration and spread of the conflict and the impact on our people, partners, clients, and vendors in neighboring countries and globally, all of which are uncertain and unpredictable.clients.
Performance metrics
We use performance metrics to analyze and assess our overall performance, make operating decisions, and forecast and plan for future periods, including:
Annual contract value (“ACV”)
ACV represents the annualized value of our active contracts as of the measurement date. The contract's total value is divided by its duration in years to calculate ACV for subscription license and Pega Cloud contracts. Maintenance revenue for the quarter then ended is multiplied by four to calculate ACV for maintenance.ACV. ACV is a performance measure that we believe provides useful information to our management and investors, particularly during our subscription transition.investors.
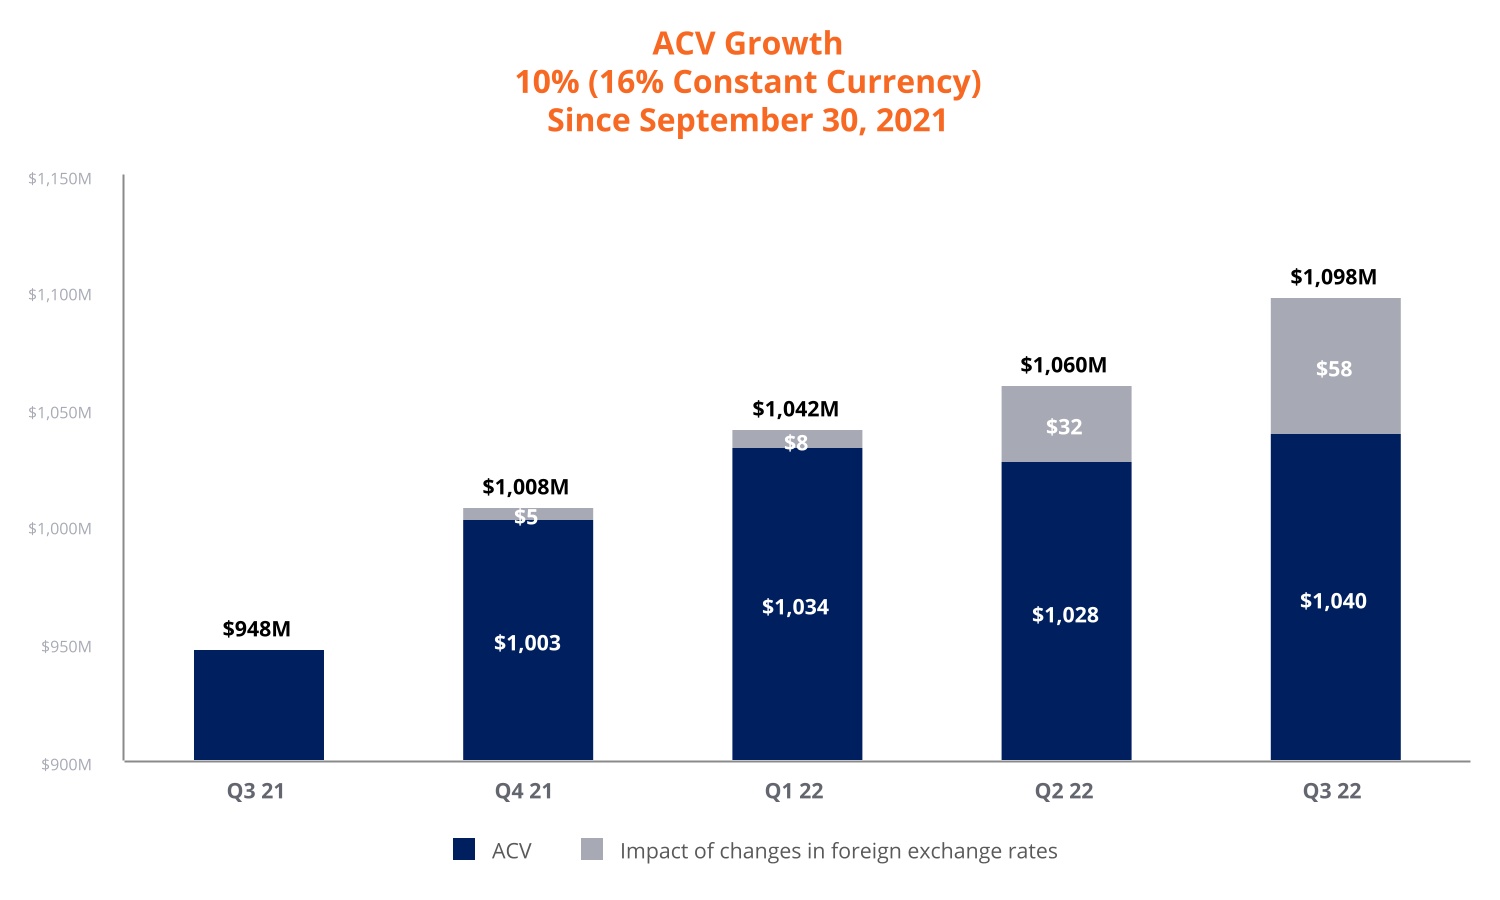
Reconciliation of ACV and Constant Currency ACV
| | | | | | | | | | | | | | | | | | | | | | | |
| (in millions, except percentages) | Q3 22 | | | | | | | | Q3 23 | | 1-Year Change |
| ACV | $ | 1,040 | | | | | | | | | $ | 1,169 | | | 12 | % |
| Impact of changes in foreign exchange rates | — | | | | | | | | | (22) | | | |
| Constant Currency ACV | $ | 1,040 | | | | | | | | | $ | 1,147 | | | 10 | % |
Note: Constant currency ACV is calculated by applying the Q3 2022 foreign exchange rates to all periods shown.
Cash flow (1)
Note: Starting in the third quarter of 2023, the Company has calculated free cash flow as cash provided by (used in) operating activities less investments in property and equipment. To ensure comparability, previously disclosed amounts have been updated.
| | | | | | | | | | | | | | | | | |
| (Dollars in thousands) | Nine Months Ended
September 30, |
| 2023 | | 2022 |
| | Margin (2) | | | Margin (2) |
| Cash provided by (used in) operating activities | $ | 137,920 | | 14 | % | | $ | (13,446) | | (1) | % |
| Investment in property and equipment | (14,271) | | | | (22,285) | | |
| Free cash flow | $ | 123,649 | | 13 | % | | $ | (35,731) | | (4) | % |
| | | | | |
| | | | | |
| | | | | |
Additional information (3) | | | | | |
| Legal fees | $ | 5,867 | | | | $ | 37,944 | | |
| Restructuring | 21,576 | | | | — | | |
| Interest on convertible senior notes | 4,134 | | | | 4,500 | | |
| Other | — | | | | 3,266 | | |
| $ | 31,577 | | | | $ | 45,710 | | |
(1) Our non-GAAP free cash flow is defined as cash provided by (used in) operating activities less investment in property and equipment. Investment in property and equipment fluctuates in amount and frequency and are significantly affected by the timing and size of investments in our facilities. We provide information on free cash flow to enable investors to assess our ability to generate cash without incurring additional external financings. This information is not a substitute for financial measures prepared under U.S. GAAP.
(2) Operating and Free Cash Flow Margin are calculated by comparing the respective cash flow to Total Revenue.
(3) The additional information discloses items that affect our cash flows and are considered by management not to be representative of our core business operations and ongoing operational performance.
•Legal fees: Includes legal and related fees arising from proceedings outside the ordinary course of business.
•Restructuring: Restructuring fluctuates in amount and frequency and is significantly affected by the timing and size of our restructuring activities.
•Interest on convertible senior notes: In February 2020, we issued convertible senior notes, due March 1, 2025, in a private placement. The Notes accrue interest at an annual rate of 0.75%, payable semi-annually in arrears on March 1 and September 1, beginning September 1, 2020.
•Other: Includes fees related to capital advisory services, canceled in-person sales and marketing events, and incremental costs incurred integrating acquisitions.
Remaining performance obligations (“Backlog”)
Reconciliation of GAAP Backlog and Constant Currency Backlog (Non-GAAP)
| | (in millions, except percentages) | (in millions, except percentages) | Q3 2022 | | 1 Year Growth Rate | (in millions, except percentages) | Q3 22 | | Q3 2023 | | 1-Year Growth Rate |
| Backlog | $ | 1,148 | | | 11 | % | |
| Backlog - GAAP | | Backlog - GAAP | $ | 1,148 | | | $ | 1,265 | | | 10 | % |
| Impact of changes in foreign exchange rates | Impact of changes in foreign exchange rates | 74 | | | 7 | % | Impact of changes in foreign exchange rates | — | | | (33) | | |
| Backlog - Constant Currency | $ | 1,222 | | | 18 | % | |
| Constant currency backlog | | Constant currency backlog | $ | 1,148 | | | $ | 1,232 | | | 7 | % |
measures areBacklog is calculated by applying the Q3 2022 foreign exchange rates for the earliest period shown to all periods. The above constant currency measures reflect foreign exchange rates applicable as of Q3 2021. We believe that non-GAAP financial measures help investors understand our core operating results and prospects, consistent with how management measures and forecasts our performance without the effect of often one-time charges and other items outside our normal operations. The supplementary non-GAAP financial measures are not meant to be superior to or a substitute for financial measures prepared under U.S. GAAP.periods shown.CRITICAL ACCOUNTING POLICIES
Management’s Discussion and Analysis of Financial Condition and Results of Operations is based upon our unaudited condensed consolidated financial statements, which have been prepared following accounting principles generally accepted in the United States of America (“U.S.”) and the rules and regulations of the SEC for interim financial reporting. The preparation ofPreparing these financial statements requires us to make estimates and judgments that affect the reported amounts of assets, liabilities, revenues, expenses, and the related disclosure of contingent assets and liabilities. We base our estimates and judgments on historical experience, knowledge of current conditions, and expectations of what could occur in the future, given the available information.
For more information about our critical accounting policies, we encourage you to read the discussion in the following locations in our Annual Report on Form 10-K for the year ended December 31, 2021:2022:
•“Critical Accounting Estimates and Significant Judgments” in Item 7; and
•“Note 2. Significant Accounting Policies” in Item 8.
We recorded a valuation allowance of $191.9 million in income tax expense during the three months ended June 30, 2022. See "Note 12. Income Taxes" in Part I, Item 1 of this Quarterly Report for additional information. There have been no other significant changes to our critical accounting policies as disclosed in our Annual Report on Form 10-K for the year ended December 31, 2021.
RESULTS OF OPERATIONS
Revenue
Subscription transition | | | | | | | | | | | | | | | | | | | | | | | | | | | | | | | | | | | | | | | | | | | | | | | | | | | | | |
| (Dollars in thousands) | Three Months Ended
September 30, | | Change | | Nine Months Ended
September 30, | | Change |
| 2023 | | 2022 | | | 2023 | | 2022 | |
| Pega Cloud | $ | 118,040 | | 35 | % | | $ | 97,359 | | 36 | % | | $ | 20,681 | | 21 | % | | $ | 340,982 | | 36 | % | | $ | 281,182 | | 31 | % | | $ | 59,800 | | 21 | % |
| Maintenance | 83,538 | | 25 | % | | 77,526 | | 29 | % | | 6,012 | | 8 | % | | 245,210 | | 25 | % | | 235,568 | | 25 | % | | 9,642 | | 4 | % |
| Subscription services | 201,578 | | 60 | % | | 174,885 | | 65 | % | | 26,693 | | 15 | % | | 586,192 | | 61 | % | | 516,750 | | 56 | % | | 69,442 | | 13 | % |
| Subscription license | 74,342 | | 22 | % | | 31,112 | | 11 | % | | 43,230 | | 139 | % | | 200,066 | | 21 | % | | 210,245 | | 23 | % | | (10,179) | | (5) | % |
| Subscription | 275,920 | | 82 | % | | 205,997 | | 76 | % | | 69,923 | | 34 | % | | 786,258 | | 82 | % | | 726,995 | | 79 | % | | 59,263 | | 8 | % |
| Consulting | 55,976 | | 17 | % | | 55,511 | | 21 | % | | 465 | | 1 | % | | 167,396 | | 18 | % | | 175,451 | | 19 | % | | (8,055) | | (5) | % |
| Perpetual license | 2,747 | | 1 | % | | 9,223 | | 3 | % | | (6,476) | | (70) | % | | 4,729 | | — | % | | 18,929 | | 2 | % | | (14,200) | | (75) | % |
| $ | 334,643 | | 100 | % | | $ | 270,731 | | 100 | % | | $ | 63,912 | | 24 | % | | $ | 958,383 | | 100 | % | | $ | 921,375 | | 100 | % | | $ | 37,008 | | 4 | % |
We are transitioning our business to sell software primarily through subscription arrangements.
This transition has impacted the optics of revenue growth as revenue from subscription service arrangements, which includes•The increases in Pega Cloud and maintenance, is typically recognized over the contract term, while revenue from license sales is recognized when the license rights become effective, typically upfront.
| | | | | | | | | | | | | | | | | | | | | | | | | | | | | | | | | | | | | | | | | | | | | | | | | | | | | |
| (Dollars in thousands) | Three Months Ended
September 30, | | Change | | Nine Months Ended
September 30, | | Change |
| 2022 | | 2021 | | | 2022 | | 2021 | |
| Pega Cloud | $ | 97,359 | | 36 | % | | $ | 78,369 | | 31 | % | | $ | 18,990 | | 24 | % | | $ | 281,182 | | 31 | % | | $ | 219,520 | | 25 | % | | $ | 61,662 | | 28 | % |
| Maintenance | 77,526 | | 29 | % | | 83,188 | | 32 | % | | (5,662) | | (7) | % | | 235,568 | | 25 | % | | 237,531 | | 26 | % | | (1,963) | | (1) | % |
| Subscription services | 174,885 | | 65 | % | | 161,557 | | 63 | % | | 13,328 | | 8 | % | | 516,750 | | 56 | % | | 457,051 | | 51 | % | | 59,699 | | 13 | % |
| Subscription license | 31,112 | | 11 | % | | 35,421 | | 14 | % | | (4,309) | | (12) | % | | 210,245 | | 23 | % | | 251,226 | | 28 | % | | (40,981) | | (16) | % |
| Subscription | 205,997 | | 76 | % | | 196,978 | | 77 | % | | 9,019 | | 5 | % | | 726,995 | | 79 | % | | 708,277 | | 79 | % | | 18,718 | | 3 | % |
| Perpetual license | 9,223 | | 3 | % | | 2,874 | | 1 | % | | 6,349 | | 221 | % | | 18,929 | | 2 | % | | 20,922 | | 2 | % | | (1,993) | | (10) | % |
| Consulting | 55,511 | | 21 | % | | 56,416 | | 22 | % | | (905) | | (2) | % | | 175,451 | | 19 | % | | 166,270 | | 19 | % | | 9,181 | | 6 | % |
| $ | 270,731 | | 100 | % | | $ | 256,268 | | 100 | % | | $ | 14,463 | | 6 | % | | $ | 921,375 | | 100 | % | | $ | 895,469 | | 100 | % | | $ | 25,906 | | 3 | % |
The revenue changes infor the three and nine months ended September 30, 2022 generally reflect2023 were primarily due to the impactgrowth of the hosted client base as our subscription transition. Other factors impacting our revenue include:
•The United States Dollar has strengthened against foreign currencies in the markets we operate, which reduced total revenue growth in the three and nine months ended September 30, 2022 by approximately 5 percent.clients continued to expand their use of Pega Cloud.
•The decreases in subscription license revenue in the three and nine months ended September 30, 2022 were primarily due to several large software license contracts recognized in revenue in the three and nine months ended September 30, 2021.
•The decreasesincreases in maintenance revenue in the three and nine months ended September 30, 20222023 were primarily due to changes in foreign currency exchange rates and the continuing shift to Pega Cloud.continued demand for our subscription license offerings which are generally bundled with maintenance.
•The increase in subscription license revenue in the three months ended September 30, 2023 was primarily due to increased license deliveries in the three months ended September 30, 2023. The decrease in subscription license revenue in the nine months ended September 30, 2023 was primarily due to several large multi-year contracts recognized in revenue in the nine months ended September 30, 2022.
•The decrease in consulting revenue in the nine months ended September 30, 20222023 was primarily due to an increaselower consultant realization rates in consultant billable hoursthe Americas.
•The decreases in North America.
Gross profit
| | | | | | | | | | | | | | | | | | | | | | | | | | | | | | | | | | | | | | | | | | | | | | | | | | | | | |
| (Dollars in thousands) | Three Months Ended
September 30, | | Change | | Nine Months Ended
September 30, | | Change |
| 2022 | | 2021 | | | 2022 | | 2021 | |
| Pega Cloud | $ | 68,673 | | 71 | % | | $ | 52,845 | | 67 | % | | $ | 15,828 | | 30 | % | | $ | 194,350 | | 69 | % | | $ | 147,388 | | 67 | % | | $ | 46,962 | | 32 | % |
| Maintenance | 71,671 | | 92 | % | | 77,895 | | 94 | % | | (6,224) | | (8) | % | | 219,296 | | 93 | % | | 221,457 | | 93 | % | | (2,161) | | (1) | % |
| Subscription services | 140,344 | | 80 | % | | 130,740 | | 81 | % | | 9,604 | | 7 | % | | 413,646 | | 80 | % | | 368,845 | | 81 | % | | 44,801 | | 12 | % |
| Subscription license | 30,484 | | 98 | % | | 34,815 | | 98 | % | | (4,331) | | (12) | % | | 208,322 | | 99 | % | | 249,415 | | 99 | % | | (41,093) | | (16) | % |
| Subscription | 170,828 | | 83 | % | | 165,555 | | 84 | % | | 5,273 | | 3 | % | | 621,968 | | 86 | % | | 618,260 | | 87 | % | | 3,708 | | 1 | % |
| Perpetual license | 9,120 | | 99 | % | | 2,824 | | 98 | % | | 6,296 | | 223 | % | | 18,756 | | 99 | % | | 20,771 | | 99 | % | | (2,015) | | (10) | % |
| Consulting | (2,267) | | (4) | % | | 3,667 | | 6 | % | | (5,934) | | * | | 4,289 | | 2 | % | | 5,238 | | 3 | % | | (949) | | (18) | % |
| $ | 177,681 | | 66 | % | | $ | 172,046 | | 67 | % | | $ | 5,635 | | 3 | % | | $ | 645,013 | | 70 | % | | $ | 644,269 | | 72 | % | | $ | 744 | | — | % |
* not meaningful
The gross profit percent changesperpetual license revenue in the three and nine months ended September 30, 2022 were primarily due to a shift in the revenue mix.2023 reflects our strategy of promoting subscription-based arrangements.
Gross profit
| | | | | | | | | | | | | | | | | | | | | | | | | | | | | | | | | | | | | | | | | | | | | | | | | | | | | |
| (Dollars in thousands) | Three Months Ended
September 30, | | Change | | Nine Months Ended
September 30, | | Change |
| 2023 | | 2022 | | | 2023 | | 2022 | |
| Pega Cloud | $ | 88,553 | | 75 | % | | $ | 68,673 | | 71 | % | | $ | 19,880 | | 29 | % | | $ | 250,943 | | 74 | % | | $ | 194,350 | | 69 | % | | $ | 56,593 | | 29 | % |
| Maintenance | 77,119 | | 92 | % | | 71,671 | | 92 | % | | 5,448 | | 8 | % | | 225,696 | | 92 | % | | 219,296 | | 93 | % | | 6,400 | | 3 | % |
| Subscription services | 165,672 | | 82 | % | | 140,344 | | 80 | % | | 25,328 | | 18 | % | | 476,639 | | 81 | % | | 413,646 | | 80 | % | | 62,993 | | 15 | % |
| Subscription license | 73,713 | | 99 | % | | 30,484 | | 98 | % | | 43,229 | | 142 | % | | 198,095 | | 99 | % | | 208,322 | | 99 | % | | (10,227) | | (5) | % |
| Subscription | 239,385 | | 87 | % | | 170,828 | | 83 | % | | 68,557 | | 40 | % | | 674,734 | | 86 | % | | 621,968 | | 86 | % | | 52,766 | | 8 | % |
| Consulting | (1,228) | | (2) | % | | (2,267) | | (4) | % | | 1,039 | | 46 | % | | (8,866) | | (5) | % | | 4,289 | | 2 | % | | (13,155) | | * |
| Perpetual license | 2,723 | | 99 | % | | 9,120 | | 99 | % | | (6,397) | | (70) | % | | 4,678 | | 99 | % | | 18,756 | | 99 | % | | (14,078) | | (75) | % |
| $ | 240,880 | | 72 | % | | $ | 177,681 | | 66 | % | | $ | 63,199 | | 36 | % | | $ | 670,546 | | 70 | % | | $ | 645,013 | | 70 | % | | $ | 25,533 | | 4 | % |
* not meaningful
•The increases in Pega Cloud gross profit percent in the three and nine months ended September 30, 20222023 were primarily due to cost-efficiency gainsincreased cost efficiency, particularly for hosting services, as Pega Cloud growscontinues to grow and scales.scale.
•The decrease in Maintenancemaintenance gross profit percent in the nine months ended September 30, 2023 was primarily due to an increase in compensation and benefits as a result of increased headcount.
•The increase in consulting gross profit percent in the three months ended September 30, 20222023 was primarily due to ahigher consultant utilization in the Americas. The decrease in maintenance revenue.consulting profit percent in the nine months ended September 30, 2023, was primarily due to lower consultant realization rates in the Americas.
Operating expenses
| | | | | | | | | | | | | | | | | | | | | | | | | | | | | | | | | | | | | | | | | |
| (Dollars in thousands) | Three Months Ended
September 30, | | Change | | Nine Months Ended
September 30, | | Change |
| 2023 | | 2022 | | | 2023 | | 2022 | |
| Selling and marketing | $ | 131,598 | | | $ | 153,517 | | | $ | (21,919) | | (14) | % | | $ | 425,253 | | | $ | 472,951 | | | $ | (47,698) | | (10) | % |
| % of Revenue | 39 | % | | 57 | % | | | | | 44 | % | | 51 | % | | | |
| Research and development | $ | 74,955 | | | $ | 75,342 | | | $ | (387) | | (1) | % | | $ | 224,262 | | | $ | 221,173 | | | $ | 3,089 | | 1 | % |
| % of Revenue | 22 | % | | 28 | % | | | | | 23 | % | | 24 | % | | | |
| General and administrative | $ | 27,321 | | | $ | 26,043 | | | $ | 1,278 | | 5 | % | | $ | 73,893 | | | $ | 94,530 | | | $ | (20,637) | | (22) | % |
| % of Revenue | 8 | % | | 10 | % | | | | | 8 | % | | 10 | % | | | |
| Restructuring | $ | 17,822 | | | $ | — | | | $ | 17,822 | | 100 | % | | $ | 21,450 | | | $ | — | | | $ | 21,450 | | 100 | % |
| % of Revenue | 5 | % | | — | % | | | | | 2 | % | | — | % | | | |
•The decreases in consulting gross profit percent inselling and marketing during the three and nine months ended September 30, 20222023 were primarily due to decreases in compensation and benefits of $18.6 million and $45.0 million, respectively. The decreases were due to increasesreduced headcount as we optimize our go-to-market strategy. For additional information, see "Note 9. Restructuring" in consultant availability.Part I, Item 1 of this Quarterly Report.
Operating expenses
| | | | | | | | | | | | | | | | | | | | | | | | | | | | | | | | | | | | | | | | | | | | | | | | | | | | | |
| (Dollars in thousands) | Three Months Ended
September 30, | | Change | | Nine Months Ended
September 30, | | Change |
| 2022 | | 2021 | | | 2022 | | 2021 | |
| % of Revenue | | | % of Revenue | | | | | | % of Revenue | | | % of Revenue | | | |
| Selling and marketing | $ | 153,517 | | 57 | % | | $ | 152,479 | | 59 | % | | $ | 1,038 | | 1 | % | | $ | 472,951 | | 51 | % | | $ | 457,641 | | 51 | % | | $ | 15,310 | | 3 | % |
| Research and development | $ | 75,342 | | 28 | % | | $ | 64,728 | | 25 | % | | $ | 10,614 | | 16 | % | | $ | 221,173 | | 24 | % | | $ | 191,565 | | 21 | % | | $ | 29,608 | | 15 | % |
| General and administrative | $ | 26,043 | | 10 | % | | $ | 20,176 | | 8 | % | | $ | 5,867 | | 29 | % | | $ | 94,530 | | 10 | % | | $ | 57,607 | | 6 | % | | $ | 36,923 | | 64 | % |
•The increase in sellingresearch and marketing indevelopment for the nine months ended September 30, 20222023 was primarily due to an increaseadditional investments in employee travelour products and entertainment and marketing events of $10.7 million.services.
•The increases in research and development in the three and nine months ended September 30, 2022 were primarily due to increases in compensation and benefits of $7.5 million and $19.6 million, attributable to increases in headcount and incentive compensation. The increases in headcount reflects additional investments in developing our solutions.
•The increaseschanges in general and administrative in the three and nine months ended September 30, 20222023 were primarily due to increasesan increase of $2.3 million in compensationthe three months ended September 30, 2023 and benefitsa decrease of $2.9$21.4 million and $5.7 million, facilities expenses of $1.1 million and $2.8 million, andin the nine months ended September 30, 2023 in legal fees and related expenses arising from litigation proceedings outside the ordinary course of business of $0.4 million and $24.0 million.business. We have incurred and expect to continue to incur additional expensescosts for these proceedings in 2022.proceedings. See "Note 14.15. Commitments and Contingencies" in Part I, Item 1 of this Quarterly Report and “Risk Factors” in Part II,I, Item 1A of this Quarterlyour Annual Report for the year ended December 31, 2022 for additional information.
•The increases in restructuring expenses during the three and nine months ended September 30, 2023 were primarily due to our efforts to optimize our go-to-market organization. For additional information, see "Note 9. Restructuring" in Part I, Item 1 of this Quarterly Report.
Other income and expenses | | (Dollars in thousands) | (Dollars in thousands) | Three Months Ended
September 30, | | Change | | Nine Months Ended
September 30, | | Change | (Dollars in thousands) | Three Months Ended
September 30, | | Change | | Nine Months Ended
September 30, | | Change |
| 2022 | | 2021 | | 2022 | | 2021 | | 2023 | | 2022 | | 2023 | | 2022 | |
| Foreign currency transaction gain (loss) | Foreign currency transaction gain (loss) | $ | 3,826 | | | $ | 518 | | | $ | 3,308 | | 639 | % | | $ | 8,415 | | | $ | (4,983) | | | $ | 13,398 | | * | Foreign currency transaction gain (loss) | $ | 1,994 | | | $ | 3,826 | | | $ | (1,832) | | (48) | % | | $ | (3,971) | | | $ | 8,415 | | | $ | (12,386) | | * |
| Interest income | Interest income | 520 | | | 166 | | | 354 | | 213 | % | | 1,036 | | | 555 | | | 481 | | 87 | % | Interest income | 2,532 | | | 520 | | | 2,012 | | 387 | % | | 5,831 | | | 1,036 | | | 4,795 | | 463 | % |
| Interest expense | Interest expense | (1,992) | | | (1,908) | | | (84) | | (4) | % | | (5,882) | | | (5,747) | | | (135) | | (2) | % | Interest expense | (1,533) | | | (1,992) | | | 459 | | 23 | % | | (5,229) | | | (5,882) | | | 653 | | 11 | % |
| (Loss) on capped call transactions | (Loss) on capped call transactions | (6,876) | | | (14,735) | | | 7,859 | | 53 | % | | (56,381) | | | (7,543) | | | (48,838) | | (647) | % | (Loss) on capped call transactions | (2,294) | | | (6,876) | | | 4,582 | | 67 | % | | (449) | | | (56,381) | | | 55,932 | | 99 | % |
| Other (loss) income, net | (29) | | | 2 | | | (31) | | * | | 6,497 | | | 108 | | | 6,389 | | 5,916 | % | |
| Other income (loss), net | | Other income (loss), net | 6,383 | | | (29) | | | 6,412 | | * | | 18,668 | | | 6,497 | | | 12,171 | | 187 | % |
|
| $ | (4,551) | | | $ | (15,957) | | | $ | 11,406 | | 71 | % | | $ | (46,315) | | | $ | (17,610) | | | $ | (28,705) | | (163) | % |
| $ | 7,082 | | | $ | (4,551) | | | $ | 11,633 | | * | | $ | 14,850 | | | $ | (46,315) | | | $ | 61,165 | | * |
* not meaningful
•The increaseschanges in foreign currency transaction gain (loss) in the three and nine months ended September 30, 20222023 were primarily due to the impact of fluctuations in foreign currency exchange rates associated with foreign currency-denominated cash and receivables held by our subsidiary in the United Kingdom.
•The increases in interest income in the three and nine months ended September 30, 20222023 were primarily due to increases in market interest rates.
•The decreases in interest expense in the three and nine months ended September 30, 2023 were due to our repurchases of Convertible Senior Notes in the nine months ended September 30, 2023. For additional information, see "Note 8. Debt" in Part I, Item 1 of this Quarterly Report.
•The changes in (loss) on capped call transactions in the three and nine months ended September 30, 20222023 were due to fair value adjustments for our capped call transactions. See
•The increase in other income (loss), net in the three months ended September 30, 2023 was due to a $6.4 million increase in the value of equity securities held in our venture investments portfolio. The increase in other income (loss), net in the nine months ended September 30, 2023, was due to a $7.9 million gain from repurchases of our convertible senior notes and a $10.9 million increase in the value of equity securities held in our venture investments portfolio. For additional information, see “Note 8. Debt” and "Note 9.10. Fair Value Measurements" in Part I, Item 1 of this Quarterly ReportReport.
Provision for additional information.income taxes | | | | | | | | | | | | | | | |
| | | Nine Months Ended
September 30, |
| (Dollars in thousands) | | | | | 2023 | | 2022 |
| Provision for income taxes | | | | | $ | 15,395 | | | $ | 190,239 | |
| Effective income tax rate | | | | | (26) | % | | (100) | % |
•The increase in other (loss)effective income nettax rate in the nine months ended September 30, 2022 was due to gains on our venture investments portfolio.
Provision for (benefit from) income taxes | | | | | | | | | | | | | | | | | | | | | | | |
| Three Months Ended
September 30, | | Nine Months Ended
September 30, |
| (Dollars in thousands) | 2022 | | 2021 | | 2022 | | 2021 |
| Provision for (benefit from) income taxes | $ | 11,748 | | | $ | (24,826) | | | $ | 190,239 | | | $ | (54,360) | |
| Effective income tax rate (benefit rate) | | | | | 100 | % | | (68) | % |
During the nine months ended September 30, 2022, the change in our effective income tax rate (benefit rate)2023 was primarily due to the recognition of a $191.9 million valuation allowance recognized at June 30, 2022, on our U.S. and U.K deferred tax assets. As a result of recordingdriven by the valuation allowance we are no longer recording any income tax benefit on our U.Sdeferred tax assets in the U.S. and U.K losses. The $11.7 million provision for (benefit from)U.K. and projected taxable income taxes forin the three months ended September 30, 2022 primarily represents non-U.K. foreign income taxes.U.S., partially offset by available tax credits and losses in the U.S.
LIQUIDITY AND CAPITAL RESOURCES | | | Nine Months Ended
September 30, | | Nine Months Ended
September 30, |
| (in thousands) | (in thousands) | 2022 | | 2021 | (in thousands) | 2023 | | 2022 |
| Cash provided by (used in): | Cash provided by (used in): | | | | Cash provided by (used in): | | | |
| Operating activities | Operating activities | $ | (13,446) | | | $ | (5,321) | | Operating activities | $ | 137,920 | | | $ | (13,446) | |
| Investing activities | Investing activities | 10,104 | | | 42,730 | | Investing activities | (24,176) | | | 10,104 | |
| Financing activities | Financing activities | (43,484) | | | (91,431) | | Financing activities | (85,031) | | | (43,484) | |
| Effect of exchange rates on cash and cash equivalents | (5,513) | | | (1,466) | | |
| Net (decrease) in cash and cash equivalents | $ | (52,339) | | | $ | (55,488) | | |
| Effect of exchange rate changes on cash, cash equivalents, and restricted cash | | Effect of exchange rate changes on cash, cash equivalents, and restricted cash | (1,621) | | | (5,513) | |
| Net increase (decrease) in cash, cash equivalents, and restricted cash | | Net increase (decrease) in cash, cash equivalents, and restricted cash | $ | 27,092 | | | $ | (52,339) | |
| | (in thousands) | (in thousands) | September 30, 2022 | | December 31, 2021 | (in thousands) | September 30, 2023 | | December 31, 2022 |
| Held by U.S. entities | Held by U.S. entities | $ | 226,640 | | | $ | 274,813 | | Held by U.S. entities | $ | 217,735 | | | $ | 248,389 | |
| Held by foreign entities | Held by foreign entities | 49,071 | | | 87,966 | | Held by foreign entities | 118,574 | | | 48,832 | |
| Total cash, cash equivalents, and marketable securities | Total cash, cash equivalents, and marketable securities | $ | 275,711 | | | $ | 362,779 | | Total cash, cash equivalents, and marketable securities | $ | 336,309 | | | $ | 297,221 | |
We believe that our current cash, cash flow fromprovided by operations, borrowing capacity, and ability to engage in capital market transactions will be sufficient to fund our operations, stock repurchases, and quarterly cash dividends for at least the next 12 months and to meet our known long-term cash requirements. Whether these resources are adequate to meet our liquidity needs beyond that period will depend on our future growth, operating results, and the investments needed to support our operations. We may utilize available funds or seek additional external financing if we require additional capital resources.
If it becomes necessary or desirable to repatriate foreign funds, we may have to pay U.S.federal, state, and local income taxes as well as foreign withholding taxes upon repatriation. However, estimating the taxes we would have to pay is impracticable due to the complexity of income tax laws and regulations, it is impracticable to estimate the amount of taxes we would have to pay.regulations.
Operating activities
We are transitioning our business to sell software primarily through subscription arrangements. This transition has impacted and is expected to continue impacting our billings and cash collections, as subscription licenses and services are generally billed and collected over the contract term, while perpetual license arrangements are generally billed and collected upfront when the license rights become effective.
The change in cash provided by (used in) operating activities in the nine months ended September 30, 20222023 was primarily due to our subscription transition and increased costs as we made investmentsgrowth in research and development to support developmentclient collections, the impact of our offerings partially offset by strong client collections. In addition, in the nine months ended September 30, 2022cost-efficiency initiatives, and 2021, we incurred $32.4 million and $8.4 million inlower legal fees and related expensescosts arising from proceedings that originated outside of the ordinary course of business. We expect to continue to incur additional expensescosts for these proceedings. SeeFor additional information, see “Note 9. Restructuring” and "Note 14.15. Commitments and Contingencies" in Part I, Item 1 of this Quarterly Report for additional information.Report.
Investing activities
The change in cash (used in) provided by investing activities in the nine months ended September 30, 20222023 was primarily driven bydue to our investments in financial instruments and an increasereduced investment in property and equipment as we optimize our office space related capital expenditures.space.
Financing activities
Debt financing
In February 2020, we issued $600 million in aggregate principal amount of convertible senior notes, which mature on March 1, 2025. In the nine months ended September 30, 2023, we paid $89 million to repurchase $97.7 million in aggregate principal amount of convertible senior notes. As of September 30, 2023, we had $502 million in aggregate principal amount of convertible senior notes outstanding due on March 1, 2025. For additional information, see "Note 8. Debt" in Part I, Item 1 of this Quarterly Report.
In November 2019, and as since amended, we entered into a five-year $100 million senior secured revolving credit agreement (the “Credit Facility”) with PNC Bank, National Association. As of September 30, 2023 and December 31, 2022, we had no outstanding cash borrowings under the Credit Facility but had $27.3 million in outstanding letters of credit, which reducereduced the Company’s available borrowing capacity. Seecapacity under the Credit Facility and no outstanding cash borrowings under the Credit Facility. For additional information, see "Note 8. Debt" in Part I, Item 1 of this Quarterly Report for additional information.Report.
Stock repurchase program
Changes in the remaining stock repurchase authority: | | | | | |
| (in thousands) | Nine Months Ended
September 30, 20222023 |
December 31, 20212022 | $ | 22,58358,075 | |
Authorizations (1) | 60,0001,925 | |
Repurchases (2)
| (24,508) | |
September 30, 20222023 | $ | 58,07560,000 | |
(1) On June 2, 2022, we announced thatApril 25, 2023, our Board of Directors extended the current stock repurchase program’s expiration date of our current share repurchase program from June 30, 2023 to June 30, 2023.
(2) All purchases under this program have been made on2024, and the open market.
amount of stock we are authorized to repurchase was increased to $60 million.Common stock repurchases | | | Nine Months Ended
September 30, | | Nine Months Ended
September 30, |
| | 2022 | | 2021 | | 2023 | | 2022 |
| (in thousands) | (in thousands) | Shares | | Amount | | Shares | | Amount | (in thousands) | Shares | | Amount | | Shares | | Amount |
| Repurchases paid | 279 | | | $ | 24,508 | | | 245 | | | $ | 31,788 | | |
| Repurchases unpaid at period end | — | | | — | | | 3 | | | 400 | | |
| | Stock repurchase program | Stock repurchase program | 279 | | | 24,508 | | | 248 | | | 32,188 | | Stock repurchase program | — | | | — | | | 279 | | | 24,508 | |
| Tax withholdings for net settlement of equity awards | Tax withholdings for net settlement of equity awards | 253 | | | 17,575 | | | 462 | | | 59,819 | | Tax withholdings for net settlement of equity awards | 39 | | | 1,654 | | | 253 | | | 17,575 | |
| | 532 | | | $ | 42,083 | | | 710 | | | $ | 92,007 | | | 39 | | | $ | 1,654 | | | 532 | | | $ | 42,083 | |
DuringIn the nine months ended September 30, 20222023 and 2021,2022, instead of receiving cash from the equity holders, we withheld shares with a value of $11.5$1.0 million and $47.1$11.5 million, respectively, for the exercise price of options. These amounts are not included in the table above.
Dividends
We intend to pay a quarterly cash dividend of $0.03 per share. However, the Board of Directors may terminate or modify the dividend program without prior notice. | | | Nine Months Ended
September 30, | | Nine Months Ended
September 30, |
| (in thousands) | (in thousands) | 2022 | | 2021 | (in thousands) | 2023 | | 2022 |
| Dividend payments to stockholders | Dividend payments to stockholders | $ | 7,368 | | | $ | 7,310 | | Dividend payments to stockholders | $ | 7,458 | | | $ | 7,368 | |
Contractual obligations
As of September 30, 2022,2023, our contractual obligations were: | | | Payments due by period | | | Payments due by period | |
| (in thousands) | (in thousands) | Remainder of 2022 | | 2023 | | 2024 | | 2025 | | 2026 | | 2027 and thereafter | | Other | | Total | (in thousands) | Remainder of 2023 | | 2024 | | 2025 | | 2026 | | 2027 | | 2028 and after | | Other | | Total |
Convertible senior notes (1) | Convertible senior notes (1) | $ | — | | | $ | 4,500 | | | $ | 4,500 | | | $ | 602,250 | | | $ | — | | | $ | — | | | $ | — | | | $ | 611,250 | | Convertible senior notes (1) | $ | — | | | $ | 3,767 | | | $ | 504,154 | | | $ | — | | | $ | — | | | $ | — | | | $ | — | | | $ | 507,921 | |
Purchase obligations (2) | Purchase obligations (2) | 7,925 | | | 14,802 | | | 15,479 | | | 17,594 | | | 14,492 | | | 14 | | | — | | | 70,306 | | Purchase obligations (2) | 43,491 | | | 134,122 | | | 126,065 | | | 120,745 | | | 134,060 | | | 177 | | | — | | | 558,660 | |
| Operating lease obligations | Operating lease obligations | (4,717) | | | 18,804 | | | 16,841 | | | 14,778 | | | 11,257 | | | 48,397 | | | — | | | 105,360 | | Operating lease obligations | 4,775 | | | 17,976 | | | 14,870 | | | 10,853 | | | 9,808 | | | 39,299 | | | — | | | 97,581 | |
Liability for uncertain tax positions (3) | — | | | — | | | — | | | — | | | — | | | — | | | 1,242 | | | 1,242 | | |
Venture investment commitments (3) | | Venture investment commitments (3) | 500 | | | 500 | | | — | | | — | | | — | | | — | | | — | | | 1,000 | |
Liability for uncertain tax positions (4) | | Liability for uncertain tax positions (4) | — | | | — | | | — | | | — | | | — | | | — | | | 2,017 | | | 2,017 | |
| | $ | 3,208 | | | $ | 38,106 | | | $ | 36,820 | | | $ | 634,622 | | | $ | 25,749 | | | $ | 48,411 | | | $ | 1,242 | | | $ | 788,158 | | | $ | 48,766 | | | $ | 156,365 | | | $ | 645,089 | | | $ | 131,598 | | | $ | 143,868 | | | $ | 39,476 | | | $ | 2,017 | | | $ | 1,167,179 | |
(1) Includes principal and interest.
(2) Represents the fixed or minimum amounts due underamount owed for purchase obligations forof software licenses, hosting services, and sales and marketing programs.
(3) Represents the maximum funding under existing venture investment agreements. Our venture investment agreements generally allow us to withhold unpaid funds at our discretion.
(4) We are unable tocannot reasonably estimate the timing of this cash outflow due to uncertainties in the timing of the effective settlement of tax positions.
ITEM 3. QUANTITATIVE AND QUALITATIVE DISCLOSURES ABOUT MARKET RISK
Market risk is the risk of loss from adverse changes in financial market prices and rates.
Foreign currency exposure
Translation risk
Our international operations’ operating expenses are primarily denominated in foreign currencies. However, our international sales are also primarily denominated in foreign currencies, which partially offsetsoffsetting our foreign currency exposure.
A hypothetical 10% strengthening in the U.S. dollar against other currencies would have resulted in:in the following: | | | | | | | | | | | |
| Nine Months Ended
September 30, |
| 2022 | | 2021 |
| (Decrease) increase in revenue | (4) | % | | (4) | % |
| Increase (decrease) in net income | 2 | % | | (9) | % |
| | | | | | | | | | | |
| Nine Months Ended
September 30, |
| 2023 | | 2022 |
| (Decrease) in revenue | (4) | % | | (4) | % |
| (Decrease) increase in net income | (5) | % | | 2 | % |
Remeasurement risk
We incur transaction gains and losses from the remeasurement of monetary assets and liabilities denominated in currencies other than the functional currency of the entities in which they are recorded.
We are primarily exposed to changes in foreign currency exchange rates associated with the Australian dollar, Euro, and U.S. dollar-denominated cash, cash equivalents, receivables, and intercompany balances held by our U.K. subsidiary, a British pound functional entity.
A hypothetical 10% strengthening in the British pound exchange rate in comparison to the Australian dollar, Euro, and U.S. dollar would have resulted in the following impact: | | | Nine Months Ended
September 30, | | Nine Months Ended
September 30, |
| (in thousands) | (in thousands) | 2022 | | 2021 | (in thousands) | 2023 | | 2022 |
| Foreign currency gain (loss) | $ | (6,335) | | | $ | (4,480) | | |
| Foreign currency (loss) | | Foreign currency (loss) | $ | (11,351) | | | $ | (6,335) | |
ITEM 4. CONTROLS AND PROCEDURES
(a) Evaluation of disclosure controls and procedures
Our management, with the participation of our Chief Executive Officer (“CEO”) and Chief Financial Officer (“CFO”), evaluated the effectiveness of our disclosure controls and procedures (as defined in Rules 13a-15(e) and 15d-15(e) under the Securities Exchange Act of 1934, as amended (“Exchange Act”)) as of September 30, 2022.2023. In designing and evaluating our disclosure controls and procedures, our management recognized that any controls and procedures, no matter how well designed and operated, can provide only reasonable assurance of achieving their objectives, and our management necessarily applied its judgment in evaluating the cost-benefit relationship of possible controls and procedures. Based on this evaluation, our CEO and CFO concluded that our disclosure controls and procedures were effective as of September 30, 2022.2023.
(b) Changes in internal control over financial reporting
There have been no changes in our internal control over financial reporting (as defined in Rules 13a-15(f) and 15d-15(f) under the Exchange Act) during the quarter ended September 30, 20222023 that have materially affected or are reasonably likely to materially affect our internal control over financial reporting.
PART II - OTHER INFORMATION
ITEM 1. LEGAL PROCEEDINGS
The information set forth in “Note 14.15. Commitments and Contingencies”, in Part I, Item 1 of this Quarterly Report is incorporated herein by reference and updates the description of our pending legal proceedings, as described in our Annual Report on Form 10-K filed with the U.S. Securities and Exchange Commission (“SEC”) on February 16, 2022 and in our Quarterly Reports on Form 10-Q filed with the U.S. Securities and Exchange Commission on April 28, 2022 and July 27, 2022.reference.
ITEM 1A. RISK FACTORS
The risk factors set forth below update the risk factors in our Annual Report on Form 10-K filed with the SEC on February 16, 2022 and in our Quarterly Reports on Form 10-Q filed with the SEC on April 28, 2022 and July 27, 2022.
In addition to the risk factors set forth below, weWe encourage you to carefully consider the risk factors identified in Item 1A. “Risk Factors” of our Annual Report on Form 10-K for the year ended December 31, 2021,2022, filed with the U.S. Securities and Exchange Commission. These risk factors could materially affect our business, financial condition, and future results and may cause our actual business and financial results to differ materially from those contained in forward-looking statements made in this Quarterly Report on Form 10-Q or elsewhere by management.
We face risks related to intellectual property claims or appropriation of our intellectual property rights.
We rely primarily on a combination of patent, copyright, trademark, and trade secrets laws, as well as intellectual property and confidentiality agreements to protect our proprietary rights. We also try to control access to and distribution of our technologies and other proprietary information. We have obtained patents in strategically important global markets relating to the architecture of our systems. We cannot be certain that such patents will not be challenged, invalidated, or circumvented, or that rights granted thereunder, or the claims contained therein will provide us with competitive advantages. Moreover, despite our efforts to protect our proprietary rights, unauthorized parties may attempt to copy aspects of our software or to obtain the use of information that we regard as proprietary. Although we generally enter into intellectual property and confidentiality agreements with our employees and strategic partners, despite our efforts our former employees may seek employment with our business partners, clients, or competitors, and there can be no assurance that the confidential nature of our proprietary information will be maintained. In addition, the laws of some foreign countries do not protect our proprietary rights as effectively as they do in the U.S. There can be no assurance that our means of protecting our proprietary rights will be adequate or that our competitors will not independently develop similar technology.
Other companies or individuals have obtained proprietary rights covering a variety of designs, processes, and systems. Third parties have claimed and may in the future claim that we have infringed or otherwise violated their intellectual property. We are currently party to litigation with Appian Corp. - see Part II, Item 1 “Legal Proceedings” and Note 14 in the “Notes to Unaudited Condensed Consolidated Financial Statements” included in Part I, Item 1 of this Quarterly Report; Part II, Item 1 “Legal Proceedings” and Note 14 in the “Notes to Unaudited Condensed Consolidated Financial Statements” included in Part I, Item 1 of our Quarterly Report filed with the SEC on July 27, 2022; Part II, Item 1 “Legal Proceedings” and Note 14 in the “Notes to Unaudited Condensed Consolidated Financial Statements” included in Part I, Item 1 of our Quarterly Report filed with the SEC on April 28, 2022; and Part I, Item 3 “Legal Proceedings” and Note 19 in the “Notes to Consolidated Financial Statements” included in Part II, Item 8 of our Annual Report filed with the SEC on February 16, 2022.
Although we attempt to limit the amount and type of our contractual liability for infringement or other violation of the proprietary rights of third parties and assert ownership of work product and intellectual property rights as appropriate, there are often exceptions, and limitations may not be applicable and enforceable in all cases. Even if limitations are found to be applicable and enforceable, our liability to our clients for these types of claims could be material given the size of certain of our transactions. We expect that software product developers will increasingly be subject to infringement claims as the number of products and competitors in our industry segment grows and the functionality of products in different industry segments overlaps. Any such claims, with or without merit, could be time-consuming, result in costly litigation, cause product shipment and delivery delays, require us to enter into royalty or licensing agreements, or preclude us from making and selling the infringing software, if such proprietary rights are found to be valid. Royalty or licensing agreements, if required, may not be available on terms acceptable to us or at all. These claims could also subject us to significant liability for damages, potentially including treble damages if we are found to have willfully infringed patents or copyrights. Even if a license were available, we could be required to pay significant royalties, which would increase our operating expenses. As a result, we may be required to develop alternative non-infringing technology, which could require substantial effort and cost. If we cannot license or develop technology for any infringing aspect of our business, we would be forced to limit or stop sales of our software and may be unable to compete effectively, which could have a material effect upon our business, operating results, and financial condition.
Intellectual property rights claims by third parties are extremely costly to defend, could require us to pay significant damages, and could limit our ability to use certain technologies.
Companies in the software and technology industries, including some of our current and potential competitors, own large numbers of patents, copyrights, trademarks, and trade secrets and frequently enter into litigation based on allegations of infringement or other violations of intellectual property rights. In addition, many of these companies can dedicate greater resources to enforce their intellectual property rights and to defend claims that may be brought against them. The litigation may involve patent holding companies or other adverse patent owners that have no relevant product revenues and against which our patents may, therefore, provide little or no deterrence. Third parties have claimed and may claim in the future that we have misappropriated, misused, or infringed other parties' intellectual property rights, and, to the extent we gain greater market visibility, we face a higher risk of being the subject of intellectual property claims.
Any litigation regarding intellectual property could be costly and time-consuming and could divert the attention of our management and key personnel from our business operations. Significant judgments are required for the determination of probability and the range of the outcomes in any legal dispute, and the estimates are based only on the information available to us at the time. Due to the inherent uncertainties involved in claims, legal proceedings, and in estimating the losses that may arise, actual outcomes may differ from our estimates. Contingencies deemed not probable or for which losses were not estimable in one period may become probable, or losses may become estimable in later periods which may have a material impact on our results of operations and financial position. Intellectual property disputes could subject us to significant liabilities, require us to enter into royalty and licensing arrangements on unfavorable terms, prevent us from manufacturing or licensing certain of our products, cause severe disruptions to our operations or the markets in which we compete or require us to satisfy indemnification commitments to our customers. Any of these could seriously harm our business.
We are currently party to litigation with Appian Corp. - see Part II, Item 1 “Legal Proceedings” and Note 14 in the “Notes to Unaudited Condensed Consolidated Financial Statements” included in Part I, Item 1 of this Quarterly Report; Part II, Item 1 “Legal Proceedings” and Note 14 in the “Notes to Unaudited Condensed Consolidated Financial Statements” included in Part I, Item 1 of our Quarterly Report filed with the SEC on July 27, 2022; Part II, Item 1 “Legal Proceedings” and Note 14 in the “Notes to Unaudited Condensed Consolidated Financial Statements” included in Part I, Item 1 of our Quarterly Report filed with the SEC on April 28, 2022; and Part I, Item 3 “Legal Proceedings” and Note 19 in the “Notes to Consolidated Financial Statements” included in Part II, Item 8 of our Annual Report filed with the SEC on February 16, 2022. On September 15, 2022, the circuit court of Fairfax County entered judgment in the amount of $2,060,479,287, consisting of the jury verdict and the Court’s award of attorneys’ fees and costs to Appian, and stating that Appian will be entitled to post-judgment interest at the rate of 6% per annum from the date of the jury verdict (May 9, 2022) as to the amount of the jury verdict and from September 15, 2022 as to the portion of the judgment that is attributable to the Court’s award of attorneys’ fees and costs. On September 15, 2022, the Company filed a notice of appeal from the judgment. On September 29, 2022, the circuit court of Fairfax County approved of the $25,000,000 letter of credit obtained by the Company to secure the judgment and entered an order suspending the judgment during the pendency of the Company’s appeal. This appeals process could potentially take years to complete. Notwithstanding the circuit court of Fairfax County having entered this judgment, we are unable to reasonably estimate possible damages in that matter because, among other things, of the uncertainty as to the outcome of appellate proceedings, and/or any potential new trial resulting from the appellate proceedings. If we are ultimately unsuccessful in prevailing in the matter in its entirety or in obtaining a substantially smaller jury verdict, we may be required to incur debt or otherwise engage in capital market transactions to finance the final judgment, together with interest and any awards of attorneys’ fees and costs. In addition, if we do not satisfy the judgment within 60 days following the expiration of the right to appeal, there may be an acceleration of liabilities under our Convertible Senior Notes and our Credit Facility. While we continue to believe that we have the financial strength to pay these amounts if it ever becomes necessary, it is possible that we may not be able to engage in these activities on desirable terms, which could have a material adverse effect on our business, financial condition, and operating results.
ITEM 2. UNREGISTERED SALES OF EQUITY SECURITIES AND USE OF PROCEEDS
Issuer purchases of equity securities(1)
Common stock repurchased in the three months ended September 30, 2022:2023: | | | | | | | | | | | | | | | | | | | | | | | |
| (in thousands, except per share amounts) | Total Number of Shares Purchased (1) (2) | | Average Price Paid per Share (1) (2) | | Total Number of Shares Purchased as Part of Publicly Announced Share Repurchase Program (2) | | Approximate Dollar Value of Shares That May Yet Be Purchased at Period End Under Publicly Announced Share Repurchase Programs (2) |
| July 1, 2022 - July 31, 2022 | 14 | | | $ | 48.98 | | | — | | | $ | 58,075 | |
| August 1, 2022 - August 31, 2022 | 7 | | | 40.49 | | | — | | | $ | 58,075 | |
| September 1, 2022 - September 30, 2022 | 121 | | | 36.81 | | | — | | | $ | 58,075 | |
| 142 | | | $ | 38.20 | | | — | | | |
| | | | | | | | | | | | | | | | | | | | | | | |
| (in thousands, except per share amounts) | Total Number of Shares Purchased (2) | | Average Price Paid per Share (2) | | Total Number of Shares Purchased as Part of Publicly Announced Share Repurchase Program | | Approximate Dollar Value of Shares That May Yet Be Purchased at Period End Under Publicly Announced Share Repurchased Programs |
| July 1, 2023 - July 31, 2023 | 3 | | | $ | 55.81 | | | — | | | $ | 60,000 | |
| August 1, 2023 - August 31, 2023 | — | | | — | | | — | | | $ | 60,000 | |
| September 1, 2023 - September 30, 2023 | 4 | | | 48.92 | | | — | | | $ | 60,000 | |
| 7 | | | $ | 51.65 | | | — | | | |
(1) Shares withheld to cover the option exercise price and tax withholding obligations under the net settlement provisions of our stock compensation awards have been included in these amounts.
(2) On June 2, 2022, we announced that our Board of Directors extended the current stock repurchase program’s expiration date to June 30, 2023 and increased the remaining stock repurchase authority to $60 million. SeeFor additional information, see "Liquidity and Capital Resources" in Part I, Item 2 of this Quarterly ReportReport.
(2) Includes shares withheld to cover the option exercise price and tax withholding obligations for additional information.
stock compensation awards subject to net settlement provisions.
ITEM 5. OTHER INFORMATION
During the three months ended September 30, 2023, no director or officer of the Company adopted or terminated a “Rule 10b5-1 trading arrangement” or “non-Rule 10b5-1 trading arrangement,” as each term is defined in Item 408(a) of Regulation S-K.
ITEM 6. EXHIBITS | | Exhibit No. | Exhibit No. | | Description | | Incorporation by Reference | | Filed Herewith | Exhibit No. | | Description | | Incorporation by Reference | | Filed Herewith |
| Form | | Exhibit | | Filing Date | | | Form | | Exhibit | | Filing Date | |
| 3.1 | 3.1 | | | | 10-Q | | 3.1 | | November 4, 2014 | | | 3.1 | | | | 10-Q | | 3.1 | | November 4, 2014 | | |
| 3.2 | 3.2 | | | | 8-K | | 3.2 | | June 15, 2020 | | 3.2 | | | | 8-K | | 3.2 | | June 15, 2020 | |
| 31.1 | 31.1 | | | | X | 31.1 | | | | X |
| 31.2 | 31.2 | | | | X | 31.2 | | | | X |
| 32++ | | | | X | |
| 32 | | 32 | | | | + |
| 101.INS | 101.INS | | Inline XBRL Instance Document - the instance document does not appear in the Interactive Data File because its XBRL tags are embedded within the Inline XBRL document. | | X | 101.INS | | Inline XBRL Instance Document - the instance document does not appear in the Interactive Data File because its XBRL tags are embedded within the Inline XBRL document. | | X |
| 101.SCH | 101.SCH | | Inline XBRL Taxonomy Extension Schema Document. | | X | 101.SCH | | Inline XBRL Taxonomy Extension Schema Document. | | X |
| 101.CAL | 101.CAL | | Inline XBRL Taxonomy Calculation Linkbase Document. | | X | 101.CAL | | Inline XBRL Taxonomy Calculation Linkbase Document. | | X |
| 101.DEF | 101.DEF | | Inline XBRL Taxonomy Extension Definition Linkbase Document. | | X | 101.DEF | | Inline XBRL Taxonomy Extension Definition Linkbase Document. | | X |
| 101.LAB | 101.LAB | | Inline XBRL Taxonomy Label Linkbase Document. | | X | 101.LAB | | Inline XBRL Taxonomy Label Linkbase Document. | | X |
| 101.PRE | 101.PRE | | Inline XBRL Taxonomy Presentation Linkbase Document. | | X | 101.PRE | | Inline XBRL Taxonomy Presentation Linkbase Document. | | X |
| 104 | 104 | | Cover Page Interactive Data File (formatted as Inline XBRL and contained in Exhibit 101) | | X | 104 | | Cover Page Interactive Data File (formatted as Inline XBRL and contained in Exhibit 101) | | X |
++ Indicates that the exhibit is being furnished with this report and is not filed as a part of it.
SIGNATURE
Pursuant to the requirements of the Securities Exchange Act of 1934, the Registrant has duly caused this report to be signed on its behalf by the undersigned thereunto duly authorized. | | | | | | | | | | | |
| | Pegasystems Inc. |
| | | |
| Dated: | October 26, 202225, 2023 | By: | /s/ KENNETH STILLWELL |
| | | Kenneth Stillwell |
| | | Chief Operating Officer and Chief Financial Officer |
| | | (Principal Financial Officer) |