UNITED STATES
SECURITIES AND EXCHANGE COMMISSION
Washington, D.C. 20549
FORM 10-Q
QUARTERLY REPORT PURSUANT TO SECTION 13 OR 15(d) OF THE SECURITIES EXCHANGE ACT OF 1934
For the quarterly period ended September 30, 2017
2018
Commission File Number 1-11921
________________________________
E TRADE Financial Corporation
 (Exact Name of Registrant as Specified in its Charter)
|
| | |
| Delaware | | 94-2844166 |
(State or other jurisdiction of incorporation or organization) | | (I.R.S. Employer Identification Number) |
11 Times Square, 32nd Floor, New York, New York 10036
(Address of principal executive offices and Zip Code)
(646) 521-4300
(Registrant’s telephone number, including area code)
_____________________________________
Indicate by check mark whether the registrant (1) has filed all reports required to be filed by Section 13 or 15(d) of the Securities Exchange Act of 1934 during the preceding 12 months (or for such shorter period that the registrant was required to file such reports) and (2) has been subject to such filing requirements for the past 90 days. Yes x No ¨
Indicate by check mark whether the registrant has submitted electronically and posted on its corporate Website, if any, every Interactive Data File required to be submitted and posted pursuant to Rule 405 of Regulation S-T during the preceding 12 months (or for such shorter period that the registrant was required to submit and post such files). Yes x No ¨
Indicate by check mark whether the registrant is a large accelerated filer, an accelerated filer, a non-accelerated filer, a smaller reporting company or an emerging growth company. See definitions of "large accelerated filer," "accelerated filer," "smaller reporting company" and "emerging growth company" in Rule 12b-2 of the Exchange Act. |
| | | |
Large accelerated filer x | Accelerated filer | | ¨ |
Non-accelerated filer ¨ (Do not check if a smaller reporting company) | Smaller reporting company | | ¨ |
Emerging growth company ¨ | | | |
If an emerging growth company, indicate by check mark if the registrant has elected not to use the extended transition period for complying with any new or revised financial accounting standards provided pursuant to Section 13(a) of the Exchange Act. ¨
Indicate by check mark whether the registrant is a shell company (as defined in Rule 12b-2 of the Exchange Act). Yes ¨ No x
Indicate the number of shares outstanding of each of the issuer’s classes of common stock, as of the latest practicable date:
As of October 31, 2017,30, 2018, there were 269,659,766254,239,061 shares of common stock outstanding.
E*TRADE FINANCIAL CORPORATION
FORM 10-Q QUARTERLY REPORT
For the Quarter Ended September 30, 20172018
TABLE OF CONTENTS |
| | |
| PART I | FINANCIAL INFORMATION | |
| | |
| Item 1. | | |
| | |
| | | |
| | | |
| | | |
| | | |
| | | |
| | |
| | | |
| | | |
| | | |
| | | |
| | | |
| | | |
| | | |
| | | |
| | |
| | |
| | |
| | |
| | |
| | | |
| | |
| | |
| | |
| | |
| | |
| | |
| | |
| Item 2. | | |
| | | |
| | | |
| | | |
| | | |
| | | |
| | | |
| | | |
| Item 3. | | |
| | | |
| Item 4. | | |
PARTPart II | | |
| Item 1. | | |
| Item 1A. | | |
| Item 2. | | |
| Item 3. | | |
| Item 4. | | |
Item 5.5 | | |
| Item 6. | | |
| | | |
|
| | |
E*TRADE | Q3 2017 10-Q | | E*TRADE Q3 2018 10-Q | Page i |
Unless otherwise indicated, references to "the Company," "we," "us," "our," "E*TRADE" and "E*TRADE Financial" mean E*TRADE Financial Corporation and its subsidiaries, and references to the parent company mean E*TRADE Financial Corporation but not its subsidiaries.
E*TRADE, E*TRADE Financial, E*TRADE Bank, the Converging Arrows logo, OptionsHouse, Equity Edge Online, Trust Company of America (TCA), and OptionsHouseLibertyTM are trademarks or registered trademarks of E*TRADE Financial Corporation in the United States and in other countries. All other trademarks are the property of their respective owners.
|
| | |
E*TRADE | Q3 2017 10-Q | | E*TRADE Q3 2018 10-Q | Page ii |
PART I
FORWARD-LOOKING STATEMENTS
This report contains forward-looking statements, within the meaning of the Private Securities Litigation Reform Act of 1995, that involve risks and uncertainties. These statements discuss, among other things, things:
our future plans, objectives, outlook, strategies, expectations and intentions relating to our business and future financial and operating results and the assumptions that underlie these matters and include statements regarding the Company'sour proposed transaction with Trust Company of America (TCA)Capital One Financial Corporation (Capital One) and its benefits and timing, our business strategy, objectives and vision; our plans and ability to deliver new products and solutions; our ability to improve client acquisition and deepen relationships with existing clients; our ability to effectively monetize brokerage relationships by investing in agency mortgage-backed securities;
our capital plan initiatives,
the expected balance sheet size, any balance sheet growthtiming and the incremental regulatory and reporting requirements that our balance sheet size and growth may require; our plans to run off our legacy mortgage and consumer loan portfolio; repurchases of our common stock, payment of dividends on our capital stock, including our common and preferred stock; our ability to maintain required regulatory capital ratios; our plans for stock,
the payment of dividends from our subsidiaries to our parent company; proposed issuancecompany,
the management of preferred stockour legacy mortgage and the expected financing of the proposed transaction; our target liquidity positions; consumer loan portfolio,
our ability to identifyutilize deferred tax assets, the expected implementation and applicability of government regulation and our ability to comply with these regulations,
our ability to maintain required regulatory capital ratios,
continued repurchases of our common stock,
our ability to meet upcoming debt obligations,
the integration and related restructuring costs of past and any future acquisitions,
the expected outcome of existing or new litigation,
our ability to execute our business plans and manage risks appropriately;risk,
future sources of revenue, expense and liquidity, and
any other statement that is not historical in nature.
These statements may be identified by the use of words such as "assume," "expect," "believe," "may," "will," "should," "anticipate," "intend," "plan," "estimate," "continue" and similar expressions.
We caution that actual results could differ materially from those discussed in these forward-looking statements. Important factors that could contribute to our actual results differing materially from any forward-looking statements include, but are not limited to, to:
the closing of the proposed transaction with TCACapital One may not occur or may be delayed regulatory risks associatedand that the actual aggregate consideration paid in connection with the proposed transaction unanticipated restructuring costs which may be incurred or undisclosed liabilities assumed, attemptsis still subject to retain key TCA personnel may not succeed, expected synergies and other financial benefits may not be realized or integration plans may not be implemented as anticipated; final determination,
changes in business, economic or political condition; conditions,
performance, volume and volatility in the equity and capital markets; fluctuationsmarkets,
changes in interest rates; rates or interest rate volatility,
customer demand for financial products and services; increased competition; services,
our ability to continue to compete effectively and respond to aggressive price competition within our industry,
cyber security threats, potential system disruptions and other security breaches; breaches or incidents,
our ability to participate in consolidation opportunities in our industry; industry, to complete consolidation transactions and to realize synergies or implement integration plans,
our ability to service our corporate debt; debt and, if necessary, to raise additional capital,
changes in government regulation or actions by our regulators; regulators, including those that may result from the implementation and enforcement of regulatory reform legislation,
E*TRADE Q3 2018 10-Q | Page 1
our ability to move capital to our parent company from our subsidiaries; subsidiaries,
adverse developments in litigation, or regulatory matters;
our ability to manage our balance sheet growth,
the timing, duration and durationcosts associated with our stock repurchase program,
our ability to manage credit risk with customers and counterparties, and
the impact of federal tax reform, including as a result of future regulations and the amount of shares repurchased and amount of cash expended in connection with, the share repurchase program; the availability, timing and size of any preferred stock issuance; and other factors discussed under guidance.
Part II. Item 1A. Risk Factors and Part I. Item 2. Management’s Discussion and Analysis of Financial Condition and Results of Operations of this Form 10-Q; and Part I. Item 1A. Risk Factors of our Annual Report on Form 10-K for the year ended December 31, 2016, filed with the Securities and Exchange Commission (SEC), which are incorporated herein by reference. By their nature forward-looking statements are not guarantees of future performance or results and are subject to risks, uncertainties and assumptions that are difficult to predict or quantify. Actual future results may vary materially from expectations expressed or implied in this report or any of our prior communications. Investors should also consider the risks and uncertainties described elsewhere in this report, including under Part I. Item 2. Management’s Discussion and Analysis of Financial Condition and Results of Operations and Part II. Item 1A. Risk Factors of this Quarterly Report and Part I. Item 1A. Risk Factors of our Annual Report on Form 10-K for the year ended December 31, 2017, filed with the Securities and Exchange Commission (SEC), which are incorporated herein by reference. The forward-looking statements contained in this report reflect our expectations only as of the date of this report. YouInvestors should not place undue reliance on forward-looking statements, as we do not undertake to update or revise forward-looking statements, to reflect the impact of circumstances or events that arise after the date the forward-looking statements were made, except as required by law.
E*TRADE Q3 2018 10-Q | Page 2
ITEM 2. MANAGEMENT’S DISCUSSION AND ANALYSIS OF FINANCIAL CONDITION AND RESULTS OF OPERATIONS (MD&A)
The following discussion should be read in conjunction with the consolidated financial statements and the related notes that appear elsewhere in this document and with the Annual Report on Form 10-K for the year ended December 31, 2016.2017.
Company Overview
E*TRADE is a financial services company that provides online brokerage and related products and services primarily to individual retail investors. Our mission isFounded on the principle of innovation, we aim to enhance the financial independence of traders and investors through a powerful digital experience that includes tools and educational materials, supported by professional guidance, to help individual investors and traders meet both near- and long-term investing goals. We provide these services to customers through our digital platforms and network of industry-licensed customer service representatives and financial consultants, over the phone, by email and online via two national financial centers and in-person at 30 regional financial centers across the United States. We operate directly and through several subsidiaries, many of which are overseen by governmental and self-regulatory organizations. Our most important subsidiaries are described below:
E*TRADE Securities LLC (E*TRADE Securities) is a registered broker-dealer that clears and settles customer securities transactions.
E*TRADE Bank is a federally chartered savings bank that provides Federal Deposit Insurance Corporation (FDIC) insurance on qualifying amounts of customer deposits and provides other banking and cash management capabilities.
E*TRADE Savings Bank, a subsidiary of E*TRADE Bank, is a federally chartered savings bank that provides FDIC insurance on qualifying amounts of customer deposits and custody solutions for registered investment advisors (RIAs).
E*TRADE Financial Corporate Services is a provider of software and services for managing equity compensation plans to our corporate clients.
E*TRADE Futures LLC (E*TRADE Futures) is a registered non-clearing Futures Commission Merchant (FCM) that provides clearing and settlement services for customer futures transactions.
E*TRADE Capital Management, LLC (E*TRADE Capital Management) is an RIA that provides investment advisory services for our customers.
E*TRADE Q3 2018 10-Q | Page 3
Delivering a powerful digital offering and professional guidance. Our visionfor our customers is to be the #1 digital broker and advisor to traders and investors, known for ease of use and the completenessa core pillar of our offering.business strategy and we believe our focus on being a digital leader in the financial services industry is a competitive advantage. Our hybrid delivery model is available through the following award-winning digital platforms:
|
| |
| Web |
| Our leading-edge sites for customers and our primary channel to interact with prospects |
|
• Access to a broad range of trading solutions • Actionable ideas and information • Research and education for decision making |
|
| Mobile |
| Powerful trading applications for smartphones, tablets and watches |
|
• Award-winning mobile apps • Platforms to manage accounts on the move • Stock and portfolio alerts |
| |
| Active Trading Platforms |
| Powerful software and web-based trading solutions |
|
• Sophisticated trading tools • Idea generation and analysis • Advanced portfolio and market tracking |
Strategy
Our business strategy is centered on two key objectives: accelerating the growth of our core brokerage business to drive organic growth and improve competitive position,market share, and generating robust earnings growth and healthy returns on capital to deliver long-term value for our stakeholders.shareholders.
Accelerate Growth of Core Brokerage Business
Enhance overall customer experience
We are focused on delivering cutting-edge trading solutions while improving our market position in investing products. Through these offerings, we aim to drivecontinue growing our customer acquisitionbase while deepening engagement with our existing customers.
Capitalize on value of corporate services channel
Our corporate services channel is a strategically important driver of brokerage account and asset growth. We leverage our industry-leading position in corporate stock plan administration to improve client acquisition and engage with plan participants to bolster awareness of our full suite of offerings. Our corporate services channel is a strategically important driver
E*TRADE Q3 2018 10-Q | Page 4
Generate Robust Earnings Growth and Healthy Returns on Capital
Utilize balance sheet to enhance returns
We utilize our bank structure to effectively monetize brokerage relationships by investing stable, low-cost deposits primarily in agency mortgage-backed securities. Meanwhile, we continue to manage down the size and risk associated with our legacy mortgage and consumer loan portfolio.
Put capital to work for shareholders
We have put significantAs we continue to deliver on our capital to work through balance sheet growth, share repurchases and acquisition activity. Weplan initiatives, we are focused on generating and effectively deploying and returning excess capital, including through our share repurchase program and common stock dividends, for the benefit of our shareholders.
Products and Services
We offer a broad range of products and services to our customers. Our core brokerage business is organized into four product areas: Trading, Investing, Corporate Services, and Advisor Services. Additionally, we offer banking and cash management capabilities, including deposit accounts insured by the FDIC, which are fully integrated into customer brokerage accounts. Among other features, customers have access to debit cards with ATM fee refunds, online and mobile bill pay, mobile check deposits, and E*TRADE Line of Credit, a program which allows customers to borrow against the market value of securities pledged as collateral.
Trading
The Company delivers automated trade order placement and execution services, offering our customers a full range of investment vehicles, including US equities, exchange-traded funds (ETFs), options, bonds, futures, American depositary receipts and non-proprietary mutual funds. Margin accounts are also available to qualifying customers, enabling them to borrow against their securities. We help customers plan and execute margin trades through robust margin solutions, including calculators and requirement lookup and analysis tools. The Company also offers a fully paid lending program, which allows our customers to be compensated for allowing us to lend certain securities in their account.
The Company markets trading products and services to self-directed investors and active traders. Products and services are delivered through web, desktop and mobile digital channels. Trading and investing tools are supported by guidance, including fixed income, options and futures specialists available on-call for customers. Other tools and resources include independent research and analytics, live and on-demand education, market commentary, and strategies, trading ideas and screeners for major asset classes.
Investing
The Company endeavors to help investors build wealth and address their long-term investing needs. Products and services include individual retirement accounts (IRAs), including Roth IRAs, and a suite of managed products and asset allocation models. These include our Core Portfolios, Blend Portfolios, Dedicated Portfolios, and Fixed Income Portfolios. Investors are provided a full suite of digital tools across the Company's web and mobile channels to address their investing needs. These include planning and allocation tools, education and editorial content.
The Company also offers guidance through a team of licensed financial consultants and Chartered Retirement Planning CounselorsSM at our 30 regional financial centers across the country. Guidance is also accessible through our two national financial centers by phone, email and online channels. Customers can receive complimentary portfolio reviews and personalized investment recommendations.
E*TRADE Q3 2018 10-Q | Page 5
Corporate Services
The Company provides stock plan administration services for both public and private companies. Through our industry-leading platform, Equity Edge OnlineTM, the Company offers management of employee stock option plans, employee stock purchase plans and restricted stock plans with fully-automated stock plan administration. Accounting, reporting and scenario modeling tools are also available. The integrated stock plan solutions include multi-currency settlement and delivery, disbursement in various currencies and streamlined tax calculation. Additionally, corporate clients are offered 10b5-1 plan design and implementation and SEC filing assistance. The Company's digital platforms allow participants in corporate client stock plans to view and manage their holdings. Participants have access to education tools, restricted stock sales support and dedicated stock plan service representatives. Our Corporate Services channel is an important driver of brokerage account and asset growth, serving as an introductory channel to the Company, with over 1.7 million individual stock plan accounts. We serve approximately 20% of S&P 500 companies, including nearly 40% of technology companies and nearly 50% of healthcare companies within the index. In total, we serve over 50% of all publicly traded U.S. technology companies. As of September 30, 2018, approximately 35% of customer cash is related to the Corporate Services channel.
Advisor Services
With the acquisition of TCA, which was completed on April 9, 2018, the Company has expanded its ability to provide technology solutions and custody services to independent RIAs. Liberty, our proprietary technology platform, includes sophisticated modeling, rebalancing, reporting and practice management capabilities that are fully customizable for the RIA. We expect our Advisor Services channel to provide access to a growing segment of our industry and help bolster the Company's ability to attract and retain customers in need of specialized and sophisticated customer service engagement. As of September 30, 2018, the Advisor Services channel had approximately $12 billion in commitments for future assets under custody from RIAs, representing a significant increase from the $17 billion in assets under custody when the Company announced the planned acquisition of TCA in October 2017.
For additional information about our business see Part I. Item 1. Business in the Annual Report on Form 10-K for the year ended December 31, 2017.
Financial Performance
Our net revenue is generated primarily from net interest income, commissions and fees and service charges.
Net interest income is largely impacted by the size of our balance sheet, our balance sheet mix, and average yields on our assets and liabilities. Net interest income is driven primarily from interest earned on investment securities, and margin receivables, and our legacy loan portfolio, less interest paidincurred on interest-bearing liabilities, including deposits, customer
payables, corporate debt and other borrowings. Net interest income is also earned on our legacy mortgage and consumer loan portfolio which we expect to continue to run off in future periods.
Commissions revenue is generated by customer trades and is largely impacted by trade volume, trade type, and commission rates.
Fees and service charges revenue is mainly impacted by order flow revenue, fees earned on off-balance sheet customer cash and other assets, and advisor management and custody fees, and mutual fund service fees.
Our net revenue is offset by non-interest expenses, the largest of which are compensation and benefits and advertising and market development.
E*TRADE Q3 2018 10-Q | Page 6
Significant Events in the Third Quarter of 20172018
Announced Trust CompanyDeclared quarterly dividend on common stock
In October 2018, our Board of America acquisition
On October 19, 2017, we announced an agreement to acquire Trust CompanyDirectors declared a quarterly cash dividend of America, Inc. (TCA), a leading provider$0.14 per share on our outstanding shares of technology solutions and custody services to the registered investment adviser market, for $275 million in cash. We anticipate funding the transaction through the issuance of non-cumulative perpetual preferredcommon stock. The acquisitiondividend is expectedpayable on November 15, 2018, to shareholders of record as of the close inof business on October 30, 2018.
Completed prior $1 billion share repurchase program and approved new $1 billion program
During the secondthird quarter of 2018, subject to customary closing conditions and regulatory approvals.
Completed OptionsHouse integration
In August 2017, we completed the integration of Aperture, LLC (dba OptionsHouse), which was acquired by the Company in 2016. Completion of the integration included the rollout of OptionsHouse features and functionality through E*TRADE.com and the transfer of retail brokerage accounts and customer-related balances of OptionsHouse to E*TRADE Securities LLC (E*TRADE Securities). Futures accounts and balances of E*TRADE Securities were transferred to E*TRADE Futures LLC (formerly known as Aperture, LLC).
Issuedour prior $1 billion of senior notes and redeemed higher cost corporate debt
We issued $600 million of 2.95% Senior Notes and $400 million of 3.80% Senior Notes and usedshare repurchase program with the net proceeds, along with existing corporate cash, to redeem our outstanding $540 million of 5.375% Senior Notes and $460 million of 4.625% Senior Notes, resulting in a $58 million loss on early extinguishment of debt. This transaction reduces our annual corporate debt service costs from $50 million to $33 million.
Repurchased 4.6 million shares of our common stock
We continue to execute on our stock repurchase plan, under which the Board of Directors has authorized a $1 billion repurchase of shares of our common stock. During the three months ended September 30, 2017, the Company repurchased 4.65.3 million shares of common stock at an average price of $40.64 for a total of $187 million.$58.74 per share, or $310 million in the aggregate during the quarter. As of September 30, 2017, $813 million remained available for additional repurchases. As of October 31, 2017,2018, we have subsequently repurchased an additional 1.019.5 million shares of common stock at an average price of $43.53.$51.38 per share since we began repurchasing shares under this authorization in the third quarter of 2017. In October 2018, our Board of Directors authorized a new $1 billion share repurchase program. The timing and exact amount of any common stock repurchases will depend on various factors, including market conditions and our capital position. We have the ability to complete up to half of the authorization during the fourth quarter of 2018 and intend to complete the remainder by the end of 2019. As of October 30, 2018, we have subsequently repurchased an additional 2.5 million shares of common stock at an average price of $47.77 per share.
Redeemed our Trust Preferred Securities (TRUPs)
During the third quarter of 2018, the Company redeemed all $413 million of its outstanding TRUPs. In connection with the redemption, we recognized a loss on early extinguishment of debt of $4 million, consisting of the difference between the carrying value of the TRUPs redeemed, including unamortized debt issuance costs, and the total cash amount paid, including related fees and expenses. Net proceeds from the June 2018 issuance of the 4.50% Senior Notes due 2028 (Senior Notes) were used to redeem the TRUPs. For additional information about the debt issuance, see Note 11—Corporate Debt.
E*TRADE Q3 2018 10-Q | Page 7
Key Performance Metrics
Management monitors a number of customer activity and companycorporate metrics to evaluate the Company’s performance. The most significant of these are displayed below along with the percentage variance for the three months ended September 30, 20172018 from the same period in 2016, where applicable, and includes OptionsHouse2017. These metrics include the impact of the TCA acquisition from the September 12, 2016April 9, 2018 acquisition date.date, as applicable.
Customer Activity Metrics:
E*TRADE Q3 2018 10-Q | Page 8
E*TRADE Q3 2018 10-Q | Page 9
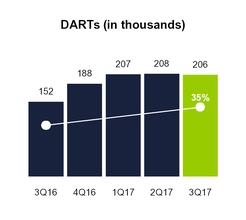
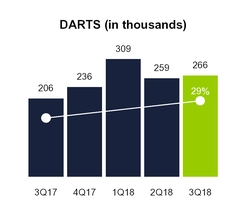
Daily Average Revenue Trades (DARTs) is the predominant driver of commissions revenue from our customers. DARTs were 205,763266,290 and 207,065277,796 for the three and nine months ended September 30, 2017,2018, respectively, compared to 151,905205,763 and 156,368207,065 for the same periods in 2016.2017.
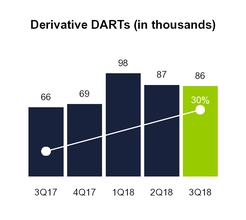
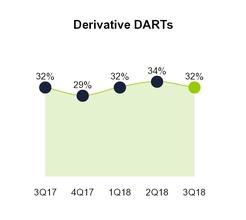
Derivative DARTs, a key driver of commissions revenue, is the daily average number of options and futures trades, and Derivative DARTs percentage is the mix of options and futures as a component of total DARTs and is a key driver of commissions revenue.DARTs. Derivative DARTs represented 32%were 85,977 and 31% of total DARTs90,075 for the three and nine months ended September 30, 2017,2018, respectively, compared to 26%66,122 and 25%63,869 for the same periods in 2016.2017. Derivative DARTs represented 32% of total DARTs for both the three and nine months ended September 30, 2018, compared to 32% and 31% for the same periods in 2017.
E*TRADE Q3 2018 10-Q | Page 10
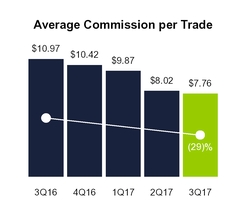
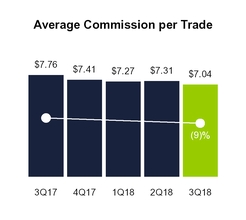
Average commission per trade is an indicator of changes in our customer mix, product mix and/or product pricing. Average commission per trade was $7.76$7.04 and $8.54$7.21 for the three and nine months ended September 30, 2017,2018, respectively, compared to $10.97$7.76 and $10.81$8.54 for the same periods in 2016.2017. Average commission per trade for the three and nine months ended September 30, 20172018 was impacted by trade mix and the continued migration of customers to lower active trader commission pricing resulting from our reduced commission rates for equity and options trades effective March 13, 2017, which were as follows:
Stock, options and exchange-traded fund (ETF)ETF trade commissions reduced to $6.95 from $9.99
For active traders, commissions reduced to $4.95 from $7.99 and options charges reduced to $0.50 per contract from $0.75; trades required for active trader tier reduced to 30 per quarter from 150150.
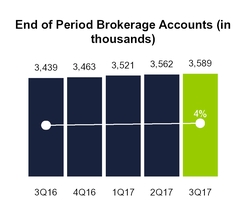
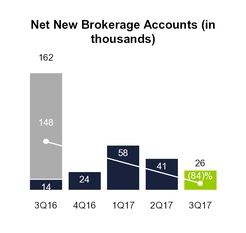
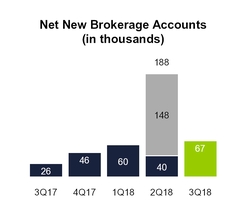
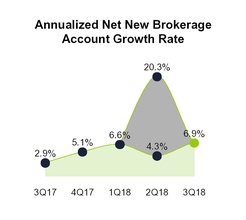
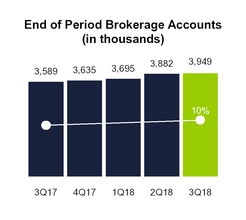
End of period brokerage accounts and net new brokerage accountsare indicators of our ability to attract and retain brokerage customers. End of period brokerage accounts were 3.9 million and 3.6 million at September 30, 2018 and 2017, respectively. Net new brokerage accounts were 67,163 and 314,490 for the three and nine months ended September 30, 2018, respectively, compared to 26,225 and 125,711 for the same periods in 2017. Our annualized net new brokerage account growth rate was 6.9% and 11.5% for the three and nine months ended September 30, 2018, respectively, compared to 2.9% and 4.8% for the same periods in 2017. Excluding the 145,891 accounts acquired on April 9, 2018 as part of the TCA acquisition, the adjusted annualized net new brokerage account growth rate was 6.2% for the nine months ended September 30, 2018.
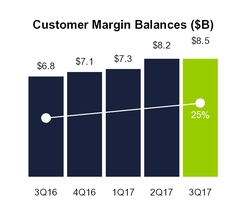
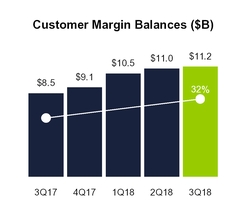
Customer margin balances represents credit extended to customers to finance their purchases of securities by borrowing against securities they own and is a key driver of net interest income. Customer margin balances were $8.5$11.2 billion and $6.8$8.5 billion at September 30, 2018 and 2017, and 2016, respectively. Customer margin for periods prior to September 30, 2017, includes OptionsHouse balances which were held by a third party clearing firm. In connection with the integration of OptionsHouse, $0.4 billion of customer margin held by the third party clearing firm was transferred to our balance sheet and is reflected as margin receivables at September 30, 2017.
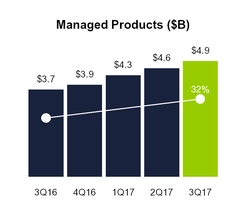
Managed products represents customer assets in our Managed Investment Portfolio, Unified Managed Account, Adaptive Portfolio, and Fixed Income Separately Managed Account products. Managed products are a driver of fees and service charges revenue. Managed products were $4.9 billion and $3.7 billion at September 30, 2017 and 2016, respectively.
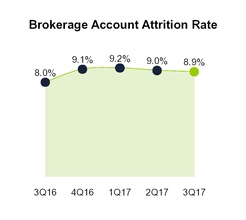
End of period brokerage accounts, net new brokerage accountsandbrokerage account attrition rate are indicators of our ability to attract and retain brokerage customers. End of period brokerage accounts were 3.6 million and 3.4 million at September 30, 2017 and 2016, respectively. Net new brokerage accounts were 26,225 and 125,711 for the three and nine months ended September 30, 2017, respectively, and 161,885 and 225,434 for the same periods in 2016. Our annualized brokerage account attrition rate was 8.9% and 9.1% for the three and nine months ended September 30, 2017, respectively, compared to 8.0% and 8.1% for the same periods in 2016. During the three and nine months ended September 30, 2017, our annualized net new brokerage account growth rate was 2.9% and 4.8% respectively, compared to 1.7% and 3.2% for the same periods in 2016. End of period brokerage accounts and net new brokerage accounts for the three months ended September 30, 2016 include 147,761 accounts from the OptionsHouse acquisition.
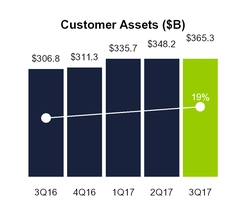
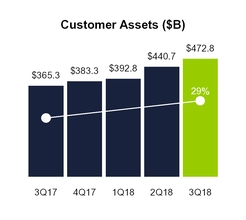
Customer assets is an indicator of the value of our relationship with the customer. An increase generally indicates that the use of our products and services by existingnew and newexisting customers is expanding. Changes in this metric are also driven by changes in the valuations of our customers' underlying securities. Customer assets were $365.3$472.8 billion and $306.8$365.3 billion at September 30, 2018 and 2017, respectively.
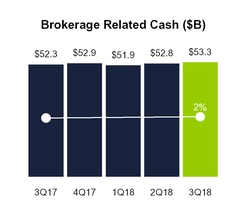
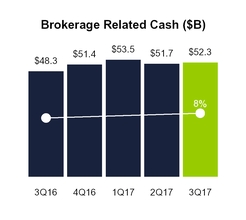
Brokerage related cash is an indicator of the level of engagement with our brokerage customers and 2016,is a key driver of net interest income as well as fees and service charges revenue, which includes fees earned on customer cash held by third parties. Brokerage related cash was $53.3 billion and $52.3 billion at September 30, 2018 and 2017, respectively.
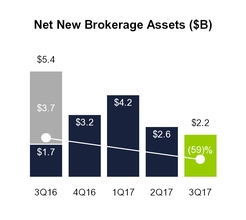
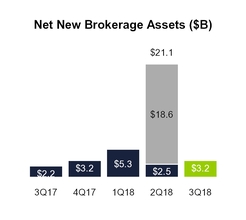
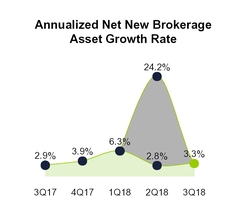
Net new brokerage assets is total inflows to new and existing brokerage accounts less total outflows from closed and existing brokerage accounts. The net new brokerage assets metric is a general indicator of the use of our products and services by new and existing brokerage customers. Net new brokerage assets were $2.2$3.2 billion and $9.0$29.6 billion for the three and nine months ended September 30, 2017,2018, respectively, compared to $5.4$2.2 billion and $9.9$9.0 billion for the same periods in 2016.2017. During the three and nine months ended September 30, 2017,2018, our annualized net new brokerage asset growth rate was 2.9%3.3% and 4.4%11.6%, respectively, compared to 2.7%2.9% and 3.4%4.4% for the same periods in 2016. Net2017. Excluding the $18.4 billion of assets acquired on April 9, 2018 as part of the TCA acquisition, the adjusted annualized net new brokerage assetsasset growth rate was 4.4% for the threenine months ended September 30, 2016 includes $3.72018.
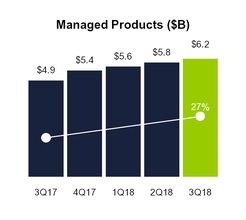
Managed products represents customer assets in our Managed Portfolios which are a driver of fees and service charges revenue. Managed products were $6.2 billion from the OptionsHouse acquisition.and $4.9 billion at September 30, 2018 and 2017, respectively.
E*TRADE Q3 2018 10-Q | Page 11
Brokerage related cash is an indicator of the level of engagement with our brokerage customers and is a key driver of net interest income as well as fees and service charges revenue, which includes fees earned on customer cash held by third parties. Brokerage related cash was $52.3 billion and $48.3 billion at September 30, 2017 and 2016, respectively.
CompanyCorporate Metrics:
E*TRADE Q3 2018 10-Q | Page 12
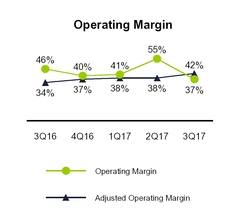
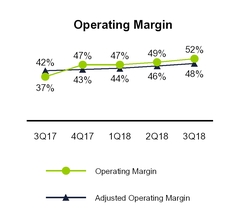
Operating margin is the percentage of net revenue that results in income before income taxes and is an indicator of the Company's profitability. Operating margin was 37%52% and 44%49% for the three and nine months ended September 30, 2017,2018, respectively, compared to 46%37% and 44% for the same periods in 2016.2017.
Adjusted operating margin is a non-GAAP measure that provides useful information about our ongoing operating performance by excluding the provision (benefit) for loan losses and losses on early extinguishment of debt, which are not viewed as key factors governing our investment in the business and are excluded by management when evaluating operating margin performance. Adjusted operating margin was 42%48% and 39%46% for the three and nine months ended September 30, 2017,2018, respectively, compared to 34%42% and 35%39% for the same periods in 2016.2017. See MD&A—Earnings Overview for a reconciliation of thisadjusted operating margin to operating margin.
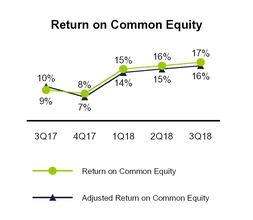
Return on common equity is calculated by dividing annualized net income available to common shareholders by average common shareholders' equity, which excludes preferred stock. Return on common equity was 17% and 16% for the three and nine months ended September 30, 2018, respectively, compared to 9% and 10% for the same periods in 2017.
Adjusted return on common equity is a non-GAAP measure calculated by dividing annualized adjusted net income available to common shareholders, a non-GAAP measure which excludes the most directly comparable GAAP measure.provision (benefit) for loan losses and losses on early extinguishment of debt, which are not viewed as key factors governing our investment in the business and are excluded by management when evaluating return on common equity performance, by average common shareholders' equity, which excludes preferred stock. Adjusted return on common equity was 16% and 15% for the three and nine months ended September 30, 2018, respectively, compared to 10% and 9% for the same periods in 2017. See MD&A—Earnings Overview for a reconciliation of adjusted net income available to common shareholders to net income and adjusted return on common equity to return on common equity.
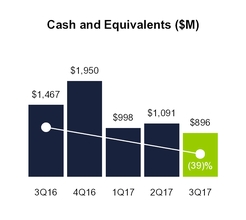
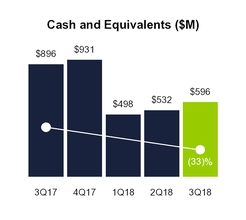
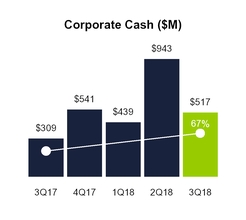
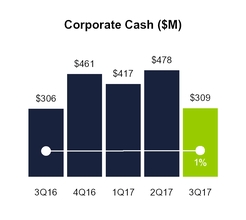
Corporate cash, a non-GAAP measure, is a component of cash and equivalents and represents the primary source of capital above and beyond the capital deployed in our regulated subsidiaries. Corporate cashCash and equivalents was $309$596 million and $306$896 million at September 30, 20172018 and 2016,2017, respectively, while corporate cash and equivalents was $896$517 million and $1.5 billion$309 million for the same periods. See MD&A—Liquidity and Capital Resources for a reconciliation of corporate cash to cash and equivalents.
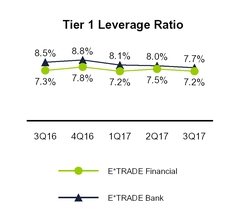
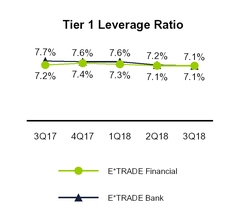
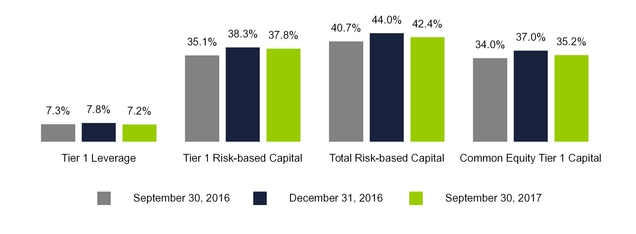
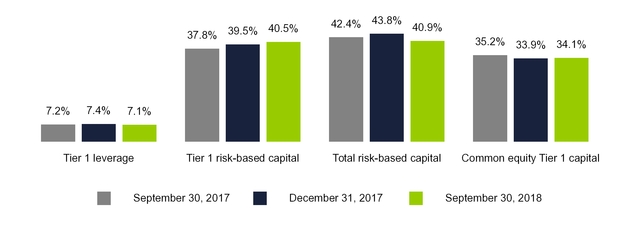
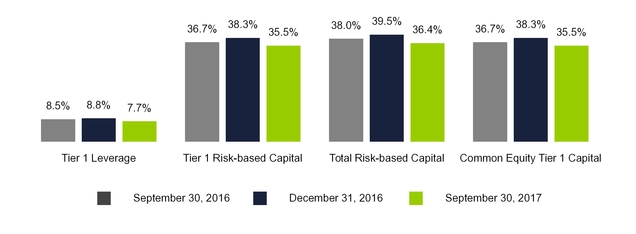
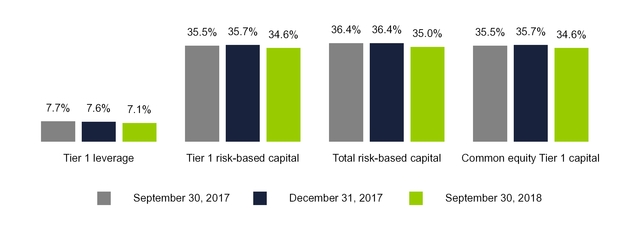
Tier 1 leverage ratio is an indicator of capital adequacy for E*TRADE Financial and E*TRADE Bank. Tier 1 leverage ratio is Tier 1 capital divided by adjusted average assets for leverage capital purposes. E*TRADE Financial's Tier 1 leverage ratio was 7.2%7.1% and 7.3%7.2% at September 30, 20172018 and 2016,2017, respectively. E*TRADE Bank's Tier 1 leverage ratio was 7.7%7.1% and 8.5%7.7% at September 30, 20172018 and 2016,2017, respectively. See MD&A—Liquidity and Capital Resources for additional information, including the calculation of regulatory capital ratios.
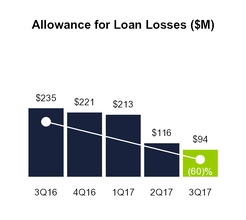
Allowance for loan losses is an estimate
E*TRADE Q3 2018 10-Q | Page 13
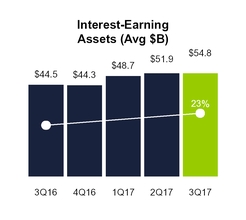
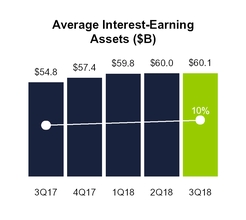
Interest-earning assets, along with net interest margin, isare an indicator of our ability to generate net interest income. Average interest-earning assets were $54.8$60.1 billion and $51.8$60.0 billion for the three and nine months ended September 30, 2017,2018, respectively, compared to $44.5$54.8 billion and $42.9$51.8 billion for the same periods in 2016.2017.
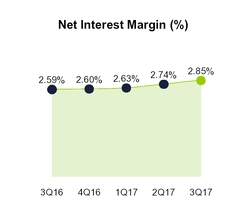
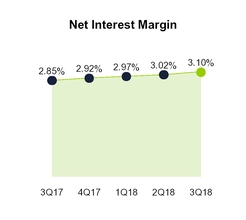
Net interest margin is a measure of the net yield on our average interest-earning assets. Net interest margin is calculated for a given period by dividing the annualized sum of net interest income by average interest-earning assets. Net interest margin was 2.85%3.10% and 2.74%3.03% for the three and nine months ended September 30, 2017,2018, respectively, compared to 2.59%2.85% and 2.67%2.74% for the same periods in 2016.2017.
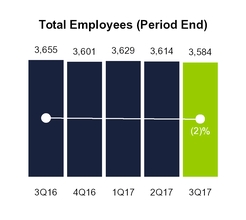
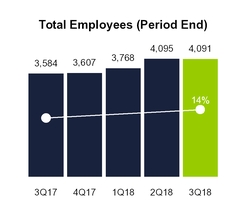
Total employees were 3,5844,091 and 3,6553,584 at September 30, 2018 and 2017, and 2016, respectively.
Regulatory Developments
In April 2016, the U.S.US Department of Labor (DOL) published its final fiduciaryConflicts of Interest Rule—Retirement Investment Advice regulations under the Employee Retirement Income Security Act of 1974 and the Internal Revenue Code of 1986. Certain aspects of these regulations began to take effect in June 2017. These regulations1986 (Fiduciary Rule). The Fiduciary Rule generally subjectsubjects particular persons, such as broker-dealers and other financial advisersadvisors providing investment advice to individual retirement accounts and other qualified retirement plans and accounts, to fiduciary duties and additional regulatory restrictions for a wider range of customer interactions. On March 5, 2018, the Fifth Circuit Court of Appeals issued a decision vacating the Fiduciary Rule in its entirety, and on June 21, 2018, following expiration of the appeals period for the decision and resolution of certain motions for appeal and intervention, issued a mandate making the decision effective.
In May 2018, the Economic Growth, Regulatory Relief, and Consumer Protection Act of 2018 (EGRRCPA) was passed. The remaining aspects of these regulations are currently scheduled to take effect on January 1, 2018. During this transition period, the Department of Labor indicated in Field Assistance Bulletin 2017-02 issued in May 2017, that it will not take enforcement actions against impacted parties that are in reasonable compliance with the regulations. The Company isEGRRCPA amended provisions in the processDodd-Frank Wall Street Reform and Consumer Protection Act of implementing2010 (Dodd-Frank Act) as well as other statutes administered by the remaining applicable components for compliance.
The Company has historically not been subject to certain regulatory requirements that apply to banking organizations with $50 billion or more in total consolidated assets as defined by each applicable regulation. Total consolidated assets of $50 billion, which is measured in accordance with each applicable regulation, but generally onFederal Reserve Board, the basisOffice of the averageComptroller of the four most recent quarters, isCurrency, and the FDIC (collectively, the “federal banking agencies”). In July 2018, the federal banking agencies issued a meaningful regulatory thresholdjoint release clarifying that as U.S. banking organizations become subject to a numberresult of additionalthe passage of EGRRCPA, certain requirements, including company-run stress testing requirements under the Dodd-Frank Act, would no longer be required for savings and in some cases, more stringent regulatory requirements once they reach that size. The Company surpassed $50loan holding companies and banks with less than $100 billion in total consolidated assets, on a four quarter average in the first quarter of 2017.
The Company expects these regulatory requirements, not all of which have been finalized, to start becoming applicable to it in 2018. The Company has begun implementing policies, procedures, systems and governance structures that are designed to comply with the requirements. Additionally, while savings and loan holding companies are currently excluded from the scope of certain regulations that apply to bank holding companies,such as the Company expectsand E*TRADE Bank. In addition the Federal Reserve Board issued a separate statement clarifying that, pursuant to EGRRCPA, it will ultimately be subjectnot take action to these requirements. For additional information seeenforce certain regulatory and reporting requirements, including the modified liquidity coverage ratio (LCR) for firms, like the Company, with less than $100 billion in total consolidated assets. Part I. Item 1. BusinessSee MD&A—Liquidity and Capital Resources of our Annual Report on Form 10-K for the year ended December 31, 2016.further information.
E*TRADE Q3 2018 10-Q | Page 14
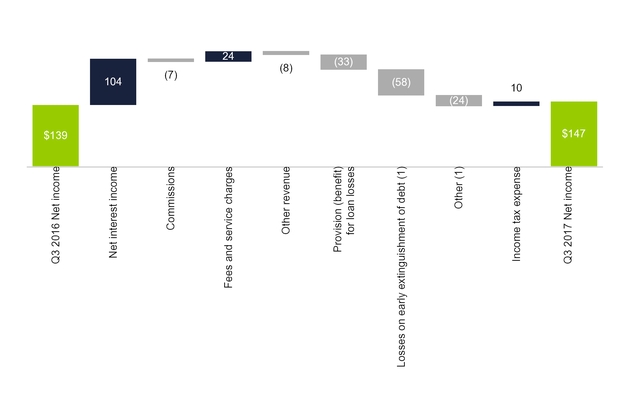
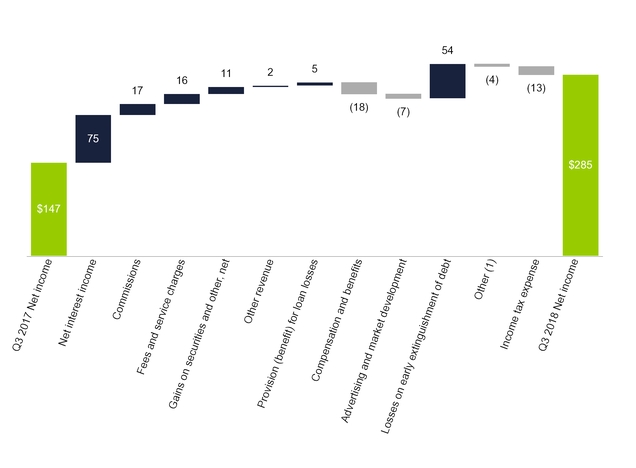
We generated net income of $147$285 million and $485$782 million on total net revenue of $599$720 million and $1.7$2.1 billion for the three and nine months ended September 30, 2017,2018, respectively. The following chart providespresents a reconciliation of net income for the three months ended September 30, 20162017 to net income for the three months ended September 30, 20172018 (dollars in millions):
| |
| (1) | TotalIncludes clearing and servicing, professional services, occupancy and equipment, communications, depreciation and amortization, FDIC insurance premiums, amortization of other intangibles, restructuring and acquisition-related activities and other non-interest expense increased $82 million for the periods presented which includes $58 million of losses on early extinguishment of debt.expenses. |
|
| | |
E*TRADE | Q3 2017 10-Q | | 10 |
E*TRADE Q3 2018 10-Q | Page 15
The following table presents significant components of the consolidated statement of income are as follows (dollars in millions except per share amounts): | | | | Three Months Ended September 30, | | Variance | | Nine Months Ended September 30, | | Variance | Three Months Ended September 30, | | Variance | | Nine Months Ended September 30, | | Variance |
| | | 2017 vs. 2016 | | 2017 vs. 2016 | | 2018 vs. 2017 | | 2018 vs. 2017 |
| | 2017 | | 2016 | | Amount | | % | | 2017 | | 2016 | | Amount | | % | 2018 | | 2017 | | Amount | | % | | 2018 | | 2017 | | Amount | | % |
| Net interest income | $ | 391 |
| | $ | 287 |
| | $ | 104 |
| | 36 | % | | $ | 1,066 |
| | $ | 860 |
| | $ | 206 |
| | 24 | % | $ | 466 |
| | $ | 391 |
| | $ | 75 |
| | 19 | % | | $ | 1,364 |
| | $ | 1,066 |
| | $ | 298 |
| | 28 | % |
| Total non-interest income | 208 |
| | 199 |
| | 9 |
| | 5 | % | | 663 |
| | 572 |
| | 91 |
| | 16 | % | 254 |
| | 208 |
| | 46 |
| | 22 | % | | 774 |
| | 663 |
| | 111 |
| | 17 | % |
| Total net revenue | 599 |
| | 486 |
| | 113 |
| | 23 | % | | 1,729 |
| | 1,432 |
| | 297 |
| | 21 | % | 720 |
| | 599 |
| | 121 |
| | 20 | % | | 2,138 |
| | 1,729 |
| | 409 |
| | 24 | % |
| Provision (benefit) for loan losses | (29 | ) | | (62 | ) | | 33 |
| | (53 | )% | | (142 | ) | | (131 | ) | | (11 | ) | | 8 | % | (34 | ) | | (29 | ) | | (5 | ) | | 17 | % | | (74 | ) | | (142 | ) | | 68 |
| | (48 | )% |
| Total non-interest expense | 405 |
| | 323 |
| | 82 |
| | 25 | % | | 1,106 |
| | 930 |
| | 176 |
| | 19 | % | 380 |
| | 405 |
| | (25 | ) | | (6 | )% | | 1,159 |
| | 1,106 |
| | 53 |
| | 5 | % |
| Income before income tax expense | 223 |
| | 225 |
| | (2 | ) | | (1 | )% | | 765 |
| | 633 |
| | 132 |
| | 21 | % | 374 |
| | 223 |
| | 151 |
| | 68 | % | | 1,053 |
| | 765 |
| | 288 |
| | 38 | % |
| Income tax expense | 76 |
| | 86 |
| | (10 | ) | | (12 | )% | | 280 |
| | 208 |
| | 72 |
| | 35 | % | 89 |
| | 76 |
| | 13 |
| | 17 | % | | 271 |
| | 280 |
| | (9 | ) | | (3 | )% |
| Net income | $ | 147 |
| | $ | 139 |
| | $ | 8 |
| | 6 | % | | $ | 485 |
| | $ | 425 |
| | $ | 60 |
| | 14 | % | $ | 285 |
| | $ | 147 |
| | $ | 138 |
| | 94 | % | | $ | 782 |
| | $ | 485 |
| | $ | 297 |
| | 61 | % |
| Preferred stock dividends | 12 |
| | — |
| | 12 |
| | 100 | % | | 25 |
| | — |
| | 25 |
| | 100 | % | 24 |
| | 12 |
| | 12 |
| | 100 | % | | 36 |
| | 25 |
| | 11 |
| | 44 | % |
| Net income available to common shareholders | $ | 135 |
| | $ | 139 |
| | $ | (4 | ) | | (3 | )% | | $ | 460 |
| | $ | 425 |
| | $ | 35 |
| | 8 | % | $ | 261 |
| | $ | 135 |
| | $ | 126 |
| | 93 | % | | $ | 746 |
| | $ | 460 |
| | $ | 286 |
| | 62 | % |
| Diluted earnings per common share | $ | 0.49 |
| | $ | 0.51 |
| | $ | (0.02 | ) | | (4 | )% | | $ | 1.67 |
| | $ | 1.52 |
| | $ | 0.15 |
| | 10 | % | $ | 1.00 |
| | $ | 0.49 |
| | $ | 0.51 |
| | 104 | % | | $ | 2.82 |
| | $ | 1.67 |
| | $ | 1.15 |
|
| 69 | % |
Net income increased 6%94% to $147$285 million and 14%61% to $485$782 million for the three and nine months ended September 30, 2017,2018, respectively, compared to the same periods in 2016.2017. Net income available to common shareholders was $261 million and $746 million for the three and nine months ended September 30, 2018, respectively, which reflects payments of $24 million and $36 million in preferred stock dividends, respectively. This compares to $135 million and $460 million for the three and nine months ended September 30, 2017 respectively, which reflects payments of $12 million and $25 million in preferred stock dividends, respectively, compared to net income available to common shareholders of $139 million and $425 million during the same periods in 2016. respectively.
The increase in net income for both periods in 2017 was driven by higher interest income due to a larger average balance sheet and higheran improvement in net interest rates,margin, as well as higher commissions, fees and service charges revenue. We recognized a benefit for loan losses of $29 million and $142 million for the threenet gains on securities and nine months ended September 30, 2017, respectively, compared to $62 million and $131 million for the same periods in 2016. Net income for the three and nine months ended September 30, 2017 also included $11 million and $27 million, respectively, of pre-tax costs primarily incurred in connection with the OptionsHouse integration and preparation for the incremental regulatory and reporting requirements that our balance sheet growth requires, as well as pre-taxother. Lower losses on early extinguishment of debt of $58 million. Non-interest expensealso contributed to increase net income for the three and nine months ended September 30, 2017 also included higher advertising and market development expenses driven by our new advertising campaign, as well as increased communications expense. These expenses were partially offset by lower restructuring and acquisition-related activities and an income tax benefit related to the revaluation of certain net state deferred tax assets. Net income forboth periods. During the nine months ended September 30, 2016 included an income tax2018, these increases were partially offset by a lower benefit relatedfor loan losses and higher non-interest expense due primarily to increased compensation and benefits and advertising and market development expenses.
Net Revenue
The following table presents the releasesignificant components of a valuation allowance against certain state deferred tax assets.net revenue (dollars in millions): |
| | | | | | | | | | | | | | | | | | | | | | | | | | | | | |
| | Three Months Ended September 30, | | Variance | | Nine Months Ended September 30, | | Variance |
| | | 2018 vs. 2017 | | | 2018 vs. 2017 |
| | 2018 | | 2017 | | Amount | | % | | 2018 | | 2017 | | Amount | | % |
| Net interest income | $ | 466 |
| | $ | 391 |
| | $ | 75 |
| | 19 | % | | $ | 1,364 |
| | $ | 1,066 |
| | $ | 298 |
| | 28 | % |
| Commissions | 117 |
| | 100 |
| | 17 |
| | 17 | % | | 375 |
| | 332 |
| | 43 |
| | 13 | % |
| Fees and service charges | 108 |
| | 92 |
| | 16 |
| | 17 | % | | 323 |
| | 276 |
| | 47 |
| | 17 | % |
| Gains on securities and other, net | 17 |
| | 6 |
| | 11 |
| | 183 | % | | 42 |
| | 23 |
| | 19 |
| | 83 | % |
| Other revenue | 12 |
| | 10 |
| | 2 |
| | 20 | % | | 34 |
| | 32 |
| | 2 |
| | 6 | % |
| Total non-interest income | 254 |
| | 208 |
| | 46 |
| | 22 | % | | 774 |
| | 663 |
| | 111 |
| | 17 | % |
| Total net revenue | $ | 720 |
| | $ | 599 |
| | $ | 121 |
| | 20 | % | | $ | 2,138 |
| | $ | 1,729 |
| | $ | 409 |
| | 24 | % |
|
| | |
E*TRADE | Q3 2017 10-Q | | 11 |
E*TRADE Q3 2018 10-Q | Page 16
Net Revenue
The components of net revenue and the resulting variances are as follows (dollars in millions): |
| | | | | | | | | | | | | | | | | | | | | | | | | | | | | |
| | Three Months Ended September 30, | | Variance | | Nine Months Ended September 30, | | Variance |
| | | 2017 vs. 2016 | | | 2017 vs. 2016 |
| | 2017 | | 2016 | | Amount | | % | | 2017 | | 2016 | | Amount | | % |
| Net interest income | $ | 391 |
| | $ | 287 |
| | $ | 104 |
| | 36 | % | | $ | 1,066 |
| | $ | 860 |
| | $ | 206 |
| | 24 | % |
| Commissions | 100 |
| | 107 |
| | (7 | ) | | (7 | )% | | 332 |
| | 320 |
| | 12 |
| | 4 | % |
| Fees and service charges | 92 |
| | 68 |
| | 24 |
| | 35 | % | | 276 |
| | 188 |
| | 88 |
| | 47 | % |
| Gains on securities and other, net | 6 |
| | 14 |
| | (8 | ) | | (57 | )% | | 23 |
| | 34 |
| | (11 | ) | | (32 | )% |
| Other revenue | 10 |
| | 10 |
| | — |
| | — | % | | 32 |
| | 30 |
| | 2 |
| | 7 | % |
| Total non-interest income | 208 |
| | 199 |
| | 9 |
| | 5 | % | | 663 |
| | 572 |
| | 91 |
| | 16 | % |
| Total net revenue | $ | 599 |
| | $ | 486 |
| | $ | 113 |
| | 23 | % | | $ | 1,729 |
| | $ | 1,432 |
| | $ | 297 |
| | 21 | % |
Net Interest Income
Net interest income increased 36%19% to $391$466 million and 24%28% to $1.1$1.4 billion for the three and nine months ended September 30, 2017,2018, respectively, compared to the same periods in 2016.2017. Net interest income is earned primarily through investment securities, margin receivables and our legacy mortgage and consumer loan portfolio, offset by funding costs.
|
| | |
E*TRADE | Q3 2017 10-Q | | 12 |
The following table presents average balance sheet data and interest income and expense data, as well as the related net interest margin, yields and rates prepared on the basis required by the SEC’s Industry Guide 3, "Statistical Disclosure by Bank Holding Companies"(dollars in millions):
| | | | Three Months Ended September 30, | Three Months Ended September 30, |
| | 2017 | | 2016 | 2018 | | 2017 |
| | Average Balance | | Interest Inc./Exp. | | Average Yield/ Cost | | Average Balance | | Interest Inc./Exp. | | Average Yield/ Cost | Average Balance | | Interest Inc./Exp. | | Average Yield/ Cost | | Average Balance | | Interest Inc./Exp. | | Average Yield/ Cost |
| Cash and equivalents | $ | 905 |
| | $ | 2 |
| | 1.06 | % | | $ | 1,989 |
| | $ | 2 |
| | 0.42 | % | $ | 471 |
| | $ | 2 |
| | 1.84 | % | | $ | 905 |
| | $ | 2 |
| | 1.06 | % |
| Cash required to be segregated under federal or other regulations | 759 |
| | 3 |
| | 1.26 | % | | 1,885 |
| | 2 |
| | 0.33 | % | 836 |
| | 4 |
| | 2.15 | % | | 759 |
| | 3 |
| | 1.26 | % |
| Available-for-sale securities | 19,064 |
| | 102 |
| | 2.13 | % | | 13,301 |
| | 66 |
| | 1.99 | % | |
| Held-to-maturity securities | 22,162 |
| | 153 |
| | 2.77 | % | | 15,937 |
| | 109 |
| | 2.73 | % | |
Investment securities(1) | | 44,773 |
| | 315 |
| | 2.82 | % | | 41,226 |
| | 255 |
| | 2.47 | % |
| Margin receivables | 8,096 |
| | 87 |
| | 4.26 | % | | 6,479 |
| | 60 |
| | 3.68 | % | 10,902 |
| | 130 |
| | 4.74 | % | | 8,096 |
| | 87 |
| | 4.26 | % |
Loans (1) | 3,024 |
| | 37 |
| | 4.95 | % | | 4,202 |
| | 46 |
| | 4.44 | % | |
Loans(2) | | 2,332 |
| | 32 |
| | 5.38 | % | | 3,024 |
| | 37 |
| | 4.95 | % |
| Broker-related receivables and other | 829 |
| | 1 |
| | 0.45 | % | | 696 |
| | — |
| | 0.13 | % | 798 |
| | 4 |
| | 2.02 | % | | 829 |
| | 1 |
| | 0.45 | % |
| Subtotal interest-earning assets | 54,839 |
| | 385 |
| | 2.80 | % | | 44,489 |
| | 285 |
| | 2.56 | % | 60,112 |
| | 487 |
| | 3.24 | % | | 54,839 |
| | 385 |
| | 2.80 | % |
Other interest revenue (2) | — |
| | 28 |
| | | | — |
| | 24 |
| | | |
Other interest revenue(3) | | — |
| | 27 |
| | | | — |
| | 28 |
| | |
| Total interest-earning assets | 54,839 |
| | 413 |
| | 3.01 | % | | 44,489 |
| | 309 |
| | 2.77 | % | 60,112 |
| | 514 |
| | 3.41 | % | | 54,839 |
| | 413 |
| | 3.01 | % |
Total non-interest-earning assets (3) | 4,952 |
| | | | | | 4,793 |
| | | | | |
| Total non-interest-earning assets | | 4,291 |
| | | | | | 4,952 |
| | | | |
| Total assets | $ | 59,791 |
| | | | | | $ | 49,282 |
| | | | | $ | 64,403 |
| | | | | | $ | 59,791 |
| | | | |
| | | | | | | | | | | | | | | | | | | | | | | |
| Deposits | $ | 40,758 |
| | $ | 1 |
| | 0.01 | % | | $ | 32,285 |
| | $ | 1 |
| | 0.01 | % | $ | 42,456 |
| | $ | 16 |
| | 0.15 | % | | $ | 40,758 |
| | $ | 1 |
| | 0.01 | % |
| Customer payables | 8,463 |
| | 1 |
| | 0.06 | % | | 7,592 |
| | 2 |
| | 0.06 | % | 10,352 |
| | 8 |
| | 0.30 | % | | 8,463 |
| | 1 |
| | 0.06 | % |
| Broker-related payables and other | 1,301 |
| | — |
| | 0.00 | % | | 1,258 |
| | — |
| | 0.00 | % | 1,880 |
| | 3 |
| | 0.53 | % | | 1,301 |
| | — |
| | 0.00 | % |
| Other borrowings | 831 |
| | 6 |
| | 2.91 | % | | 409 |
| | 4 |
| | 4.15 | % | 752 |
| | 6 |
| | 2.95 | % | | 831 |
| | 6 |
| | 2.91 | % |
| Corporate debt | 1,002 |
| | 12 |
| | 4.64 | % | | 993 |
| | 13 |
| | 5.40 | % | 1,408 |
| | 13 |
| | 3.90 | % | | 1,002 |
| | 12 |
| | 4.64 | % |
| Subtotal interest-bearing liabilities | 52,355 |
| | 20 |
| | 0.15 | % | | 42,537 |
| | 20 |
| | 0.19 | % | 56,848 |
| | 46 |
| | 0.32 | % | | 52,355 |
| | 20 |
| | 0.15 | % |
Other interest expense (4) | — |
| | 2 |
| | | | — |
| | 2 |
| | | — |
| | 2 |
| | | | — |
| | 2 |
| | |
| Total interest-bearing liabilities | 52,355 |
| | 22 |
| | 0.17 | % | | 42,537 |
| | 22 |
| | 0.20 | % | 56,848 |
| | 48 |
| | 0.33 | % | | 52,355 |
| | 22 |
| | 0.17 | % |
| Total non-interest-bearing liabilities | 820 |
| | | | | | 719 |
| | | | | 859 |
| | | | | | 820 |
| | | | |
| Total liabilities | 53,175 |
| | | | | | 43,256 |
| | | | | 57,707 |
| | | | | | 53,175 |
| | | | |
| Total shareholders' equity | 6,616 |
| | | | | | 6,026 |
| | | | | 6,696 |
| | | | | | 6,616 |
| | | | |
| Total liabilities and shareholders' equity | $ | 59,791 |
| | | | | | $ | 49,282 |
| | | | | $ | 64,403 |
| | | | | | $ | 59,791 |
| | | | |
| Excess interest earning assets over interest bearing liabilities/net interest income/net interest margin | $ | 2,484 |
| | $ | 391 |
| | 2.85 | % | | $ | 1,952 |
| | $ | 287 |
| | 2.59 | % | $ | 3,264 |
| | $ | 466 |
| | 3.10 | % | | $ | 2,484 |
| | $ | 391 |
| | 2.85 | % |
| |
| (1) | For the three months ended September 30, 2018, includes a $5 million net loss related to fair value hedging adjustments, previously referred to as hedge ineffectiveness. Amounts prior to 2018 have not been reclassified to conform to current period presentation and continue to be reflected within the gains on securities and other, net line item. See Note 8—Derivative Instruments and Hedging Activities for additional information. |
| |
| (2) | Nonaccrual loans are included in the average loan balances. Interest payments received on nonaccrual loans are recognized on a cash basis in interest income until it is doubtful that full payment will be collected, at which point payments are applied to principal. |
| |
(2)(3) | Represents interest income on securities loaned. |
| |
(3) | Non-interest earning assets consist of property and equipment, net, goodwill, other intangibles, net and other assets that do not generate interest income. |
| |
| (4) | Represents interest expense on securities borrowed. |
|
| | |
E*TRADE | Q3 2017 10-Q | | 13 |
E*TRADE Q3 2018 10-Q | Page 17
| | | | Nine Months Ended September 30, | Nine Months Ended September 30, |
| | 2017 | | 2016 | 2018 | | 2017 |
| | Average Balance | | Interest Inc./Exp. | | Average Yield/ Cost | | Average Balance | | Interest Inc./Exp. | | Average Yield/ Cost | Average Balance | | Interest Inc./Exp. | | Average Yield/ Cost | | Average Balance | | Interest Inc./Exp. | | Average Yield/ Cost |
| Cash and equivalents | $ | 1,045 |
| | $ | 6 |
| | 0.83 | % | | $ | 1,730 |
| | $ | 5 |
| | 0.40 | % | $ | 601 |
| | $ | 7 |
| | 1.60 | % | | $ | 1,045 |
| | $ | 6 |
| | 0.83 | % |
| Cash required to be segregated under federal or other regulations | 1,263 |
| | 9 |
| | 0.90 | % | | 1,540 |
| | 4 |
| | 0.33 | % | 795 |
| | 11 |
| | 1.91 | % | | 1,263 |
| | 9 |
| | 0.90 | % |
| Available-for-sale securities | 17,958 |
| | 282 |
| | 2.09 | % | | 13,149 |
| | 198 |
| | 2.01 | % | |
| Held-to-maturity securities | 19,823 |
| | 410 |
| | 2.76 | % | | 14,993 |
| | 319 |
| | 2.84 | % | |
Investment securities(1) | | 44,979 |
| | 908 |
| | 2.69 | % | | 37,781 |
| | 692 |
| | 2.44 | % |
| Margin receivables | 7,383 |
| | 228 |
| | 4.12 | % | | 6,553 |
| | 185 |
| | 3.77 | % | 10,225 |
| | 351 |
| | 4.59 | % | | 7,383 |
| | 228 |
| | 4.12 | % |
Loans (1) | 3,319 |
| | 121 |
| | 4.86 | % | | 4,505 |
| | 146 |
| | 4.33 | % | |
Loans(2) | | 2,475 |
| | 98 |
| | 5.25 | % | | 3,319 |
| | 121 |
| | 4.86 | % |
| Broker-related receivables and other | 1,029 |
| | 2 |
| | 0.24 | % | | 470 |
| | 1 |
| | 0.21 | % | 898 |
| | 12 |
| | 1.76 | % | | 1,029 |
| | 2 |
| | 0.24 | % |
| Subtotal interest-earning assets | 51,820 |
| | 1,058 |
| | 2.72 | % | | 42,940 |
| | 858 |
| | 2.67 | % | 59,973 |
| | 1,387 |
| | 3.09 | % | | 51,820 |
| | 1,058 |
| | 2.72 | % |
Other interest revenue (2) | — |
| | 74 |
| | | | — |
| | 65 |
| | | |
Other interest revenue(3) | | — |
| | 84 |
| | | | — |
| | 74 |
| | |
| Total interest-earning assets | 51,820 |
| | 1,132 |
| | 2.91 | % | | 42,940 |
| | 923 |
| | 2.87 | % | 59,973 |
| | 1,471 |
| | 3.27 | % | | 51,820 |
| | 1,132 |
| | 2.91 | % |
Total non-interest-earning assets (3) | 5,051 |
| | | | | | 4,882 |
| | | | | |
| Total non-interest-earning assets | | 4,479 |
| | | | | | 5,051 |
| | | | |
| Total assets | $ | 56,871 |
| | | | | | $ | 47,822 |
| | | | | $ | 64,452 |
| | | | | | $ | 56,871 |
| | | | |
| | | | | | | | | | | | | | | | | | | | | | | |
| Deposits | $ | 37,862 |
| | $ | 3 |
| | 0.01 | % | | $ | 31,243 |
| | $ | 3 |
| | 0.01 | % | $ | 42,877 |
| | $ | 26 |
| | 0.08 | % | | $ | 37,862 |
| | $ | 3 |
| | 0.01 | % |
| Customer payables | 8,611 |
| | 4 |
| | 0.06 | % | | 6,988 |
| | 4 |
| | 0.07 | % | 9,817 |
| | 13 |
| | 0.18 | % | | 8,611 |
| | 4 |
| | 0.06 | % |
| Broker-related payables and other | 1,233 |
| | — |
| | 0.00 | % | | 1,351 |
| | — |
| | 0.00 | % | 1,885 |
| | 7 |
| | 0.49 | % | | 1,233 |
| | — |
| | 0.00 | % |
| Other borrowings | 667 |
| | 16 |
| | 3.23 | % | | 418 |
| | 13 |
| | 4.23 | % | 837 |
| | 21 |
| | 3.28 | % | | 667 |
| | 16 |
| | 3.23 | % |
| Corporate debt | 996 |
| | 39 |
| | 5.14 | % | | 994 |
| | 40 |
| | 5.40 | % | 1,149 |
| | 32 |
| | 3.75 | % | | 996 |
| | 39 |
| | 5.14 | % |
| Subtotal interest-bearing liabilities | 49,369 |
| | 62 |
| | 0.17 | % | | 40,994 |
| | 60 |
| | 0.19 | % | 56,565 |
| | 99 |
| | 0.23 | % | | 49,369 |
| | 62 |
| | 0.17 | % |
Other interest expense (4) | — |
| | 4 |
| | | | — |
| | 3 |
| | | — |
| | 8 |
| | | | — |
| | 4 |
| | |
| Total interest-bearing liabilities | 49,369 |
| | 66 |
| | 0.18 | % | | 40,994 |
| | 63 |
| | 0.20 | % | 56,565 |
| | 107 |
| | 0.25 | % | | 49,369 |
| | 66 |
| | 0.18 | % |
| Total non-interest-bearing liabilities | 1,033 |
| | | | | | 1,010 |
| | | | | 939 |
| | | | | | 1,033 |
| | | | |
| Total liabilities | 50,402 |
| | | | | | 42,004 |
| | | | | 57,504 |
| | | | | | 50,402 |
| | | | |
| Total shareholders' equity | 6,469 |
| | | | | | 5,818 |
| | | | | 6,948 |
| | | | | | 6,469 |
| | | | |
| Total liabilities and shareholders' equity | $ | 56,871 |
| | | | | | $ | 47,822 |
| | | | | $ | 64,452 |
| | | | | | $ | 56,871 |
| | | | |
| Excess interest earning assets over interest bearing liabilities/net interest income/net interest margin | $ | 2,451 |
| | $ | 1,066 |
| | 2.74 | % | | $ | 1,946 |
| | $ | 860 |
| | 2.67 | % | $ | 3,408 |
| | $ | 1,364 |
| | 3.03 | % | | $ | 2,451 |
| | $ | 1,066 |
| | 2.74 | % |
| |
| (1) | For the nine months ended September 30, 2018, includes a $13 million net loss related to fair value hedging adjustments, previously referred to as hedge ineffectiveness. Amounts prior to 2018 have not been reclassified to conform to current period presentation and continue to be reflected within the gains on securities and other, net line item. See Note 8—Derivative Instruments and Hedging Activities for additional information. |
| |
| (2) | Nonaccrual loans are included in the average loan balances. Interest payments received on nonaccrual loans are recognized on a cash basis in interest income until it is doubtful that full payment will be collected, at which point payments are applied to principal. |
| |
(2)(3) | Represents interest income on securities loaned. |
| |
(3) | Non-interest earning assets consist of property and equipment, net, goodwill, other intangibles, net and other assets that do not generate interest income. |
| |
| (4) | Represents interest expense on securities borrowed. |
Average interest-earning assets increased 23%10% to $54.8$60.1 billion and 21%16% to $51.8$60.0 billion for the three and nine months ended September 30, 2017,2018, respectively, compared to the same periods in 2016.2017. The fluctuation in interest-earning assets is generally driven by changes in interest-bearing liabilities, primarily deposits and customer payables. Average interest-bearing liabilities increased 23%9% to $52.4$56.8 billion and 20%15% to $49.4$56.6 billion for the three and nine months ended September 30, 2017,2018, respectively, compared to the same periods in 2016.2017. The increase during the nine months ended September 30, 2018, was primarily due to higher deposits as a result of transferring customer cash held by third parties to our balance sheet. For additional information on our balance sheet growththroughout 2017 and early 2018, partially offset by customer cash held by third parties, see Balance Sheet Overview.net buying of $12.0 billion during the nine months ended September 30, 2018, compared to $6.9 billion during the same period in 2017.
E*TRADE Q3 2018 10-Q | Page 18
Net interest margin increased 2625 basis points to 2.85%3.10% and 729 basis points to 2.74%3.03% for the three and nine months ended September 30, 2017,2018, respectively, compared to the same periods in 2016.2017. Net interest margin is driven by the mix of average asset and liability average balances and the interest rates earned or paid on those balances. The increase during the three and nine months ended September 30, 2017,2018, compared to the same period in 2016,2017 is due to higher interest rates earned on increasedhigher margin receivablereceivables and investment securities balances,
|
| | |
E*TRADE | Q3 2017 10-Q | | 14 |
and higher securities lending activities, partially offset by the continued run-off of our higher yielding legacy mortgage and consumer loan portfolio. Additionally, funding costs increased primarily due to increased rates paid on deposits and customer payables during the three and nine months ended September 30, 2018. These increases were partially offset by lower corporate debt service costs during the nine months ended September 30, 2018.
Commissions
Commissions revenue decreased 7%increased 17% to $100$117 million and increased 4%13% to $332$375 million for the three and nine months ended September 30, 2017,2018, respectively, compared to the same periods in 2016.2017. The mainprimary factors that affect commissions revenue are DARTs, average commission per trade and the number of trading days.
DARTs volume increased 35%29% to 205,763266,290 and 32%34% to 207,065277,796 for the three and nine months ended September 30, 2017,2018, respectively, compared to the same periods in 2016,2017. The increase during the three and nine months ended September 30, 2018 was mainly driven by continued improved market sentiment along with the inclusion of OptionsHouse accounts and the strengthhigher volatility of the equity markets. Derivative DARTs represented 32%volume increased 30% to 85,977 and 31% of trading volume41% to 90,075 for the three and nine months ended September 30, 2017,2018, respectively, compared to 26% and 25% of trading volume for the same periods in 2016.2017.
Average commission per trade decreased 29%9% to $7.76$7.04 and 21%16% to $8.54$7.21 for the three and nine months ended September 30, 2017,2018, respectively, compared to the same periods in 2016.2017. Average commission per trade is impacted by customertrade mix and differing commission rates on various trade types (e.g. equities, derivatives, stock plan and mutual funds). Average commission per trade for the three and nine months ended September 30, 20172018 was also impacted by reduced commission rates implemented in March 2017 as well as the lower price structure for customer accounts associated with the OptionsHouse acquisition. We have also experienced increased trading activity from certaincontinued migration of customers qualifying them forto lower commission rates due to our new active trader pricing. This increased engagement is a key driver behind the decrease in average commission per trade.pricing.
Fees and Service Charges
The following table presents the significant components of fees and service charges and the resulting variances are as follows (dollars in millions): | | | | Three Months Ended September 30, | | Variance | | Nine Months Ended September 30, | | Variance | Three Months Ended September 30, | | Variance | | Nine Months Ended September 30, | | Variance |
| | | 2017 vs. 2016 | | 2017 vs. 2016 | | 2018 vs. 2017 | | 2018 vs. 2017 |
| | 2017 | | 2016 | | Amount | | % | | 2017 | | 2016 | | Amount | | % | 2018 | | 2017 | | Amount | | % | | 2018 | | 2017 | | Amount | | % |
| Order flow revenue | $ | 33 |
| | $ | 24 |
| | $ | 9 |
| | 38 | % | | $ | 98 |
| | $ | 68 |
| | $ | 30 |
| | 44 | % | $ | 40 |
| | $ | 33 |
| | $ | 7 |
| | 21 | % | | $ | 130 |
| | $ | 98 |
| | $ | 32 |
| | 33 | % |
Money market funds and sweep deposits revenue(1) | 23 |
| | 13 |
| | 10 |
| | 77 | % | | 71 |
| | 31 |
| | 40 |
| | 129 | % | 18 |
| | 23 |
| | (5 | ) | | (22 | )% | | 53 |
| | 71 |
| | (18 | ) | | (25 | )% |
| Advisor management and custody fees | | 19 |
| | 9 |
| | 10 |
| | 111 | % | | 46 |
| | 26 |
| | 20 |
| | 77 | % |
| Mutual fund service fees | 10 |
| | 9 |
| | 1 |
| | 11 | % | | 29 |
| | 27 |
| | 2 |
| | 7 | % | 13 |
| | 10 |
| | 3 |
| | 30 | % | | 36 |
| | 29 |
| | 7 |
| | 24 | % |
| Advisor management fees | 9 |
| | 8 |
| | 1 |
| | 13 | % | | 26 |
| | 21 |
| | 5 |
| | 24 | % | |
| Foreign exchange revenue | 6 |
| | 6 |
| | — |
| | — | % | | 20 |
| | 15 |
| | 5 |
| | 33 | % | 7 |
| | 6 |
| | 1 |
| | 17 | % | | 21 |
| | 20 |
| | 1 |
| | 5 | % |
| Reorganization fees | 5 |
| | 4 |
| | 1 |
| | 25 | % | | 13 |
| | 11 |
| | 2 |
| | 18 | % | 3 |
| | 5 |
| | (2 | ) | | (40 | )% | | 10 |
| | 13 |
| | (3 | ) | | (23 | )% |
| Other fees and service charges | 6 |
| | 4 |
| | 2 |
| | 50 | % | | 19 |
| | 15 |
| | 4 |
| | 27 | % | 8 |
| | 6 |
| | 2 |
| | 33 | % | | 27 |
| | 19 |
| | 8 |
| | 42 | % |
| Total fees and service charges | $ | 92 |
| | $ | 68 |
| | $ | 24 |
| | 35 | % | | $ | 276 |
| | $ | 188 |
| | $ | 88 |
| | 47 | % | $ | 108 |
| | $ | 92 |
| | $ | 16 |
| | 17 | % | | $ | 323 |
| | $ | 276 |
| | $ | 47 |
| | 17 | % |
| |
| (1) | Includes revenue earned on average customer cash held by third parties based on the federal funds rate or LIBOR plus a negotiated spread or other contractual arrangements with the third party institutions. |
Fees and service charges increased 35% to $92 million and 47% to $276 million for the three and nine months ended September 30, 2017, respectively, compared to the same periods in 2016. The increase in fees and service charges was largely driven by an increase in revenue earned on customer cash held by third parties, which was impacted by a higher interest rate environment, partially offset by lower average balances. The gross yield on customer cash held by third parties for the three and nine months ended September 30, 2017 of approximately 120 and 85 basis points compares to approximately 45 and 40 basis
|
| | |
E*TRADE | Q3 2017 10-Q | | 15 |
E*TRADE Q3 2018 10-Q | Page 19
Fees and service charges increased 17% for both the three and nine months ended September 30, 2018, to $108 million and $323 million, respectively, compared to the same periods in 2017. These increases were primarily driven by increased order flow revenue due to higher trade volume and improved rates as well as increased advisor management and custody fees as a result of the acquisition of TCA and higher balances held in our managed products. This increase was partially offset by decreased money market funds and sweep deposits revenue driven by lower customer cash balances held by third parties as a result of transferring cash onto our balance sheet. The impact of the lower balances was partially offset by a higher yield of approximately 145 and 140 basis points for the three and nine months ended September 30, 2018, respectively, compared to approximately 120 and 85 basis points for the same periods in 2016. In addition, fees and service charges benefited from increased order flow revenue resulting primarily from higher options trading activity and improved rates.2017.
Gains on Securities and Other, Net
The following table presents the significant components of gains on securities and other, net and the resulting variances are as follows (dollars in millions): |
| | | | | | | | | | | | | | | | | | | | | | | | | | | | | |
| | Three Months Ended September 30, | | Variance | | Nine Months Ended September 30, | | Variance |
| | | 2017 vs. 2016 | | | 2017 vs. 2016 |
| | 2017 | | 2016 | | Amount | | % | | 2017 | | 2016 | | Amount | | % |
| Gains on available-for-sale securities | $ | 7 |
| | $ | 17 |
| | $ | (10 | ) | | (59 | )% | | $ | 25 |
| | $ | 46 |
| | $ | (21 | ) | | (46 | )% |
| Hedge ineffectiveness | (2 | ) | | (4 | ) | | 2 |
| | (50 | )% | | (5 | ) | | (8 | ) | | 3 |
| | (38 | )% |
| Equity method investment income (loss) and other | 1 |
| | 1 |
| | — |
| | — | % | | 3 |
| | (4 | ) | | 7 |
| | (175 | )% |
| Gains on securities and other, net | $ | 6 |
| | $ | 14 |
| | $ | (8 | ) | | (57 | )% | | $ | 23 |
| | $ | 34 |
| | $ | (11 | ) | | (32 | )% |
|
| | | | | | | | | | | | | | | | | | | | | | | | | | | | | |
| | Three Months Ended September 30, | | Variance | | Nine Months Ended September 30, | | Variance |
| | | 2018 vs. 2017 | | | 2018 vs. 2017 |
| | 2018 | | 2017 | | Amount | | % | | 2018 | | 2017 | | Amount | | % |
Gains on available-for-sale securities, net(1) | 11 |
| | 7 |
| | 4 |
| | 57 | % | | 33 |
| | 25 |
| | 8 |
| | 32 | % |
Equity method investment income (loss) and other(2)(3) | 6 |
| | (1 | ) | | 7 |
| | * |
| | 9 |
| | (2 | ) | | 11 |
| | * |
|
| Gains on securities and other, net | $ | 17 |
| | $ | 6 |
| | $ | 11 |
| | 183 | % | | $ | 42 |
| | $ | 23 |
| | $ | 19 |
| | 83 | % |
| |
| * | Percentage not meaningful. |
| |
| (1) | In August 2018, the Company sold available-for-sale securities and reinvested the sale proceeds in agency-backed securities at current market rates. See Note 6—Available-for-Sale and Held-to-Maturity Securities for additional information. |
| |
| (2) | Includes a $5 million gain on the sale of our Chicago Stock Exchange investment for the three and nine months ended September 30, 2018. |
| |
| (3) | Includes a loss of $2 million and $5 million on hedge ineffectiveness for the three and nine months ended September 30, 2017. Beginning January 1, 2018, fair value hedging adjustments are recognized within net interest income. See Note 1—Organization, Basis of Presentation and Summary of Significant Accounting Policies for additional information. |
Provision (Benefit) for Loan Losses
We recognized a benefit for loan losses of $29$34 million and $142$74 million for the three and nine months ended September 30, 2017,2018, respectively, compared to a benefit of $62$29 million and $131$142 million for the same periods in 2016.2017. The timing and magnitude of the provision (benefit) for loan losses is affected by many factors that could result in variability. These benefits reflected better than expected performance of our portfolio as well as recoveries in excess of prior estimates,expectations, including sales of charged-off loans and recoveries of previous charge-offs. The benefit for loan losses for the nine months ended September 30, 2017 also reflected approximately $70 million of benefit recognizedcharge-offs that were not included in the second quarter of 2017 resulting from refined default assumptions based on the sustained outperformance of converted mortgage loans that had been amortizing for 12 months or longer.our loss estimates. For additional information on management's estimate of the allowance for loan losses, see Concentrations of Credit Risk and Summary of Critical Accounting Policies and EstimatesNote 7—Loans Receivable, Net.
|
| | |
E*TRADE | Q3 2017 10-Q | | 16 |
E*TRADE Q3 2018 10-Q | Page 20
Non-Interest Expense
The following table presents the significant components of non-interest expense and the resulting variances are as follows (dollars in millions): | | | | Three Months Ended September 30, | | Variance | | Nine Months Ended September 30, | | Variance | Three Months Ended September 30, | | Variance | | Nine Months Ended September 30, | | Variance |
| | | 2017 vs. 2016 | | 2017 vs. 2016 | | 2018 vs. 2017 | | 2018 vs. 2017 |
| | 2017 | | 2016 | | Amount | | % | | 2017 | | 2016 | | Amount | | % | 2018 | | 2017 | | Amount | | % | | 2018 | | 2017 | | Amount | | % |
| Compensation and benefits | $ | 139 |
| | $ | 123 |
| | $ | 16 |
| | 13 | % | | $ | 408 |
| | $ | 374 |
| | $ | 34 |
| | 9 | % | $ | 157 |
| | $ | 139 |
| | $ | 18 |
| | 13 | % | | $ | 469 |
| | $ | 408 |
| | $ | 61 |
| | 15 | % |
| Advertising and market development | 38 |
| | 27 |
| | 11 |
| | 41 | % | | 123 |
| | 100 |
| | 23 |
| | 23 | % | 45 |
| | 38 |
| | 7 |
| | 18 | % | | 152 |
| | 123 |
| | 29 |
| | 24 | % |
| Clearing and servicing | 29 |
| | 26 |
| | 3 |
| | 12 | % | | 94 |
| | 75 |
| | 19 |
| | 25 | % | 28 |
| | 29 |
| | (1 | ) | | (3 | )% | | 94 |
| | 94 |
| | — |
| | — | % |
| Professional services | 25 |
| | 26 |
| | (1 | ) | | (4 | )% | | 71 |
| | 70 |
| | 1 |
| | 1 | % | 23 |
| | 25 |
| | (2 | ) | | (8 | )% | | 70 |
| | 71 |
| | (1 | ) | | (1 | )% |
| Occupancy and equipment | 28 |
| | 24 |
| | 4 |
| | 17 | % | | 84 |
| | 71 |
| | 13 |
| | 18 | % | 29 |
| | 28 |
| | 1 |
| | 4 | % | | 89 |
| | 84 |
| | 5 |
| | 6 | % |
| Communications | 29 |
| | 22 |
| | 7 |
| | 32 | % | | 90 |
| | 65 |
| | 25 |
| | 38 | % | 30 |
| | 29 |
| | 1 |
| | 3 | % | | 89 |
| | 90 |
| | (1 | ) | | (1 | )% |
| Depreciation and amortization | 20 |
| | 20 |
| | — |
| | — | % | | 60 |
| | 60 |
| | — |
| | — | % | 25 |
| | 20 |
| | 5 |
| | 25 | % | | 70 |
| | 60 |
| | 10 |
| | 17 | % |
| FDIC insurance premiums | 8 |
| | 6 |
| | 2 |
| | 33 | % | | 24 |
| | 18 |
| | 6 |
| | 33 | % | 8 |
| | 8 |
| | — |
| | — | % | | 26 |
| | 24 |
| | 2 |
| | 8 | % |
| Amortization of other intangibles | 9 |
| | 5 |
| | 4 |
| | 80 | % | | 27 |
| | 15 |
| | 12 |
| | 80 | % | 12 |
| | 9 |
| | 3 |
| | 33 | % | | 34 |
| | 27 |
| | 7 |
| | 26 | % |
| Restructuring and acquisition-related activities | 4 |
| | 25 |
| | (21 | ) | | (84 | )% | | 12 |
| | 28 |
| | (16 | ) | | (57 | )% | 4 |
| | 4 |
| | — |
| | — | % | | 6 |
| | 12 |
| | (6 | ) | | (50 | )% |
| Losses on early extinguishment of debt | 58 |
| | — |
| | 58 |
| | 100 | % | | 58 |
| | — |
| | 58 |
| | 100 | % | 4 |
| | 58 |
| | (54 | ) | | (93 | )% | | 4 |
| | 58 |
| | (54 | ) | | (93 | )% |
| Other non-interest expenses | 18 |
| | 19 |
| | (1 | ) | | (5 | )% | | 55 |
| | 54 |
| | 1 |
| | 2 | % | 15 |
| | 18 |
| | (3 | ) | | (17 | )% | | 56 |
| | 55 |
| | 1 |
| | 2 | % |
| Total non-interest expense | $ | 405 |
| | $ | 323 |
| | $ | 82 |
| | 25 | % | | $ | 1,106 |
| | $ | 930 |
| | $ | 176 |
| | 19 | % | $ | 380 |
| | $ | 405 |
| | $ | (25 | ) | | (6 | )% | | $ | 1,159 |
| | $ | 1,106 |
| | $ | 53 |
| | 5 | % |
Compensation and Benefits
Compensation and benefits expense increased 13% to $139$157 million and 9%15% to $408$469 million for the three and nine months ended September 30, 2017,2018, respectively, compared to the same periods in 2016.2017. The expense increase was primarily driven by increased incentive compensation during the three and nine months endeda 14% increase in headcount since September 30, 2017.2017 as a result of the TCA acquisition and growth in our business.
Advertising and Market Development
Advertising and market development expense increased 41%18% to $38$45 million and 23%24% to $123$152 million for the three and nine months ended September 30, 2017,2018, respectively, compared to the same periods in 2016. The2017. This planned increase was primarily due to higher spending as we launchedmedia and brand production spend resulting from our increased focus on accelerating the growth of our business by increasing engagement across new advertising campaign during the three months ended June 30, 2017.and existing customers.
ClearingRestructuring and ServicingAcquisition-Related Activities
ClearingRestructuring and servicing expense increased 12% to $29acquisition-related activities expenses remained flat at $4 million and 25%decreased 50% to $94$6 million for the three and nine months ended September 30, 2017,2018, respectively, compared to the same periods in 2016. The increase was primarily related to higher trading volume compared to the same periods in 2016.
Communications
Communications expense increased 32% to $29 million and 38% to $90 million for the three and nine months ended September 30, 2017, respectively, compared to the same periods in 2016. The increase was primarily driven by increased market data fees resulting from higher trading activity. Additionally, during the three months ended June 30, 2017, we updated our accrual estimate for professional users of real time market data and recognized $9 million related to previous usage.
|
| | |
E*TRADE | Q3 2017 10-Q | | 17 |
Restructuring and Acquisition-Related Activities
Restructuring and acquisition-related activities were $4 million and $12 million for the three and nine months ended September 30, 2017, respectively, compared to $25 million and $28 million the same periods in 2016.2017. Restructuring and acquisition-related activities during the three and nine months ended September 30, 20162018 reflected $18$4 million and $21$6 million, respectively, of expenses in connection with the restructuring of our regulatory and enterprise risk management functions due to bank regulatory reform and the closing of the TCA acquisition. The restructuring costs for the three and nine months ended September 30, 2017 primarily related to the realignmentintegration of our core brokerage business and $7 millionOptionsHouse.
E*TRADE Q3 2018 10-Q | Page 21
Losses on Early Extinguishment of Debt
Losses on early extinguishment of debt were $4 million for both the three and nine months ended September 30, 2018 and $58 million for both the three and nine months ended September 30, 2017.
During the third quarter of 2018, we used the net proceeds from the June 2018 issuance of Senior Notes to redeem all $413 million of our outstanding TRUPs. In connection with the redemption, we recognized a loss on early extinguishment of debt of $4 million.
During the third quarter of 2017, we issued $600 million of 2.95% Senior Notes due 2022 and $400 million of 3.80% Senior Notes anddue 2027. We used the net proceeds, along with existing corporate cash, to redeem our outstanding $540 million of 5.375% Senior Notes and $460 million of 4.625% Senior Notes, which resulted in a $58 million loss on early extinguishment of debt.
Operating Margin
Operating margin was 37%52% and 44%49% for the three and nine months ended September 30, 2017,2018, respectively, compared to 46%37% and 44% for the same periods in 2016.2017. Adjusted operating margin, a non-GAAP measure, was 42%48% and 39%46% for the three and nine months ended September 30, 2017,2018, respectively, compared to 34%42% and 35%39% for the same periods in 2016.2017.
Adjusted operating margin is a non-GAAP measure calculated by dividing adjusted income before income tax expense by total net revenue. Adjusted income before income tax expense, a non-GAAP measure, excludes the provision (benefit) for loan losses and losses on early extinguishment of debt. The following table providespresents a reconciliation of adjusted income before income tax expense and adjusted operating margin, non-GAAP measures, to the most directly comparable GAAP measures (dollars in millions):
| | | | Three Months Ended September 30, | | Nine Months Ended September 30, | Three Months Ended September 30, | | Nine Months Ended September 30, |
| | 2017 | | 2016 | | 2017 | | 2016 | 2018 | | 2017 | | 2018 | | 2017 |
| | Amount | | Operating Margin % | | Amount | | Operating Margin % | | Amount | | Operating Margin % | | Amount | | Operating Margin % | Amount | | Operating Margin % | | Amount | | Operating Margin % | | Amount | | Operating Margin % | | Amount | | Operating Margin % |
| Income before income tax expense / operating margin | $ | 223 |
| | 37% | | $ | 225 |
| | 46% | | $ | 765 |
| | 44% | | $ | 633 |
| | 44% | $ | 374 |
| | 52% | | $ | 223 |
| | 37% | | $ | 1,053 |
| | 49% | | $ | 765 |
| | 44% |
| Add back impact of pre-tax items: | | | | | | | | | | | | | | | | |
| Provision (benefit) for loan losses | (29 | ) | | (62 | ) | | (142 | ) | | (131 | ) | | (34 | ) | | (29 | ) | | (74 | ) | | (142 | ) | |
| Losses on early extinguishment of debt | 58 |
| | — |
| | 58 |
| | — |
| | 4 |
| | 58 |
| | 4 |
| | 58 |
| |
| Subtotal | 29 |
| | (62 | ) | | (84 | ) | | (131 | ) | | (30 | ) | | 29 |
| | (70 | ) | | (84 | ) | |
| Adjusted income before income tax expense / adjusted operating margin | $ | 252 |
| | 42% | | $ | 163 |
| | 34% | | $ | 681 |
| | 39% | | $ | 502 |
| | 35% | $ | 344 |
| | 48% | | $ | 252 |
| | 42% | | $ | 983 |
| | 46% | | $ | 681 |
| | 39% |
Return on Common Equity
Return on common equity was 17% and 16% for the three and nine months ended September 30, 2018, respectively, compared to 9% and 10% for the same periods in 2017. Adjusted return on common equity, a non-GAAP measure, was 16% and 15% for the three and nine months ended September 30, 2018, respectively, compared to 10% and 9% for the same periods in 2017.
|
| | |
E*TRADE | Q3 2017 10-Q | | 18 |
E*TRADE Q3 2018 10-Q | Page 22
Adjusted return on common equity, a non-GAAP measure, is calculated by dividing annualized adjusted net income available to common shareholders by average common shareholders' equity, which excludes preferred stock. Adjusted net income available to common shareholders, a non-GAAP measure, excludes the after-tax impact of provision (benefit) for loan losses and losses on early extinguishment of debt. The following table provides a reconciliation of GAAP net income available to common shareholders and return on common equity percentage to non-GAAP adjusted net income available to common shareholders and adjusted return on common equity percentage (dollars in millions):
|
| | | | | | | | | | | | | | | | | | | | | | | |
| | Three Months Ended September 30, | | Nine Months Ended September 30, |
| | 2018 | | 2017 | | 2018 | | 2017 |
| | Amount | | Return on Common Equity % | | Amount | | Return on Common Equity % | | Amount | | Return on Common Equity % | | Amount | | Return on Common Equity % |
| Net income available to common shareholders and return on common equity | $ | 261 |
| | 17% | | $ | 135 |
| | 9% | | $ | 746 |
| | 16% | | $ | 460 |
| | 10% |
| Add back impact of the following items: | | | | | | | | | | | | | | | |
| Provision (benefit) for loan losses | (34 | ) | | | | (29 | ) | | | | (74 | ) | | | | (142 | ) | | |
| Losses on early extinguishment of debt | 4 |
| | | | 58 |
| | | | 4 |
| | | | 58 |
| | |
| Subtotal | (30 | ) | | | | 29 |
| | | | (70 | ) | | | | (84 | ) | | |
| Income tax impact | 8 |
| | | | (12 | ) | | | | 18 |
| | | | 32 |
| | |
| Net of tax | (22 | ) | | | | 17 |
| | | | (52 | ) | | | | (52 | ) | | |
| Adjusted net income available to common shareholders and return on common equity | $ | 239 |
| | 16% | | $ | 152 |
| | 10% | | $ | 694 |
| | 15% | | $ | 408 |
| | 9% |
Income Tax Expense
Income tax expense was $76$89 million and $280$271 million for the three and nine months ended September 30, 2017,2018, respectively, compared to $86$76 million and $208$280 million for the same periods in 2016.2017. The effective tax rates wererate was 24% and 26% for the three and nine months ended September 30, 2018, respectively, compared to 34% and 37% for the same periods in 2017.
The lower effective tax rate for both the three and nine months ended September 30, 2018 includes the impact of federal tax reform, which resulted in a lower federal tax rate beginning January 1, 2018, and an $8 million income tax benefit related to the revaluation of certain net state deferred tax assets.
The effective tax rates for the three and nine months ended September 30, 2017 respectively, compared to 38% and 33% for the same periods in 2016.
The effective tax rates of 34% and 37% for the three and nine months ended September 30, 2017, respectively, includealso included tax benefits related to the revaluation of certain net state deferred tax assets and to the adoption of amended accounting guidance for employee share-based compensation. See Note 1—Organization, Basis of Presentation and Summary of Significant Accounting Policies for additional information on the adoption of the amended accounting guidance. The effective tax rate of 33% for the nine months ended September 30, 2016 was impacted by a tax benefit related to the release of valuation allowances against certain state deferred tax assets.
|
| | |
E*TRADE | Q3 2017 10-Q | | 19 |
E*TRADE Q3 2018 10-Q | Page 23
The following table sets forthpresents the significant components of the consolidated balance sheet (dollars in millions): | | | | | | Variance | | | Variance |
| | September 30, | | December 31, | | 2017 vs. 2016 | September 30, | | December 31, | | 2018 vs. 2017 |
| | 2017 | | 2016 | | Amount | | % | 2018 | | 2017 | | Amount | | % |
| Assets: | | | | | | | | | | | | | | |
| Cash and equivalents | $ | 896 |
| | $ | 1,950 |
| | $ | (1,054 | ) | | (54 | )% | $ | 596 |
| | $ | 931 |
| | $ | (335 | ) | | (36 | )% |
| Segregated cash | 696 |
| | 1,460 |
| | (764 | ) | | (52 | )% | 856 |
| | 872 |
| | (16 | ) | | (2 | )% |
Securities(1) | 42,093 |
| | 29,643 |
| | 12,450 |
| | 42 | % | |
Investment securities(1) | | 44,890 |
| | 44,518 |
| | 372 |
| | 1 | % |
| Margin receivables | 8,535 |
| | 6,731 |
| | 1,804 |
| | 27 | % | 11,184 |
| | 9,071 |
| | 2,113 |
| | 23 | % |
| Loans receivable, net | 2,838 |
| | 3,551 |
| | (713 | ) | | (20 | )% | 2,251 |
| | 2,654 |
| | (403 | ) | | (15 | )% |
Receivables from brokers, dealers and clearing organizations(2) | 1,108 |
| | 1,056 |
| | 52 |
| | 5 | % | 786 |
| | 1,178 |
| | (392 | ) | | (33 | )% |
| Goodwill and other intangibles, net | 2,664 |
| | 2,690 |
| | (26 | ) | | (1 | )% | 2,876 |
| | 2,654 |
| | 222 |
| | 8 | % |
| Deferred tax assets, net | 416 |
| | 756 |
| | (340 | ) | | (45 | )% | |
Other(3) | 1,129 |
| | 1,162 |
| | (33 | ) | | (3 | )% | |
Other(2) | | 1,267 |
|
| 1,487 |
| | (220 | ) | | (15 | )% |
| Total assets | $ | 60,375 |
| | $ | 48,999 |
| | $ | 11,376 |
| | 23 | % | $ | 64,706 |
| | $ | 63,365 |
| | $ | 1,341 |
| | 2 | % |
| Liabilities and shareholders’ equity: | | | | | | | | | | | | | | |
| Deposits | $ | 41,543 |
| | $ | 31,682 |
| | $ | 9,861 |
| | 31 | % | $ | 43,074 |
| | $ | 42,742 |
| | $ | 332 |
| | 1 | % |
| Customer payables | 8,716 |
| | 8,159 |
| | 557 |
| | 7 | % | 10,534 |
| | 9,449 |
| | 1,085 |
| | 11 | % |
Payables to brokers, dealers and clearing organizations(4) | 1,392 |
| | 983 |
| | 409 |
| | 42 | % | |
| Payables to brokers, dealers and clearing organizations | | 1,845 |
| | 1,542 |
| | 303 |
| | 20 | % |
| Other borrowings | 609 |
| | 409 |
| | 200 |
| | 49 | % | 550 |
| | 910 |
| | (360 | ) | | (40 | )% |
| Corporate debt | 991 |
| | 994 |
| | (3 | ) | | — | % | 1,408 |
| | 991 |
| | 417 |
| | 42 | % |
| Other liabilities | 476 |
| | 500 |
| | (24 | ) | | (5 | )% | 529 |
| | 800 |
| | (271 | ) | | (34 | )% |
| Total liabilities | 53,727 |
| | 42,727 |
| | 11,000 |
| | 26 | % | 57,940 |
| | 56,434 |
| | 1,506 |
| | 3 | % |
| Shareholders’ equity | 6,648 |
| | 6,272 |
| | 376 |
| | 6 | % | 6,766 |
| | 6,931 |
| | (165 | ) | | (2 | )% |
| Total liabilities and shareholders’ equity | $ | 60,375 |
| | $ | 48,999 |
| | $ | 11,376 |
| | 23 | % | $ | 64,706 |
| | $ | 63,365 |
| | $ | 1,341 |
| | 2 | % |
| |
| (1) | Includes balance sheet line items available-for-sale and held-to-maturity securities. |
| |
| (2) | Includes deposits paid for securities borrowed of $484 million and $774 million as of September 30, 2017 and December 31, 2016, respectively. |
| |
(3) | Includes balance sheet line items property and equipment, net and other assets. |
| |
(4) | Includes deposits received Other assets includes deferred tax assets, net due to a presentation change beginning January 1, 2018. See Note 1—Organization, Basis of Presentation and Summary of Significant Accounting Policies for securities loaned of $1.3 billion and $926 million as of September 30, 2017 and December 31, 2016, respectively.additional information. |
Cash and Equivalents
Cash and equivalents decreased 54%36% to $896$596 million during the nine months ended September 30, 2017 and includes corporate cash of $309 million as of September 30, 2017.2018. Cash and equivalents will fluctuate based on a variety of factors, including, among other drivers, liquidity needs at the parent, customer activity at our regulated subsidiaries, and the timing of investments at E*TRADE Bank. For additional information on our use of cash and equivalents, including corporate cash, see MD&A—Liquidity and Capital Resources.Resources and the consolidated statement of cash flows.
E*TRADE Q3 2018 10-Q | Page 24
Segregated Cash
Cash required to be segregated under federal or other regulations decreased 52%2% to $696$856 million during the nine months ended September 30, 2017.2018. The level of segregated cash is driven largely by customer payables and securities lending balances we hold as liabilities compared with the amount of margin receivables and securities borrowed balances we hold as assets. The excess represents customer cash that we are required by our regulators to segregate for the exclusive benefit of our brokerage customers. At
|
| | |
E*TRADE | Q3 2017 10-Q | | 20 |
both September 30, 20172018 and December 31, 2016,2017, $800 million and $500 million, respectively, of reverse repurchase agreements between E*TRADE Securities and E*TRADE Bank, representing investments that were also segregated under federal or other regulations by E*TRADE Securities, were eliminated in consolidation.
Investment Securities
Available-for-saleThe following table presents the significant components of available-for-sale and held-to-maturity securities are summarized as follows (dollars in millions): | | | | | | Variance | | | Variance |
| | September 30, | | December 31, | | 2017 vs. 2016 | September 30, | | December 31, | | 2018 vs. 2017 |
| | 2017 | | 2016 | | Amount | | % | 2018 | | 2017 | | Amount | | % |
| Available-for-sale securities: | | | | | | | | | | | | | | |
| Debt securities: | | | | | | | | | | | | | | |
| Agency mortgage-backed securities | $ | 17,663 |
| | $ | 12,634 |
| | $ | 5,029 |
| | 40 | % | $ | 21,639 |
| | $ | 19,195 |
| | $ | 2,444 |
| | 13 | % |
| Other debt securities | 1,503 |
| | 1,251 |
| | 252 |
| | 20 | % | 1,225 |
| | 1,477 |
| | (252 | ) | | (17 | )% |
| Total debt securities | 19,166 |
| | 13,885 |
| | 5,281 |
| | 38 | % | 22,864 |
| | 20,672 |
| | 2,192 |
| | 11 | % |
Publicly traded equity securities(1) | 7 |
| | 7 |
| | — |
| | — | % | — |
| | 7 |
| | (7 | ) | | (100 | )% |
| Total available-for-sale securities | $ | 19,173 |
| | $ | 13,892 |
| | $ | 5,281 |
| | 38 | % | $ | 22,864 |
| | $ | 20,679 |
| | $ | 2,185 |
| | 11 | % |
| Held-to-maturity securities: | | | | | | | | | | | | | | |
| Agency mortgage-backed securities | $ | 19,850 |
| | $ | 12,868 |
| | $ | 6,982 |
| | 54 | % | $ | 18,427 |
| | $ | 20,502 |
| | $ | (2,075 | ) | | (10 | )% |
| Other debt securities | 3,070 |
| | 2,883 |
| | 187 |
| | 6 | % | 3,599 |
| | 3,337 |
| | 262 |
| | 8 | % |
| Total held-to-maturity securities | $ | 22,920 |
| | $ | 15,751 |
| | $ | 7,169 |
| | 46 | % | $ | 22,026 |
| | $ | 23,839 |
| | $ | (1,813 | ) | | (8 | )% |
| Total investments in securities | $ | 42,093 |
| | $ | 29,643 |
| | $ | 12,450 |
| | 42 | % | |
| Total investment securities | | $ | 44,890 |
| | $ | 44,518 |
| | $ | 372 |
| | 1 | % |
| |
| (1) | Consists of investments in a Community Reinvestment Act investments(CRA) related mutual fund. At September 30, 2018, these equity securities are included in other assets on the consolidated balance sheet as a mutual fund.result of the adoption of amended accounting guidance related to the classification and measurement of financial instruments. See Note 1—Organization, Basis of Presentation and Summary of Significant Accounting Policies for additional information. |
Securities represented 70%69% and 60%70% of total assets at September 30, 20172018 and December 31, 2016,2017, respectively. We classify debt securities as available-for-sale or held-to-maturity based on our investment strategy and management’s assessment of our intent and ability to hold the debt securities until maturity.
The increase in total investments in securities during the nine months ended September 30, 2017 was primarily due to net purchases as a result of our efforts to grow the balance sheet by transferring customer cash held by third parties to our balance sheet.
Margin Receivables
Margin receivables increased 27% to $8.5 billion during the nine months ended September 30, 2017. The increase in margin receivables was primarily driven by improved market sentiment increasing demand for additional margin lending. During the three months ended September 30, 2017, we alsoMarch 31, 2018 securities with a carrying value of $4.7 billion and related unrealized pre-tax gain of $7 million were transferred $0.4from held-to-maturity securities to available-for-sale securities as part of a one-time transition election for early adopting the new derivatives and hedge accounting guidance. Securities with a fair value of $1.2 billion were transferred from available-for-sale to held-to-maturity pursuant to an evaluation of customer margin balances heldour investment strategy and an assessment by a third party clearing firmmanagement about our intent and ability to E*TRADEhold those particular securities until maturity.
See Note 1—Organization, Basis of Presentation and Summary of Significant Accounting Policies, Note 6—Available-for-Sale and Held-to-Maturity Securities in connection with the integration of OptionsHouse.and Note 12—Shareholders' Equity for additional information.
|
| | |
E*TRADE | Q3 2017 10-Q | | 21 |
E*TRADE Q3 2018 10-Q | Page 25
Loans Receivable, NetMargin Receivables
Loans receivable, net are summarized as follows (dollars in millions): |
| | | | | | | | | | | | | | |
| | | | Variance |
| | September 30, | | December 31, | | 2017 vs. 2016 |
| | 2017 | | 2016 | | Amount | | % |
| One- to four-family | $ | 1,531 |
| | $ | 1,950 |
| | $ | (419 | ) | | (21 | )% |
| Home equity | 1,197 |
| | 1,556 |
| | (359 | ) | | (23 | )% |
| Consumer and other | 192 |
| | 250 |
| | (58 | ) | | (23 | )% |
| Total loans receivable | 2,920 |
| | 3,756 |
| | (836 | ) | | (22 | )% |
| Unamortized premiums, net | 12 |
| | 16 |
| | (4 | ) | | (25 | )% |
| Allowance for loan losses | (94 | ) | | (221 | ) | | 127 |
| | (57 | )% |
| Total loans receivable, net | $ | 2,838 |
| | $ | 3,551 |
| | $ | (713 | ) | | (20 | )% |
Loans receivable, net decreased 20%Margin receivables increased 23% to $2.8$11.2 billion during the nine months ended September 30, 2017. During2018. We believe recent market appreciation of customer assets provided additional capacity which, coupled with market sentiment, drove the threeincrease in margin receivables.
Loans Receivable, Net
The following table presents the significant components of loans receivable, net (dollars in millions): |
| | | | | | | | | | | | | | |
| | | | Variance |
| | September 30, | | December 31, | | 2018 vs. 2017 |
| | 2018 | | 2017 | | Amount | | % |
| One- to four-family | $ | 1,150 |
| | $ | 1,432 |
| | $ | (282 | ) | | (20 | )% |
| Home equity | 890 |
| | 1,097 |
| | (207 | ) | | (19 | )% |
Consumer and other(1) | 244 |
| | 188 |
| | 56 |
| | 30 | % |
| Total loans receivable | 2,284 |
| | 2,717 |
| | (433 | ) | | (16 | )% |
| Unamortized premiums, net | 8 |
| | 11 |
| | (3 | ) | | (27 | )% |
| Subtotal | 2,292 |
| | 2,728 |
| | (436 | ) | | (16 | )% |
| Less: Allowance for loan losses | 41 |
| | 74 |
| | (33 | ) | | (45 | )% |
| Total loans receivable, net | $ | 2,251 |
| | $ | 2,654 |
| | $ | (403 | ) | | (15 | )% |
| |
| (1) | In 2017 we introduced E*TRADE Line of Credit, a securities-based lending product, where customers can borrow against the market value of their securities pledged as collateral. The drawn amount and unused credit line amount totaled $113 million and $168 million, respectively, as of September 30, 2018 and $12 million and $35 million, respectively, as of December 31, 2017. |
Loans receivable, net decreased 15% to $2.3 billion during the nine months ended JuneSeptember 30, 2017 the Company sold certain loans with a carrying value of $41 million for proceeds that approximated book value.2018. We expect the remaining legacy mortgage and consumer loan portfolio to continue its run-off for the foreseeable future. As our portfolio has seasoned and substantially all interest-only loans have converted to amortizing, we continue to assess underlying performance, the economic environment, and the value of the portfolio in the marketplace. While it is our intention to hold these loans, if the markets improve or our assessment changes, our strategy could change. For additional information on management's estimate of the allowance for loan losses, see Concentrations of Credit Risk and Summary of Critical Accounting Policies and EstimatesNote 7—Loans Receivable, Net.
In the third quarter of 2017 we introduced a securities-based lending product, where customers can borrow up to 50% of the market value of securities pledged as collateral. Activity for these loans is reflected as consumer and other within loans receivable, net and related disclosures.
Deposits
Deposits are summarized as follows (dollars in millions): |
| | | | | | | | | | | | | | |
| | | | Variance |
| | September 30, | | December 31, | | 2017 vs. 2016 |
| | 2017 | | 2016 | | Amount | | % |
| Sweep deposits | $ | 36,507 |
| | $ | 26,362 |
| | $ | 10,145 |
| | 38 | % |
| Savings deposits | 3,011 |
| | 3,185 |
| | (174 | ) | | (5 | )% |
| Other deposits | 2,025 |
| | 2,135 |
| | (110 | ) | | (5 | )% |
| Total deposits | $ | 41,543 |
| | $ | 31,682 |
| | $ | 9,861 |
| | 31 | % |
Deposits represented 77% and 74% of total liabilities at September 30, 2017 and December 31, 2016, respectively. At September 30, 2017, approximately 92% of our customer deposits were covered by FDIC insurance. Deposits increased $9.9 billion during the nine months ended September 30, 2017 primarily as a result of transferring customer cash held by third parties to our balance sheet.
|
| | |
E*TRADE | Q3 2017 10-Q | | 22 |
E*TRADE Q3 2018 10-Q | Page 26
Receivables from and Payables to Brokers, Dealers and Clearing Organizations
The following table presents the significant components of receivables from and payables to brokers, dealers and clearing organizations (dollars in millions): |
| | | | | | | | | | | | | | |
| | | | Variance |
| | September 30, | | December 31, | | 2018 vs. 2017 |
| | 2018 | | 2017 | | Amount | | % |
| Receivables: | | | | | | | |
| Securities borrowed | $ | 321 |
| | $ | 740 |
| | $ | (419 | ) | | (57 | )% |
| Receivables from clearing organizations | 405 |
| | 376 |
| | 29 |
| | 8 | % |
| Other | 60 |
| | 62 |
| | (2 | ) | | (3 | )% |
| Total | $ | 786 |
| | $ | 1,178 |
| | $ | (392 | ) | | (33 | )% |
| | | | | | | |
|
|
| Payables: | | | | | | |
|
|
| Securities loaned | $ | 1,794 |
| | $ | 1,373 |
| | $ | 421 |
| | 31 | % |
| Payables to clearing organizations | 14 |
| | 123 |
| | (109 | ) | | (89 | )% |
| Other | 37 |
| | 46 |
| | (9 | ) | | (20 | )% |
| Total | $ | 1,845 |
| | $ | 1,542 |
| | $ | 303 |
| | 20 | % |
Securities borrowed decreased 57% to $321 million during the nine months ended September 30, 2018. The decrease was driven by a lower demand for securities to cover customer short positions during the period.
Securities loaned increased 31% to $1.8 billion during the nine months ended September 30, 2018. The increase was driven by funding requirements at E*TRADE Securities, primarily to fund increased margin lending activity. For additional information on E*TRADE Securities liquidity, see MD&A—Liquidity and Capital Resources.
Goodwill and Other Intangibles, Net
Goodwill and other intangibles, net increased 8% to $2.9 billion during the nine months ended September 30, 2018. The increase was driven by the addition of goodwill and other intangibles in connection with the TCA acquisition. See Note 2—Business Acquisition for additional information.
Deposits
The following table presents the significant components of deposits (dollars in millions): |
| | | | | | | | | | | | | | |
| | | | Variance |
| | September 30, | | December 31, | | 2018 vs. 2017 |
| | 2018 | | 2017 | | Amount | | % |
| Sweep deposits | $ | 37,998 |
| | $ | 37,734 |
| | $ | 264 |
| | 1 | % |
| Savings deposits | 3,145 |
| | 2,912 |
| | 233 |
| | 8 | % |
| Other deposits | 1,931 |
| | 2,096 |
| | (165 | ) | | (8 | )% |
| Total deposits | $ | 43,074 |
| | $ | 42,742 |
| | $ | 332 |
| | 1 | % |
Deposits represented 74% and 76% of total liabilities at September 30, 2018 and December 31, 2017, respectively.
E*TRADE Q3 2018 10-Q | Page 27
Brokerage Related Cash
The majority of the deposits balance, specifically sweep deposits, is included in brokerage related cash, which is reported as a customer activity metric. TotalThe following table presents the significant components of total brokerage related cash is summarized as follows (dollars in millions): | | | | | | Variance | | | Variance |
| | September 30, | | December 31, | | 2017 vs. 2016 | September 30, | | December 31, | | 2018 vs. 2017 |
| | 2017 | | 2016 | | Amount | | % | 2018 | | 2017 | | Amount | | % |
Sweep deposits(1) | $ | 36,507 |
| | $ | 26,362 |
| | $ | 10,145 |
| | 38 | % | |
| Brokerage customer cash held on balance sheet: | | | | | | | | |
| Sweep deposits | | $ | 37,998 |
| | $ | 37,734 |
| | $ | 264 |
| | 1 | % |
| Customer payables | 8,716 |
| | 8,159 |
| | 557 |
| | 7 | % | 10,534 |
| | 9,449 |
| | 1,085 |
| | 11 | % |
| Subtotal | 45,223 |
|
| 34,521 |
| | 10,702 |
| | 31 | % | 48,532 |
|
| 47,183 |
| | 1,349 |
| | 3 | % |
Customer cash held by third parties(2) | 7,076 |
| | 16,848 |
| | (9,772 | ) | | (58 | )% | |
Customer cash held by third parties(1): | | | | | |
|
| |
|
|
| Sweep deposits | | 3,007 |
| | 4,724 |
| | (1,717 | ) | | (36 | )% |
| Money market funds and other | | 1,761 |
| | 1,016 |
| | 745 |
| | 73 | % |
| Subtotal | | 4,768 |
| | 5,740 |
| | (972 | ) | | (17 | )% |
| Total brokerage related cash | $ | 52,299 |
| | $ | 51,369 |
| | $ | 930 |
| | 2 | % | $ | 53,300 |
| | $ | 52,923 |
| | $ | 377 |
| | 1 | % |
| |
| (1) | Sweep deposits are held at bank subsidiaries and are included in the deposits line item on our consolidated balance sheet. |
| |
(2) | Customer cash held by third parties is maintained at unaffiliated financial institutions outside E*TRADE Financial and includes money market funds and sweep deposit accounts. Prior to September 30, 2017, customer cash held by third parties also included OptionsHouse customer cash held by a third party clearing firm. These balances were transferred to E*TRADE Securities during the three months ended September 30, 2017, in connection with the integration of OptionsHouse.institutions. Customer cash held by third parties is not reflected on our consolidated balance sheet and is not immediately available for liquidity purposes. |
We offer an extendedthe following sweep deposit account programs to our brokerage customers:
Extended insurance sweep deposit account (ESDA) program to our brokerage customers.
E*TRADE Cash Account Program offered by E*TRADE Savings Bank for uninvested cash held in eligible custodial accounts as part of the Advisor Services offering launched in connection with the TCA acquisition
Retirement sweep deposit account (RSDA) program for retirement plan customers launched in the second quarter of 2018
The ESDA program utilizesprograms utilize our bank subsidiaries, in combination with additional third party program banks, to allow customers the ability to have aggregate deposits they hold in the ESDA programprograms insured up to $500,000 or $1,250,000 for each category of legal ownership.ownership depending on the program. As of September 30, 2017, approximately2018, 99% of sweep deposits were in the ESDA program.
Customer cash held by third parties is maintained at unaffiliated financial institutions. The components of customer cash held by third parties are summarized as follows (dollars in millions): |
| | | | | | | | | | | | | | |
| | | | Variance |
| | September 30, | | December 31, | | 2017 vs. 2016 |
| | 2017 | | 2016 | | Amount | | % |
| Sweep deposits held by unaffiliated financial institutions | $ | 6,360 |
| | $ | 14,943 |
| | $ | (8,583 | ) | | (57 | )% |
Customer cash held by third party clearing firm(1) | — |
| | 1,634 |
| | (1,634 | ) | | (100 | )% |
| Municipal funds and other | 716 |
| | 271 |
| | 445 |
| | 164 | % |
| Customer cash held by third parties | $ | 7,076 |
| | $ | 16,848 |
| | $ | (9,772 | ) | | (58 | )% |
| |
(1) | Represents OptionsHouse customer cash held by a third party clearing firm that was transferred to E*TRADE Securities during the three months ended September 30, 2017 in connection with the integration of OptionsHouse. |
As of September 30, 2017, approximately $3.4 billion of customer cash held by third parties was available forthese programs. Sweep deposits on balance sheet growth. The timingare held at bank subsidiaries and are included in the deposits line item on our consolidated balance sheet.
E*TRADE Q3 2018 10-Q | Page 28
Other Borrowings
Other borrowings are summarized as follows (dollars in millions): |
| | | | | | | | | | | | | | |
| | | | Variance |
| | September 30, | | December 31, | | 2017 vs. 2016 |
| | 2017 | | 2016 | | Amount | | % |
| FHLB advances | $ | 200 |
| | $ | — |
| | $ | 200 |
| | 100 | % |
| Trust preferred securities | 409 |
| | 409 |
| | — |
| | — | % |
| Total other borrowings | $ | 609 |
| | $ | 409 |
| | $ | 200 |
| | 49 | % |
|
| | |
E*TRADE | Q3 2017 10-Q | | 23 |
|
| | | | | | | | | | | | | | |
| | | | Variance |
| | September 30, | | December 31, | | 2018 vs. 2017 |
| | 2018 | | 2017 | | Amount | | % |
| FHLB advances | $ | 550 |
| | $ | 500 |
| | $ | 50 |
| | 10 | % |
| Trust preferred securities | — |
| | 410 |
| | (410 | ) | | (100 | )% |
| Total other borrowings | $ | 550 |
| | $ | 910 |
| | $ | (360 | ) | | (40 | )% |
Other borrowings increased 49%decreased 40% to $609$550 million during the nine months ended September 30, 2017 as we utilized2018, primarily due to the redemption of TRUPs, partially offset by additional utilization of Federal Home Loan Bank (FHLB) advances for short-term liquidity and funding requirements. SeeMD&A—Liquidity and Capital Resources for additional information on liquidity and funding sources at E*TRADE Bank.and Note 10—Other Borrowings for additional information on the redemption of TRUPs.
Corporate Debt
Corporate debt increased 42% to $1.4 billion during the nine months ended September 30, 2018, as we issued Senior Notes in June 2018 and used the net proceeds from the issuance to redeem our TRUPs. See Note 11—Corporate Debt and Note 15—Commitments, Contingencies and Other Regulatory Matters.
|
|
| LIQUIDITY AND CAPITAL RESOURCES |
We have established liquidity and capital policies to support the successful execution of our business strategy, while maintaining ongoing and sufficient liquidity through the business cycle. We believe liquidity is of critical importance to the Company and especially important for E*TRADE Bank and our broker-dealer subsidiaries.E*TRADE Securities. The objective of our policies is to ensure that we can meet our corporate, banking and broker-dealer liquidity needs under both normal operating conditions and under periods of stress in the financial markets.
Liquidity
Our corporate liquidity needs are primarily driven by capital needs at E*TRADE Bank and E*TRADE Securities as well as by the principal and interest due on our corporate debt and the amount of dividend payments on our preferred stock and common stock. Our banking and brokerage subsidiaries' liquidity needs are driven primarily by the level and volatility of our customer activity. Management maintains a set of liquidity sources and monitors certain business trends and market metrics closely in an effort to ensure we have sufficient liquidity. Potential loans by E*TRADE Bank to the parent company and itsthe parent company's other non-bank subsidiaries are subject to various quantitative, arm’s length, collateralization, capital and other requirements. The Company expects to use existing cash during the fourth quarter of 2018 to fund the acquisition of approximately one million retail brokerage accounts from Capital One.
The Company became subject to the modified LCR requirement beginning April 1, 2018 which required the Company to hold at least 70% of its projected net cash outflows over a 30-day period in high-quality liquid assets. In July 2018, the Federal Reserve Board clarified that, pursuant to EGRRCPA, certain regulatory and reporting requirements, including the modified LCR would no longer apply to firms, like the Company, with less than $100 billion in total consolidated assets.
E*TRADE Q3 2018 10-Q | Page 29
Parent Company Liquidity
The parent company's primary source of liquidity is corporate cash. Corporate cash, a non-GAAP measure, is a component of cash and equivalents; see the consolidated statement of cash flows within Item 1. Condensed Consolidated Financial Statements (Unaudited) for information on cash and equivalents activity. We define corporate cash as cash held at the parent company and subsidiaries, excluding bank, broker-dealer, and futures commission merchant (FCM)FCM subsidiaries that require regulatory approval or notification prior to the payment of certain dividends to the parent company. Corporate cash includes the parent company's deposits placed with E*TRADE Bank. E*TRADE Bank may use these deposits for investment purposes; however, these investments are not included in consolidated cash and equivalents.
We believe corporate cash is a useful measure of the parent company’s liquidity as it is the primary source of capital above and beyond the capital deployed in our regulated subsidiaries. Corporate cash can fluctuate in any given quarter and is impacted primarily by the following:
Dividends from and investments in subsidiaries
Non-cumulative preferred stock dividends
Common stock dividends
Share repurchases
Debt activity, including issuances, paydowns and debt service costs
Acquisitions and other investments
Tax payments and the reimbursementReimbursements from the parent company's subsidiaries for the use of itsthe parent company's deferred tax assets
OtherParent company overhead and expenseless reimbursements through cost sharing arrangements with subsidiaries
|
| | |
E*TRADE | Q3 2017 10-Q | | 24 |
E*TRADE Q3 2018 10-Q | Page 30
The following chart provides a roll forward of corporate cash at December 31, 20162017 to corporate cash at September 30, 20172018 (dollars in millions):
(1) Other activity includes contributions to subsidiaries and parent company overhead, offset by reimbursements from subsidiaries for use of the parent's deferred tax assets and related proceeds under overhead cost sharing arrangements.
The following table providespresents a reconciliation of consolidated cash and equivalents to corporate cash, a non-GAAP measure (dollars in millions):
| | | | September 30, | | December 31, | | September 30, | September 30, | | December 31, | | September 30, |
| | 2017 | | 2016 | | 2016 | 2018 | | 2017 | | 2017 |
| Consolidated cash and equivalents | $ | 896 |
| | $ | 1,950 |
| | $ | 1,467 |
| $ | 596 |
| | $ | 931 |
| | $ | 896 |
|
Less: Cash at regulated subsidiaries(1) | (587 | ) | | (1,489 | ) | | (1,161 | ) | (590 | ) | | (659 | ) | | (729 | ) |
Add: Cash on deposit at E*TRADE Bank(1) | | 511 |
| | 269 |
| | 142 |
|
| Corporate cash | $ | 309 |
| | $ | 461 |
| | $ | 306 |
| $ | 517 |
| | $ | 541 |
| | $ | 309 |
|
| |
| (1) | Corporate cash includes the parent company's deposits placed with E*TRADE Bank. E*TRADE Bank may use these deposits for investment purposes; however, these investments are not included in consolidated cash and equivalents. |
(1) Reported net of corporate cash on deposit at E*TRADE Bank that is eliminated in consolidation.
Corporate cash decreased $152 million to $309 million during the nine months ended September 30, 2017. Corporate cash included dividends of $220 million from E*TRADE Securities to the parent company during the nine months ended September 30, 2017. Corporate cash also included the impact of share repurchases, corporate debt refinance activity, preferred stock dividends, debt service, overhead cost sharing arrangements between the parent and our operating subsidiaries, and the impact of annual incentive compensation payments in the nine months ended September 30, 2017.
|
| | |
E*TRADE | Q3 2017 10-Q | | 25 |
E*TRADE Q3 2018 10-Q | Page 31
DuringCorporate cash decreased $24 million to $517 million during the three and nine months ended September 30, 2017, we2018 primarily due to the following:
$360 million and $363 million received in net dividends from E*TRADE Securities and E*TRADE Bank, respectively
$384 million received from corporate debt activity which includes $417 million in net debt issuance proceeds partially offset by $33 million in debt service costs
$638 million used $76for share repurchases
$429 million in investments in subsidiaries which includes the $413 million payment to redeem the TRUPs
$102 million used primarily for parent company overhead less reimbursements from subsidiaries under cost sharing arrangements
Corporate cash is monitored as part of our liquidity risk management and our current corporate cash target is $300 million. This target covers approximately 18 months of parent company fixed costs, which includes preferred stock dividends, debt service and other overhead costs. The Company maintains $300 million of corporate cash along with the net proceeds from the issuance of $1 billion of senior notes, to redeem our higher cost corporate debt, and to pay the associated redemption premiums, accrued and unpaid interest and related fees and expenses. This transaction decreased our annual corporate debt service costs from $50 million to $33 million. We maintain corporate cash at a minimum of two times our scheduled annual corporate debt service payments and scheduled maturities over the next 12 months. As we do not have any scheduled maturities of corporate debt in the coming year, our current minimum under this methodology is approximately $66 million; however, we are currently targeting $200 million in corporate cash for future periods. Our nearest maturity of interest-bearing corporate debt is August 2022.
On June 23, 2017, we entered intoadditional liquidity through an unsecured committed revolving credit facility with certain lenders, which replaced our previous secured committed revolving credit facility entered into in November 2014 and increased our total borrowing capacity under the facility to $300 million.facility. The Companyparent has the ability to borrow against the credit facility for working capital and general corporate purposes. The unsecured committed revolving credit facility will mature on June 23, 2020. At September 30, 2017,2018, there was no outstanding balance under this revolving credit facility.
On October 19, 2017, we announced an agreement to acquire TCA For additional information about our liquidity risk management approach see Part II. Item 7. Management's Discussion and Analysis of Financial Condition and Results of Operations of ourAnnual ReportonForm 10-K for $275 million in cash. We anticipate funding the transaction through the issuance of non-cumulative perpetual preferred stock. Based on this structure, we do not expect the acquisition to impact our ability to maintain a 6.5% Tier 1 leverage ratio.year endedDecember 31, 2017.
E*TRADE Bank Liquidity
E*TRADE Bank, including its subsidiary E*TRADE Savings Bank, relies on bank cash and deposits for liquidity needs. Management believes that within deposits, sweep deposits are of particular importance as they are a stable source of liquidity for E*TRADE Bank. We haveThe vast majority of E*TRADE Bank's liquidity is invested in securities backed by the ability to generate liquidity in the form of additional deposits by raising the yield on our customer deposit products and by bringing additional deposits onto our balance sheet. Sweep deposits on our balance sheet as of September 30, 2017 increased $10.1 billion compared to December 31, 2016. We utilize our sweep deposit platform to efficiently manage our balance sheet size.US government or its agencies, representing highly liquid securities with low credit risk.
We may also utilize wholesale funding sources for short-term liquidity and contingency funding requirements. Our ability to borrow these funds is dependent upon the continued availability of funding in the wholesale borrowings market. In addition, we can borrow from the Federal Reserve Bank of Richmond's discount window to meet short-term liquidity requirements, although it is not viewed as a primary source of funding. At September 30, 2017,2018, E*TRADE Bank had approximately $5.1$6.7 billion and $0.9$1.0 billion in additional collateralized borrowing capacity with the FHLB and the Federal Reserve Bank of Richmond, respectively.
E*TRADE Securities Liquidity
E*TRADE Securities relies on customer payables, securities lending, and internal and external lines of credit to provide liquidity and to fund margin lending. At September 30, 2017,2018, E*TRADE Securities' external liquidity lines totaled approximately $1.1$1.3 billion and included the following:
A 364-day, $450$600 million senior unsecured committed revolving credit facility with a syndicate of banks, with a maturity date ofin June 2018 and a commitment fee of 0.35% on unused balances2019
Secured committed lines of credit with two unaffiliated banks, aggregating to $175 million, with a maturity date ofdates in June 2018 and a commitment fee of 0.15% on unused balances2019
Unsecured uncommitted lines of credit with twothree unaffiliated banks, aggregating to $75$125 million, of which $50 million matures in June 20182019 and the remaining line haslines have no maturity date
E*TRADE Q3 2018 10-Q | Page 32
Secured uncommitted lines of credit with several unaffiliated banks, aggregating to $375 million with no maturity date
The revolving credit facility contains certain covenants, including maintenance covenants related to E*TRADE Securities' minimum consolidated tangible net worth and regulatory net capital ratio. There were
|
| | |
E*TRADE | Q3 2017 10-Q | | 26 |
no outstanding balances for any of these lines at September 30, 2017.2018. E*TRADE Securities also maintains lines of credit with the parent company and E*TRADE Bank.
Liquidity Coverage RatioCapital Resources
As a resultThe Company seeks to manage capital levels in support of our business strategy of generating and effectively deploying capital for the benefit of our shareholders, governed by the Company's balance sheet growth, we will be subject to the modified liquidity coverage ratio (LCR) requirement beginning April 1, 2018. The purpose of the LCR is to require banking organizations to hold minimum amounts of high-quality liquid assets (HQLA) basedrisk management framework. For additional information on a percentage of their net cash outflows over a 30-day period. Bankour bank and savings and loan holding companies with total consolidated assets of $50 billion or more, based on the average of the four most recent quarters, are subject to a modified LCR requiring them to hold HQLA in an amount equal to at least 70% of their projected net cash outflows over a 30-day period. The Company believes the LCR is an important measure of liquidity and has been managing against it in preparation for the applicability of these requirements. In addition, beginning October 1, 2018, we will be required to disclose certain quantitative and qualitative information related to our LCR calculation after each calendar quarter.
Capital Resourcesbrokerage capital requirements, see Note 14—Regulatory Requirements.
Bank Capital Requirements
The Dodd-Frank Act requires all companies, including savings and loan holding companies, that directly or indirectly control an insured depository institution, to serve as a source of strength for the institution. TheThere are bank regulatory capital requirements applicable to the Company and E*TRADE Bank, are subject to regulatory capital requirements. Somesome of these requirementswhich are still subject to phase-in periods, including certain deductions from and adjustments to regulatory capital. TheseMost of these requirements are currently scheduled to bebecame fully implemented in 2018, though proposed rulemaking may impact the phase-in periods or certain deductions.as of January 1, 2018. For additional information on bank regulatory requirements and phase-in periods, see Overview—Regulatory Developmentsas well as Part I. Item 1. Business—Regulation in our Annual Report on Form 10-K for the year ended December 31, 2016. 2017.
At September 30, 2017,2018, our regulatory capital ratios for E*TRADE Financial were well above the minimum ratios required to be "well capitalized." E*TRADE Financial's current Tier 1 Leverageleverage ratio threshold ofis 6.5% was reduced from 7.0% in July 2017.. E*TRADE Financial's capital ratios are as follows:
|
| | |
E*TRADE | Q3 2017 10-Q | | 27 |
E*TRADE Q3 2018 10-Q | Page 33
The following table presents the calculation of E*TRADE Financial's capital ratios are calculated as follows (dollars in millions): | | | | September 30, | | December 31, | | September 30, | | | | | | | |
| | 2017 | | 2016 | | 2016 | September 30, 2018 | | December 31, 2017 | | September 30, 2017 |
| E*TRADE Financial shareholders’ equity | $ | 6,648 |
| | $ | 6,272 |
| | $ | 6,316 |
| $ | 6,766 |
| | $ | 6,931 |
| | $ | 6,648 |
|
| Deduct: | | | | | | | | | | |
| Preferred stock | (394 | ) | | (394 | ) | | (394 | ) | (689 | ) | | (689 | ) | | (394 | ) |
| E*TRADE Financial Common Equity Tier 1 capital before regulatory adjustments | $ | 6,254 |
| | $ | 5,878 |
| | $ | 5,922 |
| $ | 6,077 |
| | $ | 6,242 |
| | $ | 6,254 |
|
| Add: | | | | | | | | | | |
| (Gains) losses in other comprehensive income on available-for-sale debt securities, net of tax | 50 |
| | 139 |
| | (37 | ) | |
| Losses in other comprehensive income on available-for-sale debt securities, net of tax | | 329 |
| | 26 |
| | 50 |
|
| Deduct: | | | | | | | | | | |
| Goodwill and other intangible assets, net of deferred tax liabilities | (2,014 | ) | | (2,029 | ) | | (2,043 | ) | (2,450 | ) | | (2,191 | ) | | (2,014 | ) |
| Disallowed deferred tax assets | (472 | ) | | (505 | ) | | (556 | ) | (257 | ) | | (304 | ) | | (472 | ) |
| E*TRADE Financial Common Equity Tier 1 capital | 3,818 |
| | 3,483 |
| | 3,286 |
| 3,699 |
| | 3,773 |
| | 3,818 |
|
| Add: | | | | | | | | | | |
| Preferred stock | 394 |
| | 394 |
| | 394 |
| 689 |
| | 689 |
| | 394 |
|
| Deduct: | | | | | | | | | | |
| Disallowed deferred tax assets | (112 | ) | | (267 | ) | | (284 | ) | — |
| | (76 | ) | | (112 | ) |
| E*TRADE Financial Tier 1 capital | $ | 4,100 |
| | $ | 3,610 |
| | $ | 3,396 |
| $ | 4,388 |
| | $ | 4,386 |
| | $ | 4,100 |
|
| Add: | | | | | | | | | | |
| Allowable allowance for loan losses | 94 |
| | 124 |
| | 128 |
| 41 |
| | 74 |
| | 94 |
|
| Non-qualifying capital instruments subject to phase-out (trust preferred securities) | 414 |
| | 414 |
| | 414 |
| — |
| | 414 |
| | 414 |
|
| E*TRADE Financial total capital | $ | 4,608 |
| | $ | 4,148 |
| | $ | 3,938 |
| $ | 4,429 |
| | $ | 4,874 |
| | $ | 4,608 |
|
| | | | | | | | | | | |
| E*TRADE Financial average assets for leverage capital purposes | $ | 59,835 |
| | $ | 49,113 |
| | $ | 49,240 |
| $ | 64,676 |
| | $ | 62,095 |
| | $ | 59,835 |
|
| Deduct: | | | | | | | | | | |
| Goodwill and other intangible assets, net of deferred tax liabilities | (2,014 | ) | | (2,029 | ) | | (2,043 | ) | (2,450 | ) | | (2,191 | ) | | (2,014 | ) |
| Disallowed deferred tax assets | (584 | ) | | (772 | ) | | (840 | ) | (257 | ) | | (380 | ) | | (584 | ) |
| E*TRADE Financial adjusted average assets for leverage capital purposes | $ | 57,237 |
| | $ | 46,312 |
| | $ | 46,357 |
| $ | 61,969 |
| | $ | 59,524 |
| | $ | 57,237 |
|
| | | | | | | | | | | |
E*TRADE Financial total risk-weighted assets(1) | $ | 10,855 |
| | $ | 9,422 |
| | $ | 9,678 |
| $ | 10,840 |
| | $ | 11,115 |
| | $ | 10,855 |
|
| | | | | | | | | | | |
E*TRADE Financial Tier 1 leverage ratio(2) (Tier 1 capital / Adjusted average assets for leverage capital purposes) | 7.2 | % | | 7.8 | % | | 7.3 | % | |
| E*TRADE Financial Common Equity Tier 1 capital / Total risk-weighted assets | 35.2 | % | | 37.0 | % | | 34.0 | % | |
| E*TRADE Financial Tier 1 leverage ratio (Tier 1 capital / Adjusted average assets for leverage capital purposes) | | 7.1 | % | | 7.4 | % | | 7.2 | % |
E*TRADE Financial Common Equity Tier 1 capital / Total risk-weighted assets(1) | | 34.1 | % | | 33.9 | % | | 35.2 | % |
| E*TRADE Financial Tier 1 capital / Total risk-weighted assets | 37.8 | % | | 38.3 | % | | 35.1 | % | 40.5 | % | | 39.5 | % | | 37.8 | % |
| E*TRADE Financial total capital / Total risk-weighted assets | 42.4 | % | | 44.0 | % | | 40.7 | % | 40.9 | % | | 43.8 | % | | 42.4 | % |
| |
| (1) | Under the regulatory guidelines for risk-based capital, on-balance sheet assets and credit equivalent amounts of derivatives and off-balance sheet items are assigned to one of several broad risk categories according to the obligor or, if relevant, the guarantor or the nature of any collateral. The aggregate dollar amount in each risk category is then multiplied by the risk weight associated with that category. The resulting weighted values from each of the risk categories are aggregated for determining total risk-weighted assets. |
|
| | |
E*TRADE | Q3 2017 10-Q | | 28 |
E*TRADE Q3 2018 10-Q | Page 34
At September 30, 2017,2018, our regulatory capital ratios for E*TRADE Bank were well above the minimum ratios required to be "well capitalized." E*TRADE Bank's current Tier 1 Leverageleverage ratio threshold iswas reduced to 7.0% from 7.5%. We plan to use excess capital at E*TRADE Bank to grow the balance sheet. Accordingly, at current capital thresholds, we do not expect to distribute dividends from E*TRADE Bank to the parent while we fund that growth. in January 2018. E*TRADE Bank's capital ratios are as follows:
|
| | |
E*TRADE | Q3 2017 10-Q | | 29 |
The following table presents the calculation of E*TRADE Bank's capital ratios are calculated as follows (dollars in millions): | | | | September 30, | | December 31, | | September 30, | | | | | | | |
| | 2017 | | 2016 | | 2016 | September 30, 2018 | | December 31, 2017 | | September 30, 2017 |
| E*TRADE Bank shareholder's equity | $ | 3,608 |
| | $ | 3,153 |
| | $ | 3,278 |
| $ | 3,489 |
| | $ | 3,703 |
| | $ | 3,608 |
|
| Add: | | | | | | | | | | |
| (Gains) losses in other comprehensive income on available-for-sale debt securities, net of tax | 50 |
| | 139 |
| | (37 | ) | |
| Losses in other comprehensive income on available-for-sale debt securities, net of tax | | 329 |
| | 26 |
| | 50 |
|
| Deduct: | | | | | | | | | | |
| Goodwill and other intangible assets, net of deferred tax liabilities | (38 | ) | | (38 | ) | | (38 | ) | (290 | ) | | (38 | ) | | (38 | ) |
| Disallowed deferred tax assets | (56 | ) | | (122 | ) | | (134 | ) | (62 | ) | | (71 | ) | | (56 | ) |
| E*TRADE Bank Common Equity Tier 1 capital / Tier 1 capital | 3,564 |
| | 3,132 |
| | 3,069 |
| 3,466 |
| | 3,620 |
| | 3,564 |
|
| Add: | | | | | | | | | | |
| Allowable allowance for loan losses | 94 |
| | 105 |
| | 107 |
| 41 |
| | 74 |
| | 94 |
|
| E*TRADE Bank total capital | $ | 3,658 |
| | $ | 3,237 |
| | $ | 3,176 |
| $ | 3,507 |
| | $ | 3,694 |
| | $ | 3,658 |
|
| | | | | | | | | | | |
| E*TRADE Bank average assets for leverage capital purposes | $ | 46,562 |
| | $ | 35,885 |
| | $ | 36,300 |
| $ | 49,194 |
| | $ | 47,992 |
| | $ | 46,562 |
|
| Deduct: | | | | | | | | | | |
| Goodwill and other intangible assets, net of deferred tax liabilities | (38 | ) | | (38 | ) | | (38 | ) | (290 | ) | | (38 | ) | | (38 | ) |
| Disallowed deferred tax assets | (56 | ) | | (122 | ) | | (134 | ) | (62 | ) | | (71 | ) | | (56 | ) |
| E*TRADE Bank adjusted average assets for leverage capital purposes | $ | 46,468 |
| | $ | 35,725 |
| | $ | 36,128 |
| $ | 48,842 |
| | $ | 47,883 |
| | $ | 46,468 |
|
| | | | | | | | | | | |
E*TRADE Bank total risk-weighted assets(1) | $ | 10,044 |
| | $ | 8,187 |
| | $ | 8,368 |
| $ | 10,027 |
| | $ | 10,147 |
| | $ | 10,044 |
|
| | | | | | | | | | | |
| E*TRADE Bank Tier 1 leverage ratio (Tier 1 capital / Adjusted average assets for leverage capital purposes) | 7.7 | % | | 8.8 | % | | 8.5 | % | 7.1 | % | | 7.6 | % | | 7.7 | % |
| E*TRADE Bank Common Equity Tier 1 capital / Total risk-weighted assets | 35.5 | % | | 38.3 | % | | 36.7 | % | 34.6 | % | | 35.7 | % | | 35.5 | % |
| E*TRADE Bank Tier 1 capital / Total risk-weighted assets | 35.5 | % | | 38.3 | % | | 36.7 | % | 34.6 | % | | 35.7 | % | | 35.5 | % |
| E*TRADE Bank total capital / Total risk-weighted assets | 36.4 | % | | 39.5 | % | | 38.0 | % | 35.0 | % | | 36.4 | % | | 36.4 | % |
| |
| (1) | Under the regulatory guidelines for risk-based capital, on-balance sheet assets and credit equivalent amounts of derivatives and off-balance sheet items are assigned to one of several broad risk categories according to the obligor or, if relevant, the guarantor or the nature of any collateral. The aggregate dollar amount in each risk category is then multiplied by the risk weight associated with that category. The resulting weighted values from each of the risk categories are aggregated for determining total risk-weighted assets. |
E*TRADE Q3 2018 10-Q | Page 35
Broker-Dealer and FCM Capital Requirements
Our broker-dealer and FCM subsidiaries are subject to capital requirements determined by their respective regulators. At September 30, 2017,2018, these subsidiaries met their minimum net capital requirements. We continue to assess our ability to distribute excess net capital to the parent while maintaining adequate capital at the broker-dealer and FCM subsidiaries. E*TRADE Securities paid dividends of $220 million to the parent company during the nine months ended September 30, 2017. For additional information on our broker-dealer and FCM capital requirements, see Note 13—14—Regulatory Requirements.
Off-Balance Sheet Arrangements
We enter into various off-balance sheet arrangements in the ordinary course of business, primarily to meet the needs of our customers and to reduce our own exposure to interest rate risk. These arrangements include firm commitments to extend credit. Additionally, we enter into guarantees and other similar arrangements as part of transactions in the ordinary course of business. For additional information on these arrangements, see Note 14—15—Commitments, Contingencies and Other Regulatory Matters.
|
| | |
E*TRADE | Q3 2017 10-Q | | 30RISK MANAGEMENT |
RISK MANAGEMENT
The identification, mitigation and management of existing and potential risks is critical to effective enterprise risk management. There are certain risks inherent to our industry (e.g. execution of transactions) and certain risks that will surface through the conduct of our business operations. We seek to monitor and manage our significant risk exposures by operating under a set of Board-approved limits and by monitoring certain risk indicators. Our governance framework is designed to comply with applicable requirements and requires regular reporting on metrics and significant risks and exposures to senior management and the Board of Directors.
We face the following key types of risks: credit, interest rate, liquidity, market, operational, information security,technology, data, strategic, reputational, legal, as well as regulatory and compliance. We have a Board-approved Enterprise Risk Appetite Statement (RAS) that is provided to all employees. The RAS specifies significant risk exposures and addresses the Company's tolerance of those risks, which are described in further detail within Part II. Item 7. Management’sManagement's Discussion and Analysis of Financial Condition and Results of Operations of our Annual Report on Form 10-K for the year ended December 31, 2016.2017.
In August 2017, the RAS was updated and approved by the Board to include Data Management Risk—the risk of impairment to or loss of data assets through ineffective governance over the creation, usage, quality, inventory, storage, security and disposal of data assets.
We are also subject to other risks that could impactaffect our business, financial condition, results of operations or cash flows in future periods. SeeFor additional information see Part I. Item 1A. — Risk Factors in our Annual Report on Form 10-K for the year ended December 31, 2016.2017.
|
|
| CONCENTRATIONS OF CREDIT RISK |
Credit risk is the risk of loss arising from the inability or failure of a borrower or counterparty to meet its credit obligations. Our mortgage loan portfolio represents our most significant credit risk exposure. See Part II. Item 7. Management’sManagement's Discussion and Analysis of Financial Condition and Results of Operations of our Annual Report on Form 10-K for the year ended December 31, 20162017 for additional information on our management of credit risk.
One- to Four-Family Interest-Only Loans
One- to four-family loans include loans with a five to ten year interest-only period, followed by an amortizing period ranging from 20 to 25 years. At September 30, 2017, over 99%2018, nearly 100% of thethese loans were amortizing and the portfolio will be fully converted in 2018.amortizing.
E*TRADE Q3 2018 10-Q | Page 36
Home Equity Loans
The home equity loan portfolio consists of home equity installment loans (HEILs) and home equity lines of credit (HELOCs) and is primarily second lien loans on residential real estate properties that have a higher level of credit risk than first lien mortgage loans. HEILs are primarily fixed rate and fixed term, fully amortizing loans that do not offer the option of an interest-only payment. The majority of HELOCs had an interest onlyinterest-only draw period at origination and converted to amortizing loans at the end of the draw period, which typically ranged from five to ten years. At September 30, 2017, 1%2018, nearly 100% of the HELOC portfolio had not converted from the interest-only draw period and will be fully converted in 2019.
|
| | |
E*TRADE | Q3 2017 10-Q | | 31 |
Nonperforming Assets
We classify loans as nonperforming when they are no longer accruing interest, which includes loans that are 90 days and greater past due, TDRs that are on nonaccrual status for all classes of loans (including loans in bankruptcy) and certain junior liens that have a delinquent senior lien. The following table shows comparative data for nonperforming loans and assets at September 30, 2017 and December 31, 2016 (dollars in millions):
|
| | | | | | | |
| | September 30, 2017 | | December 31, 2016 |
| One- to four-family | $ | 196 |
| | $ | 215 |
|
| Home equity | 109 |
| | 136 |
|
| Consumer and other | — |
| | 1 |
|
| Total nonperforming loans receivable | 305 |
| | 352 |
|
| Real estate owned and other repossessed assets, net | 28 |
| | 36 |
|
| Total nonperforming assets, net | $ | 333 |
|
| $ | 388 |
|
Allowance for Loan Losses
The allowance for loan losses is management’s estimate of probable losses inherent in the loan portfolio at the balance sheet date, as well as the forecasted losses, including economic concessions to borrowers, over the estimated remaining life of loans modified as TDRs. The general allowance for loan losses includes a qualitative component to account for a variety of factors that present additional uncertainty that may not be fully considered in the quantitative loss model but are factors we believe may impact the level of credit losses. The following table presents the allowance for loan losses by loan portfolio at September 30, 2017 and December 31, 2016 (dollars in millions):
|
| | | | | | | | | | | | | | | | | | | | | | | | | | | | | | | |
| | One- to Four-Family | | Home Equity | | Consumer and other | | Total |
| | September 30, 2017 | | December 31, 2016 | | September 30, 2017 | | December 31, 2016 | | September 30, 2017 | | December 31, 2016 | | September 30, 2017 | | December 31, 2016 |
| General reserve: | | | | | | | | | | | | | | | |
| Quantitative component | $ | 12 |
| | $ | 34 |
| | $ | 33 |
| | $ | 118 |
| | $ | 3 |
| | $ | 5 |
| | $ | 48 |
| | $ | 157 |
|
| Qualitative component | 3 |
| | 4 |
| | 6 |
| | 2 |
| | 1 |
| | — |
| | 10 |
| | 6 |
|
| Specific valuation allowance | 6 |
| | 7 |
| | 30 |
| | 51 |
| | — |
| | — |
| | 36 |
| | 58 |
|
| Total allowance for loan losses | $ | 21 |
| | $ | 45 |
| | $ | 69 |
| | $ | 171 |
| | $ | 4 |
| | $ | 5 |
| | $ | 94 |
| | $ | 221 |
|
Allowance as a % of loans
receivable(1) | 1.4 | % | | 2.3 | % | | 5.8 | % | | 11.0 | % | | 2.0 | % | | 1.9 | % | | 3.2 | % | | 5.8 | % |
| |
(1) | Allowance as a percentage of loans receivable is calculated based on the gross loans receivable including net unamortized premiums for each respective category. |
Total loans receivable designated as held-for-investment decreased $0.7 billion during the nine months ended September 30, 2017. The allowance for loan losses was $94 million, or 3.2% of total loans receivable, as of September 30, 2017 compared to $221 million, or 5.8% of total loans receivable, as of December 31, 2016. The benefit for loan losses of $142 million for the nine months ended September 30, 2017 reflected approximately $70 million of benefit recognized in the second quarter of 2017 resulting from refined default assumptions based on the sustained outperformance of converted mortgage loans that had been amortizing for 12 months or longer.
|
| | |
E*TRADE | Q3 2017 10-Q | | 32 |
Net recoveries for the nine months ended September 30, 2017 were $15 million compared to $13 million in the same period in 2016. The timing and magnitude of charge-offs and recoveries are affected by many factors and we anticipate variability from quarter to quarter.
For additional information on the loans portfolio and management's estimate of the allowance for loan losses, see Note 6—Loans Receivable, Net and Summary of Critical Accounting Policies and Estimates.period.
Securities
We focus primarily on security type and credit rating to monitor credit risk in our securities portfolios. We consider securities backed by the U.S.US government or its agencies to have low credit risk as the long-term debt rating of the U.S.US government is AA+ by S&P and AAAAaa by Moody’s and Fitch at September 30, 2017.2018. The amortized cost of these securities accounted for over 99% of our total securities portfolio at September 30, 2017.2018. We review the remaining debt securities that were not backed by the U.S.US government or its agencies according to their credit ratings from S&P Moody’s and FitchMoody’s where available. At September 30, 2017,2018, all municipal bonds in our securities portfolio were rated investment grade (defined as a rating equivalent to a Moody’s rating of "Baa3" or higher, or an S&P or Fitch rating of "BBB-"“BBB-“ or higher).
|
| | |
E*TRADE | Q3 2017 10-Q | | 33 |
SUMMARY OF CRITICAL ACCOUNTING POLICIES AND ESTIMATES
The discussion and analysis of our financial condition and results of operations are based on our consolidated financial statements, which have been prepared in conformity with GAAP.accounting principles generally accepted in the United States of America (GAAP). Note 1—Organization, Basis of Presentation and Summary of Significant Accounting Policies in Part II. Item 8.8. Financial Statements and Supplementary Data in the Company's Annual Report on Form 10-K for the year ended December 31, 2016,2017, contains a summary of our significant accounting policies, many of which require the use of estimates and assumptions that affect the amounts reported in the consolidated financial statements and related notes for the periods presented. We believe that, of our significant accounting policies, the following are critical because they are based on estimates and assumptions that require complex and subjective judgments by management: allowance for loan losses;losses, valuation and impairment of goodwill and acquired intangible assets;assets and estimates of effective tax rates, deferred taxes and valuation allowance. Changes in these estimates or assumptions could materially impact our financial condition and results of operations, and actual results could differ from our estimates. With respect to the allowance for loan losses, we refined our default assumptions during the second quarter of 2017 based on the sustained outperformance of loans that reached the end of their interest-only period. Our remaining critical accounting policies are more fully described in Part II. Item 7. Management's Discussion and Analysis of Financial Condition and Results of Operations—Operations—Summary of Critical Accounting Policies and Estimates in our Annual Report on Form 10-K for the year ended December 31, 2016.2017.
Allowance for Loan Losses
Description
The allowance for loan losses is management’s estimate of probable losses inherent in the loan portfolio as of the balance sheet date. In determining the adequacy of the allowance, we perform ongoing evaluations of the loan portfolio and loss forecasting assumptions. As of September 30, 2017, the allowance for loan losses was $94 million on $2.9 billion of total gross loans receivable designated as held-for-investment.
Judgments
Determining the adequacy of the allowance is complex and requires judgment by management about the effect of matters that are inherently uncertain. Subsequent evaluations of the loan portfolio, in light of the factors then prevailing, may result in significant changes in the allowance for loan losses in future periods. For loans that are not TDRs, we establish a general allowance and evaluate the adequacy of the allowance for loan losses by loan portfolio segment: one- to four-family, home equity and consumer. For modified loans accounted for as TDRs that are valued using the discounted cash flow model, we establish a specific allowance by forecasting losses, including economic concessions to borrowers, over the estimated remaining life of these loans.
|
| | |
E*TRADE | Q3 2017 10-Q | | 34 |
E*TRADE Q3 2018 10-Q | Page 37
The estimate of the allowance for loan losses continues to be based on a variety of quantitative and qualitative factors, including:
The composition and quality of the portfolio
Delinquency levels and trends
Current and historical charge-off and loss experience
Our historical loss mitigation experience
The condition of the real estate market and geographic concentrations within the loan portfolio
The interest rate climate
The overall availability of housing credit
General economic conditions, including the impact of weather-related events
Total loans receivable designated as held-for-investment decreased $0.7 billion during the nine months ended September 30, 2017. The allowance for loan losses was $94 million, or 3.2% of total loans receivable, as of September 30, 2017 compared to $221 million, or 5.8% of total loans receivable, as of December 31, 2016. The benefit for loan losses was $29 million and $142 million for the three and nine months ended September 30, 2017, respectively.
The allowance for loan losses is typically equal to management’s forecast of loan losses in the 18 months following the balance sheet date as well as the forecasted losses, including economic concessions to borrowers, over the estimated remaining life of loans modified as TDRs. The quantitative allowance methodology also includes the identification of higher risk mortgage loans and the period of loan losses captured within the general allowance includes the total probable loss over the remaining life of these loans. As mortgage loan conversions from interest-only to amortizing have continued, 99% of HELOCs and over 99% of one- to four-family mortgages had converted at September 30, 2017.
During the second quarter of 2017, management refined the default assumptions in the quantitative allowance methodology based on the sustained outperformance of converted mortgage loans that had been amortizing for 12 months or longer. At the time of this refinement, more than 50% of these converted loans had been amortizing 12 months or longer. This actual performance data was better than our prior performance assumptions, and combined with the substantial performance history, the uncertainty with respect to the population of converting loans had significantly decreased as of June 30, 2017. This refinement resulted in approximately $70 million of benefit for loan losses during the second quarter of 2017. In order to refine our default assumptions around the remaining population that had not yet started amortizing or that had not reached 12 months post conversion, we evaluated whether the credit quality and performance of these loans was consistent with the seasoned amortizing portfolio. We determined that FICO scores, LTV/CLTVs and delinquency rates were comparable to the seasoned portfolio, and therefore applied the refined default assumptions to this remaining population.
The general allowance for loan losses also included a qualitative component to account for a variety of factors that present additional uncertainty that may not be fully considered in the quantitative loss model but are factors we believe may impact the level of credit losses. We utilize a qualitative factor framework whereby, on a quarterly basis, management assesses the risk associated with three primary sets of factors: external factors, internal factors, and portfolio specific factors. The uncertainty related to these factors may expand over time, temporarily increasing the qualitative component in advance of the more precise identification of these probable losses being captured within the quantitative component of the general allowance. The total qualitative component was $10 million and $6 million as of September 30, 2017 and December 31, 2016, respectively.
|
| | |
E*TRADE | Q3 2017 10-Q | | 35 |
Effects if Actual Results Differ
It is difficult to estimate how potential changes in the quantitative and qualitative factors, including the impact of loans converting from interest only to amortizing, might impact the allowance for loan losses. Our underlying assumptions and judgments could prove to be inaccurate, which could materially impact our regulatory capital position and results of operations in future periods.
During the normal course of conducting examinations, our banking regulators, the OCC and Federal Reserve, continue to review our business and practices. This process is dynamic and ongoing and we cannot be certain that additional changes or actions will not result from their continuing review.
ITEM 3. QUANTITATIVE AND QUALITATIVE DISCLOSURES ABOUT MARKET RISK
The following discussion about market risk includes forward-looking statements. Actual results could differ materially from those projected in the forward-looking statements as a result of certain factors, including, but not limited to, those set forth in Part I. Forward Looking Statements in this Quarterly Report and Part I. Item 1A. Risk Factors in the Annual Report on Form 10-K for the year ended December 31, 2016.2017.
Interest Rate Risk
Our exposure to interest rate risk is related primarily to interest-earning assets and interest-bearing liabilities. Managing interest rate risk is essential to profitability. The primary objective of the management of interest rate risk is to control exposure to interest rates within the Board-approved limits and with limited exposure to earnings volatility resulting from interest rate fluctuations. Our general strategies to manage interest rate risk include balancing variable-rate and fixed-rate assets and liabilities and utilizing derivatives to help manage exposures to changes in interest rates. Exposure to interest rate risk requires management to make complex assumptions regarding maturities, market interest rates and customer behavior. Changes in interest rates, including the following, could impact interest income and expense:
Interest-earning assets and interest-bearing liabilities may re-price at different times or by different amounts, creating a mismatch.
The yield curve may steepen, flatten or otherwise change shape, which could affect the spread between short- and long-term rates. Widening or narrowing spreads could impact net interest income.
Market interest rates may influence prepayments, resulting in maturity mismatches. In addition, prepayments could impact yields as premiums and discounts amortize.
Exposure to interest rate risk is dependent upon the distribution and composition of interest-earning assets, interest-bearing liabilities and derivatives. The differing risk characteristics of each product are managed to mitigate our exposure to interest rate fluctuations. At September 30, 2017, 93%2018, 94% of our total assets were interest-earning assets and we had no securities classified as trading.
At September 30, 2017, approximately 67%2018, 66% of total assets were available-for-sale and held-to-maturity mortgage-backed securities and residential real estate loans. The values of these assets are sensitive to changes in interest rates as well as expected prepayment levels. As interest rates increase, fixed-rate residential mortgages and mortgage-backed securities tend to exhibit lower prepayments. The inverse is true in a falling rate environment.
When real estate loans or mortgage-backed securities are prepaid, unamortized premiums and/or discounts are recognized immediately in interest income. Depending on the timing of the prepayment, these adjustments to income would impact anticipated yields. The Company reviews estimates of the impact of changing market rates on prepayments. This information is incorporated into our interest rate risk management strategy.
|
| | |
E*TRADE | Q3 2017 10-Q | | 36 |
Our liability structure consists of two central sources of funding: deposits and customer payables, both of which re-price at management’s discretion. We may utilize securities lending and wholesale funding sources as needed for short-term liquidity and contingency funding requirements.
Derivative Instruments
We use derivative instruments to help manage interest rate risk using designated hedge relationships. Interest rate swaps involve the exchange of fixed-rate and variable-rate interest payments between two parties based on a contractual underlying notional amount, but do not involve the exchange of the
E*TRADE Q3 2018 10-Q | Page 38
underlying notional amounts. See Note 7—8—Derivative Instruments and Hedging Activities for additional information about our use of derivative contracts.
Scenario Analysis
Scenario analysis is an advanced approach to estimating interest rate risk exposure. The Company monitors interest rate risk using the Economic Value of Equity (EVE) approach and the Earnings-at-Risk (EAR) approach.
Under the EVE approach, the present value of expected cash flows of all existing interest-earning assets, interest-bearing liabilities, derivatives and forward commitments are estimated and combined to produce an EVE figure. The change in EVE is a long-term sensitivity measure of interest rate risk. The approach values only the current balance sheet in which the most significant assumptions are the prepayment rates of the loan portfolio and mortgage-backed securities and the repricing of deposits. This approach does not incorporate assumptions related to business growth, or liquidation and re-investment of instruments. This approach provides an indicator of future earnings and capital levels because changes in EVE indicate the anticipated change in the value of future cash flows. The sensitivity of this value to changes in interest rates is then determined by applying alternative interest rate scenarios. The change in EVE amounts fluctuate based on instantaneous parallel shifts in interest rates primarily due to the change in timing of cash flows, which considers prepayment estimates, in the Company’s residential loan and mortgage-backed securities portfolios.
EAR is a short-term sensitivity measure of interest rate risk and illustrates the impact of alternative interest rate scenarios on net interest income, including corporate interest expense, over a twelve month time frame. In measuring the sensitivity of net interest income to changes in interest rates, we assume instantaneous parallel interest rate shocks applied to the forward curve. In addition, we assume that cash flows from loan payoffs are reinvested in mortgage-backed securities, we exclude revenue from off-balance sheet customer cash and we assume no balance sheet growth.
The following table presents the sensitivity of EAREVE and EVEEAR at the consolidated E*TRADE Financial level at September 30, 2017 and December 31, 2016 is as follows (dollars in millions): | | Instantaneous Parallel Change in Interest Rates (basis points) (1) | | Economic Value of Equity | | Earnings-at-Risk | | Economic Value of Equity | | Earnings-at-Risk |
| | September 30, 2017 | | December 31, 2016 | | September 30, 2017 | | December 31, 2016 | | September 30, 2018 | | December 31, 2017 | | September 30, 2018 | | December 31, 2017 |
| | Amount | | Percentage | | Amount | | Percentage | | Amount | | Percentage | | Amount | | Percentage | | Amount | | Percentage | | Amount | | Percentage | | Amount | | Percentage | | Amount | | Percentage |
| +200 | | $ | (205 | ) | | (2.6 | )% | | $ | (129 | ) | | (2.1 | )% | | $ | 207 |
| | 13.4 | % | | $ | 169 |
| | 13.9 | % | | $ | (309 | ) | | (3.6 | )% | | $ | (172 | ) | | (2.1 | )% | | $ | 195 |
| | 9.8 | % | | $ | 197 |
| | 11.5 | % |
| +100 | | $ | 95 |
| | 1.2 | % | | $ | 59 |
| | 0.9 | % | | $ | 142 |
| | 9.2 | % | | $ | 109 |
| | 9.0 | % | | $ | (88 | ) | | (1.0 | )% | | $ | (23 | ) | | (0.3 | )% | | $ | 101 |
| | 5.1 | % | | $ | 113 |
| | 6.6 | % |
| +50 | | | $ | (19 | ) | | (0.2 | )% | | $ | 94 |
| | 1.1 | % | | $ | 52 |
| | 2.6 | % | | $ | 79 |
| | 4.7 | % |
| -50 | | $ | (203 | ) | | (2.6 | )% | | $ | (106 | ) | | (1.7 | )% | | $ | (96 | ) | | (6.2 | )% | | $ | (73 | ) | | (6.0 | )% | | $ | (64 | ) | | (0.8 | )% | | $ | (225 | ) | | (2.7 | )% | | $ | (61 | ) | | (3.1 | )% | | $ | (102 | ) | | (6.0 | )% |
| |
| (1) | These scenario analyses assume a balance sheet size as of the dates indicated. Any changes in size would cause the amounts to vary. |
We actively manage interest rate risk positions. As interest rates change, we will adjust our strategy and mix of assets, liabilities and derivatives to optimize our position. For example, a 100 basis points increase in rates may not result in a change in value as indicated above. We compare the instantaneous parallel shift in interest rate changes in EVE and EAR to the established limits set by the Board of Directors in order to
|
| | |
E*TRADE | Q3 2017 10-Q | | 37 |
assess interest rate risk. In the event that the percentage change in EVE or EAR exceeds the Board limits, our Chief Executive Officer, Chief Risk Officer, Chief Financial Officer and Treasurer must all be promptly notified in writing and decide upon a plan of remediation. In addition, the Board of Directors must be notified of the exception and the planned resolution. At September 30, 2017,2018, the EVE and EAR percentage changes were within our Board limits.
|
| | |
E*TRADE | Q3 2017 10-Q | | 38 |
E*TRADE Q3 2018 10-Q | Page 39
KEY TERMS
Active customers—Customers that have an account with a balance of $25 or more or a trade in the last six months.
Active trader—Customers that execute 30 or more trades per quarter.
Agency—U.S.US Government sponsored enterprises and federal agencies, such as Federal National Mortgage Association, Federal Home Loan Mortgage Corporation, Government National Mortgage Association, the Small Business Administration, the Export-Import Bank, Federal Home Loan Bank and the Federal Home LoanFarm Credit Bank.
Average commission per trade—Total commissions revenue divided by total number of revenue trades.
Bank—ETB Holdings, Inc. (ETBH), the entity that is our bank holding company and parent to E*TRADE Bank.
Basel III—Global regulatory standards for bank capital adequacy and liquidity as issued by the international Basel Committee on Banking Supervision.
Basis point—One one-hundredth of a percentage point.
Brokerage account attrition rate—The brokerage account attrition rate is calculated by dividing attriting brokerage accounts by total brokerage accounts from the previous period end, and is presented on an annualized basis. Attriting brokerage accounts are derived by subtracting net new brokerage accounts from gross new brokerage accounts.
Brokerage related cash—Customer sweep deposits held at banking subsidiaries, customer payables and customer cash held by third parties.
BPO—Broker price opinion.
CFTC—Commodity Futures Trading Commission.
Charge-off—The result of removing a loan or portion of a loan from an entity’s balance sheet because the loan is considered to be uncollectible.
CRA—Community Reinvestment Act.
CLTV—Combined loan-to-value ratio.
Common Equity Tier 1 Capital—A measurement of the Company's core equity capital used in the calculation of capital adequacy ratios. Common Equity Tier 1 Capital equals: total shareholders' equity, less preferred stock and related surplus, plus/(less) unrealized losses (gains) on certain available-for-sale securities, less goodwill and certain other intangible assets, less certain disallowed deferred tax assets and subject to certain other applicable adjustments.
Consolidated financial statements—Refers to the consolidated financial statements prepared in accordance with GAAP as included in the Company's annual reportAnnual Report on Form 10-K, and the condensed consolidated financial statements included in the Company's interim reportsQuarterly Reports on Form 10-Q.
Corporate cash—Cash held at the parent company as well as cash held in certain subsidiaries that can distribute cash to the parent company without any regulatory approval or notification.
Customer assets—Market value of all customer assets held by the Company including security holdings, sweep and other deposits, customer cash held by third parties, customer payables and vested unexercised stock plan holdings.
Daily average revenue trades (DARTs)—Total revenue trades in a period divided by the number of trading days during that period.
Derivative—A financial instrument or other contract which includes one or more underlying securities, notional amounts, or payment provisions. The contract generally requires no initial net investment and is settled on a net basis.
|
| | |
E*TRADE | Q3 2017 10-Q | | 39 |
Derivative DARTs—Options and futures revenue trades in a period divided by the number of trading days during that period.
E*TRADE Q3 2018 10-Q | Page 40
DOL—US Department of Labor.
Earnings at Risk (EAR)—The sensitivity of GAAP net interest income to changes in interest rates over a twelve month horizon. It is a short-term measurement of interest rate risk and does not consider risks beyond the simulation time horizon. In addition, it requires reinvestment, funding, and hedging assumptions for the horizon.
Economic Value of Equity (EVE)—The sensitivity of the value of existing assets and liabilities, including derivatives and forward commitments, to changes in interest rates. It is a long-term measurement of interest rate risk and requires assumptions that include prepayment rates on the loan portfolio and mortgage-backed securities and the repricing of deposits.
ESDA—Extended insurance sweep deposit accounts.
Fair value—The price that would be received to sell an asset or paid to transfer a liability in an orderly transaction between market participants at the measurement date.
Fair value hedge—A derivative instrument designated in a hedging relationship that mitigates exposure to changes in the fair value of a recognized asset or liability or a firm commitment.
FASB—Financial Accounting Standards Board.
FCM—Futures Commission Merchant.
FDIC—Federal Deposit Insurance Corporation.
Federal Reserve—Federal Reserve System, including the Federal Reserve Board of Governors of the Federal Reserve System and the twelve regional Federal Reserve Banks.
FHLB—Federal Home Loan Bank.
FICO—Fair Isaac Credit Organization.
Fiduciary Rule—DOL’s final Conflicts of Interest Rule- Retirement Investment Advice regulations under the Employee Retirement Income Security Act of 1974 and the Internal Revenue Code of 1986.
FINRA—Financial Industry Regulatory Authority.
FCM—Futures Commission Merchant.
Generally Accepted Accounting Principles (GAAP)—Accounting principles generally accepted in the United States of America.
Gross loans receivable—Includes unpaid principal balances and premiums (discounts).
HEIL—Home equity installment loan.
HELOC—Home equity lines of credit.
HQLA—High-quality liquid assets.
Interest-bearing liabilities—Liabilities such as deposits, customer payables, other borrowings, corporate debt and certain customer credit balances and securities lending balances on which the Company pays interest; excludes customer balances held by third parties.
Interest-earning assets—Assets such as available-for-sale securities, held-to-maturity securities, margin receivables, loans, securities borrowed balances and cash and investments required to be segregated under regulatory guidelines that earn interest for the Company.
E*TRADE Q3 2018 10-Q | Page 41
Interest rate swaps—Contracts that are entered into primarily as an asset/liability management strategy to reduce interest rate risk. Interest rate swap contracts are exchanges of interest rate payments, such as fixed-rate payments for floating-rate payments, based on notional amounts.
|
| | |
E*TRADE | Q3 2017 10-Q | | 40 |
LCR—Liquidity coverage ratio. The purpose of the LCR is to require banking organizations to hold minimum amounts of HQLA based on a percentage of their net cash outflows over a 30-day period.
LIBOR—London Interbank Offered Rate. LIBOR is the interest rate at which banks borrow funds from other banks in the London wholesale money market (or interbank market).
LLC—Limited liability company.
LTV—Loan-to-value ratio.
Managed Portfolios—Consist of the following professionally managed portfolios: Core Portfolio, Blend Portfolio, Dedicated Portfolio and Fixed Income Portfolio.
NASDAQ—National Association of Securities Dealers Automated Quotations.
Net interest income—A measure of interest revenue, net interest income is equal to interest income less interest expense.
NFA—National Futures Association.
Net interest margin—A measure of the net yield on our average interest-earning assets. Net interest margin is calculated for a given period by dividing the annualized sum of net interest income by average interest-earning assets.
Net new brokerage assets—The total inflows to all new and existing brokerage customer accounts less total outflows from all closed and existing brokerage customer accounts, excluding the effects of market movements in the value of brokerage customer assets.
NFA—National Futures Association.
Nonperforming assets—Assets originally acquired to earn income (nonperforming loans) and those not intended to earn income (real estate owned). Loans are classified as nonperforming when they are no longer accruing interest, which includes loans that are 90 days and greater past due, TDRs that are on nonaccrual status for all classes of loans (including loans in bankruptcy) and certain junior liens that have a delinquent senior lien.
Notional amount—The specified dollar amount underlying a derivative on which the calculated payments are based.
OCC—Office of the Comptroller of the Currency.
Options—Contracts that grant the purchaser, for a premium payment, the right, but not the obligation, to either purchase or sell the associated financial instrument at a set price during a period or at a specified date in the future.
RAS—Risk Appetite Statement.
Real estate owned and other repossessed assets—Ownership or physical possession of real property by the Company, generally acquired as a result of foreclosure or repossession.
Recovery—Represents cash proceeds received on a loan that had been previously charged off.
Repurchase agreement—An agreement giving the transferor of an asset the right or obligation to repurchase the same or similar securities at a specified price on a given date from the transferee. These agreements are generally collateralized by mortgage-backed or investment-grade securities. From the transferee's perspective the arrangement is referred to as a reverse repurchase agreement.
RIA—Registered Investment Advisor.
E*TRADE Q3 2018 10-Q | Page 42
Risk-weighted assets—Primarily computed by the assignment of specific risk-weightings to assets and off-balance sheet instruments for capital adequacy calculations.
RSDA—Retirement sweep deposit account.
S&P—Standard & Poor’s.
SEC—U.S.US Securities and Exchange Commission.
|
| | |
E*TRADE | Q3 2017 10-Q | | 41 |
Sweep deposit accounts—Accounts with the functionality to transfer customer cash balances to and from an FDIC insured account.
TCA—Trust Company of America, Inc.
Tier 1 capital—Adjusted equity capital used in the calculation of capital adequacy ratios. Tier 1 capital equals: Common Equity Tier 1 capital plus qualifying preferred stock and related surplus, subject to certain other applicable adjustments.
Troubled Debt Restructuring (TDR)—A loan modification that involves granting an economic concession to a borrower who is experiencing financial difficulty, and loans that have been charged-off due to bankruptcy notification.
TRUPs—Trust preferred securities.
VIE—Variable interest entity.
Wholesale borrowings—Borrowings that consist of repurchase agreements and FHLB advances.
|
| | |
E*TRADE | Q3 2017 10-Q | | 42 |
E*TRADE Q3 2018 10-Q | Page 43
PART I - FINANCIAL INFORMATION
ITEM 1. CONDENSED CONSOLIDATED FINANCIAL STATEMENTS (UNAUDITED)
|
| | |
E*TRADE | Q3 2017 10-Q | | 43 |
E*TRADE Q3 2018 10-Q | Page 44
E*TRADE FINANCIAL CORPORATION AND SUBSIDIARIES
CONDENSED CONSOLIDATED STATEMENT OF INCOME
(In millions, except share data and per share amounts)
(Unaudited)
| | | | Three Months Ended September 30, | | Nine Months Ended September 30, | Three Months Ended September 30, | | Nine Months Ended September 30, |
| | 2017 | | 2016 | | 2017 | | 2016 | 2018 | | 2017 | | 2018 | | 2017 |
| Revenue: | | | | | | | | | | | | | | |
| Interest income | $ | 413 |
| | $ | 309 |
| | $ | 1,132 |
| | $ | 923 |
| $ | 514 |
| | $ | 413 |
| | $ | 1,471 |
| | $ | 1,132 |
|
| Interest expense | (22 | ) | | (22 | ) | | (66 | ) | | (63 | ) | (48 | ) | | (22 | ) | | (107 | ) | | (66 | ) |
| Net interest income | 391 |
| | 287 |
| | 1,066 |
| | 860 |
| 466 |
| | 391 |
| | 1,364 |
| | 1,066 |
|
| Commissions | 100 |
| | 107 |
| | 332 |
| | 320 |
| 117 |
| | 100 |
| | 375 |
| | 332 |
|
| Fees and service charges | 92 |
| | 68 |
| | 276 |
| | 188 |
| 108 |
| | 92 |
| | 323 |
| | 276 |
|
| Gains on securities and other, net | 6 |
| | 14 |
| | 23 |
| | 34 |
| 17 |
| | 6 |
| | 42 |
| | 23 |
|
| Other revenue | 10 |
| | 10 |
| | 32 |
| | 30 |
| 12 |
| | 10 |
| | 34 |
| | 32 |
|
| Total non-interest income | 208 |
| | 199 |
| | 663 |
| | 572 |
| 254 |
| | 208 |
| | 774 |
| | 663 |
|
| Total net revenue | 599 |
| | 486 |
| | 1,729 |
| | 1,432 |
| 720 |
| | 599 |
| | 2,138 |
| | 1,729 |
|
| Provision (benefit) for loan losses | (29 | ) | | (62 | ) | | (142 | ) | | (131 | ) | (34 | ) | | (29 | ) | | (74 | ) | | (142 | ) |
| Non-interest expense: | | | | | | | | | | | | | | |
| Compensation and benefits | 139 |
| | 123 |
| | 408 |
| | 374 |
| 157 |
| | 139 |
| | 469 |
| | 408 |
|
| Advertising and market development | 38 |
| | 27 |
| | 123 |
| | 100 |
| 45 |
| | 38 |
| | 152 |
| | 123 |
|
| Clearing and servicing | 29 |
| | 26 |
| | 94 |
| | 75 |
| 28 |
| | 29 |
| | 94 |
| | 94 |
|
| Professional services | 25 |
| | 26 |
| | 71 |
| | 70 |
| 23 |
| | 25 |
| | 70 |
| | 71 |
|
| Occupancy and equipment | 28 |
| | 24 |
| | 84 |
| | 71 |
| 29 |
| | 28 |
| | 89 |
| | 84 |
|
| Communications | 29 |
| | 22 |
| | 90 |
| | 65 |
| 30 |
| | 29 |
| | 89 |
| | 90 |
|
| Depreciation and amortization | 20 |
| | 20 |
| | 60 |
| | 60 |
| 25 |
| | 20 |
| | 70 |
| | 60 |
|
| FDIC insurance premiums | 8 |
| | 6 |
| | 24 |
| | 18 |
| 8 |
| | 8 |
| | 26 |
| | 24 |
|
| Amortization of other intangibles | 9 |
| | 5 |
| | 27 |
| | 15 |
| 12 |
| | 9 |
| | 34 |
| | 27 |
|
| Restructuring and acquisition-related activities | 4 |
| | 25 |
| | 12 |
| | 28 |
| 4 |
| | 4 |
| | 6 |
| | 12 |
|
| Losses on early extinguishment of debt | 58 |
| | — |
| | 58 |
| | — |
| 4 |
| | 58 |
| | 4 |
| | 58 |
|
| Other non-interest expenses | 18 |
| | 19 |
| | 55 |
| | 54 |
| 15 |
| | 18 |
| | 56 |
| | 55 |
|
| Total non-interest expense | 405 |
| | 323 |
| | 1,106 |
| | 930 |
| 380 |
| | 405 |
| | 1,159 |
| | 1,106 |
|
| Income before income tax expense | 223 |
| | 225 |
| | 765 |
| | 633 |
| 374 |
| | 223 |
| | 1,053 |
| | 765 |
|
| Income tax expense | 76 |
| | 86 |
| | 280 |
| | 208 |
| 89 |
| | 76 |
| | 271 |
| | 280 |
|
| Net income | $ | 147 |
| | $ | 139 |
| | $ | 485 |
| | $ | 425 |
| $ | 285 |
| | $ | 147 |
| | $ | 782 |
| | $ | 485 |
|
| Preferred stock dividends | 12 |
| | — |
| | 25 |
| | — |
| 24 |
| | 12 |
| | 36 |
| | 25 |
|
| Net income available to common shareholders | $ | 135 |
| | $ | 139 |
| | $ | 460 |
| | $ | 425 |
| $ | 261 |
| | $ | 135 |
| | $ | 746 |
| | $ | 460 |
|
| Basic earnings per common share | $ | 0.49 |
| | $ | 0.51 |
| | $ | 1.67 |
| | $ | 1.53 |
| $ | 1.01 |
| | $ | 0.49 |
| | $ | 2.84 |
| | $ | 1.67 |
|
| Diluted earnings per common share | $ | 0.49 |
| | $ | 0.51 |
| | $ | 1.67 |
| | $ | 1.52 |
| $ | 1.00 |
| | $ | 0.49 |
| | $ | 2.82 |
| | $ | 1.67 |
|
| Shares used in computation of per common share data: | | | | | | | | | | | | | | |
| Basic (in thousands) | 273,441 |
| | 274,362 |
| | 274,565 |
| | 278,864 |
| 259,498 |
| | 273,441 |
| | 263,292 |
| | 274,565 |
|
| Diluted (in thousands) | 274,594 |
| | 275,472 |
| | 275,703 |
| | 280,136 |
| 260,661 |
| | 274,594 |
| | 264,433 |
| | 275,703 |
|
See accompanying notes to the condensed consolidated financial statements
|
| | |
E*TRADE | Q3 2017 10-Q | | 44 |
E*TRADE Q3 2018 10-Q | Page 45
E*TRADE FINANCIAL CORPORATION AND SUBSIDIARIES
CONDENSED CONSOLIDATED STATEMENT OF COMPREHENSIVE INCOME
(In millions)
(Unaudited)
| | | | Three Months Ended September 30, | | Nine Months Ended September 30, | Three Months Ended September 30, | | Nine Months Ended September 30, |
| | 2017 | | 2016 | | 2017 | | 2016 | 2018 | | 2017 | | 2018 | | 2017 |
| Net income | $ | 147 |
| | $ | 139 |
| | $ | 485 |
| | $ | 425 |
| $ | 285 |
| | $ | 147 |
| | $ | 782 |
| | $ | 485 |
|
| Other comprehensive income, net of tax | | | | | | | | | | | | | | |
| Available-for-sale securities: | | | | | | | | | | | | | | |
| Unrealized gains, net | 16 |
| | 3 |
| | 104 |
| | 166 |
| |
| Unrealized gains (losses), net | | (86 | ) | | 16 |
| | (265 | ) | | 104 |
|
| Reclassification into earnings, net | (4 | ) | | (10 | ) | | (15 | ) | | (28 | ) | (8 | ) | | (4 | ) | | (23 | ) | | (15 | ) |
Transfer of held-to-maturity securities to available-for-sale securities(1) | | — |
| | — |
| | 6 |
| | — |
|
| Net change from available-for-sale securities | 12 |
| | (7 | ) | | 89 |
| | 138 |
| (94 | ) | | 12 |
| | (282 | ) | | 89 |
|
| Reclassification of foreign currency translation gains | — |
| | — |
| | (2 | ) | | — |
| — |
| | — |
| | — |
| | (2 | ) |
| Other comprehensive income | 12 |
| | (7 | ) | | 87 |
| | 138 |
| |
| Other comprehensive income (loss) | | (94 | ) | | 12 |
| | (282 | ) | | 87 |
|
| Comprehensive income | $ | 159 |
| | $ | 132 |
| | $ | 572 |
| | $ | 563 |
| $ | 191 |
| | $ | 159 |
| | $ | 500 |
| | $ | 572 |
|
| |
| (1) | During the three months ended March 31, 2018, securities with a carrying value of $4.7 billion and related unrealized pre-tax gain of $7 million, or $6 million net of tax, were transferred from held-to-maturity securities to available-for-sale securities as part of a one-time transition election for early adopting the new derivatives and hedge accounting guidance. See Note 1—Organization, Basis of Presentation and Summary of Significant Accounting Policies for additional information. |
See accompanying notes to the condensed consolidated financial statements
|
| | |
E*TRADE | Q3 2017 10-Q | | 45 |
E*TRADE Q3 2018 10-Q | Page 46
E*TRADE FINANCIAL CORPORATION AND SUBSIDIARIES
CONDENSED CONSOLIDATED BALANCE SHEET
(In millions, except share data)
(Unaudited)
| | | | September 30, | | December 31, | September 30, | | December 31, |
| | 2017 | | 2016 | 2018 | | 2017 |
| ASSETS | | | | | | |
| Cash and equivalents | $ | 896 |
| | $ | 1,950 |
| $ | 596 |
| | $ | 931 |
|
| Cash required to be segregated under federal or other regulations | 696 |
| | 1,460 |
| 856 |
| | 872 |
|
| Available-for-sale securities | 19,173 |
| | 13,892 |
| 22,864 |
| | 20,679 |
|
| Held-to-maturity securities (fair value of $22,963 and $15,716 at September 30, 2017 and December 31, 2016, respectively) | 22,920 |
| | 15,751 |
| |
| Held-to-maturity securities (fair value of $21,321 and $23,719 at September 30, 2018 and December 31, 2017, respectively) | | 22,026 |
| | 23,839 |
|
| Margin receivables | 8,535 |
| | 6,731 |
| 11,184 |
| | 9,071 |
|
| Loans receivable, net (net of allowance for loan losses of $94 million and $221 million at September 30, 2017 and December 31, 2016, respectively) | 2,838 |
| | 3,551 |
| |
| Loans receivable, net (net of allowance for loan losses of $41 and $74 at September 30, 2018 and December 31, 2017, respectively) | | 2,251 |
| | 2,654 |
|
| Receivables from brokers, dealers and clearing organizations | 1,108 |
| | 1,056 |
| 786 |
| | 1,178 |
|
| Property and equipment, net | 250 |
| | 239 |
| 261 |
| | 253 |
|
| Goodwill | 2,370 |
| | 2,370 |
| 2,485 |
| | 2,370 |
|
| Other intangibles, net | 294 |
| | 320 |
| 391 |
| | 284 |
|
| Deferred tax assets, net | 416 |
| | 756 |
| |
| Other assets | 879 |
| | 923 |
| 1,006 |
| | 1,234 |
|
| Total assets | $ | 60,375 |
| | $ | 48,999 |
| $ | 64,706 |
| | $ | 63,365 |
|
| LIABILITIES AND SHAREHOLDERS’ EQUITY | | | | | | |
| Liabilities: | | | | | | |
| Deposits | $ | 41,543 |
| | $ | 31,682 |
| $ | 43,074 |
| | $ | 42,742 |
|
| Customer payables | 8,716 |
| | 8,159 |
| 10,534 |
| | 9,449 |
|
| Payables to brokers, dealers and clearing organizations | 1,392 |
| | 983 |
| 1,845 |
| | 1,542 |
|
| Other borrowings | 609 |
| | 409 |
| 550 |
| | 910 |
|
| Corporate debt | 991 |
| | 994 |
| 1,408 |
| | 991 |
|
| Other liabilities | 476 |
| | 500 |
| 529 |
| | 800 |
|
| Total liabilities | 53,727 |
| | 42,727 |
| 57,940 |
| | 56,434 |
|
| Commitments and contingencies (see Note 14) |
|
| |
|
| |
| Commitments and contingencies (see Note 15) | |
|
| |
|
|
| Shareholders’ equity: | | | | | | |
| Preferred stock, $0.01 par value, $1,000 liquidation preference, shares authorized: 1,000,000 at September 30, 2017 and December 31, 2016; shares issued and outstanding: 400,000 at both September 30, 2017 and December 31, 2016 | 394 |
| | 394 |
| |
| Common stock, $0.01 par value, shares authorized: 400,000,000 at September 30, 2017 and December 31, 2016; shares issued and outstanding: 270,688,918 and 273,963,415 at September 30, 2017 and December 31, 2016, respectively | 3 |
| | 3 |
| |
| Preferred stock, $0.01 par value, 1,000,000 shares authorized, 403,000 shares issued and outstanding at both September 30, 2018 and December 31, 2017; aggregate liquidation preference of $700 at both September 30, 2018 and December 31, 2017 | | 689 |
| | 689 |
|
| Common stock, $0.01 par value, 400,000,000 shares authorized, 256,765,011 and 266,827,881 shares issued and outstanding at September 30, 2018 and December 31, 2017, respectively | | 3 |
| | 3 |
|
| Additional paid-in-capital | 6,747 |
| | 6,921 |
| 5,953 |
| | 6,582 |
|
| Accumulated deficit | (446 | ) | | (909 | ) | |
| Retained earnings (accumulated deficit) | | 450 |
| | (317 | ) |
| Accumulated other comprehensive loss | (50 | ) | | (137 | ) | (329 | ) | | (26 | ) |
| Total shareholders’ equity | 6,648 |
| | 6,272 |
| 6,766 |
| | 6,931 |
|
| Total liabilities and shareholders’ equity | $ | 60,375 |
| | $ | 48,999 |
| $ | 64,706 |
| | $ | 63,365 |
|
See accompanying notes to the condensed consolidated financial statements
|
| | |
E*TRADE | Q3 2017 10-Q | | 46 |
E*TRADE Q3 2018 10-Q | Page 47
E*TRADE FINANCIAL CORPORATION AND SUBSIDIARIES
CONDENSED CONSOLIDATED STATEMENT OF SHAREHOLDERS’ EQUITY
(In millions)
(Unaudited)
| | | | | | | | | Additional
Paid-in
Capital | | Retained Earnings (Accumulated Deficit) | | Accumulated
Other
Comprehensive
Loss | | Total
Shareholders’
Equity |
| | | Preferred Stock | | Common Stock | |
| | | Amount | | Shares | | Amount | |
| Balance at December 31, 2017 | | $ | 689 |
| | 267 |
| | $ | 3 |
| | $ | 6,582 |
| | $ | (317 | ) | | $ | (26 | ) | | $ | 6,931 |
|
| Cumulative effect of hedge accounting adoption | | — |
| | — |
| | — |
| | — |
| | 7 |
| | (7 | ) | | — |
|
| Reclassification of tax effects due to federal tax reform | | — |
| | — |
| | — |
| | — |
| | 14 |
| | (14 | ) | | — |
|
| Net income | | — |
| | — |
| | — |
| | — |
| | 782 |
| | — |
| | 782 |
|
| Other comprehensive loss | | — |
| | — |
| | — |
| | — |
| | — |
| | (282 | ) | | (282 | ) |
| Preferred stock dividends | | — |
| | — |
| | — |
| | — |
| | (36 | ) | | — |
| | (36 | ) |
| Repurchases of common stock | | — |
| | (11 | ) | | — |
| | (638 | ) | | — |
| | — |
| | (638 | ) |
| Share-based compensation | | — |
| | — |
| | — |
| | 35 |
| | — |
| | — |
| | 35 |
|
| Other common stock activity | | — |
| | 1 |
| | — |
| | (26 | ) | | — |
| | — |
| | (26 | ) |
| Balance at September 30, 2018 | | $ | 689 |
| | 257 |
| | $ | 3 |
| | $ | 5,953 |
| | $ | 450 |
| | $ | (329 | ) | | $ | 6,766 |
|
| | | | | | Additional
Paid-in
Capital | | Accumulated
Deficit | | Accumulated
Other
Comprehensive
Loss | | Total
Shareholders’
Equity | | | | | | | Additional Paid-in Capital | | Accumulated Deficit | | Accumulated Other Comprehensive Loss | | Total Shareholders’ Equity |
| | Preferred Stock | | Common Stock | | Preferred Stock | | Common Stock | |
| | Amount | | Shares | | Amount | | Amount | | Shares | | Amount | |
| Balance at December 31, 2016 | $ | 394 |
| | 274 |
| | $ | 3 |
| | $ | 6,921 |
| | $ | (909 | ) | | $ | (137 | ) | | $ | 6,272 |
| $ | 394 |
| | 274 |
| | $ | 3 |
| | $ | 6,921 |
| | $ | (909 | ) | | $ | (137 | ) | | $ | 6,272 |
|
| Cumulative effect of accounting change | — |
| | — |
| | — |
| | — |
| | 3 |
| | — |
| | 3 |
| — |
| | — |
| | — |
| | — |
| | 3 |
| | — |
| | 3 |
|
| Net income | — |
| | — |
| | — |
| | — |
| | 485 |
| | — |
| | 485 |
| — |
| | — |
| | — |
| | — |
| | 485 |
| | — |
| | 485 |
|
| Other comprehensive income | — |
| | — |
| | — |
| | — |
| | — |
| | 87 |
| | 87 |
| — |
| | — |
| | — |
| | — |
| | — |
| | 87 |
| | 87 |
|
| Conversion of convertible debentures | — |
| | — |
| | — |
| | 3 |
| | — |
| | — |
| | 3 |
| |
| Preferred stock dividends | — |
| | — |
| | — |
| | — |
| | (25 | ) | | — |
| | (25 | ) | — |
| | — |
| | — |
| | — |
| | (25 | ) | | — |
| | (25 | ) |
| Repurchases of common stock | — |
| | (5 | ) | | — |
| | (187 | ) | | — |
| | — |
| | (187 | ) | — |
| | (5 | ) | | — |
| | (187 | ) | | — |
| | — |
| | (187 | ) |
| Issuance of common stock for share-based compensation, net of shares withheld to pay taxes | — |
| | 2 |
| | — |
| | (22 | ) | | — |
| | — |
| | (22 | ) | |
| Share-based compensation | — |
| | — |
| | — |
| | 32 |
| | — |
| | — |
| | 32 |
| — |
| | — |
| | — |
| | 32 |
| | — |
| | — |
| | 32 |
|
| Other common stock activity | | — |
| | 2 |
| | — |
| | (19 | ) | | — |
| | — |
| | (19 | ) |
| Balance at September 30, 2017 | $ | 394 |
| | 271 |
| | $ | 3 |
| | $ | 6,747 |
| | $ | (446 | ) | | $ | (50 | ) | | $ | 6,648 |
| $ | 394 |
| | 271 |
| | $ | 3 |
| | $ | 6,747 |
| | $ | (446 | ) | | $ | (50 | ) | | $ | 6,648 |
|
| | | | | | Additional Paid-in Capital | | Accumulated Deficit | | Accumulated Other Comprehensive Income (Loss) | | Total Shareholders’ Equity | |
| | Preferred Stock | | Common Stock | | |
| | Amount | | Shares | | Amount | | |
| Balance at December 31, 2015 | $ | — |
| | 291 |
| | $ | 3 |
| | $ | 7,356 |
| | $ | (1,461 | ) | | $ | (99 | ) | | $ | 5,799 |
| |
| Net income | — |
| | — |
| | — |
| | — |
| | 425 |
| | — |
| | 425 |
| |
| Other comprehensive income | — |
| | — |
| | — |
| | — |
| | — |
| | 138 |
| | 138 |
| |
| Conversion of convertible debentures | — |
| | 1 |
| | — |
| | 5 |
| | — |
| | — |
| | 5 |
| |
| Exercise of stock options and related tax effects | — |
| | — |
| | — |
| | 3 |
| | — |
| | — |
| | 3 |
| |
| Issuance of preferred stock | 394 |
| | — |
| | — |
| | — |
| | — |
| | — |
| | 394 |
| |
| Repurchases of common stock | — |
| | (19 | ) | | — |
| | (452 | ) | | — |
| | — |
| | (452 | ) | |
| Issuance of common stock for share-based compensation, net of shares withheld to pay taxes | — |
| | 1 |
| | — |
| | (17 | ) | | — |
| | — |
| | (17 | ) | |
| Share-based compensation | — |
| | — |
| | — |
| | 21 |
| | — |
| | — |
| | 21 |
| |
| Balance at September 30, 2016 | $ | 394 |
| | 274 |
| | $ | 3 |
| | $ | 6,916 |
| | $ | (1,036 | ) | | $ | 39 |
| | $ | 6,316 |
| |
See accompanying notes to the condensed consolidated financial statements
|
| | |
E*TRADE | Q3 2017 10-Q | | 47 |
E*TRADE Q3 2018 10-Q | Page 48
E*TRADE FINANCIAL CORPORATION AND SUBSIDIARIES CONDENSED CONSOLIDATED STATEMENT OF CASH FLOWS (In millions) (Unaudited)
| |
E*TRADE FINANCIAL CORPORATION CONDENSED CONSOLIDATED STATEMENT OF CASH FLOWS (In millions) (Unaudited) | | E*TRADE FINANCIAL CORPORATION CONDENSED CONSOLIDATED STATEMENT OF CASH FLOWS (In millions) (Unaudited) |
| | | Nine Months Ended September 30, | Nine Months Ended September 30, |
| | 2017 | | 2016 | 2018 | | 2017 |
| Cash flows from operating activities: | | | | | | |
| Net income | $ | 485 |
| | $ | 425 |
| $ | 782 |
| | $ | 485 |
|
| Adjustments to reconcile net income to net cash provided by operating activities: | | | | | | |
| Provision (benefit) for loan losses | (142 | ) | | (131 | ) | (74 | ) | | (142 | ) |
| Depreciation and amortization (including discount amortization and accretion) | 192 |
| | 174 |
| 192 |
| | 192 |
|
| Gains on securities and other, net | (23 | ) | | (34 | ) | (42 | ) | | (23 | ) |
| Losses on early extinguishment of debt | 9 |
| | — |
| 4 |
| | 58 |
|
| Share-based compensation | 32 |
| | 21 |
| 35 |
| | 32 |
|
| Deferred tax expense | 288 |
| | 190 |
| 253 |
| | 288 |
|
| Other | (5 | ) | | (4 | ) | 10 |
| | (5 | ) |
| Net effect of changes in assets and liabilities: | | | | | | |
| Decrease (increase) in cash required to be segregated under federal or other regulations | 764 |
| | (1,101 | ) | |
| Increase in receivables from brokers, dealers and clearing organizations | (63 | ) | | (591 | ) | |
| (Increase) decrease in margin receivables | (1,804 | ) | | 846 |
| |
| (Increase) decrease in other assets | (16 | ) | | 27 |
| |
| Increase (decrease) in payables to brokers, dealers and clearing organizations | 409 |
| | (349 | ) | |
| Decrease (increase) in receivables from brokers, dealers and clearing organizations | | 392 |
| | (63 | ) |
| Increase in margin receivables | | (2,113 | ) | | (1,804 | ) |
| Decrease (increase) in other assets | | 349 |
| | (16 | ) |
| Increase in payables to brokers, dealers and clearing organizations | | 303 |
| | 409 |
|
| Increase in customer payables | 557 |
| | 1,283 |
| 1,085 |
| | 557 |
|
| Decrease in other liabilities | (25 | ) | | (11 | ) | |
| Net cash provided by operating activities | 658 |
| | 745 |
| |
| Increase (decrease) in other liabilities | | 47 |
| | (25 | ) |
| Net cash provided by (used in) operating activities | | 1,223 |
| | (57 | ) |
| Cash flows from investing activities: | | | | | | |
| Purchases of available-for-sale securities | (7,520 | ) | | (4,490 | ) | (6,966 | ) | | (7,520 | ) |
| Proceeds from sales of available-for-sale securities | 1,238 |
| | 2,494 |
| 6,293 |
| | 1,238 |
|
| Proceeds from maturities of and principal payments on available-for-sale securities | 1,146 |
| | 1,111 |
| 1,555 |
| | 1,146 |
|
| Purchases of held-to-maturity securities | (9,087 | ) | | (4,221 | ) | (3,684 | ) | | (9,087 | ) |
| Proceeds from maturities of and principal payments on held-to-maturity securities | 1,881 |
| | 1,476 |
| 1,781 |
| | 1,881 |
|
| Proceeds from sale of loans | 40 |
| | — |
| |
| Proceeds from sales of loans | | 30 |
| | 40 |
|
| Decrease in loans receivable | 793 |
| | 888 |
| 451 |
| | 793 |
|
| Capital expenditures for property and equipment | (77 | ) | | (51 | ) | (78 | ) | | (77 | ) |
| Proceeds from sale of real estate owned and repossessed assets | 25 |
| | 15 |
| 19 |
| | 25 |
|
| Acquisition of OptionsHouse, net of cash acquired | — |
| | (723 | ) | |
| Acquisition of TCA, net of cash acquired | | (36 | ) | | — |
|
| Net cash flow from derivative contracts | 54 |
| | (107 | ) | 200 |
| | 54 |
|
| Other | (23 | ) | | 3 |
| (32 | ) | | (23 | ) |
| Net cash used in investing activities | (11,530 | ) | | (3,605 | ) | (467 | ) | | (11,530 | ) |
|
| | |
E*TRADE | Q3 2017 10-Q | | 48 |
E*TRADE Q3 2018 10-Q | Page 49
E*TRADE FINANCIAL CORPORATION AND SUBSIDIARIES CONDENSED CONSOLIDATED STATEMENT OF CASH FLOWS—(Continued) (In millions)
| |
E*TRADE FINANCIAL CORPORATION CONDENSED CONSOLIDATED STATEMENT OF CASH FLOWS (In millions) (Unaudited)
| | E*TRADE FINANCIAL CORPORATION CONDENSED CONSOLIDATED STATEMENT OF CASH FLOWS (In millions) (Unaudited)
|
| | | Nine Months Ended September 30, | Nine Months Ended September 30, |
| | 2017 | | 2016 | 2018 | | 2017 |
| Cash flows from financing activities: | | | | | | |
| Increase in deposits | $ | 9,861 |
| | $ | 2,252 |
| |
| (Decrease) increase in deposits | | $ | (458 | ) | | $ | 9,861 |
|
| Preferred stock dividends | (25 | ) | | — |
| (36 | ) | | (25 | ) |
| Net decrease in securities sold under agreements to repurchase | — |
| | (82 | ) | |
| Advances from FHLB | 1,150 |
| | — |
| |
| Payments on advances from FHLB | (950 | ) | | — |
| |
| Net increase in advances from FHLB | | 50 |
| | 200 |
|
| Proceeds from issuance of senior notes | 999 |
| | — |
| 420 |
| | 999 |
|
| Payments on senior notes | (1,000 | ) | | — |
| — |
| | (1,049 | ) |
| Proceeds from issuance of preferred stock | — |
| | 400 |
| |
| Payments on trust preferred securities | | (413 | ) | | — |
|
| Repurchases of common stock | (187 | ) | | (452 | ) | (638 | ) | | (187 | ) |
| Other | (30 | ) | | (24 | ) | (32 | ) | | (30 | ) |
| Net cash provided by financing activities | 9,818 |
| | 2,094 |
| |
| Decrease in cash and equivalents | (1,054 | ) | | (766 | ) | |
| Cash and equivalents, beginning of period | 1,950 |
| | 2,233 |
| |
| Net cash (used in) provided by financing activities | | (1,107 | ) | | 9,769 |
|
| Decrease in cash, cash equivalents and segregated cash | | (351 | ) | | (1,818 | ) |
| Cash, cash equivalents and segregated cash, beginning of period | | 1,803 |
| | 3,410 |
|
| Cash, cash equivalents and segregated cash, end of period | | $ | 1,452 |
| | $ | 1,592 |
|
| | | | | |
| Cash and equivalents, end of period | $ | 896 |
| | $ | 1,467 |
| $ | 596 |
| | $ | 896 |
|
| Segregated cash, end of period | | 856 |
| | 696 |
|
| Cash, cash equivalents and segregated cash, end of period | | $ | 1,452 |
| | $ | 1,592 |
|
| | | | | |
| Supplemental disclosures: | | | | | | |
Cash paid for interest(1) | $ | 117 |
| | $ | 58 |
| |
| Cash paid for interest | | $ | 106 |
| | $ | 117 |
|
| Cash paid for income taxes, net of refunds | $ | 6 |
| | $ | 6 |
| $ | 9 |
| | $ | 6 |
|
| Non-cash investing and financing activities: | | | | | | |
| Transfers of loans held-for-investment to loans held-for-sale | $ | 40 |
| | $ | — |
| $ | — |
| | $ | 40 |
|
| Transfers from loans to other real estate owned and repossessed assets | $ | 23 |
| | $ | 23 |
| $ | 13 |
| | $ | 23 |
|
| Conversion of convertible debentures to common stock | $ | 3 |
| | $ | 5 |
| $ | — |
| | $ | 3 |
|
| Transfer of available-for-sale securities to held-to-maturity securities | $ | — |
| | $ | 492 |
| $ | 1,161 |
| | $ | — |
|
| Transfer of held-to-maturity securities to available-for-sale securities | | $ | 4,672 |
| | $ | — |
|
| |
(1) | Includes early redemption premium of $49 million paid in connection with corporate debt refinancing during the nine months ended September 30, 2017 |
See accompanying notes to the condensed consolidated financial statements
|
| | |
E*TRADE | Q3 2017 10-Q | | 49 |
E*TRADE Q3 2018 10-Q | Page 50
E*TRADE FINANCIAL CORPORATION AND SUBSIDIARIES
NOTES TO THE CONDENSED CONSOLIDATED FINANCIAL STATEMENTS (UNAUDITED)
(Unaudited)
|
|
| NOTE 1—ORGANIZATION, BASIS OF PRESENTATION AND SUMMARY OF SIGNIFICANT ACCOUNTING POLICIES |
Organization
E*TRADE Financial Corporation is a financial services company that provides brokerage and related products and services primarily to individual retail investors under the brand E*"E*TRADE Financial." The Company also provides investor-focused banking products, primarily sweep deposits, to retail investors.
Basis of Presentation
The condensed consolidated financial statements, also referred to herein as the consolidated financial statements, include the accounts of the Company and its majority-owned subsidiaries as determined under the voting interest model. Entities in which the Company has the ability to exercise significant influence but in which the Company does not possess control are generally accounted for by the equity method. Entities in which the Company does not have the ability to exercise significant influence are generally carried at cost. Investments in marketable equity securities wherecost, or, to the Company does not have the ability to exercise significant influence over the entities are accounted for as available-for-sale equity securities.extent that a readily determinable fair value is available, at fair value through net income. The Company also evaluates its initial and continuing involvement with certain entities to determine if the Company is required to consolidate the entities under the variable interest entity (VIE) model. This evaluation is based on a qualitative assessment of whether the Company is the primary beneficiary of the VIE, which requires the Company to possess both: 1) the power to direct the activities that most significantly impact the economic performance of the VIE; and 2) the obligation to absorb losses or the right to receive benefits of the VIE that could potentially be significant to the VIE. The consolidated financial statements do not include any consolidated VIEs for all periods presented.
The Company's consolidated financial statements are prepared in accordance with GAAP. Intercompany accounts and transactions are eliminated in consolidation. These consolidated financial statements reflect all adjustments, which are normal and recurring in nature, necessary to present fairly the financial position, results of operations and cash flows for the periods presented. These
Beginning January 1, 2018, the Company updated the presentation of the consolidated financial statements shouldas follows:
On the consolidated statement of income, fair value hedging adjustments, previously referred to as hedge ineffectiveness, are included within net interest income as a result of the adoption of new accounting guidance. Prior period amounts have not been reclassified to current period presentation and continue to be read in conjunction withreflected within gains on securities and other, net. Fair value hedging adjustments were as follows:
| |
| ◦ | Expenses of $5 million and $13 million for the three and nine months ended September 30, 2018. |
| |
| ◦ | Expenses of $2 million and $5 million for the same periods in 2017. |
On the Annual Reportconsolidated balance sheet, deferred tax assets, net has been reclassified to other assets. The prior period has been reclassified to conform to the current period presentation. Deferred tax assets, net were $94 million and $251 million at September 30, 2018 and December 31, 2017, respectively.
E*TRADE Q3 2018 10-Q | Page 51
E*TRADE FINANCIAL CORPORATION
NOTES TO THE CONDENSED CONSOLIDATED FINANCIAL STATEMENTS (UNAUDITED)
On the consolidated balance sheet, publicly traded equity securities are presented within other assets as a result of the adoption of amended accounting guidance. The prior period has not been reclassified as the amended accounting guidance was adopted on Form 10-Ka modified retrospective basis. Accordingly, publicly traded equity securities for the year ended December 31, 2016. While certain disclosures included in annual financial statements prepared in accordance with GAAP have been omitted in this quarterly report, the Company believes that the information and disclosuresprior period are presented herein are adequate and that such disclosures are not misleading.within available-for-sale securities.
Use of Estimates
Preparing the Company's consolidated financial statements in accordance with GAAP requires management to make estimates and assumptions that affect the amounts reported in the consolidated financial statements and related notes for the periods presented. Actual results could differ from management’s estimates. Certain significant accounting policies are critical because they are based on estimates and assumptions that require complex and subjective judgments by management. Changes in these estimates or assumptions could materially impactmanagement including the Company’s financial condition and results of operations. Material estimates in which management believes changes could reasonably occur include: allowance for loan losses;losses, valuation and impairment of goodwill and acquired intangible assets;assets and estimates of effective tax rates, deferred taxes and valuation allowance.
|
| | |
E*TRADE | Q3 2017 10-Q | | 50 |
the Company's ongoing evaluations based on available information.
Adoption of New Accounting Standards
Accounting for Employee Share-Based Payments
In March 2016, the FASB amended the accounting guidance on employee share-based payments. Relevant changes in the amended guidance include the requirement to recognize all excess tax benefits and deficiencies upon exercise or vesting as income tax expense or benefit in the consolidated statement of income; to treat excess tax benefits and deficiencies as discrete items in the reporting period they occur; to not delay recognition of excess tax benefits until the tax benefit is realized through a reduction in current taxes payable; and to make an accounting policy election to either estimate forfeitures or account for them as they occur. The Company adopted the amended accounting guidance as of January 1, 2017 and recognized a $3 million deferred tax asset and cumulative-effect adjustment to equity as of the beginning of the period. In addition, for the nine months ended September 30, 2016 the Company reclassified $17 million related to shares withheld to pay taxesRevenue from cash flows from operating activities to the other line item within cash flows from financing activities. Forfeitures will continue to be estimated consistent with the Company's prior accounting policies. The impact to the Company's financial condition, results of operations and cash flows will vary based on, among other factors, the market price of the Company's common stock. During the nine months ended September 30, 2017 the Company recognized an $8 million income tax benefit in accordance with the new guidance.
New Accounting Standards Not Yet Adopted
Revenue Recognition on Contracts with Customers
In May 2014, the FASB amended the guidance on revenue recognition onfrom contracts with customers. The new standard outlines a single comprehensive model for entities to apply in accounting for revenue arising from contracts with customers. The Company's accounting for net interest income iswas not expected to be impacted by the new standard. The FASB issued supplemental amendments to the new standard to clarify certain accounting guidance and to provide narrow scope improvements and practical expedients during 2016. The amended guidance will bebecame effective for annual and interim periods beginning on January 1, 2018 and may be appliedthe Company adopted the guidance on either a full retrospective or modified retrospective basis. Based on the Company's analysis to date, thisThis adoption isdid not expected to have a material impact on the Company’s financial condition, results of operations or cash flows as the satisfaction of performance obligations under the new guidance is expected to be materially consistent with the Company's existingprevious revenue recognition policies. Similarly, the amended guidance isdid not expected to have a material impact on the recognition of costs incurred to obtain new contracts. The Company is in process of completing its evaluationFor additional information on the Company's adoption of the newamended guidance, including considerations relating to financial statement presentation, disclosures and controls. The Company intends to apply the guidance on a modified retrospective basis.see Note 3—Net Revenue.
Classification and Measurement of Financial Instruments
In January 2016, the FASB amended the accounting and disclosure guidance on the classification and measurement of financial instruments. Relevant changes in the amended guidance include the requirement that equity investments, excluding those accounted for under the equity method of accounting or those resulting in consolidation of the investee, be measured at fair value in the consolidated balance sheet with changes in fair value recognized in net income. For disclosure purposes, the Company will no longer be required to disclose the methods and significant assumptions used to estimate fair value for financial instruments measured at amortized cost in the consolidated balance sheet. The amended guidance will bebecame effective for interim and annual periods beginning on January 1, 2018, and is required to bewas applied on a modified retrospective basis by means of a cumulative-effect adjustment to the consolidated balance sheet on that date.basis. The adoption isdid not expected to have a material impact on the Company’s financial condition, results of operations or cash flows as debt securities represent the majority of the Company's investment portfolio. Beginning January 1, 2018, publicly traded equity securities are presented within other assets on the consolidated balance sheet.
|
| | |
E*TRADE | Q3 2017 10-Q | | 51 |
E*TRADE Q3 2018 10-Q | Page 52
E*TRADE FINANCIAL CORPORATION
NOTES TO THE CONDENSED CONSOLIDATED FINANCIAL STATEMENTS (UNAUDITED)
Classification of Certain Cash Receipts and Cash Payments
In August 2016, the FASB amended the guidance on the presentation and classification of certain cash receipts and cash payments in the consolidated statement of cash flows to eliminate diversity in practice. The new guidance became effective on January 1, 2018, and the retrospective transition method has been applied to each period presented. Among other changes, the Company now classifies debt extinguishment costs within cash flows from financing activities. The Company reclassified $49 million of debt extinguishment costs incurred during the three and nine months ended September 30, 2017 to cash flows from financing activities as a result of this adoption.
Classification of Restricted Cash
In November 2016, the FASB amended the guidance on the presentation and classification of changes in restricted cash in the consolidated statement of cash flows to eliminate diversity in practice. The amended guidance requires the consolidated statement of cash flows to explain the change during the period in the total cash, cash equivalents, and amounts generally described as restricted cash and restricted cash equivalents. The new guidance became effective on January 1, 2018 and has been applied using a retrospective transition method to each period presented. The Company concluded that cash required to be segregated under federal or other regulations is considered restricted cash and the segregated cash activity is now presented on the consolidated statement of cash flows.
Clarifying the Definition of a Business
In January 2017, the FASB amended the guidance to clarify the definition of a business in order to assist companies in the evaluation of whether transactions should be accounted for as acquisitions or disposals of assets or businesses. The guidance, which became effective on January 1, 2018, did not change the Company's accounting conclusions for the TCA acquisition and is not expected to impact the Company's accounting conclusions for the acquisition of brokerage accounts from Capital One.
Premium Amortization on Purchased Callable Debt Securities
In March 2017, the FASB amended the guidance on the amortization period for certain callable debt securities held at a premium. The amended guidance shortens the amortization period for these securities by requiring the premium to be amortized to the earliest call date. The guidance does not amend the accounting for securities held at a discount. The Company early adopted this guidance beginning January 1, 2018; however, a cumulative-effect adjustment to retained earnings was not required upon adoption as the Company did not hold any callable debt securities at a premium as of January 1, 2018.
Targeted Improvements to Accounting for Hedging Activities
In August 2017, the FASB amended the guidance to update the recognition and presentation of hedging relationships. Among other changes, the new guidance eases hedge documentation requirements and allows additional types of hedge accounting strategies. The Company early adopted this guidance beginning January 1, 2018. The Company applied the guidance on a modified retrospective basis, which resulted in a $7 million cumulative-effect adjustment to increase retained earnings and to decrease accumulated other comprehensive income. In addition, the guidance provided a one-time transition election to transfer certain debt securities from held-to-maturity to available-for-sale. The Company transferred agency mortgage-backed and agency debt securities with a fair value of $4.7 billion, and recognized a net pre-tax gain of $7 million within other comprehensive income. For additional information on the Company's adoption of the amended guidance, see Note 8—Derivative Instruments and Hedging Activities.
E*TRADE Q3 2018 10-Q | Page 53
E*TRADE FINANCIAL CORPORATION
NOTES TO THE CONDENSED CONSOLIDATED FINANCIAL STATEMENTS (UNAUDITED)
Reclassification of Certain Tax Effects from Accumulated Other Comprehensive Income
In February 2018, the FASB amended the guidance to address certain income tax effects in accumulated other comprehensive income resulting from the federal tax reform enacted in 2017. The amended guidance provides an option to reclassify tax effects within accumulated other comprehensive income to retained earnings in the period in which the effect of the tax reform is recorded. The amendments are effective for fiscal years beginning after December 15, 2018, including interim periods. Early adoption is permitted. The Company adopted the amended guidance in the first quarter of 2018 and used the portfolio approach to record a $14 million increase to retained earnings and a corresponding decrease to accumulated other comprehensive income. The amount of the reclassification related only to the change in the federal corporate tax rate.
Changes to Disclosure Requirements for Fair Value Measurements
In August 2018, the FASB amended the guidance on the disclosure requirements for fair value measurements as part of its disclosure effectiveness project. The amended guidance eliminates several disclosure requirements including the policies related to valuation processes for Level 3 fair value measurements, the timing of transfers between levels of the fair value hierarchy and the amount of and reasons for transfers between Level 1 and Level 2. The amended guidance adds an explicit disclosure requirement to disclose the range and weighted average used to develop significant unobservable inputs for Level 3 fair value measurements. The guidance is effective for fiscal years beginning after December 15, 2019, including interim periods. Early adoption is permitted. The Company early adopted this guidance as of September 30, 2018 on a retrospective basis.
New Accounting Standards Not Yet Adopted
Accounting for Leases
In February 2016, the FASB amended the guidance on accounting for leases. The new standard requires lessees to recognize assets and liabilities on the balance sheet for the rights and obligations created by all qualifying leases with terms of more than twelve months. The recognition, measurement and presentation of expenses and cash flows arising from a lease by a lessee remains substantially unchanged and depends on classification as a finance or operating lease. The new standard also requires quantitative and qualitative disclosures that provide information about the amounts related to leasing arrangements recorded in the consolidated financial statements. The new guidance will be effective for interim and annual periods beginning on January 1, 2019, andis required to be applied on a modified retrospective basis to the earliest period presented, which includes practical expedient options in certain circumstances.basis. The Company is in the process of evaluating the new accounting guidance, which includes the assessment of whether certain executory contracts contain embedded leases. The Company has 30 regional branches and 10 corporate locations which are leased. Theexpects to recognize right of use assetassets related to its property leases within the range of $210 million to $250 million based on incremental borrowing rates as of September 30, 2018, which includes leases in effect through the filing of these condensed consolidated financial statements and corresponding lease liability for these leasesterms we expect to be in effect as of the implementation date. The Company does not expect a material impact to the Company’s income statement; however, the impact of the Company’s adoption of the amended lease accounting guidance will be recognizeddepend on subsequent changes to the Company's balance sheet upon adoption.lease portfolio, the incremental borrowing rates and the identification of embedded leases as of the adoption date.
E*TRADE Q3 2018 10-Q | Page 54
E*TRADE FINANCIAL CORPORATION
NOTES TO THE CONDENSED CONSOLIDATED FINANCIAL STATEMENTS (UNAUDITED)
Accounting for Credit Losses
In June 2016, the FASB amended the accounting guidance on accounting for credit losses. The amended guidance requires measurement of all expected credit losses for financial instruments, including loans and debt securities, and other commitments to extend credit held at the reporting date. For financial assets measured at amortized cost, factors such as historical experience, current conditions, and reasonable and supportable forecasts will be used to estimate expected credit losses. The amended guidance will also change the mannerresult in which credit losses are recognized on impaired available-for-sale debt securities classified as available-for-sale.being recorded through an allowance for credit losses. The new guidance will be effective for interim and annual periods beginning January 1, 2020. Early adoption is permitted. The Company is currently evaluating the impact of the new accounting guidance on the Company's financial condition, results of operations and cash flows. The Company does not expect the amended accounting guidance to have as significant of an impact as it could have if the Company were originating or purchasing loans. OurCompany's evaluation is contemplatingcontemplates the recent performance of the Company's run-off legacy mortgage and consumer loan portfolio and the credit profile of the current investment securities portfolio; however, the impact of the new guidance will depend on the current and expected macroeconomic conditions and the nature and characteristics of financial assets held by usthe Company on the date of adoption.
Classification of Certain Cash Receipts and Cash Payments
In August 2016, the FASB amended the guidance on the presentation and classification of certain cash receipts and cash payments in the consolidated statement of cash flows to eliminate current diversity in practice. The new guidance will be effective for interim and annual periods beginning January 1, 2018, and must be applied using a retrospective transition method to each period presented. Among other changes, the Company expects to begin classifying debt extinguishment costs within cash flows from financing activities.
Classification of Restricted Cash
In November 2016, the FASB amended the guidance on the presentation and classification of changes in restricted cash in the consolidated statement of cash flows to eliminate current diversity in practice. The amended guidance requires the consolidated statement of cash flows to explain the change during the period in the total cash, cash equivalents, and amounts generally described as restricted cash and restricted cash equivalents. The Company expects to begin presenting segregated cash activity on the consolidated statement of cash flows. The guidance will be effective for interim and annual periods beginning January 1, 2018, and must be applied using a retrospective transition method to each period presented.
|
| | |
E*TRADE | Q3 2017 10-Q | | 52 |
Clarifying the Definition of a Business
In January 2017, the FASB issued guidance to clarify the definition of a business in order to assist companies in the evaluation of whether transactions should be accounted for as acquisitions or disposals of assets or businesses. The amended guidance also removes the existing evaluation of a market participant's ability to replace missing elements and narrows the definition of output to achieve consistency with other topics. The guidance will be effective for interim and annual periods beginning January 1, 2018, and must be applied prospectively.
Simplifying the Test for Goodwill Impairment
In January 2017, the FASB issuedamended the guidance to simplify the test for goodwill impairment by eliminating Step 2 from the goodwill impairment test. The amended guidance requires the Company to perform its annual goodwill impairment test by comparing the fair value of a reporting unit with its carrying amount. An impairment charge should be recognized at the amount by which the carrying amount exceeds the fair value of the reporting unit; however, the loss recognized should not exceed the total amount of goodwill allocated to that reporting unit. Income tax effects resulting from any tax deductible goodwill should be considered when measuring the goodwill impairment loss, if applicable. The Company will still have the option to perform a qualitative assessment to conclude whether it is more likely than not that the carrying amount of the Company exceeds its fair value. The guidance will be effective for interim and annual periods beginning January 1, 2020, and must be applied prospectively. Early adoption is permitted.
Premium Amortization on Purchased Callable Debt SecuritiesImplementation Costs Incurred in a Cloud Computing Arrangement that is a Service Contract
In March 2017,August 2018, the FASB issuedamended the guidance to amend the amortization periodon accounting for certain purchased callable debt securities held atimplementation costs incurred in a premium.cloud computing arrangement that is a service contract. The amended guidance shortensaligns the amortization periodrequirements for certain callable debt securities held atcapitalizing implementation costs incurred in a premium by requiringhosting arrangement that is a service contract with the premiumrequirements for capitalizing implementation costs incurred to be amortized to the earliest call date.develop or obtain internal-use software. The guidance does not amend the accounting for securities held at a discount. Thenew guidance will be effective for interim and annual periods beginning on January 1, 2019,2020, and mustshould be applied on a modified retrospective basis through a cumulative-effect adjustment to retained earnings aseither retrospectively or prospectively. The Company is currently evaluating the impact of the beginning of the period of adoption. Early adoption is permitted. Based on the current composition of the Company's securities portfolio, the new accounting guidance is not expected to have a significant impact on the Company's financial condition, or results of operations.operations and cash flows.
Targeted Improvements toInclusion of the Secured Overnight Financing Rate (SOFR) Overnight Index Swap (OIS) Rate as a Benchmark Interest Rate for Hedge Accounting for Hedging ActivitiesPurposes
In August 2017,October 2018, the FASB issued guidance to update the recognition and presentation of hedging relationships. Among other changes, the new guidance eases hedge documentation requirements and allows additional types of accounting hedges. In addition,amended the guidance provides a one-time transition electionon hedge accounting. The amended guidance adds the OIS rate based on the SOFR to transfer certain debt securities from held-to-maturity to available-for-sale.the list of permitted benchmark interest rates for hedge accounting purposes. The guidance will beis effective for the Company for interim and annual periods beginning January 1, 2019, and must be applied on a modified retrospective basis through a cumulative-effect adjustment to the opening balance of retained earnings as of the beginning of the fiscal year of adoption.2019. Early adoption is permitted. The guidance will be adopted on a prospective basis for qualifying new or redesignated hedging relationships entered into on or after the date of adoption. The Company is in process of evaluating the new guidance, including adoption timing, which could be as early as January 1, 2018.currently
E*TRADE Q3 2018 10-Q | Page 55
E*TRADE FINANCIAL CORPORATION
NOTES TO THE CONDENSED CONSOLIDATED FINANCIAL STATEMENTS (UNAUDITED)
evaluating the impact of the new accounting guidance on the Company's financial condition, results of operations and cash flows.
|
| | |
E*TRADE | Q3 2017 10-Q | | 53NOTE 2—BUSINESS ACQUISITION |
TCA Acquisition
On April 9, 2018, the Company completed its acquisition of TCA for $275 million in cash. TCA is a leading provider of technology solutions and custody services to the RIA market. The acquisition is expected to benefit the Company as the RIA portion of our industry is growing and the Company expects to leverage the E*TRADE brand to accelerate growth. The Company also expects this acquisition to help bolster the Company's ability to retain customers in need of specialized customer service engagement.
The results of TCA's operations have been included in the Company's consolidated statement of income for the three and nine months ended September 30, 2018 from the date of acquisition. While we do not maintain discrete financial information for TCA, we estimate TCA's net revenue from April 9, 2018 through September 30, 2018 was approximately $40 million. Supplementary pro forma financial information related to the acquisition is not included because the impact to the Company's consolidated statement of income is not material.
The following table summarizes the allocation of the purchase price to the net assets of TCA as of April 9, 2018 (dollars in millions):
|
| | | |
| | April 9, 2018 |
| Purchase price | $ | 275 |
|
| Fair value of net assets acquired | 160 |
|
| Goodwill | $ | 115 |
|
The following table summarizes the fair values of the assets acquired and liabilities assumed as of the acquisition date (dollars in millions): |
| | | |
| | April 9, 2018 |
| Assets | |
| Cash and equivalents | $ | 239 |
|
| Available-for-sale securities | 554 |
|
| Other intangibles | 140 |
|
Other(1) | 23 |
|
| Total assets acquired | 956 |
|
| Liabilities | |
| Deposits | 790 |
|
| Other liabilities | 6 |
|
| Total liabilities assumed | 796 |
|
| Net assets acquired | $ | 160 |
|
(1) Includes balance sheet line items property and equipment, net and other assets.
E*TRADE Q3 2018 10-Q | Page 56
E*TRADE FINANCIAL CORPORATION
NOTES TO THE CONDENSED CONSOLIDATED FINANCIAL STATEMENTS (UNAUDITED)
The goodwill of $115 million includes the synergies expected to result from combining operations with TCA, coupling its custody platform with the Company's existing product offerings and leveraging customer relationships with RIAs. The goodwill is deductible for tax purposes.
The Company recorded intangible assets of $140 million, which are subject to amortization over their estimated useful lives. The intangible assets are deductible for tax purposes. The fair value of the intangible assets was determined under the income approach. The following table summarizes the fair value and estimated useful lives of the intangible assets (dollars in millions):
|
| | | | | |
| | Estimated Fair Value | | Estimated Useful Life (In Years) |
| Customer Relationships | $ | 119 |
| | 22 |
| Technology | 20 |
| | 5 |
| Trade name | 1 |
| | 2 |
| Total intangible assets | $ | 140 |
| | |
| | | | |
The following table presents the significant components of total net revenue (dollars in millions): |
| | | | | | | | | | | | | | | |
| | Three Months Ended September 30, | | Nine Months Ended September 30, |
| | 2018 | | 2017 | | 2018 | | 2017 |
| Net interest income | $ | 466 |
| | $ | 391 |
| | $ | 1,364 |
| | $ | 1,066 |
|
| Commissions | 117 |
| | 100 |
| | 375 |
| | 332 |
|
| Fees and service charges | 108 |
| | 92 |
| | 323 |
| | 276 |
|
| Gains on securities and other, net | 17 |
| | 6 |
| | 42 |
| | 23 |
|
| Other revenue | 12 |
| | 10 |
| | 34 |
| | 32 |
|
| Total net revenue | $ | 720 |
| | $ | 599 |
| | $ | 2,138 |
| | $ | 1,729 |
|
E*TRADE Q3 2018 10-Q | Page 57
E*TRADE FINANCIAL CORPORATION
NOTES TO THE CONDENSED CONSOLIDATED FINANCIAL STATEMENTS (UNAUDITED)
NOTE 2—INTEREST INCOME AND INTEREST EXPENSEInterest Income and Interest Expense
The following table showspresents the significant components of interest income and interest expense (dollars in millions): | | | | Three Months Ended September 30, | | Nine Months Ended September 30, | Three Months Ended September 30, | | Nine Months Ended September 30, |
| | 2017 | | 2016 | | 2017 | | 2016 | 2018 | | 2017 | | 2018 | | 2017 |
| Interest income: | | | | | | | | | | | | | | |
| Cash and equivalents | $ | 2 |
| | $ | 2 |
| | $ | 6 |
| | $ | 5 |
| $ | 2 |
| | $ | 2 |
| | $ | 7 |
| | $ | 6 |
|
| Cash required to be segregated under federal or other regulations | 3 |
| | 2 |
| | 9 |
| | 4 |
| 4 |
| | 3 |
| | 11 |
| | 9 |
|
| Available-for-sale securities | 102 |
| | 66 |
| | 282 |
| | 198 |
| |
| Held-to-maturity securities | 153 |
| | 109 |
| | 410 |
| | 319 |
| |
Investment securities(1) | | 315 |
| | 255 |
| | 908 |
| | 692 |
|
| Margin receivables | 87 |
| | 60 |
| | 228 |
| | 185 |
| 130 |
| | 87 |
| | 351 |
| | 228 |
|
| Loans | 37 |
| | 46 |
| | 121 |
| | 146 |
| 32 |
| | 37 |
| | 98 |
| | 121 |
|
| Broker-related receivables and other | 1 |
| | — |
| | 2 |
| | 1 |
| 4 |
| | 1 |
| | 12 |
| | 2 |
|
| Subtotal interest income | 385 |
| | 285 |
| | 1,058 |
| | 858 |
| 487 |
| | 385 |
| | 1,387 |
| | 1,058 |
|
Other interest revenue(1) | 28 |
| | 24 |
| | 74 |
| | 65 |
| |
Other interest revenue(2) | | 27 |
| | 28 |
| | 84 |
| | 74 |
|
| Total interest income | 413 |
| | 309 |
| | 1,132 |
| | 923 |
| 514 |
| | 413 |
| | 1,471 |
| | 1,132 |
|
| Interest expense: | | | | | | | | | | | | | | |
| Deposits | (1 | ) | | (1 | ) | | (3 | ) | | (3 | ) | 16 |
| | 1 |
| | 26 |
| | 3 |
|
| Customer payables | (1 | ) | | (2 | ) | | (4 | ) | | (4 | ) | 8 |
| | 1 |
| | 13 |
| | 4 |
|
| Broker-related payables and other | | 3 |
| | — |
| | 7 |
| | — |
|
| Other borrowings | (6 | ) | | (4 | ) | | (16 | ) | | (13 | ) | 6 |
| | 6 |
| | 21 |
| | 16 |
|
| Corporate debt | (12 | ) | | (13 | ) | | (39 | ) | | (40 | ) | 13 |
| | 12 |
| | 32 |
| | 39 |
|
| Subtotal interest expense | (20 | ) |
| (20 | ) | | (62 | ) | | (60 | ) | 46 |
|
| 20 |
| | 99 |
| | 62 |
|
Other interest expense(2)(3) | (2 | ) | | (2 | ) | | (4 | ) | | (3 | ) | 2 |
| | 2 |
| | 8 |
| | 4 |
|
| Total interest expense | (22 | ) | | (22 | ) | | (66 | ) | | (63 | ) | 48 |
| | 22 |
| | 107 |
| | 66 |
|
| Net interest income | $ | 391 |
| | $ | 287 |
| | $ | 1,066 |
| | $ | 860 |
| $ | 466 |
| | $ | 391 |
| | $ | 1,364 |
| | $ | 1,066 |
|
| |
| (1) | For the three and nine months ended September 30, 2018, includes $5 million and $13 million of net fair value hedging adjustments. See Note 8—Derivative Instruments and Hedging Activities for additional information. |
| |
| (2) | Represents interest income on securities loaned. |
| |
(2)(3) | Represents interest expense on securities borrowed. |
E*TRADE Q3 2018 10-Q | Page 58
E*TRADE FINANCIAL CORPORATION
NOTES TO THE CONDENSED CONSOLIDATED FINANCIAL STATEMENTS (UNAUDITED)
Fees and Service Charges
The following table presents the significant components of fees and service charges revenue (dollars in millions): |
| | | | | | | | | | | | | | | |
| | Three Months Ended September 30, | | Nine Months Ended September 30, |
| | 2018 | | 2017 | | 2018 | | 2017 |
| Fees and service charges: | | | | | | | |
| Order flow revenue | $ | 40 |
| | $ | 33 |
| | $ | 130 |
| | $ | 98 |
|
| Money market funds and sweep deposits revenue | 18 |
| | 23 |
| | 53 |
| | 71 |
|
| Advisor management and custody fees | 19 |
| | 9 |
| | 46 |
| | 26 |
|
| Mutual fund service fees | 13 |
| | 10 |
| | 36 |
| | 29 |
|
| Foreign exchange revenue | 7 |
| | 6 |
| | 21 |
| | 20 |
|
| Reorganization fees | 3 |
| | 5 |
| | 10 |
| | 13 |
|
| Other fees and service charges | 8 |
| | 6 |
| | 27 |
| | 19 |
|
| Total fees and service charges | $ | 108 |
| | $ | 92 |
| | $ | 323 |
| | $ | 276 |
|
Revenue from Contracts with Customers
On January 1, 2018, the Company adopted the new accounting standard, Revenue from Contracts with Customers, and all the related amendments using the modified retrospective method.
A performance obligation is a promise in a contract to transfer a distinct good or service to the customer, and is the unit of account in the new revenue recognition standard. The transaction price in a contract is allocated to each distinct performance obligation and is recognized as revenue when, or as, the performance obligation is satisfied.
Commissions Revenue
Commissions are derived from the Company's customers and are impacted by DARTs, average commission per trade and the number of trading days. Commission rates differ by trade type (e.g., equities, derivatives, stock plan and mutual funds) and are also impacted by lower pricing for customers that qualify for active trader pricing. For certain trade types, such as options contracts, the total commission earned varies based on contract volume. Commissions from securities transactions are recognized on a trade-date basis.
Order Flow Revenue
Order flow revenue is generated from market centers that accept trade orders from customer securities transactions. Order flow revenue is recognized on a trade-date basis when the Company has satisfied its performance obligation to the market center.
Money Market Funds and Sweep Deposits Revenue
Money market funds and sweep deposits revenue is driven by fees earned from off-balance sheet customer cash. This revenue is typically based on the average daily balance and the federal funds rate or LIBOR plus a negotiated spread.
E*TRADE Q3 2018 10-Q | Page 59
E*TRADE FINANCIAL CORPORATION
NOTES TO THE CONDENSED CONSOLIDATED FINANCIAL STATEMENTS (UNAUDITED)
Advisor Management and Custody Fees
Advisor management and custody fees are generally earned based on a percentage of customer assets under management or the balance of assets under custody and are recognized over time as the services are provided.
Mutual Fund Service Fees
Mutual fund service fees are asset-based fees that are driven by the amount of customer assets invested in each fund. Revenue is recognized over time as the performance obligation to provide shareholder services is satisfied.
Other
Other fees and service charges are recognized when or as the performance obligations are satisfied. Fees from software and services for managing equity compensation plans are recognized as the performance obligations are satisfied and are presented within other revenue on the consolidated statement of income.
|
|
| NOTE 4—FAIR VALUE DISCLOSURES |
Fair value is defined as the price that would be received to sell an asset or paid to transfer a liability in an orderly transaction between market participants at the measurement date. In determining fair value, the Company may use various valuation approaches, including market, income and/or cost approaches. The fair value hierarchy requires the Company to maximize the use of observable inputs and minimize the use of unobservable inputs when measuring fair value. Fair value is a market-based measure considered from the perspective of a market participant. Accordingly, even when market assumptions are not readily available, the Company’s own assumptions reflect those that market participants would use in pricing the asset or liability at the measurement date. The fair value measurement accounting guidance describes the following three levels used to classify fair value measurements:
Level 1—1 - unadjusted quoted prices in active markets for identical assets or liabilities that are accessible by the Company
Level 2—2 - quoted prices for similar assets and liabilities in an active market, quoted prices in markets that are not active or for which all significant inputs are observable, either directly or indirectly
Level 3—3 - unobservable inputs that are significant to the fair value of the assets or liabilities
|
| | |
E*TRADE | Q3 2017 10-Q | | 54 |
The availability of observable inputs can vary and in certain cases, the inputs used to measure fair value may fall into different levels of the fair value hierarchy. In such cases, the level within the fair value hierarchy is based on the lowest level of input that is significant to the fair value measurement. The Company’s assessment of the significance of a particular input to a fair value measurement requires judgment and consideration of factors specific to the asset or liability.
E*TRADE Q3 2018 10-Q | Page 60
E*TRADE FINANCIAL CORPORATION
NOTES TO THE CONDENSED CONSOLIDATED FINANCIAL STATEMENTS (UNAUDITED)
Recurring Fair Value Measurement Techniques
Mortgage-backed Securities
The Company’s mortgage-backed securities portfolio is comprised of agency mortgage-backed securities which are guaranteedguaranteed by U.S.US government sponsored enterprises and federal agencies. The fair value of agency mortgage-backed securities was determined using a market approach with quoted market prices, recent transactions and spread data for identical or similar instruments. Agency mortgage-backed securities were categorized in Level 2 of the fair value hierarchy.
Other Debt Securities
The Company's fair value level classification of U.S.US Treasuries is based on the original maturity dates of the securities and whether the securities are the most recent issuances of a given maturity. U.S.US Treasuries with original maturities less than one year are classified as Level 1. U.S.US Treasuries with original maturities longergreater than one year are classified as Level 1 if they represent the most recent issuance of a given maturity; otherwise, these securities are classified as Level 2.
The fair value measurements of agency debentures and agency debt securities were determined using market and income approaches along with the Company’s own trading activities for identical or similar instruments and were categorized in Level 2 of the fair value hierarchy.
All of the Company’s municipal bonds were rated investment grade at September 30, 2017.2018. These securities were valued using a market approach with pricing service valuations corroborated by recent market transactions for identical or similar bonds. Municipal bonds and corporate bonds were categorized in Level 2 of the fair value hierarchy.
Publicly Traded Equity Securities
The fair value measurements of the Company's publicly traded equity securities were classified as Level 1 of the fair value hierarchy as they were based on quoted prices in active markets.
Derivative Instruments
Interest rate swap and option contractsswaps were valued with an income approach using pricing models that are commonly used by the financial services industry. The market observable inputs used in the pricing models include the swap curve the volatility surface, and prime or overnight indexed swap basis from a financial data provider. The Company does not consider these models to involve significant judgment on the part of management, and the Company corroborated the fair value measurements with counterparty valuations. The Company’s derivative instruments were categorized in Level 2 of the fair value hierarchy. The consideration of credit risk, the Company’s or the counterparty’s, did not result in an adjustment to the valuation of its derivative instruments in the periods presented.
|
| | |
E*TRADE | Q3 2017 10-Q | | 55 |
Nonrecurring Fair Value Measurement Techniques
Certain other assets are recorded at fair value on a nonrecurring basis: 1) one- to four-family and home equity loans in which the amount of the loan balance in excess of the estimated current value of the underlying property less estimated selling costs has been charged-off; and 2) real estate owned that is carried at the lower of the property’s carrying value or fair value less estimated selling costs.
The Company evaluates and reviews assets that have been subject to fair value measurement requirements on a quarterly basis in accordance with policies and procedures that were designed to be in compliance with guidance from the Company’s regulators. These policies and procedures govern the frequency
E*TRADE Q3 2018 10-Q | Page 61
E*TRADE FINANCIAL CORPORATION
NOTES TO THE CONDENSED CONSOLIDATED FINANCIAL STATEMENTS (UNAUDITED)
Loans Receivable
Loans that have been delinquent for 180 days or that are in bankruptcy and certain TDR loan modifications are charged-off based on the estimated current value of the underlying property less estimated selling costs. Property valuations for these one- to four-family and home equity loans are based on the most recent "as is" property valuation data available, which may include appraisals, broker price opinions, (BPOs), automated valuation models or updated values using home price indices. Subsequent to the recording of an initial fair value measurement, these loans continue to be measured at fair value on a nonrecurring basis, utilizing the estimated value of the underlying property less estimated selling costs. These property valuations are updated on a monthly, quarterly or semi-annual basis depending on the type of valuation initially used. If the valuation data obtained is significantly different from the valuation previously received, the Company reviews additional property valuation data to corroborate or update the valuation. If the value of the underlying property has declined, an additional charge-off is recorded. If the value of the underlying property has increased, previously charged-off amounts are not reversed. Recoveries of previously charged-off amounts are recognized within the allowance for loan losses when received.
Real Estate Owned
Property valuations for real estate owned are based on the lowest value of the most recent property valuation data available, which may include appraisals, listing prices or approved offer prices.
Nonrecurring fair value measurements on one- to four-family andloans, home equity loans and real estate owned were classified as Level 3 of the fair value hierarchy as the valuations included unobservable inputs that were significant to the fair value. The following table presents additional information about significant unobservable inputs used in the valuation of assets measured at fair value on a nonrecurring basis that were categorized in Level 3 of the fair value hierarchy at September 30, 2017 and December 31, 2016:hierarchy:
| | | | Unobservable Inputs | | Average | | Range | Unobservable Inputs | | Average | | Range |
| September 30, 2017 | | | | |
| September 30, 2018 | | | | |
| Loans receivable: | | | | | | |
| One- to four-family | Appraised value | | $ | 470,600 |
| | $40,500-$1,200,000 | Appraised value | | $ | 621,000 |
| | $195,000 - $2,000,000 |
| Home equity | Appraised value | | $ | 327,800 |
| | $30,000-$2,200,000 | Appraised value | | $ | 371,000 |
| | $65,000 - $950,000 |
| Real estate owned | Appraised value | | $ | 363,700 |
| | $13,500-$2,200,000 | Appraised value | | $ | 315,000 |
| | $45,000 - $1,149,000 |
| | | | | | | |
| December 31, 2016 | | | | |
| December 31, 2017 | | | | |
| Loans receivable: | | | | | | |
| One- to four-family | Appraised value | | $ | 408,100 |
| | $50,000-$1,490,000 | Appraised value | | $ | 520,700 |
| | $60,000 - $1,200,000 |
| Home equity | Appraised value | | $ | 312,000 |
| | $6,000-$2,500,000 | Appraised value | | $ | 317,300 |
| | $38,000 - $2,066,000 |
| Real estate owned | Appraised value | | $ | 342,300 |
| | $21,500-$1,800,000 | Appraised value | | $ | 355,200 |
| | $4,500 - $2,000,000 |
|
| | |
E*TRADE | Q3 2017 10-Q | | 56 |
E*TRADE Q3 2018 10-Q | Page 62
E*TRADE FINANCIAL CORPORATION
NOTES TO THE CONDENSED CONSOLIDATED FINANCIAL STATEMENTS (UNAUDITED)
Recurring and Nonrecurring Fair Value Measurements
AssetsThe following tables presents the significant components of assets and liabilities measured at fair value at September 30, 2017 and December 31, 2016 are summarized in the following tables (dollars in millions): |
| | | | | | | | | | | | | | | |
| | Level 1 | | Level 2 | | Level 3 | | Total Fair Value |
| September 30, 2018: | | | | | | | |
| Recurring fair value measurements: | | | | | | | |
| Assets | | | | | | | |
| Available-for-sale securities: | | | | | | | |
| Agency mortgage-backed securities | $ | — |
| | $ | 21,639 |
| | $ | — |
| | $ | 21,639 |
|
| Agency debentures | — |
| | 1,069 |
| | — |
| | 1,069 |
|
| Agency debt securities | — |
| | 142 |
| | — |
| | 142 |
|
| Municipal bonds | — |
| | 12 |
| | — |
| | 12 |
|
| Other | — |
| | 2 |
| | — |
| | 2 |
|
| Total available-for-sale securities | — |
| | 22,864 |
| | — |
| | 22,864 |
|
| Other assets: | | | | | | | |
Derivative assets(1) | — |
| | 11 |
| | — |
| | 11 |
|
Publicly traded equity securities(2) | 7 |
| | — |
| | — |
| | 7 |
|
Total assets measured at fair value on a recurring basis(3) | $ | 7 |
| | $ | 22,875 |
| | $ | — |
| | $ | 22,882 |
|
| Nonrecurring fair value measurements: | | | | | | | |
| Loans receivable, net: | | | | | | | |
| One- to four-family | $ | — |
| | $ | — |
| | $ | 16 |
| | $ | 16 |
|
| Home equity | — |
| | — |
| | 5 |
| | 5 |
|
| Total loans receivable | — |
| | — |
| | 21 |
| | 21 |
|
| Other assets: | | | | | | | |
| Real estate owned | — |
| | — |
| | 11 |
| | 11 |
|
Total assets measured at fair value on a nonrecurring basis(4) | $ | — |
| | $ | — |
| | $ | 32 |
| | $ | 32 |
|
| |
| (1) | All derivative assets were interest rate contracts at September 30, 2018. Information related to derivative instruments is detailed in Note 8—Derivative Instruments and Hedging Activities. |
| |
| (2) | Consists of investments in a mutual fund related to the CRA. At September 30, 2018, these equity securities are included in other assets on the consolidated balance sheet as a result of the adoption of amended accounting guidance. See Note 1—Organization, Basis of Presentation and Summary of Significant Accounting Policies for additional information. |
| |
| (3) | Assets measured at fair value on a recurring basis represented 35% of the Company’s total assets at September 30, 2018. |
| |
| (4) | Represents the fair value of assets prior to deducting estimated selling costs that were carried on the consolidated balance sheet at September 30, 2018, and for which a fair value measurement was recorded during the period. |
|
| | | | | | | | | | | | | | | |
| | Level 1 | | Level 2 | | Level 3 | | Total Fair Value |
| September 30, 2017: | | | | | | | |
| Recurring fair value measurements: | | | | | | | |
| Assets | | | | | | | |
| Available-for-sale securities: | | | | | | | |
| Debt securities: | | | | | | | |
| Agency mortgage-backed securities | $ | — |
| | $ | 17,663 |
| | $ | — |
| | $ | 17,663 |
|
| Agency debentures | — |
| | 989 |
| | — |
| | 989 |
|
| U.S. Treasuries | — |
| | 450 |
| | — |
| | 450 |
|
| Agency debt securities | — |
| | 33 |
| | — |
| | 33 |
|
| Municipal bonds | — |
| | 31 |
| | — |
| | 31 |
|
| Total debt securities | — |
| | 19,166 |
| | — |
| | 19,166 |
|
| Publicly traded equity securities | 7 |
| | — |
| | — |
| | 7 |
|
| Total available-for-sale securities | 7 |
| | 19,166 |
| | — |
| | 19,173 |
|
| Receivables from brokers, dealers and clearing organizations: | | | | | | | |
| U.S. Treasuries | 200 |
| | — |
| | — |
| | 200 |
|
| Other assets: | | | | | | | |
Derivative assets(1) | — |
| | 92 |
| | — |
| | 92 |
|
Total assets measured at fair value on a recurring basis(2) | $ | 207 |
| | $ | 19,258 |
| | $ | — |
| | $ | 19,465 |
|
| Liabilities | | | | | | | |
| Other liabilities: | | | | | | | |
Derivative liabilities(1) | $ | — |
| | $ | 37 |
| | $ | — |
| | $ | 37 |
|
Total liabilities measured at fair value on a recurring basis(2) | $ | — |
| | $ | 37 |
| | $ | — |
| | $ | 37 |
|
| Nonrecurring fair value measurements: | | | | | | | |
| Loans receivable, net: | | | | | | | |
| One- to four-family | $ | — |
| | $ | — |
| | $ | 19 |
| | $ | 19 |
|
| Home equity | — |
| | — |
| | 18 |
| | 18 |
|
| Total loans receivable | — |
| | — |
| | 37 |
| | 37 |
|
| Other assets: | | | | | | | |
| Real estate owned | — |
| | — |
| | 23 |
| | 23 |
|
Total assets measured at fair value on a nonrecurring basis(3) | $ | — |
| | $ | — |
| | $ | 60 |
| | $ | 60 |
|
E*TRADE Q3 2018 10-Q | Page 63
E*TRADE FINANCIAL CORPORATION
NOTES TO THE CONDENSED CONSOLIDATED FINANCIAL STATEMENTS (UNAUDITED)
|
| | | | | | | | | | | | | | | |
| | Level 1 | | Level 2 | | Level 3 | | Total Fair Value |
| December 31, 2017: | | | | | | | |
| Recurring fair value measurements: | | | | | | | |
| Assets | | | | | | | |
| Available-for-sale securities: | | | | | | | |
| Debt securities: | | | | | | | |
| Agency mortgage-backed securities | $ | — |
| | $ | 19,195 |
| | $ | — |
| | $ | 19,195 |
|
| Agency debentures | — |
| | 966 |
| | — |
| | 966 |
|
| US Treasuries | — |
| | 458 |
| | — |
| | 458 |
|
| Agency debt securities | — |
| | 33 |
| | — |
| | 33 |
|
| Municipal bonds | — |
| | 20 |
| | — |
| | 20 |
|
| Total debt securities | — |
| | 20,672 |
| | — |
| | 20,672 |
|
| Publicly traded equity securities | 7 |
| | — |
| | — |
| | 7 |
|
| Total available-for-sale securities | 7 |
| | 20,672 |
| | — |
| | 20,679 |
|
| Receivables from brokers, dealers and clearing organizations: | | | | | | | |
| US Treasuries | 300 |
| | — |
| | — |
| | 300 |
|
| Other assets: | | | | | | | |
Derivative assets(1) | — |
| | 131 |
| | — |
| | 131 |
|
Total assets measured at fair value on a recurring basis(2) | $ | 307 |
| | $ | 20,803 |
| | $ | — |
| | $ | 21,110 |
|
| Liabilities | | | | | | | |
| Other liabilities: | | | | | | | |
Derivative liabilities(1) | $ | — |
| | $ | 14 |
| | $ | — |
| | $ | 14 |
|
Total liabilities measured at fair value on a recurring basis(2) | $ | — |
| | $ | 14 |
| | $ | — |
| | $ | 14 |
|
| Nonrecurring fair value measurements: | | | | | | | |
| Loans receivable, net: | | | | | | | |
| One- to four-family | $ | — |
| | $ | — |
| | $ | 22 |
| | $ | 22 |
|
| Home equity | — |
| | — |
| | 13 |
| | 13 |
|
| Total loans receivable | — |
| | — |
| | 35 |
| | 35 |
|
| Other assets: | | | | | | | |
| Loans held-for-sale | — |
| | 17 |
| | — |
| | 17 |
|
| Real estate owned | — |
| | — |
| | 26 |
| | 26 |
|
Total assets measured at fair value on a nonrecurring basis(3) | $ | — |
| | $ | 17 |
| | $ | 61 |
| | $ | 78 |
|
| |
| (1) | All derivative assets and liabilities were interest rate contracts at September 30,December 31, 2017. Information related to derivative instruments is detailed in Note 7—8—Derivative Instruments and Hedging Activities. |
| |
| (2) | Assets and liabilities measured at fair value on a recurring basis represented 32% and less than 1% of the Company’s total assets and total liabilities, respectively, at September 30, 2017. |
| |
(3) | Represents the fair value of assets prior to deducting estimated selling costs that were carried on the consolidated balance sheet at September 30, 2017, and for which a fair value measurement was recorded during the period. |
|
| | |
E*TRADE | Q3 2017 10-Q | | 57 |
|
| | | | | | | | | | | | | | | |
| | Level 1 | | Level 2 | | Level 3 | | Total Fair Value |
| December 31, 2016: | | | | | | | |
| Recurring fair value measurements: | | | | | | | |
| Assets | | | | | | | |
| Available-for-sale securities: | | | | | | | |
| Debt securities: | | | | | | | |
| Agency mortgage-backed securities | $ | — |
| | $ | 12,634 |
| | $ | — |
| | $ | 12,634 |
|
| Agency debentures | — |
| | 788 |
| | — |
| | 788 |
|
| U.S. Treasuries | — |
| | 407 |
| | — |
| | 407 |
|
| Agency debt securities | — |
| | 24 |
| | — |
| | 24 |
|
| Municipal bonds | — |
| | 32 |
| | — |
| | 32 |
|
| Total debt securities | — |
| | 13,885 |
| | — |
| | 13,885 |
|
| Publicly traded equity securities | 7 |
| | — |
| | — |
| | 7 |
|
| Total available-for-sale securities | 7 |
| | 13,885 |
| | — |
| | 13,892 |
|
| Other assets: | | | | | | | |
Derivative assets(1) | — |
| | 165 |
| | — |
| | 165 |
|
Total assets measured at fair value on a recurring basis(2) | $ | 7 |
| | $ | 14,050 |
| | $ | — |
| | $ | 14,057 |
|
| Liabilities | | | | | | | |
| Other liabilities: | | | | | | | |
Derivative liabilities(1) | $ | — |
| | $ | 31 |
| | $ | — |
| | $ | 31 |
|
Total liabilities measured at fair value on a recurring basis(2) | $ | — |
| | $ | 31 |
| | $ | — |
| | $ | 31 |
|
| Nonrecurring fair value measurements: | | | | | | | |
| Loans receivable, net: | | | | | | | |
| One- to four-family | $ | — |
| | $ | — |
| | $ | 25 |
| | $ | 25 |
|
| Home equity | — |
| | — |
| | 21 |
| | 21 |
|
| Total loans receivable | — |
| | — |
| | 46 |
| | 46 |
|
| Other assets: | | | | | | | |
| Real estate owned | — |
| | — |
| | 35 |
| | 35 |
|
Total assets measured at fair value on a nonrecurring basis(3) | $ | — |
| | $ | — |
| | $ | 81 |
| | $ | 81 |
|
| |
(1) | All derivative assets and liabilities were interest rate contracts at December 31, 2016. Information related to derivative instruments is detailed in Note 7—Derivative Instruments and Hedging Activities.
|
| |
(2) | Assets and liabilities measured at fair value on a recurring basis represented 29%33% and less than 1% of the Company’s total assets and total liabilities, respectively, at December 31, 2016.2017. |
| |
| (3) | Represents the fair value of assets prior to deducting estimated selling costs that were carried on the consolidated balance sheet at December 31, 2016,2017, and for which a fair value measurement was recorded during the period. |
|
| | |
E*TRADE | Q3 2017 10-Q | | 58 |
E*TRADE Q3 2018 10-Q | Page 64
E*TRADE FINANCIAL CORPORATION
NOTES TO THE CONDENSED CONSOLIDATED FINANCIAL STATEMENTS (UNAUDITED)
The following table presents gains and losses recognized on assets measured at fair value on a nonrecurring basis during the three and nine months ended September 30, 2017 and 2016 (dollars in millions): |
| | | | | | | | | | | | | | | |
| | Three Months Ended September 30, | | Nine Months Ended September 30, |
| | 2017 | | 2016 | | 2017 | | 2016 |
| One- to four-family | $ | 1 |
| | $ | 1 |
| | $ | 3 |
| | $ | 3 |
|
| Home equity | — |
| | 2 |
| | 3 |
| | 9 |
|
| Total losses on loans receivable measured at fair value | $ | 1 |
| | $ | 3 |
| | $ | 6 |
| | $ | 12 |
|
| Gains on real estate owned measured at fair value | $ | (1 | ) | | $ | (1 | ) | | $ | (1 | ) | | $ | — |
|
Transfers Between Levels 1, 2 and 3
For assets and liabilities measured at fair value on a recurring basis, the Company’s transfers between levels of the fair value hierarchy are deemed to have occurred at the beginning of the reporting period on a quarterly basis. The Company had no transfers between levels during the nine months ended September 30, 2017 and 2016. |
| | | | | | | | | | | | | | | |
| | Three Months Ended September 30, | | Nine Months Ended September 30, |
| | 2018 | | 2017 | | 2018 | | 2017 |
| One- to four-family | $ | — |
| | $ | 1 |
| | $ | 2 |
| | $ | 3 |
|
| Home equity | — |
| | — |
| | — |
| | 3 |
|
| Total losses on loans receivable measured at fair value | $ | — |
| | $ | 1 |
| | $ | 2 |
| | $ | 6 |
|
| Gains on real estate owned measured at fair value | $ | — |
| | $ | (1 | ) | | $ | (1 | ) | | $ | (1 | ) |
Recurring Fair Value Measurements Categorized within Level 3
For the periods presented,As of September 30, 2018 and December 31, 2017, no assets or liabilities measured at fair value on a recurring basis were categorized within Level 3 of the fair value hierarchy. The Company had no transfers between levels during the nine months ended September 30, 2018 and 2017.
|
| | |
E*TRADE | Q3 2017 10-Q | | 59 |
E*TRADE Q3 2018 10-Q | Page 65
E*TRADE FINANCIAL CORPORATION
NOTES TO THE CONDENSED CONSOLIDATED FINANCIAL STATEMENTS (UNAUDITED)
Fair Value of Financial Instruments Not Carried at Fair Value
The following table summarizespresents the carrying values, fair values and fair value hierarchy level classification of financial instruments that are not carried at fair value on the consolidated balance sheet at September 30, 2017 and December 31, 2016 (dollars in millions): | | | | September 30, 2017 | September 30, 2018 |
| | Carrying Value | | Level 1 | | Level 2 | | Level 3 | | Total Fair Value | Carrying Value | | Level 1 | | Level 2 | | Level 3 | | Total Fair Value |
| Assets | | | | | | | | | | | | | | | | | | |
| Cash and equivalents | $ | 896 |
| | $ | 896 |
| | $ | — |
| | $ | — |
| | $ | 896 |
| $ | 596 |
| | $ | 596 |
| | $ | — |
| | $ | — |
| | $ | 596 |
|
| Cash required to be segregated under federal or other regulations | $ | 696 |
| | $ | 696 |
| | $ | — |
| | $ | — |
| | $ | 696 |
| $ | 856 |
| | $ | 856 |
| | $ | — |
| | $ | — |
| | $ | 856 |
|
| Held-to-maturity securities: | | | | | | | | | | | | | | | | | | |
| Agency mortgage-backed securities | $ | 19,850 |
| | $ | — |
| | $ | 19,893 |
| | $ | — |
| | $ | 19,893 |
| $ | 18,427 |
| | $ | — |
| | $ | 17,836 |
| | $ | — |
| | $ | 17,836 |
|
| Agency debentures | 400 |
| | — |
| | 398 |
| | — |
| | 398 |
| 1,564 |
| | — |
| | 1,532 |
| | — |
| | 1,532 |
|
| Agency debt securities | 2,658 |
| | — |
| | 2,660 |
| | — |
| | 2,660 |
| 2,035 |
| | — |
| | 1,953 |
| | — |
| | 1,953 |
|
| Other | 12 |
| | — |
| | — |
| | 12 |
| | 12 |
| |
| Total held-to-maturity securities | $ | 22,920 |
| | $ | — |
| | $ | 22,951 |
| | $ | 12 |
| | $ | 22,963 |
| $ | 22,026 |
| | $ | — |
| | $ | 21,321 |
| | $ | — |
| | $ | 21,321 |
|
Margin receivables(1) | $ | 8,535 |
| | $ | — |
| | $ | 8,535 |
| | $ | — |
| | $ | 8,535 |
| $ | 11,184 |
| | $ | — |
| | $ | 11,184 |
| | $ | — |
| | $ | 11,184 |
|
| Loans receivable, net: | | | | | | | | | | | | | | | | | | |
| One- to four-family | $ | 1,520 |
| | $ | — |
| | $ | — |
| | $ | 1,576 |
| | $ | 1,576 |
| $ | 1,145 |
| | $ | — |
| | $ | — |
| | $ | 1,170 |
| | $ | 1,170 |
|
| Home equity | 1,127 |
| | — |
| | — |
| | 1,133 |
| | 1,133 |
| 863 |
| | — |
| | — |
| | 879 |
| | 879 |
|
| Consumer and other | 191 |
| | — |
| | — |
| | 193 |
| | 193 |
| 243 |
| | — |
| | — |
| | 240 |
| | 240 |
|
Total loans receivable, net(2) | $ | 2,838 |
| | $ | — |
| | $ | — |
| | $ | 2,902 |
| | $ | 2,902 |
| $ | 2,251 |
|
| $ | — |
| | $ | — |
| | $ | 2,289 |
| | $ | 2,289 |
|
Receivables from brokers, dealers and clearing organizations(1) | $ | 908 |
| | $ | — |
| | $ | 908 |
| | $ | — |
| | $ | 908 |
| $ | 786 |
| | $ | — |
| | $ | 786 |
| | $ | — |
| | $ | 786 |
|
Other assets(1)(3) | | $ | 42 |
| | $ | — |
| | $ | 42 |
| | $ | — |
| | $ | 42 |
|
| Liabilities | | | | | | | | | | | | | | | | | | |
| Deposits | $ | 41,543 |
| | $ | — |
| | $ | 41,543 |
| | $ | — |
| | $ | 41,543 |
| $ | 43,074 |
| | $ | — |
| | $ | 43,073 |
| | $ | — |
| | $ | 43,073 |
|
| Customer payables | $ | 8,716 |
| | $ | — |
| | $ | 8,716 |
| | $ | — |
| | $ | 8,716 |
| $ | 10,534 |
| | $ | — |
| | $ | 10,534 |
| | $ | — |
| | $ | 10,534 |
|
| Payables to brokers, dealers and clearing organizations | $ | 1,392 |
| | $ | — |
| | $ | 1,392 |
| | $ | — |
| | $ | 1,392 |
| $ | 1,845 |
| | $ | — |
| | $ | 1,845 |
| | $ | — |
| | $ | 1,845 |
|
| Other borrowings: | | | | | | | | | | |
| FHLB advances | $ | 200 |
| | $ | — |
| | $ | 200 |
| | $ | — |
| | $ | 200 |
| |
| Trust preferred securities | $ | 409 |
| | $ | — |
| | $ | — |
| | $ | 315 |
| | $ | 315 |
| |
| Total other borrowings | $ | 609 |
|
| $ | — |
|
| $ | 200 |
|
| $ | 315 |
|
| $ | 515 |
| |
| Other borrowings | | $ | 550 |
| | $ | — |
| | $ | 550 |
| | $ | — |
| | $ | 550 |
|
| Corporate debt | $ | 991 |
| | $ | — |
| | $ | 1,004 |
| | $ | — |
| | $ | 1,004 |
| $ | 1,408 |
| | $ | — |
| | $ | 1,379 |
| | $ | — |
| | $ | 1,379 |
|
| |
| (1) | The fair value of securities that the Company received as collateral in connection with margin receivables and securities borrowing activities, including the fully paid lending program, where the Company is permitted to sell or re-pledge the securities, was approximately $11.9$15.3 billion at September 30, 2017.2018. Of this amount, $3.1$3.8 billion had been pledged or sold in connection with securities loaned and deposits with clearing organizations at September 30, 2017.2018. |
| |
| (2) | The carrying value of loans receivable, net includes the allowance for loan losses of $94$41 million and loans that are recorded at fair value on a nonrecurring basis at September 30, 2017.2018. |
| |
| (3) | The $42 million in other assets at September 30, 2018 represents securities borrowing from customers under the fully paid lending program. |
|
| | |
E*TRADE | Q3 2017 10-Q | | 60 |
E*TRADE Q3 2018 10-Q | Page 66
E*TRADE FINANCIAL CORPORATION
NOTES TO THE CONDENSED CONSOLIDATED FINANCIAL STATEMENTS (UNAUDITED)
| | | | December 31, 2016 | December 31, 2017 |
| | Carrying Value | | Level 1 | | Level 2 | | Level 3 | | Total Fair Value | Carrying Value | | Level 1 | | Level 2 | | Level 3 | | Total Fair Value |
| Assets | | | | | | | | | | | | | | | | | | |
| Cash and equivalents | $ | 1,950 |
| | $ | 1,950 |
| | $ | — |
| | $ | — |
| | $ | 1,950 |
| $ | 931 |
| | $ | 931 |
| | $ | — |
| | $ | — |
| | $ | 931 |
|
| Cash required to be segregated under federal or other regulations | $ | 1,460 |
| | $ | 1,460 |
| | $ | — |
| | $ | — |
| | $ | 1,460 |
| $ | 872 |
| | $ | 872 |
| | $ | — |
| | $ | — |
| | $ | 872 |
|
| Held-to-maturity securities: | | | | | | | | | | | | | | | | | | |
| Agency mortgage-backed securities | $ | 12,868 |
| | $ | — |
| | $ | 12,839 |
| | $ | — |
| | $ | 12,839 |
| $ | 20,502 |
| | $ | — |
| | $ | 20,404 |
| | $ | — |
| | $ | 20,404 |
|
| Agency debentures | 29 |
| | — |
| | 29 |
| | — |
| | 29 |
| 710 |
| | — |
| | 708 |
| | — |
| | 708 |
|
| Agency debt securities | 2,854 |
| | — |
| | 2,848 |
| | — |
| | 2,848 |
| 2,615 |
| | — |
| | 2,595 |
| | — |
| | 2,595 |
|
| Other | | 12 |
| | — |
| | — |
| | 12 |
| | 12 |
|
| Total held-to-maturity securities | $ | 15,751 |
| | $ | — |
| | $ | 15,716 |
| | $ | — |
| | $ | 15,716 |
| $ | 23,839 |
| | $ | — |
| | $ | 23,707 |
| | $ | 12 |
| | $ | 23,719 |
|
Margin receivables(1) | $ | 6,731 |
| | $ | — |
| | $ | 6,731 |
| | $ | — |
| | $ | 6,731 |
| $ | 9,071 |
| | $ | — |
| | $ | 9,071 |
| | $ | — |
| | $ | 9,071 |
|
| Loans receivable, net: | | | | | | | | | | | | | | | | | | |
| One- to four-family | $ | 1,918 |
| | $ | — |
| | $ | — |
| | $ | 1,942 |
| | $ | 1,942 |
| $ | 1,417 |
| | $ | — |
| | $ | — |
| | $ | 1,463 |
| | $ | 1,463 |
|
| Home equity | 1,385 |
| | — |
| | — |
| | 1,311 |
| | 1,311 |
| 1,051 |
| | — |
| | — |
| | 1,055 |
| | 1,055 |
|
| Consumer and other | 248 |
| | — |
| | — |
| | 249 |
| | 249 |
| 186 |
| | — |
| | — |
| | 187 |
| | 187 |
|
Total loans receivable, net(2) | $ | 3,551 |
| | $ | — |
| | $ | — |
| | $ | 3,502 |
| | $ | 3,502 |
| $ | 2,654 |
| | $ | — |
| | $ | — |
| | $ | 2,705 |
| | $ | 2,705 |
|
| Receivables from brokers, dealers and clearing organizations | $ | 1,056 |
| | $ | — |
| | $ | 1,056 |
| | $ | — |
| | $ | 1,056 |
| |
Receivables from brokers, dealers and clearing organizations(1) | | $ | 878 |
| | $ | — |
| | $ | 878 |
| | $ | — |
| | $ | 878 |
|
Other assets(1)(3) | | $ | 18 |
| | $ | — |
| | $ | 18 |
| | $ | — |
| | $ | 18 |
|
| Liabilities | | | | | | | | | | | | | | | | | | |
| Deposits | $ | 31,682 |
| | $ | — |
| | $ | 31,681 |
| | $ | — |
| | $ | 31,681 |
| $ | 42,742 |
| | $ | — |
| | $ | 42,741 |
| | $ | — |
| | $ | 42,741 |
|
| Customer Payables | $ | 8,159 |
| | $ | — |
| | $ | 8,159 |
| | $ | — |
| | $ | 8,159 |
| $ | 9,449 |
| | $ | — |
| | $ | 9,449 |
| | $ | — |
| | $ | 9,449 |
|
| Payables to brokers, dealers and clearing organizations | $ | 983 |
| | $ | — |
| | $ | 983 |
| | $ | — |
| | $ | 983 |
| $ | 1,542 |
| | $ | — |
| | $ | 1,542 |
| | $ | — |
| | $ | 1,542 |
|
| Other borrowings: | | | | | | | | | | |
| FHLB advances | | $ | 500 |
| | $ | — |
| | $ | 500 |
| | $ | — |
| | $ | 500 |
|
| Trust preferred securities | $ | 409 |
| | $ | — |
| | $ | — |
| | $ | 288 |
| | $ | 288 |
| $ | 410 |
| | $ | — |
| | $ | — |
| | $ | 379 |
| | $ | 379 |
|
| Total other borrowings | | $ | 910 |
|
| $ | — |
|
| $ | 500 |
|
| $ | 379 |
|
| $ | 879 |
|
| Corporate debt | $ | 994 |
| | $ | — |
| | $ | 1,050 |
| | $ | — |
| | $ | 1,050 |
| $ | 991 |
| | $ | — |
| | $ | 992 |
| | $ | — |
| | $ | 992 |
|
| |
| (1) | The fair value of securities that the Company received as collateral in connection with margin receivables and securities borrowing activities, where the Company is permitted to sell or re-pledge the securities, was approximately $9.8$12.8 billion at December 31, 2016.2017. Of this amount, $2.0$3.2 billion had been pledged or sold in connection with securities loaned and deposits with clearing organizations at December 31, 2016.2017. |
| |
| (2) | The carrying value of loans receivable, net includes the allowance for loan losses of $221$74 million and loans that are recorded at fair value on a nonrecurring basis at December 31, 2016.2017. |
| |
| (3) | The $18 million in other assets at December 31, 2017 represents securities borrowing from customers under the fully paid lending program. |
E*TRADE Q3 2018 10-Q | Page 67
E*TRADE FINANCIAL CORPORATION
NOTES TO THE CONDENSED CONSOLIDATED FINANCIAL STATEMENTS (UNAUDITED)
The fair value measurement techniques for financial instruments not carried at fair value on the consolidated balance sheet at September 30, 2017 and December 31, 2016 are summarized as follows:
Cash and equivalents, cash required to be segregated under federal or other regulations, margin receivables, receivables from brokers, dealers and clearing organizations, other assets, customer payables and payables to brokers, dealers and clearing organizations—Due to their short term nature, fair value is estimated to be carrying value.
Held-to-maturity securities—The held-to-maturity securities portfolio included agency mortgage-backed securities, agency debentures, agency debt securities, and other debt securities. The fairFair value of held-to-maturity securities is determined consistentlyin a manner consistent with the pricing of available-for-sale securities described above.
Loans receivable, net—Fair value is estimated using a discounted cash flow model. Loans are differentiated based on their individual portfolio characteristics, such as product classification, loan category and pricing features. Assumptions for expected losses, prepayments, cash flows and discount rates are adjusted to reflect the individual characteristics of the loans, such as credit risk, coupon, lien position, and payment characteristics, as well as the secondary market conditions for these types of loans.
|
| | |
E*TRADE | Q3 2017 10-Q | | 61 |
Credit receivables, included in Consumer and other, is estimated to be carrying value consistent with the Company's valuation of margin receivables.
Although the market for one- to four-family and home equity loan portfolios has improved, given the lack of observability of valuation inputs, these fair value measurements cannot be determined with precision and changes in the underlying assumptions used, including discount rates, could significantly affect the results of current or future fair value estimates. In addition, the amount that would be realized in a forced liquidation, an actual sale or immediate settlement could be lower than both the carrying value and the estimated fair value of the portfolio.
Deposits—ForFair value of certificates of deposit fair value is estimated using a discounted cash flow model. For the remainder of deposits, fair value is the amount payable on demand at the reporting date.
FHLB advances—Fair value for FHLB advances was determined by discounting future cash flows using discount factors derived from current observable rates implied for other similar instruments with similar remaining maturities.
Trust preferred securities—For subordinated debentures, fairFair value iswas estimated by discounting future cash flows at the yield implied by dealer pricing quotes. See Note 10—Other Borrowings, Note 11—Corporate Debt and Note 15—Commitments, Contingencies and Other Regulatory Matters.
Corporate debt—For interest-bearing corporate debt, fairFair value is estimated using dealer pricing quotes.
Fair Value of Commitments and Contingencies
In the normal course of business, the Company makes various commitments to extend credit and incur contingent liabilities that are not reflected in the consolidated balance sheet. Changes in the economy or interest rates may influence the impact that these commitments and contingencies have on the Company in the future. The Company does not estimate the fair value of those commitments. The Company has the right to cancel these commitments in certain circumstances and has closed a significant amount of customer HELOCs in the past ten years. Information related to such commitments and contingent liabilities is included in Note 14—15—Commitments, Contingencies and Other Regulatory Matters.Matters.
|
| | |
E*TRADE | Q3 2017 10-Q | | 62 |
E*TRADE Q3 2018 10-Q | Page 68
E*TRADE FINANCIAL CORPORATION
NOTES TO THE CONDENSED CONSOLIDATED FINANCIAL STATEMENTS (UNAUDITED)
NOTE 4—OFFSETTING ASSETS AND LIABILITIES |
|
| NOTE 5—OFFSETTING ASSETS AND LIABILITIES |
For financial statement purposes, the Company does not offset derivative instruments or securities borrowing and securities lending transactions. These activities are generally transacted under master agreements that are widely used by counterparties and that may allow for net settlements of payments in the normal course, as well as offsetting of all contracts with a given counterparty in the event of bankruptcy or default of one of the two parties to the transaction. The following table presents information about thesethe Company's derivative instruments, securities borrowing and securities lending transactions which are transacted under master agreements to enable the users of the Company’s consolidated financial statements to evaluate the potential effect of rights of set-off between these recognized assets and liabilities at September 30, 2017 and December 31, 2016 (dollars in millions):
|
| | | | | | | | | | | | | | | | | | | | | | | | | | |
| | | | | | | | | | | Gross Amounts Not Offset in the Consolidated Balance Sheet | | |
| | | | | Gross Amounts of Recognized Assets and Liabilities | | Gross Amounts Offset in the Consolidated Balance Sheet | | Net Amounts Presented in the Consolidated Balance Sheet (1) | | Financial Instruments | | Collateral Received or Pledged (Including Cash) | | Net Amount |
| September 30, 2017 | | | | | | | | | | | |
| | Assets: | | | | | | | | | | | |
| | | Deposits paid for securities borrowed (2) | $ | 484 |
| | $ | — |
| | $ | 484 |
| | $ | (200 | ) | | $ | (273 | ) | | $ | 11 |
|
| | | | Total | $ | 484 |
| | $ | — |
| | $ | 484 |
| | $ | (200 | ) | | $ | (273 | ) | | $ | 11 |
|
| | | | | | | | | | | | | | | |
| | Liabilities: | | | | | | | | | | | |
| | | Deposits received for securities loaned (3) | $ | 1,348 |
| | $ | — |
| | $ | 1,348 |
| | $ | (200 | ) | | $ | (1,049 | ) | | $ | 99 |
|
| | | Derivative liabilities (4)(5) | 7 |
| | — |
| | 7 |
| | — |
| | (7 | ) | | — |
|
| | | | Total | $ | 1,355 |
| | $ | — |
| | $ | 1,355 |
| | $ | (200 | ) | | $ | (1,056 | ) | | $ | 99 |
|
| | | | | | | | | | | | | | | |
| December 31, 2016 | | | | | | | | | | | |
| | Assets: | | | | | | | | | | | |
| | | Deposits paid for securities borrowed (2) | $ | 774 |
| | $ | — |
| | $ | 774 |
| | $ | (192 | ) | | $ | (560 | ) | | $ | 22 |
|
| | | | Total | $ | 774 |
| | $ | — |
| | $ | 774 |
| | $ | (192 | ) | | $ | (560 | ) | | $ | 22 |
|
| | | | | | | | | | | | | | | |
| | Liabilities: | | | | | | | | | | | |
| | | Deposits received for securities loaned (3) | $ | 926 |
| | $ | — |
| | $ | 926 |
| | $ | (192 | ) | | $ | (661 | ) | | $ | 73 |
|
| | | Derivative liabilities (4)(5) | 6 |
| | — |
| | 6 |
| | — |
| | (6 | ) | | — |
|
| | | | Total | $ | 932 |
| | $ | — |
| | $ | 932 |
| | $ | (192 | ) | | $ | (667 | ) | | $ | 73 |
|
|
| | | | | | | | | | | | | | | | | | | | | | | | | | |
| | | | | | | | | | | Gross Amounts Not Offset in the Consolidated Balance Sheet | | |
| | | | | Gross Amounts of Recognized Assets and Liabilities | | Gross Amounts Offset in the Consolidated Balance Sheet | | Net Amounts Presented in the Consolidated Balance Sheet (1) | | Financial Instruments | | Collateral Received or Pledged (Including Cash) | | Net Amount |
| September 30, 2018 | | | | | | | | | | | |
| | Assets: | | | | | | | | | | | |
| | | Deposits paid for securities borrowed (2) | $ | 363 |
| | $ | — |
| | $ | 363 |
| | $ | (109 | ) | | $ | (239 | ) | | $ | 15 |
|
| | | Derivative assets (3) | 11 |
| | — |
| | 11 |
| | — |
| | (5 | ) | | 6 |
|
| | | | Total | $ | 374 |
| | $ | — |
| | $ | 374 |
| | $ | (109 | ) | | $ | (244 | ) | | $ | 21 |
|
| | | | | | | | | | | | | | | |
| | Liabilities: | | | | | | | | | | | |
| | | Deposits received for securities loaned (4) | $ | 1,794 |
| | $ | — |
| | $ | 1,794 |
| | $ | (109 | ) | | $ | (1,521 | ) | | $ | 164 |
|
| | | | Total | $ | 1,794 |
| | $ | — |
| | $ | 1,794 |
| | $ | (109 | ) | | $ | (1,521 | ) | | $ | 164 |
|
| | | | | | | | | | | | | | | |
| December 31, 2017 | | | | | | | | | | | |
| | Assets: | | | | | | | | | | | |
| | | Deposits paid for securities borrowed (2) | $ | 759 |
| | $ | — |
| | $ | 759 |
| | $ | (251 | ) | | $ | (483 | ) | | $ | 25 |
|
| | | | Total | $ | 759 |
| | $ | — |
| | $ | 759 |
| | $ | (251 | ) | | $ | (483 | ) | | $ | 25 |
|
| | | | | | | | | | | | | | | |
| | Liabilities: | | | | | | | | | | | |
| | | Deposits received for securities loaned (4) | $ | 1,373 |
| | $ | — |
| | $ | 1,373 |
| | $ | (251 | ) | | $ | (1,004 | ) | | $ | 118 |
|
| | | Derivative liabilities (5)(6) | 5 |
| | — |
| | 5 |
| | — |
| | (5 | ) | | — |
|
| | | | Total | $ | 1,378 |
| | $ | — |
| | $ | 1,378 |
| | $ | (251 | ) | | $ | (1,009 | ) | | $ | 118 |
|
| |
| (1) | NetThe vast majority of the net amount of deposits paid for securities borrowed are reflected in the receivables from brokers, dealers and clearing organizations line item while the deposits paid for securities borrowed under the fully paid lending program are reflected in other assets. Derivative assets are reflected in the other assets line item in the consolidated balance sheet. Net amount of depositsDeposits received for securities loaned and derivative liabilities are reflected in the payables to brokers, dealers and clearing organizations and other liabilities line itemsitem in the consolidated balance sheet, respectively.sheet. Derivative liabilities are reflected in the other liabilities line item in the consolidated balance sheet. |
E*TRADE Q3 2018 10-Q | Page 69
E*TRADE FINANCIAL CORPORATION
NOTES TO THE CONDENSED CONSOLIDATED FINANCIAL STATEMENTS (UNAUDITED)
| |
| (2) | Included in the gross amounts of deposits paid for securities borrowed was $257$227 million and $307$347 million at September 30, 20172018 and December 31, 2016,2017, respectively, transacted through a program with a clearing organization, which guarantees the return of cash to the Company. For presentation purposes, these amounts presented are based on the counterparties under the Company’s master securities loan agreements. |
|
| | |
E*TRADE | Q3 2017 10-Q | | 63 |
| |
| (3) | Collateral received included cash at September 30, 2018. |
| |
| (4) | Included in the gross amounts of deposits received for securities loaned was $801 million$1.2 billion and $546$821 million at September 30, 20172018 and December 31, 2016,2017, respectively, transacted through a program with a clearing organization, which guarantees the return of securities to the Company. For presentation purposes, these amounts presented are based on the counterparties under the Company’s master securities loan agreements. |
| |
(4)(5) | Excludes net accrued interest payable of $1 million at September 30, 2017 and $2 million at December 31, 2016, respectively.2017. |
| |
(5)(6) | Collateral pledged included held-to-maturity securities at amortized cost at both September 30, 2017 and December 31, 2016.2017. |
Securities Lending Transactions
Deposits paid for securities borrowed and deposits received for securities loaned are recorded at the amount of cash collateral advanced or received. Securities borrowing transactions require the Company to deposit cash with the lender whereas securities lending transactions result in the Company receiving collateral in the form of cash, with both requiring cash in an amount generally in excess of the market value of the securities. These transactions have overnight or continuous remaining contractual maturities.
Securities lending transactions expose the Company to counterparty credit risk and market risk. To manage the counterparty risk, the Company maintains internal standards for approving counterparties, reviews and analyzes the credit rating of each counterparty, and monitors its positions with each counterparty on an ongoing basis. In addition, for certain of the Company's securities lending transactions, the Company uses a program with a clearing organization that guarantees the return of securities.collateral. The Company monitors the market value of the securities borrowed and loaned using collateral arrangements that require additional collateral to be obtained from or excess collateral to be returned to the counterparties based on changes in market value, to maintain specified collateral levels.
Derivative Transactions
Certain types of derivatives that the Company utilizes in its hedging activities are subject to derivatives clearing agreements (cleared derivatives contracts) under the Dodd-Frank Act.. These cleared derivatives contracts enable clearing by a derivatives clearing organization through a clearing member. Under the contracts, the clearing member typically has a one-way right to offset all contracts in the event of the Company's default or bankruptcy. Collateral exchanged under these contracts is not included in the preceding table above as the contracts may not qualify as master netting agreements. At September 30, 2017See Note 8—Derivative Instruments and December 31, 2016, the Company had $92 million and $165 million, respectively, of cleared derivative contract assets. At September 30, 2017 and December 31, 2016, the Company had $30 million and $25 million, respectively, of cleared derivative contract liabilities.Hedging Activities for additional information.
In January 2017, a clearing organization through which the Company executes certain of its derivative contracts amended its rulebook to legally characterize variation margin payments as settlements of the derivatives' exposure rather than collateral against the exposure. For these contracts, amounts exchanged with counterparties are reflected as a reduction of the related derivative assets or liabilities, including accrued interest, on the consolidated balance sheet. At September 30, 2017, the Company had derivative assets and liabilities of $10 million and $20 million, respectively, excluding accrued interest, that were settled by variation margin payments and are therefore excluded from the table above.
|
| | |
E*TRADE | Q3 2017 10-Q | | 64 |
E*TRADE Q3 2018 10-Q | Page 70
E*TRADE FINANCIAL CORPORATION
NOTES TO THE CONDENSED CONSOLIDATED FINANCIAL STATEMENTS (UNAUDITED)
|
|
| NOTE 6—AVAILABLE-FOR-SALE AND HELD-TO-MATURITY SECURITIES |
The following table presents the amortized cost and fair value of available-for-sale and held-to-maturity securities at September 30, 2017 and December 31, 2016 are shown in the following tables (dollars in millions): | | | | Amortized Cost | | Gross Unrealized / Unrecognized Gains | | Gross Unrealized / Unrecognized Losses | | Fair Value | Amortized Cost | | Gross Unrealized / Unrecognized Gains | | Gross Unrealized / Unrecognized Losses | | Fair Value |
| September 30, 2017: | | | | | | | | |
| September 30, 2018: | | | | | | | | |
Available-for-sale securities:(1) | | | | | | | | |
| Agency mortgage-backed securities | | $ | 22,137 |
| | $ | 42 |
| | $ | (540 | ) | | $ | 21,639 |
|
| Agency debentures | | 1,072 |
| | 11 |
| | (14 | ) | | 1,069 |
|
| Agency debt securities | | 146 |
| | — |
| | (4 | ) | | 142 |
|
| Municipal bonds | | 13 |
| | — |
| | (1 | ) | | 12 |
|
| Other | | 2 |
| | — |
| | — |
| | 2 |
|
| Total available-for-sale securities | | $ | 23,370 |
| | $ | 53 |
| | $ | (559 | ) | | $ | 22,864 |
|
Held-to-maturity securities:(1) | | | | | | | | |
| Agency mortgage-backed securities | | $ | 18,427 |
| | $ | 7 |
| | $ | (598 | ) | | $ | 17,836 |
|
| Agency debentures | | 1,564 |
| | — |
| | (32 | ) | | 1,532 |
|
| Agency debt securities | | 2,035 |
| | 1 |
| | (83 | ) | | 1,953 |
|
| Total held-to-maturity securities | | $ | 22,026 |
| | $ | 8 |
| | $ | (713 | ) | | $ | 21,321 |
|
| | | | | | | | | |
| December 31, 2017: | |
| | | | | |
|
| Available-for-sale securities: | | | | | | | | | | | | | | |
| Debt securities: | | | | | | | | | | | | | | |
| Agency mortgage-backed securities | $ | 17,809 |
| | $ | 59 |
| | $ | (205 | ) | | $ | 17,663 |
| $ | 19,395 |
| | $ | 47 |
| | $ | (247 | ) | | $ | 19,195 |
|
| Agency debentures | 969 |
| | 34 |
| | (14 | ) | | 989 |
| 939 |
| | 39 |
| | (12 | ) | | 966 |
|
| U.S. Treasuries | 452 |
| | 6 |
| | (8 | ) | | 450 |
| |
| US Treasuries | | 452 |
| | 10 |
| | (4 | ) | | 458 |
|
| Agency debt securities | 34 |
| | — |
| | (1 | ) | | 33 |
| 34 |
| | — |
| | (1 | ) | | 33 |
|
| Municipal bonds | 31 |
| | — |
| | — |
| | 31 |
| 20 |
| | — |
| | — |
| | 20 |
|
| Total debt securities | 19,295 |
| | 99 |
| | (228 | ) | | 19,166 |
| 20,840 |
| | 96 |
| | (264 | ) | | 20,672 |
|
Publicly traded equity securities(1) | 7 |
| | — |
| | — |
| | 7 |
| |
Publicly traded equity securities(2) | | 7 |
| | — |
| | — |
| | 7 |
|
| Total available-for-sale securities | $ | 19,302 |
| | $ | 99 |
| | $ | (228 | ) | | $ | 19,173 |
| $ | 20,847 |
| | $ | 96 |
| | $ | (264 | ) | | $ | 20,679 |
|
| Held-to-maturity securities: | | | | | | | | | | | | | | |
| Agency mortgage-backed securities | $ | 19,850 |
| | $ | 155 |
| | $ | (112 | ) | | $ | 19,893 |
| $ | 20,502 |
| | $ | 95 |
| | $ | (193 | ) | | $ | 20,404 |
|
| Agency debentures | 400 |
| | — |
| | (2 | ) | | 398 |
| 710 |
| | — |
| | (2 | ) | | 708 |
|
| Agency debt securities | 2,658 |
| | 24 |
| | (22 | ) | | 2,660 |
| 2,615 |
| | 15 |
| | (35 | ) | | 2,595 |
|
| Other | 12 |
| | — |
| | — |
| | 12 |
| 12 |
| | — |
| | — |
| | 12 |
|
| Total held-to-maturity securities | $ | 22,920 |
| | $ | 179 |
| | $ | (136 | ) | | $ | 22,963 |
| $ | 23,839 |
| | $ | 110 |
| | $ | (230 | ) | | $ | 23,719 |
|
| | | | | | | | | |
| December 31, 2016: |
| | | | | |
| |
| Available-for-sale securities: | | | | | | | | |
| Debt securities: | | | | | | | | |
| Agency mortgage-backed securities | $ | 12,946 |
| | $ | 24 |
| | $ | (336 | ) | | $ | 12,634 |
| |
| Agency debentures | 791 |
| | 18 |
| | (21 | ) | | 788 |
| |
| U.S. Treasuries | 452 |
| | — |
| | (45 | ) | | 407 |
| |
| Agency debt securities | 25 |
| | — |
| | (1 | ) | | 24 |
| |
| Municipal bonds | 32 |
| | — |
| | — |
| | 32 |
| |
| Total debt securities | 14,246 |
| | 42 |
| | (403 | ) | | 13,885 |
| |
Publicly traded equity securities(1) | 7 |
| | — |
| | — |
| | 7 |
| |
| Total available-for-sale securities | $ | 14,253 |
| | $ | 42 |
| | $ | (403 | ) | | $ | 13,892 |
| |
| Held-to-maturity securities: | | | | | | | | |
| Agency mortgage-backed securities | $ | 12,868 |
| | $ | 123 |
| | $ | (152 | ) | | $ | 12,839 |
| |
| Agency debentures | 29 |
| | — |
| | — |
| | 29 |
| |
| Agency debt securities | 2,854 |
| | 26 |
| | (32 | ) | | 2,848 |
| |
| Total held-to-maturity securities | $ | 15,751 |
| | $ | 149 |
| | $ | (184 | ) | | $ | 15,716 |
| |
| |
| (1) | Securities with a carrying value of $4.7 billion and related unrealized pre-tax gain of $7 million were transferred from held-to-maturity securities to available-for-sale securities during the three months ended March 31, 2018, as part of a one-time transition election for early adopting the new derivatives and hedge accounting guidance. Securities with a fair value of $1.2 billion were transferred from available-for-sale securities to held-to-maturity securities during the three months ended March 31, 2018 pursuant to an evaluation of our investment strategy and an assessment by management about our intent and ability to |
E*TRADE Q3 2018 10-Q | Page 71
E*TRADE FINANCIAL CORPORATION
NOTES TO THE CONDENSED CONSOLIDATED FINANCIAL STATEMENTS (UNAUDITED)
hold those particular securities until maturity. See Note 12—Shareholders' Equity for information on the impact to accumulated other comprehensive income.
| |
| (2) | Consists of investments in a mutual fund related to the Community Reinvestment Act.CRA. At September 30, 2018, these equity securities are included in other assets on the consolidated balance sheet as a result of the adoption of amended accounting guidance related to the classification and measurement of financial instruments. See Note 1—Organization, Basis of Presentation and Summary of Significant Accounting Policies for additional information. |
|
| | |
E*TRADE | Q3 2017 10-Q | | 65 |
Contractual Maturities
The following table presents the contractual maturities of all available-for-sale and held-to-maturity debt securities at September 30, 2017 are shown in the following table (dollars in millions):
| | | | | | | September 30, 2018 |
| | Amortized Cost | | Fair Value | Amortized Cost | | Fair Value |
| Available-for-sale debt securities: | | | | | | |
| Due within one year | $ | 4 |
| | $ | 4 |
| $ | 5 |
| | $ | 5 |
|
| Due within one to five years | 121 |
| | 118 |
| 905 |
| | 881 |
|
| Due within five to ten years | 7,473 |
| | 7,418 |
| 9,278 |
| | 9,106 |
|
| Due after ten years | 11,697 |
| | 11,626 |
| 13,182 |
| | 12,872 |
|
| Total available-for-sale debt securities | $ | 19,295 |
| | $ | 19,166 |
| $ | 23,370 |
| | $ | 22,864 |
|
| Held-to-maturity debt securities: | | | | | | |
| Due within one year | $ | 214 |
| | $ | 214 |
| $ | 105 |
| | $ | 104 |
|
| Due within one to five years | 1,880 |
| | 1,913 |
| 1,635 |
| | 1,598 |
|
| Due within five to ten years | 5,418 |
| | 5,432 |
| 5,242 |
| | 5,055 |
|
| Due after ten years | 15,408 |
| | 15,404 |
| 15,044 |
| | 14,564 |
|
| Total held-to-maturity debt securities | $ | 22,920 |
| | $ | 22,963 |
| $ | 22,026 |
| | $ | 21,321 |
|
At September 30, 20172018 and December 31, 2016,2017, the Company had pledged $4.3$6.5 billion and $0.5$5.5 billion, respectively, of held-to-maturity debt securities, and $0.5$222 million and $6$352 million, respectively, of available-for-sale securities, respectively, for the same periods, as collateral for FHLB advances, derivatives and other purposes.
|
| | |
E*TRADE | Q3 2017 10-Q | | 66 |
E*TRADE Q3 2018 10-Q | Page 72
E*TRADE FINANCIAL CORPORATION
NOTES TO THE CONDENSED CONSOLIDATED FINANCIAL STATEMENTS (UNAUDITED)
Investments with Unrealized or Unrecognized Losses
The following tables showtable presents the fair value and unrealized or unrecognized losses on available-for-sale and held-to-maturity securities, aggregated by investment category, and the length of time that individual securities have been in a continuous unrealized or unrecognized loss position at September 30, 2017 and December 31, 2016 (dollars in millions):
| | | | Less than 12 Months | | 12 Months or More | | Total | Less than 12 Months | | 12 Months or More | | Total |
| | Fair Value | | Unrealized / Unrecognized Losses | | Fair Value | | Unrealized / Unrecognized Losses | | Fair Value | | Unrealized / Unrecognized Losses | Fair Value | | Unrealized / Unrecognized Losses | | Fair Value | | Unrealized / Unrecognized Losses | | Fair Value | | Unrealized / Unrecognized Losses |
| September 30, 2017: | | | | | | | | | | | | |
| September 30, 2018: | | | | | | | | | | | | |
| Available-for-sale securities: | | | | | | | | | | | | | | | | | | | | | | |
| Debt securities: | | | | | | | | | | | | |
| Agency mortgage-backed securities | $ | 7,282 |
| | $ | (117 | ) | | $ | 3,312 |
| | $ | (88 | ) | | $ | 10,594 |
| | $ | (205 | ) | $ | 10,753 |
| | $ | (185 | ) | | $ | 6,581 |
| | $ | (355 | ) | | $ | 17,334 |
| | $ | (540 | ) |
| Agency debentures | 161 |
| | (3 | ) | | 121 |
| | (11 | ) | | 282 |
| | (14 | ) | 418 |
| | (5 | ) | | 113 |
| | (9 | ) | | 531 |
| | (14 | ) |
| U.S. Treasuries | 289 |
| | (8 | ) | | — |
| | — |
| | 289 |
| | (8 | ) | |
| Agency debt securities | 33 |
| | (1 | ) | | — |
| | — |
| | 33 |
| | (1 | ) | 113 |
| | (2 | ) | | 29 |
| | (2 | ) | | 142 |
| | (4 | ) |
| Municipal bonds | 12 |
| | — |
| | — |
| | — |
| | 12 |
| | — |
| 3 |
| | — |
| | 9 |
| | (1 | ) | | 12 |
| | (1 | ) |
| Other | | 2 |
| | — |
| | — |
| | — |
| | 2 |
| | — |
|
| Total temporarily impaired available-for-sale securities | $ | 7,777 |
| | $ | (129 | ) | | $ | 3,433 |
| | $ | (99 | ) | | $ | 11,210 |
| | $ | (228 | ) | $ | 11,289 |
| | $ | (192 | ) | | $ | 6,732 |
| | $ | (367 | ) | | $ | 18,021 |
| | $ | (559 | ) |
| Held-to-maturity securities: | | | | | | | | | | | | | | | | | | | | | | |
| Agency mortgage-backed securities | $ | 8,309 |
| | $ | (78 | ) | | $ | 1,443 |
| | $ | (34 | ) | | $ | 9,752 |
| | $ | (112 | ) | $ | 10,041 |
| | $ | (253 | ) | | $ | 6,960 |
| | $ | (345 | ) | | $ | 17,001 |
| | $ | (598 | ) |
| Agency debentures | 302 |
| | (2 | ) | | — |
| | — |
| | 302 |
| | (2 | ) | 1,180 |
| | (17 | ) | | 353 |
| | (15 | ) | | 1,533 |
| | (32 | ) |
| Agency debt securities | 1,435 |
| | (20 | ) | | 65 |
| | (2 | ) | | 1,500 |
| | (22 | ) | 574 |
| | (15 | ) | | 1,273 |
| | (68 | ) | | 1,847 |
| | (83 | ) |
| Total temporarily impaired held-to-maturity securities | $ | 10,046 |
| | $ | (100 | ) | | $ | 1,508 |
| | $ | (36 | ) | | $ | 11,554 |
| | $ | (136 | ) | $ | 11,795 |
| | $ | (285 | ) | | $ | 8,586 |
| | $ | (428 | ) | | $ | 20,381 |
| | $ | (713 | ) |
| | | | | | | | | | | | | | | | | | | | | | | |
| December 31, 2016: |
| |
| |
| |
| |
| |
| |
| December 31, 2017: | | | | | | | | | | | | |
| Available-for-sale securities: | | | | | | | | |
|
| |
|
| | | | | | | | | | | |
| Debt securities: | | | | | | | | | | | | | | | | | | | | | | |
| Agency mortgage-backed securities | $ | 9,281 |
| | $ | (279 | ) | | $ | 1,620 |
| | $ | (57 | ) | | $ | 10,901 |
| | $ | (336 | ) | $ | 4,638 |
| | $ | (23 | ) | | $ | 8,027 |
| | $ | (224 | ) | | $ | 12,665 |
| | $ | (247 | ) |
| Agency debentures | 454 |
| | (21 | ) | | — |
| | — |
| | 454 |
| | (21 | ) | — |
| | — |
| | 283 |
| | (12 | ) | | 283 |
| | (12 | ) |
| U.S. Treasuries | 407 |
| | (45 | ) | | — |
| | — |
| | 407 |
| | (45 | ) | |
| US Treasuries | | — |
| | — |
| | 147 |
| | (4 | ) | | 147 |
| | (4 | ) |
| Agency debt securities | 24 |
| | (1 | ) | | — |
| | — |
| | 24 |
| | (1 | ) | 9 |
| | — |
| | 24 |
| | (1 | ) | | 33 |
| | (1 | ) |
| Municipal bonds | 13 |
| | — |
| | — |
| | — |
| | 13 |
| | — |
| — |
| | — |
| | 11 |
| | — |
| | 11 |
| | — |
|
| Publicly traded equity securities | 7 |
| | — |
| | — |
| | — |
| | 7 |
| | — |
| 7 |
| | — |
| | — |
| | — |
| | 7 |
| | — |
|
| Total temporarily impaired available-for-sale securities | $ | 10,186 |
| | $ | (346 | ) | | $ | 1,620 |
| | $ | (57 | ) | | $ | 11,806 |
| | $ | (403 | ) | $ | 4,654 |
| | $ | (23 | ) | | $ | 8,492 |
| | $ | (241 | ) | | $ | 13,146 |
| | $ | (264 | ) |
| Held-to-maturity securities: | | | | | | | | | | | | | | | | | | | | | | |
| Agency mortgage-backed securities | $ | 5,929 |
| | $ | (123 | ) | | $ | 1,272 |
| | $ | (29 | ) | | $ | 7,201 |
| | $ | (152 | ) | $ | 9,982 |
| | $ | (78 | ) | | $ | 4,906 |
| | $ | (115 | ) | | $ | 14,888 |
| | $ | (193 | ) |
| Agency debentures | 18 |
| | — |
| | — |
| | — |
| | 18 |
| | — |
| 597 |
| | (2 | ) | | 9 |
| | — |
| | 606 |
| | (2 | ) |
| Agency debt securities | 1,739 |
| | (32 | ) | | 18 |
| | — |
| | 1,757 |
| | (32 | ) | 373 |
| | (3 | ) | | 1,345 |
| | (32 | ) | | 1,718 |
| | (35 | ) |
| Total temporarily impaired held-to-maturity securities | $ | 7,686 |
| | $ | (155 | ) | | $ | 1,290 |
| | $ | (29 | ) | | $ | 8,976 |
| | $ | (184 | ) | $ | 10,952 |
| | $ | (83 | ) | | $ | 6,260 |
| | $ | (147 | ) | | $ | 17,212 |
| | $ | (230 | ) |
E*TRADE Q3 2018 10-Q | Page 73
E*TRADE FINANCIAL CORPORATION
NOTES TO THE CONDENSED CONSOLIDATED FINANCIAL STATEMENTS (UNAUDITED)
The Company does not believe that any individual unrealized loss in the available-for-sale portfolio or unrecognized loss in the held-to-maturity portfolio as of September 30, 20172018 represents a credit loss. The
|
| | |
E*TRADE | Q3 2017 10-Q | | 67 |
Company does not intend to sell the debt securities in an unrealized or unrecognized loss position as of the balance sheet date and it is not more likely than not that the Company will be required to sell the debt securities before the anticipated recovery of its remaining amortized cost of the debt securities in an unrealized or unrecognized loss position at September 30, 2017.2018.
There were no impairment losses recognized in earnings on available-for-sale or held-to-maturity securities during the nine months ended September 30, 20172018 and 2016, respectively.2017.
Gains on Securities and Other, Net
The following table showspresents the components of the gains on securities and other, net line item on the consolidated statement of income for the three and nine months ended September 30, 2017 and 2016 (dollars in millions): | | | | Three Months Ended September 30, | | Nine Months Ended September 30, | Three Months Ended September 30, | | Nine Months Ended September 30, |
| | 2017 | | 2016 | | 2017 | | 2016 | 2018 | | 2017 | | 2018 | | 2017 |
Gains on available-for-sale securities | $ | 7 |
| | $ | 17 |
| | $ | 25 |
| | $ | 46 |
| $ | 65 |
| | $ | 7 |
| | $ | 87 |
| | $ | 25 |
|
| Hedge ineffectiveness | (2 | ) | | (4 | ) | | (5 | ) | | (8 | ) | |
| Equity method investment income (loss) and other | 1 |
| | 1 |
| | 3 |
| | (4 | ) | |
Losses on available-for-sale securities(1) | | (54 | ) | | — |
| | (54 | ) | | — |
|
| Subtotal | | 11 |
| | 7 |
| | 33 |
| | 25 |
|
Equity method investment income (loss) and other(2)(3) | | 6 |
| | (1 | ) | | 9 |
| | (2 | ) |
| Gains on securities and other, net | $ | 6 |
| | $ | 14 |
| | $ | 23 |
| | $ | 34 |
| $ | 17 |
| | $ | 6 |
| | $ | 42 |
| | $ | 23 |
|
| |
| (1) | In August 2018, the Company sold available-for-sale securities and reinvested the sale proceeds in agency-backed securities at current market rates. A subset of these securities had been purchased in lower interest rate environments and were in unrealized loss positions at the time of sale. As both the change in intent related to these securities and the sale of these securities occurred within the same reporting period, the Company presented the losses on the sale of these securities within the gains on securities and other, net line item. |
| |
| (2) | Includes a $5 million gain on the sale of our Chicago Stock Exchange investment for the three and nine months ended September 30, 2018. |
| |
| (3) | Includes a loss of $2 million and $5 million on hedge ineffectiveness for the three and nine months ended September 30, 2017. Beginning January 1, 2018 fair value hedging adjustments are recognized within net interest income. See Note 1—Organization, Basis of Presentation and Summary of Significant Accounting Policies for additional information. |
E*TRADE Q3 2018 10-Q | Page 74
NOTE 6—
E*TRADE FINANCIAL CORPORATION
NOTES TO THE CONDENSED CONSOLIDATED FINANCIAL STATEMENTS (UNAUDITED)
|
|
| NOTE 7—LOANS RECEIVABLE, NET |
LoansThe following table presents loans receivable net at September 30, 2017 and December 31, 2016 are summarized as followsdisaggregated by delinquency status (dollars in millions): |
| | | | | | | |
| | September 30, | | December 31, |
| | 2017 | | 2016 |
| One- to four-family | $ | 1,531 |
| | $ | 1,950 |
|
| Home equity | 1,197 |
| | 1,556 |
|
| Consumer and other | 192 |
| | 250 |
|
| Total loans receivable | 2,920 |
| | 3,756 |
|
| Unamortized premiums, net | 12 |
| | 16 |
|
| Allowance for loan losses | (94 | ) | | (221 | ) |
| Total loans receivable, net | $ | 2,838 |
| | $ | 3,551 |
|
|
| | | | | | | | | | | | | | | | | | | | | | | | | | | | | | | | |
| | | | | Days Past Due | | | | | | | | |
| | | Current | | 30-89 | | 90-179 | | 180+ | | Total | | Unamortized premiums, net | | Allowance for loans losses | | Loans Receivable, Net |
| September 30, 2018 | | | | | | | | | | | | | | | | |
| One- to four-family | | $ | 1,034 |
| | $ | 45 |
| | $ | 13 |
| | $ | 58 |
| | $ | 1,150 |
| | $ | 7 |
| | $ | (12 | ) | | $ | 1,145 |
|
| Home equity | | 821 |
| | 29 |
| | 14 |
| | 26 |
| | 890 |
| | — |
| | (27 | ) | | 863 |
|
Consumer and other(1) | | 242 |
| | 2 |
| | — |
| | — |
| | 244 |
| | 1 |
| | (2 | ) | | 243 |
|
| Total loans receivable | | $ | 2,097 |
| | $ | 76 |
| | $ | 27 |
| | $ | 84 |
| | $ | 2,284 |
| | $ | 8 |
| | $ | (41 | ) | | $ | 2,251 |
|
| | | | | | | | | | | | | | | | | |
| December 31, 2017 | | | | | | | | | | | | | | | | |
| One- to four-family | | $ | 1,269 |
| | $ | 59 |
| | $ | 22 |
| | $ | 82 |
| | $ | 1,432 |
| | $ | 9 |
| | $ | (24 | ) | | $ | 1,417 |
|
| Home equity | | 1,014 |
| | 36 |
| | 15 |
| | 32 |
| | 1,097 |
| | — |
| | (46 | ) | | 1,051 |
|
Consumer and other(1) | | 185 |
| | 3 |
| | — |
| | — |
| | 188 |
| | 2 |
| | (4 | ) | | 186 |
|
| Total loans receivable | | $ | 2,468 |
| | $ | 98 |
| | $ | 37 |
| | $ | 114 |
| | $ | 2,717 |
| | $ | 11 |
| | $ | (74 | ) | | $ | 2,654 |
|
| |
| (1) | In 2017 we introduced E*TRADE Line of Credit, a securities-based lending product, where customers can borrow against the market value of their securities pledged as collateral. The drawn amount and unused credit line amount totaled $113 million and $168 million, respectively, as of September 30, 2018 and $12 million and $35 million, respectively, as of December 31, 2017. |
During the three months ended June 30,At December 31, 2017, the Company sold certainhad loans with a carrying value of $41$17 million classified as held for proceeds that approximated book value.sale. These loans were presented within other assets as of December 31, 2017 and were sold during the three months ended March 31, 2018.
At September 30, 2017,2018, the Company pledged $2.4$1.8 billion and $0.2$0.1 billion of loans as collateral to the FHLB and Federal Reserve Bank of Richmond, respectively. At December 31, 2016,2017, the Company pledged $3.1$2.2 billion and $0.3$0.2 billion of loans as collateral to the FHLB and Federal Reserve Bank of Richmond, respectively.
|
| | |
E*TRADE | Q3 2017 10-Q | | 68 |
E*TRADE Q3 2018 10-Q | Page 75
The following table presents the total recorded investment in loans receivable and allowance for loan losses by loans that have been collectively evaluated for impairment and those that have been individually evaluated for impairment by loan class at September 30, 2017 and December 31, 2016 (dollars in millions):
E*TRADE FINANCIAL CORPORATION
NOTES TO THE CONDENSED CONSOLIDATED FINANCIAL STATEMENTS (UNAUDITED)
|
| | | | | | | | | | | | | | | |
| | Recorded Investment | | Allowance for Loan Losses |
| | September 30, | | December 31, | | September 30, | | December 31, |
| | 2017 | | 2016 | | 2017 | | 2016 |
| Collectively evaluated for impairment: | | | | | | | |
| One- to four-family | $ | 1,327 |
| | $ | 1,717 |
| | $ | 15 |
| | $ | 38 |
|
| Home equity | 1,023 |
| | 1,361 |
| | 39 |
| | 120 |
|
| Consumer and other | 194 |
| | 253 |
| | 4 |
| | 5 |
|
| Total collectively evaluated for impairment | 2,544 |
| | 3,331 |
| | 58 |
| | 163 |
|
| Individually evaluated for impairment: | | | | | | | |
| One- to four-family | 214 |
| | 246 |
| | 6 |
| | 7 |
|
| Home equity | 174 |
| | 195 |
| | 30 |
| | 51 |
|
| Total individually evaluated for impairment | 388 |
| | 441 |
| | 36 |
| | 58 |
|
| Total | $ | 2,932 |
| | $ | 3,772 |
| | $ | 94 |
| | $ | 221 |
|
Credit Quality and Concentrations of Credit Risk
The Company tracks and reviews factors to predict and monitor credit risk in its mortgage loan portfolio on an ongoing basis. These factors include: loan type, estimated current LTV/CLTV ratios, delinquency history, borrowers’ current credit scores, housing prices, loan vintage and geographic location of the property. The Company believes LTV/CLTV ratios and credit scores are the key factors in determining future loan performance. The factors are updated on at least a quarterly basis. The Company tracks and reviews delinquency status to predict and monitor credit risk in the consumer loan portfolio on at least a quarterly basis.
|
| | |
E*TRADE | Q3 2017 10-Q | | 69 |
Credit Quality
The following tables showpresent the distribution of the Company’s mortgage loan portfolios by credit quality indicator at September 30, 2017 and December 31, 2016 (dollars in millions):
| | | | One- to Four-Family | | Home Equity | | | | | | | | | |
| | September 30, | | December 31, | | September 30, | | December 31, | One- to Four-Family | | Home Equity |
Current LTV/CLTV(1) | 2017 | | 2016 | | 2017 | | 2016 | September 30, 2018 | | December 31, 2017 | | September 30, 2018 | | December 31, 2017 |
| <=80% | $ | 1,076 |
| | $ | 1,308 |
| | $ | 564 |
| | $ | 686 |
| $ | 877 |
| | $ | 1,031 |
| | $ | 475 |
| | $ | 531 |
|
| 80%-100% | 292 |
| | 413 |
| | 319 |
| | 414 |
| 181 |
| | 256 |
| | 230 |
| | 291 |
|
| 100%-120% | 102 |
| | 143 |
| | 201 |
| | 274 |
| 53 |
| | 91 |
| | 121 |
| | 176 |
|
| >120% | 61 |
| | 86 |
| | 113 |
| | 182 |
| 39 |
| | 54 |
| | 64 |
| | 99 |
|
| Total mortgage loans receivable | $ | 1,531 |
| | $ | 1,950 |
| | $ | 1,197 |
| | $ | 1,556 |
| $ | 1,150 |
| | $ | 1,432 |
| | $ | 890 |
| | $ | 1,097 |
|
Average estimated current LTV/CLTV (2) | 71 | % | | 73 | % | | 85 | % | | 87 | % | 66 | % | | 70 | % | | 80 | % | | 84 | % |
Average LTV/CLTV at loan origination (3) | 71 | % | | 71 | % | | 81 | % | | 81 | % | 71 | % | | 71 | % | | 82 | % | | 81 | % |
| |
| (1) | Current CLTV calculations for home equity loans are based on the maximum available line for HELOCs and outstanding principal balance for home equity installment loans.HEILs. For home equity loans in the second lien position, the original balance of the first lien loan at origination date and updated valuations on the property underlying the loan are used to calculate CLTV. Current property value estimates are updated on a quarterly basis. |
| |
| (2) | The average estimated current LTV/CLTV ratio reflects the outstanding balance at the balance sheet date and the maximum available line for HELOCs, divided by the estimated current value of the underlying property. |
| |
| (3) | Average LTV/CLTV at loan origination calculations are based on LTV/CLTV at time of purchase for one- to four-family purchased loans, HEILs and home equity installment loans andthe maximum available line for HELOCs. |
|
| | | | | | | | | | | | | | | |
| | One- to Four-Family | | Home Equity |
| | September 30, | | December 31, | | September 30, | | December 31, |
| Current FICO | 2017 | | 2016 | | 2017 | | 2016 |
| >=720 | $ | 862 |
| | $ | 1,121 |
| | $ | 603 |
| | $ | 778 |
|
| 719 - 700 | 140 |
| | 179 |
| | 114 |
| | 156 |
|
| 699 - 680 | 111 |
| | 153 |
| | 100 |
| | 141 |
|
| 679 - 660 | 93 |
| | 121 |
| | 89 |
| | 117 |
|
| 659 - 620 | 128 |
| | 154 |
| | 115 |
| | 149 |
|
| <620 | 197 |
| | 222 |
| | 176 |
| | 215 |
|
| Total mortgage loans receivable | $ | 1,531 |
| | $ | 1,950 |
| | $ | 1,197 |
| | $ | 1,556 |
|
Concentrations of Credit Risk |
| | | | | | | | | | | | | | | |
| | One- to Four-Family | | Home Equity |
| Current FICO | September 30, 2018 | | December 31, 2017 | | September 30, 2018 | | December 31, 2017 |
| >=720 | $ | 660 |
| | $ | 805 |
| | $ | 463 |
| | $ | 548 |
|
| 719 - 700 | 105 |
| | 138 |
| | 84 |
| | 106 |
|
| 699 - 680 | 77 |
| | 105 |
| | 77 |
| | 93 |
|
| 679 - 660 | 72 |
| | 78 |
| | 60 |
| | 79 |
|
| 659 - 620 | 90 |
| | 122 |
| | 88 |
| | 103 |
|
| <620 | 146 |
| | 184 |
| | 118 |
| | 168 |
|
| Total mortgage loans receivable | $ | 1,150 |
| | $ | 1,432 |
| | $ | 890 |
| | $ | 1,097 |
|
One- to four-family loans include loans with an interest-only period, followed by an amortizing period. At September 30, 2017, over 99%2018, nearly 100% of thethese loans were amortizing and this portfolio will be fully converted in 2018.amortizing. The home equity loan portfolio consists of HEILs and HELOCs. HEILs are primarily fully amortizing loans that do not offer the option of an interest-only payment. The majority of HELOCs had an interest only draw period at origination and converted to amortizing loans at the end of the draw period. At September 30, 2017, 1%2018, nearly 100% of the HELOC portfolio had not converted from the interest-only draw period and will be fully converted in 2019.period.
E*TRADE Q3 2018 10-Q | Page 76
E*TRADE FINANCIAL CORPORATION
NOTES TO THE CONDENSED CONSOLIDATED FINANCIAL STATEMENTS (UNAUDITED)
The weighted average age of our mortgage and consumer loans receivable was 11.612.6 and 10.811.8 years at September 30, 20172018 and December 31, 2016,2017, respectively. Approximately 34%33% and 36%34% of the Company’s mortgage loans receivable were concentrated in California at September 30, 20172018 and December 31, 2016,2017, respectively. Approximately 10% and 9% of the Company's mortgage loans receivable were concentrated in New York at September 30, 2018 and December 31, 2017, respectively. No other state had concentrations of mortgage loans that represented 10% or more of the Company’s mortgage loans receivable at September 30, 20172018 and December 31, 2016.2017.
|
| | |
E*TRADE | Q3 2017 10-Q | | 70 |
Delinquent Loans
The following table shows total loans receivable by delinquency category atAt September 30, 20172018, 27% and December 31, 2016 (dollars19% of the Company’s past-due mortgage loans were concentrated in millions):
|
| | | | | | | | | | | | | | | | | | | |
| | Current | | 30-89 Days Delinquent | | 90-179 Days Delinquent | | 180+ Days Delinquent | | Total |
| September 30, 2017 | | | | | | | | | |
| One- to four-family | $ | 1,363 |
| | $ | 56 |
| | $ | 27 |
| | $ | 85 |
| | $ | 1,531 |
|
| Home equity | 1,101 |
| | 42 |
| | 19 |
| | 35 |
| | 1,197 |
|
| Consumer and other | 188 |
| | 4 |
| | — |
| | — |
| | 192 |
|
| Total loans receivable | $ | 2,652 |
| | $ | 102 |
| | $ | 46 |
| | $ | 120 |
| | $ | 2,920 |
|
| December 31, 2016 | | | | | | | | | |
| One- to four-family | $ | 1,774 |
| | $ | 67 |
| | $ | 23 |
| | $ | 86 |
| | $ | 1,950 |
|
| Home equity | 1,442 |
| | 43 |
| | 18 |
| | 53 |
| | 1,556 |
|
| Consumer and other | 245 |
| | 4 |
| | 1 |
| | — |
| | 250 |
|
| Total loans receivable | $ | 3,461 |
| | $ | 114 |
| | $ | 42 |
| | $ | 139 |
| | $ | 3,756 |
|
One- to four-familyCalifornia and New York, respectively. No other state had concentrations of past-due mortgage loans are generally securedthat represented 10% or more of the Company's past-due mortgage loans. At September 30, 2018, 43% and 10% of the Company’s impaired mortgage loans were concentrated in a first lien position by real estate assets, reducingCalifornia and New York, respectively. No other state had concentrations of impaired mortgage loans that represented 10% or more of the potential loss when compared to an unsecured loan. Home equity loans are generally secured by real estate assets; however, the majority of these loans are secured in a second lien position, which substantially increases the potential loss when compared to a first lien position.Company's impaired mortgage loans.
Nonperforming Loans
The Company classifies loans as nonperforming when they are no longer accruing interest. The following table shows the comparative data forpresents nonperforming loans at September 30, 2017 and December 31, 2016by loan portfolio (dollars in millions): | | | | September 30, | | December 31, | | | | | |
| | 2017 | | 2016 | September 30, 2018 | | December 31, 2017 |
| One- to four-family | $ | 196 |
| | $ | 215 |
| $ | 153 |
| | $ | 192 |
|
| Home equity | 109 |
| | 136 |
| 77 |
| | 98 |
|
| Consumer and other | — |
| | 1 |
| |
| Total nonperforming loans receivable | $ | 305 |
| | $ | 352 |
| $ | 230 |
| | $ | 290 |
|
At September 30, 20172018 and December 31, 2016,2017, the Company held $27$17 million and $35$26 million, respectively, of real estate owned that werewas acquired through foreclosure or through a deed in lieu of foreclosure or similar legal agreement. The Company held $105$60 million and $112$101 million of loans for which formal foreclosure proceedings were in process at September 30, 20172018 and December 31, 2016,2017, respectively.
|
| | |
E*TRADE | Q3 2017 10-Q | | 71 |
E*TRADE Q3 2018 10-Q | Page 77
E*TRADE FINANCIAL CORPORATION
NOTES TO THE CONDENSED CONSOLIDATED FINANCIAL STATEMENTS (UNAUDITED)
Allowance for Loan Losses
The allowance for loan losses is management’s estimate of probable losses inherent in the loan portfolio at the balance sheet date, as well as the forecasted losses, including economic concessions to borrowers, over the estimated remaining life of loans modified as TDRs. The general allowance for loan losses includes a qualitative component to account for a variety of factors that present additional uncertainty that may not be fully considered in the quantitative loss model but are factors we believe may impact the level of credit losses.
The following table providespresents the allowance for loan losses by loan portfolio (dollars in millions):
|
| | | | | | | | | | | | | | | | | | | | | | | | | | | | | | | |
| | One- to Four-Family | | Home Equity | | Consumer and other | | Total |
| | September 30,
2018 | | December 31, 2017 | | September 30,
2018 | | December 31, 2017 | | September 30,
2018 | | December 31,
2017 | | September 30,
2018 | | December 31, 2017 |
| General reserve: | | | | | | | | | | | | | �� | | |
| Quantitative component | $ | 7 |
| | $ | 15 |
| | $ | 6 |
| | $ | 14 |
| | $ | 2 |
| | $ | 4 |
| | $ | 15 |
| | $ | 33 |
|
| Qualitative component | 1 |
| | 3 |
| | — |
| | 3 |
| | — |
| | — |
| | 1 |
| | 6 |
|
| Specific valuation allowance | 4 |
| | 6 |
| | 21 |
| | 29 |
| | — |
| | — |
| | 25 |
| | 35 |
|
| Total allowance for loan losses | $ | 12 |
| | $ | 24 |
| | $ | 27 |
| | $ | 46 |
| | $ | 2 |
| | $ | 4 |
| | $ | 41 |
| | $ | 74 |
|
Allowance as a % of loans
receivable(1) | 1.1 | % | | 1.6 | % | | 3.0 | % | | 4.2 | % | | 0.9 | % | | 2.1 | % | | 1.8 | % | | 2.7 | % |
| |
| (1) | Allowance as a percentage of loans receivable is calculated based on the gross loans receivable including net unamortized premiums for each respective category. |
E*TRADE Q3 2018 10-Q | Page 78
E*TRADE FINANCIAL CORPORATION
NOTES TO THE CONDENSED CONSOLIDATED FINANCIAL STATEMENTS (UNAUDITED)
The following table presents a roll forward by loan portfolio of the allowance for loan losses for the three and nine months ended September 30, 2017 and 2016 (dollars in millions):
| | | | Three Months Ended September 30, 2017 | Three Months Ended September 30, 2018 |
| | One- to Four-Family | | Home Equity | | Consumer and other | | Total | One- to Four-Family | | Home Equity | | Consumer and other | | Total |
| Allowance for loan losses, beginning of period | $ | 29 |
| | $ | 82 |
| | $ | 5 |
| | $ | 116 |
| $ | 16 |
| | $ | 36 |
| | $ | 2 |
| | $ | 54 |
|
| Provision (benefit) for loan losses | (12 | ) | | (17 | ) | | — |
| | (29 | ) | (6 | ) | | (28 | ) | | — |
| | (34 | ) |
| Charge-offs | — |
| | (1 | ) | | (1 | ) | | (2 | ) | — |
| | — |
| | (1 | ) | | (1 | ) |
| Recoveries | 4 |
| | 5 |
| | — |
| | 9 |
| |
Recoveries(1) | | 2 |
| | 19 |
| | 1 |
| | 22 |
|
| Net (charge-offs) recoveries | 4 |
| | 4 |
| | (1 | ) | | 7 |
| 2 |
| | 19 |
| | — |
| | 21 |
|
| Allowance for loan losses, end of period | $ | 21 |
| | $ | 69 |
| | $ | 4 |
| | $ | 94 |
| $ | 12 |
| | $ | 27 |
| | $ | 2 |
| | $ | 41 |
|
| | | | | | | | | | | | | | | |
| | Three Months Ended September 30, 2016 | Three Months Ended September 30, 2017 |
| | One- to Four-Family | | Home Equity | | Consumer and other | | Total | One- to Four-Family | | Home Equity | | Consumer and other | | Total |
| Allowance for loan losses, beginning of period | $ | 42 |
| | $ | 245 |
| | $ | 6 |
| | $ | 293 |
| $ | 29 |
| | $ | 82 |
| | $ | 5 |
| | $ | 116 |
|
| Provision (benefit) for loan losses | 2 |
| | (64 | ) | | — |
| | (62 | ) | (12 | ) | | (17 | ) | | — |
| | (29 | ) |
| Charge-offs | — |
| | (4 | ) | | (1 | ) | | (5 | ) | — |
| | (1 | ) | | (1 | ) | | (2 | ) |
| Recoveries | 3 |
| | 6 |
| | — |
| | 9 |
| 4 |
| | 5 |
| | — |
| | 9 |
|
| Net (charge-offs) recoveries | 3 |
| | 2 |
| | (1 | ) | | 4 |
| 4 |
| | 4 |
| | (1 | ) | | 7 |
|
| Allowance for loan losses, end of period | $ | 47 |
| | $ | 183 |
| | $ | 5 |
| | $ | 235 |
| $ | 21 |
| | $ | 69 |
| | $ | 4 |
| | $ | 94 |
|
| | | | | | | | | | | | | | | |
| | Nine Months Ended September 30, 2017 | Nine Months Ended September 30, 2018 |
| | One- to Four-Family | | Home Equity | | Consumer and other | | Total | One- to Four-Family | | Home Equity | | Consumer and other | | Total |
| Allowance for loan losses, beginning of period | $ | 45 |
| | $ | 171 |
| | $ | 5 |
| | $ | 221 |
| $ | 24 |
| | $ | 46 |
| | $ | 4 |
| | $ | 74 |
|
| Provision (benefit) for loan losses | (30 | ) | | (113 | ) | | 1 |
| | (142 | ) | (17 | ) | | (56 | ) | | (1 | ) | | (74 | ) |
| Charge-offs | — |
| | (6 | ) | | (4 | ) | | (10 | ) | (1 | ) | | — |
| | (3 | ) | | (4 | ) |
Recoveries(2) | | 6 |
| | 37 |
| | 2 |
| | 45 |
|
| Net (charge-offs) recoveries | | 5 |
| | 37 |
| | (1 | ) | | 41 |
|
| Allowance for loan losses, end of period | | $ | 12 |
| | $ | 27 |
| | $ | 2 |
| | $ | 41 |
|
| | | | | | | | | |
| | | Nine Months Ended September 30, 2017 |
| | | One- to
Four-Family | | Home
Equity | | Consumer and other | | Total |
| Allowance for loan losses, beginning of period | | $ | 45 |
| | $ | 171 |
| | $ | 5 |
| | $ | 221 |
|
| Provision (benefit) for loan losses | | (30 | ) | | (113 | ) | | 1 |
| | (142 | ) |
| Charge-offs | | — |
| | (6 | ) | | (4 | ) | | (10 | ) |
| Recoveries | 6 |
| | 17 |
| | 2 |
| | 25 |
| 6 |
| | 17 |
| | 2 |
| | 25 |
|
| Net (charge-offs) recoveries | 6 |
| | 11 |
| | (2 | ) | | 15 |
| 6 |
| | 11 |
| | (2 | ) | | 15 |
|
| Allowance for loan losses, end of period | $ | 21 |
| | $ | 69 |
| | $ | 4 |
| | $ | 94 |
| $ | 21 |
| | $ | 69 |
| | $ | 4 |
| | $ | 94 |
|
|
| | | | | | | | | | | | | | | |
| | Nine Months Ended September 30, 2016 |
| | One- to Four-Family | | Home Equity | | Consumer and other | | Total |
| Allowance for loan losses, beginning of period | $ | 40 |
| | $ | 307 |
| | $ | 6 |
| | $ | 353 |
|
| Provision (benefit) for loan losses | 2 |
| | (134 | ) | | 1 |
| | (131 | ) |
| Charge-offs | (1 | ) | | (13 | ) | | (5 | ) | | (19 | ) |
| Recoveries | 6 |
| | 23 |
| | 3 |
| | 32 |
|
| Net (charge-offs) recoveries | 5 |
| | 10 |
| | (2 | ) | | 13 |
|
| Allowance for loan losses, end of period | $ | 47 |
| | $ | 183 |
| | $ | 5 |
| | $ | 235 |
|
The benefit for loan losses of $142 million for the nine months ended September 30, 2017 reflected approximately $70 million of benefit recognized in the second quarter of 2017 resulting from the Company's refinement of default assumptions in the quantitative allowance methodology based on the sustained outperformance of converted mortgage loans that had been amortizing for 12 months or longer. In order to refine the default assumptions around the remaining population that had not yet started amortizing or that
| |
| (1) | Includes $10 million of recoveries recognized during the three months ended September 30, 2018 related to the sale of previously charged-off home equity loans. |
| |
| (2) | Total includes $15 million of recoveries recognized during the nine months ended September 30, 2018 related to the sale of previously charged-off home equity loans. |
|
| | |
E*TRADE | Q3 2017 10-Q | | 72 |
E*TRADE Q3 2018 10-Q | Page 79
E*TRADE FINANCIAL CORPORATION
NOTES TO THE CONDENSED CONSOLIDATED FINANCIAL STATEMENTS (UNAUDITED)
had not reached 12Total loans receivable designated as held-for-investment decreased $0.4 billion during the nine months post conversion,ended September 30, 2018. The allowance for loan losses was $41 million, or 1.8% of total loans receivable, as of September 30, 2018 compared to $74 million, or 2.7% of total loans receivable, as of December 31, 2017. Net recoveries for the Company evaluated whethernine months ended September 30, 2018 were $41 million compared to $15 million in the credit qualitysame period in 2017.
The benefit for loan losses was $74 million for the nine months ended September 30, 2018. The timing and magnitude of the provision (benefit) for loan losses is affected by many factors that could result in variability. These benefits reflected better than expected performance of these loans was consistent with the seasoned amortizing portfolio. The Company determined that FICO scores, LTV/CLTVs and delinquency rates were comparable to the seasonedour portfolio and therefore applied the refined default assumptions to this remaining population. The current period benefit also reflectedas well as recoveries in excess of prior estimates,expectations, including sales of charged-off loans and recoveries of previous charge-offs.charge-offs that were not included in our loss estimates.
The following table presents the total recorded investment in loans receivable and allowance for loan losses by loans that have been collectively evaluated for impairment and those that have been individually evaluated for impairment by loan portfolio (dollars in millions): |
| | | | | | | | | | | | | | | |
| | Recorded Investment | | Allowance for Loan Losses |
| | September 30, | | December 31, | | September 30, | | December 31, |
| | 2018 | | 2017 | | 2018 | | 2017 |
| Collectively evaluated for impairment: | | | | | | | |
| One- to four-family | $ | 963 |
| | $ | 1,228 |
| | $ | 8 |
| | $ | 18 |
|
| Home equity | 746 |
| | 932 |
| | 6 |
| | 17 |
|
| Consumer and other | 245 |
| | 190 |
| | 2 |
| | 4 |
|
| Total collectively evaluated for impairment | 1,954 |
| | 2,350 |
| | 16 |
| | 39 |
|
| Individually evaluated for impairment: | | | | | | | |
| One- to four-family | 194 |
| | 213 |
| | 4 |
| | 6 |
|
| Home equity | 144 |
| | 165 |
| | 21 |
| | 29 |
|
| Total individually evaluated for impairment | 338 |
| | 378 |
| | 25 |
| | 35 |
|
| Total | $ | 2,292 |
| | $ | 2,728 |
| | $ | 41 |
| | $ | 74 |
|
Impaired Loans—Troubled Debt Restructurings
Delinquency status is the primary measure the Company uses to evaluate the performance of loans modified as TDRs. The Company classifies loans as nonperforming when they are no longer accruing interest. The recorded investment in loans modified as TDRs includes the charge-offs related to certain loans that were written down to estimated current value of the underlying property less estimated selling costs.
E*TRADE Q3 2018 10-Q | Page 80
E*TRADE FINANCIAL CORPORATION
NOTES TO THE CONDENSED CONSOLIDATED FINANCIAL STATEMENTS (UNAUDITED)
The following table showspresents a summary of the Company’s recorded investment in TDRs that were on accrual and nonaccrual status, further disaggregated by delinquency status in addition to the recorded investment in TDRs at September 30, 2017 and December 31, 2016 (dollars in millions):
| | | | | | Nonaccrual TDRs | | | | | Nonaccrual TDRs | | |
| | Accrual TDRs(1) | | Current(2) | | 30-89 Days Delinquent | | 90-179 Days Delinquent | | 180+ Days Delinquent | | Total Recorded Investment in TDRs (3)(4) | Accrual TDRs(1) | | Current(2) | | 30-89 Days Delinquent | | 90-179 Days Delinquent | | 180+ Days Delinquent | | Total Recorded Investment in TDRs (3)(4) |
| September 30, 2017 | | | | | | | | | | | | |
| September 30, 2018 | | | | | | | | | | | | |
| One- to four-family | $ | 88 |
| | $ | 69 |
| | $ | 15 |
| | $ | 9 |
| | $ | 33 |
| | $ | 214 |
| $ | 85 |
| | $ | 70 |
| | $ | 12 |
| | $ | 4 |
| | $ | 23 |
| | $ | 194 |
|
| Home equity | 108 |
| | 36 |
| | 10 |
| | 5 |
| | 15 |
| | 174 |
| 93 |
| | 23 |
| | 10 |
| | 6 |
| | 12 |
| | 144 |
|
| Total | $ | 196 |
| | $ | 105 |
| | $ | 25 |
| | $ | 14 |
| | $ | 48 |
| | $ | 388 |
| $ | 178 |
| | $ | 93 |
| | $ | 22 |
| | $ | 10 |
| | $ | 35 |
| | $ | 338 |
|
| December 31, 2016 | | | | | | | | | | | | |
| December 31, 2017 | | | | | | | | | | | | |
| One- to four-family | $ | 97 |
| | $ | 90 |
| | $ | 16 |
| | $ | 8 |
| | $ | 35 |
| | $ | 246 |
| $ | 83 |
| | $ | 74 |
| | $ | 13 |
| | $ | 5 |
| | $ | 38 |
| | $ | 213 |
|
| Home equity | 119 |
| | 41 |
| | 10 |
| | 4 |
| | 21 |
| | 195 |
| 104 |
| | 34 |
| | 10 |
| | 4 |
| | 13 |
| | 165 |
|
| Total | $ | 216 |
| | $ | 131 |
| | $ | 26 |
| | $ | 12 |
| | $ | 56 |
| | $ | 441 |
| $ | 187 |
| | $ | 108 |
| | $ | 23 |
| | $ | 9 |
| | $ | 51 |
| | $ | 378 |
|
| |
| (1) | Represents loans modified as TDRs that are current and have made six or more consecutive payments. |
| |
| (2) | Represents loans modified as TDRs that are current but have not yet made six consecutive payments, bankruptcy loans and certain junior lien TDRs that have a delinquent senior lien. |
| |
| (3) | The unpaid principal balance in one- to four-family TDRs was $212 million and $243 million at September 30, 2017 and December 31, 2016, respectively. For home equity loans, theTotal recorded investment in TDRs represents the unpaid principal balance.includes premium (discount), as applicable, and is net of charge-offs, which were $58 million and $127 million for one-to four-family and home equity loans, respectively, as of September 30, 2018 and $67 million and $144 million, respectively, as of December 31, 2017. |
| |
| (4) | Total recorded investment in TDRs at September 30, 20172018 consisted of $289$261 million of loans modified as TDRs and $99$77 million of loans that have been charged off due to bankruptcy notification. Total recorded investment in TDRs at December 31, 20162017 consisted of $316$285 million of loans modified as TDRs and $125$93 million of loans that have been charged off due to bankruptcy notification. |
The recorded investment in loans modified as TDRs includes the charge-offs related to certain loans that were written down to estimated current value of the underlying property less estimated selling costs. These charge-offs were recorded on modified loans that were delinquent in excess of 180 days, in bankruptcy, or when certain characteristics of the loan, including CLTV, borrower's credit and type of modification, cast substantial doubt on the borrower's ability to repay the loan.
|
| | |
E*TRADE | Q3 2017 10-Q | | 73 |
The following table showstables present the average recorded investment and interest income recognized both on a cash and accrual basis for the Company’s TDRs during the three and nine months ended September 30, 2017 and 2016 (dollars in millions): | | | | Average Recorded Investment | | Interest Income Recognized | Average Recorded Investment | | Interest Income Recognized |
| | Three Months Ended September 30, | | Three Months Ended September 30, | Three Months Ended September 30, | | Three Months Ended September 30, |
| | 2017 | | 2016 | | 2017 | | 2016 | 2018 | | 2017 | | 2018 | | 2017 |
| One- to four-family | $ | 219 |
| | $ | 264 |
| | $ | 2 |
| | $ | 2 |
| $ | 198 |
| | $ | 219 |
| | $ | 2 |
| | $ | 2 |
|
| Home equity | 176 |
| | 205 |
| | 4 |
| | 5 |
| 148 |
| | 176 |
| | 4 |
| | 4 |
|
| Total | $ | 395 |
| | $ | 469 |
| | $ | 6 |
| | $ | 7 |
| $ | 346 |
| | $ | 395 |
| | $ | 6 |
| | $ | 6 |
|
| | | | | | | | | |
| | Average Recorded Investment | | Interest Income Recognized | |
| | Nine Months Ended September 30, | | Nine Months Ended September 30, | |
| | 2017 | | 2016 | | 2017 | | 2016 | |
| One- to four-family | $ | 230 |
| | $ | 275 |
| | $ | 7 |
| | $ | 7 |
| |
| Home equity | 185 |
| | 205 |
| | 12 |
| | 13 |
| |
| Total | $ | 415 |
| | $ | 480 |
| | $ | 19 |
| | $ | 20 |
| |
|
| | | | | | | | | | | | | | | |
| | Average Recorded Investment | | Interest Income Recognized |
| | Nine Months Ended September 30, | | Nine Months Ended September 30, |
| | 2018 | | 2017 | | 2018 | | 2017 |
| One- to four-family | $ | 205 |
| | $ | 230 |
| | $ | 6 |
| | $ | 7 |
|
| Home equity | 156 |
| | 185 |
| | 10 |
| | 12 |
|
| Total | $ | 361 |
| | $ | 415 |
| | $ | 16 |
| | $ | 19 |
|
E*TRADE Q3 2018 10-Q | Page 81
E*TRADE FINANCIAL CORPORATION
NOTES TO THE CONDENSED CONSOLIDATED FINANCIAL STATEMENTS (UNAUDITED)
The following table showspresents detailed information related to the Company’s TDRs and specific valuation allowances at September 30, 2017 and December 31, 2016 (dollars in millions):
| | | | September 30, 2017 | | December 31, 2016 | September 30, 2018 | | December 31, 2017 |
| | Recorded Investment in TDRs | | Specific Valuation Allowance | | Net Investment in TDRs | | Recorded Investment in TDRs | | Specific Valuation Allowance | | Net Investment in TDRs | Recorded Investment in TDRs | | Specific Valuation Allowance | | Net Investment in TDRs | | Recorded Investment in TDRs | | Specific Valuation Allowance | | Net Investment in TDRs |
| With a recorded allowance: | | | | | | | | | | | | | | | | | | | | | | |
| One- to four-family | $ | 53 |
| | $ | 6 |
| | $ | 47 |
| | $ | 61 |
| | $ | 7 |
| | $ | 54 |
| $ | 52 |
| | $ | 4 |
| | $ | 48 |
| | $ | 54 |
| | $ | 6 |
| | $ | 48 |
|
| Home equity | $ | 88 |
| | $ | 30 |
| | $ | 58 |
| | $ | 111 |
| | $ | 51 |
| | $ | 60 |
| $ | 64 |
| | $ | 21 |
| | $ | 43 |
| | $ | 83 |
| | $ | 29 |
| | $ | 54 |
|
Without a recorded allowance:(1) | | | | | | | | | | | | | | | | | | | | | | |
| One- to four-family | $ | 161 |
| | $ | — |
| | $ | 161 |
| | $ | 185 |
| | $ | — |
| | $ | 185 |
| $ | 142 |
| | $ | — |
| | $ | 142 |
| | $ | 159 |
| | $ | — |
| | $ | 159 |
|
| Home equity | $ | 86 |
| | $ | — |
| | $ | 86 |
| | $ | 84 |
| | $ | — |
| | $ | 84 |
| $ | 80 |
| | $ | — |
| | $ | 80 |
| | $ | 82 |
| | $ | — |
| | $ | 82 |
|
| Total: | | | | | | | | | | | | | | | | | | | | | | |
| One- to four-family | $ | 214 |
| | $ | 6 |
| | $ | 208 |
| | $ | 246 |
| | $ | 7 |
| | $ | 239 |
| $ | 194 |
| | $ | 4 |
| | $ | 190 |
| | $ | 213 |
| | $ | 6 |
| | $ | 207 |
|
| Home equity | $ | 174 |
| | $ | 30 |
| | $ | 144 |
| | $ | 195 |
| | $ | 51 |
| | $ | 144 |
| $ | 144 |
| | $ | 21 |
| | $ | 123 |
| | $ | 165 |
| | $ | 29 |
| | $ | 136 |
|
| |
| (1) | Represents loans where the discounted cash flow analysis or collateral value is equal to or exceeds the recorded investment in the loan. |
|
| | |
E*TRADE | Q3 2017 10-Q | | 74 |
E*TRADE Q3 2018 10-Q | Page 82
E*TRADE FINANCIAL CORPORATION
NOTES TO THE CONDENSED CONSOLIDATED FINANCIAL STATEMENTS (UNAUDITED)
The following tables providepresent the number of loans and post-modification balances immediately after being modified by major class during the three and nine months ended September 30, 2017 and 2016 (dollars in millions): | | | | Three Months Ended September 30, 2017 | Three Months Ended |
| | | | Interest Rate Reduction | | | | | | | Interest Rate Reduction | | | | |
| | Number of Loans | | Re-age/ Extension/ Interest Capitalization | | Other with Interest Rate Reduction | | Other(1) | | Total | Number of Loans | | Re-age/ Extension/ Interest Capitalization | | Other with Interest Rate Reduction | | Other(1) | | Total |
| September 30, 2018 | | | | | | | | | | |
| One- to four-family | 7 |
| | $ | 3 |
| | $ | — |
| | $ | — |
| | $ | 3 |
| 11 |
| | $ | 2 |
| | $ | — |
| | $ | 2 |
| | $ | 4 |
|
| Home equity | 46 |
| | 4 |
| | — |
| | — |
| | 4 |
| 15 |
| | — |
| | — |
| | 1 |
| | 1 |
|
| Total | 53 |
| | $ | 7 |
| | $ | — |
| | $ | — |
| | $ | 7 |
| 26 |
| | $ | 2 |
| | $ | — |
| | $ | 3 |
| | $ | 5 |
|
| | | | | | | | | | | | | | | | | | | |
| | Three Months Ended September 30, 2016 | |
| | | | Interest Rate Reduction | | | | | |
| | Number of Loans | | Re-age/ Extension/ Interest Capitalization | | Other with Interest Rate Reduction | | Other(1) | | Total | |
| September 30, 2017 | | | | | | | | | | |
| One- to four-family | 11 |
| | $ | 2 |
| | $ | — |
| | $ | 2 |
| | $ | 4 |
| 7 |
| | $ | 3 |
| | $ | — |
| | $ | — |
| | $ | 3 |
|
| Home equity | 102 |
| | 2 |
| | — |
| | 5 |
| | 7 |
| 46 |
| | 4 |
| | — |
| | — |
| | 4 |
|
| Total | 113 |
| | $ | 4 |
| | $ | — |
| | $ | 7 |
| | $ | 11 |
| 53 |
| | $ | 7 |
| | $ | — |
| | $ | — |
| | $ | 7 |
|
| | | | | | | | | | | |
| | Nine Months Ended September 30, 2017 | |
| | | | Interest Rate Reduction | | | | | |
| | Number of Loans | | Re-age/ Extension/ Interest Capitalization | | Other with
Interest Rate
Reduction | | Other(1) | | Total | |
| One- to four-family | 19 |
| | $ | 6 |
| | $ | — |
| | $ | 1 |
| | $ | 7 |
| |
| Home equity | 260 |
| | 9 |
| | 1 |
| | 9 |
| | 19 |
| |
| Total | 279 |
| | $ | 15 |
| | $ | 1 |
| | $ | 10 |
| | $ | 26 |
| |
| | | | Nine Months Ended September 30, 2016 | Nine Months Ended |
| | | | Interest Rate Reduction | | | | | | | Interest Rate Reduction | | | | |
| | Number of
Loans | | Re-age/
Extension/
Interest
Capitalization | | Other with
Interest Rate
Reduction | | Other(1) | | Total | Number of
Loans | | Re-age/
Extension/
Interest
Capitalization | | Other with
Interest Rate
Reduction | | Other(1) | | Total |
| September 30, 2018 | | | | | | | | | | |
| One- to four-family | 32 |
| | $ | 8 |
| | $ | — |
| | $ | 4 |
| | $ | 12 |
| 46 |
| | $ | 14 |
| | $ | — |
| | $ | 6 |
| | $ | 20 |
|
| Home equity | 459 |
| | 7 |
| | 3 |
| | 23 |
| | 33 |
| 75 |
| | 4 |
| | 1 |
| | 1 |
| | 6 |
|
| Total | 491 |
| | $ | 15 |
| | $ | 3 |
| | $ | 27 |
| | $ | 45 |
| 121 |
| | $ | 18 |
| | $ | 1 |
| | $ | 7 |
| | $ | 26 |
|
| | | | | | | | | | | |
| September 30, 2017 | | | | | | | | | | |
| One- to four-family | | 19 |
| | $ | 6 |
| | $ | — |
| | $ | 1 |
| | $ | 7 |
|
| Home equity | | 260 |
| | 9 |
| | 1 |
| | 9 |
| | 19 |
|
| Total | | 279 |
| | $ | 15 |
| | $ | 1 |
| | $ | 10 |
| | $ | 26 |
|
| |
| (1) | Amounts represent loans whose terms were modified in a manner that did not result in an interest rate reduction, including re-aged loans, extensions, and loans with capitalized interest. |
|
| | |
E*TRADE | Q3 2017 10-Q | | 75 |
E*TRADE Q3 2018 10-Q | Page 83
E*TRADE FINANCIAL CORPORATION
NOTES TO THE CONDENSED CONSOLIDATED FINANCIAL STATEMENTS (UNAUDITED)
|
|
| NOTE 8—DERIVATIVE INSTRUMENTS AND HEDGING ACTIVITIES |
The Company enters into derivative transactions primarily to protect against interest rate risk on the value of certain assets. Each derivative instrument is recorded on the consolidated balance sheet at fair value as a freestanding asset or liability.
The following table summarizes theCompany utilizes fair value of derivatives as reported in the consolidated balance sheet at September 30, 2017 and December 31, 2016 (dollars in millions):
|
| | | | | | | | | | | | | | | |
| | | | Fair Value(1) |
| | Notional | | Asset(2) | | Liability(3) | | Net(4) |
| September 30, 2017 | | | | | | | |
| Interest rate contracts: | | | | | | | |
| Fair value hedges | $ | 7,092 |
| | $ | 92 |
| | $ | (37 | ) | | $ | 55 |
|
Total derivatives designated as hedging instruments(5) | $ | 7,092 |
| | $ | 92 |
| | $ | (37 | ) | | $ | 55 |
|
| December 31, 2016 | | | | | | | |
| Interest rate contracts: | | | | | | | |
| Fair value hedges | $ | 3,862 |
| | $ | 165 |
| | $ | (31 | ) | | $ | 134 |
|
Total derivatives designated as hedging instruments(5) | $ | 3,862 |
| | $ | 165 |
| | $ | (31 | ) | | $ | 134 |
|
| |
(1) | At September 30, 2017, excludes derivative assets and liabilities of $10 million and $20 million, respectively, that were executed through a central clearing organization and were settled by variation margin payments. See Note 4—Offsetting Assets and Liabilities for additional information.
|
| |
(2) | Reflected in the other assets line item on the consolidated balance sheet. |
| |
(3) | Reflected in the other liabilities line item on the consolidated balance sheet. |
| |
(4) | Represents net fair value of derivative instruments for disclosure purposes only. |
| |
(5) | All derivatives were designated as hedging instruments at September 30, 2017 and December 31, 2016. |
Fair Value Hedges
Fair value hedges are used to offset exposure to changes in value of certain fixed-rate assets. Fair value hedges are accounted for by recordingAll of the Company's derivative instruments were designated in fair value ofhedging relationships at September 30, 2018 and December 31, 2017. For each fair value hedge, both the gain or loss on the derivative, instrument andincluding interest accruals, as well as the fair value of the asset being hedgedoffsetting gain or loss on the consolidated balance sheet. Changes inhedged item attributable to the fair value of both the derivative instruments and the underlying assetshedged risk are recognized in the gains on securities and other, net line item in the consolidated statement of income. To the extent that the hedge is ineffective, the changes in the fair values will not offset and the difference, or hedge ineffectiveness, is reflected in the gains on securities and other, net line item in the consolidated statement of income.
earnings. Hedge accounting is discontinued for fair value hedges if a derivative instrument is sold, terminated or otherwise de-designated. If fair value hedge accounting is discontinued, the previously hedged item is no longer adjusted for changes in fair value through the consolidated statement of income and the cumulative net gain or loss on the hedged asset or liability at the time of de-designationitem is amortized to net interest income or interest expense using the effective interest method over the expected remaining life of the hedged item. Changes
Beginning January 1, 2018, the net earnings impact of a fair value hedge that is not perfectly effective is recognized in the interest income line item in the consolidated statement of income. Prior to January 1, 2018, the net earnings impact due to changes in fair value of the derivative instruments after de-designation of fair value hedge accounting are recordedand the hedged item, which was previously referred to as ineffectiveness, is reflected in the gains on securities and other, net line item in the consolidated statement of income. The earnings impact of interest accruals on the derivative is reflected in the interest income line item in the consolidated statement of income.
In January 2017, one of the two central clearing organizations through which the Company executes certain of its derivative contracts amended its rulebooks to legally characterize variation margin payments as settlements of the derivatives' exposure rather than collateral against the exposure. By January 2018, both central clearing organizations had adopted similar rulebook amendments. As a result, for centrally cleared derivatives contracts, amounts exchanged with counterparties are reflected as a reduction of the related derivative assets or liabilities, including accrued interest, on the consolidated balance sheet. The Company therefore had no centrally cleared derivative contract assets or liabilities reflected on the consolidated balance sheet as a result of the rulebook changes as of September 30, 2018. At December 31, 2017, the Company had $131 million and $9 million of centrally cleared derivative contract assets and liabilities, respectively, reflected on the consolidated balance sheet.
The consolidated balance sheet and the table below exclude the following as these contracts were executed through a central clearing organization and were settled by variation margin payments:
Derivative assets of $371 million and $6 million at September 30, 2018 and December 31, 2017, respectively
Derivative liabilities of $1 million and $18 million at September 30, 2018 and December 31, 2017, respectively
|
| | |
E*TRADE | Q3 2017 10-Q | | 76 |
E*TRADE Q3 2018 10-Q | Page 84
E*TRADE FINANCIAL CORPORATION
NOTES TO THE CONDENSED CONSOLIDATED FINANCIAL STATEMENTS (UNAUDITED)
Presentation on the Consolidated Balance Sheet
The following table summarizespresents a summary of the effectfair value of derivatives as reported in the consolidated balance sheet (dollars in millions):
|
| | | | | | | | | | | | | | | |
| | | | Fair Value |
| | Notional | | Asset(1) | | Liability(2) | | Net(3) |
| September 30, 2018 | | | | | | | |
| Interest rate contracts: | | | | | | | |
| Fair value hedges | $ | 8,109 |
| | $ | 11 |
| | $ | — |
| | $ | 11 |
|
Total derivatives designated as hedging instruments(4) | $ | 8,109 |
| | $ | 11 |
| | $ | — |
| | $ | 11 |
|
| December 31, 2017 | | | | | | | |
| Interest rate contracts: | | | | | | | |
| Fair value hedges | $ | 8,609 |
| | $ | 131 |
| | $ | (14 | ) | | $ | 117 |
|
Total derivatives designated as hedging instruments(4) | $ | 8,609 |
| | $ | 131 |
| | $ | (14 | ) | | $ | 117 |
|
| |
| (1) | Reflected in the other assets line item on the consolidated balance sheet. |
| |
| (2) | Reflected in the other liabilities line item on the consolidated balance sheet. |
| |
| (3) | Represents net fair value of derivative instruments for disclosure purposes only. |
| |
| (4) | All derivatives were designated as hedging instruments at September 30, 2018 and December 31, 2017. |
The following table presents the cumulative basis adjustments related to the carrying amount of hedged assets in fair value hedging relationships (dollars in millions): |
| | | | | | | | | | | |
| | | | Cumulative Amount of Fair Value Hedging Basis Adjustment Included in Carrying Amount of Hedged Assets(2) |
| | Carrying Amount of Hedged Assets(1) | | Total | | Discontinued |
| September 30, 2018 | | | | | |
Available-for-sale securities(3) | $ | 11,487 |
| | $ | (361 | ) | | $ | (272 | ) |
| |
| (1) | The carrying amount includes the impact of basis adjustments on active fair value hedges and the impact of basis adjustments from previously discontinued fair value hedges. |
| |
| (2) | Represents the increase (decrease) to the carrying amount of hedged assets. The discontinued portion of the cumulative amount of fair value hedging basis adjustments is amortized into net interest income using the effective interest method over the expected remaining life of the hedged items. |
| |
| (3) | Includes the amortized cost basis of closed portfolios of prepayable securities designated in hedging relationships in which the hedged item is the last layer of principal expected to be remaining throughout the hedge term. As of September 30, 2018, the amortized cost basis of this portfolio was $831 million, the amount of the designated hedged items was $192 million and the cumulative basis adjustments associated with these hedges was $1 million. |
E*TRADE Q3 2018 10-Q | Page 85
E*TRADE FINANCIAL CORPORATION
NOTES TO THE CONDENSED CONSOLIDATED FINANCIAL STATEMENTS (UNAUDITED)
Presentation on the Consolidated Statement of Income
The following table presents the effects of fair value hedge accounting on the consolidated statement of income (dollars in millions): |
| | | | | | | |
| | Interest Income |
| | Three Months Ended September 30, 2018 | | Nine Months Ended September 30, 2018 |
| Total interest income | $ | 514 |
| | $ | 1,471 |
|
| | | | |
Effects of fair value hedging on total interest income(1)(2) | | | |
| Agency debentures: | | | |
| Amounts recognized as interest accruals on derivatives | (1 | ) | | (4 | ) |
| Changes in fair value of hedged items | (8 | ) | | (74 | ) |
| Changes in fair value of derivatives | 8 |
| | 74 |
|
| Net loss on fair value hedging relationships - agency debentures | (1 | ) | | (4 | ) |
| | | | |
| Agency mortgage backed securities: | | | |
| Amounts recognized as interest accruals on derivatives | 1 |
| | (14 | ) |
| Amortization of basis adjustments from discontinued hedges | 7 |
| | 16 |
|
| Changes in fair value of hedged items | (88 | ) | | (416 | ) |
| Changes in fair value of derivatives | 83 |
| | 403 |
|
| Net gain (loss) on fair value hedging relationships - agency mortgage backed securities | 3 |
| | (11 | ) |
| Total net gain (loss) on fair value hedging relationships | $ | 2 |
| | $ | (15 | ) |
| |
| (1) | Excludes interest income accruals on hedged items and amounts recognized upon the sale of securities attributable to fair value hedge accounting. |
| |
| (2) | Excludes interest on variation margin related to centrally cleared derivative contracts. |
E*TRADE Q3 2018 10-Q | Page 86
E*TRADE FINANCIAL CORPORATION
NOTES TO THE CONDENSED CONSOLIDATED FINANCIAL STATEMENTS (UNAUDITED)
The following table presents the changes in fair value of interest rate derivative contracts designated as fair value hedges and related hedged items as reflected on the consolidated statement of income for the three and nine months ended September 30, 2017 and 2016 (dollars in millions): |
| | | | | | | | | | | |
| | Three Months Ended September 30, 2017 |
| | Hedging Instrument | | Hedged Item | | Hedge Ineffectiveness(1) |
| Agency debentures | $ | (1 | ) | | $ | 1 |
| | $ | — |
|
| Agency mortgage-backed securities | 4 |
| | (6 | ) | | (2 | ) |
| Total gains (losses) included in earnings | $ | 3 |
| | $ | (5 | ) | | $ | (2 | ) |
| |
| (1) | Reflected in the gains on securities and other, net line item on the consolidated statement of income. |
| | | | Three Months Ended September 30, | | | | | | | |
| | 2017 | | 2016 | Nine Months Ended September 30, 2017 |
| | Hedging Instrument | | Hedged Item | | Hedge Ineffectiveness(1) | | Hedging Instrument | | Hedged Item | | Hedge Ineffectiveness(1) | Hedging Instrument | | Hedged Item | | Hedge Ineffectiveness(1) |
| Agency debentures | $ | (1 | ) | | $ | 1 |
| | $ | — |
| | $ | 1 |
| | $ | (3 | ) | | $ | (2 | ) | $ | (7 | ) | | $ | 7 |
| | $ | — |
|
| Agency mortgage-backed securities | 4 |
| | (6 | ) | | (2 | ) | | 14 |
| | (16 | ) | | (2 | ) | (29 | ) | | 24 |
| | (5 | ) |
| Total gains (losses) included in earnings | $ | 3 |
| | $ | (5 | ) | | $ | (2 | ) | | $ | 15 |
| | $ | (19 | ) | | $ | (4 | ) | $ | (36 | ) | | $ | 31 |
| | $ | (5 | ) |
| | | | | | | | | | | | | |
| | Nine Months Ended September 30, | |
| | 2017 | | 2016 | |
| | Hedging Instrument | | Hedged Item | | Hedge Ineffectiveness(1) | | Hedging Instrument | | Hedged Item | | Hedge Ineffectiveness(1) | |
| Agency debentures | $ | (7 | ) | | $ | 7 |
| | $ | — |
| | $ | (89 | ) | | $ | 85 |
| | $ | (4 | ) | |
| Agency mortgage-backed securities | (29 | ) | | 24 |
| | (5 | ) | | (100 | ) | | 96 |
| | (4 | ) | |
| Total gains (losses) included in earnings | $ | (36 | ) | | $ | 31 |
| | $ | (5 | ) | | $ | (189 | ) | | $ | 181 |
| | $ | (8 | ) | |
| |
| (1) | Reflected in the gains on securities and other, net line item on the consolidated statement of income. |
Deposits are summarized as followsThe following table presents the significant components of deposits (dollars in millions): | | | | Amount | | Weighted-Average Rate | Amount | | Weighted-Average Rate |
| | September 30, 2017 | | December 31, 2016 | | September 30, 2017 | | December 31, 2016 | September 30, 2018 | | December 31, 2017 | | September 30, 2018 | | December 31, 2017 |
| Sweep deposits | $ | 36,507 |
| | $ | 26,362 |
| | 0.01 | % | | 0.01 | % | $ | 37,998 |
| | $ | 37,734 |
| | 0.15 | % | | 0.01 | % |
| Savings deposits | 3,011 |
| | 3,185 |
| | 0.01 | % | | 0.01 | % | 3,145 |
| | 2,912 |
| | 0.40 | % | | 0.01 | % |
Other deposits(2)(1) | 2,025 |
| | 2,135 |
| | 0.03 | % | | 0.03 | % | 1,931 |
| | 2,096 |
| | 0.03 | % | | 0.03 | % |
| Total deposits | $ | 41,543 |
| | $ | 31,682 |
| | 0.01 | % | | 0.01 | % | $ | 43,074 |
| | $ | 42,742 |
| | 0.17 | % | | 0.01 | % |
| |
| (1) | Includes checking deposits, money market deposits and time deposits. |
| |
(2) | certificates of deposit. As of September 30, 20172018 and December 31, 2016,2017, the Company had $202$193 million and $177$207 million in non-interest bearing deposits, respectively. |
|
| | |
E*TRADE | Q3 2017 10-Q | | 77NOTE 10—OTHER BORROWINGS |
NOTE 9—OTHER BORROWINGS
Otherother borrowings at September 30, 2017 and December 31, 2016 are summarized as follows (dollars in millions): | | | | September 30, | | December 31, | | | | | |
| | 2017 | | 2016 | September 30, 2018 | | December 31, 2017 |
| FHLB advances | $ | 200 |
| | $ | — |
| $ | 550 |
| | $ | 500 |
|
Trust preferred securities (1) | 409 |
| | 409 |
| |
| Trust preferred securities | | — |
| | 410 |
|
| Total other borrowings | $ | 609 |
| | $ | 409 |
| $ | 550 |
| | $ | 910 |
|
| |
(1) | Trust preferred securities begin maturing in 2031. |
During the three months ended September 30, 2018, the Company redeemed $413 million of its outstanding TRUPs. In connection with the redemption, the Company recognized a loss on early extinguishment of debt of $4 million, consisting of the difference between the carrying value of the TRUPs redeemed, including unamortized debt issuance costs, and the total cash amount paid, including related
E*TRADE Q3 2018 10-Q | Page 87
E*TRADE FINANCIAL CORPORATION
NOTES TO THE CONDENSED CONSOLIDATED FINANCIAL STATEMENTS (UNAUDITED)
fees and expenses. Net proceeds from the June 2018 issuance of $420 million Senior Notes were used to redeem the TRUPs. See Note 11—Corporate Debt and Note 15—Commitments, Contingencies and Other Regulatory Matters.
External Lines of Credit maintained at E*TRADE Securities
E*TRADE Securities' external liquidity lines total approximately $1.1$1.3 billion as of September 30, 20172018 and include the following:
A 364-day, $450$600 million senior unsecured committed revolving credit facility with a syndicate of banks, with a maturity date ofin June 20182019
Secured committed lines of credit with two unaffiliated banks, aggregating to $175 million, with a maturity date ofdates in June 20182019
Unsecured uncommitted lines of credit with twothree unaffiliated banks aggregating to $75$125 million, of which $50 million has a maturity date of June 20182019 and the remaining line has no maturity date
Secured uncommitted lines of credit with several unaffiliated banks aggregating to $375 million with no maturity date
The revolving credit facility contains maintenance covenants related to E*TRADE Securities' minimum consolidated tangible net worth and regulatory net capital ratio.ratio with which the Company was in compliance at September 30, 2018. There were no outstanding balances for these lines at September 30, 2017.2018.
|
| | |
E*TRADE | Q3 2017 10-Q | | 78NOTE 11—CORPORATE DEBT |
The following table presents the significant components of corporate debt (dollars in millions): |
| | | | | | | | | | | |
| | Face Value | | Discount | | Net |
| September 30, 2018 | | | | | |
| Interest-bearing notes: | | | | | |
| 2.95% Senior Notes, due 2022 | $ | 600 |
| | $ | (4 | ) | | $ | 596 |
|
| 3.80% Senior Notes, due 2027 | 400 |
| | (4 | ) | | 396 |
|
| 4.50% Senior Notes, due 2028 | 420 |
| | (4 | ) | | 416 |
|
| Total corporate debt | $ | 1,420 |
| | $ | (12 | ) | | $ | 1,408 |
|
|
| | | | | | | | | | | |
| December 31, 2017 | | | | | |
| Interest-bearing notes: | | | | | |
| 2.95% Senior Notes, due 2022 | $ | 600 |
| | $ | (5 | ) | | $ | 595 |
|
| 3.80% Senior Notes, due 2027 | 400 |
| | (4 | ) | | 396 |
|
| Total corporate debt | $ | 1,000 |
| | $ | (9 | ) | | $ | 991 |
|
E*TRADE Q3 2018 10-Q | Page 88
NOTE 10—CORPORATE DEBT
Corporate debt at September 30, 2017 and December 31, 2016 is outlined in the following table (dollars in millions): |
| | | | | | | | | | | |
| | Face Value | | Discount | | Net |
| September 30, 2017 | | | | | |
| Interest-bearing notes: | | | | | |
| 2.95% Notes, due 2022 | $ | 600 |
| | $ | (5 | ) | | $ | 595 |
|
| 3.80% Notes, due 2027 | 400 |
| | (4 | ) | | 396 |
|
| Total corporate debt | $ | 1,000 |
| | $ | (9 | ) | | $ | 991 |
|
|
| | | | | | | | | | | |
| December 31, 2016 | | | | | |
| Interest-bearing notes: | | | | | |
| 5.375% Notes, due 2022 | $ | 540 |
| | $ | (5 | ) | | $ | 535 |
|
| 4.625% Notes, due 2023 | 460 |
| | (4 | ) | | 456 |
|
| Total interest-bearing notes | 1,000 |
| | (9 | ) | | 991 |
|
| Non-interest-bearing debt: | | | | | |
| 0% Convertible debentures, due 2019 | 3 |
| | — |
| | 3 |
|
| Total corporate debt | $ | 1,003 |
| | $ | (9 | ) | | $ | 994 |
|
E*TRADE FINANCIAL CORPORATION
NOTES TO THE CONDENSED CONSOLIDATED FINANCIAL STATEMENTS (UNAUDITED)
Issuance of Corporate Debt
During the three months ended SeptemberJune 30, 2017,2018, the Company issued $1 billion$420 million in aggregate principal amount of Senior Notes in two tranches.due 2028. The first tranche of $600 million aggregate principal amount of Senior Notes due 2022 bearsbear interest at an annual rate of 2.95%4.50% and will mature on August 24, 2022.June 20, 2028. The second tranche of $400 million aggregate principal amount of Senior Notes due 2027 bears interest at an annual rate of 3.80% and will mature on August 24, 2027 (together with the first tranche, the “Notes”). The Notes will beare our general unsecured senior obligations and rank equally in right of payment with all of our other unsecured seniorexisting and future unsubordinated indebtedness. The Senior Notes will effectively rank junior to our secured indebtedness, if any, to the extent of the collateral securing such indebtedness, and are structurally subordinated to all liabilities of our subsidiaries. The Senior Notes willare not be guaranteed by ourthe subsidiaries.
The netCompany used the proceeds from the saleissuance of the Notes were used, along with existing corporate cash, to redeem all $540 million aggregate principal amount of our outstanding 5.375% Senior Notes due 2022 and all $460 million aggregate principal amount of our outstanding 4.625% Senior Notes due 2023, including associated redemption premiums, accrued interest, and related fees and expenses. In connection withfor the redemption we recognized a loss on early extinguishment of debt of approximately $58 million, consisting of the difference between the carrying valueTRUPs issued by ETB Holdings, a subsidiary of the debt redeemedE*TRADE Financial. For additional information about TRUPs, see Note 10—Other Borrowings and total cash amount paid (including related feesNote 15—Commitments, Contingencies and expenses), together with the unamortized debt issuance costs.
Conversions of Convertible Debentures
During the nine months ended September 30, 2017, $3 million of the Company’s convertible debentures were converted into 0.3 million shares of common stock.Other Regulatory Matters.
Credit Facility
On June 23,In 2017, wethe Company entered into ana new $300 million unsecured committed revolving credit facility with certain lenders which replaced our previous secured committed revolving credit facility entered into in November 2014 and increased our total borrowing capacity under the facility to $300 million.will mature on June 23, 2020. The Company has the ability to borrow against the credit facility for working capital and general corporate purposes. The unsecured
|
| | |
E*TRADE | Q3 2017 10-Q | | 79 |
committed revolving credit facility will mature on June 23, 2020.has terms which include financial maintenance covenants, with which the Company was in compliance at September 30, 2018. At September 30, 2017,2018, there was no outstanding balance under this revolving credit facility.
E*TRADE Q3 2018 10-Q | Page 89
NOTE 11—
E*TRADE FINANCIAL CORPORATION
NOTES TO THE CONDENSED CONSOLIDATED FINANCIAL STATEMENTS (UNAUDITED)
|
|
| NOTE 12—SHAREHOLDERS' EQUITY |
Preferred Stock
The following table presents the preferred stock outstanding (in millions except total shares outstanding and per share data): |
| | | | | | | | | | | | | | | | | | | |
| | | | | | | | | | | Carrying Value at |
| Description | | Issuance Date | | Per Annum Dividend Rate | | Total Shares Outstanding | | Liquidation Preference per Share | | September 30, 2018 | | December 31, 2017 |
| Series A | | | | | | | | | | | | |
| Fixed-to-Floating Rate Non-Cumulative | | 8/25/2016 | | 5.875% to, but excluding, 9/15/2026; 3-mo LIBOR + 4.435% thereafter | | 400,000 |
| | $ | 1,000 |
| | $ | 394 |
| | $ | 394 |
|
| Series B | | | | | | | | | | | | |
| Fixed-to-Floating Rate Non-Cumulative | | 12/6/2017 | | 5.30% to, but excluding, 3/15/2023; 3-mo LIBOR + 3.16% thereafter | | 3,000 |
| | $ | 100,000 |
| | 295 |
| | 295 |
|
| Total | | | | | | 403,000 |
| | | | $ | 689 |
| | $ | 689 |
|
The following table presents the cash dividend paid on preferred stock (in millions except per share data): |
| | | | | | | | | | | | | | | | | | | | | | | | | | |
| Nine Months Ended September 30, 2018 | | Nine Months Ended September 30, 2017 |
| Declaration Date | | Record Date | | Payment Date | | Dividend per Share | | Dividend Paid | | Declaration Date | | Record Date | | Payment Date | | Dividend per Share | | Dividend Paid |
Series A (1) | | | | | | | | | | | | | | | | | | |
| 2/8/2018 | | 2/28/2018 | | 3/15/2018 | | $ | 29.38 |
| | $ | 12 |
| | 2/2/2017 | | 2/28/2017 | | 3/15/2017 | | $ | 32.64 |
| | $ | 13 |
|
| 7/26/2018 | | 8/31/2018 | | 9/17/2018 | | $ | 29.38 |
| | 12 |
| | 8/2/2017 | | 8/31/2017 | | 9/15/2017 | | $ | 29.38 |
| | 12 |
|
Series B (1) | | | | | | | | | | | | | | | | | | |
| 7/26/2018 | | 8/31/2018 | | 9/17/2018 | | $ | 4,107.50 |
| | 12 |
| | | | | | | | | | |
| Total | | | | | | | | $ | 36 |
| | | | | | | | | | $ | 25 |
|
| |
| (1) | Dividends are non-cumulative and payable semi-annually, if declared. |
Common Stock
Dividend on Common Stock
On October 17, 2018, the Company's Board of Directors declared a quarterly cash dividend of $0.14 per share on the Company's outstanding shares of common stock. The dividend is payable on November 15, 2018, to shareholders of record as of the close of business on October 30, 2018.
Employee Stock Purchase Plan
In May 2018, the shareholders of the Company approved the 2018 Employee Stock Purchase Plan (the "2018 Plan"), and reserved 4.0 million shares of common stock for sale to employees at a price no less than 85% of the fair market value per share of the common stock on the purchase date. The Company currently offers six month enrollment periods at the end of which employees can purchase shares of the Company's
E*TRADE Q3 2018 10-Q | Page 90
E*TRADE FINANCIAL CORPORATION
NOTES TO THE CONDENSED CONSOLIDATED FINANCIAL STATEMENTS (UNAUDITED)
common stock at a price equal to 95% of the closing market price on the date of purchase. The initial offering period began on September 1, 2018. No share-based compensation expense was recorded in connection with the 2018 Plan as it was deemed non-compensatory. No shares were purchased under the plan during the three or nine months ended September 30, 2018.
Share Repurchases
During the third quarter of 2018, the Company completed its prior $1 billion share repurchase program with the repurchase of 5.3 million shares of common stock at an average price of $58.74 per share, or $310 million. As of September 30, 2018, the Company had repurchased 19.5 million shares of common stock at an average price of $51.38 per share, for a total of $1 billion since the Company began repurchasing shares under this authorization in the third quarter of 2017. The Company accounts for share repurchases retired after repurchase by allocating the excess repurchase price over par to additional paid-in-capital. In October 2018, the Company announced that its Board of Directors has authorized a new $1 billion share repurchase program.
Other Common Stock Activity
Other common stock activity includes shares withheld to pay taxes for share-based compensation, exercises of stock options, and other activity. During the nine months ended September 30, 2017, it also includes $3 million of conversion of the Company's convertible debentures into 0.3 million shares of common stock. There were no conversions of convertible debentures during the nine months ended September 30, 2018.
E*TRADE Q3 2018 10-Q | Page 91
E*TRADE FINANCIAL CORPORATION
NOTES TO THE CONDENSED CONSOLIDATED FINANCIAL STATEMENTS (UNAUDITED)
Accumulated Other Comprehensive Loss
The following tables present after-tax changes in each component of accumulated other comprehensive income (loss) for the nine months ended September 30, 2017 and 2016loss (dollars in millions): |
| | | | | | | | | | | |
| | Available-for-Sale Securities | | Foreign Currency Translation | | Total |
| Balance, December 31, 2016 | $ | (139 | ) | | $ | 2 |
| | $ | (137 | ) |
| Other comprehensive income before reclassifications | 46 |
| | — |
| | 46 |
|
| Amounts reclassified from accumulated other comprehensive loss | (5 | ) | | (2 | ) | | (7 | ) |
| Net change | 41 |
|
| (2 | ) |
| 39 |
|
| Balance, March 31, 2017 | $ | (98 | ) |
| $ | — |
|
| $ | (98 | ) |
| Other comprehensive income before reclassifications | 42 |
| | — |
| | 42 |
|
| Amounts reclassified from accumulated other comprehensive loss | (6 | ) | | — |
| | (6 | ) |
| Net change | 36 |
| | — |
| | 36 |
|
| Balance, June 30, 2017 | $ | (62 | ) | | $ | — |
| | $ | (62 | ) |
| Other comprehensive income before reclassifications | 16 |
| | — |
| | 16 |
|
| Amounts reclassified from accumulated other comprehensive loss | (4 | ) | | — |
| | (4 | ) |
| Net change | 12 |
| | — |
| | 12 |
|
| Balance, September 30, 2017 | $ | (50 | ) | | $ | — |
| | $ | (50 | ) |
|
| | | |
| | Total (1) |
| Balance, December 31, 2017 | $ | (26 | ) |
| Other comprehensive loss before reclassifications | (128 | ) |
| Amounts reclassified from accumulated other comprehensive loss | (7 | ) |
Transfer of held-to-maturity securities to available-for-sale securities(2) | 6 |
|
| Net change | (129 | ) |
| Cumulative effect of hedge accounting adoption | (7 | ) |
| Reclassification of tax effects due to federal tax reform | (14 | ) |
| Balance, March 31, 2018 | $ | (176 | ) |
| Other comprehensive loss before reclassifications | (51 | ) |
| Amounts reclassified from accumulated other comprehensive loss | (8 | ) |
| Net change | (59 | ) |
| Balance, June 30, 2018 | $ | (235 | ) |
| Other comprehensive loss before reclassifications | (86 | ) |
| Amounts reclassified from accumulated other comprehensive loss | (8 | ) |
| Net change | (94 | ) |
Balance, September 30, 2018(3) | $ | (329 | ) |
| |
| (1) | During the nine months ended September 30, 2018, the accumulated other comprehensive loss activity was related to available-for-sale securities. |
| |
| (2) | Securities with a carrying value of $4.7 billion and related unrealized pre-tax gain of $7 million, or $6 million net of tax, were transferred from held-to-maturity securities to available-for-sale securities during the three months ended March 31, 2018, as part of a one-time transition election for early adopting the new derivatives and hedge accounting guidance. See Note 1—Organization, Basis of Presentation and Summary of Significant Accounting Policies for additional information. |
| |
| (3) | Includes unamortized unrealized pre-tax losses of $23 million at September 30, 2018 of which $17 million is related to the transfer of available-for-sale securities to held-to-maturity securities during the three months ended March 31, 2018. |
|
| | |
E*TRADE | Q3 2017 10-Q | | 80 |
E*TRADE Q3 2018 10-Q | Page 92
E*TRADE FINANCIAL CORPORATION
NOTES TO THE CONDENSED CONSOLIDATED FINANCIAL STATEMENTS (UNAUDITED)
|
| | | | | | | | | | | |
| | Available-for-Sale Securities | | Foreign Currency Translation | | Total |
| Balance, December 31, 2015 | $ | (101 | ) | | $ | 2 |
| | $ | (99 | ) |
| Other comprehensive income before reclassifications | 94 |
| | — |
| | 94 |
|
| Amounts reclassified from accumulated other comprehensive loss | (9 | ) | | — |
| | (9 | ) |
| Net change | 85 |
| | — |
| | 85 |
|
| Balance, March 31, 2016 | $ | (16 | ) | | $ | 2 |
| | $ | (14 | ) |
| Other comprehensive income before reclassifications | 69 |
| | — |
| | 69 |
|
| Amounts reclassified from accumulated other comprehensive income | (9 | ) | | — |
| | (9 | ) |
| Net change | 60 |
| | — |
| | 60 |
|
| Balance, June 30, 2016 | $ | 44 |
| | $ | 2 |
| | $ | 46 |
|
| Other comprehensive income before reclassifications | 3 |
| | — |
| | 3 |
|
| Amounts reclassified from accumulated other comprehensive income | (10 | ) | | — |
| | (10 | ) |
| Net change | (7 | ) | | — |
| | (7 | ) |
| Balance, September 30, 2016 | $ | 37 |
| | $ | 2 |
| | $ | 39 |
|
The following table presents other comprehensive income activity and the related tax effect for the three and nine months ended September 30, 2017 and 2016 (dollars in millions): |
| | | | | | | | | | | | | | | | | | | | | | | |
| | Three Months Ended September 30, |
| | 2017 | | 2016 |
| | Before Tax | | Tax Effect | | After Tax | | Before Tax | | Tax Effect | | After Tax |
| Other comprehensive income | | | | | | | | | | | |
| Available-for-sale securities: | | | | | | | | | | | |
| Unrealized gains, net | $ | 26 |
| | $ | (10 | ) | | $ | 16 |
| | $ | 5 |
| | $ | (2 | ) | | $ | 3 |
|
| Reclassification into earnings, net | (7 | ) | | 3 |
| | (4 | ) | | (17 | ) | | 7 |
| | (10 | ) |
| Net change from available-for-sale securities | 19 |
| | (7 | ) | | 12 |
| | (12 | ) | | 5 |
| | (7 | ) |
| Other comprehensive income | $ | 19 |
| | $ | (7 | ) | | $ | 12 |
| | $ | (12 | ) | | $ | 5 |
| | $ | (7 | ) |
| |
| | Nine Months Ended September 30, |
| | 2017 | | 2016 |
| | Before Tax | | Tax Effect | | After Tax | | Before Tax | | Tax Effect | | After Tax |
| Other comprehensive income | | | | | | | | | | | |
| Available-for-sale securities: | | | | | | | | | | | |
| Unrealized gains, net | $ | 170 |
| | $ | (66 | ) | | $ | 104 |
| | $ | 269 |
| | $ | (103 | ) | | $ | 166 |
|
| Reclassification into earnings, net | (24 | ) | | 9 |
| | (15 | ) | | (46 | ) | | 18 |
| | (28 | ) |
| Net change from available-for-sale securities | 146 |
|
| (57 | ) |
| 89 |
| | 223 |
| | (85 | ) | | 138 |
|
| Reclassification of foreign currency translation gains | (2 | ) | | — |
| | (2 | ) | | — |
| | — |
| | — |
|
| Other comprehensive income | $ | 144 |
| | $ | (57 | ) | | $ | 87 |
| | $ | 223 |
| | $ | (85 | ) | | $ | 138 |
|
|
| | | | | | | | | | | |
| | Available-for-Sale Securities | | Foreign Currency Translation | | Total |
| Balance, December 31, 2016 | $ | (139 | ) | | $ | 2 |
| | $ | (137 | ) |
| Other comprehensive income before reclassifications | 46 |
| | — |
| | 46 |
|
| Amounts reclassified from accumulated other comprehensive loss | (5 | ) | | (2 | ) | | (7 | ) |
| Net change | 41 |
| | (2 | ) | | 39 |
|
| Balance, March 31, 2017 | $ | (98 | ) | | $ | — |
| | $ | (98 | ) |
| Other comprehensive income before reclassifications | 42 |
| | — |
| | 42 |
|
| Amounts reclassified from accumulated other comprehensive loss | (6 | ) | | — |
| | (6 | ) |
| Net change | 36 |
| | — |
| | 36 |
|
| Balance, June 30, 2017 | $ | (62 | ) | | $ | — |
| | $ | (62 | ) |
| Other comprehensive income before reclassifications | 16 |
| | — |
| | 16 |
|
| Amounts reclassified from accumulated other comprehensive loss | (4 | ) | | — |
| | (4 | ) |
| Net change | 12 |
| | — |
| | 12 |
|
| Balance, September 30, 2017 | $ | (50 | ) | | $ | — |
| | $ | (50 | ) |
|
| | |
E*TRADE | Q3 2017 10-Q | | 81 |
E*TRADE Q3 2018 10-Q | Page 93
E*TRADE FINANCIAL CORPORATION
NOTES TO THE CONDENSED CONSOLIDATED FINANCIAL STATEMENTS (UNAUDITED)
The following table presents other comprehensive income (loss) activity and the related tax effect (dollars in millions): |
| | | | | | | | | | | | | | | | | | | | | | | |
| | Three Months Ended September 30, |
| | 2018 | | 2017 |
| | Before Tax | | Tax Effect | | After Tax | | Before Tax | | Tax Effect | | After Tax |
| Other comprehensive income (loss) | | | | | | | | | | | |
| Available-for-sale securities: | | | | | | | | | | | |
| Unrealized gains (losses), net | $ | (112 | ) | | $ | 26 |
| | $ | (86 | ) | | $ | 26 |
| | $ | (10 | ) | | $ | 16 |
|
| Reclassification into earnings, net | (11 | ) | | 3 |
| | (8 | ) | | (7 | ) | | 3 |
| | (4 | ) |
| Net change from available-for-sale securities | (123 | ) | | 29 |
| | (94 | ) | | 19 |
| | (7 | ) | | 12 |
|
| Other comprehensive income (loss) | $ | (123 | ) | | $ | 29 |
| | $ | (94 | ) | | $ | 19 |
| | $ | (7 | ) | | $ | 12 |
|
| |
| | Nine Months Ended September 30, |
| | 2018 | | 2017 |
| | Before Tax | | Tax Effect | | After Tax | | Before Tax | | Tax Effect | | After Tax |
| Other comprehensive income (loss) | | | | | | | | | | | |
| Available-for-sale securities: | | | | | | | | | | | |
| Unrealized gains (losses), net | $ | (353 | ) | | $ | 88 |
| | $ | (265 | ) | | $ | 170 |
| | $ | (66 | ) | | $ | 104 |
|
| Reclassification into earnings, net | (32 | ) | | 9 |
| | (23 | ) | | (24 | ) | | 9 |
| | (15 | ) |
| Transfer of held-to-maturity securities to available-for-sale securities | 7 |
| | (1 | ) | | 6 |
| | — |
| | — |
| | — |
|
| Net change from available-for-sale securities | (378 | ) |
| 96 |
|
| (282 | ) | | 146 |
| | (57 | ) | | 89 |
|
| Reclassification of foreign currency translation gains | — |
| | — |
| | — |
| | (2 | ) | | — |
| | (2 | ) |
| Other comprehensive income (loss) | $ | (378 | ) | | $ | 96 |
| | $ | (282 | ) | | $ | 144 |
| | $ | (57 | ) | | $ | 87 |
|
E*TRADE Q3 2018 10-Q | Page 94
E*TRADE FINANCIAL CORPORATION
NOTES TO THE CONDENSED CONSOLIDATED FINANCIAL STATEMENTS (UNAUDITED)
The following table presents the consolidated statement of income line items impacted by reclassifications out of accumulated other comprehensive income (loss) for the three and nine months ended September 30, 2017 and 2016loss (dollars in millions): | | | Accumulated Other Comprehensive Income (Loss) Components | | Amounts Reclassified from Accumulated Other Comprehensive Income (Loss) | | Affected Line Items in the Consolidated Statement of Income | |
| Accumulated Other Comprehensive Loss Components | | | Amounts Reclassified from Accumulated Other Comprehensive Loss | | Affected Line Items in the Consolidated Statement of Income |
| | | Three Months Ended September 30, | | Nine Months Ended September 30, | | | | Three Months Ended September 30, | | Nine Months Ended September 30, | |
| | | 2017 | | 2016 | | 2017 | | 2016 | | | 2018 | | 2017 | | 2018 | | 2017 | |
| Available-for-sale securities: | | | | | | | | | | | $ | 12 |
| | $ | 7 |
| | $ | 34 |
| | $ | 24 |
| | Gains on securities and other, net |
| | | $ | 7 |
| | $ | 17 |
| | $ | 24 |
| | $ | 46 |
| | Gains on securities and other, net | | (1 | ) | | — |
| | (2 | ) | | — |
| | Interest income |
| | | (3 | ) | | (7 | ) | | (9 | ) | | (18 | ) | | Income tax expense | | 11 |
| | 7 |
| | 32 |
| | 24 |
| | Reclassification into earnings, before tax |
| | | $ | 4 |
| | $ | 10 |
| | $ | 15 |
| | $ | 28 |
| | Reclassification into earnings, net | | (3 | ) | | (3 | ) | | (9 | ) | | (9 | ) | | Income tax expense |
| | | | | | | | | | | | $ | 8 |
| | $ | 4 |
| | $ | 23 |
| | $ | 15 |
| | Reclassification into earnings, net |
| | | | | | | | | | | |
| Foreign currency translation: | | | | | | | | | | | $ | — |
| | $ | — |
| | $ | — |
| | $ | 2 |
| | Other non-interest expenses |
| | | $ | — |
| | $ | — |
| | $ | 2 |
| | $ | — |
| | Other non-interest expenses | | $ | — |
| | $ | — |
| | $ | — |
| | $ | 2 |
| | Reclassification into earnings, net |
| | | $ | — |
| | $ | — |
| | $ | 2 |
| | $ | — |
| | Reclassification into earnings, net | |
Preferred Stock Dividends
On February 2, 2017, the Company's Board of Directors declared a dividend of $32.64 per share, or $13 million, to holders of record of the Series A Preferred stock as of February 28, 2017. The dividend was paid on March 15, 2017. On August 2, 2017, the Company's Board of Directors declared a dividend of $29.38 per share, or $12 million, to holders of record of the Series A Preferred stock as of August 31, 2017. The dividend was paid on September 15, 2017.
Share Repurchases
On July 20, 2017, the Company announced that its Board of Directors authorized the repurchase of up to $1 billion of shares of its common stock. As of September 30, 2017, the Company repurchased a total of $187 million, or 4.6 million shares, of common stock under this program. As of September 30, 2017, $813 million remained available for additional repurchases. As of October 31, 2017, the Company has subsequently repurchased an additional 1.0 million shares of common stock at an average price of $43.53. The Company accounts for share repurchases retired after repurchase by allocating the excess repurchase price over par to additional paid-in-capital.
|
| | |
E*TRADE | Q3 2017 10-Q | | 82 |
NOTE 12—NOTE 13—EARNINGS PER SHARE
The following table presents a reconciliation of basic and diluted earnings per common share (in millions, except share data and per share amounts):
| | | | Three Months Ended September 30, | | Nine Months Ended September 30, | Three Months Ended September 30, | | Nine Months Ended September 30, |
| | 2017 | | 2016 | | 2017 | | 2016 | 2018 | | 2017 | | 2018 | | 2017 |
| | | | | | | | | | | | | | | |
| Net income | $ | 147 |
| | $ | 139 |
| | $ | 485 |
| | $ | 425 |
| $ | 285 |
| | $ | 147 |
| | $ | 782 |
| | $ | 485 |
|
| Preferred stock dividends | 12 |
| | — |
| | 25 |
| | — |
| |
| Less: Preferred stock dividends | | 24 |
| | 12 |
| | 36 |
| | 25 |
|
| Net income available to common shareholders | $ | 135 |
| | $ | 139 |
| | $ | 460 |
| | $ | 425 |
| $ | 261 |
| | $ | 135 |
| | $ | 746 |
| | $ | 460 |
|
| | | | | | | | | | | | | | | |
| Share data (in thousands): | | | | | | | | | | | | | | |
| Basic weighted-average shares outstanding | 273,441 |
| | 274,362 |
| | 274,565 |
| | 278,864 |
| 259,498 |
| | 273,441 |
| | 263,292 |
| | 274,565 |
|
| Effect of weighted average dilutive securities: | | | | | | | | |
| Effect of weighted-average dilutive securities: | | | | | | | | |
Restricted stock and options | 1,134 |
| | 792 |
| | 1,029 |
| | 861 |
| 1,147 |
| | 1,134 |
| | 1,125 |
| | 1,029 |
|
| Convertible debentures | 19 |
| | 318 |
| | 109 |
| | 411 |
| 16 |
| | 19 |
| | 16 |
| | 109 |
|
Diluted weighted-average shares outstanding | 274,594 |
| | 275,472 |
| | 275,703 |
| | 280,136 |
| 260,661 |
| | 274,594 |
| | 264,433 |
| | 275,703 |
|
| | | | | | | | | | | | | | | |
| Basic earnings per common share | $ | 0.49 |
| | $ | 0.51 |
| | $ | 1.67 |
| | $ | 1.53 |
| $ | 1.01 |
| | $ | 0.49 |
| | $ | 2.84 |
| | $ | 1.67 |
|
Diluted earnings per common share | $ | 0.49 |
| | $ | 0.51 |
| | $ | 1.67 |
| | $ | 1.52 |
| $ | 1.00 |
| | $ | 0.49 |
| | $ | 2.82 |
| | $ | 1.67 |
|
| |
| (1) | Includes dilutive restricted stock units and awards, employee stock purchase plan shares and stock options. |
| |
| (2) | The amount of certain restricted stock and options excluded from the calculations of diluted earnings per share due to the anti-dilutive effect was not material for the three and nine months ended September 30, 2018 and 2017. |
|
| | |
E*TRADE | Q3 2017 10-Q | | 83 |
E*TRADE Q3 2018 10-Q | Page 95
E*TRADE FINANCIAL CORPORATION
NOTES TO THE CONDENSED CONSOLIDATED FINANCIAL STATEMENTS (UNAUDITED)
|
|
| NOTE 14—REGULATORY REQUIREMENTS |
Broker-Dealer and FCM Capital Requirements
The Company’s U.S.Company's US broker-dealer, subsidiaryE*TRADE Securities, is subject to the Uniform Net Capital Rule under the Securities Exchange Act of 1934 administered by the SEC and FINRA, which requires the maintenance of minimum net capital. The minimum net capital requirements can be met under either the Aggregate Indebtedness method or the Alternative method. Under the Aggregate Indebtedness method, a broker-dealer is required to maintain net capital equal to or in excess of the greater of 6 2/3% of its aggregate indebtedness, as defined, or a minimum dollar amount. E*TRADE Securities has elected the Alternative method, under which it is required to maintain net capital equal to the greater of $250,000 or 2% of aggregate debit balances arising from customer transactions. The Company’s international broker-dealer subsidiary is subject to capital requirements determined by its respective regulator.
The Company’sCompany's FCM, subsidiary, E*TRADE Futures, is subject to CFTC net capital requirements, including the maintenance of adjusted net capital equal to or in excess of the greater of (1) $1,000,000, (2) the FCM's risk-based capital requirement, computed as 8% of the total risk margin requirements for all positions carried in customer and non-customer accounts, or (3) the amount of adjusted net capital required by the NFA.
At September 30, 20172018 and December 31, 2016,2017, all of the Company’s broker-dealer and FCM subsidiaries met applicable minimum net capital requirements. The following table below summarizespresents a summary of the minimum net capital requirements and excess capital for the Company’s broker-dealer and FCM subsidiaries at September 30, 2017 and December 31, 2016 (dollars in millions): | | | | Required Net Capital | | Net Capital | | Excess Net Capital | Required Net Capital | | Net Capital | | Excess Net Capital |
| September 30, 2017: | | | | | | |
| September 30, 2018: | | | | | | |
E*TRADE Securities(2)(1) | $ | 199 |
| | $ | 1,179 |
| | $ | 980 |
| $ | 248 |
| | $ | 1,443 |
| | $ | 1,195 |
|
E*TRADE Futures(2) | 4 |
| | 18 |
| | 14 |
| |
| E*TRADE Futures | | 3 |
| | 26 |
| | 23 |
|
| International broker-dealer | — |
| | 24 |
| | 24 |
| — |
| | 19 |
| | 19 |
|
| Total | $ | 203 |
| | $ | 1,221 |
| | $ | 1,018 |
| $ | 251 |
| | $ | 1,488 |
| | $ | 1,237 |
|
| December 31, 2016: | | | | | | |
| December 31, 2017: | | | | | | |
E*TRADE Securities(1) | $ | 158 |
| | $ | 969 |
| | $ | 811 |
| $ | 211 |
| | $ | 1,213 |
| | $ | 1,002 |
|
OptionsHouse(3) | 1 |
| | 22 |
| | 21 |
| |
| E*TRADE Futures | | 4 |
| | 19 |
| | 15 |
|
| International broker-dealer | — |
| | 21 |
| | 21 |
| — |
| | 19 |
| | 19 |
|
| Total | $ | 159 |
| | $ | 1,012 |
| | $ | 853 |
| $ | 215 |
| | $ | 1,251 |
| | $ | 1,036 |
|
| |
| (1) | Elected to use the Alternative method to compute required net capital. |
| |
(2) | E*TRADE Securities paid dividends of $220$360 million to the parent company during the nine months ended September 30, 2017. In August 2017, all brokerage accounts and brokerage customer-related assets and obligations of OptionsHouse were transferred in connection with the integration. Upon completion of this transaction OptionsHouse was renamed E*TRADE Futures and E*TRADE Securities' futures accounts and futures customer-related assets and obligations were transferred to E*TRADE Futures. |
| |
(3) | Elected to use the Aggregate Indebtedness method to compute net capital; however, as OptionsHouse was an FCM, the prescribed fixed-dollar minimum capital requirement was $1 million.2018. |
Bank Capital Requirements
E*TRADE Financial and its bank subsidiaries, E*TRADE Bank and E*TRADE Savings Bank, are subject to various regulatory capital requirements administered by federal banking agencies. Failure to meet minimum capital requirements can trigger certain mandatory and possibly additional discretionary actions by regulators that, if undertaken, could have a direct material effect on E*TRADE Financial’s and E*TRADE Bank’sthe financial condition and results of operations.operations of these entities. Under capital adequacy guidelines and the regulatory framework for prompt corrective action, E*TRADE Financial and E*TRADE Bankthese entities must meet specific capital guidelines that involve quantitative measures of assets, liabilities and certain off-balance sheet items as calculated under regulatory accounting practices. In addition,
E*TRADE BankQ3 2018 10-Q | Page 96
E*TRADE FINANCIAL CORPORATION
NOTES TO THE CONDENSED CONSOLIDATED FINANCIAL STATEMENTS (UNAUDITED)
addition, the Company's bank subsidiaries may not pay dividends to the parent company without the non-
|
| | |
E*TRADE | Q3 2017 10-Q | | 84 |
objection,non-objection, or in certain cases the approval, of itstheir regulators, and any loans by E*TRADE Bankthe bank subsidiaries to the parent company and its other non-bank subsidiaries are subject to various quantitative, arm’s length, collateralization and other requirements. E*TRADE Financial’s and E*TRADE Bank’sThe capital amounts and classificationclassifications of these entities are also subject to qualitative judgments by the regulators about components, risk weightings and other factors.
Quantitative measures established by regulation to ensure capital adequacy require E*TRADE Financial and E*TRADE Bankthese entities to meet minimum Tier 1 leverage, common equity Tier 1 capital, Tier 1 risk-based capital and total risk-based capital ratios. Events beyond management's control, such as deterioration in credit markets, could adversely affect future earnings and E*TRADE Financial’s and E*TRADE Bank’stheir ability to meet future capital requirements. E*TRADE Financial, E*TRADE Bank and E*TRADE Savings Bank were categorized as "well capitalized" under the regulatory framework for prompt corrective action for the periods presented in the following table below (dollars in millions): |
| | | | | | | | | | | | | | | | | | | | | | | | | | | | | | | | | | | |
| | September 30, 2017 | | December 31, 2016 |
| | Actual | | Well Capitalized Minimum Capital | | Excess Capital | | Actual | | Well Capitalized Minimum Capital | | Excess Capital |
| | Amount | | Ratio | | Amount | | Ratio | | Amount | | Amount | | Ratio | | Amount | | Ratio | | Amount |
E*TRADE Financial(1) | | | | | | | | | | | | | | | | | | | |
| Tier 1 leverage | $ | 4,100 |
| | 7.2 | % | | $ | 2,862 |
| | 5.0 | % | | $ | 1,238 |
| | $ | 3,610 |
| | 7.8 | % | | $ | 2,316 |
| | 5.0 | % | | $ | 1,294 |
|
| Common equity Tier 1 capital | $ | 3,818 |
| | 35.2 | % | | $ | 706 |
| | 6.5 | % | | $ | 3,112 |
| | $ | 3,483 |
| | 37.0 | % | | $ | 612 |
| | 6.5 | % | | $ | 2,871 |
|
| Tier 1 risk-based capital | $ | 4,100 |
| | 37.8 | % | | $ | 868 |
| | 8.0 | % | | $ | 3,232 |
| | $ | 3,610 |
| | 38.3 | % | | $ | 754 |
| | 8.0 | % | | $ | 2,856 |
|
| Total risk-based capital | $ | 4,608 |
| | 42.4 | % | | $ | 1,085 |
| | 10.0 | % | | $ | 3,523 |
| | $ | 4,148 |
| | 44.0 | % | | $ | 942 |
| | 10.0 | % | | $ | 3,206 |
|
| | | | September 30, 2017 | | December 31, 2016 | September 30, 2018 | | December 31, 2017 |
| | Actual | | Well Capitalized Minimum Capital | | Excess Capital | | Actual | | Well Capitalized Minimum Capital | | Excess Capital | Actual | | Well Capitalized Minimum Capital | | Excess Capital | | Actual | | Well Capitalized Minimum Capital | | Excess Capital |
| | Amount | | Ratio | | Amount | | Ratio | | Amount | | Amount | | Ratio | | Amount | | Ratio | | Amount | Amount | | Ratio | | Amount | | Ratio | | Amount | | Amount | | Ratio | | Amount | | Ratio | | Amount |
E*TRADE Bank(1) | | | | | | | | | | | | | | | | | | | | |
E*TRADE Financial(1) | | E*TRADE Financial(1) |
| Tier 1 leverage | $ | 3,564 |
| | 7.7 | % | | $ | 2,323 |
| | 5.0 | % | | $ | 1,241 |
| | $ | 3,132 |
| | 8.8 | % | | $ | 1,786 |
| | 5.0 | % | | $ | 1,346 |
| $ | 4,388 |
| | 7.1 | % | | $ | 3,098 |
| | 5.0 | % | | $ | 1,290 |
| | $ | 4,386 |
| | 7.4 | % | | $ | 2,976 |
| | 5.0 | % | | $ | 1,410 |
|
| Common equity Tier 1 capital | $ | 3,564 |
| | 35.5 | % | | $ | 653 |
| | 6.5 | % | | $ | 2,911 |
| | $ | 3,132 |
| | 38.3 | % | | $ | 532 |
| | 6.5 | % | | $ | 2,600 |
| $ | 3,699 |
| | 34.1 | % | | $ | 705 |
| | 6.5 | % | | $ | 2,994 |
| | $ | 3,773 |
| | 33.9 | % | | $ | 722 |
| | 6.5 | % | | $ | 3,051 |
|
| Tier 1 risk-based capital | $ | 3,564 |
| | 35.5 | % | | $ | 803 |
| | 8.0 | % | | $ | 2,761 |
| | $ | 3,132 |
| | 38.3 | % | | $ | 655 |
| | 8.0 | % | | $ | 2,477 |
| $ | 4,388 |
| | 40.5 | % | | $ | 867 |
| | 8.0 | % | | $ | 3,521 |
| | $ | 4,386 |
| | 39.5 | % | | $ | 889 |
| | 8.0 | % | | $ | 3,497 |
|
| Total risk-based capital | $ | 3,658 |
| | 36.4 | % | | $ | 1,004 |
| | 10.0 | % | | $ | 2,654 |
| | $ | 3,237 |
| | 39.5 | % | | $ | 819 |
| | 10.0 | % | | $ | 2,418 |
| $ | 4,429 |
| | 40.9 | % | | $ | 1,084 |
| | 10.0 | % | | $ | 3,345 |
| | $ | 4,874 |
| | 43.8 | % | | $ | 1,111 |
| | 10.0 | % | | $ | 3,763 |
|
E*TRADE Bank(1)(2) | | E*TRADE Bank(1)(2) |
| Tier 1 leverage | | $ | 3,466 |
| | 7.1 | % | | $ | 2,442 |
| | 5.0 | % | | $ | 1,024 |
| | $ | 3,620 |
| | 7.6 | % | | $ | 2,394 |
| | 5.0 | % | | $ | 1,226 |
|
| Common equity Tier 1 capital | | $ | 3,466 |
| | 34.6 | % | | $ | 652 |
| | 6.5 | % | | $ | 2,814 |
| | $ | 3,620 |
| | 35.7 | % | | $ | 660 |
| | 6.5 | % | | $ | 2,960 |
|
| Tier 1 risk-based capital | | $ | 3,466 |
| | 34.6 | % | | $ | 802 |
| | 8.0 | % | | $ | 2,664 |
| | $ | 3,620 |
| | 35.7 | % | | $ | 812 |
| | 8.0 | % | | $ | 2,808 |
|
| Total risk-based capital | | $ | 3,507 |
| | 35.0 | % | | $ | 1,003 |
| | 10.0 | % | | $ | 2,504 |
| | $ | 3,694 |
| | 36.4 | % | | $ | 1,015 |
| | 10.0 | % | | $ | 2,679 |
|
E*TRADE Savings Bank(1) | | E*TRADE Savings Bank(1) |
| Tier 1 leverage | | $ | 1,442 |
| | 26.0 | % | | $ | 277 |
| | 5.0 | % | | $ | 1,165 |
| | $ | 904 |
| | 26.6 | % | | $ | 170 |
| | 5.0 | % | | $ | 734 |
|
| Common equity Tier 1 capital | | $ | 1,442 |
| | 166.5 | % | | $ | 56 |
| | 6.5 | % | | $ | 1,386 |
| | $ | 904 |
| | 111.1 | % | | $ | 53 |
| | 6.5 | % | | $ | 851 |
|
| Tier 1 risk-based capital | | $ | 1,442 |
| | 166.5 | % | | $ | 69 |
| | 8.0 | % | | $ | 1,373 |
| | $ | 904 |
| | 111.1 | % | | $ | 65 |
| | 8.0 | % | | $ | 839 |
|
| Total risk-based capital | | $ | 1,443 |
| | 166.5 | % | | $ | 87 |
| | 10.0 | % | | $ | 1,356 |
| | $ | 905 |
| | 111.2 | % | | $ | 81 |
| | 10.0 | % | | $ | 824 |
|
| |
| (1) | The Basel III final rule introducesincludes a capital conservation buffer that limits a banking organization’s ability to make capital distributions and discretionary bonus payments to executive officers if a banking organization fails to maintain a Common Equity Tier 1 capital conservation buffer of more than 2.5%, on a fully phased-in basis, of total risk-weighted assets above each of the following minimum risk-based capital ratio requirements: Common Equity Tier 1 capital (4.5%), Tier 1 risk-based capital (6.0%), and totalTotal risk-based capital (8.0%). This requirement was effective beginning on January 1, 2016, and will be fully phased-in by 2019. See Overview—Regulatory DevelopmentsPart I. Item 1. Business—Regulation in our Annual Report on Form 10-K for the year ended December 31, 2017 for additional information.
|
| |
| (2) | E*TRADE Bank paid net dividends of $363 million to the parent company during the nine months ended September 30, 2018. |
|
| | |
E*TRADE | Q3 2017 10-Q | | 85 |
E*TRADE Q3 2018 10-Q | Page 97
E*TRADE FINANCIAL CORPORATION
NOTES TO THE CONDENSED CONSOLIDATED FINANCIAL STATEMENTS (UNAUDITED)
|
|
| NOTE 15—COMMITMENTS, CONTINGENCIES AND OTHER REGULATORY MATTERS |
The Company reviews its lawsuits, regulatory inquiries and other legal proceedings on an ongoing basis and provides disclosure and records loss contingencies in accordance with the loss contingencies accounting guidance. The Company establishes an accrual for losses at management's best estimate when it assesses that it is probable that a loss has been incurred and the amount of the loss can be reasonably estimated. The Company monitors these matters for developments that would affect the likelihood of a loss and the accrued amount, if any, and adjusts the amount as appropriate.
Litigation Matters
On October 27, 2000, Ajaxo, Inc. (Ajaxo) filed a complaint in the Superior Court for the State of California, County of Santa Clara. Ajaxo sought damages and certain non-monetary relief for the Company’s alleged breach of a non-disclosure agreement with Ajaxo pertaining to certain wireless technology that Ajaxo offered the Company as well as damages and other relief against the Company for their alleged misappropriation of Ajaxo’s trade secrets. Following a jury trial, a judgment was entered in 2003 in favor of Ajaxo against the Company for $1 million for breach of the Ajaxo non-disclosure agreement. The trial court subsequently denied Ajaxo’s requests for additional damages and relief following which Ajaxo appealed. Although the Company paid Ajaxo the full amount due on the above-described judgment, the case was remanded back to the trial court by the California Court of Appeal, and on May 30, 2008, a jury returned a verdict in favor of the Company denying all claims raised and demands for damages against the Company. After various appeals the case was again remanded back to the trial court. Following the third trial of thein this matter, in a Judgment and Statement of Decision filed September 16, 2015, the Court denied all claims for royalties by Ajaxo. Ajaxo’s post-trial motions were denied. Ajaxo has appealed to the Court of Appeal,Appeals, Sixth District. Briefing of this appeal is expected to continue to November 21, 2017. The Company will continue to defend itself vigorously in this matter.
On May 16, 2011, Droplets Inc., the holder of two patents pertaining to user interface servers, filed a complaint in the U.S.US District Court for the Eastern District of Texas against E*TRADE Financial Corporation, E*TRADE Securities, E*TRADE Bank and multiple other unaffiliated financial services firms. The plaintiff contends that the defendants engaged in patent infringement under federal law and seeks unspecified damages and an injunction against future infringements, plus royalties, costs, interest and attorneys’ fees. On March 28, 2012, a change of venue was granted and the case was transferred to the United States District Court for the Southern District of New York. The Company's motion for summary judgment on the grounds of non-infringement was granted by the U.S.US District Court in a Decision and Order dated March 9, 2015. All remaining claims are stayed pending resolution of issues on Droplet's remaining patents under review by the Patent Trial and Appeal Board (PTAB). After a hearing, the PTAB deemed Droplets’ putative '115 patent to be “unpatentable” on June 23, 2016. In a separate proceeding, the PTAB has also separately deemed Droplets’ putative '838 patent to be “unpatentable.” Droplets has appealed to the Circuit Court of Appeals for the District of Columbia. The briefingdecision of the PTAB was completedaffirmed on July 24, 2017, and oral argument has not yet been scheduled.April 19, 2018. The Company will continue to defend itself vigorously in this matter.
On April 30, 2013, a putative class action was filed by John Scranton, on behalf of himself and a class of persons similarly situated, against E*TRADE Financial Corporation and E*TRADE Securities in the Superior Court of California, County of Santa Clara, pursuant to the California procedures for a private Attorney General action. The complaint alleged that the Company misrepresented through its website that it would always automatically exercise options that were in-the-money by $0.01 or more on expiration date. The plaintiffs allege violations of the California Unfair Competition Law, the California Consumer Remedies Act, fraud, misrepresentation, negligent misrepresentation and breach of fiduciary duty and plaintiffs seek unspecified damages. Final judgment was entered in the Company's favor on April 8, 2015, and the plaintiff filed an appeal. The briefing is complete and oral argument was heard on October 24, 2017. The Company will continue to defend itself vigorously in this matter.
|
| | |
E*TRADE | Q3 2017 10-Q | | 86 |
On March 26, 2015, a putative class action was filed in the U.S.US District Court for the Northern District of California by Ty Rayner, on behalf of himself and all others similarly situated, naming E*TRADE Financial Corporation and E*TRADE Securities as defendants. The complaint alleges that E*TRADE breached a fiduciary duty and unjustly enriched itself in connection with the routing of its customers’ orders to various market-makers and exchanges. The plaintiff seeks unspecified damages, declaratory relief, restitution, disgorgement of payments received by the Company, and attorneys’ fees. On April 2, 2017, the District Court dismissed the complaint in Rayner. The plaintiffs in Rayner appealed and the oral argument was heard by the Second Court of Appeals on December 7, 2017. On July 31, 2018, the Second Court of
E*TRADE Q3 2018 10-Q | Page 98
E*TRADE FINANCIAL CORPORATION
NOTES TO THE CONDENSED CONSOLIDATED FINANCIAL STATEMENTS (UNAUDITED)
Appeals upheld the dismissal of the complaint. The Company will continue to defend itself vigorously in this matter.
On July 23, 2016, a putative class action was filed in the U.S.US District Court for the Southern District of New York by Craig L. Schwab, on behalf of himself and others similarly situated, naming E*TRADE Financial Corporation, E*TRADE Securities, and former Company executives as defendants. The complaint alleges that E*TRADE violated federal securities laws in connection with the routing of its customers’ orders to various market-makers and exchanges. The plaintiff seeks unspecified damages, declaratory relief, restitution, disgorgement of payments received by the Company, and attorneys’ fees. By stipulation both matters are now venued in the Southern District of New York. On April 2, 2017, the District Court dismissed the complaint in Rayner. The plaintiffs in Rayner appealed. Oral argument on the appeal is scheduled for December 8, 2017. On July 10, 2017 the Court dismissed the Schwab claims without prejudice. The plaintiff in Schwab filed a third amended complaint on August 9, 2017, which E*TRADE has moved to dismiss. On January 22, 2018, the Court dismissed all claims with prejudice. Plaintiffs have appealed to the Second Court of Appeals on October 23, 2018. On October 26, 2018, the Second Court of Appeals upheld the dismissal of the complaint. The Company will continue to defend itself vigorously in these matters.this matter.
In addition to the matters described above, the Company is subject to various legal proceedings and claims that arise in the normal course of business. In each pending matter, the Company contests liability or the amount of claimed damages. In view of the inherent difficulty of predicting the outcome of such matters, particularly in cases where claimants seek substantial or indeterminate damages, or where investigation or discovery have yet to be completed, the Company is unable to estimate a range of reasonably possible losses on its remaining outstanding legal proceedings; however, the Company believes any losses, both individually or in the aggregate, would not be reasonably likely to have a material adverse effect on the consolidated financial condition or results of operations of the Company.
An unfavorable outcome in any matter could have a material adverse effect on the Company’s business, financial condition, results of operations or cash flows. In addition, even if the ultimate outcomes are resolved in the Company’s favor, the defense of such litigation could entail considerable cost or the diversion of the efforts of management, either of which could have a material adverse effect on the Company’s business, financial condition, results of operations or cash flows.
Regulatory Matters
The securities, futures, foreign currency and banking industries are subject to extensive regulation under federal, state and applicable international laws. From time to time, the Company has been threatened with or named as a defendant in lawsuits, arbitrations and administrative claims involving securities, banking and other matters. The Company is also subject to periodic regulatory examinations and inspections. Compliance and trading problems that are reported to regulators, such as the SEC, FINRA, NASDAQ, CFTC, NFA, FDIC, Federal Reserve Bank of Richmond, OCC, or the Consumer Financial Protection Bureau (CFPB) by dissatisfied customers or others are investigated by such regulators, and may, if pursued, result in formal claims being filed against the Company by customers or disciplinary action being taken against the Company or its employees by regulators. Any such claims or disciplinary actions that are decided against the Company could have a material impact on the financial results of the Company or any of its subsidiaries.
|
| | |
E*TRADE | Q3 2017 10-Q | | 87 |
E*TRADE Q3 2018 10-Q | Page 99
E*TRADE FINANCIAL CORPORATION
NOTES TO THE CONDENSED CONSOLIDATED FINANCIAL STATEMENTS (UNAUDITED)
Insurance
The Company maintains insurance coverage that management believes is reasonable and prudent. The principal insurance coverage it maintains covers commercial general liability; property damage; hardware/software damage; cyber liability; directors and officers; employment practices liability; certain criminal acts against the Company; and errors and omissions. The Company believes that such insurance coverage is adequate for the purpose of its business. The Company’s ability to maintain this level of insurance coverage in the future, however, is subject to the availability of affordable insurance in the marketplace.
Commitments
In the normal course of business, the Company makes various commitments to extend credit and incur contingent liabilities that are not reflected in the consolidated balance sheet. Significant changes in the economy or interest rates may influence the impact that these commitments and contingencies have on the Company in the future.
The Company’s equity method, cost method and other investments are generally limited liability investments in partnerships, companies and other similar entities, including tax credit partnerships and community development entities, which are not required to be consolidated. The Company had $115$77 million in unfunded commitments with respect to these investments at September 30, 2017. 2018.
At September 30, 2017,2018, the Company had approximately $21$17 million of certificates of deposit scheduled to mature in less than one year.
Guarantees
In prior periods when the Company sold loans, the Company provided guarantees to investors purchasing mortgage loans, which are considered standard representations and warranties within the mortgage industry. The primary guarantees are that: the mortgage and the mortgage note have been duly executed and each is the legal, valid and binding obligation of the Company, enforceable in accordance with its terms; the mortgage has been duly acknowledged and recorded and is valid; and the mortgage and the mortgage note are not subject to any right of rescission, set-off, counterclaim or defense, including, without limitation, the defense of usury, and no such right of rescission, set-off, counterclaim or defense has been asserted with respect thereto. The Company is responsible for the guarantees on loans sold. If these claims prove to be untrue, the investor can require the Company to repurchase the loan and return all loan purchase and servicing release premiums. Management does not believe the potential liability exposure will have a material impact on the Company’s results of operations, cash flows or financial condition due to the nature of the standard representations and warranties, which have resulted in a minimal amount of loan repurchases.
Prior to 2008, ETBHETB Holdings raised capital through the formation of trusts, which sold TRUPs in the capital markets. The capital securities mustwere required to be redeemed in whole at the due date, which is generally 30 years after issuance. Each trust issued TRUPs at par, with a liquidation amount of $1,000 per capital security. The trusts used the proceeds from the sale of issuances to purchase subordinated debentures issued by ETBH.
ETB Holdings. During the 30-year period prior to the redemption of the TRUPs, ETBH guaranteesETB Holdings guaranteed the accrued and unpaid distributions on these securities, as well as the redemption price of the securities and certain costs that may be incurred in liquidating, terminating or dissolving the trusts (all of which would otherwise be payable by the trusts). At September 30, 2017, management estimated thatDuring the maximum potential liability under this arrangement, includingthird quarter of 2018, the current carrying value of the trusts, was equal to approximately $416 million or the total face value of these securities plus accrued interest payable, which may be unpaid at the termination of the trust arrangement.Company redeemed its outstanding TRUPs. See Note 10—Other Borrowings and Note 11—Corporate Debt for further details.
|
| | |
E*TRADE | Q3 2017 10-Q | | 88 |
E*TRADE Q3 2018 10-Q | Page 100
NOTE 15—SUBSEQUENT EVENTS
Trust Company of America acquisition
On October 19, 2017, we announced an agreement to acquire Trust Company of America, Inc., a leading provider of technology solutions and custody services to the independent registered investment adviser market, for $275 million in cash. The Company anticipates funding the transaction through the issuance of non-cumulative perpetual preferred stock. The acquisition is expected to close in the second quarter of 2018, subject to customary closing conditions and regulatory approvals.
|
| | |
E*TRADE | Q3 2017 10-Q | | 89 |
ITEM 4. CONTROLS AND PROCEDURES
| |
| (a) | Based on an evaluation under the supervision and with the participation of our management, our Chief Executive Officer and our Chief Financial Officer have concluded that the Company's disclosure controls and procedures, as defined in Rules 13a-15(e) under the Securities Exchange Act of 1934, as amended (the Exchange Act), were effective as of the end of the period covered by this report to provide reasonable assurance that information required to be disclosed by the Company in reports that it files or submits under the Exchange Act is (i) recorded, processed, summarized and reported within the time periods specified in the Securities and Exchange Commission rules and forms and (ii) accumulated and communicated to the Company’s management, including our Chief Executive Officer and Chief Financial Officer, as appropriate to allow timely decisions regarding required disclosure. |
| |
| (b) | There were no changes in the Company’s internal control over financial reporting during the quarter ended September 30, 2017,2018, identified in connection with management's evaluation required by paragraph (d) of Exchange Act Rules 13a-15 and 15d-15, that have materially affected, or are reasonably likely to materially affect, the Company’s internal control over financial reporting. |
|
| | |
E*TRADE | Q3 2017 10-Q | | 90 |
E*TRADE Q3 2018 10-Q | Page 101
PART II
ITEM 1. LEGAL PROCEEDINGS
Information in response to this item can be found under the heading LegalLitigation Matters in Note 14—15—Commitments, Contingencies and Other Regulatory Matters to Part I. Item 1. Condensed Consolidated Financial Statements (Unaudited)in this Quarterly Report and is incorporated by reference into this item.
ITEM 1A. RISK FACTORS
There have been no material changes in the Company's risk factors from those disclosed in its Annual Report on Form 10-K for the year ended December 31, 2016.2017, except for the risk factor included below:
Risks Relating to Owning Our Stock
Our future ability to pay cash dividends to holders of our common stock is subject to the discretion of our board of directors and will be limited by our ability to generate sufficient earnings and cash flows.
We recently announced the declaration of a quarterly dividend on shares of our common stock. Payment of future dividends, if any, will be at the discretion of our board of directors and will depend upon a number of factors that the board of directors deems relevant, including future earnings, the success of our business activities, capital requirements, the general financial condition and future prospects of our business and general business conditions. If we are unable to generate sufficient earnings and cash flows from our business, we may not be able to pay dividends on our common stock.
The failure to declare a quarterly dividend in the future could adversely affect the market price of our common stock. Furthermore, the terms of our outstanding preferred stock prohibit us from declaring or paying any dividends on any junior series of our capital stock, including our common stock, or from repurchasing, redeeming or acquiring such junior stock, unless we have declared and paid full dividends on our outstanding preferred stock for the most recently completed dividend period.
In addition, our ability to pay dividends on our common stock is subject to statutory and regulatory limitations, and subject to the ability of our subsidiaries to pay dividends up to the parent company.
E*TRADE Q3 2018 10-Q | Page 102
ITEM 2. UNREGISTERED SALES OF EQUITY SECURITIES AND USE OF PROCEEDS
Issuer Purchases of Equity Securities
The table below shows the timing and impact of our share repurchase program, if applicable, and the shares withheld from employees to satisfy tax withholding obligations during the three months ended September 30, 20172018 (dollars in millions, except share data and per share amounts):
|
| | | | | | | | | | | | | | |
| Period | | Total Number of Shares Purchased(1) | | Average Price Paid per Share(2) | | Total Number of Shares Purchased as Part of the Publicly Announced Plan(3) | | Maximum Dollar Value of Shares That May Yet Be Purchased Under the Plan(3) |
| July 1, 2017 - July 31, 2017 | | 652,118 |
| | $ | 41.27 |
| | 650,000 |
| | $ | 973.2 |
|
| August 1, 2017 - August 31, 2017 | | 2,556,962 |
| | $ | 40.60 |
| | 2,555,800 |
| | $ | 869.4 |
|
| September 1, 2017 - September 30, 2017 | | 1,533,555 |
| | $ | 40.54 |
| | 1,394,050 |
| | $ | 813.0 |
|
| Total | | 4,742,635 |
| | $ | 40.67 |
| | 4,599,850 |
| | |
|
| | | | | | | | | | | | | | |
| Period | | Total Number of Shares Purchased(1) | | Average Price Paid per Share(2) | | Total Number of Shares Purchased as Part of the Publicly Announced Program(3) | | Maximum Dollar Value of Shares That May Yet Be Purchased Under the Program(3) |
| July 1, 2018 - July 31, 2018 | | 1,845,660 |
| | $ | 60.93 |
| | 1,845,600 |
| | $ | 197 |
|
| August 1, 2018 - August 31, 2018 | | 1,632,863 |
| | $ | 60.13 |
| | 1,625,200 |
| | $ | 100 |
|
| September 1, 2018 - September 30, 2018 | | 1,926,402 |
| | $ | 55.16 |
| | 1,795,385 |
| | $ | — |
|
| Total | | 5,404,925 |
| | $ | 58.63 |
| | 5,266,185 |
| | |
| |
| (1) | Includes 142,785138,740 shares withheld to satisfy tax withholding obligations associated with restricted shares. |
| |
| (2) | Excludes commission paid, if any. |
| |
| (3) | On July 20, 2017, the Company announced that its Board of Directors authorized the repurchase of up to $1 billion of shares of its common stock. The timing and exact amountCompany completed repurchases under this program in September 2018. On October 18, 2018, the Company announced that its Board of any common stock repurchases will depend on various factors, including market conditions and the Company's capital position.Directors authorized a new $1 billion repurchase program. |
E*TRADE Q3 2018 10-Q | Page 103
ITEM 3. DEFAULTS UPON SENIOR SECURITIES
None.
ITEM 4. MINE SAFETY DISCLOSURES
Not applicable.
|
| | |
E*TRADE | Q3 2017 10-Q | | 91 |
ITEM 5. OTHER INFORMATION
None.
ITEM 6. EXHIBITS
|
| | |
Exhibit Number | | Description |
| | |
| | Indenture, dated as of August 24, 2017, between E*TRADE Financial Corporation and The Bank of New York Mellon Trust Company, N.A., as trustee (incorporated by reference to Exhibit 4.1 of the Company’s Current Report on Form 8-K filed on August 24, 2017). |
| | |
| | First Supplemental Indenture, dated as of August 24, 2017, between E*TRADE Financial Corporation and The Bank of New York Mellon Trust Company, N.A., as trustee (incorporated by reference to Exhibit 4.1 of the Company’s Current Report on Form 8-K filed on August 24, 2017).
|
| | |
| | Second Supplemental Indenture, dated as of August 24, 2017, between E*TRADE Financial Corporation and The Bank of New York Mellon Trust Company, N.A., as trustee (incorporated by reference to Exhibit 4.1 of the Company’s Current Report on Form 8-K filed on August 24, 2017). |
| | |
| | Form of 2.950% Senior Notes due 2022 (included in Exhibit 4.2) |
| | |
| | Form of 3.800% Senior Notes due 2027 (included in Exhibit 4.3) |
| | | |
| | Form of IndemnificationEmployment Agreement between the Company and each of Michael J. Curcio and Michael A. Pizzi. |
| | Form of Restricted Stock Unit Award Agreement for Directors2015 Omnibus Incentive Plan. |
| | Form of Executive Restricted Stock Unit Award Agreement for 2015 Omnibus Incentive Plan. |
| | Certification of Chief Executive Officer pursuant to Section 302 of the Sarbanes-Oxley Act of 2002. |
| | | |
| | Certification of Chief Financial Officer pursuant to Section 302 of the Sarbanes-Oxley Act of 2002. |
| | | |
| | Certification of Chief Executive Officer and Chief Financial Officer pursuant to Section 906 of the Sarbanes-Oxley Act of 2002. |
| | | |
| *101.INS | | XBRL Instance Document |
| | | |
| *101.SCH | | XBRL Taxonomy Extension Schema Document |
| | | |
| *101.CAL | | XBRL Taxonomy Extension Calculation Linkbase Document |
| | | |
| *101.DEF | | XBRL Taxonomy Extension Definition Linkbase Document |
| | |
| *101.LAB | | XBRL Taxonomy Extension Label Linkbase Document |
| | |
| *101.PRE | | XBRL Taxonomy Extension Presentation Linkbase Document |
|
| | |
E*TRADE | Q3 2017 10-Q | | 92 |
E*TRADE Q3 2018 10-Q | Page 104
SIGNATURES
Pursuant to the requirements of Section 13 or 15(d) of the Securities Exchange Act of 1934, the registrant has duly caused this report to be signed on its behalf by the undersigned, thereunto duly authorized.
Dated: November 2, 20171, 2018
|
| | |
| | | |
E*TRADE Financial Corporation (Registrant) |
| | | |
| By | | /S/ KARL A. ROESSNER |
| | | Karl A. Roessner |
| | | Chief Executive Officer |
| | | (Principal Executive Officer) |
| | |
| By | | /S/ MICHAEL A. PIZZI |
| | | Michael A. Pizzi |
| | | Chief Operating Officer and |
| | Chief Financial Officer |
| | | (Principal Financial Officer) |
| | |
| By | | /S/ BRENT B. SIMONICH |
| | | Brent B. Simonich |
| | | Corporate Controller |
| | | (Principal Accounting Officer) |
|
| | |
E*TRADE | Q3 2017 10-Q | | 93 |
E*TRADE Q3 2018 10-Q | Page 105