UNITED STATES
SECURITIES AND EXCHANGE COMMISSION
Washington, D.C. 20549
FORM 10-Q
|
| |
| ☒ | QUARTERLY REPORT PURSUANT TO SECTION 13 OR 15(d) OF THE SECURITIES EXCHANGE ACT OF 1934 |
For the quarterly period ended March 31,September 30, 2019
|
| |
| ☐ | TRANSITION REPORT PURSUANT TO SECTION 13 OR 15(d) OF THE SECURITIES EXCHANGE ACT OF 1934 |
For the transition period from _____ to _____
Commission File Number 1-11921
E TRADE Financial Corporation
 E*TRADE Financial Corporation
(Exact Name of Registrant as Specified in its Charter)
|
| | |
| Delaware |
| 94-2844166 |
(State or other jurisdiction of incorporation or organization) | | (I.R.S. Employer Identification Number) |
11 Times Square, 32nd Floor, New York, New York10036
(Address of principal executive offices and Zip Code)
(646) (646) 521-4300
(Registrant’s telephone number, including area code)
Securities Registered Pursuant to Section 12(b) of the Act:
|
| | |
| Title of Each Class | Trading Symbol | Name of Each Exchange on Which Registered |
| Common Stock, par value $0.01 per share | ETFC | The NASDAQ Stock Market LLC |
| NASDAQ Global Select Market |
Indicate by check mark whether the registrant (1) has filed all reports required to be filed by Section 13 or 15(d) of the Securities Exchange Act of 1934 during the preceding 12 months (or for such shorter period that the registrant was required to file such reports) and (2) has been subject to such filing requirements for the past 90 days. Yes x No ¨
Indicate by check mark whether the registrant has submitted electronically every Interactive Data File required to be submitted pursuant to Rule 405 of Regulation S-T during the preceding 12 months (or for such shorter period that the registrant was required to submit such files). Yes x No ¨
Indicate by check mark whether the registrant is a large accelerated filer, an accelerated filer, a non-accelerated filer, a smaller reporting company or an emerging growth company. See definitions of "large accelerated filer," "accelerated filer," "smaller reporting company" and "emerging growth company" in Rule 12b-2 of the Exchange Act. |
| | | | | |
Large accelerated filer | x | | Accelerated filer | | ¨☐ |
Non-accelerated filer ¨ (Do not check if a smaller reporting company) | Smaller reporting company | | ¨☐ |
Emerging growth company ¨
| | | Emerging growth company | | ☐ |
If an emerging growth company, indicate by check mark if the registrant has elected not to use the extended transition period for complying with any new or revised financial accounting standards provided pursuant to Section 13(a) of the Exchange Act. ¨
Indicate by check mark whether the registrant is a shell company (as defined in Rule 12b-2 of the Exchange Act). Yes ¨ ☐ No x
Indicate the number of shares outstanding of each of the issuer’s classes of common stock, as of the latest practicable date:
As of April 30,October 29, 2019, there were 244,670,688225,915,870 shares of common stock outstanding.
E*TRADE FINANCIAL CORPORATION
FORM 10-Q QUARTERLY REPORT
For the Quarter Ended March 31,September 30, 2019
|
| | |
| PART I | FINANCIAL INFORMATION | |
| | | |
| Item 1. | | |
| | | |
| | | |
| | | |
| | | |
| | | |
| | | |
| | | |
| | | |
| | | |
| | | |
| | | |
| | | |
| | | |
| | | |
| | | |
| | | |
| | | |
| | | |
| | | |
| | | |
| Item 2. | | |
| | | |
| | | |
| | | |
| | | |
| | | |
| | | |
| | | |
| Item 3. | | |
| | | |
| Item 4. | | |
| Part II | OTHER INFORMATION | |
| Item 1. | | |
| Item 1A. | | |
| Item 2. | | |
| Item 3. | | |
| Item 4. | | |
| Item 5. | | |
| Item 6. | | |
| | | |
E*TRADE Q1Q3 2019 10-Q | Page i
Unless otherwise indicated, references to "the Company," "we," "us," "our," "E*TRADE" and "E*TRADE Financial" mean E*TRADE Financial Corporation and its subsidiaries, and references to the parent company mean E*TRADE Financial Corporation but not its subsidiaries.
E*TRADE, E*TRADE Financial, E*TRADE Bank, E*TRADE Savings Bank, the Converging Arrows logo, Power E*TRADE, Equity Edge Online, Trust Company of America, (TCA), now E*TRADE Advisor Services, E*TRADE Advisor Network, and Liberty are trademarks or registered trademarks of E*TRADE Financial Corporation in the United States and in other countries. All other trademarks are the property of their respective owners.
E*TRADE Q1Q3 2019 10-Q | Page ii
PART I
FORWARD-LOOKING STATEMENTS
This report contains forward-looking statements, within the meaning of the Private Securities Litigation Reform Act of 1995, that involve risks and uncertainties. These statements discuss, among other things:
our future plans, objectives, outlook, strategies, expectations and intentions relating to our business and future financial and operating results and the assumptions that underlie these matters
our capital plan initiatives
the timing and payment of dividends on our common and preferred stock
the payment of dividends from our subsidiaries to our parent company
the management of our legacy mortgage and consumer loan portfolio
our ability to comply with future changes to government regulations
our ability to maintain required regulatory capital ratios
continued repurchases of our common stock
our ability to meet upcoming debt obligations
the integration and related restructuring costs of past and any future acquisitions
the expected outcome of existing or new litigation
our ability to execute our business plans and manage risk
future sources of revenue, expense and liquidity
the ability of our technology solution for advisors and our referral program to attract and retain customers seeking specialized services and sophisticated advice
the expected impact of the adoption of the amended accounting and disclosure guidance governing the accounting for credit losses
the expected impact from and responses to the elimination of retail commissions for online US listed stock, exchange-traded funds (ETF), and options trades
any other statement that is not historical in nature
These statements may be identified by the use of words such as "assume," "expect," "believe," "may," "will," "should," "anticipate," "intend," "plan," "estimate," "continue" and similar expressions.
We caution that actual results could differ materially from those discussed in these forward-looking statements. Important factors that could contribute to our actual results differing materially from any forward-looking statements include, but are not limited to:
changes in business, economic or political conditions
performance, volume and volatility in the equity and capital markets
changes in interest rates or interest rate volatility
our ability to manage our balance sheet size and capital levels
disruptions or failures of our information technology systems or those of our third partythird-party service providers
cyber security threats, system disruptions and other potential security breaches or incidents
customer demand for financial products and services
our ability to continue to compete effectively and respond to aggressive competition within our industry, such as the elimination of retail commissions for online US listed stock, ETF and options trades
E*TRADE Q3 2019 10-Q | Page 1
our ability to participate in consolidation opportunities in our industry, to complete consolidation transactions and to realize synergies or implement integration plans
our ability to manage our significant risk exposures effectively
the occurrence of risks associated with our advisory services
our ability to manage credit risk with customers and counterparties
our ability to service our corporate debt and, if necessary, to raise additional capital
E*TRADE Q1 2019 10-Q | Page 1
changes in government regulation, including interpretations, or actions by our regulators, including those that may result from the implementation and enforcement of regulatory reform legislation
adverse developments in any investigations, disciplinary actions or litigation
changes in actual or forecasted assumptions impacting the measurement of expected credit losses upon adoption of the amended guidance governing the accounting for credit losses
By their nature forward-looking statements are not guarantees of future performance or results and are subject to risks, uncertainties and assumptions that are difficult to predict or quantify. Actual future results may vary materially from expectations expressed or implied in this report or any of our prior communications. Investors should also consider the risks and uncertainties described elsewhere in this report, including under Part II. Item 1A. Risk Factors and Part I. Item 2. Management's Discussion and Analysis of Financial Condition and Results of Operations of this Quarterly Report and Part I. Item 1A. Risk Factors of our Annual Report on Form 10-K for the year ended December 31, 2018, as amended by Amendment No. 1 on Form 10-K/A (the 2018 Annual Report), filed with the Securities and Exchange Commission (SEC), which are incorporated herein by reference. The forward-looking statements contained in this report reflect our expectations only as of the date of this report. Investors should not place undue reliance on forward-looking statements, as we do not undertake to update or revise forward-looking statements, except as required by law.
E*TRADE Q1Q3 2019 10-Q | Page 2
ITEM 2. MANAGEMENT’S DISCUSSION AND ANALYSIS OF FINANCIAL CONDITION AND RESULTS OF OPERATIONS (MD&A)
The following discussion should be read in conjunction with the consolidated financial statements and the related notes that appear elsewhere in this document and with the 2018 Annual Report. Company Overview
E*TRADE is a financial services company that provides brokerage and related products and services for traders, investors, stock plan administrators and participants, and registered investment advisors (RIAs). Founded on the principle of innovation, we aim to enhance the financial independence of customers through a powerful digital offering that includes tools and educational materials, complemented by professional advice and support, catering to the complex and unique needs of customers to help meet their near- and long-term investing goals. We provide these services through our digital platforms and network of industry-licensed customer service representatives and financial consultants, over the phone, by email and online via two national financial centers and in-person at 30 regional financial centers across the United States. We operate directly and through several subsidiaries, many of which are overseen by governmental and self-regulatory organizations. Our most important subsidiaries are described below:
E*TRADE Securities LLC (E*TRADE Securities) is a registered broker-dealer that clears and settles customer transactions
E*TRADE Bank is a federally chartered savings bank that provides Federal Deposit Insurance Corporation (FDIC) insurance on certain qualifying amounts of customer deposits and provides other banking and cash management capabilities
E*TRADE Savings Bank, a subsidiary of E*TRADE Bank, is a federally chartered savings bank that provides FDIC insurance on certain qualifying amounts of customer deposits and provides custody solutions for RIAs
E*TRADE Financial Corporate Services, Inc. (E*TRADE Financial Corporate Services) is a provider of software and services for managing equity compensation plans to our corporate clients
E*TRADE Futures LLC (E*TRADE Futures) is a registered non-clearing Futures Commission Merchant (FCM) that provides retail futures transaction capabilities for our customers
E*TRADE Capital Management LLC (E*TRADE Capital Management) is an RIA that provides investment advisory services for our customers
Delivering a powerful digital offering for our customers is a core pillar of our business strategy and we believe our focus on being a digital leader in the financial services industry is a competitive advantage. We offer a broad range of products and services to customers through the following customer channels:
| |
| • | Retail: Our retail channel includes retail brokerage and banking customers that utilize our web, mobile and/or active trading platforms to meet trading, investing and/or banking needs. |
| |
| • | Institutional: Our institutional channels include Corporate Services and Advisor Services. We provide stock plan administration services for public and private companies globally through our corporate services channel. We also provide custody services to independent RIAs through our advisor services channel. |
E*TRADE Q1Q3 2019 10-Q | Page 3
Strategy
Our business strategy is focused on leveraging our brand, hybrid support model, and technology to grow our retail and institutional channels while generating robust earnings growth and exceptional returns for the benefit of our shareholders.maximizing shareholder returns.
Leverage our brand, hybrid support model, and leading technology for scale and growth
E*TRADE's unrivaled and tech-forward brand is synonymous with digital brokerage and drives outsized awareness and consideration among business-to-customer and business-to-business audiences. We are able to serve peak volumes across channels with capacity for growth and acquisition through our strong and scalable infrastructure. Our customers benefit from digitally led experiences, complemented by professional advice and support. We cater to the complex and unique needs of traders, investors, stock plan administrators and participants, and independent RIAs.
Empower self-directed retail customers through a powerful digital offering and professional guidance
E*TRADE has three core digital offerings for the retail investor—trading, investing, and banking. With trading, we maintain a leading position among active and derivatives traders through the Power E*TRADE web-based platform and support model. On the investing front we connect customers with a range of easy-to-use wealth management solutions. We are also advancing digital banking capabilities to help increase engagement with customers and prospects.
Capitalize on symbiotic institutional channels to drive growth
E*TRADE's corporate services and advisor services channels are critical for growth. We aim to expand on our #1 position in stock plan administration through innovative digital solutions and expert support—driving growth in retail and institutional relationships. We plan to leverage the power of E*TRADE's brand, digital ethos, and our broad customer base to grow the advisor services channel. We also plan to connect retail customers and stock plan participants seeking higher touch services to top-tier advisors through our recently launched referral network—driving asset growth and retention.
Generate robust earnings growth and returns
We aim to deliver superior returns on customer assets by capturing the full value of our retail and institutional relationships and leveraging E*TRADE's highly scalable model to expand operating margin and generate robust earnings growth. We aim to return a significant portion of our earnings to shareholdersgrowth and expand return on equity over time.maximize shareholder returns.
E*TRADE Q1Q3 2019 10-Q | Page 4
Products and Services
Our hybrid delivery model is available through the following award-winning digital platforms which are complemented by professional advice and support. |
| | | | |
| | Platforms for Retail Channel(1) | Platforms for Institutional Channel(1) |
| | | | | |
| | | Web | | Equity Edge Online(1)(2) |
| | Our easy-to-use site is the primary channel to interact with customers and prospects | Equity Edge Online is the #1 rated platform in the stock plan administration industry that offers automation and flexibility |
| |
| |
| | | | |
| | | Mobile(2)(3) | | Liberty |
| | Our top-rated mobile applications are industry leading and include integrations with leading artificial intelligence assistants | Liberty is intuitive technology built for RIAs that simplifies the investment and management of client assets |
| |
| |
| | | | | |
| | | Active Trading Platforms | | |
| | Active trading platforms include sophisticated trading tools, advanced portfolio and market tracking, and idea generation and analysis | |
| | |
| | |
| | | | | |
| | Complemented by professional advice and support |
| | | | | |
| | | Customer Service | | Financial Consultants |
| | Customer service is available 24/7 via phone, email or chat from industry licensed representatives. White glove service is available for our highest-tiered customers | Financial consultants are available by phone or at branches to provide one-on-one investing advice |
| |
| |
| | | | | |
| | | | Active Trader Services | | Corporate Services |
| | | | ProvidesActive trader services support includes specialized support for sophisticated customers with advanced knowledge and skill |
| Corporate services support includes personalized service on a global scale driven by dedicated relationship and service managers backed by comprehensive training and education |
| | |
| |
| | | | | |
| | Advisor Services | | |
| Advisor services support includes dedicated relationship managers who act as a single point of contact for specialized support | |
|
|
| |
| (1) | E*TRADE was rated #1 online broker in Kiplinger's 2019 Best Online Brokers review. |
| |
| (2) | In September 2019, Equity Edge Online was rated #1 in Loyalty and Overall Satisfaction for the eighth consecutive year in the 2018, 2017, 2016, 2015, 2014, and 2013 Group Five Stock Plan Administration Industry Report.Benchmark Study. |
| |
(2)(3) | E*TRADE was awarded the #1 Mobile Trading award in StockBrokers.com's 2019 Online Broker Review of 17 firms across 284 different variables. |
E*TRADE Q1Q3 2019 10-Q | Page 5
We deliver a broad range of products and services through theour retail and institutional customer channels across the following five product areas: Trading, Investing, Banking and Cash Management, Corporate Services and Advisor Services.
Trading
The Company delivers automated trade order placement and execution services, offering our customers a full range of investment vehicles, including US equities, exchange-traded funds (ETFs),ETFs, options, bonds, futures, American depositary receipts and non-proprietary mutual funds. We also offer margin accounts, enabling qualifying customers to borrow against their securities, supported by robust tools enabling customers to analyze their positions and easily understand collateral requirements. The Company also offers a fully paid lending program which allows customers to earn income on certain securities held in cash accounts when they permit us to lend thosethese securities.
The Company markets trading products and services to active traders and self-directed investors. Products and services are delivered through web, desktop and mobile platforms. Trading and investing tools are supported by guidance, including fixed income, options and futures specialists available on-call for customers. Other tools and resources include independent research and analytics, live and on-demand education, market commentary, and strategies, trading ideas and screeners for major asset classes.
Investing
The Company endeavors to help investors build wealth and address their long-term investing needs through a variety of products and services, a suite of managed products, and asset allocation models. These include our Core Portfolios, Blend Portfolios, Dedicated Portfolios, and Fixed Income Portfolios. The Company also offers self-directed digital tools across web and mobile platforms, including mutual fund and ETF screeners, All StarAll-Star Lists, a collection of pre-built ETF or mutual fund portfolios based on time frame and risk tolerance, an assortment of planning and allocation tools, thematic investing opportunities, education and editorial content. Investors also have access to a wide selection of ETFs and mutual funds, including more than 250 commission-free2,300 ETFs and more than 4,4004,700 no-load, no-transaction fee mutual funds.
The Company also offers guidance through a team of licensed financial consultants and Chartered Retirement Planning CounselorsSM at our 30 regional financial centers and through our two national financial centers by phone, email and online. Customers can receive complimentary portfolio reviews and personalized investment recommendations.
Banking and Cash Management Capabilities
The Company's banking and cash management capabilities include deposit accounts insured by the FDIC, which are fully integrated into customer brokerage accounts. Among other features, E*TRADE Bank's customers are able tocan transfer to and from accounts at E*TRADE and elsewhere for free and checking account customers have access to debit cards with ATM fee refunds, online and mobile bill pay, and mobile check deposits. E*TRADE Bank's savings account offerings include the Premium Savings Account, which provides a higher yield to savings account customers as compared to our other deposit products. The E*TRADE Line of Credit program allows customers to borrow against the market value of securities pledged as collateral.
E*TRADE Q1Q3 2019 10-Q | Page 6
Corporate Services
Through our industry-leading platform, Equity Edge Online, we serve approximately 20% of S&P 500 companies, including nearly 40% of technology companies and over 50% of healthcare companies within the S&P 500 index. The Company offers management of employee stock option plans, employee stock purchase plans, and restricted stock plans with fully-automated stock plan administration. Accounting, reporting and scenario modeling tools are also available. The integrated stock plan solutions include multi-currency settlement and delivery, and streamlined tax calculation. Additionally, corporate clients are offered 10b5-1 plan design and implementation, along with SEC filing assistance and automated solutions. Through our platform, participants have enhanced visibility into the creation and approval of their plan through digital tools and resources. Participants have full access to E*TRADE's robust investing and trading capabilities, including tailored education and planning tools, and dedicated stock plan service representatives. Of companies that offer equity plans to employees, we serve approximately 50% of US publicly traded technology and healthcare companies, and more than 20% of companies within the S&P 500 index.
Corporate Services is an important driver of account and asset growth, serving as a conduit to the retail channel. Over the lasttrailing 12 months, ending March 31, 2019, there were $99approximately $100 billion of gross inflows into our corporate services channel, primarily driven by $26$25 billion of new corporate client implementations and $73 billion of new grants and employee stock purchase plan transactions. Over this same 12 month period, domestic stock plan participants generated $27$30 billion of net proceeds through transactions of vested assets. These participant proceeds represent a key source of net new assets for the retail customer channel.
Advisor Services
Through our proprietary technology platform, Liberty, the Company offers sophisticated modeling, rebalancing, reporting, and practice management capabilities that are fully customizable for the RIA. E*TRADE's financial consultants can refer retail customers to pre-qualified RIAs on our custody platform through our referral program, the E*TRADE Advisor Network.Network, which is operational at our two national and 30 regional financial centers. We expect the E*TRADE Advisor Network will improve the Company's ability to drive asset growth and retain customers seeking specialized services and sophisticated advice.
E*TRADE Q3 2019 10-Q | Page 7
Significant Events
Rated #1 online broker in Kiplinger's annual Best Online Brokers review
In August 2019, E*TRADE was awarded first place overall and "Best for Mutual Fund Investors" in Kiplinger's annual Best Online Brokers Review of 10 firms across seven categories. We also received high marks for user experience, investment choices, advisory services, and mobile as part of the review.
Completed $1 billion share repurchase program; progress made on $1.5 billion program
The Company repurchased 3.6 million shares for $157 million during the third quarter to complete repurchases under its previous $1 billion share repurchase program. The Company also repurchased 9.8 million shares for $409 million under its $1.5 billion share repurchase program during the third quarter. We have the ability to complete this program by the third quarter of 2020; however we retain flexibility to deploy capital in the most accretive way possible.
Eliminated commission rates for equity and options trades
On October 2, 2019, we announced the elimination of retail commissions for online US listed stock, ETF and options trades. We also reduced the options contract charge to $0.65 per contract for all traders while maintaining our active trader pricing at $0.50 per contract. The Company estimates that the annual revenue impact of these changes, which became effective on October 7, 2019, would be approximately $300 million based on operating results in the second quarter of 2019. We expect the majority of commissions revenue in future periods will be driven from options contract charges and futures trading activity.
Financial Performance
Our net revenue is generated primarily from net interest income, commissions and fees and service charges:
Net interest income is largely impacted by the size of our balance sheet, our balance sheet mix, and average yields on our assets and liabilities. Net interest income is driven primarily from interest earned on investment securities, margin receivables, securities lending, and our legacy loan portfolio, less interest incurred on interest-bearing liabilities, including deposits, customer payables, corporate debt and other borrowings.
Commissions revenue is generated by customer trades and is largely impacted by trade volume, trade type, and commission rates. With the elimination of retail commissions for online US listed stock, ETF and options trades, we expect the majority of commissions revenue in future periods will be driven from options contract charges and futures trading activity.
Fees and service charges revenue is primarily impacted by order flow revenue, fees earned on off-balance sheet customer cash and other assets, advisor management and custody fees, and mutual fund service fees.
Our net revenue is offset by non-interest expenses, the largest of which are compensation and benefits and advertising and market development.
E*TRADE Q1Q3 2019 10-Q | Page 78
Key Performance Metrics
Management monitors customer activity and corporate metrics to evaluate the Company’s performance. The most significant of these are displayed below.
In the first quarter of 2019, the Company updated the structure of its customer activity metrics to better align to its retail and institutional customer channels. Additionally, the Company has refined the presentation of certain customer activity metrics, as follows:
| |
| • | Commissionable trades: The definition of trades was updated to capture only commissionable trades (this impacts DARTs,daily average revenue trades (DARTs), derivative DARTs percentage, and average commission per trade). |
| |
| • | Customer accounts: The definition of accounts was updated to align the minimum threshold for gross new and end of period retail accounts to $25. The definition for gross new retail accounts sourced from Corporate Services was also updated to include only those accounts which maintain a minimum balance of $25 at the end of the reporting period or trade within the reporting period. |
These updates have been reflected in the customer activity metrics for all periods presented and did not have an impact on the Company’s financial statements.
E*TRADE Q1Q3 2019 10-Q | Page 89
Customer Activity Metrics
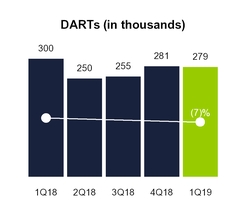
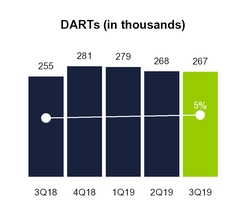
Daily Average Revenue Trades (DARTs)is an important measure of customer trading activity, and is a key driver of commissions revenue. DARTs were 279,405266,935 and 299,673271,514 for the three and nine months ended March 31,September 30, 2019, respectively, compared to 255,139 and 2018, respectively.267,985 for the same periods in 2018.
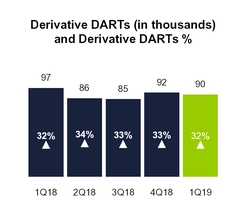
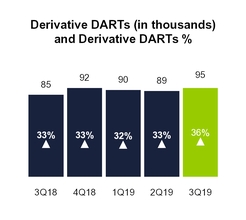
Derivative DARTs, a key component of overall DARTs that represents advanced trading activities by our customers, is the daily average number of options and futures trades, and Derivative DARTs percentage is the mix of options and futures trades as a component of total DARTs. Derivative DARTs were 90,04294,895 and 96,80691,470 for the three and nine months ended March 31,September 30, 2019, respectively, compared to 84,978 and 2018, respectively.89,164 for the same periods in 2018. Derivative DARTs represented 32%36% and 34% of total DARTs for both the three and nine months ended March 31,September 30, 2019, andrespectively, compared to 33% for the same periods in 2018.
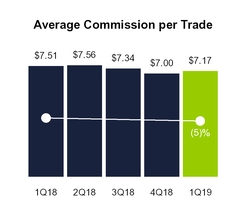
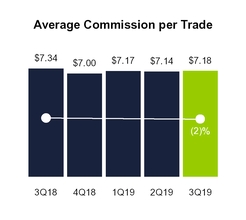
Average commission per trade is an indicator of changes in our customer mix, product mix and/or product pricing. Average commission per trade was $7.17$7.18 and $7.51$7.16 for the three and nine months ended March 31,September 30, 2019, respectively, compared to $7.34 and 2018, respectively.$7.47 for the same periods in 2018.
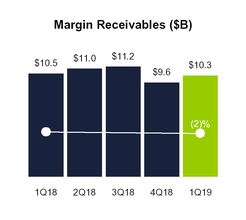
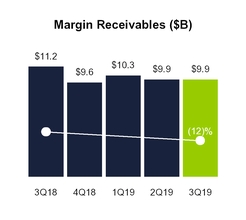
Margin receivables represent credit extended to customers to finance their purchases of securities by borrowing against securities they own and is a key driver of net interest income. Margin receivables were $10.3$9.9 billion and $10.5$11.2 billion at March 31,September 30, 2019 and 2018, respectively.
E*TRADE Q1Q3 2019 10-Q | Page 910
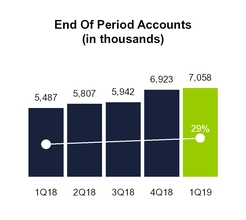
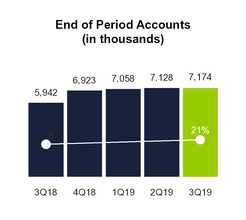
End of period accounts and net new accounts are indicators of our ability to attract and retain customers. The following table presents end of period accounts by channel: | | | | 1Q 2019 | | 4Q 2018 | | 3Q 2018 | | 2Q 2018 | | 1Q 2018 | 3Q 2019 | | 2Q 2019 | | 1Q 2019 | | 4Q 2018 | | 3Q 2018 |
| End of period retail accounts | 5,088,597 |
| | 5,007,767 |
| | 4,056,416 |
| | 3,992,575 |
| | 3,955,131 |
| 5,130,138 |
| | 5,122,669 |
| | 5,088,597 |
| | 5,007,767 |
| | 4,056,416 |
|
| End of period advisor services accounts | 151,222 |
| | 151,241 |
| | 150,063 |
| | 147,640 |
| | — |
| 150,401 |
| | 151,275 |
| | 151,222 |
| | 151,241 |
| | 150,063 |
|
| End of period corporate services accounts | 1,817,983 |
| | 1,763,829 |
| | 1,735,675 |
| | 1,666,354 |
| | 1,532,329 |
| 1,893,881 |
| | 1,853,875 |
| | 1,817,983 |
| | 1,763,829 |
| | 1,735,675 |
|
| End of period accounts | 7,057,802 |
| | 6,922,837 |
| | 5,942,154 |
| | 5,806,569 |
| | 5,487,460 |
| 7,174,420 |
| | 7,127,819 |
| | 7,057,802 |
| | 6,922,837 |
| | 5,942,154 |
|
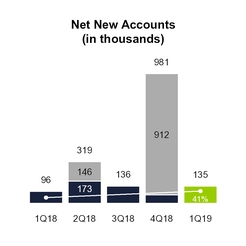
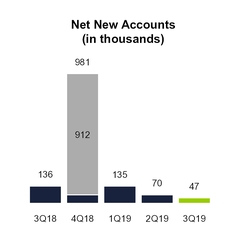
The following table presents net new accounts and annualized growth rates by channel: | | | | 1Q 2019 | | 4Q 2018 | | 3Q 2018 | | 2Q 2018 | | 1Q 2018 | 3Q 2019 | | 2Q 2019 | | 1Q 2019 | | 4Q 2018 | | 3Q 2018 |
| Net new retail accounts | 80,830 |
| | 951,351 |
| | 63,841 |
| | 37,444 |
| | 55,909 |
| 7,469 |
| | 34,072 |
| | 80,830 |
| | 951,351 |
| | 63,841 |
|
| Net new advisor services accounts | (19) |
| | 1,178 |
| | 2,423 |
| | 147,640 |
| | — |
| (874) |
| | 53 |
| | (19) |
| | 1,178 |
| | 2,423 |
|
| Net new corporate services accounts | 54,154 |
| | 28,154 |
| | 69,321 |
| | 134,025 |
| | 39,953 |
| 40,006 |
| | 35,892 |
| | 54,154 |
| | 28,154 |
| | 69,321 |
|
| Net new accounts | 134,965 |
| | 980,683 |
| | 135,585 |
| | 319,109 |
| | 95,862 |
| 46,601 |
| | 70,017 |
| | 134,965 |
| | 980,683 |
| | 135,585 |
|
| | | | | | | | | | | | | | | | | | | |
| Net new retail account growth rate | 6.5 | % | | 93.8 | % | | 6.4 | % | | 3.8 | % | | 5.7 | % | 0.6 | % | | 2.7 | % | | 6.5 | % | | 93.8 | % | | 6.4 | % |
| Net new advisor services account growth rate | (0.1 | )% | | 3.1 | % | | 6.6 | % | | 100.0 | % | | — | % | (2.3 | )% | | 0.1 | % | | (0.1 | )% | | 3.1 | % | | 6.6 | % |
| Net new corporate services account growth rate | 12.3 | % | | 6.5 | % | | 16.6 | % | | 35.0 | % | | 10.7 | % | 8.6 | % | | 7.9 | % | | 12.3 | % | | 6.5 | % | | 16.6 | % |
| Net new total account growth rate | 7.8 | % | | 66.0 | % | | 9.3 | % | | 23.3 | % | | 7.1 | % | 2.6 | % | | 4.0 | % | | 7.8 | % | | 66.0 | % | | 9.3 | % |
We added 1,057,956 net new accounts as part of acquisitions during the year ended December 31, 2018, including 145,891 advisor services accounts related to the TCATrust Company of America (TCA) acquisition in the three months ended June 30, 2018 and 912,065 retail accounts related to the Capital One account acquisition in the three months ended December 31, 2018.
E*TRADE Q1Q3 2019 10-Q | Page 1011
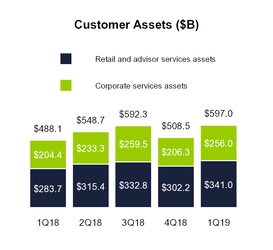
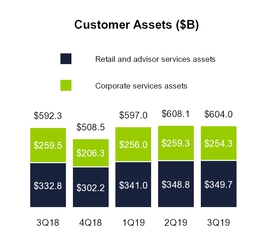
Total customer assets is an indicator of the value of our relationship with our customers. An increase generally indicates that the use of our products and services is expanding. Changes in this metric are also driven by changes in the valuations of our customers' underlying securities. The following table presents the significant components of total customer assets (dollars in millions)billions):
| | | | 1Q 2019 | | 4Q 2018 | | 3Q 2018 | | 2Q 2018 | | 1Q 2018 | 3Q 2019 | | 2Q 2019 | | 1Q 2019 | | 4Q 2018 | | 3Q 2018 |
| Security holdings | $ | 279,289 |
| | $ | 241,921 |
| | $ | 274,469 |
| | $ | 257,637 |
| | $ | 226,823 |
| $ | 284.7 |
| | $ | 286.6 |
| | $ | 279.3 |
| | $ | 242.0 |
| | $ | 274.4 |
|
| Cash and deposits | 61,691 |
| | 60,198 |
| | 58,376 |
| | 57,676 |
| | 56,854 |
| 65.0 |
| | 62.2 |
| | 61.7 |
| | 60.2 |
| | 58.4 |
|
| Retail and advisor services assets | 340,980 |
| | 302,119 |
| | 332,845 |
| | 315,313 |
| | 283,677 |
| 349.7 |
| | 348.8 |
| | 341.0 |
| | 302.2 |
| | 332.8 |
|
| Corporate services vested assets | 140,637 |
| | 111,977 |
| | 139,994 |
| | 125,341 |
| | 109,092 |
| 138.9 |
| | 142.3 |
| | 140.6 |
| | 111.9 |
| | 140.0 |
|
| Retail, advisor services, and corporate services vested assets | 481,617 |
| | 414,096 |
| | 472,839 |
| | 440,654 |
| | 392,769 |
| 488.6 |
| | 491.1 |
| | 481.6 |
| | 414.1 |
| | 472.8 |
|
| Corporate services unvested holdings | 115,386 |
| | 94,360 |
| | 119,469 |
| | 107,956 |
| | 95,345 |
| 115.4 |
| | 117.0 |
| | 115.4 |
| | 94.4 |
| | 119.5 |
|
| Total customer assets | $ | 597,003 |
| | $ | 508,456 |
| | $ | 592,308 |
| | $ | 548,610 |
| | $ | 488,114 |
| $ | 604.0 |
| | $ | 608.1 |
| | $ | 597.0 |
| | $ | 508.5 |
| | $ | 592.3 |
|
Customer cash and deposits is a significant component of total customer assets as it is a key driver of net interest income as well as fees and service charges revenue, which includes fees earned on customer cash held by third parties. The following table presents the significant components of total customer cash and deposits (dollars in millions)billions): | | | | 1Q 2019 | | 4Q 2018 | | 3Q 2018 | | 2Q 2018 | | 1Q 2018 | 3Q 2019 | | 2Q 2019 | | 1Q 2019 | | 4Q 2018 | | 3Q 2018 |
| Sweep deposits | $ | 38,639 |
| | $ | 39,322 |
| | $ | 37,998 |
| | $ | 37,794 |
| | $ | 37,927 |
| $ | 30.8 |
| | $ | 31.7 |
| | $ | 38.6 |
| | $ | 39.3 |
| | $ | 38.0 |
|
| Customer payables | 10,600 |
| | 10,117 |
| | 10,534 |
| | 9,959 |
| | 8,947 |
| 11.2 |
| | 10.6 |
| | 10.6 |
| | 10.1 |
| | 10.5 |
|
| Savings, checking and other banking assets | 7,689 |
| | 5,991 |
| | 5,076 |
| | 4,870 |
| | 4,975 |
| 9.6 |
| | 8.6 |
| | 7.7 |
| | 6.0 |
| | 5.1 |
|
| Total on-balance sheet cash | 56,928 |
| | 55,430 |
| | 53,608 |
| | 52,623 |
| | 51,849 |
| 51.6 |
| | 50.9 |
| | 56.9 |
| | 55.4 |
| | 53.6 |
|
| Sweep deposits at unaffiliated financial institutions | 3,011 |
| | 3,009 |
| | 3,007 |
| | 3,505 |
| | 3,444 |
| 11.7 |
| | 9.6 |
| | 3.0 |
| | 3.0 |
| | 3.0 |
|
| Money market funds and other | 1,752 |
| | 1,759 |
| | 1,761 |
| | 1,552 |
| | 1,561 |
| 1.7 |
| | 1.7 |
| | 1.8 |
| | 1.8 |
| | 1.8 |
|
Total customer cash held by third parties(1) | 4,763 |
| | 4,768 |
| | 4,768 |
| | 5,057 |
| | 5,005 |
| 13.4 |
| | 11.3 |
| | 4.8 |
| | 4.8 |
| | 4.8 |
|
| Total customer cash and deposits | $ | 61,691 |
| | $ | 60,198 |
| | $ | 58,376 |
| | $ | 57,680 |
| | $ | 56,854 |
| $ | 65.0 |
| | $ | 62.2 |
| | $ | 61.7 |
| | $ | 60.2 |
| | $ | 58.4 |
|
| |
| (1) | Customer cash held by third parties is maintained at unaffiliated financial institutions. Customer cash held by third parties is not reflected in the Company's consolidated balance sheet and is not immediately available for liquidity purposes. |
E*TRADE Q1Q3 2019 10-Q | Page 1112
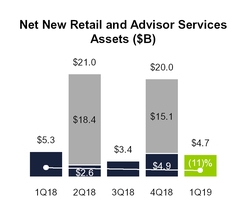
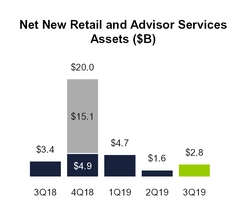
Net new retail and advisor services assets equals total inflows to new and existing retail and advisor services accounts less total outflows from closed and existing retail and advisor services accounts. The net new retail and advisor services assets metric is a general indicator of the use of our products and services by new and existing retail and advisor services customers. Net new retail and advisor services assets were $4.7$2.8 billion and $5.3$9.1 billion for the three and nine months ended March 31,September 30, 2019, respectively, compared to $3.4 billion and 2018, respectively.$29.7 billion for the same periods in 2018. The following table presents annualized net new retail and advisor services assets growth rates: | | | | 1Q 2019 | | 4Q 2018 | | 3Q 2018 | | 2Q 2018 | | 1Q 2018 | 3Q 2019 | | 2Q 2019 | | 1Q 2019 | | 4Q 2018 | | 3Q 2018 |
| Net new retail assets growth rate | 6.8 | % | | 25.2 | % | | 4.2 | % | | 3.3 | % | | 7.6 | % | 3.4 | % | | 2.1 | % | | 6.8 | % | | 25.2 | % | | 4.2 | % |
| Net new advisor services assets growth rate | (3.5 | )% | | 3.9 | % | | 7.6 | % | | 100.0 | % | | — | % | 0.8 | % | | (1.2 | )% | | (3.5 | )% | | 3.9 | % | | 7.6 | % |
| Net new retail and advisor services assets growth rate | 6.2 | % | | 24.0 | % | | 4.4 | % | | 29.5 | % | | 7.6 | % | 3.2 | % | | 1.9 | % | | 6.2 | % | | 24.0 | % | | 4.4 | % |
We added $33.5 billion in net new retail and advisor services assets as part of acquisitions during the year ended December 31, 2018, including $18.4 billion in advisor services assets related to the TCA acquisition during the three months ended June 30, 2018 and $15.1 billion in retail assets related to the acquisition of customer accounts from Capital One during the three months ended December 31, 2018.
Corporate Metrics:
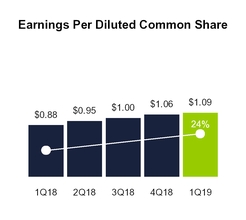
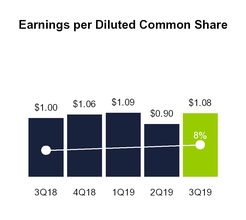
Earnings per diluted common share is the portion of a company's profit allocated to each diluted share of common stock and is a key indicator of the Company's profitability. Earnings per diluted share was $1.09$1.08 and $0.88$3.07 for the three and nine months ended September 30, 2019, respectively, compared to $1.00 and $2.82 for the same periods in 2018. Earnings per diluted share includes $80 million of losses from our balance sheet repositioning in June 2019, which had an after-tax impact of $59 million, or $0.24 per diluted share for the three months ended March 31,June 30, 2019 and 2018, respectively.the nine months ended September 30, 2019.
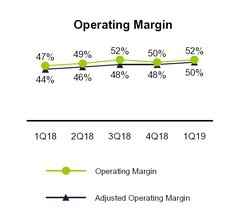
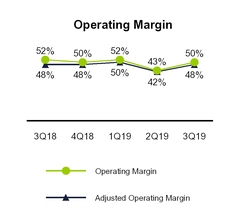
Operating margin is the percentage of net revenue that results in income before income taxes and is an indicator of the Company's profitability. Operating margin was 50% and 48% for the three and nine months ended September 30, 2019, respectively, compared to 52% and 47%49% for the same periods in 2018. Income before income tax expense and net revenue, the numerator and denominator in the operating margin calculation, include $80 million of losses from our balance sheet repositioning in June 2019, which resulted in a 6 percentage point and a 2 percentage point reduction in operating margin for the three months ended March 31,June 30, 2019 and 2018,the nine months ended September 30, 2019, respectively.
Adjusted operating margin is a non-GAAP measure that provides useful information about our ongoing operating performance by excluding the provision (benefit) for loan losses and losses on early extinguishment of debt, which isare not viewed as a key factorfactors governing our investment in the business and isare excluded by management when evaluating operating margin performance. Adjusted operating margin was 50%48% and 44%47% for the three and nine months ended September 30, 2019, respectively, compared to
E*TRADE Q3 2019 10-Q | Page 13
48% and 46% for the same periods in 2018. Adjusted income before income tax expense and net revenue, the numerator and denominator in the adjusted operating margin calculation, include $80 million of losses from our balance sheet repositioning in June 2019, which resulted in a 6 percentage point and a 2 percentage point reduction in adjusted operating margin for the three months ended March 31,June 30, 2019 and 2018,the nine months ended September 30, 2019, respectively. See MD&A—Earnings Overview for a reconciliation of adjusted operating margin to operating margin.
E*TRADE Q1 2019 10-Q | Page 12
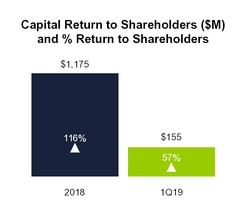
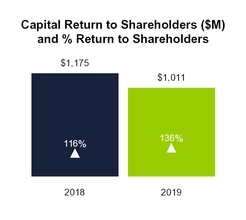
Capital return to shareholders represents the amount of earnings returned to shareholders through share repurchases and common stock dividends and Capital return percentage to shareholders is capital returned to shareholders as a percentage of net income available to common shareholders. Capital return to shareholders was $155 million$1.0 billion and $1.2 billion for the threenine months ended March 31,September 30, 2019 and the year ended December 31, 2018, respectively. Capital return percentage to shareholders was 57%136% and 116% for the threenine months ended March 31,September 30, 2019 and the year ended December 31, 2018, respectively. The Company's balance sheet repositioning in the second quarter 2019 generated additional capital to support share repurchases. In addition, the Company also returned capital to shareholders in the form of shares withheld for taxes of $16$20 million and $28 million for the threenine months ended March 31,September 30, 2019 and the year ended December 31, 2018, respectively.
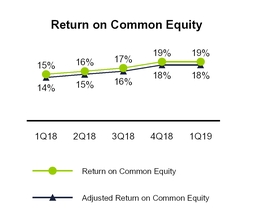
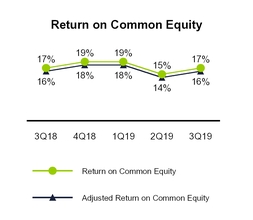
Return on common equity is calculated by dividing net income available to common shareholders by average common shareholders' equity, which excludes preferred stock. Return on common equity was 19%17% for both the three and 15%nine months ended September 30, 2019, respectively, compared to 17% and 16% for the same periods in 2018. Net income available to common shareholders includes $80 million of losses from our balance sheet repositioning in June 2019, which had an after-tax impact of $59 million and resulted in a 4 percentage point and one percentage point reduction in return on common equity for the three months ended March 31,June 30, 2019 and 2018,the nine months ended September 30, 2019, respectively.
Adjusted return on common equity is a non-GAAP measure calculated by dividing adjusted net income available to common shareholders by average common shareholders' equity, which excludes preferred stock. Adjusted net income available to common shareholders is a non-GAAP measure which excludes the provision (benefit) for loan losses and losses on early extinguishment of debt, which isare not viewed as a key factorfactors governing our investment in the business and isare excluded by management when evaluating return on common equity performance. Adjusted return on common equity was 18%16% for both the three and 14%nine months ended September 30, 2019 compared to 16% and 15% for the three months ended March 31, 2019 and 2018, respectively.same periods in 2018. See MD&A—Earnings Overview for a reconciliation of adjusted net income available to common shareholders to net income and adjusted return on common equity to return on common equity. Adjusted net income available to common shareholders includes $80 million of losses from our balance sheet repositioning in June 2019, which had an after-tax impact of $59 million and resulted in a 4 percentage point and 2 percentage point reduction in adjusted return on common equity for the three months ended June 30, 2019 and the nine months ended September 30, 2019, respectively.
E*TRADE Q1Q3 2019 10-Q | Page 1314
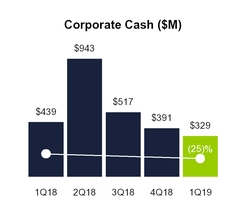
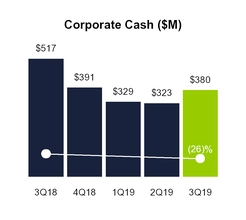
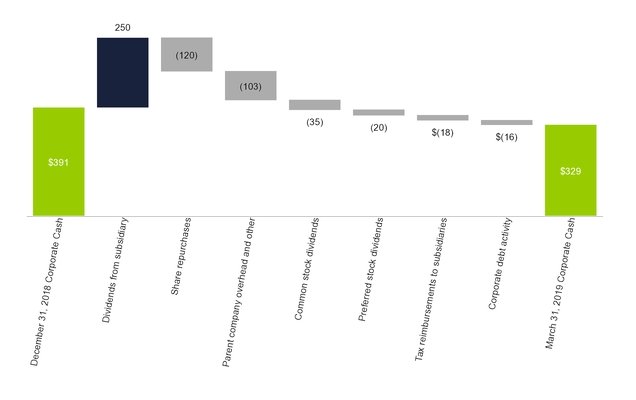
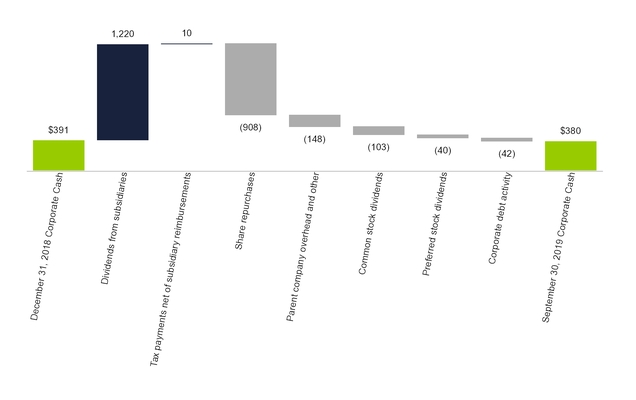
Corporate cash, a non-GAAP measure, is a component of cash and equivalents and represents the primary source of capital above and beyond the capital deployed in our regulated subsidiaries. Cash and equivalents was $523$493 million and $498$596 million at March 31,September 30, 2019 and 2018, respectively, while corporate cash was $329$380 million and $439$517 million for the same periods. See MD&A—Liquidity and Capital Resources for a reconciliation of corporate cash to cash and equivalents.
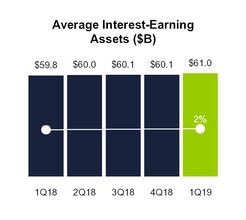
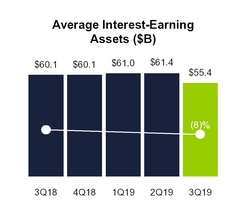
Average interest-earning assets, along with net interest margin, are indicators of our ability to generate net interest income. Average interest-earning assets were $61.0$55.4 billion and $59.8$59.3 billion for the three and nine months ended March 31,September 30, 2019, respectively, compared to $60.1 billion and 2018, respectively.$60.0 billion for the same periods in 2018.
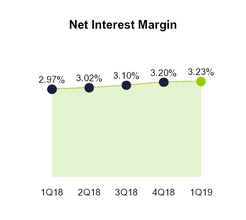
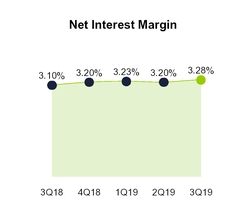
Net interest margin is a measure of the net yield on our average interest-earning assets. Net interest margin is calculated for a given period by dividing the annualized sum of net interest income by average interest-earning assets. Net interest margin was 3.23%3.28% and 2.97%3.23% for the three and nine months ended March 31,September 30, 2019, respectively, compared to 3.10% and 2018, respectively.3.03% for the same periods in 2018.
E*TRADE Q1Q3 2019 10-Q | Page 1415
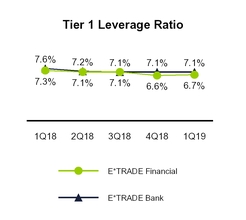
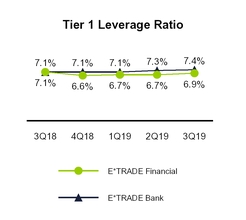
Tier 1 leverage ratio is an indicator of capital adequacy for E*TRADE Financial and E*TRADE Bank. Tier 1 leverage ratio is Tier 1 capital divided by adjusted average assets for leverage capital purposes. E*TRADE Financial's Tier 1 leverage ratio was 6.7%6.9% and 7.3%7.1% at March 31,September 30, 2019 and 2018, respectively. E*TRADE Bank's Tier 1 leverage ratio was 7.4% and 7.1% and 7.6% at March 31,September 30, 2019 and 2018, respectively. The internal threshold for E*TRADE Financial's Tier 1 leverage ratio is 6.5% and the internal threshold for E*TRADE Bank's Tier 1 leverage ratio is 7.0%. See MD&A—Liquidity and Capital Resources for additional information, including the calculation of regulatory capital ratios.
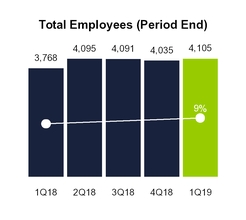
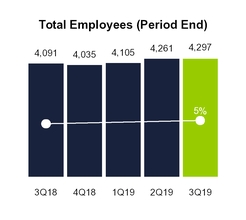
Total employees is the key driver of compensation and benefits expense, our largest non-interest expense category. Total employees were 4,1054,297 and 3,7684,091 at March 31,September 30, 2019 and 2018, respectively.
E*TRADE Q1Q3 2019 10-Q | Page 1516
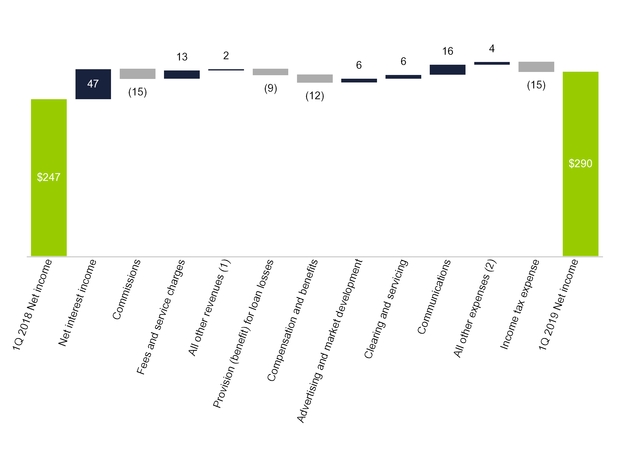
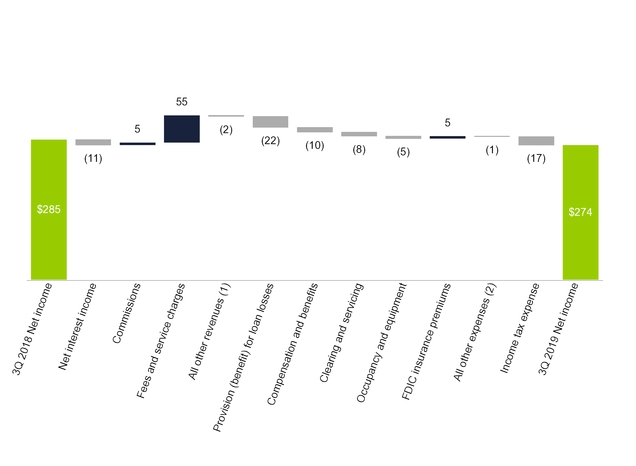
We generated net income of $290$274 million and $783 million on total net revenue of $755$767 million and $2.2 billion for the three and nine months ended March 31, 2019.September 30, 2019, respectively. The following chart presents a reconciliation of net income for the three months ended March 31,September 30, 2018 to net income for the three months ended March 31,September 30, 2019 (dollars in millions):
| |
| (1) | Includes gains (losses) on securities and other, net and other revenue. |
| |
| (2) | Includes advertising and market development, professional services, occupancy and equipment,communications, depreciation and amortization, FDIC insurance premiums, amortization of other intangibles, restructuring and acquisition-related activities, losses on early extinguishment of debt and other non-interest expenses. |
E*TRADE Q1Q3 2019 10-Q | Page 1617
The following table presents significant components of the consolidated statement of income (dollars in millions, except per share amounts): | | | | Three Months Ended March 31, | | Variance | Three Months Ended September 30, | | Variance | | Nine Months Ended September 30, | | Variance |
| | | 2019 vs. 2018 | | 2019 vs. 2018 | | 2019 vs. 2018 |
| | 2019 | | 2018 | | Amount | | % | 2019 | | 2018 | | Amount | | % | | 2019 | | 2018 | | Amount | | % |
| Net interest income | $ | 492 |
| | $ | 445 |
| | $ | 47 |
| | 11 | % | $ | 455 |
| | $ | 466 |
| | $ | (11 | ) | | (2 | )% | | $ | 1,437 |
| | $ | 1,364 |
| | $ | 73 |
| | 5 | % |
| Total non-interest income | 263 |
| | 263 |
| | — |
| | — | % | 312 |
| | 254 |
| | 58 |
| | 23 | % | | 770 |
| | 774 |
| | (4 | ) | | (1 | )% |
| Total net revenue | 755 |
| | 708 |
| | 47 |
| | 7 | % | 767 |
| | 720 |
| | 47 |
| | 7 | % | | 2,207 |
| | 2,138 |
| | 69 |
| | 3 | % |
| Provision (benefit) for loan losses | (12 | ) | | (21 | ) | | 9 |
| | (43 | )% | (12 | ) | | (34 | ) | | 22 |
| | (65 | )% | | (32 | ) | | (74 | ) | | 42 |
| | (57 | )% |
| Total non-interest expense | 375 |
| | 395 |
| | (20 | ) | | (5 | )% | 399 |
| | 380 |
| | 19 |
| | 5 | % | | 1,172 |
| | 1,159 |
| | 13 |
| | 1 | % |
| Income before income tax expense | 392 |
| | 334 |
| | 58 |
| | 17 | % | 380 |
| | 374 |
| | 6 |
| | 2 | % | | 1,067 |
| | 1,053 |
| | 14 |
| | 1 | % |
| Income tax expense | 102 |
| | 87 |
| | 15 |
| | 17 | % | 106 |
| | 89 |
| | 17 |
| | 19 | % | | 284 |
| | 271 |
| | 13 |
| | 5 | % |
| Net income | $ | 290 |
| | $ | 247 |
| | $ | 43 |
| | 17 | % | $ | 274 |
| | $ | 285 |
| | $ | (11 | ) | | (4 | )% | | $ | 783 |
| | $ | 782 |
| | $ | 1 |
| | — | % |
| Preferred stock dividends | 20 |
| | 12 |
| | 8 |
| | 67 | % | 20 |
| | 24 |
| | (4 | ) | | (17 | )% | | 40 |
| | 36 |
| | 4 |
| | 11 | % |
| Net income available to common shareholders | $ | 270 |
| | $ | 235 |
| | $ | 35 |
| | 15 | % | $ | 254 |
| | $ | 261 |
| | $ | (7 | ) | | (3 | )% | | $ | 743 |
| | $ | 746 |
| | $ | (3 | ) | | — | % |
| Diluted earnings per common share | $ | 1.09 |
| | $ | 0.88 |
| | $ | 0.21 |
| | 24 | % | $ | 1.08 |
| | $ | 1.00 |
| | $ | 0.08 |
| | 8 | % | | $ | 3.07 |
| | $ | 2.82 |
| | $ | 0.25 |
|
| 9 | % |
Net income increased 17%decreased 4% to $290$274 million or $1.09$1.08 per diluted share and slightly increased to $783 million or $3.07 per diluted share, for the three and nine months ended March 31,September 30, 2019, respectively, compared to the same periodperiods in 2018. Net income available to common shareholders was $270$254 million and $743 million for the three and nine months ended September 30, 2019, respectively, which reflects payments of $20 million and $40 million in preferred stock dividends, respectively. This compares to $261 million and $746 million for the same periods in 2018, which reflects payments of $24 million and $36 million in preferred stock dividends, respectively.
The decrease in net income for the three months ended March 31,September 30, 2019 which reflects payment of $20 million in preferred stock dividends, comparedwas primarily driven by lower benefit for loan losses and higher non-interest and income tax expenses, partially offset by higher non-interest income primarily due to $235 millionhigher revenue earned on customer cash held by third parties. The increase for the same period in 2018, which reflects payment of $12 million in preferred stock dividends. The increase in net incomenine months ended September 30, 2019 was primarily driven by higher net interest income, due to a larger average balance sheet, an improvement in net interest margin and higher fees and service charges, that were offset by decreased commissions revenue driven by lower trading volume. Lower non-interest expense also contributed to increased net income, which was driven by lower advertising and market development, clearing and servicing and communications expense, partially offset by increased compensation and benefits expense. These drivers of increased net income were partially offset by a lower benefit for loan losses during the three months ended March 31, 2019.and higher non-interest and income tax expenses.
Net Revenue
The following table presents the significant components of total net revenue (dollars in millions): | | | | Three Months Ended March 31, | | Variance | Three Months Ended September 30, | | Variance | | Nine Months Ended September 30, | | Variance |
| | | 2019 vs. 2018 | | 2019 vs. 2018 | | 2019 vs. 2018 |
| | 2019 | | 2018 | | Amount | | % | 2019 | | 2018 | | Amount | | % | | 2019 | | 2018 | | Amount | | % |
| Net interest income | $ | 492 |
| | $ | 445 |
| | $ | 47 |
| | 11 | % | $ | 455 |
| | $ | 466 |
| | $ | (11 | ) | | (2 | )% | | $ | 1,437 |
| | $ | 1,364 |
| | $ | 73 |
| | 5 | % |
| Commissions | 122 |
| | 137 |
| | (15 | ) | | (11 | )% | 122 |
| | 117 |
| | 5 |
| | 4 | % | | 365 |
| | 375 |
| | (10 | ) | | (3 | )% |
| Fees and service charges | 118 |
| | 105 |
| | 13 |
| | 12 | % | 163 |
| | 108 |
| | 55 |
| | 51 | % | | 407 |
| | 323 |
| | 84 |
| | 26 | % |
| Gains on securities and other, net | 11 |
| | 10 |
| | 1 |
| | 10 | % | |
| Gains (losses) on securities and other, net | | 16 |
| | 17 |
| | (1 | ) | | (6 | )% | | (37 | ) | | 42 |
| | (79 | ) | | * |
|
| Other revenue | 12 |
| | 11 |
| | 1 |
| | 9 | % | 11 |
| | 12 |
| | (1 | ) | | (8 | )% | | 35 |
| | 34 |
| | 1 |
| | 3 | % |
| Total non-interest income | 263 |
| | 263 |
| | — |
| | — | % | 312 |
| | 254 |
| | 58 |
| | 23 | % | | 770 |
| | 774 |
| | (4 | ) | | (1 | )% |
| Total net revenue | $ | 755 |
| | $ | 708 |
| | $ | 47 |
| | 7 | % | $ | 767 |
| | $ | 720 |
| | $ | 47 |
| | 7 | % | | $ | 2,207 |
| | $ | 2,138 |
| | $ | 69 |
| | 3 | % |
Net Interest Income
Net interest income increased 11% to $492 million for the three months ended March 31, 2019 compared to the same period in 2018. Net interest income is earned primarily through investment securities, margin receivables and our legacy mortgage and consumer loan portfolio, offset by funding costs.
| |
| * | Percentage not meaningful. |
E*TRADE Q1Q3 2019 10-Q | Page 1718
Net Interest Income
Net interest income decreased 2% to $455 million and increased 5% to $1.4 billion for the three and nine months ended September 30, 2019, respectively, compared to the same periods in 2018. Net interest income is earned primarily through investment securities, margin receivables, securities lending, and our legacy mortgage and consumer loan portfolio, offset by funding costs.
The following table presentstables present average balance sheet data and interest income and expense data, as well as related net interest margin, yields, and rates (dollars in millions):
| | | | Three Months Ended March 31, | Three Months Ended September 30, |
| | 2019 | | 2018 | 2019 | | 2018 |
| | Average Balance | | Interest Inc./Exp. | | Average Yield/ Cost | | Average Balance | | Interest Inc./Exp. | | Average Yield/ Cost | Average Balance | | Interest Inc./Exp. | | Average Yield/ Cost | | Average Balance | | Interest Inc./Exp. | | Average Yield/ Cost |
| Cash and equivalents | $ | 607 |
| | $ | 3 |
| | 2.31 | % | | $ | 803 |
| | $ | 3 |
| | 1.42 | % | $ | 429 |
| | $ | 2 |
| | 2.11 | % | | $ | 471 |
| | $ | 2 |
| | 1.84 | % |
| Cash segregated under federal or other regulations | 986 |
| | 6 |
| | 2.63 | % | | 795 |
| | 3 |
| | 1.62 | % | 1,073 |
| | 7 |
| | 2.41 | % | | 836 |
| | 4 |
| | 2.15 | % |
| Investment securities | 46,968 |
| | 365 |
| | 3.10 | % | | 45,194 |
| | 290 |
| | 2.57 | % | 41,326 |
| | 324 |
| | 3.13 | % | | 44,773 |
| | 315 |
| | 2.82 | % |
| Margin receivables | 9,766 |
| | 126 |
| | 5.24 | % | | 9,466 |
| | 103 |
| | 4.41 | % | 9,880 |
| | 120 |
| | 4.83 | % | | 10,902 |
| | 130 |
| | 4.74 | % |
Loans(1) | 2,058 |
| | 28 |
| | 5.48 | % | | 2,629 |
| | 33 |
| | 5.07 | % | 1,812 |
| | 25 |
| | 5.58 | % | | 2,332 |
| | 32 |
| | 5.38 | % |
| Broker-related receivables and other | 632 |
| | 4 |
| | 2.24 | % | | 950 |
| | 4 |
| | 1.55 | % | 918 |
| | 5 |
| | 2.02 | % | | 798 |
| | 4 |
| | 2.02 | % |
| Total interest-earning assets | 61,017 |
| | 532 |
| | 3.50 | % | | 59,837 |
| | 436 |
| | 2.92 | % | 55,438 |
| | 483 |
| | 3.47 | % | | 60,112 |
| | 487 |
| | 3.24 | % |
Other interest revenue(2) | — |
| | 23 |
| | | | — |
| | 32 |
| | | — |
| | 38 |
| | | | — |
| | 27 |
| | |
| Total interest-earning assets | 61,017 |
| | 555 |
| | 3.65 | % | | 59,837 |
| | 468 |
| | 3.14 | % | 55,438 |
| | 521 |
| | 3.74 | % | | 60,112 |
| | 514 |
| | 3.41 | % |
| Total non-interest-earning assets | 4,991 |
| | | | | | 4,787 |
| | | | | 5,859 |
| | | | | | 4,291 |
| | | | |
| Total assets | $ | 66,008 |
| | | | | | $ | 64,624 |
| | | | | $ | 61,297 |
| | | | | | $ | 64,403 |
| | | | |
| | | | | | | | | | | | | | | | | | | | | | | |
| Sweep deposits | $ | 38,433 |
| | $ | 20 |
| | 0.21 | % | | $ | 38,299 |
| | $ | 2 |
| | 0.02 | % | $ | 30,559 |
| | $ | 11 |
| | 0.14 | % | | $ | 37,550 |
| | $ | 14 |
| | 0.15 | % |
| Savings deposits | 4,968 |
| | 15 |
| | 1.22 | % | | 2,833 |
| | — |
| | 0.01 | % | 7,533 |
| | 27 |
| | 1.44 | % | | 2,972 |
| | 2 |
| | 0.26 | % |
| Other deposits | 1,785 |
| | — |
| | 0.03 | % | | 2,046 |
| | — |
| | 0.02 | % | 1,614 |
| | — |
| | 0.03 | % | | 1,934 |
| | — |
| | 0.03 | % |
| Customer payables | 10,462 |
| | 9 |
| | 0.34 | % | | 9,556 |
| | 1 |
| | 0.06 | % | 10,915 |
| | 7 |
| | 0.27 | % | | 10,352 |
| | 8 |
| | 0.30 | % |
| Broker-related payables and other | 999 |
| | 1 |
| | 0.49 | % | | 1,566 |
| | 1 |
| | 0.20 | % | 1,241 |
| | 2 |
| | 0.51 | % | | 1,880 |
| | 3 |
| | 0.53 | % |
| Other borrowings | 269 |
| | 2 |
| | 3.81 | % | | 932 |
| | 7 |
| | 3.12 | % | 102 |
| | 1 |
| | 4.77 | % | | 752 |
| | 6 |
| | 2.95 | % |
| Corporate debt | 1,409 |
| | 14 |
| | 3.91 | % | | 991 |
| | 9 |
| | 3.62 | % | 1,410 |
| | 14 |
| | 3.86 | % | | 1,408 |
| | 13 |
| | 3.90 | % |
| Total interest-bearing liabilities | 58,325 |
| | 61 |
| | 0.42 | % | | 56,223 |
| | 20 |
| | 0.14 | % | 53,374 |
| | 62 |
| | 0.46 | % | | 56,848 |
| | 46 |
| | 0.32 | % |
Other interest expense(3) | — |
| | 2 |
| | | | — |
| | 3 |
| | | — |
| | 4 |
| | | | — |
| | 2 |
| | |
| Total interest-bearing liabilities | 58,325 |
| | 63 |
| | 0.44 | % | | 56,223 |
| | 23 |
| | 0.17 | % | 53,374 |
| | 66 |
| | 0.49 | % | | 56,848 |
| | 48 |
| | 0.33 | % |
| Total non-interest-bearing liabilities | 1,183 |
| | | | | | 1,329 |
| | | | | 1,251 |
| | | | | | 859 |
| | | | |
| Total liabilities | 59,508 |
| | | | | | 57,552 |
| | | | | 54,625 |
| | | | | | 57,707 |
| | | | |
| Total shareholders' equity | 6,500 |
| | | | | | 7,072 |
| | | | | 6,672 |
| | | | | | 6,696 |
| | | | |
| Total liabilities and shareholders' equity | $ | 66,008 |
| | | | | | $ | 64,624 |
| | | | | $ | 61,297 |
| | | | | | $ | 64,403 |
| | | | |
| Excess interest earning assets over interest bearing liabilities/net interest income/net interest margin | $ | 2,692 |
| | $ | 492 |
| | 3.23 | % | | $ | 3,614 |
| | $ | 445 |
| | 2.97 | % | $ | 2,064 |
| | $ | 455 |
| | 3.28 | % | | $ | 3,264 |
| | $ | 466 |
| | 3.10 | % |
| |
| (1) | Nonaccrual loans are included in the average loan balances. Interest payments received on nonaccrual loans are recognized on a cash basis in interest income until it is doubtful that full payment will be collected, at which point payments are applied to principal. |
| |
| (2) | Other interest revenue is earned on certain securities loaned balances. Interest expense incurred on other securities loaned balances is presented on the broker-related payables and other line item above. |
| |
| (3) | Other interest expense is incurred on certain securities borrowed balances. Interest income earned on other securities borrowed balances is presented on the broker-related receivables and other line item above. |
E*TRADE Q3 2019 10-Q | Page 19
|
| | | | | | | | | | | | | | | | | | | | | |
| | Nine Months Ended September 30, |
| | 2019 | | 2018 |
| | Average Balance | | Interest Inc./Exp. | | Average Yield/ Cost | | Average Balance | | Interest Inc./Exp. | | Average Yield/ Cost |
| Cash and equivalents | $ | 497 |
| | $ | 8 |
| | 2.26 | % | | $ | 601 |
| | $ | 7 |
| | 1.60 | % |
| Cash segregated under federal or other regulations | 977 |
| | 19 |
| | 2.55 | % | | 795 |
| | 11 |
| | 1.91 | % |
| Investment securities | 45,202 |
| | 1,057 |
| | 3.12 | % | | 44,979 |
| | 908 |
| | 2.69 | % |
| Margin receivables | 9,910 |
| | 376 |
| | 5.08 | % | | 10,225 |
| | 351 |
| | 4.59 | % |
Loans(1) | 1,929 |
| | 81 |
| | 5.60 | % | | 2,475 |
| | 98 |
| | 5.25 | % |
| Broker-related receivables and other | 738 |
| | 12 |
| | 2.15 | % | | 898 |
| | 12 |
| | 1.76 | % |
| Total interest-earning assets | 59,253 |
| | 1,553 |
| | 3.50 | % | | 59,973 |
| | 1,387 |
| | 3.09 | % |
Other interest revenue(2) | — |
| | 83 |
| | | | — |
| | 84 |
| | |
| Total interest-earning assets | 59,253 |
| | 1,636 |
| | 3.68 | % | | 59,973 |
| | 1,471 |
| | 3.27 | % |
| Total non-interest-earning assets | 5,318 |
| | | | | | 4,479 |
| | | | |
| Total assets | $ | 64,571 |
| | | | | | $ | 64,452 |
| | | | |
| | | | | | | | | | | | |
| Sweep deposits | $ | 35,429 |
| | $ | 49 |
| | 0.18 | % | | $ | 38,012 |
| | $ | 23 |
| | 0.08 | % |
| Savings deposits | 6,292 |
| | 65 |
| | 1.39 | % | | 2,857 |
| | 3 |
| | 0.11 | % |
| Other deposits | 1,709 |
| | — |
| | 0.03 | % | | 2,008 |
| | — |
| | 0.02 | % |
| Customer payables | 10,658 |
| | 24 |
| | 0.30 | % | | 9,817 |
| | 13 |
| | 0.18 | % |
| Broker-related payables and other | 1,098 |
| | 4 |
| | 0.49 | % | | 1,885 |
| | 7 |
| | 0.49 | % |
| Other borrowings | 227 |
| | 7 |
| | 3.94 | % | | 837 |
| | 21 |
| | 3.28 | % |
| Corporate debt | 1,410 |
| | 42 |
| | 3.94 | % | | 1,149 |
| | 32 |
| | 3.75 | % |
| Total interest-bearing liabilities | 56,823 |
| | 191 |
| | 0.45 | % | | 56,565 |
| | 99 |
| | 0.23 | % |
Other interest expense(3) | — |
| | 8 |
| | | | — |
| | 8 |
| | |
| Total interest-bearing liabilities | 56,823 |
| | 199 |
| | 0.47 | % | | 56,565 |
| | 107 |
| | 0.25 | % |
| Total non-interest-bearing liabilities | 1,152 |
| | | | | | 939 |
| | | | |
| Total liabilities | 57,975 |
| | | | | | 57,504 |
| | | | |
| Total shareholders' equity | 6,596 |
| | | | | | 6,948 |
| | | | |
| Total liabilities and shareholders' equity | $ | 64,571 |
| | | | | | $ | 64,452 |
| | | | |
| Excess interest earning assets over interest bearing liabilities/net interest income/net interest margin | $ | 2,430 |
| | $ | 1,437 |
| | 3.23 | % | | $ | 3,408 |
| | $ | 1,364 |
| | 3.03 | % |
| |
| (1) | Nonaccrual loans are included in the average loan balances. Interest payments received on nonaccrual loans are recognized on a cash basis in interest income until it is doubtful that full payment will be collected, at which point payments are applied to principal. |
| |
| (2) | Other interest revenue is earned on certain securities loaned balances. Interest expense incurred on other securities loaned balances is presented on the broker-related payables and other line item above. |
| |
| (3) | Other interest expense is incurred on certain securities borrowed balances. Interest income earned on other securities borrowed balances is presented on the broker-related receivables and other line item above. |
Average interest-earning assets increased 2%decreased 8% to $61.0$55.4 billion and 1% to $59.3 billion for the three and nine months ended March 31,September 30, 2019, respectively, compared to the same periodperiods in 2018. The fluctuation in interest-earning assets is generally driven by changes in interest-bearing liabilities, primarily deposits and customer payables. Average interest-bearing liabilities decreased 6% to $53.4 billion and slightly increased 4% to $58.3$56.8 billion for the three and nine months ended March 31,September 30, 2019, respectively, compared to the same periodperiods in 2018 due to the following:
| |
| • | Deposits and customer payables: The increase to savings deposits was primarily driven by higher deposits, as we assumed deposits as part of the acquisition of TCA and retail accounts from Capital One, and from the growth in the Premium Savings Account product first introduced in the second quarter of 2018. These increasesThe decrease in sweep deposits was primarily driven by the balance sheet repositioning during the second quarter of 2019, as we moved $6.6 billion of deposits to third-party banks. The deposits and customer payables balances were partially offsetalso impacted by customer net buying, which reflected net buying of $3.3$3.4 billion during the threenine months ended March 31,September 30, 2019, compared to net buying of $6.9$12.0 billion in the same period in 2018. |
E*TRADE Q1Q3 2019 10-Q | Page 1820
| |
| • | Other interest-bearing liabilities: The increasedecrease in customer payables resulted in lower utilization of broker-related payables and other forborrowings was driven by customer activity, including short-term liquidity management.needs at E*TRADE Bank and E*TRADE Securities. In addition, net proceeds from the June 2018 issuance of corporate debt were used to redeem the Company's trust preferred securities in the third quarter of 2018, resulting in the increase in corporate debt partially offset by thea decrease in other borrowings.borrowings and an offsetting increase to corporate debt as compared to the nine months ended September 30, 2018. |
Net interest margin increased 2618 basis points to 3.28% and 20 basis points to 3.23% for the three and nine months ended March 31,September 30, 2019, respectively, compared to the same periodperiods in 2018. Net interest margin is driven by the mix of average asset and liability balances and the interest rates earned or paid on those balances. The increase during the three and nine months ended March 31,September 30, 2019, compared to the same periodperiods in 2018, is due to higher interest rates earned on higher margin receivables, and investment securities, and loans balances as well as higher securities lending revenues, partially offset by increased funding costs due to increased rates paid on deposits, including the Premium Savings Account product, and customer payables during the three months ended March 31, 2019.product. The increase in rates was largely driven by the four increases in federal funds rates that occurred during 2018.2018 partially offset by the two federal funds rate cuts during 2019. Our net interest margin was also impacted by the continued run-off of our higher yielding legacy mortgage and consumer loan portfolio.
Commissions
Commissions revenue decreased 11%increased 4% to $122 million and decreased 3% to $365 million for the three and nine months ended March 31,September 30, 2019, respectively, compared to the same periodperiods in 2018. The primary factors that affect commissions revenue are DARTs, average commission per trade and the number of trading days. With the elimination of retail commissions for online US listed stock, ETF and options trades, which became effective on October 7, 2019, we expect the majority of commissions revenue in future periods will be driven from options contract charges and futures trading activity. For additional information see MD&A—Overview.
DARTs volume decreased 7%increased 5% to 279,405266,935 and 1% to 271,514 for the three and nine months ended March 31,September 30, 2019, respectively, compared to the same periodperiods in 2018. DARTs volume is impacted by market sentiment as well as volatility of the equity markets. Derivative DARTs volume decreased 7%increased 12% to 90,04294,895 and 3% to 91,470 for the three and nine months ended March 31,September 30, 2019, respectively, compared to the same periodperiods in 2018.
Average commission per trade decreased 5%2% to $7.17$7.18 and 4% to $7.16 for the three and nine months ended March 31,September 30, 2019, respectively, compared to the same periodperiods in 2018. Average commission per trade is impacted by trade mix and differing commission rates on various trade types (e.g. equities, derivatives, corporate services and mutual funds).
E*TRADE Q3 2019 10-Q | Page 21
Fees and Service Charges
The following table presents the significant components of fees and service charges (dollars in millions): | | | | Three Months Ended March 31, | | Variance | Three Months Ended September 30, | | Variance | | Nine Months Ended September 30, | | Variance |
| | | 2019 vs. 2018 | | 2019 vs. 2018 | | 2019 vs. 2018 |
| | 2019 | | 2018 | | Amount | | % | 2019 | | 2018 | | Amount | | % | | 2019 | | 2018 | | Amount | | % |
Money market funds and sweep deposits revenue(1) | | $ | 62 |
| | $ | 18 |
| | $ | 44 |
| | 244 | % | | $ | 106 |
| | $ | 53 |
| | $ | 53 |
| | 100 | % |
| Order flow revenue | $ | 43 |
| | $ | 47 |
| | $ | (4 | ) | | (9 | )% | 46 |
| | 40 |
| | 6 |
| | 15 | % | | 134 |
| | 130 |
| | 4 |
| | 3 | % |
Money market funds and sweep deposits revenue(1) | 21 |
| | 17 |
| | 4 |
| | 24 | % | |
| Advisor management and custody fees | 18 |
| | 11 |
| | 7 |
| | 64 | % | 19 |
| | 19 |
| | — |
| | — | % | | 56 |
| | 46 |
| | 10 |
| | 22 | % |
| Mutual fund service fees | 12 |
| | 11 |
| | 1 |
| | 9 | % | 13 |
| | 13 |
| | — |
| | — | % | | 38 |
| | 36 |
| | 2 |
| | 6 | % |
| Foreign exchange revenue | 8 |
| | 8 |
| | — |
| | — | % | 8 |
| | 7 |
| | 1 |
| | 14 | % | | 24 |
| | 21 |
| | 3 |
| | 14 | % |
| Reorganization fees | 6 |
| | 3 |
| | 3 |
| | 100 | % | 5 |
| | 3 |
| | 2 |
| | 67 | % | | 18 |
| | 10 |
| | 8 |
| | 80 | % |
| Other fees and service charges | 10 |
| | 8 |
| | 2 |
| | 25 | % | 10 |
| | 8 |
| | 2 |
| | 25 | % | | 31 |
| | 27 |
| | 4 |
| | 15 | % |
| Total fees and service charges | $ | 118 |
| | $ | 105 |
| | $ | 13 |
| | 12 | % | $ | 163 |
| | $ | 108 |
| | $ | 55 |
| | 51 | % | | $ | 407 |
| | $ | 323 |
| | $ | 84 |
| | 26 | % |
| |
| (1) | Includes revenue earned on average customer cash held by third parties based on the federal funds rate or LIBOR plus a negotiated spread or other contractual arrangements with the third partythird-party institutions. |
Fees and service charges increased 51% to $163 million and 26% to $407 million for the three and nine months ended September 30, 2019, respectively, compared to the same periods in 2018. These increases were primarily driven by higher money market funds and sweep deposits revenue driven by larger balances as a result of the balance sheet repositioning in June 2019 and a higher yield of approximately 195 and 180 basis points for the three and nine months ended September 30, 2019, respectively, compared to 145 and 140 basis points for the same periods in 2018. Advisor management and custody fees for the nine months ended September 30, 2019 also increased as a result of the acquisition of TCA in the second quarter of 2018.
E*TRADE Q1Q3 2019 10-Q | Page 1922
Fees and service charges increased 12% to $118 million for the three months ended March 31, 2019 compared to the same period in 2018 primarily driven by increased advisor management and custody fees as a result of the acquisition of TCA and increased money market funds and sweep deposits revenue driven by a higher yield of approximately 165 basis points for the three months ended March 31, 2019 compared to 135 basis points for the same period in 2018. These increases were partially offset by decreased order flow revenue driven by lower trade volume.
Gains (Losses) on Securities and Other, Net
The following table presents the significant components of gains (losses) on securities and other, net (dollars in millions): |
| | | | | | | | | | | | | | |
| | Three Months Ended March 31, | | Variance |
| | | 2019 vs. 2018 |
| | 2019 | | 2018 | | Amount | | % |
| Gains on available-for-sale securities | $ | 11 |
| | $ | 11 |
| | $ | — |
| | — | % |
| Equity method investment income (loss) and other | — |
| | (1 | ) | | 1 |
| | (100 | )% |
| Gains on securities and other, net | $ | 11 |
| | $ | 10 |
| | $ | 1 |
| | 10 | % |
|
| | | | | | | | | | | | | | | | | | | | | | | | | | | | | |
| | Three Months Ended September 30, | | Variance | | Nine Months Ended September 30, | | Variance |
| | | 2019 vs. 2018 | | | 2019 vs. 2018 |
| | 2019 | | 2018 | | Amount | | % | | 2019 | | 2018 | | Amount | | % |
| Gains (losses) on available-for-sale securities, net: | | | | | | | | | | | | | | | |
Gains on available-for-sale securities(1)(2) | $ | 14 |
| | $ | 65 |
| | $ | (51 | ) | | (78 | )% | | $ | 40 |
| | $ | 87 |
| | $ | (47 | ) | | (54 | )% |
Losses on available-for-sale securities(1)(2) | — |
| | (54 | ) | | 54 |
| | (100 | )% | | (80 | ) | | (54 | ) | | (26 | ) | | 48 | % |
| Subtotal | 14 |
| | 11 |
| | 3 |
| | 27 | % | | (40 | ) | | 33 |
| | (73 | ) | | * |
|
Equity method investment income and other(3) | 2 |
| | 6 |
| | (4 | ) | | (67 | )% | | 3 |
| | 9 |
| | (6 | ) | | (67 | )% |
| Gains (losses) on securities and other, net | $ | 16 |
| | $ | 17 |
| | $ | (1 | ) | | (6 | )% | | $ | (37 | ) | | $ | 42 |
| | $ | (79 | ) | | * |
|
| |
| * | Percentage not meaningful. |
| |
| (1) | In June 2019, the Company sold $4.5 billion of lower-yielding investment securities at losses as it repositioned its balance sheet. See MD&A—Balance Sheet Overview and Note 5—Available-for-Sale and Held-to-Maturity Securities for additional information. |
| |
| (2) | In August 2018, the Company sold available-for-sale securities and reinvested the sale proceeds in agency-backed securities at current market rates. See Note 5—Available-for-Sale and Held-to-Maturity Securities for additional information. |
| |
| (3) | Includes a $5 million gain on the sale of our Chicago Stock Exchange investment for the three and nine months ended September 30, 2018. |
Provision (Benefit) for Loan Losses
We recognized a benefit for loan losses of $12 million and $21$32 million for the three and nine months ended March 31,September 30, 2019, respectively, compared to a benefit for loan losses of $34 million and 2018, respectively.$74 million for the same periods in 2018. The timing and magnitude of the provision (benefit) for loan losses is affected by many factors that could result in variability. These benefits reflected better than expected performance of our portfolio as well as recoveries in excess of prior expectations, including sales of charged-off loans and recoveries of previous charge-offs that were not included in our loss estimates. For additional information on management's estimate of the allowance for loan losses, see Note 6—Loans Receivable, Net.
E*TRADE Q3 2019 10-Q | Page 23
Non-Interest Expense
The following table presents the significant components of non-interest expense (dollars in millions): | | | | Three Months Ended March 31, | | Variance | Three Months Ended September 30, | | Variance | | Nine Months Ended September 30, | | Variance |
| | | 2019 vs. 2018 | | 2019 vs. 2018 | | 2019 vs. 2018 |
| | 2019 | | 2018 | | Amount | | % | 2019 | | 2018 | | Amount | | % | | 2019 | | 2018 | | Amount | | % |
| Compensation and benefits | $ | 164 |
| | $ | 152 |
| | $ | 12 |
| | 8 | % | $ | 167 |
| | $ | 157 |
| | $ | 10 |
| | 6 | % | | $ | 499 |
| | $ | 469 |
| | $ | 30 |
| | 6 | % |
| Advertising and market development | 54 |
| | 60 |
| | (6 | ) | | (10 | )% | 41 |
| | 45 |
| | (4 | ) | | (9 | )% | | 143 |
| | 152 |
| | (9 | ) | | (6 | )% |
| Clearing and servicing | 30 |
| | 36 |
| | (6 | ) | | (17 | )% | 36 |
| | 28 |
| | 8 |
| | 29 | % | | 98 |
| | 94 |
| | 4 |
| | 4 | % |
| Professional services | 22 |
| | 22 |
| | — |
| | — | % | 27 |
| | 23 |
| | 4 |
| | 17 | % | | 75 |
| | 70 |
| | 5 |
| | 7 | % |
| Occupancy and equipment | 32 |
| | 30 |
| | 2 |
| | 7 | % | 34 |
| | 29 |
| | 5 |
| | 17 | % | | 98 |
| | 89 |
| | 9 |
| | 10 | % |
| Communications | 15 |
| | 31 |
| | (16 | ) | | (52 | )% | 26 |
| | 30 |
| | (4 | ) | | (13 | )% | | 70 |
| | 89 |
| | (19 | ) | | (21 | )% |
| Depreciation and amortization | 21 |
| | 22 |
| | (1 | ) | | (5 | )% | 23 |
| | 25 |
| | (2 | ) | | (8 | )% | | 65 |
| | 70 |
| | (5 | ) | | (7 | )% |
| FDIC insurance premiums | 4 |
| | 9 |
| | (5 | ) | | (56 | )% | 3 |
| | 8 |
| | (5 | ) | | (63 | )% | | 11 |
| | 26 |
| | (15 | ) | | (58 | )% |
| Amortization of other intangibles | 15 |
| | 10 |
| | 5 |
| | 50 | % | 16 |
| | 12 |
| | 4 |
| | 33 | % | | 46 |
| | 34 |
| | 12 |
| | 35 | % |
| Restructuring and acquisition-related activities | | 2 |
| | 4 |
| | (2 | ) | | (50 | )% | | 2 |
| | 6 |
| | (4 | ) | | (67 | )% |
| Losses on early extinguishment of debt | | — |
| | 4 |
| | (4 | ) | | (100 | )% | | — |
| | 4 |
| | (4 | ) | | (100 | )% |
| Other non-interest expenses | 18 |
| | 23 |
| | (5 | ) | | (22 | )% | 24 |
| | 15 |
| | 9 |
| | 60 | % | | 65 |
| | 56 |
| | 9 |
| | 16 | % |
| Total non-interest expense | $ | 375 |
| | $ | 395 |
| | $ | (20 | ) | | (5 | )% | $ | 399 |
| | $ | 380 |
| | $ | 19 |
| | 5 | % | | $ | 1,172 |
| | $ | 1,159 |
| | $ | 13 |
| | 1 | % |
Compensation and Benefits
Compensation and benefits expense increased 6% to $167 million and 6% to $499 million for the three and nine months ended September 30, 2019, respectively, compared to the same periods in 2018. The expense increase was primarily driven by a 5% increase in headcount as a result of acquisitions during 2018, as well as growth in our business. The nine months ended September 30, 2019 also included an additional $7 million of severance expense compared to the nine months ended September 30, 2018. This increase in severance was related primarily to organizational realignments in the second quarter of 2019 and an executive transition in the third quarter of 2019.
Clearing and Servicing
Clearing and servicing expense increased 29% to $36 million and 4% to $98 million for the three and nine months ended September 30, 2019, respectively, compared to the same periods in 2018. The expense increase was primarily driven by increased fees on higher off-balance sheet customer cash and increased trading volume.
E*TRADE Q1Q3 2019 10-Q | Page 2024
Compensation and BenefitsProfessional Services
Compensation and benefitsProfessional services expense increased 8%17% to $164$27 million and 7% to $75 million for the three and nine months ended March 31,September 30, 2019, respectively, compared to the same periodperiods in 2018. The expense increase includes continued investment in projects to drive operational efficiencies.
Occupancy and Equipment
Occupancy and equipment expense increased 17% to $34 million and 10% to $98 million for the three and nine months ended September 30, 2019, respectively, compared to the same periods in 2018. The expense increase was primarily driven by a 9% increase in headcount as a result of the TCA acquisitionhigher software licenses and to support the onboarding of the retail accounts from Capital One, as well as other growth in our business.
Advertising and Market Development
Advertising and market development expense decreased 10% to $54 million for the three months ended March 31, 2019 compared to the same period in 2018. The decrease was primarily due to lower media and brand production spend as compared to the prior periods.
Clearing and Servicing
Clearing and servicing expense decreased 17% to $30 million for the three months ended March 31, 2019 compared to the same period in 2018. The decrease was primarily due to lower trading-related expenses, driven by lower trading volume, as well as lower loan servicing expense during the three months ended March 31, 2019.facilities expense.
Communications
Communications expense decreased 52%13% to $15$26 million and 21% to $70 million for the three and nine months ended March 31,September 30, 2019, respectively, compared to the same periodperiods in 2018. The decrease during the nine months ended September 30, 2019 was due to a $14 million benefit in the first quarter of 2019 related to a change in estimate for previous market data usage.
FDIC Insurance Premiums
FDIC insurance premiums expense decreased 56%63% to $4$3 million and 58% to $11 million for the three and nine months ended March 31,September 30, 2019, respectively, compared to the same periodperiods in 2018. The decrease wasdecreases were driven primarily by the termination of surcharges paid to the Deposit Insurance Fund after it attained the minimum reserve ratio of 1.35 percent of insured deposits in September 2018.2018, and our balance sheet repositioning in June 2019 when we moved $6.6 billion of deposits to third-party banks.
Amortization of Other Intangibles
Amortization of other intangibles expense increased 50%33% to $15$16 million and 35% to $46 million for the three and nine months ended March 31,September 30, 2019, respectively, compared to the same periodperiods in 2018. The increase wasincreases were primarily due to the intangible assets recognized in connection with the TCA acquisition and acquisition of retail accounts from Capital One and the TCA acquisition.during 2018.
Other Non-Interest Expenses
Other non-interest expenses decreased 22%increased 60% to $18$24 million and 16% to $65 million for the three and nine months ended March 31,September 30, 2019, respectively, compared to the same periodperiods in 2018. The decrease wasincreases were primarily driven by $5 million inhigher business taxes, asset disposals, and losses during the three months ended March 31, 2018 related to margin lending activity and futures transactions due to high market volatility experienced in early February 2018.increased trading activity.
Operating Margin
Operating margin was 52%50% and 48% for the three and nine months ended March 31,September 30, 2019, respectively, compared to 47%52% and 49% for the same periodperiods in 2018. Adjusted operating margin, a non-GAAP measure, was 50%48% and 47% for the three and nine months ended March 31,September 30, 2019, respectively, compared to 44%48% and 46% for the same periodperiods in 2018.
E*TRADE Q1Q3 2019 10-Q | Page 2125
Adjusted operating margin is calculated by dividing adjusted income before income tax expense by total net revenue. Adjusted income before income tax expense, a non-GAAP measure, excludes provision (benefit) for loan losses.losses and losses on early extinguishment of debt. The following table presents a reconciliation of adjusted income before income tax expense and adjusted operating margin, non-GAAP measures, to the most directly comparable GAAP measures (dollars in millions):
| | | | Three Months Ended March 31, | Three Months Ended September 30, | | Nine Months Ended September 30, |
| | 2019 | | 2018 | 2019 | | 2018 | | 2019 | | 2018 |
| | Amount | | Operating Margin % | | Amount | | Operating Margin % | Amount | | Operating Margin % | | Amount | | Operating Margin % | | Amount | | Operating Margin % | | Amount | | Operating Margin % |
Income before income tax expense / operating margin | $ | 392 |
| | 52 | % | | $ | 334 |
| | 47 | % | $ | 380 |
| | 50 | % | | $ | 374 |
| | 52 | % | | $ | 1,067 |
| | 48 | % | | $ | 1,053 |
| | 49 | % |
| Add back impact of pre-tax items: | | | | | | | | | | | | | | | | |
| Provision (benefit) for loan losses | (12 | ) | | | | (21 | ) | | | (12 | ) | | | | (34 | ) | | | | (32 | ) | | | | (74 | ) | | |
| Adjusted income before income tax expense / adjusted operating margin | $ | 380 |
| | 50 | % | | $ | 313 |
| | 44 | % | |
| Losses on early extinguishment of debt | | — |
| | | | 4 |
| | | | — |
| | | | 4 |
| | |
| Subtotal | | (12 | ) | | | | (30 | ) | | | | (32 | ) | | | | (70 | ) | | |
Adjusted income before income tax expense / adjusted operating margin(1) | | $ | 368 |
| | 48 | % | | $ | 344 |
| | 48 | % | | $ | 1,035 |
| | 47 | % | | $ | 983 |
| | 46 | % |
| |
| (1) | Income before income tax expense and adjusted income before income tax expense included $80 million of pre-tax losses from balance sheet repositioning for the nine months ended September 30, 2019, which resulted in a 2 percentage point reduction in both operating margin and adjusted operating margin. |
E*TRADE Q3 2019 10-Q | Page 26
Return on Common Equity
Return on common equity was 19%17% for both the three and nine months ended March 31,September 30, 2019, respectively, compared to 15%17% and 16% for the same periodperiods in 2018. Adjusted return on common equity, a non-GAAP measure, was 18%16% for both the three and nine months ended March 31,September 30, 2019, respectively, compared to 14%16% and 15% for the same periodperiods in 2018.
Adjusted return on common equity is calculated by dividing adjusted net income available to common shareholders by average common shareholders' equity, which excludes preferred stock. Adjusted net income available to common shareholders, a non-GAAP measure, excludes the after-tax impact of the provision (benefit) for loan losses.losses and losses on early extinguishment of debt. The following table provides a reconciliation of GAAP net income available to common shareholders and return on common equity percentage to non-GAAP adjusted net income available to common shareholders and adjusted return on common equity percentage (dollars in millions): | | | | Three Months Ended March 31, | Three Months Ended September 30, | | Nine Months Ended September 30, |
| | 2019 | | 2018 | 2019 | | 2018 | | 2019 | | 2018 |
| | Amount | | Return on Common Equity % | | Amount | | Return on Common Equity % | Amount | | Return on Common Equity % | | Amount | | Return on Common Equity % | | Amount | | Return on Common Equity % | | Amount | | Return on Common Equity % |
Net income available to common shareholders and return on common equity | $ | 270 |
| | 19 | % | | $ | 235 |
| | 15 | % | $ | 254 |
| | 17 | % | | $ | 261 |
| | 17 | % | | $ | 743 |
| | 17% | | $ | 746 |
| | 16 | % |
| Add back impact of the following item: | | | | | | | | |
| Add back impact of the following items: | | | | | | | | | | | | | | |
| Provision (benefit) for loan losses | (12 | ) | | | | (21 | ) | | | (12 | ) | | | | (34 | ) | | | | (32 | ) | | (74 | ) | | |
| Losses on early extinguishment of debt | | — |
| | | | 4 |
| | | | — |
| | 4 |
| | |
| Subtotal | | (12 | ) | | | | (30 | ) | | | | (32 | ) | | (70 | ) | | |
| Income tax impact | 3 |
| | | | 5 |
| | | 3 |
| | | | 8 |
| | | | 8 |
| | 18 |
| | |
| Net of tax | (9 | ) | | | | (16 | ) | | | (9 | ) | | | | (22 | ) | | | | (24 | ) | | (52 | ) | | |
| Adjusted net income available to common shareholders and return on common equity | $ | 261 |
| | 18 | % | | $ | 219 |
| | 14 | % | |
Adjusted net income available to common shareholders and return on common equity(1) | | $ | 245 |
| | 16 | % | | $ | 239 |
| | 16 | % | | $ | 719 |
| | 16% | | $ | 694 |
| | 15 | % |
| |
| (1) | Net income available to common shareholders and adjusted net income available to common shareholders included $59 million of after-tax losses from balance sheet repositioning for the nine months ended September 30, 2019, which resulted in one percentage point reduction to return on common equity and a 2 percentage point reduction to adjusted return on common equity. |
Income Tax Expense
Income tax expense was $102$106 million and $87$284 million for the three and nine months ended March 31,September 30, 2019, respectively, compared to $89 million and 2018, respectively.$271 million for the same periods in 2018. The effective tax rate was 28% and 27% for the three and nine months ended September 30, 2019, respectively, compared to 24% and 26% for the same periods in 2018. The lower effective tax rate for both periods.the three and nine months ended September 30, 2018 includes an $8 million income tax benefit related to the revaluation of certain net state deferred tax assets.
E*TRADE Q1Q3 2019 10-Q | Page 2227
The following table presents the significant components of the consolidated balance sheet (dollars in millions): | | | | | | Variance | | | Variance |
| | March 31, | | December 31, | | 2019 vs. 2018 | September 30, | | December 31, | | 2019 vs. 2018 |
| | 2019 | | 2018 | | Amount | | % | 2019 | | 2018 | | Amount | | % |
| Assets: | | | | | | | | | | | | | | |
| Cash and equivalents | $ | 523 |
| | $ | 2,333 |
| | $ | (1,810 | ) | | (78 | )% | $ | 493 |
| | $ | 2,333 |
| | $ | (1,840 | ) | | (79 | )% |
| Segregated cash | 677 |
| | 1,011 |
| | (334 | ) | | (33 | )% | 1,365 |
| | 1,011 |
| | 354 |
| | 35 | % |
| Investment securities | 48,898 |
| | 45,037 |
| | 3,861 |
| | 9 | % | 42,562 |
| | 45,037 |
| | (2,475 | ) | | (5 | )% |
| Margin receivables | 10,267 |
| | 9,560 |
| | 707 |
| | 7 | % | 9,859 |
| | 9,560 |
| | 299 |
| | 3 | % |
| Loans receivable, net | 1,965 |
| | 2,103 |
| | (138 | ) | | (7 | )% | 1,747 |
| | 2,103 |
| | (356 | ) | | (17 | )% |
| Receivables from brokers, dealers and clearing organizations | 597 |
| | 760 |
| | (163 | ) | | (21 | )% | 1,038 |
| | 760 |
| | 278 |
| | 37 | % |
| Property and equipment, net | | 338 |
| | 281 |
| | 57 |
| | 20 | % |
| Goodwill and other intangibles, net | 2,961 |
| | 2,976 |
| | (15 | ) | | (1 | )% | 2,931 |
| | 2,976 |
| | (45 | ) | | (2 | )% |
Other(1) | 1,630 |
|
| 1,223 |
| | 407 |
| | 33 | % | |
| Other assets | | 1,374 |
|
| 942 |
| | 432 |
| | 46 | % |
| Total assets | $ | 67,518 |
| | $ | 65,003 |
| | $ | 2,515 |
| | 4 | % | $ | 61,707 |
| | $ | 65,003 |
| | $ | (3,296 | ) | | (5 | )% |
| Liabilities and shareholders’ equity: | | | | | | | | | | | | | | |
| Deposits | $ | 46,328 |
| | $ | 45,313 |
| | $ | 1,015 |
| | 2 | % | $ | 40,382 |
| | $ | 45,313 |
| | $ | (4,931 | ) | | (11 | )% |
| Customer payables | 10,600 |
| | 10,117 |
| | 483 |
| | 5 | % | 11,183 |
| | 10,117 |
| | 1,066 |
| | 11 | % |
| Payables to brokers, dealers and clearing organizations | 1,162 |
| | 948 |
| | 214 |
| | 23 | % | 1,091 |
| | 948 |
| | 143 |
| | 15 | % |
| Other borrowings | 300 |
| | — |
| | 300 |
| | 100 | % | |
| Corporate debt | 1,409 |
| | 1,409 |
| | — |
| | — | % | 1,410 |
| | 1,409 |
| | 1 |
| | — | % |
| Other liabilities | 937 |
| | 654 |
| | 283 |
| | 43 | % | 1,072 |
| | 654 |
| | 418 |
| | 64 | % |
| Total liabilities | 60,736 |
| | 58,441 |
| | 2,295 |
| | 4 | % | 55,138 |
| | 58,441 |
| | (3,303 | ) | | (6 | )% |
| Shareholders’ equity | 6,782 |
| | 6,562 |
| | 220 |
| | 3 | % | 6,569 |
| | 6,562 |
| | 7 |
| | — | % |
| Total liabilities and shareholders’ equity | $ | 67,518 |
| | $ | 65,003 |
| | $ | 2,515 |
| | 4 | % | $ | 61,707 |
| | $ | 65,003 |
| | $ | (3,296 | ) | | (5 | )% |
| |
(1) | Includes balance sheet line items property and equipment, net and other assets. |
Cash and Equivalents
Cash and equivalents decreased 78%79% to $523$493 million during the threenine months ended March 31,September 30, 2019. Cash and equivalents will fluctuate based on a variety of factors, including, among other drivers, liquidity needs at the parent, customer activity at our regulated subsidiaries, and the timing of investments at E*TRADE Bank. For additional information on our use of cash and equivalents, see MD&A—Liquidity and Capital Resources and the consolidated statement of cash flows.
Segregated Cash
Cash segregated under federal or other regulations decreased $334 millionincreased 35% to $1.4 billion during the first quarter to $677 million as of March 31,nine months ended September 30, 2019. The level of segregated cash is driven by customer payables and securities lending balances we hold as liabilities compared with the amount of margin receivables and securities borrowed balances we hold as assets. The excess represents customer cash that we segregate for the exclusive benefit of our brokerage customers. Segregated cash can also be impacted by the level of reverse repurchasesecurities purchased under agreements to resell between E*TRADE Securities and E*TRADE Bank, representing investments that were also segregated under federal or other regulations by E*TRADE Securities and eliminated in consolidation, which increased $850$550 million to $1.3 billion$950 million as of March 31,September 30, 2019.
E*TRADE Q1Q3 2019 10-Q | Page 2328
Investment Securities
The following table presents the significant components of investment securities (dollars in millions): | | | | | | Variance | | | Variance |
| | March 31, | | December 31, | | 2019 vs. 2018 | September 30, | | December 31, | | 2019 vs. 2018 |
| | 2019 | | 2018 | | Amount | | % | 2019 | | 2018 | | Amount | | % |
| Available-for-sale securities: | | | | | | | | | | | | | | |
| Agency mortgage-backed securities | $ | 23,423 |
| | $ | 22,162 |
| | $ | 1,261 |
| | 6 | % | $ | 18,514 |
| | $ | 22,162 |
| | $ | (3,648 | ) | | (16 | )% |
| Other agency debt securities | 955 |
| | 991 |
| | (36 | ) | | (4 | )% | 674 |
| | 991 |
| | (317 | ) | | (32 | )% |
| US Treasuries | 438 |
| | — |
| | 438 |
| | 100 | % | 1,349 |
| | — |
| | 1,349 |
| | 100 | % |
Non-agency debt securities(1) | 155 |
| | — |
| | 155 |
| | 100 | % | 483 |
| | — |
| | 483 |
| | 100 | % |
| Total available-for-sale securities | $ | 24,971 |
| | $ | 23,153 |
| | $ | 1,818 |
| | 8 | % | $ | 21,020 |
| | $ | 23,153 |
| | $ | (2,133 | ) | | (9 | )% |
| Held-to-maturity securities: | | | | | | | | | | | | | | |
| Agency mortgage-backed securities | $ | 20,337 |
| | $ | 18,085 |
| | $ | 2,252 |
| | 12 | % | $ | 19,563 |
| | $ | 18,085 |
| | $ | 1,478 |
| | 8 | % |
| Other agency debt securities | 3,590 |
| | 3,799 |
| | (209 | ) | | (6 | )% | 1,979 |
| | 3,799 |
| | (1,820 | ) | | (48 | )% |
| Total held-to-maturity securities | $ | 23,927 |
| | $ | 21,884 |
| | $ | 2,043 |
| | 9 | % | $ | 21,542 |
| | $ | 21,884 |
| | $ | (342 | ) | | (2 | )% |
| Total investment securities | $ | 48,898 |
| | $ | 45,037 |
| | $ | 3,861 |
| | 9 | % | $ | 42,562 |
| | $ | 45,037 |
| | $ | (2,475 | ) | | (5 | )% |
| |
| (1) | Includes non-agency asset-backed securities (ABS) and non-agency commercial mortgage-backed securities. |
Securities represented 72% and 69% of total assets at March 31,both September 30, 2019 and December 31, 2018, respectively. We classify debt securities as available-for-sale or held-to-maturity based on our investment strategy and management’s assessment of our intent and ability to hold the debt securities until maturity.
The decrease in available-for-sale securities during the nine months ended September 30, 2019 related primarily to the sale of $4.5 billion of lower-yielding investment securities as part of the Company's balance sheet repositioning in June 2019. See MD&A—Overview, MD&A—Earnings Overview and Note 5—Available-for-Sale and Held-to-Maturity Securities for additional information.
Margin Receivables
Margin receivables increased 7%3% to $10.3$9.9 billion during the threenine months ended March 31,September 30, 2019. Market valuation of customer assets and market sentiment are economic factors that impact the margin receivables balance.
E*TRADE Q1Q3 2019 10-Q | Page 2429
Loans Receivable, Net
The following table presents the significant components of loans receivable, net (dollars in millions): | | | | | | Variance | | | Variance |
| | March 31, | | December 31, | | 2019 vs. 2018 | September 30, | | December 31, | | 2019 vs. 2018 |
| | 2019 | | 2018 | | Amount | | % | 2019 | | 2018 | | Amount | | % |
| One- to four-family | $ | 1,003 |
| | $ | 1,071 |
| | $ | (68 | ) | | (6 | )% | $ | 861 |
| | $ | 1,071 |
| | $ | (210 | ) | | (20 | )% |
| Home equity | 785 |
| | 836 |
| | (51 | ) | | (6 | )% | 680 |
| | 836 |
| | (156 | ) | | (19 | )% |
| Consumer | 106 |
| | 118 |
| | (12 | ) | | (10 | )% | 85 |
| | 118 |
| | (33 | ) | | (28 | )% |
Securities-based lending(1) | 97 |
| | 107 |
| | (10 | ) | | (9 | )% | 142 |
| | 107 |
| | 35 |
| | 33 | % |
| Total loans receivable | 1,991 |
| | 2,132 |
| | (141 | ) | | (7 | )% | 1,768 |
| | 2,132 |
| | (364 | ) | | (17 | )% |
| Unamortized premiums, net | 6 |
| | 8 |
| | (2 | ) | | (25 | )% | 6 |
| | 8 |
| | (2 | ) | | (25 | )% |
| Subtotal | 1,997 |
| | 2,140 |
| | (143 | ) | | (7 | )% | 1,774 |
| | 2,140 |
| | (366 | ) | | (17 | )% |
| Less: Allowance for loan losses | 32 |
| | 37 |
| | (5 | ) | | (14 | )% | 27 |
| | 37 |
| | (10 | ) | | (27 | )% |
| Total loans receivable, net | $ | 1,965 |
| | $ | 2,103 |
| | $ | (138 | ) | | (7 | )% | $ | 1,747 |
| | $ | 2,103 |
| | $ | (356 | ) | | (17 | )% |
| |
| (1) | E*TRADE Line of Credit is a securities-based lending product where customers can borrow against the market value of their securities pledged as collateral. The drawn amount and unused credit line amount totaled $97 million and $220 million, respectively, as of March 31, 2019 and $107$310 million and $173 million respectively, as of September 30, 2019 and December 31, 2018.2018, respectively. |
Loans receivable, net decreased 7%17% to $2.0$1.7 billion during the threenine months ended March 31,September 30, 2019. We expect the remaining legacy mortgage and consumer loan portfolio to continue its run-off for the foreseeable future. As our portfolio has seasoned and substantially all interest-only loans have converted to amortizing, we continue to assess underlying performance, the economic environment, and the value of the portfolio in the marketplace. While it is our intention to continue to hold these loans, if the markets improve or our assessment changes, our strategy could change. For additional information on management's estimate of the allowance for loan losses, see Note 1—Organization, Basis of Presentation and Summary of Significant Accounting Policies and Note 6—Loans Receivable, Net.
E*TRADE Q1Q3 2019 10-Q | Page 2530
Receivables from and Payables to Brokers, Dealers and Clearing Organizations
The following table presents the significant components of receivables from and payables to brokers, dealers and clearing organizations (dollars in millions): | | | | | | Variance | | | Variance |
| | March 31, | | December 31, | | 2019 vs. 2018 | September 30, | | December 31, | | 2019 vs. 2018 |
| | 2019 | | 2018 | | Amount | | % | 2019 | | 2018 | | Amount | | % |
| Receivables: | | | | | | | | | | | | | | |
| Securities borrowed | $ | 277 |
| | $ | 140 |
| | $ | 137 |
| | 98 | % | $ | 621 |
| | $ | 140 |
| | $ | 481 |
| | 344 | % |
| Receivables from clearing organizations | 255 |
| | 555 |
| | (300 | ) | | (54 | )% | 326 |
| | 555 |
| | (229 | ) | | (41 | )% |
| Other | 65 |
| | 65 |
| | — |
| | — | % | 91 |
| | 65 |
| | 26 |
| | 40 | % |
| Total | $ | 597 |
| | $ | 760 |
| | $ | (163 | ) | | (21 | )% | $ | 1,038 |
| | $ | 760 |
| | $ | 278 |
| | 37 | % |
| | | | | | | |
|
| | | | | | |
|
|
| Payables: | | | | | | |
|
| | | | | | |
|
|
| Securities loaned | $ | 1,109 |
| | $ | 887 |
| | $ | 222 |
| | 25 | % | $ | 1,028 |
| | $ | 887 |
| | $ | 141 |
| | 16 | % |
| Payables to clearing organizations | 6 |
| | 11 |
| | (5 | ) | | (45 | )% | 16 |
| | 11 |
| | 5 |
| | 45 | % |
| Other | 47 |
| | 50 |
| | (3 | ) | | (6 | )% | 47 |
| | 50 |
| | (3 | ) | | (6 | )% |
| Total | $ | 1,162 |
| | $ | 948 |
| | $ | 214 |
| | 23 | % | $ | 1,091 |
| | $ | 948 |
| | $ | 143 |
| | 15 | % |
Securities borrowed increased 98%344% to $277$621 million during the threenine months ended March 31,September 30, 2019. The increase was primarily driven by a higher demand for securities to cover customer short positions during the period. The 54%41% decrease in receivables from clearing organizations during the threenine months ended March 31,September 30, 2019 to $255$326 million was primarily driven by the decreased use of cash collateral for the Company's derivatives transactions utilized for hedging activities.
Securities loaned increased 25%16% to $1.1$1.0 billion during the threenine months ended March 31,September 30, 2019. The increase was primarily driven by higher demand for securities from our counterparties.counterparties, and an increase in fully paid lending activity. For additional information on E*TRADE Securities liquidity, see MD&A—Liquidity and Capital Resources.
Other Assets
Other assets increased 46% to $1.4 billion during the nine months ended September 30, 2019. The increase was driven by $250 million of securities purchased under agreements to resell that were outstanding at the end of the period and $211 million of operating lease assets related to the Company's adoption of the new guidance on accounting for leases in 2019. See Note 10—Lease Arrangements for additional information.
Deposits
The following table presents the significant components of deposits (dollars in millions): | | | | | | Variance | | | Variance |
| | March 31, | | December 31, | | 2019 vs. 2018 | September 30, | | December 31, | | 2019 vs. 2018 |
| | 2019 | | 2018 | | Amount | | % | 2019 | | 2018 | | Amount | | % |
| Sweep deposits | $ | 38,639 |
| | $ | 39,322 |
| | $ | (683 | ) | | (2 | )% | $ | 30,778 |
| | $ | 39,322 |
| | $ | (8,544 | ) | | (22 | )% |
Savings deposits(1) | 5,790 |
| | 4,133 |
| | 1,657 |
| | 40 | % | 7,964 |
| | 4,133 |
| | 3,831 |
| | 93 | % |
| Other deposits | 1,899 |
| | 1,858 |
| | 41 |
| | 2 | % | 1,640 |
| | 1,858 |
| | (218 | ) | | (12 | )% |
| Total deposits | $ | 46,328 |
| | $ | 45,313 |
| | $ | 1,015 |
| | 2 | % | $ | 40,382 |
| | $ | 45,313 |
| | $ | (4,931 | ) | | (11 | )% |
| |
| (1) | Includes $3.8$6.3 billion and $2.0 billion of deposits at March 31,September 30, 2019 and December 31, 2018, respectively, in our Premium Savings Account product. |
Deposits represented 76% and 78% of total liabilities at March 31, 2019 and December 31, 2018, respectively.
E*TRADE Q1Q3 2019 10-Q | Page 2631
Deposits represented 73% and 78% of total liabilities at September 30, 2019 and December 31, 2018, respectively. The decrease in deposits during the nine months ended September 30, 2019 was primarily driven by the move of $6.6 billion of deposits to third-party banks as part of the Company's balance sheet repositioning in June 2019 partially offset by the growth in our Premium Savings Account product. See MD&A—Earnings Overview and Note 5—Available-for-Sale and Held-to-Maturity Securities for additional information.
We offer the following sweep deposit account programs to our brokerage customers:
Extended insurance sweep deposit account (ESDA) program
Retirement sweep deposit account (RSDA) program for retirement plan customers
Cash balance program offered by E*TRADE Savings Bank for uninvested cash held in eligible custodial accounts as part of the advisor services offering launched in connection with the TCA acquisition
The programs utilize our bank subsidiaries, in combination with additional third partythird-party program banks, as applicable, to allow customers the ability to have aggregate deposits they hold in the programs insured up to $1,250,000 for each category of legal ownership depending on the program. As of March 31,September 30, 2019, approximately 99%98% of sweep deposits were in these programs. Sweep deposits on balance sheet are held at bank subsidiaries and are included in the deposits line item on our consolidated balance sheet.
Other Borrowings
Other borrowings increased to $300 million during the three months ended March 31, 2019, as we utilized Federal Home Loan Bank (FHLB) advances for short-term liquidity and funding needs. See MD&A—Liquidity and Capital Resources for additional information on liquidity and funding sources.
|
|
| LIQUIDITY AND CAPITAL RESOURCES |
We have established liquidity and capital policies to support the successful execution of our business strategy, while maintaining ongoing and sufficient liquidity through the business cycle. We believe liquidity is of critical importance to the Company and especially important for E*TRADE Bank and E*TRADE Securities. The objective of our policies is to ensure that we can meet our corporate, banking and broker-dealer liquidity needs under both normal operating conditions and under periods of stress in the financial markets.
Liquidity
Our liquidity needs are primarily driven by capital needs at E*TRADE Bank and E*TRADE Securities, interest due on our corporate debt, dividend payments on our preferred stock and plannedother capital returns to holders of our common stock. Our banking and brokerage subsidiaries' liquidity needs are driven primarily by the level and volatility of our customer activity. Management maintains a set of liquidity sources and monitors certain business trends and market metrics closely in an effort to ensure we have sufficient liquidity. Potential loans by E*TRADE Bank to the parent company or the parent company's other non-bank subsidiaries are subject to various quantitative, arm’s length, collateralization, capital and other requirements.
Parent Company Liquidity
The parent company's primary source of liquidity is corporate cash. Corporate cash, a non-GAAP measure, is a component of cash and equivalents; see the consolidated statement of cash flows for information on cash and equivalents activity. We define corporate cash as cash held at the parent company and subsidiaries, excluding bank, broker-dealer, and FCM subsidiaries that require regulatory approval or notification prior to the payment of certain dividends to the parent company. Corporate cash includes the parent company's deposits placed with E*TRADE Bank. E*TRADE Bank may use these deposits for investment purposes; however, these investments are not included in consolidated cash and equivalents.
E*TRADE Q1Q3 2019 10-Q | Page 2732
We believe corporate cash is a useful measure of the parent company’s liquidity as it is the primary source of capital above and beyond the capital deployed in our regulated subsidiaries. Corporate cash is monitored as part of our liquidity risk management. Our current corporate cash minimum target is $300 million and covers approximately 18 months of parent company fixed costs, which includes preferred stock dividends, corporate debt serviceinterest and other overhead costs.costs, and contractual corporate debt maturities over the next 12 months. The Company maintains $300 million of additional liquidity through an unsecured committed revolving credit facility. The parent has the ability to borrow against the credit facility for working capital and general corporate purposes. Dividends from our operating subsidiaries, including E*TRADE Bank and E*TRADE Securities, are additional sources of corporate cash. Subject to regulatory approval or notification, capital generated by these subsidiaries could be distributed to the parent company to the extent the excess capital levels exceed both regulatory capital requirements and internal capital thresholds. As of March 31,September 30, 2019, our subsidiaries maintained excess regulatory capital over internal thresholds and paid dividends of $250 million$1.2 billion to the parent company during the nine months ended September 30, 2019.
The following chart presents the key activities impacting corporate cash and provides a roll forward of corporate cash from December 31, 2018 to corporate cash at March 31,September 30, 2019 (dollars in millions):
The following table presents a reconciliation of consolidated cash and equivalents to corporate cash, a non-GAAP measure (dollars in millions):
| | | | March 31, 2019 | | December 31, 2018 | September 30, 2019 | | December 31, 2018 |
| Consolidated cash and equivalents | $ | 523 |
| | $ | 2,333 |
| $ | 493 |
| | $ | 2,333 |
|
| Less: Cash at regulated subsidiaries | (518 | ) | | (2,347 | ) | (465 | ) | | (2,347 | ) |
Add: Cash on deposit at E*TRADE Bank(1) | 324 |
| | 405 |
| 352 |
| | 405 |
|
| Corporate cash | $ | 329 |
| | $ | 391 |
| $ | 380 |
| | $ | 391 |
|
| |
| (1) | Corporate cash includes the parent company's deposits placed with E*TRADE Bank. E*TRADE Bank may use these deposits for investment purposes; however, these investments are not included in consolidated cash and equivalents. |
E*TRADE Q1Q3 2019 10-Q | Page 2833
Corporate cash decreased $62$11 million to $329$380 million during the threenine months ended March 31,September 30, 2019 primarily due to the following:
$250 million1.2 billion of dividends received from E*TRADE Securitiessubsidiaries
$12010 million of tax payments received from subsidiaries, net of taxes paid
$908 million used for share repurchases
$103148 million used primarily for parent company overhead less reimbursements from subsidiaries under cost sharing arrangements
$35143 million used for dividends, including $103 million in common stock dividends and $40 million in preferred stock dividends
$2042 million used for preferred stock dividendscorporate debt activity
E*TRADE Bank Liquidity
E*TRADE Bank, including its subsidiary E*TRADE Savings Bank, relies on bank cash and deposits for liquidity needs. Management believes that within deposits, sweep deposits are of particular importance as they are a stable source of liquidity for E*TRADE Bank. The vast majority of E*TRADE Bank's liquidity is invested in securities backed by the US government or its agencies, representing highly liquid securities with low credit risk.
We may also utilize wholesale funding sources for short-term liquidity and contingency funding requirements. Our ability to borrow these funds is dependent upon the continued availability of funding in the wholesale borrowings market. In addition, we can borrow from the Federal Reserve Bank of Richmond's discount window to meet short-term liquidity requirements, although it is not viewed as a primary source of funding.
E*TRADE Securities Liquidity
E*TRADE Securities relies on customer payables, securities lending, and internal and external lines of credit to provide liquidity and to fund margin lending. E*TRADE Securities maintains additional liquidity through external lines of credit totaling approximately $1.3 billion. E*TRADE Securities also maintains lines of credit with the parent company and E*TRADE Bank.
E*TRADE Q3 2019 10-Q | Page 34
External Liquidity Sources
The following table presents the Company's external lines of credit at March 31,September 30, 2019 (dollars in millions):
| | | Description | Maturity | Borrower | Outstanding | Available | Maturity Date | Borrower | Outstanding | Available |
Unsecured, committed revolving credit facility(1) | June 2020 | ETFC | $ | — |
| $ | 300 |
| |
Senior unsecured, committed revolving credit facility(1) | | June 2024 | ETFC | $ | — |
| $ | 300 |
|
| FHLB secured credit facility | Determined at trade | ETB | $ | 300 |
| $ | 6,231 |
| Determined at trade | ETB | $ | — |
| $ | 7,290 |
|
| Federal Reserve Bank discount window | Overnight | ETB | $ | — |
| $ | 941 |
| Overnight | ETB | $ | — |
| $ | 1,131 |
|
Senior unsecured, committed revolving credit facility(2) | June 2019 | ETS | $ | — |
| $ | 600 |
| June 2020 | ETS | $ | — |
| $ | 600 |
|
| Secured, committed lines of credit | June 2019 | ETS | $ | — |
| $ | 175 |
| June 2020 | ETS | $ | — |
| $ | 175 |
|
| Unsecured, uncommitted lines of credit | June 2019 | ETS | $ | — |
| $ | 50 |
| June 2020 | ETS | $ | — |
| $ | 50 |
|
| Unsecured, uncommitted lines of credit | None | ETS | $ | — |
| $ | 75 |
| None | ETS | $ | — |
| $ | 75 |
|
| Secured, uncommitted lines of credit | None | ETS | $ | — |
| $ | 375 |
| None | ETS | $ | — |
| $ | 425 |
|
| |
| (1) | On June 21, 2019, the Company entered into a new five year, $300 million senior unsecured committed revolving credit facility, which replaced its three year senior unsecured committed revolving credit facility entered into on June 23, 2017. The senior unsecured committed revolving credit facility contains certain covenants, including maintenance covenants related to the Company's interest coverage, leverage and regulatory net capital ratios with which the Company was in compliance at March 31,September 30, 2019. |
| |
| (2) | On June 21, 2019, E*TRADE Securities entered into a 364-day, $600 million senior unsecured committed revolving credit facility, which replaced its 364-day senior unsecured committed revolving credit facility entered into on June 22, 2018. The senior unsecured committed revolving credit facility contains certain covenants, including maintenance covenants related to E*TRADE Securities' minimum consolidated tangible net worth and regulatory net capital ratio with which the Company was in compliance at March 31,September 30, 2019. |
E*TRADE Q1 2019 10-Q | Page 29
Capital Resources
The Company seeks to manage capital levels in support of our business strategy of generating and effectively deploying capital for the benefit of our shareholders, governed by the Company's risk management framework. For additional information on our bank and brokerage capital requirements, refer to Note 13—Regulatory Requirements.
E*TRADE Q3 2019 10-Q | Page 35
Bank Capital Requirements
At March 31,September 30, 2019, our regulatory capital ratios for E*TRADE Financial and E*TRADE Bank were above the minimum ratios required to be "well capitalized." Currently, the internal threshold for E*TRADE Financial's Tier 1 leverage ratio is 6.5% and the internal threshold for E*TRADE Bank's Tier 1 leverage ratio is 7.0%. For additional information on bank regulatory requirements and phase-in periods, refer to Part I. Item 1. Business—Regulation in the Company's 2018 Annual Report. The following table presents E*TRADE Financial and E*TRADE Bank's capital ratios (dollars in millions): | | | | E*TRADE Financial | | E*TRADE Bank | E*TRADE Financial | | E*TRADE Bank |
| | March 31, 2019 | | December 31, 2018 | | March 31, 2019 | | December 31, 2018 | September 30, 2019 | | December 31, 2018 | | September 30, 2019 | | December 31, 2018 |
| Shareholders’ equity | $ | 6,782 |
| | $ | 6,562 |
| | $ | 3,822 |
| | $ | 3,557 |
| $ | 6,569 |
| | $ | 6,562 |
| | $ | 3,662 |
| | $ | 3,557 |
|
| Deduct: | | | | | | | | | | | | | | |
| Preferred stock | (689 | ) | | (689 | ) | | — |
| | — |
| (689 | ) | | (689 | ) | | — |
| | — |
|
| Common Equity Tier 1 capital before regulatory adjustments | $ | 6,093 |
| | $ | 5,873 |
| | $ | 3,822 |
| | $ | 3,557 |
| $ | 5,880 |
| | $ | 5,873 |
| | $ | 3,662 |
| | $ | 3,557 |
|
| Add: | | | | | | | | | | | | | | |
| Losses in other comprehensive income on available-for-sale debt securities, net of tax | 170 |
| | 275 |
| | 170 |
| | 275 |
| 24 |
| | 275 |
| | 24 |
| | 275 |
|
| Deduct: | | | | | | | | | | | | | | |
| Goodwill and other intangible assets, net of deferred tax liabilities | (2,519 | ) | | (2,540 | ) | | (285 | ) | | (287 | ) | (2,475 | ) | | (2,540 | ) | | (279 | ) | | (287 | ) |
| Disallowed deferred tax assets | (166 | ) | | (200 | ) | | (67 | ) | | (61 | ) | (74 | ) | | (200 | ) | | (3 | ) | | (61 | ) |
| Common Equity Tier 1 capital | $ | 3,578 |
| | $ | 3,408 |
| | $ | 3,640 |
| | $ | 3,484 |
| $ | 3,355 |
| | $ | 3,408 |
| | $ | 3,404 |
| | $ | 3,484 |
|
| Add: | | | | | | | | | | | | | | |
| Preferred stock | 689 |
| | 689 |
| | — |
| | — |
| 689 |
| | 689 |
| | — |
| | — |
|
| Tier 1 capital | $ | 4,267 |
| | $ | 4,097 |
| | $ | 3,640 |
| | $ | 3,484 |
| $ | 4,044 |
| | $ | 4,097 |
| | $ | 3,404 |
| | $ | 3,484 |
|
| Add: | | | | | | | | | | | | | | |
| Other | 42 |
| | 46 |
| | 32 |
| | 37 |
| 35 |
| | 46 |
| | 27 |
| | 37 |
|
| Total capital | $ | 4,309 |
| | $ | 4,143 |
| | $ | 3,672 |
| | $ | 3,521 |
| $ | 4,079 |
| | $ | 4,143 |
| | $ | 3,431 |
| | $ | 3,521 |
|
| | | | | | | | | | | | | | | |
| Average assets for leverage capital purposes | $ | 66,277 |
| | $ | 64,767 |
| | $ | 51,609 |
| | $ | 49,568 |
| $ | 61,364 |
| | $ | 64,767 |
| | $ | 46,126 |
| | $ | 49,568 |
|
| Deduct: | | | | | | | | | | | | | | |
| Goodwill and other intangible assets, net of deferred tax liabilities | (2,519 | ) | | (2,540 | ) | | (285 | ) | | (287 | ) | (2,475 | ) | | (2,540 | ) | | (279 | ) | | (287 | ) |
| Disallowed deferred tax assets | (166 | ) | | (200 | ) | | (67 | ) | | (61 | ) | (74 | ) | | (200 | ) | | (3 | ) | | (61 | ) |
| Adjusted average assets for leverage capital purposes | $ | 63,592 |
| | $ | 62,027 |
| | $ | 51,257 |
| | $ | 49,220 |
| $ | 58,815 |
| | $ | 62,027 |
| | $ | 45,844 |
| | $ | 49,220 |
|
| | | | | | | | | | | | | | | |
Total risk-weighted assets(1) | $ | 11,889 |
| | $ | 10,970 |
| | $ | 10,755 |
| | $ | 9,994 |
| $ | 10,689 |
| | $ | 10,970 |
| | $ | 9,155 |
| | $ | 9,994 |
|
| | | | | | | | | | | | | | | |
| Tier 1 leverage ratio (Tier 1 capital / Adjusted average assets for leverage capital purposes) | 6.7 | % | | 6.6 | % | | 7.1 | % | | 7.1 | % | 6.9 | % | | 6.6 | % | | 7.4 | % | | 7.1 | % |
Common Equity Tier 1 capital / Total risk-weighted assets(1) | 30.1 | % | | 31.1 | % | | 33.9 | % | | 34.9 | % | 31.4 | % | | 31.1 | % | | 37.2 | % | | 34.9 | % |
| Tier 1 capital / Total risk-weighted assets | 35.9 | % | | 37.3 | % | | 33.9 | % | | 34.9 | % | 37.8 | % | | 37.3 | % | | 37.2 | % | | 34.9 | % |
| Total capital / Total risk-weighted assets | 36.3 | % | | 37.8 | % | | 34.2 | % | | 35.2 | % | 38.2 | % | | 37.8 | % | | 37.5 | % | | 35.2 | % |
| |
| (1) | Under the regulatory guidelines for risk-based capital, on-balance sheet assets and credit equivalent amounts of derivatives and off-balance sheet items are assigned to one of several broad risk categories according to the obligor or, if relevant, the guarantor or the nature of any collateral. The aggregate dollar amount in each risk category is then multiplied by the risk weight associated with that category. The resulting weighted values from each of the risk categories are aggregated for determining total risk-weighted assets. |
E*TRADE Q1Q3 2019 10-Q | Page 3036
Broker-Dealer and FCM Capital Requirements
Our broker-dealer and FCM subsidiaries are subject to capital requirements determined by their respective regulators. At March 31,September 30, 2019, these subsidiaries met their minimum net capital requirements. We continue to assess our ability to distribute excess net capital to the parent while maintaining adequate capital at the broker-dealer and FCM subsidiaries. For additional information on our broker-dealer and FCM capital requirements, refer to Note 13—Regulatory Requirements.
Off-Balance Sheet Arrangements
We enter into various off-balance sheet arrangements in the ordinary course of business, primarily to meet the needs of our customers and to reduce our own exposure to interest rate risk. These arrangements include firm commitments to extend credit. Additionally, we enter into guarantees and other similar arrangements as part of transactions in the ordinary course of business. For additional information on these arrangements, refer to Note 14—Commitments, Contingencies and Other Regulatory Matters.
The identification, mitigation and management of existing and potential risks is critical to effective enterprise risk management. There are certain risks inherent to our industry (e.g. execution of transactions) and certain risks that will surface through the conduct of our business operations. We seek to monitor and manage our significant risk exposures by operating under a set of Board-approved limits and by monitoring certain risk indicators. Our governance framework is designed to comply with applicable requirements and requires regular reporting on metrics and significant risks and exposures to senior management and the Board of Directors.
We face the following key types of risks: credit,strategic, operational, reputational, liquidity, market, operational, information technology, data, strategic, reputational, legal,credit, as well as regulatorylegal and compliance.regulatory. We have a Board-approved Enterprise Risk Appetite Statement (RAS) that is provided to all employees. The RAS specifies significant risk exposures and addresses the Company's tolerance of thosefor these risks, which are described in further detail within Part II. Item 7. Management's Discussion and Analysis of Financial Condition and Results of Operations in our 2018 Annual Report. We are also subject to other risks that could affect our business, financial condition, results of operations or cash flows in future periods. For additional information see Part I. Item 1A. — Risk Factors in our 2018 Annual Report. |
|
| CONCENTRATIONS OF CREDIT RISK |
Credit risk is the risk of loss arising from the inability or failure of a borrower or counterparty to meet its credit obligations. Our mortgage loan portfolio represents our most significant credit risk exposure.
| |
| • | One- to Four-Family Interest-Only Loans: One- to four-family loans include loans with a five to ten year interest-only period, followed by an amortizing period ranging from 20 to 25 years. At March 31,September 30, 2019, 100% of these loans were amortizing. |
E*TRADE Q1 2019 10-Q | Page 31
| |
| • | Home Equity Loans: The home equity loan portfolio consists of home equity installment loans (HEILs) and home equity lines of credit (HELOCs) and is primarily second lien loans on residential real estate properties that have a higher level of credit risk than first lien mortgage loans. HEILs are primarily fixed rate and fixed term, fully amortizing loans that do not offer the option of an interest-only payment. The majority of HELOCs had an interest-only draw period at origination and converted to amortizing loans at the end of the draw period, which typically ranged from five to ten years. At March 31,September 30, 2019, nearly 100% of the HELOC portfolio had converted from the interest-only draw period. |
E*TRADE Q3 2019 10-Q | Page 37
| |
| • | Securities: We focus primarily on security type and credit rating to monitor credit risk in our securities portfolios. We consider securities backed by the US government or its agencies to have low credit risk as the long-term debt rating of the US government is AA+ by S&P and Aaa by Moody’s at March 31,September 30, 2019. The amortized cost of these securities accounted for over 99% of our total securities portfolio at March 31,September 30, 2019. We review the remaining debt securities that were not backed by the US government or its agencies according to their credit ratings from S&P and Moody’s where available, and all such debt securities were rated investment grade at March 31,September 30, 2019. |
|
|
| SUMMARY OF CRITICAL ACCOUNTING POLICIES AND ESTIMATES |
The discussion and analysis of our financial condition and results of operations are based on our consolidated financial statements, which have been prepared in conformity with accounting principles generally accepted in the United States of America (GAAP). Note 1—Organization, Basis of Presentation and Summary of Significant Accounting Policies in Part II. Item 8. Financial Statements and Supplementary Data in the Company's 2018 Annual Report contains a summary of our significant accounting policies, many of which require the use of estimates and assumptions that affect the amounts reported in the consolidated financial statements and related notes for the periods presented. We believe that, of our significant accounting policies, the following are critical because they are based on estimates and assumptions that require complex and subjective judgments by management: allowance for loan losses; valuation and impairment of goodwill and acquired intangible assets; and income taxes. Changes in these estimates or assumptions could materially impact our financial condition and results of operations, and actual results could differ from our estimates. Our critical accounting policies are more fully described in Part II. Item 7. Management's Discussion and Analysis of Financial Condition and Results of Operations—Summary of Critical Accounting Policies and Estimates in our 2018 Annual Report. New Accounting Standards Not Yet Adopted
Accounting for Credit Losses
In June 2016, the Financial Accounting Standards Board (FASB) amended the guidance on accounting for credit losses and has subsequently issued clarifications and improvements. The new guidance will be effective for interim and annual periods beginning January 1, 2020 and early adoption is permitted. The amended guidance requires measurement of an allowance for credit losses for financial instruments, including loans and debt securities, and other commitments to extend credit held at the reporting date. For financial assets measured at amortized cost, factors such as historical performance, current conditions, and reasonable and supportable forecasts, including expected charge-off recoveries, will be used to estimate expected credit losses. The FASB issued additional amended guidance during the second quarter of 2019 that clarified that the current expected credit losses (CECL) standard allows for subsequent increases in the fair value of collateral for collateral-dependent loans to be recognized up to the amount previously charged-off. See Note 1—Organization, Basis of Presentation and Summary of Significant Accounting Policies for additional information on the Company’s interpretation of the amended guidance.
Determining the CECL allowance is complex and requires judgment by management about the effect of matters that are inherently uncertain. The Company has not originated a mortgage loan since 2008 when the Company exited direct retail lending, which was the last remaining loan origination channel after the Company’s exit from the wholesale mortgage lending channel in 2007. We expect the legacy mortgage portfolio to continue its run-off for the foreseeable future. Our portfolio has seasoned, as the weighted average age of the mortgage loan portfolio is approximately 14 years, and substantially all interest-only loans have converted to amortizing loans. As of September 30, 2019, the Company expects to recognize an after-tax benefit related to mortgage loans of approximately $75 million to $100 million as an adjustment to opening retained earnings at adoption on January 1, 2020. The expected benefit is related to the fair value
E*TRADE Q1Q3 2019 10-Q | Page 3238
of the underlying collateral for mortgage loans that were determined to be collateral-dependent and previously written down to the fair value of the underlying collateral.
The CECL allowance is based on assumptions about quantitative and qualitative factors, and changes to the allowance may result if future conditions differ from these assumptions. For example, in the event the cash received through liquidation or other form of recovery for collateral-dependent loans is less than the fair value of collateral less estimated costs to sell, additional losses may be recognized. Subsequent evaluations of the loan portfolio, in light of the factors then prevailing, may result in significant changes in the CECL allowance in future periods. Our underlying assumptions and judgments could prove to be inaccurate, which could materially impact our regulatory capital position and results of operations in future periods. See Note 1—Organization, Basis of Presentation and Summary of Significant Accounting Policies for additional information.
E*TRADE Q3 2019 10-Q | Page 39
ITEM 3. QUANTITATIVE AND QUALITATIVE DISCLOSURES ABOUT MARKET RISK
The following discussion about market risk includes forward-looking statements. Actual results could differ materially from those projected in the forward-looking statements as a result of certain factors, including, but not limited to, those set forth in Part I. Forward Looking Statements in this Quarterly Report and Part I. Item 1A. Risk Factors in the 2018 Annual Report. Interest Rate Risk
Our exposure to interest rate risk is related primarily to interest-earning assets and interest-bearing liabilities. Managing interest rate risk is essential to profitability. The primary objective of the management of interest rate risk management is to control exposure to interest rates within the Board-approved limits and with limited exposure to earnings volatility resulting from interest rate fluctuations. Our general strategies to manage interest rate risk include balancing variable-rate and fixed-rate assets and liabilities and utilizing derivatives to help manage exposures to changes in interest rates. Exposure to interest rate risk requires management to make complex assumptions regarding maturities, market interest rates and customer behavior. Changes in interest rates, including the following, could impact interest income and expense:
Interest-earning assets and interest-bearing liabilities may re-price at different times or by different amounts, creating a mismatch.
The yield curve may steepen, flatten or otherwise change shape, which could affect the spread between short- and long-term rates. Widening or narrowing spreads could impact net interest income.
Market interest rates may influence prepayments, resulting in maturity mismatches. In addition, prepayments could impact yields as premiums and discounts amortize.
Exposure to interest rate risk is dependent upon the distribution and composition of interest-earning assets, interest-bearing liabilities and derivatives. The differing risk characteristics of each product are managed to mitigate our exposure to interest rate fluctuations. At March 31,September 30, 2019, 93%91% of our total assets were interest-earning assets and we had no securities classified as trading.
At March 31,September 30, 2019, 67%63% of total assets were available-for-sale and held-to-maturity mortgage-backed securities and residential real estate loans. The values of these assets are sensitive to changes in interest rates as well as expected prepayment levels. As interest rates increase, fixed-rate residential mortgages and mortgage-backed securities tend to exhibit lower prepayments. The inverse is true in a falling rate environment.
When real estate loans or mortgage-backed securities are prepaid, unamortized premiums and/or discounts are recognized immediately in interest income. Depending on the timing of the prepayment, these adjustments to income would impact anticipated yields. The Company reviews estimates of the impact of changing market rates on prepayments. This information is incorporated into our interest rate risk management strategy.
Our liability structure consists of two central sources of funding: deposits and customer payables, both of which re-price at management’s discretion. We may utilize securities lending and wholesale funding sources as needed for short-term liquidity and contingency funding requirements.
Derivative Instruments
We use derivative instruments to help manage interest rate risk using designated hedge relationships. Interest rate swaps involve the exchange of fixed-rate and variable-rate interest payments between two parties based on a contractual underlying notional amount, but do not involve the exchange of the
E*TRADE Q1Q3 2019 10-Q | Page 3340
underlying notional amounts. See Note 7—Derivative Instruments and Hedging Activities for additional information about our use of derivative contracts.
Scenario Analysis
Scenario analysis is an advanced approach to estimating interest rate risk exposure. The Company monitors interest rate risk using the Economic Value of Equity (EVE) approach and the Earnings-at-Risk (EAR) approach.
Under the EVE approach, the present value of expected cash flows of all existing interest-earning assets, interest-bearing liabilities, derivatives and forward commitments are estimated and combined to produce an EVE figure. The change in EVE is a long-term sensitivity measure of interest rate risk. The approach values only the current balance sheet in which the most significant assumptions are the prepayment rates of the loan portfolio and mortgage-backed securities portfolios and the repricing of deposits. This approach does not incorporate assumptions related to business growth, or liquidation and re-investmentreinvestment of instruments. This approach provides an indicator of future earnings and capital levels because changes in EVE indicate the anticipated change in the value of future cash flows. The sensitivity of this value to changes in interest rates is then determined by applying alternative interest rate scenarios. The change in EVE amounts fluctuate based on instantaneous parallel shifts in interest rates primarily due to the change in timing of cash flows, which considers prepayment estimates, in the Company’s residential loan and mortgage-backed securities portfolios.
EAR is a short-term sensitivity measure of interest rate risk and illustrates the impact of alternative interest rate scenarios on net interest income, including corporate interest expense, over a twelve month time frame. In measuring the sensitivity of net interest income to changes in interest rates, we assume instantaneous parallel interest rate shocks applied to the forward curve. In addition, we assume that cash flows from loan payoffs are reinvested in mortgage-backed securities, we exclude revenue from off-balance sheet customer cash and we assume no balance sheet growth.
The following table presents the sensitivity of EVE and EAR at the consolidated E*TRADE Financial level (dollars in millions): | | Instantaneous Parallel Change in Interest Rates (basis points) (1) | | Economic Value of Equity | | Earnings-at-Risk | | Economic Value of Equity | | Earnings-at-Risk |
| | March 31, 2019 | | December 31, 2018 | | March 31, 2019 | | December 31, 2018 | | September 30, 2019 | | December 31, 2018 | | September 30, 2019 | | December 31, 2018 |
| | Amount | | Percentage | | Amount | | Percentage | | Amount | | Percentage | | Amount | | Percentage | | Amount | | Percentage | | Amount | | Percentage | | Amount | | Percentage | | Amount | | Percentage |
| +200 | | $ | 30 |
| | 0.4 | % | | $ | 148 |
| | 1.8 | % | | $ | 168 |
| | 8.2 | % | | $ | 187 |
| | 9.2 | % | | $ | 109 |
| | 1.8 | % | | $ | 148 |
| | 1.8 | % | | $ | 253 |
| | 15.6 | % | | $ | 187 |
| | 9.2 | % |
| +100 | | $ | 181 |
| | 2.3 | % | | $ | 198 |
| | 2.4 | % | | $ | 96 |
| | 4.7 | % | | $ | 101 |
| | 5.0 | % | | $ | 215 |
| | 3.6 | % | | $ | 198 |
| | 2.4 | % | | $ | 148 |
| | 9.1 | % | | $ | 101 |
| | 5.0 | % |
| +50 | | $ | 147 |
| | 1.8 | % | | $ | 146 |
| | 1.8 | % | | $ | 53 |
| | 2.6 | % | | $ | 53 |
| | 2.6 | % | | $ | 153 |
| | 2.5 | % | | $ | 146 |
| | 1.8 | % | | $ | 79 |
| | 4.9 | % | | $ | 53 |
| | 2.6 | % |
| -50 | | $ | (304 | ) | | (3.8 | )% | | $ | (273 | ) | | (3.4 | )% | | $ | (80 | ) | | (3.9 | )% | | $ | (88 | ) | | (4.3 | )% | | $ | (271 | ) | | (4.5 | )% | | $ | (273 | ) | | (3.4 | )% | | $ | (105 | ) | | (6.4 | )% | | $ | (88 | ) | | (4.3 | )% |
| |
| (1) | These scenario analyses assume a balance sheet size as of the dates indicated. Any changes in size would cause the amounts to vary. |
We actively manage interest rate risk. As interest rates change, we will adjust our strategy and mix of assets, liabilities and derivatives to optimize our interest rate risk position. For example, a 100 basis points increase in rates may not result in a change in value as indicated above. We compare the instantaneous parallel interest rate changes in EVE and EAR to the established limits set by the Board of Directors in order to assess interest rate risk. In the event that the percentage change in EVE or EAR exceeds the Board limits, our Chief Executive Officer, Chief Risk Officer, Chief Financial Officer and Treasurer must all be promptly notified in writing and decide upon a plan of remediation. In addition, the Board of Directors must be notified of the exception and the planned resolution. At March 31,September 30, 2019 the EVE and EAR percentage changes were within our Board limits.
E*TRADE Q1Q3 2019 10-Q | Page 3441
KEY TERMS
Active trader—Customers that execute 30 or more trades per quarter.
Adjusted operating margin—Adjusted operating margin is calculated by dividing adjusted income before income tax expense by total net revenue. Adjusted income before income tax expense, a non-GAAP measure, excludes provision (benefit) for loan losses and losses on early extinguishment of debt, as applicable.
Adjusted return on common equity—A non-GAAP measure calculated by dividing adjusted net income available to common shareholders, a non-GAAP measure which excludes the provision (benefit) for loan losses and losses on early extinguishment of debt, as applicable, by average common shareholders' equity, which excludes preferred stock.
Agency—US Government sponsored enterprises and federal government and other agencies, such as the Federal National Mortgage Association, Federal Home Loan Mortgage Corporation, Government National Mortgage Association, the Small Business Administration, the Export-Import Bank, Federal Home Loan Bank and the Federal Farm Credit Bank.
Asset-backed securities (ABS)—Debt securities backed by financial assets such as credit cards, automobile loans, student loans or other receivables.
Average commission per trade—Total commissions revenue divided by total commissionable trades.
Basel III—Global regulatory standards for bank capital adequacy and liquidity as issued by the international Basel Committee on Banking Supervision.
Basis point—One one-hundredth of a percentage point.
Capital return percentage to shareholders—Represents the amount of earnings returned to shareholders through share repurchases and common stock dividends as a percentage of net income available to common shareholders.
CECL—Current expected credit losses.
CFTC—Commodity Futures Trading Commission.
Charge-off—The result of removing a loan or portion of a loan from an entity’s balance sheet because the loan is considered to be uncollectible.
CLTV—Combined loan-to-value ratio.
Collateral-dependent—Prior to adoption of the CECL accounting standard, a loan where repayment is expected to be provided solely through the sale of the underlying collateral when the borrower is experiencing financial difficulty. After adoption of the CECL accounting standard, a loan for which foreclosure is probable or a loan where repayment is expected to be provided substantially through the sale of the underlying collateral when the borrower is experiencing financial difficulty.
Commissionable trades—Commissionable trades exclude trades related to no transaction fee mutual funds and commission-free ETFs, rebalancing trades associated with our managed products, and other non-commissionable trades.
Common Equity Tier 1 Capitalcapital—A measurement of the Company's core equity capital used in the calculation of capital adequacy ratios. Common Equity Tier 1 Capitalcapital equals: total shareholders' equity, less preferred stock and related surplus, plus/(less) unrealized losses (gains) on certain available-for-sale securities, less goodwill and certain other intangible assets, less certain disallowed deferred tax assets and subject to certain other applicable adjustments.
E*TRADE Q3 2019 10-Q | Page 42
Consolidated financial statements—Refers to the consolidated financial statements prepared in accordance with GAAP as included in the Company's 2018 Annual Report, and the condensed consolidated financial statements included in the Company's Quarterly Reports on Form 10-Q. Corporate cash—Cash held at the parent company as well as cash held in certain subsidiaries that can distribute cash to the parent company without any regulatory approval or notification.
CRA—Community Reinvestment Act.
E*TRADE Q1 2019 10-Q | Page 35
Customer account—Retail and advisor services accounts are defined as those with a minimum balance of $25 or a trade within the prior six months. Corporate services accounts are defined as those holding any type of vested or unvested securities from a corporate services client company or with a trade in the prior six months.
Customer assets—Market value of all customer assets held by the Company including security holdings, customer cash and deposits, and corporate services vested and unvested equity and option holding.holdings.
Daily average revenue trades (DARTs)—Total commissionable trades in a period divided by the number of trading days during that period.
Derivative—A financial instrument or other contract which includes one or more underlying securities, notional amounts, or payment provisions. The contract generally requires no initial net investment and is settled on a net basis.
Derivative DARTs—Commissionable options and futures trades in a period divided by the number of trading days during that period.
Earnings at Riskrisk (EAR)—The sensitivity of GAAP net interest income to changes in interest rates over a twelve month horizon. It is a short-term measurement of interest rate risk and does not consider risks beyond the simulation time horizon. In addition, it requires reinvestment, funding, and hedging assumptions for the horizon.
Economic Valuevalue of Equityequity (EVE)—The sensitivity of the value of existing assets and liabilities, including derivatives and forward commitments, to changes in interest rates. It is a long-term measurement of interest rate risk and requires assumptions that include prepayment rates on the loan portfolio and mortgage-backed securities and the repricing of deposits.
ESDA—Extended insurance sweep deposit accounts.
ETB—E*TRADE Bank.
ETFC—E*TRADE Financial Corporation.
ETS—E*TRADE Securities.
Fair value—The price that would be received to sell an asset or paid to transfer a liability in an orderly transaction between market participants at the measurement date.
Fair value hedge—A derivative instrument designated in a hedging relationship that mitigates exposure to changes in the fair value of a recognized asset or liability or a firm commitment.
FASB—Financial Accounting Standards Board.
FCM—Futures Commission Merchant.
FDIC—Federal Deposit Insurance Corporation.
E*TRADE Q3 2019 10-Q | Page 43
Federal Reserve—Federal Reserve System, including the Board of Governors of the Federal Reserve System and the twelve regional Federal Reserve Banks.
FHLB—Federal Home Loan Bank.
FICO—Fair Isaac Credit Organization.
FINRA—Financial Industry Regulatory Authority.
Generally Accepted Accounting Principlesaccepted accounting principles (GAAP)—Accounting principles generally accepted in the United States of America.
E*TRADE Q1 2019 10-Q | Page 36
Gross loans receivable—Includes unpaid principal balances and premiums (discounts).
HEIL—Home equity installment loan.
HELOC—Home equity linesline of credit.
Interest-bearing liabilities—Liabilities such as deposits, customer payables, other borrowings, corporate debt and certain customer credit balances and securities lending balances on which the Company pays interest; excludes customer cash held by third parties.
Interest-earning assets—Assets such as available-for-sale securities, held-to-maturity securities, margin receivables, loans, securities borrowed balances and segregated cash that earn interest for the Company.
Interest rate swaps—Contracts that are entered into primarily as an asset/liability management strategy to reduce interest rate risk. Interest rate swap contracts are exchanges of interest rate payments, such as fixed-rate payments for floating-rate payments, based on notional amounts.
Investment grade—Defined as a rating equivalent to a Moody’s Investors Service (Moody’s) rating of “Baa3” or higher or a Standard & Poor’s (S&P) rating of “BBB-” or higher.
LIBOR—London Interbank Offered Rate. LIBOR is the interest rate at which banks borrow funds from other banks in the London wholesale money market (or interbank market).
LLC—Limited liability company.
LTV—Loan-to-value ratio.
NASDAQ—National Association of Securities Dealers Automated Quotations.
Net interest income—A measure of interest revenue, net interest income is equal to interest income less interest expense.
NFA—National Futures Association.
Net interest margin—A measure of the net yield on our average interest-earning assets. Net interest margin is calculated for a given period by dividing the annualized sum of net interest income by average interest-earning assets.
Net new retail and advisor services assets—Net new retail and advisor services assets exclude the effects of market movements in the value of retail and advisor services assets.
NFA—National Futures Association.
Notional amount—The specified dollar amount underlying a derivative on which the calculated payments are based.
OCC—Office of the Comptroller of the Currency.
E*TRADE Q3 2019 10-Q | Page 44
Options—Contracts that grant the purchaser, for a premium payment, the right, but not the obligation, to either purchase or sell the associated financial instrument at a set price during a period or at a specified date in the future.
RAS—Risk Appetite Statement.
Real estate owned and repossessed assets—Ownership or physical possession of real property by the Company, generally acquired as a result of foreclosure or repossession.
Recovery—Represents cash proceeds received on a loan that had been previously charged off.
E*TRADE Q1 2019 10-Q | Page 37
Repurchase agreement—An agreement giving the transferor of an asset the right or obligation to repurchase the same or similar securities at a specified price on a given date from the transferee. These agreements are generally collateralized by mortgage-backed or investment-grade securities. From the transferee's perspective the arrangement is referred to as a reverse repurchase agreement.
RIA—Registered Investment Advisor.
Risk-weighted assets—Primarily computed by the assignment of specific risk-weightings to assets and off-balance sheet instruments for capital adequacy calculations.
RSDA—Retirement sweep deposit account.
S&P—Standard & Poor’s.
SEC—US Securities and Exchange Commission.
Sweep deposit accounts—Accounts with the functionality to transfer customer cash balances to and from an FDIC insured account.
TCA—Trust Company of America, Inc.
Tier 1 capital—Adjusted equity capital used in the calculation of capital adequacy ratios. Tier 1 capital equals: Common Equity Tier 1 capital plus qualifying preferred stock and related surplus, subject to certain other applicable adjustments.
Troubled Debt Restructuringdebt restructuring (TDR)—A loan modification that involves granting an economic concession to a borrower who is experiencing financial difficulty, and loans that have been charged-off due to bankruptcy notification.
VIE—Variable interest entity.
Wholesale borrowings—Borrowings that consist of repurchase agreements and FHLB advances.
E*TRADE Q1Q3 2019 10-Q | Page 3845
ITEM 1. CONDENSED CONSOLIDATED FINANCIAL STATEMENTS (UNAUDITED)
|
| |
| Condensed Consolidated Statement of Income | |
| Condensed Consolidated Statement of Comprehensive Income | |
| Condensed Consolidated Balance Sheet | |
| Condensed Consolidated Statement of Shareholders’ Equity | |
| Condensed Consolidated Statement of Cash Flows | |
| Notes to the Condensed Consolidated Financial Statements | |
| Note 1—Organization, Basis of Presentation and Summary of Significant Accounting Policies | |
| Note 2—Net Revenue | |
| Note 3—Fair Value Disclosures | |
| Note 4—Offsetting Assets and Liabilities | |
| Note 5—Available-for-Sale and Held-to-Maturity Securities | |
| Note 6—Loans Receivable, Net | |
| Note 7—Derivative Instruments and Hedging Activities | |
| Note 8—Deposits | |
| Note 9—Other Borrowings and Corporate Debt | |
| |
| Note 11—Shareholders' Equity | |
Note 12—Earnings perPer Share | |
| Note 13—Regulatory Requirements | |
| Note 14—Commitments, Contingencies and Other Regulatory Matters | |
E*TRADE Q1Q3 2019 10-Q | Page 3946
E*TRADE FINANCIAL CORPORATION
CONDENSED CONSOLIDATED STATEMENT OF INCOME
(In millions, except share data and per share amounts)
(Unaudited)
| | | | Three Months Ended March 31, | Three Months Ended September 30, | | Nine Months Ended September 30, |
| | 2019 | | 2018 | 2019 | | 2018 | | 2019 | | 2018 |
| Revenue: | | | | | | | | | | |
| Interest income | $ | 555 |
| | $ | 468 |
| $ | 521 |
| | $ | 514 |
| | $ | 1,636 |
| | $ | 1,471 |
|
| Interest expense | (63 | ) | | (23 | ) | (66 | ) | | (48 | ) | | (199 | ) | | (107 | ) |
| Net interest income | 492 |
| | 445 |
| 455 |
| | 466 |
| | 1,437 |
| | 1,364 |
|
| Commissions | 122 |
| | 137 |
| 122 |
| | 117 |
| | 365 |
| | 375 |
|
| Fees and service charges | 118 |
| | 105 |
| 163 |
| | 108 |
| | 407 |
| | 323 |
|
| Gains on securities and other, net | 11 |
| | 10 |
| |
| Gains (losses) on securities and other, net | | 16 |
| | 17 |
| | (37 | ) | | 42 |
|
| Other revenue | 12 |
| | 11 |
| 11 |
| | 12 |
| | 35 |
| | 34 |
|
| Total non-interest income | 263 |
| | 263 |
| 312 |
| | 254 |
| | 770 |
| | 774 |
|
| Total net revenue | 755 |
| | 708 |
| 767 |
| | 720 |
| | 2,207 |
| | 2,138 |
|
| Provision (benefit) for loan losses | (12 | ) | | (21 | ) | (12 | ) | | (34 | ) | | (32 | ) | | (74 | ) |
| Non-interest expense: | | | | | | | | | | |
| Compensation and benefits | 164 |
| | 152 |
| 167 |
| | 157 |
| | 499 |
| | 469 |
|
| Advertising and market development | 54 |
| | 60 |
| 41 |
| | 45 |
| | 143 |
| | 152 |
|
| Clearing and servicing | 30 |
| | 36 |
| 36 |
| | 28 |
| | 98 |
| | 94 |
|
| Professional services | 22 |
| | 22 |
| 27 |
| | 23 |
| | 75 |
| | 70 |
|
| Occupancy and equipment | 32 |
| | 30 |
| 34 |
| | 29 |
| | 98 |
| | 89 |
|
| Communications | 15 |
| | 31 |
| 26 |
| | 30 |
| | 70 |
| | 89 |
|
| Depreciation and amortization | 21 |
| | 22 |
| 23 |
| | 25 |
| | 65 |
| | 70 |
|
| FDIC insurance premiums | 4 |
| | 9 |
| 3 |
| | 8 |
| | 11 |
| | 26 |
|
| Amortization of other intangibles | 15 |
| | 10 |
| 16 |
| | 12 |
| | 46 |
| | 34 |
|
| Restructuring and acquisition-related activities | | 2 |
| | 4 |
| | 2 |
| | 6 |
|
| Losses on early extinguishment of debt | | — |
| | 4 |
| | — |
| | 4 |
|
| Other non-interest expenses | 18 |
| | 23 |
| 24 |
| | 15 |
| | 65 |
| | 56 |
|
| Total non-interest expense | 375 |
| | 395 |
| 399 |
| | 380 |
| | 1,172 |
| | 1,159 |
|
| Income before income tax expense | 392 |
| | 334 |
| 380 |
| | 374 |
| | 1,067 |
| | 1,053 |
|
| Income tax expense | 102 |
| | 87 |
| 106 |
| | 89 |
| | 284 |
| | 271 |
|
| Net income | $ | 290 |
| | $ | 247 |
| $ | 274 |
| | $ | 285 |
| | $ | 783 |
| | $ | 782 |
|
| Preferred stock dividends | 20 |
| | 12 |
| 20 |
| | 24 |
| | 40 |
| | 36 |
|
| Net income available to common shareholders | $ | 270 |
| | $ | 235 |
| $ | 254 |
| | $ | 261 |
| | $ | 743 |
| | $ | 746 |
|
| Basic earnings per common share | $ | 1.10 |
| | $ | 0.88 |
| $ | 1.08 |
| | $ | 1.01 |
| | $ | 3.08 |
| | $ | 2.84 |
|
| Diluted earnings per common share | $ | 1.09 |
| | $ | 0.88 |
| $ | 1.08 |
| | $ | 1.00 |
| | $ | 3.07 |
| | $ | 2.82 |
|
| Weighted average common shares outstanding: | | | | | | | | | | |
| Basic (in thousands) | 246,252 |
| | 266,558 |
| 235,829 |
| | 259,498 |
| | 241,657 |
| | 263,292 |
|
| Diluted (in thousands) | 246,934 |
| | 267,699 |
| 236,313 |
| | 260,661 |
| | 242,199 |
| | 264,433 |
|
See accompanying notes to the condensed consolidated financial statements (unaudited)
E*TRADE Q1Q3 2019 10-Q | Page 4047
E*TRADE FINANCIAL CORPORATION
CONDENSED CONSOLIDATED STATEMENT OF COMPREHENSIVE INCOME
(In millions)
(Unaudited)
| | | | Three Months Ended March 31, | Three Months Ended September 30, | | Nine Months Ended September 30, |
| | 2019 | | 2018 | 2019 | | 2018 | | 2019 | | 2018 |
| Net income | $ | 290 |
| | $ | 247 |
| $ | 274 |
| | $ | 285 |
| | $ | 783 |
| | $ | 782 |
|
| Other comprehensive income (loss), net of tax | | | | | | | | | | |
| Available-for-sale securities: | | | | | | | | | | |
| Unrealized gains (losses), net | 112 |
| | (128 | ) | 43 |
| | (86 | ) | | 219 |
| | (265 | ) |
| Reclassification into earnings, net | (7 | ) | | (7 | ) | (9 | ) | | (8 | ) | | 32 |
| | (23 | ) |
| Transfer of held-to-maturity securities to available-for-sale securities | — |
| | 6 |
| — |
| | — |
| | — |
| | 6 |
|
| Net change from available-for-sale securities | 105 |
| | (129 | ) | 34 |
| | (94 | ) | | 251 |
| | (282 | ) |
| Other comprehensive income (loss) | 105 |
| | (129 | ) | 34 |
| | (94 | ) | | 251 |
| | (282 | ) |
| Comprehensive income | $ | 395 |
| | $ | 118 |
| $ | 308 |
| | $ | 191 |
| | $ | 1,034 |
| | $ | 500 |
|
See accompanying notes to the condensed consolidated financial statements (unaudited)
E*TRADE Q1Q3 2019 10-Q | Page 4148
E*TRADE FINANCIAL CORPORATION
CONDENSED CONSOLIDATED BALANCE SHEET
(In millions, except share data)
(Unaudited)
| | | | March 31, | | December 31, | September 30, | | December 31, |
| | 2019 | | 2018 | 2019 | | 2018 |
| ASSETS | | | | | | |
| Cash and equivalents | $ | 523 |
| | $ | 2,333 |
| $ | 493 |
| | $ | 2,333 |
|
| Cash segregated under federal or other regulations | 677 |
| | 1,011 |
| 1,365 |
| | 1,011 |
|
| Available-for-sale securities | 24,971 |
| | 23,153 |
| 21,020 |
| | 23,153 |
|
| Held-to-maturity securities (fair value of $23,824 and $21,491 at March 31, 2019 and December 31, 2018, respectively) | 23,927 |
| | 21,884 |
| |
| Held-to-maturity securities (fair value of $21,912 and $21,491 at September 30, 2019 and December 31, 2018, respectively) | | 21,542 |
| | 21,884 |
|
| Margin receivables | 10,267 |
| | 9,560 |
| 9,859 |
| | 9,560 |
|
| Loans receivable, net (net of allowance for loan losses of $32 and $37 at March 31, 2019 and December 31, 2018, respectively) | 1,965 |
| | 2,103 |
| |
| Loans receivable, net (net of allowance for loan losses of $27 and $37 at September 30, 2019 and December 31, 2018, respectively) | | 1,747 |
| | 2,103 |
|
| Receivables from brokers, dealers and clearing organizations | 597 |
| | 760 |
| 1,038 |
| | 760 |
|
| Property and equipment, net | 308 |
| | 281 |
| 338 |
| | 281 |
|
| Goodwill | 2,485 |
| | 2,485 |
| 2,485 |
| | 2,485 |
|
| Other intangibles, net | 476 |
| | 491 |
| 446 |
| | 491 |
|
| Other assets | 1,322 |
| | 942 |
| 1,374 |
| | 942 |
|
| Total assets | $ | 67,518 |
| | $ | 65,003 |
| $ | 61,707 |
| | $ | 65,003 |
|
| LIABILITIES AND SHAREHOLDERS’ EQUITY | | | | | | |
| Liabilities: | | | | | | |
| Deposits | $ | 46,328 |
| | $ | 45,313 |
| $ | 40,382 |
| | $ | 45,313 |
|
| Customer payables | 10,600 |
| | 10,117 |
| 11,183 |
| | 10,117 |
|
| Payables to brokers, dealers and clearing organizations | 1,162 |
| | 948 |
| 1,091 |
| | 948 |
|
| Other borrowings | 300 |
| | — |
| |
| Corporate debt | 1,409 |
| | 1,409 |
| 1,410 |
| | 1,409 |
|
| Other liabilities | 937 |
| | 654 |
| 1,072 |
| | 654 |
|
| Total liabilities | 60,736 |
| | 58,441 |
| 55,138 |
| | 58,441 |
|
| Commitments and contingencies (see Note 14) |
|
| |
|
|
|
| |
|
|
| Shareholders’ equity: | | | | | | |
| Preferred stock, $0.01 par value, 1,000,000 shares authorized, 403,000 shares issued and outstanding at both March 31, 2019 and December 31, 2018; aggregate liquidation preference of $700 at both March 31, 2019 and December 31, 2018 | 689 |
| | 689 |
| |
| Common stock, $0.01 par value, 400,000,000 shares authorized, 244,647,243 and 246,495,174 shares issued and outstanding at March 31, 2019 and December 31, 2018, respectively | 2 |
| | 2 |
| |
| Preferred stock, $0.01 par value, 1,000,000 shares authorized, 403,000 shares issued and outstanding at both September 30, 2019 and December 31, 2018; aggregate liquidation preference of $700 at both September 30, 2019 and December 31, 2018 | | 689 |
| | 689 |
|
Common stock, $0.01 par value, 400,000,000 shares authorized, 226,795,480
and 246,495,174 shares issued and outstanding at September 30, 2019 and December 31, 2018, respectively | | 2 |
| | 2 |
|
| Additional paid-in-capital | 5,342 |
| | 5,462 |
| 4,578 |
| | 5,462 |
|
| Retained earnings | 919 |
| | 684 |
| 1,324 |
| | 684 |
|
| Accumulated other comprehensive loss | (170 | ) | | (275 | ) | (24 | ) | | (275 | ) |
| Total shareholders’ equity | 6,782 |
| | 6,562 |
| 6,569 |
| | 6,562 |
|
| Total liabilities and shareholders’ equity | $ | 67,518 |
| | $ | 65,003 |
| $ | 61,707 |
| | $ | 65,003 |
|
See accompanying notes to the condensed consolidated financial statements (unaudited)
E*TRADE Q1Q3 2019 10-Q | Page 42
E*TRADE FINANCIAL CORPORATION
CONDENSED CONSOLIDATED STATEMENT OF SHAREHOLDERS’ EQUITY
(In millions)
|
| | | | | | | | | | | | | | | | | | | | | | | | | | |
| | | | | | Additional
Paid-in
Capital | | Retained Earnings | | Accumulated
Other
Comprehensive
Loss | | Total
Shareholders’
Equity |
| | Preferred Stock | | Common Stock | | | | |
| | Amount | | Shares | | Amount | | | | |
| Balance at December 31, 2018 | $ | 689 |
| | 246 |
| | $ | 2 |
| | $ | 5,462 |
| | $ | 684 |
| | $ | (275 | ) | | $ | 6,562 |
|
| Net income | — |
| | — |
| | — |
| | — |
| | 290 |
| | — |
| | 290 |
|
| Other comprehensive income | — |
| | — |
| | — |
| | — |
| | — |
| | 105 |
| | 105 |
|
| Common stock dividends ($0.14 per share) | — |
| | — |
| | — |
| | — |
| | (35 | ) | | — |
| | (35 | ) |
| Preferred stock dividends - Series A ($29.38 per share) | — |
| | — |
| | — |
| | — |
| | (12 | ) | | — |
| | (12 | ) |
| Preferred stock dividends - Series B ($2,650.00 per share) | — |
| | — |
| | — |
| | — |
| | (8 | ) | | — |
| | (8 | ) |
| Repurchases of common stock | — |
| | (2 | ) | | — |
| | (120 | ) | | — |
| | — |
| | (120 | ) |
| Share-based compensation | — |
| | — |
| | — |
| | 13 |
| | — |
| | — |
| | 13 |
|
| Other common stock activity | — |
| | 1 |
| | — |
| | (13 | ) | | — |
| | — |
| | (13 | ) |
| Balance at March 31, 2019 | $ | 689 |
| | 245 |
| | $ | 2 |
| | $ | 5,342 |
| | $ | 919 |
| | $ | (170 | ) | | $ | 6,782 |
|
| | | | | | | | Additional Paid-in Capital | | Accumulated Deficit | | Accumulated Other Comprehensive Loss | | Total Shareholders’ Equity |
| | Preferred Stock | | Common Stock | | | | |
| | Amount | | Shares | | Amount | | | | |
| Balance at December 31, 2017 | $ | 689 |
| | 267 |
| | $ | 3 |
| | $ | 6,582 |
| | $ | (317 | ) | | $ | (26 | ) | | $ | 6,931 |
|
| Cumulative effect of hedge accounting adoption | — |
| | — |
| | — |
| | — |
| | 7 |
| | (7 | ) | | — |
|
| Reclassification of tax effects due to federal tax reform | — |
| | — |
| | — |
| | — |
| | 14 |
| | (14 | ) | | — |
|
| Net income | — |
| | — |
| | — |
| | — |
| | 247 |
| | — |
| | 247 |
|
| Other comprehensive loss | — |
| | — |
| | — |
| | — |
| | — |
| | (129 | ) | | (129 | ) |
| Preferred stock dividends - Series A ($29.38 per share) | — |
| | — |
| | — |
| | — |
| | (12 | ) | | — |
| | (12 | ) |
| Repurchases of common stock | — |
| | (3 | ) | | — |
| | (140 | ) | | — |
| | — |
| | (140 | ) |
| Share-based compensation | — |
| | — |
| | — |
| | 10 |
| | — |
| | — |
| | 10 |
|
| Other common stock activity | — |
| | 1 |
| | — |
| | (18 | ) | | — |
| | — |
| | (18 | ) |
| Balance at March 31, 2018 | $ | 689 |
| | 265 |
| | $ | 3 |
| | $ | 6,434 |
| | $ | (61 | ) | | $ | (176 | ) | | $ | 6,889 |
|
See accompanying notes to the condensed consolidated financial statements (unaudited)
E*TRADE Q1 2019 10-Q | Page 4349
E*TRADE FINANCIAL CORPORATION CONDENSED CONSOLIDATED STATEMENT OF CASH FLOWS (In millions) (Unaudited) |
| | | | | | | |
| | Three Months Ended March 31, |
| | 2019 | | 2018 |
| Cash flows from operating activities: | | | |
| Net income | $ | 290 |
| | $ | 247 |
|
| Adjustments to reconcile net income to net cash provided by operating activities: | | | |
| Provision (benefit) for loan losses | (12 | ) | | (21 | ) |
| Depreciation and amortization (including amortization and accretion on investment securities) | 54 |
| | 65 |
|
| Gains on securities and other, net | (11 | ) | | (10 | ) |
| Share-based compensation | 13 |
| | 10 |
|
| Deferred tax expense | 93 |
| | 78 |
|
| Other | (3 | ) | | 1 |
|
| Net effect of changes in assets and liabilities: | | | |
| Decrease in receivables from brokers, dealers and clearing organizations | 163 |
| | 443 |
|
| Increase in margin receivables | (707 | ) | | (1,444 | ) |
| (Increase) decrease in other assets | (183 | ) | | 367 |
|
| Increase in payables to brokers, dealers and clearing organizations | 214 |
| | 1,350 |
|
| Increase (decrease) in customer payables | 483 |
| | (502 | ) |
| Decrease in other liabilities | (209 | ) | | (38 | ) |
| Net cash provided by operating activities | 185 |
| | 546 |
|
| Cash flows from investing activities: | | | |
| Purchases of available-for-sale securities | (3,589 | ) | | (2,282 | ) |
| Proceeds from sales of available-for-sale securities | 1,760 |
| | 797 |
|
| Proceeds from maturities of and principal payments on available-for-sale securities | 361 |
| | 459 |
|
| Purchases of held-to-maturity securities | (3,084 | ) | | (1,109 | ) |
| Proceeds from maturities of and principal payments on held-to-maturity securities | 1,034 |
| | 593 |
|
| Proceeds from sales of loans | — |
| | 15 |
|
| Decrease in loans receivable | 145 |
| | 163 |
|
| Capital expenditures for property and equipment | (38 | ) | | (21 | ) |
| Proceeds from sale of real estate owned and repossessed assets | 4 |
| | 9 |
|
| Net cash flow from derivative contracts | (29 | ) | | 10 |
|
| Other | (18 | ) | | (4 | ) |
| Net cash used in investing activities | (3,454 | ) | | (1,370 | ) |
| | | | |
E*TRADE FINANCIAL CORPORATION CONDENSED CONSOLIDATED STATEMENT OF SHAREHOLDERS’ EQUITY (In millions) (Unaudited) |
| | | | | | | | | | | | | | | | | | | | | | | | | | |
| | | | | | Additional
Paid-in
Capital | | Retained Earnings | | Accumulated
Other
Comprehensive
Loss | | Total
Shareholders’
Equity |
| | Preferred Stock | | Common Stock | | | | |
| | Amount | | Shares | | Amount | | | | |
| Balance at December 31, 2018 | $ | 689 |
| | 246 |
| | $ | 2 |
| | $ | 5,462 |
| | $ | 684 |
| | $ | (275 | ) | | $ | 6,562 |
|
| Net income | — |
| | — |
| | — |
| | — |
| | 290 |
| | — |
| | 290 |
|
| Other comprehensive income | — |
| | — |
| | — |
| | — |
| | — |
| | 105 |
| | 105 |
|
| Common stock dividends ($0.14 per share) | — |
| | — |
| | — |
| | — |
| | (35 | ) | | — |
| | (35 | ) |
| Preferred stock dividends - Series A ($29.38 per share) | — |
| | — |
| | — |
| | — |
| | (12 | ) | | — |
| | (12 | ) |
| Preferred stock dividends - Series B ($2,650.00 per share) | — |
| | — |
| | — |
| | — |
| | (8 | ) | | — |
| | (8 | ) |
| Repurchases of common stock | — |
| | (2 | ) | | — |
| | (120 | ) | | — |
| | — |
| | (120 | ) |
| Share-based compensation | — |
| | — |
| | — |
| | 13 |
| | — |
| | — |
| | 13 |
|
| Other common stock activity | — |
| | 1 |
| | — |
| | (13 | ) | | — |
| | — |
| | (13 | ) |
| Balance at March 31, 2019 | $ | 689 |
| | 245 |
| | $ | 2 |
| | $ | 5,342 |
| | $ | 919 |
| | $ | (170 | ) | | $ | 6,782 |
|
| Net income | — |
| | — |
| | — |
| | — |
| | 219 |
| | — |
| | 219 |
|
| Other comprehensive income | — |
| | — |
| | — |
| | — |
| | — |
| | 112 |
| | 112 |
|
| Common stock dividends ($0.14 per share) | — |
| | — |
| | — |
| | — |
| | (34 | ) | | — |
| | (34 | ) |
| Repurchases of common stock | — |
| | (5 | ) | | — |
| | (222 | ) | | — |
| | — |
| | (222 | ) |
| Share-based compensation | — |
| | — |
| | — |
| | 13 |
| | — |
| | — |
| | 13 |
|
| Balance at June 30, 2019 | $ | 689 |
| | 240 |
| | $ | 2 |
| | $ | 5,133 |
| | $ | 1,104 |
| | $ | (58 | ) | | $ | 6,870 |
|
| Net income | — |
| | — |
| | — |
| | — |
| | 274 |
| | — |
| | 274 |
|
| Other comprehensive income | — |
| | — |
| | — |
| | — |
| | — |
| | 34 |
| | 34 |
|
| Common stock dividends ($0.14 per share) | — |
| | — |
| | — |
| | — |
| | (34 | ) | | — |
| | (34 | ) |
| Preferred stock dividends - Series A ($29.38 per share) | — |
| | — |
| | — |
| | — |
| | (12 | ) | | — |
| | (12 | ) |
| Preferred stock dividends - Series B ($2,650.00 per share) | — |
| | — |
| | — |
| | — |
| | (8 | ) | | — |
| | (8 | ) |
| Repurchases of common stock | — |
| | (13 | ) | | — |
| | (566 | ) | | — |
| | — |
| | (566 | ) |
| Share-based compensation | — |
| | — |
| | — |
| | 12 |
| | — |
| | — |
| | 12 |
|
| Other common stock activity | — |
| | — |
| | — |
| | (1 | ) | | — |
| | — |
| | (1 | ) |
| Balance at September 30, 2019 | $ | 689 |
| | 227 |
| | $ | 2 |
| | $ | 4,578 |
| | $ | 1,324 |
| | $ | (24 | ) | | $ | 6,569 |
|
| | | | | | | | | | | | | | |
E*TRADE Q1Q3 2019 10-Q | Page 4450
E*TRADE FINANCIAL CORPORATION CONDENSED CONSOLIDATED STATEMENT OF CASH FLOWS (In millions) (Unaudited) |
| | | | | | | |
| | Three Months Ended March 31, |
| | 2019 | | 2018 |
| Cash flows from financing activities: | | | |
| Increase in deposits | $ | 1,015 |
| | $ | 160 |
|
| Common stock dividends | (35 | ) | | — |
|
| Preferred stock dividends | (20 | ) | | (12 | ) |
| Net increase in advances from FHLB | 300 |
| | — |
|
| Repurchases of common stock | (120 | ) | | (140 | ) |
| Other | (15 | ) | | (17 | ) |
| Net cash provided by (used in) financing activities | 1,125 |
| | (9 | ) |
| Decrease in cash, cash equivalents and segregated cash | (2,144 | ) | | (833 | ) |
| Cash, cash equivalents and segregated cash, beginning of period | 3,344 |
| | 1,803 |
|
| Cash, cash equivalents and segregated cash, end of period | $ | 1,200 |
| | $ | 970 |
|
| | | | |
| Cash and equivalents, end of period | $ | 523 |
| | $ | 498 |
|
| Segregated cash, end of period | 677 |
| | 472 |
|
| Cash, cash equivalents and segregated cash, end of period | $ | 1,200 |
| | $ | 970 |
|
| | | | |
| Supplemental disclosures: | | | |
| Cash paid for interest | $ | 65 |
| | $ | 30 |
|
| Cash paid for income taxes, net of refunds | $ | 3 |
| | $ | 4 |
|
| Right-of-use assets recognized upon adoption of new lease standard | $ | 193 |
| | $ | — |
|
| Right-of-use assets obtained during the period | $ | 13 |
| | $ | — |
|
| Non-cash investing and financing activities: | | | |
| Transfers from loans to other real estate owned and repossessed assets | $ | 4 |
| | $ | 6 |
|
| Transfer of available-for-sale securities to held-to-maturity securities | $ | — |
| | $ | 1,161 |
|
| Transfer of held-to-maturity securities to available-for-sale securities | $ | — |
| | $ | 4,672 |
|
E*TRADE FINANCIAL CORPORATION CONDENSED CONSOLIDATED STATEMENT OF SHAREHOLDERS’ EQUITY (In millions) (Unaudited) |
| | | | | | | | | | | | | | | | | | | | | | | | | | |
| | Preferred Stock | | Common Stock | | Additional Paid-in Capital | | Retained Earnings (Accumulated Deficit) | | Accumulated Other Comprehensive Loss | | Total Shareholders’ Equity |
| | Amount | | Shares | | Amount | | | | |
| Balance at December 31, 2017 | $ | 689 |
| | 267 |
| | $ | 3 |
| | $ | 6,582 |
| | $ | (317 | ) | | $ | (26 | ) | | $ | 6,931 |
|
| Cumulative effect of hedge accounting adoption | — |
| | — |
| | — |
| | — |
| | 7 |
| | (7 | ) | | — |
|
| Reclassification of tax effects due to federal tax reform | — |
| | — |
| | — |
| | — |
| | 14 |
| | (14 | ) | | — |
|
| Net income | — |
| | — |
| | — |
| | — |
| | 247 |
| | — |
| | 247 |
|
| Other comprehensive loss | — |
| | — |
| | — |
| | — |
| | — |
| | (129 | ) | | (129 | ) |
| Preferred stock dividends - Series A ($29.38 per share) | — |
| | — |
| | — |
| | — |
| | (12 | ) | | — |
| | (12 | ) |
| Repurchases of common stock | — |
| | (3 | ) | | — |
| | (140 | ) | | — |
| | — |
| | (140 | ) |
| Share-based compensation | — |
| | — |
| | — |
| | 10 |
| | — |
| | — |
| | 10 |
|
| Other common stock activity | — |
| | 1 |
| | — |
| | (18 | ) | | — |
| | — |
| | (18 | ) |
| Balance at March 31, 2018 | $ | 689 |
| | 265 |
| | $ | 3 |
| | $ | 6,434 |
| | $ | (61 | ) | | $ | (176 | ) | | $ | 6,889 |
|
| Net income | — |
| | — |
| | — |
| | — |
| | 250 |
| | — |
| | 250 |
|
| Other comprehensive loss | — |
| | — |
| | — |
| | — |
| | — |
| | (59 | ) | | (59 | ) |
| Repurchases of common stock | — |
| | (3 | ) | | — |
| | (189 | ) | | — |
| | — |
| | (189 | ) |
| Share-based compensation | — |
| | — |
| | — |
| | 12 |
| | — |
| | — |
| | 12 |
|
| Balance at June 30, 2018 | $ | 689 |
| | 262 |
| | $ | 3 |
| | $ | 6,257 |
| | $ | 189 |
| | $ | (235 | ) | | $ | 6,903 |
|
| Net income | — |
| | — |
| | — |
| | — |
| | 285 |
| | — |
| | 285 |
|
| Other comprehensive loss | — |
| | — |
| | — |
| | — |
| | — |
| | (94 | ) | | (94 | ) |
| Preferred stock dividends - Series A ($29.38 per share) | — |
| | — |
| | — |
| | — |
| | (12 | ) | | — |
| | (12 | ) |
| Preferred stock dividends - Series B ($4,107.50 per share) | — |
| | — |
| | — |
| | — |
| | (12 | ) | | — |
| | (12 | ) |
| Repurchases of common stock | — |
| | (5 | ) | | — |
| | (309 | ) | | — |
| | — |
| | (309 | ) |
| Share-based compensation | — |
| | — |
| | — |
| | 13 |
| | — |
| | — |
| | 13 |
|
| Other common stock activity | — |
| | — |
| | — |
| | (8 | ) | | — |
| | — |
| | (8 | ) |
| Balance at September 30, 2018 | $ | 689 |
| | 257 |
| | $ | 3 |
| | $ | 5,953 |
| | $ | 450 |
| | $ | (329 | ) | | $ | 6,766 |
|
See accompanying notes to the condensed consolidated financial statements (unaudited)
E*TRADE Q3 2019 10-Q | Page 51
E*TRADE FINANCIAL CORPORATION CONDENSED CONSOLIDATED STATEMENT OF CASH FLOWS (In millions) (Unaudited) |
| | | | | | | |
| | Nine Months Ended September 30, |
| | 2019 | | 2018 |
| Cash flows from operating activities: | | | |
| Net income | $ | 783 |
| | $ | 782 |
|
| Adjustments to reconcile net income to net cash provided by operating activities: | | | |
| Provision (benefit) for loan losses | (32 | ) | | (74 | ) |
| Depreciation and amortization (including amortization and accretion on investment securities) | 168 |
| | 192 |
|
| (Gains) losses on securities and other, net | 37 |
| | (42 | ) |
| Losses on early extinguishment of debt | — |
| | 4 |
|
| Share-based compensation | 38 |
| | 35 |
|
| Deferred tax expense | 206 |
| | 253 |
|
| Other | (1 | ) | | 10 |
|
| Net effect of changes in assets and liabilities: | | | |
| (Increase) decrease in receivables from brokers, dealers and clearing organizations | (278 | ) | | 392 |
|
| Increase in margin receivables | (299 | ) | | (2,113 | ) |
| (Increase) decrease in other assets | (189 | ) | | 349 |
|
| Increase in payables to brokers, dealers and clearing organizations | 143 |
| | 303 |
|
| Increase in customer payables | 1,066 |
| | 1,085 |
|
| (Decrease) increase in other liabilities | (673 | ) | | 47 |
|
| Net cash provided by operating activities | 969 |
| | 1,223 |
|
| Cash flows from investing activities: | | | |
| Purchases of available-for-sale securities | (7,456 | ) | | (6,966 | ) |
| Proceeds from sales of available-for-sale securities | 9,720 |
| | 6,293 |
|
| Proceeds from maturities of and principal payments on available-for-sale securities | 1,174 |
| | 1,555 |
|
| Purchases of held-to-maturity securities | (3,860 | ) | | (3,684 | ) |
| Proceeds from maturities of and principal payments on held-to-maturity securities | 4,176 |
| | 1,781 |
|
| Proceeds from sales of loans | — |
| | 30 |
|
| Decrease in loans receivable | 376 |
| | 451 |
|
| Capital expenditures for property and equipment | (117 | ) | | (78 | ) |
| Net increase in securities purchased under agreements to resell | (250 | ) | | — |
|
| Proceeds from sale of real estate owned and repossessed assets | 10 |
| | 19 |
|
| Acquisitions, net of cash acquired | — |
| | (36 | ) |
| Net cash flow from derivative contracts | (196 | ) | | 200 |
|
| Other | (28 | ) | | (32 | ) |
| Net cash provided by (used in) investing activities | 3,549 |
| | (467 | ) |
| | | | |
E*TRADE Q3 2019 10-Q | Page 52
E*TRADE FINANCIAL CORPORATION CONDENSED CONSOLIDATED STATEMENT OF CASH FLOWS (In millions) (Unaudited) |
| | | | | | | |
| | Nine Months Ended September 30, |
| | 2019 | | 2018 |
| Cash flows from financing activities: | | | |
| Decrease in deposits | $ | (4,931 | ) | | $ | (458 | ) |
| Common stock dividends | (103 | ) | | — |
|
| Preferred stock dividends | (40 | ) | | (36 | ) |
| Net increase in advances from FHLB | — |
| | 50 |
|
| Proceeds from issuance of senior notes | — |
| | 420 |
|
| Payments on trust preferred securities | — |
| | (413 | ) |
| Repurchases of common stock | (908 | ) | | (638 | ) |
| Other | (22 | ) | | (32 | ) |
| Net cash used in financing activities | (6,004 | ) | | (1,107 | ) |
| Decrease in cash, cash equivalents and segregated cash | (1,486 | ) | | (351 | ) |
| Cash, cash equivalents and segregated cash, beginning of period | 3,344 |
| | 1,803 |
|
| Cash, cash equivalents and segregated cash, end of period | $ | 1,858 |
| | $ | 1,452 |
|
| | | | |
| Cash and equivalents, end of period | $ | 493 |
| | $ | 596 |
|
| Segregated cash, end of period | 1,365 |
| | 856 |
|
| Cash, cash equivalents and segregated cash, end of period | $ | 1,858 |
| | $ | 1,452 |
|
| | | | |
| Supplemental disclosures: | | | |
| Cash paid for interest | $ | 199 |
| | $ | 106 |
|
| Cash paid for income taxes, net of refunds | $ | 52 |
| | $ | 9 |
|
| Right-of-use assets recognized upon adoption of new lease standard | $ | 193 |
| | $ | — |
|
| Right-of-use assets obtained during the period | $ | 36 |
| | $ | — |
|
| Non-cash investing and financing activities: | | | |
| Transfers from loans to other real estate owned and repossessed assets | $ | 13 |
| | $ | 13 |
|
| Transfer of available-for-sale securities to held-to-maturity securities | $ | — |
| | $ | 1,161 |
|
| Transfer of held-to-maturity securities to available-for-sale securities | $ | — |
| | $ | 4,672 |
|
See accompanying notes to the condensed consolidated financial statements (unaudited)
E*TRADE Q1Q3 2019 10-Q | Page 4553
E*TRADE FINANCIAL CORPORATION
NOTES TO THE CONDENSED CONSOLIDATED FINANCIAL STATEMENTS (UNAUDITED)
|
|
| NOTE 1—ORGANIZATION, BASIS OF PRESENTATION AND SUMMARY OF SIGNIFICANT ACCOUNTING POLICIES |
Organization
E*TRADE Financial Corporation is a financial services company that provides brokerage and related products and services for traders, investors, stock plan administrators and participants, and RIAs. The Company also provides investor-focused banking products, including sweep deposit accounts insured by the FDIC, to customers. The Company's most significant, wholly-owned subsidiaries are described below:
E*TRADE Securities is a registered broker-dealer that clears and settles customer transactions
E*TRADE Bank is a federally chartered savings bank that provides FDIC insurance on certain qualifying amounts of customer deposits and provides other banking and cash management capabilities
E*TRADE Savings Bank, a subsidiary of E*TRADE Bank, is a federally chartered savings bank that provides FDIC insurance on certain qualifying amounts of customer deposits and provides custody solutions for RIAs
E*TRADE Financial Corporate Services is a provider of software and services for managing equity compensation plans to our corporate clients
E*TRADE Futures is a registered non-clearing FCM that provides retail futures transaction capabilities for our customers
E*TRADE Capital Management is an RIA that provides investment advisory services for our customers
Basis of Presentation
The condensed consolidated financial statements, also referred to herein as the consolidated financial statements, include the accounts of the Company and its majority-owned subsidiaries as determined under the voting interest model. Entities in which the Company has the ability to exercise significant influence but in which the Company does not possess control are generally accounted for by the equity method. Entities in which the Company does not have the ability to exercise significant influence are generally carried at cost. The Company also evaluates its initial and continuing involvement with certain entities to determine if the Company is required to consolidate the entities under the variable interest entity (VIE) model. This evaluation is based on a qualitative assessment of whether the Company is the primary beneficiary of a VIE, which requires the Company to possess both: 1) the power to direct the activities that most significantly impact the economic performance of the VIE; and 2) the obligation to absorb losses or the right to receive benefits of the VIE that could potentially be significant to the VIE. There are no investments in which the Company represents the primary beneficiary of a VIE; therefore, there are no consolidated VIEs included for all periods presented.
The Company's consolidated financial statements are prepared in accordance with GAAP. Intercompany accounts and transactions are eliminated in consolidation. These consolidated financial statements reflect all adjustments, which are normal and recurring in nature, necessary to present fairly the financial position,
E*TRADE Q1Q3 2019 10-Q | Page 4654
E*TRADE FINANCIAL CORPORATION
NOTES TO THE CONDENSED CONSOLIDATED FINANCIAL STATEMENTS (UNAUDITED)
results of operations and cash flows for the periods presented and should be read in conjunction with our 2018 Annual Report. Use of Estimates
Preparing the Company's consolidated financial statements in accordance with GAAP requires management to make estimates and assumptions that affect the amounts reported in the consolidated financial statements and related notes for the periods presented. Actual results could differ from management’s estimates. Certain significant accounting policies are critical because they are based on estimates and assumptions that require complex and subjective judgments by management including the allowance for loan losses, valuation and impairment of goodwill and acquired intangible assets, and income taxes. Management also makes estimates in recognizing accrued operating expenses and other liabilities. These liabilities are impacted by estimates for litigation and regulatory matters as well as estimates related to general operating expenses, such as incentive compensation and market data usage within communications expense. Management estimates reflect the liabilities deemed probable at the balance sheet date as determined as part of the Company's ongoing evaluations based on available information.
Adoption of New Accounting Standards
Accounting for Leases
In February 2016, the Financial Accounting Standards Board (FASB)FASB amended the guidance on accounting for leases. The new guidance required lessees to recognize right-of-use (ROU) assets and lease liabilities on the balance sheet for the rights and obligations created by all qualifying leases. The recognition, measurement and presentation of expenses and cash flows arising from a lease by a lessee remains substantially unchanged and depends on classification as a finance or operating lease. The Company adopted the new guidance beginning on January 1, 2019 and elected to use the effective date as the date of initial application. As such, restated financial information and the additional disclosures required under the new standard will not be provided for the comparative periods presented. The new guidance also requires quantitative and qualitative disclosures that provide information about the amounts related to leasing arrangements recorded in the consolidated financial statements. For further information, see Note 10—Lease Arrangements. The Company elected to apply the "package of practical expedients," which permits it to not to reassess prior conclusions on existing leases regarding lease identification, lease classification and initial direct costs. In addition, the Company has elected to apply the short-term lease exception for lease arrangements with maximum lease terms of 12 months or less. The Company elected to not to apply the use-of-hindsight practical expedient, and the practical expedient relating to land easements is not applicable. Adoption of the standard did not have a material impact on the Company’s results of operations or cash flows.
At adoption, the Company recognized lease liabilities of $211 million, representing the present value of the remaining minimum fixed lease payments based on the incremental borrowing rates as of December 31, 2018. Changes in lease liabilities are based on current period interest expense and cash payments. The Company also recognized ROU assets of $193 million at adoption, which represents the measurement of the lease liabilities, prepaid lease payments made to lessors, initial direct costs incurred by the Company and lease incentives received.
E*TRADE Q1Q3 2019 10-Q | Page 4755
E*TRADE FINANCIAL CORPORATION
NOTES TO THE CONDENSED CONSOLIDATED FINANCIAL STATEMENTS (UNAUDITED)
Inclusion of the Secured Overnight Financing Rate (SOFR) Overnight Index Swap (OIS) Rate as a Benchmark Interest Rate for Hedge Accounting Purposes
In October 2018, the FASB amended the guidance on hedge accounting. The amended guidance adds the OIS rate based on the SOFR to the list of permitted benchmark interest rates for hedge accounting purposes. The amended guidance became effective on January 1, 2019, and the Company adopted the guidance on a prospective basis for qualifying new or redesignated hedging relationships entered into on or after the date of adoption. The adoption did not have a material impact on the Company's financial condition, results of operations or cash flows.
New Accounting Standards Not Yet Adopted
Accounting for Credit Losses
In June 2016, the FASB amended the accounting guidance on accounting for credit losses. The FASBlosses and has subsequently issued clarifications and improvements. The amended guidance requires measurement of all expectedan allowance for credit losses for financial instruments, including loans and debt securities, and other commitments to extend credit held at the reporting date. For financial assets measured at amortized cost, factors such as historical experience,performance, current conditions, and reasonable and supportable forecasts, including expected charge-off recoveries, will be used to estimate expected credit losses. The amended guidance will also result in credit losses on impaired available-for-sale debt securities being recorded through an allowance for credit losses. The FASB issued additional amended guidance during the second quarter of 2019 that clarified that the CECL standard allows for subsequent increases in the fair value of collateral for collateral-dependent loans to be recognized up to the amount previously charged-off. A loan is considered to be collateral-dependent when foreclosure is probable or when repayment is expected to be provided substantially through the sale of the underlying collateral when the borrower is experiencing financial difficulty. Additional amended transition guidance issued during the second quarter of 2019 allows entities to elect the fair value option on certain financial instruments, on an instrument-by-instrument basis; however, this fair value option election does not apply to held-to-maturity debt securities. The new guidance will be effective for interim and annual periods beginning January 1, 2020. Early2020 and early adoption is permitted.
The Company has continued to make progress in developing credit loss estimation methods for the mortgage loan portfolio. The Company does not expect that credit losses for the investment security portfolio, margin receivables, securities-based lending activities and other financial assets held at amortized cost will be material based on its current analysis and industry views. As of September 30, 2019, the Company expects to recognize an after-tax benefit related to mortgage loans of approximately $75 to $100 million as an adjustment to opening retained earnings at adoption on January 1, 2020.
The expected benefit relates to the fair value of the underlying collateral for mortgage loans that were determined to be collateral-dependent and previously written down to the fair value of the underlying collateral. This adoption impact will be presented on the balance sheet as a “negative allowance” associated with these loans. When estimating the fair value of collateral, property valuations for these one- to four- family and home equity loans are based on the most recent "as is" property valuation data available, which may include appraisals, broker price opinions, automated valuation models or updated values using home price indices. These property valuations are then reduced for qualifying estimated costs to sell. These costs do not include carrying costs or other disallowed adjustments, such as estimates for prolonged foreclosure proceedings associated with certain jurisdictions.
E*TRADE Q3 2019 10-Q | Page 56
E*TRADE FINANCIAL CORPORATION
NOTES TO THE CONDENSED CONSOLIDATED FINANCIAL STATEMENTS (UNAUDITED)
The expected impact includes the expected credit losses related to the remainingmortgage loans. The Company employed a probability of default and loss given default model for determining the CECL allowance for these mortgage loans, which utilized prepayment forecasts, loan amortization calculations, and other internally derived and externally sourced data and assumptions. Key inputs for the forecast included US home prices and unemployment data. The CECL impact for this portfolio is currently evaluatingnot expected to be material based on the seasoning of the Company’s mortgage loan portfolio and the credit quality of the remaining loans. The Company utilized an externally provided macroeconomic forecast over the remaining life of the loans. This forecast includes a forward-looking view of macroeconomic factors over the next two to five years, after which the macroeconomic factors revert to externally provided long-term equilibrium values, rates, or patterns that do not include specific predictions for the economy.
The Company's focus for the remainder of 2019 will be the continued development and refinement of its credit loss estimation methods, the development of policies and procedures in support of implementation, testing and validation of credit loss estimation methods, and the completion of parallel runs of credit loss modeling. The Company's evaluation of the impact of the new accounting guidance on the Company's financial condition, results of operations and cash flows. The Company's evaluation contemplates the recent performance of the run-off legacy mortgage and consumer loan portfolio and the credit profile of the current investment securities portfolio; however, the impact of the new guidance will depend on the current and expected macroeconomic conditions and the nature and characteristics of financial assets held by the Company on the date of adoption.
Simplifying the Test for Goodwill Impairment
In January 2017, the FASB amended the guidance to simplify the test for goodwill impairment by eliminating Step 2 from the goodwill impairment test. The amended guidance requires the Company to perform its annual goodwill impairment test by comparing the fair value of a reporting unit with its carrying amount. An impairment charge shouldwould be recognized at the amount by which the carrying amount exceeds the fair value of the reporting unit; however, the loss recognized should not exceed the total amount of goodwill allocated to that reporting unit. Income tax effects resulting from any tax deductible goodwill should be considered when measuring the goodwill impairment loss, if applicable. The Company will still have the option to perform a qualitative assessment to conclude whether it is more likely than not that the carrying amount of the Company exceeds its fair value. The guidance will be effective for interim and annual periods beginning January 1, 2020, and must be applied prospectively. Early adoption is permitted.
E*TRADE Q1 2019 10-Q | Page 48
E*TRADE FINANCIAL CORPORATION
NOTES TO THE CONDENSED CONSOLIDATED FINANCIAL STATEMENTS (UNAUDITED)
Implementation Costs Incurred in a Cloud Computing Arrangement that is a Service Contract
In August 2018, the FASB amended the guidance on accounting for implementation costs incurred in a cloud computing arrangement that is a service contract. The amended guidance aligns the requirements for capitalizing implementation costs incurred in a hosting arrangement that is a service contract with the requirements for capitalizing implementation costs incurred to develop or obtain internal-use software. The new guidance will be effective for interim and annual periods beginning on January 1, 2020, and should be applied either retrospectively or prospectively. The Company will adopt prospectively and is currently evaluatingfinalizing modifications to the impact of the new accounting guidance on the Company's financial condition, results of operations and cash flows.processes necessary for adoption.
Codification Improvements Related to Credit Losses, Financial Instruments, Derivatives and Hedging
In April 2019, the FASB clarified recently released guidance related to credit losses, financial instruments, derivatives and hedging. The FASB has an ongoing project on its agenda for improving the FASB's Accounting Standards Codification or correcting its unintended application. These clarifications are similar to the items in the FASB's projectThe guidance will be effective
E*TRADE Q3 2019 10-Q | Page 57
E*TRADE FINANCIAL CORPORATION
NOTES TO THE CONDENSED CONSOLIDATED FINANCIAL STATEMENTS (UNAUDITED)
for interim and are therefore not expected to have a significant effect on the Company's current accounting practices. Certain clarifications may be effective for the Company as early as the second quarter of 2019.annual periods beginning January 1, 2020. The Company is currently evaluating the impact of these clarifications on the Company's financial condition, results of operations and cash flows.
The following table presents the significant components of total net revenue (dollars in millions): | | | | Three Months Ended March 31, | Three Months Ended September 30, | | Nine Months Ended September 30, |
| | 2019 | | 2018 | 2019 | | 2018 | | 2019 | | 2018 |
| Net interest income | $ | 492 |
| | $ | 445 |
| $ | 455 |
| | $ | 466 |
| | $ | 1,437 |
| | $ | 1,364 |
|
| Commissions | 122 |
| | 137 |
| 122 |
| | 117 |
| | 365 |
| | 375 |
|
| Fees and service charges | 118 |
| | 105 |
| 163 |
| | 108 |
| | 407 |
| | 323 |
|
| Gains on securities and other, net | 11 |
| | 10 |
| |
| Gains (losses) on securities and other, net | | 16 |
| | 17 |
| | (37 | ) | | 42 |
|
| Other revenue | 12 |
| | 11 |
| 11 |
| | 12 |
| | 35 |
| | 34 |
|
Total net revenue (1) | $ | 755 |
| | $ | 708 |
| $ | 767 |
| | $ | 720 |
| | $ | 2,207 |
| | $ | 2,138 |
|
| |
| (1) | Contract balances and transaction price allocated to remaining performance obligations were not material.material for the periods presented. |
In October 2019, we announced the elimination of retail commissions for online US listed stock, ETF, and options trades. We also reduced the options contract charge to $0.65 per contract for all traders while maintaining our active trader pricing at $0.50 per contract.
E*TRADE Q1Q3 2019 10-Q | Page 4958
E*TRADE FINANCIAL CORPORATION
NOTES TO THE CONDENSED CONSOLIDATED FINANCIAL STATEMENTS (UNAUDITED)
Interest Income and Interest Expense
The following table presents the significant components of interest income and interest expense (dollars in millions): | | | | Three Months Ended March 31, | Three Months Ended September 30, | | Nine Months Ended September 30, |
| | 2019 | | 2018 | 2019 | | 2018 | | 2019 | | 2018 |
| Interest income: | | | | | | | | | | |
| Cash and equivalents | $ | 3 |
| | $ | 3 |
| $ | 2 |
| | $ | 2 |
| | $ | 8 |
| | $ | 7 |
|
| Cash segregated under federal or other regulations | 6 |
| | 3 |
| 7 |
| | 4 |
| | 19 |
| | 11 |
|
| Investment securities | 365 |
| | 290 |
| 324 |
| | 315 |
| | 1,057 |
| | 908 |
|
| Margin receivables | 126 |
| | 103 |
| 120 |
| | 130 |
| | 376 |
| | 351 |
|
| Loans | 28 |
| | 33 |
| 25 |
| | 32 |
| | 81 |
| | 98 |
|
| Broker-related receivables and other | 4 |
| | 4 |
| 5 |
| | 4 |
| | 12 |
| | 12 |
|
| Subtotal interest income | 532 |
| | 436 |
| 483 |
| | 487 |
| | 1,553 |
| | 1,387 |
|
Other interest revenue(1) | 23 |
| | 32 |
| 38 |
| | 27 |
| | 83 |
| | 84 |
|
| Total interest income | 555 |
| | 468 |
| 521 |
| | 514 |
| | 1,636 |
| | 1,471 |
|
| Interest expense: | | | | | | | | | | |
| Deposits | 35 |
| | 2 |
| |
| Sweep deposits | | 11 |
| | 14 |
| | 49 |
| | 23 |
|
| Savings deposits | | 27 |
| | 2 |
| | 65 |
| | 3 |
|
| Customer payables | 9 |
| | 1 |
| 7 |
| | 8 |
| | 24 |
| | 13 |
|
| Broker-related payables and other | 1 |
| | 1 |
| 2 |
| | 3 |
| | 4 |
| | 7 |
|
| Other borrowings | 2 |
| | 7 |
| 1 |
| | 6 |
| | 7 |
| | 21 |
|
| Corporate debt | 14 |
| | 9 |
| 14 |
| | 13 |
| | 42 |
| | 32 |
|
| Subtotal interest expense | 61 |
| | 20 |
| 62 |
|
| 46 |
| | 191 |
| | 99 |
|
Other interest expense(2) | 2 |
| | 3 |
| 4 |
| | 2 |
| | 8 |
| | 8 |
|
| Total interest expense | 63 |
| | 23 |
| 66 |
| | 48 |
| | 199 |
| | 107 |
|
| Net interest income | $ | 492 |
| | $ | 445 |
| $ | 455 |
| | $ | 466 |
| | $ | 1,437 |
| | $ | 1,364 |
|
| |
| (1) | RepresentsOther interest incomerevenue is earned on certain securities loaned.loaned balances. Interest expense incurred on other securities loaned balances is presented on the broker-related payables and other line item above. |
| |
| (2) | RepresentsOther interest expense is incurred on certain securities borrowed.borrowed balances. Interest income earned on other securities borrowed balances is presented on the broker-related receivables and other line item above. |
Fees and Service Charges
The following table presents the significant components of fees and service charges revenue (dollars in millions): |
| | | | | | | |
| | Three Months Ended March 31, |
| | 2019 | | 2018 |
| Fees and service charges: | | | |
| Order flow revenue | $ | 43 |
| | $ | 47 |
|
| Money market funds and sweep deposits revenue | 21 |
| | 17 |
|
| Advisor management and custody fees | 18 |
| | 11 |
|
| Mutual fund service fees | 12 |
| | 11 |
|
| Foreign exchange revenue | 8 |
| | 8 |
|
| Reorganization fees | 6 |
| | 3 |
|
| Other fees and service charges | 10 |
| | 8 |
|
| Total fees and service charges | $ | 118 |
| | $ | 105 |
|
E*TRADE Q1Q3 2019 10-Q | Page 5059
E*TRADE FINANCIAL CORPORATION
NOTES TO THE CONDENSED CONSOLIDATED FINANCIAL STATEMENTS (UNAUDITED)
Fees and Service Charges
The following table presents the significant components of fees and service charges (dollars in millions): |
| | | | | | | | | | | | | | | |
| | Three Months Ended September 30, | | Nine Months Ended September 30, |
| | 2019 | | 2018 | | 2019 | | 2018 |
| Fees and service charges: | | | | | | | |
| Money market funds and sweep deposits revenue | $ | 62 |
| | $ | 18 |
| | $ | 106 |
| | $ | 53 |
|
| Order flow revenue | 46 |
| | 40 |
| | 134 |
| | 130 |
|
| Advisor management and custody fees | 19 |
| | 19 |
| | 56 |
| | 46 |
|
| Mutual fund service fees | 13 |
| | 13 |
| | 38 |
| | 36 |
|
| Foreign exchange revenue | 8 |
| | 7 |
| | 24 |
| | 21 |
|
| Reorganization fees | 5 |
| | 3 |
| | 18 |
| | 10 |
|
| Other fees and service charges | 10 |
| | 8 |
| | 31 |
| | 27 |
|
| Total fees and service charges | $ | 163 |
| | $ | 108 |
| | $ | 407 |
| | $ | 323 |
|
|
|
| NOTE 3—FAIR VALUE DISCLOSURES |
Fair value is defined as the price that would be received to sell an asset or paid to transfer a liability in an orderly transaction between market participants at the measurement date. In determining fair value, the Company may use various valuation approaches, including market, income and/or cost approaches. The fair value hierarchy requires the Company to maximize the use of observable inputs and minimize the use of unobservable inputs when measuring fair value. Fair value is a market-based measure considered from the perspective of a market participant. Accordingly, even when market assumptions are not readily available, the Company’s own assumptions reflect those that market participants would use in pricing the asset or liability at the measurement date. The fair value measurement accounting guidance describes the following three levels used to classify fair value measurements:
Level 1 - unadjusted quoted prices in active markets for identical assets or liabilities that are accessible by the Company
Level 2 - quoted prices for similar assets and liabilities in an active market, quoted prices in markets that are not active or for which all significant inputs are observable, either directly or indirectly
Level 3 - unobservable inputs that are significant to the fair value of the assets or liabilities
The availability of observable inputs can vary and in certain cases, the inputs used to measure fair value may fall into different levels of the fair value hierarchy. In such cases, the level within the fair value hierarchy is based on the lowest level of input that is significant to the fair value measurement. The Company’s assessment of the significance of a particular input to a fair value measurement requires judgment and consideration of factors specific to the asset or liability.
E*TRADE Q3 2019 10-Q | Page 60
E*TRADE FINANCIAL CORPORATION
NOTES TO THE CONDENSED CONSOLIDATED FINANCIAL STATEMENTS (UNAUDITED)
Recurring Fair Value Measurement Techniques
Agency-backedAgency Debt and Mortgage-backed Securities
The Company’s agency mortgage-backed securities portfolio is comprised of debt securities which are guaranteed by US government sponsored enterprises and federal agencies. The fair value of agency mortgage-backed securities was determined using a market approach with quoted market prices, recent transactions and spread data for identical or similar instruments. Agency mortgage-backed securities were categorized in Level 2 of the fair value hierarchy.
The fair value measurements of agency debentures and other agency debt securities were determined using market and income approaches along with the Company’s own trading activities for identical or similar instruments and were categorized in Level 2 of the fair value hierarchy.
US Treasuries
The Company's fair value level classification of US Treasuries is based on the original maturity dates of the securities and whether the securities are the most recent issuances of a given maturity. US Treasuries with original maturities less than one year are classified as Level 1. US Treasuries with original maturities greater than one year are classified as Level 1 if they represent the most recent issuance of a given maturity; otherwise, these securities are classified as Level 2.
E*TRADE Q1 2019 10-Q | Page 51
E*TRADE FINANCIAL CORPORATION
NOTES TO THE CONDENSED CONSOLIDATED FINANCIAL STATEMENTS (UNAUDITED)
Non-agency Debt Securities
The Company's non-agency debt securities include senior classes of commercial mortgage-backed securities and asset-backed securities collateralized by credit card, automobile loan and student loan receivables. The fair value of non-agency debt securities was determined using a market approach with recent transactions and spread data for identical or similar instruments. Non-agency debt securities were categorized in Level 2 of the fair value hierarchy.
The Company sold its municipal bonds during the three months ended March 31, 2019. As of December 31, 2018, these securities were valued using a market approach with pricing service valuations corroborated by recent market transactions for identical or similar bonds and were categorized in Level 2 of the fair value hierarchy.
Publicly Traded Equity Securities
The fair value measurements of the Company's publicly traded equity securities were classified as Level 1 of the fair value hierarchy as they were based on quoted prices in active markets.
Nonrecurring Fair Value Measurement Techniques
Certain other assets are recorded at fair value on a nonrecurring basis: 1) one- to four-family and home equity loans in which the amount of the loan balance in excess of the estimated current value of the underlying property less estimated selling costs has been charged-off; and 2) real estate owned that is carried at the lower of the property’s carrying value or fair value less estimated selling costs.
E*TRADE Q3 2019 10-Q | Page 61
E*TRADE FINANCIAL CORPORATION
NOTES TO THE CONDENSED CONSOLIDATED FINANCIAL STATEMENTS (UNAUDITED)
Loans Receivable
Loans that have been delinquent for 180 days or that are in bankruptcy and certain troubled debt restructuring (TDR) loan modifications are charged-off based on the estimated current value of the underlying property less estimated selling costs. Property valuations for these one- to four-family and home equity loans are based on the most recent "as is" property valuation data available, which may include appraisals, broker price opinions, automated valuation models or updated values using home price indices.
E*TRADE Q1 2019 10-Q | Page 52
E*TRADE FINANCIAL CORPORATION
NOTES TO THE CONDENSED CONSOLIDATED FINANCIAL STATEMENTS (UNAUDITED)
Real Estate Owned
Property valuations for real estate owned are based on the lowest value of the most recent property valuation data available, which may include appraisals, listing prices or approved offer prices. Nonrecurring fair value measurements on one- to four-family loans, home equity loans and real estate owned were classified as Level 3 of the fair value hierarchy as the valuations included unobservable inputs that were significant to the fair value. The following table presents additional information about significant unobservable inputs used in the valuation of assets measured at fair value on a nonrecurring basis that were categorized in Level 3 of the fair value hierarchy: | | | | Unobservable Inputs | | Average | | Range | Unobservable Inputs | | Average | | Range |
| March 31, 2019: | | | | |
| September 30, 2019: | | | | |
| Loans receivable: | | | | | | |
| One- to four-family | Appraised value | | $ | 478,300 |
| | $42,000 - $1,175,000 | Appraised value | | $ | 742,000 |
| | $92,000 - $2,700,000 |
| Home equity | Appraised value | | $ | 411,600 |
| | $42,500 - $919,000 | Appraised value | | $ | 405,200 |
| | $115,000 - $1,440,000 |
| Real estate owned | Appraised value | | $ | 337,300 |
| | $47,500 - $1,500,000 | Appraised value | | $ | 387,500 |
| | $30,000 - $1,050,000 |
| | | | | | | |
| December 31, 2018: | | | | | | |
| Loans receivable: | | | | | | |
| One- to four-family | Appraised value | | $ | 594,700 |
| | $17,000 - $2,000,000 | Appraised value | | $ | 594,700 |
| | $17,000 - $2,000,000 |
| Home equity | Appraised value | | $ | 397,700 |
| | $73,000 - $1,060,000 | Appraised value | | $ | 397,700 |
| | $73,000 - $1,060,000 |
| Real estate owned | Appraised value | | $ | 329,500 |
| | $57,900 - $900,000 | Appraised value | | $ | 329,500 |
| | $57,900 - $900,000 |
E*TRADE Q1Q3 2019 10-Q | Page 5362
E*TRADE FINANCIAL CORPORATION
NOTES TO THE CONDENSED CONSOLIDATED FINANCIAL STATEMENTS (UNAUDITED)
Recurring and Nonrecurring Fair Value Measurements
The following tables present the significant components of assets and liabilities measured at fair value (dollars in millions): | | | | Level 1 | | Level 2 | | Level 3 | | Total Fair Value | Level 1 | | Level 2 | | Level 3 | | Total Fair Value |
| March 31, 2019: | | | | | | | | |
| September 30, 2019: | | | | | | | | |
| Recurring fair value measurements: | | | | | | | | | | | | | | |
| Assets | | | | | | | | | | | | | | |
| Available-for-sale securities: | | | | | | | | | | | | | | |
| Agency mortgage-backed securities | $ | — |
| | $ | 23,423 |
| | $ | — |
| | $ | 23,423 |
| $ | — |
| | $ | 18,514 |
| | $ | — |
| | $ | 18,514 |
|
| Agency debentures | — |
| | 873 |
| | — |
| | 873 |
| — |
| | 673 |
| | — |
| | 673 |
|
| US Treasuries | — |
| | 438 |
| | — |
| | 438 |
| — |
| | 1,349 |
| | — |
| | 1,349 |
|
| Non-agency asset-backed securities | — |
| | 90 |
| | — |
| | 90 |
| — |
| | 369 |
| | — |
| | 369 |
|
| Other agency debt securities | — |
| | 81 |
| | — |
| | 81 |
| |
| Non-agency mortgage-backed securities | — |
| | 65 |
| | — |
| | 65 |
| — |
| | 114 |
| | — |
| | 114 |
|
| Other | — |
| | 1 |
| | — |
| | 1 |
| — |
| | 1 |
| | — |
| | 1 |
|
| Total available-for-sale securities | — |
| | 24,971 |
| | — |
| | 24,971 |
| — |
| | 21,020 |
| | — |
| | 21,020 |
|
Publicly traded equity securities(1) | 7 |
| | — |
| | — |
| | 7 |
| 7 |
| | — |
| | — |
| | 7 |
|
Total assets measured at fair value on a recurring basis(2) | $ | 7 |
| | $ | 24,971 |
| | $ | — |
| | $ | 24,978 |
| $ | 7 |
| | $ | 21,020 |
| | $ | — |
| | $ | 21,027 |
|
| Liabilities | | | | | | | | |
| Other liabilities: | | | | | | | | |
Derivative liabilities(3) | $ | — |
| | $ | 2 |
| | $ | — |
| | $ | 2 |
| |
| Total liabilities measured at fair value on a recurring basis | $ | — |
| | $ | 2 |
| | $ | — |
| | $ | 2 |
| |
| Nonrecurring fair value measurements: | | | | | | | | | | | | | | |
| Loans receivable, net: | | | | | | | | | | | | | | |
| One- to four-family | $ | — |
| | $ | — |
| | $ | 4 |
| | $ | 4 |
| $ | — |
| | $ | — |
| | $ | 13 |
| | $ | 13 |
|
| Home equity | — |
| | — |
| | 2 |
| | 2 |
| — |
| | — |
| | 4 |
| | 4 |
|
| Total loans receivable | — |
| | — |
| | 6 |
| | 6 |
| — |
| | — |
| | 17 |
| | 17 |
|
| Other assets: | | | | | | | | | | | | | | |
| Real estate owned | — |
| | — |
| | 7 |
| | 7 |
| — |
| | — |
| | 12 |
| | 12 |
|
Total assets measured at fair value on a nonrecurring basis(4) | $ | — |
| | $ | — |
| | $ | 13 |
| | $ | 13 |
| |
Total assets measured at fair value on a nonrecurring basis(3) | | $ | — |
| | $ | — |
| | $ | 29 |
| | $ | 29 |
|
| |
| (1) | Consists of investments in a mutual fund related to the Community Reinvestment Act (CRA). |
| |
| (2) | Assets measured at fair value on a recurring basis represented 37%34% of the Company’s total assets at March 31,September 30, 2019. |
| |
| (3) | All derivative liabilities were interest rate contracts at March 31, 2019. Information related to derivative instruments is detailed in Note 7—Derivative Instruments and Hedging Activities.
|
| |
(4) | Represents the fair value of assets prior to deducting estimated selling costs that were carried on the consolidated balance sheet at March 31,September 30, 2019, and for which a fair value measurement was recorded during the period. |
E*TRADE Q1Q3 2019 10-Q | Page 5463
E*TRADE FINANCIAL CORPORATION
NOTES TO THE CONDENSED CONSOLIDATED FINANCIAL STATEMENTS (UNAUDITED)
|
| | | | | | | | | | | | | | | |
| | Level 1 | | Level 2 | | Level 3 | | Total
Fair Value |
| December 31, 2018: | | | | | | | |
| Recurring fair value measurements: | | | | | | | |
| Assets | | | | | | | |
| Available-for-sale securities: | | | | | | | |
| Agency mortgage-backed securities | $ | — |
| | $ | 22,162 |
| | $ | — |
| | $ | 22,162 |
|
| Agency debentures | — |
| | 839 |
| | — |
| | 839 |
|
| Agency debt securities | — |
| | 139 |
| | — |
| | 139 |
|
| Municipal bonds | — |
| | 12 |
| | — |
| | 12 |
|
| Other | — |
| | 1 |
| | — |
| | 1 |
|
| Total available-for-sale securities | — |
| | 23,153 |
| | — |
| | 23,153 |
|
Derivative assets(1) | — |
| | 1 |
| | — |
| | 1 |
|
Publicly traded equity securities(2) | 7 |
| | — |
| | — |
| | 7 |
|
Total assets measured at fair value on a recurring basis(3) | $ | 7 |
| | $ | 23,154 |
| | $ | — |
| | $ | 23,161 |
|
| Nonrecurring fair value measurements: | | | | | | | |
| Loans receivable, net: | | | | | | | |
| One- to four-family | $ | — |
| | $ | — |
| | $ | 17 |
| | $ | 17 |
|
| Home equity | — |
| | — |
| | 6 |
| | 6 |
|
| Total loans receivable | — |
| | — |
| | 23 |
| | 23 |
|
| Other assets: | | | | | | | |
| Real estate owned | — |
| | — |
| | 10 |
| | 10 |
|
Total assets measured at fair value on a nonrecurring basis(4) | $ | — |
| | $ | — |
| | $ | 33 |
| | $ | 33 |
|
| |
| (1) | All derivative assets were interest rate contracts at December 31, 2018. Information related to derivative instruments is detailed in Note 7—Derivative Instruments and Hedging Activities. |
| |
| (2) | Consists of investments in a mutual fund related to the CRA. At December 31, 2018, these equity securities are included in other assets on the consolidated balance sheet as a result of the adoption of amended accounting guidance. |
| |
| (3) | Assets measured at fair value on a recurring basis represented 36% of the Company’s total assets at December 31, 2018. |
| |
| (4) | Represents the fair value of assets prior to deducting estimated selling costs that were carried on the consolidated balance sheet at December 31, 2018, and for which a fair value measurement was recorded during the period. |
The following table presents (gains)Gains and losses recognized on assets measured at fair value on a nonrecurring basis (dollars in millions): |
| | | | | | | |
| | Three Months Ended March 31, |
| | 2019 | | 2018 |
| One- to four-family | $ | 1 |
| | $ | 1 |
|
| Home equity | (1 | ) | | — |
|
| Total losses on loans receivable measured at fair value | $ | — |
| | $ | 1 |
|
| Gain on real estate owned measured at fair value | $ | (1 | ) | | $ | — |
|
Recurring Fair Value Measurements Categorized within Level 3
For the periods presented, no assets or liabilities measured at fair value on a recurring basis were categorized within Level 3 of the fair value hierarchy. The Company had no transfers between levels during the periods presented.
E*TRADE Q1Q3 2019 10-Q | Page 5564
E*TRADE FINANCIAL CORPORATION
NOTES TO THE CONDENSED CONSOLIDATED FINANCIAL STATEMENTS (UNAUDITED)
Fair Value of Financial Instruments Not Carried at Fair Value
The following tables present the carrying values, fair values and fair value hierarchy level classification of financial instruments that are not carried at fair value on the consolidated balance sheet (dollars in millions): | | | | March 31, 2019 | September 30, 2019 |
| | Carrying Value | | Level 1 | | Level 2 | | Level 3 | | Total Fair Value | Carrying Value | | Level 1 | | Level 2 | | Level 3 | | Total Fair Value |
| Assets | | | | | | | | | | | | | | | | | | |
| Cash and equivalents | $ | 523 |
| | $ | 523 |
| | $ | — |
| | $ | — |
| | $ | 523 |
| $ | 493 |
| | $ | 493 |
| | $ | — |
| | $ | — |
| | $ | 493 |
|
| Cash segregated under federal or other regulations | $ | 677 |
| | $ | 677 |
| | $ | — |
| | $ | — |
| | $ | 677 |
| $ | 1,365 |
| | $ | 1,365 |
| | $ | — |
| | $ | — |
| | $ | 1,365 |
|
| Held-to-maturity securities: | | | | | | | | | | | | | | | | | | |
| Agency mortgage-backed securities | $ | 20,337 |
| | $ | — |
| | $ | 20,251 |
| | $ | — |
| | $ | 20,251 |
| $ | 19,563 |
| | $ | — |
| | $ | 19,880 |
| | $ | — |
| | $ | 19,880 |
|
| Agency debentures | 1,745 |
| | — |
| | 1,742 |
| | — |
| | 1,742 |
| 327 |
| | — |
| | 333 |
| | — |
| | 333 |
|
| Agency debt securities | 1,845 |
| | — |
| | 1,831 |
| | — |
| | 1,831 |
| 1,652 |
| | — |
| | 1,699 |
| | — |
| | 1,699 |
|
| Total held-to-maturity securities | $ | 23,927 |
| | $ | — |
| | $ | 23,824 |
| | $ | — |
| | $ | 23,824 |
| $ | 21,542 |
| | $ | — |
| | $ | 21,912 |
| | $ | — |
| | $ | 21,912 |
|
Margin receivables(1) | $ | 10,267 |
| | $ | — |
| | $ | 10,267 |
| | $ | — |
| | $ | 10,267 |
| $ | 9,859 |
| | $ | — |
| | $ | 9,859 |
| | $ | — |
| | $ | 9,859 |
|
| Loans receivable, net: | | | | | | | | | | | | | | | | | | |
| One- to four-family | $ | 1,000 |
| | $ | — |
| | $ | — |
| | $ | 1,038 |
| | $ | 1,038 |
| $ | 860 |
| | $ | — |
| | $ | — |
| | $ | 897 |
| | $ | 897 |
|
| Home equity | 764 |
| | — |
| | — |
| | 789 |
| | 789 |
| 661 |
| | — |
| | — |
| | 701 |
| | 701 |
|
| Consumer | 104 |
| | — |
| | — |
| | 104 |
| | 104 |
| 84 |
| | — |
| | — |
| | 83 |
| | 83 |
|
| Securities-based lending | 97 |
| | — |
| | 97 |
| | — |
| | 97 |
| 142 |
| | — |
| | 142 |
| | — |
| | 142 |
|
Total loans receivable, net(2) | $ | 1,965 |
|
| $ | — |
| | $ | 97 |
| | $ | 1,931 |
| | $ | 2,028 |
| $ | 1,747 |
|
| $ | — |
| | $ | 142 |
| | $ | 1,681 |
| | $ | 1,823 |
|
Receivables from brokers, dealers and clearing organizations(1) | $ | 597 |
| | $ | — |
| | $ | 597 |
| | $ | — |
| | $ | 597 |
| $ | 1,038 |
| | $ | — |
| | $ | 1,038 |
| | $ | — |
| | $ | 1,038 |
|
Other assets(1)(3) | $ | 50 |
| | $ | — |
| | $ | 50 |
| | $ | — |
| | $ | 50 |
| $ | 357 |
| | $ | — |
| | $ | 357 |
| | $ | — |
| | $ | 357 |
|
| Liabilities | | | | | | | | | | | | | | | | | | |
| Deposits | $ | 46,328 |
| | $ | — |
| | $ | 46,328 |
| | $ | — |
| | $ | 46,328 |
| $ | 40,382 |
| | $ | — |
| | $ | 40,382 |
| | $ | — |
| | $ | 40,382 |
|
| Customer payables | $ | 10,600 |
| | $ | — |
| | $ | 10,600 |
| | $ | — |
| | $ | 10,600 |
| $ | 11,183 |
| | $ | — |
| | $ | 11,183 |
| | $ | — |
| | $ | 11,183 |
|
| Payables to brokers, dealers and clearing organizations | $ | 1,162 |
| | $ | — |
| | $ | 1,162 |
| | $ | — |
| | $ | 1,162 |
| $ | 1,091 |
| | $ | — |
| | $ | 1,091 |
| | $ | — |
| | $ | 1,091 |
|
| Other borrowings | $ | 300 |
| | $ | — |
| | $ | 300 |
| | $ | — |
| | $ | 300 |
| |
| Corporate debt | $ | 1,409 |
| | $ | — |
| | $ | 1,413 |
| | $ | — |
| | $ | 1,413 |
| $ | 1,410 |
| | $ | — |
| | $ | 1,484 |
| | $ | — |
| | $ | 1,484 |
|
| |
| (1) | The fair value of securities that the Company received as collateral in connection with margin receivables and securities borrowing activities, including the fully paid lending program, where the Company is permitted to sell or re-pledge the securities, was $13.9$14.0 billion at March 31,September 30, 2019. Of this amount, $2.3 billion had been pledged or sold in connection with securities loaned and deposits with clearing organizations at March 31,September 30, 2019. |
| |
| (2) | The carrying value of loans receivable, net includes the allowance for loan losses of $32$27 million and loans that are recorded at fair value on a nonrecurring basis at March 31,September 30, 2019. |
| |
| (3) | The $50Includes $250 million in other assets at March 31, 2019 representsof securities purchased under agreements to resell and $107 million of securities borrowing from customers under the fully paid lending program. The fair value of the securities that the Company received as collateral for securities purchased under agreements to resell was $258 million at September 30, 2019. |
E*TRADE Q1Q3 2019 10-Q | Page 5665
E*TRADE FINANCIAL CORPORATION
NOTES TO THE CONDENSED CONSOLIDATED FINANCIAL STATEMENTS (UNAUDITED)
|
| | | | | | | | | | | | | | | | | | | |
| | December 31, 2018 |
| | Carrying
Value | | Level 1 | | Level 2 | | Level 3 | | Total
Fair Value |
| Assets | | | | | | | | | |
| Cash and equivalents | $ | 2,333 |
| | $ | 2,333 |
| | $ | — |
| | $ | — |
| | $ | 2,333 |
|
| Cash segregated under federal or other regulations | $ | 1,011 |
| | $ | 1,011 |
| | $ | — |
| | $ | — |
| | $ | 1,011 |
|
| Held-to-maturity securities: | | | | | | | | | |
| Agency mortgage-backed securities | $ | 18,085 |
| | $ | — |
| | $ | 17,748 |
| | $ | — |
| | $ | 17,748 |
|
| Agency debentures | 1,824 |
| | — |
| | 1,808 |
| | — |
| | 1,808 |
|
| Agency debt securities | 1,975 |
| | — |
| | 1,935 |
| | — |
| | 1,935 |
|
| Total held-to-maturity securities | $ | 21,884 |
| | $ | — |
| | $ | 21,491 |
| | $ | — |
| | $ | 21,491 |
|
Margin receivables(1) | $ | 9,560 |
| | $ | — |
| | $ | 9,560 |
| | $ | — |
| | $ | 9,560 |
|
| Loans receivable, net: | | | | | | | | | |
| One- to four-family | $ | 1,069 |
| | $ | — |
| | $ | — |
| | $ | 1,099 |
| | $ | 1,099 |
|
| Home equity | 810 |
| | — |
| | — |
| | 825 |
| | 825 |
|
| Consumer | 117 |
| | — |
| | — |
| | 115 |
| | 115 |
|
| Securities-based lending | 107 |
| | — |
| | 107 |
| | — |
| | 107 |
|
Total loans receivable, net(2) | $ | 2,103 |
| | $ | — |
| | $ | 107 |
| | $ | 2,039 |
| | $ | 2,146 |
|
Receivables from brokers, dealers and clearing organizations(1) | $ | 760 |
| | $ | — |
| | $ | 760 |
| | $ | — |
| | $ | 760 |
|
Other assets(1)(3) | $ | 36 |
| | $ | — |
| | $ | 36 |
| | $ | — |
| | $ | 36 |
|
| Liabilities | | | | | | | | | |
| Deposits | $ | 45,313 |
| | $ | — |
| | $ | 45,313 |
| | $ | — |
| | $ | 45,313 |
|
| Customer payables | $ | 10,117 |
| | $ | — |
| | $ | 10,117 |
| | $ | — |
| | $ | 10,117 |
|
| Payables to brokers, dealers and clearing organizations | $ | 948 |
| | $ | — |
| | $ | 948 |
| | $ | — |
| | $ | 948 |
|
| Corporate debt | $ | 1,409 |
| | $ | — |
| | $ | 1,372 |
| | $ | — |
| | $ | 1,372 |
|
| |
| (1) | The fair value of securities that the Company received as collateral in connection with margin receivables and securities borrowing activities, including the fully paid lending program, where the Company is permitted to sell or re-pledge the securities, was $12.9 billion at December 31, 2018. Of this amount, $2.3 billion had been pledged or sold in connection with securities loaned and deposits with clearing organizations at December 31, 2018. |
| |
| (2) | The carrying value of loans receivable, net includes the allowance for loan losses of $37 million and loans that are recorded at fair value on a nonrecurring basis at December 31, 2018. |
| |
| (3) | The $36 million in other assets at December 31, 2018 represents securities borrowing from customers under the fully paid lending program. |
Fair Value of Commitments and Contingencies
In the normal course of business, the Company makes various commitments to extend credit and incur contingent liabilities that are not reflected in the consolidated balance sheet. Changes in the economy or interest rates may influence the impact that these commitments and contingencies have on the Company in the future. The Company does not estimate the fair value of those commitments. Information related to such commitments and contingent liabilities is included in Note 14—Commitments, Contingencies and Other Regulatory Matters.
E*TRADE Q1Q3 2019 10-Q | Page 5766
E*TRADE FINANCIAL CORPORATION
NOTES TO THE CONDENSED CONSOLIDATED FINANCIAL STATEMENTS (UNAUDITED)
|
|
| NOTE 4—OFFSETTING ASSETS AND LIABILITIES |
Securities Purchased Under Agreements to Resell
Securities purchased under agreements to resell are treated as collateralized financing transactions and are recorded at their contractual amounts plus accrued interest. For financial statement purposes, the Company does not offset securities purchased under agreements to resell transactions with securities sold under agreements to repurchase. The Company obtains securities as collateral from the counterparty with a market value in excess of the principal amount loaned. This activity could result in losses if the counterparty fails to repurchase the securities held as collateral for the cash advanced and the market value of the securities declines. The Company continuously monitors the collateral value and obtains additional collateral from the counterparty in an effort to ensure full collateralization.
Securities Lending Transactions
Deposits paid for securitiesSecurities borrowed and deposits received for securities loaned transactions are recorded at the amount of cash collateral advanceddelivered to or received.received from the counterparty plus accrued interest. For financial statement purposes, the Company does not offset securities borrowing and securities lending transactions. These activities are generally transacted under master agreements that are widely used by counterparties and that may allow for net settlements of payments in the normal course, as well as offsetting of all contracts with a given counterparty in the event of bankruptcy or default of one of the two parties to the transaction.
The
following table presents information aboutCompany is required to deliver cash to the
Company'slender for securities
borrowing and securities lending transactions to enable the users of the Company’s consolidated financial statements to evaluate the potential effect of rights of set-off between these recognized assets and liabilities (dollars in millions): |
| | | | | | | | | | | | | | | | | | | | | | | |
| | | | | | | | Gross Amounts Not Offset in the Consolidated Balance Sheet | | |
| | Gross Amounts of Recognized Assets and Liabilities | | Gross Amounts Offset in the Consolidated Balance Sheet | | Net Amounts Presented in the Consolidated Balance Sheet (1) | | Financial Instruments | | Collateral Received or Pledged (Including Cash) | | Net Amount |
| March 31, 2019: | | | | | | | | | | | |
| Assets: | | | | | | | | | | | |
Securities borrowed (2) | $ | 327 |
| | $ | — |
| | $ | 327 |
| | $ | (125 | ) | | $ | (192 | ) | | $ | 10 |
|
| | | | | | | | | | | | |
| Liabilities: | | | | | | | | | | | |
Securities loaned (3) | $ | 1,109 |
| | $ | — |
| | $ | 1,109 |
| | $ | (125 | ) | | $ | (901 | ) | | $ | 83 |
|
| | | | | | | | | | | | |
| December 31, 2018: | | | | | | | | | | | |
| Assets: | | | | | | | | | | | |
Securities borrowed (2) | $ | 176 |
| | $ | — |
| | $ | 176 |
| | $ | (104 | ) | | $ | (61 | ) | | $ | 11 |
|
| | | | | | | | | | | | |
| Liabilities: | | | | | | | | | | | |
Securities loaned (3) | $ | 887 |
| | $ | — |
| | $ | 887 |
| | $ | (104 | ) | | $ | (700 | ) | | $ | 83 |
|
| |
(1) | The vast majority of the net amount of deposits paid for securities borrowed are reflected in the receivables from brokers, dealers and clearing organizations line item while the deposits paid for securities borrowed under the fully paid lending program are reflected in other assets. Deposits received for securities loaned are reflected in the payables to brokers, dealers and clearing organizations line item in the consolidated balance sheet. |
| |
(2) | Included in the gross amounts of deposits paid for securities borrowed was $192 million and $65 million at March 31, 2019 and December 31, 2018, respectively, transacted through a program with a clearing organization, which guarantees the return of cash to the Company. For presentation purposes, these amounts presented are based on the counterparties under the Company’s master securities loan agreements. |
| |
(3) | Included in the gross amounts of deposits received for securities loaned was $602 million and $543 million at March 31, 2019 and December 31, 2018, respectively, transacted through a program with a clearing organization, which guarantees the return of securities to the Company. For presentation purposes, these amounts presented are based on the counterparties under the Company’s master securities loan agreements. |
E*TRADE Q1 2019 10-Q | Page 58
E*TRADE FINANCIAL CORPORATION
NOTES TO THE CONDENSED CONSOLIDATED FINANCIAL STATEMENTS (UNAUDITED)
Securities borrowing transactions requireborrowed whereas the Company to deposit cash with the lender whereas securities lending transactions result in the Company receivingreceives collateral in the form of cash withfor securities loaned. These activities both requiringrequire cash in an amount generally in excess of the market value of the securities. These transactionssecurities and have overnight or continuous remaining contractual maturities. Securities lending transactions expose the Company to counterparty credit risk and market risk. To manage the counterparty risk, the Company maintains internal standards for approving counterparties, reviews and analyzes the credit rating of each counterparty, and monitors its positions with each counterparty on an ongoing basis. In addition, for certain of the Company's securities lending transactions, the Company uses a program with a clearing organization that guarantees the return of collateral. The Company monitors the market value of the securities borrowed and loaned using collateral arrangements that require additional collateral to be obtained from or excess collateral to be returned to the counterparties based on changes in market value, in an effort to maintain specified collateral levels.
E*TRADE Q3 2019 10-Q | Page 67
E*TRADE FINANCIAL CORPORATION
NOTES TO THE CONDENSED CONSOLIDATED FINANCIAL STATEMENTS (UNAUDITED)
The following table presents information about these transactions to enable the users of the Company’s consolidated financial statements to evaluate the potential effect of rights of set-off between these recognized assets and liabilities (dollars in millions): |
| | | | | | | | | | | | | | | | | | | | | | | |
| | | | | | | | Gross Amounts Not Offset in the Consolidated Balance Sheet | | |
| | Gross Amounts of Recognized Assets and Liabilities | | Gross Amounts Offset in the Consolidated Balance Sheet | | Net Amounts Presented in the Consolidated Balance Sheet (1)(2) | | Financial Instruments | | Collateral Received or Pledged (Including Cash) | | Net Amount |
| September 30, 2019: | | | | | | | | | | | |
| Assets: | | | | | | | | | | | |
Securities purchased under agreements to resell (3) | $ | 250 |
| | $ | — |
| | $ | 250 |
| | $ | — |
| | $ | (250 | ) | | $ | — |
|
Securities borrowed (4) | 728 |
| | — |
| | 728 |
| | (76 | ) | | (629 | ) | | 23 |
|
| Total | $ | 978 |
| | $ | — |
| | $ | 978 |
| | $ | (76 | ) | | $ | (879 | ) | | $ | 23 |
|
| | | | | | | | | | | | |
| Liabilities: | | | | | | | | | | | |
Securities loaned (5) | $ | 1,028 |
| | $ | — |
| | $ | 1,028 |
| | $ | (76 | ) | | $ | (862 | ) | | $ | 90 |
|
| Total | $ | 1,028 |
| | $ | — |
| | $ | 1,028 |
| | $ | (76 | ) | | $ | (862 | ) | | $ | 90 |
|
| | | | | | | | | | | | |
| December 31, 2018: | | | | | | | | | | | |
| Assets: | | | | | | | | | | | |
Securities borrowed (4) | $ | 176 |
| | $ | — |
| | $ | 176 |
| | $ | (104 | ) | | $ | (61 | ) | | $ | 11 |
|
| Total | $ | 176 |
| | $ | — |
| | $ | 176 |
| | $ | (104 | ) | | $ | (61 | ) | | $ | 11 |
|
| | | | | | | | | | | | |
| Liabilities: | | | | | | | | | | | |
Securities loaned (5) | $ | 887 |
| | $ | — |
| | $ | 887 |
| | $ | (104 | ) | | $ | (700 | ) | | $ | 83 |
|
| Total | $ | 887 |
| | $ | — |
| | $ | 887 |
| | $ | (104 | ) | | $ | (700 | ) | | $ | 83 |
|
| |
| (1) | Securities purchased under agreements to resell are included in the other assets line item in the consolidated balance sheet. |
| |
| (2) | The vast majority of the net amount of cash collateral paid for securities borrowed are reflected in the receivables from brokers, dealers and clearing organizations line item while the cash collateral paid for securities borrowed under the fully paid lending program are reflected in other assets. Cash collateral received for securities loaned are reflected in the payables to brokers, dealers and clearing organizations line item in the consolidated balance sheet. |
| |
| (3) | Over-collateralized at September 30, 2019, as the market value of the securities received by the Company was $258 million. |
| |
| (4) | Included in the gross amounts of cash collateral paid for securities borrowed was $501 million and $65 million at September 30, 2019 and December 31, 2018, respectively, transacted through a program with a clearing organization, which guarantees the return of cash to the Company. For presentation purposes, these amounts presented are based on the counterparties under the Company’s master securities loan agreements. |
| |
| (5) | Included in the gross amounts of cash collateral received for securities loaned was $593 million and $543 million at September 30, 2019 and December 31, 2018, respectively, transacted through a program with a clearing organization, which guarantees the return of securities to the Company. For presentation purposes, these amounts presented are based on the counterparties under the Company’s master securities loan agreements. |
E*TRADE Q3 2019 10-Q | Page 68
E*TRADE FINANCIAL CORPORATION
NOTES TO THE CONDENSED CONSOLIDATED FINANCIAL STATEMENTS (UNAUDITED)
Derivative Transactions
Certain typesAt September 30, 2019, all of the derivatives that the Company utilizesutilized in its hedging activities arewere subject to derivatives clearing agreements (centrally cleared derivatives contracts). These cleared derivatives contracts enable clearing by a derivatives clearing organization through a clearing member. Under the contracts, the clearing member typically has a one-way right to offset all contracts in the event of the Company's default or bankruptcy. Collateral exchanged under these contracts is not included in the preceding table as the contracts may not qualify as master netting agreements. For financial statement purposes, the Company does not offset derivatives assets and derivative liabilities. See Note 7—Derivative Instruments and Hedging Activities for additional information.
E*TRADE Q1Q3 2019 10-Q | Page 5969
E*TRADE FINANCIAL CORPORATION
NOTES TO THE CONDENSED CONSOLIDATED FINANCIAL STATEMENTS (UNAUDITED)
|
|
| NOTE 5—AVAILABLE-FOR-SALE AND HELD-TO-MATURITY SECURITIES |
The following table presents the amortized cost and fair value of available-for-sale and held-to-maturity securities (dollars in millions): | | | | Amortized Cost | | Gross Unrealized / Unrecognized Gains | | Gross Unrealized / Unrecognized Losses | | Fair Value | Amortized Cost | | Gross Unrealized / Unrecognized Gains | | Gross Unrealized / Unrecognized Losses | | Fair Value |
| March 31, 2019: | | | | | | | | |
| September 30, 2019: | | | | | | | | |
| Available-for-sale securities: | | | | | | | | | | | | | | |
| Agency mortgage-backed securities | $ | 23,032 |
| | $ | 587 |
| | $ | (196 | ) | | $ | 23,423 |
| $ | 17,464 |
| | $ | 1,095 |
| | $ | (45 | ) | | $ | 18,514 |
|
| Agency debentures | 854 |
| | 22 |
| | (3 | ) | | 873 |
| 639 |
| | 34 |
| | — |
| | 673 |
|
| US Treasuries | 437 |
| | 1 |
| | — |
| | 438 |
| 1,287 |
| | 73 |
| | (11 | ) | | 1,349 |
|
Non-agency asset-backed securities(1) | 89 |
| | 1 |
| | — |
| | 90 |
| 368 |
| | 2 |
| | (1 | ) | | 369 |
|
| Other agency debt securities | 81 |
| | 1 |
| | (1 | ) | | 81 |
| |
| Non-agency mortgage-backed securities | 65 |
| | — |
| | — |
| | 65 |
| 108 |
| | 6 |
| | — |
| | 114 |
|
| Other | 1 |
| | — |
| | — |
| | 1 |
| 1 |
| | — |
| | — |
| | 1 |
|
| Total available-for-sale securities | $ | 24,559 |
| | $ | 612 |
| | $ | (200 | ) | | $ | 24,971 |
| $ | 19,867 |
| | $ | 1,210 |
| | $ | (57 | ) | | $ | 21,020 |
|
| Held-to-maturity securities: | | | | | | | | | | | | | | |
| Agency mortgage-backed securities | $ | 20,337 |
| | $ | 97 |
| | $ | (183 | ) | | $ | 20,251 |
| $ | 19,563 |
| | $ | 359 |
| | $ | (42 | ) | | $ | 19,880 |
|
| Agency debentures | 1,745 |
| | 3 |
| | (6 | ) | | 1,742 |
| 327 |
| | 6 |
| | — |
| | 333 |
|
| Other agency debt securities | 1,845 |
| | 7 |
| | (21 | ) | | 1,831 |
| 1,652 |
| | 48 |
| | (1 | ) | | 1,699 |
|
| Total held-to-maturity securities | $ | 23,927 |
| | $ | 107 |
| | $ | (210 | ) | | $ | 23,824 |
| $ | 21,542 |
| | $ | 413 |
| | $ | (43 | ) | | $ | 21,912 |
|
| | | | | | | | | | | | | | | |
| December 31, 2018: |
| | | | | |
|
| | | | | |
|
| Available-for-sale securities: | | | | | | | | | | | | | | |
| Agency mortgage-backed securities | $ | 22,140 |
| | $ | 327 |
| | $ | (305 | ) | | $ | 22,162 |
| $ | 22,140 |
| | $ | 327 |
| | $ | (305 | ) | | $ | 22,162 |
|
| Agency debentures | 833 |
| | 13 |
| | (7 | ) | | 839 |
| 833 |
| | 13 |
| | (7 | ) | | 839 |
|
| Other agency debt securities | 140 |
| | 1 |
| | (2 | ) | | 139 |
| 140 |
| | 1 |
| | (2 | ) | | 139 |
|
| Municipal bonds | 12 |
| | — |
| | — |
| | 12 |
| 12 |
| | — |
| | — |
| | 12 |
|
| Other | 1 |
| | — |
| | — |
| | 1 |
| 1 |
| | — |
| | — |
| | 1 |
|
| Total available-for-sale securities | $ | 23,126 |
| | $ | 341 |
| | $ | (314 | ) | | $ | 23,153 |
| $ | 23,126 |
| | $ | 341 |
| | $ | (314 | ) | | $ | 23,153 |
|
| Held-to-maturity securities: | | | | | | | | | | | | | | |
| Agency mortgage-backed securities | $ | 18,085 |
| | $ | 26 |
| | $ | (363 | ) | | $ | 17,748 |
| $ | 18,085 |
| | $ | 26 |
| | $ | (363 | ) | | $ | 17,748 |
|
| Agency debentures | 1,824 |
| | — |
| | (16 | ) | | 1,808 |
| 1,824 |
| | — |
| | (16 | ) | | 1,808 |
|
| Other agency debt securities | 1,975 |
| | 4 |
| | (44 | ) | | 1,935 |
| 1,975 |
| | 4 |
| | (44 | ) | | 1,935 |
|
| Total held-to-maturity securities | $ | 21,884 |
| | $ | 30 |
| | $ | (423 | ) | | $ | 21,491 |
| $ | 21,884 |
| | $ | 30 |
| | $ | (423 | ) | | $ | 21,491 |
|
| |
| (1) | All non-agencyNon-agency ABS were collateralized by credit card, automobile loan and student loan receivables asrepresented approximately 61%, 21% and 18%, respectively, of March 31,the non-agency ABS held at September 30, 2019. |
E*TRADE Q1Q3 2019 10-Q | Page 6070
E*TRADE FINANCIAL CORPORATION
NOTES TO THE CONDENSED CONSOLIDATED FINANCIAL STATEMENTS (UNAUDITED)
Contractual Maturities
The following table presents the contractual maturities of all available-for-sale and held-to-maturity debt securities (dollars in millions): | | | | March 31, 2019 | September 30, 2019 |
| | Amortized Cost | | Fair Value | Amortized Cost | | Fair Value |
| Available-for-sale debt securities: | | | | | | |
| Due within one year | $ | 50 |
| | $ | 50 |
| $ | 103 |
| | $ | 103 |
|
| Due within one to five years | 824 |
| | 819 |
| 311 |
| | 314 |
|
| Due within five to ten years | 11,049 |
| | 11,488 |
| 9,464 |
| | 10,391 |
|
| Due after ten years | 12,636 |
| | 12,614 |
| 9,989 |
| | 10,212 |
|
| Total available-for-sale debt securities | $ | 24,559 |
| | $ | 24,971 |
| $ | 19,867 |
| | $ | 21,020 |
|
| Held-to-maturity debt securities: | | | | | | |
| Due within one year | $ | 21 |
| | $ | 21 |
| $ | 23 |
| | $ | 23 |
|
| Due within one to five years | 2,059 |
| | 2,058 |
| 2,094 |
| | 2,133 |
|
| Due within five to ten years | 4,758 |
| | 4,741 |
| 3,137 |
| | 3,236 |
|
| Due after ten years | 17,089 |
| | 17,004 |
| 16,288 |
| | 16,520 |
|
| Total held-to-maturity debt securities | $ | 23,927 |
| | $ | 23,824 |
| $ | 21,542 |
| | $ | 21,912 |
|
At March 31,September 30, 2019 and December 31, 2018, the Company had pledged $6.0$7.4 billion and $6.3 billion, respectively, of held-to-maturity debt securities, and $463$520 million and $151 million, respectively, of available-for-sale securities, as collateral for FHLB advances, derivatives and other purposes.
E*TRADE Q1Q3 2019 10-Q | Page 6171
E*TRADE FINANCIAL CORPORATION
NOTES TO THE CONDENSED CONSOLIDATED FINANCIAL STATEMENTS (UNAUDITED)
Investments with Unrealized or Unrecognized Losses
The following table presents the fair value and unrealized or unrecognized losses on available-for-sale and held-to-maturity securities, and the length of time that individual securities have been in a continuous unrealized or unrecognized loss position (dollars in millions): | | | | Less than 12 Months | | 12 Months or More | | Total | Less than 12 Months | | 12 Months or More | | Total |
| | Fair Value | | Unrealized / Unrecognized Losses | | Fair Value | | Unrealized / Unrecognized Losses | | Fair Value | | Unrealized / Unrecognized Losses | Fair Value | | Unrealized / Unrecognized Losses | | Fair Value | | Unrealized / Unrecognized Losses | | Fair Value | | Unrealized / Unrecognized Losses |
| March 31, 2019: | | | | | | | | | | | | |
| September 30, 2019: | | | | | | | | | | | | |
| Available-for-sale securities: | | | | | | | | | | | | | | | | | | | | | | |
| Agency mortgage-backed securities | $ | 695 |
| | $ | (10 | ) | | $ | 8,635 |
| | $ | (186 | ) | | $ | 9,330 |
| | $ | (196 | ) | $ | 843 |
| | $ | (4 | ) | | $ | 3,118 |
| | $ | (41 | ) | | $ | 3,961 |
| | $ | (45 | ) |
| Agency debentures | — |
| | — |
| | 119 |
| | (3 | ) | | 119 |
| | (3 | ) | |
| US Treasuries | 102 |
| | — |
| | — |
| | — |
| | 102 |
| | — |
| 429 |
| | (11 | ) | | — |
| | — |
| | 429 |
| | (11 | ) |
| Other agency debt securities | — |
| | — |
| | 30 |
| | (1 | ) | | 30 |
| | (1 | ) | |
| Other | 1 |
| | — |
| | — |
| | — |
| | 1 |
| | — |
| |
| Non-agency asset-backed securities | | 203 |
| | (1 | ) | | — |
| | — |
| | 203 |
| | (1 | ) |
| Total temporarily impaired available-for-sale securities | $ | 798 |
| | $ | (10 | ) | | $ | 8,784 |
| | $ | (190 | ) | | $ | 9,582 |
| | $ | (200 | ) | $ | 1,475 |
| | $ | (16 | ) | | $ | 3,118 |
| | $ | (41 | ) | | $ | 4,593 |
| | $ | (57 | ) |
| Held-to-maturity securities: | | | | | | | | | | | | | | | | | | | | | | |
| Agency mortgage-backed securities | $ | 708 |
| | $ | (4 | ) | | $ | 12,049 |
| | $ | (179 | ) | | $ | 12,757 |
| | $ | (183 | ) | $ | 403 |
| | $ | (3 | ) | | $ | 4,166 |
| | $ | (39 | ) | | $ | 4,569 |
| | $ | (42 | ) |
| Agency debentures | — |
| | — |
| | 811 |
| | (6 | ) | | 811 |
| | (6 | ) | — |
| | — |
| | 35 |
| | — |
| | 35 |
| | — |
|
| Agency debt securities | — |
| | — |
| | 1,375 |
| | (21 | ) | | 1,375 |
| | (21 | ) | |
| Other agency debt securities | | — |
| | — |
| | 143 |
| | (1 | ) | | 143 |
| | (1 | ) |
| Total temporarily impaired held-to-maturity securities | $ | 708 |
| | $ | (4 | ) | | $ | 14,235 |
| | $ | (206 | ) | | $ | 14,943 |
| | $ | (210 | ) | $ | 403 |
| | $ | (3 | ) | | $ | 4,344 |
| | $ | (40 | ) | | $ | 4,747 |
| | $ | (43 | ) |
| | | | | | | | | | | | | | | | | | | | | | | |
| December 31, 2018: | | | | | | | | | | | | | | | | | | | | | | |
| Available-for-sale securities: | | | | | | | | | | | | | | | | | | | | | | |
| Agency mortgage-backed securities | $ | 2,945 |
| | $ | (34 | ) | | $ | 7,826 |
| | $ | (271 | ) | | $ | 10,771 |
| | $ | (305 | ) | $ | 2,945 |
| | $ | (34 | ) | | $ | 7,826 |
| | $ | (271 | ) | | $ | 10,771 |
| | $ | (305 | ) |
| Agency debentures | 383 |
| | (1 | ) | | 116 |
| | (6 | ) | | 499 |
| | (7 | ) | 383 |
| | (1 | ) | | 116 |
| | (6 | ) | | 499 |
| | (7 | ) |
| Other agency debt securities | — |
| | — |
| | 30 |
| | (2 | ) | | 30 |
| | (2 | ) | — |
| | — |
| | 30 |
| | (2 | ) | | 30 |
| | (2 | ) |
| Municipal bonds | — |
| | — |
| | 9 |
| | — |
| | 9 |
| | — |
| — |
| | — |
| | 9 |
| | — |
| | 9 |
| | — |
|
| Other | 1 |
| | — |
| | — |
| | — |
| | 1 |
| | — |
| 1 |
| | — |
| | — |
| | — |
| | 1 |
| | — |
|
| Total temporarily impaired available-for-sale securities | $ | 3,329 |
| | $ | (35 | ) | | $ | 7,981 |
| | $ | (279 | ) | | $ | 11,310 |
| | $ | (314 | ) | $ | 3,329 |
| | $ | (35 | ) | | $ | 7,981 |
| | $ | (279 | ) | | $ | 11,310 |
| | $ | (314 | ) |
| Held-to-maturity securities: | | | | | | | | | | | | | | | | | | | | | | |
| Agency mortgage-backed securities | $ | 2,802 |
| | $ | (31 | ) | | $ | 11,587 |
| | $ | (332 | ) | | $ | 14,389 |
| | $ | (363 | ) | $ | 2,802 |
| | $ | (31 | ) | | $ | 11,587 |
| | $ | (332 | ) | | $ | 14,389 |
| | $ | (363 | ) |
| Agency debentures | 776 |
| | (2 | ) | | 666 |
| | (14 | ) | | 1,442 |
| | (16 | ) | 776 |
| | (2 | ) | | 666 |
| | (14 | ) | | 1,442 |
| | (16 | ) |
| Other agency debt securities | 97 |
| | (1 | ) | | 1,487 |
| | (43 | ) | | 1,584 |
| | (44 | ) | 97 |
| | (1 | ) | | 1,487 |
| | (43 | ) | | 1,584 |
| | (44 | ) |
| Total temporarily impaired held-to-maturity securities | $ | 3,675 |
| | $ | (34 | ) | | $ | 13,740 |
| | $ | (389 | ) | | $ | 17,415 |
| | $ | (423 | ) | $ | 3,675 |
| | $ | (34 | ) | | $ | 13,740 |
| | $ | (389 | ) | | $ | 17,415 |
| | $ | (423 | ) |
The Company does not believe that any individual unrealized loss in the available-for-sale portfolio or unrecognized loss in the held-to-maturity portfolio represents an other-than-temporary impairment as of March 31,September 30, 2019 represents a credit loss.or through the date of this report. The Company does not intend to sell the debt securities in an unrealized or unrecognized loss position as of the balance sheet date and it is not more likely than not that the Company will be required to sell the debt securities before the anticipated recovery of its remaining amortized cost of the debt securities in an unrealized or unrecognized loss position at March 31, 2019.position.
There were 0 impairment losses recognized in earnings on available-for-sale or held-to-maturity securities during the nine months ended September 30, 2019 and 2018.
E*TRADE Q1Q3 2019 10-Q | Page 6272
E*TRADE FINANCIAL CORPORATION
NOTES TO THE CONDENSED CONSOLIDATED FINANCIAL STATEMENTS (UNAUDITED)
There were no impairment losses recognized in earnings on available-for-sale or held-to-maturity securities during the three months ended March 31, 2019 and 2018.
Gains (Losses) on Securities and Other, Net
The following table presents the components of gains (losses) on securities and other, net (dollars in millions): |
| | | | | | | |
| | Three Months Ended March 31, |
| | 2019 | | 2018 |
| Gains on available-for-sale securities | $ | 11 |
| | $ | 11 |
|
| Equity method investment income (loss) and other | — |
| | (1 | ) |
| Gains on securities and other, net | $ | 11 |
| �� | $ | 10 |
|
|
| | | | | | | | | | | | | | | |
| | Three Months Ended September 30, | | Nine Months Ended September 30, |
| | 2019 | | 2018 | | 2019 | | 2018 |
| Gains (losses) on available-for-sale securities, net: | | | | | | | |
Gains on available-for-sale securities(1)(2) | $ | 14 |
| | $ | 65 |
| | $ | 40 |
| | $ | 87 |
|
Losses on available-for-sale securities(1)(2) | — |
| | (54 | ) | | (80 | ) | | (54 | ) |
| Subtotal | 14 |
| | 11 |
| | (40 | ) | | 33 |
|
Equity method investment income and other(3) | 2 |
| | 6 |
| | 3 |
| | 9 |
|
| Gains (losses) on securities and other, net | $ | 16 |
| | $ | 17 |
| | $ | (37 | ) | | $ | 42 |
|
| |
| (1) | In June 2019, the Company repositioned its balance sheet through the sales of $4.5 billion of lower-yielding investment securities. These sales enabled the reduction of our balance sheet size and the Company moved $6.6 billion of deposits to third-party banks generating additional capital capacity to support future share repurchases. Gains (losses) on securities and other, net for the nine months ended September 30, 2019 includes $80 million of losses related to these sales. |
| |
| (2) | In August 2018, the Company sold available-for-sale securities and reinvested the sale proceeds in agency-backed securities at current market rates. A subset of these securities had been purchased in lower interest rate environments and were in unrealized loss positions at the time of sale. As both the change in intent related to these securities and the sale of these securities occurred within the same reporting period, the Company presented the losses on the sale of these securities within the gains on securities and other, net line item. |
| |
| (3) | Includes a $5 million gain on the sale of our Chicago Stock Exchange investment for the three and nine months ended September 30, 2018. |
E*TRADE Q3 2019 10-Q | Page 73
E*TRADE FINANCIAL CORPORATION
NOTES TO THE CONDENSED CONSOLIDATED FINANCIAL STATEMENTS (UNAUDITED)
|
|
| NOTE 6—LOANS RECEIVABLE, NET |
The following table presents loans receivable disaggregated by delinquency status (dollars in millions): | | | | | | | Days Past Due | | | | | | | | | | | | Days Past Due | | | | | | | | |
| | | Current | | 30-89 | | 90-179 | | 180+ | | Total | | Unamortized premiums, net | | Allowance for loans losses | | Loans Receivable, Net | | Current | | 30-89 | | 90-179 | | 180+ | | Total | | Unamortized Premiums, Net | | Allowance for Loans Losses | | Loans Receivable, Net |
| March 31, 2019: | | | | | | | | | | | | | | | | | |
| September 30, 2019: | | | | | | | | | | | | | | | | | |
| One- to four-family | | $ | 891 |
| | $ | 49 |
| | $ | 16 |
| | $ | 47 |
| | $ | 1,003 |
| | $ | 6 |
| | $ | (9 | ) | | $ | 1,000 |
| | $ | 777 |
| | $ | 37 |
| | $ | 8 |
| | $ | 39 |
| | $ | 861 |
| | $ | 5 |
| | $ | (6 | ) | | $ | 860 |
|
| Home equity | | 727 |
| | 27 |
| | 9 |
| | 22 |
| | 785 |
| | — |
| | (21 | ) | | 764 |
| | 633 |
| | 21 |
| | 9 |
| | 17 |
| | 680 |
| | — |
| | (19 | ) | | 661 |
|
| Consumer | | 104 |
| | 2 |
| | — |
| | — |
| | 106 |
| | — |
| | (2 | ) | | 104 |
| | 83 |
| | 2 |
| | — |
| | — |
| | 85 |
| | 1 |
| | (2 | ) | | 84 |
|
Securities-based lending(1) | | 97 |
| | — |
| | — |
| | — |
| | 97 |
| | — |
| | — |
| | 97 |
| | 142 |
| | — |
| | — |
| | — |
| | 142 |
| | — |
| | — |
| | 142 |
|
| Total loans receivable | | $ | 1,819 |
| | $ | 78 |
| | $ | 25 |
| | $ | 69 |
| | $ | 1,991 |
| | $ | 6 |
| | $ | (32 | ) | | $ | 1,965 |
| | $ | 1,635 |
| | $ | 60 |
| | $ | 17 |
| | $ | 56 |
| | $ | 1,768 |
| | $ | 6 |
| | $ | (27 | ) | | $ | 1,747 |
|
| | | | | | | | | | | | | | | | | | | | | | | | | | | | | | | | | |
| December 31, 2018: | | | | | | | | | | | | | | | | | | | | | | | | | | | | | | | | |
| One- to four-family | | $ | 958 |
| | $ | 48 |
| | $ | 9 |
| | $ | 56 |
| | $ | 1,071 |
| | $ | 7 |
| | $ | (9 | ) | | $ | 1,069 |
| | $ | 958 |
| | $ | 48 |
| | $ | 9 |
| | $ | 56 |
| | $ | 1,071 |
| | $ | 7 |
| | $ | (9 | ) | | $ | 1,069 |
|
| Home equity | | 774 |
| | 25 |
| | 13 |
| | 24 |
| | 836 |
| | — |
| | (26 | ) | | 810 |
| | 774 |
| | 25 |
| | 13 |
| | 24 |
| | 836 |
| | — |
| | (26 | ) | | 810 |
|
| Consumer | | 117 |
| | 1 |
| | — |
| | — |
| | 118 |
| | 1 |
| | (2 | ) | | 117 |
| | 117 |
| | 1 |
| | — |
| | — |
| | 118 |
| | 1 |
| | (2 | ) | | 117 |
|
Securities-based lending(1) | | 107 |
| | — |
| | — |
| | — |
| | 107 |
| | — |
| | — |
| | 107 |
| | 107 |
| | — |
| | — |
| | — |
| | 107 |
| | — |
| | — |
| | 107 |
|
| Total loans receivable | | $ | 1,956 |
| | $ | 74 |
| | $ | 22 |
| | $ | 80 |
| | $ | 2,132 |
| | $ | 8 |
| | $ | (37 | ) | | $ | 2,103 |
| | $ | 1,956 |
| | $ | 74 |
| | $ | 22 |
| | $ | 80 |
| | $ | 2,132 |
| | $ | 8 |
| | $ | (37 | ) | | $ | 2,103 |
|
| |
| (1) | E*TRADE Line of Credit is a securities-based lending product where customers can borrow against the market value of their securities pledged as collateral. The unused credit line amount totaled $220$310 million and $173 million as of March 31,September 30, 2019 and December 31, 2018, respectively. |
At March 31,September 30, 2019, the Company pledged $1.5$1.3 billion and $0.1 billion of loans as collateral to the FHLB and Federal Reserve Bank of Richmond, respectively. At December 31, 2018, the Company pledged $1.6 billion and $0.1 billion of loans as collateral to the FHLB and Federal Reserve Bank of Richmond, respectively.
E*TRADE Q1Q3 2019 10-Q | Page 6374
E*TRADE FINANCIAL CORPORATION
NOTES TO THE CONDENSED CONSOLIDATED FINANCIAL STATEMENTS (UNAUDITED)
Credit Quality and Concentrations of Credit Risk
The Company tracks and reviews factors to predict and monitor credit risk in its mortgage loan portfolio on an ongoing basis. The following tables present the distribution of the Company’s mortgage loan portfolios by credit quality indicator (dollars in millions): | | | | One- to Four-Family | | Home Equity | One- to Four-Family | | Home Equity |
| | March 31, | | December 31, | | March 31, | | December 31, | September 30, | | December 31, | | September 30, | | December 31, |
Current LTV/CLTV(1) | 2019 | | 2018 | | 2019 | | 2018 | 2019 | | 2018 | | 2019 | | 2018 |
| <=80% | $ | 794 |
| | $ | 823 |
| | $ | 430 |
| | $ | 454 |
| $ | 706 |
| | $ | 823 |
| | $ | 393 |
| | $ | 454 |
|
| 80%-100% | 134 |
| | 165 |
| | 202 |
| | 215 |
| 102 |
| | 165 |
| | 169 |
| | 215 |
|
| 100%-120% | 45 |
| | 45 |
| | 100 |
| | 110 |
| 31 |
| | 45 |
| | 77 |
| | 110 |
|
| >120% | 30 |
| | 38 |
| | 53 |
| | 57 |
| 22 |
| | 38 |
| | 41 |
| | 57 |
|
| Total mortgage loans receivable | $ | 1,003 |
| | $ | 1,071 |
| | $ | 785 |
| | $ | 836 |
| $ | 861 |
| | $ | 1,071 |
| | $ | 680 |
| | $ | 836 |
|
Average estimated current LTV/CLTV (2) | 65 | % | | 66 | % | | 79 | % | | 80 | % | 62 | % | | 66 | % | | 77 | % | | 80 | % |
Average LTV/CLTV at loan origination (3) | 70 | % | | 70 | % | | 82 | % | | 82 | % | 70 | % | | 70 | % | | 82 | % | | 82 | % |
| |
| (1) | Current CLTV calculations for home equity loans are based on the maximum available line for HELOCs and outstanding principal balance for HEILs. For home equity loans in the second lien position, the original balance of the first lien loan at origination date and updated valuations on the property underlying the loan are used to calculate CLTV. Current property value estimates are updated on a quarterly basis. |
| |
| (2) | The average estimated current LTV/CLTV ratio reflects the outstanding balance at the balance sheet date and the maximum available line for HELOCs, divided by the estimated current value of the underlying property. |
| |
| (3) | Average LTV/CLTV at loan origination calculations are based on LTV/CLTV at time of purchase for one- to four-family purchased loans, HEILs and the maximum available line for HELOCs. |
| | | | One- to Four-Family | | Home Equity | One- to Four-Family | | Home Equity |
| | March 31, | | December 31, | | March 31, | | December 31, | September 30, | | December 31, | | September 30, | | December 31, |
| Current FICO | 2019 | | 2018 | | 2019 | | 2018 | 2019 | | 2018 | | 2019 | | 2018 |
| >=720 | $ | 581 |
| | $ | 617 |
| | $ | 409 |
| | $ | 442 |
| $ | 498 |
| | $ | 617 |
| | $ | 357 |
| | $ | 442 |
|
| 719 - 700 | 78 |
| | 89 |
| | 73 |
| | 78 |
| 68 |
| | 89 |
| | 63 |
| | 78 |
|
| 699 - 680 | 78 |
| | 80 |
| | 65 |
| | 70 |
| 66 |
| | 80 |
| | 58 |
| | 70 |
|
| 679 - 660 | 52 |
| | 66 |
| | 54 |
| | 56 |
| 45 |
| | 66 |
| | 48 |
| | 56 |
|
| 659 - 620 | 93 |
| | 79 |
| | 79 |
| | 80 |
| 69 |
| | 79 |
| | 62 |
| | 80 |
|
| <620 | 121 |
| | 140 |
| | 105 |
| | 110 |
| 115 |
| | 140 |
| | 92 |
| | 110 |
|
| Total mortgage loans receivable | $ | 1,003 |
| | $ | 1,071 |
| | $ | 785 |
| | $ | 836 |
| $ | 861 |
| | $ | 1,071 |
| | $ | 680 |
| | $ | 836 |
|
One- to four-family loans include loans with an interest-only period, followed by an amortizing period. At March 31,September 30, 2019, 100% of these loans were amortizing. The home equity loan portfolio consists of HEILs and HELOCs. HEILs are primarily fully amortizing loans that do not offer the option of an interest-only payment. The majority of HELOCs had an interest only draw period at origination and converted to amortizing loans at the end of the draw period. At March 31,September 30, 2019, nearly 100% of the HELOC portfolio had converted from the interest-only draw period.
E*TRADE Q1Q3 2019 10-Q | Page 6475
E*TRADE FINANCIAL CORPORATION
NOTES TO THE CONDENSED CONSOLIDATED FINANCIAL STATEMENTS (UNAUDITED)
The weighted average age of our mortgage and consumer loans receivable was 13.113.5 and 12.8 years at March 31,September 30, 2019 and December 31, 2018, respectively. Approximately 32% and 33% of the Company’s mortgage loans receivable were concentrated in California at March 31,September 30, 2019 and December 31, 2018, respectively. Approximately 10% of the Company's mortgage loans receivable were concentrated in New York at both March 31,September 30, 2019 and December 31, 2018. NoNaN other state had concentrations of mortgage loans that represented 10% or more of the Company’s mortgage loans receivable at March 31,September 30, 2019 andor December 31, 2018.
At March 31,September 30, 2019, 25%23% and 18%22% of the Company’s past-due mortgage loans were concentrated in California and New York, respectively. NoNaN other state had concentrations of past-due mortgage loans that represented 10% or more of the Company's past-due mortgage loans. At March 31,September 30, 2019, 43%42% and 10% of the Company’s impaired mortgage loans were concentrated in California and New York, respectively. NoNaN other state had concentrations of impaired mortgage loans that represented 10% or more of the Company's impaired mortgage loans.
Nonperforming Loans
The Company classifies loans as nonperforming when they are no longer accruing interest. The following table presents nonperforming loans by loan portfolio (dollars in millions): | | | | March 31, 2019 | | December 31, 2018 | September 30, 2019 | | December 31, 2018 |
| One- to four-family | $ | 134 |
| | $ | 139 |
| $ | 118 |
| | $ | 139 |
|
| Home equity | 67 |
| | 71 |
| 58 |
| | 71 |
|
| Total nonperforming loans receivable | $ | 201 |
| | $ | 210 |
| $ | 176 |
| | $ | 210 |
|
At both March 31, 2019 and December 31, 2018, theThe Company held $13 million of real estate owned that was acquired through foreclosure or through a deed in lieu of foreclosure or similar legal agreement.agreement at September 30, 2019 and December 31, 2018, respectively. The Company held $46$33 million and $51 million of loans for which formal foreclosure proceedings were in process at March 31,September 30, 2019 and December 31, 2018, respectively.
E*TRADE Q1Q3 2019 10-Q | Page 6576
E*TRADE FINANCIAL CORPORATION
NOTES TO THE CONDENSED CONSOLIDATED FINANCIAL STATEMENTS (UNAUDITED)
Allowance for Loan Losses
The allowance for loan losses is management’s estimate of probable losses inherent in the loan portfolio at the balance sheet date, as well as the forecasted losses, including economic concessions to borrowers, over the estimated remaining life of loans modified as TDRs. The general allowance for loan losses includes a qualitative component to account for a variety of factors that present additional uncertainty that may not be fully considered in the quantitative loss model but are factors we believe may impact the level of credit losses.
The following table presents the allowance for loan losses by loan portfolio (dollars in millions):
| | | | One- to Four-Family | | Home Equity | | Consumer | | Total(1) | September 30, 2019 |
| | March 31, 2019 | | December 31, 2018 | | March 31, 2019 | | December 31, 2018 | | March 31, 2019 | | December 31, 2018 | | March 31, 2019 | | December 31, 2018 | One- to Four-Family | | Home Equity | | Consumer | | Total(1) |
| General reserve: | | | | | | | | | | | | | | | | | | | | | | |
| Quantitative component | $ | 4 |
| | $ | 4 |
| | $ | 4 |
| | $ | 6 |
| | $ | 2 |
| | $ | 2 |
| | $ | 10 |
| | $ | 12 |
| $ | 1 |
| | $ | 3 |
| | $ | 2 |
| | $ | 6 |
|
| Qualitative component | — |
| | — |
| | — |
| | 1 |
| | — |
| | — |
| | — |
| | 1 |
| — |
| | (1 | ) | | — |
| | (1 | ) |
| Specific valuation allowance | 5 |
| | 5 |
| | 17 |
| | 19 |
| | — |
| | — |
| | 22 |
| | 24 |
| 5 |
| | 17 |
| | — |
| | 22 |
|
| Total allowance for loan losses | $ | 9 |
| | $ | 9 |
| | $ | 21 |
| | $ | 26 |
| | $ | 2 |
| | $ | 2 |
| | $ | 32 |
| | $ | 37 |
| $ | 6 |
| | $ | 19 |
| | $ | 2 |
| | $ | 27 |
|
Allowance as a % of loans
receivable(2) | 0.9 | % | | 0.8 | % | | 2.7 | % | | 3.1 | % | | 1.0 | % | | 1.0 | % | | 1.6 | % | | 1.7 | % | 0.7 | % | | 2.8 | % | | 1.6 | % | | 1.5 | % |
|
| | | | | | | | | | | | | | | |
| | December 31, 2018 |
| | One- to Four-Family | | Home Equity | | Consumer | | Total(1) |
| General reserve: | | | | | | | |
| Quantitative component | $ | 4 |
| | $ | 6 |
| | $ | 2 |
| | $ | 12 |
|
| Qualitative component | — |
| | 1 |
| | — |
| | 1 |
|
| Specific valuation allowance | 5 |
| | 19 |
| | — |
| | 24 |
|
| Total allowance for loan losses | $ | 9 |
| | $ | 26 |
| | $ | 2 |
| | $ | 37 |
|
Allowance as a % of loans receivable(2) | 0.8 | % | | 3.1 | % | | 1.0 | % | | 1.7 | % |
| |
| (1) | Securities-based lending loans were fully collateralized by cash and securities with fair values in excess of borrowings at both March 31,September 30, 2019 and December 31, 2018, respectively. |
| |
| (2) | Allowance as a percentage of loans receivable is calculated based on the gross loans receivable including net unamortized premiums for each respective category. |
E*TRADE Q1Q3 2019 10-Q | Page 6677
E*TRADE FINANCIAL CORPORATION
NOTES TO THE CONDENSED CONSOLIDATED FINANCIAL STATEMENTS (UNAUDITED)
The following table presents a roll forward by loan portfolio of the allowance for loan losses (dollars in millions):
| | | | Three Months Ended March 31, 2019 | Three Months Ended September 30, 2019 |
| | One- to Four-Family | | Home Equity | | Consumer | | Total | One- to Four-Family | | Home Equity | | Consumer | | Total |
| Allowance for loan losses, beginning of period | $ | 9 |
| | $ | 26 |
| | $ | 2 |
| | $ | 37 |
| $ | 9 |
| | $ | 19 |
| | $ | 2 |
| | $ | 30 |
|
| Provision (benefit) for loan losses | (2 | ) | | (10 | ) | | — |
| | (12 | ) | (5 | ) | | (6 | ) | | (1 | ) | | (12 | ) |
Charge-offs(1) | — |
| | — |
| | (1 | ) | | (1 | ) | — |
| | — |
| | — |
| | — |
|
| Recoveries | 2 |
| | 5 |
| | 1 |
| | 8 |
| 2 |
| | 6 |
| | 1 |
| | 9 |
|
| Net (charge-offs) recoveries | 2 |
| | 5 |
| | — |
| | 7 |
| 2 |
| | 6 |
| | 1 |
| | 9 |
|
Allowance for loan losses, end of period(2) | $ | 9 |
| | $ | 21 |
| | $ | 2 |
| | $ | 32 |
| $ | 6 |
| | $ | 19 |
| | $ | 2 |
| | $ | 27 |
|
| | | | | | | | | | | | | | | |
| | Three Months Ended March 31, 2018 | Three Months Ended September 30, 2018 |
| | One- to
Four-Family | | Home
Equity | | Consumer | | Total | One- to Four-Family | | Home Equity | | Consumer | | Total |
| Allowance for loan losses, beginning of period | $ | 24 |
| | $ | 46 |
| | $ | 4 |
| | $ | 74 |
| $ | 16 |
| | $ | 36 |
| | $ | 2 |
| | $ | 54 |
|
| Provision (benefit) for loan losses | (5 | ) | | (16 | ) | | — |
| | (21 | ) | (6 | ) | | (28 | ) | | — |
| | (34 | ) |
Charge-offs(1) | — |
| | — |
| | (1 | ) | | (1 | ) | — |
| | — |
| | (1 | ) | | (1 | ) |
Recoveries(3) | | 2 |
| | 19 |
| | 1 |
| | 22 |
|
| Net (charge-offs) recoveries | | 2 |
| | 19 |
| | — |
| | 21 |
|
Allowance for loan losses, end of period(2) | | $ | 12 |
| | $ | 27 |
| | $ | 2 |
| | $ | 41 |
|
| | | | | | | | | |
| | | Nine Months Ended September 30, 2019 |
| | | One- to Four-Family | | Home Equity | | Consumer | | Total |
| Allowance for loan losses, beginning of period | | $ | 9 |
| | $ | 26 |
| | $ | 2 |
| | $ | 37 |
|
| Provision (benefit) for loan losses | | (8 | ) | | (24 | ) | | — |
| | (32 | ) |
Charge-offs(1) | | — |
| | — |
| | (2 | ) | | (2 | ) |
| Recoveries | 1 |
| | 5 |
| | — |
| | 6 |
| 5 |
| | 17 |
| | 2 |
| | 24 |
|
| Net (charge-offs) recoveries | 1 |
| | 5 |
| | (1 | ) | | 5 |
| 5 |
| | 17 |
| | — |
| | 22 |
|
Allowance for loan losses, end of period(2) | $ | 20 |
| | $ | 35 |
| | $ | 3 |
| | $ | 58 |
| $ | 6 |
| | $ | 19 |
| | $ | 2 |
| | $ | 27 |
|
| | | | | | | | | |
| | | Nine Months Ended September 30, 2018 |
| | | One- to
Four-Family | | Home
Equity | | Consumer | | Total |
| Allowance for loan losses, beginning of period | | $ | 24 |
| | $ | 46 |
| | $ | 4 |
| | $ | 74 |
|
| Provision (benefit) for loan losses | | (17 | ) | | (56 | ) | | (1 | ) | | (74 | ) |
Charge-offs(1) | | (1 | ) | | — |
| | (3 | ) | | (4 | ) |
Recoveries(3) | | 6 |
| | 37 |
| | 2 |
| | 45 |
|
| Net (charge-offs) recoveries | | 5 |
| | 37 |
| | (1 | ) | | 41 |
|
Allowance for loan losses, end of period(2) | | $ | 12 |
| | $ | 27 |
| | $ | 2 |
| | $ | 41 |
|
| |
| (1) | Includes benefits resulting from recoveries of partial charge-offs due to principal paydowns or payoffs for the periods presented. The benefits included in the charge-offs line item exceeded other charge-offs for both one-to-four family and home equity loan portfolios during the periodthree months ended March 31,September 30, 2018 and 2019, respectively, and March 31, 2018, respectively.for the nine months ended September 30, 2019. The benefits included in the charge-offs line item exceeded other charge-offs for the home equity loan portfolio during the nine months ended September 30, 2018. |
E*TRADE Q3 2019 10-Q | Page 78
E*TRADE FINANCIAL CORPORATION
NOTES TO THE CONDENSED CONSOLIDATED FINANCIAL STATEMENTS (UNAUDITED)
| |
| (2) | Securities-based lending loans were fully collateralized by cash and securities with fair values in excess of borrowings atfor both March 31,the three and nine months ended September 30, 2019 and March 31,September 30, 2018, respectively. |
| |
| (3) | Includes $10 million of recoveries recognized during the three months ended September 30, 2018 and $15 million of recoveries recognized during the nine months ended September 30, 2018 related to the sale of previously charged-off home equity loans. |
Total loans receivable designated as held-for-investment decreased $0.1$0.4 billion during the threenine months ended March 31,September 30, 2019. The allowance for loan losses was $32$27 million, or 1.6%1.5% of total loans receivable, as of March 31,September 30, 2019 compared to $37 million, or 1.7% of total loans receivable, as of December 31, 2018. Net recoveries for the threenine months ended March 31,September 30, 2019 were $7$22 million compared to $5$41 million in the same period in 2018.
The benefit for loan losses was $12$32 million for the threenine months ended March 31,September 30, 2019. The timing and magnitude of the provision (benefit) for loan losses is affected by many factors that could result in variability. These benefits reflected better than expected performance of our portfolio as well as recoveries in excess of prior expectations, including sales of charged-off loans and recoveries of previous charge-offs, as applicable, that were not included in our loss estimates.
E*TRADE Q1 2019 10-Q | Page 67
E*TRADE FINANCIAL CORPORATION
NOTES TO THE CONDENSED CONSOLIDATED FINANCIAL STATEMENTS (UNAUDITED)
The following table presents the total recorded investment in loans receivable and allowance for loan losses by loans that have been collectively evaluated for impairment and those that have been individually evaluated for impairment by loan portfolio (dollars in millions): | | | | Recorded Investment | | Allowance for Loan Losses | Recorded Investment | | Allowance for Loan Losses |
| | March 31, | | December 31, | | March 31, | | December 31, | September 30, | | December 31, | | September 30, | | December 31, |
| | 2019 | | 2018 | | 2019 | | 2018 | 2019 | | 2018 | | 2019 | | 2018 |
| Collectively evaluated for impairment: | | | | | | | | | | | | | | |
| One- to four-family | $ | 829 |
| | $ | 891 |
| | $ | 4 |
| | $ | 4 |
| $ | 694 |
| | $ | 891 |
| | $ | 1 |
| | $ | 4 |
|
| Home equity | 653 |
| | 698 |
| | 4 |
| | 7 |
| 561 |
| | 698 |
| | 2 |
| | 7 |
|
| Consumer | 106 |
| | 119 |
| | 2 |
| | 2 |
| 86 |
| | 119 |
| | 2 |
| | 2 |
|
| Securities-based lending | 97 |
| | 107 |
| | — |
| | — |
| 142 |
| | 107 |
| | — |
| | — |
|
| Total collectively evaluated for impairment | 1,685 |
| | 1,815 |
| | 10 |
| | 13 |
| 1,483 |
| | 1,815 |
| | 5 |
| | 13 |
|
| Individually evaluated for impairment: | | | | | | | | | | | | | | |
| One- to four-family | 180 |
| | 187 |
| | 5 |
| | 5 |
| 172 |
| | 187 |
| | 5 |
| | 5 |
|
| Home equity | 132 |
| | 138 |
| | 17 |
| | 19 |
| 119 |
| | 138 |
| | 17 |
| | 19 |
|
| Total individually evaluated for impairment | 312 |
| | 325 |
| | 22 |
| | 24 |
| 291 |
| | 325 |
| | 22 |
| | 24 |
|
| Total | $ | 1,997 |
| | $ | 2,140 |
| | $ | 32 |
| | $ | 37 |
| $ | 1,774 |
| | $ | 2,140 |
| | $ | 27 |
| | $ | 37 |
|
Impaired Loans—Troubled Debt Restructurings
The Company considers a loan to be impaired when it meets the definition of a TDR. Delinquency status is the primary measure the Company uses to evaluate the performance of loans modified as TDRs. The Company classifies loans as nonperforming when they are no longer accruing interest. The recorded investment in loans modified as TDRs includes the charge-offs related to certain loans that were written down to estimated current value of the underlying property less estimated selling costs.
E*TRADE Q1Q3 2019 10-Q | Page 6879
E*TRADE FINANCIAL CORPORATION
NOTES TO THE CONDENSED CONSOLIDATED FINANCIAL STATEMENTS (UNAUDITED)
The following table presents a summary of the Company’s recorded investment in TDRs that were on accrual and nonaccrual status, further disaggregated by delinquency status (dollars in millions):
| | | | | | Nonaccrual TDRs | | | | | Nonaccrual TDRs | | |
| | Accrual TDRs(1) | | Current(2) | | 30-89 Days Delinquent | | 90-179 Days Delinquent | | 180+ Days Delinquent | | Total Recorded Investment in TDRs (3)(4) | Accrual TDRs(1) | | Current(2) | | 30-89 Days Delinquent | | 90-179 Days Delinquent | | 180+ Days Delinquent | | Total Recorded Investment in TDRs (3)(4) |
| March 31, 2019: | | | | | | | | | | | | |
| September 30, 2019: | | | | | | | | | | | | |
| One- to four-family | $ | 85 |
| | $ | 61 |
| | $ | 10 |
| | $ | 4 |
| | $ | 20 |
| | $ | 180 |
| $ | 83 |
| | $ | 60 |
| | $ | 10 |
| | $ | 2 |
| | $ | 17 |
| | $ | 172 |
|
| Home equity | 85 |
| | 23 |
| | 9 |
| | 3 |
| | 12 |
| | 132 |
| 78 |
| | 22 |
| | 7 |
| | 3 |
| | 9 |
| | 119 |
|
| Total | $ | 170 |
| | $ | 84 |
| | $ | 19 |
| | $ | 7 |
| | $ | 32 |
| | $ | 312 |
| $ | 161 |
| | $ | 82 |
| | $ | 17 |
| | $ | 5 |
| | $ | 26 |
| | $ | 291 |
|
| | | | | | | | | | | | | | | | | | | | | | | |
| December 31, 2018: | | | | | | | | | | | | | | | | | | | | | | |
| One- to four-family | $ | 87 |
| | $ | 61 |
| | $ | 12 |
| | $ | 4 |
| | $ | 23 |
| | $ | 187 |
| $ | 87 |
| | $ | 61 |
| | $ | 12 |
| | $ | 4 |
| | $ | 23 |
| | $ | 187 |
|
| Home equity | 90 |
| | 23 |
| | 8 |
| | 5 |
| | 12 |
| | 138 |
| 90 |
| | 23 |
| | 8 |
| | 5 |
| | 12 |
| | 138 |
|
| Total | $ | 177 |
| | $ | 84 |
| | $ | 20 |
| | $ | 9 |
| | $ | 35 |
| | $ | 325 |
| $ | 177 |
| | $ | 84 |
| | $ | 20 |
| | $ | 9 |
| | $ | 35 |
| | $ | 325 |
|
| |
| (1) | Represents loans modified as TDRs that are current and have made six or more consecutive payments. |
| |
| (2) | Represents loans modified as TDRs that are current but have not yet made six consecutive payments, bankruptcy loans and certain junior lien TDRs that have a delinquent senior lien. |
| |
| (3) | Total recorded investment in TDRs includes premium (discount), as applicable, and is net of charge-offs, which were $53$48 million and $115$102 million for one-to four-family and home equity loans, respectively, as of March 31,September 30, 2019 and $55 million and $121 million, respectively, as of December 31, 2018. |
| |
| (4) | Total recorded investment in TDRs at March 31,September 30, 2019 consisted of $245$231 million of loans modified as TDRs and $67$60 million of loans that have been charged off due to bankruptcy notification. Total recorded investment in TDRs at December 31, 2018 consisted of $253 million of loans modified as TDRs and $72 million of loans that have been charged off due to bankruptcy notification. |
The following table presents the monthly average recorded investment and interest income recognized both on a cash and accrual basis for the Company's TDRs (dollars in millions): | | | | Average Recorded Investment | | Interest Income Recognized | Average Recorded Investment | | Interest Income Recognized |
| | Three Months Ended March 31, | | Three Months Ended March 31, | Three Months Ended September 30, | | Three Months Ended September 30, |
| | 2019 | | 2018 | | 2019 | | 2018 | 2019 | | 2018 | | 2019 | | 2018 |
| One- to four-family | $ | 184 |
| | $ | 210 |
| | $ | 2 |
| | $ | 2 |
| $ | 175 |
| | $ | 198 |
| | $ | 2 |
| | $ | 2 |
|
| Home equity | 135 |
| | 165 |
| | 3 |
| | 4 |
| 122 |
| | 148 |
| | 2 |
| | 4 |
|
| Total | $ | 319 |
| | $ | 375 |
| | $ | 5 |
| | $ | 6 |
| $ | 297 |
| | $ | 346 |
| | $ | 4 |
| | $ | 6 |
|
| | | | | |
| | | Average Recorded Investment | | Interest Income Recognized |
| | | Nine Months Ended September 30, | | Nine Months Ended September 30, |
| | | 2019 | | 2018 | | 2019 | | 2018 |
| One- to four-family | | $ | 179 |
| | $ | 205 |
| | $ | 6 |
| | $ | 6 |
|
| Home equity | | 129 |
| | 156 |
| | 8 |
| | 10 |
|
| Total | | $ | 308 |
| | $ | 361 |
| | $ | 14 |
| | $ | 16 |
|
E*TRADE Q1Q3 2019 10-Q | Page 6980
E*TRADE FINANCIAL CORPORATION
NOTES TO THE CONDENSED CONSOLIDATED FINANCIAL STATEMENTS (UNAUDITED)
The following table presents detailed information related to the Company’s TDRs and specific valuation allowances (dollars in millions): | | | | March 31, 2019 | | December 31, 2018 | September 30, 2019 | | December 31, 2018 |
| | Recorded Investment in TDRs | | Specific Valuation Allowance | | Net Investment in TDRs | | Recorded Investment in TDRs | | Specific Valuation Allowance | | Net Investment in TDRs | Recorded Investment in TDRs | | Specific Valuation Allowance | | Net Investment in TDRs | | Recorded Investment in TDRs | | Specific Valuation Allowance | | Net Investment in TDRs |
| With a recorded allowance: | | | | | | | | | | | | | | | | | | | | | | |
| One- to four-family | $ | 49 |
| | $ | 5 |
| | $ | 44 |
| | $ | 50 |
| | $ | 5 |
| | $ | 45 |
| $ | 47 |
| | $ | 5 |
| | $ | 42 |
| | $ | 50 |
| | $ | 5 |
| | $ | 45 |
|
| Home equity | $ | 57 |
| | $ | 17 |
| | $ | 40 |
| | $ | 60 |
| | $ | 19 |
| | $ | 41 |
| $ | 52 |
| | $ | 17 |
| | $ | 35 |
| | $ | 60 |
| | $ | 19 |
| | $ | 41 |
|
Without a recorded allowance:(1) | | | | | | | | | | | | | | | | | | | | | | |
| One- to four-family | $ | 131 |
| | $ | — |
| | $ | 131 |
| | $ | 137 |
| | $ | — |
| | $ | 137 |
| $ | 125 |
| | $ | — |
| | $ | 125 |
| | $ | 137 |
| | $ | — |
| | $ | 137 |
|
| Home equity | $ | 75 |
| | $ | — |
| | $ | 75 |
| | $ | 78 |
| | $ | — |
| | $ | 78 |
| $ | 67 |
| | $ | — |
| | $ | 67 |
| | $ | 78 |
| | $ | — |
| | $ | 78 |
|
| Total: | | | | | | | | | | | | | | | | | | | | | | |
| One- to four-family | $ | 180 |
| | $ | 5 |
| | $ | 175 |
| | $ | 187 |
| | $ | 5 |
| | $ | 182 |
| $ | 172 |
| | $ | 5 |
| | $ | 167 |
| | $ | 187 |
| | $ | 5 |
| | $ | 182 |
|
| Home equity | $ | 132 |
| | $ | 17 |
| | $ | 115 |
| | $ | 138 |
| | $ | 19 |
| | $ | 119 |
| $ | 119 |
| | $ | 17 |
| | $ | 102 |
| | $ | 138 |
| | $ | 19 |
| | $ | 119 |
|
| |
| (1) | Represents loans where the discounted cash flow analysis or collateral value is equal to or exceeds the recorded investment in the loan. |
E*TRADE Q3 2019 10-Q | Page 81
E*TRADE FINANCIAL CORPORATION
NOTES TO THE CONDENSED CONSOLIDATED FINANCIAL STATEMENTS (UNAUDITED)
The following table presents the number of loans and post-modification balances immediately after being modified by major class (dollars in millions): | | | | Three Months Ended | Three Months Ended |
| | | | Interest Rate Reduction | | | | | | | Interest Rate Reduction | | | | |
| | Number of
Loans | | Re-age/
Extension/
Interest
Capitalization | | Other with
Interest Rate
Reduction | | Other(1) | | Total | Number of
Loans | | Re-age/
Extension/
Interest
Capitalization | | Other with
Interest Rate
Reduction | | Other(1) | | Total |
| March 31, 2019: | | | | | | | | | |
| September 30, 2019: | | | | | | | | | |
| One- to four-family | 9 | | $ | 1 |
| | $ | — |
| | $ | 1 |
| | $ | 2 |
| 7 | | $ | 4 |
| | $ | — |
| | $ | 1 |
| | $ | 5 |
|
| Home equity | 11 | | 1 |
| | — |
| | — |
| | 1 |
| 15 | | 1 |
| | — |
| | — |
| | 1 |
|
| Total | 20 | | $ | 2 |
| | $ | — |
| | $ | 1 |
| | $ | 3 |
| 22 | | $ | 5 |
| | $ | — |
| | $ | 1 |
| | $ | 6 |
|
| | | | | | | | | | | | | | | | | |
| March 31, 2018: | | | | | | | | | |
| September 30, 2018: | | | | | | | | | |
| One- to four-family | 16 | | $ | 6 |
| | $ | — |
| | $ | 2 |
| | $ | 8 |
| 11 | | $ | 2 |
| | $ | — |
| | $ | 2 |
| | $ | 4 |
|
| Home equity | 44 | | 2 |
| | — |
| | — |
| | 2 |
| 15 | | — |
| | — |
| | 1 |
| | 1 |
|
| Total | 60 | | $ | 8 |
| | $ | — |
| | $ | 2 |
| | $ | 10 |
| 26 | | $ | 2 |
| | $ | — |
| | $ | 3 |
| | $ | 5 |
|
| | | | | | | | | | |
| | | Nine Months Ended |
| | | | | Interest Rate Reduction | | | | |
| | | Number of
Loans | | Re-age/
Extension/
Interest
Capitalization | | Other with
Interest Rate
Reduction | | Other(1) | | Total |
| September 30, 2019: | | | | | | | | | |
| One- to four-family | | 23 | | $ | 6 |
| | $ | — |
| | $ | 4 |
| | $ | 10 |
|
| Home equity | | 35 | | 2 |
| | — |
| | — |
| | 2 |
|
| Total | | 58 | | $ | 8 |
| | $ | — |
| | $ | 4 |
| | $ | 12 |
|
| | | | | | | | | | |
| September 30, 2018: | | | | | | | | | |
| One- to four-family | | 46 | | $ | 14 |
| | $ | — |
| | $ | 6 |
| | $ | 20 |
|
| Home equity | | 75 | | 4 |
| | 1 |
| | 1 |
| | 6 |
|
| Total | | 121 | | $ | 18 |
| | $ | 1 |
| | $ | 7 |
| | $ | 26 |
|
| |
| (1) | Amounts represent loans whose terms were modified in a manner that did not result in an interest rate reduction, including re-aged loans, extensions, and loans with capitalized interest. |
E*TRADE Q1Q3 2019 10-Q | Page 7082
E*TRADE FINANCIAL CORPORATION
NOTES TO THE CONDENSED CONSOLIDATED FINANCIAL STATEMENTS (UNAUDITED)
|
|
| NOTE 7—DERIVATIVE INSTRUMENTS AND HEDGING ACTIVITIES |
Presentation on the Consolidated Balance Sheet
Hedging Instruments
The Company utilizes fair value hedges to offset exposure to changes in value of certain fixed-rate assets. The following table presents a summary of the fair value of derivatives as reported in the consolidated balance sheet (dollars in millions):
| | | | | | Fair Value | | | Fair Value |
| | Notional | | Asset(1) | | Liability(2) | | Net(3) | Notional | | Asset(1) | | Liability | | Net(2) |
| March 31, 2019: | | | | | | | | |
| September 30, 2019: | | | | | | | | |
| Interest rate contracts: | | | | | | | | | | | | | | |
| Fair value hedges | $ | 11,578 |
| | $ | — |
| | $ | (2 | ) | | $ | (2 | ) | |
Fair value hedges(3) | | $ | 10,643 |
| | $ | — |
| | $ | — |
| | $ | — |
|
Total derivatives designated as hedging instruments(4) | $ | 11,578 |
| | $ | — |
| | $ | (2 | ) | | $ | (2 | ) | $ | 10,643 |
| | $ | — |
| | $ | — |
| | $ | — |
|
| | | | | | | | | | | | | | | |
| December 31, 2018: | | | | | | | | | | | | | | |
| Interest rate contracts: | | | | | | | | | | | | | | |
| Fair value hedges | $ | 9,763 |
| | $ | 1 |
| | $ | — |
| | $ | 1 |
| $ | 9,763 |
| | $ | 1 |
| | $ | — |
| | $ | 1 |
|
Total derivatives designated as hedging instruments(4) | $ | 9,763 |
| | $ | 1 |
| | $ | — |
| | $ | 1 |
| $ | 9,763 |
| | $ | 1 |
| | $ | — |
| | $ | 1 |
|
| |
| (1) | Reflected in the other assets line item on the consolidated balance sheet. |
| |
| (2) | Reflected in the other liabilities line item on the consolidated balance sheet. |
| |
(3) | Represents net fair value of derivative instruments for disclosure purposes only. |
| |
| (3) | As of September 30, 2019, there are no bilateral derivative contracts. |
| |
| (4) | All derivatives were designated as hedging instruments at March 31,September 30, 2019 and December 31, 2018. |
The consolidated balance sheet and the table above exclude derivative assets of $5 million and $175 million at September 30, 2019 and December 31, 2018, respectively and derivative liabilities of $772 million and $131 million for the followingsame periods. These contracts that were executed through a central clearing organization and were settled by variation margin payments:
Derivative assets of $60 million and $175 million at March 31, 2019 and December 31, 2018, respectively
Derivative liabilities of $264 million and $131 million at March 31, 2019 and December 31, 2018, respectivelypayments.
E*TRADE Q1Q3 2019 10-Q | Page 7183
E*TRADE FINANCIAL CORPORATION
NOTES TO THE CONDENSED CONSOLIDATED FINANCIAL STATEMENTS (UNAUDITED)
Credit Risk
As the majorityall of the derivatives that the Company utilizes in its hedging activities at September 30, 2019 are subject to derivatives clearing agreements (cleared derivatives contracts), the credit risk associated with these cleared derivatives contracts is largely mitigated by the daily variation margin exchanged with counterparties. For other derivative contracts, the Company also monitors collateral requirements through credit support agreements, which reduce risk by permitting the netting of transactions with the same counterparty upon the occurrence of certain events. During the threenine months ended March 31,September 30, 2019, the consideration of counterparty credit risk did not result in an adjustment to the valuation of the Company’s derivative instruments.
Hedged Assets
The following table presents the cumulative basis adjustments related to the carrying amount of hedged assets in fair value hedging relationships (dollars in millions): | | | | | | Cumulative Amount of Fair Value Hedging Basis Adjustment Included in Carrying Amount of Hedged Assets(2) | | | Cumulative Amount of Fair Value Hedging Basis Adjustment Included in Carrying Amount of Hedged Assets(2) |
| | Carrying Amount of Hedged Assets(1) | | Total | | Discontinued | Carrying Amount of Hedged Assets(1) | | Total | | Discontinued |
| March 31, 2019: | | | | | | |
| September 30, 2019: | | | | | | |
Available-for-sale securities(3) | $ | 14,830 |
| | $ | 276 |
| | $ | (343 | ) | $ | 13,386 |
| | $ | 891 |
| | $ | (274 | ) |
| | | | | | | | | | | |
| December 31, 2018: | | | | | | | | | | |
Available-for-sale securities(3) | $ | 13,203 |
| | $ | (10 | ) | | $ | (385 | ) | $ | 13,203 |
| | $ | (10 | ) | | $ | (385 | ) |
| |
| (1) | The carrying amount includes the impact of basis adjustments on active fair value hedges and the impact of basis adjustments from previously discontinued fair value hedges. |
| |
| (2) | Represents the increase (decrease) to the carrying amount of hedged assets. The discontinued portion of the cumulative amount of fair value hedging basis adjustments is amortized into net interest income using the effective interest method over the expected remaining life of the hedged items. |
| |
| (3) | Includes the amortized cost basis of closed portfolios of prepayable securities designated in hedging relationships in which the hedged item is the last layer of principal expected to be remaining throughout the hedge term. As of March 31,September 30, 2019 and December 31, 2018, respectively, the amortized cost basis of this portfolio was $1.0 billion$45 million and $810 million, the amount of the designated hedged items was $250$30 million and $192 million and the cumulative basis adjustments associated with these hedges was $2$1 million and $6 million. |
E*TRADE Q1Q3 2019 10-Q | Page 7284
E*TRADE FINANCIAL CORPORATION
NOTES TO THE CONDENSED CONSOLIDATED FINANCIAL STATEMENTS (UNAUDITED)
Presentation on the Consolidated Statement of Income
The following table presents the effects of fair value hedge accounting on the consolidated statement of income (dollars in millions): | | | | Interest Income | Interest Income |
| | Three Months Ended March 31, | Three Months Ended September 30, | | Nine Months Ended September 30, |
| | 2019 | | 2018 | 2019 | | 2018 | | 2019 | | 2018 |
| | | | | | | | | | | |
| Total interest income | $ | 555 |
| | $ | 468 |
| $ | 521 |
| | $ | 514 |
| | $ | 1,636 |
| | $ | 1,471 |
|
| | | | | | | | | | | |
Effects of fair value hedging on total interest income(1)(2) | | | | | | | | | | |
| Agency debentures: | | | | | | | | | | |
| Amounts recognized as interest accruals on derivatives | — |
| | (2 | ) | — |
| | (1 | ) | | — |
| | (4 | ) |
| Changes in fair value of hedged items | 7 |
| | (50 | ) | 30 |
| | (8 | ) | | 61 |
| | (74 | ) |
| Changes in fair value of derivatives | (7 | ) | | 49 |
| (29 | ) | | 8 |
| | (61 | ) | | 74 |
|
| Net loss on fair value hedging relationships - agency debentures | — |
| | (3 | ) | 1 |
| | (1 | ) | | — |
| | (4 | ) |
| | | | | | | | | | | |
| Agency mortgage backed securities: | | | | |
| Agency mortgage-backed securities: | | | | | | | | |
| Amounts recognized as interest accruals on derivatives | 3 |
| | (13 | ) | (3 | ) | | 1 |
| | 1 |
| | (14 | ) |
| Amortization of basis adjustments from discontinued hedges | 10 |
| | 2 |
| 8 |
| | 7 |
| | 27 |
| | 16 |
|
| Changes in fair value of hedged items | 274 |
| | (231 | ) | 258 |
| | (88 | ) | | 946 |
| | (416 | ) |
| Changes in fair value of derivatives | (273 | ) | | 229 |
| (260 | ) | | 83 |
| | (946 | ) | | 403 |
|
| Net gain (loss) on fair value hedging relationships - agency mortgage backed securities | 14 |
| | (13 | ) | |
| Net gain (loss) on fair value hedging relationships - agency mortgage-backed securities | | 3 |
| | 3 |
| | 28 |
| | (11 | ) |
| Total net gain (loss) on fair value hedging relationships | $ | 14 |
| | $ | (16 | ) | $ | 4 |
| | $ | 2 |
| | $ | 28 |
| | $ | (15 | ) |
| |
| (1) | Excludes interest income accruals on hedged items and amounts recognized upon the sale of securities attributable to fair value hedge accounting. |
| |
| (2) | Excludes interest on variation margin related to centrally cleared derivative contracts. |
The following table presents the significant components of deposits (dollars in millions): |
| | | | | | | |
| | March 31, 2019 | | December 31, 2018 |
| Sweep deposits | $ | 38,639 |
| | $ | 39,322 |
|
Savings deposits(1) | 5,790 |
| | 4,133 |
|
Other deposits(2) | 1,899 |
| | 1,858 |
|
| Total deposits | $ | 46,328 |
| | $ | 45,313 |
|
| |
(1) | Includes $3.8 billion and $2.0 billion of deposits at March 31, 2019 and December 31, 2018, respectively, in our Premium Savings Account product. |
| |
(2) | Includes checking deposits, money market deposits and certificates of deposit. As of March 31, 2019, and December 31, 2018, the Company had $198 million and $193 million in non-interest bearing deposits, respectively. |
E*TRADE Q1Q3 2019 10-Q | Page 7385
E*TRADE FINANCIAL CORPORATION
NOTES TO THE CONDENSED CONSOLIDATED FINANCIAL STATEMENTS (UNAUDITED)
The following table presents the significant components of deposits (dollars in millions): |
| | | | | | | |
| | September 30, 2019 | | December 31, 2018 |
| Sweep deposits | $ | 30,778 |
| | $ | 39,322 |
|
Savings deposits(1) | 7,964 |
| | 4,133 |
|
Other deposits(2) | 1,640 |
| | 1,858 |
|
| Total deposits | $ | 40,382 |
| | $ | 45,313 |
|
| |
| (1) | Includes $6.3 billion and $2.0 billion of deposits at September 30, 2019, and December 31, 2018, respectively, in our Premium Savings Account product. |
| |
| (2) | Includes checking deposits, money market deposits and certificates of deposit. As of September 30, 2019 and December 31, 2018, the Company had $183 million and $193 million in non-interest bearing deposits, respectively. |
The Company moved $6.6 billion of deposits to third-party banks in June 2019 as part of the Company's balance sheet repositioning. See Note 5—Available-for-Sale and Held-to-Maturity Securities for additional information.
|
|
| NOTE 9—OTHER BORROWINGS AND CORPORATE DEBT |
Other Borrowings
The following table presents the Company's external lines of credit at March 31,September 30, 2019 (dollars in millions):
| | | Description | Maturity Date | Borrower | Outstanding | Available | Maturity Date | Borrower | Outstanding | Available |
Unsecured, committed revolving credit facility(1) | June 2020 | ETFC | $ | — |
| $ | 300 |
| |
Senior unsecured, committed revolving credit facility(1) | | June 2024 | ETFC | $ | — |
| $ | 300 |
|
| FHLB secured credit facility | Determined at trade | ETB | 300 |
| $ | 6,231 |
| Determined at trade | ETB | $ | — |
| $ | 7,290 |
|
| Federal Reserve Bank discount window | Overnight | ETB | — |
| $ | 941 |
| Overnight | ETB | $ | — |
| $ | 1,131 |
|
Senior unsecured, committed revolving credit facility(2) | June 2019 | ETS | — |
| $ | 600 |
| June 2020 | ETS | $ | — |
| $ | 600 |
|
| Secured, committed lines of credit | June 2019 | ETS | — |
| $ | 175 |
| June 2020 | ETS | $ | — |
| $ | 175 |
|
| Unsecured, uncommitted lines of credit | June 2019 | ETS | — |
| $ | 50 |
| June 2020 | ETS | $ | — |
| $ | 50 |
|
| Unsecured, uncommitted lines of credit | None | ETS | — |
| $ | 75 |
| None | ETS | $ | — |
| $ | 75 |
|
| Secured, uncommitted lines of credit | None | ETS | — |
| $ | 375 |
| None | ETS | $ | — |
| $ | 425 |
|
| Total other borrowings | | $ | 300 |
|
|
| |
| |
| (1) | On June 21, 2019, the Company entered into a new five year, $300 million senior unsecured committed revolving credit facility, which replaced its three year senior unsecured committed revolving credit facility entered into on June 23, 2017. The senior unsecured committed revolving credit facility contains certain covenants, including maintenance covenants related to the Company's interest coverage, leverage and regulatory net capital ratios with which the Company was in compliance at March 31,September 30, 2019. |
| |
| (2) | On June 21, 2019, E*TRADE Securities entered into a 364-day, $600 million senior unsecured committed revolving credit facility, which replaced its 364-day senior unsecured committed revolving credit facility entered into on June 22, 2018. The senior unsecured committed revolving credit facility contains certain covenants, including maintenance covenants related to E*TRADE Securities' minimum consolidated tangible net worth and regulatory net capital ratio with which the Company was in compliance at March 31,September 30, 2019. |
Corporate Debt
The following table presents the significant components of E*TRADE Financial's corporate debt (dollars in millions): |
| | | | | | | | | | | |
| | Face Value | | Discount | | Net |
| March 31, 2019: | | | | | |
| Interest-bearing notes: | | | | | |
| 2.95% Senior Notes, due 2022 | $ | 600 |
| | $ | (4 | ) | | $ | 596 |
|
| 3.80% Senior Notes, due 2027 | 400 |
| | (3 | ) | | 397 |
|
| 4.50% Senior Notes, due 2028 | 420 |
| | (4 | ) | | 416 |
|
| Total corporate debt | $ | 1,420 |
| | $ | (11 | ) | | $ | 1,409 |
|
|
| | | | | | | | | | | |
| December 31, 2018: | | | | | |
| Interest-bearing notes: | | | | | |
| 2.95% Senior Notes, due 2022 | $ | 600 |
| | $ | (4 | ) | | $ | 596 |
|
| 3.80% Senior Notes, due 2027 | 400 |
| | (3 | ) | | 397 |
|
| 4.50% Senior Notes, due 2028 | 420 |
| | (4 | ) | | 416 |
|
| Total corporate debt | $ | 1,420 |
| | $ | (11 | ) | | $ | 1,409 |
|
E*TRADE Q1Q3 2019 10-Q | Page 7486
E*TRADE FINANCIAL CORPORATION
NOTES TO THE CONDENSED CONSOLIDATED FINANCIAL STATEMENTS (UNAUDITED)
Corporate Debt
The following tables present the significant components of E*TRADE Financial's corporate debt (dollars in millions): |
| | | | | | | | | | | |
| | Face Value | | Discount | | Net |
| September 30, 2019: | | | | | |
| Interest-bearing notes: | | | | | |
| 2.95% Senior Notes, due 2022 | $ | 600 |
| | $ | (3 | ) | | $ | 597 |
|
| 3.80% Senior Notes, due 2027 | 400 |
| | (3 | ) | | 397 |
|
| 4.50% Senior Notes, due 2028 | 420 |
| | (4 | ) | | 416 |
|
| Total corporate debt | $ | 1,420 |
| | $ | (10 | ) | | $ | 1,410 |
|
|
| | | | | | | | | | | |
| December 31, 2018: | | | | | |
| Interest-bearing notes: | | | | | |
| 2.95% Senior Notes, due 2022 | $ | 600 |
| | $ | (4 | ) | | $ | 596 |
|
| 3.80% Senior Notes, due 2027 | 400 |
| | (3 | ) | | 397 |
|
| 4.50% Senior Notes, due 2028 | 420 |
| | (4 | ) | | 416 |
|
| Total corporate debt | $ | 1,420 |
| | $ | (11 | ) | | $ | 1,409 |
|
|
|
| NOTE 10—LEASE ARRANGEMENTS |
The Company enters into non-cancelable operating leases for its corporate offices, retail branches and other facilities. These leases have remaining terms ranging from less than one to 1312 years, and the weighted-average remaining lease term for these leases is 9.18.7 years. Most leases include one or more options to renew, with renewal terms that can extend the lease term up to 10 years. Only those renewal terms that the Company is reasonably certain of exercising are included in the calculation of the lease liability. Leases that have not yet commenced at March 31,September 30, 2019 will have an immaterial impact on the Company's right-of-use assets and lease liabilities. Certain lease agreements include rental payments based on power usage and certain others include rental payments adjustedor that adjust periodically for inflation or costs incurred by the lessor. None of the Company's current lease agreements contain material residual value guarantees or material restrictive covenants.
The following table presents balance sheet information related to the Company's classification of ROU assets and operating lease liabilities (dollars in millions):
| | | | | Classification | | March 31, 2019 | | Classification | | September 30, 2019 |
| Operating lease assets, net | | Other assets | | $ | 201 |
| | Other assets | | $ | 211 |
|
| Operating lease liabilities | | Other liabilities | | $ | 227 |
| | Other liabilities | | $ | 243 |
|
The Company utilizes incremental borrowing rates to determine the present value of lease payments for each lease. As the Company's leases do not provide an implicit rate, the incremental borrowing rate estimates are based on the terms of each lease as well as the interest rate environment at the later of the adoption date of January 1, 2019, lease commencement date or lease remeasurement date. The incremental borrowing rate has also been adjusted to reflect a secured rate. A weighted-average discount rate of 4.4%4.3% was used to calculate the lease liability balances for the Company's operating leases.
E*TRADE Q3 2019 10-Q | Page 87
E*TRADE FINANCIAL CORPORATION
NOTES TO THE CONDENSED CONSOLIDATED FINANCIAL STATEMENTS (UNAUDITED)
Leases with an initial term of twelve months or less are not recorded on the balance sheet; lease expense for these leases is recognized on a straight-line basis over the lease term. The Company has elected not to separate lease and non-lease components for all property leases for the purposes of calculating ROU assets and lease liabilities.
Cash paid for amounts included in the measurement of operating lease liabilities was $8 million and $21 million for the three and nine months ended March 31, 2019 was $7 million.September 30, 2019. The following table presents the significant components of lease expense (dollars in millions):
|
| | | | | | | | | | |
| | | Classification | | Three Months Ended September 30, 2019 | | Nine Months Ended September 30, 2019 |
Operating lease cost(1) | | Occupancy and Equipment | | $ | 10 |
| | $ | 26 |
|
| Variable lease cost | | Occupancy and Equipment | | — |
| | 2 |
|
Net lease expense(2) | | | | $ | 10 |
| | $ | 28 |
|
|
| | | | | | |
| | | Classification | | Three Months Ended March 31, 2019 |
Operating lease cost(1) | | Occupancy and Equipment | | $ | 8 |
|
| Variable lease cost | | Occupancy and Equipment | | 1 |
|
Net lease expense(2) | | | | $ | 9 |
|
| |
| (1) | Includes short-term lease costs which are not material. |
| |
| (2) | Net of sublease income which is not material. |
E*TRADE Q1 2019 10-Q | Page 75
E*TRADE FINANCIAL CORPORATION
NOTES TO THE CONDENSED CONSOLIDATED FINANCIAL STATEMENTS (UNAUDITED)
The following table presents the maturities of lease liabilities (dollars in millions): | | | | Operating Leases | Operating Leases |
| Years ending December 31, | | |
2019(1) | $ | 19 |
| $ | 8 |
|
| 2020 | 33 |
| 37 |
|
| 2021 | 32 |
| 36 |
|
| 2022 | 29 |
| 32 |
|
| 2023 | 30 |
| 33 |
|
| Thereafter | 138 |
| 149 |
|
| Total lease payments | 281 |
| 295 |
|
| Imputed interest | (54 | ) | (52 | ) |
| Present value of lease liabilities | $ | 227 |
| $ | 243 |
|
| |
| (1) | Excludes maturities during the threenine months ended March 31,September 30, 2019. |
The Company executed a sale-leaseback transaction on its Alpharetta, Georgia office in 2014. The transaction was initially accounted for as a financing as it did not qualify for sale accounting. The Company evaluated this transaction as part of the adoption of the new lease guidance in 2019 and concluded that it did not qualify for sale accounting and should continue to be accounted for as a financing. The office building is included in the property and equipment, net line item and the related financing obligation is included in the other liabilities line item in the Company's consolidated balance sheet. Future minimum lease payments and sublease proceeds to be received under the lease are $28$26 million and $12$10 million, respectively.
E*TRADE Q1Q3 2019 10-Q | Page 7688
E*TRADE FINANCIAL CORPORATION
NOTES TO THE CONDENSED CONSOLIDATED FINANCIAL STATEMENTS (UNAUDITED)
|
|
| NOTE 11—SHAREHOLDERS' EQUITY |
Preferred Stock
The following table presents the preferred stock outstanding (in millions except total shares outstanding and per share data): | | | | | | | | | Carrying Value at | | | | | | Carrying Value at |
| Description | | Issuance Date | | Per Annum Dividend Rate | | Total Shares Outstanding | | Liquidation Preference per Share | | March 31, 2019 | | December 31, 2018 | | Issuance Date | | Per Annum Dividend Rate | | Total Shares Outstanding | | Liquidation Preference per Share | | September 30, 2019 | | December 31, 2018 |
| Series A | | | | | | | | | | | | | | | | |
| Fixed-to-Floating Rate Non-Cumulative | | 8/25/2016 | | 5.875% to, but excluding, 9/15/2026; 3-mo LIBOR + 4.435% thereafter | | 400,000 |
| | $ | 1,000 |
| | $ | 394 |
| | $ | 394 |
| | 8/25/2016 | | 5.875% to, but excluding, 9/15/2026; 3-mo LIBOR + 4.435% thereafter | | 400,000 |
| | $ | 1,000 |
| | $ | 394 |
| | $ | 394 |
|
| Series B | | | | | | | | | | | | | | | | |
| Fixed-to-Floating Rate Non-Cumulative | | 12/6/2017 | | 5.30% to, but excluding, 3/15/2023; 3-mo LIBOR + 3.16% thereafter | | 3,000 |
| | $ | 100,000 |
| | 295 |
| | 295 |
| | 12/6/2017 | | 5.30% to, but excluding, 3/15/2023; 3-mo LIBOR + 3.16% thereafter | | 3,000 |
| | $ | 100,000 |
| | 295 |
| | 295 |
|
| Total | | 403,000 |
| | | | $ | 689 |
| | $ | 689 |
| | 403,000 |
| | | | $ | 689 |
| | $ | 689 |
|
Dividend on Preferred Stock
The following table presents the cash dividend paid on preferred stock (in millions except per share data): | | | Three Months Ended March 31, 2019 | | Three Months Ended March 31, 2018 | |
| Nine Months Ended September 30, 2019 | | Nine Months Ended September 30, 2019 | | Nine Months Ended September 30, 2018 |
| Declaration Date | | Record Date | | Payment Date | | Dividend per Share | | Dividend Paid | | Declaration Date | | Record Date | | Payment Date | | Dividend per Share | | Dividend Paid | | Record Date | | Payment Date | | Dividend per Share | | Dividend Paid | | Declaration Date | | Record Date | | Payment Date | | Dividend per Share | | Dividend Paid |
Series A (1) | | | | | | | | | | | | | | | | |
| 2/7/2019 | | 2/28/2019 | | 3/15/2019 | | $ | 29.38 |
| | $ | 12 |
| | 2/8/2018 | | 2/28/2018 | | 3/15/2018 | | $ | 29.38 |
| | $ | 12 |
| | 2/28/2019 | | 3/15/2019 | | $ | 29.38 |
| | $ | 12 |
| | 2/8/2018 | | 2/28/2018 | | 3/15/2018 | | $ | 29.38 |
| | $ | 12 |
|
| 7/25/2019 | | | 8/30/2019 | | 9/16/2019 | | $ | 29.38 |
| | 12 |
| | 7/26/2018 | | 8/31/2018 | | 9/17/2018 | | $ | 29.38 |
| | 12 |
|
Series B (1) | | | | | | | | | | | | | | | | |
| 2/7/2019 | | 2/28/2019 | | 3/15/2019 | | $ | 2,650.00 |
| | 8 |
| | | | | | 2/28/2019 | | 3/15/2019 | | $ | 2,650.00 |
| | 8 |
| | | | |
| 7/25/2019 | | | 8/30/2019 | | 9/16/2019 | | $ | 2,650.00 |
| | 8 |
| | 7/26/2018 | | 8/31/2018 | | 9/17/2018 | | $ | 4,107.50 |
| | 12 |
|
| Total | | | | $ | 20 |
| | | | $ | 12 |
| | | | $ | 40 |
| | | | $ | 36 |
|
| |
| (1) | Dividends are non-cumulative and payable semi-annually, if declared. |
Common Stock
Dividend on Common Stock
On January 23, 2019, the Company's Board of Directors declared a quarterly cash dividend of $0.14 per share, or $35 million, on the Company's outstanding shares of common stock. The dividend was paid on February 15, 2019, to shareholders of record as of the close of business on February 1, 2019. On April 16, 2019, the Company declared a cash dividend for the second quarter of $0.14 per share on our outstanding shares of common stock. The dividend will be paid on May 20, 2019, to shareholders of record as of the close of business on May 13, 2019.
E*TRADE Q1Q3 2019 10-Q | Page 7789
E*TRADE FINANCIAL CORPORATION
NOTES TO THE CONDENSED CONSOLIDATED FINANCIAL STATEMENTS (UNAUDITED)
Common Stock
Dividend on Common Stock
The following table presents the cash dividend paid on common stock (in millions except per share data): |
| | | | | | | | | | | | |
| Nine Months Ended September 30, 2019 |
| Declaration Date | | Record Date | | Payment Date | | Dividend per Share | | Dividend Paid |
| 1/23/2019 | | 2/1/2019 | | 2/15/2019 | | $ | 0.14 |
| | $ | 35 |
|
| 4/16/2019 | | 5/13/2019 | | 5/20/2019 | | $ | 0.14 |
| | 34 |
|
| 7/17/2019 | | 8/19/2019 | | 8/26/2019 | | $ | 0.14 |
| | 34 |
|
| Total | | | | | | | | $ | 103 |
|
On October 16, 2019, the Company declared a cash dividend for the third quarter of $0.14 per share on its outstanding shares of common stock. The dividend is payable on November 15, 2019, to shareholders of record as of the close of business on November 8, 2019.
Share Repurchases
During the three months ended September 30, 2019, the Company completed its prior $1 billion share repurchase program with the repurchase of 3.6 million shares of common stock for a total of $157 million.
In October 2018,July 2019, the Company announced that its Board of Directors has authorized a $1new $1.5 billion share repurchase program. During the three months ended March 31,September 30, 2019, the Company repurchased 2.59.8 million shares of common stock for a total of $120 million.$409 million under this new repurchase program. As of October 29, 2019, the Company had subsequently repurchased an additional 0.9 million shares of common stock at an average price of $40.88. The Company accounts for share repurchases retired after repurchase by allocating the excess repurchase price over par to additional paid-in-capital.
Other Common Stock Activity
Other common stock activity includes shares withheld to pay taxes for share-based compensation, employee stock purchase plan and other activity.
E*TRADE Q3 2019 10-Q | Page 90
E*TRADE FINANCIAL CORPORATION
NOTES TO THE CONDENSED CONSOLIDATED FINANCIAL STATEMENTS (UNAUDITED)
Accumulated Other Comprehensive Loss
The following tables presenttable presents after-tax changes in each component of accumulated other comprehensive loss (dollars in millions): | | | | Three Months Ended March 31, | | | | | |
| | 2019 | | 2018 | 2019 | | 2018 |
Accumulated other comprehensive loss, beginning of period(1) | $ | (275 | ) | | $ | (26 | ) | $ | (275 | ) | | $ | (26 | ) |
| Other comprehensive income (loss) before reclassifications | 112 |
| | (128 | ) | 112 |
| | (128 | ) |
| Amounts reclassified from accumulated other comprehensive loss | (7 | ) | | (7 | ) | (7 | ) | | (7 | ) |
Transfer of held-to-maturity securities to available-for-sale securities(2) | — |
| | 6 |
| — |
| | 6 |
|
| Net change | 105 |
| | (129 | ) | 105 |
| | (129 | ) |
| Cumulative effect of hedge accounting adoption | — |
| | (7 | ) | — |
| | (7 | ) |
| Reclassification of tax effects due to federal tax reform | — |
| | (14 | ) | — |
| | (14 | ) |
| Balance, March 31, | | $ | (170 | ) | | $ | (176 | ) |
| Other comprehensive income (loss) before reclassifications | | 64 |
| | (51 | ) |
| Amounts reclassified from accumulated other comprehensive loss | | 48 |
| | (8 | ) |
| Net change | | 112 |
| | (59 | ) |
| Balance, June 30, | | $ | (58 | ) | | $ | (235 | ) |
| Other comprehensive income (loss) before reclassifications | | 43 |
| | (86 | ) |
| Amounts reclassified from accumulated other comprehensive loss | | (9 | ) | | (8 | ) |
| Net change | | 34 |
| | (94 | ) |
Accumulated other comprehensive loss, end of period(1) | $ | (170 | ) | | $ | (176 | ) | $ | (24 | ) | | $ | (329 | ) |
| |
| (1) | The accumulated other comprehensive loss balances and activities were related to available-for-sale securities in both periods. |
| |
| (2) | Securities with a carrying value of $4.7 billion and related unrealized pre-tax gain of $7 million, or $6 million net of tax, were transferred from held-to-maturity securities to available-for-sale securities during the three months ended March 31, 2018, as part of a one-time transition election for early adopting the new derivatives and hedge accounting guidance. |
The following table presents other comprehensive income (loss) activity and the related tax effect (dollars in millions): |
| | | | | | | | | | | | | | | | | | | | | | | |
| | Three Months Ended March 31, |
| | 2019 | | 2018 |
| | Before Tax | | Tax Effect | | After Tax | | Before Tax | | Tax Effect | | After Tax |
| Other comprehensive income (loss) | | | | | | | | | | | |
| Available-for-sale securities: | | | | | | | | | | | |
| Unrealized gains (losses), net | $ | 150 |
| | $ | (38 | ) | | $ | 112 |
| | $ | (172 | ) | | $ | 44 |
| | $ | (128 | ) |
| Reclassification into earnings, net | (10 | ) | | 3 |
| | (7 | ) | | (10 | ) | | 3 |
| | (7 | ) |
| Transfer of held-to-maturity securities to available-for-sale securities | — |
| | — |
| | — |
| | 7 |
| | (1 | ) | | 6 |
|
| Net change from available-for-sale securities | 140 |
|
| (35 | ) |
| 105 |
| | (175 | ) | | 46 |
| | (129 | ) |
| Other comprehensive income (loss) | $ | 140 |
| | $ | (35 | ) | | $ | 105 |
| | $ | (175 | ) | | $ | 46 |
| | $ | (129 | ) |
E*TRADE Q1Q3 2019 10-Q | Page 7891
E*TRADE FINANCIAL CORPORATION
NOTES TO THE CONDENSED CONSOLIDATED FINANCIAL STATEMENTS (UNAUDITED)
The following table presents other comprehensive income (loss) activity and the related tax effect (dollars in millions): |
| | | | | | | | | | | | | | | | | | | | | | | |
| | Three Months Ended September 30, |
| | 2019 | | 2018 |
| | Before Tax | | Tax Effect | | After Tax | | Before Tax | | Tax Effect | | After Tax |
| Other comprehensive income (loss) | | | | | | | | | | | |
| Available-for-sale securities: | | | | | | | | | | | |
| Unrealized gains (losses), net | $ | 58 |
| | $ | (15 | ) | | $ | 43 |
| | $ | (112 | ) | | $ | 26 |
| | $ | (86 | ) |
| Reclassification into earnings, net | (12 | ) | | 3 |
| | (9 | ) | | (11 | ) | | 3 |
| | (8 | ) |
| Net change from available-for-sale securities | 46 |
| | (12 | ) | | 34 |
| | (123 | ) | | 29 |
| | (94 | ) |
| Other comprehensive income (loss) | $ | 46 |
| | $ | (12 | ) | | $ | 34 |
| | $ | (123 | ) | | $ | 29 |
| | $ | (94 | ) |
| | |
| | Nine Months Ended September 30, |
| | 2019 | | 2018 |
| | Before Tax | | Tax Effect | | After Tax | | Before Tax | | Tax Effect | | After Tax |
| Other comprehensive income (loss) | | | | | | | | | | | |
| Available-for-sale securities: | | | | | | | | | | | |
| Unrealized gains (losses), net | $ | 294 |
| | $ | (75 | ) | | $ | 219 |
| | $ | (353 | ) | | $ | 88 |
| | $ | (265 | ) |
| Reclassification into earnings, net | 43 |
| | (11 | ) | | 32 |
| | (32 | ) | | 9 |
| | (23 | ) |
| Transfer of held-to-maturity securities to available-for-sale securities | — |
| | — |
| | — |
| | 7 |
| | (1 | ) | | 6 |
|
| Net change from available-for-sale securities | 337 |
|
| (86 | ) |
| 251 |
| | (378 | ) | | 96 |
| | (282 | ) |
| Other comprehensive income (loss) | $ | 337 |
| | $ | (86 | ) | | $ | 251 |
| | $ | (378 | ) | | $ | 96 |
| | $ | (282 | ) |
The following table presents the consolidated statement of income line items impacted by reclassifications out of accumulated other comprehensive loss (dollars in millions): | | | Accumulated Other Comprehensive Loss Components | | Amounts Reclassified from Accumulated Other Comprehensive Loss | | Affected Line Items in the Consolidated Statement of Income | | Amounts Reclassified from Accumulated Other Comprehensive Loss | | Affected Line Items in the Consolidated Statement of Income |
| | | Three Months Ended March 31, | | | Three Months Ended September 30, | | Nine Months Ended September 30, | |
| | | 2019 | | 2018 | | | 2019 | | 2018 | | 2019 | | 2018 | |
| Available-for-sale securities: | | $ | 11 |
| | $ | 11 |
| | Gains on securities and other, net | | $ | 13 |
| | $ | 12 |
| | $ | (41 | ) | | $ | 34 |
| | Gains (losses) on securities and other, net |
| | | (1 | ) | | (1 | ) | | Interest income | | (1 | ) | | (1 | ) | | (2 | ) | | (2 | ) | | Interest income |
| | | 10 |
| | 10 |
| | Reclassification into earnings, before tax | | 12 |
| | 11 |
| | (43 | ) | | 32 |
| | Reclassification into earnings, before tax |
| | | (3 | ) | | (3 | ) | | Income tax expense | | (3 | ) | | (3 | ) | | 11 |
| | (9 | ) | | Income tax benefit (expense) |
| | | $ | 7 |
| | $ | 7 |
| | Reclassification into earnings, net | | $ | 9 |
| | $ | 8 |
| | $ | (32 | ) | | $ | 23 |
| | Reclassification into earnings, net |
E*TRADE Q3 2019 10-Q | Page 92
E*TRADE FINANCIAL CORPORATION
NOTES TO THE CONDENSED CONSOLIDATED FINANCIAL STATEMENTS (UNAUDITED)
|
|
| NOTE 12—EARNINGS PER SHARE |
Net income available to common shareholders, or net income less preferred stock dividends, represents the numerator used in the computation of basic and diluted earnings per common share. The denominators used in the computation of basic and diluted earnings per common share are basic and diluted weighted average common shares outstanding, respectively.
Basic weighted average common shares outstanding were 246.3235.8 million and 266.6241.7 million for the three and nine months ended March 31,September 30, 2019, respectively, compared to 259.5 million and 263.3 million for the same periods in 2018. The difference between basic and diluted weighted average common shares outstanding includes the weighted-average dilutive impact of securities, including restricted stock units and awards, dividend equivalent units, employee stock purchase plan shares and stock options, as well as the weighted-average dilutive impact of convertible debentures. This activity represented 0.60.5 million shares for both the three and nine months ended September 30, 2019, compared to 1.2 million and 1.1 million shares for the three months ended March 31, 2019 andsame periods in 2018, andrespectively. This resulted in diluted weighted average common shares outstanding of 246.9236.3 million and 267.7242.2 million for the three and nine months ended September 30, 2019, respectively, compared to 260.7 million and 264.4 million for the same periods.periods in 2018. The amount of certain restricted stock and options excluded from the calculations of diluted earnings per common share due to the anti-dilutive effect was not material for the three and nine months ended March 31,September 30, 2019 and 2018.
E*TRADE Q1Q3 2019 10-Q | Page 7993
E*TRADE FINANCIAL CORPORATION
NOTES TO THE CONDENSED CONSOLIDATED FINANCIAL STATEMENTS (UNAUDITED)
|
|
| NOTE 13—REGULATORY REQUIREMENTS |
Broker-Dealer and FCM Capital Requirements
The Company's US broker-dealer, E*TRADE Securities, is subject to the Uniform Net Capital Rule under the Securities Exchange Act of 1934 administered by the SEC and FINRA, which requires the maintenance of minimum net capital. The minimum net capital requirements can be met under either the Aggregate Indebtedness method or the Alternative method. Under the Aggregate Indebtedness method, a broker-dealer is required to maintain net capital equal to or in excess of the greater of 6 2/3% of its aggregate indebtedness, as defined, or a minimum dollar amount. E*TRADE Securities has elected the Alternative method, under which it is required to maintain net capital equal to the greater of $250,000 or 2% of aggregate debit balances arising from customer transactions. The Company’s international broker-dealer subsidiary is subject to capital requirements determined by its respective regulator.
The Company's FCM, E*TRADE Futures, is subject to CFTC net capital requirements, including the maintenance of adjusted net capital equal to or in excess of the greater of (1) $1,000,000, (2) the FCM's risk-based capital requirement, computed as 8% of the total risk margin requirements for all positions carried in customer and non-customer accounts, or (3) the amount of adjusted net capital required by the NFA.
At March 31,September 30, 2019 and December 31, 2018, all of the Company’s broker-dealer and FCM subsidiaries met applicable minimum net capital requirements. The following table presents a summary of the minimum net capital requirements and excess capital for the Company’s broker-dealer and FCM subsidiaries (dollars in millions): | | | | Required Net Capital | | Net Capital | | Excess Net Capital | Required Net Capital | | Net Capital | | Excess Net Capital |
| March 31, 2019: | | | | | | |
| September 30, 2019: | | | | | | |
E*TRADE Securities(1) | $ | 220 |
| | $ | 1,275 |
| | $ | 1,055 |
| $ | 221 |
| | $ | 1,348 |
| | $ | 1,127 |
|
| E*TRADE Futures | 2 |
| | 26 |
| | 24 |
| 2 |
| | 27 |
| | 25 |
|
| International broker-dealer | — |
| | 19 |
| | 19 |
| |
| Total | $ | 222 |
| | $ | 1,320 |
| | $ | 1,098 |
| |
Total(2) | | $ | 223 |
| | $ | 1,375 |
| | $ | 1,152 |
|
| | | | | | | | | | | |
| December 31, 2018: | | | | | | | | | | |
| E*TRADE Securities | $ | 209 |
| | $ | 1,294 |
| | $ | 1,085 |
| $ | 209 |
| | $ | 1,294 |
| | $ | 1,085 |
|
| E*TRADE Futures | 1 |
| | 26 |
| | 25 |
| 1 |
| | 26 |
| | 25 |
|
| International broker-dealer | — |
| | 18 |
| | 18 |
| — |
| | 18 |
| | 18 |
|
| Total | $ | 210 |
| | $ | 1,338 |
| | $ | 1,128 |
| $ | 210 |
| | $ | 1,338 |
| | $ | 1,128 |
|
| |
| (1) | E*TRADE Securities paid dividends of $250$660 million to the parent company during the threenine months ended March 31,September 30, 2019. |
| |
| (2) | The Company's international broker-dealer de-registered and entered into voluntary liquidation in May 2019. The international broker-dealer was not subject to minimum net capital requirements at September 30, 2019. |
Bank Capital Requirements
E*TRADE Financial and its bank subsidiaries, E*TRADE Bank and E*TRADE Savings Bank, are subject to various regulatory capital requirements administered by federal banking agencies. Failure to meet minimum capital requirements can trigger certain mandatory and possibly additional discretionary actions by regulators that, if undertaken, could have a direct material effect on the financial condition and results of operations of these entities. Under capital adequacy guidelines and the regulatory framework for prompt corrective action, these entities must meet specific capital guidelines that involve quantitative measures of
E*TRADE Q1Q3 2019 10-Q | Page 8094
E*TRADE FINANCIAL CORPORATION
NOTES TO THE CONDENSED CONSOLIDATED FINANCIAL STATEMENTS (UNAUDITED)
assets, liabilities and certain off-balance sheet items as calculated under regulatory accounting practices. In addition, the Company's bank subsidiaries may not pay dividends to the parent company without the non-objection, or in certain cases the approval, of their regulators, and any loans by the bank subsidiaries to the parent company or its other non-bank subsidiaries are subject to various quantitative, arm’s length, collateralization and other requirements. The capital amounts and classifications of these entities are also subject to qualitative judgments by the regulators about components, risk weightings and other factors.
Quantitative measures established by regulation to ensure capital adequacy require these entities to meet minimum Tier 1 leverage, Common Equity Tier 1 capital, Tier 1 risk-based capital and Total risk-based capital ratios. Events beyond management's control, such as deterioration in credit markets, could adversely affect future earnings and their ability to meet future capital requirements. E*TRADE Financial, E*TRADE Bank and E*TRADE Savings Bank were categorized as "well capitalized" under the regulatory framework for prompt corrective action for the periods presented in the following table (dollars in millions): | | | | March 31, 2019 | | December 31, 2018 | September 30, 2019 | | December 31, 2018 |
| | Actual | | Well Capitalized Minimum Capital | | Excess Capital | | Actual | | Well Capitalized Minimum Capital | | Excess Capital | Actual | | Well Capitalized Minimum Capital | | Excess Capital | | Actual | | Well Capitalized Minimum Capital | | Excess Capital |
| | Amount | | Ratio | | Amount | | Ratio | | Amount | | Amount | | Ratio | | Amount | | Ratio | | Amount | Amount | | Ratio | | Amount | | Ratio | | Amount | | Amount | | Ratio | | Amount | | Ratio | | Amount |
E*TRADE Financial(1) | E*TRADE Financial(1) | E*TRADE Financial(1) |
| Tier 1 leverage | $ | 4,267 |
| | 6.7 | % | | $ | 3,180 |
| | 5.0 | % | | $ | 1,087 |
| | $ | 4,097 |
| | 6.6 | % | | $ | 3,101 |
| | 5.0 | % | | $ | 996 |
| $ | 4,044 |
| | 6.9 | % | | $ | 2,940 |
| | 5.0 | % | | $ | 1,104 |
| | $ | 4,097 |
| | 6.6 | % | | $ | 3,101 |
| | 5.0 | % | | $ | 996 |
|
| Common Equity Tier 1 | $ | 3,578 |
| | 30.1 | % | | $ | 773 |
| | 6.5 | % | | $ | 2,805 |
| | $ | 3,408 |
| | 31.1 | % | | $ | 713 |
| | 6.5 | % | | $ | 2,695 |
| $ | 3,355 |
| | 31.4 | % | | $ | 695 |
| | 6.5 | % | | $ | 2,660 |
| | $ | 3,408 |
| | 31.1 | % | | $ | 713 |
| | 6.5 | % | | $ | 2,695 |
|
| Tier 1 risk-based | $ | 4,267 |
| | 35.9 | % | | $ | 951 |
| | 8.0 | % | | $ | 3,316 |
| | $ | 4,097 |
| | 37.3 | % | | $ | 877 |
| | 8.0 | % | | $ | 3,220 |
| $ | 4,044 |
| | 37.8 | % | | $ | 855 |
| | 8.0 | % | | $ | 3,189 |
| | $ | 4,097 |
| | 37.3 | % | | $ | 877 |
| | 8.0 | % | | $ | 3,220 |
|
| Total risk-based | $ | 4,309 |
| | 36.3 | % | | $ | 1,189 |
| | 10.0 | % | | $ | 3,120 |
| | $ | 4,143 |
| | 37.8 | % | | $ | 1,097 |
| | 10.0 | % | | $ | 3,046 |
| $ | 4,079 |
| | 38.2 | % | | $ | 1,069 |
| | 10.0 | % | | $ | 3,010 |
| | $ | 4,143 |
| | 37.8 | % | | $ | 1,097 |
| | 10.0 | % | | $ | 3,046 |
|
E*TRADE Bank(1)(2) | | Tier 1 leverage | $ | 3,640 |
| | 7.1 | % | | $ | 2,563 |
| | 5.0 | % | | $ | 1,077 |
| | $ | 3,484 |
| | 7.1 | % | | $ | 2,461 |
| | 5.0 | % | | $ | 1,023 |
| $ | 3,404 |
| | 7.4 | % | | $ | 2,292 |
| | 5.0 | % | | $ | 1,112 |
| | $ | 3,484 |
| | 7.1 | % | | $ | 2,461 |
| | 5.0 | % | | $ | 1,023 |
|
| Common Equity Tier 1 | $ | 3,640 |
| | 33.9 | % | | $ | 699 |
| | 6.5 | % | | $ | 2,941 |
| | $ | 3,484 |
| | 34.9 | % | | $ | 650 |
| | 6.5 | % | | $ | 2,834 |
| $ | 3,404 |
| | 37.2 | % | | $ | 595 |
| | 6.5 | % | | $ | 2,809 |
| | $ | 3,484 |
| | 34.9 | % | | $ | 650 |
| | 6.5 | % | | $ | 2,834 |
|
| Tier 1 risk-based | $ | 3,640 |
| | 33.9 | % | | $ | 860 |
| | 8.0 | % | | $ | 2,780 |
| | $ | 3,484 |
| | 34.9 | % | | $ | 800 |
| | 8.0 | % | | $ | 2,684 |
| $ | 3,404 |
| | 37.2 | % | | $ | 732 |
| | 8.0 | % | | $ | 2,672 |
| | $ | 3,484 |
| | 34.9 | % | | $ | 800 |
| | 8.0 | % | | $ | 2,684 |
|
| Total risk-based | $ | 3,672 |
| | 34.2 | % | | $ | 1,075 |
| | 10.0 | % | | $ | 2,597 |
| | $ | 3,521 |
| | 35.2 | % | | $ | 999 |
| | 10.0 | % | | $ | 2,522 |
| $ | 3,431 |
| | 37.5 | % | | $ | 916 |
| | 10.0 | % | | $ | 2,515 |
| | $ | 3,521 |
| | 35.2 | % | | $ | 999 |
| | 10.0 | % | | $ | 2,522 |
|
E*TRADE Savings Bank(1) | E*TRADE Savings Bank(1) | E*TRADE Savings Bank(1) |
| Tier 1 leverage | $ | 1,469 |
| | 27.1 | % | | $ | 272 |
| | 5.0 | % | | $ | 1,197 |
| | $ | 1,456 |
| | 26.6 | % | | $ | 273 |
| | 5.0 | % | | $ | 1,183 |
| $ | 1,472 |
| | 41.9 | % | | $ | 176 |
| | 5.0 | % | | $ | 1,296 |
| | $ | 1,456 |
| | 26.6 | % | | $ | 273 |
| | 5.0 | % | | $ | 1,183 |
|
| Common Equity Tier 1 | $ | 1,469 |
| | 180.2 | % | | $ | 53 |
| | 6.5 | % | | $ | 1,416 |
| | $ | 1,456 |
| | 169.4 | % | | $ | 56 |
| | 6.5 | % | | $ | 1,400 |
| $ | 1,472 |
| | 213.0 | % | | $ | 45 |
| | 6.5 | % | | $ | 1,427 |
| | $ | 1,456 |
| | 169.4 | % | | $ | 56 |
| | 6.5 | % | | $ | 1,400 |
|
| Tier 1 risk-based | $ | 1,469 |
| | 180.2 | % | | $ | 65 |
| | 8.0 | % | | $ | 1,404 |
| | $ | 1,456 |
| | 169.4 | % | | $ | 69 |
| | 8.0 | % | | $ | 1,387 |
| $ | 1,472 |
| | 213.0 | % | | $ | 56 |
| | 8.0 | % | | $ | 1,416 |
| | $ | 1,456 |
| | 169.4 | % | | $ | 69 |
| | 8.0 | % | | $ | 1,387 |
|
| Total risk-based | $ | 1,470 |
| | 180.3 | % | | $ | 82 |
| | 10.0 | % | | $ | 1,388 |
| | $ | 1,456 |
| | 169.4 | % | | $ | 86 |
| | 10.0 | % | | $ | 1,370 |
| $ | 1,472 |
| | 213.0 | % | | $ | 69 |
| | 10.0 | % | | $ | 1,403 |
| | $ | 1,456 |
| | 169.4 | % | | $ | 86 |
| | 10.0 | % | | $ | 1,370 |
|
| |
| (1) | Basel III includes a capital conservation buffer that limits a banking organization’s ability to make capital distributions and discretionary bonus payments to executive officers if a banking organization fails to maintain a Common Equity Tier 1 capital conservation buffer of more than 2.5%, on a fully phased-in basis, of total risk-weighted assets above each of the following minimum risk-based capital ratio requirements: Common Equity Tier 1 capital (4.5%), Tier 1 risk-based capital (6.0%), and Total risk-based capital (8.0%). This requirement was effective beginning on January 1, 2016, and became fully phased-in on January 1, 2019. |
| |
| (2) | E*TRADE Bank paid dividends of $535 million to the parent company during the three months ended September 30, 2019. |
E*TRADE Q1Q3 2019 10-Q | Page 8195
E*TRADE FINANCIAL CORPORATION
NOTES TO THE CONDENSED CONSOLIDATED FINANCIAL STATEMENTS (UNAUDITED)
|
|
| NOTE 14—COMMITMENTS, CONTINGENCIES AND OTHER REGULATORY MATTERS |
The Company reviews its lawsuits, regulatory inquiries and other legal proceedings on an ongoing basis and provides disclosure and records loss contingencies in accordance with the loss contingencies accounting guidance. The Company establishes an accrual for losses at management's best estimate when it assesses that it is probable that a loss has been incurred and the amount of the loss can be reasonably estimated. The Company monitors these matters for developments that would affect the likelihood of a loss and the accrued amount, if any, and adjusts the amount as appropriate.
Litigation Matters
On October 27, 2000, Ajaxo, Inc. (Ajaxo) filed a complaint in the Superior Court for the State of California, County of Santa Clara. Ajaxo sought damages and certain non-monetary relief for the Company’s alleged breach of a non-disclosure agreement with Ajaxo pertaining to certain wireless technology that Ajaxo offered the Company as well as damages and other relief against the Company for their alleged misappropriation of Ajaxo’s trade secrets. Following a jury trial, a judgment was entered in 2003 in favor of Ajaxo against the Company for $1 million for breach of the Ajaxo non-disclosure agreement. The trial court subsequently denied Ajaxo’s requests for additional damages and relief following which Ajaxo appealed. Although the Company paid Ajaxo the full amount due on the above-described judgment, the case was remanded back to the trial court by the California Court of Appeals, and on May 30, 2008, a jury returned a verdict in favor of the Company denying all claims raised and demands for damages against the Company. After various appeals the case was again remanded back to the trial court. Following the third trial in this matter, in a Judgment and Statement of Decision filed September 16, 2015, the Court denied all claims for royalties by Ajaxo. Ajaxo’s post-trial motions were denied. Ajaxo has appealed to the Court of Appeals, Sixth District. The Company will continue to defend itself vigorously in this matter.
On December 26, 2018,May 13, 2019, a draft FINRA Dispute Resolution Statement of Claim was received on behalf of an E*TRADE customer and the customer's limited liability company. The draft Statement of Claim alleges that E*TRADE Securities and E*TRADE Capital Management and John Does I-XII violated Section 10(b) of the Securities Exchange Act, committed common law fraud, breached fiduciary duties, breached contractual duties, failed to supervise, and were negligent in the maintenance of the LLC’s accounts. The claim relates to margin liquidations from the LLC's accounts in February 2018. No arbitration has yet been filed, but theThe Company intends to defend itself vigorously in this matter.
In addition to the matters described above, the Company is subject to various legal proceedings and claims that arise in the normal course of business. In each pending matter, the Company contests liability or the amount of claimed damages. In view of the inherent difficulty of predicting the outcome of such matters, particularly in cases where claimants seek substantial or indeterminate damages, or where investigation or discovery have yet to be completed, the Company is unable to estimate a range of reasonably possible losses on its remaining outstanding legal proceedings; however, the Company believes any losses, both individually or in the aggregate, should not be reasonably likely to have a material adverse effect on the consolidated financial condition or results of operations of the Company.
An unfavorable outcome in any matter could have a material adverse effect on the Company’s business, financial condition, results of operations or cash flows. In addition, even if the ultimate outcomes are resolved in the Company’s favor, the defense of such litigation could entail considerable cost or the diversion of the efforts of management, either of which could have a material adverse effect on the Company’s business, financial condition, results of operations or cash flows.
E*TRADE Q1Q3 2019 10-Q | Page 8296
E*TRADE FINANCIAL CORPORATION
NOTES TO THE CONDENSED CONSOLIDATED FINANCIAL STATEMENTS (UNAUDITED)
Regulatory Matters
The securities, futures, foreign currency and banking industries are subject to extensive regulation under federal, state and applicable international laws. From time to time, the Company has been threatened with or named as a defendant in lawsuits, arbitrations and administrative claims involving securities, banking and other matters. The Company is also subject to periodic regulatory examinations and inspections. Compliance and trading problems that are reported to regulators, such as the SEC, FINRA, NASDAQ, CFTC, NFA, FDIC, Federal Reserve Bank of Richmond, OCC, or the CFPB by dissatisfied customers or others are investigated by such regulators, and may, if pursued, result in formal claims being filed against the Company by customers or disciplinary action being taken against the Company or its employees by regulators. Any such claims or disciplinary actions that are decided against the Company could have a material impact on the financial results of the Company or any of its subsidiaries.
Insurance
The Company maintains insurance coverage that management believes is reasonable and prudent. The principal insurance coverage it maintains covers commercial general liability; property damage; hardware/software damage; cyber liability; directors and officers; employment practices liability; certain criminal acts against the Company; and errors and omissions. The Company believes that such insurance coverage is adequate for the purpose of its business. The Company’s ability to maintain this level of insurance coverage in the future, however, is subject to the availability of affordable insurance in the marketplace.
Commitments
In the normal course of business, the Company makes various commitments to extend credit and incur contingent liabilities that are not reflected in the consolidated balance sheet. Significant changes in the economy or interest rates may influence the impact that these commitments and contingencies have on the Company in the future.
The Company’s equity method, cost method and other investments are generally limited liability investments in partnerships, companies and other similar entities, including tax credit partnerships and community development entities, which are not required to be consolidated. The Company had $61$53 million in unfunded contingent investment commitments with respect to these investments at March 31,September 30, 2019.
At March 31,September 30, 2019, the Company had $16$15 million of certificates of deposit scheduled to mature in less than one year.
Guarantees
In prior periods when the Company sold loans, the Company provided guarantees to investors purchasing mortgage loans, which are considered standard representations and warranties within the mortgage industry. The primary guarantees are that: the mortgage and the mortgage note have been duly executed and each is the legal, valid and binding obligation of the Company, enforceable in accordance with its terms; the mortgage has been duly acknowledged and recorded and is valid; and the mortgage and the mortgage note are not subject to any right of rescission, set-off, counterclaim or defense, including, without limitation, the defense of usury, and no such right of rescission, set-off, counterclaim or defense has been asserted with respect thereto. The Company is responsible for the guarantees on loans sold. If these claims prove to be untrue, the investor can require the Company to repurchase the loan and return all loan purchase and servicing release premiums. Management does not believe the potential liability exposure will have a material impact on the Company’s results of operations, cash flows or financial condition due to the
E*TRADE Q1Q3 2019 10-Q | Page 8397
E*TRADE FINANCIAL CORPORATION
NOTES TO THE CONDENSED CONSOLIDATED FINANCIAL STATEMENTS (UNAUDITED)
nature of the standard representations and warranties, which have resulted in a minimal amount of loan repurchases.
ITEM 4. CONTROLS AND PROCEDURES
| |
| (a) | Based on an evaluation under the supervision and with the participation of our management, our Chief Executive Officer and our Chief Financial Officer have concluded that the Company's disclosure controls and procedures, as defined in Rules 13a-15(e) under the Securities Exchange Act of 1934, as amended (the Exchange Act), were effective as of the end of the period covered by this report to provide reasonable assurance that information required to be disclosed by the Company in reports that it files or submits under the Exchange Act is (i) recorded, processed, summarized and reported within the time periods specified in the Securities and Exchange Commission rules and forms and (ii) accumulated and communicated to the Company’s management, including our Chief Executive Officer and Chief Financial Officer, as appropriate to allow timely decisions regarding required disclosure. |
| |
| (b) | There were no changes in the Company’s internal control over financial reporting during the quarter ended March 31,September 30, 2019, identified in connection with management's evaluation required by paragraph (d) of Exchange Act Rules 13a-15 and 15d-15, that have materially affected, or are reasonably likely to materially affect, the Company’s internal control over financial reporting. |
E*TRADE Q1Q3 2019 10-Q | Page 8498
PART II
ITEM 1. LEGAL PROCEEDINGS
Information in response to this item can be found under the heading Litigation Matters in Note 14—Commitments, Contingencies and Other Regulatory Matters to Part I. Item 1. Condensed Consolidated Financial Statements (Unaudited) in this Quarterly Report and is incorporated by reference into this item.
ITEM 1A. RISK FACTORS
There have been no material changes in the Company's risk factors from those disclosed in its 2018 Annual Report. ITEM 2. UNREGISTERED SALES OF EQUITY SECURITIES AND USE OF PROCEEDS
Issuer Purchases of Equity Securities
The table below showspresents the timing and impact of our share repurchase program, if applicable, and the shares withheld from employees to satisfy tax withholding obligations during the three months ended March 31,September 30, 2019 (dollars in millions, except share data and per share amounts): |
| | | | | | | | | | | | | | |
| Period | | Total Number of Shares Purchased(1) | | Average Price Paid per Share(2) | | Total Number of Shares Purchased as Part of the Publicly Announced Programs(3) | | Maximum Dollar Value of Shares That May Yet Be Purchased Under the Program(3) |
| January 1, 2019 - January 31, 2019 | | 1,385 |
| | $ | 43.80 |
| | — |
| | $ | 499 |
|
| February 1, 2019 - February 28, 2019 | | 1,697,634 |
| | $ | 48.05 |
| | 1,369,100 |
| | $ | 434 |
|
| March 1, 2019 - March 31, 2019 | | 1,141,320 |
| | $ | 48.54 |
| | 1,128,800 |
| | $ | 379 |
|
| Total | | 2,840,339 |
| | $ | 48.24 |
| | 2,497,900 |
| | |
|
| | | | | | | | | | | | | | |
| Period | | Total Number of Shares Purchased(1) | | Average Price Paid per Share(1)(2) | | Total Number of Shares Purchased as Part of the Publicly Announced Programs(3) | | Maximum Dollar Value of Shares That May Yet Be Purchased Under the Program(3) |
| July 1, 2019 - July 31, 2019 | | 254,914 |
| | $ | 49.09 |
| | 254,100 |
| | $ | 1,645 |
|
| August 1, 2019 - August 31, 2019 | | 6,499,445 |
| | $ | 41.27 |
| | 6,491,700 |
| | $ | 1,377 |
|
| September 1, 2019 - September 30, 2019 | | 6,706,689 |
| | $ | 43.06 |
| | 6,641,082 |
| | $ | 1,091 |
|
| Total | | 13,461,048 |
| | $ | 42.31 |
| | 13,386,882 |
| | |
| |
| (1) | Includes 342,43974,166 shares withheld to satisfy tax withholding obligations associated with vesting of share-based awards. The average price paid per share for shares withheld was $44.19. |
| |
| (2) | Excludes commission paid, if any. |
| |
| (3) | In October 2018, the Company announced that its Board of Directors authorized a $1 billion share repurchase program. The Company completed repurchases under this program in September 2019. In July 2019, the Company announced that its Board of Directors authorized a new $1.5 billion share repurchase program. |
ITEM 3. DEFAULTS UPON SENIOR SECURITIES
None.
ITEM 4. MINE SAFETY DISCLOSURES
Not applicable.
ITEM 5. OTHER INFORMATION
None.
E*TRADE Q1Q3 2019 10-Q | Page 8599
ITEM 6. EXHIBITS
|
| | |
Exhibit Number | | Description |
| | | |
| | | |
| | Amendment No. 1, dated March 7, 2019, to the Employment Agreement dated February 14, 2017,effective as of August 15, 2019 between the Company and Michael J. Curcio.A. Pizzi.
|
| | Certification of Chief Executive Officer pursuant to Section 302 of the Sarbanes-Oxley Act of 2002. |
| | | |
| | Certification of Chief Financial Officer pursuant to Section 302 of the Sarbanes-Oxley Act of 2002. |
| | | |
| | Certification of Chief Executive Officer and Chief Financial Officer pursuant to Section 906 of the Sarbanes-Oxley Act of 2002. |
| | | |
| *101.INS | | XBRL Instance Document (The(the instance document does not appear in the Interactive Data File because its XBRL tags are embedded within the inlineInline XBRL document.)document) |
| | | |
| *101.SCH | | Inline XBRL Taxonomy Extension Schema Document |
| | | |
| *101.CAL | | Inline XBRL Taxonomy Extension Calculation Linkbase Document |
| | | |
| *101.DEF | | Inline XBRL Taxonomy Extension Definition Linkbase Document |
| | |
| *101.LAB | | Inline XBRL Taxonomy Extension Label Linkbase Document |
| | |
| *101.PRE | | Inline XBRL Taxonomy Extension Presentation Linkbase Document |
| | |
| *104 | | Cover Page Interactive Data File (formatted as Inline XBRL and contained in Exhibit 101) |
E*TRADE Q1Q3 2019 10-Q | Page 86100
SIGNATURES
Pursuant to the requirements of Section 13 or 15(d) of the Securities Exchange Act of 1934, the registrant has duly caused this report to be signed on its behalf by the undersigned, thereunto duly authorized.
Dated: May 2,October 31, 2019
|
| | |
| | | |
E*TRADE Financial Corporation (Registrant) |
| | | |
| By | | /S/ KARLMICHAEL A. ROESSNERPIZZI |
| | | KarlMichael A. RoessnerPizzi |
| | | Chief Executive Officer |
| | | (Principal Executive Officer) |
| | |
| By | | /S/ CHAD E. TURNER |
| | | Chad E. Turner |
| | | Chief Financial Officer |
| | | (Principal Financial Officer) |
| | |
| By | | /S/ BRENT B. SIMONICH |
| | | Brent B. Simonich |
| | | Corporate Controller |
| | | (Principal Accounting Officer) |
E*TRADE Q1Q3 2019 10-Q | Page 87101