 TRADE Financial Corporation
| ☒ | QUARTERLY REPORT PURSUANT TO SECTION 13 OR 15(d) OF THE SECURITIES EXCHANGE ACT OF 1934 | ||||
| ☐ | TRANSITION REPORT PURSUANT TO SECTION 13 OR 15(d) OF THE SECURITIES EXCHANGE ACT OF 1934 | ||||
TRADE Financial Corporation| Delaware | 94-2844166 | |||||||
(State or other jurisdiction of incorporation or organization) | (I.R.S. Employer Identification Number) | |||||||
| Title of Each Class | Trading Symbol | Name of Each Exchange on Which Registered | ||||||
| Common Stock, par value $0.01 per share | ETFC | The NASDAQ Stock Market LLC | ||||||
| NASDAQ Global Select Market | ||||||||
Large accelerated filer | x | Accelerated filer | |||||||||||||||||||||
Non-accelerated filer ¨ | Smaller reporting company | ||||||||||||||||||||||
| Emerging growth company | ☐ | ||||||||||||||||||||||
| PART I | FINANCIAL INFORMATION | |||||||
| Item 1. | ||||||||
Notes to the Condensed Consolidated Financial Statements (Unaudited) | ||||||||
| Item 2. | ||||||||
| Item 3. | ||||||||
| Item 4. | ||||||||
| Item 1. | ||||||||
| Item 1A. | ||||||||
| Item 2. | ||||||||
| Item 3. | ||||||||
| Item 4. | ||||||||
| Item 5. | ||||||||
| Item 6. | ||||||||
| OVERVIEW | ||
Platforms for Retail Channel(1) | Platforms for Institutional | ||||||||||||||||||
 | Web |  | Equity Edge Online | ||||||||||||||||
| Our | Equity Edge Online is the #1 rated platform in the stock plan administration industry that offers automation and flexibility | ||||||||||||||||||
 | Mobile |  |  | ||||||||||||||||
| Our | Gradifi is a scalable, streamlined platform that offers student loan and financial wellness benefits | ||||||||||||||||||
 | Active Trading Platforms |  | Liberty | ||||||||||||||||
| Active derivatives trading platforms include sophisticated trading tools, advanced portfolio and market tracking, and idea generation and analysis | Liberty is intuitive technology built for RIAs that simplifies the investment and management of client assets | ||||||||||||||||||
 | |||||||||||||||||||
| Complemented by professional advice and support | |||||||||||||||||||
 | |||||||||||||||||||
| Customer Service |  |  | Financial Consultants | ||||||||||||||||
| Customer service is available 24/7 via phone, email or chat from industry licensed representatives. White glove service is available for our highest-tiered customers | Financial consultants are available by phone or at branches to provide one-on-one investing advice | ||||||||||||||||||
 | Active Trader Services |  | Corporate Services | ||||||||||||||||
| Corporate services support includes personalized service on a global scale driven by dedicated relationship and service managers backed by comprehensive training and education | |||||||||||||||||||
 | Advisor Services | ||||||||||
| Advisor services support includes dedicated relationship managers who act as a single point of | |||||||||||
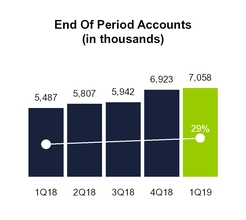
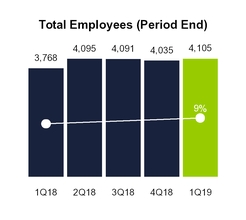
| 1Q 2019 | 4Q 2018 | 3Q 2018 | 2Q 2018 | 1Q 2018 | ||||||||||
| End of period retail accounts | 5,088,597 | 5,007,767 | 4,056,416 | 3,992,575 | 3,955,131 | |||||||||
| End of period advisor services accounts | 151,222 | 151,241 | 150,063 | 147,640 | — | |||||||||
| End of period corporate services accounts | 1,817,983 | 1,763,829 | 1,735,675 | 1,666,354 | 1,532,329 | |||||||||
| End of period accounts | 7,057,802 | 6,922,837 | 5,942,154 | 5,806,569 | 5,487,460 | |||||||||
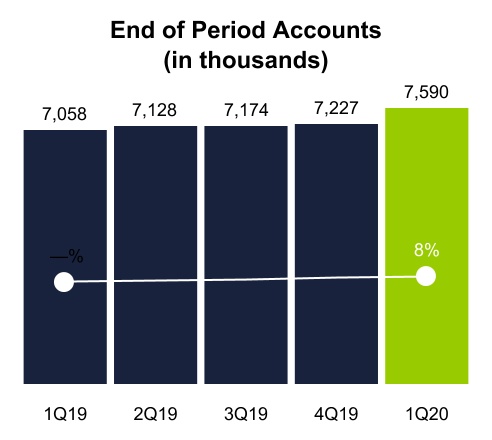
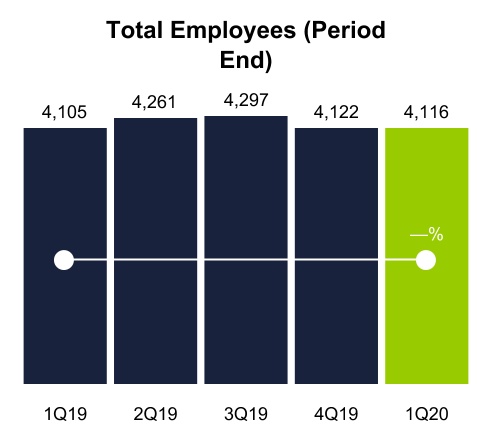
| 1Q 2020 | 4Q 2019 | 3Q 2019 | 2Q 2019 | 1Q 2019 | ||||||||||||||||||||||||||||||||||||||||
| End of period retail accounts | 5,498,596 | 5,169,757 | 5,130,138 | 5,122,669 | 5,088,597 | |||||||||||||||||||||||||||||||||||||||
| End of period advisor services accounts | 144,453 | 148,198 | 150,401 | 151,275 | 151,222 | |||||||||||||||||||||||||||||||||||||||
| End of period corporate services accounts | 1,946,956 | 1,908,836 | 1,893,881 | 1,853,875 | 1,817,983 | |||||||||||||||||||||||||||||||||||||||
| End of period accounts | 7,590,005 | 7,226,791 | 7,174,420 | 7,127,819 | 7,057,802 | |||||||||||||||||||||||||||||||||||||||
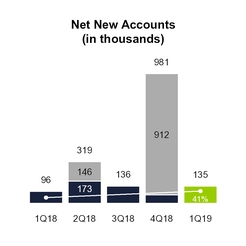
| 1Q 2019 | 4Q 2018 | 3Q 2018 | 2Q 2018 | 1Q 2018 | ||||||||||
| Net new retail accounts | 80,830 | 951,351 | 63,841 | 37,444 | 55,909 | |||||||||
| Net new advisor services accounts | (19) | 1,178 | 2,423 | 147,640 | — | |||||||||
| Net new corporate services accounts | 54,154 | 28,154 | 69,321 | 134,025 | 39,953 | |||||||||
| Net new accounts | 134,965 | 980,683 | 135,585 | 319,109 | 95,862 | |||||||||
| Net new retail account growth rate | 6.5 | % | 93.8 | % | 6.4 | % | 3.8 | % | 5.7 | % | ||||
| Net new advisor services account growth rate | (0.1 | )% | 3.1 | % | 6.6 | % | 100.0 | % | — | % | ||||
| Net new corporate services account growth rate | 12.3 | % | 6.5 | % | 16.6 | % | 35.0 | % | 10.7 | % | ||||
| Net new total account growth rate | 7.8 | % | 66.0 | % | 9.3 | % | 23.3 | % | 7.1 | % | ||||
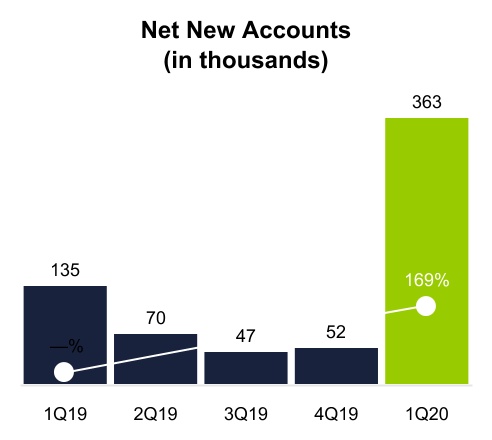
| 1Q 2020 | 4Q 2019 | 3Q 2019 | 2Q 2019 | 1Q 2019 | ||||||||||||||||||||||||||||||||||||||||
| Net new retail accounts | 328,839 | 39,619 | 7,469 | 34,072 | 80,830 | |||||||||||||||||||||||||||||||||||||||
| Net new advisor services accounts | (3,745) | (2,203) | (874) | 53 | (19) | |||||||||||||||||||||||||||||||||||||||
| Net new corporate services accounts | 38,120 | 14,955 | 40,006 | 35,892 | 54,154 | |||||||||||||||||||||||||||||||||||||||
| Net new accounts | 363,214 | 52,371 | 46,601 | 70,017 | 134,965 | |||||||||||||||||||||||||||||||||||||||
| Net new retail account growth rate | 25.4 | % | 3.1 | % | 0.6 | % | 2.7 | % | 6.5 | % | ||||||||||||||||||||||||||||||||||
| Net new advisor services account growth rate | (10.1) | % | (5.9) | % | (2.3) | % | 0.1 | % | (0.1) | % | ||||||||||||||||||||||||||||||||||
| Net new corporate services account growth rate | 8.0 | % | 3.2 | % | 8.6 | % | 7.9 | % | 12.3 | % | ||||||||||||||||||||||||||||||||||
| Net new total account growth rate | 20.1 | % | 2.9 | % | 2.6 | % | 4.0 | % | 7.8 | % | ||||||||||||||||||||||||||||||||||
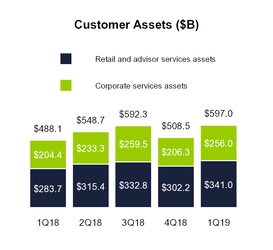
| 1Q 2019 | 4Q 2018 | 3Q 2018 | 2Q 2018 | 1Q 2018 | |||||||||||||||
| Security holdings | $ | 279,289 | $ | 241,921 | $ | 274,469 | $ | 257,637 | $ | 226,823 | |||||||||
| Cash and deposits | 61,691 | 60,198 | 58,376 | 57,676 | 56,854 | ||||||||||||||
| Retail and advisor services assets | 340,980 | 302,119 | 332,845 | 315,313 | 283,677 | ||||||||||||||
| Corporate services vested assets | 140,637 | 111,977 | 139,994 | 125,341 | 109,092 | ||||||||||||||
| Retail, advisor services, and corporate services vested assets | 481,617 | 414,096 | 472,839 | 440,654 | 392,769 | ||||||||||||||
| Corporate services unvested holdings | 115,386 | 94,360 | 119,469 | 107,956 | 95,345 | ||||||||||||||
| Total customer assets | $ | 597,003 | $ | 508,456 | $ | 592,308 | $ | 548,610 | $ | 488,114 | |||||||||
| 1Q 2019 | 4Q 2018 | 3Q 2018 | 2Q 2018 | 1Q 2018 | |||||||||||||||
| Sweep deposits | $ | 38,639 | $ | 39,322 | $ | 37,998 | $ | 37,794 | $ | 37,927 | |||||||||
| Customer payables | 10,600 | 10,117 | 10,534 | 9,959 | 8,947 | ||||||||||||||
| Savings, checking and other banking assets | 7,689 | 5,991 | 5,076 | 4,870 | 4,975 | ||||||||||||||
| Total on-balance sheet cash | 56,928 | 55,430 | 53,608 | 52,623 | 51,849 | ||||||||||||||
| Sweep deposits at unaffiliated financial institutions | 3,011 | 3,009 | 3,007 | 3,505 | 3,444 | ||||||||||||||
| Money market funds and other | 1,752 | 1,759 | 1,761 | 1,552 | 1,561 | ||||||||||||||
Total customer cash held by third parties(1) | 4,763 | 4,768 | 4,768 | 5,057 | 5,005 | ||||||||||||||
| Total customer cash and deposits | $ | 61,691 | $ | 60,198 | $ | 58,376 | $ | 57,680 | $ | 56,854 | |||||||||
| 1Q 2019 | 4Q 2018 | 3Q 2018 | 2Q 2018 | 1Q 2018 | 1Q 2020 | 4Q 2019 | 3Q 2019 | 2Q 2019 | 1Q 2019 | |||||||||||||||||||||||||||||||||||||||||||||||||
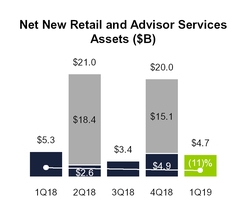
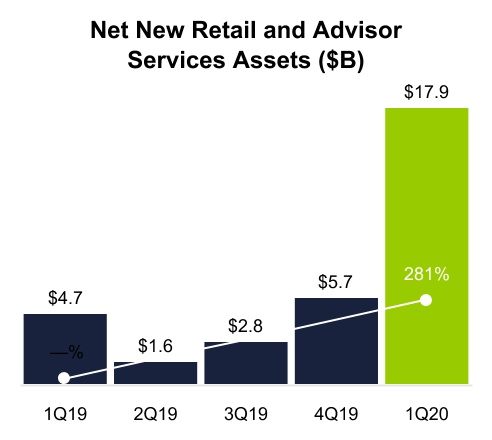
| Net new retail assets growth rate | 6.8 | % | 25.2 | % | 4.2 | % | 3.3 | % | 7.6 | % | Net new retail assets growth rate | 20.2 | % | 7.0 | % | 3.4 | % | 2.1 | % | 6.8 | % | |||||||||||||||||||||||||||||||||||||
| Net new advisor services assets growth rate | (3.5 | )% | 3.9 | % | 7.6 | % | 100.0 | % | — | % | Net new advisor services assets growth rate | (7.1) | % | (2.3) | % | 0.8 | % | (1.2) | % | (3.5) | % | |||||||||||||||||||||||||||||||||||||
| Net new retail and advisor services assets growth rate | 6.2 | % | 24.0 | % | 4.4 | % | 29.5 | % | 7.6 | % | Net new retail and advisor services assets growth rate | 18.8 | % | 6.5 | % | 3.2 | % | 1.9 | % | 6.2 | % | |||||||||||||||||||||||||||||||||||||
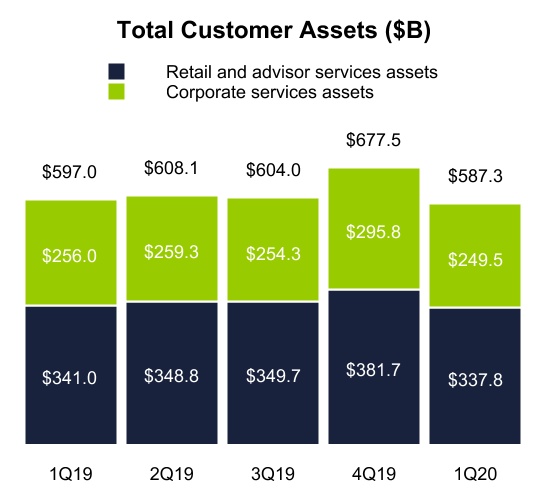
| 1Q 2020 | 4Q 2019 | 3Q 2019 | 2Q 2019 | 1Q 2019 | ||||||||||||||||||||||||||||||||||||||||
| Security holdings | $ | 253.2 | $ | 310.7 | $ | 284.7 | $ | 286.6 | $ | 279.3 | ||||||||||||||||||||||||||||||||||
| Cash and deposits | 84.6 | 71.0 | 65.0 | 62.2 | 61.7 | |||||||||||||||||||||||||||||||||||||||
| Retail and advisor services assets | 337.8 | 381.7 | 349.7 | 348.8 | 341.0 | |||||||||||||||||||||||||||||||||||||||
| Corporate services vested assets | 135.8 | 159.1 | 138.9 | 142.3 | 140.6 | |||||||||||||||||||||||||||||||||||||||
| Retail, advisor services, and corporate services vested assets | 473.6 | 540.8 | 488.6 | 491.1 | 481.6 | |||||||||||||||||||||||||||||||||||||||
| Corporate services unvested holdings | 113.7 | 136.7 | 115.4 | 117.0 | 115.4 | |||||||||||||||||||||||||||||||||||||||
| Total customer assets | $ | 587.3 | $ | 677.5 | $ | 604.0 | $ | 608.1 | $ | 597.0 | ||||||||||||||||||||||||||||||||||
| 1Q 2020 | 4Q 2019 | 3Q 2019 | 2Q 2019 | 1Q 2019 | ||||||||||||||||||||||||||||||||||||||||
| Sweep deposits: | ||||||||||||||||||||||||||||||||||||||||||||
| Brokerage sweep deposits | $ | 38.1 | $ | 27.9 | $ | 30.8 | $ | 31.7 | $ | 38.6 | ||||||||||||||||||||||||||||||||||
Bank sweep deposits(1) | 0.7 | 6.4 | — | — | — | |||||||||||||||||||||||||||||||||||||||
| Customer payables | 16.0 | 12.8 | 11.2 | 10.6 | 10.6 | |||||||||||||||||||||||||||||||||||||||
Savings, checking, and other banking assets(2) | 3.3 | 4.3 | 9.6 | 8.6 | 7.7 | |||||||||||||||||||||||||||||||||||||||
| Total on-balance sheet customer cash and deposits | 58.1 | 51.4 | 51.6 | 50.9 | 56.9 | |||||||||||||||||||||||||||||||||||||||
| Brokerage sweep deposits at unaffiliated financial institutions | 15.4 | 16.9 | 11.7 | 9.6 | 3.0 | |||||||||||||||||||||||||||||||||||||||
Bank sweep deposits at unaffiliated financial institutions(1) | 9.1 | 0.8 | — | — | — | |||||||||||||||||||||||||||||||||||||||
| Money market funds and other | 2.0 | 1.9 | 1.7 | 1.7 | 1.8 | |||||||||||||||||||||||||||||||||||||||
Total customer cash held by third parties(3) | 26.5 | 19.6 | 13.4 | 11.3 | 4.8 | |||||||||||||||||||||||||||||||||||||||
| Total customer cash and deposits | $ | 84.6 | $ | 71.0 | $ | 65.0 | $ | 62.2 | $ | 61.7 | ||||||||||||||||||||||||||||||||||
| 1Q 2020 | 4Q 2019 | 3Q 2019 | 2Q 2019 | 1Q 2019 | |||||||||||||||||||||||||
| Brokerage sweep deposits at unaffiliated financial institutions | $ | 15.4 | $ | 14.7 | $ | 11.0 | $ | 3.7 | $ | 3.4 | |||||||||||||||||||
Brokerage sweep deposit fees(1) | 148 | 179 | 218 | 221 | 221 | ||||||||||||||||||||||||
| Bank sweep deposits at unaffiliated financial institutions | $ | 5.5 | $ | 0.3 | $ | — | $ | — | $ | — | |||||||||||||||||||
Bank sweep deposit fees(1) | 8 | 6 | — | — | — | ||||||||||||||||||||||||


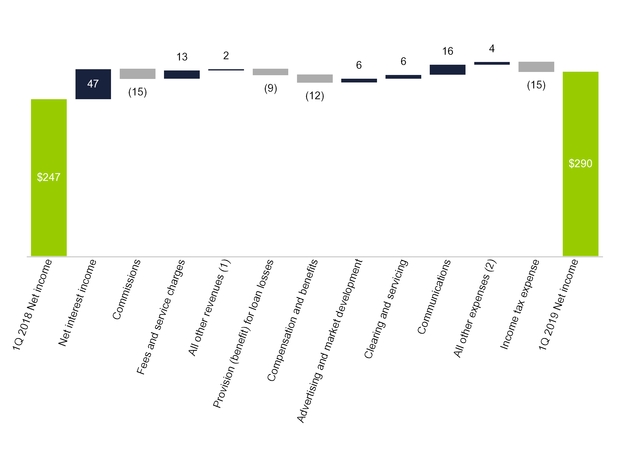
| EARNINGS OVERVIEW | ||
| Three Months Ended March 31, | Variance | Three Months Ended March 31, | Variance | ||||||||||||||||||||||||||||||||||||||||||||||||||||||||||||||||||||||||||||||||||
| 2019 vs. 2018 | 2020 vs. 2019 | ||||||||||||||||||||||||||||||||||||||||||||||||||||||||||||||||||||||||||||||||||||
| 2019 | 2018 | Amount | % | 2020 | 2019 | Amount | % | ||||||||||||||||||||||||||||||||||||||||||||||||||||||||||||||||||||||||||||||
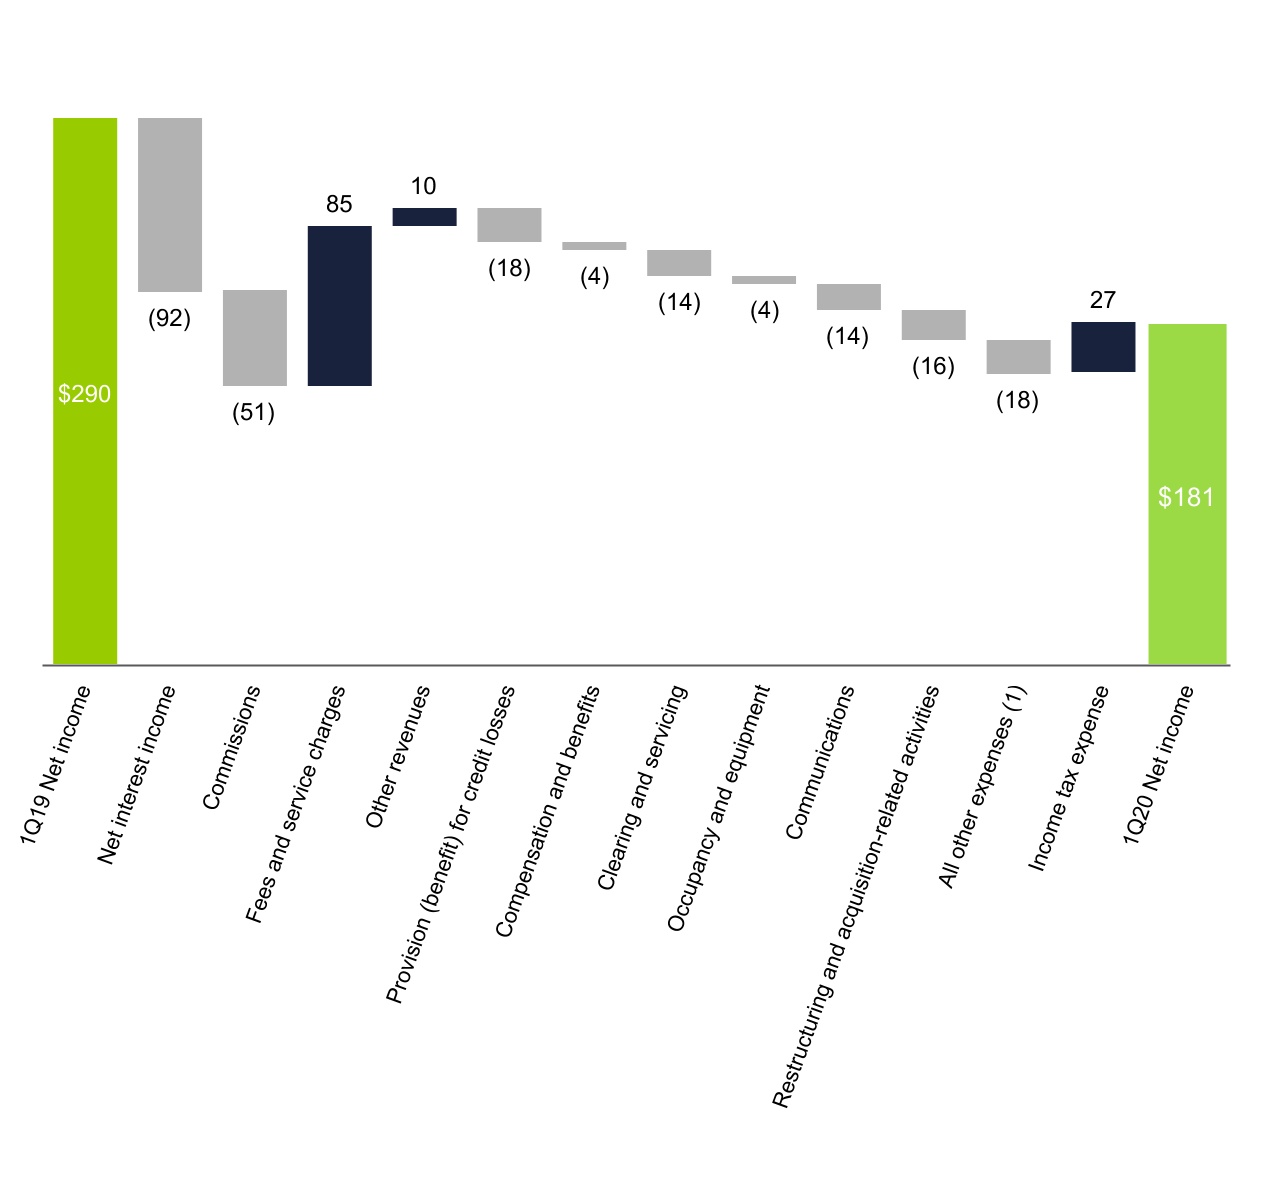
| Net interest income | $ | 492 | $ | 445 | $ | 47 | 11 | % | Net interest income | $ | 400 | $ | 492 | $ | (92) | (19) | % | ||||||||||||||||||||||||||||||||||||||||||||||||||||||||||||||||||||
| Total non-interest income | 263 | 263 | — | — | % | Total non-interest income | 307 | 263 | 44 | 17 | % | ||||||||||||||||||||||||||||||||||||||||||||||||||||||||||||||||||||||||||
| Total net revenue | 755 | 708 | 47 | 7 | % | Total net revenue | 707 | 755 | (48) | (6) | % | ||||||||||||||||||||||||||||||||||||||||||||||||||||||||||||||||||||||||||
| Provision (benefit) for loan losses | (12 | ) | (21 | ) | 9 | (43 | )% | ||||||||||||||||||||||||||||||||||||||||||||||||||||||||||||||||||||||||||||||
| Provision (benefit) for credit losses | Provision (benefit) for credit losses | 6 | (12) | 18 | * | ||||||||||||||||||||||||||||||||||||||||||||||||||||||||||||||||||||||||||||||||
| Total non-interest expense | 375 | 395 | (20 | ) | (5 | )% | Total non-interest expense | 445 | 375 | 70 | 19 | % | |||||||||||||||||||||||||||||||||||||||||||||||||||||||||||||||||||||||||
| Income before income tax expense | 392 | 334 | 58 | 17 | % | Income before income tax expense | 256 | 392 | (136) | (35) | % | ||||||||||||||||||||||||||||||||||||||||||||||||||||||||||||||||||||||||||
| Income tax expense | 102 | 87 | 15 | 17 | % | Income tax expense | 75 | 102 | (27) | (26) | % | ||||||||||||||||||||||||||||||||||||||||||||||||||||||||||||||||||||||||||
| Net income | $ | 290 | $ | 247 | $ | 43 | 17 | % | Net income | $ | 181 | $ | 290 | $ | (109) | (38) | % | ||||||||||||||||||||||||||||||||||||||||||||||||||||||||||||||||||||
| Preferred stock dividends | 20 | 12 | 8 | 67 | % | Preferred stock dividends | 20 | 20 | — | — | % | ||||||||||||||||||||||||||||||||||||||||||||||||||||||||||||||||||||||||||
| Net income available to common shareholders | $ | 270 | $ | 235 | $ | 35 | 15 | % | Net income available to common shareholders | $ | 161 | $ | 270 | $ | (109) | (40) | % | ||||||||||||||||||||||||||||||||||||||||||||||||||||||||||||||||||||
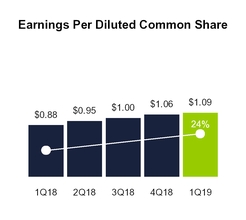
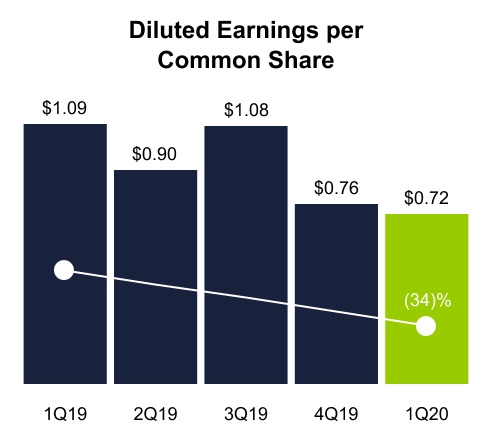
| Diluted earnings per common share | $ | 1.09 | $ | 0.88 | $ | 0.21 | 24 | % | Diluted earnings per common share | $ | 0.72 | $ | 1.09 | $ | (0.37) | (34) | % | ||||||||||||||||||||||||||||||||||||||||||||||||||||||||||||||||||||
| Three Months Ended March 31, | Variance | ||||||||||||||||||||||||||||||||||||||||||||||||||||||||||||||||||||||||||||
| 2020 vs. 2019 | |||||||||||||||||||||||||||||||||||||||||||||||||||||||||||||||||||||||||||||
| 2020 | 2019 | Amount | % | ||||||||||||||||||||||||||||||||||||||||||||||||||||||||||||||||||||||||||
| Net interest income | $ | 400 | $ | 492 | $ | (92) | (19) | % | |||||||||||||||||||||||||||||||||||||||||||||||||||||||||||||||||||||
| Commissions | 71 | 122 | (51) | (42) | % | ||||||||||||||||||||||||||||||||||||||||||||||||||||||||||||||||||||||||
| Fees and service charges | 203 | 118 | 85 | 72 | % | ||||||||||||||||||||||||||||||||||||||||||||||||||||||||||||||||||||||||
| Gains on securities and other, net | 20 | 11 | 9 | 82 | % | ||||||||||||||||||||||||||||||||||||||||||||||||||||||||||||||||||||||||
| Other revenue | 13 | 12 | 1 | 8 | % | ||||||||||||||||||||||||||||||||||||||||||||||||||||||||||||||||||||||||
| Total non-interest income | 307 | 263 | 44 | 17 | % | ||||||||||||||||||||||||||||||||||||||||||||||||||||||||||||||||||||||||
| Total net revenue | $ | 707 | $ | 755 | $ | (48) | (6) | % | |||||||||||||||||||||||||||||||||||||||||||||||||||||||||||||||||||||
| Three Months Ended March 31, | Variance | |||||||||||||
| 2019 vs. 2018 | ||||||||||||||
| 2019 | 2018 | Amount | % | |||||||||||
| Net interest income | $ | 492 | $ | 445 | $ | 47 | 11 | % | ||||||
| Commissions | 122 | 137 | (15 | ) | (11 | )% | ||||||||
| Fees and service charges | 118 | 105 | 13 | 12 | % | |||||||||
| Gains on securities and other, net | 11 | 10 | 1 | 10 | % | |||||||||
| Other revenue | 12 | 11 | 1 | 9 | % | |||||||||
| Total non-interest income | 263 | 263 | — | — | % | |||||||||
| Total net revenue | $ | 755 | $ | 708 | $ | 47 | 7 | % | ||||||
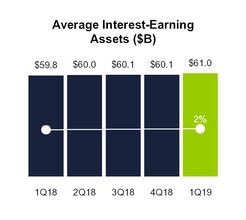
| Three Months Ended March 31, | |||||||||||||||||||||||||||||||||||||||||||||||||||||||||||||||||||||||||||||||||||
| 2020 | 2019 | ||||||||||||||||||||||||||||||||||||||||||||||||||||||||||||||||||||||||||||||||||
| Average Balance | Interest Inc./Exp. | Average Yield/ Cost | Average Balance | Interest Inc./Exp. | Average Yield/ Cost | ||||||||||||||||||||||||||||||||||||||||||||||||||||||||||||||||||||||||||||||
| Cash and equivalents | $ | 767 | $ | 2 | 1.01 | % | $ | 607 | $ | 3 | 2.31 | % | |||||||||||||||||||||||||||||||||||||||||||||||||||||||||||||||||||||||
| Cash segregated under federal or other regulations | 2,586 | 8 | 1.26 | % | 986 | 6 | 2.63 | % | |||||||||||||||||||||||||||||||||||||||||||||||||||||||||||||||||||||||||||
| Investment securities | 41,033 | 285 | 2.78 | % | 46,968 | 365 | 3.10 | % | |||||||||||||||||||||||||||||||||||||||||||||||||||||||||||||||||||||||||||
| Margin receivables | 9,361 | 94 | 4.04 | % | 9,766 | 126 | 5.24 | % | |||||||||||||||||||||||||||||||||||||||||||||||||||||||||||||||||||||||||||
Loans(1) | 1,564 | 21 | 5.36 | % | 2,058 | 28 | 5.48 | % | |||||||||||||||||||||||||||||||||||||||||||||||||||||||||||||||||||||||||||
| Broker-related receivables and other | 1,351 | 4 | 1.24 | % | 632 | 4 | 2.24 | % | |||||||||||||||||||||||||||||||||||||||||||||||||||||||||||||||||||||||||||
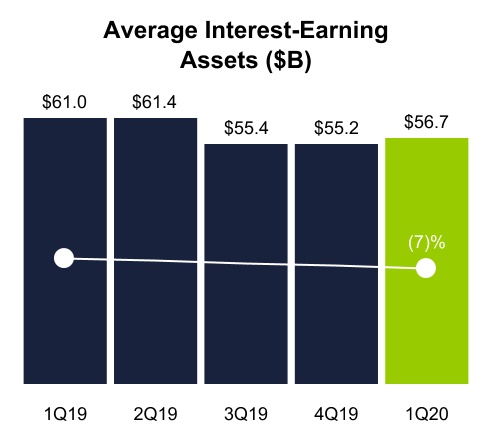
| Total interest-earning assets | 56,662 | 414 | 2.93 | % | 61,017 | 532 | 3.50 | % | |||||||||||||||||||||||||||||||||||||||||||||||||||||||||||||||||||||||||||
Other interest revenue(2) | — | 29 | — | 23 | |||||||||||||||||||||||||||||||||||||||||||||||||||||||||||||||||||||||||||||||
| Total interest-earning assets | 56,662 | 443 | 3.13 | % | 61,017 | 555 | 3.65 | % | |||||||||||||||||||||||||||||||||||||||||||||||||||||||||||||||||||||||||||
| Total non-interest-earning assets | 6,673 | 4,991 | |||||||||||||||||||||||||||||||||||||||||||||||||||||||||||||||||||||||||||||||||
| Total assets | $ | 63,335 | $ | 66,008 | |||||||||||||||||||||||||||||||||||||||||||||||||||||||||||||||||||||||||||||||
| Sweep deposits: | |||||||||||||||||||||||||||||||||||||||||||||||||||||||||||||||||||||||||||||||||||
| Brokerage sweep deposits | $ | 31,641 | $ | 5 | 0.06 | % | $ | 38,433 | $ | 20 | 0.21 | % | |||||||||||||||||||||||||||||||||||||||||||||||||||||||||||||||||||||||
Bank sweep deposits(3) | 3,307 | 13 | 1.63 | % | — | — | — | % | |||||||||||||||||||||||||||||||||||||||||||||||||||||||||||||||||||||||||||
| Savings deposits | 2,234 | 3 | 0.45 | % | 4,968 | 15 | 1.22 | % | |||||||||||||||||||||||||||||||||||||||||||||||||||||||||||||||||||||||||||
| Other deposits | 1,603 | — | 0.02 | % | 1,785 | — | 0.03 | % | |||||||||||||||||||||||||||||||||||||||||||||||||||||||||||||||||||||||||||
| Customer payables | 14,076 | 4 | 0.13 | % | 10,462 | 9 | 0.34 | % | |||||||||||||||||||||||||||||||||||||||||||||||||||||||||||||||||||||||||||
| Broker-related payables and other | 836 | — | 0.03 | % | 999 | 1 | 0.49 | % | |||||||||||||||||||||||||||||||||||||||||||||||||||||||||||||||||||||||||||
| Other borrowings | 5 | 1 | * | 269 | 2 | 3.81 | % | ||||||||||||||||||||||||||||||||||||||||||||||||||||||||||||||||||||||||||||
| Corporate debt | 1,411 | 14 | 3.86 | % | 1,409 | 14 | 3.91 | % | |||||||||||||||||||||||||||||||||||||||||||||||||||||||||||||||||||||||||||
| Total interest-bearing liabilities | 55,113 | 40 | 0.29 | % | 58,325 | 61 | 0.42 | % | |||||||||||||||||||||||||||||||||||||||||||||||||||||||||||||||||||||||||||
Other interest expense(4) | — | 3 | — | 2 | |||||||||||||||||||||||||||||||||||||||||||||||||||||||||||||||||||||||||||||||
| Total interest-bearing liabilities | 55,113 | 43 | 0.31 | % | 58,325 | 63 | 0.44 | % | |||||||||||||||||||||||||||||||||||||||||||||||||||||||||||||||||||||||||||
| Total non-interest-bearing liabilities | 1,861 | 1,183 | |||||||||||||||||||||||||||||||||||||||||||||||||||||||||||||||||||||||||||||||||
| Total liabilities | 56,974 | 59,508 | |||||||||||||||||||||||||||||||||||||||||||||||||||||||||||||||||||||||||||||||||
| Total shareholders' equity | 6,361 | 6,500 | |||||||||||||||||||||||||||||||||||||||||||||||||||||||||||||||||||||||||||||||||
| Total liabilities and shareholders' equity | $ | 63,335 | $ | 66,008 | |||||||||||||||||||||||||||||||||||||||||||||||||||||||||||||||||||||||||||||||
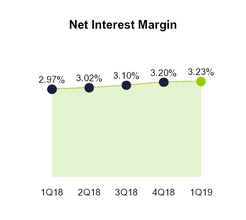
| Excess interest earning assets over interest bearing liabilities/net interest income/net interest margin | $ | 1,549 | $ | 400 | 2.82 | % | $ | 2,692 | $ | 492 | 3.23 | % | |||||||||||||||||||||||||||||||||||||||||||||||||||||||||||||||||||||||
| Three Months Ended March 31, | |||||||||||||||||||||
| 2019 | 2018 | ||||||||||||||||||||
| Average Balance | Interest Inc./Exp. | Average Yield/ Cost | Average Balance | Interest Inc./Exp. | Average Yield/ Cost | ||||||||||||||||
| Cash and equivalents | $ | 607 | $ | 3 | 2.31 | % | $ | 803 | $ | 3 | 1.42 | % | |||||||||
| Cash segregated under federal or other regulations | 986 | 6 | 2.63 | % | 795 | 3 | 1.62 | % | |||||||||||||
| Investment securities | 46,968 | 365 | 3.10 | % | 45,194 | 290 | 2.57 | % | |||||||||||||
| Margin receivables | 9,766 | 126 | 5.24 | % | 9,466 | 103 | 4.41 | % | |||||||||||||
Loans(1) | 2,058 | 28 | 5.48 | % | 2,629 | 33 | 5.07 | % | |||||||||||||
| Broker-related receivables and other | 632 | 4 | 2.24 | % | 950 | 4 | 1.55 | % | |||||||||||||
| Total interest-earning assets | 61,017 | 532 | 3.50 | % | 59,837 | 436 | 2.92 | % | |||||||||||||
Other interest revenue(2) | — | 23 | — | 32 | |||||||||||||||||
| Total interest-earning assets | 61,017 | 555 | 3.65 | % | 59,837 | 468 | 3.14 | % | |||||||||||||
| Total non-interest-earning assets | 4,991 | 4,787 | |||||||||||||||||||
| Total assets | $ | 66,008 | $ | 64,624 | |||||||||||||||||
| Sweep deposits | $ | 38,433 | $ | 20 | 0.21 | % | $ | 38,299 | $ | 2 | 0.02 | % | |||||||||
| Savings deposits | 4,968 | 15 | 1.22 | % | 2,833 | — | 0.01 | % | |||||||||||||
| Other deposits | 1,785 | — | 0.03 | % | 2,046 | — | 0.02 | % | |||||||||||||
| Customer payables | 10,462 | 9 | 0.34 | % | 9,556 | 1 | 0.06 | % | |||||||||||||
| Broker-related payables and other | 999 | 1 | 0.49 | % | 1,566 | 1 | 0.20 | % | |||||||||||||
| Other borrowings | 269 | 2 | 3.81 | % | 932 | 7 | 3.12 | % | |||||||||||||
| Corporate debt | 1,409 | 14 | 3.91 | % | 991 | 9 | 3.62 | % | |||||||||||||
| Total interest-bearing liabilities | 58,325 | 61 | 0.42 | % | 56,223 | 20 | 0.14 | % | |||||||||||||
Other interest expense(3) | — | 2 | — | 3 | |||||||||||||||||
| Total interest-bearing liabilities | 58,325 | 63 | 0.44 | % | 56,223 | 23 | 0.17 | % | |||||||||||||
| Total non-interest-bearing liabilities | 1,183 | 1,329 | |||||||||||||||||||
| Total liabilities | 59,508 | 57,552 | |||||||||||||||||||
| Total shareholders' equity | 6,500 | 7,072 | |||||||||||||||||||
| Total liabilities and shareholders' equity | $ | 66,008 | $ | 64,624 | |||||||||||||||||
| Excess interest earning assets over interest bearing liabilities/net interest income/net interest margin | $ | 2,692 | $ | 492 | 3.23 | % | $ | 3,614 | $ | 445 | 2.97 | % | |||||||||
•Deposits and customer payables: The decrease in sweep deposits was primarily driven by the balance sheet repositioning during the second quarter of 2019, as we moved $6.6 billion of deposits to third-party banks. The decrease in savings deposits was primarily driven by the conversion of Premium Savings Accounts into the bank sweep deposit program beginning in Q4 2019. These decreases were partially offset by increased customer payables as a result of increased customer engagement during the three months ended March 31, 2020. Refer to MD&A—Balance Sheet Overview for additional information. |
| Three Months Ended March 31, | Variance | |||||||||||||
| 2019 vs. 2018 | ||||||||||||||
| 2019 | 2018 | Amount | % | |||||||||||
| Order flow revenue | $ | 43 | $ | 47 | $ | (4 | ) | (9 | )% | |||||
Money market funds and sweep deposits revenue(1) | 21 | 17 | 4 | 24 | % | |||||||||
| Advisor management and custody fees | 18 | 11 | 7 | 64 | % | |||||||||
| Mutual fund service fees | 12 | 11 | 1 | 9 | % | |||||||||
| Foreign exchange revenue | 8 | 8 | — | — | % | |||||||||
| Reorganization fees | 6 | 3 | 3 | 100 | % | |||||||||
| Other fees and service charges | 10 | 8 | 2 | 25 | % | |||||||||
| Total fees and service charges | $ | 118 | $ | 105 | $ | 13 | 12 | % | ||||||
| Three Months Ended March 31, | Variance | ||||||||||||||||||||||||||||||||||||||||||||||||||||||||||||||||||||||||||||
| 2020 vs. 2019 | |||||||||||||||||||||||||||||||||||||||||||||||||||||||||||||||||||||||||||||
| 2020 | 2019 | Amount | % | ||||||||||||||||||||||||||||||||||||||||||||||||||||||||||||||||||||||||||
| Order flow revenue | $ | 85 | $ | 43 | $ | 42 | 98 | % | |||||||||||||||||||||||||||||||||||||||||||||||||||||||||||||||||||||
Money market funds and sweep deposits revenue(1) | 60 | 21 | 39 | 186 | % | ||||||||||||||||||||||||||||||||||||||||||||||||||||||||||||||||||||||||
| Advisor management and custody fees | 19 | 18 | 1 | 6 | % | ||||||||||||||||||||||||||||||||||||||||||||||||||||||||||||||||||||||||
| Mutual fund service fees | 13 | 12 | 1 | 8 | % | ||||||||||||||||||||||||||||||||||||||||||||||||||||||||||||||||||||||||
| Foreign exchange revenue | 9 | 8 | 1 | 13 | % | ||||||||||||||||||||||||||||||||||||||||||||||||||||||||||||||||||||||||
| Reorganization fees | 4 | 6 | (2) | (33) | % | ||||||||||||||||||||||||||||||||||||||||||||||||||||||||||||||||||||||||
| Other fees and service charges | 13 | 10 | 3 | 30 | % | ||||||||||||||||||||||||||||||||||||||||||||||||||||||||||||||||||||||||
| Total fees and service charges | $ | 203 | $ | 118 | $ | 85 | 72 | % | |||||||||||||||||||||||||||||||||||||||||||||||||||||||||||||||||||||
| Three Months Ended March 31, | Variance | ||||||||||||||||||||||||||||||||||||||||||||||||||||||||||||||||||||||||||||||||||||||||||
| Three Months Ended March 31, | Variance | 2020 vs. 2019 | |||||||||||||||||||||||||||||||||||||||||||||||||||||||||||||||||||||||||||||||||||||||||
| 2019 vs. 2018 | 2020 | 2019 | Amount | % | |||||||||||||||||||||||||||||||||||||||||||||||||||||||||||||||||||||||||||||||||||||||
| 2019 | 2018 | Amount | % | ||||||||||||||||||||||||||||||||||||||||||||||||||||||||||||||||||||||||||||||||||||||||
| Gains on available-for-sale securities | $ | 11 | $ | 11 | $ | — | — | % | Gains on available-for-sale securities | $ | 19 | $ | 11 | $ | 8 | 73 | % | ||||||||||||||||||||||||||||||||||||||||||||||||||||||||||||||||||||||||||
| Equity method investment income (loss) and other | — | (1 | ) | 1 | (100 | )% | |||||||||||||||||||||||||||||||||||||||||||||||||||||||||||||||||||||||||||||||||||||
| Equity method investment income and other | Equity method investment income and other | 1 | — | 1 | 100 | % | |||||||||||||||||||||||||||||||||||||||||||||||||||||||||||||||||||||||||||||||||||||
| Gains on securities and other, net | $ | 11 | $ | 10 | $ | 1 | 10 | % | Gains on securities and other, net | $ | 20 | $ | 11 | $ | 9 | 82 | % | ||||||||||||||||||||||||||||||||||||||||||||||||||||||||||||||||||||||||||
| Three Months Ended March 31, | Variance | Three Months Ended March 31, | Variance | ||||||||||||||||||||||||||||||||||||||||||||||||||||||||||||||||||||||||||||||||||
| 2019 vs. 2018 | 2020 vs. 2019 | ||||||||||||||||||||||||||||||||||||||||||||||||||||||||||||||||||||||||||||||||||||
| 2019 | 2018 | Amount | % | 2020 | 2019 | Amount | % | ||||||||||||||||||||||||||||||||||||||||||||||||||||||||||||||||||||||||||||||
| Compensation and benefits | $ | 164 | $ | 152 | $ | 12 | 8 | % | Compensation and benefits | $ | 168 | $ | 164 | $ | 4 | 2 | % | ||||||||||||||||||||||||||||||||||||||||||||||||||||||||||||||||||||
| Advertising and market development | 54 | 60 | (6 | ) | (10 | )% | Advertising and market development | 56 | 54 | 2 | 4 | % | |||||||||||||||||||||||||||||||||||||||||||||||||||||||||||||||||||||||||
| Clearing and servicing | 30 | 36 | (6 | ) | (17 | )% | Clearing and servicing | 44 | 30 | 14 | 47 | % | |||||||||||||||||||||||||||||||||||||||||||||||||||||||||||||||||||||||||
| Professional services | 22 | 22 | — | — | % | Professional services | 23 | 22 | 1 | 5 | % | ||||||||||||||||||||||||||||||||||||||||||||||||||||||||||||||||||||||||||
| Occupancy and equipment | 32 | 30 | 2 | 7 | % | Occupancy and equipment | 36 | 32 | 4 | 13 | % | ||||||||||||||||||||||||||||||||||||||||||||||||||||||||||||||||||||||||||
| Communications | 15 | 31 | (16 | ) | (52 | )% | Communications | 29 | 15 | 14 | 93 | % | |||||||||||||||||||||||||||||||||||||||||||||||||||||||||||||||||||||||||
| Depreciation and amortization | 21 | 22 | (1 | ) | (5 | )% | Depreciation and amortization | 23 | 21 | 2 | 10 | % | |||||||||||||||||||||||||||||||||||||||||||||||||||||||||||||||||||||||||
| FDIC insurance premiums | 4 | 9 | (5 | ) | (56 | )% | FDIC insurance premiums | 4 | 4 | — | — | % | |||||||||||||||||||||||||||||||||||||||||||||||||||||||||||||||||||||||||
| Amortization of other intangibles | 15 | 10 | 5 | 50 | % | Amortization of other intangibles | 15 | 15 | — | — | % | ||||||||||||||||||||||||||||||||||||||||||||||||||||||||||||||||||||||||||
| Restructuring and acquisition-related activities | Restructuring and acquisition-related activities | 16 | — | 16 | 100 | % | |||||||||||||||||||||||||||||||||||||||||||||||||||||||||||||||||||||||||||||||
| Other non-interest expenses | 18 | 23 | (5 | ) | (22 | )% | Other non-interest expenses | 31 | 18 | 13 | 72 | % | |||||||||||||||||||||||||||||||||||||||||||||||||||||||||||||||||||||||||
| Total non-interest expense | $ | 375 | $ | 395 | $ | (20 | ) | (5 | )% | Total non-interest expense | $ | 445 | $ | 375 | $ | 70 | 19 | % | |||||||||||||||||||||||||||||||||||||||||||||||||||||||||||||||||||
| Three Months Ended March 31, | Three Months Ended March 31, | |||||||||||||||||||||||||||||||||||||||||||||||||||||||||||||||||||||||||||||||||||||||||
| 2019 | 2018 | 2020 | 2019 | |||||||||||||||||||||||||||||||||||||||||||||||||||||||||||||||||||||||||||||||||||||||
| Amount | Operating Margin % | Amount | Operating Margin % | Amount | Operating Margin % | Amount | Operating Margin % | |||||||||||||||||||||||||||||||||||||||||||||||||||||||||||||||||||||||||||||||||||
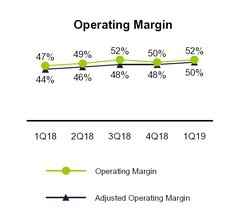
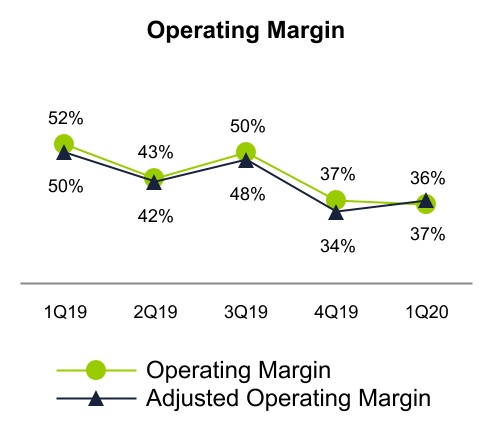
| Income before income tax expense / operating margin | $ | 392 | 52 | % | $ | 334 | 47 | % | Income before income tax expense / operating margin | $ | 256 | 36 | % | $ | 392 | 52 | % | |||||||||||||||||||||||||||||||||||||||||||||||||||||||||||||||||||||||||
| Provision (benefit) for loan losses | (12 | ) | (21 | ) | ||||||||||||||||||||||||||||||||||||||||||||||||||||||||||||||||||||||||||||||||||||||
| Provision (benefit) for credit losses | Provision (benefit) for credit losses | 6 | (12) | |||||||||||||||||||||||||||||||||||||||||||||||||||||||||||||||||||||||||||||||||||||||
| Adjusted income before income tax expense / adjusted operating margin | $ | 380 | 50 | % | $ | 313 | 44 | % | Adjusted income before income tax expense / adjusted operating margin | $ | 262 | 37 | % | $ | 380 | 50 | % | |||||||||||||||||||||||||||||||||||||||||||||||||||||||||||||||||||||||||
| Three Months Ended March 31, | Three Months Ended March 31, | |||||||||||||||||||||||||||||||||||||||||||||||||||||||||||||||||||||||||||||||||||||||||
| 2019 | 2018 | 2020 | 2019 | |||||||||||||||||||||||||||||||||||||||||||||||||||||||||||||||||||||||||||||||||||||||
| Amount | Return on Common Equity % | Amount | Return on Common Equity % | Amount | Return on Common Equity % | Amount | Return on Common Equity % | |||||||||||||||||||||||||||||||||||||||||||||||||||||||||||||||||||||||||||||||||||
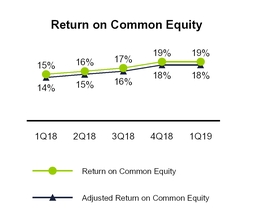
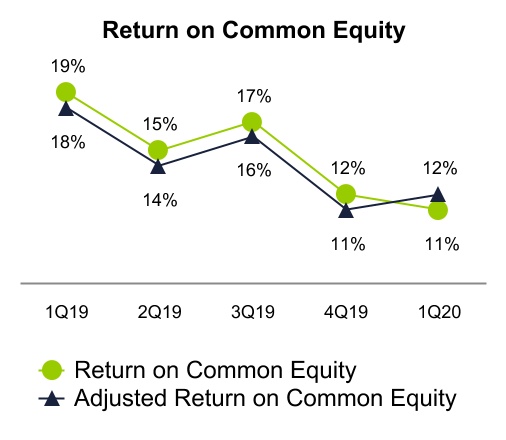
| Net income available to common shareholders and return on common equity | $ | 270 | 19 | % | $ | 235 | 15 | % | Net income available to common shareholders and return on common equity | $ | 161 | 11% | $ | 270 | 19 | % | ||||||||||||||||||||||||||||||||||||||||||||||||||||||||||||||||||||||||||
| Add back impact of the following item: | ||||||||||||||||||||||||||||||||||||||||||||||||||||||||||||||||||||||||||||||||||||||||||
| Provision (benefit) for loan losses | (12 | ) | (21 | ) | ||||||||||||||||||||||||||||||||||||||||||||||||||||||||||||||||||||||||||||||||||||||
| Add back impact of the following items: | Add back impact of the following items: | |||||||||||||||||||||||||||||||||||||||||||||||||||||||||||||||||||||||||||||||||||||||||
| Provision (benefit) for credit losses | Provision (benefit) for credit losses | 6 | (12) | |||||||||||||||||||||||||||||||||||||||||||||||||||||||||||||||||||||||||||||||||||||||
| Income tax impact | 3 | 5 | Income tax impact | (2) | 3 | |||||||||||||||||||||||||||||||||||||||||||||||||||||||||||||||||||||||||||||||||||||
| Net of tax | (9 | ) | (16 | ) | Net of tax | 4 | (9) | |||||||||||||||||||||||||||||||||||||||||||||||||||||||||||||||||||||||||||||||||||
| Adjusted net income available to common shareholders and return on common equity | $ | 261 | 18 | % | $ | 219 | 14 | % | Adjusted net income available to common shareholders and return on common equity | $ | 165 | 12% | $ | 261 | 18 | % | ||||||||||||||||||||||||||||||||||||||||||||||||||||||||||||||||||||||||||
| BALANCE SHEET OVERVIEW | ||
| Variance | |||||||||||||||||||||||||||||||||||||||||||||||||
| Variance | |||||||||||||||||||||||||||||||||||||||||||||||||
| March 31, | December 31, | 2019 vs. 2018 | March 31, | December 31, | 2020 vs. 2019 | ||||||||||||||||||||||||||||||||||||||||||||
| 2019 | 2018 | Amount | % | 2020 | 2019 | Amount | % | ||||||||||||||||||||||||||||||||||||||||||
| Assets: | Assets: | ||||||||||||||||||||||||||||||||||||||||||||||||
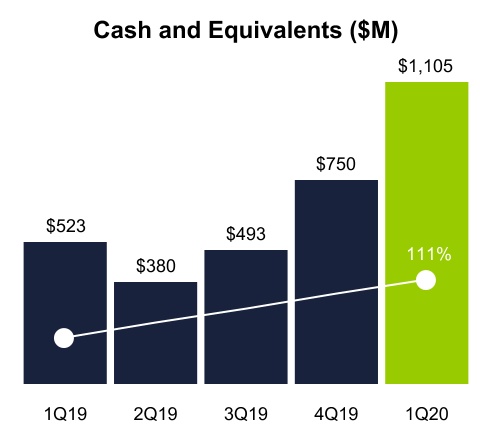
| Cash and equivalents | $ | 523 | $ | 2,333 | $ | (1,810 | ) | (78 | )% | Cash and equivalents | $ | 1,105 | $ | 750 | $ | 355 | 47 | % | |||||||||||||||||||||||||||||||
| Segregated cash | 677 | 1,011 | (334 | ) | (33 | )% | Segregated cash | 5,730 | 1,879 | 3,851 | 205 | % | |||||||||||||||||||||||||||||||||||||
| Investment securities | 48,898 | 45,037 | 3,861 | 9 | % | Investment securities | 46,530 | 41,470 | 5,060 | 12 | % | ||||||||||||||||||||||||||||||||||||||
| Margin receivables | 10,267 | 9,560 | 707 | 7 | % | Margin receivables | 7,251 | 9,675 | (2,424) | (25) | % | ||||||||||||||||||||||||||||||||||||||
| Loans receivable, net | 1,965 | 2,103 | (138 | ) | (7 | )% | Loans receivable, net | 1,634 | 1,595 | 39 | 2 | % | |||||||||||||||||||||||||||||||||||||
| Receivables from brokers, dealers and clearing organizations | 597 | 760 | (163 | ) | (21 | )% | Receivables from brokers, dealers and clearing organizations | 1,124 | 1,395 | (271) | (19) | % | |||||||||||||||||||||||||||||||||||||
| Property and equipment, net | Property and equipment, net | 339 | 339 | — | — | % | |||||||||||||||||||||||||||||||||||||||||||
| Goodwill and other intangibles, net | 2,961 | 2,976 | (15 | ) | (1 | )% | Goodwill and other intangibles, net | 2,928 | 2,943 | (15) | (1) | % | |||||||||||||||||||||||||||||||||||||
Other(1) | 1,630 | 1,223 | 407 | 33 | % | ||||||||||||||||||||||||||||||||||||||||||||
| Other assets | Other assets | 1,215 | 1,370 | (155) | (11) | % | |||||||||||||||||||||||||||||||||||||||||||
| Total assets | $ | 67,518 | $ | 65,003 | $ | 2,515 | 4 | % | Total assets | $ | 67,856 | $ | 61,416 | $ | 6,440 | 10 | % | ||||||||||||||||||||||||||||||||
| Liabilities and shareholders’ equity: | Liabilities and shareholders’ equity: | ||||||||||||||||||||||||||||||||||||||||||||||||
| Deposits | $ | 46,328 | $ | 45,313 | $ | 1,015 | 2 | % | Deposits | $ | 42,146 | $ | 38,606 | $ | 3,540 | 9 | % | ||||||||||||||||||||||||||||||||
| Customer payables | 10,600 | 10,117 | 483 | 5 | % | Customer payables | 15,960 | 12,849 | 3,111 | 24 | % | ||||||||||||||||||||||||||||||||||||||
| Payables to brokers, dealers and clearing organizations | 1,162 | 948 | 214 | 23 | % | Payables to brokers, dealers and clearing organizations | 776 | 893 | (117) | (13) | % | ||||||||||||||||||||||||||||||||||||||
| Other borrowings | 300 | — | 300 | 100 | % | ||||||||||||||||||||||||||||||||||||||||||||
| Corporate debt | 1,409 | 1,409 | — | — | % | Corporate debt | 1,411 | 1,410 | 1 | — | % | ||||||||||||||||||||||||||||||||||||||
| Other liabilities | 937 | 654 | 283 | 43 | % | Other liabilities | 1,044 | 1,115 | (71) | (6) | % | ||||||||||||||||||||||||||||||||||||||
| Total liabilities | 60,736 | 58,441 | 2,295 | 4 | % | Total liabilities | 61,337 | 54,873 | 6,464 | 12 | % | ||||||||||||||||||||||||||||||||||||||
| Shareholders’ equity | 6,782 | 6,562 | 220 | 3 | % | Shareholders’ equity | 6,519 | 6,543 | (24) | — | % | ||||||||||||||||||||||||||||||||||||||
| Total liabilities and shareholders’ equity | $ | 67,518 | $ | 65,003 | $ | 2,515 | 4 | % | Total liabilities and shareholders’ equity | $ | 67,856 | $ | 61,416 | $ | 6,440 | 10 | % | ||||||||||||||||||||||||||||||||
| Variance | |||||||||||||||||||||||||||||||||||||||||||||||||
| Variance | |||||||||||||||||||||||||||||||||||||||||||||||||
| March 31, | December 31, | 2019 vs. 2018 | March 31, | December 31, | 2020 vs. 2019 | ||||||||||||||||||||||||||||||||||||||||||||
| 2019 | 2018 | Amount | % | 2020 | 2019 | Amount | % | ||||||||||||||||||||||||||||||||||||||||||
| Available-for-sale securities: | Available-for-sale securities: | ||||||||||||||||||||||||||||||||||||||||||||||||
| Agency mortgage-backed securities | $ | 23,423 | $ | 22,162 | $ | 1,261 | 6 | % | Agency mortgage-backed securities | $ | 17,449 | $ | 17,035 | $ | 414 | 2 | % | ||||||||||||||||||||||||||||||||
| Other agency debt securities | 955 | 991 | (36 | ) | (4 | )% | Other agency debt securities | 965 | 659 | 306 | 46 | % | |||||||||||||||||||||||||||||||||||||
| US Treasuries | 438 | — | 438 | 100 | % | US Treasuries | 1,343 | 1,227 | 116 | 9 | % | ||||||||||||||||||||||||||||||||||||||
Non-agency debt securities(1) | 155 | — | 155 | 100 | % | Non-agency debt securities(1) | 1,683 | 580 | 1,103 | 190 | % | ||||||||||||||||||||||||||||||||||||||
| Total available-for-sale securities | $ | 24,971 | $ | 23,153 | $ | 1,818 | 8 | % | Total available-for-sale securities | $ | 21,440 | $ | 19,501 | $ | 1,939 | 10 | % | ||||||||||||||||||||||||||||||||
| Held-to-maturity securities: | Held-to-maturity securities: | ||||||||||||||||||||||||||||||||||||||||||||||||
| Agency mortgage-backed securities | $ | 20,337 | $ | 18,085 | $ | 2,252 | 12 | % | Agency mortgage-backed securities | $ | 23,531 | $ | 20,085 | $ | 3,446 | 17 | % | ||||||||||||||||||||||||||||||||
| Other agency debt securities | 3,590 | 3,799 | (209 | ) | (6 | )% | Other agency debt securities | 1,559 | 1,884 | (325) | (17) | % | |||||||||||||||||||||||||||||||||||||
| Total held-to-maturity securities | $ | 23,927 | $ | 21,884 | $ | 2,043 | 9 | % | Total held-to-maturity securities | $ | 25,090 | $ | 21,969 | $ | 3,121 | 14 | % | ||||||||||||||||||||||||||||||||
| Total investment securities | $ | 48,898 | $ | 45,037 | $ | 3,861 | 9 | % | Total investment securities | $ | 46,530 | $ | 41,470 | $ | 5,060 | 12 | % | ||||||||||||||||||||||||||||||||
| Variance | |||||||||||||||||||||||||||||||||||||||||||||||||
| Variance | |||||||||||||||||||||||||||||||||||||||||||||||||
| March 31, | December 31, | 2019 vs. 2018 | March 31, | December 31, | 2020 vs. 2019 | ||||||||||||||||||||||||||||||||||||||||||||
| 2019 | 2018 | Amount | % | 2020 | 2019 | Amount | % | ||||||||||||||||||||||||||||||||||||||||||
| One- to four-family | $ | 1,003 | $ | 1,071 | $ | (68 | ) | (6 | )% | One- to four-family | $ | 755 | $ | 803 | $ | (48) | (6) | % | |||||||||||||||||||||||||||||||
| Home equity | 785 | 836 | (51 | ) | (6 | )% | Home equity | 594 | 635 | (41) | (6) | % | |||||||||||||||||||||||||||||||||||||
| Consumer | 106 | 118 | (12 | ) | (10 | )% | |||||||||||||||||||||||||||||||||||||||||||
Securities-based lending(1) | 97 | 107 | (10 | ) | (9 | )% | Securities-based lending(1) | 195 | 169 | 26 | 15 | % | |||||||||||||||||||||||||||||||||||||
| Total loans receivable | 1,991 | 2,132 | (141 | ) | (7 | )% | Total loans receivable | 1,544 | 1,607 | (63) | (4) | % | |||||||||||||||||||||||||||||||||||||
| Unamortized premiums, net | 6 | 8 | (2 | ) | (25 | )% | Unamortized premiums, net | 4 | 5 | (1) | (20) | % | |||||||||||||||||||||||||||||||||||||
| Subtotal | 1,997 | 2,140 | (143 | ) | (7 | )% | Subtotal | 1,548 | 1,612 | (64) | (4) | % | |||||||||||||||||||||||||||||||||||||
| Less: Allowance for loan losses | 32 | 37 | (5 | ) | (14 | )% | |||||||||||||||||||||||||||||||||||||||||||
Allowance for credit losses(2) | Allowance for credit losses(2) | 86 | (17) | 103 | * | ||||||||||||||||||||||||||||||||||||||||||||
| Total loans receivable, net | $ | 1,965 | $ | 2,103 | $ | (138 | ) | (7 | )% | Total loans receivable, net | $ | 1,634 | $ | 1,595 | $ | 39 | 2 | % | |||||||||||||||||||||||||||||||
| Variance | |||||||||||||||||||||||||||||||||||||||||||||||||
| Variance | |||||||||||||||||||||||||||||||||||||||||||||||||
| March 31, | December 31, | 2019 vs. 2018 | March 31, | December 31, | 2020 vs. 2019 | ||||||||||||||||||||||||||||||||||||||||||||
| 2019 | 2018 | Amount | % | 2020 | 2019 | Amount | % | ||||||||||||||||||||||||||||||||||||||||||
| Receivables: | Receivables: | ||||||||||||||||||||||||||||||||||||||||||||||||
| Securities borrowed | $ | 277 | $ | 140 | $ | 137 | 98 | % | Securities borrowed | $ | 507 | $ | 1,003 | $ | (496) | (49) | % | ||||||||||||||||||||||||||||||||
| Receivables from clearing organizations | 255 | 555 | (300 | ) | (54 | )% | Receivables from clearing organizations | 499 | 297 | 202 | 68 | % | |||||||||||||||||||||||||||||||||||||
| Other | 65 | 65 | — | — | % | Other | 118 | 95 | 23 | 24 | % | ||||||||||||||||||||||||||||||||||||||
| Total | $ | 597 | $ | 760 | $ | (163 | ) | (21 | )% | Total | $ | 1,124 | $ | 1,395 | $ | (271) | (19) | % | |||||||||||||||||||||||||||||||
| Payables: | Payables: | ||||||||||||||||||||||||||||||||||||||||||||||||
| Securities loaned | $ | 1,109 | $ | 887 | $ | 222 | 25 | % | Securities loaned | $ | 696 | $ | 838 | $ | (142) | (17) | % | ||||||||||||||||||||||||||||||||
| Payables to clearing organizations | 6 | 11 | (5 | ) | (45 | )% | Payables to clearing organizations | 23 | 10 | 13 | 130 | % | |||||||||||||||||||||||||||||||||||||
| Other | 47 | 50 | (3 | ) | (6 | )% | Other | 57 | 45 | 12 | 27 | % | |||||||||||||||||||||||||||||||||||||
| Total | $ | 1,162 | $ | 948 | $ | 214 | 23 | % | Total | $ | 776 | $ | 893 | $ | (117) | (13) | % | ||||||||||||||||||||||||||||||||
| Variance | |||||||||||||||||||||||||||||||||||||||||||||||||
| Variance | |||||||||||||||||||||||||||||||||||||||||||||||||
| March 31, | December 31, | 2019 vs. 2018 | March 31, | December 31, | 2020 vs. 2019 | ||||||||||||||||||||||||||||||||||||||||||||
| 2019 | 2018 | Amount | % | 2020 | 2019 | Amount | % | ||||||||||||||||||||||||||||||||||||||||||
| Sweep deposits | $ | 38,639 | $ | 39,322 | $ | (683 | ) | (2 | )% | ||||||||||||||||||||||||||||||||||||||||
Savings deposits(1) | 5,790 | 4,133 | 1,657 | 40 | % | ||||||||||||||||||||||||||||||||||||||||||||
| Sweep deposits: | Sweep deposits: | ||||||||||||||||||||||||||||||||||||||||||||||||
| Brokerage sweep deposits | Brokerage sweep deposits | $ | 38,095 | $ | 27,949 | $ | 10,146 | 36 | % | ||||||||||||||||||||||||||||||||||||||||
Bank sweep deposits(1) | Bank sweep deposits(1) | 680 | 6,355 | (5,675) | (89) | % | |||||||||||||||||||||||||||||||||||||||||||
Savings deposits(2) | Savings deposits(2) | 1,667 | 2,592 | (925) | (36) | % | |||||||||||||||||||||||||||||||||||||||||||
| Other deposits | 1,899 | 1,858 | 41 | 2 | % | Other deposits | 1,704 | 1,710 | (6) | — | % | ||||||||||||||||||||||||||||||||||||||
| Total deposits | $ | 46,328 | $ | 45,313 | $ | 1,015 | 2 | % | Total deposits | $ | 42,146 | $ | 38,606 | $ | 3,540 | 9 | % | ||||||||||||||||||||||||||||||||
| LIQUIDITY AND CAPITAL RESOURCES | ||
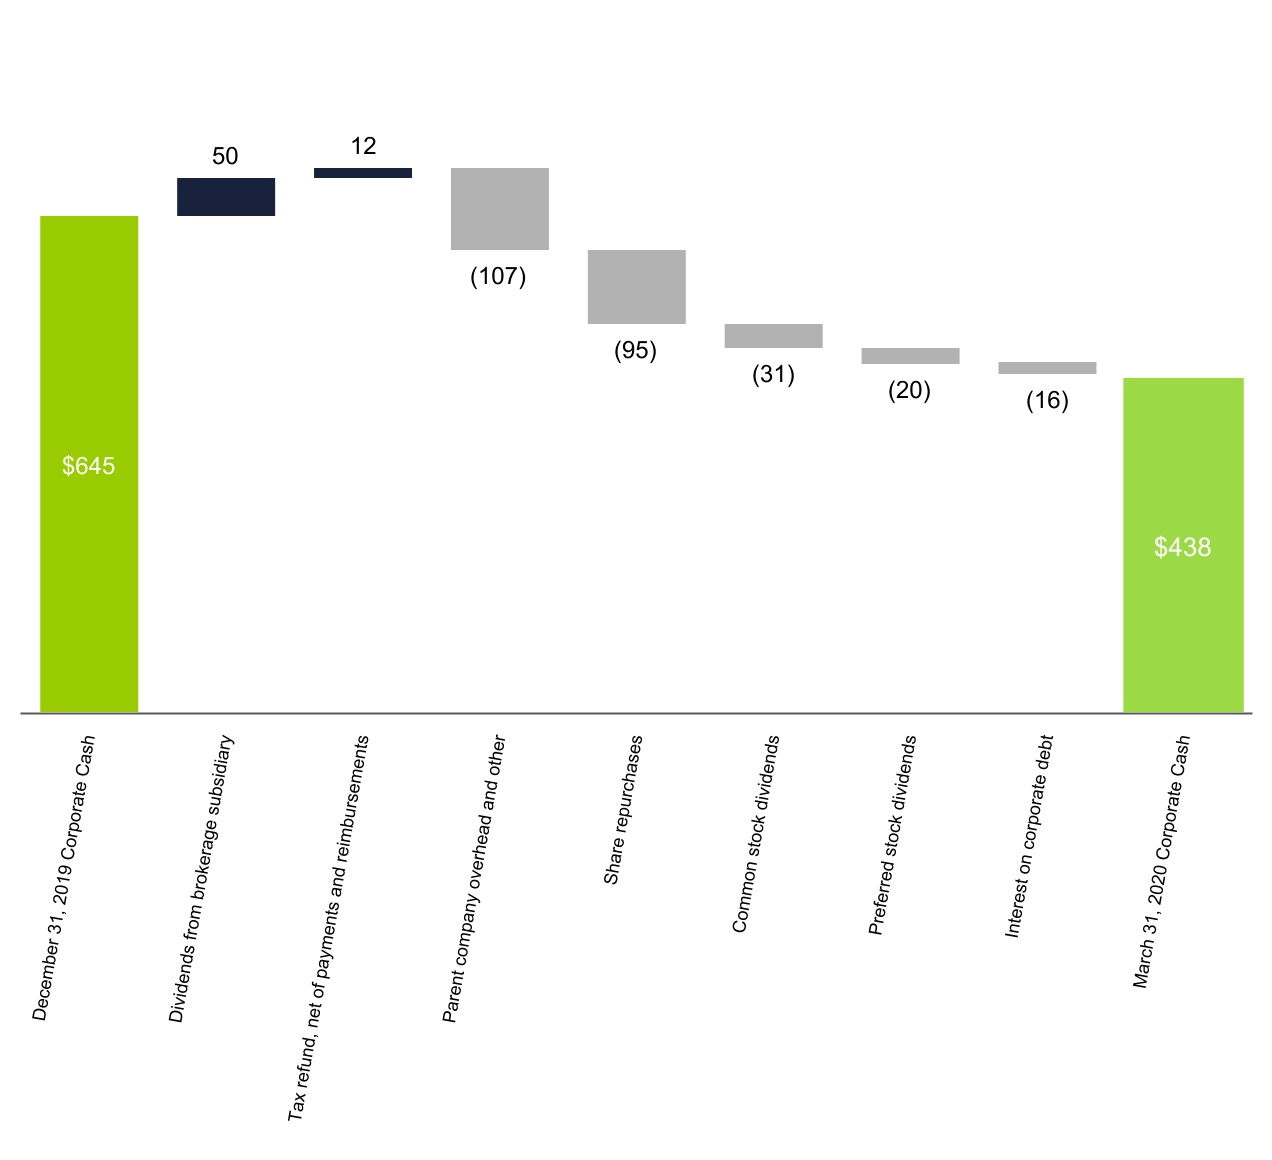
| March 31, 2020 | December 31, 2019 | ||||||||||||||||
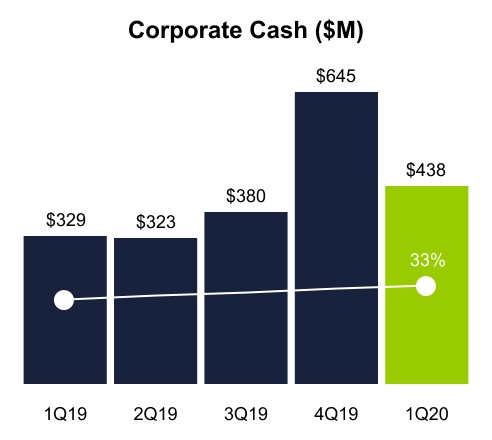
| Consolidated cash and equivalents | $ | 1,105 | $ | 750 | |||||||||||||
| Less: Cash at regulated subsidiaries | (1,094) | (716) | |||||||||||||||
Add: Cash on deposit at E*TRADE Bank(1) | 427 | 611 | |||||||||||||||
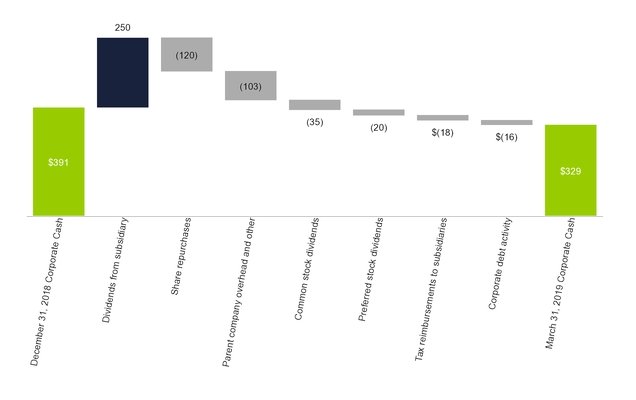
| Corporate cash | $ | 438 | $ | 645 | |||||||||||||
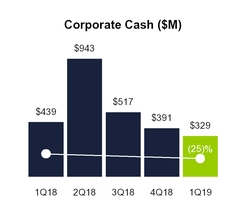
| March 31, 2019 | December 31, 2018 | ||||||
| Consolidated cash and equivalents | $ | 523 | $ | 2,333 | |||
| Less: Cash at regulated subsidiaries | (518 | ) | (2,347 | ) | |||
Add: Cash on deposit at E*TRADE Bank(1) | 324 | 405 | |||||
| Corporate cash | $ | 329 | $ | 391 | |||
| Description | Maturity | Borrower | Outstanding | Available | ||||
Unsecured, committed revolving credit facility(1) | June 2020 | ETFC | $ | — | $ | 300 | ||
| FHLB secured credit facility | Determined at trade | ETB | $ | 300 | $ | 6,231 | ||
| Federal Reserve Bank discount window | Overnight | ETB | $ | — | $ | 941 | ||
Senior unsecured, committed revolving credit facility(2) | June 2019 | ETS | $ | — | $ | 600 | ||
| Secured, committed lines of credit | June 2019 | ETS | $ | — | $ | 175 | ||
| Unsecured, uncommitted lines of credit | June 2019 | ETS | $ | — | $ | 50 | ||
| Unsecured, uncommitted lines of credit | None | ETS | $ | — | $ | 75 | ||
| Secured, uncommitted lines of credit | None | ETS | $ | — | $ | 375 | ||
| Borrower | Outstanding | Available | ||||||||||||
Senior unsecured, committed revolving credit facility | ||||||||||||||
| (1) | June 2024 | ETFC | $ | — | $ | 300 | ||||||||
| ETB | $ | — | $ | 6,430 | ||||||||||
| Federal Reserve Bank discount window | Overnight | ETB | $ | — | $ | 1,245 | ||||||||
Senior unsecured, committed revolving credit facility | June 2020 | ETS | $ | — | $ | 600 | ||||||||
| Secured, committed lines of credit | June 2020 | ETS | $ | — | $ | 175 | ||||||||
| Unsecured, uncommitted lines of credit | June 2020 | ETS | $ | — | $ | 50 | ||||||||
| Unsecured, uncommitted lines of credit | None | ETS | $ | — | $ | 75 | ||||||||
| Secured, uncommitted lines of credit | None | ETS | $ | — | $ | 425 | ||||||||
| E*TRADE Financial | E*TRADE Bank | ||||||||||||||
| March 31, 2019 | December 31, 2018 | March 31, 2019 | December 31, 2018 | ||||||||||||
| Shareholders’ equity | $ | 6,782 | $ | 6,562 | $ | 3,822 | $ | 3,557 | |||||||
| Deduct: | |||||||||||||||
| Preferred stock | (689 | ) | (689 | ) | — | — | |||||||||
| Common Equity Tier 1 capital before regulatory adjustments | $ | 6,093 | $ | 5,873 | $ | 3,822 | $ | 3,557 | |||||||
| Add: | |||||||||||||||
| Losses in other comprehensive income on available-for-sale debt securities, net of tax | 170 | 275 | 170 | 275 | |||||||||||
| Deduct: | |||||||||||||||
| Goodwill and other intangible assets, net of deferred tax liabilities | (2,519 | ) | (2,540 | ) | (285 | ) | (287 | ) | |||||||
| Disallowed deferred tax assets | (166 | ) | (200 | ) | (67 | ) | (61 | ) | |||||||
| Common Equity Tier 1 capital | $ | 3,578 | $ | 3,408 | $ | 3,640 | $ | 3,484 | |||||||
| Add: | |||||||||||||||
| Preferred stock | 689 | 689 | — | — | |||||||||||
| Tier 1 capital | $ | 4,267 | $ | 4,097 | $ | 3,640 | $ | 3,484 | |||||||
| Add: | |||||||||||||||
| Other | 42 | 46 | 32 | 37 | |||||||||||
| Total capital | $ | 4,309 | $ | 4,143 | $ | 3,672 | $ | 3,521 | |||||||
| Average assets for leverage capital purposes | $ | 66,277 | $ | 64,767 | $ | 51,609 | $ | 49,568 | |||||||
| Deduct: | |||||||||||||||
| Goodwill and other intangible assets, net of deferred tax liabilities | (2,519 | ) | (2,540 | ) | (285 | ) | (287 | ) | |||||||
| Disallowed deferred tax assets | (166 | ) | (200 | ) | (67 | ) | (61 | ) | |||||||
| Adjusted average assets for leverage capital purposes | $ | 63,592 | $ | 62,027 | $ | 51,257 | $ | 49,220 | |||||||
Total risk-weighted assets(1) | $ | 11,889 | $ | 10,970 | $ | 10,755 | $ | 9,994 | |||||||
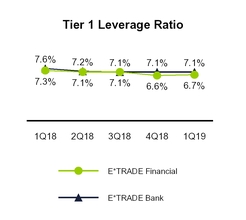
| Tier 1 leverage ratio (Tier 1 capital / Adjusted average assets for leverage capital purposes) | 6.7 | % | 6.6 | % | 7.1 | % | 7.1 | % | |||||||
Common Equity Tier 1 capital / Total risk-weighted assets(1) | 30.1 | % | 31.1 | % | 33.9 | % | 34.9 | % | |||||||
| Tier 1 capital / Total risk-weighted assets | 35.9 | % | 37.3 | % | 33.9 | % | 34.9 | % | |||||||
| Total capital / Total risk-weighted assets | 36.3 | % | 37.8 | % | 34.2 | % | 35.2 | % | |||||||
| E*TRADE Financial | E*TRADE Bank | ||||||||||||||||||||||||||||||||||
| March 31, 2020 | December 31, 2019 | March 31, 2020 | December 31, 2019 | ||||||||||||||||||||||||||||||||
| Shareholders’ equity | $ | 6,519 | $ | 6,543 | $ | 3,529 | $ | 3,488 | |||||||||||||||||||||||||||
| Deduct: | |||||||||||||||||||||||||||||||||||
| Preferred stock | (689) | (689) | — | — | |||||||||||||||||||||||||||||||
| Common Equity Tier 1 capital before regulatory adjustments | $ | 5,830 | $ | 5,854 | $ | 3,529 | $ | 3,488 | |||||||||||||||||||||||||||
| Add: | |||||||||||||||||||||||||||||||||||
| Losses in other comprehensive income on available-for-sale debt securities, net of tax | 168 | 28 | 168 | 28 | |||||||||||||||||||||||||||||||
| Deduct: | |||||||||||||||||||||||||||||||||||
| Goodwill and other intangible assets, net of deferred tax liabilities | (2,456) | (2,466) | (273) | (276) | |||||||||||||||||||||||||||||||
| Disallowed deferred tax assets | (52) | (70) | (4) | — | |||||||||||||||||||||||||||||||
| Common Equity Tier 1 capital | $ | 3,490 | $ | 3,346 | $ | 3,420 | $ | 3,240 | |||||||||||||||||||||||||||
| Add: | |||||||||||||||||||||||||||||||||||
| Preferred stock | 689 | 689 | — | — | |||||||||||||||||||||||||||||||
| Tier 1 capital | $ | 4,179 | $ | 4,035 | $ | 3,420 | $ | 3,240 | |||||||||||||||||||||||||||
| Add: | |||||||||||||||||||||||||||||||||||
| Other | — | 25 | — | 17 | |||||||||||||||||||||||||||||||
| Total capital | $ | 4,179 | $ | 4,060 | $ | 3,420 | $ | 3,257 | |||||||||||||||||||||||||||
| Average assets for leverage capital purposes | $ | 63,515 | $ | 60,968 | $ | 46,544 | $ | 45,320 | |||||||||||||||||||||||||||
| Deduct: | |||||||||||||||||||||||||||||||||||
| Goodwill and other intangible assets, net of deferred tax liabilities | (2,456) | (2,466) | (273) | (276) | |||||||||||||||||||||||||||||||
| Disallowed deferred tax assets | (52) | (70) | (4) | — | |||||||||||||||||||||||||||||||
| Adjusted average assets for leverage capital purposes | $ | 61,007 | $ | 58,432 | $ | 46,267 | $ | 45,044 | |||||||||||||||||||||||||||
Total risk-weighted assets(1) | $ | 11,920 | $ | 10,635 | $ | 9,554 | $ | 8,872 | |||||||||||||||||||||||||||
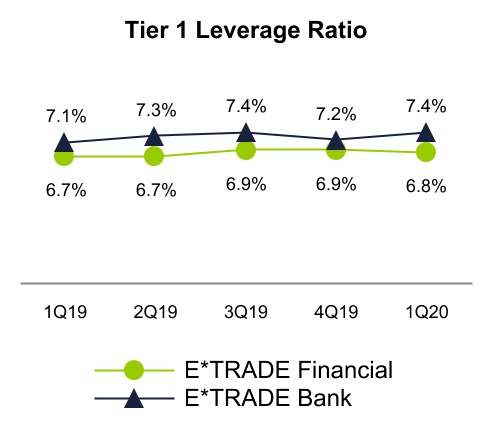
| Tier 1 leverage ratio (Tier 1 capital / Adjusted average assets for leverage capital purposes) | 6.8 | % | 6.9 | % | 7.4 | % | 7.2 | % | |||||||||||||||||||||||||||
Common Equity Tier 1 capital / Total risk-weighted assets(1) | 29.3 | % | 31.5 | % | 35.8 | % | 36.5 | % | |||||||||||||||||||||||||||
| Tier 1 capital / Total risk-weighted assets | 35.1 | % | 37.9 | % | 35.8 | % | 36.5 | % | |||||||||||||||||||||||||||
| Total capital / Total risk-weighted assets | 35.1 | % | 38.2 | % | 35.8 | % | 36.7 | % | |||||||||||||||||||||||||||
| RISK MANAGEMENT | ||
| CONCENTRATIONS OF CREDIT RISK | ||
| SUMMARY OF CRITICAL ACCOUNTING POLICIES AND ESTIMATES |
Instantaneous Parallel Change in Interest Rates (basis points) (1) | Economic Value of Equity | Earnings-at-Risk | ||||||||||||||||||||||||||||||||||||||||||||||||||||||||||||||||||||||||||||||||||||||||||||||||||||||||||||||||
| March 31, 2019 | December 31, 2018 | March 31, 2019 | December 31, 2018 | |||||||||||||||||||||||||||||||||||||||||||||||||||||||||||||||||||||||||||||||||||||||||||||||||||||||||||||||
| Amount | Percentage | Amount | Percentage | Amount | Percentage | Amount | Percentage | |||||||||||||||||||||||||||||||||||||||||||||||||||||||||||||||||||||||||||||||||||||||||||||||||||||||||||
| Instantaneous Parallel Change in Interest Rates (basis points) | Instantaneous Parallel Change in Interest Rates (basis points) | Economic Value of Equity | Earnings-at-Risk | |||||||||||||||||||||||||||||||||||||||||||||||||||||||||||||||||||||||||||||||||||||||||||||||||||||||||||||||
| March 31, 2020 | December 31, 2019 | March 31, 2020 | December 31, 2019 | |||||||||||||||||||||||||||||||||||||||||||||||||||||||||||||||||||||||||||||||||||||||||||||||||||||||||||||||
| Amount | Percentage | Amount | Percentage | Amount | Percentage | Amount | Percentage | |||||||||||||||||||||||||||||||||||||||||||||||||||||||||||||||||||||||||||||||||||||||||||||||||||||||||||
| +200 | $ | 30 | 0.4 | % | $ | 148 | 1.8 | % | $ | 168 | 8.2 | % | $ | 187 | 9.2 | % | +200 | $ | 767 | 14.9 | % | $ | (217) | (3.6) | % | $ | 355 | 26.0 | % | $ | 246 | 15.8 | % | |||||||||||||||||||||||||||||||||||||||||||||||||||||||||||||||||||||||||||||||||
| +100 | $ | 181 | 2.3 | % | $ | 198 | 2.4 | % | $ | 96 | 4.7 | % | $ | 101 | 5.0 | % | +100 | $ | 691 | 13.5 | % | $ | 39 | 0.6 | % | $ | 198 | 14.5 | % | $ | 140 | 9.0 | % | |||||||||||||||||||||||||||||||||||||||||||||||||||||||||||||||||||||||||||||||||
| +50 | $ | 147 | 1.8 | % | $ | 146 | 1.8 | % | $ | 53 | 2.6 | % | $ | 53 | 2.6 | % | +50 | $ | 398 | 7.8 | % | $ | 96 | 1.6 | % | $ | 105 | 7.7 | % | $ | 83 | 5.3 | % | |||||||||||||||||||||||||||||||||||||||||||||||||||||||||||||||||||||||||||||||||
| -50 | $ | (304 | ) | (3.8 | )% | $ | (273 | ) | (3.4 | )% | $ | (80 | ) | (3.9 | )% | $ | (88 | ) | (4.3 | )% | -50 | $ | (346) | (6.7) | % | $ | (200) | (3.3) | % | $ | (65) | (4.8) | % | $ | (103) | (6.6) | % | |||||||||||||||||||||||||||||||||||||||||||||||||||||||||||||||||||||||||||||
| Condensed Consolidated | |||||
| Condensed Consolidated | |||||
| Condensed Consolidated Balance | |||||
| Condensed Consolidated | |||||
| Condensed Consolidated | |||||
| Notes to Condensed Consolidated Financial Statements (Unaudited) | |||||
| Note 1—Organization, Basis of Presentation and Summary of Significant Accounting Policies | |||||
| Note 2— | |||||
| Note 3—Net Revenue | |||||
| Note 4—Fair Value Disclosures | |||||
| Note | |||||
| Note | |||||
| Note | |||||
| Note | |||||
| Note | |||||
| Note | |||||
| Note 11—Shareholders' Equity | |||||
| Note 12—Earnings | |||||
| Note 13—Regulatory Requirements | |||||
| Note 14—Commitments, Contingencies and Other Regulatory Matters | |||||
| Three Months Ended March 31, | |||||||||||||||||||||||||||||||||||
| 2020 | 2019 | ||||||||||||||||||||||||||||||||||
| Revenue: | |||||||||||||||||||||||||||||||||||
| Interest income | $ | 443 | $ | 555 | |||||||||||||||||||||||||||||||
| Interest expense | (43) | (63) | |||||||||||||||||||||||||||||||||
| Net interest income | 400 | 492 | |||||||||||||||||||||||||||||||||
| Commissions | 71 | 122 | |||||||||||||||||||||||||||||||||
| Fees and service charges | 203 | 118 | |||||||||||||||||||||||||||||||||
| Gains on securities and other, net | 20 | 11 | |||||||||||||||||||||||||||||||||
| Other revenue | 13 | 12 | |||||||||||||||||||||||||||||||||
| Total non-interest income | 307 | 263 | |||||||||||||||||||||||||||||||||
| Total net revenue | 707 | 755 | |||||||||||||||||||||||||||||||||
| Provision (benefit) for credit losses | 6 | (12) | |||||||||||||||||||||||||||||||||
| Non-interest expense: | |||||||||||||||||||||||||||||||||||
| Compensation and benefits | 168 | 164 | |||||||||||||||||||||||||||||||||
| Advertising and market development | 56 | 54 | |||||||||||||||||||||||||||||||||
| Clearing and servicing | 44 | 30 | |||||||||||||||||||||||||||||||||
| Professional services | 23 | 22 | |||||||||||||||||||||||||||||||||
| Occupancy and equipment | 36 | 32 | |||||||||||||||||||||||||||||||||
| Communications | 29 | 15 | |||||||||||||||||||||||||||||||||
| Depreciation and amortization | 23 | 21 | |||||||||||||||||||||||||||||||||
| FDIC insurance premiums | 4 | 4 | |||||||||||||||||||||||||||||||||
| Amortization of other intangibles | 15 | 15 | |||||||||||||||||||||||||||||||||
| Restructuring and acquisition-related activities | 16 | — | |||||||||||||||||||||||||||||||||
| Other non-interest expenses | 31 | 18 | |||||||||||||||||||||||||||||||||
| Total non-interest expense | 445 | 375 | |||||||||||||||||||||||||||||||||
| Income before income tax expense | 256 | 392 | |||||||||||||||||||||||||||||||||
| Income tax expense | 75 | 102 | |||||||||||||||||||||||||||||||||
| Net income | $ | 181 | $ | 290 | |||||||||||||||||||||||||||||||
| Preferred stock dividends | 20 | 20 | |||||||||||||||||||||||||||||||||
| Net income available to common shareholders | $ | 161 | $ | 270 | |||||||||||||||||||||||||||||||
| Basic earnings per common share | $ | 0.73 | $ | 1.10 | |||||||||||||||||||||||||||||||
| Diluted earnings per common share | $ | 0.72 | $ | 1.09 | |||||||||||||||||||||||||||||||
| Weighted average common shares outstanding: | |||||||||||||||||||||||||||||||||||
| Basic (in thousands) | 222,295 | 246,252 | |||||||||||||||||||||||||||||||||
| Diluted (in thousands) | 222,742 | 246,934 | |||||||||||||||||||||||||||||||||
| Three Months Ended March 31, | |||||||
| 2019 | 2018 | ||||||
| Revenue: | |||||||
| Interest income | $ | 555 | $ | 468 | |||
| Interest expense | (63 | ) | (23 | ) | |||
| Net interest income | 492 | 445 | |||||
| Commissions | 122 | 137 | |||||
| Fees and service charges | 118 | 105 | |||||
| Gains on securities and other, net | 11 | 10 | |||||
| Other revenue | 12 | 11 | |||||
| Total non-interest income | 263 | 263 | |||||
| Total net revenue | 755 | 708 | |||||
| Provision (benefit) for loan losses | (12 | ) | (21 | ) | |||
| Non-interest expense: | |||||||
| Compensation and benefits | 164 | 152 | |||||
| Advertising and market development | 54 | 60 | |||||
| Clearing and servicing | 30 | 36 | |||||
| Professional services | 22 | 22 | |||||
| Occupancy and equipment | 32 | 30 | |||||
| Communications | 15 | 31 | |||||
| Depreciation and amortization | 21 | 22 | |||||
| FDIC insurance premiums | 4 | 9 | |||||
| Amortization of other intangibles | 15 | 10 | |||||
| Other non-interest expenses | 18 | 23 | |||||
| Total non-interest expense | 375 | 395 | |||||
| Income before income tax expense | 392 | 334 | |||||
| Income tax expense | 102 | 87 | |||||
| Net income | $ | 290 | $ | 247 | |||
| Preferred stock dividends | 20 | 12 | |||||
| Net income available to common shareholders | $ | 270 | $ | 235 | |||
| Basic earnings per common share | $ | 1.10 | $ | 0.88 | |||
| Diluted earnings per common share | $ | 1.09 | $ | 0.88 | |||
| Weighted average common shares outstanding: | |||||||
| Basic (in thousands) | 246,252 | 266,558 | |||||
| Diluted (in thousands) | 246,934 | 267,699 | |||||
| Three Months Ended March 31, | |||||||
| 2019 | 2018 | ||||||
| Net income | $ | 290 | $ | 247 | |||
| Other comprehensive income (loss), net of tax | |||||||
| Available-for-sale securities: | |||||||
| Unrealized gains (losses), net | 112 | (128 | ) | ||||
| Reclassification into earnings, net | (7 | ) | (7 | ) | |||
| Transfer of held-to-maturity securities to available-for-sale securities | — | 6 | |||||
| Net change from available-for-sale securities | 105 | (129 | ) | ||||
| Other comprehensive income (loss) | 105 | (129 | ) | ||||
| Comprehensive income | $ | 395 | $ | 118 | |||
| Three Months Ended March 31, | |||||||||||||||||||||||
| 2020 | 2019 | ||||||||||||||||||||||
| Net income | $ | 181 | $ | 290 | |||||||||||||||||||
| Other comprehensive (loss) income, net of tax | |||||||||||||||||||||||
| Available-for-sale securities: | |||||||||||||||||||||||
| Unrealized (losses) gains, net | (126) | 112 | |||||||||||||||||||||
| Reclassification into earnings, net | (14) | (7) | |||||||||||||||||||||
| Net change from available-for-sale securities | (140) | 105 | |||||||||||||||||||||
| Other comprehensive (loss) income | (140) | 105 | |||||||||||||||||||||
| Comprehensive income | $ | 41 | $ | 395 | |||||||||||||||||||
| March 31, | December 31, | |||||||||||||||||
| March 31, | December 31, | |||||||||||||||||
| 2019 | 2018 | 2020 | 2019 | |||||||||||||||
| ASSETS | ASSETS | |||||||||||||||||
| Cash and equivalents | $ | 523 | $ | 2,333 | Cash and equivalents | $ | 1,105 | $ | 750 | |||||||||
| Cash segregated under federal or other regulations | 677 | 1,011 | Cash segregated under federal or other regulations | 5,730 | 1,879 | |||||||||||||
| Available-for-sale securities | 24,971 | 23,153 | ||||||||||||||||
| Held-to-maturity securities (fair value of $23,824 and $21,491 at March 31, 2019 and December 31, 2018, respectively) | 23,927 | 21,884 | ||||||||||||||||
Available-for-sale securities (amortized cost of $19,863 and $18,708 at March 31, 2020 and December 31, 2019, respectively) | Available-for-sale securities (amortized cost of $19,863 and $18,708 at March 31, 2020 and December 31, 2019, respectively) | 21,440 | 19,501 | |||||||||||||||
| Held-to-maturity securities (fair value of $25,926 and $22,246 at March 31, 2020 and December 31, 2019, respectively) | Held-to-maturity securities (fair value of $25,926 and $22,246 at March 31, 2020 and December 31, 2019, respectively) | 25,090 | 21,969 | |||||||||||||||
| Margin receivables | 10,267 | 9,560 | Margin receivables | 7,251 | 9,675 | |||||||||||||
| Loans receivable, net (net of allowance for loan losses of $32 and $37 at March 31, 2019 and December 31, 2018, respectively) | 1,965 | 2,103 | ||||||||||||||||
| Loans receivable, net (net of allowance for credit losses of $86 and ($17) at March 31, 2020 and December 31, 2019, respectively) | Loans receivable, net (net of allowance for credit losses of $86 and ($17) at March 31, 2020 and December 31, 2019, respectively) | 1,634 | 1,595 | |||||||||||||||
| Receivables from brokers, dealers and clearing organizations | 597 | 760 | Receivables from brokers, dealers and clearing organizations | 1,124 | 1,395 | |||||||||||||
| Property and equipment, net | 308 | 281 | Property and equipment, net | 339 | 339 | |||||||||||||
| Goodwill | 2,485 | 2,485 | Goodwill | 2,509 | 2,510 | |||||||||||||
| Other intangibles, net | 476 | 491 | Other intangibles, net | 419 | 433 | |||||||||||||
| Other assets | 1,322 | 942 | Other assets | 1,215 | 1,370 | |||||||||||||
| Total assets | $ | 67,518 | $ | 65,003 | Total assets | $ | 67,856 | $ | 61,416 | |||||||||
| LIABILITIES AND SHAREHOLDERS’ EQUITY | LIABILITIES AND SHAREHOLDERS’ EQUITY | |||||||||||||||||
| Liabilities: | Liabilities: | |||||||||||||||||
| Deposits | $ | 46,328 | $ | 45,313 | Deposits | $ | 42,146 | $ | 38,606 | |||||||||
| Customer payables | 10,600 | 10,117 | Customer payables | 15,960 | 12,849 | |||||||||||||
| Payables to brokers, dealers and clearing organizations | 1,162 | 948 | Payables to brokers, dealers and clearing organizations | 776 | 893 | |||||||||||||
| Other borrowings | 300 | — | ||||||||||||||||
| Corporate debt | 1,409 | 1,409 | Corporate debt | 1,411 | 1,410 | |||||||||||||
| Other liabilities | 937 | 654 | Other liabilities | 1,044 | 1,115 | |||||||||||||
| Total liabilities | 60,736 | 58,441 | Total liabilities | 61,337 | 54,873 | |||||||||||||
| Commitments and contingencies (see Note 14) | Commitments and contingencies (see Note 14) | |||||||||||||||||
| Shareholders’ equity: | Shareholders’ equity: | |||||||||||||||||
| Preferred stock, $0.01 par value, 1,000,000 shares authorized, 403,000 shares issued and outstanding at both March 31, 2019 and December 31, 2018; aggregate liquidation preference of $700 at both March 31, 2019 and December 31, 2018 | 689 | 689 | ||||||||||||||||
| Common stock, $0.01 par value, 400,000,000 shares authorized, 244,647,243 and 246,495,174 shares issued and outstanding at March 31, 2019 and December 31, 2018, respectively | 2 | 2 | ||||||||||||||||
| Preferred stock, $0.01 par value, 1,000,000 shares authorized, 403,000 shares issued and outstanding at both March 31, 2020 and December 31, 2019, respectively; aggregate liquidation preference of $700 at both March 31, 2020 and December 31, 2019, respectively | Preferred stock, $0.01 par value, 1,000,000 shares authorized, 403,000 shares issued and outstanding at both March 31, 2020 and December 31, 2019, respectively; aggregate liquidation preference of $700 at both March 31, 2020 and December 31, 2019, respectively | 689 | 689 | |||||||||||||||
| Common stock, $0.01 par value, 400,000,000 shares authorized, 221,032,420 and 222,622,333 shares issued and outstanding at March 31, 2020 and December 31, 2019, respectively | Common stock, $0.01 par value, 400,000,000 shares authorized, 221,032,420 and 222,622,333 shares issued and outstanding at March 31, 2020 and December 31, 2019, respectively | 2 | 2 | |||||||||||||||
| Additional paid-in-capital | 5,342 | 5,462 | Additional paid-in-capital | 4,318 | 4,416 | |||||||||||||
| Retained earnings | 919 | 684 | Retained earnings | 1,678 | 1,464 | |||||||||||||
| Accumulated other comprehensive loss | (170 | ) | (275 | ) | Accumulated other comprehensive loss | (168) | (28) | |||||||||||
| Total shareholders’ equity | 6,782 | 6,562 | Total shareholders’ equity | 6,519 | 6,543 | |||||||||||||
| Total liabilities and shareholders’ equity | $ | 67,518 | $ | 65,003 | Total liabilities and shareholders’ equity | $ | 67,856 | $ | 61,416 | |||||||||
| Additional Paid-in Capital | Retained Earnings | Accumulated Other Comprehensive Loss | Total Shareholders’ Equity | ||||||||||||||||||||||||||||||||||||||||||||||||||||||||||||||||||||||||||||
| Preferred Stock | Common Stock | ||||||||||||||||||||||||||||||||||||||||||||||||||||||||||||||||||||||||||||||
| Amount | Shares | Amount | |||||||||||||||||||||||||||||||||||||||||||||||||||||||||||||||||||||||||||||
| Balance at December 31, 2019 | Balance at December 31, 2019 | $ | 689 | 223 | $ | 2 | $ | 4,416 | $ | 1,464 | $ | (28) | $ | 6,543 | |||||||||||||||||||||||||||||||||||||||||||||||||||||||||||||||||
| Cumulative effect of CECL adoption | Cumulative effect of CECL adoption | — | — | — | — | 84 | — | 84 | |||||||||||||||||||||||||||||||||||||||||||||||||||||||||||||||||||||||
| Net income | Net income | — | — | — | — | 181 | — | 181 | |||||||||||||||||||||||||||||||||||||||||||||||||||||||||||||||||||||||
| Other comprehensive loss | Other comprehensive loss | — | — | — | — | — | (140) | (140) | |||||||||||||||||||||||||||||||||||||||||||||||||||||||||||||||||||||||
| Common stock dividends ($0.14 per share) | Common stock dividends ($0.14 per share) | — | — | — | — | (31) | — | (31) | |||||||||||||||||||||||||||||||||||||||||||||||||||||||||||||||||||||||
| Preferred stock dividends - Series A ($29.38 per share) | Preferred stock dividends - Series A ($29.38 per share) | — | — | — | — | (12) | — | (12) | |||||||||||||||||||||||||||||||||||||||||||||||||||||||||||||||||||||||
| Preferred stock dividends - Series B ($2,650.00 per share) | Preferred stock dividends - Series B ($2,650.00 per share) | — | — | — | — | (8) | — | (8) | |||||||||||||||||||||||||||||||||||||||||||||||||||||||||||||||||||||||
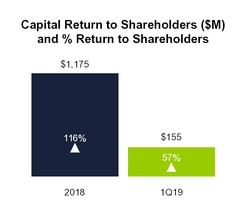
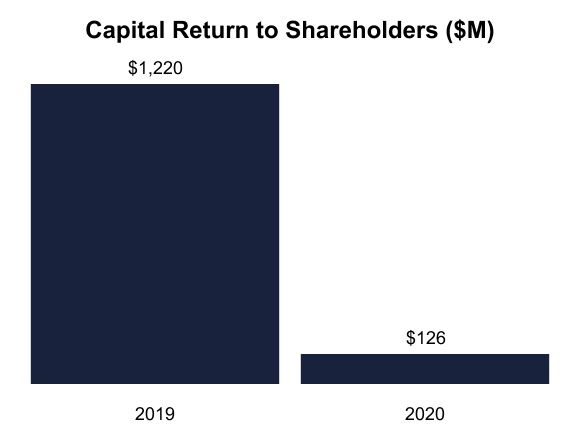
| Repurchases of common stock | Repurchases of common stock | — | (2) | — | (95) | — | — | (95) | |||||||||||||||||||||||||||||||||||||||||||||||||||||||||||||||||||||||
| Share-based compensation | Share-based compensation | — | — | — | 8 | — | — | 8 | |||||||||||||||||||||||||||||||||||||||||||||||||||||||||||||||||||||||
| Other common stock activity | Other common stock activity | — | — | — | (11) | — | — | (11) | |||||||||||||||||||||||||||||||||||||||||||||||||||||||||||||||||||||||
| Balance at March 31, 2020 | Balance at March 31, 2020 | $ | 689 | 221 | $ | 2 | $ | 4,318 | $ | 1,678 | $ | (168) | $ | 6,519 | |||||||||||||||||||||||||||||||||||||||||||||||||||||||||||||||||
| Additional Paid-in Capital | Retained Earnings | Accumulated Other Comprehensive Loss | Total Shareholders’ Equity | Additional Paid-in Capital | Retained Earnings | Accumulated Other Comprehensive Loss | Total Shareholders’ Equity | ||||||||||||||||||||||||||||||||||||||||||||||||||||||||||||||||||||||||
| Preferred Stock | Common Stock | Preferred Stock | Common Stock | ||||||||||||||||||||||||||||||||||||||||||||||||||||||||||||||||||||||||||||
| Amount | Shares | Amount | Amount | Shares | Amount | ||||||||||||||||||||||||||||||||||||||||||||||||||||||||||||||||||||||||||
| Balance at December 31, 2018 | $ | 689 | 246 | $ | 2 | $ | 5,462 | $ | 684 | $ | (275 | ) | $ | 6,562 | Balance at December 31, 2018 | $ | 689 | 246 | $ | 2 | $ | 5,462 | $ | 684 | $ | (275) | $ | 6,562 | |||||||||||||||||||||||||||||||||||||||||||||||||||
| Net income | — | — | — | — | 290 | — | 290 | Net income | — | — | — | — | 290 | — | 290 | ||||||||||||||||||||||||||||||||||||||||||||||||||||||||||||||||
| Other comprehensive income | — | — | — | — | — | 105 | 105 | Other comprehensive income | — | — | — | — | — | 105 | 105 | ||||||||||||||||||||||||||||||||||||||||||||||||||||||||||||||||
| Common stock dividends ($0.14 per share) | — | — | — | — | (35 | ) | — | (35 | ) | Common stock dividends ($0.14 per share) | — | — | — | — | (35) | — | (35) | ||||||||||||||||||||||||||||||||||||||||||||||||||||||||||||||
| Preferred stock dividends - Series A ($29.38 per share) | — | — | — | — | (12 | ) | — | (12 | ) | Preferred stock dividends - Series A ($29.38 per share) | — | — | — | — | (12) | — | (12) | ||||||||||||||||||||||||||||||||||||||||||||||||||||||||||||||
| Preferred stock dividends - Series B ($2,650.00 per share) | — | — | — | — | (8 | ) | — | (8 | ) | Preferred stock dividends - Series B ($2,650.00 per share) | — | — | — | — | (8) | — | (8) | ||||||||||||||||||||||||||||||||||||||||||||||||||||||||||||||
| Repurchases of common stock | — | (2 | ) | — | (120 | ) | — | — | (120 | ) | Repurchases of common stock | — | (2) | — | (120) | — | — | (120) | |||||||||||||||||||||||||||||||||||||||||||||||||||||||||||||
| Share-based compensation | — | — | — | 13 | — | — | 13 | Share-based compensation | — | — | — | 13 | — | — | 13 | ||||||||||||||||||||||||||||||||||||||||||||||||||||||||||||||||
| Other common stock activity | — | 1 | — | (13 | ) | — | — | (13 | ) | Other common stock activity | — | 1 | — | (13) | — | — | (13) | ||||||||||||||||||||||||||||||||||||||||||||||||||||||||||||||
| Balance at March 31, 2019 | $ | 689 | 245 | $ | 2 | $ | 5,342 | $ | 919 | $ | (170 | ) | $ | 6,782 | Balance at March 31, 2019 | $ | 689 | 245 | $ | 2 | $ | 5,342 | $ | 919 | $ | (170) | $ | 6,782 | |||||||||||||||||||||||||||||||||||||||||||||||||||
Additional Paid-in Capital | Accumulated Deficit | Accumulated Other Comprehensive Loss | Total Shareholders’ Equity | ||||||||||||||||||||||||||||||||||||||||||||||||||||||||||||||||||||||||||||
| Preferred Stock | Common Stock | ||||||||||||||||||||||||||||||||||||||||||||||||||||||||||||||||||||||||||||||
| Amount | Shares | Amount | |||||||||||||||||||||||||||||||||||||||||||||||||||||||||||||||||||||||||||||
| Balance at December 31, 2017 | $ | 689 | 267 | $ | 3 | $ | 6,582 | $ | (317 | ) | $ | (26 | ) | $ | 6,931 | ||||||||||||||||||||||||||||||||||||||||||||||||||||||||||||||||
| Cumulative effect of hedge accounting adoption | — | — | — | — | 7 | (7 | ) | — | |||||||||||||||||||||||||||||||||||||||||||||||||||||||||||||||||||||||
| Reclassification of tax effects due to federal tax reform | — | — | — | — | 14 | (14 | ) | — | |||||||||||||||||||||||||||||||||||||||||||||||||||||||||||||||||||||||
| Net income | — | — | — | — | 247 | — | 247 | ||||||||||||||||||||||||||||||||||||||||||||||||||||||||||||||||||||||||
| Other comprehensive loss | — | — | — | — | — | (129 | ) | (129 | ) | ||||||||||||||||||||||||||||||||||||||||||||||||||||||||||||||||||||||
| Preferred stock dividends - Series A ($29.38 per share) | — | — | — | — | (12 | ) | — | (12 | ) | ||||||||||||||||||||||||||||||||||||||||||||||||||||||||||||||||||||||
| Repurchases of common stock | — | (3 | ) | — | (140 | ) | — | — | (140 | ) | |||||||||||||||||||||||||||||||||||||||||||||||||||||||||||||||||||||
| Share-based compensation | — | — | — | 10 | — | — | 10 | ||||||||||||||||||||||||||||||||||||||||||||||||||||||||||||||||||||||||
| Other common stock activity | — | 1 | — | (18 | ) | — | — | (18 | ) | ||||||||||||||||||||||||||||||||||||||||||||||||||||||||||||||||||||||
| Balance at March 31, 2018 | $ | 689 | 265 | $ | 3 | $ | 6,434 | $ | (61 | ) | $ | (176 | ) | $ | 6,889 | ||||||||||||||||||||||||||||||||||||||||||||||||||||||||||||||||
E*TRADE FINANCIAL CORPORATION CONDENSED CONSOLIDATED STATEMENT OF CASH FLOWS (In millions) (Unaudited) | |||||||
| Three Months Ended March 31, | |||||||
| 2019 | 2018 | ||||||
| Cash flows from operating activities: | |||||||
| Net income | $ | 290 | $ | 247 | |||
| Adjustments to reconcile net income to net cash provided by operating activities: | |||||||
| Provision (benefit) for loan losses | (12 | ) | (21 | ) | |||
| Depreciation and amortization (including amortization and accretion on investment securities) | 54 | 65 | |||||
| Gains on securities and other, net | (11 | ) | (10 | ) | |||
| Share-based compensation | 13 | 10 | |||||
| Deferred tax expense | 93 | 78 | |||||
| Other | (3 | ) | 1 | ||||
| Net effect of changes in assets and liabilities: | |||||||
| Decrease in receivables from brokers, dealers and clearing organizations | 163 | 443 | |||||
| Increase in margin receivables | (707 | ) | (1,444 | ) | |||
| (Increase) decrease in other assets | (183 | ) | 367 | ||||
| Increase in payables to brokers, dealers and clearing organizations | 214 | 1,350 | |||||
| Increase (decrease) in customer payables | 483 | (502 | ) | ||||
| Decrease in other liabilities | (209 | ) | (38 | ) | |||
| Net cash provided by operating activities | 185 | 546 | |||||
| Cash flows from investing activities: | |||||||
| Purchases of available-for-sale securities | (3,589 | ) | (2,282 | ) | |||
| Proceeds from sales of available-for-sale securities | 1,760 | 797 | |||||
| Proceeds from maturities of and principal payments on available-for-sale securities | 361 | 459 | |||||
| Purchases of held-to-maturity securities | (3,084 | ) | (1,109 | ) | |||
| Proceeds from maturities of and principal payments on held-to-maturity securities | 1,034 | 593 | |||||
| Proceeds from sales of loans | — | 15 | |||||
| Decrease in loans receivable | 145 | 163 | |||||
| Capital expenditures for property and equipment | (38 | ) | (21 | ) | |||
| Proceeds from sale of real estate owned and repossessed assets | 4 | 9 | |||||
| Net cash flow from derivative contracts | (29 | ) | 10 | ||||
| Other | (18 | ) | (4 | ) | |||
| Net cash used in investing activities | (3,454 | ) | (1,370 | ) | |||
E*TRADE FINANCIAL CORPORATION CONDENSED CONSOLIDATED STATEMENT OF CASH FLOWS (In millions) (Unaudited) | |||||||
| Three Months Ended March 31, | |||||||
| 2019 | 2018 | ||||||
| Cash flows from financing activities: | |||||||
| Increase in deposits | $ | 1,015 | $ | 160 | |||
| Common stock dividends | (35 | ) | — | ||||
| Preferred stock dividends | (20 | ) | (12 | ) | |||
| Net increase in advances from FHLB | 300 | — | |||||
| Repurchases of common stock | (120 | ) | (140 | ) | |||
| Other | (15 | ) | (17 | ) | |||
| Net cash provided by (used in) financing activities | 1,125 | (9 | ) | ||||
| Decrease in cash, cash equivalents and segregated cash | (2,144 | ) | (833 | ) | |||
| Cash, cash equivalents and segregated cash, beginning of period | 3,344 | 1,803 | |||||
| Cash, cash equivalents and segregated cash, end of period | $ | 1,200 | $ | 970 | |||
| Cash and equivalents, end of period | $ | 523 | $ | 498 | |||
| Segregated cash, end of period | 677 | 472 | |||||
| Cash, cash equivalents and segregated cash, end of period | $ | 1,200 | $ | 970 | |||
| Supplemental disclosures: | |||||||
| Cash paid for interest | $ | 65 | $ | 30 | |||
| Cash paid for income taxes, net of refunds | $ | 3 | $ | 4 | |||
| Right-of-use assets recognized upon adoption of new lease standard | $ | 193 | $ | — | |||
| Right-of-use assets obtained during the period | $ | 13 | $ | — | |||
| Non-cash investing and financing activities: | |||||||
| Transfers from loans to other real estate owned and repossessed assets | $ | 4 | $ | 6 | |||
| Transfer of available-for-sale securities to held-to-maturity securities | $ | — | $ | 1,161 | |||
| Transfer of held-to-maturity securities to available-for-sale securities | $ | — | $ | 4,672 | |||
| Three Months Ended March 31, | |||||||||||||||||||||||
| 2020 | 2019 | ||||||||||||||||||||||
| Cash flows from operating activities: | |||||||||||||||||||||||
| Net income | $ | 181 | $ | 290 | |||||||||||||||||||
| Adjustments to reconcile net income to net cash provided by operating activities: | |||||||||||||||||||||||
| Provision (benefit) for credit losses | 6 | (12) | |||||||||||||||||||||
| Depreciation and amortization (including amortization and accretion on investment securities) | 57 | 54 | |||||||||||||||||||||
| Gains on securities and other, net | (20) | (11) | |||||||||||||||||||||
| Share-based compensation | 8 | 13 | |||||||||||||||||||||
| Deferred tax expense | (11) | 93 | |||||||||||||||||||||
| Other | 11 | (3) | |||||||||||||||||||||
| Net effect of changes in assets and liabilities: | |||||||||||||||||||||||
| Decrease in receivables from brokers, dealers and clearing organizations | 271 | 163 | |||||||||||||||||||||
| Decrease (increase) in margin receivables | 2,424 | (707) | |||||||||||||||||||||
| Increase in other assets | (103) | (183) | |||||||||||||||||||||
| (Decrease) increase in payables to brokers, dealers and clearing organizations | (117) | 214 | |||||||||||||||||||||
| Increase in customer payables | 3,111 | 483 | |||||||||||||||||||||
| Decrease in other liabilities | (997) | (209) | |||||||||||||||||||||
| Net cash provided by operating activities | 4,821 | 185 | |||||||||||||||||||||
| Cash flows from investing activities: | |||||||||||||||||||||||
| Purchases of available-for-sale securities | (3,479) | (3,589) | |||||||||||||||||||||
| Proceeds from sales of available-for-sale securities | 2,102 | 1,760 | |||||||||||||||||||||
| Proceeds from maturities of and principal payments on available-for-sale securities | 368 | 361 | |||||||||||||||||||||
| Purchases of held-to-maturity securities | (4,367) | (3,084) | |||||||||||||||||||||
| Proceeds from maturities of and principal payments on held-to-maturity securities | 1,235 | 1,034 | |||||||||||||||||||||
| Decrease in loans receivable | 65 | 145 | |||||||||||||||||||||
| Capital expenditures for property and equipment | (34) | (38) | |||||||||||||||||||||
| Net decrease in securities purchased under agreements to resell | 200 | — | |||||||||||||||||||||
| Proceeds from sale of real estate owned and repossessed assets | 3 | 4 | |||||||||||||||||||||
| Net cash flow from derivative contracts | (89) | (29) | |||||||||||||||||||||
| Other | (1) | (18) | |||||||||||||||||||||
| Net cash used in investing activities | (3,997) | (3,454) | |||||||||||||||||||||
| Three Months Ended March 31, | |||||||||||||||||||||||
| 2020 | 2019 | ||||||||||||||||||||||
| Cash flows from financing activities: | |||||||||||||||||||||||
| Increase in deposits | $ | 3,540 | $ | 1,015 | |||||||||||||||||||
| Common stock dividends | (31) | (35) | |||||||||||||||||||||
| Preferred stock dividends | (20) | (20) | |||||||||||||||||||||
| Net increase in advances from FHLB | — | 300 | |||||||||||||||||||||
| Repurchases of common stock | (95) | (120) | |||||||||||||||||||||
| Other | (12) | (15) | |||||||||||||||||||||
| Net cash provided by financing activities | 3,382 | 1,125 | |||||||||||||||||||||
| Increase (decrease) in cash, cash equivalents and segregated cash | 4,206 | (2,144) | |||||||||||||||||||||
| Cash, cash equivalents and segregated cash, beginning of period | 2,629 | 3,344 | |||||||||||||||||||||
| Cash, cash equivalents and segregated cash, end of period | $ | 6,835 | $ | 1,200 | |||||||||||||||||||
| Cash and equivalents, end of period | $ | 1,105 | $ | 523 | |||||||||||||||||||
| Segregated cash, end of period | 5,730 | 677 | |||||||||||||||||||||
| Cash, cash equivalents and segregated cash, end of period | $ | 6,835 | $ | 1,200 | |||||||||||||||||||
| Supplemental disclosures: | |||||||||||||||||||||||
| Cash paid for interest | $ | 46 | $ | 65 | |||||||||||||||||||
| (Refund received) cash paid for income taxes, net | $ | (22) | $ | 3 | |||||||||||||||||||
| Right-of-use assets recognized upon adoption of new lease standard | $ | — | $ | 193 | |||||||||||||||||||
| Right-of-use assets obtained during the period | $ | 4 | $ | 13 | |||||||||||||||||||
| Cash paid for amounts included in the measurement of lease liabilities | $ | 9 | $ | 7 | |||||||||||||||||||
| Non-cash investing and financing activities: | |||||||||||||||||||||||
| Transfers from loans to other real estate owned and repossessed assets | $ | 4 | $ | 4 | |||||||||||||||||||
| NOTE 1—ORGANIZATION, BASIS OF PRESENTATION AND SUMMARY OF SIGNIFICANT ACCOUNTING POLICIES | ||
| NOTE 2—ACQUISITIONS AND RESTRUCTURING | ||
| NOTE | ||
| Three Months Ended March 31, | |||||||||||||||||||||||||||||||||||
| 2020 | 2019 | ||||||||||||||||||||||||||||||||||
| Net interest income | $ | 400 | $ | 492 | |||||||||||||||||||||||||||||||
| Commissions | 71 | 122 | |||||||||||||||||||||||||||||||||
| Fees and service charges | 203 | 118 | |||||||||||||||||||||||||||||||||
| Gains on securities and other, net | 20 | 11 | |||||||||||||||||||||||||||||||||
| Other revenue | 13 | 12 | |||||||||||||||||||||||||||||||||
Total net revenue (1) | $ | 707 | $ | 755 | |||||||||||||||||||||||||||||||
| Three Months Ended March 31, | |||||||
| 2019 | 2018 | ||||||
| Net interest income | $ | 492 | $ | 445 | |||
| Commissions | 122 | 137 | |||||
| Fees and service charges | 118 | 105 | |||||
| Gains on securities and other, net | 11 | 10 | |||||
| Other revenue | 12 | 11 | |||||
Total net revenue (1) | $ | 755 | $ | 708 | |||
| Three Months Ended March 31, | |||||||
| 2019 | 2018 | ||||||
| Interest income: | |||||||
| Cash and equivalents | $ | 3 | $ | 3 | |||
| Cash segregated under federal or other regulations | 6 | 3 | |||||
| Investment securities | 365 | 290 | |||||
| Margin receivables | 126 | 103 | |||||
| Loans | 28 | 33 | |||||
| Broker-related receivables and other | 4 | 4 | |||||
| Subtotal interest income | 532 | 436 | |||||
Other interest revenue(1) | 23 | 32 | |||||
| Total interest income | 555 | 468 | |||||
| Interest expense: | |||||||
| Deposits | 35 | 2 | |||||
| Customer payables | 9 | 1 | |||||
| Broker-related payables and other | 1 | 1 | |||||
| Other borrowings | 2 | 7 | |||||
| Corporate debt | 14 | 9 | |||||
| Subtotal interest expense | 61 | 20 | |||||
Other interest expense(2) | 2 | 3 | |||||
| Total interest expense | 63 | 23 | |||||
| Net interest income | $ | 492 | $ | 445 | |||
| Three Months Ended March 31, | |||||||||||||||||||||||||||||||||||
| 2020 | 2019 | ||||||||||||||||||||||||||||||||||
| Interest income: | |||||||||||||||||||||||||||||||||||
| Cash and equivalents | $ | 2 | $ | 3 | |||||||||||||||||||||||||||||||
| Cash segregated under federal or other regulations | 8 | 6 | |||||||||||||||||||||||||||||||||
| Investment securities | 285 | 365 | |||||||||||||||||||||||||||||||||
| Margin receivables | 94 | 126 | |||||||||||||||||||||||||||||||||
| Loans | 21 | 28 | |||||||||||||||||||||||||||||||||
| Broker-related receivables and other | 4 | 4 | |||||||||||||||||||||||||||||||||
| Subtotal interest income | 414 | 532 | |||||||||||||||||||||||||||||||||
Other interest revenue(1) | 29 | 23 | |||||||||||||||||||||||||||||||||
| Total interest income | 443 | 555 | |||||||||||||||||||||||||||||||||
| Interest expense: | |||||||||||||||||||||||||||||||||||
| Sweep deposits: | |||||||||||||||||||||||||||||||||||
| Brokerage sweep deposits | 5 | 20 | |||||||||||||||||||||||||||||||||
Bank sweep deposits(2) | 13 | — | |||||||||||||||||||||||||||||||||
| Savings deposits | 3 | 15 | |||||||||||||||||||||||||||||||||
| Customer payables | 4 | 9 | |||||||||||||||||||||||||||||||||
| Broker-related payables and other | — | 1 | |||||||||||||||||||||||||||||||||
| Other borrowings | 1 | 2 | |||||||||||||||||||||||||||||||||
| Corporate debt | 14 | 14 | |||||||||||||||||||||||||||||||||
| Subtotal interest expense | 40 | 61 | |||||||||||||||||||||||||||||||||
Other interest expense(3) | 3 | 2 | |||||||||||||||||||||||||||||||||
| Total interest expense | 43 | 63 | |||||||||||||||||||||||||||||||||
| Net interest income | $ | 400 | $ | 492 | |||||||||||||||||||||||||||||||
| Three Months Ended March 31, | |||||||
| 2019 | 2018 | ||||||
| Fees and service charges: | |||||||
| Order flow revenue | $ | 43 | $ | 47 | |||
| Money market funds and sweep deposits revenue | 21 | 17 | |||||
| Advisor management and custody fees | 18 | 11 | |||||
| Mutual fund service fees | 12 | 11 | |||||
| Foreign exchange revenue | 8 | 8 | |||||
| Reorganization fees | 6 | 3 | |||||
| Other fees and service charges | 10 | 8 | |||||
| Total fees and service charges | $ | 118 | $ | 105 | |||
| Three Months Ended March 31, | |||||||||||||||||||||||||||||||||||
| 2020 | 2019 | ||||||||||||||||||||||||||||||||||
| Fees and service charges: | |||||||||||||||||||||||||||||||||||
| Order flow revenue | $ | 85 | $ | 43 | |||||||||||||||||||||||||||||||
| Money market funds and sweep deposits revenue | 60 | 21 | |||||||||||||||||||||||||||||||||
| Advisor management and custody fees | 19 | 18 | |||||||||||||||||||||||||||||||||
| Mutual fund service fees | 13 | 12 | |||||||||||||||||||||||||||||||||
| Foreign exchange revenue | 9 | 8 | |||||||||||||||||||||||||||||||||
| Reorganization fees | 4 | 6 | |||||||||||||||||||||||||||||||||
| Other fees and service charges | 13 | 10 | |||||||||||||||||||||||||||||||||
| Total fees and service charges | $ | 203 | $ | 118 | |||||||||||||||||||||||||||||||
| NOTE | ||
| Unobservable Inputs | Average | Range | |||||
| March 31, 2019: | |||||||
| Loans receivable: | |||||||
| One- to four-family | Appraised value | $ | 478,300 | $42,000 - $1,175,000 | |||
| Home equity | Appraised value | $ | 411,600 | $42,500 - $919,000 | |||
| Real estate owned | Appraised value | $ | 337,300 | $47,500 - $1,500,000 | |||
| December 31, 2018: | |||||||
| Loans receivable: | |||||||
| One- to four-family | Appraised value | $ | 594,700 | $17,000 - $2,000,000 | |||
| Home equity | Appraised value | $ | 397,700 | $73,000 - $1,060,000 | |||
| Real estate owned | Appraised value | $ | 329,500 | $57,900 - $900,000 | |||
| Unobservable Inputs | Average | Range | |||||||||||||||
| March 31, 2020: | |||||||||||||||||
| Loans receivable: | |||||||||||||||||
| One- to four-family | Appraised value | $ | 402,200 | $69,000 - $796,000 | |||||||||||||
| Home equity | Appraised value | $ | 295,900 | $70,000 - $756,000 | |||||||||||||
| Real estate owned | Appraised value | $ | 407,000 | $100,000 - $979,000 | |||||||||||||
| December 31, 2019: | |||||||||||||||||
| Loans receivable: | |||||||||||||||||
| One- to four-family | Appraised value | $ | 815,900 | $92,000 - $2,700,000 | |||||||||||||
| Home equity | Appraised value | $ | 437,300 | $75,000 - $1,440,000 | |||||||||||||
| Real estate owned | Appraised value | $ | 391,700 | $80,000 - $897,000 | |||||||||||||
| Level 1 | Level 2 | Level 3 | Total Fair Value | ||||||||||||||||||||
| March 31, 2020: | |||||||||||||||||||||||
| Recurring fair value measurements: | |||||||||||||||||||||||
| Assets | |||||||||||||||||||||||
| Available-for-sale securities: | |||||||||||||||||||||||
| Agency mortgage-backed securities | $ | — | $ | 17,449 | $ | — | $ | 17,449 | |||||||||||||||
| Agency debentures | — | 965 | — | 965 | |||||||||||||||||||
| US Treasuries | — | 1,343 | — | 1,343 | |||||||||||||||||||
| Non-agency asset-backed securities | — | 1,411 | — | 1,411 | |||||||||||||||||||
| Non-agency mortgage-backed securities | — | 272 | — | 272 | |||||||||||||||||||
| Total available-for-sale securities | — | 21,440 | — | 21,440 | |||||||||||||||||||
Total assets measured at fair value on a recurring basis(1) | $ | — | $ | 21,440 | $ | — | $ | 21,440 | |||||||||||||||
| Nonrecurring fair value measurements: | |||||||||||||||||||||||
| Loans receivable, net: | |||||||||||||||||||||||
| One- to four-family | $ | — | $ | — | $ | 3 | $ | 3 | |||||||||||||||
| Home equity | — | — | 2 | 2 | |||||||||||||||||||
| Total loans receivable | — | — | 5 | 5 | |||||||||||||||||||
| Other assets: | |||||||||||||||||||||||
| Real estate owned | — | — | 8 | 8 | |||||||||||||||||||
Total assets measured at fair value on a nonrecurring basis(2) | $ | — | $ | — | $ | 13 | $ | 13 | |||||||||||||||
| Level 1 | Level 2 | Level 3 | Total Fair Value | ||||||||||||
| March 31, 2019: | |||||||||||||||
| Recurring fair value measurements: | |||||||||||||||
| Assets | |||||||||||||||
| Available-for-sale securities: | |||||||||||||||
| Agency mortgage-backed securities | $ | — | $ | 23,423 | $ | — | $ | 23,423 | |||||||
| Agency debentures | — | 873 | — | 873 | |||||||||||
| US Treasuries | — | 438 | — | 438 | |||||||||||
| Non-agency asset-backed securities | — | 90 | — | 90 | |||||||||||
| Other agency debt securities | — | 81 | — | 81 | |||||||||||
| Non-agency mortgage-backed securities | — | 65 | — | 65 | |||||||||||
| Other | — | 1 | — | 1 | |||||||||||
| Total available-for-sale securities | — | 24,971 | — | 24,971 | |||||||||||
Publicly traded equity securities(1) | 7 | — | — | 7 | |||||||||||
Total assets measured at fair value on a recurring basis(2) | $ | 7 | $ | 24,971 | $ | — | $ | 24,978 | |||||||
| Liabilities | |||||||||||||||
| Other liabilities: | |||||||||||||||
Derivative liabilities(3) | $ | — | $ | 2 | $ | — | $ | 2 | |||||||
| Total liabilities measured at fair value on a recurring basis | $ | — | $ | 2 | $ | — | $ | 2 | |||||||
| Nonrecurring fair value measurements: | |||||||||||||||
| Loans receivable, net: | |||||||||||||||
| One- to four-family | $ | — | $ | — | $ | 4 | $ | 4 | |||||||
| Home equity | — | — | 2 | 2 | |||||||||||
| Total loans receivable | — | — | 6 | 6 | |||||||||||
| Other assets: | |||||||||||||||
| Real estate owned | — | — | 7 | 7 | |||||||||||
Total assets measured at fair value on a nonrecurring basis(4) | $ | — | $ | — | $ | 13 | $ | 13 | |||||||
(2)Represents the fair value of assets prior to deducting estimated selling costs that were carried on the consolidated balance sheets at March 31, 2020, and for which a fair value measurement was recorded during the period. |
| Level 1 | Level 2 | Level 3 | Total Fair Value | ||||||||||||||||||||
| December 31, 2019: | |||||||||||||||||||||||
| Recurring fair value measurements: | |||||||||||||||||||||||
| Assets | |||||||||||||||||||||||
| Available-for-sale securities: | |||||||||||||||||||||||
| Agency mortgage-backed securities | $ | — | $ | 17,035 | $ | — | $ | 17,035 | |||||||||||||||
| Agency debentures | — | 659 | — | 659 | |||||||||||||||||||
| US Treasuries | — | 1,227 | — | 1,227 | |||||||||||||||||||
| Non-agency asset-backed securities | — | 417 | — | 417 | |||||||||||||||||||
| Non-agency mortgage-backed securities | — | 163 | — | 163 | |||||||||||||||||||
| Total available-for-sale securities | — | 19,501 | — | 19,501 | |||||||||||||||||||
Total assets measured at fair value on a recurring basis(1) | $ | — | $ | 19,501 | $ | — | $ | 19,501 | |||||||||||||||
| Nonrecurring fair value measurements: | |||||||||||||||||||||||
| Loans receivable, net: | |||||||||||||||||||||||
| One- to four-family | $ | — | $ | — | $ | 14 | $ | 14 | |||||||||||||||
| Home equity | — | — | 4 | 4 | |||||||||||||||||||
| Total loans receivable | — | — | 18 | 18 | |||||||||||||||||||
| Other assets: | |||||||||||||||||||||||
| Real estate owned | — | — | 12 | 12 | |||||||||||||||||||
Total assets measured at fair value on a nonrecurring basis(2) | $ | — | $ | — | $ | 30 | $ | 30 | |||||||||||||||
| Level 1 | Level 2 | Level 3 | Total Fair Value | ||||||||||||
| December 31, 2018: | |||||||||||||||
| Recurring fair value measurements: | |||||||||||||||
| Assets | |||||||||||||||
| Available-for-sale securities: | |||||||||||||||
| Agency mortgage-backed securities | $ | — | $ | 22,162 | $ | — | $ | 22,162 | |||||||
| Agency debentures | — | 839 | — | 839 | |||||||||||
| Agency debt securities | — | 139 | — | 139 | |||||||||||
| Municipal bonds | — | 12 | — | 12 | |||||||||||
| Other | — | 1 | — | 1 | |||||||||||
| Total available-for-sale securities | — | 23,153 | — | 23,153 | |||||||||||
Derivative assets(1) | — | 1 | — | 1 | |||||||||||
Publicly traded equity securities(2) | 7 | — | — | 7 | |||||||||||
Total assets measured at fair value on a recurring basis(3) | $ | 7 | $ | 23,154 | $ | — | $ | 23,161 | |||||||
| Nonrecurring fair value measurements: | |||||||||||||||
| Loans receivable, net: | |||||||||||||||
| One- to four-family | $ | — | $ | — | $ | 17 | $ | 17 | |||||||
| Home equity | — | — | 6 | 6 | |||||||||||
| Total loans receivable | — | — | 23 | 23 | |||||||||||
| Other assets: | |||||||||||||||
| Real estate owned | — | — | 10 | 10 | |||||||||||
Total assets measured at fair value on a nonrecurring basis(4) | $ | — | $ | — | $ | 33 | $ | 33 | |||||||
| Three Months Ended March 31, | |||||||
| 2019 | 2018 | ||||||
| One- to four-family | $ | 1 | $ | 1 | |||
| Home equity | (1 | ) | — | ||||
| Total losses on loans receivable measured at fair value | $ | — | $ | 1 | |||
| Gain on real estate owned measured at fair value | $ | (1 | ) | $ | — | ||
| March 31, 2019 | March 31, 2020 | |||||||||||||||||||||||||||||||||||||||||||||||||||||||||||||||||||||||
Carrying Value | Level 1 | Level 2 | Level 3 | Total Fair Value | Carrying Value | Level 1 | Level 2 | Level 3 | Total Fair Value | |||||||||||||||||||||||||||||||||||||||||||||||||||||||||||||||
| Assets | Assets | |||||||||||||||||||||||||||||||||||||||||||||||||||||||||||||||||||||||
| Cash and equivalents | $ | 523 | $ | 523 | $ | — | $ | — | $ | 523 | Cash and equivalents | $ | 1,105 | $ | 1,105 | $ | — | $ | — | $ | 1,105 | |||||||||||||||||||||||||||||||||||||||||||||||||||
| Cash segregated under federal or other regulations | $ | 677 | $ | 677 | $ | — | $ | — | $ | 677 | Cash segregated under federal or other regulations | $ | 5,730 | $ | 5,730 | $ | — | $ | — | $ | 5,730 | |||||||||||||||||||||||||||||||||||||||||||||||||||
| Held-to-maturity securities: | Held-to-maturity securities: | |||||||||||||||||||||||||||||||||||||||||||||||||||||||||||||||||||||||
| Agency mortgage-backed securities | $ | 20,337 | $ | — | $ | 20,251 | $ | — | $ | 20,251 | Agency mortgage-backed securities | $ | 23,531 | $ | — | $ | 24,297 | $ | — | $ | 24,297 | |||||||||||||||||||||||||||||||||||||||||||||||||||
| Agency debentures | 1,745 | — | 1,742 | — | 1,742 | Agency debentures | 108 | — | 121 | — | 121 | |||||||||||||||||||||||||||||||||||||||||||||||||||||||||||||
| Agency debt securities | 1,845 | — | 1,831 | — | 1,831 | |||||||||||||||||||||||||||||||||||||||||||||||||||||||||||||||||||
| Other agency debt securities | Other agency debt securities | 1,451 | — | 1,508 | — | 1,508 | ||||||||||||||||||||||||||||||||||||||||||||||||||||||||||||||||||
| Total held-to-maturity securities | $ | 23,927 | $ | — | $ | 23,824 | $ | — | $ | 23,824 | Total held-to-maturity securities | $ | 25,090 | $ | — | $ | 25,926 | $ | — | $ | 25,926 | |||||||||||||||||||||||||||||||||||||||||||||||||||
Margin receivables(1) | $ | 10,267 | $ | — | $ | 10,267 | $ | — | $ | 10,267 | Margin receivables(1) | $ | 7,251 | $ | — | $ | 7,251 | $ | — | $ | 7,251 | |||||||||||||||||||||||||||||||||||||||||||||||||||
| Loans receivable, net: | Loans receivable, net: | |||||||||||||||||||||||||||||||||||||||||||||||||||||||||||||||||||||||
| One- to four-family | $ | 1,000 | $ | — | $ | — | $ | 1,038 | $ | 1,038 | One- to four-family | $ | 794 | $ | — | $ | — | $ | 751 | $ | 751 | |||||||||||||||||||||||||||||||||||||||||||||||||||
| Home equity | 764 | — | — | 789 | 789 | Home equity | 645 | — | — | 599 | 599 | |||||||||||||||||||||||||||||||||||||||||||||||||||||||||||||
| Consumer | 104 | — | — | 104 | 104 | |||||||||||||||||||||||||||||||||||||||||||||||||||||||||||||||||||
| Securities-based lending | 97 | — | 97 | — | 97 | Securities-based lending | 195 | — | 195 | — | 195 | |||||||||||||||||||||||||||||||||||||||||||||||||||||||||||||
Total loans receivable, net(2) | $ | 1,965 | $ | — | $ | 97 | $ | 1,931 | $ | 2,028 | Total loans receivable, net(2) | $ | 1,634 | $ | — | $ | 195 | $ | 1,350 | $ | 1,545 | |||||||||||||||||||||||||||||||||||||||||||||||||||
Receivables from brokers, dealers and clearing organizations(1) | $ | 597 | $ | — | $ | 597 | $ | — | $ | 597 | Receivables from brokers, dealers and clearing organizations(1) | $ | 1,124 | $ | — | $ | 1,124 | $ | — | $ | 1,124 | |||||||||||||||||||||||||||||||||||||||||||||||||||
Other assets(1)(3) | $ | 50 | $ | — | $ | 50 | $ | — | $ | 50 | Other assets(1)(3) | $ | 97 | $ | — | $ | 97 | $ | — | $ | 97 | |||||||||||||||||||||||||||||||||||||||||||||||||||
| Liabilities | Liabilities | |||||||||||||||||||||||||||||||||||||||||||||||||||||||||||||||||||||||
| Deposits | $ | 46,328 | $ | — | $ | 46,328 | $ | — | $ | 46,328 | Deposits | $ | 42,146 | $ | — | $ | 42,146 | $ | — | $ | 42,146 | |||||||||||||||||||||||||||||||||||||||||||||||||||
| Customer payables | $ | 10,600 | $ | — | $ | 10,600 | $ | — | $ | 10,600 | Customer payables | $ | 15,960 | $ | — | $ | 15,960 | $ | — | $ | 15,960 | |||||||||||||||||||||||||||||||||||||||||||||||||||
| Payables to brokers, dealers and clearing organizations | $ | 1,162 | $ | — | $ | 1,162 | $ | — | $ | 1,162 | Payables to brokers, dealers and clearing organizations | $ | 776 | $ | — | $ | 776 | $ | — | $ | 776 | |||||||||||||||||||||||||||||||||||||||||||||||||||
| Other borrowings | $ | 300 | $ | — | $ | 300 | $ | — | $ | 300 | ||||||||||||||||||||||||||||||||||||||||||||||||||||||||||||||
| Corporate debt | $ | 1,409 | $ | — | $ | 1,413 | $ | — | $ | 1,413 | Corporate debt | $ | 1,411 | $ | — | $ | 1,400 | $ | — | $ | 1,400 | |||||||||||||||||||||||||||||||||||||||||||||||||||
| December 31, 2019 | |||||||||||||||||||||||||||||||||||||||||||||||||||||
| Carrying Value | Level 1 | Level 2 | Level 3 | Total Fair Value | |||||||||||||||||||||||||||||||||||||||||||||||||
| Assets | |||||||||||||||||||||||||||||||||||||||||||||||||||||
| Cash and equivalents | $ | 750 | $ | 750 | $ | — | $ | — | $ | 750 | |||||||||||||||||||||||||||||||||||||||||||
| Cash segregated under federal or other regulations | $ | 1,879 | $ | 1,879 | $ | — | $ | — | $ | 1,879 | |||||||||||||||||||||||||||||||||||||||||||
| Held-to-maturity securities: | |||||||||||||||||||||||||||||||||||||||||||||||||||||
| Agency mortgage-backed securities | $ | 20,085 | $ | — | $ | 20,329 | $ | — | $ | 20,329 | |||||||||||||||||||||||||||||||||||||||||||
| Agency debentures | 267 | — | 271 | — | 271 | ||||||||||||||||||||||||||||||||||||||||||||||||
| Other agency debt securities | 1,617 | — | 1,646 | — | 1,646 | ||||||||||||||||||||||||||||||||||||||||||||||||
| Total held-to-maturity securities | $ | 21,969 | $ | — | $ | 22,246 | $ | — | $ | 22,246 | |||||||||||||||||||||||||||||||||||||||||||
Margin receivables(1) | $ | 9,675 | $ | — | $ | 9,675 | $ | — | $ | 9,675 | |||||||||||||||||||||||||||||||||||||||||||
| Loans receivable, net: | |||||||||||||||||||||||||||||||||||||||||||||||||||||
| One- to four-family | $ | 802 | $ | — | $ | — | $ | 835 | $ | 835 | |||||||||||||||||||||||||||||||||||||||||||
| Home equity | 624 | — | — | 659 | 659 | ||||||||||||||||||||||||||||||||||||||||||||||||
| Securities-based lending | 169 | — | 169 | — | 169 | ||||||||||||||||||||||||||||||||||||||||||||||||
Total loans receivable, net(2) | $ | 1,595 | $ | — | $ | 169 | $ | 1,494 | $ | 1,663 | |||||||||||||||||||||||||||||||||||||||||||
Receivables from brokers, dealers and clearing organizations(1) | $ | 1,395 | $ | — | $ | 1,395 | $ | — | $ | 1,395 | |||||||||||||||||||||||||||||||||||||||||||
Other assets(1)(3) | $ | 313 | $ | — | $ | 313 | $ | — | $ | 313 | |||||||||||||||||||||||||||||||||||||||||||
| Liabilities | |||||||||||||||||||||||||||||||||||||||||||||||||||||
| Deposits | $ | 38,606 | $ | — | $ | 38,605 | $ | — | $ | 38,605 | |||||||||||||||||||||||||||||||||||||||||||
| Customer payables | $ | 12,849 | $ | — | $ | 12,849 | $ | — | $ | 12,849 | |||||||||||||||||||||||||||||||||||||||||||
| Payables to brokers, dealers and clearing organizations | $ | 893 | $ | — | $ | 893 | $ | — | $ | 893 | |||||||||||||||||||||||||||||||||||||||||||
| Corporate debt | $ | 1,410 | $ | — | $ | 1,485 | $ | — | $ | 1,485 | |||||||||||||||||||||||||||||||||||||||||||
| December 31, 2018 | |||||||||||||||||||
| Carrying Value | Level 1 | Level 2 | Level 3 | Total Fair Value | |||||||||||||||
| Assets | |||||||||||||||||||
| Cash and equivalents | $ | 2,333 | $ | 2,333 | $ | — | $ | — | $ | 2,333 | |||||||||
| Cash segregated under federal or other regulations | $ | 1,011 | $ | 1,011 | $ | — | $ | — | $ | 1,011 | |||||||||
| Held-to-maturity securities: | |||||||||||||||||||
| Agency mortgage-backed securities | $ | 18,085 | $ | — | $ | 17,748 | $ | — | $ | 17,748 | |||||||||
| Agency debentures | 1,824 | — | 1,808 | — | 1,808 | ||||||||||||||
| Agency debt securities | 1,975 | — | 1,935 | — | 1,935 | ||||||||||||||
| Total held-to-maturity securities | $ | 21,884 | $ | — | $ | 21,491 | $ | — | $ | 21,491 | |||||||||
Margin receivables(1) | $ | 9,560 | $ | — | $ | 9,560 | $ | — | $ | 9,560 | |||||||||
| Loans receivable, net: | |||||||||||||||||||
| One- to four-family | $ | 1,069 | $ | — | $ | — | $ | 1,099 | $ | 1,099 | |||||||||
| Home equity | 810 | — | — | 825 | 825 | ||||||||||||||
| Consumer | 117 | — | — | 115 | 115 | ||||||||||||||
| Securities-based lending | 107 | — | 107 | — | 107 | ||||||||||||||
Total loans receivable, net(2) | $ | 2,103 | $ | — | $ | 107 | $ | 2,039 | $ | 2,146 | |||||||||
Receivables from brokers, dealers and clearing organizations(1) | $ | 760 | $ | — | $ | 760 | $ | — | $ | 760 | |||||||||
Other assets(1)(3) | $ | 36 | $ | — | $ | 36 | $ | — | $ | 36 | |||||||||
| Liabilities | |||||||||||||||||||
| Deposits | $ | 45,313 | $ | — | $ | 45,313 | $ | — | $ | 45,313 | |||||||||
| Customer payables | $ | 10,117 | $ | — | $ | 10,117 | $ | — | $ | 10,117 | |||||||||
| Payables to brokers, dealers and clearing organizations | $ | 948 | $ | — | $ | 948 | $ | — | $ | 948 | |||||||||
| Corporate debt | $ | 1,409 | $ | — | $ | 1,372 | $ | — | $ | 1,372 | |||||||||
| NOTE | ||
| Gross Amounts Not Offset in the Consolidated Balance Sheet | |||||||||||||||||||||||
| Gross Amounts of Recognized Assets and Liabilities | Gross Amounts Offset in the Consolidated Balance Sheet | Net Amounts Presented in the Consolidated Balance Sheet (1) | Financial Instruments | Collateral Received or Pledged (Including Cash) | Net Amount | ||||||||||||||||||
| March 31, 2019: | |||||||||||||||||||||||
| Assets: | |||||||||||||||||||||||
Securities borrowed (2) | $ | 327 | $ | — | $ | 327 | $ | (125 | ) | $ | (192 | ) | $ | 10 | |||||||||
| Liabilities: | |||||||||||||||||||||||
Securities loaned (3) | $ | 1,109 | $ | — | $ | 1,109 | $ | (125 | ) | $ | (901 | ) | $ | 83 | |||||||||
| December 31, 2018: | |||||||||||||||||||||||
| Assets: | |||||||||||||||||||||||
Securities borrowed (2) | $ | 176 | $ | — | $ | 176 | $ | (104 | ) | $ | (61 | ) | $ | 11 | |||||||||
| Liabilities: | |||||||||||||||||||||||
Securities loaned (3) | $ | 887 | $ | — | $ | 887 | $ | (104 | ) | $ | (700 | ) | $ | 83 | |||||||||
| Gross Amounts Not Offset in the Consolidated Balance Sheets | ||||||||||||||||||||||||||||||||||||||||||||||||||
| Gross Amounts of Recognized Assets and Liabilities | Gross Amounts Offset in the Consolidated Balance Sheets | Net Amounts Presented in the Consolidated Balance Sheets(1) | Financial Instruments | Collateral Received or Pledged (Including Cash) | Net Amount | |||||||||||||||||||||||||||||||||||||||||||||
| March 31, 2020: | ||||||||||||||||||||||||||||||||||||||||||||||||||
| Assets: | ||||||||||||||||||||||||||||||||||||||||||||||||||
Securities borrowed(2) | $ | 604 | $ | — | $ | 604 | $ | (68) | $ | (510) | $ | 26 | ||||||||||||||||||||||||||||||||||||||
| Total | $ | 604 | $ | — | $ | 604 | $ | (68) | $ | (510) | $ | 26 | ||||||||||||||||||||||||||||||||||||||
| Liabilities: | ||||||||||||||||||||||||||||||||||||||||||||||||||
Securities loaned(3) | $ | 696 | $ | — | $ | 696 | $ | (68) | $ | (535) | $ | 93 | ||||||||||||||||||||||||||||||||||||||
| Total | $ | 696 | $ | — | $ | 696 | $ | (68) | $ | (535) | $ | 93 | ||||||||||||||||||||||||||||||||||||||
| December 31, 2019: | ||||||||||||||||||||||||||||||||||||||||||||||||||
| Assets: | ||||||||||||||||||||||||||||||||||||||||||||||||||
Securities purchased under agreements to resell(4) | $ | 200 | $ | — | $ | 200 | $ | — | $ | (200) | $ | — | ||||||||||||||||||||||||||||||||||||||
Securities borrowed(2) | 1,116 | — | 1,116 | (83) | (1,003) | 30 | ||||||||||||||||||||||||||||||||||||||||||||
| Total | $ | 1,316 | $ | — | $ | 1,316 | $ | (83) | $ | (1,203) | $ | 30 | ||||||||||||||||||||||||||||||||||||||
| Liabilities: | ||||||||||||||||||||||||||||||||||||||||||||||||||
Securities loaned(3) | $ | 838 | $ | — | $ | 838 | $ | (83) | $ | (699) | $ | 56 | ||||||||||||||||||||||||||||||||||||||
| Total | $ | 838 | $ | — | $ | 838 | $ | (83) | $ | (699) | $ | 56 | ||||||||||||||||||||||||||||||||||||||
| NOTE | ||
| Amortized Cost | Gross Unrealized / Unrecognized Gains | Gross Unrealized / Unrecognized Losses | Fair Value | ||||||||||||||||||||
| March 31, 2020: | |||||||||||||||||||||||
| Available-for-sale securities: | |||||||||||||||||||||||
| Agency mortgage-backed securities | $ | 16,130 | $ | 1,367 | $ | (48) | $ | 17,449 | |||||||||||||||
| Agency debentures | 910 | 55 | — | 965 | |||||||||||||||||||
| US Treasuries | 1,122 | 221 | — | 1,343 | |||||||||||||||||||
Non-agency asset-backed securities(1) | 1,428 | 5 | (22) | 1,411 | |||||||||||||||||||
| Non-agency mortgage-backed securities | 273 | 3 | (4) | 272 | |||||||||||||||||||
| Total available-for-sale securities | $ | 19,863 | $ | 1,651 | $ | (74) | $ | 21,440 | |||||||||||||||
| Held-to-maturity securities: | |||||||||||||||||||||||
| Agency mortgage-backed securities | $ | 23,531 | $ | 812 | $ | (46) | $ | 24,297 | |||||||||||||||
| Agency debentures | 108 | 13 | — | 121 | |||||||||||||||||||
| Other agency debt securities | 1,451 | 58 | (1) | 1,508 | |||||||||||||||||||
| Total held-to-maturity securities | $ | 25,090 | $ | 883 | $ | (47) | $ | 25,926 | |||||||||||||||
| December 31, 2019: | |||||||||||||||||||||||
Available-for-sale securities:(2) | |||||||||||||||||||||||
| Agency mortgage-backed securities | $ | 16,267 | $ | 836 | $ | (68) | $ | 17,035 | |||||||||||||||
| Agency debentures | 632 | 27 | — | 659 | |||||||||||||||||||
| US Treasuries | 1,233 | 34 | (40) | 1,227 | |||||||||||||||||||
Non-agency asset-backed securities(1) | 417 | 2 | (2) | 417 | |||||||||||||||||||
| Non-agency mortgage-backed securities | 159 | 4 | — | 163 | |||||||||||||||||||
| Total available-for-sale securities | $ | 18,708 | $ | 903 | $ | (110) | $ | 19,501 | |||||||||||||||
Held-to-maturity securities:(2) | |||||||||||||||||||||||
| Agency mortgage-backed securities | $ | 20,085 | $ | 293 | $ | (49) | $ | 20,329 | |||||||||||||||
| Agency debentures | 267 | 4 | — | 271 | |||||||||||||||||||
| Other agency debt securities | 1,617 | 31 | (2) | 1,646 | |||||||||||||||||||
| Total held-to-maturity securities | $ | 21,969 | $ | 328 | $ | (51) | $ | 22,246 | |||||||||||||||
Amortized Cost | Gross Unrealized / Unrecognized Gains | Gross Unrealized / Unrecognized Losses | Fair Value | ||||||||||||
| March 31, 2019: | |||||||||||||||
| Available-for-sale securities: | |||||||||||||||
| Agency mortgage-backed securities | $ | 23,032 | $ | 587 | $ | (196 | ) | $ | 23,423 | ||||||
| Agency debentures | 854 | 22 | (3 | ) | 873 | ||||||||||
| US Treasuries | 437 | 1 | — | 438 | |||||||||||
Non-agency asset-backed securities(1) | 89 | 1 | — | 90 | |||||||||||
| Other agency debt securities | 81 | 1 | (1 | ) | 81 | ||||||||||
| Non-agency mortgage-backed securities | 65 | — | — | 65 | |||||||||||
| Other | 1 | — | — | 1 | |||||||||||
| Total available-for-sale securities | $ | 24,559 | $ | 612 | $ | (200 | ) | $ | 24,971 | ||||||
| Held-to-maturity securities: | |||||||||||||||
| Agency mortgage-backed securities | $ | 20,337 | $ | 97 | $ | (183 | ) | $ | 20,251 | ||||||
| Agency debentures | 1,745 | 3 | (6 | ) | 1,742 | ||||||||||
| Other agency debt securities | 1,845 | 7 | (21 | ) | 1,831 | ||||||||||
| Total held-to-maturity securities | $ | 23,927 | $ | 107 | $ | (210 | ) | $ | 23,824 | ||||||
| December 31, 2018: | |||||||||||||||
| Available-for-sale securities: | |||||||||||||||
| Agency mortgage-backed securities | $ | 22,140 | $ | 327 | $ | (305 | ) | $ | 22,162 | ||||||
| Agency debentures | 833 | 13 | (7 | ) | 839 | ||||||||||
| Other agency debt securities | 140 | 1 | (2 | ) | 139 | ||||||||||
| Municipal bonds | 12 | — | — | 12 | |||||||||||
| Other | 1 | — | — | 1 | |||||||||||
| Total available-for-sale securities | $ | 23,126 | $ | 341 | $ | (314 | ) | $ | 23,153 | ||||||
| Held-to-maturity securities: | |||||||||||||||
| Agency mortgage-backed securities | $ | 18,085 | $ | 26 | $ | (363 | ) | $ | 17,748 | ||||||
| Agency debentures | 1,824 | — | (16 | ) | 1,808 | ||||||||||
| Other agency debt securities | 1,975 | 4 | (44 | ) | 1,935 | ||||||||||
| Total held-to-maturity securities | $ | 21,884 | $ | 30 | $ | (423 | ) | $ | 21,491 | ||||||
| March 31, 2019 | March 31, 2020 | |||||||||||||||||||||||
| Amortized Cost | Fair Value | Amortized Cost | Fair Value | |||||||||||||||||||||
| Available-for-sale debt securities: | Available-for-sale debt securities: | |||||||||||||||||||||||
| Due within one year | $ | 50 | $ | 50 | Due within one year | $ | 253 | $ | 256 | |||||||||||||||
| Due within one to five years | 824 | 819 | Due within one to five years | 962 | 967 | |||||||||||||||||||
| Due within five to ten years | 11,049 | 11,488 | Due within five to ten years | 9,464 | 10,610 | |||||||||||||||||||
| Due after ten years | 12,636 | 12,614 | Due after ten years | 9,184 | 9,607 | |||||||||||||||||||
| Total available-for-sale debt securities | $ | 24,559 | $ | 24,971 | Total available-for-sale debt securities | $ | 19,863 | $ | 21,440 | |||||||||||||||
| Held-to-maturity debt securities: | Held-to-maturity debt securities: | |||||||||||||||||||||||
| Due within one year | $ | 21 | $ | 21 | Due within one year | $ | 68 | $ | 69 | |||||||||||||||
| Due within one to five years | 2,059 | 2,058 | Due within one to five years | 2,047 | 2,123 | |||||||||||||||||||
| Due within five to ten years | 4,758 | 4,741 | Due within five to ten years | 2,921 | 3,090 | |||||||||||||||||||
| Due after ten years | 17,089 | 17,004 | Due after ten years | 20,054 | 20,644 | |||||||||||||||||||
| Total held-to-maturity debt securities | $ | 23,927 | $ | 23,824 | Total held-to-maturity debt securities | $ | 25,090 | $ | 25,926 | |||||||||||||||
| Less than 12 Months | 12 Months or More | Total | ||||||||||||||||||||||||||||||||||||||||||||||||||||||||||||||||||||||||||
| Less than 12 Months | 12 Months or More | Total | Fair Value | Unrealized / Unrecognized Losses | Fair Value | Unrealized / Unrecognized Losses | Fair Value | Unrealized / Unrecognized Losses | ||||||||||||||||||||||||||||||||||||||||||||||||||||||||||||||||||||
| Fair Value | Unrealized / Unrecognized Losses | Fair Value | Unrealized / Unrecognized Losses | Fair Value | Unrealized / Unrecognized Losses | |||||||||||||||||||||||||||||||||||||||||||||||||||||||||||||||||||||||
| March 31, 2019: | ||||||||||||||||||||||||||||||||||||||||||||||||||||||||||||||||||||||||||||
| March 31, 2020: | March 31, 2020: | |||||||||||||||||||||||||||||||||||||||||||||||||||||||||||||||||||||||||||
| Available-for-sale securities: | Available-for-sale securities: | |||||||||||||||||||||||||||||||||||||||||||||||||||||||||||||||||||||||||||
| Agency mortgage-backed securities | $ | 695 | $ | (10 | ) | $ | 8,635 | $ | (186 | ) | $ | 9,330 | $ | (196 | ) | Agency mortgage-backed securities | $ | 735 | $ | (12) | $ | 1,275 | $ | (36) | $ | 2,010 | $ | (48) | ||||||||||||||||||||||||||||||||||||||||||||||||
| Agency debentures | — | — | 119 | (3 | ) | 119 | (3 | ) | ||||||||||||||||||||||||||||||||||||||||||||||||||||||||||||||||||||
| US Treasuries | 102 | — | — | — | 102 | — | ||||||||||||||||||||||||||||||||||||||||||||||||||||||||||||||||||||||
| Other agency debt securities | — | — | 30 | (1 | ) | 30 | (1 | ) | ||||||||||||||||||||||||||||||||||||||||||||||||||||||||||||||||||||
| Other | 1 | — | — | — | 1 | — | ||||||||||||||||||||||||||||||||||||||||||||||||||||||||||||||||||||||
| Non-agency mortgage-backed securities | Non-agency mortgage-backed securities | 160 | (4) | — | — | 160 | (4) | |||||||||||||||||||||||||||||||||||||||||||||||||||||||||||||||||||||
| Non-agency asset-backed securities | Non-agency asset-backed securities | 1,136 | (22) | — | — | 1,136 | (22) | |||||||||||||||||||||||||||||||||||||||||||||||||||||||||||||||||||||
| Total temporarily impaired available-for-sale securities | $ | 798 | $ | (10 | ) | $ | 8,784 | $ | (190 | ) | $ | 9,582 | $ | (200 | ) | Total temporarily impaired available-for-sale securities | $ | 2,031 | $ | (38) | $ | 1,275 | $ | (36) | $ | 3,306 | $ | (74) | ||||||||||||||||||||||||||||||||||||||||||||||||
| Held-to-maturity securities: | Held-to-maturity securities: | |||||||||||||||||||||||||||||||||||||||||||||||||||||||||||||||||||||||||||
| Agency mortgage-backed securities | $ | 708 | $ | (4 | ) | $ | 12,049 | $ | (179 | ) | $ | 12,757 | $ | (183 | ) | Agency mortgage-backed securities | $ | 1,219 | $ | (15) | $ | 1,141 | $ | (31) | $ | 2,360 | $ | (46) | ||||||||||||||||||||||||||||||||||||||||||||||||
| Agency debentures | — | — | 811 | (6 | ) | 811 | (6 | ) | ||||||||||||||||||||||||||||||||||||||||||||||||||||||||||||||||||||
| Agency debt securities | — | — | 1,375 | (21 | ) | 1,375 | (21 | ) | ||||||||||||||||||||||||||||||||||||||||||||||||||||||||||||||||||||
| Other agency debt securities | Other agency debt securities | — | — | 93 | (1) | 93 | (1) | |||||||||||||||||||||||||||||||||||||||||||||||||||||||||||||||||||||
| Total temporarily impaired held-to-maturity securities | $ | 708 | $ | (4 | ) | $ | 14,235 | $ | (206 | ) | $ | 14,943 | $ | (210 | ) | Total temporarily impaired held-to-maturity securities | $ | 1,219 | $ | (15) | $ | 1,234 | $ | (32) | $ | 2,453 | $ | (47) | ||||||||||||||||||||||||||||||||||||||||||||||||
| December 31, 2018: | ||||||||||||||||||||||||||||||||||||||||||||||||||||||||||||||||||||||||||||
| December 31, 2019: | December 31, 2019: | |||||||||||||||||||||||||||||||||||||||||||||||||||||||||||||||||||||||||||
| Available-for-sale securities: | Available-for-sale securities: | |||||||||||||||||||||||||||||||||||||||||||||||||||||||||||||||||||||||||||
| Agency mortgage-backed securities | $ | 2,945 | $ | (34 | ) | $ | 7,826 | $ | (271 | ) | $ | 10,771 | $ | (305 | ) | Agency mortgage-backed securities | $ | 2,045 | $ | (32) | $ | 1,916 | $ | (36) | $ | 3,961 | $ | (68) | ||||||||||||||||||||||||||||||||||||||||||||||||
| Agency debentures | 383 | (1 | ) | 116 | (6 | ) | 499 | (7 | ) | |||||||||||||||||||||||||||||||||||||||||||||||||||||||||||||||||||
| Other agency debt securities | — | — | 30 | (2 | ) | 30 | (2 | ) | ||||||||||||||||||||||||||||||||||||||||||||||||||||||||||||||||||||
| Municipal bonds | — | — | 9 | — | 9 | — | ||||||||||||||||||||||||||||||||||||||||||||||||||||||||||||||||||||||
| Other | 1 | — | — | — | 1 | — | ||||||||||||||||||||||||||||||||||||||||||||||||||||||||||||||||||||||
| Non-agency mortgage-backed securities | Non-agency mortgage-backed securities | 50 | — | — | — | 50 | — | |||||||||||||||||||||||||||||||||||||||||||||||||||||||||||||||||||||
| US Treasuries | US Treasuries | 402 | (40) | — | — | 402 | (40) | |||||||||||||||||||||||||||||||||||||||||||||||||||||||||||||||||||||
| Non-agency asset-backed securities | Non-agency asset-backed securities | 251 | (2) | — | — | 251 | (2) | |||||||||||||||||||||||||||||||||||||||||||||||||||||||||||||||||||||
| Total temporarily impaired available-for-sale securities | $ | 3,329 | $ | (35 | ) | $ | 7,981 | $ | (279 | ) | $ | 11,310 | $ | (314 | ) | Total temporarily impaired available-for-sale securities | $ | 2,748 | $ | (74) | $ | 1,916 | $ | (36) | $ | 4,664 | $ | (110) | ||||||||||||||||||||||||||||||||||||||||||||||||
| Held-to-maturity securities: | Held-to-maturity securities: | |||||||||||||||||||||||||||||||||||||||||||||||||||||||||||||||||||||||||||
| Agency mortgage-backed securities | $ | 2,802 | $ | (31 | ) | $ | 11,587 | $ | (332 | ) | $ | 14,389 | $ | (363 | ) | Agency mortgage-backed securities | $ | 1,337 | $ | (4) | $ | 3,600 | $ | (45) | $ | 4,937 | $ | (49) | ||||||||||||||||||||||||||||||||||||||||||||||||
| Agency debentures | 776 | (2 | ) | 666 | (14 | ) | 1,442 | (16 | ) | |||||||||||||||||||||||||||||||||||||||||||||||||||||||||||||||||||
| Other agency debt securities | 97 | (1 | ) | 1,487 | (43 | ) | 1,584 | (44 | ) | Other agency debt securities | 181 | (1) | 135 | (1) | 316 | (2) | ||||||||||||||||||||||||||||||||||||||||||||||||||||||||||||
| Total temporarily impaired held-to-maturity securities | $ | 3,675 | $ | (34 | ) | $ | 13,740 | $ | (389 | ) | $ | 17,415 | $ | (423 | ) | Total temporarily impaired held-to-maturity securities | $ | 1,518 | $ | (5) | $ | 3,735 | $ | (46) | $ | 5,253 | $ | (51) | ||||||||||||||||||||||||||||||||||||||||||||||||
| Three Months Ended March 31, | |||||||
| 2019 | 2018 | ||||||
| Gains on available-for-sale securities | $ | 11 | $ | 11 | |||
| Equity method investment income (loss) and other | — | (1 | ) | ||||
| Gains on securities and other, net | $ | 11 | �� | $ | 10 | ||
| Three Months Ended March 31, | |||||||||||||||||||||||||||||||||||
| 2020 | 2019 | ||||||||||||||||||||||||||||||||||
| Gains on available-for-sale securities | $ | 19 | $ | 11 | |||||||||||||||||||||||||||||||
| Equity method investment income and other | 1 | — | |||||||||||||||||||||||||||||||||
| Gains on securities and other, net | $ | 20 | $ | 11 | |||||||||||||||||||||||||||||||
| Days Past Due | ||||||||||||||||||||||||||||||||
| Current | 30-89 | 90-179 | 180+ | Total | Unamortized premiums, net | Allowance for loans losses | Loans Receivable, Net | |||||||||||||||||||||||||
| March 31, 2019: | ||||||||||||||||||||||||||||||||
| One- to four-family | $ | 891 | $ | 49 | $ | 16 | $ | 47 | $ | 1,003 | $ | 6 | $ | (9 | ) | $ | 1,000 | |||||||||||||||
| Home equity | 727 | 27 | 9 | 22 | 785 | — | (21 | ) | 764 | |||||||||||||||||||||||
| Consumer | 104 | 2 | — | — | 106 | — | (2 | ) | 104 | |||||||||||||||||||||||
Securities-based lending(1) | 97 | — | — | — | 97 | — | — | 97 | ||||||||||||||||||||||||
| Total loans receivable | $ | 1,819 | $ | 78 | $ | 25 | $ | 69 | $ | 1,991 | $ | 6 | $ | (32 | ) | $ | 1,965 | |||||||||||||||
| December 31, 2018: | ||||||||||||||||||||||||||||||||
| One- to four-family | $ | 958 | $ | 48 | $ | 9 | $ | 56 | $ | 1,071 | $ | 7 | $ | (9 | ) | $ | 1,069 | |||||||||||||||
| Home equity | 774 | 25 | 13 | 24 | 836 | — | (26 | ) | 810 | |||||||||||||||||||||||
| Consumer | 117 | 1 | — | — | 118 | 1 | (2 | ) | 117 | |||||||||||||||||||||||
Securities-based lending(1) | 107 | — | — | — | 107 | — | — | 107 | ||||||||||||||||||||||||
| Total loans receivable | $ | 1,956 | $ | 74 | $ | 22 | $ | 80 | $ | 2,132 | $ | 8 | $ | (37 | ) | $ | 2,103 | |||||||||||||||
| NOTE 7—LOANS RECEIVABLE AND ALLOWANCE FOR CREDIT LOSSES | ||
| Days Past Due | ||||||||||||||||||||||||||||||||||||||||||||||||||||||||||||||
| Current | 30-89 | 90-179 | 180+ | Total | Unamortized Premiums, Net | Allowance for Credit Losses(1) | Loans Receivable, Net | |||||||||||||||||||||||||||||||||||||||||||||||||||||||
| March 31, 2020: | ||||||||||||||||||||||||||||||||||||||||||||||||||||||||||||||
| One- to four-family | $ | 673 | $ | 40 | $ | 9 | $ | 33 | $ | 755 | $ | 4 | $ | 35 | $ | 794 | ||||||||||||||||||||||||||||||||||||||||||||||
| Home equity | 550 | 22 | 8 | 14 | 594 | — | 51 | 645 | ||||||||||||||||||||||||||||||||||||||||||||||||||||||
Securities-based lending(2) | 195 | — | — | — | 195 | — | — | 195 | ||||||||||||||||||||||||||||||||||||||||||||||||||||||
| Total loans receivable | $ | 1,418 | $ | 62 | $ | 17 | $ | 47 | $ | 1,544 | $ | 4 | $ | 86 | $ | 1,634 | ||||||||||||||||||||||||||||||||||||||||||||||
| Days Past Due | ||||||||||||||||||||||||||||||||||||||||||||||||||||||||||||||
| Current | 30-89 | 90-179 | 180+ | Total | Unamortized Premiums, Net | Allowance for Loan Losses(1) | Loans Receivable, Net | |||||||||||||||||||||||||||||||||||||||||||||||||||||||
| December 31, 2019: | ||||||||||||||||||||||||||||||||||||||||||||||||||||||||||||||
| One- to four-family | $ | 718 | $ | 39 | $ | 11 | $ | 35 | $ | 803 | $ | 5 | $ | (6) | $ | 802 | ||||||||||||||||||||||||||||||||||||||||||||||
| Home equity | 590 | 21 | 7 | 17 | 635 | — | (11) | 624 | ||||||||||||||||||||||||||||||||||||||||||||||||||||||
Securities-based lending(2) | 169 | — | — | — | 169 | — | — | 169 | ||||||||||||||||||||||||||||||||||||||||||||||||||||||
| Total loans receivable | $ | 1,477 | $ | 60 | $ | 18 | $ | 52 | $ | 1,607 | $ | 5 | $ | (17) | $ | 1,595 | ||||||||||||||||||||||||||||||||||||||||||||||
| One- to Four-Family | Home Equity | ||||||||||||||||||||||||||||||||||
| March 31, | December 31, | March 31, | December 31, | ||||||||||||||||||||||||||||||||
Current LTV/CLTV(1) | 2020 | 2019 | 2020 | 2019 | |||||||||||||||||||||||||||||||
| <=80% | $ | 624 | $ | 661 | $ | 350 | $ | 377 | |||||||||||||||||||||||||||
| 80%-100% | 88 | 97 | 143 | 154 | |||||||||||||||||||||||||||||||
| 100%-120% | 28 | 26 | 69 | 68 | |||||||||||||||||||||||||||||||
| >120% | 15 | 19 | 32 | 36 | |||||||||||||||||||||||||||||||
| Total mortgage loans receivable | $ | 755 | $ | 803 | $ | 594 | $ | 635 | |||||||||||||||||||||||||||
Average estimated current LTV/CLTV (2) | 61 | % | 61 | % | 77 | % | 76 | % | |||||||||||||||||||||||||||
Average LTV/CLTV at loan origination (3) | 70 | % | 70 | % | 82 | % | 82 | % | |||||||||||||||||||||||||||
| One- to Four-Family | Home Equity | ||||||||||||||
| March 31, | December 31, | March 31, | December 31, | ||||||||||||
Current LTV/CLTV(1) | 2019 | 2018 | 2019 | 2018 | |||||||||||
| <=80% | $ | 794 | $ | 823 | $ | 430 | $ | 454 | |||||||
| 80%-100% | 134 | 165 | 202 | 215 | |||||||||||
| 100%-120% | 45 | 45 | 100 | 110 | |||||||||||
| >120% | 30 | 38 | 53 | 57 | |||||||||||
| Total mortgage loans receivable | $ | 1,003 | $ | 1,071 | $ | 785 | $ | 836 | |||||||
Average estimated current LTV/CLTV (2) | 65 | % | 66 | % | 79 | % | 80 | % | |||||||
Average LTV/CLTV at loan origination (3) | 70 | % | 70 | % | 82 | % | 82 | % | |||||||
| One- to Four-Family | Home Equity | ||||||||||||||||||||||||||||||||||
| March 31, | December 31, | March 31, | December 31, | ||||||||||||||||||||||||||||||||
| Current FICO | 2020 | 2019 | 2020 | 2019 | |||||||||||||||||||||||||||||||
| >=720 | $ | 423 | $ | 462 | $ | 309 | $ | 333 | |||||||||||||||||||||||||||
| 719 - 700 | 65 | 77 | 56 | 61 | |||||||||||||||||||||||||||||||
| 699 - 680 | 52 | 55 | 49 | 54 | |||||||||||||||||||||||||||||||
| 679 - 660 | 44 | 40 | 42 | 43 | |||||||||||||||||||||||||||||||
| 659 - 620 | 66 | 63 | 54 | 59 | |||||||||||||||||||||||||||||||
| <620 | 105 | 106 | 84 | 85 | |||||||||||||||||||||||||||||||
| Total mortgage loans receivable | $ | 755 | $ | 803 | $ | 594 | $ | 635 | |||||||||||||||||||||||||||
| One- to Four-Family | Home Equity | ||||||||||||||
| March 31, | December 31, | March 31, | December 31, | ||||||||||||
| Current FICO | 2019 | 2018 | 2019 | 2018 | |||||||||||
| >=720 | $ | 581 | $ | 617 | $ | 409 | $ | 442 | |||||||
| 719 - 700 | 78 | 89 | 73 | 78 | |||||||||||
| 699 - 680 | 78 | 80 | 65 | 70 | |||||||||||
| 679 - 660 | 52 | 66 | 54 | 56 | |||||||||||
| 659 - 620 | 93 | 79 | 79 | 80 | |||||||||||
| <620 | 121 | 140 | 105 | 110 | |||||||||||
| Total mortgage loans receivable | $ | 1,003 | $ | 1,071 | $ | 785 | $ | 836 | |||||||
| March 31, 2020 | December 31, 2019 | ||||||||||
| One- to four-family | $ | 104 | $ | 114 | |||||||
| Home equity | 51 | 54 | |||||||||
| Total nonperforming loans receivable | $ | 155 | $ | 168 | |||||||
| March 31, 2019 | December 31, 2018 | ||||||
| One- to four-family | $ | 134 | $ | 139 | |||
| Home equity | 67 | 71 | |||||
| Total nonperforming loans receivable | $ | 201 | $ | 210 | |||
| March 31, 2020 | ||||||||||||||||||||
| One- to Four-Family | Home Equity | |||||||||||||||||||
| Unpaid principal balance | $ | 184 | $ | 154 | ||||||||||||||||
| Recorded investment | $ | 136 | $ | 57 | ||||||||||||||||
| Negative allowance for credit losses | $ | 37 | $ | 65 | ||||||||||||||||
| Average estimated current LTV/CLTV | 71 | % | 76 | % | ||||||||||||||||
| Average loan amount (dollars in thousands) | $ | 361 | $ | 63 | ||||||||||||||||
| One- to Four-Family | Home Equity | Consumer | Total(1) | ||||||||||||||||||||||||||||
March 31, 2019 | December 31, 2018 | March 31, 2019 | December 31, 2018 | March 31, 2019 | December 31, 2018 | March 31, 2019 | December 31, 2018 | ||||||||||||||||||||||||
| General reserve: | |||||||||||||||||||||||||||||||
| Quantitative component | $ | 4 | $ | 4 | $ | 4 | $ | 6 | $ | 2 | $ | 2 | $ | 10 | $ | 12 | |||||||||||||||
| Qualitative component | — | — | — | 1 | — | — | — | 1 | |||||||||||||||||||||||
| Specific valuation allowance | 5 | 5 | 17 | 19 | — | — | 22 | 24 | |||||||||||||||||||||||
| Total allowance for loan losses | $ | 9 | $ | 9 | $ | 21 | $ | 26 | $ | 2 | $ | 2 | $ | 32 | $ | 37 | |||||||||||||||
Allowance as a % of loans receivable(2) | 0.9 | % | 0.8 | % | 2.7 | % | 3.1 | % | 1.0 | % | 1.0 | % | 1.6 | % | 1.7 | % | |||||||||||||||
| Three Months Ended March 31, 2020 | |||||||||||||||||||||||||||||
| One- to Four-Family | Home Equity | Total(2) | |||||||||||||||||||||||||||
Allowance for loan losses, beginning of period(1) | $ | (6) | $ | (11) | $ | (17) | |||||||||||||||||||||||
Impact of CECL adoption(1)(3) | 43 | 71 | 114 | ||||||||||||||||||||||||||
| (Provision) benefit for credit losses | (1) | (5) | (6) | ||||||||||||||||||||||||||
Charge-offs(4) | — | — | — | ||||||||||||||||||||||||||
Recoveries(4) | (1) | (4) | (5) | ||||||||||||||||||||||||||
| Net charge-offs (recoveries) | (1) | (4) | (5) | ||||||||||||||||||||||||||
Allowance for credit losses, end of period(1) | $ | 35 | $ | 51 | $ | 86 | |||||||||||||||||||||||
| Three Months Ended March 31, 2019 | |||||||||||||||
One- to Four-Family | Home Equity | Consumer | Total | ||||||||||||
| Allowance for loan losses, beginning of period | $ | 9 | $ | 26 | $ | 2 | $ | 37 | |||||||
| Provision (benefit) for loan losses | (2 | ) | (10 | ) | — | (12 | ) | ||||||||
Charge-offs(1) | — | — | (1 | ) | (1 | ) | |||||||||
| Recoveries | 2 | 5 | 1 | 8 | |||||||||||
| Net (charge-offs) recoveries | 2 | 5 | — | 7 | |||||||||||
Allowance for loan losses, end of period(2) | $ | 9 | $ | 21 | $ | 2 | $ | 32 | |||||||
| Three Months Ended March 31, 2018 | |||||||||||||||
| One- to Four-Family | Home Equity | Consumer | Total | ||||||||||||
| Allowance for loan losses, beginning of period | $ | 24 | $ | 46 | $ | 4 | $ | 74 | |||||||
| Provision (benefit) for loan losses | (5 | ) | (16 | ) | — | (21 | ) | ||||||||
Charge-offs(1) | — | — | (1 | ) | (1 | ) | |||||||||
| Recoveries | 1 | 5 | — | 6 | |||||||||||
| Net (charge-offs) recoveries | 1 | 5 | (1 | ) | 5 | ||||||||||
Allowance for loan losses, end of period(2) | $ | 20 | $ | 35 | $ | 3 | $ | 58 | |||||||
| Three Months Ended March 31, 2019 | |||||||||||||||||||||||||||||||||||||||||
| One- to Four-Family | Home Equity | Consumer | Total(2) | ||||||||||||||||||||||||||||||||||||||
Allowance for loan losses, beginning of period(1) | $ | (9) | $ | (26) | $ | (2) | $ | (37) | |||||||||||||||||||||||||||||||||
| (Provision) benefit for loan losses | 2 | 10 | — | 12 | |||||||||||||||||||||||||||||||||||||
Charge-offs(4) | — | — | 1 | 1 | |||||||||||||||||||||||||||||||||||||
Recoveries(4) | (2) | (5) | (1) | (8) | |||||||||||||||||||||||||||||||||||||
| Net charge-offs (recoveries) | (2) | (5) | — | (7) | |||||||||||||||||||||||||||||||||||||
Allowance for loan losses, end of period(1) | $ | (9) | $ | (21) | $ | (2) | $ | (32) | |||||||||||||||||||||||||||||||||
(2)Securities-based lending loans were fully collateralized by cash and securities with fair values in excess of borrowings |
| Recorded Investment | Allowance for Loan Losses | ||||||||||||||
| March 31, | December 31, | March 31, | December 31, | ||||||||||||
| 2019 | 2018 | 2019 | 2018 | ||||||||||||
| Collectively evaluated for impairment: | |||||||||||||||
| One- to four-family | $ | 829 | $ | 891 | $ | 4 | $ | 4 | |||||||
| Home equity | 653 | 698 | 4 | 7 | |||||||||||
| Consumer | 106 | 119 | 2 | 2 | |||||||||||
| Securities-based lending | 97 | 107 | — | — | |||||||||||
| Total collectively evaluated for impairment | 1,685 | 1,815 | 10 | 13 | |||||||||||
| Individually evaluated for impairment: | |||||||||||||||
| One- to four-family | 180 | 187 | 5 | 5 | |||||||||||
| Home equity | 132 | 138 | 17 | 19 | |||||||||||
| Total individually evaluated for impairment | 312 | 325 | 22 | 24 | |||||||||||
| Total | $ | 1,997 | $ | 2,140 | $ | 32 | $ | 37 | |||||||
| Nonaccrual TDRs | |||||||||||||||||||||||
Accrual TDRs(1) | Current(2) | 30-89 Days Delinquent | 90-179 Days Delinquent | 180+ Days Delinquent | Total Recorded Investment in TDRs (3)(4) | ||||||||||||||||||
| March 31, 2019: | |||||||||||||||||||||||
| One- to four-family | $ | 85 | $ | 61 | $ | 10 | $ | 4 | $ | 20 | $ | 180 | |||||||||||
| Home equity | 85 | 23 | 9 | 3 | 12 | 132 | |||||||||||||||||
| Total | $ | 170 | $ | 84 | $ | 19 | $ | 7 | $ | 32 | $ | 312 | |||||||||||
| December 31, 2018: | |||||||||||||||||||||||
| One- to four-family | $ | 87 | $ | 61 | $ | 12 | $ | 4 | $ | 23 | $ | 187 | |||||||||||
| Home equity | 90 | 23 | 8 | 5 | 12 | 138 | |||||||||||||||||
| Total | $ | 177 | $ | 84 | $ | 20 | $ | 9 | $ | 35 | $ | 325 | |||||||||||
| Average Recorded Investment | Interest Income Recognized | ||||||||||||||
| Three Months Ended March 31, | Three Months Ended March 31, | ||||||||||||||
| 2019 | 2018 | 2019 | 2018 | ||||||||||||
| One- to four-family | $ | 184 | $ | 210 | $ | 2 | $ | 2 | |||||||
| Home equity | 135 | 165 | 3 | 4 | |||||||||||
| Total | $ | 319 | $ | 375 | $ | 5 | $ | 6 | |||||||
| March 31, 2019 | December 31, 2018 | ||||||||||||||||||||||
Recorded Investment in TDRs | Specific Valuation Allowance | Net Investment in TDRs | Recorded Investment in TDRs | Specific Valuation Allowance | Net Investment in TDRs | ||||||||||||||||||
| With a recorded allowance: | |||||||||||||||||||||||
| One- to four-family | $ | 49 | $ | 5 | $ | 44 | $ | 50 | $ | 5 | $ | 45 | |||||||||||
| Home equity | $ | 57 | $ | 17 | $ | 40 | $ | 60 | $ | 19 | $ | 41 | |||||||||||
Without a recorded allowance:(1) | |||||||||||||||||||||||
| One- to four-family | $ | 131 | $ | — | $ | 131 | $ | 137 | $ | — | $ | 137 | |||||||||||
| Home equity | $ | 75 | $ | — | $ | 75 | $ | 78 | $ | — | $ | 78 | |||||||||||
| Total: | |||||||||||||||||||||||
| One- to four-family | $ | 180 | $ | 5 | $ | 175 | $ | 187 | $ | 5 | $ | 182 | |||||||||||
| Home equity | $ | 132 | $ | 17 | $ | 115 | $ | 138 | $ | 19 | $ | 119 | |||||||||||
| Three Months Ended | ||||||||||||||||||||||||||||||||||||||||||||||||||||||||||||||||
| Three Months Ended | Interest Rate Reduction | |||||||||||||||||||||||||||||||||||||||||||||||||||||||||||||||
| Interest Rate Reduction | Number of Loans | Re-age/ Extension/ Interest Capitalization | Other(1) | Total | ||||||||||||||||||||||||||||||||||||||||||||||||||||||||||||
| March 31, 2020: | March 31, 2020: | |||||||||||||||||||||||||||||||||||||||||||||||||||||||||||||||
| One- to four-family | One- to four-family | 4 | $ | 2 | $ | — | $ | 2 | ||||||||||||||||||||||||||||||||||||||||||||||||||||||||
| Home equity | Home equity | 8 | 1 | — | 1 | |||||||||||||||||||||||||||||||||||||||||||||||||||||||||||
| Total | Total | 12 | $ | 3 | $ | — | $ | 3 | ||||||||||||||||||||||||||||||||||||||||||||||||||||||||
| Number of Loans | Re-age/ Extension/ Interest Capitalization | Other with Interest Rate Reduction | Other(1) | Total | ||||||||||||||||||||||||||||||||||||||||||||||||||||||||||||
| March 31, 2019: | March 31, 2019: | |||||||||||||||||||||||||||||||||||||||||||||||||||||||||||||||
| One- to four-family | 9 | $ | 1 | $ | — | $ | 1 | $ | 2 | One- to four-family | 9 | $ | 1 | $ | 1 | $ | 2 | |||||||||||||||||||||||||||||||||||||||||||||||
| Home equity | 11 | 1 | — | — | 1 | Home equity | 11 | 1 | — | 1 | ||||||||||||||||||||||||||||||||||||||||||||||||||||||
| Total | 20 | $ | 2 | $ | — | $ | 1 | $ | 3 | Total | 20 | $ | 2 | $ | 1 | $ | 3 | |||||||||||||||||||||||||||||||||||||||||||||||
| March 31, 2018: | ||||||||||||||||||||||||||||||||||||||||||||||||||||||||||||||||
| One- to four-family | 16 | $ | 6 | $ | — | $ | 2 | $ | 8 | |||||||||||||||||||||||||||||||||||||||||||||||||||||||
| Home equity | 44 | 2 | — | — | 2 | |||||||||||||||||||||||||||||||||||||||||||||||||||||||||||
| Total | 60 | $ | 8 | $ | — | $ | 2 | $ | 10 | |||||||||||||||||||||||||||||||||||||||||||||||||||||||
| NOTE | ||
| Fair Value | |||||||||||||||
| Notional | Asset(1) | Liability(2) | Net(3) | ||||||||||||
| March 31, 2019: | |||||||||||||||
| Interest rate contracts: | |||||||||||||||
| Fair value hedges | $ | 11,578 | $ | — | $ | (2 | ) | $ | (2 | ) | |||||
Total derivatives designated as hedging instruments(4) | $ | 11,578 | $ | — | $ | (2 | ) | $ | (2 | ) | |||||
| December 31, 2018: | |||||||||||||||
| Interest rate contracts: | |||||||||||||||
| Fair value hedges | $ | 9,763 | $ | 1 | $ | — | $ | 1 | |||||||
Total derivatives designated as hedging instruments(4) | $ | 9,763 | $ | 1 | $ | — | $ | 1 | |||||||
Cumulative Amount of Fair Value Hedging Basis Adjustment Included in Carrying Amount of Hedged Assets(2) | |||||||||||
Carrying Amount of Hedged Assets(1) | Total | Discontinued | |||||||||
| March 31, 2019: | |||||||||||
Available-for-sale securities(3) | $ | 14,830 | $ | 276 | $ | (343 | ) | ||||
| December 31, 2018: | |||||||||||
Available-for-sale securities(3) | $ | 13,203 | $ | (10 | ) | $ | (385 | ) | |||
Cumulative Amount of Fair Value Hedging Basis Adjustment of Hedged Assets(2) | |||||||||||||||||||||||||||||||||||
Amortized Cost of Hedged Assets(1) | Total | Active | Discontinued | ||||||||||||||||||||||||||||||||
| March 31, 2020: | |||||||||||||||||||||||||||||||||||
Available-for-sale securities(3) | $ | 14,144 | $ | 1,561 | $ | 1,785 | $ | (224) | |||||||||||||||||||||||||||
Cumulative Amount of Fair Value Hedging Basis Adjustment Included in Carrying Amount of Hedged Assets(2) | |||||||||||||||||||||||||||||||||||
Carrying Amount of Hedged Assets(4) | Total | Active | Discontinued | ||||||||||||||||||||||||||||||||
| December 31, 2019: | |||||||||||||||||||||||||||||||||||
Available-for-sale securities(3) | $ | 12,480 | $ | 583 | $ | 810 | $ | (227) | |||||||||||||||||||||||||||
| Interest Income | |||||||||||||||||||||||||||||||||||||||||
| Three Months Ended March 31, | |||||||||||||||||||||||||||||||||||||||||
| 2020 | 2019 | ||||||||||||||||||||||||||||||||||||||||
| Total interest income | $ | 443 | $ | 555 | |||||||||||||||||||||||||||||||||||||
Effects of fair value hedging on total interest income(1)(2) | |||||||||||||||||||||||||||||||||||||||||
| Agency debentures: | |||||||||||||||||||||||||||||||||||||||||
| Changes in fair value of hedged items | 215 | 7 | |||||||||||||||||||||||||||||||||||||||
| Changes in fair value of derivatives | (215) | (7) | |||||||||||||||||||||||||||||||||||||||
| Net loss on fair value hedging relationships - agency debentures | — | — | |||||||||||||||||||||||||||||||||||||||
| Agency mortgage-backed securities: | |||||||||||||||||||||||||||||||||||||||||
| Amounts recognized as interest accruals on derivatives | (12) | 3 | |||||||||||||||||||||||||||||||||||||||
| Amortization of basis adjustments from discontinued hedges | 8 | 10 | |||||||||||||||||||||||||||||||||||||||
| Changes in fair value of hedged items | 855 | 274 | |||||||||||||||||||||||||||||||||||||||
| Changes in fair value of derivatives | (866) | (273) | |||||||||||||||||||||||||||||||||||||||
| Net (loss) gain on fair value hedging relationships - agency mortgage-backed securities | (15) | 14 | |||||||||||||||||||||||||||||||||||||||
| Total net (loss) gain on fair value hedging relationships | $ | (15) | $ | 14 | |||||||||||||||||||||||||||||||||||||
| Interest Income | |||||||
| Three Months Ended March 31, | |||||||
| 2019 | 2018 | ||||||
| Total interest income | $ | 555 | $ | 468 | |||
Effects of fair value hedging on total interest income(1)(2) | |||||||
| Agency debentures: | |||||||
| Amounts recognized as interest accruals on derivatives | — | (2 | ) | ||||
| Changes in fair value of hedged items | 7 | (50 | ) | ||||
| Changes in fair value of derivatives | (7 | ) | 49 | ||||
| Net loss on fair value hedging relationships - agency debentures | — | (3 | ) | ||||
| Agency mortgage backed securities: | |||||||
| Amounts recognized as interest accruals on derivatives | 3 | (13 | ) | ||||
| Amortization of basis adjustments from discontinued hedges | 10 | 2 | |||||
| Changes in fair value of hedged items | 274 | (231 | ) | ||||
| Changes in fair value of derivatives | (273 | ) | 229 | ||||
| Net gain (loss) on fair value hedging relationships - agency mortgage backed securities | 14 | (13 | ) | ||||
| Total net gain (loss) on fair value hedging relationships | $ | 14 | $ | (16 | ) | ||
| NOTE |
| March 31, 2019 | December 31, 2018 | ||||||
| Sweep deposits | $ | 38,639 | $ | 39,322 | |||
Savings deposits(1) | 5,790 | 4,133 | |||||
Other deposits(2) | 1,899 | 1,858 | |||||
| Total deposits | $ | 46,328 | $ | 45,313 | |||
| March 31, 2020 | December 31, 2019 | ||||||||||||||||||||||
| Sweep deposits: | |||||||||||||||||||||||
| Brokerage sweep deposits | $ | 38,095 | $ | 27,949 | |||||||||||||||||||
Bank sweep deposits(1) | 680 | 6,355 | |||||||||||||||||||||
Savings deposits(2) | 1,667 | 2,592 | |||||||||||||||||||||
Other deposits(3) | 1,704 | 1,710 | |||||||||||||||||||||
| Total deposits | $ | 42,146 | $ | 38,606 | |||||||||||||||||||
| NOTE | ||
| Description | Maturity Date | Borrower | Outstanding | Available | ||||
Unsecured, committed revolving credit facility(1) | June 2020 | ETFC | $ | — | $ | 300 | ||
| FHLB secured credit facility | Determined at trade | ETB | 300 | $ | 6,231 | |||
| Federal Reserve Bank discount window | Overnight | ETB | — | $ | 941 | |||
Senior unsecured, committed revolving credit facility(2) | June 2019 | ETS | — | $ | 600 | |||
| Secured, committed lines of credit | June 2019 | ETS | — | $ | 175 | |||
| Unsecured, uncommitted lines of credit | June 2019 | ETS | — | $ | 50 | |||
| Unsecured, uncommitted lines of credit | None | ETS | — | $ | 75 | |||
| Secured, uncommitted lines of credit | None | ETS | — | $ | 375 | |||
| Total other borrowings | $ | 300 | ||||||
| Borrower | Outstanding | Available | ||||||||||||
Senior unsecured, committed revolving credit facility | ||||||||||||||
| (1) | June 2024 | ETFC | $ | — | $ | 300 | ||||||||
| ETB | $ | — | $ | 6,430 | ||||||||||
| Federal Reserve Bank discount window | Overnight | ETB | $ | — | $ | 1,245 | ||||||||
Senior unsecured, committed revolving credit facility | June 2020 | ETS | $ | — | $ | 600 | ||||||||
| Secured, committed lines of credit | June 2020 | ETS | $ | — | $ | 175 | ||||||||
| Unsecured, uncommitted lines of credit | June 2020 | ETS | $ | — | $ | 50 | ||||||||
| Unsecured, uncommitted lines of credit | None | ETS | $ | — | $ | 75 | ||||||||
| Secured, uncommitted lines of credit | None | ETS | $ | — | $ | 425 | ||||||||
| Face Value | Discount | Net | |||||||||
| March 31, 2019: | |||||||||||
| Interest-bearing notes: | |||||||||||
| 2.95% Senior Notes, due 2022 | $ | 600 | $ | (4 | ) | $ | 596 | ||||
| 3.80% Senior Notes, due 2027 | 400 | (3 | ) | 397 | |||||||
| 4.50% Senior Notes, due 2028 | 420 | (4 | ) | 416 | |||||||
| Total corporate debt | $ | 1,420 | $ | (11 | ) | $ | 1,409 | ||||
| Face Value | Discount | Net | ||||||||||||||||||||||||||
| December 31, 2018: | ||||||||||||||||||||||||||||
| March 31, 2020: | March 31, 2020: | |||||||||||||||||||||||||||
| Interest-bearing notes: | Interest-bearing notes: | |||||||||||||||||||||||||||
| 2.95% Senior Notes, due 2022 | $ | 600 | $ | (4 | ) | $ | 596 | 2.95% Senior Notes, due 2022 | $ | 600 | $ | (3) | $ | 597 | ||||||||||||||
| 3.80% Senior Notes, due 2027 | 400 | (3 | ) | 397 | 3.80% Senior Notes, due 2027 | 400 | (3) | 397 | ||||||||||||||||||||
| 4.50% Senior Notes, due 2028 | 420 | (4 | ) | 416 | 4.50% Senior Notes, due 2028 | 420 | (3) | 417 | ||||||||||||||||||||
| Total corporate debt | $ | 1,420 | $ | (11 | ) | $ | 1,409 | Total corporate debt | $ | 1,420 | $ | (9) | $ | 1,411 | ||||||||||||||
| December 31, 2019: | |||||||||||||||||
| Interest-bearing notes: | |||||||||||||||||
| 2.95% Senior Notes, due 2022 | $ | 600 | $ | (3) | $ | 597 | |||||||||||
| 3.80% Senior Notes, due 2027 | 400 | (3) | 397 | ||||||||||||||
| 4.50% Senior Notes, due 2028 | 420 | (4) | 416 | ||||||||||||||
| Total corporate debt | $ | 1,420 | $ | (10) | $ | 1,410 | |||||||||||
| Classification | March 31, 2019 | |||||
| Operating lease assets, net | Other assets | $ | 201 | |||
| Operating lease liabilities | Other liabilities | $ | 227 | |||
| Classification | Three Months Ended March 31, 2019 | |||||
Operating lease cost(1) | Occupancy and Equipment | $ | 8 | |||
| Variable lease cost | Occupancy and Equipment | 1 | ||||
Net lease expense(2) | $ | 9 | ||||
| Operating Leases | |||
| Years ending December 31, | |||
2019(1) | $ | 19 | |
| 2020 | 33 | ||
| 2021 | 32 | ||
| 2022 | 29 | ||
| 2023 | 30 | ||
| Thereafter | 138 | ||
| Total lease payments | 281 | ||
| Imputed interest | (54 | ) | |
| Present value of lease liabilities | $ | 227 | |
| NOTE 11—SHAREHOLDERS' EQUITY |
| Carrying Value at | |||||||||||||||||||
| Description | Issuance Date | Per Annum Dividend Rate | Total Shares Outstanding | Liquidation Preference per Share | March 31, 2019 | December 31, 2018 | |||||||||||||
| Series A | |||||||||||||||||||
| Fixed-to-Floating Rate Non-Cumulative | 8/25/2016 | 5.875% to, but excluding, 9/15/2026; 3-mo LIBOR + 4.435% thereafter | 400,000 | $ | 1,000 | $ | 394 | $ | 394 | ||||||||||
| Series B | |||||||||||||||||||
| Fixed-to-Floating Rate Non-Cumulative | 12/6/2017 | 5.30% to, but excluding, 3/15/2023; 3-mo LIBOR + 3.16% thereafter | 3,000 | $ | 100,000 | 295 | 295 | ||||||||||||
| Total | 403,000 | $ | 689 | $ | 689 | ||||||||||||||
| Carrying Value at | ||||||||||||||||||||||||||||||||||||||||||||
| Description | Issuance Date | Per Annum Dividend Rate | Total Shares Outstanding | Liquidation Preference per Share | March 31, 2020 | December 31, 2019 | ||||||||||||||||||||||||||||||||||||||
| Series A | ||||||||||||||||||||||||||||||||||||||||||||
| Fixed-to-Floating Rate Non-Cumulative | 8/25/2016 | 5.875% to, but excluding, 9/15/2026; 3-mo LIBOR + 4.435% thereafter | 400,000 | $ | 1,000 | $ | 394 | $ | 394 | |||||||||||||||||||||||||||||||||||
| Series B | ||||||||||||||||||||||||||||||||||||||||||||
| Fixed-to-Floating Rate Non-Cumulative | 12/6/2017 | 5.30% to, but excluding, 3/15/2023; 3-mo LIBOR + 3.16% thereafter | 3,000 | $ | 100,000 | 295 | 295 | |||||||||||||||||||||||||||||||||||||
| Total | 403,000 | $ | 689 | $ | 689 | |||||||||||||||||||||||||||||||||||||||
| Three Months Ended March 31, 2020 | ||||||||||||||||||||||||||||||||||||||||||||||||||
| Declaration Date | Record Date | Payment Date | Dividend per Share | Dividend Paid | ||||||||||||||||||||||||||||||||||||||||||||||
Series A (1) | ||||||||||||||||||||||||||||||||||||||||||||||||||
| 2/6/2020 | 3/2/2020 | 3/16/2020 | $ | 29.38 | $ | 12 | ||||||||||||||||||||||||||||||||||||||||||||
Series B (1) | ||||||||||||||||||||||||||||||||||||||||||||||||||
| 2/6/2020 | 3/2/2020 | 3/16/2020 | $ | 2,650.00 | 8 | |||||||||||||||||||||||||||||||||||||||||||||
| Total | $ | 20 | ||||||||||||||||||||||||||||||||||||||||||||||||
| Three Months Ended March 31, 2019 | ||||||||||||||||||||||||||||||||||||||||||||||||||
| Declaration Date | Record Date | Payment Date | Dividend per Share | Dividend Paid | ||||||||||||||||||||||||||||||||||||||||||||||
Series A (1) | ||||||||||||||||||||||||||||||||||||||||||||||||||
| 2/7/2019 | 2/28/2019 | 3/15/2019 | $ | 29.38 | $ | 12 | ||||||||||||||||||||||||||||||||||||||||||||
Series B (1) | ||||||||||||||||||||||||||||||||||||||||||||||||||
| 2/7/2019 | 2/28/2019 | 3/15/2019 | $ | 2,650.00 | 8 | |||||||||||||||||||||||||||||||||||||||||||||
| Total | $ | 20 | ||||||||||||||||||||||||||||||||||||||||||||||||
| Three Months Ended March 31, 2019 | Three Months Ended March 31, 2018 | |||||||||||||||||||||||||
| Declaration Date | Record Date | Payment Date | Dividend per Share | Dividend Paid | Declaration Date | Record Date | Payment Date | Dividend per Share | Dividend Paid | |||||||||||||||||
Series A (1) | ||||||||||||||||||||||||||
| 2/7/2019 | 2/28/2019 | 3/15/2019 | $ | 29.38 | $ | 12 | 2/8/2018 | 2/28/2018 | 3/15/2018 | $ | 29.38 | $ | 12 | |||||||||||||
Series B (1) | ||||||||||||||||||||||||||
| 2/7/2019 | 2/28/2019 | 3/15/2019 | $ | 2,650.00 | 8 | |||||||||||||||||||||
| Total | $ | 20 | $ | 12 | ||||||||||||||||||||||
| Three Months Ended March 31, 2020 | ||||||||||||||||||||||||||||||||||||||||||||||||||||||||||||||||||||||||||||||||
| Declaration Date | Record Date | Payment Date | Dividend per Share | Dividend Paid | ||||||||||||||||||||||||||||||||||||||||||||||||||||||||||||||||||||||||||||
| 1/22/2020 | 2/25/2020 | 3/2/2020 | $ | 0.14 | $ | 31 | ||||||||||||||||||||||||||||||||||||||||||||||||||||||||||||||||||||||||||
| Total | $ | 31 | ||||||||||||||||||||||||||||||||||||||||||||||||||||||||||||||||||||||||||||||
| Three Months Ended March 31, 2019 | ||||||||||||||||||||||||||||||||||||||||||||||||||||||||||||||||||||||||||||||||
| Declaration Date | Record Date | Payment Date | Dividend per Share | Dividend Paid | ||||||||||||||||||||||||||||||||||||||||||||||||||||||||||||||||||||||||||||
| 1/23/2019 | 2/1/2019 | 2/15/2019 | $ | 0.14 | $ | 35 | ||||||||||||||||||||||||||||||||||||||||||||||||||||||||||||||||||||||||||
| Total | $ | 35 | ||||||||||||||||||||||||||||||||||||||||||||||||||||||||||||||||||||||||||||||
| Three Months Ended March 31, | Three Months Ended March 31, | |||||||||||||||||||||||
| 2019 | 2018 | 2020 | 2019 | |||||||||||||||||||||
Accumulated other comprehensive loss, beginning of period(1) | $ | (275 | ) | $ | (26 | ) | Accumulated other comprehensive loss, beginning of period(1) | $ | (28) | $ | (275) | |||||||||||||
| Other comprehensive income (loss) before reclassifications | 112 | (128 | ) | |||||||||||||||||||||
| Other comprehensive (loss) income before reclassifications | Other comprehensive (loss) income before reclassifications | (126) | 112 | |||||||||||||||||||||
| Amounts reclassified from accumulated other comprehensive loss | (7 | ) | (7 | ) | Amounts reclassified from accumulated other comprehensive loss | (14) | (7) | |||||||||||||||||
Transfer of held-to-maturity securities to available-for-sale securities(2) | — | 6 | ||||||||||||||||||||||
| Net change | 105 | (129 | ) | Net change | (140) | 105 | ||||||||||||||||||
| Cumulative effect of hedge accounting adoption | — | (7 | ) | |||||||||||||||||||||
| Reclassification of tax effects due to federal tax reform | — | (14 | ) | |||||||||||||||||||||
Accumulated other comprehensive loss, end of period(1) | $ | (170 | ) | $ | (176 | ) | Accumulated other comprehensive loss, end of period(1) | $ | (168) | $ | (170) | |||||||||||||
(1)The accumulated |
| Three Months Ended March 31, | |||||||||||||||||||||||
| 2019 | 2018 | ||||||||||||||||||||||
| Before Tax | Tax Effect | After Tax | Before Tax | Tax Effect | After Tax | ||||||||||||||||||
| Other comprehensive income (loss) | |||||||||||||||||||||||
| Available-for-sale securities: | |||||||||||||||||||||||
| Unrealized gains (losses), net | $ | 150 | $ | (38 | ) | $ | 112 | $ | (172 | ) | $ | 44 | $ | (128 | ) | ||||||||
| Reclassification into earnings, net | (10 | ) | 3 | (7 | ) | (10 | ) | 3 | (7 | ) | |||||||||||||
| Transfer of held-to-maturity securities to available-for-sale securities | — | — | — | 7 | (1 | ) | 6 | ||||||||||||||||
| Net change from available-for-sale securities | 140 | (35 | ) | 105 | (175 | ) | 46 | (129 | ) | ||||||||||||||
| Other comprehensive income (loss) | $ | 140 | $ | (35 | ) | $ | 105 | $ | (175 | ) | $ | 46 | $ | (129 | ) | ||||||||
| Three Months Ended March 31, | |||||||||||||||||||||||||||||||||||||||||||||||||||||||||||||||||||||||||||||
| 2020 | 2019 | ||||||||||||||||||||||||||||||||||||||||||||||||||||||||||||||||||||||||||||
| Before Tax | Tax Effect | After Tax | Before Tax | Tax Effect | After Tax | ||||||||||||||||||||||||||||||||||||||||||||||||||||||||||||||||||||||||
| Other comprehensive (loss) income | |||||||||||||||||||||||||||||||||||||||||||||||||||||||||||||||||||||||||||||
| Available-for-sale securities: | |||||||||||||||||||||||||||||||||||||||||||||||||||||||||||||||||||||||||||||
| Unrealized (losses) gains, net | $ | (172) | $ | 46 | $ | (126) | $ | 150 | $ | (38) | $ | 112 | |||||||||||||||||||||||||||||||||||||||||||||||||||||||||||||||||
| Reclassification into earnings, net | (19) | 5 | (14) | (10) | 3 | (7) | |||||||||||||||||||||||||||||||||||||||||||||||||||||||||||||||||||||||
| Net change from available-for-sale securities | (191) | 51 | (140) | 140 | (35) | 105 | |||||||||||||||||||||||||||||||||||||||||||||||||||||||||||||||||||||||
| Other comprehensive (loss) income | $ | (191) | $ | 51 | $ | (140) | $ | 140 | $ | (35) | $ | 105 | |||||||||||||||||||||||||||||||||||||||||||||||||||||||||||||||||
| Accumulated Other Comprehensive Loss Components | Amounts Reclassified from Accumulated Other Comprehensive Loss | Affected Line Items in the Consolidated Statement of Income | ||||||||
| Three Months Ended March 31, | ||||||||||
| 2019 | 2018 | |||||||||
| Available-for-sale securities: | $ | 11 | $ | 11 | Gains on securities and other, net | |||||
| (1 | ) | (1 | ) | Interest income | ||||||
| 10 | 10 | Reclassification into earnings, before tax | ||||||||
| (3 | ) | (3 | ) | Income tax expense | ||||||
| $ | 7 | $ | 7 | Reclassification into earnings, net | ||||||
| Accumulated Other Comprehensive Loss Components | Amounts Reclassified from Accumulated Other Comprehensive Loss | Affected Line Items in the Consolidated Statements of Income | ||||||||||||||||||||||||
| Three Months Ended March 31, | ||||||||||||||||||||||||||
| 2020 | 2019 | |||||||||||||||||||||||||
| Available-for-sale securities: | $ | 20 | $ | 11 | Gains on securities and other, net | |||||||||||||||||||||
| (1) | (1) | Interest income | ||||||||||||||||||||||||
| 19 | 10 | Reclassification into earnings, before tax | ||||||||||||||||||||||||
| (5) | (3) | Income tax expense | ||||||||||||||||||||||||
| $ | 14 | $ | 7 | Reclassification into earnings, net | ||||||||||||||||||||||
| NOTE 12—EARNINGS PER SHARE | ||
| NOTE 13—REGULATORY REQUIREMENTS | ||
| Required Net Capital | Net Capital | Excess Net Capital | |||||||||||||||
| March 31, 2020: | |||||||||||||||||
E*TRADE Securities(1) | $ | 179 | $ | 1,360 | $ | 1,181 | |||||||||||
| E*TRADE Futures | 3 | 29 | 26 | ||||||||||||||
| Total | $ | 182 | $ | 1,389 | $ | 1,207 | |||||||||||
| December 31, 2019: | |||||||||||||||||
| E*TRADE Securities | $ | 223 | $ | 1,251 | $ | 1,028 | |||||||||||
| E*TRADE Futures | 3 | 28 | 25 | ||||||||||||||
| Total | $ | 226 | $ | 1,279 | $ | 1,053 | |||||||||||
Required Net Capital | Net Capital | Excess Net Capital | |||||||||
| March 31, 2019: | |||||||||||
E*TRADE Securities(1) | $ | 220 | $ | 1,275 | $ | 1,055 | |||||
| E*TRADE Futures | 2 | 26 | 24 | ||||||||
| International broker-dealer | — | 19 | 19 | ||||||||
| Total | $ | 222 | $ | 1,320 | $ | 1,098 | |||||
| December 31, 2018: | |||||||||||
| E*TRADE Securities | $ | 209 | $ | 1,294 | $ | 1,085 | |||||
| E*TRADE Futures | 1 | 26 | 25 | ||||||||
| International broker-dealer | — | 18 | 18 | ||||||||
| Total | $ | 210 | $ | 1,338 | $ | 1,128 | |||||
| March 31, 2020 | December 31, 2019 | |||||||||||||||||||||||||||||||||||||||||||||||||||||||||||||||||||||||||||||||||||||||||||||||||||||||||||||||||||
| Actual | Well Capitalized Minimum Capital | Excess Capital | Actual | Well Capitalized Minimum Capital | Excess Capital | |||||||||||||||||||||||||||||||||||||||||||||||||||||||||||||||||||||||||||||||||||||||||||||||||||||||||||||||
| Amount | Ratio | Amount | Ratio | Amount | Amount | Ratio | Amount | Ratio | Amount | |||||||||||||||||||||||||||||||||||||||||||||||||||||||||||||||||||||||||||||||||||||||||||||||||||||||||||
E*TRADE Financial(1) | ||||||||||||||||||||||||||||||||||||||||||||||||||||||||||||||||||||||||||||||||||||||||||||||||||||||||||||||||||||
| Tier 1 leverage | $ | 4,179 | 6.8 | % | $ | 3,051 | 5.0 | % | $ | 1,128 | $ | 4,035 | 6.9 | % | $ | 2,922 | 5.0 | % | $ | 1,113 | ||||||||||||||||||||||||||||||||||||||||||||||||||||||||||||||||||||||||||||||||||||||||||||||||
| Common Equity Tier 1 | $ | 3,490 | 29.3 | % | $ | 775 | 6.5 | % | $ | 2,715 | $ | 3,346 | 31.5 | % | $ | 692 | 6.5 | % | $ | 2,654 | ||||||||||||||||||||||||||||||||||||||||||||||||||||||||||||||||||||||||||||||||||||||||||||||||
| Tier 1 risk-based | $ | 4,179 | 35.1 | % | $ | 954 | 8.0 | % | $ | 3,225 | $ | 4,035 | 37.9 | % | $ | 852 | 8.0 | % | $ | 3,183 | ||||||||||||||||||||||||||||||||||||||||||||||||||||||||||||||||||||||||||||||||||||||||||||||||
| Total risk-based | $ | 4,179 | 35.1 | % | $ | 1,192 | 10.0 | % | $ | 2,987 | $ | 4,060 | 38.2 | % | $ | 1,064 | 10.0 | % | $ | 2,996 | ||||||||||||||||||||||||||||||||||||||||||||||||||||||||||||||||||||||||||||||||||||||||||||||||
E*TRADE Bank(1) | ||||||||||||||||||||||||||||||||||||||||||||||||||||||||||||||||||||||||||||||||||||||||||||||||||||||||||||||||||||
| Tier 1 leverage | $ | 3,420 | 7.4 | % | $ | 2,314 | 5.0 | % | $ | 1,106 | $ | 3,240 | 7.2 | % | $ | 2,253 | 5.0 | % | $ | 987 | ||||||||||||||||||||||||||||||||||||||||||||||||||||||||||||||||||||||||||||||||||||||||||||||||
| Common Equity Tier 1 | $ | 3,420 | 35.8 | % | $ | 621 | 6.5 | % | $ | 2,799 | $ | 3,240 | 36.5 | % | $ | 577 | 6.5 | % | $ | 2,663 | ||||||||||||||||||||||||||||||||||||||||||||||||||||||||||||||||||||||||||||||||||||||||||||||||
| Tier 1 risk-based | $ | 3,420 | 35.8 | % | $ | 764 | 8.0 | % | $ | 2,656 | $ | 3,240 | 36.5 | % | $ | 710 | 8.0 | % | $ | 2,530 | ||||||||||||||||||||||||||||||||||||||||||||||||||||||||||||||||||||||||||||||||||||||||||||||||
| Total risk-based | $ | 3,420 | 35.8 | % | $ | 956 | 10.0 | % | $ | 2,464 | $ | 3,257 | 36.7 | % | $ | 888 | 10.0 | % | $ | 2,369 | ||||||||||||||||||||||||||||||||||||||||||||||||||||||||||||||||||||||||||||||||||||||||||||||||
E*TRADE Savings Bank(1) | ||||||||||||||||||||||||||||||||||||||||||||||||||||||||||||||||||||||||||||||||||||||||||||||||||||||||||||||||||||
| Tier 1 leverage | $ | 1,492 | 38.5 | % | $ | 193 | 5.0 | % | $ | 1,299 | $ | 1,480 | 40.7 | % | $ | 182 | 5.0 | % | $ | 1,298 | ||||||||||||||||||||||||||||||||||||||||||||||||||||||||||||||||||||||||||||||||||||||||||||||||
| Common Equity Tier 1 | $ | 1,492 | 200.4 | % | $ | 48 | 6.5 | % | $ | 1,444 | $ | 1,480 | 224.7 | % | $ | 43 | 6.5 | % | $ | 1,437 | ||||||||||||||||||||||||||||||||||||||||||||||||||||||||||||||||||||||||||||||||||||||||||||||||
| Tier 1 risk-based | $ | 1,492 | 200.4 | % | $ | 59 | 8.0 | % | $ | 1,433 | $ | 1,480 | 224.7 | % | $ | 53 | 8.0 | % | $ | 1,427 | ||||||||||||||||||||||||||||||||||||||||||||||||||||||||||||||||||||||||||||||||||||||||||||||||
| Total risk-based | $ | 1,492 | 200.4 | % | $ | 74 | 10.0 | % | $ | 1,418 | $ | 1,480 | 224.7 | % | $ | 66 | 10.0 | % | $ | 1,414 | ||||||||||||||||||||||||||||||||||||||||||||||||||||||||||||||||||||||||||||||||||||||||||||||||
| March 31, 2019 | December 31, 2018 | ||||||||||||||||||||||||||||||||||
| Actual | Well Capitalized Minimum Capital | Excess Capital | Actual | Well Capitalized Minimum Capital | Excess Capital | ||||||||||||||||||||||||||||||
| Amount | Ratio | Amount | Ratio | Amount | Amount | Ratio | Amount | Ratio | Amount | ||||||||||||||||||||||||||
E*TRADE Financial(1) | |||||||||||||||||||||||||||||||||||
| Tier 1 leverage | $ | 4,267 | 6.7 | % | $ | 3,180 | 5.0 | % | $ | 1,087 | $ | 4,097 | 6.6 | % | $ | 3,101 | 5.0 | % | $ | 996 | |||||||||||||||
| Common Equity Tier 1 | $ | 3,578 | 30.1 | % | $ | 773 | 6.5 | % | $ | 2,805 | $ | 3,408 | 31.1 | % | $ | 713 | 6.5 | % | $ | 2,695 | |||||||||||||||
| Tier 1 risk-based | $ | 4,267 | 35.9 | % | $ | 951 | 8.0 | % | $ | 3,316 | $ | 4,097 | 37.3 | % | $ | 877 | 8.0 | % | $ | 3,220 | |||||||||||||||
| Total risk-based | $ | 4,309 | 36.3 | % | $ | 1,189 | 10.0 | % | $ | 3,120 | $ | 4,143 | 37.8 | % | $ | 1,097 | 10.0 | % | $ | 3,046 | |||||||||||||||
E*TRADE Bank(1) | |||||||||||||||||||||||||||||||||||
| Tier 1 leverage | $ | 3,640 | 7.1 | % | $ | 2,563 | 5.0 | % | $ | 1,077 | $ | 3,484 | 7.1 | % | $ | 2,461 | 5.0 | % | $ | 1,023 | |||||||||||||||
| Common Equity Tier 1 | $ | 3,640 | 33.9 | % | $ | 699 | 6.5 | % | $ | 2,941 | $ | 3,484 | 34.9 | % | $ | 650 | 6.5 | % | $ | 2,834 | |||||||||||||||
| Tier 1 risk-based | $ | 3,640 | 33.9 | % | $ | 860 | 8.0 | % | $ | 2,780 | $ | 3,484 | 34.9 | % | $ | 800 | 8.0 | % | $ | 2,684 | |||||||||||||||
| Total risk-based | $ | 3,672 | 34.2 | % | $ | 1,075 | 10.0 | % | $ | 2,597 | $ | 3,521 | 35.2 | % | $ | 999 | 10.0 | % | $ | 2,522 | |||||||||||||||
E*TRADE Savings Bank(1) | |||||||||||||||||||||||||||||||||||
| Tier 1 leverage | $ | 1,469 | 27.1 | % | $ | 272 | 5.0 | % | $ | 1,197 | $ | 1,456 | 26.6 | % | $ | 273 | 5.0 | % | $ | 1,183 | |||||||||||||||
| Common Equity Tier 1 | $ | 1,469 | 180.2 | % | $ | 53 | 6.5 | % | $ | 1,416 | $ | 1,456 | 169.4 | % | $ | 56 | 6.5 | % | $ | 1,400 | |||||||||||||||
| Tier 1 risk-based | $ | 1,469 | 180.2 | % | $ | 65 | 8.0 | % | $ | 1,404 | $ | 1,456 | 169.4 | % | $ | 69 | 8.0 | % | $ | 1,387 | |||||||||||||||
| Total risk-based | $ | 1,470 | 180.3 | % | $ | 82 | 10.0 | % | $ | 1,388 | $ | 1,456 | 169.4 | % | $ | 86 | 10.0 | % | $ | 1,370 | |||||||||||||||
| NOTE 14—COMMITMENTS, CONTINGENCIES AND OTHER REGULATORY MATTERS |
| Period | Total Number of Shares Purchased(1) | Average Price Paid per Share(1)(2) | Total Number of Shares Purchased as Part of the Publicly Announced Programs(3) | Maximum Dollar Value of Shares That May Yet Be Purchased Under the Programs(3) | ||||||||||||||||||||||
| January 1, 2020 - January 31, 2020 | 118 | $ | 46.60 | — | $ | 914 | ||||||||||||||||||||
| February 1, 2020 - February 29, 2020 | 2,426,944 | $ | 44.23 | 2,143,595 | $ | 820 | ||||||||||||||||||||
| March 1, 2020 - March 31, 2020 | 7,553 | $ | 36.78 | — | $ | 820 | ||||||||||||||||||||
| Total | 2,434,615 | $ | 44.21 | 2,143,595 | ||||||||||||||||||||||
| Period | Total Number of Shares Purchased(1) | Average Price Paid per Share(2) | Total Number of Shares Purchased as Part of the Publicly Announced Programs(3) | Maximum Dollar Value of Shares That May Yet Be Purchased Under the Program(3) | ||||||||||
| January 1, 2019 - January 31, 2019 | 1,385 | $ | 43.80 | — | $ | 499 | ||||||||
| February 1, 2019 - February 28, 2019 | 1,697,634 | $ | 48.05 | 1,369,100 | $ | 434 | ||||||||
| March 1, 2019 - March 31, 2019 | 1,141,320 | $ | 48.54 | 1,128,800 | $ | 379 | ||||||||
| Total | 2,840,339 | $ | 48.24 | 2,497,900 | ||||||||||
| Exhibit Number | Description | ||||||||||
| Certification of Chief Executive Officer pursuant to Section 302 of the Sarbanes-Oxley Act of 2002. | |||||||||||
| Certification of Chief Financial Officer pursuant to Section 302 of the Sarbanes-Oxley Act of 2002. | |||||||||||
| Certification of Chief Executive Officer and Chief Financial Officer pursuant to Section 906 of the Sarbanes-Oxley Act of 2002. | |||||||||||
| **101.INS | XBRL Instance Document | ||||||||||
| **101.SCH | Inline XBRL Taxonomy Extension Schema Document | ||||||||||
| **101.CAL | Inline XBRL Taxonomy Extension Calculation Linkbase Document | ||||||||||
| **101.DEF | Inline XBRL Taxonomy Extension Definition Linkbase Document | ||||||||||
| **101.LAB | Inline XBRL Taxonomy Extension Label Linkbase Document | ||||||||||
| **101.PRE | Inline XBRL Taxonomy Extension Presentation Linkbase Document | ||||||||||
| **104 | Cover Page Interactive Data File (formatted as Inline XBRL and contained in Exhibit 101) | ||||||||||
| * | The schedules and exhibits have been omitted pursuant to Item 601(b)(2) of Regulation S-K. The Company agrees to furnish supplementally a copy of such exhibits, or any section thereof, to the SEC upon request. | ||||||||||||||||
| ** | Filed herewith. | ||||||||||||||||
E*TRADE Financial Corporation (Registrant) | |||||||||||
| By | /S/ | ||||||||||
| Chief Executive Officer | |||||||||||
| (Principal Executive Officer) | |||||||||||
| By | /S/ CHAD E. TURNER | ||||||||||
| Chad E. Turner | |||||||||||
| Chief Financial Officer | |||||||||||
| (Principal Financial Officer) | |||||||||||
| By | /S/ | ||||||||||
| Corporate Controller | |||||||||||
| (Principal Accounting Officer) | |||||||||||