UNITED STATES SECURITIES AND EXCHANGE COMMISSION
WASHINGTON, D. C. 20549
FORM 10-Q
| | | | | |
☒ | QUARTERLY REPORT PURSUANT TO SECTION 13 OR 15(d) OF THE SECURITIES EXCHANGE ACT OF 1934 |
For the quarterly period ended March 31, 20232024
OR
| | | | | |
☐ | TRANSITION REPORT PURSUANT TO SECTION 13 OR 15(d) OF THE SECURITIES EXCHANGE ACT OF 1934 |
Commission file number: 001-14733
Lithia Motors, Inc.
(Exact name of registrant as specified in its charter)
| | | | | | | | | | | |
| Oregon | | 93-0572810 |
| (State or other jurisdiction of incorporation or organization) | | (I.R.S. Employer Identification No.) |
| 150 N. Bartlett Street | Medford, | Oregon | 97501 |
| (Address of principal executive offices) | (Zip Code) |
(541) 776-6401
Registrant’s telephone number, including area code
Securities registered pursuant to Section 12(b) of the Act:
| | | | | | | | | | | | | | |
| Title of each class | | Trading Symbol(s) | | Name of each exchange on which registered |
| Common stock without par value | | LAD | | The New York Stock Exchange |
Indicate by check mark whether the registrant (1) has filed all reports required to be filed by Section 13 or 15(d) of the Securities Exchange Act of 1934 during the preceding 12 months (or for such shorter period that the registrant was required to file such reports), and (2) has been subject to such filing requirements for the past 90 days. Yes ☒ No ☐
Indicate by check mark whether the registrant has submitted electronically every Interactive Data File required to be submitted pursuant to Rule 405 of Regulation S-T (§232.405 of this chapter) during the preceding 12 months (or for such shorter period that the registrant was required to submit such files). Yes ☒ No ☐
Indicate by check mark whether the registrant is a large accelerated filer, an accelerated filer, a non-accelerated filer, smaller reporting company, or an emerging growth company. See the definitions of “large accelerated filer,” “accelerated filer” and “smaller reporting company,” and “emerging growth company” in Rule 12b-2 of the Exchange Act.
| | | | | | | | | | | | | | |
| Large accelerated filer | Non-accelerated filer | Accelerated filer | Smaller reporting company | Emerging growth company |
| ☒ | ☐ | ☐ | ☐ | ☐ |
If an emerging growth company, indicate by check mark if the registrant has elected not to use the extended transition period for complying with any new or revised financial accounting standards provided pursuant to Section 13(a) of the Exchange Act. ☐
Indicate by check mark whether the registrant is a shell company (as defined in Rule 12b-2 of the Exchange Act). Yes ☐ No ☒
As of April 28, 2023,26, 2024, there were 27,527,76727,406,486 shares of the registrant’s common stock outstanding.
LITHIA MOTORS, INC.
FORM 10-Q QUARTERLY REPORT
TABLE OF CONTENTS
| | | | | | | | |
| Item Number | Item | Page |
| PART I | FINANCIAL INFORMATION | |
| | |
| Item 1. | | |
| | |
| | |
| | |
| | |
| | |
| | |
| | |
| Item 2. | | |
| Item 3. | | |
| Item 4. | | |
| | |
| PART II | OTHER INFORMATION | |
| | |
| Item 1. | Legal Proceedings | |
| Item 1A. | | |
| Item 2. | | |
| Item 5. | Other Information | |
| | |
| | |
| Item 6. | | |
| | |
| SIGNATURE | | |
| | CONSOLIDATED BALANCE SHEETS | CONSOLIDATED BALANCE SHEETS | CONSOLIDATED BALANCE SHEETS |
| (In millions; Unaudited) | (In millions; Unaudited) | March 31, 2023 | | December 31, 2022 | (In millions; Unaudited) | March 31, 2024 | | December 31, 2023 |
| Assets | Assets | | | | Assets | | | |
| Current assets: | Current assets: | | | | Current assets: | | | |
| Cash and restricted cash | $ | 299.4 | | | $ | 246.7 | |
| Accounts receivable, net of allowance for doubtful accounts of $3.1 and $3.1 | 843.1 | | | 813.1 | |
| Cash, restricted cash, and cash equivalents | |
| Accounts receivable, net of allowance for doubtful accounts of $3.3 and $7.1 | |
| Inventories, net | Inventories, net | 3,855.6 | | | 3,409.4 | |
| | Other current assets | Other current assets | 149.6 | | | 161.7 | |
| | Other current assets | |
| Other current assets | |
| Total current assets | Total current assets | 5,147.7 | | | 4,630.9 | |
| | Property and equipment, net of accumulated depreciation of $618.9 and $526.8 | 3,719.7 | | | 3,574.6 | |
| Property and equipment, net of accumulated depreciation of $688.1 and $646.7 | |
| Property and equipment, net of accumulated depreciation of $688.1 and $646.7 | |
| Property and equipment, net of accumulated depreciation of $688.1 and $646.7 | |
| Operating lease right-of-use assets | Operating lease right-of-use assets | 473.9 | | | 381.9 | |
| Finance receivables, net of allowance for estimated losses of $82.2 and $69.3 | 2,584.8 | | | 2,187.6 | |
| Finance receivables, net of allowance for estimated losses of $111.8 and $106.4 | |
| Goodwill | Goodwill | 1,516.2 | | | 1,460.7 | |
| Franchise value | Franchise value | 1,929.0 | | | 1,856.2 | |
| | Other non-current assets | Other non-current assets | 1,050.1 | | | 914.7 | |
| Total assets | Total assets | $ | 16,421.4 | | | $ | 15,006.6 | |
| | Liabilities and equity | |
| Liabilities and equity | |
| Liabilities and equity | Liabilities and equity | | | | | | |
| Current liabilities: | Current liabilities: | | | | Current liabilities: | | | |
| Floor plan notes payable | Floor plan notes payable | $ | 999.3 | | | $ | 627.2 | |
| Floor plan notes payable: non-trade | Floor plan notes payable: non-trade | 1,664.9 | | | 1,489.4 | |
| Current maturities of long-term debt | Current maturities of long-term debt | 35.9 | | | 20.5 | |
| Current maturities of non-recourse notes payable | Current maturities of non-recourse notes payable | 46.2 | | | — | |
| Trade payables | Trade payables | 320.0 | | | 258.4 | |
| Accrued liabilities | Accrued liabilities | 881.7 | | | 782.7 | |
| | Total current liabilities | |
| Total current liabilities | |
| Total current liabilities | Total current liabilities | 3,948.0 | | | 3,178.2 | |
| | Long-term debt, less current maturities | |
| Long-term debt, less current maturities | |
| Long-term debt, less current maturities | Long-term debt, less current maturities | 5,066.0 | | | 5,088.3 | |
| Non-recourse notes payable, less current maturities | Non-recourse notes payable, less current maturities | 779.2 | | | 422.2 | |
| Deferred revenue | Deferred revenue | 234.0 | | | 226.7 | |
| Deferred income taxes | Deferred income taxes | 290.6 | | | 286.3 | |
| Non-current operating lease liabilities | Non-current operating lease liabilities | 427.7 | | | 346.6 | |
| Other long-term liabilities | Other long-term liabilities | 194.1 | | | 207.2 | |
| Total liabilities | Total liabilities | 10,939.6 | | | 9,755.5 | |
| | Redeemable non-controlling interest | Redeemable non-controlling interest | 40.9 | | | 40.7 | |
| Redeemable non-controlling interest | |
| Redeemable non-controlling interest | |
| | Equity: | Equity: | | | |
| Equity: | |
| Equity: | | | | |
| Preferred stock - no par value; authorized 15.0 shares; none outstanding | Preferred stock - no par value; authorized 15.0 shares; none outstanding | — | | | — | |
| Common stock - no par value; authorized 125.0 shares; issued and outstanding 27.5 and 27.3 | 1,105.5 | | | 1,082.1 | |
| Common stock - no par value; authorized 125.0 shares; issued and outstanding 27.5 and 27.4 | |
| | Additional paid-in capital | Additional paid-in capital | 54.2 | | | 76.8 | |
| Accumulated other comprehensive loss | (4.9) | | | (18.0) | |
| Additional paid-in capital | |
| Additional paid-in capital | |
| Accumulated other comprehensive income | |
| Retained earnings | Retained earnings | 4,282.5 | | | 4,065.3 | |
| Total stockholders’ equity - Lithia Motors, Inc. | Total stockholders’ equity - Lithia Motors, Inc. | 5,437.3 | | | 5,206.2 | |
| Non-controlling interest | Non-controlling interest | 3.6 | | | 4.2 | |
| Total equity | Total equity | 5,440.9 | | | 5,210.4 | |
| Total liabilities, redeemable non-controlling interest and equity | $ | 16,421.4 | | | $ | 15,006.6 | |
| Total liabilities, redeemable non-controlling interest, and equity | |
See accompanying condensed notes to consolidated financial statements.
| | CONSOLIDATED STATEMENTS OF OPERATIONS | |
| CONSOLIDATED STATEMENTS OF OPERATIONS | |
CONSOLIDATED STATEMENTS OF OPERATIONS | | | | | Three Months Ended March 31, | | | | Three Months Ended March 31, |
| (In millions, except per share amounts; Unaudited) | (In millions, except per share amounts; Unaudited) | | 2023 | | 2022 | (In millions, except per share amounts; Unaudited) | | | | | 2024 | | 2023 |
| Revenues: | Revenues: | | | | | Revenues: | | | | | | | |
| New vehicle retail | New vehicle retail | | $ | 3,278.9 | | | $ | 3,061.8 | |
| Used vehicle retail | Used vehicle retail | | 2,227.5 | | | 2,234.5 | |
| Used vehicle wholesale | Used vehicle wholesale | | 356.7 | | | 385.8 | |
| Finance and insurance | Finance and insurance | | 318.3 | | | 313.2 | |
| Service, body and parts | Service, body and parts | | 736.3 | | | 627.8 | |
| Fleet and other | Fleet and other | | 56.1 | | | 82.2 | |
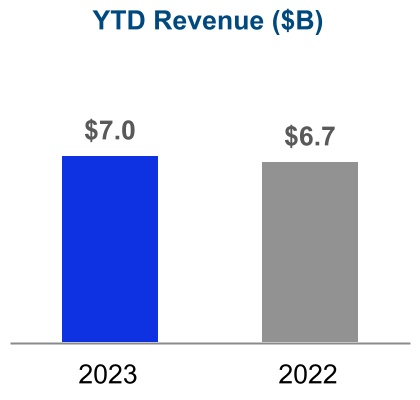
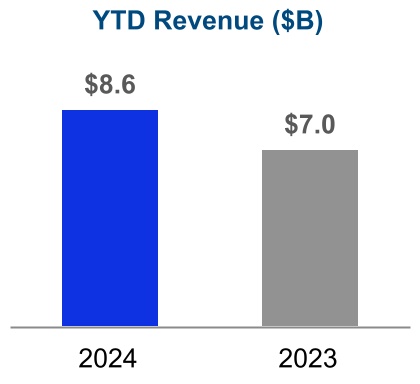
| Total revenues | Total revenues | | 6,973.8 | | | 6,705.3 | |
| Cost of sales: | Cost of sales: | | | | | Cost of sales: | | | | | | | |
| New vehicle retail | New vehicle retail | | 2,945.1 | | | 2,660.5 | |
| Used vehicle retail | Used vehicle retail | | 2,061.8 | | | 2,010.7 | |
| Used vehicle wholesale | Used vehicle wholesale | | 359.5 | | | 378.1 | |
| Service, body and parts | Service, body and parts | | 341.9 | | | 298.8 | |
| Fleet and other | Fleet and other | | 54.0 | | | 79.1 | |
| Total cost of sales | Total cost of sales | | 5,762.3 | | | 5,427.2 | |
| Gross profit | Gross profit | | 1,211.5 | | | 1,278.1 | |
| | Financing operations (loss) income | | (20.8) | | | 5.0 | |
| Financing operations loss | |
| Financing operations loss | |
| Financing operations loss | |
| | | Selling, general and administrative | |
| | Selling, general and administrative | |
| | Selling, general and administrative | Selling, general and administrative | | 764.4 | | | 739.9 | |
| Depreciation and amortization | Depreciation and amortization | | 47.3 | | | 36.5 | |
| Operating income | Operating income | | 379.0 | | | 506.7 | |
| Floor plan interest expense | Floor plan interest expense | | (27.7) | | | (4.9) | |
| Other interest expense, net | Other interest expense, net | | (39.0) | | | (26.2) | |
| Other income (expense), net | | 2.0 | | | (5.8) | |
| Other income, net | |
| Income before income taxes | Income before income taxes | | 314.3 | | | 469.8 | |
| Income tax provision | Income tax provision | | (84.7) | | | (126.2) | |
| Net income | Net income | | 229.6 | | | 343.6 | |
| Net income attributable to non-controlling interest | Net income attributable to non-controlling interest | | (0.7) | | | (0.5) | |
| Net income attributable to redeemable non-controlling interest | Net income attributable to redeemable non-controlling interest | | (0.2) | | | (0.9) | |
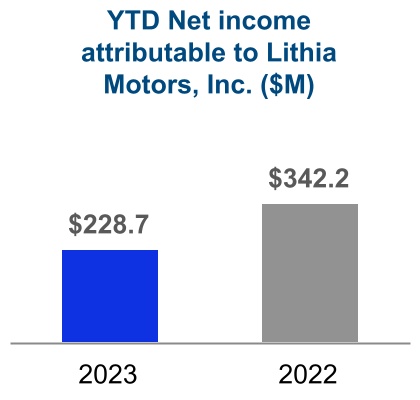
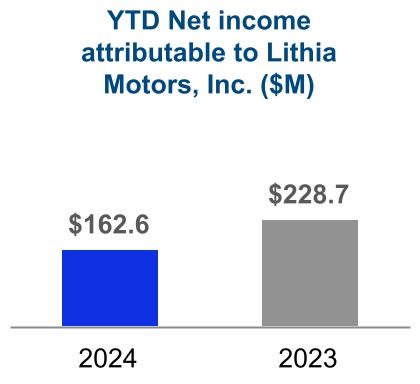
| Net income attributable to Lithia Motors, Inc. | Net income attributable to Lithia Motors, Inc. | | $ | 228.7 | | | $ | 342.2 | |
| | Basic earnings per share attributable to Lithia Motors, Inc. | Basic earnings per share attributable to Lithia Motors, Inc. | | $ | 8.32 | | | $ | 11.59 | |
| Basic earnings per share attributable to Lithia Motors, Inc. | |
| Basic earnings per share attributable to Lithia Motors, Inc. | |
| Shares used in basic per share calculations | Shares used in basic per share calculations | | 27.5 | | | 29.5 | |
| | Diluted earnings per share attributable to Lithia Motors, Inc. | |
| Diluted earnings per share attributable to Lithia Motors, Inc. | |
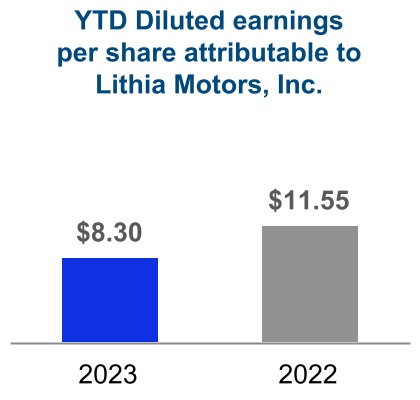
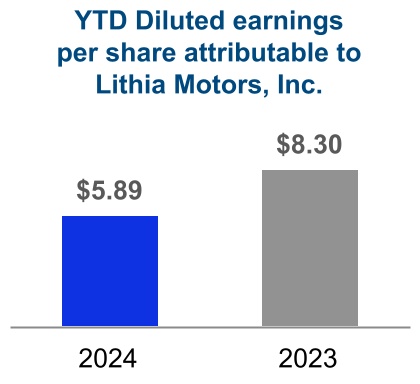
| Diluted earnings per share attributable to Lithia Motors, Inc. | Diluted earnings per share attributable to Lithia Motors, Inc. | | $ | 8.30 | | | $ | 11.55 | |
| Shares used in diluted per share calculations | Shares used in diluted per share calculations | | 27.5 | | | 29.6 | |
| | Cash dividends paid per share | Cash dividends paid per share | | $ | 0.42 | | | $ | 0.35 | |
| Cash dividends paid per share | |
| Cash dividends paid per share | |
See accompanying condensed notes to consolidated financial statements.
| | CONSOLIDATED STATEMENTS OF COMPREHENSIVE INCOME | |
| CONSOLIDATED STATEMENTS OF COMPREHENSIVE INCOME | |
CONSOLIDATED STATEMENTS OF COMPREHENSIVE INCOME | | | | | Three Months Ended March 31, | | | | Three Months Ended March 31, |
| (In millions; Unaudited) | (In millions; Unaudited) | | 2023 | | 2022 | (In millions; Unaudited) | | | | | 2024 | | 2023 |
| Net income | Net income | | $ | 229.6 | | | $ | 343.6 | |
| Other comprehensive income, net of tax: | | |
| Other comprehensive (loss) income, net of tax: | |
| Foreign currency translation adjustment | Foreign currency translation adjustment | | 13.1 | | | 4.0 | |
| Gain on cash flow hedges, net of tax expense of none and ($1.4) respectively | | — | | | 3.9 | |
| Total other comprehensive income, net of tax | | 13.1 | | | 7.9 | |
| Foreign currency translation adjustment | |
| Foreign currency translation adjustment | |
| | Unrealized loss on debt securities, net of tax benefit of $0.1 and $0.0 | |
| Unrealized loss on debt securities, net of tax benefit of $0.1 and $0.0 | |
| Unrealized loss on debt securities, net of tax benefit of $0.1 and $0.0 | |
| | Total other comprehensive (loss) income, net of tax | |
| Total other comprehensive (loss) income, net of tax | |
| Total other comprehensive (loss) income, net of tax | |
| Comprehensive income | Comprehensive income | | 242.7 | | | 351.5 | |
| | Comprehensive income attributable to non-controlling interest | Comprehensive income attributable to non-controlling interest | | (0.7) | | | (0.5) | |
| Comprehensive income attributable to non-controlling interest | |
| Comprehensive income attributable to non-controlling interest | |
| Comprehensive income attributable to redeemable non-controlling interest | Comprehensive income attributable to redeemable non-controlling interest | | (0.2) | | | (0.9) | |
| Comprehensive income attributable to Lithia Motors, Inc. | Comprehensive income attributable to Lithia Motors, Inc. | | $ | 241.8 | | | $ | 350.1 | |
See accompanying condensed notes to consolidated financial statements.
| CONSOLIDATED STATEMENTS OF EQUITY AND REDEEMABLE NON-CONTROLLING INTEREST | | | Three Months Ended March 31, |
| CONSOLIDATED STATEMENTS OF EQUITY AND REDEEMABLE NON-CONTROLLING INTEREST | |
| CONSOLIDATED STATEMENTS OF EQUITY AND REDEEMABLE NON-CONTROLLING INTEREST | |
| | | Three Months Ended March 31, | | | | | Three Months Ended March 31, |
| (In millions; Unaudited) | (In millions; Unaudited) | | 2023 | | 2022 | (In millions; Unaudited) | | | | | 2024 | | 2023 |
| Total equity, beginning balances | Total equity, beginning balances | | $ | 5,210.4 | | | $ | 4,629.2 | |
| | Common stock, beginning balances | Common stock, beginning balances | | 1,082.1 | | | 1,711.6 | |
| Stock-based compensation expense | | 31.7 | | | 17.0 | |
| Common stock, beginning balances | |
| Common stock, beginning balances | |
| Stock-based compensation | |
| Issuance of stock in connection with employee stock purchase plans | Issuance of stock in connection with employee stock purchase plans | | 6.1 | | | 7.8 | |
| | Repurchase of common stock | |
| Repurchase of common stock | |
| Repurchase of common stock | Repurchase of common stock | | (14.4) | | | (80.1) | |
| | Common stock, ending balances | Common stock, ending balances | | 1,105.5 | | | 1,656.3 | |
| | | Common stock, ending balances | |
| Common stock, ending balances | |
| | Additional paid-in capital, beginning balances | Additional paid-in capital, beginning balances | | 76.8 | | | 58.3 | |
| Stock-based compensation expense | | (22.6) | | | (6.5) | |
| Additional paid-in capital, beginning balances | |
| Additional paid-in capital, beginning balances | |
| Stock-based compensation | |
| | Additional paid-in capital, ending balances | Additional paid-in capital, ending balances | | 54.2 | | | 51.8 | |
| | Accumulated other comprehensive loss, beginning balances | | (18.0) | | | (3.0) | |
| Additional paid-in capital, ending balances | |
| | Additional paid-in capital, ending balances | |
| | Accumulated other comprehensive income (loss), beginning balances | |
| Accumulated other comprehensive income (loss), beginning balances | |
| Accumulated other comprehensive income (loss), beginning balances | |
| Foreign currency translation adjustment | Foreign currency translation adjustment | | 13.1 | | | 4.0 | |
| Gain on cash flow hedges, net of tax expense of none and ($1.4), respectively | | — | | | 3.9 | |
| Accumulated other comprehensive (loss) income, ending balances | | (4.9) | | | 4.9 | |
| | Unrealized loss on debt securities, net of tax benefit of $0.1 and $0.0 | |
| Unrealized loss on debt securities, net of tax benefit of $0.1 and $0.0 | |
| Unrealized loss on debt securities, net of tax benefit of $0.1 and $0.0 | |
| | Accumulated other comprehensive income (loss), ending balances | |
| Accumulated other comprehensive income (loss), ending balances | |
| Accumulated other comprehensive income (loss), ending balances | |
| | Retained earnings, beginning balances | Retained earnings, beginning balances | | 4,065.3 | | | 2,859.5 | |
| Retained earnings, beginning balances | |
| Retained earnings, beginning balances | |
| | Net income attributable to Lithia Motors, Inc. | |
| Net income attributable to Lithia Motors, Inc. | |
| Net income attributable to Lithia Motors, Inc. | Net income attributable to Lithia Motors, Inc. | | 228.7 | | | 342.2 | |
| Dividends paid | Dividends paid | | (11.5) | | | (10.3) | |
| | Retained earnings, ending balances | Retained earnings, ending balances | | 4,282.5 | | | 3,191.4 | |
| Retained earnings, ending balances | |
| Retained earnings, ending balances | |
| | Non-controlling interest, beginning balances | |
| Non-controlling interest, beginning balances | |
| Non-controlling interest, beginning balances | Non-controlling interest, beginning balances | | 4.2 | | | 2.8 | |
| Distribution of non-controlling interest | Distribution of non-controlling interest | | (1.3) | | | — | |
| Net income attributable to non-controlling interest | Net income attributable to non-controlling interest | | 0.7 | | | 0.5 | |
| Non-controlling interest, ending balances | Non-controlling interest, ending balances | | 3.6 | | | 3.3 | |
| | Total equity, ending balances | Total equity, ending balances | | $ | 5,440.9 | | | $ | 4,907.7 | |
| Total equity, ending balances | |
| Total equity, ending balances | |
| | Redeemable non-controlling interest, beginning balances | |
| Redeemable non-controlling interest, beginning balances | |
| Redeemable non-controlling interest, beginning balances | Redeemable non-controlling interest, beginning balances | | $ | 40.7 | | | $ | 34.0 | |
| | Net income attributable to redeemable non-controlling interest | Net income attributable to redeemable non-controlling interest | | 0.2 | | | 0.9 | |
| Net income attributable to redeemable non-controlling interest | |
| Net income attributable to redeemable non-controlling interest | |
| Redeemable non-controlling interest, ending balances | Redeemable non-controlling interest, ending balances | | $ | 40.9 | | | $ | 34.9 | |
See accompanying condensed notes to consolidated financial statements.
| | CONSOLIDATED STATEMENTS OF CASH FLOWS | CONSOLIDATED STATEMENTS OF CASH FLOWS | CONSOLIDATED STATEMENTS OF CASH FLOWS |
| | | Three Months Ended March 31, | | Three Months Ended March 31, |
| (In millions; Unaudited) | (In millions; Unaudited) | 2023 | | 2022 | (In millions; Unaudited) | 2024 | | 2023 |
| Cash flows from operating activities: | Cash flows from operating activities: | | | | Cash flows from operating activities: | | | |
| Net income | Net income | $ | 229.6 | | | $ | 343.6 | |
| Adjustments to reconcile net income to net cash used for operating activities: | | |
| Adjustments to reconcile net income to net cash provided by (used in) operating activities: | |
| | Depreciation and amortization | |
| | Depreciation and amortization | |
| | Depreciation and amortization | Depreciation and amortization | 49.6 | | | 39.2 | |
| Stock-based compensation | Stock-based compensation | 9.1 | | | 10.5 | |
| | Loss on disposal of other assets | 0.1 | | | 0.9 | |
| Gain on disposal of franchise | (7.2) | | | (10.0) | |
| Unrealized investment loss | 0.5 | | | 14.9 | |
| (Gain) loss on disposal of other assets | |
| (Gain) loss on disposal of other assets | |
| (Gain) loss on disposal of other assets | |
| Loss (gain) on sales of stores | |
| Unrealized investment (gain) loss | |
| Deferred income taxes | Deferred income taxes | 14.5 | | | 11.3 | |
| Amortization of operating lease right-of-use assets | Amortization of operating lease right-of-use assets | 15.7 | | | 3.6 | |
| (Increase) decrease (net of acquisitions and dispositions): | (Increase) decrease (net of acquisitions and dispositions): | |
| Accounts receivable, net | |
| Accounts receivable, net | |
| Accounts receivable, net | Accounts receivable, net | 23.9 | | | (80.4) | |
| Inventories | Inventories | (56.9) | | | (244.9) | |
| Finance receivables | Finance receivables | (397.0) | | | (201.4) | |
| Other assets | Other assets | 14.1 | | | (55.2) | |
| Increase (decrease) (net of acquisitions and dispositions): | Increase (decrease) (net of acquisitions and dispositions): | |
| Floor plan notes payable | Floor plan notes payable | 38.9 | | | 33.7 | |
| Floor plan notes payable | |
| Floor plan notes payable | |
| Trade payables | Trade payables | (10.0) | | | 26.0 | |
| Accrued liabilities | Accrued liabilities | 31.7 | | | 111.6 | |
| Other long-term liabilities and deferred revenue | Other long-term liabilities and deferred revenue | (5.6) | | | 22.9 | |
| Net cash (used in) provided by operating activities | (49.0) | | | 26.3 | |
| Net cash provided by (used in) operating activities | |
| Cash flows from investing activities: | Cash flows from investing activities: | | | | Cash flows from investing activities: | | | |
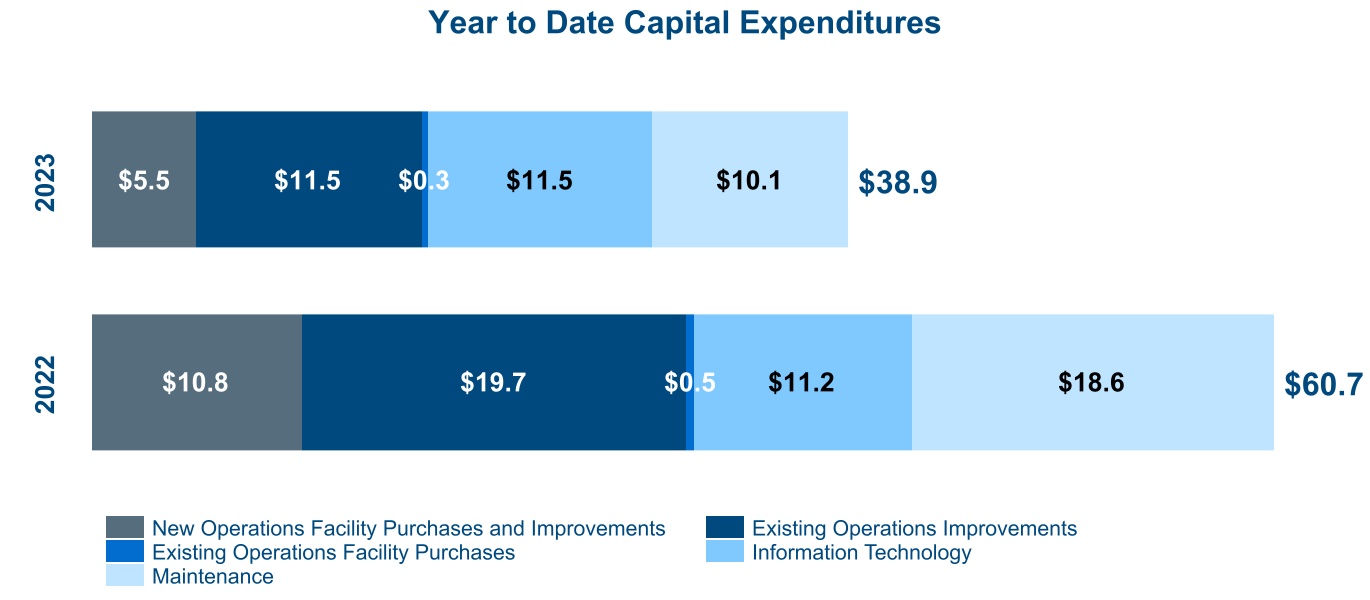
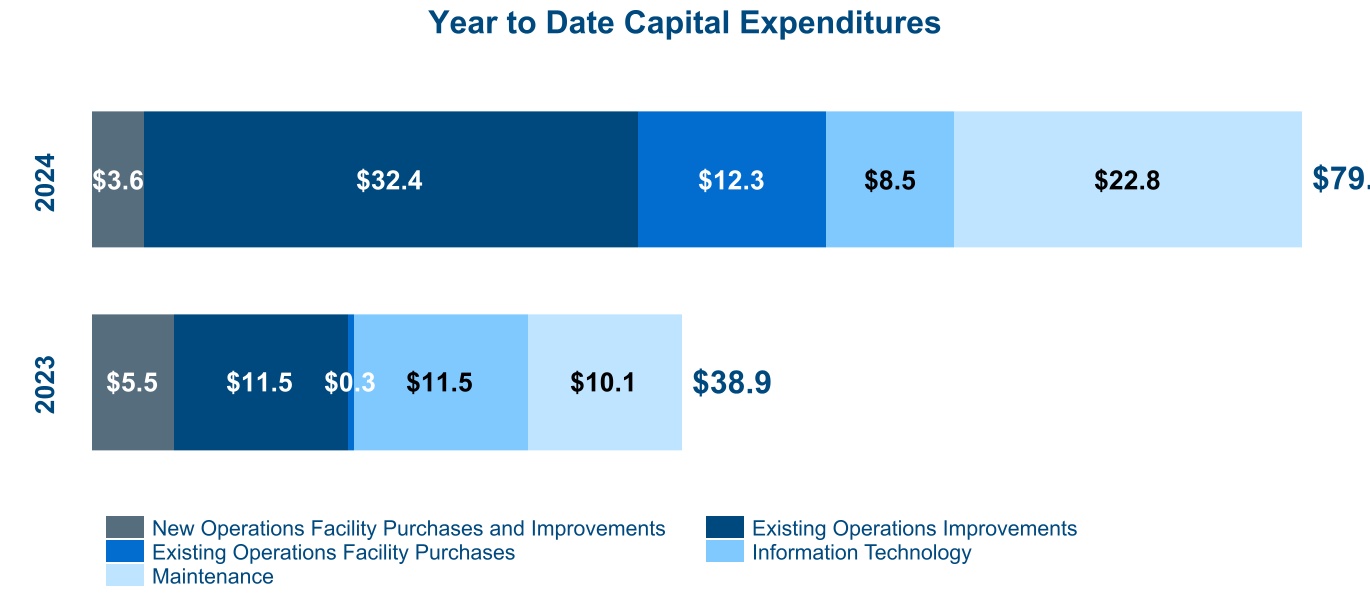
| | | Capital expenditures | |
| | Capital expenditures | |
| | Capital expenditures | Capital expenditures | (38.9) | | | (60.7) | |
| Proceeds from sales of assets | Proceeds from sales of assets | 0.8 | | | 6.8 | |
| Cash paid for other investments | Cash paid for other investments | (11.1) | | | (9.8) | |
| Cash paid for acquisitions, net of cash acquired | Cash paid for acquisitions, net of cash acquired | (387.4) | | | (326.5) | |
| Proceeds from sales of stores | Proceeds from sales of stores | 22.7 | | | 32.9 | |
| Net cash used in investing activities | Net cash used in investing activities | (413.9) | | | (357.3) | |
| Cash flows from financing activities: | Cash flows from financing activities: | | | | Cash flows from financing activities: | | | |
| Borrowings on floor plan notes payable, net: non-trade | Borrowings on floor plan notes payable, net: non-trade | 187.6 | | | 177.1 | |
| Borrowings on lines of credit | Borrowings on lines of credit | 3,462.9 | | | 2,295.0 | |
| Repayments on lines of credit | Repayments on lines of credit | (3,503.3) | | | (2,029.8) | |
| Principal payments on long-term debt and finance lease liabilities, scheduled | Principal payments on long-term debt and finance lease liabilities, scheduled | (8.7) | | | (23.6) | |
| Principal payments on long-term debt and finance lease liabilities, other | Principal payments on long-term debt and finance lease liabilities, other | (3.4) | | | (12.5) | |
| Proceeds from issuance of long-term debt | Proceeds from issuance of long-term debt | 10.4 | | | 16.2 | |
| Principal payments on non-recourse notes payable | Principal payments on non-recourse notes payable | (76.5) | | | (39.3) | |
| Proceeds from issuance of non-recourse notes payable | Proceeds from issuance of non-recourse notes payable | 479.7 | | | — | |
| Payment of debt issuance costs | Payment of debt issuance costs | (3.7) | | | — | |
| Proceeds from issuance of common stock | Proceeds from issuance of common stock | 6.1 | | | 7.8 | |
| Repurchase of common stock | Repurchase of common stock | (14.4) | | | (60.9) | |
| Dividends paid | Dividends paid | (11.5) | | | (10.3) | |
| Payment of contingent consideration related to acquisitions | Payment of contingent consideration related to acquisitions | (14.0) | | | (3.7) | |
| Other financing activity | Other financing activity | (1.3) | | | — | |
| Net cash provided by financing activities | Net cash provided by financing activities | 509.9 | | | 316.0 | |
| Effect of exchange rate changes on cash and restricted cash | 6.2 | | | 1.7 | |
| Increase (decrease) in cash and restricted cash | 53.2 | | | (13.3) | |
| Cash and restricted cash at beginning of year | 271.5 | | | 178.5 | |
| Cash and restricted cash at end of period | $ | 324.7 | | | $ | 165.2 | |
| Effect of exchange rate changes on cash, restricted cash, and cash equivalents | |
| (Decrease) increase in cash, restricted cash, and cash equivalents | |
| Cash, restricted cash, and cash equivalents at beginning of year | |
| Cash, restricted cash, and cash equivalents at end of period | |
See accompanying condensed notes to consolidated financial statements.
| | SUPPLEMENTAL DISCLOSURES OF CASH FLOW INFORMATION | SUPPLEMENTAL DISCLOSURES OF CASH FLOW INFORMATION | SUPPLEMENTAL DISCLOSURES OF CASH FLOW INFORMATION |
| Three Months Ended March 31, |
| Three Months Ended March 31, | | | Three Months Ended March 31, |
| (In millions) | (In millions) | 2023 | | 2022 | (In millions) | 2024 | | 2023 |
Reconciliation of cash and restricted cash to the consolidated balance sheets | | Cash | $ | 184.9 | | | $ | 131.6 | |
| Reconciliation of cash, restricted cash, and cash equivalents to the consolidated balance sheets | | Reconciliation of cash, restricted cash, and cash equivalents to the consolidated balance sheets |
| Cash and cash equivalents | |
| Restricted cash from collections on auto loans receivable and customer deposits | Restricted cash from collections on auto loans receivable and customer deposits | 114.5 | | | 29.8 | |
| Cash and restricted cash | 299.4 | | | 161.4 | |
| Cash, restricted cash, and cash equivalents | |
| Restricted cash on deposit in reserve accounts, included in other non-current assets | Restricted cash on deposit in reserve accounts, included in other non-current assets | 25.3 | | | 3.8 | |
| Total cash and restricted cash reported in the Consolidated Statements of Cash Flows | $ | 324.7 | | | $ | 165.2 | |
| Total cash, restricted cash, and cash equivalents reported in the Consolidated Statements of Cash Flows | |
| | Supplemental cash flow information: | Supplemental cash flow information: | |
| Supplemental cash flow information: | |
| Supplemental cash flow information: | |
| Cash paid during the period for interest | |
| Cash paid during the period for interest | |
| Cash paid during the period for interest | Cash paid during the period for interest | $ | 95.7 | | | $ | 29.3 | |
| Cash paid during the period for income taxes, net | Cash paid during the period for income taxes, net | 5.2 | | | 5.1 | |
| Debt paid in connection with store disposals | Debt paid in connection with store disposals | 1.6 | | | — | |
| | Non-cash activities: | Non-cash activities: | |
| Non-cash activities: | |
| Non-cash activities: | |
| | Debt assumed in connection with acquisitions | Debt assumed in connection with acquisitions | $ | 365.4 | | | $ | — | |
| Acquisition of finance leases in connection with acquisitions | — | | | 59.0 | |
| | Debt assumed in connection with acquisitions | |
| | Debt assumed in connection with acquisitions | |
| | | Right-of-use assets obtained in exchange for lease liabilities | Right-of-use assets obtained in exchange for lease liabilities | 103.8 | | | 8.5 | |
| Unsettled repurchases of common stock | — | | | 19.1 | |
| | Right-of-use assets obtained in exchange for lease liabilities | |
| | Right-of-use assets obtained in exchange for lease liabilities | |
|
See accompanying condensed notes to consolidated financial statements.
CONDENSED NOTES TO CONSOLIDATED FINANCIAL STATEMENTS
NOTE 1. INTERIM FINANCIAL STATEMENTS
Basis of Presentation
These condensed Consolidated Financial Statements contain unaudited information as of March 31, 2023,2024, and for the three months ended March 31, 20232024 and 2022.2023. The unaudited interim financial statements have been prepared pursuant to the rules and regulations for reporting on Form 10-Q. Accordingly, certain disclosures required by accounting principles generally accepted in the United States of America for annual financial statements are not included herein. In management’s opinion, these unaudited financial statements reflect all adjustments (which include only normal recurring adjustments) necessary for a fair presentation of the information when read in conjunction with our 20222023 audited Consolidated Financial Statements and the related notes thereto. The financial information as of December 31, 2022,2023, is derived from our Annual Report on Form 10-K filed with the Securities and Exchange Commission on February 24, 2023.23, 2024. The results of operations for the interim periods presented are not necessarily indicative of the results to be expected for the full year.
Reclassifications
Certain reclassifications of amounts previously reported have been made to the accompanying Consolidated Financial Statements to maintain consistency and comparability between periods presented. We reclassified certain components withinWithin our Consolidated Statements of Cash Flows, to present activity associated with Finance Receivables and Non-Recourse Notes Payable. We also reclassified componentsfinancing operations income, we disaggregated our “lease income” out of our Consolidated Statements of Operationspreviously reported “interest, fee, and lease income”, to present Finance Operations Income, and to change our presentation of segment reporting.be its own separately presented line item.
NOTE 2. ACCOUNTS RECEIVABLE
Accounts receivable consisted of the following:
| | (in millions) | (in millions) | March 31, 2023 | | December 31, 2022 | (in millions) | March 31, 2024 | | December 31, 2023 |
| Contracts in transit | Contracts in transit | $ | 397.1 | | | $ | 432.5 | |
| Trade receivables | Trade receivables | 135.2 | | | 122.6 | |
| Vehicle receivables | Vehicle receivables | 136.2 | | | 105.4 | |
| Manufacturer receivables | Manufacturer receivables | 173.1 | | | 151.9 | |
| Other receivables, current | Other receivables, current | 4.6 | | | 3.8 | |
| | | 846.2 | | | 816.2 | |
| Less: Allowance for doubtful accounts | Less: Allowance for doubtful accounts | (3.1) | | | (3.1) | |
| Total accounts receivable, net | Total accounts receivable, net | $ | 843.1 | | | $ | 813.1 | |
The long-term portions of accounts receivable and allowance for doubtful accounts were included as a component of other non-current assets in the Consolidated Balance Sheets.
NOTE 3. INVENTORIES AND FLOOR PLAN NOTES PAYABLE
The components of inventories, net, consisted of the following:
| | (in millions) | (in millions) | | March 31, 2023 | | December 31, 2022 | (in millions) | | March 31, 2024 | | December 31, 2023 |
| New vehicles | New vehicles | | $ | 2,139.7 | | | $ | 1,679.8 | |
| Used vehicles | Used vehicles | | 1,502.2 | | | 1,529.3 | |
| Parts and accessories | Parts and accessories | | 213.7 | | | 200.3 | |
| Total inventories | Total inventories | | $ | 3,855.6 | | | $ | 3,409.4 | |
The new vehicle inventory cost is generally reduced by manufacturer holdbacks and incentives, while the related floor plan notes payable are reflective of the gross cost of the vehicle.
| | (in millions) | (in millions) | | March 31, 2023 | | December 31, 2022 | (in millions) | | March 31, 2024 | | December 31, 2023 |
| Floor plan notes payable | |
| Floor plan notes payable: non-trade | Floor plan notes payable: non-trade | | $ | 1,664.9 | | | $ | 1,489.4 | |
| Floor plan notes payable | | 999.3 | | | 627.2 | |
| Total floor plan debt | Total floor plan debt | | $ | 2,664.2 | | | $ | 2,116.6 | |
| | | | | | | | | | | | | | |
| | NOTES TO FINANCIAL STATEMENTS | | 7 |
NOTE 4. FINANCE RECEIVABLES
Interest income on finance receivables is recognized based on the contractual terms of each loan and is accrued until repayment, reaching non-accrual status, charge-off, or repossession. Direct costs associated with loan originations are capitalized and expensed as an offset to interest income when recognized on the loans.
The balances of finance receivables are made up of loans and leases secured by the related vehicles. More than 99% of the portfolio is aged less than 60 days past due with less than 1% on non-accrual status.
Finance receivables consisted of the following:Receivables, net
| | (in millions) | (in millions) | March 31, 2023 | | December 31, 2022 | (in millions) | March 31, 2024 | | December 31, 2023 |
| Asset-backed term funding | Asset-backed term funding | $ | 993.0 | | | $ | 482.1 | |
| Warehouse facilities | Warehouse facilities | 1,254.9 | | | 1,383.9 | |
| Other managed receivables | Other managed receivables | 419.1 | | | 390.9 | |
| Total finance receivables | Total finance receivables | 2,667.0 | | | 2,256.9 | |
| Less: Allowance for finance receivable losses | Less: Allowance for finance receivable losses | (82.2) | | | (69.3) | |
| Finance receivables, net | Finance receivables, net | $ | 2,584.8 | | | $ | 2,187.6 | |
Our allowance for loan and lease losses represents the net credit losses expected over the remaining contractual life of our managed receivables. The allowances for credit losses related to finance receivables consisted of the following changes during the period:
| | | | | | | | | | | |
| Three Months Ended March 31, |
| (in millions) | 2023 | | 2022 |
| Allowance at beginning of period | $ | 69.3 | | | $ | 25.0 | |
| Charge-offs | (24.8) | | | (10.3) | |
| Recoveries | 11.4 | | | 4.3 | |
| Provision expense | 26.3 | | | 10.4 | |
| Allowance at end of period | $ | 82.2 | | | $ | 29.4 | |
Charge-off activity by year of origination:
| | | | | | | | | | | |
| Three Months Ended March 31, |
| (in millions) | 2023 | | 2022 |
| 2023 | $ | 0.1 | | | $ | — | |
| 2022 | 14.2 | | | — | |
| 2021 | 8.9 | | | 7.1 | |
| 2020 | 1.0 | | | 1.8 | |
Other finance receivables 1 | 0.6 | | | 1.4 | |
| Total charge-offs | $ | 24.8 | | | $ | 10.3 | |
1Includes legacy portfolio, loans that are originated with no FICO score available, and lease receivables.
Ending auto loan receivables (principal balances)Finance Receivables by FICO score:Score
| | As of March 31, 2023 |
| Year of Origination |
| As of March 31, 2024 | |
| As of March 31, 2024 | |
| As of March 31, 2024 | |
| Year of Origination | | | Year of Origination |
| ($ in millions) | ($ in millions) | 2023 | | 2022 | | 2021 | | 2020 | | | Total | ($ in millions) | 2024 | | 2023 | | 2022 | | 2021 | | 2020 | | | | | | Total |
<5991 | $ | 24.1 | | | $ | 59.1 | | | $ | 26.7 | | | $ | 4.1 | | | | $ | 114.0 | |
| <599 | |
| 600-699 | 600-699 | 181.8 | | | 613.6 | | | 218.1 | | | 23.7 | | | | 1,037.2 | |
| 700-774 | 700-774 | 190.5 | | | 543.0 | | | 88.2 | | | 8.7 | | | | 830.4 | |
| 775+ | 775+ | 163.0 | | | 340.4 | | | 19.5 | | | 4.1 | | | | 527.0 | |
| Total auto loan receivables | Total auto loan receivables | $ | 559.4 | | | $ | 1,556.1 | | | $ | 352.5 | | | $ | 40.6 | | | | 2,508.6 | |
Other finance receivables 1 | Other finance receivables 1 | | | | | | | | | | 158.4 | |
| Total finance receivables | Total finance receivables | | | | $ | 2,667.0 | |
| | | | | | | | | | | | | | |
| | NOTES TO FINANCIAL STATEMENTS | | 8 |
| | As of December 31, 2022 |
| Year of Origination |
| | | As of December 31, 2023 | |
| | | As of December 31, 2023 | |
| | | As of December 31, 2023 | |
| | | Year of Origination | | | | | Year of Origination |
| ($ in millions) | ($ in millions) | 2022 | | 2021 | | 2020 | | | Total | ($ in millions) | 2023 | | 2022 | | 2021 | | 2020 | | | | | | | | Total |
<5991 | $ | 63.0 | | | $ | 30.3 | | | $ | 4.8 | | | | $ | 98.1 | |
| <599 | |
| 600-699 | 600-699 | 652.6 | | | 243.4 | | | 27.2 | | | | 923.2 | |
| 700-774 | 700-774 | 575.9 | | | 97.9 | | | 10.0 | | | | 683.8 | |
| 775+ | 775+ | 369.5 | | | 21.5 | | | 4.5 | | | | 395.5 | |
| Total auto loan receivables | Total auto loan receivables | $ | 1,661.0 | | | $ | 393.1 | | | 46.6 | | | | 2,100.6 | |
Other finance receivables 1 | Other finance receivables 1 | | | | | | | | 156.3 | |
| Total finance receivables | Total finance receivables | | | | $ | 2,256.9 | |
1Includes legacy portfolio, loans that are originated with no FICO score available, and lease receivables.
In accordance with ASC Topic 326, the allowance for loan and lease losses is estimated based on our historical write-off experience, current conditions and forecasts, as well as the value of any underlying assets securing these loans. Consideration is given to recent delinquency trends and recovery rates. Account balances are charged against the allowance upon reaching 120 days past due status.
| | | | | | | | | | | | | | |
| | NOTES TO FINANCIAL STATEMENTS | | 8 |
Rollforward of Allowance for Loan and Lease Losses
Our allowance for loan and lease losses represents the net credit losses expected over the remaining contractual life of our managed receivables. The allowances for credit losses related to finance receivables consisted of the following changes during the period:
| | | | | | | | | | | |
| Three Months Ended March 31, |
| (in millions) | 2024 | | 2023 |
| Allowance at beginning of period | $ | 106.4 | | | $ | 69.3 | |
| Charge-offs | (34.1) | | | (24.8) | |
| Recoveries | 14.8 | | | 11.4 | |
| Sold loans | (0.3) | | | — | |
| Provision expense | 25.0 | | | 26.3 | |
| Allowance at end of period | $ | 111.8 | | | $ | 82.2 | |
Charge-off Activity by Year of Origination
| | | | | | | | | | | |
| Three Months Ended March 31, |
| (in millions) | 2024 | | 2023 |
| 2024 | $ | — | | | $ | — | |
| 2023 | 13.4 | | | 0.1 | |
| 2022 | 15.1 | | | 14.2 | |
| 2021 | 4.9 | | | 8.9 | |
Other finance receivables 1 | 0.7 | | | 1.6 | |
| Total charge-offs | $ | 34.1 | | | $ | 24.8 | |
1Includes legacy portfolio, loans that are originated with no FICO score available, and lease receivables.
NOTE 5. GOODWILL AND FRANCHISE VALUE
The changes in the carrying amounts of goodwill are as follows:
| | (in millions) | (in millions) | Vehicle Operations | | Financing Operations | | | Consolidated |
| Balance as of December 31, 2021 ¹ | $ | 977.3 | | | $ | — | | | | $ | 977.3 | |
| (in millions) | |
| (in millions) | | Vehicle Operations | | Financing Operations | | | | Consolidated |
| Balance as of December 31, 2022 | |
| Additions through acquisitions 2 | 483.4 | | | 17.0 | | | | 500.4 | |
Additions through acquisitions 1 | |
Additions through acquisitions 1 | |
Additions through acquisitions 1 | |
| Reductions through divestitures | Reductions through divestitures | (17.9) | | | — | | | | (17.9) | |
| | Currency translation | Currency translation | 0.7 | | | 0.2 | | | | 0.9 | |
| Balance as of December 31, 2022 ¹ | 1,443.5 | | | 17.2 | | | | 1,460.7 | |
| | Currency translation | |
| Currency translation | |
| Balance as of December 31, 2023 | |
Adjustments to purchase price allocations2 | |
Additions through acquisitions 3 | Additions through acquisitions 3 | 56.5 | | | — | | | | 56.5 | |
| Reductions through divestitures | Reductions through divestitures | (1.1) | | | — | | | | (1.1) | |
| | Currency translation | Currency translation | 0.1 | | | — | | | | 0.1 | |
| Balance as of March 31, 2023 ¹ | $ | 1,499.0 | | | $ | 17.2 | | | | $ | 1,516.2 | |
| Currency translation | |
| Currency translation | |
| Balance as of March 31, 2024 | |
1Net of accumulated impairment losses of $299.3 million recorded during the year ended December 31, 2008.
2Our purchase price allocation for the 2021 acquisitions were finalized in 2022. As a result, we added $500.4 million of goodwill.
3Our purchase price allocation for a portion of the 2022 acquisitions were finalized in 2023. As a result, we added $56.5$285.9 million of goodwill. Preliminary purchase price allocation for a portion of our 2023 acquisitions resulted in adding $233.2 million of goodwill. Our purchase price allocation for the remaining 2022 and 2023 acquisitions are preliminary and goodwill is not yet allocated to our segments. These amounts are included in other non-current assets until we finalize our purchase accounting. See Note 1112 – Acquisitions.
2Our purchase price allocation for a portion of the 2023 acquisitions recognized in 2023 was adjusted and finalized in 2024 upon the completion of our fair value adjustments for assumed contract liabilities, acquired loan portfolio, and contingent consideration, adding $47.6 million of goodwill.
3Our purchase price allocation for a portion of the 2023 acquisitions were finalized in 2024. As a result, we added $105.5 million of goodwill. Our purchase price allocation for the remaining 2023 and 2024 acquisitions are preliminary and goodwill is not yet allocated to our segments. These amounts are included in other non-current assets until we finalize our purchase accounting. See Note 12 – Acquisitions.
| | | | | | | | | | | | | | |
| | NOTES TO FINANCIAL STATEMENTS | | 9 |
The changes in the carrying amounts of franchise value are as follows:
| | | | | |
| (in millions) | Franchise Value |
Balance as of December 31, 20212022 | $ | 799.11,856.2 | |
| |
Additions through acquisitions 1 | 1,088.4556.5 | |
| Reductions through divestitures | (33.6)(14.5) | |
| |
| Currency translation | 2.34.0 | |
Balance as of December 31, 20222023 | 1,856.22,402.2 | |
| |
Additions through acquisitions 2 | 81.1140.8 | |
| Reductions through divestitures | (8.5)(1.2) | |
| |
| Currency translation | 0.2 (3.8) | |
Balance as of March 31, 20232024 | $ | 1,929.02,538.0 | |
1Our purchase price allocation for the 2021 acquisitions were finalized in 2022. As a result, we added $1.1 billion of franchise value.
2Our purchase price allocations for a portion of the 2022 acquisitions were finalized in 2023. As a result, we added $81.1$363.1 million of franchise value. Preliminary purchase price allocation for a portion of our 2023 acquisitions resulted in adding $193.4 million of franchise value. Our purchase price allocation for the remaining 2022 and 2023 acquisitions are preliminary and franchise value is not yet allocated to our reporting units. These amounts are included in other non-current assets until we finalize our purchase accounting. See Note 1112 – Acquisitions.
2Our purchase price allocations for a portion of the 2023 acquisitions were finalized in 2024. As a result, we added $140.8 million of franchise value. Our purchase price allocation for the remaining 2023 and 2024 acquisitions are preliminary and franchise value is not yet allocated to our reporting units. These amounts are included in other non-current assets until we finalize our purchase accounting. See Note 12 – Acquisitions.
| | | | | | | | | | | | | | |
| | NOTES TO FINANCIAL STATEMENTS | | 9 |
NOTE 6. NET INVESTMENT IN OPERATING LEASES
Net investment in operating leases consists primarily of lease contracts for vehicles with individuals and business entities. Assets subject to operating leases are depreciated using the straight-line method over the term of the lease to reduce the asset to its estimated residual value. Estimated residual values are based on assumptions for used vehicle prices at lease termination and the number of vehicles that are expected to be returned.
Net investment in operating leases was as follows:
| | (in millions) | (in millions) | March 31, 2023 | | December 31, 2022 | (in millions) | March 31, 2024 | | December 31, 2023 |
Vehicles, at cost 1 | Vehicles, at cost 1 | $ | 93.0 | | | $ | 92.2 | |
Accumulated depreciation 1 | Accumulated depreciation 1 | (8.3) | | | (7.6) | |
| Net investment in operating leases | Net investment in operating leases | $ | 84.7 | | | $ | 84.6 | |
1Vehicles, at cost and accumulated depreciation are recorded in other current assets on the Consolidated Balance Sheets.
NOTE 7. COMMITMENTS AND CONTINGENCIES
Contract Liabilities
We are the obligor on our lifetime oil and at home valet contracts. Revenue is allocated to these performance obligations and is recognized over time as services are provided to the customer. The amount of revenue recognized is calculated, net of cancellations, using an input method, which most closely depicts performance of the contracts. Our contract liability balances were $293.4$385.5 million and $284.3$317.0 million as of March 31, 2023,2024, and December 31, 2022,2023, respectively; and we recognized $14.7$15.8 million of revenue in the three months ended March 31, 20232024 related to our contract liability balance at December 31, 2022.2023. Our contract liability balance is included in accrued liabilities and deferred revenue.
Leases
We lease certain dealerships, office space, land and equipment. Leases with an initial term of 12 months or less are not recorded on the balance sheet; wesheet. We recognize lease expense for these leases on a straight-line basis over the lease term. We have elected not to bifurcate lease and non-lease components related to leases of real property.
Most leases include one or more options to renew, with renewal terms that can extend the lease term from one to 2423 years or more. The exercise of lease renewal options is at our sole discretion. Certain leases also include options to purchase the leased property. The depreciable life of assets and leasehold improvements are limited by the expected lease term, unless there is a transfer of title or purchase option reasonably certain of exercise.
| | | | | | | | | | | | | | |
| | NOTES TO FINANCIAL STATEMENTS | | 10 |
Certain of our lease agreements include rental payments based on a percentage of retail sales over contractual levels and others include rental payments adjusted periodically for inflation. Our lease agreements do not contain any material residual value guarantees or material restrictive covenants.
Our finance lease liabilities are included in long-term debt, with the current portion included in current maturities of long-term debt. The related assets are included in property, plant and equipment, net of accumulated amortization. These amounts are included in other non-current assets until we finalize our purchase accounting.
We rent or sublease certain real estate to third parties.
Litigation
We are party to numerous legal proceedings arising in the normal course of our business. Although we do not anticipate that the resolution of legal proceedings arising in the normal course of business will have a material adverse effect on our business, results of operations, financial condition, or cash flows, we cannot predict this with certainty.
| | | | | | | | | | | | | | |
| | NOTES TO FINANCIAL STATEMENTS | | 10 |
NOTE 8. DEBT
Credit Facilities
US Bank Syndicated Credit Facility
On February 9, 2023,23, 2024, we amended our existing syndicated credit facility (USB credit facility), comprised of 2021 financial institutions, including eight manufacturer-affiliated finance companies, maturing April 29, 2026.February 23, 2029. The amendment increased the total financing commitment and the amount to which the commitment could be further expanded.
This USB credit facility provides for a total financing commitment of $4.5$6.0 billion, which may be further expanded, subject to lender approval and the satisfaction of other conditions, up to a total of $5.5$6.5 billion. The allocation of the financing commitment is for up to $2.9 billion in new vehicle inventory floorplan financing, up to $800 million in used vehicle inventory floorplan financing, up to $1.70$100 million in service loaner vehicle floorplan financing, and up to $2.2 billion in revolving financing for general corporate purposes, including acquisitions and working capital, up to $1.95 billion in new vehicle inventory floorplan financing, and up to $50 million in service loaner vehicle floorplan financing.capital. We have the option to reallocate the commitments under this USB credit facility, provided that the aggregate revolving loan commitment may not be more than 40% of the amount of the aggregate commitment, and the aggregate service loaner vehicle floorplan commitment may not be more than the 3% of the amount of the aggregate commitment. All borrowings from, and repayments to, our lending group are presented in the Consolidated Statements of Cash Flows as financing activities.
Our obligations under our USB credit facility are secured by a substantial amount of our assets, including our inventory (including new and used vehicles, parts and accessories), equipment, accounts receivable (and other rights to payment) and our equity interests in certain of our subsidiaries. Under our USB credit facility, our obligations relating to new vehicle floor plan loans are secured only by collateral owned by borrowers ofLithia and its dealerships borrowing under the new vehicle floor plan loans underportion of the USB credit facility.
The interest rate on the USB credit facility varies based on the type of debt, with the rate of one-day SOFR plus a credit spread adjustment of 0.10% plus a margin of 1.10% for new vehicle floor plan financing, 1.40% for used vehicle floor plan financing, 1.20% for service loaner floor plan financing, and a variable interest rate on the revolving financing ranging from 1.00% to 2.00% depending on our leverage ratio. The annual interest rates associated with our floor plan commitments are as follows:
| | | | | |
| Commitment | Annual Interest Rate at March 31, 20232024 |
| New vehicle floor plan | 6.07%6.54% |
| Used vehicle floor plan | 6.37%6.84% |
| Service loaner floor plan | 6.07%6.64% |
| Revolving line of credit | 5.97%6.44% |
JPM Warehouse Facility
On February 23, 2024, we amended our securitization facility for our auto loan portfolio (JPM warehouse facility) with JPMorgan Chase Bank, as administrative agent and account bank, providing initial commitments for borrowings of up to $1.0 billion. The JPM warehouse facility matures on July 18, 2025. The interest rate on the JPM
| | | | | | | | | | | | | | |
| | NOTES TO FINANCIAL STATEMENTS | | 11 |
warehouse facility varies based on the Daily Simple SOFR rate plus 1.15% to 1.95%. As of March 31, 2024, we had $389.0 million drawn on the JPM warehouse facility.
Mizuho Warehouse Facility
On February 16, 2024, we amended our securitization facility for our auto loan portfolio (Mizuho warehouse facility), with Mizuho Bank Ltd. as administrative agent and account bank, providing initial commitments for borrowings of up to $750 million. The Mizuho warehouse facility matures on July 20, 2026. The interest rate on the Mizuho warehouse facility varies based on the Daily Simple SOFR rate plus 1.20%. As of March 31, 2024, we had $247.0 million drawn on the Mizuho warehouse facility.
Bank of Nova Scotia Syndicated Credit Facility
On March 18, 2024, we amended our syndicated credit agreement with The Bank of Nova Scotia as agent (BNS credit facility), comprised of six financing institutions, including two manufacturer-affiliated finance companies, to extend the maturity date.
The BNS credit facility provides for a total financing commitment of approximately $1.1 billion CAD, including a working capital revolving credit facility of up to $100 million CAD, a wholesale flooring facility for new vehicles up to $500 million CAD, used vehicle flooring facility of up to $100 million CAD, wholesale leasing facility of up to $400 million CAD, and daily rental vehicle facility up to $25 million CAD.
The interest rate on the Bank of Nova Scotia syndicated credit facility varies based on the type of debt, with the daily compound rate of the Canadian Overnight Repo Rate Average (CORRA) plus a margin of 1.00-1.30%. The annual interest rates associated with our floor plan commitments are as follows:
| | | | | |
| Commitment | Annual Interest Rate at March 31, 2024 |
| Wholesale flooring facility | 6.05% |
| Used vehicle flooring facility | 6.30% |
| Daily rental facility | 6.25% |
| Wholesale leasing facility | 6.35% |
| Working capital revolving facility | 6.30% |
All Canadian facilities other than the wholesale flooring facility, which is a demand facility, mature on March 18, 2027. The credit agreement includes various financial and other covenants typical of such agreements.
Non-Recourse Notes Payable
In February 2023,2024, we issued approximately $480$329.4 million in non-recourse notes payable related to the asset-backed term funding transaction.transactions. Below is a summary of outstanding non-recourse notes payable issued:
| | | | | | | | | | | | | | | | | |
| ($ in millions) | Balance as of March 31, 2023 | Initial Principal Amount | Issuance Date | Interest Rate | Final Distribution Date |
| LAD Auto Receivables Trust 2021-1 Class A | $ | 92.7 | | $ | 282.8 | | 11/24/21 | 1.300% | 08/17/26 |
| LAD Auto Receivables Trust 2021-1 Class B | 18.3 | | 18.3 | | 11/24/21 | 1.940% | 11/16/26 |
| LAD Auto Receivables Trust 2021-1 Class C | 26.0 | | 26.0 | | 11/24/21 | 2.350% | 04/15/27 |
| LAD Auto Receivables Trust 2021-1 Class D | 17.2 | | 17.2 | | 11/24/21 | 3.990% | 11/15/29 |
| LAD Auto Receivables Trust 2022-1 Class A | 182.0 | | 259.7 | | 08/17/22 | 5.210% | 06/15/27 |
| LAD Auto Receivables Trust 2022-1 Class B | 15.5 | | 15.5 | | 08/17/22 | 5.870% | 09/15/27 |
| LAD Auto Receivables Trust 2022-1 Class C | 23.0 | | 23.0 | | 08/17/22 | 6.850% | 04/15/30 |
| LAD Auto Receivables Trust 2023-1 Class A-1 | 46.2 | | 75.1 | | 02/14/23 | 4.929% | 02/15/24 |
| LAD Auto Receivables Trust 2023-1 Class A-2 | 242.0 | | 242.0 | | 02/14/23 | 5.680% | 10/15/26 |
| LAD Auto Receivables Trust 2023-1 Class A-3 | 74.4 | | 74.4 | | 02/14/23 | 5.480% | 06/15/27 |
| LAD Auto Receivables Trust 2023-1 Class B | 20.1 | | 20.1 | | 02/14/23 | 5.590% | 08/16/27 |
| LAD Auto Receivables Trust 2023-1 Class C | 36.7 | | 36.7 | | 02/14/23 | 6.180% | 12/15/27 |
| LAD Auto Receivables Trust 2023-1 Class D | 31.3 | | 31.3 | | 02/14/23 | 7.300% | 06/17/30 |
| Total non-recourse notes payable | $ | 825.4 | | $ | 1,122.1 | | | | |
| | | | | | | | | | | | | | | | | |
| ($ in millions) | Balance as of March 31, 2024 | Initial Principal Amount | Issuance Date | Interest Rate Range | Final Distribution Date |
| LAD Auto Receivables Trust 2021-1 Class A-D | 82.6 | | $ | 344.4 | | 11/24/21 | 1.30% to 3.99% | Various dates through Nov 2029 |
| LAD Auto Receivables Trust 2022-1 Class A-C | 131.6 | | 298.1 | | 08/17/22 | 5.21% to 6.85% | Various dates through Apr 2030 |
| LAD Auto Receivables Trust 2023-1 Class A-D | 279.0 | | 479.7 | | 02/14/23 | 5.48% to 7.30% | Various dates through Jun 2030 |
| LAD Auto Receivables Trust 2023-2 Class A-D | 362.5 | | 556.7 | | 05/24/23 | 5.42% to 6.30% | Various dates through Feb 2031 |
| LAD Auto Receivables Trust 2023-3 Class A-D | 316.9 | | 415.4 | | 08/23/23 | 5.95% to 6.92% | Various dates through Dec 2030 |
| LAD Auto Receivables Trust 2023-4 Class A-D | 352.4 | | 421.2 | | 11/15/23 | 6.10% to 7.37% | Various dates through Apr 2031 |
| LAD Auto Receivables Trust 2024-1 Class A-D | 306.5 | | 329.4 | | 02/14/24 | 5.17% to 6.15% | Various dates through Jun 2031 |
| Total non-recourse notes payable | $ | 1,831.5 | | $ | 2,844.9 | | | | |
| | | | | | | | | | | | | | |
| | NOTES TO FINANCIAL STATEMENTS | | 1112 |
NOTE 9. EQUITYRETIREMENT PLANS AND REDEEMABLE NON-CONTROLLING INTERESTSPOSTRETIREMENT BENEFITS
Company-Sponsored Defined Benefit Pension Plan
In January 2024, we acquired Pendragon PLC’s Fleet Management and UK Motor Divisions in the United Kingdom, which included the assumption of its company-sponsored defined benefit plan applicable to a portion of the salaried present and past employees, closed to future accrual. At the time of acquisition, these balances increased our defined benefit obligations $465.7 million and increased our fair value of plan assets $466.4 million.
Net Periodic (Benefit) Cost
Interest cost represents the increase in the projected benefit obligation, which is a discounted amount, due to the passage of time. The expected return on plan assets reflects the computed amount of current-year earnings from the investment of plan assets using an estimated long-term rate of return.
| | | | | | | |
| ($ in millions) | March 31, 2024 | | |
| | | |
| Interest cost | $ | 5.6 | | | |
| Expected return on plan assets | (6.2) | | | |
| | | |
| | | |
| | | |
| | | |
| | | |
| Net periodic benefit | $ | (0.6) | | | |
During the three months ended March 31, 2024, funding of pension plans was $12.7 million. For the remainder of 2024, we estimate approximately $3.3 million of cash contributions.
NOTE 10. EQUITY
Repurchases of Common Stock
Repurchases of our common stock occurred under a repurchase authorization granted by our Board of Directors and related to shares withheld as part of the vesting of restricted stock units (RSUs). On November 1, 2022, our Board of Directors approved an additional $450 million repurchase authorization of our common stock. This new authorization is in addition to the amount previously authorized by the Board for repurchase. Share repurchases under our authorization were as follows:
| | | | | | | | | | | | | | | | | | | | | | | | | | |
| | | Repurchases Occurring in 2023 | | Cumulative Repurchases as of March 31, 2023 |
| | | Shares | | Average Price | | Shares | | Average Price |
| Share Repurchase Authorization | | — | | | $ | — | | | 6,904,781 | | | $ | 173.59 | |
| | | | | | | | | | | | | | | | | | | | | | | | | | |
| | | Repurchases Occurring in 2024 | | Cumulative Repurchases as of March 31, 2024 |
| | | Shares | | Average Price | | Shares | | Average Price |
| Share Repurchase Authorization | | — | | | $ | — | | | 7,047,510 | | | $ | 174.96 | |
As of March 31, 2023,2024, we had $501.4$467.0 million available for repurchases pursuant to our share repurchase authorization.authorization from our Board of Directors in 2022 and prior years.
In addition, during 2023,2024, we repurchased 70,39545,516 shares at an average price of $204.75$329.21 per share, for a total of $14.4$15.0 million, related to tax withholding associated with the vesting of RSUs. The repurchase of shares related to tax withholding associated with stock awards does not reduce the number of shares available for repurchase as approved by our Board of Directors.
NOTE 10.11. FAIR VALUE MEASUREMENTS
Factors used in determining the fair value of our financial assets and liabilities are summarized into three broad categories:
•Level 1 - quoted prices in active markets for identical securities;
•Level 2 - other significant observable inputs, including quoted prices for similar securities, interest rates, prepayment spreads, credit risk; and
•Level 3 - significant unobservable inputs, including our own assumptions in determining fair value.
We determined the carrying value of cash equivalents, accounts receivable, trade payables, accrued liabilities, finance receivables, and short-term borrowings approximate their fair values because of the nature of their terms and current market rates of these instruments. We believe the carrying value of our variable rate debt approximates fair value.
We have investments primarily consistingBeginning in January of 2024, our investmentcaptive insurance subsidiary began investing the cash in Shift Technologies, Inc. (Shift), a San Francisco-based digital retail company. Shift has a readily determinable fair value following Shift going publicexcess of current needs in a reverse-merger deal with Insurance Acquisition, a special purpose acquisition company, in the fourth quarter of 2020. We calculated the fair value of this investment using quoted prices for the identical asset (Level 1) andmarketable securities, recorded the fair value as part of other non-current assets.Other current assets in the Consolidated Balance Sheets. For the
| | | | | | | | | | | | | | |
| | NOTES TO FINANCIAL STATEMENTS | | 13 |
three-month period ended March 31, 2023, we recognized a $0.5 million2024, the net unrealized investment loss related to Shift. Forlosses, net of tax, of $0.2 million were recorded in Other comprehensive income (loss) and the three-month period endednet realized investment gains of $0.1 million were recorded in Other income, net. Amortized cost for these marketable securities was $50.1 million as of March 31, 2022, we recognized a $14.9 million unrealized investment loss related to Shift. These amounts were recorded as a component of Other expense, net.2024.
We have fixed rate debt primarily consisting of amounts outstanding under our senior notes, non-recourse notes payable, and real estate mortgages. We calculated the estimated fair value of the senior notes using quoted prices for the identical liability (Level 1). The fair value of non-recourse notes payable are measured using observable Level 2 market expectations at each measurement date. The calculated estimated fair values of the fixed rate real estate mortgages and finance lease liabilities use a discounted cash flow methodology with estimated current interest rates based on a similar risk profile and duration (Level 2). The fixed cash flows are discounted and summed to compute the fair value of the debt.
We have derivative instruments consisting of an offsetting set of interest rate caps. The fair value of derivative assets and liabilities are measured using observable Level 2 market expectations at each measurement date and is recorded as other current assets, current liabilities and other long-term liabilities in the Consolidated Balance Sheets.
| | | | | | | | | | | | | | |
| | NOTES TO FINANCIAL STATEMENTS | | 12 |
Nonfinancial assets such as goodwill, franchise value, or other long-lived assets are measured and recorded at fair value during a business combination or when there is an indicator of impairment. We evaluate our goodwill and franchise value using a qualitative assessment process. If the qualitative factors determine that it is more likely than not that the carrying value exceeds the fair value, we would further evaluate for potential impairment using a quantitative assessment. The quantitative assessment estimates fair values using unobservable (Level 3) inputs by discounting expected future cash flows of the store.store for franchise value, or reporting unit for goodwill. The forecasted cash flows contain inherent uncertainties, including significant estimates and assumptions related to growth rates, margins, working capital requirements, and cost of capital, for which we utilize certain market participant-based assumptions we believe to be reasonable. We estimate the value of other long-lived assets that are recorded at fair value on a non-recurring basis on a market valuation approach. We use prices and other relevant information generated primarily by recent market transactions involving similar or comparable assets, as well as our historical experience in divestitures, acquisitions and real estate transactions. Additionally, we may use a cost valuation approach to value long-lived assets when a market valuation approach is unavailable. Under this approach, we determine the cost to replace the service capacity of an asset, adjusted for physical and economic obsolescence. When available, we use valuation inputs from independent valuation experts, such as real estate appraisers and brokers, to corroborate our estimates of fair value. Real estate appraisers’ and brokers’ valuations are typically developed using one or more valuation techniques including market, income and replacement cost approaches. Because these valuations contain unobservable inputs, we classified the measurement of fair value of long-lived assets as Level 3.
There were no changes to our valuation techniques during the three-month period ended March 31, 2023.2024.
| | | | | | | | | | | | | | |
| | NOTES TO FINANCIAL STATEMENTS | | 14 |
Below are our assets and liabilities that are measured at fair value:
| | As of March 31, 2023 | | As of December 31, 2022 |
| | As of March 31, 2024 | | | | As of March 31, 2024 | | As of December 31, 2023 |
| ($ in millions) | ($ in millions) | | Carrying Value | | Level 1 | | Level 2 | | Level 3 | | Carrying Value | | Level 1 | | Level 2 | | Level 3 | ($ in millions) | | Carrying Value | | Level 1 | | Level 2 | | Level 3 | | Carrying Value | | Level 1 | | Level 2 | | Level 3 |
| Recorded at fair value | Recorded at fair value | | | | | | | | | | | | | | | | |
| Investments | |
| Shift Technologies, Inc. | | $ | 1.3 | | | $ | 1.3 | | | $ | — | | | $ | — | | | $ | 1.8 | | | $ | 1.8 | | | $ | — | | | $ | — | |
| Marketable securities | |
| Marketable securities | |
| Marketable securities | |
| Equity securities | |
| Equity securities | |
| Equity securities | |
| | U.S. Treasury | |
| U.S. Treasury | |
| U.S. Treasury | |
| Corporate debt | |
| Total debt securities | |
| | Derivatives | Derivatives | |
| Derivatives | |
| Derivatives | |
| Derivative assets | |
| Derivative assets | |
| Derivative assets | Derivative assets | | 19.0 | | | — | | | 19.0 | | | — | | | 22.1 | | | — | | | 22.1 | | | — | |
| Derivative liabilities | Derivative liabilities | | 19.0 | | | — | | | 19.0 | | | — | | | 22.1 | | | — | | | 22.1 | | | — | |
| | Recorded at historical value | Recorded at historical value | |
| Recorded at historical value | |
| Recorded at historical value | |
Fixed rate debt 1 | Fixed rate debt 1 | |
Fixed rate debt 1 | |
Fixed rate debt 1 | |
| 4.625% Senior notes due 2027 | |
| 4.625% Senior notes due 2027 | |
| 4.625% Senior notes due 2027 | 4.625% Senior notes due 2027 | | 400.0 | | | 368.0 | | | — | | | — | | | 400.0 | | | 364.0 | | | — | | | — | |
| 4.375% Senior notes due 2031 | 4.375% Senior notes due 2031 | | 550.0 | | | 460.6 | | | — | | | — | | | 550.0 | | | 448.3 | | | — | | | — | |
| 3.875% Senior notes due 2029 | 3.875% Senior notes due 2029 | | 800.0 | | | 684.0 | | | — | | | — | | | 800.0 | | | 656.0 | | | — | | | — | |
| Non-recourse notes payable | Non-recourse notes payable | | 825.4 | | | — | | | 814.3 | | | — | | | 422.2 | | | — | | | 411.8 | | | — | |
| Real estate mortgages and other debt | Real estate mortgages and other debt | | 488.9 | | | — | | | 419.9 | | | — | | | 489.0 | | | — | | | 399.0 | | | — | |
1Excluding unamortized debt issuance costcosts
NOTE 11.12. ACQUISITIONS
In the first three months of 2024, we completed the following acquisitions:
•In January 2024, Pendragon PLC’s Fleet Management and UK Motor Divisions in the United Kingdom.
•In February 2024, Carousel Motor Group in Minnesota and Wisconsin.
Revenue and operating income contributed by the 2024 acquisitions subsequent to the date of acquisition were as follows (in millions):
| | | | | | | | |
| Three Months Ended March 31, | | 2024 |
| Revenue | | $ | 985.4 | |
| Operating income | | 13.6 | |
In the first three months of 2023, we completed the following acquisitions:
•In February 2023, Thornhill Acura in Canada.
•In March 2023, Jardine Motors Group UK Limited in the United Kingdom.
Revenue and operating income contributed by the 2023 acquisitions subsequent to the date of acquisition were as follows (in millions):
| | | | | | | | |
Three Months Ended March 31, | | 2023 |
Revenue | | $ | 127.7 | |
Operating income | | 10.5 | |
In the first three months of 2022, we completed the following acquisitions:
| | | | | | | | | | | | | | |
| | NOTES TO FINANCIAL STATEMENTS | | 13 |
•In January 2022, John L. Sullivan Chevrolet, John L. Sullivan Chrysler Dodge Jeep Ram, and Roseville Toyota in California.
•In March 2022, Sahara Chrysler Dodge Jeep Ram, Desert 215 Superstore, and Jeep Only in Nevada.
All acquisitions were accounted for as business combinations under the acquisition method of accounting. The results of operations of the acquired stores are included in our Consolidated Financial Statements from the date of acquisition.
The following tables summarize the consideration paid for the 20232024 acquisitions and the preliminary purchase price allocations for identified assets acquired and liabilities assumed as of the acquisition date:
| | | | | | | | |
| (in millions) | | Consideration |
| Cash paid, net of cash acquired | | $ | 387.41,074.4 | |
| | |
| | |
| | |
| | |
| | |
| Total consideration transferred | | $387.4 | |
| | | | | | | | | | | | | | |
| | NOTES TO FINANCIAL STATEMENTS | | 15 |
| | | | | | | | |
| (in millions) | | Assets Acquired and Liabilities Assumed |
| Trade receivables, net | | $ | 52.4119.0 | |
| Inventories | | 397.2972.1 | |
| | |
| | |
| Property and equipment | | 166.2499.6 | |
| Operating lease right-of-use assets | | 86.7289.7 | |
| Net investment in operating leases | | 181.5 | |
| | |
| Deferred taxes, net | | 20.5 | |
| Other assets | | 254.2494.1 | |
| Trade payables | | (39.6) | |
| Floor plan notes payable | | (329.0)(868.1) | |
| | |
| | |
| Operating lease liability | | Borrowings on lines of credit(283.9) | |
| Other liabilities and deferred revenue | | (36.4)(310.5) | |
| | |
Deferred taxes, net | | 10.0 | |
Other liabilities | | (213.9) | |
| Total net assets acquired and liabilities assumed | | $ | 387.41,074.4 | |
The purchase price allocations for the acquisitions from the secondthird quarter of 20222023 through the first quarter of 20232024 are preliminary, and we have not obtained and evaluated all of the detailed information necessary to finalize the opening balance sheet amounts in all respects. We recorded the purchase price allocations based upon information that is currently available and recorded unallocated items as a component of other non-current assets in the Consolidated Balance Sheets.
We do not expect all of the goodwill related to North American acquisitions completed in 2023 and 2024 to be deductible for US federal income tax purposes. Due to local country laws, we do not expect goodwill related to UK acquisitions completed in 2023 and 2024 to be deductible for UK income tax purposes.
In the three-month period ended March 31, 2023,2024, we recorded $1.3$7.7 million in acquisition-related expenses as a component of selling, general and administrative expense. Comparatively, we recorded $6.6$1.3 million of acquisition-related expenses in the same period of 2022.2023.
The following unaudited pro forma summary presents consolidated information as if all acquisitions in the three-month periods ended March 31, 20232024 and 20222023 had occurred on January 1, 2022:2023:
| | | | Three Months Ended March 31, |
| | Three Months Ended March 31, | |
| | Three Months Ended March 31, | |
| | Three Months Ended March 31, | |
| (in millions, except per share amounts) | |
| (in millions, except per share amounts) | |
| (in millions, except per share amounts) | (in millions, except per share amounts) | | | 2023 | | 2022 |
| Revenue | Revenue | | | $ | 7,385.5 | | | $ | 7,222.9 | |
| Revenue | |
| Revenue | |
| Net income attributable to Lithia Motors, Inc. | Net income attributable to Lithia Motors, Inc. | | | 236.8 | | | 352.9 | |
| Basic earnings attributable to Lithia Motors, Inc. per share | | | 8.61 | | | 11.95 | |
| Diluted earnings attributable to Lithia Motors, Inc. per share | | | 8.60 | | | 11.91 | |
| Net income attributable to Lithia Motors, Inc. | |
| Net income attributable to Lithia Motors, Inc. | |
| Basic earnings per share attributable to Lithia Motors, Inc. | |
| Basic earnings per share attributable to Lithia Motors, Inc. | |
| Basic earnings per share attributable to Lithia Motors, Inc. | |
| Diluted earnings per share attributable to Lithia Motors, Inc. | |
| Diluted earnings per share attributable to Lithia Motors, Inc. | |
| Diluted earnings per share attributable to Lithia Motors, Inc. | |
These amounts have been calculated by applying our accounting policies and estimates. The results of the acquired stores have been adjusted to reflect the following: depreciation on a straight-line basis over the expected lives for property and equipment, accounting for inventory on a specific identification method, and recognition of interest expense for real estate financing related to stores where we purchased the facility. No nonrecurring proforma adjustments directly attributable to the acquisitions are included in the reported proforma revenues and earnings.
| | | | | | | | | | | | | | |
| | NOTES TO FINANCIAL STATEMENTS | | 14 |
NOTE 12.13. EARNINGS PER SHARE
We calculate basic earnings per share (EPS) by dividing net income attributable to Lithia Motors, Inc. by the weighted average number of common shares outstanding for the period, including vested RSU awards. Diluted EPS is calculated by dividing net income attributable to Lithia Motors, Inc. by the weighted average number of shares outstanding, adjusted for the dilutive effect of unvested RSU awards and employee stock purchases.
| | | | | | | | | | | | | | |
| | NOTES TO FINANCIAL STATEMENTS | | 16 |
The following is a reconciliation of net income attributable to Lithia Motors, Inc. and weighted average shares used for our basic EPS and diluted EPS:
| | Three Months Ended March 31, | Three Months Ended March 31, | | | Three Months Ended March 31, |
| Three Months Ended March 31, | |
| Three Months Ended March 31, | |
| (in millions, except per share amounts) | (in millions, except per share amounts) | | | 2023 | | 2022 |
| (in millions, except per share amounts) | |
| (in millions, except per share amounts) | |
| Net income attributable to Lithia Motors, Inc. and applicable to common stockholders | |
| Net income attributable to Lithia Motors, Inc. and applicable to common stockholders | |
| Net income attributable to Lithia Motors, Inc. and applicable to common stockholders | Net income attributable to Lithia Motors, Inc. and applicable to common stockholders | | | $ | 228.7 | | | $ | 342.2 | |
| | Weighted average common shares outstanding – basic | Weighted average common shares outstanding – basic | | | 27.5 | | | 29.5 | |
| Effect of employee stock purchases and restricted stock units on weighted average common shares | | | — | | | 0.1 | |
| | Weighted average common shares outstanding – basic | |
| | Weighted average common shares outstanding – basic | |
| Effect of employee stock purchases and restricted stock units on weighted average common shares outstanding | |
| Effect of employee stock purchases and restricted stock units on weighted average common shares outstanding | |
| Effect of employee stock purchases and restricted stock units on weighted average common shares outstanding | |
| Weighted average common shares outstanding – diluted | |
| Weighted average common shares outstanding – diluted | |
| Weighted average common shares outstanding – diluted | Weighted average common shares outstanding – diluted | | | 27.5 | | | 29.6 | |
| | Basic earnings per share attributable to Lithia Motors, Inc. | Basic earnings per share attributable to Lithia Motors, Inc. | | | $ | 8.32 | | | $ | 11.59 | |
| | Basic earnings per share attributable to Lithia Motors, Inc. | |
| | Basic earnings per share attributable to Lithia Motors, Inc. | |
| Diluted earnings per share attributable to Lithia Motors, Inc. | Diluted earnings per share attributable to Lithia Motors, Inc. | | | $ | 8.30 | | | $ | 11.55 | |
| Diluted earnings per share attributable to Lithia Motors, Inc. | |
| Diluted earnings per share attributable to Lithia Motors, Inc. | |
The effect of antidilutive securities on common stock was evaluated for the three-month periods ended March 31, 2023,2024 and 20222023 and was determined to be immaterial.
NOTE 13.14. SEGMENTS
We operate in two reportable segments: Vehicle Operations and Financing Operations. Our Vehicle Operations consists of all aspects of our auto merchandising and service operations, excluding financing provided by our Financing Operations. Our Financing Operations segment provides financing to customers buying and leasing retail vehicles from our Vehicle Operations.Operations, as well as leasing vehicles from our fleet management services provider.
All other remaining unallocated corporate overhead expenses and internal charges are reported under “Corporate and Other”. Asset information by segment is not utilized for purposes of assessing performance or allocating resources and, as a result, such information has not been presented.
| | | | | | | | | | | | | | |
| | NOTES TO FINANCIAL STATEMENTS | | 1517 |
Certain financial information on a segment basis is as follows:
| | | |
| | | | | Three Months Ended
March 31, | | | Three Months Ended
March 31, |
| (in millions) | (in millions) | | 2023 | | 2022 | (in millions) | | | | | 2024 | | 2023 |
| Vehicle operations revenue | Vehicle operations revenue | | $ | 6,973.8 | | | $ | 6,705.3 | |
| | Vehicle operations gross profit | Vehicle operations gross profit | | 1,211.5 | | | 1,278.1 | |
| Vehicle operations gross profit | |
| Vehicle operations gross profit | |
| Floor plan interest expense | Floor plan interest expense | | (27.7) | | | (4.9) | |
| Vehicle operations selling, general and administrative | Vehicle operations selling, general and administrative | | (822.6) | | | (790.9) | |
| Vehicle operations income | Vehicle operations income | | 361.2 | | | 482.4 | |
| | Financing operations interest margin: | Financing operations interest margin: | | |
| Interest, fee, and lease income | | 53.9 | | | 22.4 | |
| Financing operations interest margin: | |
| Financing operations interest margin: | |
| Interest and fee income | |
| Interest and fee income | |
| Interest and fee income | |
| Interest expense | Interest expense | | (37.5) | | | (3.8) | |
| Total interest margin | Total interest margin | | 16.4 | | | 18.6 | |
| Lease income | |
| Depreciation and amortization | |
| Lease income, net | |
| Selling, general and administrative | Selling, general and administrative | | (8.6) | | | (7.2) | |
| Total pre-provision income | | 7.8 | | | 11.4 | |
| Provision expense | Provision expense | | (26.3) | | | (3.7) | |
| Depreciation and amortization | | (2.3) | | | (2.7) | |
| Financing operations (loss) income | | (20.8) | | | 5.0 | |
| Financing operations loss | |
| | Total segment income for reportable segments | |
| Total segment income for reportable segments | |
| Total segment income for reportable segments | Total segment income for reportable segments | | 340.4 | | | 487.4 | |
| | Corporate and other | Corporate and other | | 58.2 | | | 51.0 | |
| Corporate and other | |
| Corporate and other | |
| Depreciation and amortization | Depreciation and amortization | | (47.3) | | | (36.5) | |
| Other interest expense | Other interest expense | | (39.0) | | | (26.2) | |
| Other income (expense), net | | 2.0 | | | (5.8) | |
| Other income, net | |
| Income before income taxes | Income before income taxes | | $ | 314.3 | | | $ | 469.8 | |
NOTE 14.15. RECENT ACCOUNTING PRONOUNCEMENTS
In March 2022,November 2023, the FASBFinancial Accounting Standards Board (FASB) issued an accounting pronouncement (ASU 2022-02)standards update (ASU) 2023-07 related to troubled debt restructurings (“TDRs”)improvements to reportable segment disclosures. The amendments in this update require additional disclosure of significant expenses related to our reportable segments, additional segment disclosures on an interim basis, and vintagequalitative disclosures regarding the decision making process for financing receivables.segment resources. The amendments in this update are effective for fiscal years beginning after December 15, 2023, and interim periods within fiscal years beginning after December 15, 2024. We have adopted this pronouncement and madeplan to make the necessary updates to our vintagesegment disclosures for the interim period beginning January 1, 2023,year ending December 31, 2024, and, aside from these disclosure changes, we do not expect the amendments did notto have a material effect on our financial statements.
In December 2023, the FASB issued ASU 2023-09 related to improvements to income tax disclosures. The amendments in this update require enhanced jurisdictional and other disaggregated disclosures for the effective tax rate reconciliation and income taxes paid. The amendments in this update are effective for fiscal years beginning after December 15, 2024. We plan to adopt this pronouncement and make the necessary updates to our disclosures for the year ending December 31, 2025, and, aside from these disclosure changes, we do not expect the amendments to have a material effect on our financial statements.
| | | | | | | | | | | | | | |
| | NOTES TO FINANCIAL STATEMENTS | | 1618 |
Item 2. Management’s Discussion and Analysis of Financial Condition and Results of Operations
Forward-Looking Statements and Risk Factors
Certain statements under the sections entitled “Management’s Discussion and Analysis of Financial Condition and Results of Operations” and “Risk Factors” and elsewhere in this Form 10-Q constitute forward-looking statements within the meaning of the “Safe Harbor” provisions of the Private Securities Litigation Reform Act of 1995. Generally, you can identify forward-looking statements by terms such as “project,” “outlook,” “target,” “may,” “will,” “would,” “should,” “seek,” “expect,” “plan,” “intend,” “forecast,” “anticipate,” “believe,” “estimate,” “predict,” “potential,” “likely,” “goal,” “strategy,” “future,” “maintain,” and “continue” or the negative of these terms or other comparable terms. Examples of forward-looking statements in this Form 10-Q include, among others, statements we make regarding:
•Future market conditions, including anticipated car and other sales levels and the supply of inventory
•Our business strategy and plans, including our achieving our 2025 Plan and related targetslong-term EPS target
•The growth, expansion, make-up and success of our network, including our finding accretive acquisitions and acquiring additional stores
•Annualized revenues from acquired stores
•The growth and performance of our Driveway e-commerce home solution and Driveway Finance Corporation (DFC), their synergies and other impacts on our business and our ability to meet Driveway and DFC-related targets
•The impact of sustainable vehicles and other market and regulatory changes on our business
•Our capital allocations and uses and levels of capital expenditures in the future
•Expected operating results, such as improved store performance, continued improvement of selling, general and administrative expenses (SG&A) as a percentage of gross profit and any projections
•Our anticipated financial condition and liquidity, including from our cash and the future availability of our credit facilities, unfinanced real estate and other financing sources
•Our continuing to purchase shares under our share repurchase program
•Our compliance with financial and restrictive covenants in our credit facilities and other debt agreements
•Our programs and initiatives for employee recruitment, training, and retention
•Our strategies and targets for customer retention, growth, market position, operations, financial results and risk management
The forward-looking statements contained in this Form 10-Q involve known and unknown risks, uncertainties and situations that may cause our actual results to materially differ from the results expressed or implied by these statements. Certain important factors that could cause actual results to differ from our expectations are discussed in the Risk Factors section of our 20222023 Annual Report on Form 10-K, as supplemented and amended from time to time in Quarterly Reports on Form 10-Q and our other filings with the Securities and Exchange Commission (SEC).
By their nature, forward-looking statements involve risks and uncertainties because they relate to events that depend on circumstances that may or may not occur in the future. You should not place undue reliance on these forward-looking statements. Any forward-looking statement speaks only as of the date on which it is made. We assume no obligation to update or revise any forward-looking statement.
Overview
Lithia and Driveway (LAD) is a premierone of the largest global automotive retailer, offering a wide selectionretailers providing an array of vehicles across global carmakersproducts and providing a full suite of financing, leasing, repair,services throughout the vehicle ownership lifecycle. Simple, convenient and maintenance options. Purchasing and owning a vehicle is easy and hassle-free with convenient solutionstransparent experiences are offered through our comprehensive network of physical locations, e-commerce platforms, and captive finance division.solutions and other synergistic adjacencies. We deliverhave delivered consistent profitable growth through consolidation in a massive and unconsolidated industry. Our highly diversified and competitively differentiated design provides us the automotive retail sectorflexibility and modernizing the retail experiencescale to bepursue our vision to modernize personal transportation solutions wherever, whenever and however our consumers desire. As of March 31, 2023,2024, we operated 332482 locations representing 5051 brands in three countries.
We offer a wide array of products and services fulfilling the entire vehicle ownership lifecycle including new and used vehicles, financing and insurance products and automotive repair and maintenance. We strive for diversification in our products, services, brands and geographic locations to reduce dependence on any one manufacturer, reduce susceptibility to changing consumer preferences, manage market risk and maintain profitability. Our diversification, along with our operating structure, provides a resilient and nimble business model.
| | | | | | | | | | | | | | |
| | MANAGEMENT’S DISCUSSION AND ANALYSIS | | 19 |
We seek to provide customers with a seamless, blended online and physical retail experience, broad selection and access to specialized expertise and knowledge. Our comprehensive network enables us to provide convenient
| | | | | | | | | | | | | | |
| | MANAGEMENT’S DISCUSSION AND ANALYSIS | | 17 |
touch points for customers and provides services throughout the vehicle life cycle. We seek to increase market share and optimize profitability by focusing on the consumer experience and applying proprietary performance measurement systems fueled by data science. Our Driveway and GreenCars brands complimentcomplement our in-store experiences in the United States and provide convenient, simple and transparent platforms that serve as our e-commerce home solutions and allow us to deliver differentiated, proprietary digital experiences. DiversifyingEnhancing our business with Driveway Finance Corporation (DFC), our captive auto finance division, allows us to provide financing solutions for customers and diversify our business model with an adjacent product.
Our long-term strategy to create value for our customers, employees and shareholders includes the following elements:
Driving operational excellence, innovation and diversification
LAD builds magnetic brand loyalty in our 332 locations482 stores and with Driveway, our e-commerce home delivery experience, and GreenCars, our electric vehicle learning resource and marketplace. Operational excellence is achieved by focusing the business on convenient and transparent consumer experiences supported by proprietary data science to improve market share, consumer loyalty, and profitability. By promoting an entrepreneurial model with our in-store experiences, we build strong businesses responsive to each of our local markets. Utilizing performance-based action plans, we develop high-performing teams and foster manufacturer relationships.
In response to evolving consumer preferences, we invest in modernization that supports and expands our core business. These digital strategies combine our experienced, knowledgeable workforce with our owned inventory and physical network of stores, enabling us to be agile and adapt to consumer preferences and market specific conditions. Additionally, we systematically explore transformative adjacencies, which are identified to be synergistic and complementary to our existing business such as DFC, our captive auto loan portfolio.
Our investments in modernization are well under way and are taking hold with our teams as they provide digital shopping experiences including finance, contactless test drives and home delivery or curbside pickup for vehicle purchases. Our people and these solutions power our national brands, overlaying our physical footprint in a way that we believe attracts a larger population of digital consumers seeking transparent, empowered, flexible and simple buying and servicing experiences.
Our performance-based culture is geared toward an incentive-based compensation structure for a majority of our personnel. We develop pay plans that are measured based upon various factors such as customer satisfaction, profitability and individual performance metrics. These plans serve to reward team members for creating customer loyalty, achieving store potential, developing high-performing talent, meeting and exceeding manufacturer requirements and living our core values.
We have centralized many administrative functions to drive efficiencies and streamline store-level operations. The reduction of administrative functions at our stores allows our local managers to focus on customer-facing opportunities to increase revenues and gross profit. Our operations are supported by regional and corporate management, as well as dedicated training and personnel development programs which allow us to share best practices across our network and develop management talent.
Growth through acquisition and network optimization
Our acquisition growth strategy has been successful both financially and culturally. Our disciplined approach focuses on acquiring new vehicle franchises, which operate in markets ranging from mid-sized regional markets to metropolitan markets. Acquisition of these businesses increases our proximity to consumers.consumers throughout North America and the United Kingdom. While we target an annual after tax return of more than 15% for our acquisitions, we have averaged over a 25% return by the third year of ownership due to a disciplined approach focusing on accretive, cash flow positive targets at reasonable valuations. In addition to being financially accretive, acquisitions aim to drive network growth that improves our ability to serve customers through vast selection, greater density and access to customers and ability to leverage national branding and advertising.
As we focus on expanding our physical network of stores, one of the criteria we evaluate is a valuation multiple between 3x to 7x6x of investment in intangibles to estimated annualized adjusted EBITDA, with various factors
| | | | | | | | | | | | | | |
| | MANAGEMENT’S DISCUSSION AND ANALYSIS | | 20 |
including location, ability to expand our network and talent considered in determining value. We also target an investment in intangibles as a percentage of annualized revenues in the range of 15% to 30%.
| | | | | | | | | | | | | | |
| | MANAGEMENT’S DISCUSSION AND ANALYSIS | | 18 |
We regularly optimize and balance our network through strategic divestitures to ensure continued high performance. We believe our disciplined approach provides us with attractive acquisition opportunities and expanded coast-to-coast coverage.
Thoughtful capital allocation
We manage our liquidity and available cash to support our long-term plan focused on growth through acquisitions and investments in our existing business, technology and adjacencies that expand and diversify our business model. In the current market of elevated acquisition pricing, we have adjusted our free cash flow deployment strategy. Under current conditions, including recent trends in our stock price, we may consider repurchases as a more attractive use of funds than acquisitions. Our current free cash flow deployment strategy targetshas shifted to an allocation of 65%50 to 60% investment in acquisitions, 25% investment in capital expenditures, innovation, and diversification and 10%15 to 25% in shareholder return in the form of dividends and share repurchases. During 2023,the first three months of 2024, we utilized $38.9$79.6 million for capital expenditures investing in our existing business and paid $11.5$13.8 million in dividends. As of March 31, 2023,2024, we had available liquidity of $1.4approximately $1.3 billion, which was comprised of $184.9$264.4 million in unrestricted cash, $49.9 million in marketable securities, and $1.2$1.0 billion availability on our credit facilities. In addition, our unfinanced real estate could provide additional liquidity of approximately $0.5$0.3 billion.
| | | | | | | | | | | | | | |
| | MANAGEMENT’S DISCUSSION AND ANALYSIS | | 21 |
Financial Performance
We experienced growth of revenue in 20232024 compared to 2022,2023, primarily driven by increases in volume related to acquisitions, complemented by organic growth in new vehicle retail sales and service, body and parts sales. Gross profit on new and used vehicle retail sales declined compared to 2023 due to continued normalization of margins. Net income decline was primarily driven by this margin normalization, increased interest expense, and increased SG&A as a percentage of gross profit.
| | | | | | | | | | | | | | |
| | MANAGEMENT’S DISCUSSION AND ANALYSIS | | 1922 |
Vehicle Operations
Key performance metrics for revenue and gross profit were as follows:
| | | Three Months Ended March 31, | |
| | | | | Three Months Ended March 31, | |
| | | | | Three Months Ended March 31, | |
| | | | | Three Months Ended March 31, | |
| ($ in millions, except per unit values) | |
| ($ in millions, except per unit values) | |
| ($ in millions, except per unit values) | ($ in millions, except per unit values) | | 2023 | | 2022 | | Change | | | | | | | 2024 | | 2023 | | Change |
| Revenues | Revenues | | | | | | |
| New vehicle retail | |
| New vehicle retail | |
| New vehicle retail | New vehicle retail | | $ | 3,278.9 | | | $ | 3,061.8 | | | 7.1 | % | | | | | | | $ | 4,014.1 | | | $ | | $ | 3,278.9 | | | 22.4 | | 22.4 | % |
| Used vehicle retail | Used vehicle retail | | 2,227.5 | | | 2,234.5 | | | (0.3) | |
| | Finance and insurance | Finance and insurance | | 318.3 | | | 313.2 | | | 1.6 | |
| Finance and insurance | |
| Finance and insurance | |
| Service, body and parts | Service, body and parts | | 736.3 | | | 627.8 | | | 17.3 | |
| | Total revenues | Total revenues | | 6,973.8 | | | 6,705.3 | | | 4.0 | |
| Total revenues | |
| Total revenues | |
| | Gross profit | Gross profit | | |
| Gross profit | |
| Gross profit | |
| New vehicle retail | |
| New vehicle retail | |
| New vehicle retail | New vehicle retail | | $ | 333.8 | | | $ | 401.3 | | | (16.8) | % | | | | | | | $ | 295.3 | | | $ | | $ | 333.8 | | | (11.5) | | (11.5) | % |
| Used vehicle retail | Used vehicle retail | | 165.7 | | | 223.8 | | | (26.0) | |
| | Finance and insurance | Finance and insurance | | 318.3 | | | 313.2 | | | 1.6 | |
| Finance and insurance | |
| Finance and insurance | |
| Service, body and parts | Service, body and parts | | 394.4 | | | 329.0 | | | 19.9 | |
| | Total gross profit | Total gross profit | | 1,211.5 | | | 1,278.1 | | | (5.2) | |
| Total gross profit | |
| Total gross profit | |
| | Gross profit margins | Gross profit margins | | |
| Gross profit margins | |
| Gross profit margins | |
| New vehicle retail | |
| New vehicle retail | |
| New vehicle retail | New vehicle retail | | 10.2 | % | | 13.1 | % | | (290) | bps | | | | | | | 7.4 | % | | 10.2 | % | | (280) | bps |
| Used vehicle retail | Used vehicle retail | | 7.4 | | | 10.0 | | | (260) | |
| | Finance and insurance | Finance and insurance | | 100.0 | | | 100.0 | | | — | |
| Finance and insurance | |
| Finance and insurance | |
| Service, body and parts | Service, body and parts | | 53.6 | | | 52.4 | | | 120 | |
| | Total gross profit margin | Total gross profit margin | | 17.4 | | | 19.1 | | | (170) | |
| Total gross profit margin | |
| Total gross profit margin | |
| | Retail units sold | Retail units sold | | |
| Retail units sold | |
| Retail units sold | |
| New vehicles | |
| New vehicles | |
| New vehicles | New vehicles | | 67,796 | | | 64,942 | | | 4.4 | % | | | | | | | 85,683 | | | 67,796 | | 67,796 | | | 26.4 | | 26.4 | % |
| Used vehicles | Used vehicles | | 78,142 | | | 73,689 | | | 6.0 | |
| | Average selling price per retail unit | Average selling price per retail unit | | |
| Average selling price per retail unit | |
| Average selling price per retail unit | |
| New vehicles | |
| New vehicles | |
| New vehicles | New vehicles | | $ | 48,364 | | | $ | 47,146 | | | 2.6 | % | | | | | | | $ | 46,848 | | | $ | | $ | 48,364 | | | (3.1) | | (3.1) | % |
| Used vehicles | Used vehicles | | 28,506 | | | 30,323 | | | (6.0) | |
| | Average gross profit per retail unit | Average gross profit per retail unit | | |
| Average gross profit per retail unit | |
| Average gross profit per retail unit | |
| New vehicles | |
| New vehicles | |
| New vehicles | New vehicles | | $ | 4,924 | | | $ | 6,179 | | | (20.3) | % | | | | | | | $ | 3,447 | | | $ | | $ | 4,924 | | | (30.0) | | (30.0) | % |
| Used vehicles | Used vehicles | | 2,120 | | | 3,037 | | | (30.2) | |
| Finance and insurance | Finance and insurance | | 2,181 | | | 2,260 | | | (3.5) | |
Total vehicle 1 | Total vehicle 1 | | 5,585 | | | 6,825 | | | (18.2) | |
1Includes the sales and gross profit related to new, used retail, used wholesale and finance and insurance and unit sales for new and used retail.
| | | | | | | | | | | | | | |
| | MANAGEMENT’S DISCUSSION AND ANALYSIS | | 2023 |
Same Store Operating Data
We believe that same store comparisons are an important indicator of our financial performance. Same store measures demonstrate our ability to grow revenues in our existing locations. As a result, same store measures have been integrated into the discussion below.
Same store measures reflect results for stores that were operating in each comparison period and only include the months when operations occurred in both periods. For example, a store acquired in February 20222023 would be included in same store operating data beginning in March 2023,2024, after its first full complete comparable month of operation. The first quarter operating results for the same store comparisons would include results for that store in only the month of March for both comparable periods.
| | | Three Months Ended March 31, | |
| | | | | Three Months Ended March 31, | |
| | | | | Three Months Ended March 31, | |
| | | | | Three Months Ended March 31, | |
| ($ in millions, except per unit values) | |
| ($ in millions, except per unit values) | |
| ($ in millions, except per unit values) | ($ in millions, except per unit values) | | 2023 | | 2022 | | Change | | | | | | | 2024 | | 2023 | | Change |
| Revenues | Revenues | | | | | | |
| New vehicle retail | |
| New vehicle retail | |
| New vehicle retail | New vehicle retail | | $ | 2,900.4 | | | $ | 2,996.8 | | | (3.2) | % | | | | | | | $ | 3,261.0 | | | $ | | $ | 3,188.7 | | | 2.3 | | 2.3 | % |
| Used vehicle retail | Used vehicle retail | | 1,990.9 | | | 2,184.9 | | | (8.9) | |
| Finance and insurance | Finance and insurance | | 284.7 | | | 305.6 | | | (6.8) | |
| Service, body and parts | Service, body and parts | | 669.9 | | | 612.6 | | | 9.4 | |
| Total revenues | Total revenues | | 6,218.2 | | | 6,555.5 | | | (5.1) | |
| | Gross profit | Gross profit | | |
| Gross profit | |
| Gross profit | |
| New vehicle retail | |
| New vehicle retail | |
| New vehicle retail | New vehicle retail | | $ | 295.3 | | | $ | 392.3 | | | (24.7) | % | | | | | | | $ | 235.7 | | | $ | | $ | 323.5 | | | (27.1) | | (27.1) | % |
| Used vehicle retail | Used vehicle retail | | 148.4 | | | 218.3 | | | (32.0) | |
| Finance and insurance | Finance and insurance | | 284.7 | | | 305.6 | | | (6.8) | |
| Service, body and parts | Service, body and parts | | 355.6 | | | 321.2 | | | 10.7�� | |
| Total gross profit | Total gross profit | | 1,082.7 | | | 1,248.2 | | | (13.3) | |
| | Gross profit margins | Gross profit margins | | |
| Gross profit margins | |
| Gross profit margins | |
| New vehicle retail | |
| New vehicle retail | |
| New vehicle retail | New vehicle retail | | 10.2 | % | | 13.1 | % | | (290) | bps | | | | | | | 7.2 | % | | 10.1 | % | | (290) | bps |
| Used vehicle retail | Used vehicle retail | | 7.5 | | | 10.0 | | | (250) | |
| Finance and insurance | Finance and insurance | | 100.0 | | | 100.0 | | | — | |
| Service, body and parts | Service, body and parts | | 53.1 | | | 52.4 | | | 70 | |
| Total gross profit margin | Total gross profit margin | | 17.4 | | | 19.0 | | | (160) | |
| | Retail units sold | Retail units sold | | |
| Retail units sold | |
| Retail units sold | |
| New vehicles | |
| New vehicles | |
| New vehicles | New vehicles | | 59,440 | | | 63,439 | | | (6.3) | % | | | | | | | 68,373 | | | 65,980 | | 65,980 | | | 3.6 | | 3.6 | % |
| Used vehicles | Used vehicles | | 70,157 | | | 71,890 | | | (2.4) | |
| | Average selling price per retail unit | Average selling price per retail unit | | |
| Average selling price per retail unit | |
| Average selling price per retail unit | |
| New vehicles | |
| New vehicles | |
| New vehicles | New vehicles | | $ | 48,795 | | | $ | 47,238 | | | 3.3 | % | | | | | | | $ | 47,695 | | | $ | | $ | 48,328 | | | (1.3) | | (1.3) | % |
| Used vehicles | Used vehicles | | 28,377 | | | 30,393 | | | (6.6) | |
| | Average gross profit per retail unit | Average gross profit per retail unit | | |
| Average gross profit per retail unit | |
| Average gross profit per retail unit | |
| New vehicles | |
| New vehicles | |
| New vehicles | New vehicles | | $ | 4,968 | | | $ | 6,183 | | | (19.7) | % | | | | | | | $ | 3,448 | | | $ | | $ | 4,903 | | | (29.7) | | (29.7) | % |
| Used vehicles | Used vehicles | | 2,116 | | | 3,037 | | | (30.3) | |
| Finance and insurance | Finance and insurance | | 2,197 | | | 2,259 | | | (2.7) | |
Total vehicle 1 | Total vehicle 1 | | 5,596 | | | 6,830 | | | (18.1) | |
1Includes the sales and gross profit related to new, used retail, used wholesale and finance and insurance and unit sales for new and used retail.
New Retail Vehicles
We believe that our new vehicle retail sales create incremental profit opportunities through certain manufacturer incentive programs, arranging of third-party financing, vehicle service and insurance contracts, future resale of used vehicles acquired through trade-in, and parts and service work. Our leaders in each market continue to adapt to changing conditions, respond to customer needs and manage inventory availability and selection.
| | | | | | | | | | | | | | |
| | MANAGEMENT’S DISCUSSION AND ANALYSIS | | 2124 |
YTD 20232024 vs. YTD 20222023
New vehiclesvehicle retail revenue for the three months ended March 31, 20232024 increased 7.1%22.4% compared to the same period of 20222023 primarily due to acquisition activity and increased average selling prices.activity. Same store new vehicle retail revenue decreased 3.2%increased 2.3% due to a decreasean increase in unit volume of 6.3%3.6%, partially offset by an increasea decrease in average selling prices of 3.3%1.3%.
Same store new vehicle retail gross profit per unit decreased 19.7% due to29.7%, driven by a 6.3 % decrease in units sold and anew vehicle retail gross profit margins of 290 bps decrease in gross margins.bps. Total same store new vehicle retail gross profit per unit, which includes the finance and insurance revenue generated from the sales of new retail vehicles, decreased $1,055$1,640 to $7,500.$5,771.
Used Retail Vehicles
Used vehicle retail sales are a strategic focus for organic growth. We offer three categories of used vehicles: manufacturer certified pre-owned (CPO) vehicles; core vehicles, or late-model vehicles with lower mileage; and value autos, or vehicles with over 80,000 miles. We continue to focus on procuring vehicles across the full spectrum of the addressable used vehicle market to provide customers with a wide selection meeting all levels of affordability, driving increased used vehicle unit volumes. Our used vehicle operations provide an opportunity to generate sales to customers unable or unwilling to purchase a new vehicle, sell brands other than the store’s new vehicle franchise(s) and increase sales from finance and insurance and parts and service.
We have established a company-wide target of achieving a per store average of 100 used retail units per month. Strategies to achieve this target include reducing wholesale sales and selling the full spectrum of used units, from late model CPO models to vehicles up to twenty years old. For the trailing twelve months ended March 31, 2023,2024, our stores sold an average of 9084 used vehicles per store per month.
YTD 20232024 vs. YTD 20222023
Used vehicle retail revenue for the three months ended March 31, 2023 decreased 0.3%2024 increased 25.7% compared to the same period of 2022 due to decreased average selling prices, partially offset2023 driven by increased volume due to acquisition activity. On a same store basis, used vehicle retail sales decreased 8.9%5.0% due to a decrease of 6.6% in average selling prices of 3.5% and decreaseda decrease in unit volume of 2.4%1.6%. Volume decreases were driven by decreasing volumes associated with core vehicles and value autos, partially offset by increasing volume of certified vehicles. Total same store used vehicle retail gross profit per unit, which includes the finance and insurance revenue generated from the sales of used retail used vehicles, decreased $1,325$154 to $3,982.$3,901.
Finance and Insurance
We believe that arranging vehicle financing is an important part of our ability to sell vehicles, and we attempt to arrange financing for every vehicle we sell. We also offer related products such as extended warranties, insurance contracts and vehicle and theft protection which drive continued engagement with the consumer throughout the ownership lifecycle.
YTD 20232024 vs. YTD 20222023
Total finance and insurance income increased 1.6%7.0% in the three months ended March 31, 20232024 compared to the same period of 2022.2023, driven by acquisition activity. Same store finance and insurance revenues decreased 6.8%. Revenue decreases were highlighted4.8%, driven by a decline in finance reserve revenues as we increase ourservice contract penetration rates associated with Financing Operations and the growth of our captive auto loan and lease portfolio businesses, partially offset by revenue increases associated with service contracts.rates. On a same store basis, our finance and insurance revenue per retail unit decreased $62$123 to $2,197.$2,080.
Service, body and parts
We provide automotive repair and maintenance services for customers for the new vehicle brands sold by our stores, as well as service and repairs for most other makes and models. These after sales services are an integral part of our customer retention and the largest contributor to our overall profitability. Earnings from after sales continue to prove to be more resilient during economic downturns, when owners tend to repair their existing vehicles rather than buy new vehicles.
YTD 20232024 vs. YTD 20222023
Our service, body, and parts revenue increased 17.3%24.0% in the three months ended March 31, 20232024 compared to the same period of 2022,2023, driven by acquisitions, as well as increasesan increase in warranty and customer pay revenues. We believeSame store customer pay revenues was the increased number of units in operation will continue to benefit our service, body and parts revenue in the coming years as more late-model vehicles age, necessitating repairs and maintenance.
| | | | | | | | | | | | | | |
| | MANAGEMENT’S DISCUSSION AND ANALYSIS | | 22 |
We focus on retaining customers by offering competitively-priced routine maintenance and through our marketing efforts. The largest contribution to our service, body and parts revenue was same store customer pay revenue of $369.7at $414.8 million.
Same store service, body and parts gross profit increased 10.7%6.6%. This increase was primarily due to increased volumes of warranty and customer pay transactions. Overall same store service, body, and parts gross margins
| | | | | | | | | | | | | | |
| | MANAGEMENT’S DISCUSSION AND ANALYSIS | | 25 |
increased 70180 bps, primarily as a result of our mix continuing to shift towards customer pay, which has higher margins than other service work. Same store customer pay gross margin increased 5030 bps.
Financing Operations
In the United States, Financing Operations offers loans and leases to consumers across the full credit spectrum for both new and used vehicles through two entities, DFC and Pfaff Leasing. DFC is a captive lender, originating loans only from our stores in the United States and Driveway. Pfaff LeasingIn Canada, Financing Operations originates loans and leases from both our Canadian stores and third-party dealerships. Our stores do not exclusivelyIn the United Kingdom, Financing Operations is related to our fleet management leasing operations. Financing Operations provides an opportunity to capture additional profits, cash flows, and sales while managing our reliance on third-party finance vehicles through DFC or Pfaff Leasing, rather originations are earned on a competitive basis with other lenders. We target growing penetration to 15% of retail units by 2025.sources.
Financing Operations income reflects the interest fee, and leasefee income generated by DFC and Pfaff Leasing’sthe portfolio of auto loan and finance lease receivables, plus the lease income generated by our net investment in operating leases, less the interest expensesexpense associated with the debt utilized to fund the lending, including internal capital, a provision for estimated loan and lease losses, that include the effect of net charge-offs, depreciation on vehicles leased via operating leases, and directly-related expenses.
Selected Financing Operations Financial Information
| | | Three Months Ended March 31, |
| | | Three Months Ended March 31, | |
| | | Three Months Ended March 31, | |
| | | Three Months Ended March 31, | |
| ($ in millions) | ($ in millions) | | 2023 | | % 1 | | 2022 | | % 1 | ($ in millions) | | | | | | | | | 2024 | | % 1 | | 2023 | | % 1 |
| Interest margin: | Interest margin: | | | | | | | | |
| Interest, fee, and lease income | | $ | 53.9 | | | 8.9 | | | $ | 22.4 | | | 9.7 | |
| Interest and fee income | |
| Interest and fee income | |
| Interest and fee income | |
| Interest expense | Interest expense | | (37.5) | | | (6.2) | | | (3.8) | | | (1.7) | |
| Total interest margin | Total interest margin | | $ | 16.4 | | | 2.7 | | | $ | 18.6 | | | 8.1 | |
| | Lease income | |
| Depreciation and amortization | |
| Depreciation and amortization | |
| Depreciation and amortization | |
| Lease income, net | |
| Lease income, net | |
| Lease income, net | |
| Selling, general and administrative | |
| Selling, general and administrative | |
| Selling, general and administrative | |
| Provision expense | Provision expense | | $ | (26.3) | | | (4.3) | | | $ | (3.7) | | | (1.6) | |
| | Financing operations income (loss) | | $ | (20.8) | | | (3.4) | | | $ | 5.0 | | | 2.2 | |
| Provision expense | |
| Provision expense | |
| Financing operations loss | |
| | Total average managed finance receivables | Total average managed finance receivables | | $ | 2,461.9 | | | $ | 932.0 | | |
| | Total average managed finance receivables | |
| | Total average managed finance receivables | |
1Annualized percentage of total average managed finance receivables.
DFC Portfolio Information1
| | | | | | | | | | | | | | | |
| | | Three Months Ended March 31, |
| ($ in millions) | | | | | 2023 | | 2022 |
| Loan origination information | | | | | | | |
| Net loans originated | | | | | $ | 629.1 | | | $ | 294.5 | |
| Vehicle units financed | | | | | 20,928 | | | 8,680 | |
Total penetration rate 2 | | | | | 14.3 | % | | 6.3 | % |
| Weighted average contract rate | | | | | 9.0 | % | | 7.9 | % |
Weighted average credit score 3 | | | | | 731 | | | 690 | |
Weighted average FE LTV 4 | | | | | 95.9 | % | | 104.3 | % |
Weighted average term (in months) | | | | | 73 | | | 73 | |
| | | | | | | |
| Loan performance information | | | | | | | |
| Total ending managed receivables | | | | | $ | 2,516.0 | | | $ | 928.2 | |
| Total average managed receivables | | | | | $ | 2,312.7 | | | $ | 826.5 | |
| Allowance for loan losses | | | | | $ | 78.0 | | | $ | 26.2 | |
| Allowance for loan losses as a percentage of ending managed receivables | | | | | 3.1 | % | | 2.8 | % |
| Net credit losses on managed receivables | | | | | 13.4 | | | 6.1 | |
| Net credit losses as a percentage of total average managed receivables | | | | | 0.6 | % | | 0.7 | % |
Past due accounts as a percentage of ending managed receivables 5 | | | | | 3.7 | % | | 4.0 | % |
Average recovery rate 6 | | | | | 53.9 | % | | 67.5 | % |
| | | | | | | | | | | | | | |
| | MANAGEMENT’S DISCUSSION AND ANALYSIS | | 23 |
| | | | | | | | | | | | | | | |
| | | Three Months Ended March 31, |
| ($ in millions) | | | | | 2024 | | 2023 |
| Loan origination information | | | | | | | |
| Net loans originated | | | | | $ | 492.8 | | | $ | 629.1 | |
| Vehicle units financed | | | | | 17,219 | | | 20,928 | |
Total penetration rate 2 | | | | | 11.7 | % | | 14.3 | % |
| Weighted average contract rate | | | | | 10.2 | % | | 9.0 | % |
Weighted average credit score 3 | | | | | 735 | | | 731 | |
Weighted average FE LTV 4 | | | | | 95.2 | % | | 95.9 | % |
Weighted average term (in months) | | | | | 72 | | | 73 | |
| | | | | | | |
| Loan performance information | | | | | | | |
| Total ending managed receivables | | | | | $ | 3,349.7 | | | $ | 2,516.0 | |
| Total average managed receivables | | | | | $ | 3,263.7 | | | $ | 2,312.7 | |
| Allowance for loan losses | | | | | $ | 107.9 | | | $ | 78.0 | |
| Allowance for loan losses as a percentage of ending managed receivables | | | | | 3.2 | % | | 3.1 | % |
| Net credit losses on managed receivables | | | | | 19.3 | | | 13.4 | |
| Annualized net credit losses as a percentage of total average managed receivables | | | | | 2.4 | % | | 2.3 | % |
Past due accounts as a percentage of ending managed receivables 5 | | | | | 3.8 | % | | 3.7 | % |
Average recovery rate 6 | | | | | 43.2 | % | | 53.9 | % |
1Excludes Pfaff Leasing PortfolioCanadian portfolio
2Units financed as a percentage of total new and used vehicle retail units sold.
| | | | | | | | | | | | | | |
| | MANAGEMENT’S DISCUSSION AND ANALYSIS | | 26 |
3The credit scores represent FICO scores and reflect only receivables with obligors that have a FICO score at the time of application. For receivables with co-borrowers, the FICO score is the primary borrower’s. FICO scores are not a significant factor in our proprietary credit model, which relies on information from credit bureaus and other application information as discussed in Note 4 – Finance Receivables.information.
4Front-end loan-to-value represents the ratio of the amount financed to the total collateral value, which is measured as the vehicle selling price plus applicable taxes, title and fees.
5Past due is defined asmeans loans that have been on the books greater than or equal toat least 3 months andold that are 30 or more days delinquent
6The average recovery rate represents the average percentage of the outstanding principal balance we receive when a vehicle is repossessed and liquidated, generally at wholesale auctions.
YTD 2024 vs. YTD 2023
Financing operations loss decreased in the three months ended March 31, 2024 compared to the same period of 2023 primarily due to the addition of the UK Financing Operations business and increased contract rates to borrowers, resulting in an expansion of total interest margin to 3.5%.
The weighted average contract rate on loans originated in the three months ended March 31, 2024 increased to 10.2%, compared with 9.0% in the same period of 2023. The decrease in provision expense compared to the year ago quarter reflected the increased credit quality of the portfolio and strong performance of our operational teams. The decrease in selling, general and administrative expenses as a percentage of receivables compared to the year ago quarter reflected improved operational performance and economies of scale.
Operating Expenses
Selling, General and Administrative Expense (SG&A)
SG&A includes salaries and related personnel expenses, advertising (net of manufacturer cooperative advertising credits), rent, facility costs, and other general corporate expenses.
YTD 20232024 vs. YTD 20222023
| | | | Three Months Ended March 31, | | Increase (Decrease) | | % Increase (Decrease) | | Three Months Ended March 31, | | Increase | | % Increase |
| ($ in millions) | ($ in millions) | 2023 | | 2022 | |
| Personnel | |
| Personnel | |
| Personnel | Personnel | $ | 509.0 | | | $ | 514.2 | | | $ | (5.2) | | | (1.0) | % | $ | 602.4 | | | $ | | $ | 509.0 | | | $ | | $ | 93.4 | | | 18.3 | | 18.3 | % |
| Advertising | Advertising | 59.9 | | | 58.4 | | | 1.5 | | | 2.6 | |
| Rent | Rent | 18.9 | | | 17.6 | | | 1.3 | | | 7.4 | |
Facility costs 1 | Facility costs 1 | 41.3 | | | 35.7 | | | 5.6 | | | 15.7 | |
| Gain on sale of assets | Gain on sale of assets | (7.1) | | | (9.0) | | | 1.9 | | | NM | Gain on sale of assets | (1.0) | | | (7.1) | | (7.1) | | | 6.1 | | 6.1 | | | NM | | NM |
| Other | Other | 142.4 | | | 123.0 | | | 19.4 | | | 15.8 | |
| Total SG&A | Total SG&A | $ | 764.4 | | | $ | 739.9 | | | $ | 24.5 | | | 3.3 | % | Total SG&A | $ | 934.3 | | | $ | | $ | 764.4 | | | $ | | $ | 169.9 | | | 22.2 | | 22.2 | % |
1Includes variable lease costs related to the reimbursement of actual costs incurred by our lessors for common area maintenance, property taxes and insurance on leased property.
NM - not meaningful
| | | | Three Months Ended March 31, | | Increase | | Three Months Ended March 31, | | Increase (Decrease) |
| As a % of gross profit | As a % of gross profit | 2023 | | 2022 | |
| Personnel | Personnel | 42.0 | % | | 40.2 | % | | 180 | bps |
| Personnel | |
| Personnel | | 45.1 | % | | 42.0 | % | | 310 | bps |
| Advertising | Advertising | 4.9 | | | 4.6 | | | 30 | |
| Rent | Rent | 1.6 | | | 1.4 | | | 20 | |
| Facility costs | Facility costs | 3.4 | | | 2.8 | | | 60 | |
| (Gain) loss on sale of assets | (0.6) | | | (0.7) | | | 10 | |
| Gain on sale of assets | |
| Other | Other | 11.8 | | | 9.6 | | | 220 | |
| Total SG&A | Total SG&A | 63.1 | % | | 57.9 | % | | 520 | bps | Total SG&A | 70.0 | % | | 63.1 | % | | 690 | bps |
SG&A as a percentage of gross profit was 63.1%70.0% for the three months ended March 31, 20232024 compared to 57.9%63.1% for the same period of 2022.2023. Total SG&A expense increased 3.3%22.2%, driven by increases in mostall areas, primarily as a result of our network expansiongrowth in 2022, partially offset by efforts in personnel efficiency.the United Kingdom.
On a same store basis and excluding non-core charges, SG&A as a percentage of gross profit was 63.3%66.9% compared to 57.9%62.8% for the same period of 2022.2023. The increase was impacted by both increasedprimarily related to the decrease in gross profit exceeding the decrease in same store SG&A costs and decreased gross profit.costs.
| | | | | | | | | | | | | | |
| | MANAGEMENT’S DISCUSSION AND ANALYSIS | | 27 |
SG&A expense adjusted for non-core charges was as follows:
| | | | | | | | | | | | | | |
| | MANAGEMENT’S DISCUSSION AND ANALYSIS | | 24 |
YTD 20232024 vs. YTD 20222023
| | | | Three Months Ended March 31, | | Increase (Decrease) | | % Increase (Decrease) | | Three Months Ended March 31, | | Increase (Decrease) | | % Increase |
| ($ in millions) | ($ in millions) | 2023 | | 2022 | |
| Personnel | Personnel | $ | 509.0 | | | $ | 514.2 | | | $ | (5.2) | | | (1.0) | % |
| Personnel | |
| Personnel | | $ | 602.4 | | | $ | 509.0 | | | $ | 93.4 | | | 18.3 | % |
| Advertising | Advertising | 59.9 | | | 58.4 | | | 1.5 | | | 2.6 | % | Advertising | 63.4 | | | 59.9 | | 59.9 | | | 3.5 | | 3.5 | | | 5.8 | | 5.8 | % |
| Rent | Rent | 18.9 | | | 17.6 | | | 1.3 | | | 7.4 | % | Rent | 30.4 | | | 18.9 | | 18.9 | | | 11.5 | | 11.5 | | | 60.8 | | 60.8 | % |
Facility costs1 | Facility costs1 | 41.3 | | | 35.7 | | | 5.6 | | | 15.7 | % | Facility costs1 | 58.8 | | | 41.3 | | 41.3 | | | 17.5 | | 17.5 | | | 42.4 | | 42.4 | % |
| Adjusted loss on sale of assets | 0.1 | | | 1.0 | | | (0.9) | | | NM |
| Adjusted (gain) loss on sale of assets | | Adjusted (gain) loss on sale of assets | (1.0) | | | 0.1 | | | (1.1) | | | NM |
| Adjusted other | Adjusted other | 130.9 | | | 116.4 | | | 14.5 | | | 12.5 | % | Adjusted other | 172.6 | | | 130.9 | | 130.9 | | | 41.7 | | 41.7 | | | 31.9 | | 31.9 | % |
| Adjusted total SG&A | Adjusted total SG&A | $ | 760.1 | | | $ | 743.3 | | | $ | 16.8 | | | 2.3 | % | Adjusted total SG&A | $ | 926.6 | | | $ | | $ | 760.1 | | | $ | | $ | 166.5 | | | 21.9 | | 21.9 | % |
1Includes variable lease costs related to the reimbursement of actual costs incurred by our lessors for common area maintenance, property taxes and insurance on leased property.
NM - not meaningful
| | | |
| | | | Three Months Ended March 31, | | Increase (Decrease) | |
| As a % of gross profit | As a % of gross profit | 2023 | | 2022 | | |
| As a % of gross profit | |
| As a % of gross profit | |
| Personnel | |
| Personnel | |
| Personnel | Personnel | 42.0 | % | | 40.2 | % | | 180 | bps | |
| Advertising | Advertising | 4.9 | | | 4.6 | | | 30 | | |
| Advertising | |
| Advertising | |
| Rent | |
| Rent | |
| Rent | Rent | 1.6 | | | 1.4 | | | 20 | | |
| Facility costs | Facility costs | 3.4 | | | 2.8 | | | 60 | | |
| Facility costs | |
| Facility costs | |
| Adjusted gain on sale of assets | |
| Adjusted gain on sale of assets | |
| Adjusted gain on sale of assets | Adjusted gain on sale of assets | — | | | 0.1 | | | (10) | | |
| Adjusted other | Adjusted other | 10.8 | | | 9.1 | | | 170 | | |
| Adjusted other | |
| Adjusted other | |
| Adjusted total SG&A | Adjusted total SG&A | 62.7 | % | | 58.2 | % | | 450 | bps | |
| Adjusted total SG&A | |
| Adjusted total SG&A | |
Adjusted SG&A for the three months ended March 31, 2024 excludes $7.7 million in acquisition-related expenses.
Adjusted SG&A for the three months ended March 31, 2023 excludes $10.1 million in one-time vendor contract buyouts, $1.3 million in acquisition-related expenses and $0.1 million in storm insurance reserve charges, andoffset by a $7.2 million net gain on store disposals.
Adjusted SG&A for the three months ended March 31, 2022 excludes $6.6 million in acquisition-related expenses andis a $10.0 million net gain on store disposals.
non-GAAP measure. See “Non-GAAP Reconciliations” for more details.
Floor Plan Interest Expense and Floor Plan Assistance
Floor plan assistance is provided by manufacturers to support store financing of new vehicle inventory and is recorded as a component of new vehicle gross profit when the specific vehicle is sold. However, because manufacturers provide this assistance to offset inventory carrying costs, we believe a comparison of floor plan interest expense to floor plan assistance is a useful measure of the efficiency of our new vehicle sales relative to stocking levels.
Shown below are the details for carrying costs for new vehicles net of floor plan assistance earned:
YTD 20232024 vs. YTD 20222023
| | | | | | | | | | | | | | | | | | | | | | | |
| | Three Months Ended March 31, | | | | % |
| ($ in millions) | 2023 | | 2022 | | Change | | Change |
| Floor plan interest expense (new vehicles) | $ | 27.7 | | | $ | 4.9 | | | $ | 22.8 | | | 465.3 | % |
| Floor plan assistance (included as an offset to cost of sales) | (34.5) | | | (31.2) | | | (3.3) | | | 10.6 | |
| Net new vehicle carrying costs | $ | (6.8) | | | $ | (26.3) | | | $ | 19.5 | | | (74.1) | |
NM - Not meaningful | | | | | | | | | | | | | | | | | | | | | | | |
| | Three Months Ended March 31, | | | | % |
| ($ in millions) | 2024 | | 2023 | | Change | | Change |
| Floor plan interest expense (new vehicles) | $ | 60.7 | | | $ | 27.7 | | | $ | 33.0 | | | 119.1 | % |
| Floor plan assistance (included as an offset to cost of sales) | (40.0) | | | (34.5) | | | (5.5) | | | 15.9 | |
| Net new vehicle carrying costs (benefit) | $ | 20.7 | | | $ | (6.8) | | | $ | 27.5 | | | (404.4) | |
Floor plan interest expense increased $22.8$33.0 million in the three months ended March 31, 20232024 compared to the same period of 2022. This increase was2023 due to rising interest rates and increased inventory levels.
Depreciation and Amortization
Depreciation and amortization is comprised of depreciation expense related to buildings, significant remodels or improvements, furniture, tools, equipment, signage, and amortization of certain intangible assets, including customer lists.
| | | | | | | | | | | | | | |
| | MANAGEMENT’S DISCUSSION AND ANALYSIS | | 2528 |
YTD 20232024 vs. YTD 20222023
| | | | Three Months Ended March 31, | | Increase | | % Increase | | Three Months Ended March 31, | | Increase | | % Increase |
| ($ in millions) | ($ in millions) | 2023 | | 2022 | |
| Depreciation and amortization | Depreciation and amortization | $ | 47.3 | | | $ | 36.5 | | | $ | 10.8 | | | 29.6 | % |
| Depreciation and amortization | |
| Depreciation and amortization | | $ | 57.8 | | | $ | 47.3 | | | $ | 10.5 | | | 22.2 | % |
Acquisition activity contributed to the increasesincrease in depreciation and amortization in 20232024 compared to 2022.2023. We acquired approximately $391 million$1.0 billion of depreciable property as part of our acquisition activity over the twelve months ended March 31, 2023.2024. For the three months ended March 31, 2023,2024, we invested $38.9$79.6 million in capital expenditures. These investments increased the amount of depreciation expense in the three months ended March 31, 2023.2024. See the discussion under “Liquidity and Capital Resources” for additional information.
Operating Income
Operating income as a percentage of revenue, or operating margin, was as follows:
YTD 20232024 vs. YTD 20222023
| | | |
| | |
| | |
| | | | Three Months Ended March 31, | |
| | | 2023 | | 2022 | |
| Operating margin | Operating margin | 5.4 | % | | 7.6 | % | |
| Operating margin | |
| Operating margin | |
Operating margin adjusted for non-core charges 1 | Operating margin adjusted for non-core charges 1 | 5.5 | % | | 7.5 | % | |
Operating margin adjusted for non-core charges 1 | |
Operating margin adjusted for non-core charges 1 | |
1See “Non-GAAP Reconciliations” for more details.
Operating margin decreased 220140 bps in the three months ended March 31, 20232024 compared to the same period in 2022,2023, primarily due to increased SG&A of 22.2% and a 5.2%10.2% decrease in gross profit and a 3.3% increase in SG&A.profit.
Non-Operating Expenses
Other Interest Expense
Other interest expense includes interest on senior notes, debt incurred related to acquisitions, real estate mortgages, used and service loaner vehicle inventory financing commitments, and revolving lines of credit.
YTD 20232024 vs. YTD 20222023
| | | | Three Months Ended March 31, | | Increase | | % Increase | | Three Months Ended March 31, | | Increase | | % Increase |
| ($ in millions) | ($ in millions) | 2023 | | 2022 | |
| Mortgage interest | Mortgage interest | $ | 7.9 | | | $ | 5.4 | | | $ | 2.5 | | | 46.3 | % |
| Mortgage interest | |
| Mortgage interest | | $ | 11.3 | | | $ | 7.9 | | | $ | 3.4 | | | 43.0 | % |
| Other interest | Other interest | 31.9 | | | 21.3 | | | 10.6 | | | 49.8 | |
| Capitalized interest | Capitalized interest | (0.8) | | | (0.5) | | | 0.3 | | | NM | Capitalized interest | (1.3) | | | (0.8) | | (0.8) | | | 0.5 | | 0.5 | | | NM | | NM |
| Total other interest expense | Total other interest expense | $ | 39.0 | | | $ | 26.2 | | | $ | 12.8 | | | 48.9 | % |
NM - not meaningful
Other interest expense for the three months ended March 31, 20232024 increased $12.8$24.6 million related to increased borrowings and interest rates compared to the same period of 2022.2023.
Other Income (Expense), net
YTD 2023 vs. YTD 2022
| | | | | | | | | | | | | | | | | | | | | | | |
| | Three Months Ended March 31, | | Decrease | | % Decrease |
| ($ in millions) | 2023 | | 2022 | | |
| Other income (expense), net | $ | 2.0 | | | $ | (5.8) | | | $ | 7.8 | | | (134.5) | % |
Other income (expense), net in the three months ended March 31, 2023 was primarily related to certain manufacturer incentives, offset by a $0.5 million unrealized investment loss associated with the change in fair value of our investment in Shift Technologies, Inc. and a $1.1 million loss due to foreign currency exchange. These
| | | | | | | | | | | | | | |
| | MANAGEMENT’S DISCUSSION AND ANALYSIS | | 2629 |
compare to a $14.9 million unrealized investment loss associated with the change in fair value of our investment in Shift Technologies, Inc. and a $3.6 million gain due to foreign currency exchange in the three months ended March 31, 2022.
Income Tax Provision
Our effective income tax rate was as follows:
| | | |
| | |
| | |
| | | | | Three Months Ended March 31, |
| | | | 2023 | | 2022 |
| Effective income tax rate | Effective income tax rate | | 26.9 | % | | 26.8 | % |
| Effective income tax rate excluding other non-core items | | 26.9 | % | | 26.1 | % |
| Effective income tax rate | |
| Effective income tax rate | |
| Effective income tax rate excluding non-core items | |
| Effective income tax rate excluding non-core items | |
| Effective income tax rate excluding non-core items | |
Our effective income tax rate for the three months ended March 31, 20232024 compared to last year was negativelypositively affected by a decreasereduction in the current and deferred state tax rate due to the impact of global network expansion on worldwide combined reporting states, filing elections and statutory rate changes. Our rate was also positively affected by an increase in tax benefit from stock awards vesting in the current period a decreaseand an increase in forecasted pre-tax income, and valuation allowance recorded for certain deferred tax assets not expected to be realized. The valuation allowance impact to the 2023 effective income tax rate was less than the impact to the 2022 effective income tax rate.general business credits. Excluding the valuation allowance and other non-core charges, we estimate our annual effective income tax rate to be 27.0%26.0%.
Non-GAAP Reconciliations
Non-GAAP measures do not have definitions under GAAP and may be defined differently by and not comparable to similarly titled measures used by other companies. As a result, we review any non-GAAP financial measures in connection with a review of the most directly comparable measures calculated in accordance with GAAP. We caution you not to place undue reliance on such non-GAAP measures, but also to consider them with the most directly comparable GAAP measures. We believe each of the non-GAAP financial measures below improves the transparency of our disclosures, provides a meaningful presentation of our results from the core business operations because they exclude items not related to our ongoing core business operations and other non-cash items, and improves the period-to-period comparability of our results from the core business operations. We use these measures in conjunction with GAAP financial measures to assess our business, including our compliance with covenants in our credit facility and in communications with our Board of Directors concerning financial performance. These measures should not be considered an alternative to GAAP measures.
The following tables reconcile certain reported non-GAAP measures, which we refer to as “adjusted,” to the most comparable GAAP measure from our Consolidated Statements of Operations.
| | | | | | | | | | | | | | | | | | | | | | | | | | | | | | | | | | | | | | | | | | | | | | | | |
| | | Three Months Ended March 31, 2023 |
| (in millions, except per share amounts) | | As reported | | Net disposal gain on sale of stores | | | | Investment loss | | Insurance reserves | | Acquisition expenses | | Vendor contract buyouts | | | | Adjusted |
| | | | | | | | | | | | | | | | | | |
| Selling, general and administrative | | $ | 764.4 | | | $ | 7.2 | | | | | $ | — | | | $ | (0.1) | | | $ | (1.3) | | | $ | (10.1) | | | | | $ | 760.1 | |
| Operating income (loss) | | 379.0 | | | (7.2) | | | | | — | | | 0.1 | | | 1.3 | | | 10.1 | | | | | 383.3 | |
| Other income (expense), net | | 2.0 | | | — | | | | | 0.5 | | | — | | | — | | | — | | | | | 2.5 | |
| | | | | | | | | | | | | | | | | | |
| Income (loss) before income taxes | | $ | 314.3 | | | $ | (7.2) | | | | | $ | 0.5 | | | $ | 0.1 | | | $ | 1.3 | | | 10.1 | | | | | $ | 319.1 | |
| Income tax (provision) benefit | | (84.7) | | | 1.9 | | | | | — | | | — | | | (0.2) | | | (2.7) | | | | | (85.7) | |
| Net income (loss) | | 229.6 | | | (5.3) | | | | | 0.5 | | | 0.1 | | | 1.1 | | | 7.4 | | | | | 233.4 | |
| Net income attributable to non-controlling interest | | (0.7) | | | — | | | | | — | | | — | | | — | | | — | | | | | (0.7) | |
| Net income attributable to redeemable non-controlling interest | | (0.2) | | | — | | | | | — | | | — | | | — | | | — | | | | | (0.2) | |
| Net income (loss) attributable to Lithia Motors, Inc. | | $ | 228.7 | | | $ | (5.3) | | | | | $ | 0.5 | | | $ | 0.1 | | | $ | 1.1 | | | $ | 7.4 | | | | | $ | 232.5 | |
| | | | | | | | | | | | | | | | | | |
| Diluted earnings (loss) per share attributable to Lithia Motors, Inc. | | $ | 8.30 | | | $ | (0.19) | | | | | $ | 0.02 | | | $ | — | | | $ | 0.04 | | | $ | 0.27 | | | | | $ | 8.44 | |
| Diluted share count | | 27.5 | | | | | | | | | | | | | | | | | |
| | | | | | | | | | | | | | | | | | | | | | | | | | | | | | | | |
| | | Three Months Ended March 31, 2024 |
| (in millions, except per share amounts) | | As reported | | | | | | | | | | Acquisition expenses | | | | | | Adjusted |
| | | | | | | | | | | | | | | | | | |
| Selling, general and administrative | | $ | 934.3 | | | | | | | | | | | $ | (7.7) | | | | | | | $ | 926.6 | |
| Operating income | | 341.4 | | | | | | | | | | | 7.7 | | | | | | | 349.1 | |
| | | | | | | | | | | | | | | | | | |
| | | | | | | | | | | | | | | | | | |
| Income before income taxes | | $ | 220.6 | | | | | | | | | | | $ | 7.7 | | | | | | | $ | 228.3 | |
| Income tax provision | | (55.6) | | | | | | | | | | | (1.6) | | | | | | | (57.2) | |
| Net income | | 165.0 | | | | | | | | | | | 6.1 | | | | | | | 171.1 | |
| Net income attributable to non-controlling interest | | (1.5) | | | | | | | | | | | — | | | | | | | (1.5) | |
| Net income attributable to redeemable non-controlling interest | | (0.9) | | | | | | | | | | | — | | | | | | | (0.9) | |
| Net income attributable to Lithia Motors, Inc. | | $ | 162.6 | | | | | | | | | | | $ | 6.1 | | | | | | | $ | 168.7 | |
| | | | | | | | | | | | | | | | | | |
| Diluted earnings per share attributable to Lithia Motors, Inc. | | $ | 5.89 | | | | | | | | | | | $ | 0.22 | | | | | | | $ | 6.11 | |
| Diluted share count | | 27.6 | | | | | | | | | | | | | | | | | |
| | | | | | | | | | | | | | |
| | MANAGEMENT’S DISCUSSION AND ANALYSIS | | 2730 |
| | | |
| | | | | Three Months Ended March 31, 2022 | | Three Months Ended March 31, 2023 |
| (in millions, except per share amounts) | (in millions, except per share amounts) | | As reported | | Net disposal gain on sale of stores | | | Investment loss | | | Acquisition expenses | | | Adjusted | (in millions, except per share amounts) | | As reported | | Net disposal gain on sale of stores | | | | Investment loss | | Insurance reserves | | Acquisition expenses | | Contract buyouts | | | | Adjusted |
| | Selling, general and administrative | Selling, general and administrative | | $ | 739.9 | | | $ | 10.0 | | | | $ | — | | | | $ | (6.6) | | | | $ | 743.3 | |
| Selling, general and administrative | |
| Selling, general and administrative | |
| Operating income (loss) | Operating income (loss) | | 506.7 | | | (10.0) | | | | — | | | | 6.6 | | | | 503.3 | |
| Other (expense) income, net | | (5.8) | | | — | | | | 14.9 | | | | — | | | | 9.1 | |
| Other income, net | |
| | Income (loss) before income taxes | |
| Income (loss) before income taxes | |
| Income (loss) before income taxes | Income (loss) before income taxes | | $ | 469.8 | | | $ | (10.0) | | | | 14.9 | | | | $ | 6.6 | | | | $ | 481.3 | |
| Income tax (provision) benefit | Income tax (provision) benefit | | (126.2) | | | 2.6 | | | | — | | | | (1.9) | | | | (125.5) | |
| Net income (loss) | Net income (loss) | | 343.6 | | | (7.4) | | | | 14.9 | | | | 4.7 | | | | 355.8 | |
| Net income attributable to non-controlling interest | Net income attributable to non-controlling interest | | (0.5) | | | — | | | | — | | | | — | | | | (0.5) | |
| Net income attributable to redeemable non-controlling interest | Net income attributable to redeemable non-controlling interest | | (0.9) | | | — | | | | — | | | | — | | | | (0.9) | |
| Net income (loss) attributable to Lithia Motors, Inc. | Net income (loss) attributable to Lithia Motors, Inc. | | $ | 342.2 | | | $ | (7.4) | | | | $ | 14.9 | | | | $ | 4.7 | | | | $ | 354.4 | |
| | Diluted earnings (loss) per share attributable to Lithia Motors, Inc. | Diluted earnings (loss) per share attributable to Lithia Motors, Inc. | | $ | 11.55 | | | $ | (0.25) | | | | $ | 0.50 | | | | $ | 0.16 | | | | $ | 11.96 | |
| Diluted earnings (loss) per share attributable to Lithia Motors, Inc. | |
| Diluted earnings (loss) per share attributable to Lithia Motors, Inc. | |
| Diluted share count | Diluted share count | | 29.6 | | | | | | | | |
Liquidity and Capital Resources
We manage our liquidity and capital resources in the context of our overall business strategy, continually forecasting and managing our cash, working capital balances and capital structure in a way that we believe will meet the short-term and long-term obligations of our business while maintaining liquidity and financial flexibility. Our capital deployment strategy forIn the current market of elevated acquisition pricing, we have adjusted our free cash flows targets anflow deployment strategy. Under current conditions, including recent trends in our stock price, we may consider repurchases as a more attractive use of funds than acquisitions. Our current free cash flow deployment strategy has shifted to allocation of 65%50% to 60% investment in acquisitions, 25% internal investments includinginvestment in capital expenditures, Driveway and Driveway Finance Corporation and 10%15% to 25% in shareholder return in the form of dividends and share repurchases.
We believe we have sufficient sources of funding to meet our business requirements for the next 12 months and in the longer term. Cash flows from operations and borrowings under our credit facilities are our main sources for liquidity. In addition to the above sources of liquidity, potential sources to fund our business strategy include issuing equity through our $400 million ATM Equity Offering Agreement, financing of real estate and proceeds from debt or equity offerings. We evaluate all of these options and may select one or more of them depending on overall capital needs and the availability and cost of capital, although no assurances can be provided that these capital sources will be available in sufficient amounts or with terms acceptable to us.
Available Sources
Below is a summary of our immediately available funds:
| | ($ in millions) | ($ in millions) | March 31, 2023 | | December 31, 2022 | | Change | | % Change | ($ in millions) | March 31, 2024 | | December 31, 2023 | | Change | | % Change |
| Cash | $ | 184.9 | | | $ | 168.1 | | | $ | 16.8 | | | 10.0 | % |
| Cash and cash equivalents | | Cash and cash equivalents | $ | 264.4 | | | $ | 825.0 | | | $ | (560.6) | | | (68.0) | % |
| Marketable securities | |
| Available credit on credit facilities | Available credit on credit facilities | 1,168.8 | | | 1,419.4 | | | (250.6) | | | (17.7) | |
| Total current available funds | Total current available funds | $ | 1,353.7 | | | $ | 1,587.5 | | | $ | (233.8) | | | (14.7) | % | Total current available funds | $ | 1,284.1 | | | $ | | $ | 1,695.4 | | | $ | | $ | (411.3) | | | (24.3) | | (24.3) | % |
Information about our cash flows, by category, is presented in our Consolidated Statements of Cash Flows. The following table summarizes our cash flows:
| | | | Three Months Ended March 31, | | Change | | Three Months Ended March 31, | | Change |
| (in millions) | (in millions) | 2023 | | 2022 | | in Cash Flow | (in millions) | 2024 | | 2023 | | in Cash Flow |
| Net cash (used in) provided by operating activities | $ | (49.0) | | | $ | 26.3 | | | $ | (75.3) | |
| Net cash provided by (used in) operating activities | |
| Net cash used in investing activities | Net cash used in investing activities | (413.9) | | | (357.3) | | | (56.6) | |
| Net cash provided by financing activities | Net cash provided by financing activities | 509.9 | | | 316.0 | | | 193.9 | |
| | | | | | | | | | | | | | |
| | MANAGEMENT’S DISCUSSION AND ANALYSIS | | 31 |
Operating Activities
Cash provided by (used in) operating activities for the three months ended March 31, 2023 decreased $75.32024 increased $341.4 million compared to the same period of 2022,2023, primarily related growthto an increase in our financingfloor plan notes payable and finance receivables as we increase our auto loan portfolioactivity, partially offset by inventory activity and decreaseda decrease in net income compared to the same period of 2022.
| | | | | | | | | | | | | | |
| | MANAGEMENT’S DISCUSSION AND ANALYSIS | | 28 |
Borrowings from and repayments to our syndicated credit facilities related to our new vehicle inventory floor plan financing are presented as financing activities. To better understand the impact of changes in inventory, other assets, and the associated financing, we also consider our adjusted net cash provided by operating activities to include borrowings or repayments associated with our new vehicle floor plan commitment and exclude the impact of our financing receivables activity.
To better understand the impact of these items, adjusted Adjusted net cash provided by operating activities, a non-GAAP measure, is presented below:
| | | | Three Months Ended March 31, | | Change | | Three Months Ended March 31, | | Change |
| (in millions) | (in millions) | 2023 | | 2022 | | in Cash Flow | (in millions) | 2024 | | 2023 | | in Cash Flow |
| Net cash (used in) provided by operating activities – as reported | $ | (49.0) | | | $ | 26.3 | | | $ | (75.3) | |
| Net cash provided by (used in) operating activities – as reported | |
| Adjust: Net borrowings on floor plan notes payable, non-trade | Adjust: Net borrowings on floor plan notes payable, non-trade | 187.6 | | | 177.1 | | | 10.5 | |
| Less: Borrowings on floor plan notes payable, non-trade associated with acquired new vehicle inventory | Less: Borrowings on floor plan notes payable, non-trade associated with acquired new vehicle inventory | (3.7) | | | (47.6) | | | 43.9 | |
| Adjust: Financing receivables activity | Adjust: Financing receivables activity | 397.0 | | | 201.4 | | | 195.6 | |
| Net cash provided by operating activities – adjusted | Net cash provided by operating activities – adjusted | $ | 531.9 | | | $ | 357.2 | | | $ | 174.7 | |
|
Investing Activities
Net cash used in investing activities totaled $0.4$1.3 billion and $0.4 billion, respectively, for the three months ended March 31, 20232024 and 2022.2023.
Below are highlights of significant activity related to our cash flows from investing activities:
| | | | Three Months Ended March 31, | | Change | | Three Months Ended March 31, | | Change |
| (in millions) | (in millions) | 2023 | | 2022 | | in Cash Flow | (in millions) | 2024 | | 2023 | | in Cash Flow |
| Capital expenditures | Capital expenditures | $ | (38.9) | | | $ | (60.7) | | | $ | 21.8 | |
| Cash paid for acquisitions, net of cash acquired | Cash paid for acquisitions, net of cash acquired | (387.4) | | | (326.5) | | | (60.9) | |
| Cash paid for other investments | Cash paid for other investments | (11.1) | | | (9.8) | | | (1.3) | |
| Proceeds from sales of stores | Proceeds from sales of stores | 22.7 | | | 32.9 | | | (10.2) | |
Capital Expenditures
Below is a summary of our capital expenditure activities ($ in millions):
Many manufacturers provide assistance in the form of additional incentives or assistance if facilities meet specified standards and requirements. We expect that certain facility upgrades and remodels will generate additional
| | | | | | | | | | | | | | |
| | MANAGEMENT’S DISCUSSION AND ANALYSIS | | 32 |
manufacturer incentive payments. Also, tax laws allowing accelerated deductions for capital expenditures reduce the overall investment needed and encourage accelerated project timelines.
| | | | | | | | | | | | | | |
| | MANAGEMENT’S DISCUSSION AND ANALYSIS | | 29 |
We expect to use a portion of our future capital expenditures to upgrade facilities that we recently acquired. This additional capital investment is contemplated in our initial evaluation of the investment return metrics applied to each acquisition and is usually associated with manufacturer standards and requirements.
The decreaseincrease in capital expenditures for the three months ended March 31, 2023,2024, compared to the same period of 20222023 related primarily to lowerhigher existing operations improvements and maintenance.improvements.
If we undertake a significant capital commitment in the future, we expect to pay for the commitment out of existing cash balances, construction financing and borrowings on our credit facility. Upon completion of the projects, we believe we would have the ability to secure long-term financing and general borrowings from third party lenders for 70% to 90% of the amounts expended, although no assurances can be provided that these financings will be available to us in sufficient amounts or on terms acceptable to us.
Acquisitions
We focus on acquiring stores at attractive purchase prices that meet our return thresholds and strategic objectives. We look for acquisitions that diversify our brand and geographic mix as we continue to evaluate our portfolio to minimize exposure to any one manufacturer and achieve financial returns.
We are able to subsequently floor new vehicle inventory acquired as part of an acquisition; however, the cash generated by this transaction is recorded as borrowings on floor plan notes payable, non-trade.
Adjusted net cash paid for acquisitions, as well as certain other acquisition-related information is presented below:
| | | | Three Months Ended March 31, | | Three Months Ended March 31, |
| 2023 | | 2022 |
| 2024 | | | 2024 | | 2023 |
| Number of locations acquired | Number of locations acquired | 37 | | | 6 | |
| | | (in millions) | (in millions) | |
| | (in millions) | |
| | (in millions) | |
| Cash paid for acquisitions, net of cash acquired | |
| Cash paid for acquisitions, net of cash acquired | |
| Cash paid for acquisitions, net of cash acquired | Cash paid for acquisitions, net of cash acquired | $ | (387.4) | | | $ | (326.5) | |
| Less: Borrowings on floor plan notes payable: non-trade associated with acquired new vehicle inventory | Less: Borrowings on floor plan notes payable: non-trade associated with acquired new vehicle inventory | 3.7 | | | 47.6 | |
| Cash paid for acquisitions, net of cash acquired – adjusted | Cash paid for acquisitions, net of cash acquired – adjusted | $ | (383.7) | | | $ | (278.9) | |
We evaluate potential capital investments primarily based on targeted rates of return on assets and return on our net equity investment.
Financing Activities
Adjusted net cash provided by financing activities, a non-GAAP measure, which is adjusted for borrowings and repayments on floor plan facilities: non-trade and borrowings and repayments associated with our Financing Operations segment was as follows:
| | | | | | | | | | | | | | | | | |
| | Three Months Ended March 31, | | Change |
| (in millions) | 2023 | | 2022 | | in Cash Flow |
| Cash provided by financing activities, as reported | $ | 509.9 | | | $ | 316.0 | | | $ | 193.9 | |
| Add (less): Net borrowings on floor plan notes payable: non-trade | (187.6) | | | (177.1) | | | (10.5) | |
| Add (less): Net (borrowings) repayments on non-recourse notes payable | (403.2) | | | 39.3 | | | (442.5) | |
| Cash (used in) provided by financing activities, as adjusted | $ | (80.9) | | | $ | 178.2 | | | $ | (259.1) | |
| | | | | |
| | | | | |
| | | | | | | | | | | | | | | | | |
| | Three Months Ended March 31, | | Change |
| (in millions) | 2024 | | 2023 | | in Cash Flow |
| Cash provided by financing activities, as reported | $ | 445.0 | | | $ | 509.9 | | | $ | (64.9) | |
| Less: Net borrowings on floor plan notes payable: non-trade | (156.1) | | | (187.6) | | | 31.5 | |
| Less: Net borrowings on non-recourse notes payable | (125.9) | | | (403.2) | | | 277.3 | |
| Cash provided by (used in) financing activities, as adjusted | $ | 163.0 | | | $ | (80.9) | | | $ | 243.9 | |
| | | | | |
| | | | | |
Below are highlights of significant activity related to our cash flows from financing activities, excluding borrowings and repayments on floor plan notes payable: non-trade, and non-recourse notes payable, which are discussed above:
| | | | | | | | | | | | | | |
| | MANAGEMENT’S DISCUSSION AND ANALYSIS | | 3033 |
| | | | Three Months Ended March 31, | | Change | | Three Months Ended March 31, | | Change |
| (in millions) | (in millions) | 2023 | | 2022 | | in Cash Flow | (in millions) | 2024 | | 2023 | | in Cash Flow |
| Net borrowings on lines of credit | $ | (40.4) | | | $ | 265.2 | | | $ | (305.6) | |
| Principal payments on long-term debt and finance lease liabilities, other | (3.4) | | | (12.5) | | | 9.1 | |
| Net borrowings (repayments) on lines of credit | |
| | Proceeds from issuance of long-term debt | |
| | Proceeds from issuance of long-term debt | |
| | Proceeds from issuance of long-term debt | Proceeds from issuance of long-term debt | 10.4 | | | 16.2 | | | (5.8) | |
| Principal payments on non-recourse notes payable | Principal payments on non-recourse notes payable | (76.5) | | | (39.3) | | | (37.2) | |
| Proceeds from the issuance of non-recourse notes payable | Proceeds from the issuance of non-recourse notes payable | 479.7 | | | — | | | 479.7 | |
| | Repurchase of common stock | |
| | Repurchase of common stock | |
| | Repurchase of common stock | Repurchase of common stock | (14.4) | | | (60.9) | | | 46.5 | |
| Dividends paid | Dividends paid | (11.5) | | | (10.3) | | | (1.2) | |
| Proceeds from issuance of common stock | 6.1 | | | 7.8 | | | (1.7) | |
| Payment of contingent consideration related to acquisitions | |
|
Equity Transactions
In November 2021, ourOur Board of Directors has authorized the repurchase of up to $750 million$1.2 billion of our Common Stock, increasing our total repurchase authorization to $1.25 billion combined with the amount previously authorized by the Board for repurchase.Stock. We repurchased a total of 70,39545,516 shares of our Common Stock at an average price of $204.75$329.21 in the first three months of 2023,2024, all related to tax withholding on vesting RSUs, none related to our repurchase authorization. As of March 31, 2023,2024, we had $501.4$467.0 million remaining available for repurchases and the authorization does not have an expiration date.
In the first three months of 2023,2024, we declared and paid dividends on our Common Stock as follows:
| | Dividend paid: | Dividend paid: | | Dividend amount
per share | | Total amount of dividend
(in millions) | Dividend paid: | | Dividend amount
per share | | Total amount of dividend
(in millions) |
| March 2023 | | $ | 0.42 | | | $ | 11.5 | |
| March 2024 | |
|
We evaluate performance and make a recommendation to the Board of Directors on dividend payments on a quarterly basis.
Summary of Outstanding Balances on Credit Facilities and Long-Term Debt
Below is a summary of our outstanding balances on credit facilities and long-term debt:
| | As of March 31, 2023 | |
| | As of March 31, 2024 | |
| (in millions) | |
| (in millions) | |
| (in millions) | (in millions) | | Outstanding | | Remaining Available | | | | Outstanding | | Remaining Available | | |
| Floor plan note payable: non-trade | Floor plan note payable: non-trade | | $ | 1,664.9 | | | $ | — | | | 1 | Floor plan note payable: non-trade | | $ | 2,428.7 | | | $ | | $ | — | | | 1 | | 1 |
| Floor plan notes payable | Floor plan notes payable | | 999.3 | | | — | | | | Floor plan notes payable | | 2,533.3 | | | — | | — | | | | | |
| Used and service loaner vehicle inventory financing commitments | Used and service loaner vehicle inventory financing commitments | | 843.6 | | | 5.9 | | | 2 | Used and service loaner vehicle inventory financing commitments | | 912.7 | | | 31.7 | | 31.7 | | | 2 | | 2 |
| Revolving lines of credit | Revolving lines of credit | | 1,012.4 | | | 1,117.1 | | | 2, 3 | Revolving lines of credit | | 1,610.5 | | | 918.5 | | 918.5 | | | 2, 3 | | 2, 3 |
| Warehouse facilities | Warehouse facilities | | 875.0 | | | 45.8 | | |
| Non-recourse notes payable | Non-recourse notes payable | | 825.4 | | | — | | |
| Non-recourse notes payable | |
| Non-recourse notes payable | |
| 4.625% Senior notes due 2027 | |
| 4.625% Senior notes due 2027 | |
| 4.625% Senior notes due 2027 | 4.625% Senior notes due 2027 | | 400.0 | | | — | | |
| 4.375% Senior notes due 2031 | 4.375% Senior notes due 2031 | | 550.0 | | | — | | |
| 4.375% Senior notes due 2031 | |
| 4.375% Senior notes due 2031 | |
| 3.875% Senior notes due 2029 | 3.875% Senior notes due 2029 | | 800.0 | | | — | | |
| Finance leases and other debt | | 651.5 | | | — | | | |
| 3.875% Senior notes due 2029 | |
| 3.875% Senior notes due 2029 | |
| Real estate mortgages, finance lease obligations, and other debt | |
| Real estate mortgages, finance lease obligations, and other debt | |
| Real estate mortgages, finance lease obligations, and other debt | | | 880.6 | | | — | | | |
| Unamortized debt issuance costs | Unamortized debt issuance costs | | (30.6) | | | — | | | 4 | Unamortized debt issuance costs | | (30.2) | | | — | | — | | | 4 | | 4 |
| Total debt, net | Total debt, net | | $ | 8,591.5 | | | $ | 1,168.8 | | |
1As of March 31, 2023,2024, we had a $2.0$2.9 billion new vehicle floor plan commitment as part of our US Bank syndicated credit facility, and a $500 million CAD wholesale floorplan commitment as part of our Bank of Nova Scotia syndicated credit facility.
2The amount available on thethese credit facility isfacilities are limited based on a borrowing base calculationcalculations and fluctuates monthly.
3Available credit is based on the borrowing base amount effective as of February 28, 2023.29, 2024. This amount is reduced by $36.1$37.0 million for outstanding letters of credit.
4Debt issuance costs are presented on the balance sheet as a reduction from the carrying amount of the related debt liability.
Financial Covenants
Our credit facilities, non-recourse notes payable, and senior notes contain customary representations and warranties, conditions and covenants for transactions of these types. As of March 31, 2023 we were in compliance with all financial covenants.
| | | | | | | | | | | | | | |
| | MANAGEMENT’S DISCUSSION AND ANALYSIS | | 31 |
Recent Accounting Pronouncements
See Note 1415 – Recent Accounting Pronouncements for discussion.
| | | | | | | | | | | | | | |
| | MANAGEMENT’S DISCUSSION AND ANALYSIS | | 34 |
Critical Accounting Policies and Use of Estimates
There have been no material changes in the critical accounting policies and use of estimates described in our 20222023 Annual Report on Form 10-K filed with the Securities and Exchange Commission on February 24, 2023.23, 2024.
Seasonality and Quarterly Fluctuations
Historically, our sales have been lower in the first quarter of each year due to consumer purchasing patterns and inclement weather in certain of our markets. As a result, financial performance is expected to be lower during the first quarter than during the second, third and fourth quarters of each fiscal year. We believe that interest rates, levels of consumer debt, consumer confidence and manufacturer sales incentives, as well as general economic conditions, also contribute to fluctuations in sales and operating results.
Off-Balance Sheet Arrangements
We do not have any off-balance sheet arrangements that have or are reasonably likely to have a material current or future effect on our financial condition, changes in financial condition, revenues or expenses, results of operations, liquidity, capital expenditures or capital resources.
Item 3. Quantitative and Qualitative Disclosures About Market Risk
There have been no material changes in our reported market risks or risk management policies since the filing of our 20222023 Annual Report on Form 10-K, which was filed with the Securities and Exchange Commission on February 24, 2023.23, 2024.
Item 4. Controls and Procedures
Evaluation of Disclosure Controls and Procedures
We evaluated, with the participation and under the supervision of our Chief Executive Officer and our Chief Financial Officer, the effectiveness of our disclosure controls and procedures as of the end of the period covered by this Quarterly Report on Form 10-Q. Based on this evaluation, our Chief Executive Officer and our Chief Financial Officer concluded that our disclosure controls and procedures are effective to ensure that information we are required to disclose in reports that we file or submit under the Securities Exchange Act of 1934 is accumulated and communicated to our management, including our Chief Executive Officer and our Chief Financial Officer, as appropriate to allow timely decisions regarding required disclosure and that such information is recorded, processed, summarized and reported within the time periods specified in Securities and Exchange Commission rules and forms.
Changes in Internal Control Over Financial Reporting
There was no change in our internal control over financial reporting that occurred during our most recent fiscal quarter that has materially affected, or is reasonably likely to materially affect, our internal control over financial reporting.
PART II - OTHER INFORMATION
Item 1. Legal Proceedings
We are party to numerous legal proceedings arising in the normal course of our business. Although we do not anticipate that the resolution of legal proceedings arising in the normal course of business will have a material adverse effect on our business, results of operations, financial condition, or cash flows, we cannot predict this with certainty.
| | | | | | | | | | | | | | |
| | MANAGEMENT’S DISCUSSION AND ANALYSIS | | 32 |
Item 1A. Risk Factors
The information in this Form 10-Q should be read in conjunction with the risk factors and information disclosed in our 20222023 Annual Report on Form 10-K, which was filed with the SEC on February 24, 2023.23, 2024. We have described in our 20222023 Annual Report on Form 10-K, under “Risk Factors” in Item 1A, the primary risks related to our business and securities. We provide below the material changes to our risk factors described in that report.
Risks associated with our U.K. operations may negatively affect our business, results of operations and financial condition.
Following completion of our acquisition of Jardine Motors Group in the United Kingdom in March 2023, we own and operate dealerships in the U.K. in addition to operations in the United States and Canada. These dealerships are the first operations we have managed outside of North America. While our operations outside of the United States currently represent a smaller portion of our revenue, we anticipate that our international operations will continue to expand. We face regulatory, operational, political and economic risks and uncertainties with respect to our international operations as outlined under “Risks associated with our international operations may negatively affect our business, results of operations and financial condition” in our 2022 Annual Report on Form 10-K, which was filed with the SEC on February 24, 2023, under “Risk Factors” in Item 1A.
We are also subject to certain additional risks specific to our U.K. operations. For example, our operations in the U.K. are subject to numerous laws and regulations that may differ from those applicable to our operations in the United States and Canada, including relating to data privacy, health and safety, and environmental protection. Future laws and regulations or changes in existing laws and regulations, or interpretations thereof, in the U.K. could further impact our operations. For example, the U.K. government has proposed a ban on the sale of gasoline engines in new cars and new vans that would take effect as early as 2030 and a ban on the sale of gasoline hybrid engines in new cars and new vans as early as 2035. Such laws and proposed regulations would pose increasingly complex and costly compliance challenges or could also adversely affect demand for certain vehicles or the products we currently sell.
Further, changes by manufacturers to their distribution models may impact our operations in the U.K. Certain manufacturers are moving to an agency model in other countries, whereby the consumer places an order directly with the manufacturer and names a preferred delivery dealer. The agency model is being used by Mercedes-Benz in the U.K. and other European regions. Under an agency model, our dealerships receive a fee for facilitating the sale by the manufacturer of a new vehicle but do not hold the vehicle in inventory. The agency model will reduce reported revenues (as only the fee we receive, and not the price of the vehicle, will be reported as revenue), reduce SG&A expenses, and reduce floor plan interest expense, although the other impacts to our results of operations remain uncertain. If the agency model or another new model is implemented in the U.K. or other countries or regions in which we operate for the sale of electric or other vehicles, it could negatively affect our revenues, results of operations and financial condition.
The majority of our dealerships in the U.K. operate under franchise agreements with vehicle manufacturers, however, unlike in the United States, the U.K. generally does not have automotive dealership franchise laws and, as a result, our U.K. dealerships operate without these types of specific protections that exist in the United States. In addition, our U.K. dealerships are also subject to U.K. antitrust regulations prohibiting certain restrictions on the sale of new vehicles and spare parts and on the provision of repairs and maintenance. For instance, authorized dealers are generally able to, subject to manufacturer facility requirements, relocate or add additional facilities throughout the European Union, offer multiple brands in the same facility, allow the operation of service facilities independent of new car sales facilities and ease restrictions on cross supplies (including on transfers of dealerships) between existing authorized dealers within the European Union. However, under the EU Motor Vehicle Block Exemption Regulation, which was retained in U.K. law following U.K.’s exit from the European Union on January 31, 2020, certain restrictions on dealerships are permissible in franchise agreements provided certain conditions are met. In October 2022, the Competition and Markets Authority of the U.K. published recommendations to introduce an updated U.K. equivalent broadly similar to the EU Motor Vehicle Block Exemption Regulations, however, changes to these protections or rules could negatively affect our revenues, results of operations and financial condition.
| | | | | | | | | | | | | | |
| | MANAGEMENT’S DISCUSSION AND ANALYSIS | | 3335 |
Item 2. Unregistered Sales of Equity Securities and Use of Proceeds
We repurchased the following shares of our common stock during the first quarter of 2023:2024:
| | For the full calendar month of | For the full calendar month of | | Total number of shares purchased2 | | Average price paid per share | | Total number of shares purchased as part of publicly announced plans1 | | Maximum dollar value of shares that may yet be purchased under publicly announced plan (in thousands)1 | For the full calendar month of | | Total number of shares purchased2 | | Average price paid per share | | Total number of shares purchased as part of publicly announced plans1 | | Maximum dollar value of shares that may yet be purchased under publicly announced plan (in thousands)1 |
| January | January | | 70,350 | | | $ | 204.72 | | | — | | | $ | 501,368 | |
| February | February | | — | | | — | | | — | | | 501,368 | |
| March | March | | 45 | | | 255.18 | | | — | | | 501,368 | |
| Total | Total | | 70,395 | | | 204.75 | | | — | | | 501,368 | |
1On November 1, 2022, our Board of Directors approved an additional $450 million repurchase authorization of our common stock. This authorization was in addition to the $750 million repurchase authorization authorized by the Board on November 30, 2021. The current share repurchase plan has no expiration date.
2OfAll of the shares repurchased in the first quarter of 2023, all2024 were related to tax withholding upon the vesting of RSUs.RSUs and none related to our repurchase authorization.
Item 5. Other Information
No director or officer adopted or terminated any Rule 10b5-1 plan or any non-Rule 10b5-1 trading arrangement during the first quarter of 2024.
Item 6. Exhibits
The following exhibits are filed herewith and this list is intended to constitute the exhibit index.
| | | | | | | | | | | | | | | | | | | | | | | | | | | | | | | | | | | | | | |
| | | | Incorporated by Reference | | Filed or Furnished Herewith |
| Exhibit Number | | Exhibit Description | | Form | | File Number | | Exhibit | | Filing Date | |
| | Restated Articles of Incorporation of Lithia Motors, Inc. | | 10-Q | | 001-14733 | | 3.1 | | 07/28/21 | | |
| | Second Amended and Restated Bylaws of Lithia Motors, Inc. | | 8-K | | 001-14733 | | 3.2 | | 04/25/19 | | |
| | Fourth Amendment to Fourth Amended and Restated Loan Agreement, dated February 9, 2023, among Lithia Motors, Inc., the subsidiaries of Lithia Motors, Inc. listed on the signature pages of the agreement or that thereafter become borrowers thereunder, the lenders party thereto from time to time, and U.S. Bank National Association.* | | 8-K | | 001-14733 | | 10.1 | | 02/15/23 | | |
| | Form of Restricted Stock Unit Agreement (Time-Vesting) for awards beginning in 2023 (for Directors) | | | | | | | | | | X |
| | Certification of Chief Executive Officer pursuant to Rule 13a-14(a) of the Securities Exchange Act of 1934. | | | | | | | | | | X |
| | Certification of Chief Financial Officer pursuant to Rule 13a-14(a) of the Securities Exchange Act of 1934. | | | | | | | | | | X |
| | Certification of Chief Executive Officer pursuant to Rule 13a-14(b) of the Securities Exchange Act of 1934 and 18 U.S.C. Section 1350. | | | | | | | | | | X |
| | Certification of Chief Financial Officer pursuant to Rule 13a-14(b) of the Securities Exchange Act of 1934 and 18 U.S.C. Section 1350. | | | | | | | | | | X |
| 101 | | Inline XBRL Document Set for the consolidated financial statements and accompanying notes to consolidated financial statements | | | | | | | | | | X |
| 104 | | Cover page formatted as Inline XBRL and contained in Exhibit 101. | | | | | | | | | | X |
| | | | | | | | | | | | | | | | | | | | | | | | | | | | | | | | | | | | | | |
| | | | Incorporated by Reference | | Filed or Furnished Herewith |
| Exhibit Number | | Exhibit Description | | Form | | File Number | | Exhibit | | Filing Date | |
| | Restated Articles of Incorporation of Lithia Motors, Inc. | | 10-Q | | 001-14733 | | 3.1 | | 07/28/21 | | |
| | Second Amended and Restated Bylaws of Lithia Motors, Inc. | | 8-K | | 001-14733 | | 3.2 | | 04/25/19 | | |
| | Omnibus Amendment No. 2 to Loan Agreement, dated February 16, 2024, among DFC Business Services, LLC, Driveway Finance Corporation, the lenders party thereto from time to time, the agents from time to time party thereto, and Mizuho Bank, Ltd. | | | | | | | | | | X |
| | Amendment No. 9 to Amended and Restated Loan Agreement, dated February 23, 2024, among SCFC Business Services LLC, Driveway Finance Corporation, the lenders from time to time parties hereto, the agents from time to time parties hereto, and JPMorgan Chase Bank, N.A. | | | | | | | | | | X |
| | Fifth Amendment to Fourth Amended and Restated Loan Agreement, dated February 23, 2024, among Lithia Motors, Inc., the subsidiaries of Lithia Motors, Inc. listed on the signature pages of the agreement or that thereafter become borrowers thereunder, the lenders party thereto from time to time, and U.S. Bank National Association.* | | 8-K | | 001-14733 | | 10-1 | | 02/27/24 | | |
| | First Amendment to Credit Agreement, dated March 18, 2024, among Lithia Master LP Company, LP, the subsidiaries of Lithia Motors, Inc. listed on the signature pages of the agreement or that thereafter become borrowers thereunder, Lithia Master GP Company, Inc. and the other general partners of the Borrowers, the lenders party thereto from time to time, and The Bank of Nova Scotia.* | | | | | | | | | | X |
| | Certification of Chief Executive Officer pursuant to Rule 13a-14(a) of the Securities Exchange Act of 1934. | | | | | | | | | | X |
| | Certification of Chief Financial Officer pursuant to Rule 13a-14(a) of the Securities Exchange Act of 1934. | | | | | | | | | | X |
| | Certification of Chief Executive Officer pursuant to Rule 13a-14(b) of the Securities Exchange Act of 1934 and 18 U.S.C. Section 1350. | | | | | | | | | | X |
| | Certification of Chief Financial Officer pursuant to Rule 13a-14(b) of the Securities Exchange Act of 1934 and 18 U.S.C. Section 1350. | | | | | | | | | | X |
| 101 | | Inline XBRL Document Set for the consolidated financial statements and accompanying notes to consolidated financial statements | | | | | | | | | | X |
| 104 | | Cover page formatted as Inline XBRL and contained in Exhibit 101. | | | | | | | | | | X |
*Certain confidential and immaterial terms redacted pursuant to Item 601(b)(10)(iv) of Regulation S-K.
SIGNATURE
Pursuant to the requirements of the Securities Exchange Act of 1934, the registrant has duly caused this report to be signed on its behalf by the undersigned thereunto duly authorized.
| | | | | | | | |
Date: April 28, 202326, 2024 | LITHIA MOTORS, INC. |
| Registrant |
| | |
| By: | /s/ Tina Miller |
| | Tina Miller |
| | Chief Financial Officer, Senior Vice President, and Principal Accounting Officer |