| ☒ | |||||
| QUARTERLY REPORT PURSUANT TO SECTION 13 OR 15(d) OF THE SECURITIES EXCHANGE ACT OF 1934. | |||||
| ☐ | |||||
| TRANSITION REPORT PURSUANT TO SECTION 13 OR 15(d) OF THE SECURITIES EXCHANGE ACT OF 1934. | |||||
Federally chartered | 52-0904874 | 8200 Jones Branch Drive | 22102-3110 | (703) | 903-2000 | |||||||||||||||||||||||||||||||||||||||||
| corporation | McLean, | Virginia | ||||||||||||||||||||||||||||||||||||||||||||
| (State or other jurisdiction of incorporation or organization) | (I.R.S. Employer Identification No.) | (Address of principal executive | (Zip Code) | ( | number, including area code) | |||||||||||||||||||||||||||||||||||||||||
| Title of each class | Trading Symbol(s) | Name of each exchange on which registered | ||||||
| None | N/A | N/A | ||||||
Large accelerated filer | ☐ | Accelerated filer | ☒ | |||||||||||||||||
Non-accelerated filer | ☐ | Smaller reporting company | ☐ | |||||||||||||||||
Emerging growth company | ☐ | |||||||||||||||||||
| Table of Contents | ||
| Page | |||||
| MANAGEMENT'S DISCUSSION AND ANALYSIS OF FINANCIAL CONDITION AND RESULTS OF OPERATIONS | |||||
n Introduction | |||||
n Housing and Mortgage Market Conditions | |||||
n Consolidated Results of Operations | |||||
n Consolidated Balance Sheets Analysis | |||||
n Our Portfolios | |||||
n Our Business Segments | |||||
n Risk Management | |||||
l Credit Risk | |||||
l Market Risk | |||||
n Liquidity and Capital Resources | |||||
n Critical Accounting Estimates | |||||
n Regulation and Supervision | |||||
n Forward-Looking Statements | |||||
| FINANCIAL STATEMENTS | |||||
| OTHER INFORMATION | |||||
| CONTROLS AND PROCEDURES | |||||
| EXHIBIT INDEX | |||||
| SIGNATURES | |||||
| FORM 10-Q INDEX | |||||
| Freddie Mac 1Q 2024 Form 10-Q | i | |||||||
| Table of Contents | ||
| Table | Description | Page | ||||||
| 1 | Summary of Consolidated Statements of Income and Comprehensive Income | |||||||
| 2 | Components of Net Interest Income | |||||||
| 3 | Analysis of Net Interest Yield | |||||||
| 4 | Components of Non-Interest Income | |||||||
| 5 | (Provision) Benefit for Credit Losses | |||||||
| 6 | Components of Non-Interest Expense | |||||||
| 7 | Summarized Condensed Consolidated Balance Sheets | |||||||
| 8 | Mortgage Portfolio | |||||||
| 9 | Mortgage-Related Investments Portfolio | |||||||
| 10 | Other Investments Portfolio | |||||||
| 11 | Single-Family Segment Financial Results | |||||||
| 12 | Multifamily Segment Financial Results | |||||||
| 13 | Allowance for Credit Losses Activity | |||||||
| 14 | Allowance for Credit Losses Ratios | |||||||
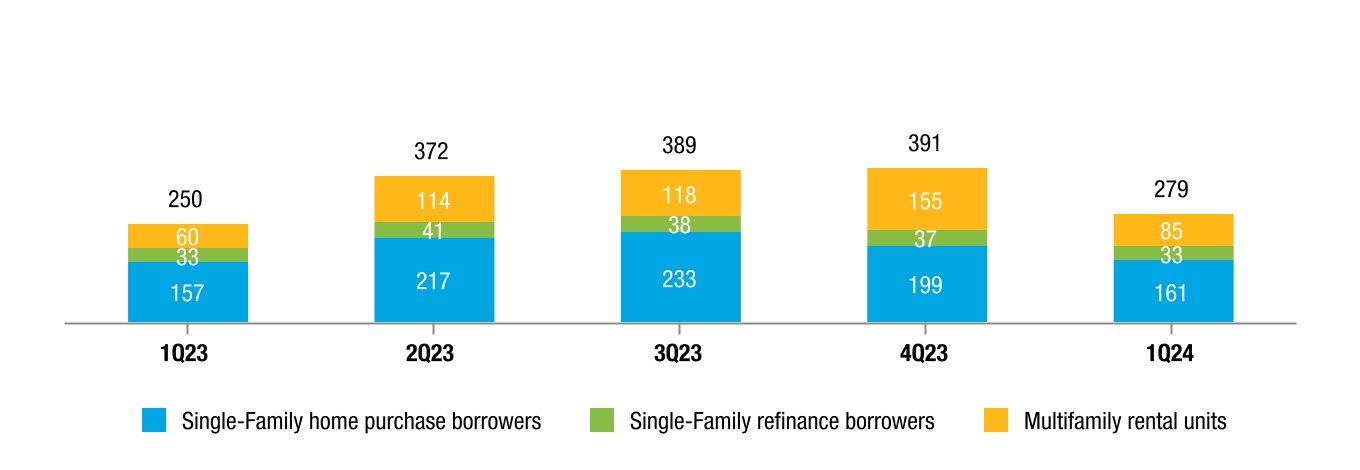
| 15 | Single-Family New Business Activity | |||||||
| 16 | Single-Family Mortgage Portfolio Newly Acquired Credit Enhancements | |||||||
| 17 | Single-Family Mortgage Portfolio Credit Enhancement Coverage Outstanding | |||||||
| 18 | Serious Delinquency Rates for Credit-Enhanced and Non-Credit-Enhanced Loans in Our Single-Family Mortgage Portfolio | |||||||
| 19 | Credit Quality Characteristics of Our Single-Family Mortgage Portfolio | |||||||
| 20 | Single-Family Mortgage Portfolio Attribute Combinations | |||||||
| 21 | Single-Family Completed Loan Workout Activity | |||||||
| 22 | Multifamily Mortgage Portfolio CRT Issuance | |||||||
| 23 | Credit-Enhanced and Non-Credit-Enhanced Loans Underlying Our Multifamily Mortgage Portfolio | |||||||
| 24 | Credit Quality of Our Multifamily Mortgage Portfolio Without Credit Enhancement | |||||||
| 25 | PVS-YC and PVS-L Results Assuming Shifts of the Yield Curve | |||||||
| 26 | Duration Gap and PVS Results | |||||||
| 27 | PVS-L Results Before Derivatives and After Derivatives | |||||||
| 28 | Earnings Sensitivity to Changes in Interest Rates | |||||||
| 29 | Liquidity Sources | |||||||
| 30 | Funding Sources | |||||||
| 31 | Debt of Freddie Mac Activity | |||||||
| 32 | Maturity and Redemption Dates | |||||||
| 33 | Debt of Consolidated Trusts Activity | |||||||
| 34 | Net Worth Activity | |||||||
| 35 | Regulatory Capital Components | |||||||
| 36 | Statutory Capital Components | |||||||
| 37 | Capital Metrics Under ERCF | |||||||
| 38 | Forecasted House Price Growth Rates | |||||||
| Freddie Mac 1Q 2024 Form 10-Q | ii | |||||||
| Management's Discussion and Analysis | Introduction | |||||||
| Freddie Mac 1Q 2024 Form 10-Q | ||||||||
| Management's Discussion and Analysis | Introduction | |||||||
| Freddie Mac 1Q 2024 Form 10-Q | ||||||||
| Management's Discussion and Analysis | ||||||||

| Freddie Mac 1Q 2024 Form 10-Q | 3 | |||||||
| Management's Discussion and Analysis | Housing and Mortgage Market Conditions | |||||||

| 3Q 2017 | 3Q 2016 | Change | YTD 2017 | YTD 2016 | Change | |||||||||||||||||||||||||
| (Dollars in millions) | $ | % | $ | % | ||||||||||||||||||||||||||
| Net interest income | $3,489 | $3,646 | ($157 | ) | (4 | )% | $10,663 | $10,494 | $169 | 2 | % | |||||||||||||||||||
| Benefit (provision) for credit losses | (716 | ) | (113 | ) | (603 | ) | (534 | )% | (178 | ) | 1,129 | (1,307 | ) | (116 | )% | |||||||||||||||
| Net interest income after benefit (provision) for credit losses | 2,773 | 3,533 | (760 | ) | (22 | )% | 10,485 | 11,623 | (1,138 | ) | (10 | )% | ||||||||||||||||||
| Non-interest income (loss): | ||||||||||||||||||||||||||||||
| Gains (losses) on extinguishment of debt | 27 | (92 | ) | 119 | 129 | % | 295 | (266 | ) | 561 | 211 | % | ||||||||||||||||||
| Derivative gains (losses) | (678 | ) | (36 | ) | (642 | ) | (1,783 | )% | (2,076 | ) | (6,655 | ) | 4,579 | 69 | % | |||||||||||||||
| Net impairment of available-for-sale securities recognized in earnings | (1 | ) | (9 | ) | 8 | 89 | % | (17 | ) | (138 | ) | 121 | 88 | % | ||||||||||||||||
| Other gains on investment securities recognized in earnings | 723 | 309 | 414 | 134 | % | 840 | 1,062 | (222 | ) | (21 | )% | |||||||||||||||||||
| Other income (loss) | 5,403 | 605 | 4,798 | 793 | % | 6,512 | 1,527 | 4,985 | 326 | % | ||||||||||||||||||||
| Total non-interest income (loss) | 5,474 | 777 | 4,697 | 605 | % | 5,554 | (4,470 | ) | 10,024 | 224 | % | |||||||||||||||||||
| Non-interest expense: | ||||||||||||||||||||||||||||||
| Administrative expense | (524 | ) | (498 | ) | (26 | ) | (5 | )% | (1,548 | ) | (1,421 | ) | (127 | ) | (9 | )% | ||||||||||||||
| REO operations expense | (35 | ) | (56 | ) | 21 | 38 | % | (128 | ) | (169 | ) | 41 | 24 | % | ||||||||||||||||
| Temporary Payroll Tax Cut Continuation Act of 2011 expense | (339 | ) | (293 | ) | (46 | ) | (16 | )% | (990 | ) | (845 | ) | (145 | ) | (17 | )% | ||||||||||||||
| Other expense | (159 | ) | (138 | ) | (21 | ) | (15 | )% | (361 | ) | (442 | ) | 81 | 18 | % | |||||||||||||||
| Total non-interest expense | (1,057 | ) | (985 | ) | (72 | ) | (7 | )% | (3,027 | ) | (2,877 | ) | (150 | ) | (5 | )% | ||||||||||||||
| Income (loss) before income tax (expense) benefit | 7,190 | 3,325 | 3,865 | 116 | % | 13,012 | 4,276 | 8,736 | 204 | % | ||||||||||||||||||||
| Income tax (expense) benefit | (2,519 | ) | (996 | ) | (1,523 | ) | (153 | )% | (4,466 | ) | (1,308 | ) | (3,158 | ) | (241 | )% | ||||||||||||||
| Net income (loss) | 4,671 | 2,329 | 2,342 | 101 | % | 8,546 | 2,968 | 5,578 | 188 | % | ||||||||||||||||||||
| Total other comprehensive income (loss), net of taxes and reclassification adjustments | (21 | ) | (19 | ) | (2 | ) | (11 | )% | 324 | 275 | 49 | 18 | % | |||||||||||||||||
| Comprehensive income (loss) | $4,650 | $2,310 | $2,340 | 101 | % | $8,870 | $3,243 | $5,627 | 174 | % | ||||||||||||||||||||
| 3Q 2017 | 3Q 2016 | |||||||||||||||||||||
| (Dollars in millions) | Average Balance | Interest Income (Expense)(1) | Average Rate | Average Balance | Interest Income (Expense)(1) | Average Rate | ||||||||||||||||
| Interest-earning assets: | ||||||||||||||||||||||
| Cash and cash equivalents | $10,064 | $14 | 0.53 | % | $21,664 | $15 | 0.28 | % | ||||||||||||||
| Securities purchased under agreements to resell | 57,107 | 166 | 1.16 | 62,086 | 56 | 0.36 | ||||||||||||||||
| Advances to lenders and other secured lending | 804 | 5 | 2.51 | 649 | 3 | 2.06 | ||||||||||||||||
| Mortgage-related securities: | ||||||||||||||||||||||
| Mortgage-related securities | 159,640 | 1,572 | 3.94 | 185,235 | 1,779 | 3.84 | ||||||||||||||||
| Extinguishment of PCs held by Freddie Mac | (85,198 | ) | (811 | ) | (3.81 | ) | (88,066 | ) | (829 | ) | (3.76 | ) | ||||||||||
| Total mortgage-related securities, net | 74,442 | 761 | 4.09 | 97,169 | 950 | 3.91 | ||||||||||||||||
| Non-mortgage-related securities | 15,127 | 60 | 1.62 | 15,671 | 26 | 0.67 | ||||||||||||||||
Loans held by consolidated trusts(1) | 1,731,577 | 14,617 | 3.38 | 1,654,288 | 13,602 | 3.29 | ||||||||||||||||
Loans held by Freddie Mac(1) | 117,298 | 1,250 | 4.26 | 131,945 | 1,395 | 4.23 | ||||||||||||||||
| Total interest-earning assets | $2,006,419 | $16,873 | 3.37 | $1,983,472 | $16,047 | 3.24 | ||||||||||||||||
| Interest-bearing liabilities: | ||||||||||||||||||||||
| Debt securities of consolidated trusts including PCs held by Freddie Mac | $1,755,578 | ($12,663 | ) | (2.89 | ) | $1,680,388 | ($11,716 | ) | (2.79 | ) | ||||||||||||
| Extinguishment of PCs held by Freddie Mac | (85,198 | ) | 811 | 3.81 | (88,066 | ) | 829 | 3.76 | ||||||||||||||
| Total debt securities of consolidated trusts held by third parties | 1,670,380 | (11,852 | ) | (2.84 | ) | 1,592,322 | (10,887 | ) | (2.73 | ) | ||||||||||||
| Other debt: | ||||||||||||||||||||||
| Short-term debt | 68,868 | (173 | ) | (0.99 | ) | 81,057 | (83 | ) | (0.40 | ) | ||||||||||||
| Long-term debt | 259,075 | (1,319 | ) | (2.02 | ) | 302,062 | (1,384 | ) | (1.82 | ) | ||||||||||||
| Total other debt | 327,943 | (1,492 | ) | (1.80 | ) | 383,119 | (1,467 | ) | (1.53 | ) | ||||||||||||
| Total interest-bearing liabilities | 1,998,323 | (13,344 | ) | (2.67 | ) | 1,975,441 | (12,354 | ) | (2.50 | ) | ||||||||||||
| Expense related to derivatives | — | (40 | ) | (0.01 | ) | — | (47 | ) | (0.01 | ) | ||||||||||||
| Impact of net non-interest-bearing funding | 8,096 | — | 0.01 | 8,031 | — | 0.01 | ||||||||||||||||
| Total funding of interest-earning assets | $2,006,419 | ($13,384 | ) | (2.67 | ) | $1,983,472 | ($12,401 | ) | (2.50 | ) | ||||||||||||
| Net interest income/yield | $3,489 | 0.70 | $3,646 | 0.74 | ||||||||||||||||||
(1) Loan fees, primarily consisting of amortization of delivery fees, included in interest income were $634 million and $737 million for loans held by consolidated trusts and $37 million and $53 million for loans held by Freddie Mac during 3Q 2017 and 3Q 2016, respectively. | ||||||||||||||||||||||
| YTD 2017 | YTD 2016 | ||||||||||||||||||||
| (Dollars in millions) | Average Balance | Interest Income (Expense)(1) | Average Rate | Average Balance | Interest Income (Expense)(1) | Average Rate | |||||||||||||||
| Interest-earning assets: | |||||||||||||||||||||
| Cash and cash equivalents | $11,417 | $38 | 0.44 | % | $16,112 | $31 | 0.26 | % | |||||||||||||
| Securities purchased under agreements to resell | 55,903 | 386 | 0.92 | 57,348 | 149 | 0.35 | |||||||||||||||
| Advances to lenders and other secured lending | 651 | 12 | 2.42 | 419 | 7 | 2.33 | |||||||||||||||
| Mortgage-related securities: | |||||||||||||||||||||
| Mortgage-related securities | 168,819 | 4,886 | 3.86 | 193,492 | 5,546 | 3.82 | |||||||||||||||
| Extinguishment of PCs held by Freddie Mac | (87,883 | ) | (2,456 | ) | (3.73 | ) | (96,388 | ) | (2,679 | ) | (3.71 | ) | |||||||||
| Total mortgage-related securities, net | 80,936 | 2,430 | 4.00 | 97,104 | 2,867 | 3.94 | |||||||||||||||
| Non-mortgage-related securities | 18,049 | 207 | 1.54 | 14,219 | 56 | 0.53 | |||||||||||||||
Loans held by consolidated trusts(1) | 1,720,906 | 43,810 | 3.39 | 1,640,997 | 41,735 | 3.39 | |||||||||||||||
Loans held by Freddie Mac(1) | 119,843 | 3,870 | 4.31 | 138,648 | 4,318 | 4.15 | |||||||||||||||
| Total interest-earning assets | $2,007,705 | $50,753 | 3.37 | $1,964,847 | $49,163 | 3.33 | |||||||||||||||
| Interest-bearing liabilities: | |||||||||||||||||||||
| Debt securities of consolidated trusts including PCs held by Freddie Mac | $1,744,260 | ($38,023 | ) | (2.91 | ) | $1,665,226 | ($36,606 | ) | (2.93 | ) | |||||||||||
| Extinguishment of PCs held by Freddie Mac | (87,883 | ) | 2,456 | 3.73 | (96,388 | ) | 2,679 | 3.71 | |||||||||||||
| Total debt securities of consolidated trusts held by third parties | 1,656,377 | (35,567 | ) | (2.86 | ) | 1,568,838 | (33,927 | ) | (2.88 | ) | |||||||||||
| Other debt: | |||||||||||||||||||||
| Short-term debt | 72,292 | (414 | ) | (0.76 | ) | 85,995 | (258 | ) | (0.39 | ) | |||||||||||
| Long-term debt | 270,251 | (3,984 | ) | (1.96 | ) | 301,791 | (4,338 | ) | (1.91 | ) | |||||||||||
| Total other debt | 342,543 | (4,398 | ) | (1.71 | ) | 387,786 | (4,596 | ) | (1.58 | ) | |||||||||||
| Total interest-bearing liabilities | 1,998,920 | (39,965 | ) | (2.66 | ) | 1,956,624 | (38,523 | ) | (2.62 | ) | |||||||||||
| Expense related to derivatives | — | (125 | ) | (0.01 | ) | — | (146 | ) | (0.01 | ) | |||||||||||
| Impact of net non-interest-bearing funding | 8,785 | — | 0.01 | 8,223 | — | 0.01 | |||||||||||||||
| Total funding of interest-earning assets | $2,007,705 | ($40,090 | ) | (2.66 | ) | $1,964,847 | ($38,669 | ) | (2.62 | ) | |||||||||||
| Net interest income/yield | $10,663 | 0.71 | $10,494 | 0.71 | |||||||||||||||||
(1) Loan fees, primarily consisting of amortization of delivery fees, included in interest income were $1.7 billion and $1.9 billion for loans held by consolidated trusts and $132 million and $184 million for loans held by Freddie Mac during YTD 2017 and YTD 2016, respectively. | |||||||||||||||||||||
| 3Q 2017 | 3Q 2016 | Change | YTD 2017 | YTD 2016 | Change | ||||||||||||||||||||||||
| (Dollars in millions) | $ | % | $ | % | |||||||||||||||||||||||||
| Contractual net interest income: | |||||||||||||||||||||||||||||
| Guarantee fee income | $808 | $822 | ($14 | ) | (2 | )% | $2,495 | $2,212 | $283 | 13 | % | ||||||||||||||||||
| Guarantee fee income related to the Temporary Payroll Tax Cut Continuation Act of 2011 | 333 | 292 | 41 | 14 | % | 974 | 838 | 136 | 16 | % | |||||||||||||||||||
| Other contractual net interest income | 1,604 | 1,635 | (31 | ) | (2 | )% | 4,900 | 5,219 | (319 | ) | (6 | )% | |||||||||||||||||
| Total contractual net interest income | 2,745 | 2,749 | (4 | ) | — | % | 8,369 | 8,269 | 100 | 1 | % | ||||||||||||||||||
| Net amortization - loans and debt securities of consolidated trusts | 822 | 884 | (62 | ) | (7 | )% | 2,442 | 2,191 | 251 | 11 | % | ||||||||||||||||||
| Net amortization - other assets and debt | (38 | ) | 60 | (98 | ) | (163 | )% | (23 | ) | 180 | (203 | ) | (113 | )% | |||||||||||||||
| Expense related to derivatives | (40 | ) | (47 | ) | 7 | 15 | % | (125 | ) | (146 | ) | 21 | 14 | % | |||||||||||||||
| Net interest income | $3,489 | $3,646 | ($157 | ) | (4 | )% | $10,663 | $10,494 | $169 | 2 | % | ||||||||||||||||||
| 3Q 2017 | 3Q 2016 | Change | YTD 2017 | YTD 2016 | Change | |||||||||||||||||||||||||
| (Dollars in billions) | $ | % | $ | % | ||||||||||||||||||||||||||
| Benefit (provision) for newly impaired loans | ($0.2 | ) | ($0.2 | ) | $— | — | % | ($0.5 | ) | ($0.6 | ) | $0.1 | 17 | % | ||||||||||||||||
| Amortization of interest rate concessions | 0.1 | 0.2 | (0.1 | ) | (50 | )% | 0.5 | 0.7 | (0.2 | ) | (29 | )% | ||||||||||||||||||
| Reclassifications of held-for-investment loans to held-for-sale loans | — | — | — | N/A | 0.3 | 0.6 | (0.3 | ) | (50 | )% | ||||||||||||||||||||
| Other, including changes in estimated default probability and loss severity | (0.6 | ) | (0.1 | ) | (0.5 | ) | (500 | )% | (0.5 | ) | 0.4 | (0.9 | ) | (225 | )% | |||||||||||||||
| Benefit (provision) for credit losses | ($0.7 | ) | ($0.1 | ) | ($0.6 | ) | (600 | )% | ($0.2 | ) | $1.1 | ($1.3 | ) | (118 | )% | |||||||||||||||
| 3Q 2017 | 3Q 2016 | Change | YTD 2017 | YTD 2016 | Change | |||||||||||||||||||||||||
| (Dollars in millions) | $ | % | $ | % | ||||||||||||||||||||||||||
| Fair value change in interest-rate swaps | $23 | $541 | ($518 | ) | (96 | )% | $116 | ($7,513 | ) | $7,629 | 102 | % | ||||||||||||||||||
| Fair value change in option-based derivatives | (198 | ) | (235 | ) | 37 | 16 | % | (519 | ) | 2,841 | (3,360 | ) | (118 | )% | ||||||||||||||||
| Fair value change in other derivatives | (105 | ) | 74 | (179 | ) | (242 | )% | (379 | ) | (657 | ) | 278 | 42 | % | ||||||||||||||||
| Accrual of periodic cash settlements | (398 | ) | (416 | ) | 18 | 4 | % | (1,294 | ) | (1,326 | ) | 32 | 2 | % | ||||||||||||||||
| Derivative gains (losses) | ($678 | ) | ($36 | ) | ($642 | ) | (1,783 | )% | ($2,076 | ) | ($6,655 | ) | $4,579 | 69 | % | |||||||||||||||
| 3Q 2017 | 3Q 2016 | Change | YTD 2017 | YTD 2016 | Change | ||||||||||||||||||||||||
| (Dollars in millions) | $ | % | $ | % | |||||||||||||||||||||||||
| Other income (loss) | |||||||||||||||||||||||||||||
| Non-agency mortgage-related securities settlements | $4,525 | $— | $4,525 | N/A | $4,525 | $— | $4,525 | N/A | |||||||||||||||||||||
| Gains (losses) on loans | 203 | 139 | $64 | 46 | % | 410 | 136 | 274 | 201 | % | |||||||||||||||||||
| Gains (losses) on held-for-sale loan purchase commitments | 271 | 391 | (120 | ) | (31 | )% | 826 | 635 | 191 | 30 | % | ||||||||||||||||||
| (Losses) gains on debt where we elected the fair value option | 62 | (174 | ) | 236 | 136 | % | (129 | ) | (268 | ) | 139 | 52 | % | ||||||||||||||||
| All other | 272 | 249 | 23 | 9 | % | 744 | 1,024 | (280 | ) | (27 | )% | ||||||||||||||||||
| Fair value hedge accounting | |||||||||||||||||||||||||||||
| Change in fair value of derivatives in qualifying hedge relationships | 85 | — | 85 | N/A | (215 | ) | — | (215 | ) | N/A | |||||||||||||||||||
| Change in fair value of hedged items in qualifying hedge relationships | (15 | ) | — | (15 | ) | N/A | 351 | — | 351 | N/A | |||||||||||||||||||
| Ineffectiveness related to fair value hedge accounting | 70 | — | 70 | N/A | 136 | — | 136 | N/A | |||||||||||||||||||||
| Total other income (loss) | $5,403 | $605 | $4,798 | 793 | % | $6,512 | $1,527 | $4,985 | 326 | % | |||||||||||||||||||
| 3Q 2017 | 3Q 2016 | Change | YTD 2017 | YTD 2016 | Change | ||||||||||||||||||||||||
| (Dollars in millions) | $ | % | $ | % | |||||||||||||||||||||||||
| Other comprehensive income, excluding certain items | $504 | $336 | $168 | 50 | % | $1,090 | $948 | $142 | 15 | % | |||||||||||||||||||
| Excluded items: | |||||||||||||||||||||||||||||
| Accretion due to significant increases in expected cash flows on previously impaired available-for-sale securities | (34 | ) | (66 | ) | 32 | 48 | % | (137 | ) | (235 | ) | 98 | 42 | % | |||||||||||||||
| Realized (gains) losses reclassified from AOCI | (491 | ) | (289 | ) | (202 | ) | (70 | )% | (629 | ) | (438 | ) | (191 | ) | (44 | )% | |||||||||||||
| Total excluded items | (525 | ) | (355 | ) | (170 | ) | (48 | )% | (766 | ) | (673 | ) | (93 | ) | (14 | )% | |||||||||||||
| Total other comprehensive income (loss) | ($21 | ) | ($19 | ) | ($2 | ) | (11 | )% | $324 | $275 | $49 | 18 | % | ||||||||||||||||
| 3Q 2017 | 3Q 2016 | Change | YTD 2017 | YTD 2016 | Change | |||||||||||||||||||||||||
| (Dollars in millions) | $ | % | $ | % | ||||||||||||||||||||||||||
| Benefit (provision) for credit losses | $52 | $59 | ($7 | ) | (12 | )% | $352 | $632 | ($280 | ) | (44 | )% | ||||||||||||||||||
| Other income (loss) - lower-of-cost-or-fair-value adjustment | — | (65 | ) | 65 | 100 | % | — | (799 | ) | 799 | 100 | % | ||||||||||||||||||
| Other expense - property taxes and insurance associated with these loans | — | (10 | ) | 10 | 100 | % | — | (150 | ) | 150 | 100 | % | ||||||||||||||||||
| Effect on income before income tax (expense) benefit | $52 | ($16 | ) | $68 | 425 | % | $352 | ($317 | ) | $669 | 211 | % | ||||||||||||||||||
| September 30, 2017 | December 31, 2016 | Change | |||||||||||||
| (Dollars in millions) | $ | % | |||||||||||||
| Assets: | |||||||||||||||
| Cash and cash equivalents | $8,183 | $12,369 | ($4,186 | ) | (34 | )% | |||||||||
| Restricted cash and cash equivalents | 7,684 | 9,851 | (2,167 | ) | (22 | )% | |||||||||
| Securities purchased under agreements to resell | 47,202 | 51,548 | (4,346 | ) | (8 | )% | |||||||||
| Subtotal | 63,069 | 73,768 | (10,699 | ) | (15 | )% | |||||||||
| Investments in securities, at fair value | 87,148 | 111,547 | (24,399 | ) | (22 | )% | |||||||||
| Mortgage loans, net | 1,844,892 | 1,803,003 | 41,889 | 2 | % | ||||||||||
| Accrued interest receivable | 6,268 | 6,135 | 133 | 2 | % | ||||||||||
| Derivative assets, net | 705 | 747 | (42 | ) | (6 | )% | |||||||||
| Deferred tax assets, net | 14,576 | 15,818 | (1,242 | ) | (8 | )% | |||||||||
| Other assets | 13,998 | 12,358 | 1,640 | 13 | % | ||||||||||
| Total assets | $2,030,656 | $2,023,376 | $7,280 | — | % | ||||||||||
| Liabilities and Equity: | |||||||||||||||
| Liabilities: | |||||||||||||||
| Accrued interest payable | $5,990 | $6,015 | ($25 | ) | — | % | |||||||||
| Debt, net | 2,009,578 | 2,002,004 | 7,574 | — | % | ||||||||||
| Derivative liabilities, net | 212 | 795 | (583 | ) | (73 | )% | |||||||||
| Other liabilities | 9,626 | 9,487 | 139 | 1 | % | ||||||||||
| Total liabilities | 2,025,406 | 2,018,301 | 7,105 | — | % | ||||||||||
| Total equity | 5,250 | 5,075 | 175 | 3 | % | ||||||||||
| Total liabilities and equity | $2,030,656 | $2,023,376 | $7,280 | — | % | ||||||||||
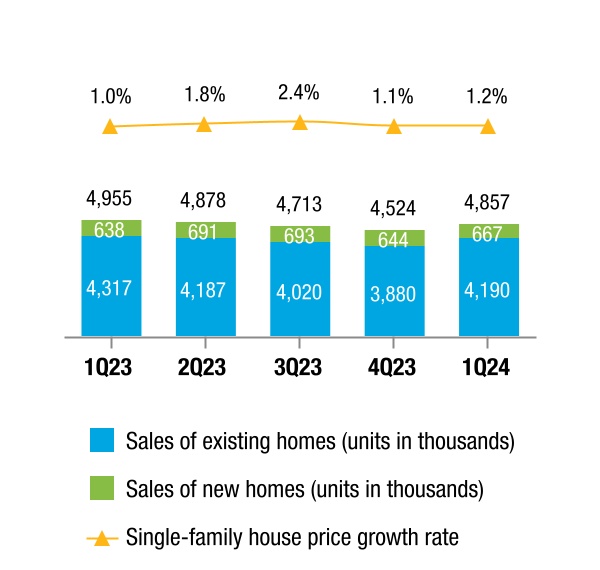 Sources: National Association of Realtors, U.S. Census Bureau, and Freddie Mac House Price Index (seasonally adjusted rate).
| Freddie Mac 1Q 2024 Form 10-Q | 4 | |||||||
| Management's Discussion and Analysis | Housing and Mortgage Market Conditions | |||||||
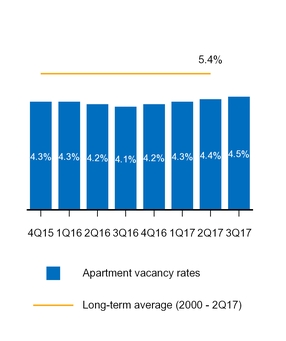
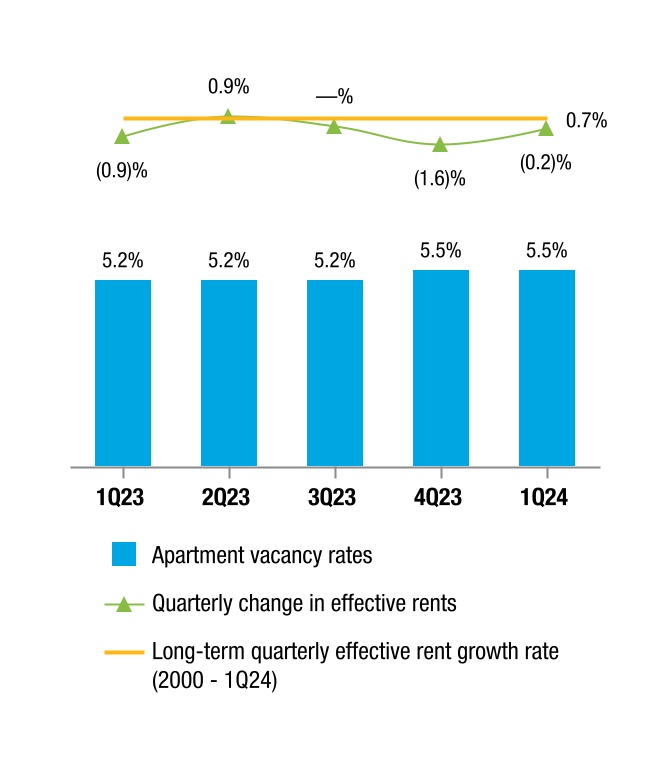 Source: Reis.
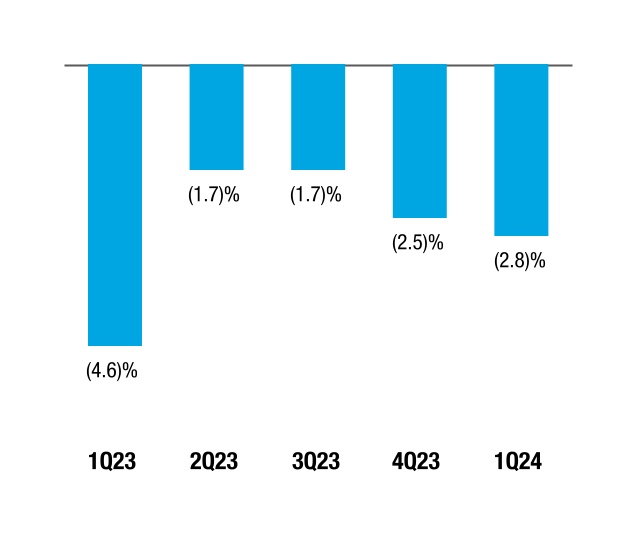
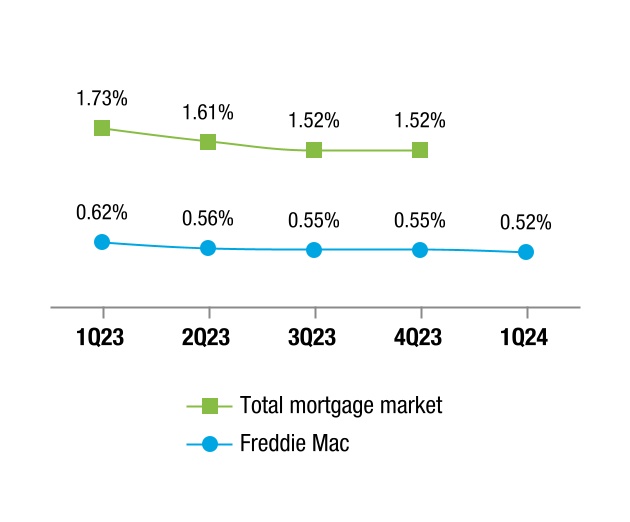
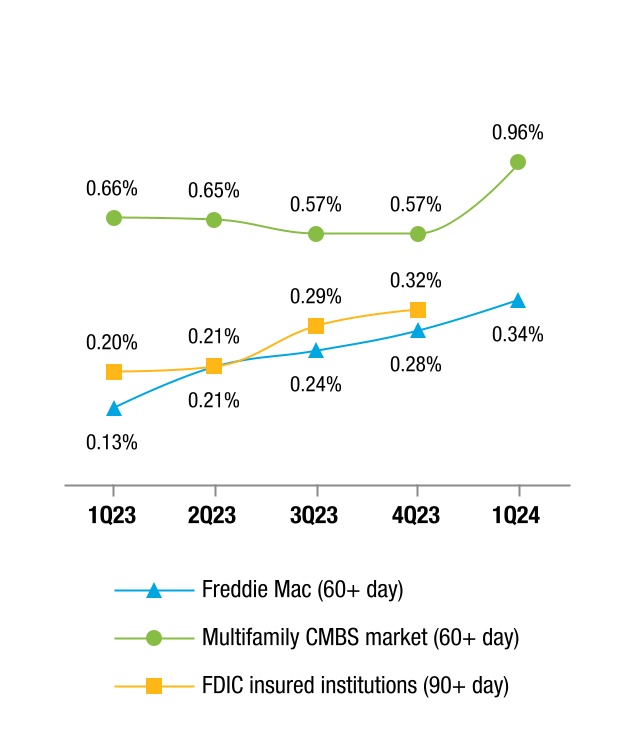 Source: Freddie Mac, FDIC Quarterly Banking Profile, Intex Solutions, Inc., and Wells Fargo Securities (Multifamily CMBS conduit market, excluding REOs). The 1Q 2024 delinquency rate for FDIC insured institutions is not yet available.
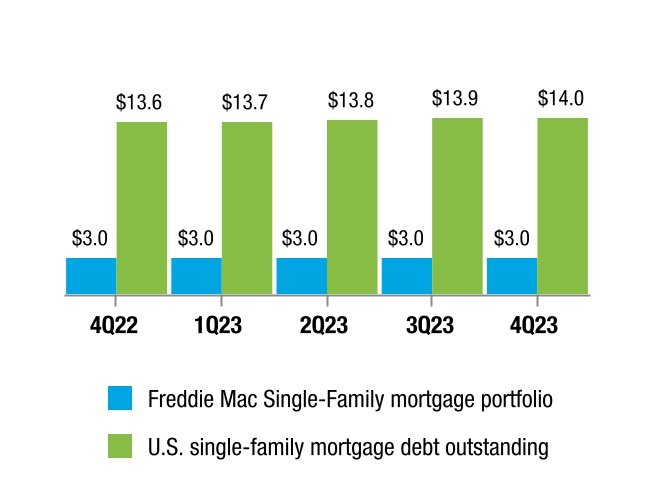
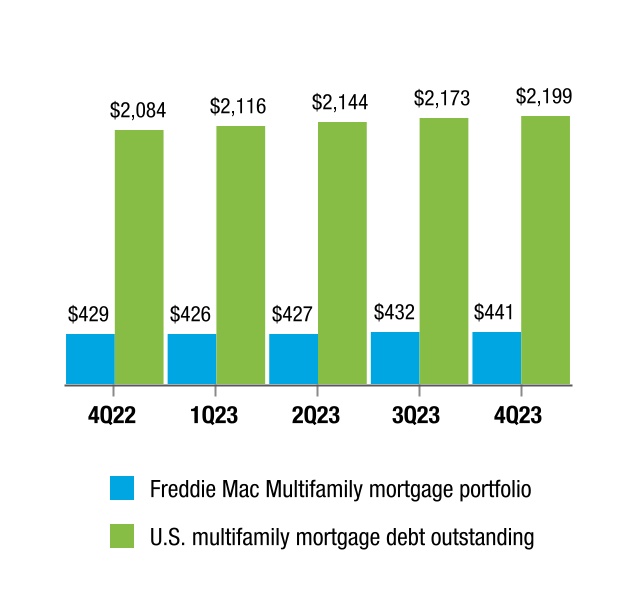 Source: Freddie Mac and Federal Reserve Financial Accounts of the United States of America. The 1Q 2024 U.S.
 | Freddie Mac 1Q 2024 Form 10-Q | 5 | |||||||
| Management's Discussion and Analysis | Consolidated Results of Operations | |||||||
| Change | ||||||||||||||||||||||||||||||||||||||
| (Dollars in millions) | 1Q 2024 | 1Q 2023 | $ | % | ||||||||||||||||||||||||||||||||||
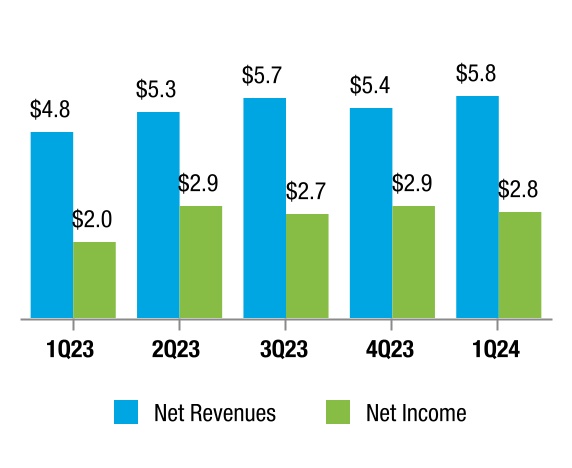
| Net interest income | $4,759 | $4,501 | $258 | 6 | % | |||||||||||||||||||||||||||||||||
| Non-interest income | 998 | 326 | 672 | 206 | ||||||||||||||||||||||||||||||||||
| Net revenues | 5,757 | 4,827 | 930 | 19 | ||||||||||||||||||||||||||||||||||
| (Provision) benefit for credit losses | (181) | (395) | 214 | 54 | ||||||||||||||||||||||||||||||||||
| Non-interest expense | (2,122) | (1,932) | (190) | (10) | ||||||||||||||||||||||||||||||||||
| Income before income tax expense | 3,454 | 2,500 | 954 | 38 | ||||||||||||||||||||||||||||||||||
| Income tax expense | (688) | (505) | (183) | (36) | ||||||||||||||||||||||||||||||||||
| Net income | 2,766 | 1,995 | 771 | 39 | ||||||||||||||||||||||||||||||||||
| Other comprehensive income (loss), net of taxes and reclassification adjustments | (25) | 54 | (79) | (146) | ||||||||||||||||||||||||||||||||||
| Comprehensive income | $2,741 | $2,049 | $692 | 34 | % | |||||||||||||||||||||||||||||||||
| Change | ||||||||||||||||||||||||||||||||||||||
| (Dollars in millions) | 1Q 2024 | 1Q 2023 | $ | % | ||||||||||||||||||||||||||||||||||
| Guarantee net interest income: | ||||||||||||||||||||||||||||||||||||||
| Contractual net interest income | $3,772 | $3,666 | $106 | 3 | % | |||||||||||||||||||||||||||||||||
| Deferred fee income | 166 | 207 | (41) | (20) | ||||||||||||||||||||||||||||||||||
| Total guarantee net interest income | 3,938 | 3,873 | 65 | 2 | ||||||||||||||||||||||||||||||||||
| Investments net interest income | 1,514 | 1,432 | 82 | 6 | ||||||||||||||||||||||||||||||||||
| Impact on net interest income from hedge accounting | (693) | (804) | 111 | 14 | ||||||||||||||||||||||||||||||||||
| Net interest income | $4,759 | $4,501 | $258 | 6 | % | |||||||||||||||||||||||||||||||||
| Freddie Mac 1Q 2024 Form 10-Q | ||||||||
| Management's Discussion and Analysis | ||||||||
| 1Q 2024 | 1Q 2023 | |||||||||||||||||||||||||||||||||||||||||||
| (Dollars in millions) | Average Balance | Interest Income (Expense) | Average Rate | Average Balance | Interest Income (Expense) | Average Rate | ||||||||||||||||||||||||||||||||||||||
| Interest-earning assets: | ||||||||||||||||||||||||||||||||||||||||||||
| Cash and cash equivalents | $12,141 | $125 | 4.09 | % | $13,758 | $121 | 3.51 | % | ||||||||||||||||||||||||||||||||||||
| Securities purchased under agreements to resell | 111,796 | 1,532 | 5.48 | 107,516 | 1,220 | 4.54 | ||||||||||||||||||||||||||||||||||||||
| Investment securities | 41,293 | 470 | 4.56 | 38,126 | 316 | 3.31 | ||||||||||||||||||||||||||||||||||||||
Mortgage loans(1) | 3,100,111 | 26,229 | 3.38 | 3,042,128 | 23,304 | 3.06 | ||||||||||||||||||||||||||||||||||||||
| Other assets | 1,784 | 29 | 6.48 | 1,930 | 26 | 5.30 | ||||||||||||||||||||||||||||||||||||||
| Total interest-earning assets | 3,267,125 | 28,385 | 3.47 | 3,203,458 | 24,987 | 3.12 | ||||||||||||||||||||||||||||||||||||||
| Interest-bearing liabilities: | ||||||||||||||||||||||||||||||||||||||||||||
| Debt of consolidated trusts | 3,035,073 | (21,122) | (2.78) | 2,975,417 | (18,261) | (2.45) | ||||||||||||||||||||||||||||||||||||||
| Debt of Freddie Mac | 180,850 | (2,504) | (5.53) | 187,599 | (2,225) | (4.74) | ||||||||||||||||||||||||||||||||||||||
| Total interest-bearing liabilities | 3,215,923 | (23,626) | (2.94) | 3,163,016 | (20,486) | (2.59) | ||||||||||||||||||||||||||||||||||||||
| Impact of net non-interest-bearing funding | 51,202 | — | 0.05 | 40,442 | — | 0.03 | ||||||||||||||||||||||||||||||||||||||
| Total funding of interest-earning assets | 3,267,125 | (23,626) | (2.89) | 3,203,458 | (20,486) | (2.56) | ||||||||||||||||||||||||||||||||||||||
| Net interest income/yield | $4,759 | 0.58 | % | $4,501 | 0.56 | % | ||||||||||||||||||||||||||||||||||||||
| Change | ||||||||||||||||||||||||||||||||||||||
| (Dollars in millions) | 1Q 2024 | 1Q 2023 | $ | % | ||||||||||||||||||||||||||||||||||
| Guarantee income | $496 | $466 | $30 | 6 | % | |||||||||||||||||||||||||||||||||
| Investment gains, net | 405 | (225) | 630 | 280 | ||||||||||||||||||||||||||||||||||
| Other income | 97 | 85 | 12 | 14 | ||||||||||||||||||||||||||||||||||
| Non-interest income | $998 | $326 | $672 | 206 | % | |||||||||||||||||||||||||||||||||
| Freddie Mac 1Q 2024 Form 10-Q | ||||||||
| Change | ||||||||||||||||||||||||||||||||||||||
| (Dollars in millions) | 1Q 2024 | 1Q 2023 | $ | % | ||||||||||||||||||||||||||||||||||
| Single-Family | ($120) | ($318) | $198 | 62 | % | |||||||||||||||||||||||||||||||||
| Multifamily | (61) | (77) | 16 | 21 | ||||||||||||||||||||||||||||||||||
| (Provision) benefit for credit losses | ($181) | ($395) | $214 | 54 | % | |||||||||||||||||||||||||||||||||
| Change | ||||||||||||||||||||||||||||||||||||||
| (Dollars in millions) | 1Q 2024 | 1Q 2023 | $ | % | ||||||||||||||||||||||||||||||||||
| Salaries and employee benefits | ($421) | ($374) | ($47) | (13) | % | |||||||||||||||||||||||||||||||||
| Credit enhancement expense | (597) | (530) | (67) | (13) | ||||||||||||||||||||||||||||||||||
| Benefit for (decrease in) credit enhancement recoveries | 1 | 49 | (48) | (98) | ||||||||||||||||||||||||||||||||||
| Legislative assessments expense: | ||||||||||||||||||||||||||||||||||||||
| Legislated guarantee fees expense | (724) | (708) | (16) | (2) | ||||||||||||||||||||||||||||||||||
| Affordable housing funds allocation | (30) | (27) | (3) | (11) | ||||||||||||||||||||||||||||||||||
| Total legislative assessments expense | (754) | (735) | (19) | (3) | ||||||||||||||||||||||||||||||||||
| Other expense | (351) | (342) | (9) | (3) | ||||||||||||||||||||||||||||||||||
| Non-interest expense | ($2,122) | ($1,932) | ($190) | (10) | % | |||||||||||||||||||||||||||||||||
| Freddie Mac 1Q 2024 Form 10-Q | 8 | |||||||
| Management's Discussion and Analysis | Consolidated Balance Sheets Analysis | |||||||
| Change | ||||||||||||||||||||
| (Dollars in millions) | March 31, 2024 | December 31, 2023 | $ | % | ||||||||||||||||
| Assets: | ||||||||||||||||||||
| Cash and cash equivalents | $3,531 | $6,019 | ($2,488) | (41) | % | |||||||||||||||
| Securities purchased under agreements to resell | 102,257 | 95,148 | 7,109 | 7 | ||||||||||||||||
| Investment securities, at fair value | 41,400 | 43,275 | (1,875) | (4) | ||||||||||||||||
| Mortgage loans held-for-sale | 12,034 | 12,941 | (907) | (7) | ||||||||||||||||
| Mortgage loans held-for-investment | 3,088,687 | 3,083,665 | 5,022 | — | ||||||||||||||||
| Accrued interest receivable, net | 10,047 | 9,925 | 122 | 1 | ||||||||||||||||
| Deferred tax assets, net | 4,227 | 4,076 | 151 | 4 | ||||||||||||||||
| Other assets | 25,190 | 25,927 | (737) | (3) | ||||||||||||||||
| Total assets | $3,287,373 | $3,280,976 | $6,397 | — | % | |||||||||||||||
| Liabilities and Equity: | ||||||||||||||||||||
| Liabilities: | ||||||||||||||||||||
| Accrued interest payable | $8,712 | $8,812 | ($100) | (1) | % | |||||||||||||||
| Debt | 3,211,742 | 3,208,346 | 3,396 | — | ||||||||||||||||
| Other liabilities | 16,456 | 16,096 | 360 | 2 | ||||||||||||||||
| Total liabilities | 3,236,910 | 3,233,254 | 3,656 | — | ||||||||||||||||
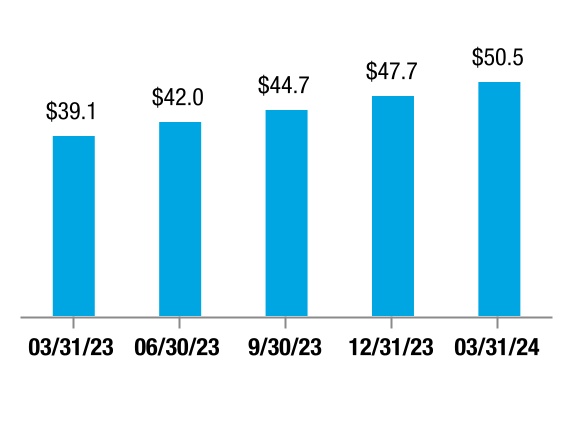
| Total equity | 50,463 | 47,722 | 2,741 | 6 | ||||||||||||||||
| Total liabilities and equity | $3,287,373 | $3,280,976 | $6,397 | — | % | |||||||||||||||
| Freddie Mac 1Q 2024 Form 10-Q | 9 | |||||||
| Management's Discussion and Analysis | Our Portfolios | |||||||
| March 31, 2024 | December 31, 2023 | |||||||||||||||||||||||||
| (In millions) | Single-Family | Multifamily | Total | Single-Family | Multifamily | Total | ||||||||||||||||||||
| Mortgage loans held-for-investment: | ||||||||||||||||||||||||||
| By consolidated trusts | $2,965,370 | $51,757 | $3,017,127 | $2,963,296 | $47,433 | $3,010,729 | ||||||||||||||||||||
| By Freddie Mac | 35,643 | 10,000 | 45,643 | 33,213 | 11,770 | 44,983 | ||||||||||||||||||||
| Total mortgage loans held-for-investment | 3,001,013 | 61,757 | 3,062,770 | 2,996,509 | 59,203 | 3,055,712 | ||||||||||||||||||||
| Mortgage loans held-for-sale | 3,104 | 9,446 | 12,550 | 3,527 | 9,905 | 13,432 | ||||||||||||||||||||
| Total mortgage loans | 3,004,117 | 71,203 | 3,075,320 | 3,000,036 | 69,108 | 3,069,144 | ||||||||||||||||||||
| Mortgage-related guarantees: | ||||||||||||||||||||||||||
| Mortgage loans held by nonconsolidated trusts | 30,324 | 361,164 | 391,488 | 30,182 | 360,928 | 391,110 | ||||||||||||||||||||
| Other mortgage-related guarantees | 8,511 | 10,720 | 19,231 | 8,692 | 10,761 | 19,453 | ||||||||||||||||||||
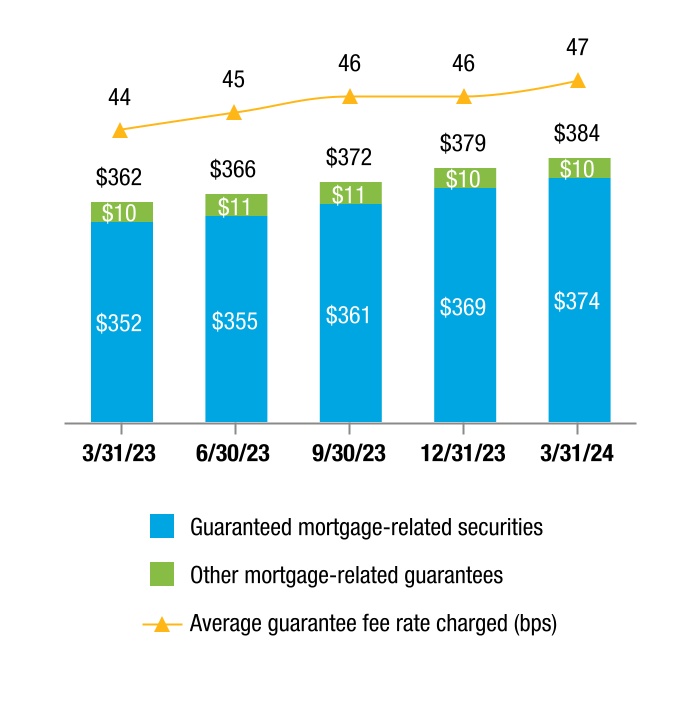
| Total mortgage-related guarantees | 38,835 | 371,884 | 410,719 | 38,874 | 371,689 | 410,563 | ||||||||||||||||||||
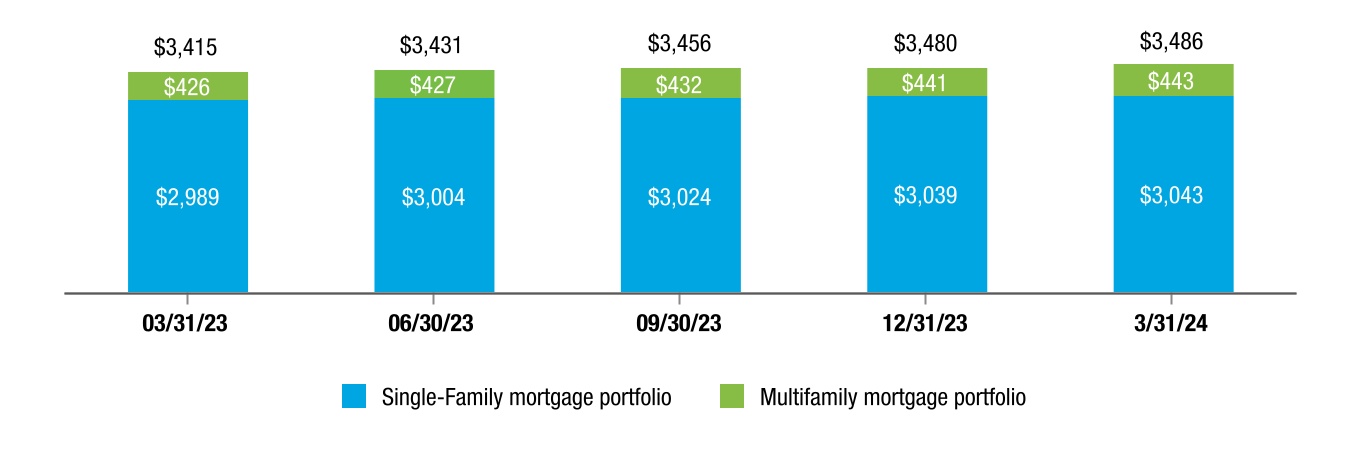
| Total mortgage portfolio | $3,042,952 | $443,087 | $3,486,039 | $3,038,910 | $440,797 | $3,479,707 | ||||||||||||||||||||
| Guaranteed mortgage-related securities: | ||||||||||||||||||||||||||
| Issued by consolidated trusts | $2,975,161 | $51,811 | $3,026,972 | $2,970,707 | $47,436 | $3,018,143 | ||||||||||||||||||||
| Issued by nonconsolidated trusts | 24,762 | 321,905 | 346,667 | 24,600 | 321,262 | 345,862 | ||||||||||||||||||||
| Total guaranteed mortgage-related securities | $2,999,923 | $373,716 | $3,373,639 | $2,995,307 | $368,698 | $3,364,005 | ||||||||||||||||||||
| Freddie Mac 1Q 2024 Form 10-Q | 10 | |||||||
| Management's Discussion and Analysis | Our Portfolios | |||||||
| March 31, 2024 | December 31, 2023 | |||||||||||||||||||||||||
| (In millions) | Single-Family | Multifamily | Total | Single-Family | Multifamily | Total | ||||||||||||||||||||
| Unsecuritized mortgage loans: | ||||||||||||||||||||||||||
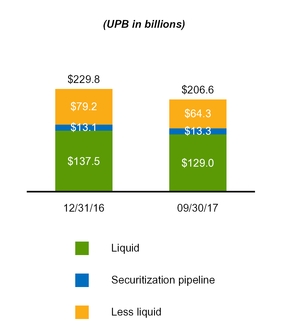
Securitization pipeline loans(1) | $9,749 | $13,057 | $22,806 | $8,225 | $15,197 | $23,422 | ||||||||||||||||||||
Other loans(2) | 28,998 | 6,389 | 35,387 | 28,515 | 6,478 | 34,993 | ||||||||||||||||||||
| Total unsecuritized mortgage loans | 38,747 | 19,446 | 58,193 | 36,740 | 21,675 | 58,415 | ||||||||||||||||||||
| Mortgage-related securities: | ||||||||||||||||||||||||||
| Investment securities | 2,916 | 4,486 | 7,402 | 2,667 | 4,613 | 7,280 | ||||||||||||||||||||
| Debt of consolidated trusts | 18,367 | 684 | 19,051 | 18,639 | 660 | 19,299 | ||||||||||||||||||||
| Total mortgage-related securities | 21,283 | 5,170 | 26,453 | 21,306 | 5,273 | 26,579 | ||||||||||||||||||||
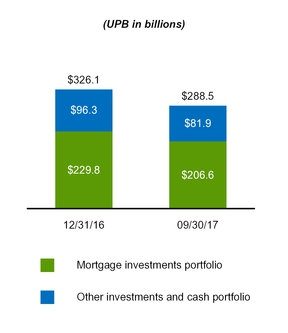
| Mortgage-related investments portfolio | $60,030 | $24,616 | $84,646 | $58,046 | $26,948 | $84,994 | ||||||||||||||||||||
| 10% of notional amount of interest-only securities | $23,126 | $22,186 | ||||||||||||||||||||||||
| Mortgage-related investments portfolio for purposes of Purchase Agreement cap | 107,772 | 107,180 | ||||||||||||||||||||||||
| March 31, 2024 | December 31, 2023 | |||||||||||||||||||||||||||||||
| (In millions) | Liquidity and Contingency Operating Portfolio | Custodial Account | Other | Total Other Investments Portfolio (1) | Liquidity and Contingency Operating Portfolio | Custodial Account | Other | Total Other Investments Portfolio (1) | ||||||||||||||||||||||||
| Cash and cash equivalents | $1,947 | $1,483 | $101 | $3,531 | $5,041 | $890 | $88 | $6,019 | ||||||||||||||||||||||||
Securities purchased under agreements to resell | 104,243 | 10,777 | 1,037 | 116,057 | 94,904 | 9,396 | 1,093 | 105,393 | ||||||||||||||||||||||||
Non-mortgage related securities(2) | 22,960 | — | 5,593 | 28,553 | 24,153 | — | 6,119 | 30,272 | ||||||||||||||||||||||||
| Other assets | — | — | 6,479 | 6,479 | — | — | 5,555 | 5,555 | ||||||||||||||||||||||||
| Other investments portfolio | $129,150 | $12,260 | $13,210 | $154,620 | $124,098 | $10,286 | $12,855 | $147,239 | ||||||||||||||||||||||||
| Freddie Mac 1Q 2024 Form 10-Q | 11 | |||||||
| Management's Discussion and Analysis | Our Business Segments | |||||||
| Segment | Description | ||||
| Single-Family | Reflects results from our purchase, securitization, and guarantee of single-family loans, our investments in single-family loans and mortgage-related securities, the management of Single-Family mortgage credit risk and market risk, and any results of our treasury function that are not allocated to each segment. | ||||
| Multifamily | Reflects results from our purchase, securitization, and guarantee of multifamily loans, our investments in multifamily loans and mortgage-related securities, and the management of Multifamily mortgage credit risk and market risk. | ||||
| Freddie Mac 1Q 2024 Form 10-Q | 12 | |||||||
| Management's Discussion and Analysis | Our Business Segments | Single-Family | ||||
| Freddie Mac 1Q 2024 Form 10-Q | ||||||||
| Management's Discussion and Analysis | Our Business Segments | Single-Family | ||||
| Freddie Mac 1Q 2024 Form 10-Q | ||||||||
| Management's Discussion and Analysis | Our Business Segments | Single-Family | ||||
| Freddie Mac 1Q 2024 Form 10-Q | ||||||||
| Management's Discussion and Analysis | Our Business Segments | Single-Family | ||||
| Change | ||||||||||||||||||||||||||||||||||||||
| (Dollars in millions) | 1Q 2024 | 1Q 2023 | $ | % | ||||||||||||||||||||||||||||||||||
| Net interest income | $4,488 | $4,296 | $192 | 4 | % | |||||||||||||||||||||||||||||||||
| Non-interest income | (14) | (93) | 79 | 85 | ||||||||||||||||||||||||||||||||||
| Net revenues | 4,474 | 4,203 | 271 | 6 | ||||||||||||||||||||||||||||||||||
| (Provision) benefit for credit losses | (120) | (318) | 198 | 62 | ||||||||||||||||||||||||||||||||||
| Non-interest expense | (1,925) | (1,783) | (142) | (8) | ||||||||||||||||||||||||||||||||||
| Income before Income tax expense | 2,429 | 2,102 | 327 | 16 | ||||||||||||||||||||||||||||||||||
| Income tax expense | (484) | (425) | (59) | (14) | ||||||||||||||||||||||||||||||||||
| Net income | 1,945 | 1,677 | 268 | 16 | ||||||||||||||||||||||||||||||||||
| Other comprehensive income (loss), net of taxes and reclassification adjustments | (5) | (1) | (4) | (400) | ||||||||||||||||||||||||||||||||||
| Comprehensive income | $1,940 | $1,676 | $264 | 16 | % | |||||||||||||||||||||||||||||||||
| Freddie Mac 1Q 2024 Form 10-Q | ||||||||
| Management's Discussion and Analysis | Our Business Segments | | |||||||
| September 30, 2017 | |||||||||||||||||||||||||||
| CLTV ≤ 80 | CLTV > 80 to 100 | CLTV > 100 | All Loans | ||||||||||||||||||||||||
| (Credit score) | % Portfolio | SDQ Rate(1) | % Portfolio | SDQ Rate(1) | % Portfolio | SDQ Rate(1) | % Portfolio | SDQ Rate(1) | % Modified | ||||||||||||||||||
| Core single-family loan portfolio: | |||||||||||||||||||||||||||
| < 620 | 0.3 | % | 1.89 | % | — | % | NM | — | % | NM | 0.3 | % | 2.11 | % | 3.3 | % | |||||||||||
| 620 to 659 | 1.7 | 0.98 | % | 0.4 | 1.11 | % | — | NM | 2.1 | 1.00 | % | 1.4 | % | ||||||||||||||
| ≥ 660 | 64.8 | 0.15 | % | 9.4 | 0.21 | % | — | NM | 74.2 | 0.16 | % | 0.2 | % | ||||||||||||||
| Not available | — | NM | — | NM | — | NM | — | NM | 3.7 | % | |||||||||||||||||
| Total | 66.8 | % | 0.18 | % | 9.8 | % | 0.25 | % | — | % | NM | 76.6 | % | 0.19 | % | 0.3 | % | ||||||||||
| Legacy and relief refinance single-family loan portfolio: | |||||||||||||||||||||||||||
| < 620 | 1.2 | % | 4.46 | % | 0.3 | % | 8.49 | % | 0.2 | % | 14.35 | % | 1.7 | % | 5.55 | % | 24.2 | % | |||||||||
| 620 to 659 | 2.0 | 3.32 | % | 0.5 | 6.65 | % | 0.2 | 12.07 | % | 2.7 | 4.18 | % | 20.8 | % | |||||||||||||
| ≥ 660 | 15.5 | 1.16 | % | 2.5 | 3.37 | % | 0.9 | 5.87 | % | 18.9 | 1.49 | % | 7.5 | % | |||||||||||||
| Not available | 0.1 | 4.85 | % | — | NM | — | NM | 0.1 | 5.32 | % | 17.5 | % | |||||||||||||||
| Total | 18.8 | % | 1.66 | % | 3.3 | % | 4.42 | % | 1.3 | % | 7.97 | % | 23.4 | % | 2.14 | % | 10.3 | % | |||||||||
| September 30, 2017 | December 31, 2016 | |||||||||||||||||||||||||
| (Dollars in billions) | UPB | CLTV | % Modified | SDQ Rate | UPB | CLTV | % Modified | SDQ Rate | ||||||||||||||||||
| Alt-A | $28.2 | 68 | % | 25.8 | % | 5.00 | % | $32.6 | 72 | % | 25.9 | % | 5.21 | % | ||||||||||||
| (Dollars in millions) | 3Q 2017 | 3Q 2016 | YTD 2017 | YTD 2016 | |||||||||||
Charge-offs, gross(1) | $1,140 | $461 | $4,033 | $1,516 | |||||||||||
| Recoveries | (145 | ) | (115 | ) | (327 | ) | (395 | ) | |||||||
| Charge-offs, net | 995 | 346 | 3,706 | 1,121 | |||||||||||
| REO operations expense | 35 | 56 | 128 | 169 | |||||||||||
| Total credit losses | $1,030 | $402 | $3,834 | $1,290 | |||||||||||
Total credit losses(1) (in bps) | 22.7 | 9.2 | 28.4 | 9.9 | |||||||||||
| September 30, 2017 | September 30, 2016 | |||||||||||||
| (Dollars in millions) | Loan Count | Amount | Loan Count | Amount | ||||||||||
| TDRs, at January 1 | 485,709 | $78,869 | 512,253 | $85,960 | ||||||||||
| New additions | 29,867 | 4,130 | 32,581 | 4,482 | ||||||||||
| Repayments and reclassifications to held-for-sale | (113,933 | ) | (21,828 | ) | (45,334 | ) | (8,863 | ) | ||||||
| Foreclosure transfers and foreclosure alternatives | (8,169 | ) | (1,122 | ) | (8,856 | ) | (1,261 | ) | ||||||
| TDRs, at September 30 | 393,474 | 60,049 | 490,644 | 80,318 | ||||||||||
| Loans impaired upon purchase | 5,782 | 380 | 8,266 | 583 | ||||||||||
| Total impaired loans with specific reserve | 399,256 | 60,429 | 498,910 | 80,901 | ||||||||||
| Allowance for loan losses | (7,706 | ) | (11,910 | ) | ||||||||||
| Net investment, at September 30 | $52,723 | $68,991 | ||||||||||||
| (In millions) | September 30, 2017 | December 31, 2016 | ||||||
| TDRs on accrual status | $58,065 | $77,122 | ||||||
| Non-accrual loans | 13,899 | 16,164 | ||||||
| Total TDRs and non-accrual loans | $71,964 | $93,286 | ||||||
| Loan loss reserves associated with: | ||||||||
| TDRs on accrual status | $6,326 | $10,295 | ||||||
| Non-accrual loans | 1,830 | 2,290 | ||||||
| Total | $8,156 | $12,585 | ||||||
| (In millions) | YTD 2017 | YTD 2016 | ||||||
Foregone interest income on TDRs and non-accrual loans(1) | $1,325 | $1,720 | ||||||
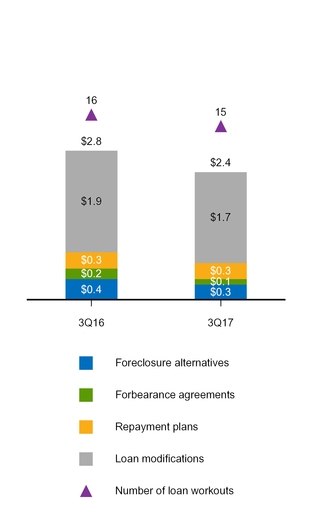
| 3Q 2017 | 3Q 2016 | YTD 2017 | YTD 2016 | |||||||||||||||||||||||||
| (Dollars in millions) | Number of Properties | Amount | Number of Properties | Amount | Number of Properties | Amount | Number of Properties | Amount | ||||||||||||||||||||
| Beginning balance — REO | 9,915 | $1,046 | 13,284 | $1,394 | 11,418 | $1,215 | 17,004 | $1,774 | ||||||||||||||||||||
| Additions | 2,853 | 282 | 3,986 | 397 | 9,697 | 949 | 12,770 | 1,229 | ||||||||||||||||||||
| Dispositions | (3,622 | ) | (348 | ) | (5,085 | ) | (503 | ) | (11,969 | ) | (1,184 | ) | (17,589 | ) | (1,715 | ) | ||||||||||||
| Ending balance — REO | 9,146 | 980 | 12,185 | 1,288 | 9,146 | 980 | 12,185 | 1,288 | ||||||||||||||||||||
| Beginning balance, valuation allowance | (10 | ) | (17 | ) | (17 | ) | (52 | ) | ||||||||||||||||||||
| Change in valuation allowance | (4 | ) | 1 | 3 | 36 | |||||||||||||||||||||||
| Ending balance, valuation allowance | (14 | ) | (16 | ) | (14 | ) | (16 | ) | ||||||||||||||||||||
| Ending balance — REO, net | $966 | $1,272 | $966 | $1,272 | ||||||||||||||||||||||||
| 3Q 2017 | 3Q 2016 | Change | YTD 2017 | YTD 2016 | Change | |||||||||||||||||||||||||
| (Dollars in millions) | $ | % | $ | % | ||||||||||||||||||||||||||
| Guarantee fee income | $1,581 | $1,641 | ($60 | ) | (4 | )% | $4,505 | $4,427 | $78 | 2 | % | |||||||||||||||||||
| Benefit (provision) for credit losses | (826 | ) | (297 | ) | (529 | ) | (178 | )% | (775 | ) | 113 | (888 | ) | (786 | )% | |||||||||||||||
| Other non-interest income (loss) | 403 | 6 | 397 | 6,617 | % | 1,081 | 131 | 950 | 725 | % | ||||||||||||||||||||
| Administrative expense | (353 | ) | (330 | ) | (23 | ) | (7 | )% | (1,018 | ) | (939 | ) | (79 | ) | (8 | )% | ||||||||||||||
| REO operations expense | (38 | ) | (59 | ) | 21 | 36 | % | (138 | ) | (177 | ) | 39 | 22 | % | ||||||||||||||||
| Other non-interest expense | (348 | ) | (311 | ) | (37 | ) | (12 | )% | (1,001 | ) | (832 | ) | (169 | ) | (20 | )% | ||||||||||||||
| Segment Earnings before income tax expense | 419 | 650 | (231 | ) | (36 | )% | 2,654 | 2,723 | (69 | ) | (3 | )% | ||||||||||||||||||
| Income tax expense | (164 | ) | (153 | ) | (11 | ) | (7 | )% | (911 | ) | (833 | ) | (78 | ) | (9 | )% | ||||||||||||||
| Segment Earnings, net of taxes | 255 | 497 | (242 | ) | (49 | )% | 1,743 | 1,890 | (147 | ) | (8 | )% | ||||||||||||||||||
| Total other comprehensive income (loss), net of tax | — | (1 | ) | 1 | 100 | % | (2 | ) | (1 | ) | (1 | ) | (100 | )% | ||||||||||||||||
| Total comprehensive income | $255 | $496 | ($241 | ) | (49 | )% | $1,741 | $1,889 | ($148 | ) | (8 | )% | ||||||||||||||||||
| Freddie Mac 1Q 2024 Form 10-Q | ||||||||
| Management's Discussion and Analysis | Our Business Segments |Multifamily | |||||||
| Freddie Mac 1Q 2024 Form 10-Q | ||||||||
| Management's Discussion and Analysis | Our Business Segments |Multifamily | |||||||
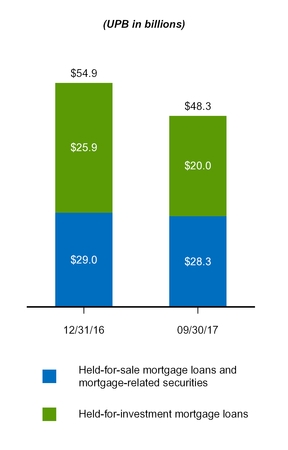
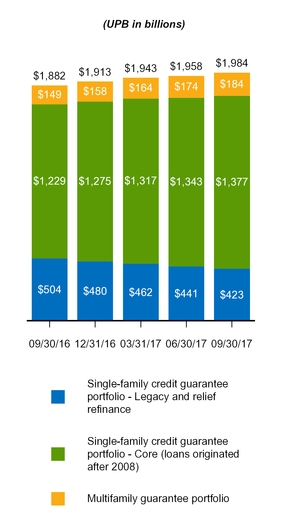
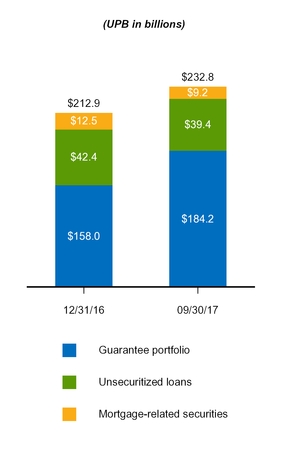
| (UPB in millions) | September 30, 2017 | December 31, 2016 | |||||
| Unsecuritized mortgage loans held-for-sale | $19,118 | $16,544 | |||||
| Unsecuritized mortgage loans held-for-investment | 20,019 | 25,874 | |||||
| Unsecuritized non-mortgage loans | 303 | — | |||||
| Mortgage-related securities | 9,172 | 12,517 | |||||
| Guarantee portfolio | 184,200 | 157,992 | |||||
| Total multifamily portfolio | 232,812 | 212,927 | |||||
Add: Unguaranteed securities(1) | 28,376 | 24,573 | |||||
Less: Acquired mortgage-related securities(2) | (5,413 | ) | (5,793 | ) | |||
| Total multifamily market support | $255,775 | $231,707 | |||||
| Freddie Mac 1Q 2024 Form 10-Q | ||||||||
| Management's Discussion and Analysis | Our Business Segments |Multifamily | |||||||
| Change | ||||||||||||||||||||||||||||||||||||||
| (Dollars in millions) | 1Q 2024 | 1Q 2023 | $ | % | ||||||||||||||||||||||||||||||||||
| Net interest income | $271 | $205 | $66 | 32 | % | |||||||||||||||||||||||||||||||||
| Non-interest income | 1,012 | 419 | 593 | 142 | ||||||||||||||||||||||||||||||||||
| Net revenues | 1,283 | 624 | 659 | 106 | ||||||||||||||||||||||||||||||||||
| (Provision) benefit for credit losses | (61) | (77) | 16 | 21 | ||||||||||||||||||||||||||||||||||
| Non-interest expense | (197) | (149) | (48) | (32) | ||||||||||||||||||||||||||||||||||
| Income before income tax expense | 1,025 | 398 | 627 | 158 | ||||||||||||||||||||||||||||||||||
| Income tax expense | (204) | (80) | (124) | (155) | ||||||||||||||||||||||||||||||||||
| Net income | 821 | 318 | 503 | 158 | ||||||||||||||||||||||||||||||||||
| Other comprehensive income (loss), net of taxes and reclassification adjustments | (20) | 55 | (75) | (136) | ||||||||||||||||||||||||||||||||||
| Comprehensive income | $801 | $373 | $428 | 115 | % | |||||||||||||||||||||||||||||||||
| Freddie Mac 1Q 2024 Form 10-Q | ||||||||
| Management's Discussion and Analysis | ||||||||
| 3Q 2017 | 3Q 2016 | Change | YTD 2017 | YTD 2016 | Change | |||||||||||||||||||||||||
| (Dollars in millions) | $ | % | $ | % | ||||||||||||||||||||||||||
| Net interest income | $342 | $255 | $87 | 34 | % | $905 | $791 | $114 | 14 | % | ||||||||||||||||||||
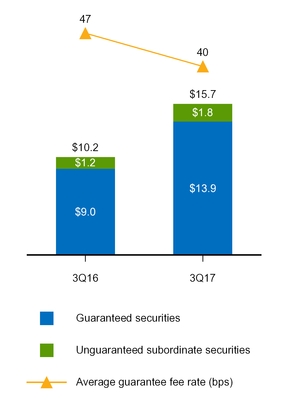
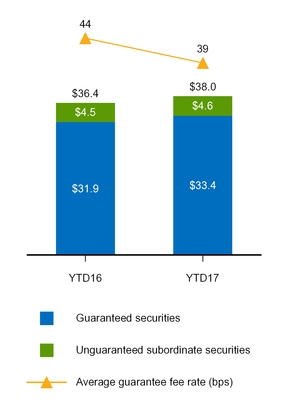
| Guarantee fee income | 170 | 134 | 36 | 27 | % | 483 | 366 | 117 | 32 | % | ||||||||||||||||||||
| Benefit (provision) for credit losses | (22 | ) | 8 | (30 | ) | (375 | )% | (10 | ) | 19 | (29 | ) | (153 | )% | ||||||||||||||||
| Gains (losses) on loans and other non-interest income | 183 | 551 | (368 | ) | (67 | )% | 831 | 1,666 | (835 | ) | (50 | )% | ||||||||||||||||||
| Derivative gains (losses) | 22 | 205 | (183 | ) | (89 | )% | (31 | ) | (878 | ) | 847 | 96 | % | |||||||||||||||||
| Administrative expense | (98 | ) | (89 | ) | (9 | ) | (10 | )% | (288 | ) | (255 | ) | (33 | ) | (13 | )% | ||||||||||||||
| Other non-interest expense | (11 | ) | (10 | ) | (1 | ) | (10 | )% | (44 | ) | (43 | ) | (1 | ) | (2 | )% | ||||||||||||||
| Segment Earnings before income tax (expense) benefit | 586 | 1,054 | (468 | ) | (44 | )% | 1,846 | 1,666 | 180 | 11 | % | |||||||||||||||||||
| Income tax (expense) benefit | (212 | ) | (310 | ) | 98 | 32 | % | (634 | ) | (510 | ) | (124 | ) | (24 | )% | |||||||||||||||
| Segment Earnings, net of taxes | 374 | 744 | (370 | ) | (50 | )% | 1,212 | 1,156 | 56 | 5 | % | |||||||||||||||||||
| Total other comprehensive income (loss), net of tax | (4 | ) | 46 | (50 | ) | (109 | )% | 65 | 56 | 9 | 16 | % | ||||||||||||||||||
| Total comprehensive income (loss) | $370 | $790 | ($420 | ) | (53 | )% | $1,277 | $1,212 | $65 | 5 | % | |||||||||||||||||||
| 3Q 2017 | 3Q 2016 | Change | YTD 2017 | YTD 2016 | Change | ||||||||||||||||||||||||
| (Dollars in millions) | $ | % | $ | % | |||||||||||||||||||||||||
| Net interest income | $804 | $933 | ($129 | ) | (14 | )% | $2,608 | $2,887 | ($279 | ) | (10 | )% | |||||||||||||||||
| Net impairment of available-for-sale securities recognized in earnings | 50 | 94 | (44 | ) | (47 | )% | 194 | 224 | (30 | ) | (13 | )% | |||||||||||||||||
| Derivative gains (losses) | (324 | ) | 212 | (536 | ) | (253 | )% | (757 | ) | (4,386 | ) | 3,629 | 83 | % | |||||||||||||||
| Gains (losses) on trading securities | (26 | ) | (203 | ) | 177 | 87 | % | (207 | ) | (12 | ) | (195 | ) | (1,625 | )% | ||||||||||||||
| Other non-interest income | 5,754 | 664 | 5,090 | 767 | % | 6,916 | 1,401 | 5,515 | 394 | % | |||||||||||||||||||
| Administrative expense | (73 | ) | (79 | ) | 6 | 8 | % | (242 | ) | (227 | ) | (15 | ) | (7 | )% | ||||||||||||||
| Segment Earnings before income tax (expense) benefit | 6,185 | 1,621 | 4,564 | 282 | % | 8,512 | (113 | ) | 8,625 | 7,633 | % | ||||||||||||||||||
| Income tax (expense) benefit | (2,143 | ) | (533 | ) | (1,610 | ) | (302 | )% | (2,921 | ) | 35 | (2,956 | ) | (8,446 | )% | ||||||||||||||
| Segment Earnings, net of taxes | 4,042 | 1,088 | 2,954 | 272 | % | 5,591 | (78 | ) | 5,669 | 7,268 | % | ||||||||||||||||||
| Total other comprehensive income (loss), net of tax | (17 | ) | (64 | ) | 47 | 73 | % | 261 | 220 | 41 | 19 | % | |||||||||||||||||
| Total comprehensive income (loss) | $4,025 | $1,024 | $3,001 | 293 | % | $5,852 | $142 | $5,710 | 4,021 | % | |||||||||||||||||||
| 3Q 2017 | 3Q 2016 | Change | YTD 2017 | YTD 2016 | Change | ||||||||||||||||||||||||
| (Dollars in billions) | $ | % | $ | % | |||||||||||||||||||||||||
| Interest rate-related | $— | $— | $— | — | % | ($0.1 | ) | ($1.9 | ) | $1.8 | 95 | % | |||||||||||||||||
| Market spread-related | 0.5 | 0.4 | 0.1 | 25 | % | 0.8 | 0.1 | 0.7 | 700 | % | |||||||||||||||||||
| 1Q 2024 | 1Q 2023 | |||||||||||||||||||||||||||||||||||||||||||
| (Dollars in millions) | Single-Family | Multifamily | Total | Single-Family | Multifamily | Total | ||||||||||||||||||||||||||||||||||||||
| Allowance for credit losses: | ||||||||||||||||||||||||||||||||||||||||||||
| Beginning balance | $6,402 | $447 | $6,849 | $7,746 | $147 | $7,893 | ||||||||||||||||||||||||||||||||||||||
| Provision (benefit) for credit losses | 120 | 61 | 181 | 318 | 77 | 395 | ||||||||||||||||||||||||||||||||||||||
| Charge-offs | (123) | — | (123) | (90) | — | (90) | ||||||||||||||||||||||||||||||||||||||
| Recoveries collected | 26 | — | 26 | 32 | — | 32 | ||||||||||||||||||||||||||||||||||||||
| Net charge-offs | (97) | — | (97) | (58) | — | (58) | ||||||||||||||||||||||||||||||||||||||
Other(1) | 83 | — | 83 | 91 | — | 91 | ||||||||||||||||||||||||||||||||||||||
| Ending balance | $6,508 | $508 | $7,016 | $8,097 | $224 | $8,321 | ||||||||||||||||||||||||||||||||||||||
Average loans outstanding during the period(2) | $3,030,531 | $58,504 | $3,089,035 | $2,985,726 | $47,748 | $3,033,474 | ||||||||||||||||||||||||||||||||||||||
| Net charge-offs to average loans outstanding | — | % | — | % | — | % | — | % | — | % | — | % | ||||||||||||||||||||||||||||||||
| Components of ending balance of allowance for credit losses: | ||||||||||||||||||||||||||||||||||||||||||||
| Mortgage loans held-for-investment | $6,189 | $381 | $6,570 | $7,675 | $160 | $7,835 | ||||||||||||||||||||||||||||||||||||||
Other(3) | 319 | 127 | 446 | 422 | 64 | 486 | ||||||||||||||||||||||||||||||||||||||
| Total ending balance | $6,508 | $508 | $7,016 | $8,097 | $224 | $8,321 | ||||||||||||||||||||||||||||||||||||||
| Freddie Mac 1Q 2024 Form 10-Q | ||||||||
| Management's Discussion and Analysis | Risk Management | |||||||
| March 31, 2024 | December 31, 2023 | ||||||||||||||||||||||
| (Dollars in millions) | Single-Family | Multifamily | Total | Single-Family | Multifamily | Total | |||||||||||||||||
| Allowance for credit losses ratios: | |||||||||||||||||||||||
Allowance for credit losses(1) to total loans outstanding | 0.20 | % | 0.64 | % | 0.21 | % | 0.20 | % | 0.57 | % | 0.21 | % | |||||||||||
| Non-accrual loans to total loans outstanding | 0.43 | 0.17 | 0.42 | 0.44 | 0.11 | 0.44 | |||||||||||||||||
| Allowance for credit losses to non-accrual loans | 47.90 | 369.90 | 50.45 | 45.01 | 509.38 | 47.20 | |||||||||||||||||
| Balances: | |||||||||||||||||||||||
| Allowance for credit losses on mortgage loans held-for-investment | $6,189 | $381 | $6,570 | $6,057 | $326 | $6,383 | |||||||||||||||||
Total loans outstanding(2) | 3,033,817 | 59,509 | 3,093,326 | 3,031,136 | 57,107 | 3,088,243 | |||||||||||||||||
Non-accrual loans(2) | 12,921 | 103 | 13,024 | 13,458 | 64 | 13,522 | |||||||||||||||||
| Freddie Mac 1Q 2024 Form 10-Q | ||||||||
| Management's Discussion and Analysis | Risk Management | |||||||
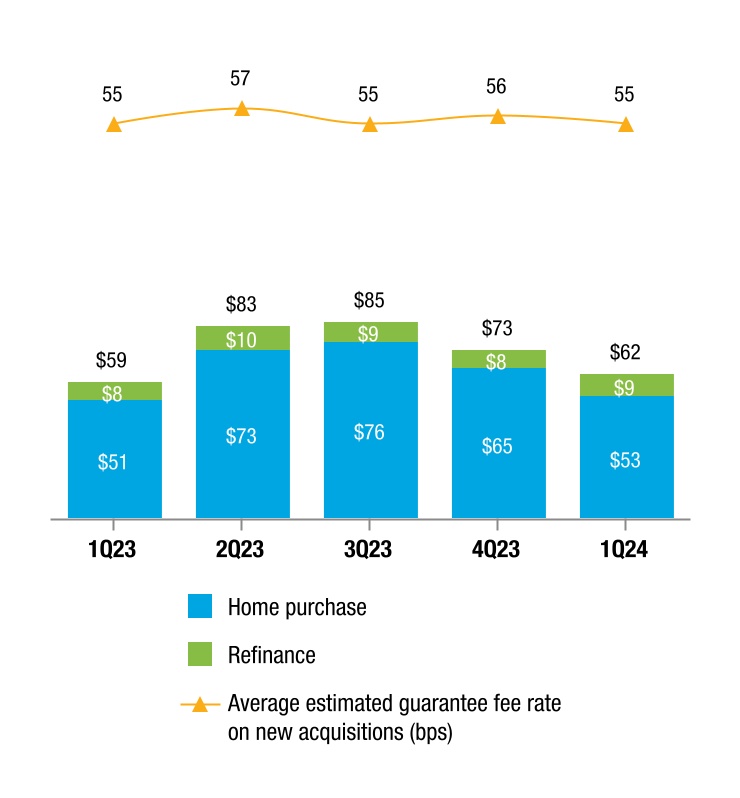
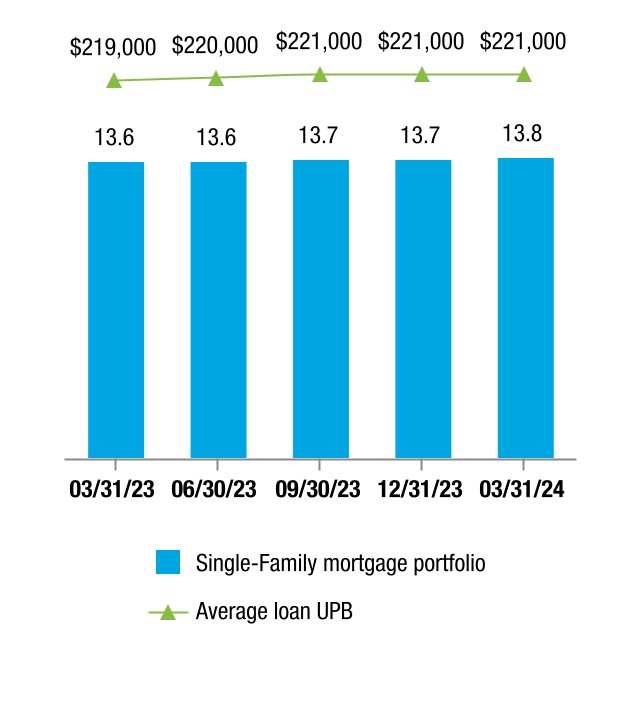
| 1Q 2024 | 1Q 2023 | |||||||||||||||||||||||||||||||
| (Dollars in millions) | Amount | % of Total | Amount | % of Total | ||||||||||||||||||||||||||||
| 20- and 30-year, amortizing fixed-rate | $59,091 | 95 | % | $55,469 | 94 | % | ||||||||||||||||||||||||||
| 15-year or less, amortizing fixed-rate | 2,278 | 4 | 2,214 | 4 | ||||||||||||||||||||||||||||
| Adjustable-rate | 900 | 1 | 1,282 | 2 | ||||||||||||||||||||||||||||
| Total | $62,269 | 100 | % | $58,965 | 100 | % | ||||||||||||||||||||||||||
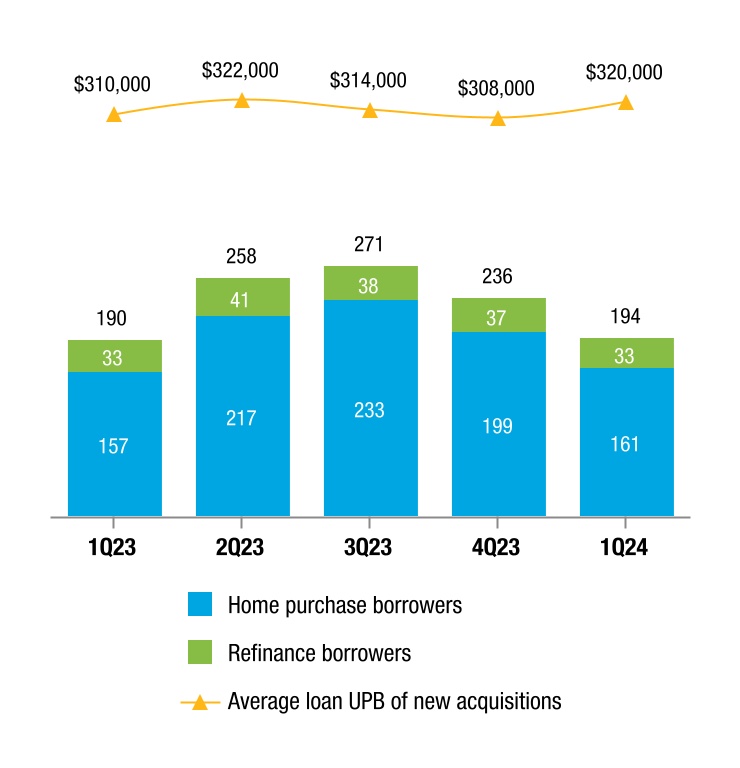
| Percentage of purchases | ||||||||||||||||||||||||||||||||
| DTI ratio > 45% | 28 | % | 23 | % | ||||||||||||||||||||||||||||
| Original LTV ratio > 90% | 25 | 28 | ||||||||||||||||||||||||||||||
| Transaction type: | ||||||||||||||||||||||||||||||||
| Guarantor swap | 66 | 72 | ||||||||||||||||||||||||||||||
| Cash window | 34 | 28 | ||||||||||||||||||||||||||||||
| Property type: | ||||||||||||||||||||||||||||||||
| Detached single-family houses and townhouses | 91 | 91 | ||||||||||||||||||||||||||||||
| Condominium or co-op | 9 | 9 | ||||||||||||||||||||||||||||||
| Occupancy type: | ||||||||||||||||||||||||||||||||
| Primary residence | 93 | 92 | ||||||||||||||||||||||||||||||
| Second home | 2 | 2 | ||||||||||||||||||||||||||||||
| Investment property | 5 | 6 | ||||||||||||||||||||||||||||||
| Loan purpose: | ||||||||||||||||||||||||||||||||
| Purchase | 86 | 86 | ||||||||||||||||||||||||||||||
| Cash-out refinance | 8 | 9 | ||||||||||||||||||||||||||||||
| Other refinance | 6 | 5 | ||||||||||||||||||||||||||||||
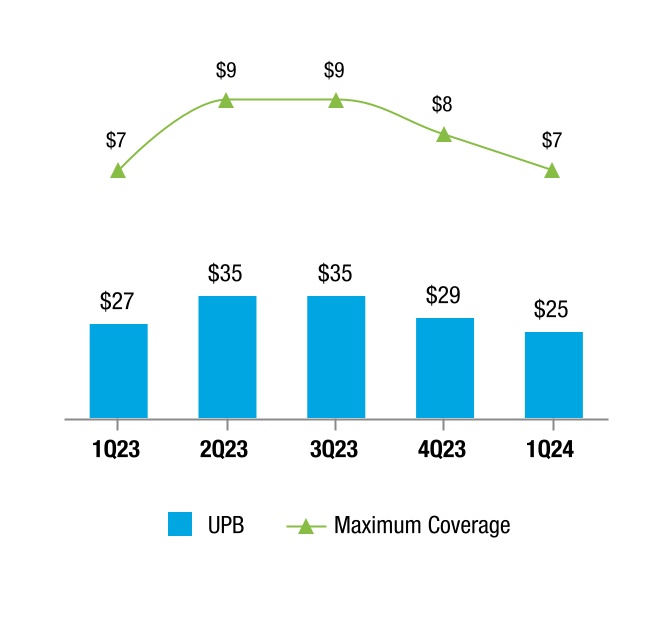
| 1Q 2024 | 1Q 2023 | ||||||||||||||||
| (In millions) | UPB(1)(2) | Maximum Coverage(3)(4) | UPB(1)(2) | Maximum Coverage(3)(4) | |||||||||||||
| Primary mortgage insurance | $25,135 | $6,616 | $26,518 | $6,920 | |||||||||||||
| CRT transactions: | |||||||||||||||||
| STACR | 41,402 | 1,284 | 14,887 | 611 | |||||||||||||
| ACIS | 15,523 | 559 | — | — | |||||||||||||
| Other | 692 | 107 | 46 | 46 | |||||||||||||
| Total CRT issuance | $57,617 | $1,950 | $14,933 | $657 | |||||||||||||
| Freddie Mac 1Q 2024 Form 10-Q | 23 | |||||||
| Management's Discussion and Analysis | Risk Management | |||||||
| March 31, 2024 | ||||||||||||||
| (Dollars in millions) | UPB(1) | % of Portfolio | Maximum Coverage(2)(3) | |||||||||||
Primary mortgage insurance(4) | $636,735 | 21 | % | $166,486 | ||||||||||
| STACR | 1,187,102 | 39 | 31,085 | |||||||||||
| ACIS | 804,323 | 26 | 17,535 | |||||||||||
| Other | 39,871 | 1 | 10,911 | |||||||||||
Less: UPB with multiple credit enhancements and other reconciling items(5) | (801,385) | (26) | — | |||||||||||
| Single-Family mortgage portfolio - credit-enhanced | 1,866,646 | 61 | 226,017 | |||||||||||
| Single-Family mortgage portfolio - non-credit-enhanced | 1,176,306 | 39 | N/A | |||||||||||
| Total | $3,042,952 | 100 | % | $226,017 | ||||||||||
| December 31, 2023 | ||||||||||||||
| (Dollars in millions) | UPB(1) | % of Portfolio | Maximum Coverage(2)(3) | |||||||||||
Primary mortgage insurance(4) | $637,037 | 21 | % | $165,738 | ||||||||||
| STACR | 1,175,837 | 39 | 31,222 | |||||||||||
| ACIS | 821,048 | 27 | 17,647 | |||||||||||
| Other | 39,901 | 1 | 11,027 | |||||||||||
Less: UPB with multiple credit enhancements and other reconciling items(5) | (813,966) | (27) | — | |||||||||||
| Single-Family mortgage portfolio - credit-enhanced | 1,859,857 | 61 | 225,634 | |||||||||||
| Single-Family mortgage portfolio - non-credit-enhanced | 1,179,053 | 39 | N/A | |||||||||||
| Total | $3,038,910 | 100 | % | $225,634 | ||||||||||
| March 31, 2024 | December 31, 2023 | |||||||||||||||||||
(% of portfolio based on UPB)(1) | % of Portfolio(2) | SDQ Rate | % of Portfolio(2) | SDQ Rate | ||||||||||||||||
| Credit-enhanced: | ||||||||||||||||||||
| Primary mortgage insurance | 21 | % | 0.92 | % | 21 | % | 0.95 | % | ||||||||||||
| CRT and other | 55 | 0.57 | 55 | 0.60 | ||||||||||||||||
| Non-credit-enhanced | 39 | 0.40 | 39 | 0.42 | ||||||||||||||||
| Total | N/A | 0.52 | N/A | 0.55 | ||||||||||||||||
| Freddie Mac 1Q 2024 Form 10-Q | 24 | |||||||
| Management's Discussion and Analysis | Risk Management | |||||||
| March 31, 2024 | ||||||||||||||||||||
| (Dollars in millions) | UPB | Original Credit Score(1) | Current Credit Score(1)(2) | Original LTV Ratio | Current LTV Ratio | |||||||||||||||
| Single-Family mortgage portfolio year of origination: | ||||||||||||||||||||
| 2024 | $42,481 | 754 | 754 | 78 | % | 78 | % | |||||||||||||
| 2023 | 278,342 | 751 | 744 | 79 | 75 | |||||||||||||||
| 2022 | 426,234 | 746 | 744 | 76 | 68 | |||||||||||||||
| 2021 | 968,107 | 752 | 755 | 71 | 53 | |||||||||||||||
| 2020 | 707,779 | 761 | 767 | 71 | 46 | |||||||||||||||
| 2019 and prior | 620,009 | 738 | 751 | 75 | 34 | |||||||||||||||
| Total | $3,042,952 | 750 | 754 | 73 | 52 | |||||||||||||||
| December 31, 2023 | ||||||||||||||||||||
| (Dollars in millions) | UPB | Original Credit Score (1) | Current Credit Score(1)(2) | Original LTV Ratio | Current LTV Ratio | |||||||||||||||
| Single-Family mortgage portfolio year of origination: | ||||||||||||||||||||
| 2023 | $265,072 | 751 | 745 | 79 | % | 75 | % | |||||||||||||
| 2022 | 433,252 | 745 | 746 | 76 | 68 | |||||||||||||||
| 2021 | 984,004 | 752 | 756 | 71 | 54 | |||||||||||||||
| 2020 | 719,822 | 761 | 768 | 71 | 46 | |||||||||||||||
| 2019 | 119,557 | 746 | 753 | 76 | 46 | |||||||||||||||
| 2018 and prior | 517,203 | 736 | 751 | 75 | 32 | |||||||||||||||
| Total | $3,038,910 | 750 | 755 | 73 | 52 | |||||||||||||||
| March 31, 2024 | ||||||||||||||||||||||||||||||||||||||||||||||||||||||||
| CLTV ≤ 60 | CLTV > 60 to 80 | CLTV > 80 to 90 | CLTV > 90 to 100 | CLTV > 100 | All Loans | |||||||||||||||||||||||||||||||||||||||||||||||||||
| Original credit score | % of Portfolio | SDQ Rate | % of Portfolio | SDQ Rate(2) | % of Portfolio | SDQ Rate(2) | % of Portfolio | SDQ Rate(2) | % of Portfolio | SDQ Rate(2) | % of Portfolio | SDQ Rate | ||||||||||||||||||||||||||||||||||||||||||||
| 740 and above | 44 | % | 0.15 | % | 15 | % | 0.23 | % | 4 | % | 0.31 | % | 2 | % | 0.29 | % | — | % | NM | 65 | % | 0.17 | % | |||||||||||||||||||||||||||||||||
| 700 to 739 | 12 | 0.49 | 6 | 0.79 | 2 | 0.89 | 1 | 0.73 | — | NM | 21 | 0.58 | ||||||||||||||||||||||||||||||||||||||||||||
| 680 to 699 | 4 | 0.85 | 2 | 1.48 | — | NM | — | NM | — | NM | 6 | 1.00 | ||||||||||||||||||||||||||||||||||||||||||||
| 660 to 679 | 3 | 1.21 | 1 | 2.13 | — | NM | — | NM | — | NM | 4 | 1.40 | ||||||||||||||||||||||||||||||||||||||||||||
| 620 to 659 | 2 | 1.89 | 1 | 3.28 | — | NM | — | NM | — | NM | 3 | 2.10 | ||||||||||||||||||||||||||||||||||||||||||||
| Less than 620 | 1 | 4.30 | — | NM | — | NM | — | NM | — | NM | 1 | 4.63 | ||||||||||||||||||||||||||||||||||||||||||||
| Total | 66 | % | 0.46 | 25 | % | 0.67 | 6 | % | 0.71 | 3 | % | 0.59 | — | % | NM | 100 | % | 0.52 | ||||||||||||||||||||||||||||||||||||||
| Freddie Mac 1Q 2024 Form 10-Q | 25 | |||||||
| Management's Discussion and Analysis | Risk Management | |||||||
| December 31, 2023 | ||||||||||||||||||||||||||||||||||||||||||||||||||||||||
| CLTV ≤ 60 | CLTV > 60 to 80 | CLTV > 80 to 90 | CLTV > 90 to 100 | CLTV > 100 | All Loans | |||||||||||||||||||||||||||||||||||||||||||||||||||
| Original credit score | % of Portfolio | SDQ Rate | % of Portfolio | SDQ Rate(2) | % of Portfolio | SDQ Rate(2) | % of Portfolio | SDQ Rate(2) | % of Portfolio | SDQ Rate(2) | % of Portfolio | SDQ Rate | ||||||||||||||||||||||||||||||||||||||||||||
| 740 and above | 45 | % | 0.16 | % | 15 | % | 0.24 | % | 4 | % | 0.32 | % | 1 | % | 0.27 | % | — | % | NM | 65 | % | 0.18 | % | |||||||||||||||||||||||||||||||||
| 700 to 739 | 13 | 0.53 | 5 | 0.82 | 2 | 0.93 | 1 | 0.59 | — | NM | 21 | 0.61 | ||||||||||||||||||||||||||||||||||||||||||||
| 680 to 699 | 4 | 0.90 | 2 | 1.50 | — | NM | — | NM | — | NM | 6 | 1.05 | ||||||||||||||||||||||||||||||||||||||||||||
| 660 to 679 | 3 | 1.28 | 1 | 2.18 | — | NM | — | NM | — | NM | 4 | 1.45 | ||||||||||||||||||||||||||||||||||||||||||||
| 620 to 659 | 2 | 2.00 | 1 | 3.37 | — | NM | — | NM | — | NM | 3 | 2.21 | ||||||||||||||||||||||||||||||||||||||||||||
| Less than 620 | 1 | 4.41 | — | NM | — | NM | — | NM | — | NM | 1 | 4.74 | ||||||||||||||||||||||||||||||||||||||||||||
| Total | 68 | % | 0.49 | 24 | % | 0.70 | 6 | % | 0.72 | 2 | % | 0.52 | — | % | NM | 100 | % | 0.55 | ||||||||||||||||||||||||||||||||||||||
| Freddie Mac 1Q 2024 Form 10-Q | 26 | |||||||
| Management's Discussion and Analysis | Risk Management | |||||||
| 1Q 2024 | 1Q 2023 | ||||||||||||||||
| (UPB in millions, loan count in thousands) | UPB | Loan Count | UPB | Loan Count | |||||||||||||
| Payment deferral plans | $2,670 | 10 | $2,735 | 11 | |||||||||||||
| Loan modifications | 1,382 | 6 | 1,259 | 6 | |||||||||||||
Forbearance plans and other(1) | 1,180 | 5 | 1,490 | 7 | |||||||||||||
| Total | $5,232 | 21 | $5,484 | 24 | |||||||||||||
| Freddie Mac 1Q 2024 Form 10-Q | 27 | |||||||
| Management's Discussion and Analysis | Risk Management | |||||||
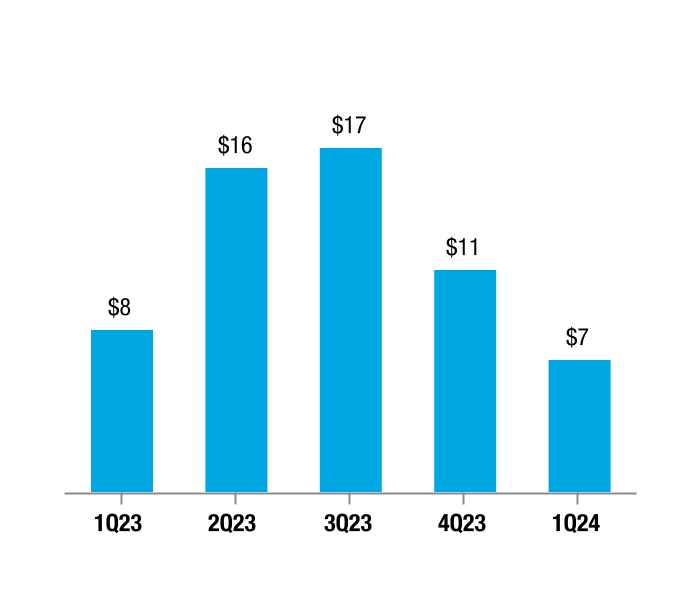
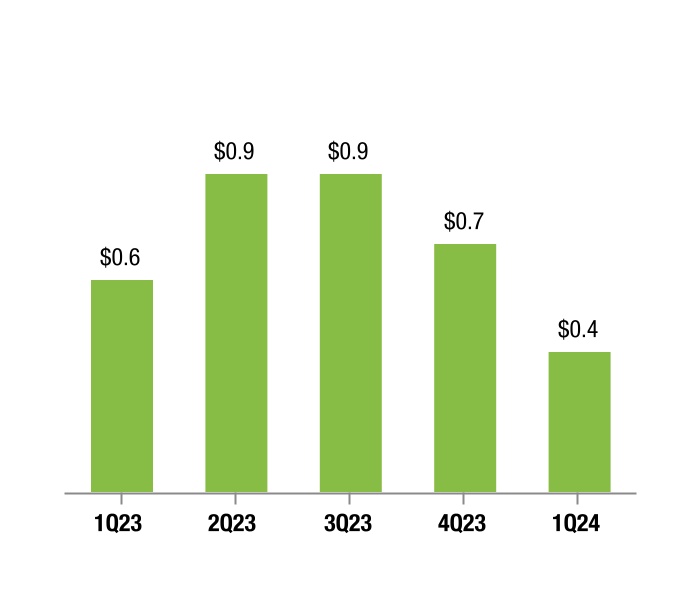
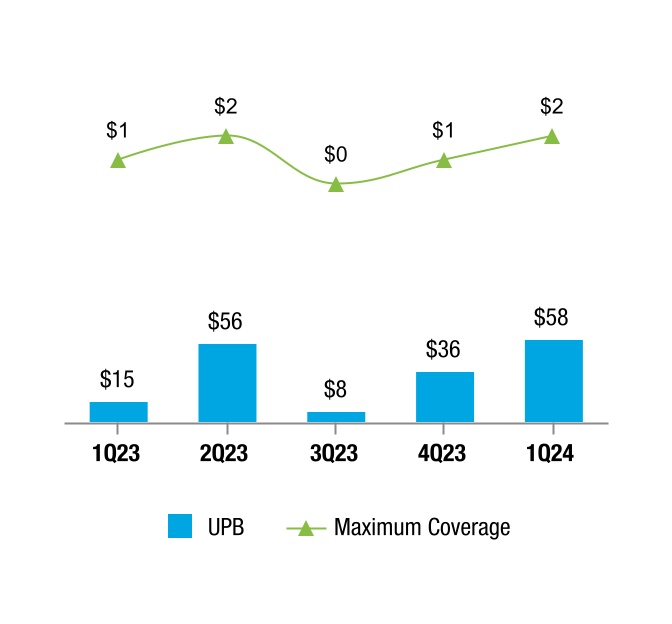
| 1Q 2024 | 1Q 2023 | |||||||||||||||||||||||||||||||||||||
| (In millions) | UPB(1) | Maximum Coverage(2)(3) | UPB(1) | Maximum Coverage(2)(3) | ||||||||||||||||||||||||||||||||||
| Subordination | $6,598 | $399 | $6,149 | $425 | ||||||||||||||||||||||||||||||||||
| SCR | — | — | 1,166 | 105 | ||||||||||||||||||||||||||||||||||
| Lender risk-sharing | — | — | 239 | 48 | ||||||||||||||||||||||||||||||||||
| Total CRT issuance | $6,598 | $399 | $7,554 | $578 | ||||||||||||||||||||||||||||||||||
| Freddie Mac 1Q 2024 Form 10-Q | 28 | |||||||
| Management's Discussion and Analysis | Risk Management | |||||||
| March 31, 2024 | December 31, 2023 | ||||||||||||||||||||||||||||||||||
| (Dollars in millions) | UPB | Delinquency Rate | UPB | Delinquency Rate | |||||||||||||||||||||||||||||||
| Credit-enhanced: | |||||||||||||||||||||||||||||||||||
| Subordination | $359,244 | 0.34 | % | $358,944 | 0.26 | % | |||||||||||||||||||||||||||||
| SCR/MCIP | 46,904 | 0.23 | 47,011 | 0.23 | |||||||||||||||||||||||||||||||
| Other | 8,779 | 0.86 | 8,844 | 0.89 | |||||||||||||||||||||||||||||||
| Total credit-enhanced | 414,927 | 0.34 | 414,799 | 0.27 | |||||||||||||||||||||||||||||||
| Non-credit-enhanced | 28,160 | 0.33 | 25,998 | 0.51 | |||||||||||||||||||||||||||||||
| Total | $443,087 | 0.34 | $440,797 | 0.28 | |||||||||||||||||||||||||||||||
| March 31, 2024 | December 31, 2023 | ||||||||||||||||||||||
| (Dollars in millions) | UPB | Delinquency Rate | UPB | Delinquency Rate | |||||||||||||||||||
| Mortgage loans held-for-sale | $8,602 | — | % | $8,823 | — | % | |||||||||||||||||
| Mortgage loans held-for-investment: | |||||||||||||||||||||||
| Held by Freddie Mac | 7,980 | 0.99 | 9,941 | 1.21 | |||||||||||||||||||
| Held by consolidated trusts | 9,182 | 0.14 | 4,851 | 0.27 | |||||||||||||||||||
| Other mortgage-related guarantees | 2,396 | — | 2,383 | — | |||||||||||||||||||
| Total | $28,160 | 0.33 | $25,998 | 0.51 | |||||||||||||||||||
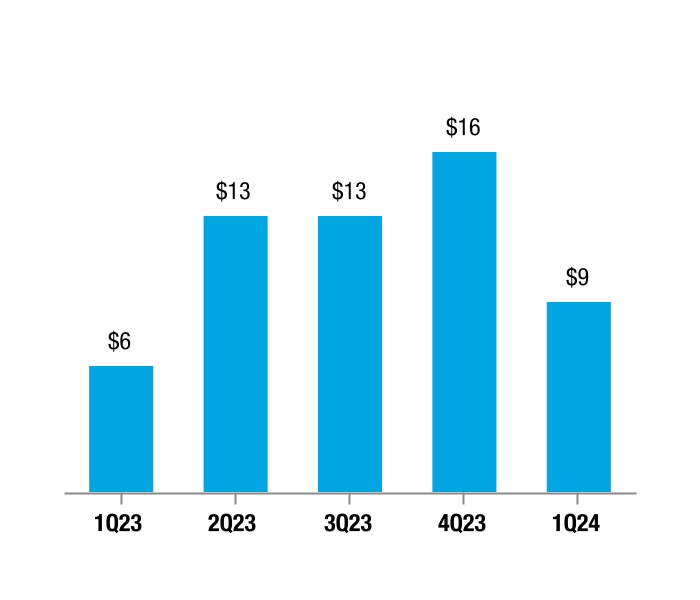
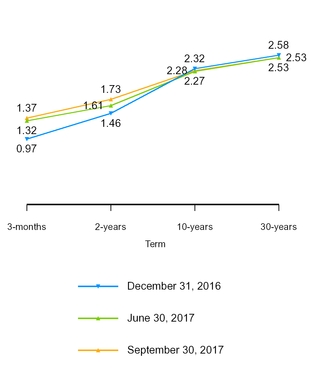
| PMVS-YC | PMVS-L | |||||||||||
| (In millions) | 25 bps | 50 bps | 100 bps | |||||||||
| Assuming shifts of the LIBOR yield curve: | ||||||||||||
| September 30, 2017 | $9 | $6 | $2 | |||||||||
| December 31, 2016 | $7 | $— | $— | |||||||||
| Freddie Mac 1Q 2024 Form 10-Q | ||||||||
| Management's Discussion and Analysis | Risk Management | |||||||
| March 31, 2024 | December 31, 2023 | |||||||||||||||||||||||||||||||
| PVS-YC | PVS-L | PVS-YC | PVS-L | |||||||||||||||||||||||||||||
| (In millions) | 25 bps | 50 bps | 100 bps | 25 bps | 50 bps | 100 bps | ||||||||||||||||||||||||||
Assuming shifts of the yield curve, (gains) losses on:(1) | ||||||||||||||||||||||||||||||||
| Assets: | ||||||||||||||||||||||||||||||||
| Investments | $316 | $3,047 | $6,015 | ($301) | $3,150 | $6,229 | ||||||||||||||||||||||||||
Guarantees(2) | (15) | (314) | (599) | 34 | (369) | (678) | ||||||||||||||||||||||||||
| Total assets | 301 | 2,733 | 5,416 | (267) | 2,781 | 5,551 | ||||||||||||||||||||||||||
| Liabilities | 56 | (1,496) | (3,044) | (52) | (1,519) | (3,073) | ||||||||||||||||||||||||||
| Derivatives | (357) | (1,267) | (2,494) | 322 | (1,274) | (2,547) | ||||||||||||||||||||||||||
| Total | $— | ($30) | ($122) | $3 | ($12) | ($69) | ||||||||||||||||||||||||||
| PVS | $— | $— | $— | $3 | $— | $— | ||||||||||||||||||||||||||
| 1Q 2024 | 1Q 2023 | |||||||||||||||||||||||||
(Duration gap in months, dollars in millions) | Duration Gap | PVS-YC 25 bps | PVS-L 50 bps | Duration Gap | PVS-YC 25 bps | PVS-L 50 bps | ||||||||||||||||||||
| Average | 0.1 | $2 | $— | — | $3 | $3 | ||||||||||||||||||||
| Minimum | (0.1) | — | — | (0.2) | — | — | ||||||||||||||||||||
| Maximum | 0.2 | 5 | 5 | 0.2 | 9 | 24 | ||||||||||||||||||||
| Standard deviation | 0.1 | 1 | 1 | 0.1 | 2 | 6 | ||||||||||||||||||||
| 3Q 2017 | 3Q 2016 | |||||||||||||||||||||
| (Duration gap in months, dollars in millions) | Duration Gap | PMVS-YC 25 bps | PMVS-L 50 bps | Duration Gap | PMVS-YC 25 bps | PMVS-L 50 bps | ||||||||||||||||
| Average | — | $9 | $35 | 0.1 | $6 | $14 | ||||||||||||||||
| Minimum | (0.4 | ) | $— | $— | (0.4 | ) | $— | $— | ||||||||||||||
| Maximum | 0.4 | $26 | $78 | 0.6 | $21 | $68 | ||||||||||||||||
| Standard deviation | 0.2 | $7 | $17 | 0.2 | $4 | $17 | ||||||||||||||||
| YTD 2017 | YTD 2016 | |||||||||||||||||||||
| (Duration gap in months, dollars in millions) | Duration Gap | PMVS-YC 25 bps | PMVS-L 50 bps | Duration Gap | PMVS-YC 25 bps | PMVS-L 50 bps | ||||||||||||||||
| Average | 0.1 | $7 | $16 | 0.1 | $6 | $21 | ||||||||||||||||
| Minimum | (0.4 | ) | $— | $— | (0.4 | ) | $— | $— | ||||||||||||||
| Maximum | 0.8 | $26 | $78 | 0.7 | $31 | $92 | ||||||||||||||||
| Standard deviation | 0.2 | $6 | $20 | 0.2 | $5 | $22 | ||||||||||||||||
| PVS-L (50 bps) | |||||||||||||||||
| (In millions) | Before Derivatives | After Derivatives | Effect of Derivatives | ||||||||||||||
| March 31, 2024 | $1,236 | $— | ($1,236) | ||||||||||||||
| December 31, 2023 | 1,261 | — | (1,261) | ||||||||||||||
| Freddie Mac 1Q 2024 Form 10-Q | 30 | |||||||
| PMVS-L (50 bps) | |||||||||||
| (In millions) | Before Derivatives | After Derivatives | Effect of Derivatives | ||||||||
| September 30, 2017 | $3,214 | $6 | ($3,208 | ) | |||||||
| December 31, 2016 | $3,651 | $— | ($3,651 | ) | |||||||
| Management's Discussion and Analysis | Risk Management | |||||||
| (In billions) | 3Q 2017 | 3Q 2016 | YTD 2017 | YTD 2016 | |||||||||||
| Interest rate effect on derivative fair values | $— | $0.5 | ($0.6 | ) | ($5.2 | ) | |||||||||
Estimate of offsetting interest rate effect related to financial instruments measured at fair value(1) | — | (0.5 | ) | — | 2.4 | ||||||||||
| Gains (losses) on mortgage loans in fair value hedge relationships | — | — | 0.4 | — | |||||||||||
| Income tax (expense) benefit | — | — | 0.1 | 1.0 | |||||||||||
| Estimated net interest rate effect on comprehensive income (loss) | $— | $— | ($0.1 | ) | ($1.8 | ) | |||||||||
| GAAP Adverse Scenario (Before-Tax) | ||||||||||
| (Dollars in billions) | Before Hedge Accounting | After Hedge Accounting | % Change | |||||||
| September 30, 2017 | ($2.8 | ) | ($1.2 | ) | 58 | % | ||||
| (In millions) | March 31, 2024 | March 31, 2023 | ||||||||||||
Interest Rate Scenarios(1) | ||||||||||||||
| Parallel yield curve shifts: | ||||||||||||||
| +100 bps | $10 | $25 | ||||||||||||
| -100 bps | (10) | (25) | ||||||||||||
| Non-parallel yield curve shifts - long-term interest rates: | ||||||||||||||
| +100 bps | 282 | 118 | ||||||||||||
| -100 bps | (282) | (118) | ||||||||||||
| Non-parallel yield curve shifts - short-term and medium-term interest rates: | ||||||||||||||
| +100 bps | (272) | (92) | ||||||||||||
| -100 bps | 272 | 92 | ||||||||||||
| Freddie Mac 1Q 2024 Form 10-Q | ||||||||
| Management's Discussion and Analysis | ||||||||
| Liquidity and Capital Resources | ||
| 3Q 2017 | |||||||||||||
| (Dollars in millions) | Short-term | Average Rate(1) | Long-term | Average Rate(1) | |||||||||
| Discount notes and Reference Bills: | |||||||||||||
| Beginning balance | $52,354 | 0.91 | % | $— | — | % | |||||||
| Issuances | 89,827 | 0.99 | % | — | — | % | |||||||
| Repurchases | — | — | % | — | — | % | |||||||
| Maturities | (93,716 | ) | 0.92 | % | — | — | % | ||||||
| Ending Balance | 48,465 | 1.05 | % | — | — | % | |||||||
| Securities sold under agreements to repurchase: | |||||||||||||
| Beginning balance | 4,772 | 1.01 | % | — | — | % | |||||||
| Additions | 30,803 | 0.92 | % | — | — | % | |||||||
| Repayments | (27,402 | ) | 0.93 | % | — | — | % | ||||||
| Ending Balance | 8,173 | 0.75 | % | — | — | % | |||||||
| Callable debt: | |||||||||||||
| Beginning balance | — | — | % | 120,450 | 1.53 | % | |||||||
| Issuances | — | — | % | 9,850 | 1.90 | % | |||||||
| Repurchases | — | — | % | (49 | ) | 2.39 | % | ||||||
| Calls | — | — | % | (13,011 | ) | 1.80 | % | ||||||
| Maturities | — | — | % | (3,850 | ) | 0.92 | % | ||||||
| Ending Balance | — | — | % | 113,390 | 1.51 | % | |||||||
Non-callable debt:(2) | |||||||||||||
| Beginning balance | 10,616 | 0.82 | % | 151,279 | 2.38 | % | |||||||
| Issuances | 2,300 | 1.07 | % | 7,555 | 1.51 | % | |||||||
| Repurchases | — | — | % | (167 | ) | 2.54 | % | ||||||
| Maturities | — | — | % | (20,947 | ) | 1.62 | % | ||||||
| Ending Balance | 12,916 | 0.86 | % | 137,720 | 2.47 | % | |||||||
| Total other debt | $69,554 | 0.98 | % | $251,110 | 2.04 | % | |||||||
| YTD 2017 | |||||||||||||
| (Dollars in millions) | Short-term | Average Rate(1) | Long-term | Average Rate(1) | |||||||||
| Discount notes and Reference Bills: | |||||||||||||
| Beginning balance | $61,042 | 0.47 | % | $— | — | % | |||||||
| Issuances | 289,138 | 0.79 | % | — | — | % | |||||||
| Repurchases | (57 | ) | 0.91 | % | — | — | % | ||||||
| Maturities | (301,658 | ) | 0.69 | % | — | — | % | ||||||
| Ending Balance | 48,465 | 1.05 | % | — | — | % | |||||||
| Securities sold under agreements to repurchase: | |||||||||||||
| Beginning balance | 3,040 | 0.42 | % | — | — | % | |||||||
| Additions | 93,948 | 0.61 | % | — | — | % | |||||||
| Repayments | (88,815 | ) | 0.57 | % | — | — | % | ||||||
| Ending Balance | 8,173 | 0.75 | % | — | — | % | |||||||
| Callable debt: | |||||||||||||
| Beginning balance | — | — | % | 98,420 | 1.44 | % | |||||||
| Issuances | — | — | % | 46,979 | 1.90 | % | |||||||
| Repurchases | — | — | % | (49 | ) | 2.39 | % | ||||||
| Calls | — | — | % | (24,227 | ) | 1.76 | % | ||||||
| Maturities | — | — | % | (7,733 | ) | 0.85 | % | ||||||
| Ending Balance | — | — | % | 113,390 | 1.51 | % | |||||||
Non-callable debt:(2) | |||||||||||||
| Beginning balance | 7,435 | 0.41 | % | 186,806 | 2.10 | % | |||||||
| Issuances | 12,866 | 0.87 | % | 18,673 | 1.99 | % | |||||||
| Repurchases | (500 | ) | 0.82 | % | (1,211 | ) | 1.40 | % | |||||
| Maturities | (6,885 | ) | 0.40 | % | (66,548 | ) | 1.46 | % | |||||
| Ending Balance | 12,916 | 0.86 | % | 137,720 | 2.47 | % | |||||||
| Total other debt | $69,554 | 0.98 | % | $251,110 | 2.04 | % | |||||||
| (In millions) | March 31, 2024(1) | December 31, 2023(1) | Description | ||||||||||||||
| Other Investments Portfolio - Liquidity and Contingency Operating Portfolio | $129,150 | $124,098 | The liquidity and contingency operating portfolio, included within our other investments portfolio, is primarily used for short-term liquidity management. | ||||||||||||||
| Mortgage-Related Investments Portfolio | 24,440 | 24,469 | The liquid portion of our mortgage-related investments portfolio can be pledged or sold for liquidity purposes. The amount of cash we may be able to successfully raise may be substantially less than the balance. | ||||||||||||||
| (In millions) | 3Q 2017 | YTD 2017 | |||||
| Beginning balance | $1,625,619 | $1,602,162 | |||||
| Issuances: | |||||||
| New issuances to third parties | 63,552 | 187,273 | |||||
| Additional issuances of securities | 39,425 | 100,507 | |||||
| Total issuances | 102,977 | 287,780 | |||||
| Extinguishments: | |||||||
| Purchases of debt securities from third parties | (7,221 | ) | (27,492 | ) | |||
| Debt securities received in settlement of advances to lenders | (8,630 | ) | (24,341 | ) | |||
| Repayments of debt securities | (68,833 | ) | (194,197 | ) | |||
| Total extinguishments | (84,684 | ) | (246,030 | ) | |||
| Ending balance | $1,643,912 | $1,643,912 | |||||
| Unamortized premiums and discounts | 47,612 | 47,612 | |||||
| Debt securities of consolidated trusts held by third parties | $1,691,524 | $1,691,524 | |||||
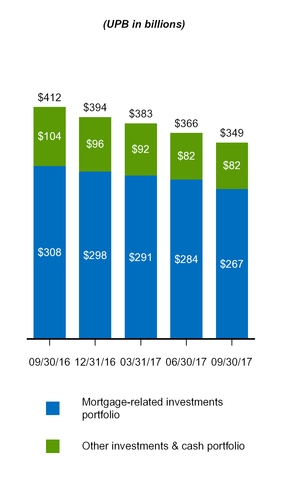
| September 30, 2017 | December 31, 2016 | |||||||||||||||||||||||||||||||
| (In billions) | Liquidity and Contingency Operating Portfolio | Custodial Account | Other(1) | Total Other Investments and Cash Portfolio | Liquidity and Contingency Operating Portfolio | Custodial Account | Other(1) | Total Other Investments and Cash Portfolio | ||||||||||||||||||||||||
| Cash and cash equivalents | $8.2 | $— | $— | $8.2 | $12.4 | $— | $— | $12.4 | ||||||||||||||||||||||||
| Restricted cash and cash equivalents | — | 5.1 | 2.6 | 7.7 | — | 9.5 | 0.4 | 9.9 | ||||||||||||||||||||||||
| Securities purchased under agreements to resell | 34.2 | 12.8 | 0.2 | 47.2 | 37.5 | 13.6 | 0.4 | 51.5 | ||||||||||||||||||||||||
| Non-mortgage-related securities | 16.9 | — | 0.6 | 17.5 | 19.6 | — | 1.5 | 21.1 | ||||||||||||||||||||||||
| Advances to lenders | — | — | 1.3 | 1.3 | — | — | 1.3 | 1.3 | ||||||||||||||||||||||||
| Total | $59.3 | $17.9 | $4.7 | $81.9 | $69.5 | $23.1 | $3.6 | $96.2 | ||||||||||||||||||||||||
| Freddie Mac 1Q 2024 Form 10-Q | ||||||||
| Management's Discussion and Analysis | Liquidity and Capital Resources | |||||||
| (In millions) | March 31, 2024(1) | December 31, 2023(1) | Description | ||||||||
| Debt of Freddie Mac | $161,704 | $166,419 | Debt of Freddie Mac is used to fund our business activities. | ||||||||
| Debt of Consolidated Trusts | 3,050,038 | 3,041,927 | Debt of consolidated trusts is used primarily to fund our Single-Family guarantee activities. This type of debt is principally repaid by the cash flows of the associated mortgage loans. As a result, our repayment obligation is limited to amounts paid pursuant to our guarantee of principal and interest and to purchase modified or seriously delinquent loans from the trusts. | ||||||||
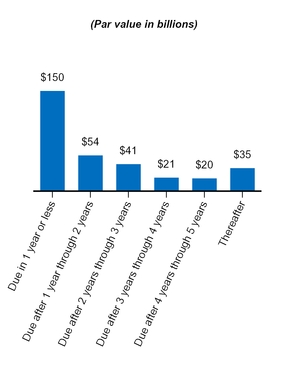
| 1Q 2024 | 1Q 2023 | |||||||||||||||||||
| (Dollars in millions) | Par Value | Average Rate(1) | Par Value | Average Rate(1) | ||||||||||||||||
| Short-term: | ||||||||||||||||||||
| Beginning balance | $6,031 | 5.39 | % | $7,716 | 3.49 | % | ||||||||||||||
| Issuances | 15,943 | 5.29 | 50,739 | 4.18 | ||||||||||||||||
| Repayments | — | — | — | — | ||||||||||||||||
| Maturities | (13,043) | 5.26 | (49,739) | 4.04 | ||||||||||||||||
| Total short-term debt | 8,931 | 5.37 | 8,716 | 4.36 | ||||||||||||||||
| Long-term: | ||||||||||||||||||||
| Beginning balance | 168,009 | 3.31 | 170,363 | 2.22 | ||||||||||||||||
| Issuances | 16,438 | 5.38 | 14,192 | 5.33 | ||||||||||||||||
| Repayments | (20,812) | 5.62 | (2,491) | 5.93 | ||||||||||||||||
| Maturities | (3,164) | 2.62 | (680) | 1.50 | ||||||||||||||||
| Total long-term debt | 160,471 | 3.24 | 181,384 | 2.51 | ||||||||||||||||
| Total debt of Freddie Mac, net | $169,402 | 3.35 | % | $190,100 | 2.60 | % | ||||||||||||||
| Freddie Mac 1Q 2024 Form 10-Q | ||||||||
| Management's Discussion and Analysis | Liquidity and Capital Resources | |||||||
| As of March 31, 2024 | As of December 31, 2023 | |||||||||||||||||||
| (In millions) | Contractual Maturity Date | Earliest Redemption Date | Contractual Maturity Date | Earliest Redemption Date | ||||||||||||||||
Debt of Freddie Mac(1): | ||||||||||||||||||||
| 1 year or less | $47,192 | $143,141 | $47,276 | $144,232 | ||||||||||||||||
| 1 year through 2 years | 54,690 | 12,049 | 61,187 | 15,249 | ||||||||||||||||
| 2 years through 3 years | 13,032 | 243 | 15,645 | 447 | ||||||||||||||||
| 3 years through 4 years | 13,154 | 290 | 12,530 | 305 | ||||||||||||||||
| 4 years through 5 years | 14,957 | 345 | 10,947 | 345 | ||||||||||||||||
| Thereafter | 24,328 | 11,285 | 24,278 | 11,285 | ||||||||||||||||
STACR and SCR debt(2) | 2,049 | 2,049 | 2,177 | 2,177 | ||||||||||||||||
| Total debt of Freddie Mac | $169,402 | $169,402 | $174,040 | $174,040 | ||||||||||||||||
| (In millions) | 1Q 2024 | 1Q 2023 | |||||||||||||||
| Beginning balance | $2,999,893 | $2,929,567 | |||||||||||||||
| Issuances | 84,873 | 87,021 | |||||||||||||||
| Repayments and extinguishments | (75,689) | (77,867) | |||||||||||||||
| Ending balance | 3,009,077 | 2,938,721 | |||||||||||||||
| Unamortized premiums and discounts | 40,961 | 48,329 | |||||||||||||||
| Debt of consolidated trusts | $3,050,038 | $2,987,050 | |||||||||||||||
| Freddie Mac 1Q 2024 Form 10-Q | 34 | |||||||
| Management's Discussion and Analysis | Liquidity and Capital Resources | |||||||
| (In millions) | 1Q 2024 | 1Q 2023 | ||||||||||||||||||
| Beginning balance | $47,722 | $37,018 | ||||||||||||||||||
| Comprehensive income | 2,741 | 2,049 | ||||||||||||||||||
| Capital draw from Treasury | — | — | ||||||||||||||||||
| Senior preferred stock dividends declared | — | — | ||||||||||||||||||
| Total equity / net worth | $50,463 | $39,067 | ||||||||||||||||||
| Remaining Treasury funding commitment | $140,162 | $140,162 | ||||||||||||||||||
| Aggregate draws under Purchase Agreement | 71,648 | 71,648 | ||||||||||||||||||
| Aggregate cash dividends paid to Treasury | 119,680 | 119,680 | ||||||||||||||||||
| Liquidation preference of the senior preferred stock | 120,370 | 109,666 | ||||||||||||||||||
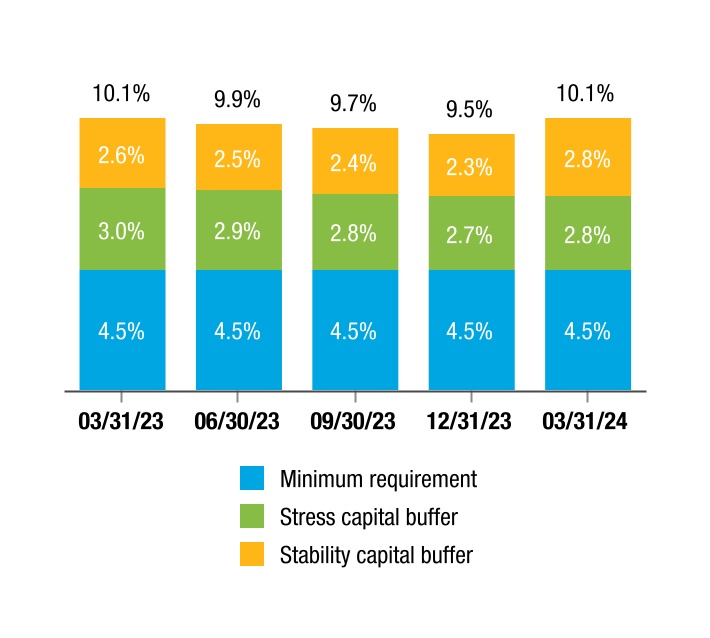
| (In millions) | 3Q 2017 | YTD 2017 | |||||
| Beginning balance | $2,586 | $5,075 | |||||
| Comprehensive (loss) income | 4,650 | 8,870 | |||||
| Capital draw from Treasury | — | — | |||||
| Senior preferred stock dividends declared | (1,986 | ) | (8,695 | ) | |||
| Total equity / net worth | $5,250 | $5,250 | |||||
| Aggregate draws under Purchase Agreement | $71,336 | $71,336 | |||||
| Aggregate cash dividends paid to Treasury | $110,143 | $110,143 | |||||
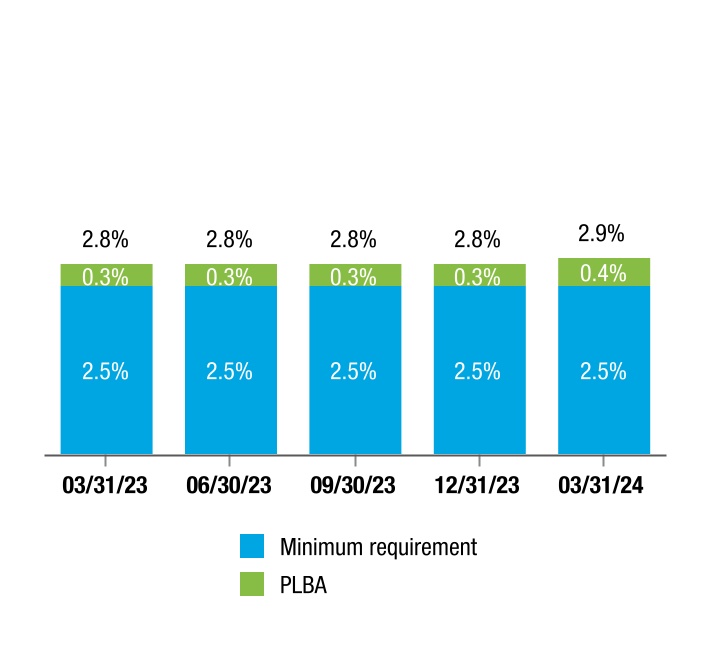
| Freddie Mac 1Q 2024 Form 10-Q | ||||||||
| Management's Discussion and Analysis | Liquidity and | |||||||
| (In billions) | March 31, 2024 | December 31, 2023 | |||||||||||||||||||||
| Total equity | $50 | $48 | |||||||||||||||||||||
| Less: | |||||||||||||||||||||||
| Senior preferred stock | 73 | 73 | |||||||||||||||||||||
| Preferred stock | 14 | 14 | |||||||||||||||||||||
| Common equity | (37) | (39) | |||||||||||||||||||||
| Less: deferred tax assets arising from temporary differences that exceed 10% of CET1 capital and other regulatory adjustments | 4 | 4 | |||||||||||||||||||||
| Common equity Tier 1 capital | (41) | (43) | |||||||||||||||||||||
| Add: Preferred stock | 14 | 14 | |||||||||||||||||||||
| Tier 1 capital | (27) | (29) | |||||||||||||||||||||
| Tier 2 capital adjustments | — | — | |||||||||||||||||||||
| Adjusted total capital | ($27) | ($29) | |||||||||||||||||||||
| (In billions) | March 31, 2024 | December 31, 2023 | |||||||||||||||||||||
| Total equity | $50 | $48 | |||||||||||||||||||||
| Less: | |||||||||||||||||||||||
| Senior preferred stock | 73 | 73 | |||||||||||||||||||||
| AOCI, net of taxes | — | — | |||||||||||||||||||||
| Core capital | (23) | (25) | |||||||||||||||||||||
General allowance for foreclosure losses(1) | 7 | 7 | |||||||||||||||||||||
| Total capital | ($16) | ($18) | |||||||||||||||||||||
| September 30, 2017 | December 31, 2016 | ||||||||||||||||||||||||||||||
| (Dollars in millions) | Liquid | Securitiz-ation Pipeline | Less Liquid | Total | Liquid | Securitiz-ation Pipeline | Less Liquid | Total | |||||||||||||||||||||||
| Capital Markets segment - Mortgage investments portfolio: | |||||||||||||||||||||||||||||||
| Single-family unsecuritized loans | |||||||||||||||||||||||||||||||
| Performing loans | $— | $13,343 | $— | $13,343 | $— | $13,113 | $— | $13,113 | |||||||||||||||||||||||
| Reperforming loans | — | — | 53,372 | 53,372 | — | — | 58,326 | 58,326 | |||||||||||||||||||||||
| Total single-family unsecuritized loans | — | 13,343 | 53,372 | 66,715 | — | 13,113 | 58,326 | 71,439 | |||||||||||||||||||||||
| Freddie Mac mortgage-related securities | 121,108 | — | 4,026 | 125,134 | 125,652 | — | 4,776 | 130,428 | |||||||||||||||||||||||
| Non-agency mortgage-related securities | 270 | — | 6,856 | 7,126 | 113 | — | 16,059 | 16,172 | |||||||||||||||||||||||
| Non-Freddie Mac agency mortgage-related securities | 7,614 | — | — | 7,614 | 11,759 | — | — | 11,759 | |||||||||||||||||||||||
| Total Capital Markets segment - Mortgage investments portfolio | 128,992 | 13,343 | 64,254 | 206,589 | 137,524 | 13,113 | 79,161 | 229,798 | |||||||||||||||||||||||
| Single-family Guarantee segment - Single-family unsecuritized seriously delinquent loans | — | — | 11,784 | 11,784 | — | — | 13,692 | 13,692 | |||||||||||||||||||||||
| Multifamily segment: | |||||||||||||||||||||||||||||||
| Unsecuritized loans | — | 18,416 | 20,721 | 39,137 | — | 16,372 | 26,047 | 42,419 | |||||||||||||||||||||||
| Mortgage-related securities | 7,211 | — | 1,960 | 9,171 | 7,447 | — | 5,070 | 12,517 | |||||||||||||||||||||||
| Total Multifamily segment | 7,211 | 18,416 | 22,681 | 48,308 | 7,447 | 16,372 | 31,117 | 54,936 | |||||||||||||||||||||||
| Total mortgage-related investments portfolio | $136,203 | $31,759 | $98,719 | $266,681 | $144,971 | $29,485 | $123,970 | $298,426 | |||||||||||||||||||||||
| Percentage of total mortgage-related investments portfolio | 51 | % | 12 | % | 37 | % | 100 | % | 49 | % | 10 | % | 41 | % | 100 | % | |||||||||||||||
| Mortgage-related investments portfolio cap at December 31, 2017 and December 31, 2016 | $288,408 | $339,304 | |||||||||||||||||||||||||||||
90% of mortgage-related investments portfolio cap at December 31, 2017 and December 31, 2016(1) | $259,567 | $305,374 | |||||||||||||||||||||||||||||
| Freddie Mac 1Q 2024 Form 10-Q | ||||||||
| Management's Discussion and Analysis | Liquidity and | |||||||
| (In billions) | March 31, 2024 | December 31, 2023 | |||||||||||||||||||||||||||
| Adjusted total assets | $3,786 | $3,775 | |||||||||||||||||||||||||||
| Risk-weighted assets (standardized approach): | |||||||||||||||||||||||||||||
| Credit risk | 893 | 884 | |||||||||||||||||||||||||||
| Market risk | 54 | 54 | |||||||||||||||||||||||||||
| Operational risk | 71 | 71 | |||||||||||||||||||||||||||
| Total risk-weighted assets | $1,018 | $1,009 | |||||||||||||||||||||||||||
| (In billions) | March 31, 2024 | December 31, 2023 | |||||||||||||||||||||||||||
| Stress capital buffer | $28 | $28 | |||||||||||||||||||||||||||
| Stability capital buffer | 29 | 23 | |||||||||||||||||||||||||||
| Countercyclical capital buffer amount | — | — | |||||||||||||||||||||||||||
| PCCBA | $57 | $51 | |||||||||||||||||||||||||||
| PLBA | $14 | $11 | |||||||||||||||||||||||||||
| March 31, 2024 | |||||||||||||||||||||||||||||
| (Dollars in billions) | Minimum Capital Requirement | Applicable Buffer(1) | Capital Requirement (Including Buffer(1)) | Available Capital (Deficit) | Capital Shortfall | ||||||||||||||||||||||||
| Risk-based capital amounts: | |||||||||||||||||||||||||||||
| Total capital | $81 | N/A | $81 | ($16) | ($97) | ||||||||||||||||||||||||
| CET1 capital | 46 | $57 | 103 | (41) | (144) | ||||||||||||||||||||||||
| Tier 1 capital | 61 | 57 | 118 | (27) | (145) | ||||||||||||||||||||||||
| Adjusted total capital | 81 | 57 | 138 | (27) | (165) | ||||||||||||||||||||||||
Risk-based capital ratios(2): | |||||||||||||||||||||||||||||
| Total capital | 8.0 | % | N/A | 8.0 | % | (1.5) | % | (9.5) | % | ||||||||||||||||||||
| CET1 capital | 4.5 | 5.6 | % | 10.1 | (4.0) | (14.1) | |||||||||||||||||||||||
| Tier 1 capital | 6.0 | 5.6 | 11.6 | (2.6) | (14.2) | ||||||||||||||||||||||||
| Adjusted total capital | 8.0 | 5.6 | 13.6 | (2.6) | (16.2) | ||||||||||||||||||||||||
| Leverage capital amounts: | |||||||||||||||||||||||||||||
| Core capital | $95 | N/A | $95 | ($23) | ($118) | ||||||||||||||||||||||||
| Tier 1 capital | 95 | $14 | 109 | (27) | (136) | ||||||||||||||||||||||||
Leverage capital ratios(3): | |||||||||||||||||||||||||||||
| Core capital | 2.5 | % | N/A | 2.5 | % | (0.6) | % | (3.1) | % | ||||||||||||||||||||
| Tier 1 capital | 2.5 | 0.4 | % | 2.9 | (0.7) | (3.6) | |||||||||||||||||||||||
| Freddie Mac 1Q 2024 Form 10-Q | ||||||||
| December 31, 2023 | |||||||||||||||||||||||||||||
| (Dollars in billions) | Minimum Capital Requirement | Applicable Buffer(1) | Capital Requirement (Including Buffer(1)) | Available Capital (Deficit) | Capital Shortfall | ||||||||||||||||||||||||
| Risk-based capital amounts: | |||||||||||||||||||||||||||||
| Total capital | $81 | N/A | $81 | ($18) | ($99) | ||||||||||||||||||||||||
| CET1 capital | 45 | $51 | 96 | (43) | (139) | ||||||||||||||||||||||||
| Tier 1 capital | 60 | 51 | 111 | (29) | (140) | ||||||||||||||||||||||||
| Adjusted total capital | 81 | 51 | 132 | (29) | (161) | ||||||||||||||||||||||||
Risk-based capital ratios(2): | |||||||||||||||||||||||||||||
| Total capital | 8.0 | % | N/A | 8.0 | % | (1.8) | % | (9.8) | % | ||||||||||||||||||||
| CET1 capital | 4.5 | 5.0 | % | 9.5 | (4.3) | (13.8) | |||||||||||||||||||||||
| Tier 1 capital | 6.0 | 5.0 | 11.0 | (2.9) | (13.9) | ||||||||||||||||||||||||
| Adjusted total capital | 8.0 | 5.0 | 13.0 | (2.9) | (15.9) | ||||||||||||||||||||||||
| Leverage capital amounts: | |||||||||||||||||||||||||||||
| Core capital | $95 | N/A | $95 | ($25) | ($120) | ||||||||||||||||||||||||
| Tier 1 capital | 95 | $11 | 106 | (29) | (135) | ||||||||||||||||||||||||
Leverage capital ratios(3): | |||||||||||||||||||||||||||||
| Core capital | 2.5 | % | N/A | 2.5 | % | (0.7) | % | (3.2) | % | ||||||||||||||||||||
| Tier 1 capital | 2.5 | 0.3 | % | 2.8 | (0.8) | (3.6) | |||||||||||||||||||||||
| Freddie Mac 1Q 2024 Form 10-Q | 38 | |||||||
| Management's Discussion and Analysis | Critical Accounting Estimates | |||||||
| 12-Month Forward | 13- to 24-Month Forward | ||||||||||
| March 31, 2024 | 0.2 | % | 0.6 | % | |||||||
| December 31, 2023 | 2.8 | 2.0 | |||||||||
| Freddie Mac 1Q 2024 Form 10-Q | 39 | |||||||
| Management's Discussion and Analysis | Regulation and Supervision | |||||||
| Goals | Market Levels | Preliminary | |||||||
| for 2016 | for 2016 | Results for 2016 | |||||||
| Single-family purchase money goals (benchmark levels) | |||||||||
| Low-income | 24 | % | 22.9 | % | 23.8 | % | |||
| Very low-income | 6 | % | 5.4 | % | 5.7 | % | |||
| Low-income areas | 17 | % | 19.7 | % | 19.9 | % | |||
| Low-income areas subgoal | 14 | % | 15.9 | % | 15.6 | % | |||
| Single-family refinance (benchmark level) | |||||||||
| Low-income goal | 21 | % | 19.8 | % | 21.0 | % | |||
| Multifamily (benchmark levels in units) | |||||||||
| Low-income goal | 300,000 | N/A | 406,958 | ||||||
| Very low-income subgoal | 60,000 | N/A | 73,030 | ||||||
| Small property low-income subgoal | 8,000 | N/A | 22,101 | ||||||
| Freddie Mac 1Q 2024 Form 10-Q | ||||||||
| Management's Discussion and Analysis | ||||||||
| Freddie Mac 1Q 2024 Form 10-Q | 41 | |||||||
| Management's Discussion and Analysis | Forward-Looking Statements | |||||||
| Freddie Mac 1Q 2024 Form 10-Q | ||||||||
| Financial Statements | ||||||||
| Financial Statements | |||||||||||||||
| Freddie Mac 1Q 2024 Form 10-Q | ||||||||
| Financial Statements | Condensed Consolidated Statements of Income and Comprehensive Income | ||||
| (In millions, except share-related amounts) | 3Q 2017 | 3Q 2016 | YTD 2017 | YTD 2016 | |||||||||||
| Interest income | |||||||||||||||
| Mortgage loans | $15,867 | $14,997 | $47,680 | $46,053 | |||||||||||
| Investments in securities | 821 | 976 | 2,637 | 2,923 | |||||||||||
| Other | 185 | 74 | 436 | 187 | |||||||||||
| Total interest income | 16,873 | 16,047 | 50,753 | 49,163 | |||||||||||
| Interest expense | (13,344 | ) | (12,354 | ) | (39,965 | ) | (38,523 | ) | |||||||
| Expense related to derivatives | (40 | ) | (47 | ) | (125 | ) | (146 | ) | |||||||
| Net interest income | 3,489 | 3,646 | 10,663 | 10,494 | |||||||||||
| Benefit (provision) for credit losses | (716 | ) | (113 | ) | (178 | ) | 1,129 | ||||||||
| Net interest income after benefit (provision) for credit losses | 2,773 | 3,533 | 10,485 | 11,623 | |||||||||||
| Non-interest income (loss) | |||||||||||||||
| Gains (losses) on extinguishment of debt | 27 | (92 | ) | 295 | (266 | ) | |||||||||
| Derivative gains (losses) | (678 | ) | (36 | ) | (2,076 | ) | (6,655 | ) | |||||||
| Net impairment of available-for-sale securities recognized in earnings | (1 | ) | (9 | ) | (17 | ) | (138 | ) | |||||||
| Other gains on investment securities recognized in earnings | 723 | 309 | 840 | 1,062 | |||||||||||
| Other income (loss) | 5,403 | 605 | 6,512 | 1,527 | |||||||||||
| Non-interest income (loss) | 5,474 | 777 | 5,554 | (4,470 | ) | ||||||||||
| Non-interest expense | |||||||||||||||
| Salaries and employee benefits | (272 | ) | (248 | ) | (813 | ) | (727 | ) | |||||||
| Professional services | (110 | ) | (129 | ) | (340 | ) | (347 | ) | |||||||
| Occupancy expense | (17 | ) | (13 | ) | (46 | ) | (41 | ) | |||||||
| Other administrative expense | (125 | ) | (108 | ) | (349 | ) | (306 | ) | |||||||
| Total administrative expense | (524 | ) | (498 | ) | (1,548 | ) | (1,421 | ) | |||||||
| Real estate owned operations expense | (35 | ) | (56 | ) | (128 | ) | (169 | ) | |||||||
| Temporary Payroll Tax Cut Continuation Act of 2011 expense | (339 | ) | (293 | ) | (990 | ) | (845 | ) | |||||||
| Other expense | (159 | ) | (138 | ) | (361 | ) | (442 | ) | |||||||
| Non-interest expense | (1,057 | ) | (985 | ) | (3,027 | ) | (2,877 | ) | |||||||
| Income (loss) before income tax (expense) benefit | 7,190 | 3,325 | 13,012 | 4,276 | |||||||||||
| Income tax (expense) benefit | (2,519 | ) | (996 | ) | (4,466 | ) | (1,308 | ) | |||||||
| Net income (loss) | 4,671 | 2,329 | 8,546 | 2,968 | |||||||||||
| Other comprehensive income (loss), net of taxes and reclassification adjustments: | |||||||||||||||
| Changes in unrealized gains (losses) related to available-for-sale securities | (47 | ) | (47 | ) | 246 | 181 | |||||||||
| Changes in unrealized gains (losses) related to cash flow hedge relationships | 26 | 29 | 81 | 95 | |||||||||||
| Changes in defined benefit plans | — | (1 | ) | (3 | ) | (1 | ) | ||||||||
| Total other comprehensive income (loss), net of taxes and reclassification adjustments | (21 | ) | (19 | ) | 324 | 275 | |||||||||
| Comprehensive income (loss) | $4,650 | $2,310 | $8,870 | $3,243 | |||||||||||
| Net income (loss) | $4,671 | $2,329 | $8,546 | $2,968 | |||||||||||
| Undistributed net worth sweep and senior preferred stock dividends | (4,650 | ) | (2,310 | ) | (8,870 | ) | (3,243 | ) | |||||||
| Net income (loss) attributable to common stockholders | $21 | $19 | ($324 | ) | ($275 | ) | |||||||||
| Net income (loss) per common share — basic and diluted | $0.01 | $0.01 | ($0.10 | ) | ($0.09 | ) | |||||||||
| Weighted average common shares outstanding (in millions) — basic and diluted | 3,234 | 3,234 | 3,234 | 3,234 | |||||||||||
(In millions, except share-related amounts) | 1Q 2024 | 1Q 2023 | ||||||||||||||||||
| Net interest income | ||||||||||||||||||||
| Interest income | $28,385 | $24,987 | ||||||||||||||||||
| Interest expense | (23,626) | (20,486) | ||||||||||||||||||
| Net interest income | 4,759 | 4,501 | ||||||||||||||||||
| Non-interest income | ||||||||||||||||||||
| Guarantee income | 496 | 466 | ||||||||||||||||||
| Investment gains, net | 405 | (225) | ||||||||||||||||||
| Other income | 97 | 85 | ||||||||||||||||||
| Non-interest income | 998 | 326 | ||||||||||||||||||
| Net revenues | 5,757 | 4,827 | ||||||||||||||||||
| (Provision) benefit for credit losses | (181) | (395) | ||||||||||||||||||
| Non-interest expense | ||||||||||||||||||||
| Salaries and employee benefits | (421) | (374) | ||||||||||||||||||
| Credit enhancement expense | (597) | (530) | ||||||||||||||||||
| Benefit for (decrease in) credit enhancement recoveries | 1 | 49 | ||||||||||||||||||
| Legislative assessments expense | (754) | (735) | ||||||||||||||||||
| Other expense | (351) | (342) | ||||||||||||||||||
| Non-interest expense | (2,122) | (1,932) | ||||||||||||||||||
| Income before income tax expense | 3,454 | 2,500 | ||||||||||||||||||
| Income tax expense | (688) | (505) | ||||||||||||||||||
| Net income | 2,766 | 1,995 | ||||||||||||||||||
| Other comprehensive income (loss), net of taxes and reclassification adjustments | (25) | 54 | ||||||||||||||||||
| Comprehensive income | $2,741 | $2,049 | ||||||||||||||||||
| Net income | $2,766 | $1,995 | ||||||||||||||||||
| Amounts attributable to senior preferred stock | (2,741) | (2,049) | ||||||||||||||||||
| Net income attributable to common stockholders | $25 | ($54) | ||||||||||||||||||
| Net income per common share | $0.01 | ($0.02) | ||||||||||||||||||
| Weighted average common shares (in millions) | 3,234 | 3,234 | ||||||||||||||||||
| Freddie Mac 1Q 2024 Form 10-Q | ||||||||
| Financial Statements | Condensed Consolidated Balance Sheets | ||||
| (In millions, except share-related amounts) | September 30, 2017 | December 31, 2016 | |||||
| Assets | |||||||
| Cash and cash equivalents (Note 12) | $8,183 | $12,369 | |||||
| Restricted cash and cash equivalents (Notes 3, 12) | 7,684 | 9,851 | |||||
| Securities purchased under agreements to resell (Notes 3, 8) | 47,202 | 51,548 | |||||
| Investments in securities, at fair value (Note 5) | 87,148 | 111,547 | |||||
| Mortgage loans held-for-sale (Note 4) (includes $18,995 and $16,255 at fair value) | 32,042 | 18,088 | |||||
| Mortgage loans held-for-investment (Notes 3, 4) (net of allowance for loan losses of $10,085 and $13,431) | 1,812,850 | 1,784,915 | |||||
| Accrued interest receivable (Note 3) | 6,268 | 6,135 | |||||
| Derivative assets, net (Notes 7, 8) | 705 | 747 | |||||
| Deferred tax assets, net (Note 10) | 14,576 | 15,818 | |||||
| Other assets (Notes 3, 15) (includes $2,761 and $2,408 at fair value) | 13,998 | 12,358 | |||||
| Total assets | $2,030,656 | $2,023,376 | |||||
| Liabilities and equity | |||||||
| Liabilities | |||||||
| Accrued interest payable (Note 3) | $5,990 | $6,015 | |||||
| Debt, net (Notes 3, 6) (includes $5,808 and $6,010 at fair value) | 2,009,578 | 2,002,004 | |||||
| Derivative liabilities, net (Notes 7, 8) | 212 | 795 | |||||
| Other liabilities (Notes 3, 15) | 9,626 | 9,487 | |||||
| Total liabilities | 2,025,406 | 2,018,301 | |||||
| Commitments and contingencies (Notes 3, 7, and 14) | |||||||
| Equity (Note 9) | |||||||
| Senior preferred stock | 72,336 | 72,336 | |||||
| Preferred stock, at redemption value | 14,109 | 14,109 | |||||
| Common stock, $0.00 par value, 4,000,000,000 shares authorized, 725,863,886 shares issued and 650,054,731 shares and 650,046,828 shares outstanding | — | — | |||||
| Additional paid-in capital | — | — | |||||
| Retained earnings (accumulated deficit) | (78,092 | ) | (77,941 | ) | |||
| AOCI, net of taxes, related to: | |||||||
| Available-for-sale securities (includes $726 and $782, related to net unrealized gains on securities for which other-than-temporary impairment has been recognized in earnings) | 1,161 | 915 | |||||
| Cash flow hedge relationships | (399 | ) | (480 | ) | |||
| Defined benefit plans | 18 | 21 | |||||
| Total AOCI, net of taxes | 780 | 456 | |||||
| Treasury stock, at cost, 75,809,155 shares and 75,817,058 shares | (3,883 | ) | (3,885 | ) | |||
| Total equity (See Note 9 for information on our dividend requirement to Treasury) | 5,250 | 5,075 | |||||
| Total liabilities and equity | $2,030,656 | $2,023,376 | |||||
| March 31, | December 31, | ||||||||||
(In millions, except share-related amounts) | 2024 | 2023 | |||||||||
| Assets | |||||||||||
| Cash and cash equivalents (includes $1,584 and $978 of restricted cash and cash equivalents) | $3,531 | $6,019 | |||||||||
| Securities purchased under agreements to resell | 102,257 | 95,148 | |||||||||
| Investment securities, at fair value | 41,400 | 43,275 | |||||||||
| Mortgage loans held-for-sale (includes $7,926 and $7,356 at fair value) | 12,034 | 12,941 | |||||||||
| Mortgage loans held-for-investment (net of allowance for credit losses of $6,570 and $6,383 and includes $1,931 and $1,806 at fair value) | 3,088,687 | 3,083,665 | |||||||||
| Accrued interest receivable, net | 10,047 | 9,925 | |||||||||
| Deferred tax assets, net | 4,227 | 4,076 | |||||||||
| Other assets (includes $5,849 and $6,095 at fair value) | 25,190 | 25,927 | |||||||||
| Total assets | $3,287,373 | $3,280,976 | |||||||||
| Liabilities and equity | |||||||||||
| Liabilities | |||||||||||
| Accrued interest payable | $8,712 | $8,812 | |||||||||
| Debt (includes $2,696 and $2,476 at fair value) | 3,211,742 | 3,208,346 | |||||||||
| Other liabilities (includes $1,053 and $873 at fair value) | 16,456 | 16,096 | |||||||||
| Total liabilities | 3,236,910 | 3,233,254 | |||||||||
| Commitments and contingencies | |||||||||||
| Equity | |||||||||||
| Senior preferred stock (liquidation preference of $120,370 and $117,309) | 72,648 | 72,648 | |||||||||
| Preferred stock, at redemption value | 14,109 | 14,109 | |||||||||
| Common stock, $0.00 par value, 4,000,000,000 shares authorized, 725,863,886 shares issued and 650,059,553 shares outstanding | — | — | |||||||||
| Retained earnings | (32,362) | (35,128) | |||||||||
| AOCI, net of taxes, related to: | |||||||||||
| Available-for-sale securities | 51 | 72 | |||||||||
| Other | (98) | (94) | |||||||||
| AOCI, net of taxes | (47) | (22) | |||||||||
| Treasury stock, at cost, 75,804,333 shares | (3,885) | (3,885) | |||||||||
Total equity | 50,463 | 47,722 | |||||||||
| Total liabilities and equity | $3,287,373 | $3,280,976 | |||||||||
| (In millions) | September 30, 2017 | December 31, 2016 | |||||
| Consolidated Balance Sheet Line Item | |||||||
| Assets: (Note 3) | |||||||
| Mortgage loans held-for-investment | $1,738,858 | $1,690,218 | |||||
| All other assets | 26,510 | 32,262 | |||||
| Total assets of consolidated VIEs | $1,765,368 | $1,722,480 | |||||
| Liabilities: (Note 3) | |||||||
| Debt, net | $1,691,524 | $1,648,683 | |||||
| All other liabilities | 4,950 | 4,846 | |||||
| Total liabilities of consolidated VIEs | $1,696,474 | $1,653,529 | |||||
| March 31, | December 31, | ||||||||||
| (In millions) | 2024 | 2023 | |||||||||
| Assets: | |||||||||||
| Cash and cash equivalents (includes $1,483 and $890 of restricted cash and cash equivalents) | $1,484 | $891 | |||||||||
| Securities purchased under agreements to resell | 10,777 | 9,396 | |||||||||
| Investment securities, at fair value | — | 65 | |||||||||
| Mortgage loans held-for-investment, net | 3,044,215 | 3,039,461 | |||||||||
| Accrued interest receivable, net | 9,051 | 8,885 | |||||||||
| Other assets | 5,525 | 4,858 | |||||||||
| Total assets of consolidated VIEs | $3,071,052 | $3,063,556 | |||||||||
| Liabilities: | |||||||||||
| Accrued interest payable | $7,702 | $7,527 | |||||||||
| Debt | 3,050,038 | 3,041,927 | |||||||||
| Total liabilities of consolidated VIEs | $3,057,740 | $3,049,454 | |||||||||
| Freddie Mac 1Q 2024 Form 10-Q | ||||||||
| Financial Statements | Condensed Consolidated Statements of | ||||
| (In millions) | YTD 2017 | YTD 2016 | |||||
| Net cash provided by operating activities | $5,862 | $5,053 | |||||
| Cash flows from investing activities | |||||||
| Purchases of trading securities | (119,548 | ) | (70,690 | ) | |||
| Proceeds from sales of trading securities | 115,727 | 45,650 | |||||
| Proceeds from maturities and repayments of trading securities | 6,775 | 18,602 | |||||
| Purchases of available-for-sale securities | (6,361 | ) | (21,988 | ) | |||
| Proceeds from sales of available-for-sale securities | 14,695 | 17,009 | |||||
| Proceeds from maturities and repayments of available-for-sale securities | 9,541 | 11,412 | |||||
| Purchases of held-for-investment mortgage loans | (92,311 | ) | (120,753 | ) | |||
| Proceeds from sales of mortgage loans held-for-investment | 4,641 | 2,605 | |||||
| Repayments of mortgage loans held-for-investment | 206,705 | 245,212 | |||||
| (Increase) decrease in restricted cash | 2,167 | (4,598 | ) | ||||
| Advances to lenders | (25,383 | ) | (20,457 | ) | |||
| Net proceeds from dispositions of real estate owned and other recoveries | 1,457 | 2,023 | |||||
| Net (increase) decrease in securities purchased under agreements to resell | 4,346 | 7,971 | |||||
| Derivative premiums and terminations, swap collateral, and exchange settlement payments, net | (1,646 | ) | (6,528 | ) | |||
| Changes in other assets | (248 | ) | (254 | ) | |||
| Net cash provided by investing activities | 120,557 | 105,216 | |||||
| Cash flows from financing activities | |||||||
| Proceeds from issuance of debt securities of consolidated trusts held by third parties | 135,697 | 178,727 | |||||
| Repayments and redemptions of debt securities of consolidated trusts held by third parties | (221,844 | ) | (251,296 | ) | |||
| Proceeds from issuance of other debt | 461,222 | 504,447 | |||||
| Repayments of other debt | (496,982 | ) | (541,125 | ) | |||
| Payment of cash dividends on senior preferred stock | (8,695 | ) | (2,673 | ) | |||
| Changes in other liabilities | (3 | ) | (4 | ) | |||
| Net cash used in financing activities | (130,605 | ) | (111,924 | ) | |||
| Net (decrease) increase in cash and cash equivalents | (4,186 | ) | (1,655 | ) | |||
| Cash and cash equivalents at beginning of year | 12,369 | 5,595 | |||||
| Cash and cash equivalents at end of period | $8,183 | $3,940 | |||||
| Supplemental cash flow information | |||||||
| Cash paid for: | |||||||
| Debt interest | $47,847 | $46,399 | |||||
| Income taxes | 887 | 1,834 | |||||
| Non-cash investing and financing activities (Note 4 and 5) | |||||||
| Shares Outstanding | Senior Preferred Stock | Preferred Stock, at Redemption Value | Common Stock, at Par Value | Retained Earnings | AOCI, Net of Tax | Treasury Stock, at Cost | Total Equity | ||||||||||||||||||||||||||||
| (In millions) | Senior Preferred Stock | Preferred Stock | Common Stock | ||||||||||||||||||||||||||||||||
| Balance at December 31, 2023 | 1 | 464 | 650 | $72,648 | $14,109 | $— | ($35,128) | ($22) | ($3,885) | $47,722 | |||||||||||||||||||||||||
| Comprehensive income: | |||||||||||||||||||||||||||||||||||
| Net income | — | — | — | — | — | — | 2,766 | — | — | 2,766 | |||||||||||||||||||||||||
| Other comprehensive income (loss): | |||||||||||||||||||||||||||||||||||
| Changes in net unrealized gains (losses) on available-for-sale securities (net of taxes of $7 million) | — | — | — | — | — | — | — | (25) | — | (25) | |||||||||||||||||||||||||
| Reclassification adjustment for (gains) losses on available-for-sale securities included in net income (net of taxes of $1 million) | — | — | — | — | — | — | — | 4 | — | 4 | |||||||||||||||||||||||||
| Other (net of taxes of $1 million) | — | — | — | — | — | — | — | (4) | — | (4) | |||||||||||||||||||||||||
| Comprehensive income | — | — | — | — | — | — | 2,766 | (25) | — | 2,741 | |||||||||||||||||||||||||
| Ending balance at March 31, 2024 | 1 | 464 | 650 | $72,648 | $14,109 | $— | ($32,362) | ($47) | ($3,885) | $50,463 | |||||||||||||||||||||||||
| Balance at December 31, 2022 | 1 | 464 | 650 | $72,648 | $14,109 | $— | ($45,666) | ($188) | ($3,885) | $37,018 | |||||||||||||||||||||||||
| Comprehensive income: | |||||||||||||||||||||||||||||||||||
| Net income | — | — | — | — | — | — | 1,995 | — | — | 1,995 | |||||||||||||||||||||||||
| Other comprehensive income (loss): | |||||||||||||||||||||||||||||||||||
| Changes in net unrealized gains (losses) on available-for-sale securities (net of taxes of $14 million) | — | — | — | — | — | — | — | 52 | — | 52 | |||||||||||||||||||||||||
| Reclassification adjustment for (gains) losses on available-for-sale securities included in net income (net of taxes of $0 million) | — | — | — | — | — | — | — | — | — | — | |||||||||||||||||||||||||
| Other (net of taxes of $1 million) | — | — | — | — | — | — | — | 2 | — | 2 | |||||||||||||||||||||||||
| Comprehensive income | — | — | — | — | — | — | 1,995 | 54 | — | 2,049 | |||||||||||||||||||||||||
| Ending balance at March 31, 2023 | 1 | 464 | 650 | $72,648 | $14,109 | $— | ($43,671) | ($134) | ($3,885) | $39,067 | |||||||||||||||||||||||||
| Freddie Mac 1Q 2024 Form 10-Q | 46 | |||||||
| Financial Statements | Condensed Consolidated Statements of Cash Flows | ||||
| (In millions) | 1Q 2024 | 1Q 2023 | |||||||||
| Net cash provided by (used in) operating activities | $2,894 | $3,435 | |||||||||
| Cash flows from investing activities | |||||||||||
| Investment securities: | |||||||||||
| Purchases | (15,067) | (39,052) | |||||||||
| Proceeds from sales | 16,257 | 34,919 | |||||||||
| Proceeds from maturities and repayments | 1,595 | 5,464 | |||||||||
| Mortgage loans acquired held-for-investment: | |||||||||||
| Purchases | (23,751) | (19,991) | |||||||||
| Proceeds from sales | 714 | 1,661 | |||||||||
| Proceeds from repayments | 57,248 | 55,034 | |||||||||
| Advances under secured lending arrangements | (19,544) | (22,317) | |||||||||
| Net (increase) decrease in securities purchased under agreements to resell | (10,736) | (13,353) | |||||||||
| Cash flows related to derivatives | 1,890 | 61 | |||||||||
| Other, net | 320 | (112) | |||||||||
| Net cash provided by (used in) investing activities | 8,926 | 2,314 | |||||||||
| Cash flows from financing activities | |||||||||||
| Debt of consolidated trusts: | |||||||||||
| Proceeds from issuance | 43,851 | 44,187 | |||||||||
| Repayments and redemptions | (57,074) | (55,197) | |||||||||
| Debt of Freddie Mac: | |||||||||||
| Proceeds from issuance | 32,281 | 64,864 | |||||||||
| Repayments | (36,920) | (52,748) | |||||||||
| Net increase (decrease) in securities sold under agreements to repurchase | 3,555 | (7,339) | |||||||||
| Other, net | (1) | (3) | |||||||||
| Net cash provided by (used in) financing activities | (14,308) | (6,236) | |||||||||
| Net increase (decrease) in cash and cash equivalents (includes restricted cash and cash equivalents) | (2,488) | (487) | |||||||||
| Cash and cash equivalents (includes restricted cash and cash equivalents) at the beginning of year | 6,019 | 6,360 | |||||||||
| Cash and cash equivalents (includes restricted cash and cash equivalents) at end of period | $3,531 | $5,873 | |||||||||
| Supplemental cash flow information | |||||||||||
| Cash paid for: | |||||||||||
| Debt interest | $24,220 | $20,806 | |||||||||
| Income taxes | — | — | |||||||||
| Non-cash investing and financing activities (Notes 3 and 6) | |||||||||||
| Freddie Mac 1Q 2024 Form 10-Q | ||||||||
| Financial Statements | Notes to the Condensed Consolidated Financial Statements| Note 1 | ||||
| Freddie Mac 1Q 2024 Form 10-Q | 48 | |||||||
| Financial Statements | Notes to the Condensed Consolidated Financial Statements| Note 1 | ||||
| Recently Adopted Accounting Guidance | |||||||||||
| Standard | Description | ||||||||||
| Date of Adoption | Effect on Consolidated Financial Statements | ||||||||||
ASU | The | January 1, | The adoption of | ||||||||
| Recently Issued Accounting Guidance, Not Yet Adopted Within Our Consolidated Financial Statements | |||||||||||||
| Standard | Description | Date of Adoption | Effect on Consolidated Financial Statements | ||||||||||
ASU | The | December 31, 2024 | We do not expect the | these amendments to have a material effect on our consolidated financial statements. | |||||||||
ASU 2023-09, Income Taxes (Topic 740): Improvements to Income Tax Disclosures | The amendments in this Update require annual disclosure of more detailed tax rate reconciliation categories and income taxes paid by geography and jurisdiction. | January 1, 2025 | We do not expect the adoption of these amendments to have a material effect on our consolidated financial statements. | ||||||||||
| Freddie Mac 1Q 2024 Form 10-Q | ||||||||
| Financial Statements | Notes to the Condensed Consolidated Financial Statements|Note | ||||
| (In millions) | September 30, 2017 | December 31, 2016 | ||||||
| Consolidated Balance Sheet Line Item | ||||||||
| Assets: | ||||||||
| Restricted cash and cash equivalents | $5,148 | $9,431 | ||||||
| Securities purchased under agreements to resell | 12,800 | 13,550 | ||||||
| Mortgage loans held-for-investment | 1,738,858 | 1,690,218 | ||||||
| Accrued interest receivable | 5,640 | 5,454 | ||||||
| Other assets | 2,922 | 3,827 | ||||||
| Total assets of consolidated VIEs | $1,765,368 | $1,722,480 | ||||||
| Liabilities: | ||||||||
| Accrued interest payable | $4,950 | $4,846 | ||||||
| Debt, net | 1,691,524 | 1,648,683 | ||||||
| Total liabilities of consolidated VIEs | $1,696,474 | $1,653,529 | ||||||
| March 31, 2024 | ||||||||||||||||||||
| Carrying Amounts of the Assets and Liabilities On the Condensed Consolidated Balance Sheets | Total Assets | Maximum Exposure to Loss | ||||||||||||||||||
| (In millions) | Investment securities | Accrued Interest Receivable and Other Assets(1) | Liabilities(1) | |||||||||||||||||
| Single-Family: | ||||||||||||||||||||
| Securitization products | $1,576 | $168 | $440 | $30,434 | $24,762 | |||||||||||||||
Resecuritization products(2) | 4,774 | 65 | 708 | 109,215 | 109,215 | |||||||||||||||
CRT products(3) | — | 90 | 284 | 29,116 | 10 | |||||||||||||||
| Total Single-Family | 6,350 | 323 | 1,432 | 168,765 | 133,987 | |||||||||||||||
| Multifamily: | ||||||||||||||||||||
Securitization products(4) | 5,775 | 5,097 | 4,519 | 361,164 | 321,905 | |||||||||||||||
CRT products(3) | — | 14 | 15 | 1,355 | 11 | |||||||||||||||
| Total Multifamily | 5,775 | 5,111 | 4,534 | 362,519 | 321,916 | |||||||||||||||
| Other | — | 7 | 5 | 112 | 483 | |||||||||||||||
| Total | $12,125 | $5,441 | $5,971 | $531,396 | $456,386 | |||||||||||||||
| Freddie Mac 1Q 2024 Form 10-Q | 50 | |||||||
| (In millions) | September 30, 2017 | December 31, 2016 | ||||||
Assets and Liabilities Recorded on our Consolidated Balance Sheets(1) | ||||||||
| Assets: | ||||||||
| Investments in securities | $52,355 | $58,995 | ||||||
| Accrued interest receivable | 236 | 254 | ||||||
| Other assets | 2,030 | 1,708 | ||||||
| Liabilities: | ||||||||
| Other liabilities | 1,902 | 1,604 | ||||||
Maximum Exposure to Loss(2)(3) | $178,765 | $150,227 | ||||||
Total Assets of Non-Consolidated VIEs(3) | $207,985 | $175,713 | ||||||
Notes to the Condensed Consolidated Financial Statements|Note 2 | |||||
| December 31, 2023 | ||||||||||||||||||||
| Carrying Amounts of the Assets and Liabilities On the Condensed Consolidated Balance Sheets | Total Assets | Maximum Exposure to Loss | ||||||||||||||||||
| (In millions) | Investment securities | Accrued Interest Receivable and Other Assets(1) | Liabilities(1) | |||||||||||||||||
| Single-Family: | ||||||||||||||||||||
| Securitization products | $1,272 | $172 | $427 | $30,298 | $24,600 | |||||||||||||||
Resecuritization products(2) | 4,952 | 67 | 626 | 110,320 | 110,320 | |||||||||||||||
CRT products(3) | — | 92 | 220 | 29,126 | 14 | |||||||||||||||
| Total Single-Family | 6,224 | 331 | 1,273 | 169,744 | 134,934 | |||||||||||||||
| Multifamily: | ||||||||||||||||||||
Securitization products(4) | 5,985 | 5,082 | 4,652 | 360,928 | 321,262 | |||||||||||||||
CRT products(3) | — | 11 | 7 | 1,359 | 8 | |||||||||||||||
| Total Multifamily | 5,985 | 5,093 | 4,659 | 362,287 | 321,270 | |||||||||||||||
| Other | — | 7 | 5 | 117 | 468 | |||||||||||||||
| Total | $12,209 | $5,431 | $5,937 | $532,148 | $456,672 | |||||||||||||||
| 51 | ||||||||
Notes to | |||||
| March 31, 2024 | December 31, 2023 | |||||||||||||||||||||||||
| (In millions) | Single-Family | Multifamily | Total | Single-Family | Multifamily | Total | ||||||||||||||||||||
| Held-for-sale UPB | $3,104 | $9,446 | $12,550 | $3,527 | $9,905 | $13,432 | ||||||||||||||||||||
| Cost basis and fair value adjustments, net | (618) | 102 | (516) | (712) | 221 | (491) | ||||||||||||||||||||
| Total held-for-sale loans, net | 2,486 | 9,548 | 12,034 | 2,815 | 10,126 | 12,941 | ||||||||||||||||||||
| Held-for-investment UPB | 3,001,013 | 61,757 | 3,062,770 | 2,996,509 | 59,203 | 3,055,712 | ||||||||||||||||||||
Cost basis and fair value adjustments, net(1) | 32,804 | (317) | 32,487 | 34,627 | (291) | 34,336 | ||||||||||||||||||||
| Allowance for credit losses | (6,189) | (381) | (6,570) | (6,057) | (326) | (6,383) | ||||||||||||||||||||
Total held-for-investment loans, net(2) | 3,027,628 | 61,059 | 3,088,687 | 3,025,079 | 58,586 | 3,083,665 | ||||||||||||||||||||
| Total mortgage loans, net | $3,030,114 | $70,607 | $3,100,721 | $3,027,894 | $68,712 | $3,096,606 | ||||||||||||||||||||
| (In millions) | 1Q 2024 | 1Q 2023 | ||||||||||||||||||
| Single-Family: | ||||||||||||||||||||
| Purchases: | ||||||||||||||||||||
| Held-for-investment loans | $62,269 | $58,965 | ||||||||||||||||||
Sales of held-for-sale loans(1) | 618 | — | ||||||||||||||||||
| Multifamily: | ||||||||||||||||||||
| Purchases: | ||||||||||||||||||||
| Held-for-investment loans | 2,625 | 3,349 | ||||||||||||||||||
| Held-for-sale loans | 6,459 | 2,695 | ||||||||||||||||||
Sales of held-for-sale loans(2) | 6,603 | 6,150 | ||||||||||||||||||
| Freddie Mac 1Q 2024 Form 10-Q | 52 | |||||||
| Financial Statements | Notes to the Condensed Consolidated Financial Statements | Note 3 | ||||
| 1Q 2024 | 1Q 2023 | ||||||||||||||||||||||
| (In millions) | UPB | Allowance for Credit Losses Reversed or (Established) | Valuation Allowance (Established) or Reversed | UPB | Allowance for Credit Losses Reversed or (Established) | Valuation Allowance (Established) or Reversed | |||||||||||||||||
| Single-Family reclassifications from: | |||||||||||||||||||||||
| Held-for-investment to held-for-sale | $376 | $8 | $— | $— | $— | $— | |||||||||||||||||
Held-for-sale to held-for-investment(2) | 50 | 4 | 4 | 48 | 4 | 4 | |||||||||||||||||
| Multifamily reclassifications from: | |||||||||||||||||||||||
| Held-for-investment to held-for-sale | 264 | 1 | (5) | 4,731 | 1 | (27) | |||||||||||||||||
Held-for-sale to held-for-investment(2) | 369 | — | 3 | 561 | — | 16 | |||||||||||||||||
| Non-Accrual Amortized Cost Basis | Interest Income Recognized(2) | |||||||||||||||||||
| (In millions) | March 31, 2024 | December 31, 2023 | 1Q 2024 | |||||||||||||||||
| Single-Family: | ||||||||||||||||||||
| 20- and 30-year or more, amortizing fixed-rate | $12,189 | $12,682 | $31 | |||||||||||||||||
| 15-year or less, amortizing fixed-rate | 485 | 519 | 1 | |||||||||||||||||
| Adjustable-rate and other | 247 | 257 | 1 | |||||||||||||||||
| Total Single-Family | 12,921 | 13,458 | 33 | |||||||||||||||||
| Total Multifamily | 103 | 64 | 1 | |||||||||||||||||
| Total Single-Family and Multifamily | $13,024 | $13,522 | $34 | |||||||||||||||||
| Non-Accrual Amortized Cost Basis | Interest Income Recognized(2) | |||||||||||||||||||
| (In millions) | March 31, 2023 | December 31, 2022 | 1Q 2023 | |||||||||||||||||
| Single-Family: | ||||||||||||||||||||
| 20- and 30-year or more, amortizing fixed-rate | $9,348 | $9,307 | $28 | |||||||||||||||||
| 15-year or less, amortizing fixed-rate | 434 | 427 | 1 | |||||||||||||||||
| Adjustable-rate and other | 332 | 361 | 1 | |||||||||||||||||
| Total Single-Family | 10,114 | 10,095 | 30 | |||||||||||||||||
| Total Multifamily | 41 | 42 | 1 | |||||||||||||||||
| Total Single-Family and Multifamily | $10,155 | $10,137 | $31 | |||||||||||||||||
| Freddie Mac 1Q 2024 Form 10-Q | 53 | |||||||
| Financial Statements | Notes to the Condensed Consolidated Financial Statements | Note 3 | ||||
| Accrued Interest Receivable, Net | Accrued Interest Receivable Related Charge-Offs | |||||||||||||||||||||||||
| (In millions) | March 31, 2024 | December 31, 2023 | 1Q 2024 | 1Q 2023 | ||||||||||||||||||||||
| Single-Family loans | $8,980 | $8,833 | ($46) | ($48) | ||||||||||||||||||||||
| Multifamily loans | 297 | 287 | (1) | — | ||||||||||||||||||||||
| Freddie Mac 1Q 2024 Form 10-Q | 54 | |||||||
| Financial Statements | Notes to the Condensed Consolidated Financial Statements | Note 3 | ||||
| March 31, 2024 | ||||||||||||||||||||||||||
| Year of Origination | Total | |||||||||||||||||||||||||
| (In millions) | 2024 | 2023 | 2022 | 2021 | 2020 | Prior | ||||||||||||||||||||
| Current LTV ratio: | ||||||||||||||||||||||||||
| 20- and 30-year or more, amortizing fixed-rate | ||||||||||||||||||||||||||
| ≤ 60 | $5,993 | $42,364 | $95,196 | $520,140 | $539,594 | $495,830 | $1,699,117 | |||||||||||||||||||
| > 60 to 80 | 16,569 | 108,193 | 181,642 | 301,741 | 87,998 | 18,128 | 714,271 | |||||||||||||||||||
| > 80 to 90 | 6,969 | 63,047 | 86,453 | 25,075 | 1,309 | 467 | 183,320 | |||||||||||||||||||
| > 90 to 100 | 10,954 | 52,215 | 21,489 | 1,673 | 106 | 94 | 86,531 | |||||||||||||||||||
| > 100 | 7 | 79 | 971 | 55 | 12 | 85 | 1,209 | |||||||||||||||||||
| Total 20- and 30-year or more, amortizing fixed-rate | 40,492 | 265,898 | 385,751 | 848,684 | 629,019 | 514,604 | 2,684,448 | |||||||||||||||||||
Current period gross charge-offs(1) | — | 1 | 9 | 10 | 6 | 29 | 55 | |||||||||||||||||||
| 15-year or less, amortizing fixed-rate | ||||||||||||||||||||||||||
| ≤ 60 | 681 | 4,466 | 20,462 | 119,250 | 95,360 | 64,690 | 304,909 | |||||||||||||||||||
| > 60 to 80 | 734 | 3,925 | 7,361 | 3,364 | 209 | 19 | 15,612 | |||||||||||||||||||
| > 80 to 90 | 108 | 627 | 376 | 20 | — | 1 | 1,132 | |||||||||||||||||||
| > 90 to 100 | 68 | 164 | 28 | — | — | — | 260 | |||||||||||||||||||
| > 100 | — | — | — | — | — | 1 | 1 | |||||||||||||||||||
| Total 15-year or less, amortizing fixed-rate | 1,591 | 9,182 | 28,227 | 122,634 | 95,569 | 64,711 | 321,914 | |||||||||||||||||||
Current period gross charge-offs(1) | — | — | — | — | — | 1 | 1 | |||||||||||||||||||
| Adjustable-rate and other | ||||||||||||||||||||||||||
| ≤ 60 | 55 | 422 | 1,670 | 3,314 | 1,432 | 12,960 | 19,853 | |||||||||||||||||||
| > 60 to 80 | 220 | 1,296 | 2,603 | 1,019 | 87 | 240 | 5,465 | |||||||||||||||||||
| > 80 to 90 | 109 | 796 | 997 | 45 | 3 | 17 | 1,967 | |||||||||||||||||||
| > 90 to 100 | 84 | 356 | 246 | 3 | — | 8 | 697 | |||||||||||||||||||
| > 100 | — | — | 15 | — | — | 4 | 19 | |||||||||||||||||||
| Total adjustable-rate and other | 468 | 2,870 | 5,531 | 4,381 | 1,522 | 13,229 | 28,001 | |||||||||||||||||||
Current period gross charge-offs(1) | — | — | — | — | — | — | — | |||||||||||||||||||
| Total for all loan product types by current LTV ratio: | ||||||||||||||||||||||||||
| ≤ 60 | 6,729 | 47,252 | 117,328 | 642,704 | 636,386 | 573,480 | 2,023,879 | |||||||||||||||||||
| > 60 to 80 | 17,523 | 113,414 | 191,606 | 306,124 | 88,294 | 18,387 | 735,348 | |||||||||||||||||||
| > 80 to 90 | 7,186 | 64,470 | 87,826 | 25,140 | 1,312 | 485 | 186,419 | |||||||||||||||||||
| > 90 to 100 | 11,106 | 52,735 | 21,763 | 1,676 | 106 | 102 | 87,488 | |||||||||||||||||||
| > 100 | 7 | 79 | 986 | 55 | 12 | 90 | 1,229 | |||||||||||||||||||
| Total Single-Family loans | $42,551 | $277,950 | $419,509 | $975,699 | $726,110 | $592,544 | $3,034,363 | |||||||||||||||||||
Total current period gross charge-offs(1) | $— | $1 | $9 | $10 | $6 | $30 | $56 | |||||||||||||||||||
| Freddie Mac 1Q 2024 Form 10-Q | 55 | |||||||
| Financial Statements | Notes to the Condensed Consolidated Financial Statements | Note 3 | ||||
| December 31, 2023 | ||||||||||||||||||||||||||
| Year of Origination | Total | |||||||||||||||||||||||||
| (In millions) | 2023 | 2022 | 2021 | 2020 | 2019 | Prior | ||||||||||||||||||||
| Current LTV ratio: | ||||||||||||||||||||||||||
| 20- and 30-year or more, amortizing fixed-rate | ||||||||||||||||||||||||||
| ≤ 60 | $39,500 | $93,279 | $513,267 | $542,449 | $94,348 | $411,663 | $1,694,506 | |||||||||||||||||||
| > 60 to 80 | 105,384 | 183,251 | 318,965 | 95,102 | 12,402 | 7,296 | 722,400 | |||||||||||||||||||
| > 80 to 90 | 55,973 | 90,785 | 27,750 | 1,272 | 213 | 262 | 176,255 | |||||||||||||||||||
| > 90 to 100 | 51,994 | 23,460 | 1,542 | 71 | 16 | 77 | 77,160 | |||||||||||||||||||
| > 100 | 28 | 912 | 24 | 9 | 5 | 88 | 1,066 | |||||||||||||||||||
| Total 20- and 30-year or more, amortizing fixed-rate | 252,879 | 391,687 | 861,548 | 638,903 | 106,984 | 419,386 | 2,671,387 | |||||||||||||||||||
Full-year gross charge-offs(1) | — | 12 | 37 | 43 | 45 | 243 | 380 | |||||||||||||||||||
| 15-year or less, amortizing fixed-rate | ||||||||||||||||||||||||||
| ≤ 60 | 4,221 | 20,246 | 121,709 | 98,338 | 12,488 | 56,493 | 313,495 | |||||||||||||||||||
| > 60 to 80 | 3,973 | 8,314 | 4,491 | 278 | 19 | 5 | 17,080 | |||||||||||||||||||
| > 80 to 90 | 623 | 509 | 25 | — | — | — | 1,157 | |||||||||||||||||||
| > 90 to 100 | 198 | 33 | 1 | — | — | — | 232 | |||||||||||||||||||
| > 100 | 1 | 1 | — | — | — | 1 | 3 | |||||||||||||||||||
| Total 15-year or less, amortizing fixed-rate | 9,016 | 29,103 | 126,226 | 98,616 | 12,507 | 56,499 | 331,967 | |||||||||||||||||||
Full-year gross charge-offs(1) | — | 1 | 2 | 1 | — | 2 | 6 | |||||||||||||||||||
| Adjustable-rate and other | ||||||||||||||||||||||||||
| ≤ 60 | 356 | 1,650 | 3,325 | 1,465 | 586 | 12,950 | 20,332 | |||||||||||||||||||
| > 60 to 80 | 1,153 | 2,651 | 1,105 | 89 | 25 | 227 | 5,250 | |||||||||||||||||||
| > 80 to 90 | 689 | 1,040 | 48 | 3 | — | 18 | 1,798 | |||||||||||||||||||
| > 90 to 100 | 317 | 276 | 2 | — | — | 8 | 603 | |||||||||||||||||||
| > 100 | — | 16 | — | — | — | 4 | 20 | |||||||||||||||||||
| Total adjustable-rate and other | 2,515 | 5,633 | 4,480 | 1,557 | 611 | 13,207 | 28,003 | |||||||||||||||||||
Full-year gross charge-offs(1) | — | — | — | — | — | 1 | 1 | |||||||||||||||||||
| Total for all loan product types by current LTV ratio: | ||||||||||||||||||||||||||
| ≤ 60 | 44,077 | 115,175 | 638,301 | 642,252 | 107,422 | 481,106 | 2,028,333 | |||||||||||||||||||
| > 60 to 80 | 110,510 | 194,216 | 324,561 | 95,469 | 12,446 | 7,528 | 744,730 | |||||||||||||||||||
| > 80 to 90 | 57,285 | 92,334 | 27,823 | 1,275 | 213 | 280 | 179,210 | |||||||||||||||||||
| > 90 to 100 | 52,509 | 23,769 | 1,545 | 71 | 16 | 85 | 77,995 | |||||||||||||||||||
| > 100 | 29 | 929 | 24 | 9 | 5 | 93 | 1,089 | |||||||||||||||||||
| Total Single-Family loans | $264,410 | $426,423 | $992,254 | $739,076 | $120,102 | $489,092 | $3,031,357 | |||||||||||||||||||
Total full-year gross charge-offs(1) | $— | $13 | $39 | $44 | $45 | $246 | $387 | |||||||||||||||||||
| Freddie Mac 1Q 2024 Form 10-Q | 56 | |||||||
| Financial Statements | Notes to the Condensed Consolidated Financial Statements | Note 3 | ||||
| March 31, 2024 | ||||||||||||||||||||||||||||||||
| Year of Origination | Total | |||||||||||||||||||||||||||||||
| (In millions) | 2024 | 2023 | 2022 | 2021 | 2020 | Prior | Revolving Loans | |||||||||||||||||||||||||
| Category: | ||||||||||||||||||||||||||||||||
| Pass | $1,512 | $14,753 | $17,617 | $7,264 | $6,208 | $7,602 | $2,289 | $57,245 | ||||||||||||||||||||||||
| Special mention | — | 20 | 307 | 63 | 35 | 410 | — | 835 | ||||||||||||||||||||||||
| Substandard | — | — | 96 | 299 | 319 | 680 | — | 1,394 | ||||||||||||||||||||||||
| Doubtful | — | — | 35 | — | — | — | — | 35 | ||||||||||||||||||||||||
| Total | $1,512 | $14,773 | $18,055 | $7,626 | $6,562 | $8,692 | $2,289 | $59,509 | ||||||||||||||||||||||||
| December 31, 2023 | ||||||||||||||||||||||||||||||||
| Year of Origination | Total | |||||||||||||||||||||||||||||||
| (In millions) | 2023 | 2022 | 2021 | 2020 | 2019 | Prior | Revolving Loans | |||||||||||||||||||||||||
| Category: | ||||||||||||||||||||||||||||||||
| Pass | $13,804 | $17,845 | $7,430 | $6,345 | $4,420 | $3,254 | $2,266 | $55,364 | ||||||||||||||||||||||||
| Special mention | 20 | 85 | 28 | 43 | 294 | 106 | — | 576 | ||||||||||||||||||||||||
| Substandard | — | 33 | 188 | 259 | 223 | 464 | — | 1,167 | ||||||||||||||||||||||||
| Doubtful | — | — | — | — | — | — | — | — | ||||||||||||||||||||||||
| Total | $13,824 | $17,963 | $7,646 | $6,647 | $4,937 | $3,824 | $2,266 | $57,107 | ||||||||||||||||||||||||
| March 31, 2024 | |||||||||||||||||||||||
| (In millions) | Current | One Month Past Due | Two Months Past Due | Three Months or More Past Due, or in Foreclosure(2) | Total | Non-Accrual With No Allowance(3) | |||||||||||||||||
| Single-Family: | |||||||||||||||||||||||
| 20- and 30-year or more, amortizing fixed-rate | $2,645,711 | $21,872 | $5,066 | $11,799 | $2,684,448 | $396 | |||||||||||||||||
| 15-year or less, amortizing fixed-rate | 319,876 | 1,335 | 231 | 472 | 321,914 | 4 | |||||||||||||||||
| Adjustable-rate and other | 27,350 | 331 | 81 | 239 | 28,001 | 47 | |||||||||||||||||
| Total Single-Family | 2,992,937 | 23,538 | 5,378 | 12,510 | 3,034,363 | 447 | |||||||||||||||||
| Total Multifamily | 59,396 | 6 | 4 | 103 | 59,509 | 16 | |||||||||||||||||
| Total Single-Family and Multifamily | $3,052,333 | $23,544 | $5,382 | $12,613 | $3,093,872 | $463 | |||||||||||||||||
| December 31, 2023 | |||||||||||||||||||||||
| (In millions) | Current | One Month Past Due | Two Months Past Due | Three Months or More Past Due, or in Foreclosure(2) | Total | Non-Accrual with No Allowance(3) | |||||||||||||||||
| Single-Family: | |||||||||||||||||||||||
| 20- and 30-year or more, amortizing fixed-rate | $2,627,763 | $25,528 | $5,787 | $12,309 | $2,671,387 | $406 | |||||||||||||||||
| 15-year or less, amortizing fixed-rate | 329,601 | 1,589 | 270 | 507 | 331,967 | 4 | |||||||||||||||||
| Adjustable-rate and other | 27,317 | 342 | 95 | 249 | 28,003 | 49 | |||||||||||||||||
| Total Single-Family | 2,984,681 | 27,459 | 6,152 | 13,065 | 3,031,357 | 459 | |||||||||||||||||
| Total Multifamily | 57,031 | 12 | — | 64 | 57,107 | 23 | |||||||||||||||||
| Total Single-Family and Multifamily | $3,041,712 | $27,471 | $6,152 | $13,129 | $3,088,464 | $482 | |||||||||||||||||
| Freddie Mac 1Q 2024 Form 10-Q | 57 | |||||||
| Financial Statements | Notes to the Condensed Consolidated Financial Statements | Note 3 | ||||
| 1Q 2024 | |||||||||||||||||||||||
| (Dollars in millions) | Payment Delay(2) | Payment Delay and Term Extension | Payment Delay, Term Extension, and Interest Rate Reduction | Total | Total as % of Class of Financing Receivable(3) | ||||||||||||||||||
| Single-Family: | |||||||||||||||||||||||
| 20- and 30-year or more, amortizing fixed-rate | $5,461 | $1,311 | $6 | $6,778 | 0.3 | % | |||||||||||||||||
| 15-year or less, amortizing fixed-rate | 222 | — | — | 222 | 0.1 | ||||||||||||||||||
| Adjustable-rate and other | 57 | 4 | 1 | 62 | 0.2 | ||||||||||||||||||
| Total Single-Family loan restructurings | $5,740 | $1,315 | $7 | $7,062 | 0.2 | ||||||||||||||||||
| 1Q 2023 | |||||||||||||||||||||||
| (Dollars in millions) | Payment Delay(2) | Payment Delay and Term Extension | Payment Delay, Term Extension, and Interest Rate Reduction | Total | Total as % of Class of Financing Receivable(3) | ||||||||||||||||||
| Single-Family: | |||||||||||||||||||||||
| 20- and 30-year or more, amortizing fixed-rate | $6,357 | $1,037 | $86 | $7,480 | 0.3 | % | |||||||||||||||||
| 15-year or less, amortizing fixed-rate | 332 | 19 | 1 | 352 | 0.1 | ||||||||||||||||||
| Adjustable-rate and other | 76 | 13 | 4 | 93 | 0.3 | ||||||||||||||||||
| Total Single-Family loan restructurings | $6,765 | $1,069 | $91 | $7,925 | 0.3 | ||||||||||||||||||
| Freddie Mac 1Q 2024 Form 10-Q | 58 | |||||||
| Financial Statements | Notes to the Condensed Consolidated Financial Statements | Note 3 | ||||
| 1Q 2024 | ||||||||||||||
| (Dollars in thousands) | Weighted-Average Interest Rate Reduction | Weighted-Average Months of Term Extension | Weighted-Average Payment Deferral or Principal Forbearance(2) | |||||||||||
| Single-Family: | ||||||||||||||
| 20- and 30-year or more, amortizing fixed-rate | 1.2 | % | 171 | $16 | ||||||||||
| 15-year or less, amortizing fixed-rate | — | 22 | 14 | |||||||||||
| Adjustable-rate and other | 0.8 | 217 | 16 | |||||||||||
| 1Q 2023 | ||||||||||||||
| (Dollars in thousands) | Weighted-Average Interest Rate Reduction | Weighted-Average Months of Term Extension | Weighted-Average Payment Deferral or Principal Forbearance(2) | |||||||||||
| Single-Family: | ||||||||||||||
| 20- and 30-year or more, amortizing fixed-rate | 0.9 | % | 180 | $16 | ||||||||||
| 15-year or less, amortizing fixed-rate | 0.4 | 354 | 16 | |||||||||||
| Adjustable-rate and other | 2.0 | 206 | 19 | |||||||||||
| 1Q 2024 | ||||||||||||||||||||
| (In millions) | Payment Delay | Payment Delay and Term Extension | Payment Delay, Term Extension, and Interest Rate Reduction | Total | ||||||||||||||||
| Single-Family: | ||||||||||||||||||||
| 20- and 30-year or more, amortizing fixed-rate | $798 | $397 | $5 | $1,200 | ||||||||||||||||
| 15-year or less, amortizing fixed-rate | 30 | — | — | 30 | ||||||||||||||||
| Adjustable-rate and other | 9 | — | — | 9 | ||||||||||||||||
| Total Single-Family | $837 | $397 | $5 | $1,239 | ||||||||||||||||
| 1Q 2023 | ||||||||||||||||||||
| (In millions) | Payment Delay | Payment Delay and Term Extension | Payment Delay, Term Extension, and Interest Rate Reduction | Total | ||||||||||||||||
| Single-Family: | ||||||||||||||||||||
| 20- and 30-year or more, amortizing fixed-rate | $704 | $175 | $206 | $1,085 | ||||||||||||||||
| 15-year or less, amortizing fixed-rate | 32 | — | — | 32 | ||||||||||||||||
| Adjustable-rate and other | 10 | 2 | 5 | 17 | ||||||||||||||||
| Total Single-Family | $746 | $177 | $211 | $1,134 | ||||||||||||||||
| Freddie Mac 1Q 2024 Form 10-Q | 59 | |||||||
| Financial Statements | Notes to the Condensed Consolidated Financial Statements | Note 3 | ||||
| March 31, 2024 | ||||||||||||||||||||
| (In millions) | Current | One Month Past Due | Two Months Past Due | Three Months or More Past Due | Total | |||||||||||||||
| Single-Family: | ||||||||||||||||||||
| 20- and 30-year or more, amortizing fixed-rate | $11,438 | $2,559 | $1,363 | $5,201 | $20,561 | |||||||||||||||
| 15-year or less, amortizing fixed-rate | 394 | 84 | 49 | 191 | 718 | |||||||||||||||
| Adjustable-rate and other | 102 | 19 | 14 | 53 | 188 | |||||||||||||||
| Total Single-Family | $11,934 | $2,662 | $1,426 | $5,445 | $21,467 | |||||||||||||||
| March 31, 2023 | ||||||||||||||||||||
| (In millions) | Current | One Month Past Due | Two Months Past Due | Three Months or More Past Due | Total | |||||||||||||||
| Single-Family: | ||||||||||||||||||||
| 20- and 30-year or more, amortizing fixed-rate | $16,491 | $2,381 | $1,572 | $6,642 | $27,086 | |||||||||||||||
| 15-year or less, amortizing fixed-rate | 670 | 98 | 71 | 310 | 1,149 | |||||||||||||||
| Adjustable-rate and other | 227 | 33 | 17 | 115 | 392 | |||||||||||||||
| Total Single-Family | $17,388 | $2,512 | $1,660 | $7,067 | $28,627 | |||||||||||||||
| Freddie Mac 1Q 2024 Form 10-Q | 60 | |||||||
| Financial Statements | Notes to the Condensed Consolidated Financial Statements |Note 4 | ||||
| March 31, 2024 | |||||||||||||||||
(Dollars in millions, terms in years) | UPB | Maximum Exposure | Recognized Liability(1) | Maximum Remaining Term | |||||||||||||
| Single-Family mortgage-related guarantees: | |||||||||||||||||
Nonconsolidated securitization products(2) | $30,434 | $24,762 | $395 | 40 | |||||||||||||
| Other mortgage-related guarantees | 8,511 | 8,511 | 152 | 28 | |||||||||||||
| Total Single-Family mortgage-related guarantees | 38,945 | 33,273 | 547 | ||||||||||||||
| Multifamily mortgage-related guarantees: | |||||||||||||||||
Nonconsolidated securitization products(2)(3) | 361,164 | 321,905 | 4,451 | 36 | |||||||||||||
| Other mortgage-related guarantees | 10,720 | 10,720 | 363 | 35 | |||||||||||||
| Total Multifamily mortgage-related guarantees | 371,884 | 332,625 | 4,814 | ||||||||||||||
Guarantees of Fannie Mae securities(4) | 109,215 | 109,215 | — | 38 | |||||||||||||
| Other | 112 | 483 | — | 30 | |||||||||||||
| December 31, 2023 | |||||||||||||||||
(Dollars in millions, terms in years) | UPB | Maximum Exposure | Recognized Liability(1) | Maximum Remaining Term | |||||||||||||
| Single-Family mortgage-related guarantees: | |||||||||||||||||
Nonconsolidated securitization products(2) | $30,289 | $24,600 | $382 | 40 | |||||||||||||
| Other mortgage-related guarantees | 8,692 | 8,692 | 161 | 28 | |||||||||||||
| Total Single-Family mortgage-related guarantees | 38,981 | 33,292 | 543 | ||||||||||||||
| Multifamily mortgage-related guarantees: | |||||||||||||||||
Nonconsolidated securitization products(2)(3) | 360,928 | 321,262 | 4,577 | 36 | |||||||||||||
| Other mortgage-related guarantees | 10,761 | 10,761 | 383 | 35 | |||||||||||||
| Total Multifamily mortgage-related guarantees | 371,689 | 332,023 | 4,960 | ||||||||||||||
Guarantees of Fannie Mae securities(4) | 110,320 | 110,320 | — | 38 | |||||||||||||
| Other | 117 | 468 | — | 30 | |||||||||||||
| Freddie Mac 1Q 2024 Form 10-Q | ||||||||
| Financial Statements | Notes to the Condensed Consolidated Financial Statements |Note 4 | ||||
| March 31, 2024 | ||||||||||||||||||||
| (In millions) | Current | One Month Past Due | Two Months Past Due | Three Months or More Past Due, or in Foreclosure | Total | |||||||||||||||
| Single-Family | $34,447 | $2,208 | $835 | $1,455 | $38,945 | |||||||||||||||
| Multifamily | 370,265 | 298 | 125 | 1,196 | 371,884 | |||||||||||||||
| Total | $404,712 | $2,506 | $960 | $2,651 | $410,829 | |||||||||||||||
| December 31, 2023 | ||||||||||||||||||||
| (In millions) | Current | One Month Past Due | Two Months Past Due | Three Months or More Past Due, or in Foreclosure | Total | |||||||||||||||
| Single-Family | $34,524 | $2,172 | $827 | $1,458 | $38,981 | |||||||||||||||
| Multifamily | 369,785 | 850 | 98 | 956 | 371,689 | |||||||||||||||
| Total | $404,309 | $3,022 | $925 | $2,414 | $410,670 | |||||||||||||||
| (In millions) | March 31, 2024 | December 31, 2023 | |||||||||
Mortgage loan purchase commitments(1) | $12,523 | $10,378 | |||||||||
Unsettled securities purchased under agreements to resell, net(2) | 29,896 | 22,276 | |||||||||
Other commitments(3) | 4,640 | 4,701 | |||||||||
| Total | $47,059 | $37,355 | |||||||||
| Freddie Mac 1Q 2024 Form 10-Q | 62 | |||||||
| Financial Statements | Notes to the Condensed Consolidated Financial Statements | Note | ||||
| September 30, 2017 | December 31, 2016 | ||||||||||||||||||
| (Dollars in millions, terms in years) | Maximum Exposure(1) | Recognized Liability(2) | Maximum Remaining Term | Maximum Exposure(1) | Recognized Liability(2) | Maximum Remaining Term | |||||||||||||
| K Certificates, SB Certificates, senior subordinate securitization structures, and other securitization products | $178,738 | $1,834 | 40 | $150,227 | $1,532 | 40 | |||||||||||||
| Other mortgage-related guarantees | 16,577 | 669 | 33 | 16,445 | 679 | 34 | |||||||||||||
| Derivative instruments | 11,603 | 136 | 28 | 6,396 | 127 | 29 | |||||||||||||
| 1Q 2024 | 1Q 2023 | |||||||||||||||||||||||||||||||||||||||||||
| (In millions) | Single-Family | Multifamily | Total | Single-Family | Multifamily | Total | ||||||||||||||||||||||||||||||||||||||
| Beginning balance | $6,402 | $447 | $6,849 | $7,746 | $147 | $7,893 | ||||||||||||||||||||||||||||||||||||||
| Provision (benefit) for credit losses | 120 | 61 | 181 | 318 | 77 | 395 | ||||||||||||||||||||||||||||||||||||||
| Charge-offs | (123) | — | (123) | (90) | — | (90) | ||||||||||||||||||||||||||||||||||||||
| Recoveries collected | 26 | — | 26 | 32 | — | 32 | ||||||||||||||||||||||||||||||||||||||
Other(1) | 83 | — | 83 | 91 | — | 91 | ||||||||||||||||||||||||||||||||||||||
| Ending balance | $6,508 | $508 | $7,016 | $8,097 | $224 | $8,321 | ||||||||||||||||||||||||||||||||||||||
| Components of the ending balance of the allowance for credit losses: | ||||||||||||||||||||||||||||||||||||||||||||
| Mortgage loans held-for-investment | $6,189 | $381 | $6,570 | $7,675 | $160 | $7,835 | ||||||||||||||||||||||||||||||||||||||
Other(2) | 319 | 127 | 446 | 422 | 64 | 486 | ||||||||||||||||||||||||||||||||||||||
| Total ending balance | $6,508 | $508 | $7,016 | $8,097 | $224 | $8,321 | ||||||||||||||||||||||||||||||||||||||
Maximum Exposure (1) at | Maximum Coverage (2) at | |||||||||||||||
| (In millions) | September 30, 2017 | December 31, 2016 | September 30, 2017 | December 31, 2016 | ||||||||||||
| K Certificates and SB Certificates | $164,308 | $139,416 | $27,307 | $23,864 | ||||||||||||
| Other securitization products | 6,732 | 5,545 | 1,521 | 1,359 | ||||||||||||
| Total | $171,040 | $144,961 | $28,828 | $25,223 | ||||||||||||
| Freddie Mac 1Q 2024 Form 10-Q | ||||||||
| Financial Statements | Notes to the Condensed Consolidated Financial Statements | Note | ||||
| September 30, 2017 | December 31, 2016 | |||||||||||||||||||||||
| (In millions) | Held by Freddie Mac | Held by consolidated trusts | Total | Held by Freddie Mac | Held by consolidated trusts | Total | ||||||||||||||||||
| Held-for-sale: | ||||||||||||||||||||||||
| Single-family | $15,753 | $— | $15,753 | $2,092 | $— | $2,092 | ||||||||||||||||||
| Multifamily | 19,118 | — | 19,118 | 16,544 | — | 16,544 | ||||||||||||||||||
| Total UPB | 34,871 | — | 34,871 | 18,636 | — | 18,636 | ||||||||||||||||||
| Cost basis and fair value adjustments, net | (2,829 | ) | — | (2,829 | ) | (548 | ) | — | (548 | ) | ||||||||||||||
| Total held-for-sale loans, net | 32,042 | — | 32,042 | 18,088 | — | 18,088 | ||||||||||||||||||
| Held-for-investment: | ||||||||||||||||||||||||
| Single-family | 62,746 | 1,708,458 | 1,771,204 | 83,040 | 1,659,591 | 1,742,631 | ||||||||||||||||||
| Multifamily | 20,019 | 2,776 | 22,795 | 25,873 | 3,048 | 28,921 | ||||||||||||||||||
| Total UPB | 82,765 | 1,711,234 | 1,793,999 | 108,913 | 1,662,639 | 1,771,552 | ||||||||||||||||||
| Cost basis adjustments | (2,321 | ) | 31,257 | 28,936 | (3,755 | ) | 30,549 | 26,794 | ||||||||||||||||
| Allowance for loan losses | (6,452 | ) | (3,633 | ) | (10,085 | ) | (10,461 | ) | (2,970 | ) | (13,431 | ) | ||||||||||||
| Total held-for-investment loans, net | 73,992 | 1,738,858 | 1,812,850 | 94,697 | 1,690,218 | 1,784,915 | ||||||||||||||||||
| Total loans, net | $106,034 | $1,738,858 | $1,844,892 | $112,785 | $1,690,218 | $1,803,003 | ||||||||||||||||||
| September 30, 2017 | December 31, 2016 | ||||||||||||||||||||||||||||||
| Current LTV Ratio | Current LTV Ratio | ||||||||||||||||||||||||||||||
| (In millions) | ≤ 80 | > 80 to 100 | > 100(1) | Total | ≤ 80 | > 80 to 100 | > 100(1) | Total | |||||||||||||||||||||||
20 and 30-year or more, amortizing fixed-rate(2) | $1,205,240 | $216,924 | $16,863 | $1,439,027 | $1,120,722 | $236,111 | $30,063 | $1,386,896 | |||||||||||||||||||||||
15-year amortizing fixed-rate(2) | 270,755 | 7,690 | 485 | 278,930 | 274,967 | 11,016 | 887 | 286,870 | |||||||||||||||||||||||
| Adjustable-rate | 49,703 | 3,222 | 35 | 52,960 | 52,319 | 2,955 | 85 | 55,359 | |||||||||||||||||||||||
| Alt-A, interest-only, and option ARM | 22,118 | 5,199 | 1,921 | 29,238 | 26,293 | 9,392 | 4,634 | 40,319 | |||||||||||||||||||||||
| Total single-family loans | $1,547,816 | $233,035 | $19,304 | $1,800,155 | $1,474,301 | $259,474 | $35,669 | $1,769,444 | |||||||||||||||||||||||
| (In millions) | September 30, 2017 | December 31, 2016 | ||||||
Credit risk profile by internally assigned grade:(1) | ||||||||
| Pass | $22,515 | $27,830 | ||||||
| Special mention | 145 | 502 | ||||||
| Substandard | 120 | 570 | ||||||
| Doubtful | — | — | ||||||
| Total | $22,780 | $28,902 | ||||||
| September 30, 2017 | |||||||||||||||||||||||
| (In millions) | Current | One Month Past Due | Two Months Past Due | Three Months or More Past Due, or in Foreclosure(1) | Total | Non-accrual | |||||||||||||||||
| Single-family: | |||||||||||||||||||||||
| 20 and 30-year or more, amortizing fixed-rate | $1,406,602 | $18,569 | $4,457 | $9,399 | $1,439,027 | $9,394 | |||||||||||||||||
| 15-year amortizing fixed-rate | 277,161 | 1,315 | 175 | 279 | 278,930 | 279 | |||||||||||||||||
| Adjustable-rate | 52,363 | 358 | 69 | 170 | 52,960 | 170 | |||||||||||||||||
| Alt-A, interest-only, and option ARM | 25,680 | 1,404 | 497 | 1,657 | 29,238 | 1,655 | |||||||||||||||||
| Total single-family | 1,761,806 | 21,646 | 5,198 | 11,505 | 1,800,155 | 11,498 | |||||||||||||||||
| Total multifamily | 22,755 | 25 | — | — | 22,780 | 48 | |||||||||||||||||
| Total single-family and multifamily | $1,784,561 | $21,671 | $5,198 | $11,505 | $1,822,935 | $11,546 | |||||||||||||||||
| December 31, 2016 | |||||||||||||||||||||||
| (In millions) | Current | One Month Past Due | Two Months Past Due | Three Months or More Past Due, or in Foreclosure(1) | Total | Non-accrual | |||||||||||||||||
| Single-family: | |||||||||||||||||||||||
| 20 and 30-year or more, amortizing fixed-rate | $1,354,511 | $16,645 | $4,865 | $10,875 | $1,386,896 | $10,868 | |||||||||||||||||
| 15-year amortizing fixed-rate | 285,373 | 1,010 | 178 | 309 | 286,870 | 309 | |||||||||||||||||
| Adjustable-rate | 54,738 | 354 | 77 | 190 | 55,359 | 190 | |||||||||||||||||
| Alt-A, interest-only, and option ARM | 35,994 | 1,748 | 650 | 1,927 | 40,319 | 1,927 | |||||||||||||||||
| Total single-family | 1,730,616 | 19,757 | 5,770 | 13,301 | 1,769,444 | 13,294 | |||||||||||||||||
| Total multifamily | 28,902 | — | — | — | 28,902 | 89 | |||||||||||||||||
| Total single-family and multifamily | $1,759,518 | $19,757 | $5,770 | $13,301 | $1,798,346 | $13,383 | |||||||||||||||||
| (Dollars in millions) | September 30, 2017 | December 31, 2016 | ||||||
Single-family:(1) | ||||||||
| Non-credit-enhanced portfolio | ||||||||
| Serious delinquency rate | 0.92 | % | 1.02 | % | ||||
| Total number of seriously delinquent loans | 66,641 | 77,662 | ||||||
Credit-enhanced portfolio:(2) | ||||||||
| Primary mortgage insurance: | ||||||||
| Serious delinquency rate | 1.15 | % | 1.46 | % | ||||
| Total number of seriously delinquent loans | 18,048 | 21,460 | ||||||
Other credit protection:(3) | ||||||||
| Serious delinquency rate | 0.34 | % | 0.43 | % | ||||
| Total number of seriously delinquent loans | 9,222 | 9,455 | ||||||
| Total single-family: | ||||||||
| Serious delinquency rate | 0.86 | % | 1.00 | % | ||||
| Total number of seriously delinquent loans | 92,091 | 107,170 | ||||||
Multifamily:(4) | ||||||||
| Non-credit-enhanced portfolio: | ||||||||
| Delinquency rate | 0.05 | % | 0.04 | % | ||||
| UPB of delinquent loans | $23 | $19 | ||||||
| Credit-enhanced portfolio: | ||||||||
| Delinquency rate | 0.02 | % | 0.02 | % | ||||
| UPB of delinquent loans | $29 | $37 | ||||||
| Total Multifamily: | ||||||||
| Delinquency rate | 0.02 | % | 0.03 | % | ||||
| UPB of delinquent loans | $52 | $56 | ||||||
| 3Q 2017 | 3Q 2016 | ||||||||||||||||||||||||||||||
| Allowance for Loan Losses | Reserve for Guarantee Losses | Allowance for Loan Losses | Reserve for Guarantee Losses | ||||||||||||||||||||||||||||
| (In millions) | Held by Freddie Mac | Held By Consolidated Trusts | Total | Held by Freddie Mac | Held By Consolidated Trusts | Total | |||||||||||||||||||||||||
| Single-family: | |||||||||||||||||||||||||||||||
| Beginning balance | $7,541 | $2,755 | $55 | $10,351 | $10,886 | $2,589 | $56 | $13,531 | |||||||||||||||||||||||
| Provision (benefit) for credit losses | (330 | ) | 1,023 | 1 | 694 | (249 | ) | 368 | 2 | 121 | |||||||||||||||||||||
Charge-offs(1) | (1,126 | ) | (12 | ) | (2 | ) | (1,140 | ) | (422 | ) | (37 | ) | (2 | ) | (461 | ) | |||||||||||||||
| Recoveries | 143 | 2 | — | 145 | 113 | 2 | — | 115 | |||||||||||||||||||||||
Transfers, net(2) | 192 | (136 | ) | — | 56 | 98 | (16 | ) | — | 82 | |||||||||||||||||||||
| Ending balance | 6,420 | 3,632 | 54 | 10,106 | 10,426 | 2,906 | 56 | 13,388 | |||||||||||||||||||||||
| Multifamily ending balance | 32 | 1 | 8 | 41 | 22 | 2 | 14 | 38 | |||||||||||||||||||||||
| Total ending balance | $6,452 | $3,633 | $62 | $10,147 | $10,448 | $2,908 | $70 | $13,426 | |||||||||||||||||||||||
| YTD 2017 | YTD 2016 | ||||||||||||||||||||||||||||||
| Allowance for Loan Losses | Reserve for Guarantee Losses | Allowance for Loan Losses | Reserve for Guarantee Losses | ||||||||||||||||||||||||||||
| (in millions) | Held by Freddie Mac | Held By Consolidated Trusts | Total | Held by Freddie Mac | Held By Consolidated Trusts | Total | |||||||||||||||||||||||||
| Single-family: | |||||||||||||||||||||||||||||||
| Beginning balance | $10,442 | $2,969 | $54 | $13,465 | $12,516 | $2,775 | $57 | $15,348 | |||||||||||||||||||||||
| Provision (benefit) for credit losses | (1,058 | ) | 1,223 | 3 | 168 | (1,424 | ) | 308 | 6 | (1,110 | ) | ||||||||||||||||||||
Charge-offs(1) | (3,942 | ) | (88 | ) | (3 | ) | (4,033 | ) | (1,388 | ) | (121 | ) | (7 | ) | (1,516 | ) | |||||||||||||||
| Recoveries | 322 | 5 | — | 327 | 387 | 8 | — | 395 | |||||||||||||||||||||||
Transfers, net(2) | 656 | (477 | ) | — | 179 | 335 | (64 | ) | — | 271 | |||||||||||||||||||||
| Ending balance | 6,420 | 3,632 | 54 | 10,106 | 10,426 | 2,906 | 56 | 13,388 | |||||||||||||||||||||||
| Multifamily ending balance | 32 | 1 | 8 | 41 | 22 | 2 | 14 | 38 | |||||||||||||||||||||||
| Total ending balance | $6,452 | $3,633 | $62 | $10,147 | $10,448 | $2,908 | $70 | $13,426 | |||||||||||||||||||||||
| 3Q 2017 | 3Q 2016 | YTD 2017 | YTD 2016 | |||||||||||||||||||||||||
| (Dollars in millions) | Number of Loans | Post-TDR Recorded Investment | Number of Loans | Post-TDR Recorded Investment | Number of Loans | Post-TDR Recorded Investment | Number of Loans | Post-TDR Recorded Investment | ||||||||||||||||||||
Single-family:(1) | ||||||||||||||||||||||||||||
| 20 and 30-year or more, amortizing fixed-rate | 7,502 | $1,069 | 8,052 | $1,166 | 24,485 | $3,503 | 26,948 | $3,855 | ||||||||||||||||||||
| 15-year amortizing fixed-rate | 993 | 75 | 1,052 | 74 | 3,275 | 251 | 3,498 | 254 | ||||||||||||||||||||
| Adjustable-rate | 202 | 30 | 228 | 33 | 667 | 97 | 724 | 104 | ||||||||||||||||||||
| Alt-A, interest-only, and option ARM | 645 | 119 | 669 | 113 | 1,926 | 344 | 2,339 | 411 | ||||||||||||||||||||
| Total single-family | 9,342 | 1,293 | 10,001 | 1,386 | 30,353 | 4,195 | 33,509 | 4,624 | ||||||||||||||||||||
Multifamily(2) | 1 | — | — | — | 1 | — | 2 | 8 | ||||||||||||||||||||
| Total | 9,343 | $1,293 | 10,001 | $1,386 | 30,354 | $4,195 | 33,511 | $4,632 | ||||||||||||||||||||
| 3Q 2017 | 3Q 2016 | YTD 2017 | YTD 2016 | ||||||||||||||||||||||||
| (Dollars in millions) | Number of Loans | Post-TDR Recorded Investment | Number of Loans | Post-TDR Recorded Investment | Number of Loans | Post-TDR Recorded Investment | Number of Loans | Post-TDR Recorded Investment | |||||||||||||||||||
| Single-family: | |||||||||||||||||||||||||||
| 20 and 30-year or more, amortizing fixed-rate | 3,526 | $555 | 4,043 | $626 | 10,183 | $1,642 | 11,947 | $1,859 | |||||||||||||||||||
| 15-year amortizing fixed-rate | 191 | 14 | 206 | 17 | 505 | 40 | 631 | 52 | |||||||||||||||||||
| Adjustable-rate | 47 | 8 | 74 | 9 | 156 | 24 | 211 | 30 | |||||||||||||||||||
| Alt-A, interest-only, and option ARM | 336 | 62 | 358 | 71 | 924 | 188 | 1,202 | 240 | |||||||||||||||||||
| Total single-family | 4,100 | $639 | 4,681 | $723 | 11,768 | $1,894 | 13,991 | $2,181 | |||||||||||||||||||
| Multifamily | — | $— | — | $— | — | $— | — | $— | |||||||||||||||||||
| September 30, 2017 | December 31, 2016 | ||||||||||||||||||||||
| (In millions) | UPB | Recorded Investment | Associated Allowance | UPB | Recorded Investment | Associated Allowance | |||||||||||||||||
| Single-family — | |||||||||||||||||||||||
With no specific allowance recorded:(1) | |||||||||||||||||||||||
| 20 and 30-year or more, amortizing fixed-rate | $4,095 | $3,152 | N/A | $4,963 | $3,746 | N/A | |||||||||||||||||
| 15-year amortizing fixed-rate | 28 | 24 | N/A | 31 | 26 | N/A | |||||||||||||||||
| Adjustable-rate | 278 | 276 | N/A | 292 | 289 | N/A | |||||||||||||||||
| Alt-A, interest-only, and option ARM | 1,626 | 1,354 | N/A | 1,935 | 1,561 | N/A | |||||||||||||||||
| Total with no specific allowance recorded | 6,027 | 4,806 | N/A | 7,221 | 5,622 | N/A | |||||||||||||||||
With specific allowance recorded:(2) | |||||||||||||||||||||||
| 20 and 30-year or more, amortizing fixed-rate | 52,901 | 51,669 | ($6,430 | ) | 67,853 | 66,143 | ($9,678 | ) | |||||||||||||||
| 15-year amortizing fixed-rate | 761 | 764 | (23 | ) | 847 | 851 | (25 | ) | |||||||||||||||
| Adjustable-rate | 246 | 241 | (15 | ) | 319 | 312 | (19 | ) | |||||||||||||||
| Alt-A, interest-only, and option ARM | 8,208 | 7,755 | (1,238 | ) | 12,699 | 12,105 | (2,258 | ) | |||||||||||||||
| Total with specific allowance recorded | 62,116 | 60,429 | (7,706 | ) | 81,718 | 79,411 | (11,980 | ) | |||||||||||||||
| Combined single-family: | |||||||||||||||||||||||
| 20 and 30-year or more, amortizing fixed-rate | 56,996 | 54,821 | (6,430 | ) | 72,816 | 69,889 | (9,678 | ) | |||||||||||||||
| 15-year amortizing fixed-rate | 789 | 788 | (23 | ) | 878 | 877 | (25 | ) | |||||||||||||||
| Adjustable-rate | 524 | 517 | (15 | ) | 611 | 601 | (19 | ) | |||||||||||||||
| Alt-A, interest-only, and option ARM | 9,834 | 9,109 | (1,238 | ) | 14,634 | 13,666 | (2,258 | ) | |||||||||||||||
| Total single-family | $68,143 | $65,235 | ($7,706 | ) | $88,939 | $85,033 | ($11,980 | ) | |||||||||||||||
| Multifamily — | |||||||||||||||||||||||
With no specific allowance recorded(1) | $113 | $105 | N/A | $321 | $308 | N/A | |||||||||||||||||
| With specific allowance recorded | 15 | 15 | ($4 | ) | 44 | 42 | ($9 | ) | |||||||||||||||
| Total multifamily | $128 | $120 | ($4 | ) | $365 | $350 | ($9 | ) | |||||||||||||||
| Total single-family and multifamily | $68,271 | $65,355 | ($7,710 | ) | $89,304 | $85,383 | ($11,989 | ) | |||||||||||||||
| 3Q 2017 | 3Q 2016 | |||||||||||||||||||||||
| (In millions) | Average Recorded Investment | Interest Income Recognized | Interest Income Recognized On Cash Basis(3) | Average Recorded Investment | Interest Income Recognized | Interest Income Recognized On Cash Basis(3) | ||||||||||||||||||
| Single-family — | ||||||||||||||||||||||||
With no specific allowance recorded:(1) | ||||||||||||||||||||||||
| 20 and 30-year or more, amortizing fixed-rate | $3,367 | $97 | $3 | $4,184 | $118 | $4 | ||||||||||||||||||
| 15-year amortizing fixed-rate | 24 | — | — | 33 | 1 | — | ||||||||||||||||||
| Adjustable rate | 287 | 2 | — | 268 | 2 | — | ||||||||||||||||||
| Alt-A, interest-only, and option ARM | 1,390 | 29 | 1 | 1,500 | 30 | — | ||||||||||||||||||
| Total with no specific allowance recorded | 5,068 | 128 | 4 | 5,985 | 151 | 4 | ||||||||||||||||||
With specific allowance recorded:(2) | ||||||||||||||||||||||||
| 20 and 30-year or more, amortizing fixed-rate | 53,250 | 618 | 58 | 67,333 | 677 | 61 | ||||||||||||||||||
| 15-year amortizing fixed-rate | 758 | 8 | 2 | 857 | 10 | 1 | ||||||||||||||||||
| Adjustable rate | 236 | 2 | 1 | 359 | 3 | — | ||||||||||||||||||
| Alt-A, interest-only, and option ARM | 8,014 | 89 | 7 | 12,642 | 108 | 10 | ||||||||||||||||||
| Total with specific allowance recorded | 62,258 | 717 | 68 | 81,191 | 798 | 72 | ||||||||||||||||||
| Combined single-family: | ||||||||||||||||||||||||
| 20 and 30-year or more, amortizing fixed-rate | 56,617 | 715 | 61 | 71,517 | 795 | 65 | ||||||||||||||||||
| 15-year amortizing fixed-rate | 782 | 8 | 2 | 890 | 11 | 1 | ||||||||||||||||||
| Adjustable rate | 523 | 4 | 1 | 627 | 5 | — | ||||||||||||||||||
| Alt-A, interest-only, and option ARM | 9,404 | 118 | 8 | 14,142 | 138 | 10 | ||||||||||||||||||
| Total single-family | $67,326 | $845 | $72 | $87,176 | $949 | $76 | ||||||||||||||||||
| Multifamily — | ||||||||||||||||||||||||
With no specific allowance recorded(1) | $115 | $2 | $1 | $311 | $4 | $1 | ||||||||||||||||||
| With specific allowance recorded | 15 | — | — | 46 | — | — | ||||||||||||||||||
| Total multifamily | $130 | $2 | $1 | $357 | $4 | $1 | ||||||||||||||||||
| Total single-family and multifamily | $67,456 | $847 | $73 | $87,533 | $953 | $77 | ||||||||||||||||||
| YTD 2017 | YTD 2016 | |||||||||||||||||||||||
| (In millions) | Average Recorded Investment | Interest Income Recognized | Interest Income Recognized On Cash Basis(3) | Average Recorded Investment | Interest Income Recognized | Interest Income Recognized On Cash Basis(3) | ||||||||||||||||||
| Single-family — | ||||||||||||||||||||||||
With no specific allowance recorded:(1) | ||||||||||||||||||||||||
| 20 and 30-year or more, amortizing fixed-rate | $3,733 | $307 | $12 | $4,105 | $337 | $10 | ||||||||||||||||||
| 15-year amortizing fixed-rate | 26 | 1 | — | 35 | 4 | — | ||||||||||||||||||
| Adjustable rate | 301 | 8 | — | 247 | 6 | — | ||||||||||||||||||
| Alt-A, interest-only, and option ARM | 1,518 | 85 | 3 | 1,362 | 82 | 2 | ||||||||||||||||||
| Total with no specific allowance recorded | 5,578 | 401 | 15 | 5,749 | 429 | 12 | ||||||||||||||||||
With specific allowance recorded:(2) | ||||||||||||||||||||||||
| 20 and 30-year or more, amortizing fixed-rate | 62,277 | 1,931 | 188 | 69,060 | 2,015 | 196 | ||||||||||||||||||
| 15-year amortizing fixed-rate | 18,292 | 25 | 5 | 901 | 30 | 5 | ||||||||||||||||||
| Adjustable rate | 430 | 7 | 2 | 409 | 11 | 2 | ||||||||||||||||||
| Alt-A, interest-only, and option ARM | 7,033 | 296 | 26 | 13,156 | 331 | 27 | ||||||||||||||||||
| Total with specific allowance recorded | 88,032 | 2,259 | 221 | 83,526 | 2,387 | 230 | ||||||||||||||||||
| Combined single-family: | ||||||||||||||||||||||||
| 20 and 30-year or more, amortizing fixed-rate | 66,010 | 2,238 | 200 | 73,165 | 2,352 | 206 | ||||||||||||||||||
| 15-year amortizing fixed-rate | 18,318 | 26 | 5 | 936 | 34 | 5 | ||||||||||||||||||
| Adjustable rate | 731 | 15 | 2 | 656 | 17 | 2 | ||||||||||||||||||
| Alt-A, interest-only, and option ARM | 8,551 | 381 | 29 | 14,518 | 413 | 29 | ||||||||||||||||||
| Total single-family | $93,610 | $2,660 | $236 | $89,275 | $2,816 | $242 | ||||||||||||||||||
| Multifamily — | ||||||||||||||||||||||||
With no specific allowance recorded(1) | $287 | $7 | $2 | $354 | $11 | $3 | ||||||||||||||||||
| With specific allowance recorded | 25 | 1 | 1 | 67 | 2 | 1 | ||||||||||||||||||
| Total multifamily | $312 | $8 | $3 | $421 | $13 | $4 | ||||||||||||||||||
| Total single-family and multifamily | $93,922 | $2,668 | $239 | $89,696 | $2,829 | $246 | ||||||||||||||||||
| September 30, 2017 | December 31, 2016 | |||||||||||||||||||||||
| (In millions) | Single-family | Multifamily | Total | Single-family | Multifamily | Total | ||||||||||||||||||
| Recorded investment: | ||||||||||||||||||||||||
| Collectively evaluated | $1,734,920 | $22,660 | $1,757,580 | $1,684,411 | $28,552 | $1,712,963 | ||||||||||||||||||
| Individually evaluated | 65,235 | 120 | 65,355 | 85,033 | 350 | 85,383 | ||||||||||||||||||
| Total recorded investment | 1,800,155 | 22,780 | 1,822,935 | 1,769,444 | 28,902 | 1,798,346 | ||||||||||||||||||
| Ending balance of the allowance for loan losses: | ||||||||||||||||||||||||
| Collectively evaluated | (2,346 | ) | (29 | ) | (2,375 | ) | (1,431 | ) | (11 | ) | (1,442 | ) | ||||||||||||
| Individually evaluated | (7,706 | ) | (4 | ) | (7,710 | ) | (11,980 | ) | (9 | ) | (11,989 | ) | ||||||||||||
| Total ending balance of the allowance | (10,052 | ) | (33 | ) | (10,085 | ) | (13,411 | ) | (20 | ) | (13,431 | ) | ||||||||||||
| Net investment in loans | $1,790,103 | $22,747 | $1,812,850 | $1,756,033 | $28,882 | $1,784,915 | ||||||||||||||||||
| September 30, 2017 | December 31, 2016 | |||||||||||||||||||||||
| (In millions) | Total Current and Protected UPB(1) | Maximum Coverage(1)(2) | Collateralized Coverage Remaining (3) | Total Current and Protected UPB(1) | Maximum Coverage(1)(2) | Collateralized Coverage Remaining (3) | ||||||||||||||||||
| Credit enhancements at the time we acquire the loan: | ||||||||||||||||||||||||
| Primary mortgage insurance | $321,809 | $82,261 | $— | $291,217 | $74,345 | $— | ||||||||||||||||||
Seller indemnification(4) | 1,920 | 24 | 24 | 1,030 | 10 | 10 | ||||||||||||||||||
Deep mortgage insurance CRT(4)(5) | 6,617 | 176 | 48 | 3,067 | 81 | — | ||||||||||||||||||
Lender recourse and indemnification agreements(6) | 5,299 | 4,766 | — | 5,247 | 4,911 | — | ||||||||||||||||||
Pool insurance(6) | 884 | 493 | — | 1,719 | 618 | — | ||||||||||||||||||
| Other: | ||||||||||||||||||||||||
| HFA indemnification | 1,456 | 1,456 | — | 1,747 | 1,747 | — | ||||||||||||||||||
| Subordination | 1,642 | 175 | — | 1,874 | 230 | — | ||||||||||||||||||
Other credit enhancements(6) | 15 | 5 | — | 17 | 6 | — | ||||||||||||||||||
| Credit enhancements subsequent to our purchase or guarantee of the loan: | ||||||||||||||||||||||||
STACR debt note(4)(7) | 532,197 | 16,401 | 16,401 | 427,978 | 14,507 | 14,507 | ||||||||||||||||||
ACIS transactions(4)(8) | 556,621 | 6,175 | 1,065 | 453,670 | 5,355 | 877 | ||||||||||||||||||
Whole loan securities and senior subordinate securitization structures(4) | 7,292 | 1,140 | 1,140 | 2,494 | 375 | 375 | ||||||||||||||||||
| Less: UPB with more than one type of credit enhancement | (701,800 | ) | — | — | (559,400 | ) | — | — | ||||||||||||||||
| Single-family loan portfolio with credit enhancement | 733,952 | 113,072 | 18,678 | 630,660 | 102,185 | 15,769 | ||||||||||||||||||
| Single-family loan portfolio without credit enhancement | 1,066,112 | — | — | 1,124,066 | — | — | ||||||||||||||||||
| Total | $1,800,064 | $113,072 | $18,678 | $1,754,726 | $102,185 | $15,769 | ||||||||||||||||||
| (In millions) | March 31, 2024 | December 31, 2023 | |||||||||
| Trading securities | $36,671 | $38,385 | |||||||||
| Available-for-sale securities | 4,729 | 4,890 | |||||||||
| Total fair value of investment securities | $41,400 | $43,275 | |||||||||
| (In millions) | September 30, 2017 | December 31, 2016 | |||||
| Trading securities | $35,726 | $44,790 | |||||
| Available-for-sale securities | 51,422 | 66,757 | |||||
| Total | $87,148 | $111,547 | |||||
| (In millions) | March 31, 2024 | December 31, 2023 | |||||||||
| Mortgage-related securities | $8,118 | $8,113 | |||||||||
| Non-mortgage-related securities | 28,553 | 30,272 | |||||||||
| Total fair value of trading securities | $36,671 | $38,385 | |||||||||
| (In millions) | September 30, 2017 | December 31, 2016 | ||||||
| Mortgage-related securities: | ||||||||
| Freddie Mac | $12,911 | $15,343 | ||||||
| Other agency | 5,010 | 8,161 | ||||||
| All other | 298 | 149 | ||||||
| Total mortgage-related securities | 18,219 | 23,653 | ||||||
| Non-mortgage-related securities | 17,507 | 21,137 | ||||||
| Total fair value of trading securities | $35,726 | $44,790 | ||||||
| March 31, 2024 | ||||||||||||||||||||
| Amortized Cost Basis | Gross Unrealized Gains in Other Comprehensive Income | Gross Unrealized Losses in Other Comprehensive Income | Fair Value | Accrued Interest Receivable | ||||||||||||||||
| (In millions) | ||||||||||||||||||||
| Agency mortgage-related securities | $4,355 | $7 | ($126) | $4,236 | $10 | |||||||||||||||
| Other mortgage-related securities | 317 | 187 | (11) | 493 | 3 | |||||||||||||||
| Total available-for-sale securities | $4,672 | $194 | ($137) | $4,729 | $13 | |||||||||||||||
| September 30, 2017 | ||||||||||||||||||||
| Gross Unrealized Losses | ||||||||||||||||||||
| (In millions) | Amortized Cost | Gross Unrealized Gains | Other-Than-Temporary Impairment(1) | Temporary Impairment(2) | Fair Value | |||||||||||||||
| Available-for-sale securities: | ||||||||||||||||||||
| Freddie Mac | $38,807 | $689 | $— | ($349 | ) | $39,147 | ||||||||||||||
| Other agency | 3,011 | 92 | — | (14 | ) | 3,089 | ||||||||||||||
| Non-agency RMBS | 4,013 | 1,130 | (6 | ) | (2 | ) | 5,135 | |||||||||||||
| Non-agency CMBS | 3,410 | 246 | (6 | ) | (1 | ) | 3,649 | |||||||||||||
| Obligations of states and political subdivisions | 396 | 6 | — | — | 402 | |||||||||||||||
| Total available-for-sale securities | $49,637 | $2,163 | ($12 | ) | ($366 | ) | $51,422 | |||||||||||||
| December 31, 2016 | ||||||||||||||||||||
| Gross Unrealized Losses | ||||||||||||||||||||
| (In millions) | Amortized Cost | Gross Unrealized Gains | Other-Than-Temporary Impairment(1) | Temporary Impairment(2) | Fair Value | |||||||||||||||
| Available-for-sale securities: | ||||||||||||||||||||
| Freddie Mac | $43,671 | $563 | $— | ($582 | ) | $43,652 | ||||||||||||||
| Other agency | 4,127 | 119 | — | (25 | ) | 4,221 | ||||||||||||||
| Non-agency RMBS | 10,606 | 1,271 | (62 | ) | (18 | ) | 11,797 | |||||||||||||
| Non-agency CMBS | 6,288 | 160 | (3 | ) | (23 | ) | 6,422 | |||||||||||||
| Obligations of states and political subdivisions | 657 | 8 | — | — | 665 | |||||||||||||||
| Total available-for-sale securities | $65,349 | $2,121 | ($65 | ) | ($648 | ) | $66,757 | |||||||||||||
| December 31, 2023 | ||||||||||||||||||||
| Amortized Cost Basis | Gross Unrealized Gains in Other Comprehensive Income | Gross Unrealized Losses in Other Comprehensive Income | Fair Value | Accrued Interest Receivable | ||||||||||||||||
| (In millions) | ||||||||||||||||||||
| Agency mortgage-related securities | $4,467 | $13 | ($110) | $4,370 | $10 | |||||||||||||||
| Other mortgage-related securities | 340 | 188 | (8) | 520 | 3 | |||||||||||||||
| Total available-for-sale securities | $4,807 | $201 | ($118) | $4,890 | $13 | |||||||||||||||
| Freddie Mac 1Q 2024 Form 10-Q | ||||||||
| Financial Statements | Notes to the Condensed Consolidated Financial Statements | Note | ||||
| March 31, 2024 | ||||||||||||||||||||
| Less than 12 Months | 12 Months or Greater | |||||||||||||||||||
| (In millions) | Fair Value | Gross Unrealized Losses | Fair Value | Gross Unrealized Losses | ||||||||||||||||
| Agency mortgage-related securities | $575 | ($6) | $2,842 | ($120) | ||||||||||||||||
| Other mortgage-related securities | 14 | (3) | 40 | (8) | ||||||||||||||||
| Total available-for-sale securities in a gross unrealized loss position | $589 | ($9) | $2,882 | ($128) | ||||||||||||||||
| September 30, 2017 | ||||||||||||||||
| Less than 12 Months | 12 Months or Greater | |||||||||||||||
| (In millions) | Fair Value | Gross Unrealized Losses | Fair Value | Gross Unrealized Losses | ||||||||||||
| Available-for-sale securities: | ||||||||||||||||
| Freddie Mac | $9,741 | ($160 | ) | $5,612 | ($189 | ) | ||||||||||
| Other agency | 4 | — | 1,551 | (14 | ) | |||||||||||
| Non-agency RMBS | 6 | — | 122 | (8 | ) | |||||||||||
| Non-agency CMBS | 241 | (1 | ) | 59 | (6 | ) | ||||||||||
| Obligations of states and political subdivisions | 37 | — | — | — | ||||||||||||
| Total available-for-sale securities in a gross unrealized loss position | $10,029 | ($161 | ) | $7,344 | ($217 | ) | ||||||||||
| December 31, 2016 | ||||||||||||||||
| Less than 12 Months | 12 Months or Greater | |||||||||||||||
| (In millions) | Fair Value | Gross Unrealized Losses | Fair Value | Gross Unrealized Losses | ||||||||||||
| Available-for-sale securities: | ||||||||||||||||
| Freddie Mac | $19,786 | ($559 | ) | $1,732 | ($23 | ) | ||||||||||
| Other agency | 542 | (6 | ) | 2,040 | (19 | ) | ||||||||||
| Non-agency RMBS | 309 | (1 | ) | 2,188 | (79 | ) | ||||||||||
| Non-agency CMBS | 383 | (2 | ) | 204 | (24 | ) | ||||||||||
| Obligations of states and political subdivisions | 83 | — | — | — | ||||||||||||
| Total available-for-sale securities in a gross unrealized loss position | $21,103 | ($568 | ) | $6,164 | ($145 | ) | ||||||||||
| December 31, 2023 | ||||||||||||||||||||
| Less than 12 Months | 12 Months or Greater | |||||||||||||||||||
| (In millions) | Fair Value | Gross Unrealized Losses | Fair Value | Gross Unrealized Losses | ||||||||||||||||
| Agency mortgage-related securities | $374 | ($1) | $3,006 | ($108) | ||||||||||||||||
| Other mortgage-related securities | 23 | (4) | 23 | (5) | ||||||||||||||||
| Total available-for-sale securities in a gross unrealized loss position | $397 | ($5) | $3,029 | ($113) | ||||||||||||||||
| (In millions) | 1Q 2024 | 1Q 2023 | |||||||||
| Total Proceeds | $399 | $459 | |||||||||
| Gross realized gains | $1 | $2 | |||||||||
| Gross realized losses | (6) | (2) | |||||||||
| Net realized gains (losses) | ($5) | $— | |||||||||
| (In millions) | 3Q 2017 | 3Q 2016 | YTD 2017 | YTD 2016 | |||||||||||
| Gross realized gains | $806 | $510 | $1,153 | $1,003 | |||||||||||
| Gross realized losses | (10 | ) | (13 | ) | (44 | ) | (48 | ) | |||||||
| Net realized gains (losses) | $796 | $497 | $1,109 | $955 | |||||||||||
| Freddie Mac 1Q 2024 Form 10-Q | ||||||||
| Financial Statements | Notes to the Condensed Consolidated Financial Statements|Note | ||||
| (In millions) | March 31, 2024 | December 31, 2023 | |||||||||
| Debt of consolidated trusts | $3,050,038 | $3,041,927 | |||||||||
| Debt of Freddie Mac: | |||||||||||
| Short-term debt | 8,887 | 5,976 | |||||||||
| Long-term debt | 152,817 | 160,443 | |||||||||
| Total debt of Freddie Mac | 161,704 | 166,419 | |||||||||
| Total debt | $3,211,742 | $3,208,346 | |||||||||
| Balance, Net | Interest Expense | ||||||||||||||||||||||
| (In millions) | September 30, 2017 | December 31, 2016 | 3Q 2017 | 3Q 2016 | YTD 2017 | YTD 2016 | |||||||||||||||||
| Debt securities of consolidated trusts held by third parties | $1,691,524 | $1,648,683 | $11,852 | $10,887 | $35,567 | $33,927 | |||||||||||||||||
| Other debt: | |||||||||||||||||||||||
| Short-term debt | 69,430 | 71,451 | 173 | 83 | 414 | 258 | |||||||||||||||||
| Long-term debt | 248,624 | 281,870 | 1,319 | 1,384 | 3,984 | 4,338 | |||||||||||||||||
| Total other debt | 318,054 | 353,321 | 1,492 | 1,467 | 4,398 | 4,596 | |||||||||||||||||
| Total debt, net | $2,009,578 | $2,002,004 | $13,344 | $12,354 | $39,965 | $38,523 | |||||||||||||||||
| March 31, 2024 | December 31, 2023 | |||||||||||||||||||||||||||||||
| (Dollars in millions) | Contractual Maturity | UPB | Carrying Amount(1) | Weighted Average Coupon(2) | Contractual Maturity | UPB | Carrying Amount(1) | Weighted Average Coupon(2) | ||||||||||||||||||||||||
| Single-Family: | ||||||||||||||||||||||||||||||||
| 20-and 30-year or more, fixed-rate | 2024 - 2061 | $2,616,819 | $2,653,655 | 3.12 | % | 2024 - 2061 | $2,603,100 | $2,640,550 | 3.06 | % | ||||||||||||||||||||||
| 15-year or less, fixed-rate | 2024 - 2039 | 317,001 | 321,732 | 2.22 | 2024 - 2039 | 326,242 | 331,291 | 2.20 | ||||||||||||||||||||||||
| Adjustable-rate and other | 2024 - 2054 | 23,490 | 23,973 | 4.10 | 2024 - 2054 | 23,251 | 23,749 | 3.93 | ||||||||||||||||||||||||
| Total Single-Family | 2,957,310 | 2,999,360 | 2,952,593 | 2,995,590 | ||||||||||||||||||||||||||||
| Multifamily | 2024 - 2053 | 51,767 | 50,678 | 3.46 | 2024 - 2053 | 47,300 | 46,337 | 3.35 | ||||||||||||||||||||||||
| Total debt of consolidated trusts | $3,009,077 | $3,050,038 | $2,999,893 | $3,041,927 | ||||||||||||||||||||||||||||
| September 30, 2017 | December 31, 2016 | ||||||||||||||||||||||||
| (Dollars in millions) | Contractual Maturity | UPB | Carrying Amount | Weighted Average Coupon(1) | Contractual Maturity | UPB | Carrying Amount | Weighted Average Coupon(1) | |||||||||||||||||
| Single-family: | |||||||||||||||||||||||||
30-year or more, fixed-rate(2) | 2017 - 2055 | $1,246,377 | $1,284,710 | 3.69 | % | 2017 - 2055 | $1,193,329 | $1,229,849 | 3.71 | % | |||||||||||||||
| 20-year fixed-rate | 2017 - 2037 | 74,560 | 76,772 | 3.44 | 2017 - 2037 | 74,033 | 76,331 | 3.49 | |||||||||||||||||
| 15-year fixed-rate | 2017 - 2032 | 262,508 | 268,335 | 2.87 | 2017 - 2032 | 267,739 | 273,978 | 2.90 | |||||||||||||||||
| Adjustable-rate | 2017 - 2047 | 48,867 | 49,965 | 2.81 | 2017 - 2047 | 52,991 | 54,205 | 2.69 | |||||||||||||||||
| Interest-only | 2026 - 2041 | 7,819 | 7,892 | 3.71 | 2026 - 2041 | 10,007 | 10,057 | 3.47 | |||||||||||||||||
| FHA/VA | 2017 - 2046 | 886 | 906 | 4.87 | 2017 - 2046 | 1,015 | 1,038 | 4.92 | |||||||||||||||||
| Total single-family | 1,641,017 | 1,688,580 | 1,599,114 | 1,645,458 | |||||||||||||||||||||
Multifamily(2) | 2019 - 2045 | 2,895 | 2,944 | 3.20 | 2019 - 2033 | 3,048 | 3,225 | 4.63 | |||||||||||||||||
| Total debt securities of consolidated trusts held by third parties | $1,643,912 | $1,691,524 | $1,602,162 | $1,648,683 | |||||||||||||||||||||
| September 30, 2017 | December 31, 2016 | |||||||||||||||||||||
| (Dollars in millions) | Par Value | Carrying Amount(1) | Weighted Average Effective Rate(2) | Par Value | Carrying Amount(1) | Weighted Average Effective Rate(2) | ||||||||||||||||
| Other short-term debt: | ||||||||||||||||||||||
Discount notes and Reference Bills® | $48,465 | $48,340 | 1.05 | % | $61,042 | $60,976 | 0.47 | % | ||||||||||||||
| Medium-term notes | 12,916 | 12,917 | 0.86 | 7,435 | 7,435 | 0.41 | ||||||||||||||||
| Securities sold under agreements to repurchase | 8,173 | 8,173 | 0.75 | 3,040 | 3,040 | 0.42 | ||||||||||||||||
| Total other short-term debt | $69,554 | $69,430 | 0.98 | $71,517 | $71,451 | 0.47 | ||||||||||||||||
| Other long-term debt: | ||||||||||||||||||||||
| Original maturities on or before December 31, | ||||||||||||||||||||||
| 2017 | $20,346 | $20,347 | 1.67 | % | $92,831 | $92,855 | 1.43 | % | ||||||||||||||
| 2018 | 70,909 | 70,959 | 1.17 | 71,392 | 71,500 | 1.18 | ||||||||||||||||
| 2019 | 55,818 | 55,762 | 1.56 | 46,436 | 46,378 | 1.59 | ||||||||||||||||
| 2020 | 32,156 | 32,119 | 1.63 | 13,274 | 13,254 | 1.54 | ||||||||||||||||
| 2021 | 21,314 | 21,336 | 1.78 | 20,372 | 20,341 | 1.81 | ||||||||||||||||
| Thereafter | 50,567 | 48,101 | 4.21 | 40,921 | 37,542 | 4.36 | ||||||||||||||||
Total other long-term debt(3) | 251,110 | 248,624 | 2.00 | 285,226 | 281,870 | 1.81 | ||||||||||||||||
| Total other debt | $320,664 | $318,054 | $356,743 | $353,321 | ||||||||||||||||||
| March 31, 2024 | December 31, 2023 | |||||||||||||||||||||||||
| (Dollars in millions) | Par Value | Carrying Amount | Weighted Average Effective Rate | Par Value | Carrying Amount | Weighted Average Effective Rate | ||||||||||||||||||||
Discount notes and Reference Bills® | $8,931 | $8,887 | 5.37 | % | $6,032 | $5,976 | 5.39 | % | ||||||||||||||||||
| Freddie Mac 1Q 2024 Form 10-Q | ||||||||
| March 31, 2024 | December 31, 2023 | |||||||||||||||||||||||||||||||
| (Dollars in millions) | Contractual Maturity | Par Value | Carrying Amount(1) | Weighted Average Effective Rate(2) | Contractual Maturity | Par Value | Carrying Amount(1) | Weighted Average Effective Rate(2) | ||||||||||||||||||||||||
| Long-term debt: | ||||||||||||||||||||||||||||||||
| Fixed-rate: | ||||||||||||||||||||||||||||||||
| Medium-term notes — callable | 2024 - 2050 | $132,076 | $131,981 | 3.04 | % | 2024 - 2050 | $139,344 | $139,257 | 3.13 | % | ||||||||||||||||||||||
| Medium-term notes — non-callable | 2024 - 2028 | 1,573 | 1,574 | 0.98 | 2024 - 2028 | 1,573 | 1,574 | 0.98 | ||||||||||||||||||||||||
| Reference Notes securities — non-callable | 2025 - 2032 | 18,162 | 18,209 | 3.19 | 2025 - 2032 | 18,162 | 18,209 | 3.19 | ||||||||||||||||||||||||
| SCR debt notes | 2031 - 2032 | 80 | 82 | 13.00 | 2031 - 2032 | 82 | 83 | 13.00 | ||||||||||||||||||||||||
| Variable-rate: | ||||||||||||||||||||||||||||||||
| Medium-term notes — callable | 2024 - 2029 | 1,729 | 1,727 | 4.60 | 2024 - 2028 | 1,869 | 1,867 | 4.81 | ||||||||||||||||||||||||
| Medium-term notes — non-callable | 2026 | 47 | 47 | 8.10 | 2026 | 47 | 47 | 8.10 | ||||||||||||||||||||||||
| STACR | 2024 - 2042 | 1,969 | 1,885 | 11.60 | 2024 - 2042 | 2,095 | 2,006 | 11.45 | ||||||||||||||||||||||||
| Zero-coupon: | ||||||||||||||||||||||||||||||||
| Medium-term notes — non-callable | 2024 - 2039 | 4,835 | 3,148 | 6.19 | 2024 - 2039 | 4,836 | 3,100 | 6.17 | ||||||||||||||||||||||||
| Other | 2047 - 2053 | — | 122 | 0.83 | 2047 - 2053 | — | 121 | 0.84 | ||||||||||||||||||||||||
| Hedging-related basis adjustments | N/A | (5,958) | N/A | (5,821) | ||||||||||||||||||||||||||||
| Total long-term debt | $160,471 | $152,817 | 3.23 | % | $168,008 | $160,443 | 3.30 | % | ||||||||||||||||||||||||
| March 31, 2024 | ||||||||
| (In millions) | Amounts | |||||||
| Annual Maturities | ||||||||
| Long-term debt (excluding STACR and SCR debt notes): | ||||||||
| 2024 | $27,525 | |||||||
| 2025 | 57,582 | |||||||
| 2026 | 17,711 | |||||||
| 2027 | 13,738 | |||||||
| 2028 | 10,248 | |||||||
| Thereafter | 31,618 | |||||||
Debt of consolidated trusts, STACR, and SCR debt notes(1) | 3,011,126 | |||||||
| Total | 3,169,548 | |||||||
Net discounts, premiums, debt issuance costs, hedge-related, and other basis adjustments(2) | 33,307 | |||||||
| Total debt of consolidated trusts, STACR, SCR, and long-term debt | $3,202,855 | |||||||
| Freddie Mac 1Q 2024 Form 10-Q | 67 | |||||||
| Financial Statements | Notes to the Condensed Consolidated Financial Statements |Note | ||||
| September 30, 2017 | December 31, 2016 | ||||||||||||||||||||||
Notional or Contractual Amount | Derivatives at Fair Value | Notional or Contractual Amount | Derivatives at Fair Value | ||||||||||||||||||||
| (In millions) | Assets | Liabilities | Assets | Liabilities | |||||||||||||||||||
| Not designated as hedges | |||||||||||||||||||||||
| Interest-rate swaps: | |||||||||||||||||||||||
| Receive-fixed | $326,297 | $2,342 | ($1,487 | ) | $313,106 | $4,337 | ($2,703 | ) | |||||||||||||||
| Pay-fixed | 215,069 | 1,370 | (5,595 | ) | 271,477 | 2,586 | (9,684 | ) | |||||||||||||||
| Basis (floating to floating) | 100 | — | — | 1,450 | 1 | — | |||||||||||||||||
| Total interest-rate swaps | 541,466 | 3,712 | (7,082 | ) | 586,033 | 6,924 | (12,387 | ) | |||||||||||||||
| Option-based: | |||||||||||||||||||||||
| Call swaptions | |||||||||||||||||||||||
| Purchased | 60,335 | 3,147 | — | 60,730 | 2,817 | — | |||||||||||||||||
| Written | 7,400 | — | (99 | ) | 1,350 | — | (78 | ) | |||||||||||||||
| Put swaptions | |||||||||||||||||||||||
Purchased(1) | 51,635 | 1,260 | — | 48,080 | 1,442 | — | |||||||||||||||||
| Written | 2,750 | — | (18 | ) | 3,200 | — | (28 | ) | |||||||||||||||
Other option-based derivatives(2) | 10,767 | 808 | — | 11,032 | 795 | — | |||||||||||||||||
| Total option-based | 132,887 | 5,215 | (117 | ) | 124,392 | 5,054 | (106 | ) | |||||||||||||||
| Futures | 277,940 | — | — | 138,294 | — | — | |||||||||||||||||
| Commitments | 85,992 | 133 | (77 | ) | 45,353 | 289 | (151 | ) | |||||||||||||||
| Credit derivatives | 3,100 | 1 | (47 | ) | 2,951 | 1 | (27 | ) | |||||||||||||||
| Other | 2,879 | 1 | (19 | ) | 2,879 | — | (21 | ) | |||||||||||||||
| Total derivatives not designated as hedges | 1,044,264 | 9,062 | (7,342 | ) | 899,902 | 12,268 | (12,692 | ) | |||||||||||||||
| Designated as fair value hedges | |||||||||||||||||||||||
| Interest-rate swaps: | |||||||||||||||||||||||
| Pay-fixed | 45,481 | 159 | (924 | ) | — | — | — | ||||||||||||||||
| Total derivatives designated as fair value hedges | 45,481 | 159 | (924 | ) | — | — | — | ||||||||||||||||
| Derivative interest receivable (payable) | 1,393 | (1,654 | ) | 1,442 | (1,770 | ) | |||||||||||||||||
Netting adjustments(3) | (9,909 | ) | 9,708 | (12,963 | ) | 13,667 | |||||||||||||||||
| Total derivative portfolio, net | $1,089,745 | $705 | ($212 | ) | $899,902 | $747 | ($795 | ) | |||||||||||||||
| March 31, 2024 | December 31, 2023 | |||||||||||||||||||||||||
| Notional or Contractual Amount | Derivative Assets | Derivative Liabilities | Notional or Contractual Amount | Derivative Assets | Derivative Liabilities | |||||||||||||||||||||
| (In millions) | ||||||||||||||||||||||||||
| Not designated as hedges | ||||||||||||||||||||||||||
| Interest-rate risk management derivatives: | ||||||||||||||||||||||||||
| Swaps | $308,358 | $1,896 | ($394) | $351,193 | $1,638 | ($462) | ||||||||||||||||||||
| Written options | 45,423 | — | (1,690) | 48,227 | — | (1,746) | ||||||||||||||||||||
Purchased options(1) | 82,160 | 4,107 | — | 89,790 | 4,251 | — | ||||||||||||||||||||
| Futures | 90,146 | — | — | 132,982 | — | — | ||||||||||||||||||||
| Total interest-rate risk management derivatives | 526,087 | 6,003 | (2,084) | 622,192 | 5,889 | (2,208) | ||||||||||||||||||||
| Mortgage commitment derivatives | 45,803 | 15 | (8) | 26,911 | 43 | (10) | ||||||||||||||||||||
CRT-related derivatives(2) | 30,535 | — | (300) | 30,578 | — | (228) | ||||||||||||||||||||
| Other | 15,777 | 33 | (656) | 14,572 | 3 | (567) | ||||||||||||||||||||
| Total derivatives not designated as hedges | 618,202 | 6,051 | (3,048) | 694,253 | 5,935 | (3,013) | ||||||||||||||||||||
| Designated as fair value hedges | ||||||||||||||||||||||||||
| Interest-rate risk management derivatives: | ||||||||||||||||||||||||||
| Swaps | 169,942 | 187 | (5,797) | 172,202 | 276 | (5,658) | ||||||||||||||||||||
| Total derivatives designated as fair value hedges | 169,942 | 187 | (5,797) | 172,202 | 276 | (5,658) | ||||||||||||||||||||
| Receivables (payables) | 6 | (17) | 17 | (36) | ||||||||||||||||||||||
Netting adjustments(3) | (5,952) | 7,810 | (5,742) | 7,834 | ||||||||||||||||||||||
| Total derivative portfolio, net | $788,144 | $292 | ($1,052) | $866,455 | $486 | ($873) | ||||||||||||||||||||
| Freddie Mac 1Q 2024 Form 10-Q | ||||||||
| Financial Statements | Notes to the Condensed Consolidated Financial Statements |Note | ||||
| March 31, 2024 | December 31, 2023 | |||||||||||||||||||
| Derivative Assets | Derivative Liabilities | Derivative Assets | Derivative Liabilities | |||||||||||||||||
| (In millions) | ||||||||||||||||||||
| OTC derivatives | $6,191 | ($7,877) | $6,165 | ($7,866) | ||||||||||||||||
| Cleared and exchange-traded derivatives | 2 | (21) | 13 | (36) | ||||||||||||||||
| Mortgage commitment derivatives | 18 | (8) | 47 | (10) | ||||||||||||||||
| Other | 33 | (956) | 3 | (795) | ||||||||||||||||
| Total derivatives | 6,244 | (8,862) | 6,228 | (8,707) | ||||||||||||||||
| Counterparty netting | (4,141) | 4,141 | (4,210) | 4,210 | ||||||||||||||||
Cash collateral netting(1) | (1,811) | 3,669 | (1,532) | 3,624 | ||||||||||||||||
| Net amount presented in the consolidated balance sheets | 292 | (1,052) | 486 | (873) | ||||||||||||||||
Gross amount not offset in the consolidated balance sheets(2) | (159) | 42 | (366) | 47 | ||||||||||||||||
| Net amount | $133 | ($1,010) | $120 | ($826) | ||||||||||||||||
| (In millions) | 1Q 2024 | 1Q 2023 | |||||||||
| Not designated as hedges | |||||||||||
| Interest-rate risk management derivatives: | |||||||||||
| Swaps | $262 | $29 | |||||||||
| Written options | 37 | 195 | |||||||||
| Purchased options | 56 | (504) | |||||||||
| Futures | 374 | (307) | |||||||||
| Total interest-rate risk management derivatives fair value gains (losses) | 729 | (587) | |||||||||
| Mortgage commitment derivatives | 40 | (80) | |||||||||
CRT-related derivatives(1) | (43) | (76) | |||||||||
| Other | (108) | 61 | |||||||||
| Total derivatives not designated as hedges fair value gains (losses) | $618 | ($682) | |||||||||
| (In millions) | 3Q 2017 | 3Q 2016 | YTD 2017 | YTD 2016 | |||||||||||
| Not designated as hedges | |||||||||||||||
| Interest-rate swaps: | |||||||||||||||
| Receive-fixed | ($329 | ) | ($1,176 | ) | $195 | $3,707 | |||||||||
| Pay-fixed | 352 | 1,717 | (78 | ) | (11,221 | ) | |||||||||
| Basis (floating to floating) | — | — | (1 | ) | 1 | ||||||||||
| Total interest-rate swaps | 23 | 541 | 116 | (7,513 | ) | ||||||||||
| Option based: | |||||||||||||||
| Call swaptions | |||||||||||||||
| Purchased | (67 | ) | (116 | ) | (106 | ) | 3,283 | ||||||||
| Written | 5 | 1 | 6 | (88 | ) | ||||||||||
| Put swaptions | |||||||||||||||
| Purchased | (145 | ) | (98 | ) | (481 | ) | (612 | ) | |||||||
| Written | 7 | 2 | 49 | 49 | |||||||||||
Other option-based derivatives(1) | 2 | (24 | ) | 13 | 209 | ||||||||||
| Total option-based | (198 | ) | (235 | ) | (519 | ) | 2,841 | ||||||||
| Other: | |||||||||||||||
| Futures | 18 | 103 | (212 | ) | (365 | ) | |||||||||
| Commitments | (121 | ) | 8 | (128 | ) | (222 | ) | ||||||||
| Credit derivatives | (2 | ) | (35 | ) | (33 | ) | (66 | ) | |||||||
| Other | — | (2 | ) | (6 | ) | (4 | ) | ||||||||
| Total other | (105 | ) | 74 | (379 | ) | (657 | ) | ||||||||
| Accrual of periodic cash settlements: | |||||||||||||||
| Receive-fixed interest-rate swaps | 343 | 586 | 1,198 | 1,825 | |||||||||||
| Pay-fixed interest-rate swaps | (741 | ) | (1,003 | ) | (2,492 | ) | (3,152 | ) | |||||||
| Other | — | 1 | — | 1 | |||||||||||
| Total accrual of periodic cash settlements | (398 | ) | (416 | ) | (1,294 | ) | (1,326 | ) | |||||||
| Total | ($678 | ) | ($36 | ) | ($2,076 | ) | ($6,655 | ) | |||||||
| Freddie Mac 1Q 2024 Form 10-Q | ||||||||
| Financial Statements | Notes to the Condensed Consolidated Financial Statements |Note | ||||
| 1Q 2024 | 1Q 2023 | ||||||||||||||||
| (In millions) | Interest Income | Interest Expense | Interest Income | Interest Expense | |||||||||||||
| Total amounts of income and expense line items presented in our condensed consolidated statements of income in which the effects of fair value hedges are recorded: | $28,385 | ($23,626) | $24,987 | ($20,486) | |||||||||||||
| Interest contracts on mortgage loans held-for-investment: | |||||||||||||||||
| Gain (loss) on fair value hedging relationships: | |||||||||||||||||
| Hedged items | (995) | — | 1,123 | — | |||||||||||||
| Derivatives designated as hedging instruments | 953 | — | (1,073) | — | |||||||||||||
| Interest accruals on hedging instruments | 234 | — | 211 | — | |||||||||||||
| Discontinued hedge related basis adjustments amortization | 43 | — | 31 | — | |||||||||||||
| Interest contracts on debt: | |||||||||||||||||
| Gain (loss) on fair value hedging relationships: | |||||||||||||||||
| Hedged items | — | 134 | — | (1,535) | |||||||||||||
| Derivatives designated as hedging instruments | — | (127) | — | 1,534 | |||||||||||||
| Interest accruals on hedging instruments | — | (929) | — | (1,051) | |||||||||||||
| Discontinued hedge related basis adjustment amortization | — | (2) | — | (38) | |||||||||||||
| 3Q 2017 | |||||||||
| Gains (Losses) Recorded in Net Income | |||||||||
| (In millions) | Derivative(1) | Hedged Item(1) | Hedge Ineffectiveness(2) | ||||||
| Interest rate risk on mortgage loans held-for-investment | $85 | ($15 | ) | $70 | |||||
| March 31, 2024 | |||||||||||||||||||||||||||||
| Carrying Amount Assets / (Liabilities) | Cumulative Amount of Fair Value Hedging Basis Adjustment Included in the Carrying Amount | Closed Portfolio Under the Portfolio Layer Method | |||||||||||||||||||||||||||
| (In millions) | Total | Under the Portfolio Layer Method | Discontinued - Hedge Related | Total Amount by Amortized Cost Basis | Designated Amount by UPB | ||||||||||||||||||||||||
| Mortgage loans held-for-investment | $1,107,342 | ($3,205) | ($546) | ($2,659) | $59,281 | $11,845 | |||||||||||||||||||||||
| Mortgage loans held-for-sale | 131 | 1 | — | 1 | — | — | |||||||||||||||||||||||
| Debt | (132,323) | 5,958 | — | 26 | — | — | |||||||||||||||||||||||
| December 31, 2023 | |||||||||||||||||||||||||||||
| Carrying Amount Assets / (Liabilities) | Cumulative Amount of Fair Value Hedging Basis Adjustment Included in the Carrying Amount | Closed Portfolio Under the Portfolio Layer Method | |||||||||||||||||||||||||||
| (In millions) | Total | Under the Portfolio Layer Method | Discontinued - Hedge Related | Total Amount by Amortized Cost Basis | Designated Amount by UPB | ||||||||||||||||||||||||
| Mortgage loans held-for-investment | $1,115,454 | ($2,253) | ($220) | ($2,033) | $59,786 | $11,670 | |||||||||||||||||||||||
| Mortgage loans held-for-sale | 128 | 1 | — | 1 | — | — | |||||||||||||||||||||||
| Debt | (143,407) | 5,821 | — | 29 | — | — | |||||||||||||||||||||||
| YTD 2017 | |||||||||
| Gains (Losses) Recorded in Net Income | |||||||||
| (In millions) | Derivative(1) | Hedged Item(1) | Hedge Ineffectiveness(2) | ||||||
| Interest rate risk on mortgage loans held-for-investment | ($215 | ) | $351 | $136 | |||||
| Freddie Mac 1Q 2024 Form 10-Q | ||||||||
| Financial Statements | Notes to the Condensed Consolidated Financial Statements |Note | ||||
| March 31, 2024 | ||||||||||||||||||||
| (In millions) | Gross Amount Recognized | Amount Offset in the Condensed Consolidated Balance Sheets | Net Amount Presented in the Condensed Consolidated Balance Sheets | Gross Amount Not Offset in the Condensed Consolidated Balance Sheets(1) | Net Amount | |||||||||||||||
| Assets: | ||||||||||||||||||||
| Securities purchased under agreements to resell | $116,057 | ($13,800) | $102,257 | ($102,257) | $— | |||||||||||||||
| Liabilities: | ||||||||||||||||||||
| Securities sold under agreements to repurchase | (13,800) | 13,800 | — | — | — | |||||||||||||||
| December 31, 2023 | ||||||||||||||||||||
| (In millions) | Gross Amount Recognized | Amount Offset in the Condensed Consolidated Balance Sheets | Net Amount Presented in the Condensed Consolidated Balance Sheets | Gross Amount Not Offset in the Condensed Consolidated Balance Sheets(1) | Net Amount | |||||||||||||||
| Assets: | ||||||||||||||||||||
| Securities purchased under agreements to resell | $105,393 | ($10,245) | $95,148 | ($95,148) | $— | |||||||||||||||
| Liabilities: | ||||||||||||||||||||
| Securities sold under agreements to repurchase | (10,245) | 10,245 | — | — | — | |||||||||||||||
| September 30, 2017 | |||||||||||||||||||||||
Gross Amount Recognized | Amount Offset in the Consolidated Balance Sheets | Net Amount Presented in the Consolidated Balance Sheets | Gross Amount Not Offset in the Consolidated Balance Sheets(2) | Net Amount | |||||||||||||||||||
| (In millions) | Counterparty Netting | Cash Collateral Netting(1) | |||||||||||||||||||||
| Assets: | |||||||||||||||||||||||
| Derivatives: | |||||||||||||||||||||||
| OTC derivatives | $8,467 | ($5,988 | ) | ($2,187 | ) | $292 | ($260 | ) | $32 | ||||||||||||||
| Cleared and exchange-traded derivatives | 2,012 | (1,924 | ) | 190 | 278 | — | 278 | ||||||||||||||||
| Other | 135 | — | — | 135 | — | 135 | |||||||||||||||||
| Total derivatives | 10,614 | (7,912 | ) | (1,997 | ) | 705 | (260 | ) | 445 | ||||||||||||||
Securities purchased under agreements to resell(3) | 47,202 | — | — | 47,202 | (47,202 | ) | — | ||||||||||||||||
| Total | $57,816 | ($7,912 | ) | ($1,997 | ) | $47,907 | ($47,462 | ) | $445 | ||||||||||||||
| Liabilities: | |||||||||||||||||||||||
| Derivatives: | |||||||||||||||||||||||
| OTC derivatives | ($6,783 | ) | $5,989 | $728 | ($66 | ) | $— | ($66 | ) | ||||||||||||||
| Cleared and exchange-traded derivatives | (2,994 | ) | 1,924 | 1,067 | (3 | ) | — | (3 | ) | ||||||||||||||
| Other | (143 | ) | — | — | (143 | ) | — | (143 | ) | ||||||||||||||
| Total derivatives | (9,920 | ) | 7,913 | 1,795 | (212 | ) | — | (212 | ) | ||||||||||||||
| Securities sold under agreements to repurchase | (8,173 | ) | — | — | (8,173 | ) | 8,173 | — | |||||||||||||||
| Total | ($18,093 | ) | $7,913 | $1,795 | ($8,385 | ) | $8,173 | ($212 | ) | ||||||||||||||
| December 31, 2016 | |||||||||||||||||||||||
Gross Amount Recognized | Amount Offset in the Consolidated Balance Sheets | Net Amount Presented in the Consolidated Balance Sheets | Gross Amount Not Offset in the Consolidated Balance Sheets(2) | Net Amount | |||||||||||||||||||
| (In millions) | Counterparty Netting | Cash Collateral Netting(1) | |||||||||||||||||||||
| Assets: | |||||||||||||||||||||||
| Derivatives: | |||||||||||||||||||||||
| OTC derivatives | $8,531 | ($6,367 | ) | ($1,760 | ) | $404 | ($353 | ) | $51 | ||||||||||||||
| Cleared and exchange-traded derivatives | 4,889 | (4,674 | ) | (162 | ) | 53 | — | 53 | |||||||||||||||
| Other | 290 | — | — | 290 | — | 290 | |||||||||||||||||
| Total derivatives | 13,710 | (11,041 | ) | (1,922 | ) | 747 | (353 | ) | 394 | ||||||||||||||
Securities purchased under agreements to resell(3) | 51,548 | — | — | 51,548 | (51,548 | ) | — | ||||||||||||||||
| Total | $65,258 | ($11,041 | ) | ($1,922 | ) | $52,295 | ($51,901 | ) | $394 | ||||||||||||||
| Liabilities: | |||||||||||||||||||||||
| Derivatives: | |||||||||||||||||||||||
| OTC derivatives | ($7,298 | ) | $6,367 | $469 | ($462 | ) | $274 | ($188 | ) | ||||||||||||||
| Cleared and exchange-traded derivatives | (6,965 | ) | 4,705 | 2,126 | (134 | ) | — | (134 | ) | ||||||||||||||
| Other | (199 | ) | — | — | (199 | ) | — | (199 | ) | ||||||||||||||
| Total derivatives | (14,462 | ) | 11,072 | 2,595 | (795 | ) | 274 | (521 | ) | ||||||||||||||
| Securities sold under agreements to repurchase | (3,040 | ) | — | — | (3,040 | ) | 3,040 | — | |||||||||||||||
| Total | ($17,502 | ) | $11,072 | $2,595 | ($3,835 | ) | $3,314 | ($521 | ) | ||||||||||||||
| September 30, 2017 | ||||||||||||||||
| (In millions) | Derivatives | Securities sold under agreements to repurchase | Other(2) | Total | ||||||||||||
Debt securities of consolidated trusts(1) | $431 | $— | $199 | $630 | ||||||||||||
| Available-for-sale securities | — | — | 335 | 335 | ||||||||||||
| Trading securities | 2,875 | 8,240 | 383 | 11,498 | ||||||||||||
| Total securities pledged that may be repledged by the secured party | $3,306 | $8,240 | $917 | $12,463 | ||||||||||||
| December 31, 2016 | ||||||||||||||||
| (In millions) | Derivatives | Securities sold under agreements to repurchase | Other(2) | Total | ||||||||||||
Debt securities of consolidated trusts(1) | $686 | $— | $— | $686 | ||||||||||||
| Available-for-sale securities | — | — | 260 | 260 | ||||||||||||
| Trading securities | 3,014 | 3,070 | — | 6,084 | ||||||||||||
| Total securities pledged that may be repledged by the secured party | $3,700 | $3,070 | $260 | $7,030 | ||||||||||||
| March 31, 2024 | ||||||||||||||||||||
| (In millions) | Overnight and Continuous | 30 Days or Less | After 30 Days Through 90 Days | Greater Than 90 Days | Total | |||||||||||||||
| Securities sold under agreements to repurchase | $10,434 | $3,366 | $— | $— | $13,800 | |||||||||||||||
| September 30, 2017 | ||||||||||||||||||||||||||||||||||||||||||||||||||||||||||||||
| December 31, 2023 | December 31, 2023 | |||||||||||||||||||||||||||||||||||||||||||||||||||||||||||||
| (In millions) | Overnight and continuous | 30 days or less | After 30 days through 90 days | Greater than 90 days | Total | (In millions) | Overnight and Continuous | 30 Days or Less | After 30 Days Through 90 Days | Greater Than 90 Days | Total | |||||||||||||||||||||||||||||||||||||||||||||||||||
| U.S. Treasury securities | $— | $8,240 | $— | $— | $8,240 | |||||||||||||||||||||||||||||||||||||||||||||||||||||||||
| Securities sold under agreements to repurchase | ||||||||||||||||||||||||||||||||||||||||||||||||||||||||||||||
| Freddie Mac 1Q 2024 Form 10-Q | ||||||||
| Financial Statements | Notes to the Condensed Consolidated Financial Statements |Note 9 | ||||
| March 31, 2024 | |||||||||||||||||
| (In millions) | Derivatives | Securities Sold Under Agreements to Repurchase | Other(1) | Total | |||||||||||||
Cash equivalents(2) | $— | $75 | $— | $75 | |||||||||||||
| Trading securities | 1,903 | 5,500 | 2,330 | 9,733 | |||||||||||||
| Other assets | — | 4,002 | — | 4,002 | |||||||||||||
| Total securities pledged | $1,903 | $9,577 | $2,330 | $13,810 | |||||||||||||
| December 31, 2023 | |||||||||||||||||
| (In millions) | Derivatives | Securities Sold Under Agreements to Repurchase | Other(1) | Total | |||||||||||||
| Trading securities | $1,866 | $3,666 | $2,370 | $7,902 | |||||||||||||
| Other assets | — | 4,555 | — | 4,555 | |||||||||||||
| Total securities pledged | $1,866 | $8,221 | $2,370 | $12,457 | |||||||||||||
| YTD 2017 | ||||||||||||||||
| (In millions) | AOCI Related to Available- For-Sale Securities | AOCI Related to Cash Flow Hedge Relationships | AOCI Related to Defined Benefit Plans | Total | ||||||||||||
| Beginning balance | $915 | ($480 | ) | $21 | $456 | |||||||||||
Other comprehensive income before reclassifications(1) | 955 | — | (2 | ) | 953 | |||||||||||
| Amounts reclassified from accumulated other comprehensive income | (709 | ) | 81 | (1 | ) | (629 | ) | |||||||||
| Changes in AOCI by component | 246 | 81 | (3 | ) | 324 | |||||||||||
| Ending balance | $1,161 | ($399 | ) | $18 | $780 | |||||||||||
| YTD 2016 | ||||||||||||||||
| (In millions) | AOCI Related to Available- For-Sale Securities | AOCI Related to Cash Flow Hedge Relationships | AOCI Related to Defined Benefit Plans | Total | ||||||||||||
| Beginning balance | $1,740 | ($621 | ) | $34 | $1,153 | |||||||||||
Other comprehensive income before reclassifications(1) | 712 | — | 1 | 713 | ||||||||||||
| Amounts reclassified from accumulated other comprehensive income | (531 | ) | 95 | (2 | ) | (438 | ) | |||||||||
| Changes in AOCI by component | 181 | 95 | (1 | ) | 275 | |||||||||||
| Ending balance | $1,921 | ($526 | ) | $33 | $1,428 | |||||||||||
| Freddie Mac 1Q 2024 Form 10-Q | ||||||||
| Financial Statements | Notes to the Condensed Consolidated Financial Statements|Note | ||||
Details about Accumulated Other Comprehensive Income Components | Affected Line Item in the Condensed Consolidated Statements of Comprehensive Income | |||||||||||||||||
| (In millions) | 3Q 2017 | 3Q 2016 | YTD 2017 | YTD 2016 | ||||||||||||||
| AOCI related to available-for-sale securities | ||||||||||||||||||
| $796 | $497 | $1,109 | $955 | Other gains on investment securities recognized in earnings | ||||||||||||||
| (1 | ) | (9 | ) | (17 | ) | (138 | ) | Net impairment of available-for-sale securities recognized in earnings | ||||||||||
| 795 | 488 | 1,092 | 817 | Total before tax | ||||||||||||||
| (279 | ) | (171 | ) | (383 | ) | (286 | ) | Tax (expense) or benefit | ||||||||||
| 516 | 317 | 709 | 531 | Net of tax | ||||||||||||||
| AOCI related to cash flow hedge relationships | ||||||||||||||||||
| — | — | — | (1 | ) | Interest expense | |||||||||||||
| (40 | ) | (47 | ) | (125 | ) | (146 | ) | Expense related to derivatives | ||||||||||
| (40 | ) | (47 | ) | (125 | ) | (147 | ) | Total before tax | ||||||||||
| 14 | 18 | 44 | 52 | Tax (expense) or benefit | ||||||||||||||
| (26 | ) | (29 | ) | (81 | ) | (95 | ) | Net of tax | ||||||||||
| AOCI related to defined benefit plans | ||||||||||||||||||
| 1 | 1 | 1 | 3 | Salaries and employee benefits | ||||||||||||||
| — | — | — | (1 | ) | Tax (expense) or benefit | |||||||||||||
| 1 | 1 | 1 | 2 | Net of tax | ||||||||||||||
| Total reclassifications in the period | $491 | $289 | $629 | $438 | Net of tax | |||||||||||||
| (In millions) | 1Q 2024 | 1Q 2023 | ||||||||||||||||||
| Interest income: | ||||||||||||||||||||
| Mortgage loans | $26,229 | $23,304 | ||||||||||||||||||
| Investment securities | 470 | 316 | ||||||||||||||||||
| Securities purchased under agreements to resell | 1,532 | 1,220 | ||||||||||||||||||
| Other | 154 | 147 | ||||||||||||||||||
| Total interest income | 28,385 | 24,987 | ||||||||||||||||||
| Interest expense: | ||||||||||||||||||||
| Debt of consolidated trusts | (21,122) | (18,261) | ||||||||||||||||||
| Debt of Freddie Mac: | ||||||||||||||||||||
| Short-term debt | (256) | (154) | ||||||||||||||||||
| Long-term debt | (2,248) | (2,071) | ||||||||||||||||||
| Total interest expense | (23,626) | (20,486) | ||||||||||||||||||
| Net interest income | 4,759 | 4,501 | ||||||||||||||||||
| (Provision) benefit for credit losses | (181) | (395) | ||||||||||||||||||
| Net interest income after (provision) benefit for credit losses | $4,578 | $4,106 | ||||||||||||||||||
| Freddie Mac 1Q 2024 Form 10-Q | ||||||||
| Financial Statements | Notes to the Condensed Consolidated Financial Statements|Note | ||||
| Segment | Description | |||||
| Single-Family | ||||||
| Multifamily | Reflects results from our purchase, | ||||||
| 1Q 2024 | 1Q 2023 | |||||||||||||||||||||||||||||||
| (In millions) | Single-Family | Multifamily | Total | Single-Family | Multifamily | Total | ||||||||||||||||||||||||||
| Net interest income | $4,488 | $271 | $4,759 | $4,296 | $205 | $4,501 | ||||||||||||||||||||||||||
| Non-interest income | ||||||||||||||||||||||||||||||||
| Guarantee income | 19 | 477 | 496 | 32 | 434 | 466 | ||||||||||||||||||||||||||
| Investment gains, net | (86) | 491 | 405 | (179) | (46) | (225) | ||||||||||||||||||||||||||
| Other income | 53 | 44 | 97 | 54 | 31 | 85 | ||||||||||||||||||||||||||
| Non-interest income | (14) | 1,012 | 998 | (93) | 419 | 326 | ||||||||||||||||||||||||||
| Net revenues | 4,474 | 1,283 | 5,757 | 4,203 | 624 | 4,827 | ||||||||||||||||||||||||||
| (Provision) benefit for credit losses | (120) | (61) | (181) | (318) | (77) | (395) | ||||||||||||||||||||||||||
| Non-interest expense | (1,925) | (197) | (2,122) | (1,783) | (149) | (1,932) | ||||||||||||||||||||||||||
| Income before income tax expense | 2,429 | 1,025 | 3,454 | 2,102 | 398 | 2,500 | ||||||||||||||||||||||||||
| Income tax expense | (484) | (204) | (688) | (425) | (80) | (505) | ||||||||||||||||||||||||||
| Net income | 1,945 | 821 | 2,766 | 1,677 | 318 | 1,995 | ||||||||||||||||||||||||||
| Other comprehensive income (loss), net of taxes and reclassification adjustments | (5) | (20) | (25) | (1) | 55 | 54 | ||||||||||||||||||||||||||
| Comprehensive income | $1,940 | $801 | $2,741 | $1,676 | $373 | $2,049 | ||||||||||||||||||||||||||
| (In millions) | March 31, 2024 | December 31, 2023 | ||||||||||||
| Single-Family | $3,042,952 | $3,038,910 | ||||||||||||
| Multifamily | 443,087 | 440,797 | ||||||||||||
| Total segment assets | 3,486,039 | 3,479,707 | ||||||||||||
Reconciling items(1) | (198,666) | (198,731) | ||||||||||||
| Total assets per condensed consolidated balance sheets | $3,287,373 | $3,280,976 | ||||||||||||
| Freddie Mac 1Q 2024 Form 10-Q | ||||||||
| Financial Statements | Notes to the Condensed Consolidated Financial Statements|Note 12 | ||||
| March 31, 2024 | ||||||||||||||
| (Dollars in millions) | Portfolio UPB(1) | % of Portfolio | SDQ Rate | |||||||||||
Region:(2) | ||||||||||||||
| West | $909,769 | 30 | % | 0.41 | % | |||||||||
| Northeast | 704,001 | 23 | 0.61 | |||||||||||
| Southeast | 532,815 | 17 | 0.54 | |||||||||||
| Southwest | 453,381 | 15 | 0.51 | |||||||||||
| North Central | 442,742 | 15 | 0.52 | |||||||||||
| Total | $3,042,708 | 100 | % | 0.52 | ||||||||||
| State: | ||||||||||||||
| California | $513,997 | 17 | % | 0.41 | ||||||||||
| Texas | 214,630 | 7 | 0.54 | |||||||||||
| Florida | 201,175 | 7 | 0.61 | |||||||||||
| New York | 132,747 | 4 | 0.89 | |||||||||||
| Illinois | 113,777 | 4 | 0.69 | |||||||||||
| All other | 1,866,382 | 61 | 0.49 | |||||||||||
| Total | $3,042,708 | 100 | % | 0.52 | ||||||||||
| Freddie Mac 1Q 2024 Form 10-Q | 75 | |||||||
| Financial Statements | Notes to the Condensed Consolidated Financial Statements | Note | ||||
| (In millions) | 3Q 2017 | 3Q 2016 | YTD 2017 | YTD 2016 | |||||||||||
| Segment Earnings (loss), net of taxes: | |||||||||||||||
| Single-family Guarantee | $255 | $497 | $1,743 | $1,890 | |||||||||||
| Multifamily | 374 | 744 | 1,212 | 1,156 | |||||||||||
| Capital Markets | 4,042 | 1,088 | 5,591 | (78 | ) | ||||||||||
| All Other | — | — | — | — | |||||||||||
| Total Segment Earnings, net of taxes | 4,671 | 2,329 | 8,546 | 2,968 | |||||||||||
| Net income | $4,671 | $2,329 | $8,546 | $2,968 | |||||||||||
| Comprehensive income (loss) of segments: | |||||||||||||||
| Single-family Guarantee | $255 | $496 | $1,741 | $1,889 | |||||||||||
| Multifamily | 370 | 790 | 1,277 | 1,212 | |||||||||||
| Capital Markets | 4,025 | 1,024 | 5,852 | 142 | |||||||||||
| All Other | — | — | — | — | |||||||||||
| Comprehensive income of segments | 4,650 | 2,310 | 8,870 | 3,243 | |||||||||||
| Comprehensive income | $4,650 | $2,310 | $8,870 | $3,243 | |||||||||||
| 3Q 2017 | |||||||||||||||||||||||||||
Total Segment Earnings (Loss) | Total per Condensed Consolidated Statements of Comprehensive Income | ||||||||||||||||||||||||||
| (In millions) | Single-family Guarantee | Multifamily | Capital Markets | All Other | Reclassifications | ||||||||||||||||||||||
| Net interest income | $— | $342 | $804 | $— | $1,146 | $2,343 | $3,489 | ||||||||||||||||||||
Guarantee fee income(1) | 1,581 | 170 | — | — | 1,751 | (1,582 | ) | 169 | |||||||||||||||||||
| Benefit (provision) for credit losses | (826 | ) | (22 | ) | — | — | (848 | ) | 132 | (716 | ) | ||||||||||||||||
| Net impairment of available-for-sale securities recognized in earnings | — | — | 50 | — | 50 | (51 | ) | (1 | ) | ||||||||||||||||||
| Derivative gains (losses) | (2 | ) | 22 | (324 | ) | — | (304 | ) | (374 | ) | (678 | ) | |||||||||||||||
| Gains (losses) on trading securities | — | (47 | ) | (26 | ) | — | (73 | ) | — | (73 | ) | ||||||||||||||||
| Gains (losses) on loans | — | (84 | ) | — | — | (84 | ) | 287 | 203 | ||||||||||||||||||
| Other non-interest income (loss) | 405 | 314 | 5,757 | — | 6,476 | (622 | ) | 5,854 | |||||||||||||||||||
| Administrative expenses | (353 | ) | (98 | ) | (73 | ) | — | (524 | ) | — | (524 | ) | |||||||||||||||
| REO operations expense | (38 | ) | — | — | — | (38 | ) | 3 | (35 | ) | |||||||||||||||||
| Other non-interest expense | (348 | ) | (11 | ) | (3 | ) | — | (362 | ) | (136 | ) | (498 | ) | ||||||||||||||
| Income tax expense | (164 | ) | (212 | ) | (2,143 | ) | — | (2,519 | ) | — | (2,519 | ) | |||||||||||||||
| Net income | 255 | 374 | 4,042 | — | 4,671 | — | 4,671 | ||||||||||||||||||||
| Changes in unrealized gains (losses) related to available-for-sale securities | — | (4 | ) | (43 | ) | — | (47 | ) | — | (47 | ) | ||||||||||||||||
| Changes in unrealized gains (losses) related to cash flow hedge relationships | — | — | 26 | — | 26 | — | 26 | ||||||||||||||||||||
| Changes in defined benefit plans | — | — | — | — | — | — | — | ||||||||||||||||||||
| Total other comprehensive income (loss), net of taxes | — | (4 | ) | (17 | ) | — | (21 | ) | — | (21 | ) | ||||||||||||||||
| Comprehensive income | $255 | $370 | $4,025 | $— | $4,650 | $— | $4,650 | ||||||||||||||||||||
| YTD 2017 | |||||||||||||||||||||||||||
Total Segment Earnings (Loss) | Total per Condensed Consolidated Statements of Comprehensive Income | ||||||||||||||||||||||||||
| (In millions) | Single-family Guarantee | Multifamily | Capital Markets | All Other | Reclassifications | ||||||||||||||||||||||
| Net interest income | $— | $905 | $2,608 | $— | $3,513 | $7,150 | $10,663 | ||||||||||||||||||||
Guarantee fee income(1) | 4,505 | 483 | — | — | 4,988 | (4,512 | ) | 476 | |||||||||||||||||||
| Benefit (provision) for credit losses | (775 | ) | (10 | ) | — | — | (785 | ) | 607 | (178 | ) | ||||||||||||||||
| Net impairment of available-for-sale securities recognized in earnings | — | (4 | ) | 194 | — | 190 | (207 | ) | (17 | ) | |||||||||||||||||
| Derivative gains (losses) | (34 | ) | (31 | ) | (757 | ) | — | (822 | ) | (1,254 | ) | (2,076 | ) | ||||||||||||||
| Gains (losses) on trading securities | — | (62 | ) | (207 | ) | — | (269 | ) | — | (269 | ) | ||||||||||||||||
| Gains (losses) on loans | — | (75 | ) | — | — | (75 | ) | 485 | 410 | ||||||||||||||||||
| Other non-interest income (loss) | 1,115 | 972 | 6,924 | — | 9,011 | (1,981 | ) | 7,030 | |||||||||||||||||||
| Administrative expense | (1,018 | ) | (288 | ) | (242 | ) | — | (1,548 | ) | — | (1,548 | ) | |||||||||||||||
| REO operations expense | (138 | ) | — | — | — | (138 | ) | 10 | (128 | ) | |||||||||||||||||
| Other non-interest expense | (1,001 | ) | (44 | ) | (8 | ) | — | (1,053 | ) | (298 | ) | (1,351 | ) | ||||||||||||||
| Income tax expense | (911 | ) | (634 | ) | (2,921 | ) | — | (4,466 | ) | — | (4,466 | ) | |||||||||||||||
| Net income | 1,743 | 1,212 | 5,591 | — | 8,546 | — | 8,546 | ||||||||||||||||||||
| Changes in unrealized gains (losses) related to available-for-sale securities | — | 65 | 181 | — | 246 | — | 246 | ||||||||||||||||||||
| Changes in unrealized gains (losses) related to cash flow hedge relationships | — | — | 81 | — | 81 | — | 81 | ||||||||||||||||||||
| Changes in defined benefit plans | (2 | ) | — | (1 | ) | — | (3 | ) | — | (3 | ) | ||||||||||||||||
| Total other comprehensive income (loss), net of taxes | (2 | ) | 65 | 261 | — | 324 | — | 324 | |||||||||||||||||||
| Comprehensive income | $1,741 | $1,277 | $5,852 | $— | $8,870 | $— | $8,870 | ||||||||||||||||||||
| 3Q 2016 | |||||||||||||||||||||||||||
Total Segment Earnings (Loss) | Total per Condensed Consolidated Statements of Comprehensive Income | ||||||||||||||||||||||||||
| (In millions) | Single-family Guarantee | Multifamily | Capital Markets | All Other | Reclassifications | ||||||||||||||||||||||
| Net interest income | $— | $255 | $933 | $— | $1,188 | $2,458 | $3,646 | ||||||||||||||||||||
Guarantee fee income(1) | 1,641 | 134 | — | — | 1,775 | (1,642 | ) | 133 | |||||||||||||||||||
| Benefit (provision) for credit losses | (297 | ) | 8 | — | — | (289 | ) | 176 | (113 | ) | |||||||||||||||||
| Net impairment of available-for-sale securities recognized in earnings | — | — | 94 | — | 94 | (103 | ) | (9 | ) | ||||||||||||||||||
| Derivative gains (losses) | (35 | ) | 205 | 212 | — | 382 | (418 | ) | (36 | ) | |||||||||||||||||
| Gains (losses) on trading securities | — | 15 | (203 | ) | — | (188 | ) | — | (188 | ) | |||||||||||||||||
| Gains (losses) on loans | — | 126 | — | — | 126 | 13 | 139 | ||||||||||||||||||||
| Other non-interest income (loss) | 41 | 410 | 664 | — | 1,115 | (377 | ) | 738 | |||||||||||||||||||
| Administrative expenses | (330 | ) | (89 | ) | (79 | ) | — | (498 | ) | — | (498 | ) | |||||||||||||||
| REO operations expense | (59 | ) | — | — | — | (59 | ) | 3 | (56 | ) | |||||||||||||||||
| Other non-interest expense | (311 | ) | (10 | ) | — | — | (321 | ) | (110 | ) | (431 | ) | |||||||||||||||
| Income tax expense | (153 | ) | (310 | ) | (533 | ) | — | (996 | ) | — | (996 | ) | |||||||||||||||
| Net income | 497 | 744 | 1,088 | — | 2,329 | — | 2,329 | ||||||||||||||||||||
| Changes in unrealized gains (losses) related to available-for-sale securities | — | 46 | (93 | ) | — | (47 | ) | — | (47 | ) | |||||||||||||||||
| Changes in unrealized gains (losses) related to cash flow hedge relationships | — | — | 29 | — | 29 | — | 29 | ||||||||||||||||||||
| Changes in defined benefit plans | (1 | ) | — | — | — | (1 | ) | — | (1 | ) | |||||||||||||||||
| Total other comprehensive income (loss), net of taxes | (1 | ) | 46 | (64 | ) | — | (19 | ) | — | (19 | ) | ||||||||||||||||
| Comprehensive income | $496 | $790 | $1,024 | $— | $2,310 | $— | $2,310 | ||||||||||||||||||||
| YTD 2016 | |||||||||||||||||||||||||||
Total Segment Earnings (Loss) | Total per Condensed Consolidated Statements of Comprehensive Income | ||||||||||||||||||||||||||
| (In millions) | Single-family Guarantee | Multifamily | Capital Markets | All Other | Reclassifications | ||||||||||||||||||||||
| Net interest income | $— | $791 | $2,887 | $— | $3,678 | $6,816 | $10,494 | ||||||||||||||||||||
Guarantee fee income(1) | 4,427 | 366 | — | — | 4,793 | (4,426 | ) | 367 | |||||||||||||||||||
| Benefit (provision) for credit losses | 113 | 19 | — | — | 132 | 997 | 1,129 | ||||||||||||||||||||
| Net impairment of available-for-sale securities recognized in earnings | — | — | 224 | — | 224 | (362 | ) | (138 | ) | ||||||||||||||||||
| Derivative gains (losses) | (64 | ) | (878 | ) | (4,386 | ) | — | (5,328 | ) | (1,327 | ) | (6,655 | ) | ||||||||||||||
| Gains (losses) on trading securities | — | 119 | (12 | ) | — | 107 | — | 107 | |||||||||||||||||||
| Gains (losses) on loans | — | 747 | — | — | 747 | (611 | ) | 136 | |||||||||||||||||||
| Other non-interest income (loss) | 195 | 800 | 1,404 | — | 2,399 | (686 | ) | 1,713 | |||||||||||||||||||
| Administrative expense | (939 | ) | (255 | ) | (227 | ) | — | (1,421 | ) | — | (1,421 | ) | |||||||||||||||
| REO operations expense | (177 | ) | — | — | — | (177 | ) | 8 | (169 | ) | |||||||||||||||||
| Other non-interest expense | (832 | ) | (43 | ) | (3 | ) | — | (878 | ) | (409 | ) | (1,287 | ) | ||||||||||||||
| Income tax (expense) benefit | (833 | ) | (510 | ) | 35 | — | (1,308 | ) | — | (1,308 | ) | ||||||||||||||||
| Net income (loss) | 1,890 | 1,156 | (78 | ) | — | 2,968 | — | 2,968 | |||||||||||||||||||
| Changes in unrealized gains (losses) related to available-for-sale securities | — | 56 | 125 | — | 181 | — | 181 | ||||||||||||||||||||
| Changes in unrealized gains (losses) related to cash flow hedge relationships | — | — | 95 | — | 95 | — | 95 | ||||||||||||||||||||
| Changes in defined benefit plans | (1 | ) | — | — | — | (1 | ) | — | (1 | ) | |||||||||||||||||
| Total other comprehensive income (loss), net of taxes | (1 | ) | 56 | 220 | — | 275 | — | 275 | |||||||||||||||||||
| Comprehensive income | $1,889 | $1,212 | $142 | $— | $3,243 | $— | $3,243 | ||||||||||||||||||||
| March 31, 2024 | |||||||||||||||||
| (Dollars in millions) | Portfolio UPB | % of Portfolio | Delinquency Rate(1) | ||||||||||||||
Region(2)(3): | |||||||||||||||||
| West | $110,321 | 25 | % | 0.10 | % | ||||||||||||
| Northeast | 107,670 | 24 | 0.72 | ||||||||||||||
| Southwest | 91,795 | 21 | 0.32 | ||||||||||||||
| Southeast | 89,530 | 20 | 0.16 | ||||||||||||||
| North Central | 43,771 | 10 | 0.41 | ||||||||||||||
| Total | $443,087 | 100 | % | 0.34 | |||||||||||||
State(3): | |||||||||||||||||
| California | $58,752 | 13 | % | 0.03 | |||||||||||||
| Texas | 56,448 | 13 | 0.34 | ||||||||||||||
| Florida | 39,019 | 9 | 0.12 | ||||||||||||||
| New York | 33,941 | 8 | 1.87 | ||||||||||||||
| Georgia | 18,316 | 4 | 0.11 | ||||||||||||||
| All other | 236,611 | 53 | 0.25 | ||||||||||||||
| Total | $443,087 | 100 | % | 0.34 | |||||||||||||
| September 30, 2017 | December 31, 2016 | Percent of Credit Losses | |||||||||||||||
Percentage of Portfolio | Serious Delinquency Rate | Percentage of Portfolio | Serious Delinquency Rate | YTD 2017 | YTD 2016 | ||||||||||||
| Loan Portfolio | |||||||||||||||||
| Core single-family loan portfolio | 77 | % | 0.19 | % | 73 | % | 0.20 | % | 3 | % | 6 | % | |||||
| Legacy and relief refinance single-family loan portfolio | 23 | 2.14 | % | 27 | 2.28 | % | 97 | 94 | |||||||||
| Total | 100 | % | 0.86 | % | 100 | % | 1.00 | % | 100 | % | 100 | % | |||||
Region(1)(3) | |||||||||||||||||
| West | 30 | % | 0.47 | % | 30 | % | 0.57 | % | 27 | % | 10 | % | |||||
| Northeast | 25 | 1.24 | % | 25 | 1.45 | % | 34 | 40 | |||||||||
| North Central | 16 | 0.81 | % | 16 | 0.93 | % | 16 | 25 | |||||||||
| Southeast | 16 | 1.02 | % | 16 | 1.19 | % | 19 | 19 | |||||||||
| Southwest | 13 | 0.67 | % | 13 | 0.78 | % | 4 | 6 | |||||||||
| Total | 100 | % | 0.86 | % | 100 | % | 1.00 | % | 100 | % | 100 | % | |||||
State(2)(3) | |||||||||||||||||
| California | 18 | % | 0.40 | % | 18 | % | 0.46 | % | 18 | % | 4 | % | |||||
| Florida | 6 | 1.17 | % | 6 | 1.42 | % | 12 | 9 | |||||||||
| Illinois | 5 | 1.14 | % | 5 | 1.34 | % | 9 | 10 | |||||||||
| New Jersey | 3 | 1.82 | % | 3 | 2.26 | % | 9 | 11 | |||||||||
| New York | 5 | 1.75 | % | 5 | 2.05 | % | 8 | 9 | |||||||||
| All other | 63 | 0.78 | % | 63 | 0.90 | % | 44 | 57 | |||||||||
| Total | 100 | % | 0.86 | % | 100 | % | 1.00 | % | 100 | % | 100 | % | |||||
| Freddie Mac 1Q 2024 Form 10-Q | ||||||||
| Financial Statements | Notes to the Condensed Consolidated Financial Statements|Note | ||||
Percentage of Portfolio(1) | Serious Delinquency Rate(1) | ||||||||||
| (Percentage of portfolio based on UPB) | September 30, 2017 | December 31, 2016 | September 30, 2017 | December 31, 2016 | |||||||
| Interest-only | 1 | % | 1 | % | 4.68 | % | 4.34 | % | |||
| Alt-A | 2 | % | 2 | % | 5.00 | % | 5.21 | % | |||
Original LTV ratio greater than 90%(2) | 17 | % | 16 | % | 1.32 | % | 1.58 | % | |||
| Lower credit scores at origination (less than 620) | 2 | % | 2 | % | 5.22 | % | 5.73 | % | |||
| YTD 2017 | YTD 2016 | |||||
| Single-family Sellers | ||||||
| Wells Fargo Bank, N.A. | 16 | % | 14 | % | ||
| Other top 10 sellers | 37 | 33 | ||||
| Top 10 single-family sellers | 53 | % | 47 | % | ||
| Multifamily Sellers | ||||||
| CBRE Capital Markets, Inc. | 17 | % | 17 | % | ||
| Holliday Fenoglio Fowler, L.P. | 10 | 8 | ||||
| Berkadia Commercial Mortgage LLC | 9 | 19 | ||||
| Walker & Dunlop, LLC | 8 | 12 | ||||
| Other top 10 sellers | 34 | 22 | ||||
| Top 10 multifamily sellers | 78 | % | 78 | % | ||
| September 30, 2017 | December 31, 2016 | |||||
| Single-family Servicers | ||||||
| Wells Fargo Bank, N.A. | 18 | % | 19 | % | ||
| Other top 10 servicers | 41 | 41 | ||||
| Top 10 single-family servicers | 59 | % | 60 | % | ||
| Multifamily Servicers | ||||||
| Wells Fargo Bank, N.A. | 15 | % | 15 | % | ||
| CBRE Capital Markets, Inc. | 13 | 14 | ||||
| Berkadia Commercial Mortgage LLC | 9 | 11 | ||||
| Other top 10 servicers | 40 | 39 | ||||
| Top 10 multifamily servicers | 77 | % | 79 | % | ||
| Mortgage Insurance Coverage | ||||||||
Credit Rating(1) | September 30, 2017 | December 31, 2016 | ||||||
| Arch Mortgage Insurance Company | A- | 24 | % | 25 | % | |||
| Radian Guaranty Inc. | BBB- | 21 | 21 | |||||
| Mortgage Guaranty Insurance Corporation | BBB | 20 | 20 | |||||
| Genworth Mortgage Insurance Corporation | BB+ | 15 | 15 | |||||
| Essent Guaranty, Inc. | BBB+ | 11 | 10 | % | ||||
| Total | 91 | % | 91 | % | ||||
| March 31, 2024 | ||||||||||||||||||||
| (In millions) | Level 1 | Level 2 | Level 3 | Netting Adjustments(1) | Total | |||||||||||||||
| Assets: | ||||||||||||||||||||
| Investment securities: | ||||||||||||||||||||
| Available-for-sale | $— | $4,092 | $637 | $— | $4,729 | |||||||||||||||
| Trading: | ||||||||||||||||||||
| Mortgage-related securities | — | 5,116 | 3,002 | — | 8,118 | |||||||||||||||
| Non-mortgage-related securities | 28,136 | 417 | — | — | 28,553 | |||||||||||||||
| Total trading securities | 28,136 | 5,533 | 3,002 | — | 36,671 | |||||||||||||||
| Total investment securities | 28,136 | 9,625 | 3,639 | — | 41,400 | |||||||||||||||
| Mortgage loans held-for-sale | — | 7,139 | 787 | — | 7,926 | |||||||||||||||
| Mortgage loans held-for-investment | — | 1,236 | 695 | — | 1,931 | |||||||||||||||
| Other assets: | ||||||||||||||||||||
| Guarantee assets | — | — | 5,341 | — | 5,341 | |||||||||||||||
| Derivative assets, net | — | 6,206 | 32 | (5,946) | 292 | |||||||||||||||
| Other assets | — | 49 | 167 | — | 216 | |||||||||||||||
| Total other assets | — | 6,255 | 5,540 | (5,946) | 5,849 | |||||||||||||||
| Total assets carried at fair value on a recurring basis | $28,136 | $24,255 | $10,661 | ($5,946) | $57,106 | |||||||||||||||
| Liabilities: | ||||||||||||||||||||
| Debt: | ||||||||||||||||||||
| Debt of consolidated trusts | $— | $1,951 | $360 | $— | $2,311 | |||||||||||||||
| Debt of Freddie Mac | — | 295 | 90 | — | 385 | |||||||||||||||
| Total debt | — | 2,246 | 450 | — | 2,696 | |||||||||||||||
| Other liabilities: | ||||||||||||||||||||
| Derivative liabilities, net | 4 | 8,763 | 78 | (7,793) | 1,052 | |||||||||||||||
| Other liabilities | — | — | 1 | — | 1 | |||||||||||||||
| Total other liabilities | 4 | 8,763 | 79 | (7,793) | 1,053 | |||||||||||||||
| Total liabilities carried at fair value on a recurring basis | $4 | $11,009 | $529 | ($7,793) | $3,749 | |||||||||||||||
| Freddie Mac 1Q 2024 Form 10-Q | ||||||||
| Financial Statements | Notes to the Condensed Consolidated Financial Statements|Note 13 | ||||
| December 31, 2023 | ||||||||||||||||||||
| (In millions) | Level 1 | Level 2 | Level 3 | Netting Adjustments(1) | Total | |||||||||||||||
| Assets: | ||||||||||||||||||||
| Investment securities: | ||||||||||||||||||||
| Available-for-sale | $— | $4,212 | $678 | $— | $4,890 | |||||||||||||||
| Trading: | ||||||||||||||||||||
| Mortgage-related securities | — | 5,342 | 2,771 | — | 8,113 | |||||||||||||||
| Non-mortgage-related securities | 29,854 | 418 | — | — | 30,272 | |||||||||||||||
| Total trading securities | 29,854 | 5,760 | 2,771 | — | 38,385 | |||||||||||||||
| Total investment securities | 29,854 | 9,972 | 3,449 | — | 43,275 | |||||||||||||||
| Mortgage loans held-for-sale | — | 6,460 | 896 | — | 7,356 | |||||||||||||||
| Mortgage loans held-for-investment | — | 1,333 | 473 | — | 1,806 | |||||||||||||||
| Other assets: | ||||||||||||||||||||
| Guarantee assets | — | — | 5,351 | — | 5,351 | |||||||||||||||
| Derivative assets, net | — | 6,209 | 2 | (5,725) | 486 | |||||||||||||||
| Other assets | — | 92 | 166 | — | 258 | |||||||||||||||
| Total other assets | — | 6,301 | 5,519 | (5,725) | 6,095 | |||||||||||||||
| Total assets carried at fair value on a recurring basis | $29,854 | $24,066 | $10,337 | ($5,725) | $58,532 | |||||||||||||||
| Liabilities: | ||||||||||||||||||||
| Debt: | ||||||||||||||||||||
| Debt of consolidated trusts | $— | $1,707 | $343 | $— | $2,050 | |||||||||||||||
| Debt of Freddie Mac | — | 336 | 90 | — | 426 | |||||||||||||||
| Total debt | — | 2,043 | 433 | — | 2,476 | |||||||||||||||
| Other liabilities: | ||||||||||||||||||||
| Derivative liabilities, net | — | 8,608 | 63 | (7,798) | 873 | |||||||||||||||
| Other liabilities | — | — | — | — | — | |||||||||||||||
| Total other liabilities | — | 8,608 | 63 | (7,798) | 873 | |||||||||||||||
| Total liabilities carried at fair value on a recurring basis | $— | $10,651 | $496 | ($7,798) | $3,349 | |||||||||||||||
| September 30, 2017 | |||||||||||||||||||
| (In millions) | Level 1 | Level 2 | Level 3 | Netting Adjustment(1) | Total | ||||||||||||||
| Assets: | |||||||||||||||||||
| Investments in securities: | |||||||||||||||||||
| Available-for-sale, at fair value: | |||||||||||||||||||
| Mortgage-related securities: | |||||||||||||||||||
| Freddie Mac | $— | $33,567 | $5,580 | $— | $39,147 | ||||||||||||||
| Other agency | — | 3,041 | 48 | — | 3,089 | ||||||||||||||
| Non-agency RMBS | — | — | 5,135 | — | 5,135 | ||||||||||||||
| Non-agency CMBS | — | 180 | 3,469 | — | 3,649 | ||||||||||||||
| Obligations of states and political subdivisions | — | — | 402 | — | 402 | ||||||||||||||
| Total available-for-sale securities, at fair value | — | 36,788 | 14,634 | — | 51,422 | ||||||||||||||
| Trading, at fair value: | |||||||||||||||||||
| Mortgage-related securities: | |||||||||||||||||||
| Freddie Mac | — | 11,881 | 1,030 | — | 12,911 | ||||||||||||||
| Other agency | — | 4,742 | 268 | — | 5,010 | ||||||||||||||
| All other | — | 27 | 271 | — | 298 | ||||||||||||||
| Total mortgage-related securities | — | 16,650 | 1,569 | — | 18,219 | ||||||||||||||
| Non-mortgage-related securities | 14,648 | 2,859 | — | — | 17,507 | ||||||||||||||
| Total trading securities, at fair value | 14,648 | 19,509 | 1,569 | — | 35,726 | ||||||||||||||
| Total investments in securities | 14,648 | 56,297 | 16,203 | — | 87,148 | ||||||||||||||
| Mortgage loans: | |||||||||||||||||||
| Held-for-sale, at fair value | — | 18,995 | — | — | 18,995 | ||||||||||||||
| Derivative assets, net: | |||||||||||||||||||
| Interest-rate swaps | — | 3,871 | — | — | 3,871 | ||||||||||||||
| Option-based derivatives | — | 5,215 | — | — | 5,215 | ||||||||||||||
| Other | — | 132 | 3 | — | 135 | ||||||||||||||
| Subtotal, before netting adjustments | — | 9,218 | 3 | — | 9,221 | ||||||||||||||
Netting adjustments(1) | — | — | — | (8,516 | ) | (8,516 | ) | ||||||||||||
| Total derivative assets, net | — | 9,218 | 3 | (8,516 | ) | 705 | |||||||||||||
| Other assets: | |||||||||||||||||||
| Guarantee asset, at fair value | — | — | 2,621 | — | 2,621 | ||||||||||||||
| Non-derivative held-for-sale purchase commitments, at fair value | — | 140 | — | — | 140 | ||||||||||||||
| All other, at fair value | — | — | — | — | — | ||||||||||||||
| Total other assets | — | 140 | 2,621 | — | 2,761 | ||||||||||||||
| Total assets carried at fair value on a recurring basis | $14,648 | $84,650 | $18,827 | ($8,516 | ) | $109,609 | |||||||||||||
| Liabilities: | |||||||||||||||||||
| Debt securities of consolidated trusts held by third parties, at fair value | $— | $15 | $531 | $— | $546 | ||||||||||||||
| Other debt, at fair value | 5,173 | 89 | — | 5,262 | |||||||||||||||
| Derivative liabilities, net: | |||||||||||||||||||
| Interest-rate swaps | — | 8,006 | — | — | 8,006 | ||||||||||||||
| Option-based derivatives | — | 117 | — | — | 117 | ||||||||||||||
| Other | 76 | 67 | — | 143 | |||||||||||||||
| Subtotal, before netting adjustments | — | 8,199 | 67 | — | 8,266 | ||||||||||||||
Netting adjustments(1) | — | — | — | (8,054 | ) | (8,054 | ) | ||||||||||||
| Total derivative liabilities, net | — | 8,199 | 67 | (8,054 | ) | 212 | |||||||||||||
| Other liabilities: | |||||||||||||||||||
| Non-derivative held-for-sale purchase commitments, at fair value | — | 36 | — | — | 36 | ||||||||||||||
| All other, at fair value | — | — | 23 | — | 23 | ||||||||||||||
| Total liabilities carried at fair value on a recurring basis | $— | $13,423 | $710 | ($8,054 | ) | $6,079 | |||||||||||||
| December 31, 2016 | |||||||||||||||||||
| (In millions) | Level 1 | Level 2 | Level 3 | Netting Adjustment(1) | Total | ||||||||||||||
| Assets: | |||||||||||||||||||
| Investments in securities: | |||||||||||||||||||
| Available-for-sale, at fair value: | |||||||||||||||||||
| Mortgage-related securities: | |||||||||||||||||||
| Freddie Mac | $— | $33,805 | $9,847 | $— | $43,652 | ||||||||||||||
| Other agency | — | 4,155 | 66 | — | 4,221 | ||||||||||||||
| Non-agency RMBS | — | — | 11,797 | — | 11,797 | ||||||||||||||
| Non-agency CMBS | — | 3,056 | 3,366 | — | 6,422 | ||||||||||||||
| Obligations of states and political subdivisions | — | — | 665 | — | 665 | ||||||||||||||
| Total available-for-sale securities, at fair value | — | 41,016 | 25,741 | — | 66,757 | ||||||||||||||
| Trading, at fair value: | |||||||||||||||||||
| Mortgage-related securities: | |||||||||||||||||||
| Freddie Mac | — | 14,248 | 1,095 | — | 15,343 | ||||||||||||||
| Other agency | — | 8,149 | 12 | — | 8,161 | ||||||||||||||
| All other | — | 36 | 113 | — | 149 | ||||||||||||||
| Total mortgage-related securities | — | 22,433 | 1,220 | — | 23,653 | ||||||||||||||
| Non-mortgage-related securities | 19,402 | 1,735 | — | — | 21,137 | ||||||||||||||
| Total trading securities, at fair value | 19,402 | 24,168 | 1,220 | — | 44,790 | ||||||||||||||
| Total investments in securities | 19,402 | 65,184 | 26,961 | — | 111,547 | ||||||||||||||
| Mortgage loans: | |||||||||||||||||||
| Held-for-sale, at fair value | — | 16,255 | — | — | 16,255 | ||||||||||||||
| Derivative assets, net: | |||||||||||||||||||
| Interest-rate swaps | — | 6,924 | — | — | 6,924 | ||||||||||||||
| Option-based derivatives | — | 5,054 | — | — | 5,054 | ||||||||||||||
| Other | — | 287 | 3 | — | 290 | ||||||||||||||
| Subtotal, before netting adjustments | — | 12,265 | 3 | — | 12,268 | ||||||||||||||
Netting adjustments(1) | — | — | — | (11,521 | ) | (11,521 | ) | ||||||||||||
| Total derivative assets, net | — | 12,265 | 3 | (11,521 | ) | 747 | |||||||||||||
| Other assets: | |||||||||||||||||||
| Guarantee asset, at fair value | — | — | 2,298 | — | 2,298 | ||||||||||||||
| Non-derivative held-for-sale purchase commitments, at fair value | — | 108 | — | — | 108 | ||||||||||||||
| All other, at fair value | — | — | 2 | — | 2 | ||||||||||||||
| Total other assets | — | 108 | 2,300 | — | 2,408 | ||||||||||||||
| Total assets carried at fair value on a recurring basis | $19,402 | $93,812 | $29,264 | ($11,521 | ) | $130,957 | |||||||||||||
| Liabilities: | |||||||||||||||||||
| Debt securities of consolidated trusts held by third parties, at fair value | $— | $144 | $— | $— | $144 | ||||||||||||||
| Other debt, at fair value | — | 5,771 | 95 | — | 5,866 | ||||||||||||||
| Derivative liabilities, net: | |||||||||||||||||||
| Interest-rate swaps | — | 12,387 | — | — | 12,387 | ||||||||||||||
| Option-based derivatives | — | 106 | — | — | 106 | ||||||||||||||
| Other | — | 147 | 52 | — | 199 | ||||||||||||||
| Subtotal, before netting adjustments | — | 12,640 | 52 | — | 12,692 | ||||||||||||||
Netting adjustments(1) | — | — | — | (11,897 | ) | (11,897 | ) | ||||||||||||
| Total derivative liabilities, net | — | 12,640 | 52 | (11,897 | ) | 795 | |||||||||||||
| Other liabilities: | |||||||||||||||||||
| Non-derivative held-for-sale purchase commitments, at fair value | — | 37 | — | — | 37 | ||||||||||||||
| Total liabilities carried at fair value on a recurring basis | $— | $18,592 | $147 | ($11,897 | ) | $6,842 | |||||||||||||
| September 30, 2017 | December 31, 2016 | ||||||||||||||||||||||||||||||
| (In millions) | Level 1 | Level 2 | Level 3 | Total | Level 1 | Level 2 | Level 3 | Total | |||||||||||||||||||||||
| Assets measured at fair value on a non-recurring basis: | |||||||||||||||||||||||||||||||
Mortgage loans(1) | $— | $58 | $5,715 | $5,773 | $— | $199 | $2,483 | $2,682 | |||||||||||||||||||||||
| Freddie Mac 1Q 2024 Form 10-Q | ||||||||
| Financial Statements | Notes to the Condensed Consolidated Financial Statements|Note 13 | ||||
| 1Q 2024 | ||||||||||||||||||||||||||||||||||||||||||||||||||||||||||||||||||||||||||
| Balance, January 1, 2024 | Total Realized/Unrealized Gains/Losses(1) | Purchases | Issues | Sales | Settlements, Net | Transfers into Level 3 | Transfers out of Level 3 | Balance, March 31, 2024 | Change in Unrealized Gains/Losses(1) Included in Net Income Related to Assets and Liabilities Still Held as of March 31, 2024(2) | Change in Unrealized Gains/Losses(1), Net of Tax, Included in OCI Related to Assets and Liabilities Still Held as of March 31, 2024 | ||||||||||||||||||||||||||||||||||||||||||||||||||||||||||||||||
| (In millions) | Included in Earnings | Included in Other Comprehensive Income | ||||||||||||||||||||||||||||||||||||||||||||||||||||||||||||||||||||||||
| Assets | ||||||||||||||||||||||||||||||||||||||||||||||||||||||||||||||||||||||||||
| Investment securities: | ||||||||||||||||||||||||||||||||||||||||||||||||||||||||||||||||||||||||||
| Available-for-sale | $678 | $— | ($5) | $— | $— | $— | ($36) | $— | $— | $637 | $— | ($4) | ||||||||||||||||||||||||||||||||||||||||||||||||||||||||||||||
| Trading | 2,771 | (112) | — | 359 | — | — | (16) | — | — | 3,002 | 19 | — | ||||||||||||||||||||||||||||||||||||||||||||||||||||||||||||||
| Total investment securities | 3,449 | (112) | (5) | 359 | — | — | (52) | — | — | 3,639 | 19 | (4) | ||||||||||||||||||||||||||||||||||||||||||||||||||||||||||||||
| Mortgage loans held-for-sale | 896 | (6) | — | 294 | — | (273) | — | 35 | (159) | 787 | (7) | — | ||||||||||||||||||||||||||||||||||||||||||||||||||||||||||||||
| Mortgage loans held-for-investment | 473 | (24) | — | — | — | — | (47) | 298 | (5) | 695 | (29) | — | ||||||||||||||||||||||||||||||||||||||||||||||||||||||||||||||
| Other assets: | ||||||||||||||||||||||||||||||||||||||||||||||||||||||||||||||||||||||||||
| Guarantee assets | 5,351 | 111 | — | — | 105 | — | (226) | — | — | 5,341 | 111 | — | ||||||||||||||||||||||||||||||||||||||||||||||||||||||||||||||
| Other assets | 168 | 20 | — | (10) | 1 | (5) | 25 | — | — | 199 | 19 | — | ||||||||||||||||||||||||||||||||||||||||||||||||||||||||||||||
| Total other assets | 5,519 | 131 | — | (10) | 106 | (5) | (201) | — | — | 5,540 | 130 | — | ||||||||||||||||||||||||||||||||||||||||||||||||||||||||||||||
| Total assets | 10,337 | (11) | (5) | 643 | 106 | (278) | (300) | 333 | (164) | 10,661 | 113 | (4) | ||||||||||||||||||||||||||||||||||||||||||||||||||||||||||||||
| Liabilities | ||||||||||||||||||||||||||||||||||||||||||||||||||||||||||||||||||||||||||
| Debt | $433 | $5 | $— | ($4) | $19 | $— | ($3) | $— | $— | $450 | $10 | $— | ||||||||||||||||||||||||||||||||||||||||||||||||||||||||||||||
| Other liabilities | 63 | 15 | — | 2 | — | — | (1) | — | — | 79 | 16 | — | ||||||||||||||||||||||||||||||||||||||||||||||||||||||||||||||
| Total liabilities | $496 | $20 | $— | ($2) | $19 | $— | ($4) | $— | $— | $529 | $26 | $— | ||||||||||||||||||||||||||||||||||||||||||||||||||||||||||||||
| 1Q 2023 | ||||||||||||||||||||||||||||||||||||||||||||||||||||||||||||||||||||||||||
| Balance, January 1, 2023 | Total Realized/Unrealized Gains/Losses(1) | Purchases | Issues | Sales | Settlements, Net | Transfers into Level 3 | Transfers out of Level 3 | Balance, March 31, 2023 | Change in Unrealized Gains/Losses(1) Included in Net Income Related to Assets and Liabilities Still Held as of March 31, 2023(2) | Change in Unrealized Gains/Losses(1), Net of Tax, Included in OCI Related to Assets and Liabilities Still Held as of March 31, 2023 | ||||||||||||||||||||||||||||||||||||||||||||||||||||||||||||||||
| (In millions) | Included in Earnings | Included in Other Comprehensive Income | ||||||||||||||||||||||||||||||||||||||||||||||||||||||||||||||||||||||||
| Assets | ||||||||||||||||||||||||||||||||||||||||||||||||||||||||||||||||||||||||||
| Investment securities: | ||||||||||||||||||||||||||||||||||||||||||||||||||||||||||||||||||||||||||
| Available-for-sale | $894 | $1 | ($3) | $— | $— | $— | ($39) | $— | $— | $853 | $— | ($3) | ||||||||||||||||||||||||||||||||||||||||||||||||||||||||||||||
| Trading | 2,731 | (139) | — | 324 | — | — | (11) | — | — | 2,905 | 33 | — | ||||||||||||||||||||||||||||||||||||||||||||||||||||||||||||||
| Total investment securities | 3,625 | (138) | (3) | 324 | — | — | (50) | — | — | 3,758 | 33 | (3) | ||||||||||||||||||||||||||||||||||||||||||||||||||||||||||||||
| Mortgage loans held-for-sale | 310 | 1 | — | 26 | — | — | (1) | 11 | — | 347 | — | — | ||||||||||||||||||||||||||||||||||||||||||||||||||||||||||||||
| Mortgage loans held-for-investment | 110 | 2 | — | — | — | — | — | — | (48) | 64 | 2 | — | ||||||||||||||||||||||||||||||||||||||||||||||||||||||||||||||
| Other assets: | ||||||||||||||||||||||||||||||||||||||||||||||||||||||||||||||||||||||||||
| Guarantee assets | 5,442 | 85 | — | — | 127 | — | (222) | — | — | 5,432 | 85 | — | ||||||||||||||||||||||||||||||||||||||||||||||||||||||||||||||
| Other assets | 131 | 16 | — | (10) | — | — | (9) | — | — | 128 | 16 | — | ||||||||||||||||||||||||||||||||||||||||||||||||||||||||||||||
| Total other assets | 5,573 | 101 | — | (10) | 127 | — | (231) | — | — | 5,560 | 101 | — | ||||||||||||||||||||||||||||||||||||||||||||||||||||||||||||||
| Total assets | $9,618 | ($34) | ($3) | $340 | $127 | $— | ($282) | $11 | ($48) | $9,729 | $136 | ($3) | ||||||||||||||||||||||||||||||||||||||||||||||||||||||||||||||
| Liabilities | ||||||||||||||||||||||||||||||||||||||||||||||||||||||||||||||||||||||||||
| Debt | $388 | ($12) | $— | $— | $12 | $— | ($4) | $— | $— | $384 | ($8) | $— | ||||||||||||||||||||||||||||||||||||||||||||||||||||||||||||||
| Other liabilities | 97 | (18) | — | — | — | — | (2) | — | — | 77 | (19) | — | ||||||||||||||||||||||||||||||||||||||||||||||||||||||||||||||
| Total liabilities | $485 | ($30) | $— | $— | $12 | $— | ($6) | $— | $— | $461 | ($27) | $— | ||||||||||||||||||||||||||||||||||||||||||||||||||||||||||||||
| 3Q 2017 | |||||||||||||||||||||||||||||||||||||||||||||||
| Realized and unrealized gains (losses) | |||||||||||||||||||||||||||||||||||||||||||||||
| Balance, July 1, 2017 | Included in earnings | Included in other comprehensive income | Total | Purchases | Issues | Sales | Settlements, net | Transfers into Level 3(1) | Transfers out of Level 3(1) | Balance, September 30, 2017 | Unrealized gains (losses) still held(3) | ||||||||||||||||||||||||||||||||||||
| (In millions) | |||||||||||||||||||||||||||||||||||||||||||||||
| Assets | |||||||||||||||||||||||||||||||||||||||||||||||
| Investments in securities: | |||||||||||||||||||||||||||||||||||||||||||||||
| Available-for-sale, at fair value: | |||||||||||||||||||||||||||||||||||||||||||||||
| Mortgage-related securities: | |||||||||||||||||||||||||||||||||||||||||||||||
| Freddie Mac | $5,686 | ($4 | ) | $82 | $78 | $141 | $— | $— | ($325 | ) | $— | $— | $5,580 | ($4 | ) | ||||||||||||||||||||||||||||||||
| Other agency | 51 | — | — | — | — | — | — | (3 | ) | — | — | 48 | — | ||||||||||||||||||||||||||||||||||
| Non-agency RMBS | 8,639 | 854 | (128 | ) | 726 | — | — | (3,953 | ) | (277 | ) | — | — | 5,135 | 38 | ||||||||||||||||||||||||||||||||
| Non-agency CMBS | 3,470 | 1 | 5 | 6 | — | — | — | (7 | ) | — | — | 3,469 | 1 | ||||||||||||||||||||||||||||||||||
| Obligations of states and political subdivisions | 481 | — | (1 | ) | (1 | ) | — | — | — | (78 | ) | — | — | 402 | — | ||||||||||||||||||||||||||||||||
| Total available-for-sale mortgage-related securities | 18,327 | 851 | (42 | ) | 809 | 141 | — | (3,953 | ) | (690 | ) | — | — | 14,634 | 35 | ||||||||||||||||||||||||||||||||
| Trading, at fair value: | |||||||||||||||||||||||||||||||||||||||||||||||
| Mortgage-related securities: | |||||||||||||||||||||||||||||||||||||||||||||||
| Freddie Mac | 888 | (45 | ) | — | (45 | ) | 587 | — | — | (4 | ) | — | (396 | ) | 1,030 | (43 | ) | ||||||||||||||||||||||||||||||
| Other agency | 10 | (1 | ) | — | (1 | ) | 259 | — | — | — | — | — | 268 | (1 | ) | ||||||||||||||||||||||||||||||||
| All other | 108 | (2 | ) | — | (2 | ) | 176 | — | — | (11 | ) | — | — | 271 | (2 | ) | |||||||||||||||||||||||||||||||
| Total trading mortgage-related securities | 1,006 | (48 | ) | — | (48 | ) | 1,022 | — | — | (15 | ) | — | (396 | ) | 1,569 | (46 | ) | ||||||||||||||||||||||||||||||
| Other assets: | |||||||||||||||||||||||||||||||||||||||||||||||
| Guarantee asset | 2,480 | (1 | ) | — | (1 | ) | — | 265 | — | (123 | ) | — | — | 2,621 | (1 | ) | |||||||||||||||||||||||||||||||
| Realized and unrealized (gains) losses | |||||||||||||||||||||||||||||||||||||||||||||||
| Balance, July 1, 2017 | Included in earnings | Included in other comprehensive income | Total | Purchases | Issues | Sales | Settlements, net | Transfers into Level 3(1) | Transfers out of Level 3(1) | Balance, September 30, 2017 | Unrealized (gains) losses still held(3) | ||||||||||||||||||||||||||||||||||||
| (In millions) | |||||||||||||||||||||||||||||||||||||||||||||||
| Liabilities | |||||||||||||||||||||||||||||||||||||||||||||||
| Debt securities of consolidated trusts held by third parties, at fair value | $531 | $— | $— | $— | $— | $— | $— | $— | $— | $— | $531 | $— | |||||||||||||||||||||||||||||||||||
| Other debt, at fair value | 89 | — | — | — | — | — | — | — | — | — | 89 | — | |||||||||||||||||||||||||||||||||||
Net derivatives(2) | 68 | 2 | — | 2 | — | (1 | ) | — | (2 | ) | — | — | 67 | (2 | ) | ||||||||||||||||||||||||||||||||
| Other liabilities: | |||||||||||||||||||||||||||||||||||||||||||||||
| All other, at fair value | 17 | (12 | ) | — | (12 | ) | 5 | — | 13 | — | — | — | 23 | (12 | ) | ||||||||||||||||||||||||||||||||
| Freddie Mac 1Q 2024 Form 10-Q | ||||||||
| Financial Statements | Notes to the Condensed Consolidated Financial Statements|Note 13 | ||||
| YTD 2017 | |||||||||||||||||||||||||||||||||||||||||||||||
| Realized and unrealized gains (losses) | |||||||||||||||||||||||||||||||||||||||||||||||
Balance, January 1, 2017 | Included in earnings | Included in other comprehensive income | Total | Purchases | Issues | Sales | Settlements, net | Transfers into Level 3(1) | Transfers out of Level 3(1) | Balance, September 30, 2017 | Unrealized gains (losses) still held(3) | ||||||||||||||||||||||||||||||||||||
| (in millions) | |||||||||||||||||||||||||||||||||||||||||||||||
| Assets | |||||||||||||||||||||||||||||||||||||||||||||||
| Investments in securities: | |||||||||||||||||||||||||||||||||||||||||||||||
| Available-for-sale, at fair value: | |||||||||||||||||||||||||||||||||||||||||||||||
| Mortgage-related securities: | |||||||||||||||||||||||||||||||||||||||||||||||
| Freddie Mac | $9,847 | ($6 | ) | $117 | $111 | $635 | $— | ($907 | ) | ($1,027 | ) | $17 | ($3,096 | ) | $5,580 | ($15 | ) | ||||||||||||||||||||||||||||||
| Other agency | 66 | — | (1 | ) | (1 | ) | — | — | — | (9 | ) | — | (8 | ) | 48 | — | |||||||||||||||||||||||||||||||
| Non-agency RMBS | 11,797 | 1,285 | (68 | ) | 1,217 | — | — | (6,649 | ) | (1,230 | ) | — | — | 5,135 | 111 | ||||||||||||||||||||||||||||||||
| Non-agency CMBS | 3,366 | 4 | 128 | 132 | — | — | — | (29 | ) | — | — | 3,469 | 4 | ||||||||||||||||||||||||||||||||||
| Obligations of states and political subdivisions | 665 | 1 | (2 | ) | (1 | ) | — | — | — | (262 | ) | — | — | 402 | — | ||||||||||||||||||||||||||||||||
| Total available-for-sale mortgage-related securities | 25,741 | 1,284 | 174 | 1,458 | 635 | — | (7,556 | ) | (2,557 | ) | 17 | (3,104 | ) | 14,634 | 100 | ||||||||||||||||||||||||||||||||
| Trading, at fair value: | |||||||||||||||||||||||||||||||||||||||||||||||
| Mortgage-related securities: | |||||||||||||||||||||||||||||||||||||||||||||||
| Freddie Mac | 1,095 | (121 | ) | — | (121 | ) | 889 | — | (592 | ) | (9 | ) | 14 | (246 | ) | 1,030 | (92 | ) | |||||||||||||||||||||||||||||
| Other agency | 12 | (3 | ) | — | (3 | ) | 259 | — | — | — | — | — | 268 | (3 | ) | ||||||||||||||||||||||||||||||||
| All other | 113 | — | — | — | 176 | — | — | (18 | ) | — | — | 271 | — | ||||||||||||||||||||||||||||||||||
| Total trading mortgage-related securities | 1,220 | (124 | ) | — | (124 | ) | 1,324 | — | (592 | ) | (27 | ) | 14 | (246 | ) | 1,569 | (95 | ) | |||||||||||||||||||||||||||||
| Other assets: | |||||||||||||||||||||||||||||||||||||||||||||||
| Guarantee asset | 2,299 | (2 | ) | — | (2 | ) | — | 677 | — | (353 | ) | — | — | 2,621 | (2 | ) | |||||||||||||||||||||||||||||||
| Realized and unrealized (gains) losses | |||||||||||||||||||||||||||||||||||||||||||||||
| Balance, January 1, 2017 | Included in earnings | Included in other comprehensive income | Total | Purchases | Issues | Sales | Settlements, net | Transfers into Level 3(1) | Transfers out of Level 3(1) | Balance, September 30, 2017 | Unrealized (gains) losses still held(3) | ||||||||||||||||||||||||||||||||||||
| (in millions) | |||||||||||||||||||||||||||||||||||||||||||||||
| Liabilities | |||||||||||||||||||||||||||||||||||||||||||||||
| Debt securities of consolidated trusts held by third parties, at fair value | $— | $1 | $— | $1 | $— | $530 | $— | $— | $— | $— | $531 | $1 | |||||||||||||||||||||||||||||||||||
| Other debt, at fair value | 95 | — | — | — | — | — | — | (6 | ) | — | — | 89 | — | ||||||||||||||||||||||||||||||||||
Net derivatives(2) | 50 | 36 | — | 36 | — | — | — | (19 | ) | — | — | 67 | 19 | ||||||||||||||||||||||||||||||||||
| Other liabilities: | |||||||||||||||||||||||||||||||||||||||||||||||
| All other, at fair value | (2 | ) | (5 | ) | — | (5 | ) | 17 | — | 13 | — | — | — | 23 | (5 | ) | |||||||||||||||||||||||||||||||
| 3Q 2016 | |||||||||||||||||||||||||||||||||||||||||||||||
| Realized and unrealized gains (losses) | |||||||||||||||||||||||||||||||||||||||||||||||
Balance, July 1, 2016 | Included in earnings | Included in other comprehensive income | Total | Purchases | Issues | Sales | Settlements, net | Transfers into Level 3 | Transfers out of Level 3 | Balance, September 30, 2016 | Unrealized gains (losses) still held(3) | ||||||||||||||||||||||||||||||||||||
| (In millions) | |||||||||||||||||||||||||||||||||||||||||||||||
| Assets | |||||||||||||||||||||||||||||||||||||||||||||||
| Investments in securities: | |||||||||||||||||||||||||||||||||||||||||||||||
| Available-for-sale, at fair value: | |||||||||||||||||||||||||||||||||||||||||||||||
| Mortgage-related securities: | |||||||||||||||||||||||||||||||||||||||||||||||
| Freddie Mac | $11,462 | $— | ($38 | ) | ($38 | ) | $462 | $— | ($366 | ) | ($246 | ) | $— | ($4,134 | ) | $7,140 | ($1 | ) | |||||||||||||||||||||||||||||
| Other agency | 73 | — | — | — | — | — | — | (4 | ) | — | — | 69 | — | ||||||||||||||||||||||||||||||||||
| Non-agency RMBS | 15,497 | 437 | 214 | 651 | — | — | (2,869 | ) | (672 | ) | — | — | 12,607 | 87 | |||||||||||||||||||||||||||||||||
| Non-agency CMBS | 3,611 | 1 | 125 | 126 | — | — | — | (8 | ) | — | — | 3,729 | 1 | ||||||||||||||||||||||||||||||||||
| Obligations of states and political subdivisions | 890 | — | (2 | ) | (2 | ) | — | — | — | (92 | ) | — | — | 796 | — | ||||||||||||||||||||||||||||||||
| Total available-for-sale mortgage-related securities | 31,533 | 438 | 299 | 737 | 462 | — | (3,235 | ) | (1,022 | ) | — | (4,134 | ) | 24,341 | 87 | ||||||||||||||||||||||||||||||||
| Trading, at fair value: | |||||||||||||||||||||||||||||||||||||||||||||||
| Mortgage-related securities: | |||||||||||||||||||||||||||||||||||||||||||||||
| Freddie Mac | 315 | 11 | — | 11 | 753 | — | (5 | ) | (5 | ) | 99 | (234 | ) | 934 | 3 | ||||||||||||||||||||||||||||||||
| Other agency | 615 | 4 | — | 4 | — | — | (112 | ) | (20 | ) | — | (474 | ) | 13 | — | ||||||||||||||||||||||||||||||||
| All other | 1 | — | — | — | — | — | — | — | — | — | 1 | — | |||||||||||||||||||||||||||||||||||
| Total trading mortgage-related securities | 931 | 15 | — | 15 | 753 | — | (117 | ) | (25 | ) | 99 | (708 | ) | 948 | 3 | ||||||||||||||||||||||||||||||||
| Other assets: | |||||||||||||||||||||||||||||||||||||||||||||||
| Guarantee asset | 2,057 | — | — | — | — | 204 | — | (96 | ) | — | — | 2,165 | — | ||||||||||||||||||||||||||||||||||
| Realized and unrealized (gains) losses | |||||||||||||||||||||||||||||||||||||||||||||||
| Balance, July 1, 2016 | Included in earnings | Included in other comprehensive income | Total | Purchases | Issues | Sales | Settlements, net | Transfers into Level 3 | Transfers out of Level 3 | Balance, September 30, 2016 | Unrealized (gains) losses still held(3) | ||||||||||||||||||||||||||||||||||||
| (In millions) | |||||||||||||||||||||||||||||||||||||||||||||||
| Liabilities | |||||||||||||||||||||||||||||||||||||||||||||||
| Other debt, at fair value | $52 | $— | $— | $— | $— | $— | $— | $— | $— | $— | $52 | $— | |||||||||||||||||||||||||||||||||||
Net derivatives(2) | 27 | 39 | — | 39 | — | — | — | (9 | ) | — | — | 57 | 33 | ||||||||||||||||||||||||||||||||||
| Other Liabilities: | |||||||||||||||||||||||||||||||||||||||||||||||
| All other, at fair value | 15 | 10 | — | 10 | (25 | ) | — | — | — | — | — | — | 10 | ||||||||||||||||||||||||||||||||||
| YTD 2016 | |||||||||||||||||||||||||||||||||||||||||||||||
| Realized and unrealized gains (losses) | |||||||||||||||||||||||||||||||||||||||||||||||
| Balance, January 1, 2016 | Included in earnings | Included in other comprehensive income | Total | Purchases | Issues | Sales | Settlements, net | Transfers into Level 3 | Transfers out of Level 3 | Balance, September 30, 2016 | Unrealized gains (losses) still held(3) | ||||||||||||||||||||||||||||||||||||
| (in millions) | |||||||||||||||||||||||||||||||||||||||||||||||
| Assets | |||||||||||||||||||||||||||||||||||||||||||||||
| Investments in securities: | |||||||||||||||||||||||||||||||||||||||||||||||
| Available-for-sale, at fair value: | |||||||||||||||||||||||||||||||||||||||||||||||
| Mortgage-related securities: | |||||||||||||||||||||||||||||||||||||||||||||||
| Freddie Mac | $2,608 | $20 | $28 | $48 | $5,618 | $— | ($491 | ) | ($328 | ) | $— | ($315 | ) | $7,140 | ($1 | ) | |||||||||||||||||||||||||||||||
| Other agency | 91 | — | (1 | ) | (1 | ) | — | — | — | (15 | ) | — | (6 | ) | 69 | — | |||||||||||||||||||||||||||||||
| Non-agency RMBS | 20,333 | 810 | (73 | ) | 737 | — | — | (5,887 | ) | (2,576 | ) | — | — | 12,607 | 201 | ||||||||||||||||||||||||||||||||
| Non-agency CMBS | 3,530 | 2 | 224 | 226 | — | — | — | (27 | ) | — | — | 3,729 | 2 | ||||||||||||||||||||||||||||||||||
| Obligations of states and political subdivisions | 1,205 | 1 | (4 | ) | (3 | ) | — | — | — | (406 | ) | — | — | 796 | — | ||||||||||||||||||||||||||||||||
| Total available-for-sale mortgage-related securities | 27,767 | 833 | 174 | 1,007 | 5,618 | — | (6,378 | ) | (3,352 | ) | — | (321 | ) | 24,341 | 202 | ||||||||||||||||||||||||||||||||
| Trading, at fair value: | |||||||||||||||||||||||||||||||||||||||||||||||
| Mortgage-related securities: | |||||||||||||||||||||||||||||||||||||||||||||||
| Freddie Mac | 331 | (4 | ) | — | (4 | ) | 800 | — | (142 | ) | (3 | ) | 74 | (122 | ) | 934 | (4 | ) | |||||||||||||||||||||||||||||
| Other agency | 41 | (1 | ) | — | (1 | ) | — | — | (20 | ) | (7 | ) | — | — | 13 | (2 | ) | ||||||||||||||||||||||||||||||
| All other | 2 | — | — | — | — | — | — | (1 | ) | — | — | 1 | — | ||||||||||||||||||||||||||||||||||
| Total trading mortgage-related securities | 374 | (5 | ) | — | (5 | ) | 800 | — | (162 | ) | (11 | ) | 74 | (122 | ) | 948 | (6 | ) | |||||||||||||||||||||||||||||
| Other assets: | |||||||||||||||||||||||||||||||||||||||||||||||
| Guarantee asset | 1,753 | 68 | — | 68 | — | 602 | — | (258 | ) | — | — | 2,165 | 68 | ||||||||||||||||||||||||||||||||||
| Realized and unrealized (gains) losses | |||||||||||||||||||||||||||||||||||||||||||||||
| Balance, January 1, 2016 | Included in earnings | Included in other comprehensive income | Total | Purchases | Issues | Sales | Settlements, net | Transfers into Level 3 | Transfers out of Level 3 | Balance, September 30, 2016 | Unrealized (gains) losses still held(3) | ||||||||||||||||||||||||||||||||||||
| (in millions) | |||||||||||||||||||||||||||||||||||||||||||||||
| Liabilities | |||||||||||||||||||||||||||||||||||||||||||||||
| Other debt, at fair value | $— | $— | $— | $— | $— | $52 | $— | $— | $— | $— | $52 | $— | |||||||||||||||||||||||||||||||||||
Net derivatives(2) | 8 | 67 | — | 67 | — | 1 | — | (19 | ) | — | — | 57 | 48 | ||||||||||||||||||||||||||||||||||
| Other Liabilities: | |||||||||||||||||||||||||||||||||||||||||||||||
| All other, at fair value | 10 | 7 | — | 7 | (17 | ) | — | — | — | — | — | — | 7 | ||||||||||||||||||||||||||||||||||
| March 31, 2024 | ||||||||||||||||||||||||||||||||
Level 3 Fair Value | Predominant Valuation Technique(s) | Unobservable Inputs | ||||||||||||||||||||||||||||||
(Dollars in millions, except for certain unobservable inputs as shown) | Type | Range | Weighted Average(1) | |||||||||||||||||||||||||||||
| Assets | ||||||||||||||||||||||||||||||||
| Investment securities: | ||||||||||||||||||||||||||||||||
| Available-for-sale | $469 | Median of external sources | External pricing sources | $59.7 - $70.6 | $65.5 | |||||||||||||||||||||||||||
| 169 | Other | |||||||||||||||||||||||||||||||
| Trading | 2,235 | Single external source | External pricing source | $0.0 - $4,251.3 | $129.4 | |||||||||||||||||||||||||||
| 767 | Other | |||||||||||||||||||||||||||||||
| Mortgage loans held-for-sale | 787 | Single external source | External pricing source | $64.9 - $108.3 | $100.3 | |||||||||||||||||||||||||||
| Mortgage loans held-for-investment | 695 | Single external source | External pricing source | $29.5 - $100.0 | $80.8 | |||||||||||||||||||||||||||
| Guarantee assets | 5,012 | Discounted cash flows | OAS | 17 - 233 bps | 47 bps | |||||||||||||||||||||||||||
| 329 | Other | |||||||||||||||||||||||||||||||
Insignificant Level 3 assets(2) | 198 | |||||||||||||||||||||||||||||||
| Total level 3 assets | $10,661 | |||||||||||||||||||||||||||||||
| Liabilities | ||||||||||||||||||||||||||||||||
Insignificant Level 3 liabilities(2) | 529 | |||||||||||||||||||||||||||||||
| Total level 3 liabilities | $529 | |||||||||||||||||||||||||||||||
| December 31, 2023 | ||||||||||||||||||||||||||||||||
| Level 3 Fair Value | Predominant Valuation Technique(s) | Unobservable Inputs | ||||||||||||||||||||||||||||||
(Dollars in millions, except for certain unobservable inputs as shown) | Type | Range | Weighted Average(1) | |||||||||||||||||||||||||||||
| Assets | ||||||||||||||||||||||||||||||||
| Investment securities: | ||||||||||||||||||||||||||||||||
| Available-for-sale | $489 | Median of external sources | External pricing sources | $61.2 - $71.6 | $66.7 | |||||||||||||||||||||||||||
| 189 | Other | |||||||||||||||||||||||||||||||
| Trading | 2,085 | Single external source | External pricing source | $0.0 - $4,471.7 | $147.3 | |||||||||||||||||||||||||||
| 686 | Other | |||||||||||||||||||||||||||||||
| Mortgage loans held-for-sale | 896 | Single external source | External pricing source | $59.3 - $110.4 | $100.3 | |||||||||||||||||||||||||||
| Mortgage loans held-for-investment | 473 | Single external source | External pricing source | $24.7 - $99.2 | $74.7 | |||||||||||||||||||||||||||
| Guarantee assets | 5,014 | Discounted cash flows | OAS | 17 - 233 bps | 47 bps | |||||||||||||||||||||||||||
| 337 | Other | |||||||||||||||||||||||||||||||
Insignificant Level 3 assets(2) | 168 | |||||||||||||||||||||||||||||||
| Total level 3 assets | $10,337 | |||||||||||||||||||||||||||||||
| Liabilities | ||||||||||||||||||||||||||||||||
Insignificant Level 3 liabilities(2) | 496 | |||||||||||||||||||||||||||||||
| Total level 3 liabilities | $496 | |||||||||||||||||||||||||||||||
| September 30, 2017 | |||||||||
Level 3 Fair Value | Predominant Valuation Technique(s) | Unobservable Inputs(1) | |||||||
| (Dollars in millions, except for certain unobservable inputs as shown) | Type | Range | Weighted Average | ||||||
| Recurring fair value measurements | |||||||||
| Assets | |||||||||
| Investments in securities | |||||||||
| Available-for-sale, at fair value | |||||||||
| Mortgage-related securities | |||||||||
| Freddie Mac | $5,393 | Discounted cash flows | OAS | 19 - 514 bps | 56 bps | ||||
| 187 | Other | ||||||||
| Total Freddie Mac | 5,580 | ||||||||
| Other agency | 29 | Median of external sources | |||||||
| 19 | Single external source | ||||||||
| Total other agency | 48 | ||||||||
| Non-agency RMBS | 4,511 | Median of external sources | External pricing sources | $74.7 - $79.3 | $76.4 | ||||
| 624 | Other | ||||||||
| Total non-agency RMBS | 5,135 | ||||||||
| Non-agency CMBS | 3,468 | Single external source | External pricing sources | $6.3 - $107.8 | $95.7 | ||||
| 1 | Other | ||||||||
| Total non-agency CMBS | 3,469 | ||||||||
| Obligations of states and political subdivisions | 366 | Median of external sources | External pricing sources | $101.3 - $101.7 | $101.5 | ||||
| 36 | Other | ||||||||
| Total obligations of states and political subdivisions | 402 | ||||||||
| Total available-for-sale mortgage-related securities | 14,634 | ||||||||
| Trading, at fair value | |||||||||
| Mortgage-related securities | |||||||||
| Freddie Mac | 664 | Discounted cash flows | OAS | (7,125) - 27,202 bps | 144 bps | ||||
| 99 | Risk metrics | ||||||||
| 98 | Single external source | ||||||||
| 169 | Other | ||||||||
| Total Freddie Mac | 1,030 | ||||||||
| Other agency | 208 | Discounted cash flows | OAS | (562) - 424 bps | (60) bps | ||||
| 60 | Risk metrics | ||||||||
| Total other agency | 268 | ||||||||
| All other | 171 | Risk metrics | Effective duration | 0.00 - 7.32 years | 7.32 years | ||||
| 99 | Single external source | ||||||||
| 1 | Other | ||||||||
| Total all other | 271 | ||||||||
| Total trading mortgage-related securities | 1,569 | ||||||||
| Total investments in securities | $16,203 | ||||||||
| Other assets: | |||||||||
| Guarantee asset, at fair value | $2,621 | Discounted cash flow | OAS | 17 - 198 bps | 42 bps | ||||
| Liabilities | |||||||||
| Debt securities of consolidated trusts held by third parties, at fair value | 531 | Single External Source | External Pricing Sources | $100.0 - $100.5 | $100.1 | ||||
| Other debt, at fair value | 89 | Other | |||||||
| Net derivatives | 67 | Other | |||||||
| Other liabilities | |||||||||
| All other, at fair value | 23 | Other | |||||||
| Freddie Mac 1Q 2024 Form 10-Q | ||||||||
| Financial Statements | Notes to the Condensed Consolidated Financial Statements|Note 13 | ||||
| December 31, 2016 | |||||||||||
Level 3 Fair Value | Predominant Valuation Technique(s) | Unobservable Inputs(1) | |||||||||
| (Dollars in millions, except for certain unobservable inputs as shown) | Type | Range | Weighted Average | ||||||||
| Recurring fair value measurements | |||||||||||
| Assets | |||||||||||
| Investments in securities | |||||||||||
| Available-for-sale, at fair value | |||||||||||
| Mortgage-related securities | |||||||||||
| Freddie Mac | $7,619 | Discounted cash flows | OAS | (146) - 500 bps | 91 bps | ||||||
| 129 | Median of external sources | External pricing sources | $100.8 - $103.3 | $101.8 | |||||||
| 66 | Single external source | ||||||||||
| 60 | Risk Metrics | ||||||||||
| 1,973 | Other | ||||||||||
| Total Freddie Mac | 9,847 | ||||||||||
| Other agency | 32 | Median of external sources | |||||||||
| 23 | Single external source | ||||||||||
| 11 | Other | ||||||||||
| Total other agency | 66 | ||||||||||
| Non-agency RMBS | 9,974 | Median of external sources | External pricing sources | $74.0 - $78.8 | $76.0 | ||||||
| 1,823 | Other | ||||||||||
| Total non-agency RMBS | 11,797 | ||||||||||
| Non-agency CMBS | 3,365 | Risk Metrics | Effective duration | 2.15 - 10.02 years | 8.57 years | ||||||
| 1 | Other | ||||||||||
| Total non-agency CMBS | 3,366 | ||||||||||
| Obligations of states and political subdivisions | 619 | Median of external sources | External pricing sources | $100.9 - $101.5 | $101.2 | ||||||
| 46 | Other | ||||||||||
| Total obligations of states and political subdivisions | 665 | ||||||||||
| Total available-for-sale mortgage-related securities | 25,741 | ||||||||||
| Trading, at fair value | |||||||||||
| Mortgage-related securities | |||||||||||
| Freddie Mac | 452 | Risk metrics | Effective duration | (5.07) - 46.37 years | 6.94 years | ||||||
| 311 | Discounted cash flows | OAS | (3,346) - 2,460 bps | (224) bps | |||||||
| 5 | Single external source | ||||||||||
| 4 | Median of external sources | ||||||||||
| 323 | Other | ||||||||||
| Total Freddie Mac | 1,095 | ||||||||||
| Other agency | 12 | Discounted cash flows | |||||||||
| All other | 113 | Risk metrics | Effective duration | 0.14 - 4.08 years | 2.52 years | ||||||
| Total trading mortgage-related securities | 1,220 | ||||||||||
| Total investments in securities | $26,961 | ||||||||||
| Other assets: | |||||||||||
| Guarantee asset, at fair value | $2,091 | Discounted cash flows | OAS | 17 - 198 bps | 50 bps | ||||||
| 207 | Other | ||||||||||
| Total guarantee asset, at fair value | 2,298 | ||||||||||
| All other at fair value | 2 | Other | |||||||||
| Total other assets | 2,300 | �� | |||||||||
| Liabilities | |||||||||||
| Other debt, at fair value | 95 | Other | |||||||||
| Net derivatives | 49 | Other | |||||||||
| March 31, 2024 | December 31, 2023 | |||||||||||||||||||||||||||||||
| (In millions) | Level 1 | Level 2 | Level 3 | Total | Level 1 | Level 2 | Level 3 | Total | ||||||||||||||||||||||||
Mortgage loans(1) | $— | $407 | $1,280 | $1,687 | $— | $640 | $1,578 | $2,218 | ||||||||||||||||||||||||
| March 31, 2024 | ||||||||||||||||||||||||||
Level 3 Fair Value | Predominant Valuation Technique(s) | Unobservable Inputs | ||||||||||||||||||||||||
(Dollars in millions, except for certain unobservable inputs as shown) | Type | Range | Weighted Average(1) | |||||||||||||||||||||||
| Mortgage loans | $1,076 | Median of external sources | External pricing sources | $74.8 - $98.6 | $83.2 | |||||||||||||||||||||
| 204 | Other | |||||||||||||||||||||||||
| Total | $1,280 | |||||||||||||||||||||||||
| December 31, 2023 | ||||||||||||||||||||||||||
Level 3 Fair Value | Predominant Valuation Technique(s) | Unobservable Inputs | ||||||||||||||||||||||||
(Dollars in millions, except for certain unobservable inputs as shown) | Type | Range | Weighted Average(1) | |||||||||||||||||||||||
| Mortgage loans | $1,394 | Median of external sources | External pricing sources | $72.9 - $98.8 | $82.4 | |||||||||||||||||||||
| 184 | Other | |||||||||||||||||||||||||
| Total | $1,578 | |||||||||||||||||||||||||
| Freddie Mac 1Q 2024 Form 10-Q | |||||||||||||||||
Notes to the | |||||
| March 31, 2024 | |||||||||||||||||||||||||||||||||||||||||
GAAP Measurement Category(1) | Carrying Amount | Fair Value | |||||||||||||||||||||||||||||||||||||||
| (In millions) | Level 1 | Level 2 | Level 3 | Netting Adjustments(2) | Total | ||||||||||||||||||||||||||||||||||||
| Financial Assets | |||||||||||||||||||||||||||||||||||||||||
| Cash and cash equivalents | Amortized cost | $3,531 | $3,531 | $— | $— | $— | $3,531 | ||||||||||||||||||||||||||||||||||
| Securities purchased under agreements to resell | Amortized cost | 102,257 | — | 116,057 | — | (13,800) | 102,257 | ||||||||||||||||||||||||||||||||||
| Investment securities: | |||||||||||||||||||||||||||||||||||||||||
| Available-for-sale | FV - OCI | 4,729 | — | 4,092 | 637 | — | 4,729 | ||||||||||||||||||||||||||||||||||
| Trading | FV - NI | 36,671 | 28,136 | 5,533 | 3,002 | — | 36,671 | ||||||||||||||||||||||||||||||||||
| Total investment securities | 41,400 | 28,136 | 9,625 | 3,639 | — | 41,400 | |||||||||||||||||||||||||||||||||||
| Mortgage loans: | |||||||||||||||||||||||||||||||||||||||||
| Mortgage loans held-for-sale | 12,034 | — | 8,826 | 3,383 | — | 12,209 | |||||||||||||||||||||||||||||||||||
| Mortgage loans held-for-investment, net of allowance for credit losses | 3,088,687 | — | 2,412,334 | 267,683 | — | 2,680,017 | |||||||||||||||||||||||||||||||||||
| Total mortgage loans | Various(3) | 3,100,721 | — | 2,421,160 | 271,066 | — | 2,692,226 | ||||||||||||||||||||||||||||||||||
| Other assets: | |||||||||||||||||||||||||||||||||||||||||
| Guarantee assets | FV - NI | 5,341 | — | — | 5,343 | — | 5,343 | ||||||||||||||||||||||||||||||||||
| Derivative assets, net | FV - NI | 292 | — | 6,206 | 32 | (5,946) | 292 | ||||||||||||||||||||||||||||||||||
Other assets(4) | Various | 2,910 | — | 434 | 2,482 | — | 2,916 | ||||||||||||||||||||||||||||||||||
| Total other assets | 8,543 | — | 6,640 | 7,857 | (5,946) | 8,551 | |||||||||||||||||||||||||||||||||||
| Total financial assets | $3,256,452 | $31,667 | $2,553,482 | $282,562 | ($19,746) | $2,847,965 | |||||||||||||||||||||||||||||||||||
| Financial Liabilities | |||||||||||||||||||||||||||||||||||||||||
| Debt: | |||||||||||||||||||||||||||||||||||||||||
| Debt of consolidated trusts | $3,050,038 | $— | $2,632,804 | $737 | $— | $2,633,541 | |||||||||||||||||||||||||||||||||||
| Debt of Freddie Mac | 161,704 | — | 172,726 | 3,361 | (13,800) | 162,287 | |||||||||||||||||||||||||||||||||||
| Total debt | Various(5) | 3,211,742 | — | 2,805,530 | 4,098 | (13,800) | 2,795,828 | ||||||||||||||||||||||||||||||||||
| Other liabilities: | |||||||||||||||||||||||||||||||||||||||||
| Guarantee obligations | Amortized cost | 5,302 | — | 102 | 6,348 | — | 6,450 | ||||||||||||||||||||||||||||||||||
| Derivative liabilities, net | FV - NI | 1,052 | 4 | 8,763 | 78 | (7,793) | 1,052 | ||||||||||||||||||||||||||||||||||
Other liabilities(4) | FV - NI | 14 | — | 423 | 169 | — | 592 | ||||||||||||||||||||||||||||||||||
| Total other liabilities | 6,368 | 4 | 9,288 | 6,595 | (7,793) | 8,094 | |||||||||||||||||||||||||||||||||||
| Total financial liabilities | $3,218,110 | $4 | $2,814,818 | $10,693 | ($21,593) | $2,803,922 | |||||||||||||||||||||||||||||||||||
| Freddie Mac 1Q 2024 Form 10-Q | ||||||||
| Financial Statements | Notes to the Condensed Consolidated Financial Statements|Note 13 | ||||
| December 31, 2023 | |||||||||||||||||||||||||||||||||||||||||
GAAP Measurement Category(1) | Carrying Amount | Fair Value | |||||||||||||||||||||||||||||||||||||||
| (In millions) | Level 1 | Level 2 | Level 3 | Netting Adjustments(2) | Total | ||||||||||||||||||||||||||||||||||||
| Financial Assets | |||||||||||||||||||||||||||||||||||||||||
| Cash and cash equivalents | Amortized cost | $6,019 | $6,019 | $— | $— | $— | $6,019 | ||||||||||||||||||||||||||||||||||
| Securities purchased under agreements to resell | Amortized cost | 95,148 | — | 105,393 | — | (10,245) | 95,148 | ||||||||||||||||||||||||||||||||||
| Investment securities: | |||||||||||||||||||||||||||||||||||||||||
| Available-for-sale | FV - OCI | 4,890 | — | 4,212 | 678 | — | 4,890 | ||||||||||||||||||||||||||||||||||
| Trading | FV - NI | 38,385 | 29,854 | 5,760 | 2,771 | — | 38,385 | ||||||||||||||||||||||||||||||||||
| Total investment securities | 43,275 | 29,854 | 9,972 | 3,449 | — | 43,275 | |||||||||||||||||||||||||||||||||||
| Mortgage loans: | |||||||||||||||||||||||||||||||||||||||||
| Mortgage loans held-for-sale | 12,941 | — | 9,276 | 3,868 | — | 13,144 | |||||||||||||||||||||||||||||||||||
| Mortgage loans held-for-investment, net of allowance for credit losses | 3,083,665 | — | 2,466,127 | 254,877 | — | 2,721,004 | |||||||||||||||||||||||||||||||||||
| Total mortgage loans | Various(3) | 3,096,606 | — | 2,475,403 | 258,745 | — | 2,734,148 | ||||||||||||||||||||||||||||||||||
| Other assets: | |||||||||||||||||||||||||||||||||||||||||
| Guarantee assets | FV - NI | 5,351 | — | — | 5,353 | — | 5,353 | ||||||||||||||||||||||||||||||||||
| Derivative assets, net | FV - NI | 486 | — | 6,209 | 2 | (5,725) | 486 | ||||||||||||||||||||||||||||||||||
Other assets(4) | Various | 2,107 | — | 946 | 1,165 | — | 2,111 | ||||||||||||||||||||||||||||||||||
| Total other assets | 7,944 | — | 7,155 | 6,520 | (5,725) | 7,950 | |||||||||||||||||||||||||||||||||||
| Total financial assets | $3,248,992 | $35,873 | $2,597,923 | $268,714 | ($15,970) | $2,886,540 | |||||||||||||||||||||||||||||||||||
| Financial Liabilities | |||||||||||||||||||||||||||||||||||||||||
| Debt: | |||||||||||||||||||||||||||||||||||||||||
| Debt of consolidated trusts | $3,041,927 | $— | $2,673,019 | $727 | $— | $2,673,746 | |||||||||||||||||||||||||||||||||||
| Debt of Freddie Mac | 166,419 | — | 173,877 | 3,391 | (10,245) | 167,023 | |||||||||||||||||||||||||||||||||||
| Total debt | Various(5) | 3,208,346 | — | 2,846,896 | 4,118 | (10,245) | 2,840,769 | ||||||||||||||||||||||||||||||||||
| Other liabilities: | |||||||||||||||||||||||||||||||||||||||||
| Guarantee obligations | Amortized cost | 5,451 | — | 103 | 6,023 | — | 6,126 | ||||||||||||||||||||||||||||||||||
| Derivative liabilities, net | FV - NI | 873 | — | 8,608 | 63 | (7,798) | 873 | ||||||||||||||||||||||||||||||||||
Other liabilities(4) | FV - NI | 14 | — | 465 | 194 | — | 659 | ||||||||||||||||||||||||||||||||||
| Total other liabilities | 6,338 | — | 9,176 | 6,280 | (7,798) | 7,658 | |||||||||||||||||||||||||||||||||||
| Total financial liabilities | $3,214,684 | $— | $2,856,072 | $10,398 | ($18,043) | $2,848,427 | |||||||||||||||||||||||||||||||||||
| September 30, 2017 | |||||||||||||||||||||||
| Fair Value | |||||||||||||||||||||||
| (In millions) | GAAP Carrying Amount | Level 1 | Level 2 | Level 3 | Netting Adjustments(1) | Total | |||||||||||||||||
| Financial Assets | |||||||||||||||||||||||
| Cash and cash equivalents | $8,183 | $8,183 | $— | $— | $— | $8,183 | |||||||||||||||||
| Restricted cash and cash equivalents | 7,684 | 7,684 | — | — | — | 7,684 | |||||||||||||||||
| Securities purchased under agreements to resell | 47,202 | — | 47,202 | — | — | 47,202 | |||||||||||||||||
| Investments in securities: | |||||||||||||||||||||||
| Available-for-sale, at fair value | 51,422 | — | 36,788 | 14,634 | — | 51,422 | |||||||||||||||||
| Trading, at fair value | 35,726 | 14,648 | 19,509 | 1,569 | — | 35,726 | |||||||||||||||||
| Total investments in securities | 87,148 | 14,648 | 56,297 | 16,203 | — | 87,148 | |||||||||||||||||
| Mortgage loans: | |||||||||||||||||||||||
| Loans held by consolidated trusts | 1,738,858 | — | 1,613,122 | 141,914 | — | 1,755,036 | |||||||||||||||||
| Loans held by Freddie Mac | 106,034 | — | 34,015 | 75,050 | — | 109,065 | |||||||||||||||||
| Total mortgage loans | 1,844,892 | — | 1,647,137 | 216,964 | — | 1,864,101 | |||||||||||||||||
| Derivative assets, net | 705 | — | 9,218 | 3 | (8,516 | ) | 705 | ||||||||||||||||
| Guarantee asset | 2,621 | — | — | 2,789 | — | 2,789 | |||||||||||||||||
| Non-derivative purchase commitments, at fair value | 140 | — | 140 | 45 | — | 185 | |||||||||||||||||
| Advances to lenders and other secured lending | 1,649 | — | 303 | 1,346 | — | 1,649 | |||||||||||||||||
| Total financial assets | $2,000,224 | $30,515 | $1,760,297 | $237,350 | ($8,516 | ) | $2,019,646 | ||||||||||||||||
| Financial Liabilities | |||||||||||||||||||||||
| Debt, net: | |||||||||||||||||||||||
| Debt securities of consolidated trusts held by third parties | $1,691,524 | $— | $1,700,555 | $3,419 | $— | $1,703,974 | |||||||||||||||||
| Other debt | 318,054 | — | 318,649 | 4,166 | — | 322,815 | |||||||||||||||||
| Total debt, net | 2,009,578 | — | 2,019,204 | 7,585 | — | 2,026,789 | |||||||||||||||||
| Derivative liabilities, net | 212 | — | 8,199 | 67 | (8,054 | ) | 212 | ||||||||||||||||
| Guarantee obligation | 2,503 | — | — | 3,217 | — | 3,217 | |||||||||||||||||
| Non-derivative purchase commitments, at fair value | 36 | — | 36 | 32 | — | 68 | |||||||||||||||||
| Total financial liabilities | $2,012,329 | $— | $2,027,439 | $10,901 | ($8,054 | ) | $2,030,286 | ||||||||||||||||
| Freddie Mac 1Q 2024 Form 10-Q | ||||||||
| Financial Statements | Notes to the Condensed Consolidated Financial Statements|Note 13 | ||||
| December 31, 2016 | |||||||||||||||||||||||
| Fair Value | |||||||||||||||||||||||
| (In millions) | GAAP Carrying Amount | Level 1 | Level 2 | Level 3 | Netting Adjustments(1) | Total | |||||||||||||||||
| Financial Assets | |||||||||||||||||||||||
Cash and cash equivalents | $12,369 | $12,369 | $— | $— | $— | $12,369 | |||||||||||||||||
| Restricted cash and cash equivalents | 9,851 | 9,851 | — | — | — | 9,851 | |||||||||||||||||
| Securities purchased under agreements to resell | 51,548 | — | 51,548 | — | — | 51,548 | |||||||||||||||||
| Investments in securities: | |||||||||||||||||||||||
| Available-for-sale, at fair value | 66,757 | — | 41,016 | 25,741 | — | 66,757 | |||||||||||||||||
| Trading, at fair value | 44,790 | 19,402 | 24,168 | 1,220 | — | 44,790 | |||||||||||||||||
| Total investments in securities | 111,547 | 19,402 | 65,184 | 26,961 | — | 111,547 | |||||||||||||||||
| Mortgage loans: | |||||||||||||||||||||||
| Loans held by consolidated trusts | 1,690,218 | — | 1,554,143 | 142,121 | — | 1,696,264 | |||||||||||||||||
| Loans held by Freddie Mac | 112,785 | — | 31,004 | 84,227 | — | 115,231 | |||||||||||||||||
| Total mortgage loans | 1,803,003 | — | 1,585,147 | 226,348 | — | 1,811,495 | |||||||||||||||||
| Derivative assets, net | 747 | — | 12,265 | 3 | (11,521 | ) | 747 | ||||||||||||||||
| Guarantee asset | 2,298 | — | — | 2,490 | — | 2,490 | |||||||||||||||||
| Non-derivative purchase commitments, at fair value | 108 | — | 108 | 18 | — | 126 | |||||||||||||||||
| Advances to lenders and other secured lending | 1,278 | — | — | 1,278 | — | 1,278 | |||||||||||||||||
| Total financial assets | $1,992,749 | $41,622 | $1,714,252 | $257,098 | ($11,521 | ) | $2,001,451 | ||||||||||||||||
| Financial Liabilities | |||||||||||||||||||||||
| Debt, net: | |||||||||||||||||||||||
| Debt securities of consolidated trusts held by third parties | $1,648,683 | $— | $1,651,313 | $605 | $— | $1,651,918 | |||||||||||||||||
| Other debt | 353,321 | — | 352,837 | 4,809 | — | 357,646 | |||||||||||||||||
| Total debt, net | 2,002,004 | — | 2,004,150 | 5,414 | — | 2,009,564 | |||||||||||||||||
| Derivative liabilities, net | 795 | — | 12,640 | 52 | (11,897 | ) | 795 | ||||||||||||||||
| Guarantee obligation | 2,208 | — | — | 3,399 | — | 3,399 | |||||||||||||||||
| Non-derivative purchase commitments, at fair value | 37 | — | 37 | 45 | — | 82 | |||||||||||||||||
| Total financial liabilities | $2,005,044 | $— | $2,016,827 | $8,910 | ($11,897 | ) | $2,013,840 | ||||||||||||||||
| September 30, 2017 | December 31, 2016 | |||||||||||||||||||||||
| (In millions) | Multifamily Held-For-Sale Loans | Other Debt - Long Term | Debt securities of consolidated trusts held by third parties (1) | Multifamily Held-For-Sale Loans | Other Debt - Long Term | Debt securities of consolidated trusts held by third parties (1) | ||||||||||||||||||
| Fair value | $18,995 | $5,262 | $531 | $16,255 | $5,866 | $— | ||||||||||||||||||
| Unpaid principal balance | 18,786 | 4,836 | 530 | 16,231 | 5,584 | — | ||||||||||||||||||
| Difference | $209 | $426 | $1 | $24 | $282 | $— | ||||||||||||||||||
| March 31, 2024 | December 31, 2023 | |||||||||||||||||||||||||
| (In millions) | Fair value | UPB | Difference | Fair value | UPB | Difference | ||||||||||||||||||||
| Mortgage loans held-for-sale | $7,926 | $7,793 | $133 | $7,356 | $7,080 | $276 | ||||||||||||||||||||
| Mortgage loans held-for-investment | 1,931 | 2,227 | (296) | 1,806 | 2,095 | (289) | ||||||||||||||||||||
| Debt of Freddie Mac | 200 | 194 | 6 | 240 | 234 | 6 | ||||||||||||||||||||
| Debt of consolidated trusts | 1,950 | 2,070 | (120) | 1,705 | 1,799 | (94) | ||||||||||||||||||||
| Other assets (other liabilities) | 48 | N/A | N/A | 95 | N/A | N/A | ||||||||||||||||||||
| 1Q 2024 | 1Q 2023 | |||||||||||||||||||
| (In millions) | Gains (Losses) | |||||||||||||||||||
| Mortgage loans held-for-sale | ($159) | $4 | ||||||||||||||||||
| Mortgage loans held-for-investment | (31) | 26 | ||||||||||||||||||
| Debt of Freddie Mac | 1 | 14 | ||||||||||||||||||
| Debt of consolidated trusts | 9 | (35) | ||||||||||||||||||
| Other assets/other liabilities | 143 | 55 | ||||||||||||||||||
| Freddie Mac 1Q 2024 Form 10-Q | ||||||||
| Financial Statements | Notes to the Condensed Consolidated Financial Statements|Note 14 | ||||
| Freddie Mac 1Q 2024 Form 10-Q | 85 | |||||||
| Financial Statements | Notes to the Condensed Consolidated Financial Statements|Note 14 | ||||
| Freddie Mac 1Q 2024 Form 10-Q | 86 | |||||||
| Financial Statements | Notes to the Condensed Consolidated Financial Statements|Note 15 | ||||
| (In billions) | March 31, 2024 | December 31, 2023 | |||||||||||||||||||||
| Adjusted total assets | $3,786 | $3,775 | |||||||||||||||||||||
| Risk-weighted assets (standardized approach) | 1,018 | 1,009 | |||||||||||||||||||||
| March 31, 2024 | |||||||||||||||||||||||
| Amounts | Ratios | ||||||||||||||||||||||
| (Dollars in billions) | Available Capital (Deficit) | Minimum Capital Requirement | Capital Requirement (Including Buffer(1)) | Available Capital (Deficit) Ratio(2) | Minimum Capital Requirement Ratio(2) | Capital Requirement Ratio(2) (Including Buffer(1)) | |||||||||||||||||
| Risk-based capital: | |||||||||||||||||||||||
| Total capital | ($16) | $81 | $81 | (1.5) | % | 8.0 | % | 8.0 | % | ||||||||||||||
| CET1 capital | (41) | 46 | 103 | (4.0) | 4.5 | 10.1 | |||||||||||||||||
| Tier 1 capital | (27) | 61 | 118 | (2.6) | 6.0 | 11.6 | |||||||||||||||||
| Adjusted total capital | (27) | 81 | 138 | (2.6) | 8.0 | 13.6 | |||||||||||||||||
| Leverage capital: | |||||||||||||||||||||||
| Core capital | ($23) | $95 | $95 | (0.6) | % | 2.5 | % | 2.5 | % | ||||||||||||||
| Tier 1 capital | (27) | 95 | 109 | (0.7) | 2.5 | 2.9 | |||||||||||||||||
| December 31, 2023 | |||||||||||||||||||||||
| Amounts | Ratios | ||||||||||||||||||||||
| (Dollars in billions) | Available Capital (Deficit) | Minimum Capital Requirement | Capital Requirement (Including Buffer(1)) | Available Capital (Deficit) Ratio(2) | Minimum Capital Requirement Ratio(2) | Capital Requirement Ratio(2) (Including Buffer(1)) | |||||||||||||||||
| Risk-based capital: | |||||||||||||||||||||||
| Total capital | ($18) | $81 | $81 | (1.8) | % | 8.0 | % | 8.0 | % | ||||||||||||||
| CET1 capital | (43) | 45 | 96 | (4.3) | 4.5 | 9.5 | |||||||||||||||||
| Tier 1 capital | (29) | 60 | 111 | (2.9) | 6.0 | 11.0 | |||||||||||||||||
| Adjusted total capital | (29) | 81 | 132 | (2.9) | 8.0 | 13.0 | |||||||||||||||||
| Leverage capital: | |||||||||||||||||||||||
| Core capital | ($25) | $95 | $95 | (0.7) | % | 2.5 | % | 2.5 | % | ||||||||||||||
| Tier 1 capital | (29) | 95 | 106 | (0.8) | 2.5 | 2.8 | |||||||||||||||||
| Freddie Mac 1Q 2024 Form 10-Q | 87 | |||||||
| Other Information | ||
| (In millions) | 3Q 2017 | 3Q 2016 | YTD 2017 | YTD 2016 | |||||||||||
| Other income (loss): | |||||||||||||||
| Non-agency mortgage-related securities settlements | $4,525 | $— | $4,525 | $— | |||||||||||
| Gains (losses) on held-for-sale loan purchase commitments | 271 | 391 | 826 | 635 | |||||||||||
| (Losses) gains on debt recorded at fair value | 62 | (174 | ) | (129 | ) | (268 | ) | ||||||||
| All other | 545 | 388 | 1,290 | 1,160 | |||||||||||
| Total other income (loss) | $5,403 | $605 | $6,512 | $1,527 | |||||||||||
| (In millions) | September 30, 2017 | December 31, 2016 | |||||
| Other assets: | |||||||
| Real estate owned, net | $972 | $1,198 | |||||
Accounts and other receivables(1) | 7,728 | 5,083 | |||||
| Guarantee asset | 2,621 | 2,298 | |||||
| All other | 2,677 | 3,779 | |||||
| Total other assets | $13,998 | $12,358 | |||||
| Other liabilities: | |||||||
| Guarantee obligation | $2,503 | $2,208 | |||||
| Payables related to securities | 3,190 | 4,510 | |||||
| Income taxes payable | 1,602 | — | |||||
| All other | 2,331 | 2,769 | |||||
| Total other liabilities | $9,626 | $9,487 | |||||
| Freddie Mac 1Q 2024 Form 10-Q | ||||||||
| Other Information | ||||
| Freddie Mac 1Q 2024 Form 10-Q | ||||||||
| Controls and Procedures | ||||
| Freddie Mac 1Q 2024 Form 10-Q | ||||||||
| 4.1 | ||||||
| 10.1 | ||||||
| 31.1 | ||||||
| 31.2 | ||||||
| 32.1 | ||||||
| 32.2 | ||||||
| 101.INS | XBRL Instance Document - the instance document does not appear in the Interactive Data File because its XBRL tags are embedded within the Inline XBRL document | |||||
| 101.SCH | XBRL Taxonomy Extension Schema | |||||
| 101. CAL | XBRL Taxonomy Extension Calculation | |||||
| 101.DEF | XBRL Taxonomy Extension | |||||
| 101.LAB | XBRL Taxonomy Label | |||||
| 101. PRE | XBRL Taxonomy Extension Presentation | |||||
| 104 | Cover Page Interactive Data File - the cover page interactive data file does not appear in the Interactive Data File because its XBRL tags are embedded within the Inline XBRL document | |||||
| * | The SEC file numbers for the | ||||
| Freddie Mac 1Q 2024 Form 10-Q | ||||||||
| 91 | ||
| Signatures | ||
| Federal Home Loan Mortgage Corporation | ||||||||||
| By: | /s/ Michael T. Hutchins | |||||||||
| President and Interim Chief Executive Officer | ||||||||||
| (Principal Executive Officer) | ||||||||||
| By: | /s/ Christian M. Lown | ||||||||
| Christian M. Lown | |||||||||
| Executive Vice President | |||||||||
| (Principal Financial Officer) | |||||||||
| Freddie Mac 1Q 2024 Form 10-Q | ||||||||
| Item 1. | Financial Statements | |||||||
| Item 2. | Management's Discussion and Analysis of Financial Condition and Results of Operations | |||||||
| Item 3. | Quantitative and Qualitative Disclosures About Market Risk | |||||||
| Item 4. | Controls and Procedures | |||||||
| PART II | OTHER INFORMATION | |||||||
| Item 1. | Legal Proceedings | |||||||
| Item | Risk Factors | |||||||
| Item 2. | Unregistered Sales of Equity Securities and Use of Proceeds | |||||||
| Item | ||||||||
| Item 6. | ||||||||
| Exhibit Index | ||||||||
| Signatures | ||||||||
| Freddie Mac 1Q 2024 Form 10-Q | ||||||||