UNITED STATES
SECURITIES AND EXCHANGE COMMISSION
WASHINGTON,Washington, D.C. 20549
FORM 10-Q
|
| | |
| ý | | QUARTERLY REPORT PURSUANT TO SECTION 13 OR 15(d) OF THE SECURITIES EXCHANGE ACT OF 1934 |
For the Quarterly Period Ended SeptemberJune 30, 20162017 |
ORor |
| o | | TRANSITION REPORT PURSUANT TO SECTION 13 OR 15(d) OF THE SECURITIES EXCHANGE ACT OF 1934 |
| Commission File Number 1-13953 |
W. R. GRACE & CO.
(Exact name of registrant as specified in its charter)
|
| | |
Delaware (State or other jurisdiction of incorporation)incorporation or organization) | | 65-0773649 (I.R.S. Employer Identification No.) |
7500 Grace Drive, Columbia, Maryland 21044-4098
(Address of principal executive offices) (Zip code)Code)
(410) 531-4000
(Registrant's telephone number, including area code)
Indicate by check mark whether the registrant (1) has filed all reports required to be filed by Section 13 or 15(d) of the Securities Exchange Act of 1934 during the preceding 12 months (or for such shorter period that the registrant was required to file such reports), and (2) has been subject to such filing requirements for the past 90 days. Yes ý No o
Indicate by check mark whether the registrant has submitted electronically and posted on its corporate website, if any, every Interactive Data File required to be submitted and posted pursuant to Rule 405 of Regulation S-T (§232.405 of this chapter) during the preceding 12 months (or for such shorter period that the registrant was required to submit and post such files). Yes ý No o
Indicate by check mark whether the registrant is a large accelerated filer, an accelerated filer, a non-accelerated filer, or a smaller reporting company, or an emerging growth company. See the definitions of "large accelerated filer," "accelerated filer"filer," "smaller reporting company," and "smaller reporting"emerging growth company" in Rule 12b-2 of the Exchange Act.
|
| | | | | | |
Large accelerated filer ý | | Accelerated filer o | |
Non-accelerated filer o (Do (Do not check if a
smaller reporting company) | | Smaller reporting company o |
Emerging growth company o | | |
If an emerging growth company, indicate by check mark if the registrant has elected not to use the extended transition period for complying with any new or revised financial accounting standards provided pursuant to Section 13(a) of the Exchange Act. o
Indicate by check mark whether the registrant is a shell company (as defined in Rule 12b-2 of the Exchange Act). Yes o No ý
Indicate by check mark whether the registrant has filed all documents and reports required to be filed by Sections 12, 13 or 15(d) of the Securities Exchange Act of 1934 subsequent to the distribution of securities under a plan confirmed by a court. Yes ý No o
Indicate the number of shares outstanding of each of the issuer's classes of common stock, as of the latest practicable date.
|
| | |
| Class | | Outstanding at October 31, 2016July 25, 2017 |
| Common Stock, $0.01 par value per share | | 70,095,60568,226,961 shares |
TABLE OF CONTENTS
GRACE®, the GRACE® logo and, except as otherwise indicated, the other trademarks, service marks or trade names used in the text of this Report are trademarks, service marks, or trade names of operating units of W. R. Grace & Co. or its subsidiaries and/or affiliates. Unless otherwise indicated, in this Report the terms "Grace," "we," "us," or "our" mean W. R. Grace & Co. and/or its consolidated subsidiaries and affiliates, and the term "the Company" means W. R. Grace & Co. Unless otherwise indicated, the contents of websites mentioned in this report are not incorporated by reference or otherwise made a part of this Report. GRACE®, the GRACE® logo and, except as otherwise indicated, the other trademarks, service marks or trade names used in the text of this Report are trademarks, service marks, or trade names of operating units of W. R. Grace & Co. or its affiliates and/or subsidiaries.
The Financial Accounting Standards Board is referred to in this Report as the "FASB." The FASB issues, among other things, Accounting Standards Codifications (ASCs)("ASC") and Accounting Standards Updates (ASUs)("ASU").
PART I. FINANCIAL INFORMATION
Item 1. Financial Statements
Review by Independent Registered Public Accounting Firm
With respect to the interim consolidated financial statements included in this Quarterly Report on Form 10-Q for the quarter ended SeptemberJune 30, 20162017, PricewaterhouseCoopers LLP, the Company's independent registered public accounting firm, has applied limited procedures in accordance with professional auditing standards for a review of such information. Their report on the interim consolidated financial statements, which follows, states that they did not audit and they do not express an opinion on the unaudited interim consolidated financial statements. Accordingly, the degree of reliance on their report on the unaudited interim consolidated financial statements should be restricted in light of the limited nature of the review procedures applied. This report is not considered a "report" within the meaning of Sections 7 and 11 of the Securities Act of 1933, and, therefore, the independent accountants' liability under Section 11 does not extend to it.
Report of Independent Registered Public Accounting Firm
To the Shareholders and Board of Directors of W. R. Grace & Co.:
We have reviewed the accompanying consolidatedbalance sheetof W. R. Grace & Co. and its subsidiaries (the “Company”) as of SeptemberJune 30, 2016,2017, and the related consolidated statements of operations and comprehensive income (loss) for the three-month and nine-monthsix-month periods ended SeptemberJune 30, 20162017 and 20152016 and the consolidated statements of cash flows and equity for the nine-monthsix-month periods ended SeptemberJune 30, 20162017 and 2015.2016. These interim financial statements are the responsibility of the Company’s management.
We conducted our review in accordance with the standards of the Public Company Accounting Oversight Board (United States). A review of interim financial information consists principally of applying analytical procedures and making inquiries of persons responsible for financial and accounting matters. It is substantially less in scope than an audit conducted in accordance with the standards of the Public Company Accounting Oversight Board (United States), the objective of which is the expression of an opinion regarding the financial statements taken as a whole. Accordingly, we do not express such an opinion.
Based on our review, we are not aware of any material modifications that should be made to the accompanying consolidated interim financial statementsfor them to be in conformity with accounting principles generally accepted in the United States of America.
We previously audited, in accordance with the standards of the Public Company Accounting Oversight Board (United States), the consolidated balance sheet as of December 31, 2015,2016, and the related consolidated statements of operations, comprehensive income, equity and of cash flows for the year then ended (not presented herein), and in our report dated February 25, 2016,23, 2017, which included a paragraph that described thedescribing a change in classificationthe manner of deferred taxes on the consolidated balance sheet,accounting for debt issuance costs and stock compensation in 2016, we expressed an unqualified opinion on those consolidated financial statements. In our opinion, the information set forth in the accompanying consolidated balance sheet as of December 31, 2015,2016, is fairly stated in all material respects in relation to the consolidated balance sheet from which it has been derived.
/s/ PricewaterhouseCoopers LLP
Baltimore, Maryland
November 3, 2016July 28, 2017
W. R. Grace & Co. and Subsidiaries
Consolidated Statements of Operations (unaudited)
| | | | Three Months Ended September 30, | | Nine Months Ended September 30, | Three Months Ended June 30, | | Six Months Ended June 30, |
| (In millions, except per share amounts) | 2016 | | 2015 | | 2016 | | 2015 | 2017 | | 2016 | | 2017 | | 2016 |
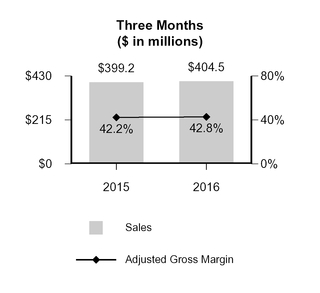
| Net sales | $ | 404.5 |
| | $ | 399.2 |
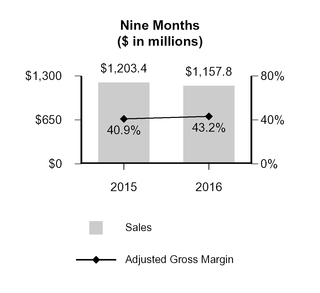
| | $ | 1,157.8 |
| | $ | 1,203.4 |
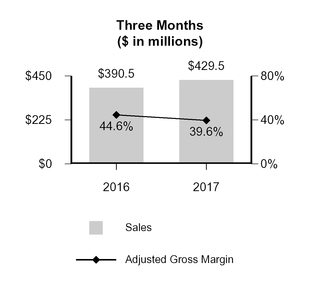
| $ | 429.5 |
| | $ | 390.5 |
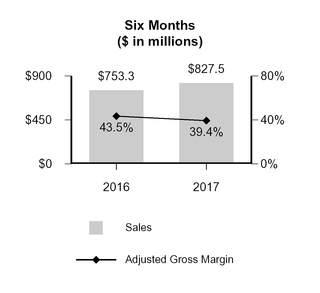
| | $ | 827.5 |
| | $ | 753.3 |
|
| Cost of goods sold | 236.3 |
| | 233.1 |
| | 663.7 |
| | 722.5 |
| 260.2 |
| | 217.3 |
| | 505.0 |
| | 427.4 |
|
| Gross profit | 168.2 |
| | 166.1 |
| | 494.1 |
| | 480.9 |
| 169.3 |
| | 173.2 |
| | 322.5 |
| | 325.9 |
|
| Selling, general and administrative expenses | 67.1 |
| | 70.5 |
| | 201.5 |
| | 221.0 |
| 70.3 |
| | 66.4 |
| | 136.8 |
| | 134.4 |
|
| Research and development expenses | 12.1 |
| | 11.8 |
| | 36.2 |
| | 36.2 |
| 12.9 |
| | 12.4 |
| | 26.1 |
| | 24.1 |
|
| Provision for environmental remediation, net | 11.9 |
| | 4.2 |
| | 19.4 |
| | 1.6 |
| 13.2 |
| | 5.3 |
| | 13.2 |
| | 7.5 |
|
| Equity in earnings of unconsolidated affiliate | (8.5 | ) | | (3.6 | ) | | (18.0 | ) | | (12.1 | ) | (6.1 | ) | | (2.6 | ) | | (13.1 | ) | | (9.5 | ) |
| Restructuring and repositioning expenses | 5.6 |
| | 5.2 |
| | 28.6 |
| | 14.9 |
| 5.4 |
| | 9.4 |
| | 7.7 |
| | 23.0 |
|
| Interest expense and related financing costs | 19.8 |
| | 25.2 |
| | 61.6 |
| | 74.5 |
| 20.1 |
| | 19.8 |
| | 39.6 |
| | 41.8 |
|
| Other (income) expense, net | (0.5 | ) | | 1.5 |
| | 13.3 |
| | (4.7 | ) | (9.6 | ) | | 3.1 |
| | (11.8 | ) | | 13.8 |
|
| Total costs and expenses | 107.5 |
| | 114.8 |
| | 342.6 |
| | 331.4 |
| 106.2 |
| | 113.8 |
| | 198.5 |
| | 235.1 |
|
| Income from continuing operations before income taxes | 60.7 |
| | 51.3 |
| | 151.5 |
| | 149.5 |
| |
| Provision for income taxes | (19.4 | ) |
| (17.7 | ) | | (62.1 | ) | | (53.1 | ) | |
| Income from continuing operations | 41.3 |
|
| 33.6 |
| | 89.4 |
| | 96.4 |
| |
| (Loss) income from discontinued operations, net of income taxes | (1.6 | ) | | (19.9 | ) | | (10.9 | ) | | 27.4 |
| |
| Net income | 39.7 |
| | 13.7 |
| | 78.5 |
| | 123.8 |
| |
| Income (loss) from continuing operations before income taxes | | 63.1 |
| | 59.4 |
| | 124.0 |
| | 90.8 |
|
| (Provision for) benefit from income taxes | | (19.6 | ) |
| (21.5 | ) | | (37.6 | ) | | (42.7 | ) |
| Income (loss) from continuing operations | | 43.5 |
|
| 37.9 |
| | 86.4 |
| | 48.1 |
|
| Income (loss) from discontinued operations, net of income taxes | | — |
| | 0.6 |
| | — |
| | (9.3 | ) |
| Net income (loss) | | 43.5 |
| | 38.5 |
| | 86.4 |
| | 38.8 |
|
| Less: Net (income) loss attributable to noncontrolling interests | (0.1 | ) | | 0.1 |
| | 0.3 |
| | 0.1 |
| 0.4 |
| | 0.2 |
| | 0.4 |
| | 0.4 |
|
| Net income attributable to W. R. Grace & Co. shareholders | $ | 39.6 |
| | $ | 13.8 |
| | $ | 78.8 |
| | $ | 123.9 |
| |
| Net income (loss) attributable to W. R. Grace & Co. shareholders | | $ | 43.9 |
| | $ | 38.7 |
| | $ | 86.8 |
| | $ | 39.2 |
|
| Amounts Attributable to W. R. Grace & Co. Shareholders: | | | | | | | | | | | | | | |
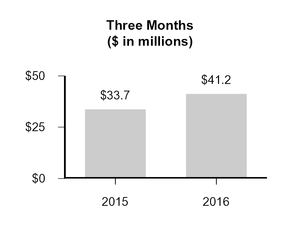
| Income from continuing operations attributable to W. R. Grace & Co. shareholders | $ | 41.2 |
| | $ | 33.7 |
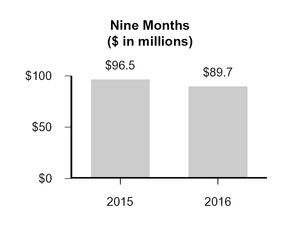
| | $ | 89.7 |
| | $ | 96.5 |
| |
| (Loss) income from discontinued operations, net of income taxes | (1.6 | ) | | (19.9 | ) | | (10.9 | ) | | 27.4 |
| |
| Net income attributable to W. R. Grace & Co. shareholders | $ | 39.6 |
| | $ | 13.8 |
| | $ | 78.8 |
| | $ | 123.9 |
| |
| Income (loss) from continuing operations attributable to W. R. Grace & Co. shareholders | | $ | 43.9 |
| | $ | 38.1 |
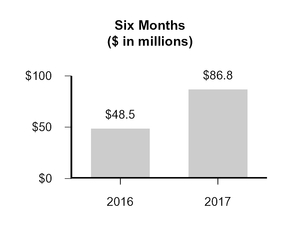
| | $ | 86.8 |
| | $ | 48.5 |
|
| Income (loss) from discontinued operations, net of income taxes | | — |
| | 0.6 |
| | — |
| | (9.3 | ) |
| Net income (loss) attributable to W. R. Grace & Co. shareholders | | $ | 43.9 |
| | $ | 38.7 |
| | $ | 86.8 |
| | $ | 39.2 |
|
| Earnings Per Share Attributable to W. R. Grace & Co. Shareholders | | | | | | | | | | | | | | |
| Basic earnings per share: | | | | | | | | | | | | | | |
| Income from continuing operations | $ | 0.59 |
| | $ | 0.47 |
| | $ | 1.27 |
| | $ | 1.33 |
| |
| (Loss) income from discontinued operations, net of income taxes | (0.03 | ) | | (0.28 | ) | | (0.15 | ) | | 0.38 |
| |
| Net income | $ | 0.56 |
| | $ | 0.19 |
| | $ | 1.12 |
| | $ | 1.71 |
| |
| Income (loss) from continuing operations | | $ | 0.64 |
| | $ | 0.54 |
| | $ | 1.27 |
| | $ | 0.69 |
|
| Income (loss) from discontinued operations, net of income taxes | | — |
| | 0.01 |
| | — |
| | (0.13 | ) |
| Net income (loss) | | $ | 0.64 |
| | $ | 0.55 |
| | $ | 1.27 |
| | $ | 0.56 |
|
| Weighted average number of basic shares | 70.3 |
|
| 72.1 |
| | 70.5 |
| | 72.5 |
| 68.3 |
|
| 70.5 |
| | 68.3 |
| | 70.5 |
|
| Diluted earnings per share: | | | | | | | | | | | | | | |
| Income from continuing operations | $ | 0.58 |
| | $ | 0.46 |
| | $ | 1.27 |
| | $ | 1.32 |
| |
| (Loss) income from discontinued operations, net of income taxes | (0.02 | ) | | (0.27 | ) | | (0.16 | ) | | 0.37 |
| |
| Net income | $ | 0.56 |
| | $ | 0.19 |
| | $ | 1.11 |
| | $ | 1.69 |
| |
| Income (loss) from continuing operations | | $ | 0.64 |
| | $ | 0.54 |
| | $ | 1.27 |
| | $ | 0.68 |
|
| Income (loss) from discontinued operations, net of income taxes | | — |
| | 0.01 |
| | — |
| | (0.13 | ) |
| Net income (loss) | | $ | 0.64 |
| | $ | 0.55 |
| | $ | 1.27 |
| | $ | 0.55 |
|
| Weighted average number of diluted shares | 70.7 |
| | 72.7 |
| | 70.9 |
| | 73.1 |
| 68.4 |
| | 70.9 |
| | 68.5 |
| | 71.0 |
|
| Dividends per common share | $ | 0.17 |
| | $ | — |
| | $ | 0.34 |
| | $ | — |
| $ | 0.21 |
| | $ | 0.17 |
| | $ | 0.42 |
| | $ | 0.17 |
|
The Notes to Consolidated Financial Statements are an integral part of these statements.
5
W. R. Grace & Co. and Subsidiaries
Consolidated Statements of Comprehensive Income (Loss) (unaudited)
| | | | Three Months Ended September 30, | | Nine Months Ended September 30, | Three Months Ended June 30, | | Six Months Ended June 30, |
| (In millions) | 2016 | | 2015 | | 2016 | | 2015 | 2017 | | 2016 | | 2017 | | 2016 |
| Net income | $ | 39.7 |
| | $ | 13.7 |
| | $ | 78.5 |
| | $ | 123.8 |
| |
| Net income (loss) | | $ | 43.5 |
| | $ | 38.5 |
| | $ | 86.4 |
| | $ | 38.8 |
|
| Other comprehensive income (loss): | | | | | | | | | | | | | | |
| Defined benefit pension and other postretirement plans, net of income taxes | (0.3 | ) | | (2.6 | ) | | (1.0 | ) | | (3.8 | ) | (0.4 | ) | | (0.4 | ) | | (0.7 | ) | | (0.7 | ) |
| Currency translation adjustments | (2.3 | ) | | (32.8 | ) | | (6.4 | ) | | (44.3 | ) | (8.3 | ) | | 1.3 |
| | (9.7 | ) | | (4.1 | ) |
| Gain (loss) from hedging activities, net of income taxes | 0.6 |
| | (1.4 | ) | | (2.7 | ) | | (1.7 | ) | (0.2 | ) | | (0.3 | ) | | 0.5 |
| | (3.3 | ) |
| Total other comprehensive (loss) income attributable to noncontrolling interests | — |
| | (0.6 | ) | | 2.6 |
| | 0.1 |
| |
| Total other comprehensive loss | (2.0 | ) | | (37.4 | ) | | (7.5 | ) | | (49.7 | ) | |
| Total other comprehensive income (loss) attributable to noncontrolling interests | | — |
| | — |
| | — |
| | 2.6 |
|
| Total other comprehensive income (loss) | | (8.9 | ) | | 0.6 |
| | (9.9 | ) | | (5.5 | ) |
| Comprehensive income (loss) | 37.7 |
| | (23.7 | ) | | 71.0 |
| | 74.1 |
| 34.6 |
| | 39.1 |
| | 76.5 |
| | 33.3 |
|
| Less: comprehensive (income) loss attributable to noncontrolling interests | (0.1 | ) | | 0.7 |
| | (2.3 | ) | | — |
| 0.4 |
| | 0.2 |
| | 0.4 |
| | (2.2 | ) |
| Comprehensive income (loss) attributable to W. R. Grace & Co. shareholders | $ | 37.6 |
| | $ | (23.0 | ) | | $ | 68.7 |
| | $ | 74.1 |
| $ | 35.0 |
| | $ | 39.3 |
| | $ | 76.9 |
| | $ | 31.1 |
|
The Notes to Consolidated Financial Statements are an integral part of these statements.
6
W. R. Grace & Co. and Subsidiaries
Consolidated Statements of Cash Flows (unaudited)
| | | | Nine Months Ended September 30, | Six Months Ended June 30, |
| (In millions) | 2016 | | 2015 | 2017 | | 2016 |
| OPERATING ACTIVITIES | | | | | | |
| Net income | $ | 78.5 |
| | $ | 123.8 |
| |
| Net income (loss) | | $ | 86.4 |
| | $ | 38.8 |
|
| Less: loss (income) from discontinued operations | 10.9 |
| | (27.4 | ) | — |
| | 9.3 |
|
| Income from continuing operations | 89.4 |
| | 96.4 |
| 86.4 |
| | 48.1 |
|
| Reconciliation to net cash provided by (used for) operating activities from continuing operations: | | | | | | |
| Depreciation and amortization | 73.8 |
| | 74.8 |
| 54.2 |
| | 46.8 |
|
| Equity in earnings of unconsolidated affiliate | (18.0 | ) | | (12.1 | ) | (13.1 | ) | | (9.5 | ) |
| Dividends received from unconsolidated affiliate | 24.8 |
| | 11.8 |
| — |
| | 16.8 |
|
| Cash paid for Chapter 11, and legacy product and environmental | (17.3 | ) | | (502.2 | ) | |
| Provision for income taxes | 62.1 |
| | 53.1 |
| |
| Cash paid for income taxes, net of refunds | (40.1 | ) | | (18.4 | ) | |
| Costs related to legacy product, environmental and other claims | | 17.0 |
|
| 11.1 |
|
| Cash paid for legacy product, environmental and other claims | | (44.2 | ) | | (6.0 | ) |
| Provision for (benefit from) income taxes | | 37.6 |
| | 42.7 |
|
| Cash paid for income taxes | | (31.3 | ) | | (26.8 | ) |
| Income tax refunds received | | 29.7 |
| | 2.3 |
|
| Loss on early extinguishment of debt | 11.1 |
| | — |
| — |
| | 11.1 |
|
| Cash paid for interest on credit arrangements | (45.5 | ) | | (54.0 | ) | |
| Interest expense and related financing costs | | 39.6 |
|
| 41.8 |
|
| Cash paid for interest | | (34.3 | ) | | (40.6 | ) |
| Defined benefit pension expense | 8.2 |
| | 19.6 |
| 8.2 |
| | 5.3 |
|
| Cash paid under defined benefit pension arrangements | (12.1 | ) | | (11.5 | ) | (7.8 | ) | | (8.0 | ) |
| Cash paid for restructuring | (13.6 | ) | | (4.2 | ) | |
| Changes in assets and liabilities, excluding effect of currency translation and acquisitions: | | | | | | |
| Trade accounts receivable | 9.7 |
| | 16.3 |
| 4.3 |
| | 37.2 |
|
| Inventories | (5.8 | ) | | (3.3 | ) | (3.9 | ) | | (7.7 | ) |
| Accounts payable | 11.0 |
| | 9.7 |
| 7.4 |
| | 7.0 |
|
| All other items, net | 69.9 |
| | 94.6 |
| (9.3 | ) | | (34.8 | ) |
| Net cash provided by (used for) operating activities from continuing operations | 207.6 |
| | (229.4 | ) | 140.5 |
| | 136.8 |
|
| INVESTING ACTIVITIES | | | | | | |
| Capital expenditures | (89.4 | ) | | (86.2 | ) | (59.1 | ) | | (57.3 | ) |
| Business acquired | (245.1 | ) | | — |
| — |
| | (245.1 | ) |
| Proceeds from sale of product lines | 11.3 |
| | — |
| 0.6 |
| | 11.3 |
|
| Other investing activities | (1.4 | ) | | (2.1 | ) | (1.1 | ) | | (0.6 | ) |
| Net cash used for investing activities from continuing operations | (324.6 | ) | | (88.3 | ) | |
| Net cash provided by (used for) investing activities from continuing operations | | (59.6 | ) | | (291.7 | ) |
| FINANCING ACTIVITIES | | | | | | |
| Borrowings under credit arrangements | 20.6 |
| | 278.7 |
| 98.8 |
| | 16.0 |
|
| Repayments under credit arrangements | (614.9 | ) | | (44.7 | ) | (61.5 | ) | | (609.4 | ) |
| Cash paid for repurchases of common stock | (55.1 | ) | | (220.1 | ) | (30.0 | ) | | (35.1 | ) |
| Proceeds from exercise of stock options | 13.3 |
| | 24.9 |
| 12.2 |
| | 9.2 |
|
| Dividends paid | (24.1 | ) | | — |
| (28.7 | ) | | (12.0 | ) |
| Distribution from GCP | 750.0 |
| | — |
| — |
| | 750.0 |
|
| Other financing activities | (2.4 | ) | | (2.9 | ) | (4.0 | ) | | (2.7 | ) |
| Net cash provided by financing activities from continuing operations | 87.4 |
| | 35.9 |
| |
| Net cash provided by (used for) financing activities from continuing operations | | (13.2 | ) | | 116.0 |
|
| Effect of currency exchange rate changes on cash and cash equivalents | 2.7 |
| | (3.4 | ) | 3.5 |
| | 1.9 |
|
| Decrease in cash and cash equivalents from continuing operations | (26.9 | ) | | (285.2 | ) | |
| Increase (decrease) in cash and cash equivalents from continuing operations | | 71.2 |
| | (37.0 | ) |
| Cash flows from discontinued operations | | | | | | |
| Net cash provided by operating activities | 23.9 |
| | 148.3 |
| |
| Net cash used for investing activities | (9.5 | ) | | (25.8 | ) | |
| Net cash provided by (used for) operating activities | | — |
| | 23.9 |
|
| Net cash provided by (used for) investing activities | | — |
| | (9.5 | ) |
| Net cash provided by (used for) financing activities | 31.4 |
| | (10.6 | ) | — |
| | 31.4 |
|
| Effect of currency exchange rate changes on cash and cash equivalents | (1.0 | ) | | (53.1 | ) | — |
| | (1.0 | ) |
| Increase in cash and cash equivalents from discontinued operations | 44.8 |
| | 58.8 |
| |
| Increase (decrease) in cash and cash equivalents from discontinued operations | | — |
| | 44.8 |
|
| Net increase (decrease) in cash and cash equivalents | 17.9 |
|
| (226.4 | ) | 71.2 |
|
| 7.8 |
|
| Less: cash and cash equivalents of discontinued operations | (143.4 | ) | | — |
| — |
| | (143.4 | ) |
| Cash and cash equivalents, beginning of period | 329.9 |
| | 557.5 |
| 90.6 |
| | 329.9 |
|
| Cash and cash equivalents, end of period | $ | 204.4 |
| | $ | 331.1 |
| $ | 161.8 |
| | $ | 194.3 |
|
| | | | | | | |
| Supplemental disclosure of cash flow information | | | | | | |
| Capital expenditures in accounts payable | | $ | 17.8 |
| | $ | 19.7 |
|
| Net share settled stock option exercises | $ | 10.4 |
| | $ | — |
| 1.2 |
| | $ | 10.1 |
|
The Notes to Consolidated Financial Statements are an integral part of these statements.
7
W. R. Grace & Co. and Subsidiaries
Consolidated Balance Sheets (unaudited)
| | | (In millions, except par value and shares) | September 30,
2016 | | December 31,
2015 | June 30,
2017 | | December 31,
2016 |
| ASSETS | | | | | | |
| Current Assets | | | | | | |
| Cash and cash equivalents | $ | 204.4 |
| | $ | 231.3 |
| $ | 161.8 |
| | $ | 90.6 |
|
| Restricted cash and cash equivalents | 9.8 |
| | 9.4 |
| 10.8 |
| | 10.0 |
|
| Trade accounts receivable, less allowance of $2.4 (2015—$1.4) | 252.7 |
| | 254.5 |
| |
| Trade accounts receivable, less allowance of $2.4 (2016—$2.2) | | 265.0 |
| | 273.9 |
|
| Inventories | 236.1 |
| | 198.8 |
| 236.5 |
| | 228.0 |
|
| Other current assets | 45.3 |
|
| 44.1 |
| 41.4 |
|
| 52.3 |
|
| Assets of discontinued operations | — |
| | 446.4 |
| |
| Total Current Assets | 748.3 |
| | 1,184.5 |
| 715.5 |
| | 654.8 |
|
| Properties and equipment, net of accumulated depreciation and amortization of $1,337.1 (2015—$1,287.4) | 731.7 |
| | 624.9 |
| |
| Properties and equipment, net of accumulated depreciation and amortization of $1,397.6 (2016—$1,327.5) | | 749.7 |
| | 729.6 |
|
| Goodwill | 395.2 |
| | 336.5 |
| 397.5 |
| | 394.2 |
|
| Technology and other intangible assets, net | 270.3 |
| | 227.5 |
| 261.9 |
| | 269.1 |
|
| Deferred income taxes | 717.0 |
| | 714.3 |
| 700.3 |
| | 709.4 |
|
| Investment in unconsolidated affiliate | 107.5 |
| | 103.2 |
| 131.9 |
| | 117.6 |
|
| Other assets | 37.5 |
|
| 33.9 |
| 33.1 |
|
| 37.1 |
|
| Assets of discontinued operations | — |
| | 420.9 |
| |
| Total Assets | $ | 3,007.5 |
| | $ | 3,645.7 |
| $ | 2,989.9 |
| | $ | 2,911.8 |
|
| LIABILITIES AND EQUITY | | | | | | |
| Current Liabilities | | | | | | |
| Debt payable within one year | $ | 77.1 |
| | $ | 58.8 |
| $ | 86.5 |
| | $ | 76.5 |
|
| Accounts payable | 162.2 |
| | 157.8 |
| 199.9 |
| | 195.4 |
|
| Other current liabilities | 233.9 |
| | 234.4 |
| 183.6 |
| | 208.9 |
|
| Liabilities of discontinued operations | — |
| | 256.4 |
| |
| Total Current Liabilities | 473.2 |
| | 707.4 |
| 470.0 |
| | 480.8 |
|
| Debt payable after one year | 1,513.1 |
| | 2,114.0 |
| 1,516.5 |
| | 1,507.6 |
|
| Deferred income taxes | 2.4 |
| | 1.2 |
| |
| Unrecognized tax benefits | 9.6 |
| | 9.8 |
| |
| Underfunded and unfunded defined benefit pension plans | 379.0 |
| | 377.5 |
| 444.2 |
| | 424.3 |
|
| Other liabilities | 135.6 |
| | 115.9 |
| 153.6 |
| | 126.7 |
|
| Liabilities of discontinued operations | — |
| | 107.4 |
| |
| Total Liabilities | 2,512.9 |
| | 3,433.2 |
| 2,584.3 |
| | 2,539.4 |
|
| Commitments and Contingencies—Note 8 | | | | | | |
| Equity | | | | | | |
| Common stock issued, par value $0.01; 300,000,000 shares authorized; outstanding: 70,253,231 (2015—70,533,515) | 0.7 |
| | 0.7 |
| |
| Common stock issued, par value $0.01; 300,000,000 shares authorized; outstanding: 68,226,070 (2016—68,309,431) | | 0.7 |
| | 0.7 |
|
| Paid-in capital | 489.7 |
| | 496.0 |
| 474.0 |
| | 487.3 |
|
| Retained earnings | 616.1 |
| | 436.3 |
| 677.3 |
| | 619.3 |
|
| Treasury stock, at cost: shares: 7,203,394 (2015—6,923,110) | (673.6 | ) | | (658.4 | ) | |
| Treasury stock, at cost: shares: 9,230,557 (2016—9,147,196) | | (806.1 | ) | | (804.9 | ) |
| Accumulated other comprehensive income (loss) | 58.4 |
| | (66.8 | ) | 56.5 |
| | 66.4 |
|
| Total W. R. Grace & Co. Shareholders' Equity | 491.3 |
| | 207.8 |
| 402.4 |
| | 368.8 |
|
| Noncontrolling interests | 3.3 |
| | 4.7 |
| 3.2 |
| | 3.6 |
|
| Total Equity | 494.6 |
| | 212.5 |
| 405.6 |
| | 372.4 |
|
| Total Liabilities and Equity | $ | 3,007.5 |
| | $ | 3,645.7 |
| $ | 2,989.9 |
| | $ | 2,911.8 |
|
The Notes to Consolidated Financial Statements are an integral part of these statements.
8
W. R. Grace & Co. and Subsidiaries
Consolidated Statements of Equity (unaudited)
| | | (In millions) | Common Stock and Paid-in Capital | | Retained Earnings | | Treasury Stock | | Accumulated Other Comprehensive Income (Loss) | | Noncontrolling Interests | | Total Equity | Common Stock and Paid-in Capital | | Retained Earnings | | Treasury Stock | | Accumulated Other Comprehensive Income (Loss) | | Noncontrolling Interests | | Total Equity |
| Balance, December 31, 2014 | $ | 526.8 |
| | $ | 292.1 |
| | $ | (429.2 | ) | | $ | (23.8 | ) | | $ | 3.1 |
| | $ | 369.0 |
| |
| Net income | — |
| | 123.9 |
| | — |
| | — |
| | 0.5 |
| | 124.4 |
| |
| Repurchase of common stock | — |
| | — |
| | (220.1 | ) | | — |
| | — |
| | (220.1 | ) | |
| Purchase of noncontrolling interest | (0.7 | ) | | — |
| | — |
| | — |
| | 0.7 |
| | — |
| |
| Stock based compensation | 7.4 |
| | — |
| | — |
| | — |
| | — |
| | 7.4 |
| |
| Exercise of stock options | (43.1 | ) | | — |
| | 68.0 |
| | — |
| | — |
| | 24.9 |
| |
| Tax benefit related to stock plans | 0.5 |
| | — |
| | — |
| | — |
| | — |
| | 0.5 |
| |
| Shares issued | 1.0 |
| | — |
| | — |
| | — |
| | — |
| | 1.0 |
| |
| Other comprehensive (loss) income | — |
| | — |
| | — |
| | (49.8 | ) | | 0.1 |
| | (49.7 | ) | |
| Balance, September 30, 2015 | $ | 491.9 |
| | $ | 416.0 |
| | $ | (581.3 | ) | | $ | (73.6 | ) | | $ | 4.4 |
| | $ | 257.4 |
| |
| Balance, December 31, 2015 | $ | 496.7 |
| | $ | 436.3 |
| | $ | (658.4 | ) | | $ | (66.8 | ) | | $ | 4.7 |
| | $ | 212.5 |
| $ | 496.7 |
| | $ | 436.3 |
| | $ | (658.4 | ) | | $ | (66.8 | ) | | $ | 4.7 |
| | $ | 212.5 |
|
| Net income (loss) | — |
| | 78.8 |
| | — |
| | — |
| | (0.3 | ) | | 78.5 |
| — |
| | 39.2 |
| | — |
| | — |
| | (0.4 | ) | | 38.8 |
|
| Repurchase of common stock | — |
| | — |
| | (55.1 | ) | | — |
| | — |
| | (55.1 | ) | — |
| | — |
| | (35.1 | ) | | — |
| | — |
| | (35.1 | ) |
| Stock based compensation | 9.2 |
| | — |
| | — |
| | — |
| | — |
| | 9.2 |
| 6.5 |
| | — |
| | — |
| | — |
| | — |
| | 6.5 |
|
| Exercise of stock options | (16.2 | ) | | — |
| | 39.9 |
| | — |
| | — |
| | 23.7 |
| (10.5 | ) | | — |
| | 29.8 |
| | — |
| | — |
| | 19.3 |
|
| Tax benefit related to stock plans | — |
| | 70.4 |
| | — |
| | — |
| | — |
| | 70.4 |
| — |
| | 72.3 |
| | — |
| | — |
| | — |
| | 72.3 |
|
| Shares issued | 0.7 |
| | — |
| | — |
| | — |
| | — |
| | 0.7 |
| 0.7 |
| | — |
| | — |
| | — |
| | — |
| | 0.7 |
|
| Other comprehensive (loss) income | — |
| | — |
| | — |
| | (10.1 | ) | | 2.6 |
| | (7.5 | ) | — |
| | — |
| | — |
| | (8.1 | ) | | 2.6 |
| | (5.5 | ) |
| Cash dividends declared | — |
| | (24.1 | ) | | — |
| | — |
| | — |
| | (24.1 | ) | — |
| | (12.0 | ) | | — |
| | — |
| | — |
| | (12.0 | ) |
| Distribution of GCP | — |
| | 54.7 |
| | — |
| | 135.3 |
| | (3.7 | ) | | 186.3 |
| — |
| | 59.9 |
| | — |
| | 135.3 |
| | (3.7 | ) | | 191.5 |
|
| Balance, September 30, 2016 | $ | 490.4 |
| | $ | 616.1 |
| | $ | (673.6 | ) | | $ | 58.4 |
| | $ | 3.3 |
| | $ | 494.6 |
| |
| Balance, June 30, 2016 | | $ | 493.4 |
| | $ | 595.7 |
| | $ | (663.7 | ) | | $ | 60.4 |
| | $ | 3.2 |
| | $ | 489.0 |
|
| Balance, December 31, 2016 | | $ | 488.0 |
| | $ | 619.3 |
| | $ | (804.9 | ) | | $ | 66.4 |
| | $ | 3.6 |
| | $ | 372.4 |
|
| Net income (loss) | | — |
| | 86.8 |
| | — |
| | — |
| | (0.4 | ) | | 86.4 |
|
| Repurchase of common stock | | — |
| | — |
| | (30.0 | ) | | — |
| | — |
| | (30.0 | ) |
| Payments to taxing authorities in consideration of employee tax obligations relative to stock-based compensation arrangements | | (2.4 | ) | | — |
| | — |
| | — |
| | — |
| | (2.4 | ) |
| Stock based compensation | | 5.4 |
| | — |
| | — |
| | — |
| | — |
| | 5.4 |
|
| Exercise of stock options | | (17.0 | ) | | — |
| | 28.8 |
| | — |
| | — |
| | 11.8 |
|
| Shares issued | | 0.7 |
| | — |
| | — |
| | — |
| | — |
| | 0.7 |
|
| Other comprehensive (loss) income | | — |
| | — |
| | — |
| | (9.9 | ) | | — |
| | (9.9 | ) |
| Dividends declared | | — |
| | (28.8 | ) | | — |
| | — |
| | — |
| | (28.8 | ) |
| Balance, June 30, 2017 | | $ | 474.7 |
| | $ | 677.3 |
| | $ | (806.1 | ) | | $ | 56.5 |
| | $ | 3.2 |
| | $ | 405.6 |
|
The Notes to Consolidated Financial Statements are an integral part of these statements.
9
Notes to Consolidated Financial Statements
1. Basis of Presentation and Summary of Significant Accounting and Financial Reporting Policies
W. R. Grace & Co., through its subsidiaries, is engaged in specialty chemicals and specialty materials businesses on a global basis through two reportable segments: Grace Catalysts Technologies, which includes catalysts and related products and technologies used in refining, petrochemical and other chemical manufacturing applications; and Grace Materials Technologies, which includes specialty materials, including silica-based and silica-alumina-based materials, used in coatings, consumer, industrial, and pharmaceutical applications.
W. R. Grace & Co. conducts all of its business through a single wholly owned subsidiary, W. R. Grace & Co.–Conn. ("Grace–Conn."). Grace–Conn. owns all of the assets, properties and rights of W. R. Grace & Co. on a consolidated basis, either directly or through subsidiaries.
As used in these notes, the term "Company" refers to W. R. Grace & Co. The term "Grace" refers to the Company and/or one or more of its subsidiaries and, in certain cases, their respective predecessors.
Separation Transaction On February 5, 2015, Grace announced a plan to separate into two independent, publicly traded companies, intended to improve Grace's strategic focus, simplify its operating structure, and allow for more efficient capital allocation. On January 27, 2016, Grace entered into a separation agreement with GCP Applied Technologies Inc., then a wholly-owned subsidiary of Grace ("GCP"), pursuant to which Grace agreed to transfer its Grace Construction Products operating segment and the packaging technologies business of its Grace Materials Technologies operating segment to GCP (the "Separation"). TheGrace and GCP completed the Separation occurred on February 3, 2016 (the "Distribution Date"), by means of a pro rata distribution to the Company's stockholders of all of the outstanding shares of GCP common stock (the "Distribution"). Under the Distribution,, with one share of GCP common stock was distributed for each share of Company common stock held as of the close of business on January 27, 2016. As a result of the Distribution, GCP is nowbecame an independent public company and its common stock is listed under the symbol “GCP” on the New York Stock Exchange.company. GCP’s historical financial results through the Distribution Date are reflected in Grace’s Consolidated Financial Statements as discontinued operations.
Basis of Presentation The interim Consolidated Financial Statements presented herein are unaudited and should be read in conjunction with the Consolidated Financial Statements presented in the Company's 20152016 Annual Report on Form 10-K. Such interim Consolidated Financial Statements reflect all adjustments that, in the opinion of management, are necessary for a fair statement of the results of the interim periods presented; all such adjustments are of a normal recurring nature except for the impacts of adopting new accounting standards as discussed below. All significant intercompany accounts and transactions have been eliminated.
The results of operations for the nine-monthsix-month interim period ended SeptemberJune 30, 20162017, are not necessarily indicative of the results of operations to be attained for the year ending December 31, 20162017.
Use of Estimates The preparation of financial statements in conformity with U.S. generally accepted accounting principles ("U.S. GAAP") requires management to make estimates and assumptions that affect the reported amount of assets and liabilities and disclosure of contingent assets and liabilities at the date of the Consolidated Financial Statements, and the reported amounts of revenues and expenses for the periods presented. Actual amounts could differ from those estimates, and the differences could be material. Changes in estimates are recorded in the period identified. Grace's accounting measurements that are most affected by management's estimates of future events are:
Realization values of net deferred tax assets, which depend on projections of future taxable income (see Note 5);
Pension and postretirement liabilities, thatwhich depend on assumptions regarding participant life spans, future inflation, discount rates and total returns on invested funds (see Note 6);
Carrying values of goodwill and other intangible assets, which depend on assumptions of future earnings and cash flows; and
Contingent liabilities, which depend on an assessment of the probability of loss and an estimate of ultimate obligation, such as litigation (see Note 8), income taxes (see Note 5), and environmental remediation (see Note 8).
Reclassifications Certain amounts in prior years' Consolidated Financial Statements have been reclassified to conform to the current year presentation. Such reclassifications have not materially affected previously reported amounts in the Consolidated Financial Statements.
Notes to Consolidated Financial Statements (Continued)
1. Basis of Presentation and Summary of Significant Accounting and Financial Reporting Policies (Continued)
Recently Issued Accounting Standards In May 2014, the FASB issued ASU 2014-09 "Revenue from Contracts with Customers." This update is intended to remove inconsistencies and weaknesses in revenue requirements; provide a more robust framework for addressing revenue issues; improve comparability of revenue recognition practices across entities, industries, jurisdictions and capital markets; provide more useful information to users of financial statements through improved disclosure requirements; and simplify the preparation of financial statements by reducing the number of requirements to which an entity must refer. The new requirements were to beare effective for fiscal years beginning after December 15, 2016,2017, and for interim periods within those fiscal years, with early adoption not permitted. In August 2015, the FASB issued ASU 2015-14 "Revenue from Contracts with Customers—Deferral of the Effective Date," deferring the effective date by one year but permitting adoption as of the original effective date.permitted for fiscal years beginning after December 15, 2016. The revised standard allows for two methods of adoption: (a) full retrospective adoption, meaning the standard is applied to all periods presented, or (b) modified retrospective adoption, meaning the cumulative effect of applying the new standard is recognized as an adjustment to the opening retained earnings balance. Grace does not intend towill adopt the standard earlyin the 2018 first quarter. Grace has begun its preliminary assessment and is in the processidentifying specific areas of determining the adoption method as well as the effects the adoption will haveimpact on the Consolidated Financial Statements.
In July 2015, At this time, Grace cannot reasonably estimate the FASB issued ASU 2015-11 "Simplifying the Measurementeffect of Inventory." This update is part of the FASB's Simplification Initiative and is also intendedadoption. Grace has tentatively decided to enhance convergence with the International Accounting Standards Board's ("IASB") measurement of inventory. The update requires that inventory be measured at the lower of cost or net realizable value for entities using FIFO (first-in, first-out) or average cost methods. The new requirements are effective for fiscal years beginning after December 15, 2016, and for interim periods within those fiscal years, with early adoption permitted. Grace will adopt this standard when it becomes effectiveunder the modified retrospective approach and does not expect it to have a materialis still evaluating the effect on the Consolidated Financial Statements.its financial statements and disclosures.
In February 2016, the FASB issued ASU 2016-02 "Leases."Leases (Topic 842)." This update is intended to increase transparency and comparability among organizations by recognizing lease assets and lease liabilities on the balance sheet and disclosing key information about leasing arrangements. The core principle of Topic 842 is that a lessee should recognize the assets and liabilities that arise from leases. A lessee should recognize in the statement of financial position a liability to make lease payments (the lease liability) and a right-of-use asset representing its right to use the underlying asset for the lease term, including optional payments where they are reasonably certain to occur. The amendments in this update are effective for fiscal years beginning after December 15, 2018, including interim periods within those fiscal years, with early adoption permitted. Currently, as a lessee, Grace is a party to a number of leases which, under existing guidance, are classified as operating leases and not recorded on the balance sheet but are expensed as incurred. Under the new standard, many of these leases will be recorded on the Consolidated Balance Sheets. Grace will adopt the standard in 2019 and at this time cannot reasonably estimate the effect of adoption.
In November 2016, the FASB issued ASU 2016-18 "Statement of Cash Flows (Topic 230): Restricted Cash," which requires that a statement of cash flows explain the change during the period in the total of cash, cash equivalents, and amounts generally described as restricted cash or restricted cash equivalents. Therefore, amounts generally described as restricted cash and restricted cash equivalents should be included with cash and cash equivalents when reconciling the beginning-of-period and end-of-period total amounts shown on the statement of cash flows. The new requirements are effective for fiscal years beginning after December 15, 2017, and interim periods within those fiscal years, with early adoption permitted. Grace is currently evaluating itsthe timing of adoption and does not expect the update to have a material effect on the financial statementsConsolidated Financial Statements. As of June 30, 2017, and December 31, 2016, restricted cash included in the Consolidated Balance Sheets was $10.8 million and $10.0 million, respectively.
In January 2017, the FASB issued ASU 2017-01 "Business Combinations (Topic 805)," which provides a screen to determine when an integrated set of assets and activities is not a business. The screen requires that when substantially all of the fair value of the gross assets acquired (or disposed of) is concentrated in a single identifiable asset or a group of similar identifiable assets, the set is not a business. This screen reduces the number of transactions that need to be further evaluated. If the screen is not met, the amendments in this update (1) require that to be considered a business, a set must include, at a minimum, an input and a substantive process that together significantly contribute to the ability to create output and (2) remove the evaluation of whether a market participant could replace missing elements. The amendments in this update also narrow the definition of the term "output" so that the term is consistent with how outputs are described in Topic 606. Public business entities are required to apply the amendments in this update to annual periods beginning after December 15, 2017, including interim periods within those periods. Early application is permitted. Grace will evaluate the effect of the update at the time of any future acquisition or disposal.
Notes to Consolidated Financial Statements (Continued)
1. Basis of Presentation and Summary of Significant Accounting and Financial Reporting Policies (Continued)
In January 2017, the FASB issued ASU 2017-04 "Intangibles—Goodwill and Other (Topic 350)." This update modifies the concept of impairment from the condition that exists when the carrying amount of goodwill exceeds its implied fair value to the condition that exists when the carrying amount of a reporting unit exceeds its fair value. An entity no longer will determine goodwill impairment by calculating the implied fair value of goodwill by assigning the fair value of a reporting unit to all of its assets and liabilities as if that reporting unit had been acquired in a business combination ("Step 2"). Because these amendments eliminate Step 2 from the goodwill impairment test, they should reduce the cost and complexity of evaluating goodwill for impairment. Public business entities are required to adopt the amendments in this update for annual or any interim goodwill impairment tests in fiscal years beginning after December 15, 2019. Early adoption is permitted for interim or annual goodwill impairment tests performed on testing dates after January 1, 2017. Grace is currently evaluating the timing of adoption.adoption and does not expect the update to have a material effect on the Consolidated Financial Statements.
In March 2017, the FASB issued ASU 2017-07 "Compensation—Retirement Benefits (Topic 715)." This update requires that the service cost component of net benefit cost be presented with other compensation costs arising from services rendered. The remaining net benefit cost is either presented as a line item in the statement of operations outside of a subtotal for income from operations, if presented, or disclosed separately. Only the service cost component of net benefit expense can be capitalized. Public business entities are required to adopt the amendments in this update for fiscal years beginning after December 15, 2017. Grace is currently evaluating the update's effect on the Consolidated Financial Statements and will adopt the update in the 2018 first quarter.
In May 2017, the FASB issued ASU 2017-09 "Compensation—Stock Compensation (Topic 718)." This update clarifies the existing definition of the term "modification," which is currently defined as "a change in any of the terms or conditions of a share-based payment award." The update requires entities to account for modifications of share-based payment awards unless the (1) fair value, (2) vesting conditions and (3) classification as an equity instrument or a liability instrument of the modified award are the same as of the original award before modification. Public business entities are required to adopt the amendments in this update for fiscal years and interim periods beginning after December 15, 2017, with early adoption permitted. Grace does not currently have any modifications of share-based awards and will adopt the update when it becomes effective.
Recently Adopted Accounting StandardsIn July 2015, the FASB issued ASU 2015-11 "Simplifying the Measurement of Inventory." This update is part of the FASB's Simplification Initiative and is also intended to enhance convergence with the International Accounting Standards Board's ("IASB") measurement of inventory. The update requires that inventory be measured at the lower of cost or net realizable value for entities using FIFO (first-in, first-out) or average cost methods. The new requirements are effective for fiscal years beginning after December 15, 2016, and for interim periods within those fiscal years, with early adoption permitted. Grace adopted this update in the first quarter of 2017, and it did not have a material effect on the Consolidated Financial Statements.
In August 2016, the FASB issued ASU 2016-15 "Classification of Certain Cash Receipts and Cash Payments." This update is intended to reduce diversity in practice in how certain cash receipts and cash payments are presented and classified in the statement of cash flows. It addresses eight specific issues. The amendments in this update are effective for fiscal years beginning after December 15, 2017, and interim periods within those fiscal years, with early adoption permitted, includingpermitted. Grace adopted this update in an interim period, as of the beginning of the fiscal year. Grace is currently evaluating the timing of adoption2017 second quarter, and doesit did not expect it to have a material effect on the Consolidated Financial Statements.
Recently Adopted Accounting StandardsIn April 2014, the FASB issued ASU 2014-08 "Reporting Discontinued Operations and Disclosures of Disposals of Components of an Entity." This update is intended to change the requirements for reporting discontinued operations and enhance convergence of the FASB’s and the IASB reporting requirements for discontinued operations. Grace adopted this standard in the 2016 first quarter.
In April 2015, the FASB issued ASU 2015-03 "Simplifying the Presentation of Debt Issuance Costs." This update is part of the FASB's Simplification Initiative and is also intended to enhance convergence with the IASB's treatment of debt issuance costs. The update requires that debt issuance costs related to a recognized debt liability be presented in the balance sheet as a direct deduction from the carrying amount of that debt liability, consistent with debt discounts. In August 2015, the FASB issued ASU 2015-15 "Presentation and Subsequent Measurement of Debt Issuance Costs Associated with Line-of-Credit Arrangements." The update clarifies ASU 2015-03, allowing debt issuance costs related to line of credit arrangements to be deferred and presented as an asset and subsequently amortized ratably over the term of the line-of-credit arrangement, regardless of whether
Notes to Consolidated Financial Statements (Continued)
1. Basis of Presentation and Summary of Significant Accounting and Financial Reporting Policies (Continued)
there are any outstanding borrowings on the line-of-credit arrangement. Grace adopted this standard in the 2016 first quarter and reclassified $30.3 million of capitalized financing fees from other assets to debt payable after one year in the Consolidated Balance Sheet as of December 31, 2015.
In September 2015, the FASB issued ASU 2015-16 "Simplifying the Accounting for Measurement-Period Adjustments," which is part of the FASB's Simplification Initiative. The update requires that adjustments to provisional amounts that are identified during the measurement period following a business combination be recognized in the reporting period in which the adjustment amounts are determined. Acquirers must also recognize, in the same period's financial statements, the effect on earnings of changes in depreciation, amortization, or other income effects resulting from the change to the provisional amounts, calculated as if the accounting had been completed at the acquisition date. Grace adopted this standard in the 2016 third quarter. See Note 16.
Accounting for Stock Compensation
In March 2016, the FASB issued ASU 2016-09 "Compensation—Stock Compensation," which is part of the FASB's Simplification Initiative. The update requires that excess tax benefits and deficiencies be recorded in the income statement when the awards vest or are settled. It also eliminates the requirement that excess tax benefits be realized (reduce cash taxes payable) before being recognized. Previously, an entity could not recognize excess tax benefits if the tax deduction increased a net operating loss ("NOL") or tax credit carryforward. The updated standard no longer requires cash flows related to excess tax benefits to be presented as a financing activity separate from other income tax cash flows. The update also allows Grace to repurchase more of an employee's shares for tax withholding purposes without triggering liability accounting, clarifies that all cash payments to taxing authorities made on an employee's behalf for withheld shares should be presented as a financing activity on the statement of cash flows, and provides for an accounting policy election to account for forfeitures as they occur.
Grace elected to early adopt this update in the 2016 second quarter, which requires any adjustments to be reflected as of January 1, 2016. This resulted in the recognition of excess tax benefits on the Consolidated Balance Sheet that were previously not recognized, as the benefits would have increased Grace's NOL or tax credit carryforwards. The recognition increased Grace's net deferred tax asset by $70.4 million ($90.9 million net of a $20.5 million valuation allowance) as of January 1, 2016. Previously reported amounts have been corrected for a $0.3 million increase in the gross amount of excess tax benefits and a $2.2 million increase in the valuation allowance on these excess tax benefits as of January 1, 2016, which Grace concluded were not material to the prior period.
In addition, Grace will recognize excess tax benefits in the provision for income taxes rather than paid-in capital for 2016 and future periods. Grace has elected to continue to estimate forfeitures expected to occur to determine the amount of compensation expense to be recognized each period.
2. Inventories
Inventories are stated at the lower of cost or market, and cost is determined using FIFO. Inventories consisted of the following at September 30, 2016, and December 31, 2015:
|
| | | | | | | |
| (In millions) | September 30,
2016 | | December 31,
2015 |
| Raw materials | $ | 56.6 |
| | $ | 47.1 |
|
| In process | 35.2 |
| | 33.4 |
|
| Finished products | 122.7 |
| | 98.2 |
|
| Other | 21.6 |
| | 20.1 |
|
| | $ | 236.1 |
| | $ | 198.8 |
|
Notes to Consolidated Financial Statements (Continued)
3. Debt2. Inventories
Inventories are stated at the lower of cost or net realizable value, and cost is determined using FIFO. Inventories consisted of the following at June 30, 2017, and December 31, 2016:
|
| | | | | | | |
| (In millions) | June 30,
2017 | | December 31,
2016 |
| Raw materials | $ | 55.3 |
| | $ | 57.7 |
|
| In process | 36.0 |
| | 33.4 |
|
| Finished products | 123.1 |
| | 115.8 |
|
| Other | 22.1 |
| | 21.1 |
|
| | $ | 236.5 |
| | $ | 228.0 |
|
3. Debt
Components of Debt
| | | (In millions) | September 30,
2016 | | December 31,
2015 | June 30,
2017 | | December 31,
2016 |
| 5.125% senior notes due 2021, net of unamortized debt issuance costs of $7.8 at September 30, 2016 (2015—$8.9) | $ | 692.2 |
| | $ | 691.1 |
| |
| U.S. dollar term loan, net of unamortized debt issuance costs and discounts of $6.1 at September 30, 2016 (2015—$15.6) | 402.3 |
| | 919.3 |
| |
| 5.625% senior notes due 2024, net of unamortized debt issuance costs of $4.1 at September 30, 2016 (2015—$4.5) | 295.9 |
| | 295.5 |
| |
| Euro term loan, net of unamortized debt issuance costs and discounts of $1.4 at September 30, 2016 (2015—$3.4) | 88.2 |
| | 158.7 |
| |
| Debt payable—unconsolidated affiliate | 38.9 |
| | 33.4 |
| |
| 5.125% senior notes due 2021, net of unamortized debt issuance costs of $6.6 at June 30, 2017 (2016—$7.3) | | $ | 693.4 |
| | $ | 692.7 |
|
| U.S. dollar term loan, net of unamortized debt issuance costs and discounts of $5.1 at June 30, 2017 (2016—$5.7) | | 403.3 |
| | 402.7 |
|
| 5.625% senior notes due 2024, net of unamortized debt issuance costs of $3.7 at June 30, 2017 (2016—$4.0) | | 296.3 |
| | 296.0 |
|
| Euro term loan, net of unamortized debt issuance costs and discounts of $1.1 at June 30, 2017 (2016—$1.3) | | 89.9 |
| | 82.5 |
|
| Revolving credit facility | | 40.0 |
| | — |
|
| Debt payable to unconsolidated affiliate | | 40.0 |
| | 39.5 |
|
| Deferred payment obligation | 29.7 |
| | 29.1 |
| — |
| | 30.0 |
|
| Other borrowings(1) | 43.0 |
| | 45.7 |
| 40.1 |
| | 40.7 |
|
| Total debt | 1,590.2 |
| | 2,172.8 |
| 1,603.0 |
| | 1,584.1 |
|
| Less debt payable within one year | 77.1 |
| | 58.8 |
| 86.5 |
| | 76.5 |
|
| Debt payable after one year | $ | 1,513.1 |
| | $ | 2,114.0 |
| $ | 1,516.5 |
| | $ | 1,507.6 |
|
| Weighted average interest rates on total debt | 4.6 | % | | 4.1 | % | 4.6 | % | | 4.6 | % |
(1) Represents borrowings under various lines of credit and other borrowings, primarily by non-U.S. subsidiaries.
See Note 4 for a discussion of the fair value of Grace's debt.
The principal maturities of debt outstanding at SeptemberJune 30, 2016,2017, were as follows:
| | | | (In millions) | (In millions) |
| 2016 | $ | 42.5 |
| |
| 2017 | 37.7 |
| $ | 82.4 |
|
| 2018 | 7.7 |
| 8.4 |
|
| 2019 | 7.0 |
| 7.8 |
|
| 2020 | 5.8 |
| 6.6 |
|
| 2021 | | 1,191.7 |
|
| Thereafter | 1,489.5 |
| 306.1 |
|
| Total debt | $ | 1,590.2 |
| $ | 1,603.0 |
|
Notes to Consolidated Financial Statements (Continued)
3. Debt (Continued)
On January 30, 2015,February 3, 2017, Grace borrowed on its $250funded the PD trust with $30.0 million delayed draw term loan facility and usedin respect of the funds, together with cash on hand,deferred payment obligation relating to repurchase the warrant issued to the asbestos personal injury trust for $490 million.ZAI PD Claims. (See Note 8 for Chapter 11 information.8.)
Grace had no outstanding draws on its revolving credit facility asAs of SeptemberJune 30, 2016; however,2017, the available credit under thatthe $300 million revolving credit facility was reduced to $253.8$222.3 million by a $40.0 million outstanding draw and by outstanding letters of credit.
During the 2015 fourth2016 first quarter, to permit the Separation, Grace entered into an amendment to the credit agreement providing for the term loans. The amendment, which became effective upon completion of the Separation, revised certain covenants, reduced the revolving credit facility limit to $300 million and extended the facility's term to November 1, 2020. The Separation had no impact on payment or other terms of the senior notes, which remained obligations of Grace.
Inin connection with the Separation, GCP distributed $750 million to Grace. Grace used $600 million of those funds to repay $526.9 million of its U.S. dollar term loan and €67.3 million of its euro term loan. As a result, Grace recorded a loss on early extinguishment of debt of $11.1 million, which is included in "other (income) expense"expense, net" in the Consolidated Statements of Operations.
Notes to Consolidated Financial Statements (Continued)
4. Fair Value Measurements and Risk
Certain of Grace's assets and liabilities are reported at fair value on a gross basis. ASC 820 "Fair Value Measurements and Disclosures" defines fair value as the value that would be received at the measurement date in the principal or "most advantageous" market. Grace uses principal market data, whenever available, to value assets and liabilities that are required to be reported at fair value.
Grace has identified the following financial assets and liabilities that are subject to the fair value analysis required by ASC 820:
Fair Value of Debt and Other Financial Instruments Debt payable is recorded at carrying value. Fair value is determined based on Level 2 inputs, including expected future cash flows (discounted at market interest rates), estimated current market prices and quotes from financial institutions.
At SeptemberJune 30, 20162017, the carrying amounts and fair values of Grace's debt were as follows:
| | | | September 30, 2016 | | December 31, 2015 | June 30, 2017 | | December 31, 2016 |
| (In millions) | Carrying Amount | | Fair Value | | Carrying Amount | | Fair Value | Carrying Amount | | Fair Value | | Carrying Amount | | Fair Value |
| 5.125% senior notes due 2021(1) | $ | 692.2 |
| | $ | 738.9 |
| | $ | 691.1 |
| | $ | 701.5 |
| $ | 693.4 |
| | $ | 745.4 |
| | $ | 692.7 |
| | $ | 721.3 |
|
| U.S. dollar term loan(2) | 402.3 |
| | 402.8 |
| | 919.3 |
| | 907.2 |
| 403.3 |
| | 402.8 |
| | 402.7 |
| | 408.2 |
|
| 5.625% senior notes due 2024(1) | 295.9 |
| | 324.8 |
| | 295.5 |
| | 298.1 |
| 296.3 |
| | 318.5 |
| | 296.0 |
| | 311.5 |
|
| Euro term loan(2) | 88.2 |
| | 87.7 |
| | 158.7 |
| | 157.3 |
| 89.9 |
| | 89.9 |
| | 82.5 |
| | 82.0 |
|
| Other borrowings | 111.6 |
| | 111.6 |
| | 108.2 |
| | 108.2 |
| 120.1 |
| | 120.1 |
| | 110.2 |
| | 110.2 |
|
| Total debt | $ | 1,590.2 |
| | $ | 1,665.8 |
| | $ | 2,172.8 |
| | $ | 2,172.3 |
| $ | 1,603.0 |
| | $ | 1,676.7 |
| | $ | 1,584.1 |
| | $ | 1,633.2 |
|
| |
| (1) | Carrying amounts are net of unamortized debt issuance costs of $7.8$6.6 million and $4.1$3.7 million as of SeptemberJune 30, 2016,2017, and $8.9$7.3 million and $4.5$4.0 million as of December 31, 2015,2016, related to the 5.125% senior notes due 2021 and 5.625% senior notes due 2024, respectively. |
| |
| (2) | Carrying amounts are net of unamortized debt issuance costs and discounts of $6.1$5.1 million and $1.4$1.1 million as of SeptemberJune 30, 2016,2017, and $15.6$5.7 million and $3.4$1.3 million as of December 31, 2015,2016, related to the U.S. dollar term loan and euro term loan, respectively. |
At SeptemberJune 30, 20162017, the recorded values of other financial instruments such as cash equivalents and trade receivables and payables approximated their fair values, based on the short-term maturities and floating rate characteristics of these instruments.
Commodity DerivativesFrom time to time, Grace enters into commodity derivatives such as fixed-rate swaps or options with financial institutions to mitigate the risk of volatility of prices of natural gas or other commodities. Under fixed-rate swaps, Grace locks in a fixed rate with a financial institution for future purchases, purchases its commodity from a supplier at the prevailing market rate, and then settles with the bank for any difference in the rates, thereby "swapping" a variable rate for a fixed rate.
The valuation of Grace's fixed-rate natural gas swaps was determined using a market approach, based on natural gas futures trading prices quoted on the New York Mercantile Exchange. Commodity fixed-rate swaps with maturities of not more than 15 months are used and designated as cash flow hedges of forecasted purchases of natural gas. The effective portion of the gain or loss on the commodity contracts is recorded in "accumulated other comprehensive income (loss)" and reclassified into income in the same period or periods that the underlying commodity purchase affects income. At September 30, 2016, there were no open fixed-rate natural gas swaps.
The valuation of Grace's fixed-rate aluminum swaps was determined using a market approach, based on aluminum futures trading prices quoted on the London Metal Exchange. Commodity fixed-rate swaps with maturities of not more than 15 months are used and designated as cash flow hedges of forecasted purchases of aluminum. Current open contracts hedge forecasted transactions until May 2017. The effective portion of the gain or loss on the commodity contracts is recorded in "accumulated other comprehensive income (loss)" and reclassified into income in the same period or periods that the underlying commodity purchase affects income. At
Notes to Consolidated Financial Statements (Continued)
4. Fair Value Measurements and Risk (Continued)
September 30, 2016, the contract volume, or notional amount, of the commodity contracts was 1.3 million pounds with a total contract value of $1.0 million.
Currency Derivatives Because Grace conducts businessoperates and/or sells to customers in over 4060 countries and in more than 30 currencies, its results are exposed to fluctuations in currency exchange rates. Grace seeks to minimize exposure to these fluctuations by matching sales in volatile currencies with expenditures in the same currencies, but it is not always possible to do so. From time to time, Grace will use financial instruments such as currency forward contracts, options, swaps, or combinations thereof to reduce the risk of certain specific transactions. However, Grace does not have a policy of hedging all exposures, because management does not believe that such a level of hedging would be cost-effective. Forward contracts with maturities of not more than 12 months are used and designated as cash flow hedges of forecasted repayments of intercompany loans. The effective portion of gains and losses on these currency hedges is recorded in "accumulated other comprehensive income (loss)" and reclassified into "other (income) expense" when these derivatives mature.
The valuation of Grace's currency exchange rate forward contracts and swaps is determined using both a market approach and an income approach. Inputs used to value currency exchange rate forward contracts consist of: (1) spot rates, which are quoted by various financial institutions; (2) forward points, which are primarily affected by changes in interest rates; and (3) discount rates used to present value future cash flows, which are based on the London Interbank Offered Rate (LIBOR) curve or overnight indexed swap rates.
Debt and Interest Rate Swap Agreements Grace uses interest rate swaps designated as cash flow hedges to manage fluctuations in interest rates on variable rate debt. The effective portion of gains and losses on these interest rate cash flow hedges is recorded in "accumulated other comprehensive income (loss)" and reclassified into "interest expense and related financing costs" during the hedged interest period.
In connection with its emergence financing, Grace entered into an interest rate swap beginning on February 3, 2015, and maturing on February 3, 2020, fixing the LIBOR component of the interest on $250 million of Grace's term debt at a rate of 2.393%. The valuation of this interest rate swap is determined using both a market approach and an income approach, using prevailing market interest rates and discount rates to present value future cash flows based on the forward LIBOR yield curves.
The following tables present the fair value hierarchy for financial assets and liabilities measured at fair value on a recurring basis as of SeptemberJune 30, 20162017, and December 31, 20152016:
| | | | Fair Value Measurements at September 30, 2016, Using | Fair Value Measurements at June 30, 2017, Using |
(In millions) | Total | | Quoted Prices in Active Markets for Identical Assets or Liabilities (Level 1) | | Significant Other Observable Inputs (Level 2) | | Significant Unobservable Inputs (Level 3) | Total | | Quoted Prices in Active Markets for Identical Assets or Liabilities (Level 1) | | Significant Other Observable Inputs (Level 2) | | Significant Unobservable Inputs (Level 3) |
| Assets | | | | | | | | | | | | | | |
| Currency derivatives | $ | 2.9 |
| | $ | — |
| | $ | 2.9 |
| | $ | — |
| $ | 3.6 |
| | $ | — |
| | $ | 3.6 |
| | $ | — |
|
| Total Assets | $ | 2.9 |
| | $ | — |
| | $ | 2.9 |
| | $ | — |
| $ | 3.6 |
| | $ | — |
| | $ | 3.6 |
| | $ | — |
|
| Liabilities | | | | | | | | | | | | | | |
| Interest rate derivatives | $ | 10.6 |
| | $ | — |
| | $ | 10.6 |
| | $ | — |
| $ | 5.1 |
| | $ | — |
| | $ | 5.1 |
| | $ | — |
|
| Currency derivatives | 6.0 |
| | — |
| | 6.0 |
| | — |
| 11.6 |
| | — |
| | 11.6 |
| | — |
|
| Total Liabilities | $ | 16.6 |
| | $ | — |
| | $ | 16.6 |
| | $ | — |
| $ | 16.7 |
| | $ | — |
| | $ | 16.7 |
| | $ | — |
|
Notes to Consolidated Financial Statements (Continued)
4. Fair Value Measurements and Risk (Continued)
| | | | Fair Value Measurements at December 31, 2015, Using | Fair Value Measurements at December 31, 2016, Using |
(In millions) | Total | | Quoted Prices in Active Markets for Identical Assets or Liabilities (Level 1) | | Significant Other Observable Inputs (Level 2) | | Significant Unobservable Inputs (Level 3) | Total | | Quoted Prices in Active Markets for Identical Assets or Liabilities (Level 1) | | Significant Other Observable Inputs (Level 2) | | Significant Unobservable Inputs (Level 3) |
| Assets | | | | | | | | | | | | | | |
| Currency derivatives | $ | 1.0 |
| | $ | — |
| | $ | 1.0 |
| | $ | — |
| $ | 8.8 |
| | $ | — |
| | $ | 8.8 |
| | $ | — |
|
| Commodity derivatives | 0.6 |
| | — |
| | 0.6 |
| | — |
| |
| Total Assets | $ | 1.6 |
| | $ | — |
| | $ | 1.6 |
| | $ | — |
| $ | 8.8 |
| | $ | — |
| | $ | 8.8 |
| | $ | — |
|
| Liabilities | | | | | | | | | | | | | | |
| Interest rate derivatives | $ | 7.9 |
| | $ | — |
| | $ | 7.9 |
| | $ | — |
| $ | 6.0 |
| | $ | — |
| | $ | 6.0 |
| | $ | — |
|
| Commodity derivatives | 0.1 |
| | — |
| | 0.1 |
| | — |
| |
| Currency derivatives | 0.5 |
| | — |
| | 0.5 |
| | — |
| 0.9 |
| | — |
| | 0.9 |
| | — |
|
| Total Liabilities | $ | 8.5 |
| | $ | — |
| | $ | 8.5 |
| | $ | — |
| $ | 6.9 |
| | $ | — |
| | $ | 6.9 |
| | $ | — |
|
The following tables present the location and fair values of derivative instruments included in the Consolidated Balance Sheets as of SeptemberJune 30, 20162017, and December 31, 20152016:
| | September 30, 2016
(In millions) | Asset Derivatives | | Liability Derivatives | |
Balance Sheet Location | | Fair Value | | Balance Sheet Location | | Fair Value | |
June 30, 2017
(In millions) | | Asset Derivatives | | Liability Derivatives |
| Balance Sheet Location | | Fair Value | | Balance Sheet Location | | Fair Value |
| Derivatives designated as hedging instruments under ASC 815: | | | | | | | | | | | | | | |
| Currency contracts | Other current assets | | $ | 2.8 |
| | Other current liabilities | | $ | 0.4 |
| Other current assets | | $ | 3.0 |
| | Other current liabilities | | $ | 0.4 |
|
| Interest rate contracts | Other current assets | | — |
| | Other current liabilities | | 4.1 |
| Other current assets | | — |
| | Other current liabilities | | 1.9 |
|
| Currency contracts | Other assets | | — |
| | Other liabilities | | 5.4 |
| Other assets | | — |
| | Other liabilities | | 10.5 |
|
| Interest rate contracts | Other assets | | — |
| | Other liabilities | | 6.5 |
| Other assets | | — |
| | Other liabilities | | 3.2 |
|
| Derivatives not designated as hedging instruments under ASC 815: | | | | | | | | | | | | | | |
| Currency contracts | Other current assets | | 0.1 |
| | Other current liabilities | | 0.2 |
| Other current assets | | 0.6 |
| | Other current liabilities | | 0.7 |
|
| Total derivatives | | | $ | 2.9 |
| | | | $ | 16.6 |
| | | $ | 3.6 |
| | | | $ | 16.7 |
|
| | December 31, 2015
(In millions) | Asset Derivatives | | Liability Derivatives | |
Balance Sheet Location | | Fair Value | | Balance Sheet Location | | Fair Value | |
December 31, 2016
(In millions) | | Asset Derivatives | | Liability Derivatives |
| Balance Sheet Location | | Fair Value | | Balance Sheet Location | | Fair Value |
| Derivatives designated as hedging instruments under ASC 815: | | | | | | | | | | | | | | |
| Commodity contracts | Other current assets | | $ | 0.6 |
| | Other current liabilities | | $ | 0.1 |
| |
| Currency contracts | Other current assets | | 0.7 |
| | Other current liabilities | | 0.3 |
| Other current assets | | $ | 4.0 |
| | Other current liabilities | | $ | — |
|
| Interest rate contracts | Other current assets | | — |
| | Other current liabilities | | 4.1 |
| Other current assets | | — |
| | Other current liabilities | | 2.8 |
|
| Currency contracts | Other assets | | 0.2 |
| | Other liabilities | | — |
| Other assets | | 4.0 |
| | Other liabilities | | — |
|
| Interest rate contracts | Other assets | | — |
| | Other liabilities | | 3.8 |
| Other assets | | — |
| | Other liabilities | | 3.2 |
|
| Derivatives not designated as hedging instruments under ASC 815: | | | | | | | | | | | | | | |
| Currency contracts | Other current assets | | 0.1 |
| | Other current liabilities | | 0.2 |
| Other current assets | | 0.8 |
| | Other current liabilities | | 0.9 |
|
| Total derivatives | | | $ | 1.6 |
| | | | $ | 8.5 |
| | | $ | 8.8 |
| | | | $ | 6.9 |
|
Notes to Consolidated Financial Statements (Continued)
4. Fair Value Measurements and Risk (Continued)
The following tables present the location and amount of gains and losses on derivative instruments included in the Consolidated Statements of Operations or, when applicable, gains and losses initially recognized in other comprehensive income (loss) ("OCI") for the three and ninesix months ended SeptemberJune 30, 20162017 and 20152016:
| | Three Months Ended September 30, 2016
(In millions) | Amount of Gain (Loss) Recognized in OCI on Derivatives (Effective Portion) | | Location of Gain (Loss) Reclassified from Accumulated OCI into Income (Effective Portion) | | Amount of Gain (Loss) Reclassified from OCI into Income (Effective Portion) | |
Three Months Ended June 30, 2017
(In millions) | | Amount of Gain (Loss) Recognized in OCI on Derivatives (Effective Portion) | | Location of Gain (Loss) Reclassified from Accumulated OCI into Income (Effective Portion) | | Amount of Gain (Loss) Reclassified from OCI into Income (Effective Portion) |
| Derivatives in ASC 815 cash flow hedging relationships: | Derivatives in ASC 815 cash flow hedging relationships: | | | | | Derivatives in ASC 815 cash flow hedging relationships: | | | | |
| Interest rate contracts | $ | 0.6 |
| | Interest expense | | $ | (1.0 | ) | $ | (1.1 | ) | | Interest expense | | $ | (0.8 | ) |
| Currency contracts | (0.4 | ) | | Other expense | | 0.3 |
| — |
| | Other expense | | (0.1 | ) |
| Commodity contracts | (0.1 | ) | | Cost of goods sold | | (0.1 | ) | |
| Total derivatives | $ | 0.1 |
| | | | $ | (0.8 | ) | $ | (1.1 | ) | | | | $ | (0.9 | ) |
| | | | | |
| | | Location of Gain (Loss) Recognized in Income on Derivatives | | Amount of Gain (Loss) Recognized in Income on Derivatives | |
| Derivatives not designated as hedging instruments under ASC 815: | | | | | |
| Currency contracts | | Other expense | | $ | 0.1 |
| |
|
| | | | | | | | | |
Nine Months Ended September 30, 2016
(In millions) | Amount of Gain (Loss) Recognized in OCI on Derivatives (Effective Portion) | | Location of Gain (Loss) Reclassified from Accumulated OCI into Income (Effective Portion) | | Amount of Gain (Loss) Reclassified from OCI into Income (Effective Portion) |
| Derivatives in ASC 815 cash flow hedging relationships: | | | | |
| Interest rate contracts | $ | (5.8 | ) | | Interest expense | | $ | (3.1 | ) |
| Currency contracts | (0.3 | ) | | Other expense | | 0.7 |
|
| Commodity contracts | (0.4 | ) | | Cost of goods sold | | 0.1 |
|
| Total derivatives | $ | (6.5 | ) | | | | $ | (2.3 | ) |
| | | | | | |
| | | Location of Gain (Loss) Recognized in Income on Derivatives | | Amount of Gain (Loss) Recognized in Income on Derivatives |
| Derivatives not designated as hedging instruments under ASC 815: | | | | |
| Currency contracts | | Other expense | | $ | (0.7 | ) |
Notes to Consolidated Financial Statements (Continued)
4. Fair Value Measurements and Risk (Continued)
|
| | | | | | | | | |
Six Months Ended June 30, 2017
(In millions) | Amount of Gain (Loss) Recognized in OCI on Derivatives (Effective Portion) | | Location of Gain (Loss) Reclassified from Accumulated OCI into Income (Effective Portion) | | Amount of Gain (Loss) Reclassified from OCI into Income (Effective Portion) |
| Derivatives in ASC 815 cash flow hedging relationships: | | | | |
| Interest rate contracts | $ | (1.0 | ) | | Interest expense | | $ | (1.7 | ) |
| Currency contracts | (0.1 | ) | | Other expense | | (0.1 | ) |
| Total derivatives | $ | (1.1 | ) | | | | $ | (1.8 | ) |
| | Three Months Ended September 30, 2015
(In millions) | Amount of Gain (Loss) Recognized in OCI on Derivatives
(Effective Portion) | | Location of Gain (Loss) Reclassified from Accumulated OCI into Income
(Effective Portion) | | Amount of Gain (Loss) Reclassified from OCI into Income
(Effective Portion) | |
Three Months Ended June 30, 2016
(In millions) | | Amount of Gain (Loss) Recognized in OCI on Derivatives
(Effective Portion) | | Location of Gain (Loss) Reclassified from Accumulated OCI into Income
(Effective Portion) | | Amount of Gain (Loss) Reclassified from OCI into Income
(Effective Portion) |
| Derivatives in ASC 815 cash flow hedging relationships: | Derivatives in ASC 815 cash flow hedging relationships: | | | | | Derivatives in ASC 815 cash flow hedging relationships: | | | | |
| Interest rate contracts | $ | (4.1 | ) | | Interest expense | | $ | (1.1 | ) | $ | (1.9 | ) | | Interest expense | | $ | (1.1 | ) |
| Currency contracts | (0.6 | ) | | Other expense | | (1.0 | ) | 0.2 |
| | Other expense | | (0.1 | ) |
| Commodity contracts | (0.6 | ) | | Cost of goods sold | | (0.9 | ) | |
| Total derivatives | $ | (5.3 | ) | | | | $ | (3.0 | ) | $ | (1.7 | ) | | | | $ | (1.2 | ) |
| | | | | |
| | | Location of Gain (Loss) Recognized in Income on Derivatives | | Amount of Gain (Loss) Recognized in Income on Derivatives | |
| Derivatives not designated as hedging instruments under ASC 815: | | | | | |
| Currency contracts | | Other expense | | $ | — |
| |
| | Nine Months Ended September 30, 2015
(In millions) | Amount of Gain (Loss) Recognized in OCI on Derivatives
(Effective Portion) | | Location of Gain (Loss) Reclassified from Accumulated OCI into Income
(Effective Portion) | | Amount of Gain (Loss) Reclassified from OCI into Income
(Effective Portion) | |
Six Months Ended June 30, 2016
(In millions) | | Amount of Gain (Loss) Recognized in OCI on Derivatives
(Effective Portion) | | Location of Gain (Loss) Reclassified from Accumulated OCI into Income
(Effective Portion) | | Amount of Gain (Loss) Reclassified from OCI into Income
(Effective Portion) |
| Derivatives in ASC 815 cash flow hedging relationships: | Derivatives in ASC 815 cash flow hedging relationships: | | | | | Derivatives in ASC 815 cash flow hedging relationships: | | | | |
| Interest rate contracts | $ | (7.0 | ) | | Interest expense | | $ | (2.8 | ) | $ | (6.4 | ) | | Interest expense | | $ | (2.1 | ) |
| Currency contracts | 0.6 |
| | Other expense | | 0.2 |
| 0.1 |
| | Other expense | | 0.4 |
|
| Commodity contracts | (1.6 | ) | | Cost of goods sold | | (3.0 | ) | |
| Total derivatives | $ | (8.0 | ) | | | | $ | (5.6 | ) | $ | (6.3 | ) | | | | $ | (1.7 | ) |
| | | | | |
| | | Location of Gain (Loss) Recognized in Income on Derivatives | | Amount of Gain (Loss) Recognized in Income on Derivatives | |
| Derivatives not designated as hedging instruments under ASC 815: | | | | | |
| Currency contracts | | Other expense | | $ | (0.2 | ) | |
Net Investment Hedges Grace uses foreign currency denominated debt as nonderivative hedging instruments in certain net investment hedges. The effective portion of gains and losses attributable to these net investment hedges is recorded to "currency translation adjustments" within "accumulated other comprehensive income (loss)." Recognition in earnings of amounts previously recorded to "currency translation adjustments" is limited to circumstances such as complete or substantially complete liquidation of the net investment in the hedged foreign operation. At September 30, 2016, €80.1 million of Grace's term loan principal was designated as a hedging instrument of its net investment in European subsidiaries.
Grace also uses cross-currency swaps as derivative hedging instruments in certain net investment hedges of ourits non-U.S. subsidiaries. The effective portion of gains and losses attributable to these net investment hedges is recorded net of tax to "currency translation adjustments" within "accumulated other comprehensive income (loss)" to offset the change in the carrying value of the net investment being hedged. Recognition in earnings of amounts previously recorded to "currency translation adjustments" is limited to circumstances such as complete or substantially complete liquidation of the net investment in the hedged foreign operation. At SeptemberJune 30, 2016,2017, the notional amount of €170.0 million of Grace's cross-currency swaps was designated as a hedging instrument of its net investment in its European subsidiaries.
The following tables present the location and amount of gains and losses on nonderivative and derivative instruments designated as net investment hedges for the three and nine months ended September 30, 2016 and
Notes to Consolidated Financial Statements (Continued)
4. Fair Value Measurements and Risk (Continued)
2015.Grace also uses foreign currency denominated debt and deferred intercompany royalties as non-derivative hedging instruments in certain net investment hedges. The effective portion of gains and losses attributable to these net investment hedges is recorded to "currency translation adjustments" within "accumulated other comprehensive income (loss)." Recognition in earnings of amounts previously recorded to "currency translation adjustments" is limited to circumstances such as complete or substantially complete liquidation of the net investment in the hedged foreign operation. At June 30, 2017, €80.1 million of Grace's term loan principal was designated as a hedging instrument of its net investment in its European subsidiaries. At June 30, 2017, €45.0 million of Grace's deferred intercompany royalties was designated as a hedging instrument of its net investment in its European subsidiaries.
The following tables present the location and amount of gains and losses on derivative and non-derivative instruments designated as net investment hedges for the three and six months ended June 30, 2017 and 2016. There were no reclassifications of the effective portion of net investment hedges out of OCI and into earnings for the periods presented in the tables below.
|
| | | |
Three Months Ended September 30, 2016
(In millions) | Amount of Gain (Loss) Recognized in OCI in Currency Translation Adjustments (Effective Portion) |
| Derivatives in ASC 815 net investment hedging relationships: | |
| Cross-currency swap | $ | (1.8 | ) |
| Total derivatives | $ | (1.8 | ) |
| Nonderivatives in ASC 815 net investment hedging relationships: | |
| Foreign currency denominated debt | $ | (0.8 | ) |
| Total nonderivatives | $ | (0.8 | ) |
|
| | | |
Three Months Ended June 30, 2017
(In millions) | Amount of Gain (Loss) Recognized in OCI in Currency Translation Adjustments (Effective Portion) |
| Derivatives in ASC 815 net investment hedging relationships: | |
| Cross-currency swap | $ | (6.1 | ) |
| Non-derivatives in ASC 815 net investment hedging relationships: | |
| Foreign currency denominated debt | $ | (4.9 | ) |
| Foreign currency denominated deferred intercompany royalties | (2.9 | ) |
| | $ | (7.8 | ) |
|
| | | |
Nine Months Ended September 30, 2016
(In millions) | Amount of Gain (Loss) Recognized in OCI in Currency Translation Adjustments (Effective Portion) |
| Derivatives in ASC 815 net investment hedging relationships: | |
| Cross-currency swap | $ | (1.7 | ) |
| Total derivatives | $ | (1.7 | ) |
| Nonderivatives in ASC 815 net investment hedging relationships: | |
| Foreign currency denominated debt | $ | (1.2 | ) |
| Total nonderivatives | $ | (1.2 | ) |
|
| | | |
Six Months Ended June 30, 2017
(In millions) | Amount of Gain (Loss) Recognized in OCI in Currency Translation Adjustments (Effective Portion) |
| Derivatives in ASC 815 net investment hedging relationships: | |
| Cross-currency swap | $ | (8.6 | ) |
| Non-derivatives in ASC 815 net investment hedging relationships: | |
| Foreign currency denominated debt | $ | (7.2 | ) |
| Foreign currency denominated deferred intercompany royalties | (4.4 | ) |
| | $ | (11.6 | ) |
|
| | | |
Three Months Ended September 30, 2015
(In millions) | Amount of Gain (Loss) Recognized in OCI in Currency Translation Adjustments (Effective Portion) |
| Nonderivatives in ASC 815 net investment hedging relationships: | |
| Foreign currency denominated debt | $ | 0.1 |
|
| Total nonderivatives | $ | 0.1 |
|
|
| | | |
Three Months Ended June 30, 2016
(In millions) | Amount of Gain (Loss) Recognized in OCI in Currency Translation Adjustments (Effective Portion) |
| Derivatives in ASC 815 net investment hedging relationships: | |
| Cross-currency swap | $ | 0.1 |
|
| Non-derivatives in ASC 815 net investment hedging relationships: | |
| Foreign currency denominated debt | $ | 0.9 |
|
Notes to Consolidated Financial Statements (Continued)
4. Fair Value Measurements and Risk (Continued)
|
| | | |
Nine Months Ended September 30, 2015
(In millions) | Amount of Gain (Loss) Recognized in OCI in Currency Translation Adjustments (Effective Portion) |
| Nonderivatives in ASC 815 net investment hedging relationships: | |
| Foreign currency denominated debt | $ | 15.3 |
|
| Total nonderivatives | $ | 15.3 |
|
|
| | | |
Six Months Ended June 30, 2016
(In millions) | Amount of Gain (Loss) Recognized in OCI in Currency Translation Adjustments (Effective Portion) |
| Derivatives in ASC 815 net investment hedging relationships: | |
| Cross-currency swap | $ | 0.1 |
|
| Non-derivatives in ASC 815 net investment hedging relationships: | |
| Foreign currency denominated debt | $ | (0.5 | ) |
Credit Risk Grace is exposed to credit risk in its trade accounts receivable. Customers in the petroleum refining industry represent the greatest exposure. Grace's credit evaluation policies mitigate credit risk exposures, and it has a history of minimal credit losses mitigate credit risk exposures.losses. Grace does not generally require collateral for its trade accounts receivable but may require a bank letter of credit in certain instances, particularly when selling to customers in cash-restricted countries.
Notes to Consolidated Financial Statements (Continued)
4. Fair Value Measurements and Risk (Continued)
Grace may also be exposed to credit risk in its derivatives contracts. Grace monitors counterparty credit risk and currently does not anticipate nonperformance by counterparties to its derivatives. Grace's derivative contracts are with internationally recognized commercial financial institutions.
5. Income Taxes
The annualized effective tax rate on 2016 forecasted income from continuing operations is estimated to be 38.0%32.1% as of SeptemberJune 30, 2016,2017, compared with 36.0%35.6% for the year ended December 31, 2015.2016. The 2017 tax rate includes a discrete benefit of $3.0 million for share-based compensation deductions offset by a charge of $1.1 million for a tax law change in Tennessee. The 2016 tax rate includes a $12.8included $10.1 million in discrete charge forcharges caused by an increase in the valuation allowance associated with Grace's state NOL carryforwards, of which $8.8 million related to a Separation-related change in Grace's outlook for being able to use these NOLs and $4.0 million related to a Louisianaon deferred tax law change,assets, partially offset by a discrete benefit of $6.3$6.7 million for share-based compensation deductions related to the early adoption of ASU 2016-09.deductions.
Grace generated approximately $1,800 million in U.S. federal tax deductions relating to its emergence from bankruptcy. Thesebankruptcy in 2014. The deductions generated a U.S. federal and state NOL in 2014,NOLs, which Grace has carried forward and expects to utilize in subsequent years. Under U.S. federal income tax law, a corporation is generally permitted to carry forward NOLs for a 20-year period for deduction against future taxable income. Grace also expects to generate agenerated U.S. federal tax deductiondeductions of $30 million upon payment of the ZAI PD deferred payment obligation in 2017.the 2017 first quarter. (See Note 8.)
The following table summarizes the balance of deferred tax assets, net of deferred tax liabilities, at SeptemberJune 30, 2016,2017, of $714.6$697.3 million:
| | | | Deferred Tax Asset (Net of Liabilities) | | Valuation Allowance | | Net Deferred Tax Asset | Deferred Tax Asset (Net of Liabilities) | | Valuation Allowance | | Net Deferred Tax Asset |
United States—Federal(1) | $ | 660.7 |
| | $ | (20.8 | ) | | $ | 639.9 |
| $ | 627.1 |
| | $ | (17.7 | ) | | $ | 609.4 |
|
United States—States(1) | 55.2 |
| | (18.1 | ) | | 37.1 |
| 50.9 |
| | (11.2 | ) | | 39.7 |
|
| Germany | 30.9 |
| | — |
| | 30.9 |
| 42.7 |
| | — |
| | 42.7 |
|
| Other foreign | 9.3 |
| | (2.6 | ) | | 6.7 |
| 8.0 |
| | (2.5 | ) | | 5.5 |
|
| Total | $ | 756.1 |
| | $ | (41.5 | ) | | $ | 714.6 |
| $ | 728.7 |
| | $ | (31.4 | ) | | $ | 697.3 |
|
| |
(1) | The U.S. federal deductions generated relating to emergence of $1,800 million, plus the $30 million ZAI PD deferred payment obligation, account for a majority of the U.S. federal and state deferred tax assets. |
Grace will need to generate approximately $1,800$1,700 million of U.S. federal taxable income by 2035 (or approximately $95 million per year during the carryforward period) to fully realize the U.S. federal net deferred tax assets.
As discussed in
Notes 1 and 15, the Separation of Grace and GCP was completed on February 3, 2016. In conjunction with the Separation, approximately $85 million of Grace’s deferred tax assets were transferred to GCP. As a result of the early adoption of ASU 2016-09, Grace recognized excess tax benefits in the Consolidated Balance Sheets which were previously not recognized. This increased Grace's deferred tax assets as of January 1, 2016, by $70.4 million, which is net of a $20.5 million valuation allowance.Financial Statements (Continued)
5. Income Taxes (Continued)
The following table summarizes expiration dates in jurisdictions where Grace has, or will have, material tax loss and credit carryforwards:
|
| |
| | Expiration Dates |
| United States—Federal (NOLs) | 2034 - 2035 |
| United States—Federal (Credits) | 2019 - 20252027 |
| United States—States (NOLs) | 20162017 - 2035 |
Notes to Consolidated Financial Statements (Continued)
5. Income Taxes (Continued)
In evaluating its ability to realize its deferred tax assets, Grace considers all reasonably available positive and negative evidence, including recent earnings experience, expectations of future taxable income and the tax character of that income, the period of time over which the temporary differences become deductible and the carryforward and/or carryback periods available to Grace for tax reporting purposes in the related jurisdiction. In estimating future taxable income, Grace relies upon assumptions and estimates about future activities, including the amount of future federal, state and international pretax operating income that Grace will generate; the reversal of temporary differences; and the implementation of feasible and prudent tax planning strategies. Grace records a valuation allowance to reduce deferred tax assets to the amount that it believes is more likely than not to be realized. Through September 30, 2016, Grace increased its valuation allowance by $12.8 million related to state NOL carryforwards and $20.5 million primarily for foreign tax credits recognized upon the adoption of ASU 2016-09.
As of December 31, 2014, Grace had the intent and ability to indefinitely reinvest undistributed earnings of its foreign subsidiaries outside the United States. However, in connection with the Separation, Grace repatriated a total of $173.1 million of foreign earnings from foreign subsidiaries transferred to GCP pursuant to the Separation. Such amount was determined based on an analysis of each non-U.S. subsidiary's requirements for working capital, debt repayment and strategic initiatives. Grace also considered local country legal and regulatory restrictions. Grace included tax expense in discontinued operations of $19.0 million in 2015 for repatriation and $1.7 million in 2016 for deemed repatriation attributable to both current and prior years' earnings. The tax effect of the repatriation is determined by several variables including the tax rate applicable to the entity making the distribution, the cumulative earnings and associated foreign taxes of the entity and the extent to which those earnings may have already been taxed in the U.S.
Grace believes that the Separation was a one-time, non-recurring event and that recognition of deferred taxes on undistributed earnings would not have occurred if not for the Separation. Subsequent to separation, Grace expects undistributed prior-year earnings of its foreign subsidiaries to remain permanently reinvested except in certain instances where repatriation of such earnings would result in minimal or no tax. Grace bases this assertion on:
| |
(1) | the expectation that it will satisfy its U.S. cash obligations in the foreseeable future without requiring the repatriation of prior-year foreign earnings; |
| |
(2) | plans for significant and continued reinvestment of foreign earnings in organic and inorganic growth initiatives outside the U.S.; and |
| |
(3) | remittance restrictions imposed by local governments. |
Grace will continually analyze and evaluate its cash needs to determine the appropriateness of its indefinite reinvestment assertion.
6. Pension Plans and Other Postretirement Benefit Plans
Pension Plans The following table presents the funded status of Grace's fully-funded, underfunded and unfunded pension plans:
| | | (In millions) | September 30,
2016 | | December 31,
2015 | June 30,
2017 | | December 31,
2016 |
| Overfunded defined benefit pension plans | $ | 0.4 |
| | $ | — |
| |
| Underfunded defined benefit pension plans | (70.3 | ) | | (73.2 | ) | $ | (81.5 | ) | | $ | (83.1 | ) |
| Unfunded defined benefit pension plans | (308.7 | ) | | (304.3 | ) | (362.7 | ) | | (341.2 | ) |
| Total underfunded and unfunded defined benefit pension plans | (379.0 | ) | | (377.5 | ) | (444.2 | ) | | (424.3 | ) |
| Pension liabilities included in other current liabilities | (14.3 | ) | | (14.2 | ) | (15.0 | ) | | (14.4 | ) |
| Net funded status | $ | (392.9 | ) | | $ | (391.7 | ) | $ | (459.2 | ) | | $ | (438.7 | ) |
Underfunded plans include a group of advance-funded plans that are underfunded on a projected benefit obligation ("PBO") basis. Unfunded plans include several plans that are funded on a pay-as-you-go basis, and therefore, the entire PBO is unfunded.
Components of Net Periodic Benefit Cost (Income)
|
| | | | | | | | | | | | | | | | | | | | | | | |
| | Three Months Ended June 30, |
| | 2017 | | 2016 |
| | Pension | | Other Post Retirement | | Pension | | Other Post Retirement |
| (In millions) | U.S. | | Non-U.S. | | | U.S. | | Non-U.S. | |
| Service cost | $ | 4.3 |
| | $ | 2.0 |
| | $ | — |
| | $ | 4.4 |
| | $ | 1.7 |
| | $ | — |
|
| Interest cost | 10.5 |
| | 1.1 |
| | — |
| | 10.2 |
| | 1.3 |
| | — |
|
| Expected return on plan assets | (14.4 | ) | | (0.2 | ) | | — |
| | (14.2 | ) | | (0.3 | ) | | — |
|
| Amortization of prior service credit | (0.1 | ) | | — |
| | (0.5 | ) | | — |
| | — |
| | (0.6 | ) |
| Amortization of net deferred actuarial loss | — |
| | — |
| | 0.1 |
| | — |
| | — |
| | 0.1 |
|
| Curtailment gain | — |
| | — |
| | — |
| | — |
| | (0.7 | ) | | — |
|
| Net periodic benefit cost (income) from continuing operations | $ | 0.3 |
| | $ | 2.9 |
| | $ | (0.4 | ) | | $ | 0.4 |
| | $ | 2.0 |
| | $ | (0.5 | ) |
Notes to Consolidated Financial Statements (Continued)
6. Pension Plans and Other Postretirement Benefit Plans (Continued)
Fully-funded plans include several advance-funded plans where the fair value of the plan assets exceeds the projected benefit obligation ("PBO"). This group of plans was overfunded by $0.4 million as of September 30, 2016, and the overfunded status is included in "other assets" in the Consolidated Balance Sheets. Underfunded plans include a group of advance-funded plans that are underfunded on a PBO basis. Unfunded plans include several plans that are funded on a pay-as-you-go basis, and therefore, the entire PBO is unfunded. The combined balance of the underfunded and unfunded plans was $393.3 million as of September 30, 2016.
Components of Net Periodic Benefit Cost (Income)
|
| | | | | | | | | | | | | | | | | | | | | | | |
| | Three Months Ended September 30, |
| | 2016 | | 2015 |
| | Pension | | Other Post Retirement | | Pension | | Other Post Retirement |
| (In millions) | U.S. | | Non-U.S. | | | U.S. | | Non-U.S. | |
| Service cost | $ | 4.5 |
| | $ | 1.7 |
| | $ | — |
| | $ | 6.4 |
| | $ | 3.0 |
| | $ | — |
|
| Interest cost | 10.1 |
| | 1.3 |
| | — |
| | 13.7 |
| | 4.1 |
| | — |
|
| Expected return on plan assets | (14.2 | ) | | (0.2 | ) | | — |
| | (17.6 | ) | | (3.3 | ) | | — |
|
| Amortization of prior service (credit) cost | (0.1 | ) | | — |
| | (0.5 | ) | | 0.1 |
| | — |
| | (0.9 | ) |
| Amortization of net deferred actuarial loss | — |
| | — |
| | 0.1 |
| | — |
| | — |
| | 0.2 |
|
| Curtailment gain | — |
| | (0.2 | ) | | — |
| | — |
| | — |
| | (4.5 | ) |
| Net periodic benefit cost (income) | 0.3 |
| | 2.6 |
| | (0.4 | ) | | 2.6 |
| | 3.8 |
| | (5.2 | ) |
| Less: discontinued operations | — |
| | — |
| | — |
| | (0.7 | ) | | (0.6 | ) | | 0.4 |
|
| Net periodic benefit cost (income) from continuing operations | $ | 0.3 |
| | $ | 2.6 |
| | $ | (0.4 | ) | | $ | 1.9 |
| | $ | 3.2 |
| | $ | (4.8 | ) |
| | | | Nine Months Ended September 30, | Six Months Ended June 30, |
| | 2016 | | 2015 | 2017 | | 2016 |
| | Pension | | Other Post Retirement | | Pension | | Other Post Retirement | Pension | | Other Post Retirement | | Pension | | Other Post Retirement |
| (In millions) | U.S. | | Non-U.S. | | U.S. | | Non-U.S. | | U.S. | | Non-U.S. | | U.S. | | Non-U.S. | |
| Service cost | $ | 13.9 |
| | $ | 5.4 |
| | $ | — |
| | $ | 19.3 |
| | $ | 8.9 |
| | $ | — |
| $ | 8.6 |
| | $ | 4.0 |
| | $ | — |
| | $ | 9.4 |
| | $ | 3.7 |
| | $ | — |
|
| Interest cost | 30.8 |
| | 4.6 |
| | — |
| | 41.3 |
| | 12.3 |
| | 0.1 |
| 21.0 |
| | 2.1 |
| | — |
| | 20.7 |
| | 3.3 |
| | — |
|
| Expected return on plan assets | (43.0 | ) | | (1.5 | ) | | — |
| | (52.8 | ) | | (10.0 | ) | | — |
| (28.8 | ) | | (0.4 | ) | | — |
| | (28.8 | ) | | (1.3 | ) | | — |
|
| Amortization of prior service (credit) cost | (0.2 | ) | | — |
| | (1.7 | ) | | 0.2 |
| | — |
| | (2.8 | ) | |
| Amortization of prior service credit | | (0.2 | ) | | — |
| | (1.0 | ) | | (0.1 | ) | | — |
| | (1.2 | ) |
| Amortization of net deferred actuarial loss | — |
| | — |
| | 0.4 |
| | — |
| | — |
| | 0.5 |
| — |
| | — |
| | 0.2 |
| | — |
| | — |
| | 0.3 |
|
| Curtailment gain | — |
| | (0.9 | ) | | — |
| | — |
| | — |
| | (4.5 | ) | — |
| | — |
| | — |
| | — |
| | (0.7 | ) | | — |
|
| Net periodic benefit cost (income) | 1.5 |
| | 7.6 |
| | (1.3 | ) | | 8.0 |
| | 11.2 |
| | (6.7 | ) | 0.6 |
| | 5.7 |
| | (0.8 | ) | | 1.2 |
| | 5.0 |
| | (0.9 | ) |
| Less: discontinued operations | (0.5 | ) | | (0.2 | ) | | — |
| | (2.2 | ) | | (1.6 | ) | | 1.2 |
| — |
| | — |
| | — |
| | (0.5 | ) | | (0.2 | ) | | — |
|
| Net periodic benefit cost (income) from continuing operations | $ | 1.0 |
| | $ | 7.4 |
| | $ | (1.3 | ) | | $ | 5.8 |
| | $ | 9.6 |
| | $ | (5.5 | ) | $ | 0.6 |
| | $ | 5.7 |
| | $ | (0.8 | ) | | $ | 0.7 |
| | $ | 4.8 |
| | $ | (0.9 | ) |
Plan Contributions and Funding Grace intends to satisfy its funding obligations under the U.S. qualified pension plans and to comply with all of the requirements of the Employee Retirement Income Security Act of 1974 ("ERISA"). For ERISA purposes, funded status is calculated on a different basis than under U.S. GAAP.
Grace intends to fund non-U.S. pension plans based on applicable legal requirements and actuarial and trustee recommendations.
Defined Contribution Retirement Plan Grace sponsors a defined contribution retirement plan for its employees in the United States. This plan is qualified under section 401(k) of the U.S. tax code. Currently, Grace contributes an amount equal to 100% of employee contributions, up to 6% of an individual employee's salary or
Notes to Consolidated Financial Statements (Continued)
6. Pension Plans and Other Postretirement Benefit Plans (Continued)
wages. Grace's costs related to this benefit plan for the three and ninesix months ended SeptemberJune 30, 20162017, were $2.93.0 million and $8.3$5.7 million compared with $2.5$2.7 million and $7.8$5.4 million for the corresponding prior-year periods. U.S. salaried employees and certain U.S. hourly employees that are hired on or after January 1, 2017, and employees in Germany that are hired on or after January 1, 2016, will participate in defined contribution plans instead of defined benefit pension plans.
7. Other Balance Sheet Accounts
| | | (In millions) | September 30,
2016 | | December 31,
2015 | June 30,
2017 | | December 31,
2016 |
| Other Current Liabilities | | | | | | |
| Accrued compensation | $ | 48.7 |
| | $ | 53.5 |
| $ | 39.0 |
| | $ | 49.6 |
|
| Environmental contingencies | | 26.8 |
| | 32.5 |
|
| Deferred revenue | | 21.2 |
| | 27.2 |
|
| Accrued interest | | 17.0 |
| | 16.2 |
|
| Pension liabilities | | 15.0 |
| | 14.4 |
|
| Income taxes payable | 31.6 |
| | 25.8 |
| 8.5 |
| | 5.7 |
|
| Environmental contingencies | 29.9 |
| | 21.4 |
| |
| Accrued interest | 29.4 |
| | 18.9 |
| |
| Deferred revenue | 24.4 |
| | 24.7 |
| |
| Pension liabilities | 14.3 |
| | 14.2 |
| |
| Other accrued liabilities | 55.6 |
| | 75.9 |
| 56.1 |
| | 63.3 |
|
| | $ | 233.9 |
| | $ | 234.4 |
| $ | 183.6 |
| | $ | 208.9 |
|
Accrued compensation includes salaries and wages as well as estimated current amounts due under the annual and long-term incentive programs.
Notes to Consolidated Financial Statements (Continued)
7. Other Balance Sheet Accounts (Continued)
|
| | | | | | | |
| (In millions) | June 30,
2017 | | December 31,
2016 |
| Other Liabilities | | | |
| Environmental contingencies | $ | 41.5 |
| | $ | 33.8 |
|
| Liability to unconsolidated affiliate | 27.4 |
| | 27.0 |
|
| Asset retirement obligation | 8.7 |
| | 10.2 |
|
| Postemployment liability | 7.0 |
| | 7.2 |
|
| Deferred revenue | 9.4 |
| | 2.3 |
|
| Other noncurrent liabilities | 59.6 |
| | 46.2 |
|
| | $ | 153.6 |
| | $ | 126.7 |
|
8. Commitments and Contingent Liabilities
Over the years, Grace operated numerous types of businesses that are no longer part of its business portfolio. As Grace divested or otherwise ceased operating these businesses, it retained certain liabilities and obligations, which we refer to as legacy liabilities. The principal legacy liabilities are product and environmental liabilities. Although the outcome of each of the matters discussed below cannot be predicted with certainty, Grace has assessed its risk and has made accounting estimates as required under U.S. GAAP.
Legacy Product and Environmental Liabilities
Legacy Product Liabilities Grace emerged from an asbestos-related Chapter 11 bankruptcy on February 3, 2014 (the "Effective Date"). Under its plan of reorganization, all pending and future asbestos-related claims are channeled for resolution to either a personal injury trust (the "PI Trust") or a property damage trust (the "PD Trust"). The trusts are the sole recourse for holders of asbestos-related claims. The channeling injunctions issued by the bankruptcy court prohibit holders of asbestos-related claims from asserting such claims directly against Grace.
Grace has satisfied all of its financial obligations to the PI Trust. Grace has fixed and contingent financial obligations remaining to the PD Trust. With respect to property damage claims related to Grace’s former attic insulation product installed in the U.S. ("ZAI PD Claims"), the PD Trust was funded with $34.4 million on the Effective Date. Grace is obligated to make a payment of $30Date and $30.0 million to the PD Trust in respect of ZAI PD Claims on February 3, 2017, and has recorded a liability of $29.7 million representing the present value of this amount in "debt payable within one year" in the accompanying Consolidated Balance Sheets.2017. Grace is also obligated to make up to 10 contingent deferred payments of $8 million per year to the PD Trust in respect of ZAI PD Claims during the 20-year period beginning on the fifth anniversary of the Effective Date, with each such payment due only if the assets of the PD Trust in respect of ZAI PD Claims fall below $10 million during the preceding year. Grace has not accrued for the 10 additional payments as Grace does not currently believe they are probable. Grace is not obligated to make additional payments to the PD Trust in respect of ZAI PD Claims beyond the payments described above. Grace has satisfied all of its financial obligations with respect to Canadian ZAI PD Claims.
With respect to other asbestos property damage claims ("Other PD Claims"), claims unresolved as of the Effective Date are to be litigated in the bankruptcy court and any future claims are to be litigated in a federal district court, in each case pursuant to procedures to be approved by the bankruptcy court. To the extent any such Other PD Claims are determined to be allowed claims, they are to be paid in cash by the PD Trust. Grace is
Notes to Consolidated Financial Statements (Continued)
8. Commitments and Contingent Liabilities (Continued)
obligated to make a payment to the PD Trust every six months in the amount of any Other PD Claims allowed during the preceding six months plus interest (if applicable) and the amount of PD Trust expenses for the preceding six months (the "PD Obligation"). The aggregate amount to be paid under the PD Obligation is not capped and Grace may be obligated to make additional payments to the PD Trust in respect of the PD Obligation. Grace has accrued for those unresolved Other PD Claims that it believes are probable and estimable. Grace has not accrued for other unresolved or unasserted Other PD Claims as it does not believe that payment is probable.
All payments to the PD Trust required after the Effective Date are secured by the Company's obligation to issue 77,372,257 shares of Company common stock to the PD Trust in the event of default, subject to customary anti-dilution provisions.
Notes to Consolidated Financial Statements (Continued)
8. Commitments and Contingent Liabilities (Continued)
This summary of the commitments and contingencies related to the Chapter 11 proceeding does not purport to be complete and is qualified in its entirety by reference to the plan of reorganization and the exhibits and documents related thereto, which have been filed with the SEC.
Legacy Environmental Liabilities Grace is subject to loss contingencies resulting from extensive and evolving federal, state, local and foreign environmental laws and regulations relating to its manufacturing operations. Grace has procedures in place to minimize such contingencies; nevertheless, it has liabilities associated with past operations and additional claims may arise in the future. To address its legacy liabilities, Grace accrues for anticipated costs of response efforts where an assessment has indicated that a probable liability has been incurred and the cost can be reasonably estimated. These accruals do not take into account any discounting for the time value of money.
Grace's environmental liabilities are reassessed regularly and adjusted when circumstances become better defined or response efforts and their costs can be better estimated.estimated, typically as a matter moves through the life-cycle of environmental investigation and remediation. These liabilities are evaluated based on currently available information, relating to the nature and extent of contamination, risk assessments, feasibility of response actions, and apportionment amongst other potentially responsible parties, all evaluated in light of prior experience.
At SeptemberJune 30, 2016,2017, Grace's estimated liability for legacy environmental response costs totaled $63.8$68.3 million, compared with $55.2$66.3 million at December 31, 2015,2016, and was included in "other current liabilities" and "other liabilities" in the Consolidated Balance Sheets. These amounts are based on agreements in place or on Grace's estimate of costs where no formal remediation plan exists, yet there is sufficient information to estimate response costs. Net cash paid against previously established reserves for the nine months endedSeptember 30, 2016 and 2015, was $11.4 million and $8.4 million, respectively.
Vermiculite-Related Matters
Grace purchased a vermiculite mine in Libby, Montana, in 1963 and operated it until 1990. Vermiculite concentrate from the Libby mine was used in the manufacture of attic insulation and other products. Some of the vermiculite ore contained naturally occurring asbestos.
Grace is engaged with the U.S. Environmental Protection Agency (the "EPA") and other federal, state and local governmental agencies in a remedial investigation and feasibility study ("RI/FS") of the Libby mine and the surrounding area. This investigationIn its 2017 Annual Project Update for the Libby Asbestos Superfund Site, the EPA announced a narrowing of its focus from the former "OU3 Study Area" to a smaller Operable Unit 3 or "OU3." Within this revised area, the RI/FS will determine the specific areas requiring remediation and will likely provideidentify possible remedial action alternatives. Possible remedial actions within OU3 are wide-ranging, from institutional controls such as land use restrictions, to more active measures involving soil removal, containment projects, or other protective measures. Grace expects the RI/FS and a record of decision to be completed by the end of 2019. When meaningful new information becomes available, Grace will reevaluate estimated liability for the costs for remediation of the mine and surrounding area and adjust its reserves accordingly.
During 2010, theThe EPA began reinvestigating certain facilities on a list of 105 facilities whereis also investigating or remediating formerly owned or operated sites that processed Libby vermiculite concentrate from the Libby mine was thought to have been used, stored or processed.into finished products. Grace is cooperating with the EPA on this reinvestigationthese investigation and remediation activities, and has remediated, or paid for remediation, at several of these facilities. Grace has specific reserves for each site where an assessmentrecorded a liability to the extent that its review has indicated that a probable liability has been incurred and the cost can be reasonably estimated.is estimable. These liabilities cover the estimated cost of investigations and, to the extent an assessment has indicated that remediation is necessary, the estimable cost of response actions. Response actions typically involve soil excavation and removal, and replacement with clean fill. The EPA may requestcommence additional remediationinvestigations in the future at other facilities; however, at this timesites that processed Libby vermiculite, but Grace does not believe, based on its knowledge of prior and current operations and site conditions, that additionalliability for remediation at such other sites is probable at the majority of these sites.probable.
In the 2016 third quarter Grace accrued $8.9$4.3 million in the three months ended June 30, 2017 for future costs related to vermiculite-related matters.matters, which reflects provision for an agreed upon remedy at a former vermiculite processing site. Grace's total estimated liability for response costs that are currently estimable related to site assessment, investigation,for the Libby mine and feasibility study at the former vermiculite mine in Libbysurrounding area, and response efforts at vermiculite processing sites outside of Libby at SeptemberJune 30, 2016,2017, and December 31, 2015,2016, was $26.3 million and $18.7$26.8
Notes to Consolidated Financial Statements (Continued)
8. Commitments and Contingent Liabilities (Continued)
million and $31.2 million, respectively. It is probable that Grace's ultimate liability for these vermiculite-related matters will exceed current estimates by material amounts. Grace is unable to estimate a range of probable additional losses for its vermiculite-related matters at this time because it is contingent on information not currently available to Grace, including: the content of the site assessment, investigation and feasibility studies; finalization of, or changes to, the remedial design; findings during remediation; changes in existing technologies; and other information that will allow Grace to create, refine, or adjust its estimated environmental liabilities.
Currently, Grace expects that additional information will become available over the 2017-2019 period to enable it to estimate further its remediation liabilities for the Libby mine site, the surrounding area, and other vermiculite processing sites outside of Libby.
Non-Vermiculite-Related Matters
Grace accrued $8.9 million in the three months ended June 30, 2017 for future costs related to non-vermiculite-related matters, $7.2 million of which was to increase the liability for remediation at a former manufacturing site to maintain ten years of operation and maintenance expenses. At SeptemberJune 30, 2016,2017, and December 31, 2015,2016, Grace's estimated legacy environmental liability for response costs at sites not related to its former vermiculite mining and processing activities was $37.5$41.5 million and $36.5$35.1 million, respectively. This liability relates to Grace's former businesses or operations, including its share of liability at off-site disposal facilities. Grace's estimated liability is based upon regulatory requirements and environmental conditions at each site. As Grace receives new information its estimated liability may change materially.
Commercial and Financial Commitments and Contingencies
Purchase Commitments Grace uses purchase commitments to ensure supply and to minimize the volatility of major components of direct manufacturing costs including natural gas, certain metals, rare earths, and other materials. Such commitments are for quantities that Grace fully expects to use in its normal operations.
Guarantees and Indemnification Obligations Grace is a party to many contracts containing guarantees and indemnification obligations. These contracts primarily consist of:
Product warranties with respect to certain products sold to customers in the ordinary course of business. These warranties typically provide that products will conform to specifications. Grace accrues a warranty liability on a transaction-specific basis depending on the individual facts and circumstances related to each sale. Both the liability and annual expense related to product warranties are immaterial to the Consolidated Financial Statements.
Performance guarantees offered to customers under certain licensing arrangements. Grace has not established a liability for these arrangements based on past performance.
Licenses of intellectual property by Grace to third parties in which Grace has agreed to indemnify the licensee against third party infringement claims.
Contracts providing for the sale of a former business unit or product line in which Grace has agreed to indemnify the buyer against liabilities related to activities prior to the closing of the transaction, including environmental liabilities.
Contracts related to the Separation in which Grace has agreed to indemnify GCP against liabilities related to activities prior to the closing of the transaction, including tax, employee, and environmental liabilities.
Guarantees of real property lease obligations of third parties, typically arising out of (a) leases entered into by former subsidiaries of Grace, or (b) the assignment or sublease of a lease by Grace to a third party.
Financial Assurances Financial assurances have been established for a variety of purposes, including insurance and environmental matters, trade-related commitments and other matters. At SeptemberJune 30, 20162017, Grace had gross financial assurances issued and outstanding of $117.1122.9 million, composed of $33.739.5 million of
Notes to Consolidated Financial Statements (Continued)
8. Commitments and Contingent Liabilities (Continued)
surety bonds issued by various insurance companies and $83.4 million of standby letters of credit and other financial assurances issued by various banks.
Notes to Consolidated Financial Statements (Continued)
9. Restructuring Expenses and Repositioning Expenses
Restructuring Expenses In the 2016 third2017 second quarter, Grace incurred costs from restructuring actions, primarily related to workforce reductions as a result of changes in the business environment and its business structure, which are included in "restructuring and repositioning expenses" in the Consolidated Statements of Operations. Costs in the 2016 first and second quarters primarily related to the exit of certain non-strategic product lines in the Materials Technologies reportable segment.
The following table presents restructuring expenses by reportable segment for the three and ninesix months ended SeptemberJune 30, 2016.2017.
| | | | Three Months Ended September 30, | | Nine Months Ended September 30, | Three Months Ended June 30, | | Six Months Ended June 30, |
| (In millions) | 2016 | | 2015 | | 2016 | | 2015 | 2017 | | 2016 | | 2017 | | 2016 |
| Catalysts Technologies | $ | 1.6 |
| | $ | 0.5 |
| | $ | 2.7 |
| | $ | 3.8 |
| $ | — |
| | $ | 0.6 |
| | $ | 0.4 |
| | $ | 1.1 |
|
| Materials Technologies | (0.1 | ) | | 0.2 |
| | 15.1 |
| | 0.8 |
| 0.1 |
| | 7.3 |
| | 0.3 |
| | 15.2 |
|
| Corporate | 0.3 |
| | 1.8 |
| | 0.4 |
| | 4.2 |
| 1.9 |
| | — |
| | 4.1 |
| | 0.1 |
|
| Total restructuring expenses | $ | 1.8 |
| | $ | 2.5 |
| | $ | 18.2 |
| | $ | 8.8 |
| $ | 2.0 |
| | $ | 7.9 |
| | $ | 4.8 |
| | $ | 16.4 |
|
These costs are not included in segment operating income. Substantially all costs related to the restructuring programs are expected to be paid by December 31, 2017.
| | Restructuring Liability (In millions) | Total | Total |
| Balance, December 31, 2015 | $ | 7.6 |
| |
| Balance, December 31, 2016 | | $ | 9.6 |
|
| Accruals for severance and other costs | 11.8 |
| 4.4 |
|
| Payments | (13.6 | ) | (7.2 | ) |
| Currency translation adjustments and other | 0.2 |
| 0.1 |
|
| Balance, September 30, 2016 | $ | 6.0 |
| |
| Balance, June 30, 2017 | | $ | 6.9 |
|
Repositioning Expenses Pretax repositioning expenses included in continuing operations for the three and ninesix months ended SeptemberJune 30, 2016,2017, were $3.8$3.3 million and $10.4$2.8 million respectively, compared with $2.7$1.5 million and $6.1$6.6 millionfor the corresponding prior-year periods. TheseThe expenses incurred in 2017 primarily relate to the Separation and third party consulting costs related to the Separation.productivity initiatives. Substantially all of these costs have been or are expected to be settled in cash.
10. Other (Income) Expense, net
Components of other (income) expense, net are as follows:
|
| | | | | | | | | | | | | | | |
| | Three Months Ended June 30, | | Six Months Ended June 30, |
| (In millions) | 2017 | | 2016 | | 2017 | | 2016 |
| Business interruption insurance recovery | $ | (10.6 | ) | | $ | — |
| | $ | (13.1 | ) | | $ | — |
|
| Currency transaction effects | 1.5 |
| | (0.2 | ) | | 2.0 |
| | 0.3 |
|
| Chapter 11 expenses, net | 0.6 |
| | 0.8 |
| | 1.5 |
| | 2.0 |
|
| Interest income | (0.6 | ) | | (0.4 | ) | | (0.8 | ) | | (0.6 | ) |
| Net (gain) loss on sales of investments and disposals of assets | 0.4 |
| | (0.3 | ) | | 0.8 |
| | 0.2 |
|
| Loss on early extinguishment of debt | — |
| | — |
| | — |
| | 11.1 |
|
| Third-party acquisition-related costs | — |
| | 2.5 |
| | — |
| | 2.5 |
|
| Other miscellaneous (income) expense | (0.9 | ) | | 0.7 |
| | (2.2 | ) | | (1.7 | ) |
| Total other (income) expense, net | $ | (9.6 | ) | | $ | 3.1 |
| | $ | (11.8 | ) | | $ | 13.8 |
|
Notes to Consolidated Financial Statements (Continued)
10. Other (Income) Expense, net (Continued)
ComponentsIn January 2017, a Catalysts Technologies customer experienced an explosion and fire resulting in an extended outage. Grace has confirmed with its third party insurer that it has a valid claim under its business interruption insurance policy for lost profits as a result of other (income) expense, net are as follows:
|
| | | | | | | | | | | | | | | |
| | Three Months Ended September 30, | | Nine Months Ended September 30, |
| (In millions) | 2016 | | 2015 | | 2016 | | 2015 |
| Loss on early extinguishment of debt | $ | — |
| | $ | — |
| | $ | 11.1 |
| | $ | — |
|
| Third-party acquisition-related costs | — |
| | — |
| | 2.5 |
| | — |
|
| Chapter 11 expenses, net | 0.4 |
| | 1.1 |
| | 2.4 |
| | 4.3 |
|
| Interest income | (0.4 | ) | | (0.1 | ) | | (1.0 | ) | | (0.3 | ) |
| Currency transaction effects | (0.2 | ) | | (0.4 | ) | | 0.1 |
| | (2.1 | ) |
| Net (gain) loss on sales of investments and disposals of assets | (0.1 | ) | | 0.3 |
| | 0.1 |
| | 0.7 |
|
| Bankruptcy-related charges, net | — |
| | — |
| | — |
| | (8.7 | ) |
| Other miscellaneous (income) expense | (0.2 | ) | | 0.6 |
| | (1.9 | ) | | 1.4 |
|
| Total other (income) expense, net | $ | (0.5 | ) | | $ | 1.5 |
| | $ | 13.3 |
| | $ | (4.7 | ) |
See Note 3 for more information related to Grace's 2016 early extinguishment of debt.
In the 2015 first quarter, Grace finalized its accounting for emergence from bankruptcy and recorded a gain of $9.0 million reflecting the final resolution of certain bankruptcy liabilities.
11. Other Comprehensive LossIncome (Loss)
The following tables present the pre-tax, tax, and after-tax components of Grace's other comprehensive lossincome (loss) for the three and ninesix months ended SeptemberJune 30, 20162017 and 20152016:
| | Three Months Ended September 30, 2016
(In millions) | Pre-Tax Amount | | Tax Benefit/ (Expense) | | After-Tax Amount | |
Three Months Ended June 30, 2017
(In millions) | | Pre-Tax Amount | | Tax Benefit/ (Expense) | | After-Tax Amount |
| Defined benefit pension and other postretirement plans: | | | | | | | | | | |
| Amortization of net prior service credit included in net periodic benefit cost | $ | (0.6 | ) | | $ | 0.2 |
| | $ | (0.4 | ) | $ | (0.6 | ) | | $ | 0.2 |
| | $ | (0.4 | ) |
| Amortization of net deferred actuarial loss included in net periodic benefit cost | 0.1 |
| | — |
| | 0.1 |
| 0.1 |
| | (0.1 | ) | | — |
|
| Benefit plans, net | (0.5 | ) | | 0.2 |
| | (0.3 | ) | (0.5 | ) | | 0.1 |
| | (0.4 | ) |
| Currency translation adjustments | (2.3 | ) | | — |
| | (2.3 | ) | (8.3 | ) | | — |
| | (8.3 | ) |
| Gain from hedging activities | 0.9 |
| | (0.3 | ) | | 0.6 |
| |
| Other comprehensive loss attributable to W. R. Grace & Co. shareholders | $ | (1.9 | ) | | $ | (0.1 | ) | | $ | (2.0 | ) | |
| Gain (loss) from hedging activities | | (0.2 | ) | | — |
| | (0.2 | ) |
| Other comprehensive income (loss) attributable to W. R. Grace & Co. shareholders | | $ | (9.0 | ) | | $ | 0.1 |
| | $ | (8.9 | ) |
| | Nine Months Ended September 30, 2016
(In millions) | Pre-Tax Amount | | Tax Benefit/ (Expense) | | After-Tax Amount | |
Six Months Ended June 30, 2017
(In millions) | | Pre-Tax Amount | | Tax Benefit/ (Expense) | | After-Tax Amount |
| Defined benefit pension and other postretirement plans: | | | | | | | | | | |
| Amortization of net prior service credit included in net periodic benefit cost | $ | (1.9 | ) | | $ | 0.7 |
| | $ | (1.2 | ) | $ | (1.2 | ) | | $ | 0.4 |
| | $ | (0.8 | ) |
| Amortization of net deferred actuarial loss included in net periodic benefit cost | 0.4 |
| | (0.2 | ) | | 0.2 |
| 0.2 |
| | (0.1 | ) | | 0.1 |
|
| Benefit plans, net | (1.5 | ) | | 0.5 |
| | (1.0 | ) | (1.0 | ) | | 0.3 |
| | (0.7 | ) |
| Currency translation adjustments | (6.4 | ) | | — |
| | (6.4 | ) | (9.7 | ) | | — |
| | (9.7 | ) |
| Loss from hedging activities | (4.2 | ) | | 1.5 |
| | (2.7 | ) | |
| Other comprehensive loss attributable to W. R. Grace & Co. shareholders | $ | (12.1 | ) | | $ | 2.0 |
| | $ | (10.1 | ) | |
| Gain (loss) from hedging activities | | 0.7 |
| | (0.2 | ) | | 0.5 |
|
| Other comprehensive income (loss) attributable to W. R. Grace & Co. shareholders | | $ | (10.0 | ) | | $ | 0.1 |
| | $ | (9.9 | ) |
|
| | | | | | | | | | | |
Three Months Ended June 30, 2016
(In millions) | Pre-Tax Amount | | Tax Benefit/ (Expense) | | After-Tax Amount |
| Defined benefit pension and other postretirement plans: | | | | | |
| Amortization of net prior service credit included in net periodic benefit cost | $ | (0.6 | ) | | $ | 0.2 |
| | $ | (0.4 | ) |
| Amortization of net deferred actuarial loss included in net periodic benefit cost | 0.1 |
| | (0.1 | ) | | — |
|
| Benefit plans, net | (0.5 | ) | | 0.1 |
| | (0.4 | ) |
| Currency translation adjustments | 1.3 |
| | — |
| | 1.3 |
|
| Gain (loss) from hedging activities | (0.4 | ) | | 0.1 |
| | (0.3 | ) |
| Other comprehensive income (loss) attributable to W. R. Grace & Co. shareholders | $ | 0.4 |
| | $ | 0.2 |
| | $ | 0.6 |
|
Notes to Consolidated Financial Statements (Continued)
11. Other Comprehensive LossIncome (Loss) (Continued)
|
| | | | | | | | | | | |
Three Months Ended September 30, 2015
(In millions) | Pre-Tax Amount | | Tax Benefit/ (Expense) | | After-Tax Amount |
| Defined benefit pension and other postretirement plans: | | | | | |
| Net prior service credit arising during period | $ | 1.1 |
| | $ | (0.4 | ) | | $ | 0.7 |
|
| Net deferred actuarial gain arising during period | 0.1 |
| | — |
| | 0.1 |
|
| Gain on curtailment of postretirement plans | (4.5 | ) | | 1.6 |
| | (2.9 | ) |
| Amortization of net prior service credit included in net periodic benefit cost | (0.8 | ) | | 0.2 |
| | (0.6 | ) |
| Amortization of net deferred actuarial loss included in net periodic benefit cost | 0.2 |
| | (0.1 | ) | | 0.1 |
|
| Benefit plans, net | (3.9 | ) | | 1.3 |
| | (2.6 | ) |
| Currency translation adjustments | (32.8 | ) | | — |
| | (32.8 | ) |
| Loss from hedging activities | (2.1 | ) | | 0.7 |
| | (1.4 | ) |
| Other comprehensive loss attributable to W. R. Grace & Co. shareholders | $ | (38.8 | ) | | $ | 2.0 |
| | $ | (36.8 | ) |
|
| | | | | | | | | | | |
Nine Months Ended September 30, 2015
(In millions) | Pre-Tax Amount | | Tax Benefit/ (Expense) | | After-Tax Amount |
| Defined benefit pension and other postretirement plans: | | | | | |
| Net prior service credit arising during period | $ | 1.1 |
| | $ | (0.4 | ) | | $ | 0.7 |
|
| Net deferred actuarial gain arising during period | 0.1 |
| | — |
| | 0.1 |
|
| Gain on curtailment of postretirement plans | (4.5 | ) | | 1.6 |
| | (2.9 | ) |
| Amortization of net prior service credit included in net periodic benefit cost | (2.6 | ) | | 0.9 |
| | (1.7 | ) |
| Amortization of net deferred actuarial loss included in net periodic benefit cost | 0.5 |
| | (0.2 | ) | | 0.3 |
|
| Other changes in funded status | (0.4 | ) | | 0.1 |
| | (0.3 | ) |
| Benefit plans, net | (5.8 | ) | | 2.0 |
| | (3.8 | ) |
| Currency translation adjustments | (44.3 | ) | | — |
| | (44.3 | ) |
| Loss from hedging activities | (2.5 | ) | | 0.8 |
| | (1.7 | ) |
| Other comprehensive loss attributable to W. R. Grace & Co. shareholders | $ | (52.6 | ) | | $ | 2.8 |
| | $ | (49.8 | ) |
|
| | | | | | | | | | | |
Six Months Ended June 30, 2016
(In millions) | Pre-Tax Amount | | Tax Benefit/ (Expense) | | After-Tax Amount |
| Defined benefit pension and other postretirement plans: | | | | | |
| Amortization of net prior service credit included in net periodic benefit cost | $ | (1.3 | ) | | $ | 0.5 |
| | $ | (0.8 | ) |
| Amortization of net deferred actuarial loss included in net periodic benefit cost | 0.3 |
| | (0.2 | ) | | 0.1 |
|
| Benefit plans, net | (1.0 | ) | | 0.3 |
| | (0.7 | ) |
| Currency translation adjustments | (4.1 | ) | | — |
| | (4.1 | ) |
| Gain (loss) from hedging activities | (5.1 | ) | | 1.8 |
| | (3.3 | ) |
| Other comprehensive income (loss) attributable to W. R. Grace & Co. shareholders | $ | (10.2 | ) | | $ | 2.1 |
| | $ | (8.1 | ) |
The following tables present the changes in accumulated other comprehensive income (loss), net of tax, for the ninesix months ended SeptemberJune 30, 20162017 and 20152016:
|
| | | | | | | | | | | | | | | |
Nine Months Ended September 30, 2016
(In millions) | Defined Benefit Pension and Other Postretirement Plans | | Currency Translation Adjustments | | Gain (loss) from Hedging Activities | | Total |
| Beginning balance | $ | 3.0 |
| | $ | (66.1 | ) | | $ | (3.7 | ) | | $ | (66.8 | ) |
| Other comprehensive loss before reclassifications | — |
| | (6.4 | ) | | (4.3 | ) | | (10.7 | ) |
| Amounts reclassified from accumulated other comprehensive income (loss) | (1.0 | ) | | — |
| | 1.6 |
| | 0.6 |
|
| Net current-period other comprehensive loss | (1.0 | ) | | (6.4 | ) | | (2.7 | ) | | (10.1 | ) |
| Distribution of GCP | (0.2 | ) | | 135.5 |
| | — |
| | 135.3 |
|
| Ending balance | $ | 1.8 |
| | $ | 63.0 |
| | $ | (6.4 | ) | | $ | 58.4 |
|
Notes to Consolidated Financial Statements (Continued)
11. Other Comprehensive Loss (Continued)
|
| | | | | | | | | | | | | | | |
Six Months Ended June 30, 2017
(In millions) | Defined Benefit Pension and Other Postretirement Plans | | Currency Translation Adjustments | | Gain (Loss) from Hedging Activities | | Total |
| Beginning balance | $ | 2.2 |
| | $ | 67.6 |
| | $ | (3.4 | ) | | $ | 66.4 |
|
| Other comprehensive income (loss) before reclassifications | — |
| | (9.7 | ) | | (0.7 | ) | | (10.4 | ) |
| Amounts reclassified from accumulated other comprehensive income (loss) | (0.7 | ) | | — |
| | 1.2 |
| | 0.5 |
|
| Net current-period other comprehensive income (loss) | (0.7 | ) | | (9.7 | ) | | 0.5 |
| | (9.9 | ) |
| Ending balance | $ | 1.5 |
| | $ | 57.9 |
| | $ | (2.9 | ) | | $ | 56.5 |
|
| | Nine Months Ended September 30, 2015
(In millions) | Defined Benefit Pension and Other Postretirement Plans | | Currency Translation Adjustments | | Loss from Hedging Activities | | Total | |
Six Months Ended June 30, 2016
(In millions) | | Defined Benefit Pension and Other Postretirement Plans | | Currency Translation Adjustments | | Gain (Loss) from Hedging Activities | | Total |
| Beginning balance | $ | 4.0 |
| | $ | (22.8 | ) | | $ | (5.0 | ) | | $ | (23.8 | ) | $ | 3.0 |
| | $ | (66.1 | ) | | $ | (3.7 | ) | | $ | (66.8 | ) |
| Other comprehensive income (loss) before reclassifications | 0.5 |
| | (44.3 | ) | | (0.9 | ) | | (44.7 | ) | — |
| | (4.1 | ) | | (4.4 | ) | | (8.5 | ) |
| Amounts reclassified from accumulated other comprehensive income (loss) | (4.3 | ) | | — |
| | (0.8 | ) | | (5.1 | ) | (0.7 | ) | | — |
| | 1.1 |
| | 0.4 |
|
| Net current-period other comprehensive loss | (3.8 | ) | | (44.3 | ) | | (1.7 | ) | | (49.8 | ) | |
| Net current-period other comprehensive income (loss) | | (0.7 | ) | | (4.1 | ) | | (3.3 | ) | | (8.1 | ) |
| Distribution of GCP | | (0.2 | ) | | 135.5 |
| | — |
| | 135.3 |
|
| Ending balance | $ | 0.2 |
| | $ | (67.1 | ) | | $ | (6.7 | ) | | $ | (73.6 | ) | $ | 2.1 |
| | $ | 65.3 |
| | $ | (7.0 | ) | | $ | 60.4 |
|
Grace is a global enterprise operating in over 40many countries with local currency generally deemed to be the functional currency for accounting purposes. The currency translation amount represents the adjustments necessary to translate the balance sheets valued in local currencies to the U.S. dollar as of the end of each period presented, and to translate revenues and expenses at average exchange rates for each period presented.
See Note 4 for a discussion of hedging activities. See Note 6 for a discussion of pension plans and other postretirement benefit plans.
Notes to Consolidated Financial Statements (Continued)
12. Earnings Per Share
The following table shows a reconciliation of the numerators and denominators used in calculating basic and diluted earnings per share.
|
| | | | | | | | | | | | | | | |
| | Three Months Ended September 30, | | Nine Months Ended September 30, |
| (In millions, except per share amounts) | 2016 | | 2015 | | 2016 | | 2015 |
| Numerators | | | | | | | |
| Income from continuing operations attributable to W. R. Grace & Co. shareholders | $ | 41.2 |
| | $ | 33.7 |
| | $ | 89.7 |
| | $ | 96.5 |
|
| (Loss) income from discontinued operations, net of income taxes | (1.6 | ) | | (19.9 | ) | | (10.9 | ) | | 27.4 |
|
| Net income attributable to W. R. Grace & Co. shareholders | $ | 39.6 |
| | $ | 13.8 |
| | $ | 78.8 |
| | $ | 123.9 |
|
| Denominators | | | | | | | |
| Weighted average common shares—basic calculation | 70.3 |
| | 72.1 |
| | 70.5 |
| | 72.5 |
|
| Dilutive effect of employee stock options | 0.4 |
| | 0.6 |
| | 0.4 |
| | 0.6 |
|
| Weighted average common shares—diluted calculation | 70.7 |
| | 72.7 |
| | 70.9 |
| | 73.1 |
|
| Basic earnings per share attributable to W. R. Grace & Co. shareholders | | | | | | | |
| Income from continuing operations | $ | 0.59 |
| | $ | 0.47 |
| | $ | 1.27 |
| | $ | 1.33 |
|
| (Loss) income from discontinued operations, net of income taxes | (0.03 | ) | | (0.28 | ) | | (0.15 | ) | | 0.38 |
|
| Net income | $ | 0.56 |
| | $ | 0.19 |
| | $ | 1.12 |
| | $ | 1.71 |
|
| Diluted earnings per share attributable to W. R. Grace & Co. shareholders | | | | | | | |
| Income from continuing operations | $ | 0.58 |
| | $ | 0.46 |
| | $ | 1.27 |
| | $ | 1.32 |
|
| (Loss) income from discontinued operations, net of income taxes | (0.02 | ) | | (0.27 | ) | | (0.16 | ) | | 0.37 |
|
| Net income | $ | 0.56 |
| | $ | 0.19 |
| | $ | 1.11 |
| | $ | 1.69 |
|
Notes to Consolidated Financial Statements (Continued)
12. Earnings Per Share (Continued)
|
| | | | | | | | | | | | | | | |
| | Three Months Ended June 30, | | Six Months Ended June 30, |
| (In millions, except per share amounts) | 2017 | | 2016 | | 2017 | | 2016 |
| Numerators | | | | | | | |
| Income (loss) from continuing operations attributable to W. R. Grace & Co. shareholders | $ | 43.9 |
| | $ | 38.1 |
| | $ | 86.8 |
| | $ | 48.5 |
|
| Income (loss) from discontinued operations, net of income taxes | — |
| | 0.6 |
| | — |
| | (9.3 | ) |
| Net income (loss) attributable to W. R. Grace & Co. shareholders | $ | 43.9 |
| | $ | 38.7 |
| | $ | 86.8 |
| | $ | 39.2 |
|
| Denominators | | | | | | | |
| Weighted average common shares—basic calculation | 68.3 |
| | 70.5 |
| | 68.3 |
| | 70.5 |
|
| Dilutive effect of employee stock options | 0.1 |
| | 0.4 |
| | 0.2 |
| | 0.5 |
|
| Weighted average common shares—diluted calculation | 68.4 |
|
| 70.9 |
|
| 68.5 |
|
| 71.0 |
|
| Basic earnings per share attributable to W. R. Grace & Co. shareholders | | | | | | | |
| Income (loss) from continuing operations | $ | 0.64 |
| | $ | 0.54 |
| | $ | 1.27 |
| | $ | 0.69 |
|
| Income (loss) from discontinued operations, net of income taxes | — |
| | 0.01 |
| | — |
| | (0.13 | ) |
| Net income (loss) | $ | 0.64 |
| | $ | 0.55 |
| | $ | 1.27 |
| | $ | 0.56 |
|
| Diluted earnings per share attributable to W. R. Grace & Co. shareholders | | | | | | | |
| Income (loss) from continuing operations | $ | 0.64 |
| | $ | 0.54 |
| | $ | 1.27 |
| | $ | 0.68 |
|
| Income (loss) from discontinued operations, net of income taxes | — |
| | 0.01 |
| | — |
| | (0.13 | ) |
| Net income (loss) | $ | 0.64 |
| | $ | 0.55 |
| | $ | 1.27 |
| | $ | 0.55 |
|
There were 1.01.6 million and 1.5 million anti-dilutive options outstanding for the three and ninesix months ended SeptemberJune 30, 2016,2017, compared with 0.61.0 million and 0.41.2 million for the corresponding prior-year periods.
On January 15,February 5, 2015, the Company completed an initial $500 million share repurchase program. On February 5, 2015, Grace'sannounced that its Board of Directors had authorized an additionala share repurchase program of up to $500 million. During the six months ended June 30, 2017 and 2016, the Company repurchased 425,673 shares and 472,400 shares of Company common stock for $30.0 million and $35.1 million, respectively, pursuant to the terms of the share repurchase program. As of June 30, 2017, $3.9 million remained under this authorization. On February 8, 2017, the Company announced that its Board of Directors authorized a new share repurchase program of up to $250 million, expected to be completed over the next 24 to 36 months at the discretion of management. The timing of the repurchases and the actual amount repurchased will depend on a variety of factors, including the market price of the Company's shares, the strategic deployment of capital, and general market and economic conditions. During the nine months ended September 30, 2016 and 2015, the Company repurchased 737,922 shares and 2,263,121 shares of Company common stock for $55.1 million and $220.1 million, respectively, pursuant to the terms of the share repurchase programs.
13. Segment Information
Grace is a global producer of specialty chemicals and specialty materials. Grace's two reportable business segments are Grace Catalysts Technologies and Grace Materials Technologies. Grace Catalysts Technologies includes catalysts and related products and technologies used in refining, petrochemical and other chemical manufacturing applications. Advanced Refining Technologies (ART), Grace's joint venture with Chevron Products Company, a division of Chevron U.S.A. Inc. ("Chevron"), is managed in this segment. (See Note 14.) Grace Catalysts Technologies comprises two operating segments, Grace Refining Technologies and Grace Specialty
Notes to Consolidated Financial Statements (Continued)
13. Segment Information (Continued)
Catalysts, which are aggregated into theone reportable segment based upon similar economic characteristics, the nature of the products and production processes, type and class of customer, and channels of distribution. Grace Materials Technologies includes specialty materials, including silica-based and silica-alumina-based materials, used in coatings, consumer, industrial, and pharmaceutical applications. The table below presents information related to Grace's reportable segments. Only those corporate expenses directly related to the reportable segments are allocated for reporting purposes. All remaining corporate items are reported separately and labeled as such.
Grace excludes defined benefit pension expense from the calculation of segment operating income. Grace believes that the exclusion of defined benefit pension expense provides a better indicator of its reportable segment performance as defined benefit pension expense is not managed at a reportable segment level.
Grace defines Adjusted EBIT to be income from continuing operations attributable to W. R. Grace & Co. shareholders adjusted for interest income and expense; income taxes; costs related to Chapter 11, and legacy product, environmental and environmental;other claims; restructuring and repositioning expenses and asset impairments; pension costs other than service and interest costs, expected returns on plan assets, and amortization of prior service costs/credits; income and expense items related to divested businesses, product lines, and certain other investments; gains and losses on sales of businesses, product lines, and certain other investments; third-party acquisition-related costs and the amortization of acquired inventory fair value adjustment; and certain other items that are not representative of underlying trends.
Notes to Consolidated Financial Statements (Continued)
13. Segment Information (Continued)
Reportable Segment Data
|
| | | | | | | | | | | | | | | |
| | Three Months Ended September 30, | | Nine Months Ended September 30, |
| (In millions) | 2016 | | 2015 | | 2016 | | 2015 |
| Net Sales | | | | | | | |
| Catalysts Technologies | $ | 295.8 |
| | $ | 285.3 |
| | $ | 834.8 |
| | $ | 855.6 |
|
| Materials Technologies | 108.7 |
| | 113.9 |
| | 323.0 |
| | 347.8 |
|
| Total | $ | 404.5 |
| | $ | 399.2 |
| | $ | 1,157.8 |
| | $ | 1,203.4 |
|
| Adjusted EBIT | | | | | | | |
| Catalysts Technologies segment operating income | $ | 94.3 |
| | $ | 86.4 |
| | $ | 260.1 |
| | $ | 246.7 |
|
| Materials Technologies segment operating income | 26.4 |
| | 23.6 |
| | 75.0 |
| | 71.3 |
|
| Corporate costs | (14.9 | ) | | (22.3 | ) | | (44.4 | ) | | (66.1 | ) |
| Gain on curtailment of postretirement plans related to current businesses | — |
| | 1.9 |
| | — |
| | 1.9 |
|
| Certain pension costs | (3.1 | ) | | (5.1 | ) | | (9.3 | ) | | (15.4 | ) |
| Total | $ | 102.7 |
| | $ | 84.5 |
| | $ | 281.4 |
| | $ | 238.4 |
|
| | | | | | | | Three Months Ended June 30, | | Six Months Ended June 30, |
| (In millions) | September 30,
2016 | | December 31,
2015 | 2017 | | 2016 | | 2017 | | 2016 |
| Total Assets | | | | |
| Net Sales | | | | | | | | |
| Catalysts Technologies | $ | 1,665.7 |
| | $ | 1,390.8 |
| $ | 320.5 |
| | $ | 278.4 |
| | $ | 614.3 |
| | $ | 539.0 |
|
| Materials Technologies | 299.8 |
| | 333.4 |
| 109.0 |
| | 112.1 |
| | 213.2 |
| | 214.3 |
|
| Corporate | 1,042.0 |
| | 1,054.2 |
| |
| Assets of discontinued operations | — |
| | 867.3 |
| |
| Total | $ | 3,007.5 |
| | $ | 3,645.7 |
| $ | 429.5 |
| | $ | 390.5 |
| | $ | 827.5 |
| | $ | 753.3 |
|
| Adjusted EBIT | | | | | | | | |
| Catalysts Technologies segment operating income | | $ | 101.3 |
| | $ | 87.5 |
| | $ | 182.5 |
| | $ | 165.8 |
|
| Materials Technologies segment operating income | | 24.2 |
| | 28.0 |
| | 49.0 |
| | 48.6 |
|
| Corporate costs | | (18.3 | ) | | (16.3 | ) | | (34.4 | ) | | (29.5 | ) |
| Certain pension costs | | (3.2 | ) | | (3.1 | ) | | (6.3 | ) | | (6.2 | ) |
| Total | | $ | 104.0 |
| | $ | 96.1 |
| | $ | 190.8 |
| | $ | 178.7 |
|
Corporate costs include corporate support function costs and other corporate costs such as professional fees and insurance premiums. Certain pension costs include only ongoing costs recognized quarterly, which include service and interest costs, expected returns on plan assets, and amortization of prior service costs/credits.
Notes to Consolidated Financial Statements (Continued)
13. Segment Information (Continued)
Reconciliation of Reportable Segment Data to Financial Statements Grace Adjusted EBIT for the three and ninesix months ended SeptemberJune 30, 20162017 and 20152016, is reconciled below to income from continuing operations before income taxes presented in the accompanying Consolidated Statements of Operations.
| | | | Three Months Ended September 30, | | Nine Months Ended September 30, | Three Months Ended June 30, | | Six Months Ended June 30, |
| (In millions) | 2016 | | 2015 | | 2016 | | 2015 | 2017 | | 2016 | | 2017 | | 2016 |
| Grace Adjusted EBIT | $ | 102.7 |
| | $ | 84.5 |
| | $ | 281.4 |
| | $ | 238.4 |
| $ | 104.0 |
| | $ | 96.1 |
| | $ | 190.8 |
| | $ | 178.7 |
|
| (Costs) benefit related to legacy product, environmental and other claims | | (14.9 | ) | | (6.7 | ) | | (17.0 | ) | | (11.1 | ) |
| Restructuring and repositioning expenses | (5.6 | ) | | (5.2 | ) | | (28.6 | ) | | (14.9 | ) | (5.4 | ) | | (9.4 | ) | | (7.7 | ) | | (23.0 | ) |
| (Costs) benefit related to Chapter 11, and legacy product and environmental, net | (13.1 | ) | | (6.2 | ) | | (24.2 | ) | | 0.6 |
| |
| Pension MTM adjustment and other related costs, net | | — |
| | 0.7 |
| | (1.9 | ) | | 0.9 |
|
| Income and expense items related to divested businesses | | (0.7 | ) | | 0.1 |
| | (1.0 | ) | | (0.2 | ) |
| Third-party acquisition-related costs | — |
| | — |
| | (2.5 | ) | | — |
| — |
| | (2.5 | ) | | — |
| | (2.5 | ) |
| Amortization of acquired inventory fair value adjustment | (4.1 | ) | | — |
| | (4.1 | ) | | — |
| |
| Pension MTM adjustment and other related costs, net | 0.2 |
| | — |
| | 1.1 |
| | (4.2 | ) | |
| Gain on sale of product line | — |
| | — |
| | 0.7 |
| | — |
| — |
| | 0.7 |
| | — |
| | 0.7 |
|
| Income and expense items related to divested businesses | (0.1 | ) | | 0.8 |
| | (0.3 | ) | | 1.3 |
| |
| Gain on curtailment of postretirement plans related to divested businesses | — |
| | 2.6 |
| | — |
| | 2.6 |
| |
| Loss on early extinguishment of debt | — |
| | — |
| | (11.1 | ) | | — |
| — |
| | — |
| | — |
| | (11.1 | ) |
| Interest expense, net | (19.4 | ) | | (25.1 | ) | | (60.6 | ) | | (74.2 | ) | (19.5 | ) | | (19.4 | ) | | (38.8 | ) | | (41.2 | ) |
| Net income (loss) attributable to noncontrolling interests | 0.1 |
| | (0.1 | ) | | (0.3 | ) | | (0.1 | ) | (0.4 | ) | | (0.2 | ) | | (0.4 | ) | | (0.4 | ) |
| Income from continuing operations before income taxes | $ | 60.7 |
| | $ | 51.3 |
| | $ | 151.5 |
| | $ | 149.5 |
| $ | 63.1 |
| | $ | 59.4 |
| | $ | 124.0 |
| | $ | 90.8 |
|
Geographic Area Data The table below presents information related to the geographic areas in which Grace operates. Sales are attributed to geographic areas based on customer location.
| | | | Three Months Ended September 30, | | Nine Months Ended September 30, | Three Months Ended June 30, | | Six Months Ended June 30, |
| (In millions) | 2016 | | 2015 | | 2016 | | 2015 | 2017 | | 2016 | | 2017 | | 2016 |
| Net Sales | | | | | | | | | | | | | | |
| United States | $ | 115.8 |
| | $ | 115.0 |
| | $ | 336.4 |
| | $ | 331.9 |
| $ | 108.8 |
| | $ | 112.4 |
| | $ | 212.6 |
| | $ | 220.6 |
|
| Canada and Puerto Rico | 11.8 |
| | 7.0 |
| | 34.1 |
| | 35.8 |
| 12.0 |
| | 11.6 |
| | 23.9 |
| | 22.3 |
|
| Total North America | 127.6 |
| | 122.0 |
| | 370.5 |
| | 367.7 |
| 120.8 |
| | 124.0 |
| | 236.5 |
| | 242.9 |
|
| Europe Middle East Africa | 171.6 |
| | 157.9 |
| | 472.4 |
| | 463.4 |
| 163.9 |
| | 158.4 |
| | 312.6 |
| | 300.8 |
|
| Asia Pacific | 76.7 |
| | 88.8 |
| | 231.9 |
| | 285.5 |
| 115.5 |
| | 83.1 |
| | 215.4 |
| | 155.2 |
|
| Latin America | 28.6 |
| | 30.5 |
| | 83.0 |
| | 86.8 |
| 29.3 |
| | 25.0 |
| | 63.0 |
| | 54.4 |
|
| Total | $ | 404.5 |
| | $ | 399.2 |
| | $ | 1,157.8 |
| | $ | 1,203.4 |
| $ | 429.5 |
| | $ | 390.5 |
| | $ | 827.5 |
| | $ | 753.3 |
|
14. Unconsolidated Affiliate
Grace accounts for its 50% ownership interest in ART, its joint venture with Chevron, using the equity method of accounting. Grace's investment in ART amounted to $107.5131.9 million and $103.2117.6 million as of SeptemberJune 30, 20162017, and December 31, 20152016, respectively, and the amount included in "equity in earnings of unconsolidated affiliate" in the accompanying Consolidated Statements of Operations totaled $8.56.1 million and $18.0$13.1 million for the three and ninesix months ended SeptemberJune 30, 20162017, compared with $3.62.6 million and $12.1$9.5 million for the corresponding prior-year periods. ART is a private, limited liability company, taxed as a partnership, and accordingly does not have a quoted market price available.
The following summary presents ART's assets, liabilities and results of operations.
Notes to Consolidated Financial Statements (Continued)
14. Unconsolidated Affiliate (Continued)
|
| | | | | | | |
| (In millions) | June 30,
2017 | | December 31, 2016 |
| Summary Balance Sheet information: | | | |
| Current assets | $ | 246.7 |
| | $ | 249.2 |
|
| Noncurrent assets | 84.9 |
| | 84.8 |
|
| Total assets | $ | 331.6 |
| | $ | 334.0 |
|
| | | | |
| Current liabilities | $ | 71.7 |
| | $ | 102.0 |
|
| Noncurrent liabilities | — |
| | 0.3 |
|
| Total liabilities | $ | 71.7 |
| | $ | 102.3 |
|
|
| | | | | | | | | | | | | | | |
| | Three Months Ended June 30, | | Six Months Ended June 30, |
| (In millions) | 2017 | | 2016 | | 2017 | | 2016 |
| Net sales | $ | 110.5 |
| | $ | 81.7 |
| | $ | 207.9 |
| | $ | 145.7 |
|
| Costs and expenses applicable to net sales | 94.7 |
| | 75.2 |
| | 173.6 |
| | 123.4 |
|
| Income before income taxes | 12.6 |
| | 5.3 |
| | 26.8 |
| | 19.2 |
|
| Net income | 12.2 |
| | 5.1 |
| | 26.2 |
| | 18.9 |
|
Grace and ART transact business on a regular basis and maintain several agreements in order to operate the joint venture. These agreements are treated as related party activities with an unconsolidated affiliate. Sales to ART are accounted for on a net basis, with a mark-up, in "cost of goods sold" in the Consolidated Statements of Operations. Grace also receives reimbursement from ART for fixed costs, research and development, selling, general and administrative services and depreciation. Grace records reimbursements against the respective line items on Grace's Consolidated Statement of Operations. The table below presents summary financial data related to transactions between Grace and ART.
| | | | Three Months Ended September 30, | | Nine Months Ended September 30, | Three Months Ended June 30, | | Six Months Ended June 30, |
| (In millions) | 2016 | | 2015 | | 2016 | | 2015 | 2017 | | 2016 | | 2017 | | 2016 |
| Grace sales of catalysts to ART | $ | 56.1 |
| | $ | 76.7 |
| | $ | 156.4 |
| | $ | 194.2 |
| $ | 53.1 |
| | $ | 43.8 |
| | $ | 104.5 |
| | $ | 100.3 |
|
| Charges for fixed costs, research and development and selling, general and administrative services to ART | 6.2 |
| | 6.0 |
| | 18.5 |
| | 17.8 |
| |
| Mark-up on Grace's sales to ART included as a reduction of Grace's cost of goods sold | | 1.0 |
| | 1.1 |
| | 2.0 |
| | 2.0 |
|
| Charges for fixed costs, research and development, selling, general and administrative services, and depreciation to ART | | 10.4 |
| | 6.1 |
| | 20.8 |
| | 12.3 |
|
The table below lists Grace balances related to ART.
|
| | | | | | | |
| (in millions) | June 30,
2017 | | December 31,
2016 |
| Accounts receivable | $ | 3.3 |
| | $ | 14.9 |
|
| Noncurrent asset | 27.4 |
| | 27.0 |
|
| Accounts payable | 28.8 |
| | 28.7 |
|
| Debt payable within one year | 7.8 |
| | 7.6 |
|
| Debt payable after one year | 32.2 |
| | 31.9 |
|
| Noncurrent liability | 27.4 |
| | 27.0 |
|
The noncurrent asset and noncurrent liability in the table above represent spending to date related to a planned residue hydroprocessing catalyst production plant in Lake Charles, Louisiana. Grace manages the
Notes to Consolidated Financial Statements (Continued)
14. Unconsolidated Affiliate (Continued)
design and construction of the plant, and the asset will be included in "other assets" in Grace's Consolidated Balance Sheets until construction is completed. Grace has likewise recorded a liability for the transfer of the asset to ART upon completion, included in "other liabilities" in the Consolidated Balance Sheets.
Grace and Chevron provide lines of credit in the amount of $15.0$15.0 million each at a commitment fee of 0.1% of the credit amount. These agreements expire onhave been approved by the ART Executive Committee for renewal until February 24, 2017.2018. No amounts were outstanding at SeptemberJune 30, 2016,2017, and December 31, 2015.2016.
15. Discontinued Operations
As a result of the Separation and Distribution, GCP is now an independent public company and its common stock is listed under the symbol “GCP”"GCP" on the New York Stock Exchange. Grace does not beneficially own any shares of GCP common stock and will not consolidate the financial results of GCP in its future financial reporting, as GCP is no longer a related party to Grace subsequent to the Separation. GCP’s historical financial results through the Distribution Date are reflected in Grace’s Consolidated Financial Statements as discontinued operations.
Separation and Distribution Agreement Prior to the completion of the Separation and the Distribution, W. R. Grace & Co., Grace–Conn. and GCP entered into a Separation and Distribution Agreement and certain related agreements that govern the post-Separation relationship between Grace and GCP. The Separation and Distribution Agreement identifies the transfer of Grace's assets and liabilities that are specifically identifiable or otherwise allocable to GCP, the elimination of Grace’s equity interest in GCP, the removal of certain non-recurring separation costs directly related to the Separation and Distribution, the cash distribution from GCP to Grace, the reduction in Grace's debt using the cash received from GCP, and it provides for when and how these transfers, assumptions and assignments have occurred or will occur.
Tax Sharing Agreement W. R. Grace & Co., Grace–Conn. and GCP entered into a Tax Sharing Agreement that generally governs the parties’ respective rights, responsibilities and obligations after the Distribution with respect to taxes (including taxes arising in the ordinary course of business and taxes, if any, incurred as a result of any failure of the Distribution and certain related transactions to qualify under Sections 355 and certain other relevant provisions of the Internal Revenue Code (the “Code”)), tax attributes, the preparation and filing of tax returns, tax elections, tax contests, and certain other tax matters.
In addition, the Tax Sharing Agreement imposes certain restrictions on GCP and its subsidiaries (including restrictions on share issuances, business combinations, sales of assets and similar transactions) that are designed to preserve the qualification of the Distribution and certain related transactions under Sections 355 and certain other relevant provisions of the Code. The Tax Sharing Agreement provides special rules that allocate tax liabilities in the event the Distribution, together with certain related transactions, does not so qualify. In general, under the Tax Sharing Agreement, each party is expected to be responsible for any taxes imposed on, and certain related amounts payable by, GCP or Grace that arise from the failure of the Distribution and certain related transactions, to qualify under Sections 355 and certain other relevant provisions of the Code, to the extent that the failure to so qualify is attributable to actions, events or transactions relating to such party’s respective stock, assets or business, or a breach of the relevant representations or covenants made by that party in the Tax Sharing Agreement.
The foregoing is For a summary of the Separation and Distribution Agreement and the related Tax Sharing Agreement.Agreement, see Note 21, "Discontinued Operations" to the Consolidated Financial Statements in Grace's Form 10-K for the year ended December 31, 2016. Grace has filed the full texts of the Separation and Distribution Agreement and the Tax Sharing Agreement with the SEC, which are readily available on the Internet at www.sec.gov.
Notes to Consolidated Financial Statements (Continued)
15. Discontinued Operations (Continued)
TheGCP's historical financial results of operations of GCPthrough the February 3, 2016, Distribution Date and other effects of the Separation for the six months ended June 30, 2016, are presented as discontinued operations as summarized below:
|
| | | | | | | |
| | Nine Months Ended September 30, |
| (In millions, except per share amounts) | 2016 | | 2015 |
| Net sales | $ | 99.6 |
| | $ | 1,089.4 |
|
| Cost of goods sold | 62.6 |
| | 689.5 |
|
| Gross profit | 37.0 |
| | 399.9 |
|
| Selling, general and administrative expenses | 21.6 |
| | 184.3 |
|
| Research and development expenses | 1.7 |
| | 17.0 |
|
| Loss in Venezuela | — |
| | 60.8 |
|
| Repositioning expenses | 22.0 |
| | 28.2 |
|
| Interest expense and related financing costs | 0.7 |
| | 1.1 |
|
| Other expense, net | 4.4 |
| | 11.2 |
|
| Total costs and expenses | 50.4 |
| | 302.6 |
|
| (Loss) Income from discontinued operations before income taxes | (13.4 | ) | | 97.3 |
|
| Benefit from (provision for) income taxes | 2.6 |
| | (69.3 | ) |
| (Loss) Income from discontinued operations after income taxes | (10.8 | ) | | 28.0 |
|
| Less: Net income attributable to noncontrolling interests | (0.1 | ) | | (0.6 | ) |
| Net (loss) income from discontinued operations | $ | (10.9 | ) | | $ | 27.4 |
|
Notes to Consolidated Financial Statements (Continued)
15. Discontinued Operations (Continued)
The carrying amounts of the major classes of assets and liabilities classified as assets and liabilities of discontinued operations as of December 31, 2015, related to GCP consisted of the following:
|
| | | |
| (In millions) | December 31,
2015 |
| ASSETS | |
| Current Assets | |
| Cash and cash equivalents | $ | 98.6 |
|
| Trade accounts receivable, net | 203.6 |
|
| Inventories | 105.3 |
|
| Other current assets | 38.9 |
|
| Total Current Assets | 446.4 |
|
| Properties and equipment, net of accumulated depreciation and amortization | 217.5 |
|
| Goodwill | 102.5 |
|
| Technology and other intangible assets, net | 33.3 |
|
| Deferred income taxes | 32.0 |
|
| Overfunded defined benefit pension plans | 26.1 |
|
| Other assets | 9.5 |
|
| Total Assets | $ | 867.3 |
|
| LIABILITIES AND EQUITY | |
| Current Liabilities | |
| Debt payable within one year | $ | 25.7 |
|
| Accounts payable | 109.0 |
|
| Other current liabilities | 121.7 |
|
| Total Current Liabilities | 256.4 |
|
| Deferred income taxes | 8.7 |
|
| Unrecognized tax benefits | 11.1 |
|
| Underfunded and unfunded defined benefit pension plans | 79.0 |
|
| Other liabilities | 8.6 |
|
| Total Liabilities | $ | 363.8 |
|
Grace has revised the accompanying 2015 Consolidated Balance Sheet to correct the presentation of certain long-lived assets that were transferred to GCP as part of the Separation. The revision resulted in reductions of "properties and equipment, net" and "deferred income taxes" of $20.4 million and $8.8 million, respectively, with a corresponding increase in the noncurrent "assets of discontinued operations." |
| | | |
| | Six Months Ended June 30, |
| (In millions) | 2016 |
| Net sales | $ | 99.6 |
|
| Cost of goods sold | 62.6 |
|
| Gross profit | 37.0 |
|
| Selling, general and administrative expenses | 21.6 |
|
| Research and development expenses | 1.7 |
|
| Repositioning expenses | 22.0 |
|
| Interest expense and related financing costs | 0.7 |
|
| Other expense, net | 3.9 |
|
| Total costs and expenses | 49.9 |
|
| (Loss) Income from discontinued operations before income taxes | (12.9 | ) |
| Benefit from (provision for) income taxes | 3.7 |
|
| (Loss) Income from discontinued operations after income taxes | (9.2 | ) |
| Less: Net income attributable to noncontrolling interests | (0.1 | ) |
| Net (loss) income from discontinued operations | $ | (9.3 | ) |
In January 2016, GCP completed the sale of $525.0 million aggregate principal amount of 9.500% Senior Notes due in 2023. GCP used a portion of these proceeds to fund a $500.0 million distribution to Grace in connection with the Separation and the Distribution.
In February 2016, GCP entered into a credit agreement that provides for new senior secured credit facilities in an aggregate principal amount of $525.0 million, consisting of term loans in an aggregate principal amount of $275.0 million maturing in 2022 and of revolving loans in an aggregate principal amount of $250.0 million maturing in 2021, which were undrawn at closing. GCP used a portion of these proceeds to fund a $250.0 million distribution to Grace in connection with the Separation and the Distribution.
16. Acquisitions
On June 30, 2016, Grace acquired the assets of BASF's polyolefin catalysts business for total consideration of $248.7 million, including an estimated $3.3 million holdback liability. The business is included in the Specialty Catalysts operating segment of the Catalysts Technologies reportable segment. The acquisition purchase price has been allocated to the tangible and identifiable intangible assets acquired based on their estimated fair values
Notes to Consolidated Financial Statements (Continued)
16. Acquisitions (Continued)
at the acquisition date in accordance with ASC 805 "Business Combinations." The excess of the purchase price over the fair value of the tangible and intangible assets acquired was recorded as goodwill. The goodwill recognized is attributable to the expected growth and operating synergies that Grace expects to realize from this acquisition. Approximately $43 million of goodwill generated from the acquisition will be deductible for U.S. income tax purposes over a period of 15 years. Due to the timing of the acquisition closing, Grace did not have adequate time to finalize the purchase price allocation during the 2016 second quarter. During the 2016 third quarter, Grace recorded adjustments resulting from the finalization of the purchase price allocation. These adjustments resulted in increases to inventories and intangible assets of $3.8 million and $6.4 million, respectively, and decreases to properties and equipment and goodwill of $1.2 million and $9.0 million, respectively.
|
| | | |
| | (In millions) |
| Inventories | $ | 30.2 |
|
| Properties and equipment | 98.5 |
|
| Goodwill | 60.9 |
|
| Intangible assets | 59.1 |
|
| Net assets acquired | $ | 248.7 |
|
The table below presents the intangible assets acquired as part of the acquisition of the assets of BASF's polyolefin catalysts business and the periods over which they will be amortized.
|
| | | | | |
| | Amount (In millions) | | Weighted Average Amortization Period (in years) |
| Customer Lists | $ | 37.4 |
| | 20.0 |
| Trademarks | 13.4 |
| | 20.0 |
| Technology | 8.3 |
| | 20.0 |
| Total | $ | 59.1 |
| | 20.0 |
The carrying amount of goodwill attributable to each reportable segment and the changes in those balances during the nine months ended September 30, 2016, are as follows:
|
| | | | | | | | | | | |
| (In millions) | Catalysts Technologies | | Materials Technologies | | Total Grace |
| Balance, December 31, 2015 | $ | 292.8 |
| | $ | 43.7 |
| | $ | 336.5 |
|
| Goodwill acquired during the year | 60.9 |
| | — |
| | 60.9 |
|
| Foreign currency translation | 0.1 |
| | 0.2 |
| | 0.3 |
|
| Write-off related to exited product lines | — |
| | (2.5 | ) | | (2.5 | ) |
| Balance, September 30, 2016 | $ | 353.8 |
| | $ | 41.4 |
| | $ | 395.2 |
|
ITEM 2. MANAGEMENT'S DISCUSSION AND ANALYSIS OF FINANCIAL CONDITION AND RESULTS OF OPERATIONS
We generally refer to the quarter ended SeptemberJune 30, 20162017, as the "thirdsecond quarter," the quarter ended SeptemberJune 30, 20152016, as the "prior-year quarter," the quarter ended March 31, 2016,2017, as the "2016"2017 first quarter," the quartersix months ended June 30, 2016, as "the 2016 second quarter," the nine months ended September 30, 2016,2017, as the "nine"six months," and the ninesix months ended SeptemberJune 30, 2015,2016, as the "prior-year period." See Analysis of Operations for a discussion of our non-GAAP performance measures. Our references to "emerging regions" refer to emerging and developing regions as defined by the International Monetary Fund.
Results of Operations
ThirdSecond Quarter Performance Summary
Following is a summary of our financial performance for the thirdsecond quarter compared with the prior-year quarter.
Net sales increased 1.3%10.0% to $404.5$429.5 million.
Income from continuing operations attributable to Grace increased 22.3% to $41.2was $43.9 million or $0.58$0.64 per diluted share. Adjusted EPS was $0.80increased 13.5% to $0.84 per diluted share.
Adjusted EBIT increased 21.5%8.2% to $102.7$104.0 million.
Adjusted EBIT Return On Invested Capital was 23.3% on a trailing four-quarter basis compared with 24.3% as of December 31, 2015.
2016 Events
On June 30, 2016, we completed the acquisition of the assets of the BASF Polyolefin Catalysts business (the "polyolefin catalysts acquisition"), which included technologies, patents, trademarks, and production plants in Pasadena, Texas, and Tarragona, Spain. We added the following technologiesEBITDA increased 9.5% to our catalysts portfolio: (1) LYNX® high-activity polyethylene (PE) catalyst technologies used commercially in slurry processes for the production of high-density PE resins such as bimodal film and pipe, and (2) LYNX® polypropylene (PP) catalyst technologies used commercially in all major PP process technologies including slurry, bulk loop, stirred gas, fluid gas, and stirred bulk. The acquisition also will provide us with significant additional flexibility and capacity for our global polyolefin catalysts manufacturing network.
In the 2016 second quarter, we exited certain product lines that were previously part of our Discovery Sciences product group included in our Grace Materials Technologies operating segment, as these product lines no longer fit into our strategic growth plans. As part of the exit, we sold certain assets to two unaffiliated buyers for aggregate proceeds of $11.3$131.1 million.
On February 5, 2015, we announced a plan to separate into two independent, publicly traded companies, intended to improve our strategic focus, simplify our operating structure, and allow for more efficient capital allocation. On January 27, 2016, we entered into a separation agreement with GCP Applied Technologies Inc., then a wholly-owned subsidiary of Grace ("GCP"), pursuant to which we agreed to transfer our Grace Construction Products operating segment and the packaging technologies business of our Grace Materials Technologies operating segment to GCP (the "Separation"). The Separation occurred on February 3, 2016, by means of a pro rata distribution to Grace stockholders of all of the outstanding shares of GCP common stock (the "Distribution"). Under the Distribution, one share of GCP common stock was distributed for each share of Grace common stock held as of the close of business on January 27, 2016. As a result of the Distribution, GCP is now an independent public company and its common stock is listed under the symbol "GCP" on the New York Stock Exchange. GCP’s historical financial results through the Distribution Date are reflected in our Consolidated Financial Statements as discontinued operations.
Summary Description of Business
We are engaged in specialty chemicals and specialty materials businesses on a worldwide basis through our two reportable segments.
Grace Catalysts Technologies produces and sells catalysts and related products and technologies used in refining, petrochemical and other chemical manufacturing applications, as follows:
Fluid catalytic cracking catalysts, also called FCC catalysts, that help to "crack" the hydrocarbon chain in distilled crude oil to produce transportation fuels, such as gasoline and diesel fuels, and other petroleum-based products; and FCC additives used to reduce sulfur in gasoline, maximize propylene production from refinery FCC units, and reduce emissions of sulfur oxides, nitrogen oxides and carbon monoxide from refinery FCC units.
Hydroprocessing catalysts (HPC), most of which are marketed through our ART joint venture with Chevron in which we hold a 50% economic interest, that are used in process reactors to upgrade heavy oils into lighter, more useful products by removing impurities such as nitrogen, sulfur and heavy metals, allowing less expensive feedstocks to be used in the petroleum refining process (ART is not consolidated in our financial statements, so ART's sales are excluded from our sales).
Polyolefin catalysts and catalyst supports, also called specialty catalysts (SC), for the production of polypropylene and polyethylene thermoplastic resins, which can be customized to enhance the performance of a wide range of industrial and consumer end-use applications including high pressure pipe, geomembranes, food packaging, automotive parts, medical devices, and textiles; chemical catalysts used in a variety of industrial, environmental and consumer applications; and gas-phase polypropylene process technology, which provides our licensees with a reliable capability to manufacture polypropylene products for a broad array of end-use applications.
Grace Materials Technologies produces and sells specialty materials, including silica-based and silica-alumina-based materials, used in coatings, consumer, industrial, and pharmaceutical applications, as follows:
Coatings and print media applications, functional additives that provide matting effects and corrosion protection for industrial and consumer coatings and media and paper products to enhance quality in ink jet coatings.
Consumer/Pharma applications, as a free-flow agent, carrier or processing aid in food and personal care products; as a toothpaste abrasive and thickener; and for the processing and stabilization of
edible oils and beverages; as well as pharmaceutical, life science and related applications including silica-based separation media, excipients and pharmaceutical intermediates.
Chemical Process applications, such as tires and rubber, plastics, precision investment casting, refractory, insulating glass windows, adsorbents for use in petrochemical and natural gas processes and biofuels, various functions such as reinforcement, high temperature binding and moisture scavenging.
Global Scope
We operate our business on a global scale with approximately 73%72% of our annual 20152016 sales and 71%74% of our ninesix months sales to customers located outside the United States. We operate and/or sell to customers in over 4060 countries and do business in more than 30 currencies. We manage our operating segments on a global basis, to serve global markets. Currency fluctuations affect our reported results of operations, cash flows, and financial position.
Analysis of Operations
We have set forth in the table below our key operating statistics with percentage changes for the thirdsecond quarter and ninesix months compared with the corresponding prior-year periods. Please refer to this Analysis of Operations when reviewing this Management's Discussion and Analysis of Financial Condition and Results of Operations. In the table we present financial information in accordance with U.S. GAAP, as well as the non-GAAP financial information described below. We believe that the non-GAAP financial information provides useful supplemental information about the performance of our businesses, improves period-to-period comparability and provides clarity on the information our management uses to evaluate the performance of our businesses. In the table, we have provided reconciliations of these non-GAAP financial measures to the most directly comparable financial measure calculated and presented in accordance with U.S. GAAP. The non-GAAP financial measures should not be considered as a substitute for financial measures calculated in accordance with U.S. GAAP, and the financial results calculated in accordance with U.S. GAAP and reconciliations from those results should be evaluated carefully.
We define Adjusted EBIT (a non-GAAP financial measure) to be income from continuing operations attributable to W. R. Grace & Co. shareholders adjusted for interest income and expense; income taxes; costs related to Chapter 11, and legacy product, environmental and environmental;other claims; restructuring and repositioning expenses and asset impairments; pension costs other than service and interest costs, expected returns on plan assets, and amortization of prior service costs/credits; income and expense items related to divested businesses, product lines, and certain other investments; gains and losses on sales of businesses, product lines, and certain other investments; third-party acquisition-related costs and the amortization of acquired inventory fair value adjustment; and certain other items that are not representative of underlying trends.
We define Adjusted EBITDA (a non-GAAP financial measure) to be Adjusted EBIT adjusted for depreciation and amortization.
We define Adjusted EBIT Return On Invested Capital (a non-GAAP financial measure) to be Adjusted EBIT (on a trailing four quarters basis) divided by the sum of net working capital, properties and equipment and certain other assets and liabilities.
We define Adjusted Gross Margin (a non-GAAP financial measure) to be gross margin adjusted for pension-related costs included in cost of goods sold and the amortization of acquired inventory fair value adjustment.
We define Adjusted Earnings Per Share (EPS) (a non-GAAP financial measure) to be diluted EPS from continuing operations adjusted for costs related to Chapter 11, and legacy product, environmental and environmental;other claims; restructuring and repositioning expenses and asset impairments; pension costs other than service and interest costs, expected returns on plan assets, and amortization of prior service costs/credits; income and expense items related to divested businesses, product lines, and certain other investments; gains and losses on sales of businesses, product lines and certain other investments; third-party acquisition-related costs and the amortization of acquired inventory fair value adjustment; certain other items that are not representative of underlying trends; and certain discrete tax items.
We use Adjusted EBIT as a performance measure in significant business decisions and in determining certain incentive compensation. We use Adjusted EBIT as a performance measure because it provides improved
period-to-period comparability for decision making and compensation purposes, and because it better measures the ongoing earnings results of our strategic and operating decisions by excluding the earnings effects of our Chapter 11 proceedings, legacy product, environmental and environmental matters,other claims; restructuring and repositioning activities,activities; divested businesses,businesses; and the effects of acquisitions.
We use Adjusted EBITDA, Adjusted EBIT Return On Invested Capital, Adjusted Gross Margin, and Adjusted EPS as performance measures and may use these measures in determining certain incentive compensation. We use Adjusted EBIT Return On Invested Capital in making operating and investment decisions and in balancing the growth and profitability of our operations.
Adjusted EBIT, Adjusted EBITDA, Adjusted EBIT Return On Invested Capital, Adjusted Gross Margin, and Adjusted EPS do not purport to represent income measures as defined under U.S. GAAP, and should not be used as alternatives to such measures as an indicator of our performance. These measures are provided to investors and others to improve the period-to-period comparability and peer-to-peer comparability of our financial results, and to ensure that investors understand the information we use to evaluate the performance of our businesses. These measures may have material limitations due to the exclusion or inclusion of amounts that are included or excluded, respectively, in the most directly comparable measures calculated and presented in accordance with U.S. GAAP and thus investors and others should review carefully the financial results calculated in accordance with U.S. GAAP.
Adjusted EBIT has material limitations as an operating performance measure because it excludes costs related to Chapter 11 and legacy product, environmental and environmental mattersother claims, and may exclude income and expenses from restructuring and repositioning activities and divested businesses, which historically have been material components of our net income. Adjusted EBITDA also has material limitations as an operating performance measure because it excludes the impact of depreciation and amortization expense. Our business is substantially dependent on the successful deployment of capital, and depreciation and amortization expense is a necessary element of our costs. We compensate for the limitations of these measurements by using these indicators together with net income as measured under U.S. GAAP to present a complete analysis of our results of operations. Adjusted EBIT and Adjusted EBITDA should be evaluated together with net income and net income attributable to Grace shareholders, measured under U.S. GAAP for a complete understanding of our results of operations.
| | Analysis of Operations (In millions, except per share amounts) | Three Months Ended September 30, | | Nine Months Ended September 30, | Three Months Ended June 30, | | Six Months Ended June 30, |
| 2016 | | 2015 | | % Change | | 2016 | | 2015 | | % Change | 2017 | | 2016 | | % Change | | 2017 | | 2016 | | % Change |
| Net sales: | | | | | | | | | | | | | | | | | | | | | | |
| Catalysts Technologies | $ | 295.8 |
| | $ | 285.3 |
| | 3.7 | % | | $ | 834.8 |
| | $ | 855.6 |
| | (2.4 | )% | $ | 320.5 |
| | $ | 278.4 |
| | 15.1 | % | | $ | 614.3 |
| | $ | 539.0 |
| | 14.0 | % |
| Materials Technologies | 108.7 |
| | 113.9 |
| | (4.6 | )% | | 323.0 |
| | 347.8 |
| | (7.1 | )% | 109.0 |
| | 112.1 |
| | (2.8 | )% | | 213.2 |
| | 214.3 |
| | (0.5 | )% |
| Total Grace net sales | $ | 404.5 |
| | $ | 399.2 |
| | 1.3 | % | | $ | 1,157.8 |
| | $ | 1,203.4 |
| | (3.8 | )% | $ | 429.5 |
| | $ | 390.5 |
| | 10.0 | % | | $ | 827.5 |
| | $ | 753.3 |
| | 9.8 | % |
| Net sales by region: | | | | | | | | | | | | | | | | | | | | | | |
| North America | $ | 127.6 |
| | $ | 122.0 |
| | 4.6 | % | | $ | 370.5 |
| | $ | 367.7 |
| | 0.8 | % | $ | 120.8 |
| | $ | 124.0 |
| | (2.6 | )% | | $ | 236.5 |
| | $ | 242.9 |
| | (2.6 | )% |
| Europe Middle East Africa | 171.6 |
| | 157.9 |
| | 8.7 | % | | 472.4 |
| | 463.4 |
| | 1.9 | % | 163.9 |
| | 158.4 |
| | 3.5 | % | | 312.6 |
| | 300.8 |
| | 3.9 | % |
| Asia Pacific | 76.7 |
| | 88.8 |
| | (13.6 | )% | | 231.9 |
| | 285.5 |
| | (18.8 | )% | 115.5 |
| | 83.1 |
| | 39.0 | % | | 215.4 |
| | 155.2 |
| | 38.8 | % |
| Latin America | 28.6 |
| | 30.5 |
| | (6.2 | )% | | 83.0 |
| | 86.8 |
| | (4.4 | )% | 29.3 |
| | 25.0 |
| | 17.2 | % | | 63.0 |
| | 54.4 |
| | 15.8 | % |
| Total net sales by region | $ | 404.5 |
| | $ | 399.2 |
| | 1.3 | % | | $ | 1,157.8 |
| | $ | 1,203.4 |
| | (3.8 | )% | $ | 429.5 |
| | $ | 390.5 |
| | 10.0 | % | | $ | 827.5 |
| | $ | 753.3 |
| | 9.8 | % |
| Performance measures: | | | | | | | | | | | | | | | | | | | | | | |
| Adjusted EBIT(A): | | | | | | | | | | | | | | | | | | | | | | |
| Catalysts Technologies segment operating income | $ | 94.3 |
| | $ | 86.4 |
| | 9.1 | % | | $ | 260.1 |
| | $ | 246.7 |
| | 5.4 | % | $ | 101.3 |
| | $ | 87.5 |
| | 15.8 | % | | $ | 182.5 |
| | $ | 165.8 |
| | 10.1 | % |
| Materials Technologies segment operating income | 26.4 |
| | 23.6 |
| | 11.9 | % | | 75.0 |
| | 71.3 |
| | 5.2 | % | 24.2 |
| | 28.0 |
| | (13.6 | )% | | 49.0 |
| | 48.6 |
| | 0.8 | % |
| Corporate costs | (14.9 | ) | | (22.3 | ) | | 33.2 | % | | (44.4 | ) | | (66.1 | ) | | 32.8 | % | (18.3 | ) | | (16.3 | ) | | (12.3 | )% | | (34.4 | ) | | (29.5 | ) | | (16.6 | )% |
| Gain on curtailment of postretirement plans related to current businesses | — |
| | 1.9 |
| | NM |
| | — |
| | 1.9 |
| | NM |
| |
| Certain pension costs(B) | (3.1 | ) | | (5.1 | ) | | 39.2 | % | | (9.3 | ) | | (15.4 | ) | | 39.6 | % | (3.2 | ) | | (3.1 | ) | | (3.2 | )% | | (6.3 | ) | | (6.2 | ) | | (1.6 | )% |
| Adjusted EBIT | 102.7 |
| | 84.5 |
| | 21.5 | % | | 281.4 |
| | 238.4 |
| | 18.0 | % | 104.0 |
| | 96.1 |
| | 8.2 | % | | 190.8 |
| | 178.7 |
| | 6.8 | % |
| (Costs) benefit related to legacy product, environmental and other claims | | (14.9 | ) | | (6.7 | ) | | | | (17.0 | ) | | (11.1 | ) | | |
| Restructuring and repositioning expenses | (5.6 | ) | | (5.2 | ) | | | | (28.6 | ) | | (14.9 | ) | | | (5.4 | ) | | (9.4 | ) | | | | (7.7 | ) | | (23.0 | ) | | |
| (Costs) benefit related to Chapter 11, and legacy product and environmental, net | (13.1 | ) | | (6.2 | ) | | | | (24.2 | ) | | 0.6 |
| | | |
| Pension MTM adjustment and other related costs, net | | — |
| | 0.7 |
| | | | (1.9 | ) | | 0.9 |
| | |
| Income and expense items related to divested businesses | | (0.7 | ) | | 0.1 |
| | | | (1.0 | ) | | (0.2 | ) | | |
| Third-party acquisition-related costs | — |
| | — |
| | | | (2.5 | ) | | — |
| | | — |
| | (2.5 | ) | | | | — |
| | (2.5 | ) | | |
| Amortization of acquired inventory fair value adjustment | (4.1 | ) | | — |
| | | | (4.1 | ) | | — |
| | | |
| Pension MTM adjustment and other related costs, net | 0.2 |
| | — |
| | | | 1.1 |
| | (4.2 | ) | | | |
| Gain on sale of product line | — |
| | — |
| | | | 0.7 |
| | — |
| | | — |
| | 0.7 |
| | | | — |
| | 0.7 |
| | |
| Income and expense items related to divested businesses | (0.1 | ) | | 0.8 |
| | | | (0.3 | ) | | 1.3 |
| | | |
| Gain on curtailment of postretirement plans related to divested businesses | — |
| | 2.6 |
| | | | — |
| | 2.6 |
| | | |
| Loss on early extinguishment of debt | — |
| | — |
| | | | (11.1 | ) | | — |
| | | — |
| | — |
| | | | — |
| | (11.1 | ) | | |
| Interest expense, net | (19.4 | ) | | (25.1 | ) | | 22.7 | % | | (60.6 | ) | | (74.2 | ) | | 18.3 | % | (19.5 | ) | | (19.4 | ) | | (0.5 | )% | | (38.8 | ) | | (41.2 | ) | | 5.8 | % |
| Provision for income taxes | (19.4 | ) | | (17.7 | ) | | (9.6 | )% | | (62.1 | ) | | (53.1 | ) | | (16.9 | )% | |
| Income from continuing operations attributable to W. R. Grace & Co. shareholders | $ | 41.2 |
| | $ | 33.7 |
| | 22.3 | % | | $ | 89.7 |
| | $ | 96.5 |
| | (7.0 | )% | |
| (Provision for) benefit from income taxes | | (19.6 | ) | | (21.5 | ) | | 8.8 | % | | (37.6 | ) | | (42.7 | ) | | 11.9 | % |
| Income (loss) from continuing operations attributable to W. R. Grace & Co. shareholders | | $ | 43.9 |
| | $ | 38.1 |
| | 15.2 | % | | $ | 86.8 |
| | $ | 48.5 |
| | 79.0 | % |
| Diluted EPS from continuing operations | $ | 0.58 |
| | $ | 0.46 |
| | 26.1 | % | | $ | 1.27 |
| | $ | 1.32 |
| | (3.8 | )% | $ | 0.64 |
| | $ | 0.54 |
| | 18.5 | % | | $ | 1.27 |
| | $ | 0.68 |
| | 86.8 | % |
| Adjusted EPS | $ | 0.80 |
| | $ | 0.54 |
| | 48.1 | % | | $ | 2.15 |
| | $ | 1.46 |
| | 47.3 | % | $ | 0.84 |
| | $ | 0.74 |
| | 13.5 | % | | $ | 1.52 |
| | $ | 1.35 |
| | 12.6 | % |
| | Analysis of Operations (In millions) | Three Months Ended September 30, | | Nine Months Ended September 30, | Three Months Ended June 30, | | Six Months Ended June 30, |
| 2016 | | 2015 | | % Change | | 2016 | | 2015 | | % Change | 2017 | | 2016 | | % Change | | 2017 | | 2016 | | % Change |
| Adjusted performance measures: | |
| | |
| | |
| | | | | | | |
| | |
| | |
| | | | | | |
| Gross Margin: | |
| | |
| | |
| | | | | | | |
| | |
| | |
| | | | | | |
| Catalysts Technologies | 44.6 | % | | 43.5 | % | | 1.1 pts |
| | 44.8 | % | | 41.9 | % | | 2.9 pts |
| 40.4 | % | | 46.2 | % | | (5.8) pts |
| | 39.9 | % | | 44.9 | % | | (5.0) pts |
|
| Materials Technologies | 37.8 | % | | 39.0 | % | | (1.2) pts |
| | 39.3 | % | | 38.4 | % | | 0.9 pts |
| 37.4 | % | | 40.6 | % | | (3.2) pts |
| | 38.2 | % | | 40.0 | % | | (1.8) pts |
|
| Adjusted Gross Margin | 42.8 | % | | 42.2 | % | | 0.6 pts |
| | 43.2 | % | | 40.9 | % | | 2.3 pts |
| 39.6 | % | | 44.6 | % | | (5.0) pts |
| | 39.4 | % | | 43.5 | % | | (4.1) pts |
|
| Amortization of acquired inventory fair value adjustment | (1.0 | )% | | — | % | | (1.0) pts |
| | (0.4 | )% | | — | % | | (0.4) pts |
| |
| Pension costs in cost of goods sold | (0.2 | )% | | (0.6 | )% | | 0.4 pts |
| | (0.1 | )% | | (0.9 | )% | | 0.8 pts |
| (0.2 | )% | | (0.2 | )% | | 0.0 pts |
| | (0.4 | )% | | (0.2 | )% | | (0.2) pts |
|
| Total Grace | 41.6 | % | | 41.6 | % | | 0.0 pts |
| | 42.7 | % | | 40.0 | % | | 2.7 pts |
| 39.4 | % | | 44.4 | % | | (5.0) pts |
| | 39.0 | % | | 43.3 | % | | (4.3) pts |
|
| Adjusted EBIT: | |
| | |
| | |
| | |
| | |
| | |
| |
| | |
| | |
| | |
| | |
| | |
|
| Catalysts Technologies | $ | 94.3 |
| | $ | 86.4 |
| | 9.1 | % | | $ | 260.1 |
| | $ | 246.7 |
| | 5.4 | % | $ | 101.3 |
| | $ | 87.5 |
| | 15.8 | % | | $ | 182.5 |
| | $ | 165.8 |
| | 10.1 | % |
| Materials Technologies | 26.4 |
| | 23.6 |
| | 11.9 | % | | 75.0 |
| | 71.3 |
| | 5.2 | % | 24.2 |
| | 28.0 |
| | (13.6 | )% | | 49.0 |
| | 48.6 |
| | 0.8 | % |
| Corporate, pension, and other | (18.0 | ) | | (25.5 | ) | | 29.4 | % | | (53.7 | ) | | (79.6 | ) | | 32.5 | % | (21.5 | ) | | (19.4 | ) | | (10.8 | )% | | (40.7 | ) | | (35.7 | ) | | (14.0 | )% |
| Total Grace | 102.7 |
| | 84.5 |
| | 21.5 | % | | 281.4 |
| | 238.4 |
| | 18.0 | % | 104.0 |
| | 96.1 |
| | 8.2 | % | | 190.8 |
| | 178.7 |
| | 6.8 | % |
| Depreciation and amortization: | |
| | |
| | |
| | |
| | |
| | |
| |
| | |
| | |
| | |
| | |
| | |
|
| Catalysts Technologies | $ | 21.0 |
| | $ | 17.1 |
| | 22.8 | % | | $ | 56.5 |
| | $ | 51.2 |
| | 10.4 | % | $ | 21.1 |
| | $ | 17.8 |
| | 18.5 | % | | $ | 42.4 |
| | $ | 35.5 |
| | 19.4 | % |
| Materials Technologies | 5.0 |
| | 5.5 |
| | (9.1 | )% | | 14.7 |
| | 17.6 |
| | (16.5 | )% | 4.8 |
| | 4.7 |
| | 2.1 | % | | 9.5 |
| | 9.7 |
| | (2.1 | )% |
| Corporate | 1.0 |
| | 2.0 |
| | (50.0 | )% | | 2.6 |
| | 6.0 |
| | (56.7 | )% | 1.2 |
| | 1.1 |
| | 9.1 | % | | 2.3 |
| | 1.6 |
| | 43.8 | % |
| Total Grace | 27.0 |
| | 24.6 |
| | 9.8 | % | | 73.8 |
| | 74.8 |
| | (1.3 | )% | 27.1 |
| | 23.6 |
| | 14.8 | % | | 54.2 |
| | 46.8 |
| | 15.8 | % |
| Adjusted EBITDA: | |
| | |
| | |
| | |
| | |
| | |
| |
| | |
| | |
| | |
| | |
| | |
|
| Catalysts Technologies | $ | 115.3 |
| | $ | 103.5 |
| | 11.4 | % | | $ | 316.6 |
| | $ | 297.9 |
| | 6.3 | % | $ | 122.4 |
| | $ | 105.3 |
| | 16.2 | % | | $ | 224.9 |
| | $ | 201.3 |
| | 11.7 | % |
| Materials Technologies | 31.4 |
| | 29.1 |
| | 7.9 | % | | 89.7 |
| | 88.9 |
| | 0.9 | % | 29.0 |
| | 32.7 |
| | (11.3 | )% | | 58.5 |
| | 58.3 |
| | 0.3 | % |
| Corporate, pension, and other | (17.0 | ) | | (23.5 | ) | | 27.7 | % | | (51.1 | ) | | (73.6 | ) | | 30.6 | % | (20.3 | ) | | (18.3 | ) | | (10.9 | )% | | (38.4 | ) | | (34.1 | ) | | (12.6 | )% |
| Total Grace | 129.7 |
| | 109.1 |
| | 18.9 | % | | 355.2 |
| | 313.2 |
| | 13.4 | % | 131.1 |
| | 119.7 |
| | 9.5 | % | | 245.0 |
| | 225.5 |
| | 8.6 | % |
| Adjusted EBIT margin: | |
| | |
| | |
| | | | | | | |
| | |
| | |
| | | | | | |
| Catalysts Technologies | 31.9 | % | | 30.3 | % | | 1.6 pts |
| | 31.2 | % | | 28.8 | % | | 2.4 pts |
| 31.6 | % | | 31.4 | % | | 0.2 pts |
| | 29.7 | % | | 30.8 | % | | (1.1) pts |
|
| Materials Technologies | 24.3 | % | | 20.7 | % | | 3.6 pts |
| | 23.2 | % | | 20.5 | % | | 2.7 pts |
| 22.2 | % | | 25.0 | % | | (2.8) pts |
| | 23.0 | % | | 22.7 | % | | 0.3 pts |
|
| Total Grace | 25.4 | % | | 21.2 | % | | 4.2 pts |
| | 24.3 | % | | 19.8 | % | | 4.5 pts |
| 24.2 | % | | 24.6 | % | | (0.4) pts |
| | 23.1 | % | | 23.7 | % | | (0.6) pts |
|
| Adjusted EBITDA margin: | |
| | |
| | |
| | |
| | |
| | |
| |
| | |
| | |
| | |
| | |
| | |
|
| Catalysts Technologies | 39.0 | % | | 36.3 | % | | 2.7 pts |
| | 37.9 | % | | 34.8 | % | | 3.1 pts |
| 38.2 | % | | 37.8 | % | | 0.4 pts |
| | 36.6 | % | | 37.3 | % | | (0.7) pts |
|
| Materials Technologies | 28.9 | % | | 25.5 | % | | 3.4 pts |
| | 27.8 | % | | 25.6 | % | | 2.2 pts |
| 26.6 | % | | 29.2 | % | | (2.6) pts |
| | 27.4 | % | | 27.2 | % | | 0.2 pts |
|
| Total Grace | 32.1 | % | | 27.3 | % | | 4.8 pts |
| | 30.7 | % | | 26.0 | % | | 4.7 pts |
| 30.5 | % | | 30.7 | % | | (0.2) pts |
| | 29.6 | % | | 29.9 | % | | (0.3) pts |
|
| | Analysis of Operations (In millions) | Four Quarters Ended | Four Quarters Ended |
September 30,
2016 | | December 31, 2015 | June 30,
2017 | | December 31, 2016 |
Calculation of Adjusted EBIT Return On Invested Capital (trailing four quarters): | | Adjusted EBIT | $ | 388.8 |
| | $ | 345.8 |
| $ | 412.4 |
| | $ | 400.3 |
|
| Invested Capital: | | | | | | |
| Trade accounts receivable | 252.7 |
| | 254.5 |
| 265.0 |
| | 273.9 |
|
| Inventories | 236.1 |
| | 198.8 |
| 236.5 |
| | 228.0 |
|
| Accounts payable | (162.2 | ) | | (157.8 | ) | (199.9 | ) | | (195.4 | ) |
| | 326.6 |
| | 295.5 |
| 301.6 |
| | 306.5 |
|
| Other current assets (excluding income taxes) | 37.9 |
| | 43.2 |
| 35.7 |
| | 32.0 |
|
| Properties and equipment, net | 731.7 |
| | 624.9 |
| 749.7 |
| | 729.6 |
|
| Goodwill | 395.2 |
| | 336.5 |
| 397.5 |
| | 394.2 |
|
| Technology and other intangible assets, net | 270.3 |
| | 227.5 |
| 261.9 |
| | 269.1 |
|
| Investment in unconsolidated affiliate | 107.5 |
| | 103.2 |
| 131.9 |
| | 117.6 |
|
| Other assets (excluding capitalized financing fees) | 35.1 |
| | 31.8 |
| 31.2 |
| | 34.9 |
|
| Other current liabilities (excluding income taxes, legacy environmental matters, accrued interest, and restructuring) | (136.5 | ) | | (160.0 | ) | (124.1 | ) | | (144.4 | ) |
| Other liabilities (excluding legacy environmental matters) | (101.1 | ) | | (81.4 | ) | (111.6 | ) | | (89.3 | ) |
| Total invested capital | $ | 1,666.7 |
| | $ | 1,421.2 |
| $ | 1,673.8 |
| | $ | 1,650.2 |
|
| Adjusted EBIT Return On Invested Capital | 23.3 | % | | 24.3 | % | 24.6 | % | | 24.3 | % |
Amounts may not add due to rounding.
| |
| (A) | Grace's segment operating income includes only Grace's share of income of consolidated and unconsolidated joint ventures. |
| |
| (B) | Certain pension costs include only ongoing costs recognized quarterly, which include service and interest costs, expected returns on plan assets, and amortization of prior service costs/credits. Catalysts Technologies and Materials Technologies segment operating income and corporate costs do not include any amounts for pension expense. Other pension related costs including annual mark-to-market adjustments and actuarial gains and losses are excluded from Adjusted EBIT. These amounts are not used by management to evaluate the performance of Grace's businesses and significantly affect the peer-to-peer and period-to-period comparability of our financial results. Mark-to-market adjustments and actuarial gains and losses relate primarily to changes in financial market values and actuarial assumptions and are not directly related to the operation of Grace's businesses. |
NM—Not Meaningful
Grace Overview
Following is an overview of our financial performance for the thirdsecond quarter and ninesix months compared with the corresponding prior-year periods.
Net Sales and Gross Margin
Sales were $404.5$429.5 million and $1,157.8$827.5 million for the thirdsecond quarter and ninesix months compared with $399.2$390.5 million and $1,203.4$753.3 million for the corresponding prior-year periods. Gross margin was 41.6%39.4% and 42.7%39.0% for the thirdsecond quarter and ninesix months compared with 41.6%44.4% and 40.0%43.3% for the corresponding prior-year periods. Adjusted Gross Margin was 42.8%39.6% and 43.2%39.4% for the thirdsecond quarter and ninesix months compared with 42.2%44.6% and 40.9%43.5% for the corresponding prior-year periods.
The following tables identify the year-over-year increase or decrease in sales attributable to changes in sales volume and/or mix, product price, and the impact of currency translation.
| | | | Three Months Ended September 30, 2016
as a Percentage Increase (Decrease) from
Three Months Ended September 30, 2015 | Three Months Ended June 30, 2017
as a Percentage Increase (Decrease) from
Three Months Ended June 30, 2016 |
| Net Sales Variance Analysis | Volume | | Price | | Currency Translation | | Total | Volume | | Price | | Currency Translation | | Total |
| Catalysts Technologies | 4.3 | % | | (0.4 | )% | | (0.2 | )% | | 3.7 | % | 16.2 | % | | (0.2 | )% | | (0.9 | )% | | 15.1 | % |
| Materials Technologies | (3.6 | )% | | (0.1 | )% | | (0.9 | )% | | (4.6 | )% | (1.8 | )% | | (0.2 | )% | | (0.8 | )% | | (2.8 | )% |
| Net sales | 2.0 | % | | (0.3 | )% | | (0.4 | )% | | 1.3 | % | 11.1 | % | | (0.2 | )% | | (0.9 | )% | | 10.0 | % |
| By Region: | | | | | | | | | | | | | | |
| North America | 4.8 | % | | (0.2 | )% | | — | % | | 4.6 | % | (3.2 | )% | | 0.6 | % | | — | % | | (2.6 | )% |
| Europe Middle East Africa | 9.8 | % | | (0.4 | )% | | (0.7 | )% | | 8.7 | % | 5.6 | % | | 0.1 | % | | (2.2 | )% | | 3.5 | % |
| Asia Pacific | (12.9 | )% | | (1.0 | )% | | 0.3 | % | | (13.6 | )% | 40.3 | % | | (1.1 | )% | | (0.2 | )% | | 39.0 | % |
| Latin America | (5.8 | )% | | 1.7 | % | | (2.1 | )% | | (6.2 | )% | 19.1 | % | | (2.8 | )% | | 0.9 | % | | 17.2 | % |
Sales for the second quarter increased 10.0% compared with the prior-year quarter. Higher sales volumes include a favorable impact relatedin Catalysts Technologies were primarily due to the 2016 polyolefin catalysts acquisition as well asand organic growth in the unfavorable effectexisting businesses driven by higher demand in emerging regions. Sales volumes in Materials Technologies were down, primarily driven by lost sales from the exit of certain product lines exited in Materials Technologies.2016.
Gross margin was flat at 41.6%decreased 500 basis points to 39.4% for the third quarter and the prior-yearsecond quarter. Adjusted Gross Margin increased 60decreased 500 basis points to 42.8%39.6% for the third quarter from 42.2% for the prior-yearsecond quarter. The increase in Adjusted Gross Margin wasdecreases were primarily due to lowerproduct and regional mix including the effect of the 2016 polyolefin catalysts acquisition, and higher manufacturing costs.
| | | | Nine Months Ended September 30, 2016
as a Percentage Increase (Decrease) from
Nine Months Ended September 30, 2015 | Six Months Ended June 30, 2017
as a Percentage Increase (Decrease) from
Six Months Ended June 30, 2016 |
| Net Sales Variance Analysis | Volume | | Price | | Currency Translation | | Total | Volume | | Price | | Currency Translation | | Total |
| Catalysts Technologies | (1.5 | )% | | (0.7 | )% | | (0.2 | )% | | (2.4 | )% | 14.7 | % | | 0.3 | % | | (1.0 | )% | | 14.0 | % |
| Materials Technologies | (5.6 | )% | | 0.2 | % | | (1.7 | )% | | (7.1 | )% | 0.8 | % | | (0.4 | )% | | (0.9 | )% | | (0.5 | )% |
| Net sales | (2.7 | )% | | (0.4 | )% | | (0.7 | )% | | (3.8 | )% | 10.7 | % | | 0.1 | % | | (1.0 | )% | | 9.8 | % |
| By Region: | | | | | | | | | | | | | | |
| North America | 1.1 | % | | (0.3 | )% | | — | % | | 0.8 | % | (3.5 | )% | | 0.9 | % | | — | % | | (2.6 | )% |
| Europe Middle East Africa | 3.1 | % | | (0.4 | )% | | (0.8 | )% | | 1.9 | % | 6.5 | % | | — | % | | (2.6 | )% | | 3.9 | % |
| Asia Pacific | (17.3 | )% | | (1.3 | )% | | (0.2 | )% | | (18.8 | )% | 39.6 | % | | (0.5 | )% | | (0.3 | )% | | 38.8 | % |
| Latin America | (2.2 | )% | | 1.5 | % | | (3.7 | )% | | (4.4 | )% | 15.2 | % | | (0.9 | )% | | 1.5 | % | | 15.8 | % |
Weaker demand in Asia Pacific negatively impacted sales volumesSales for both businessesthe six months increased 9.8% compared with the prior-year period. In addition, Materials TechnologiesHigher sales volumes decreasedin Catalysts Technologies were primarily due to the exit2016 polyolefin catalysts acquisition and organic growth in the existing businesses driven by higher demand in emerging regions. Sales volumes in Materials Technologies were higher in all regions except for Latin America, offset by the effect of certain product lines earlierexited in the year, and Catalysts Technologies sales volumes benefited from the polyolefin catalysts acquisition. Currency translation negatively impacted both reportable segments for the nine months.2016.
Gross margin increased 270decreased 430 basis points to 42.7%39.0% for the ninesix months from 40.0%43.3% for the prior-year period. Adjusted Gross Margin increased 230decreased 410 basis points to 43.2%39.4% for the ninesix months from 40.9%43.5% for the prior-year period. The increasesdecreases were primarily due to lowerproduct and regional mix including the effect of the 2016 polyolefin catalysts acquisition, and higher manufacturing costs, including 250 basis points related to lower raw materials costs, and improved productivity.costs.
Grace Income From Continuing Operations
Income from continuing operations attributable to Grace was $41.2$43.9 million for the thirdsecond quarter an increase of 22.3% compared with $33.7$38.1 million for the prior-year quarter. The increase was primarily due to lower corporate costshigher segment operating income and lower net interest expense resulting from the pay down of debt in the 2016 first quarter,restructuring and repositioning expenses, partially offset by a higher provision for environmental remediation.
Income from continuing operations attributable to Grace was $89.7$86.8 million for the ninesix months, a decreasean increase of 7.0%79.0% compared with $96.5$48.5 million for the prior-year period. The decreaseincrease was primarily due to a higher provision for environmental remediation, highersegment operating income, lower restructuring and repositioning expenses, aand the 2016 loss on early extinguishment of debt due to the accelerated amortization of capitalized financing costs associated with the pay down of $600 million of debt in the 2016 first quarter, and a higher provision for income taxes primarily due to the tax effects of the Separation, partially offset by lower corporate costs, lower net interest expense resulting from the pay down of debt in the 2016 first quarter and higher gross margin. Income in the prior-year period included a $9.0 million gain reflecting the final resolution of certain bankruptcy liabilities.debt.
Adjusted EBIT
Adjusted EBIT was $102.7$104.0 million for the thirdsecond quarter, an increase of 21.5%8.2% compared with the prior-year quarter. The increase was primarily due to increasedbusiness interruption insurance recoveries for lost profits as a result of a customer outage, higher sales volumes in Catalysts Technologies, and higher income from our ART joint venture, higher sales volumes, improved product mix, and lower operating expenses including lower corporate costs,venture. The increase was partially offset by unfavorable currency translationproduct and lower pricing. The prior-year quarter, prepared onregional mix, higher manufacturing costs and higher operating expenses primarily attributable to a discontinued operations basis, includes certain costs which were either assumed by GCP at the time of the Separation or eliminated through restructuring or other cost reduction actions.favorable prior year accrual adjustment.
Adjusted EBIT was $281.4$190.8 million for the ninesix months, an increase of 18.0%6.8% compared with the prior-year period. The increase was primarily due to higher Adjusted Gross Margin, lower operating expenses including lower corporate costs,sales volumes in both segments and increased income from our ART joint venture,business interruption insurance recoveries, partially offset by lower sales volumes,higher manufacturing costs, unfavorable currency translation,product and lower pricing. The prior-year period, prepared on a discontinued operations basis, includes certain costs which were either assumed by GCP at the time of the Separation or eliminated through restructuring or other cost reduction actions.regional mix and higher operating expenses.
Adjusted EPS
The following table reconciles our Diluted EPS to our Adjusted EPS:
| | | | Three Months Ended September 30, | Three Months Ended June 30, |
| | 2016 | | 2015 | 2017 | | 2016 |
| (In millions, except per share amounts) | Pre- Tax | | Tax Effect | | After- Tax | | Per Share | | Pre- Tax | | Tax Effect | | After- Tax | | Per Share | Pre- Tax | | Tax Effect | | After- Tax | | Per Share | | Pre- Tax | | Tax Effect | | After- Tax | | Per Share |
| Diluted earnings per share from continuing operations | |
| | |
| | |
| | $ | 0.58 |
| | |
| | |
| | |
| | $ | 0.46 |
| |
| | |
| | |
| | $ | 0.64 |
| | |
| | |
| | |
| | $ | 0.54 |
|
| Costs related to Chapter 11, and legacy product and environmental, net | $ | 13.1 |
| | $ | 4.9 |
| | $ | 8.2 |
| | 0.12 |
| | $ | 6.2 |
| | $ | 1.8 |
| | $ | 4.4 |
| | 0.06 |
| |
| Costs (benefit) related to legacy product, environmental and other claims | | $ | 14.9 |
| | $ | 5.6 |
| | $ | 9.3 |
| | 0.14 |
| | $ | 6.7 |
| | $ | 2.4 |
| | $ | 4.3 |
| | 0.06 |
|
| Restructuring and repositioning expenses | 5.6 |
| | 1.4 |
| | 4.2 |
| | 0.06 |
| | 5.2 |
| | 1.7 |
| | 3.5 |
| | 0.05 |
| 5.4 |
| | 2.5 |
| | 2.9 |
| | 0.04 |
| | 9.4 |
| | 3.4 |
| | 6.0 |
| | 0.08 |
|
| Amortization of acquired inventory fair value adjustment | 4.1 |
| | 1.5 |
| | 2.6 |
| | 0.04 |
| | — |
| | — |
| | — |
| | — |
| |
| Income and expense items related to divested businesses | | 0.7 |
| | 0.3 |
| | 0.4 |
| | 0.01 |
| | (0.1 | ) | | — |
| | (0.1 | ) | | — |
|
| Third-party acquisition-related costs | | — |
| | — |
| | — |
| | — |
| | 2.5 |
| | 0.7 |
| | 1.8 |
| | 0.03 |
|
| Gain on sale of product line | | — |
| | — |
| | — |
| | — |
| | (0.7 | ) | | (0.3 | ) | | (0.4 | ) | | (0.01 | ) |
| Pension MTM adjustment and other related costs, net | (0.2 | ) | | (0.1 | ) | | (0.1 | ) | | — |
| | — |
| | — |
| | — |
| | — |
| — |
| | — |
| | — |
| | — |
| | (0.7 | ) | | (0.1 | ) | | (0.6 | ) | | (0.01 | ) |
| Income and expense items related to divested businesses | 0.1 |
| | — |
| | 0.1 |
| | — |
| | (0.8 | ) | | (0.3 | ) | | (0.5 | ) | | (0.01 | ) | |
| Gain on curtailment of postretirement plans related to divested businesses | — |
|
| — |
|
| — |
|
| — |
| | (2.6 | ) | | (0.7 | ) | | (1.9 | ) | | (0.03 | ) | |
| Discrete tax items, including adjustments to uncertain tax positions | |
| | (0.3 | ) | | 0.3 |
| | — |
| | |
| | (1.0 | ) | | 1.0 |
| | 0.01 |
| |
| | (0.9 | ) | | 0.9 |
| | 0.01 |
| | |
| | (3.5 | ) | | 3.5 |
| | 0.05 |
|
| Adjusted EPS | |
| | |
| | |
| | $ | 0.80 |
| | |
| | |
| | |
| | $ | 0.54 |
| |
| | |
| | |
| | $ | 0.84 |
| | |
| | |
| | |
| | $ | 0.74 |
|
| | | | Nine Months Ended September 30, | Six Months Ended June 30, |
| | 2016 | | 2015 | 2017 | | 2016 |
| (In millions, except per share amounts) | Pre- Tax | | Tax Effect | | After- Tax | | Per Share | | Pre- Tax | | Tax Effect | | After- Tax | | Per Share | Pre- Tax | | Tax Effect | | After- Tax | | Per Share | | Pre- Tax | | Tax Effect | | After- Tax | | Per Share |
| Diluted earnings per share from continuing operations | |
| | |
| | |
| | $ | 1.27 |
| | | | | | | | $ | 1.32 |
| |
| | |
| | |
| | $ | 1.27 |
| | | | | | | | $ | 0.68 |
|
| Costs (benefit) related to legacy product, environmental and other claims | | $ | 17.0 |
| | $ | 6.4 |
| | $ | 10.6 |
| | 0.15 |
| | $ | 11.1 |
| | $ | 4.1 |
| | $ | 7.0 |
| | 0.10 |
|
| Restructuring and repositioning expenses | $ | 28.6 |
| | $ | 9.5 |
| | $ | 19.1 |
| | 0.27 |
| | $ | 14.9 |
| | $ | 4.6 |
| | $ | 10.3 |
| | 0.14 |
| 7.7 |
| | 3.3 |
| | 4.4 |
| | 0.06 |
| | 23.0 |
| | 8.1 |
| | 14.9 |
| | 0.21 |
|
| Costs (benefit) related to Chapter 11, and legacy product and environmental, net | 24.2 |
| | 9.0 |
| | 15.2 |
| | 0.21 |
| | (0.6 | ) | | (0.2 | ) | | (0.4 | ) | | (0.01 | ) | |
| Pension MTM adjustment and other related costs, net | | 1.9 |
| | 0.7 |
| | 1.2 |
| | 0.02 |
| | (0.9 | ) | | (0.2 | ) | | (0.7 | ) | | (0.01 | ) |
| Income and expense items related to divested businesses | | 1.0 |
| | 0.4 |
| | 0.6 |
| | 0.01 |
| | 0.2 |
| | 0.1 |
| | 0.1 |
| | — |
|
| Loss on early extinguishment of debt | 11.1 |
| | 4.1 |
| | 7.0 |
| | 0.10 |
| | — |
| | — |
| | — |
| | — |
| — |
| | — |
| | — |
| | — |
| | 11.1 |
| | 4.1 |
| | 7.0 |
| | 0.10 |
|
| Amortization of acquired inventory fair value adjustment | 4.1 |
| | 1.5 |
| | 2.6 |
| | 0.04 |
| | — |
| | — |
| | — |
| | — |
| |
| Third-party acquisition-related costs | 2.5 |
| | 0.7 |
| | 1.8 |
| | 0.03 |
| | — |
| | — |
| | — |
| | — |
| — |
| | — |
| | — |
| | — |
| | 2.5 |
| | 0.7 |
| | 1.8 |
| | 0.03 |
|
| Pension MTM adjustment and other related costs, net | (1.1 | ) | | (0.3 | ) | | (0.8 | ) | | (0.01 | ) | | 4.2 |
| | 1.7 |
| | 2.5 |
| | 0.03 |
| |
| Gain on sale of product line | (0.7 | ) | | (0.3 | ) | | (0.4 | ) | | (0.01 | ) | | — |
| | — |
| | — |
| | — |
| — |
| | — |
| | — |
| | — |
| | (0.7 | ) | | (0.3 | ) | | (0.4 | ) | | (0.01 | ) |
| Income and expense items related to divested businesses | 0.3 |
| | 0.1 |
| | 0.2 |
| | — |
| | (1.3 | ) | | (0.5 | ) | | (0.8 | ) | | (0.01 | ) | |
| Gain on curtailment of postretirement plans related to divested businesses | — |
| | — |
| | — |
| | — |
| | (2.6 | ) | | (0.7 | ) | | (1.9 | ) | | (0.03 | ) | |
| Discrete tax items, including adjustments to uncertain tax positions | |
| | (17.7 | ) | | 17.7 |
| | 0.25 |
| |
|
| | (1.6 | ) | | 1.6 |
| | 0.02 |
| |
| | (0.4 | ) | | 0.4 |
| | 0.01 |
| |
|
| | (17.4 | ) | | 17.4 |
| | 0.25 |
|
| Adjusted EPS | |
| | |
| | |
| | $ | 2.15 |
| | |
| | |
| | |
| | $ | 1.46 |
| |
| | |
| | |
| | $ | 1.52 |
| | |
| | |
| | |
| | $ | 1.35 |
|
Adjusted EBIT Return On Invested Capital
Adjusted EBIT Return On Invested Capital for the thirdsecond quarter decreased to 23.3%was 24.6% on a trailing four quarters basis fromcompared with 24.3% on the same basis as of December 31, 2015, primarily due to the polyolefin catalysts acquisition. The acquisition, which was completed on June 30, 2016, increased invested capital at that date, but Adjusted EBIT includes only one quarter of earnings from the acquired business. We expect Adjusted EBIT Return On Invested Capital to increase in subsequent quarters to reflect future earnings of this business.2016.
We manage our operations with the objective of maximizing sales, earnings and cash flow over time. Doing so requires that we successfully balance our growth, profitability and working capital and other investments to support sustainable, long-term financial performance. We use Adjusted EBIT Return On Invested Capital as a performance measure in evaluating operating results, in making operating and investment decisions and in balancing the growth and profitability of our operations.
Segment Overview—Grace Catalysts Technologies
Following is an overview of the financial performance of Catalysts Technologies for the thirdsecond quarter and ninesix months compared with the corresponding prior-year periods.
Net Sales—Grace Catalysts Technologies
Sales were $295.8$320.5 million for the thirdsecond quarter, an increase of 3.7%15.1% compared with the prior-year quarter. The increase was due to higher sales volumes (+4.3%16.2%), partially offset by lower pricing (-0.4%) and unfavorable currency translation (-0.9%) and lower pricing (-0.2%). Higher sales volumes are primarily related to the 2016 polyolefin catalysts acquisition and organic growth in the existing businesses driven by higher demand in emerging regions. Sales volumes of refining catalysts declinedincreased compared with the prior-year quarter, primarily in Asia due to reductions innew customer trials, order timing,acquisition, bid business and penetration of new products. All regions contributed sales volume growth except North America. Sales volumes of specialty catalysts, excluding the effect of reduced capacity at our Curtis Bay plant. Specialty catalysts sales volumesacquisition, increased in all regions except forNorth America and Asia including a favorable impact relateddue to the polyolefin catalysts acquisition. Sales volumes in Asia were primarily impacted by declines in China as customers reducedhigher demand for polypropylene and polyethylene catalysts to aligncompared with lower growth rates and operating rates.the prior-year quarter. Unfavorable currency translation affected both product groups as the U.S. dollar strengthened against multiple currencies, especially the euro, compared with the prior-year quarter.
Sales were $834.8$614.3 million for the ninesix months, a decreasean increase of 2.4%14.0% compared with the prior-year period. The decreaseincrease was due to lowerhigher sales volumes (-1.5%(+14.7%) and improved pricing (+0.3%), lower pricing (-0.7%), andpartially offset by unfavorable currency translation (-0.2%(-1.0%). Refining catalystsHigher sales volumes declinedare primarily related to the 2016 polyolefin catalysts acquisition and organic growth in the existing businesses driven by higher demand in emerging regions. Sales volumes of refining catalysts increased compared with the prior-year period primarilyin all regions except North America due to reductions innew customer trials, higher refinery turnarounds,acquisition, bid business and order timing. In January, we reduced 10,000 tonspenetration of our least efficient capacity at our Curtis Bay plant, which also contributed to the decline in sales volumes. Specialty catalysts sales volumes increased as growth in Europe more than offset declines in Asia.new products. Sales volumes of specialty catalysts, excluding the acquisition, increased primarily in Asia were primarily impacted by declines in China as customers reduced inventoriesdue to align with lower projected growth ratescustomer order timing of chemical catalysts and decreasedhigher demand for chemical catalysts. The higher specialtypolypropylene and polyethylene catalysts sales volumes reflect a favorable impact related tocompared with the polyolefin catalysts acquisition.prior-year period. Unfavorable currency translation primarily affected refining catalysts.both product groups as the U.S. dollar strengthened against multiple currencies, especially the euro, compared with the prior-year period.
Segment Operating Income (SOI) and Margin—Grace Catalysts Technologies
Gross profit was $132.0$129.6 million for the thirdsecond quarter, an increase of 6.5%0.8% compared with the prior-year quarter. Gross margin of 44.6% increased 11040.4% decreased 580 basis points from 43.5%46.2% for the prior-year quarter. The increasedecrease in gross margin was primarily due to lower manufacturing costs, partially offset byproduct and regional mix, including the effect of the 2016 polyolefin catalysts acquisition.acquisition, and higher manufacturing costs.
Operating income was $94.3$101.3 million for the thirdsecond quarter, an increase of 9.1%15.8% compared with the prior-year quarter, primarily due to improved gross margins,business interruption insurance recoveries, higher sales volumes and higher income from the ART income, and the polyolefin catalysts acquisition,joint venture. The increase was partially offset by higher operating expenses.the impact of lower gross margins and unfavorable currency translation. The ART joint venture contributed $8.5$6.1 million to operating income, an increase of $4.9$3.5 million compared with the prior-year quarter. Operating margin for the thirdsecond quarter was 31.9%31.6%, an increase of 16020 basis points compared with the prior-year quarter.
Gross profit was $373.8$244.9 million for the ninesix months, an increase of 4.4%1.3% compared with the prior-year period. Gross margin of 44.8% increased 29039.9% decreased 500 basis points compared with 41.9%44.9% for the prior-year period. Both gross profit andThe decrease in gross margin increased as lowerwas primarily due to product and regional mix, including the effect of the 2016 polyolefin catalysts acquisition, and higher manufacturing costs, including 300 basis points related to lower raw materials costs, and improved productivity more than offset the decrease in sales volumes.costs.
Operating income was $260.1$182.5 million for the ninesix months, an increase of 5.4%10.1% compared with the prior-year period, primarily due to improvedbusiness interruption insurance recoveries and higher sales volumes, offset by the impact of lower gross margins higher ART income, and the polyolefin catalysts acquisition, partially offset by higher operating expenses.unfavorable currency translation. The ART joint venture contributed $18.0$13.1 million to operating income, an increase of $5.9$3.6 million compared with the prior-year period. Operating margin for the ninesix months was 31.2%29.7%, an increasea decrease of 240110 basis points compared with the prior-year period.
In January 2017, a Catalysts Technologies customer experienced an explosion and fire resulting in an extended outage. We have confirmed with our third party insurer that we have a valid claim under our business interruption insurance policy for lost profits as a result of the outage. The policy has a $25 million limit. Given the length of the outage, we expect to receive the full value of the policy by the end of 2017. We have recognized a benefit of $13.1 million for the six months under this insurance policy of which we have received $10.4 million in payments from the insurer through June 30, 2017.
As of June 30, 2017, we have a past-due receivable of $10.9 million ($10.0 million net of bad debt reserve) from an FCC customer in Venezuela. We are working with the customer to arrange a payment plan. While we believe the net receivable likely will be collected, there is increasing collection risk due to political and economic uncertainties in the country. We will continue to evaluate the collectability of this receivable and will further adjust the reserve if necessary.
Segment Overview—Grace Materials Technologies
Following is an overview of the financial performance of Materials Technologies for the thirdsecond quarter and ninesix months compared with the corresponding prior-year periods.
Net Sales—Grace Materials Technologies
Sales were $108.7$109.0 million for the thirdsecond quarter, a decrease of 4.6%2.8% compared with the prior-year quarter.quarter, including the negative effect (-3.3%) of product lines exited in 2016. The decrease was due to lower sales volumes (-3.6%(-1.8%), unfavorable currency translation (-0.8%) and lower pricing (-0.2%). Sales volumes decreased in all regions except Europe, primarily due to product lines exited in 2016 and delays in pharma fine chemicals orders, partially offset by higher silica volumes.
Sales were $213.2 million for the six months, a decrease of 0.5% compared with the prior-year period, including the negative effect (-5.5%) of product lines exited in 2016. The decrease was due to unfavorable currency translation (-0.9%) and lower pricing (-0.1%(-0.4%). Higher, offset by higher sales volumes of continuing product lines were more than offset by a 6.5% impact related to the exit of certain product lines.
Sales were $323.0 million for the nine months, a decrease of 7.1% compared with the prior-year period. The decrease was due to lower sales volumes (-5.6%) and unfavorable currency translation (-1.7%), partially offset by improved pricing (+0.2%0.8%). Sales volumes declined primarily in Asia, where customers delayed orders and reduced inventory levels in the 2016 first quarter. Lower sales volumes include a 3.7% impact related to the exit of certain product lines.
Segment Operating Income (SOI) and Margin—Grace Materials Technologies
Gross profit was $41.1$40.7 million for the thirdsecond quarter, a decrease of 7.4%10.5% compared with the prior-year quarter. Gross margin of 37.8% decreased 120 basis pointswas 37.4% compared with 39.0%40.6% for the prior-year quarter. The decrease in gross margin was primarily due to higher manufacturing costs, product mix with higher silicas and lower operating rates.pharma fine chemicals, and regional mix.
.
Operating income was $26.4$24.2 million for the thirdsecond quarter, an increasea decrease of 11.9%13.6% compared with the prior-year quarter, primarily due to lower operating expenses, partially offset by lower gross profit related to the exited product lines.profit. Operating margin for the thirdsecond quarter was 24.3%22.2%, an increasea decrease of 360280 basis points compared with the prior-year quarter.
Gross profit was $126.9$81.4 million for the ninesix months, a decrease of 4.9%5.1% compared with the prior-year period. Gross margin of 39.3% increased 9038.2% decreased 180 basis points compared with 38.4%40.0% for the prior-year period. The increasedecrease in gross margin was primarily due to lowerhigher manufacturing costs, improved productivity and improved pricing, partially offset by the exited product lines.costs.
Operating income was $75.0$49.0 million for the ninesix months, an increase of 5.2%0.8% compared with the prior-year period primarily due to lower operating expenses, lowerhigher sales volumes, offset by higher manufacturing costs and improved productivity, partially offset by unfavorable currency translation and lower sales volumes.the effect of product lines exited in 2016. Operating margin for the ninesix months was 23.2%23.0%, an increase of 27030 basis points from the prior-year period.
Corporate OverviewCosts
Corporate costs include corporate functional costs and other corporate costs such as professional fees and insurance premiums. Corporate costs for the thirdsecond quarter and ninewere $18.3 million, an increase of $2.0 million from the prior-year quarter, primarily due to an unfavorable comparison with a prior year accrual adjustment.
Corporate costs for the six months were $14.9$34.4 million, and $44.4an increase of $4.9 million decreases of $7.4 million and $21.7 million, respectively, compared with the corresponding prior-year periods prepared onperiod, primarily due to a discontinued operations basis. Certain costs includedfavorable settlement of a claim in the prior-year periods were either assumed by GCP at the time of the Separation or have been eliminated through restructuring or other cost reduction actions.2016 and an unfavorable comparison to a prior year accrual adjustment.
Defined Benefit Pension Expense
Certain pension costs for the thirdsecond quarter and ninesix months were $3.2 million and $6.3 million compared with $3.1 million and $9.3 million compared with $5.1 million and $15.4$6.2 million for the corresponding prior-year periods. The decreases were primarily due to lower service and interest costs.
As of December 31, 2015, we changed the approach used to determine the service and interest cost components of defined benefit pension expense. Previously, we estimated service and interest costs using a single weighted average discount rate derived from the same yield curve used to measure the projected benefit obligation. For 2016, we elected to measure service and interest costs by applying the specific spot rates along that yield curve to the plans’ liability cash flows. We believe the new approach provides a more precise measurement of service and interest costs by aligning the timing of the plans’ liability cash flows to the corresponding spot rates on the yield curve. This change did not affect the measurement of the projected benefit obligation as of December 31, 2015. We consider this a change in accounting estimate, which is being accounted for prospectively as of January 1, 2016. For full-year 2016, the change in estimate is expected to reduce service and interest costs by $12 million to $14 million when compared to the prior methodology.
Repositioning Expenses
Pretax repositioning expenses included in continuing operations were $3.8 million and $10.4 million for the third quarter and nine months, compared with $2.7 million and $6.1 million for the corresponding prior-year periods. These expenses primarily related to the Separation.
We have spent a significant amount of time and money related to the Separation. We exclude from Adjusted EBIT specific third party costs of advisors, attorneys and accountants that have assisted us with the Separation. We have also excluded certain internal costs that we would not have spent absent the Separation. These internal costs primarily include compensation, benefits, severance costs, and specific costs related to the Separation.
Interest and Financing Expenses
Net interest and financing expenses were $19.4 million and $60.6$19.5 million for the thirdsecond quarter, and nine months, decreasesan increase of 22.7% and 18.3%, respectively,0.5% compared with the corresponding prior-year periods,quarter, primarily due to borrowings on the revolving credit facility. Net interest and financing expenses were $38.8 million for the six months, a decrease of 5.8% compared with the prior-year period, primarily due to voluntary prepayments related to our term loans in February and March 2016.
Income Taxes
The annualized effectiveincome tax provision at the U.S. federal corporate rate on 2016 forecasted income from continuing operations is estimated to be 38.0% as of September 30, 2016,35% for the second quarter and the prior-year quarter would have been $22.1 million and $20.8 million, respectively, compared with 36.0%the recorded provision of $19.6 million and $21.5 million, respectively. The income tax provision at the statutory rate of 35% for the year ended December 31, 2015.six months and the prior-year period would have been $43.4 million and $31.8 million, respectively, compared with the recorded provision of $37.6 million and $42.7 million, respectively. The differenceprimary differences between thesethe tax
provision at the U.S. statutory rate and the recorded provision for income taxes are the effect of lower tax rates is primarily related to a charge of $12.8 million for an increase in the valuation allowance associated with Grace's state NOL carryforwards in 2016, partially offset by a benefit of $6.3 million forforeign jurisdictions, share-based compensation deductions, related toand the early adoptionimpact of ASU 2016-09 in 2016.
Also, as a result of the early adoption of ASU 2016-09, we recognized a one-time excess tax benefit in our Consolidated Balance Sheets which was not previously recognized. This increased our deferred tax assets as of January 1, 2016, by $70.4 million which is net of a $20.5 million valuation allowance.state law changes.
We generated approximately $1,800 million in U.S. federal tax deductions relating to our emergence from bankruptcy. These deductions generated U.S. federal and state NOL carryforwards in 2014, which we will carry forward and expect to utilize in subsequent years. Under U.S. federal income tax law, a corporation is generally permitted to carry forward NOLs for a 20-year period for deduction against future taxable income. We also expect to generategenerated U.S. federal tax deductions of $30 million upon payment of the ZAI PD deferred payment obligation in 2017.the 2017 first quarter. (See Note 8.)
We pay cash taxes in foreign jurisdictions and a limited number of states. Income taxes paid in cash netwere $31.3 million for the six months, or approximately 25% of income before income taxes. Income tax refunds which includesreceived for the six months were $29.7 million. Income taxes paid in cash for the prior-year period, including payments related to the Separation, and certain true up payments made to foreign jurisdictions, were $40.1$26.8 million, for the nine months, or approximately 26%30% of income before income taxes.
As of December 31, 2014, we had the intent and ability to indefinitely reinvest undistributed earnings of our foreign subsidiaries outside the United States. In 2015, in connection with the Separation, we repatriated a total of $173.1 million of foreign earnings from foreign subsidiaries transferred to GCP pursuant to the Separation. Such amount was determined based on an analysis of each non-U.S. subsidiary's requirements for working capital, debt repayment and strategic initiatives. We also considered local country legal and regulatory restrictions. We included Income tax expense of $19.0 million in discontinued operations in 2015 for repatriation and $1.7 million in the 2016 first quarter for deemed repatriation attributable to both current and prior years' earnings.
We believe that the Separation was a one-time, non-recurring event, and such recognition of deferred taxes on undistributed earnings would not have occurred if notrefunds received for the Separation. Subsequent to separation, we expect undistributed prior-year earnings of our foreign subsidiaries to remain permanently reinvested except in certain instances where repatriation of such earnings would result in minimal or no tax. We base this assertion on:
| |
(1) | the expectation that we will satisfy our U.S. cash obligations in the foreseeable future without requiring the repatriation of prior-year foreign earnings; |
| |
(2) | plans for significant and continued reinvestment of foreign earnings in organic and inorganic growth initiatives outside the U.S.; and |
| |
(3) | remittance restrictions imposed by local governments. |
We will continually analyze and evaluate our cash needs to determine the appropriateness of our indefinite reinvestment assertion.period were $2.3 million.
See Note 5 to the Consolidated Financial Statements for additional information regarding income taxes.
Financial Condition, Liquidity, and Capital Resources
Following is an analysis of our financial condition, liquidity and capital resources at SeptemberJune 30, 2016.2017.
Our principal uses of cash are generally capital investments and acquisitions,acquisitions; working capital investments,investments; compensation paid to employees, including contributions to our defined benefit pension plans and defined contribution plans; the repayment of debt. We alsodebt; and the return of cash to shareholders through repurchase of shares of our common stock. In Januaryand dividends.
On February 5, 2015, we completedannounced that the initial $500 million share repurchase program authorized by our Board of Directors following emergence from bankruptcy. The Board of Directors hashad authorized an additionala share repurchase program of up to $500 million. Under this program, during the ninesix months we repurchased 737,922425,673 shares of Company common stock for $55.1$30.0 million. As of June 30, 2017, $3.9 million remained under this authorization. On February 8, 2017, we announced that the Board of Directors had authorized a new share repurchase program of up to $250 million.
In the 2016 second quarter, we began to pay a quarterly cash dividend, at an annual rate of $0.68 per share of Company common stock. On February 8, 2017, we announced that the Board of Directors had approved an increase in the annual dividend rate, to $0.84 per share of Company common stock, which became effective in the 2017 first quarter. We paid cash dividends of $28.7 million during the six months.
We believe that the cash we expect to generate during 20162017 and thereafter, together with other available liquidity and capital resources, are sufficient to finance our operations, growth strategy, share repurchase program and expected dividend payments, and meet our debt and pension obligations.
During the 2015 fourth quarter, to permit the Separation, we entered into an amendment to the credit agreement providing for our term loans. The amendment, which became effective upon completion of the Separation, also reduced the revolving credit facility to $300 million and extended its term to November 1, 2020. In connection with the Separation, GCP distributed $750 million to Grace. Using a portion of those proceeds, we repaid $600 million of our euro and U.S. dollar term loans. The Separation had no impact on payment or other terms of the senior notes due in 2021 and 2024, and they remain our obligations.
Cash Resources and Available Credit Facilities
At SeptemberJune 30, 2016,2017, we had available liquidity of $503.0$424.3 million, consisting of $204.4$161.8 million in cash and cash equivalents ($100.145.2 million in the U.S.), $253.8$222.3 million available under our revolving credit facility, and $44.8$40.2 million of available liquidity under various non-U.S. credit facilities. The $300 million revolving credit facility includes a $150 million sublimit for letters of credit.
Our non-U.S. credit facilities are extended to various subsidiaries that use them primarily to issue bank guarantees supporting trade activity and to provide working capital during occasional cash shortfalls. Our credit facility in Germany is secured by third-party accounts receivable, with availability determined on the basis of eligible outstanding receivables. We generally renew these credit facilities as they expire.
The following table summarizes our non-U.S. credit facilities as of SeptemberJune 30, 2016:2017:
|
| | | | | | | | | |
(In millions) | Maximum Borrowing Amount | | Available Liquidity | | Expiration Date |
| Germany | $ | 56.0 |
| | $ | 12.6 |
| | Various through 2017 |
| Other countries | 51.4 |
| | 32.2 |
| | Various through 2017 |
| Total | $ | 107.4 |
| | $ | 44.8 |
| | |
|
| | | | | | | | | |
(In millions) | Maximum Borrowing Amount | | Available Liquidity | | Expiration Date |
| Germany | $ | 56.8 |
| | $ | 13.7 |
| | 12/31/2017 |
| Other countries | 51.3 |
| | 26.5 |
| | Various through 2020 |
| Total | $ | 108.1 |
| | $ | 40.2 |
| | |
Analysis of Cash Flows
The following table summarizes our cash flows for the ninesix months and prior-year period:
| | | | Nine Months Ended September 30, | Six Months Ended June 30, |
| (In millions) | 2016 | | 2015 | 2017 | | 2016 |
| Net cash provided by (used for) operating activities from continuing operations | $ | 207.6 |
| | $ | (229.4 | ) | $ | 140.5 |
| | $ | 136.8 |
|
| Net cash used for investing activities from continuing operations | (324.6 | ) | | (88.3 | ) | |
| Net cash provided by financing activities from continuing operations | 87.4 |
| | 35.9 |
| |
| Net cash provided by (used for) investing activities from continuing operations | | (59.6 | ) | | (291.7 | ) |
| Net cash provided by (used for) financing activities from continuing operations | | (13.2 | ) | | 116.0 |
|
| Effect of currency exchange rate changes on cash and cash equivalents | 2.7 |
| | (3.4 | ) | 3.5 |
| | 1.9 |
|
| Decrease in cash and cash equivalents from continuing operations | (26.9 | ) | | (285.2 | ) | |
| Increase in cash and cash equivalents from discontinued operations | 44.8 |
| | 58.8 |
| |
| Increase (decrease) in cash and cash equivalents from continuing operations | | 71.2 |
| | (37.0 | ) |
| Increase (decrease) in cash and cash equivalents from discontinued operations | | — |
| | 44.8 |
|
| Net increase (decrease) in cash and cash equivalents | 17.9 |
| | (226.4 | ) | 71.2 |
| | 7.8 |
|
| Less: cash and cash equivalents of discontinued operations | (143.4 | ) | | — |
| — |
| | (143.4 | ) |
| Cash and cash equivalents, beginning of period | 329.9 |
| | 557.5 |
| 90.6 |
| | 329.9 |
|
| Cash and cash equivalents, end of period | $ | 204.4 |
| | $ | 331.1 |
| $ | 161.8 |
| | $ | 194.3 |
|
Net cash provided by operating activities from continuing operations for the ninesix months was $207.6$140.5 million, compared with a net use$136.8 million for the prior-year period. The year-over-year change in cash flow was primarily due to higher income and lower cash paid for repositioning, and an income tax refund, partially offset by the 2017 first quarter payment of $30.0 million to fund the PD Trust, higher environmental payments compared with the prior-year period, and better working capital performance in the prior-year period.
Net cash of $229.4used for investing activities from continuing operations for the six months was $59.6 million, compared with $291.7 million for the prior-year period. The year-over-year change in cash flow was primarily due to the 2015 first2016 second quarter payment of $490.0$245.1 million to repurchasefor the warrant issued at emergence, partiallypolyolefin catalysts acquisition, which was slightly offset by higher cash paid for repositioning and higher net cash paid for income taxes$11.3 million in 2016.proceeds from the sale of assets in the same quarter.
Net cash used for investing activities from continuing operations for the nine months was $324.6 million, compared with $88.3 million for the prior-year period. On June 30, 2016, we completed the polyolefin catalysts acquisition for $245.1 million in cash.
Net cash provided by financing activities from continuing operations for the ninesix months was $87.4$13.2 million, compared with $35.9net cash provided of $116.0 million in the prior-year period. In 2016, we received a $750 million distribution of cash from GCP, of which $600 million was used to pay down our euro and U.S. dollar term loans in the first quarter, and we paid cash dividends of $24.1 million. In 2015, we borrowed on the $250 million delayed draw term loan facility, and had higher cash paid for repurchases of common stock.quarter.
Included in net cash provided by (used for) operating activities from continuing operations are Chapter 11 and legacy product, environmental and environmental expensesother claims paid of $17.3$44.2 million and $502.2$6.0 million, restructuring expenses paid of $13.6$7.2 million and $4.2$10.7 million, and repositioning expenses paid of $35.4$2.8 million and $18.6$31.6 million for the ninesix months and prior-year period, respectively; and cash taxes related to repositioning of $2.6 million, and cash paid for third-party acquisition-related costs of $1.6$1.2 million for the nine months.prior-year period. Included in capital expenditures are $1.8 million and $3.0$0.9 million related to repositioning for the nine months and prior-year period. These cash flows totaled $72.3$54.2 million and $528.0$53.0 million for the ninesix months and prior-year period, respectively. We do not include these cash flows when evaluating the performance of our businesses.
Debt and Other Contractual Obligations
Total debt outstanding at SeptemberJune 30, 2016,2017, was $1,590.2$1,603.0 million. During the 2016 first quarter, we repaid $526.9 million
See Note 8 to the Consolidated Financial Statements for a discussion of Financial Assurances.
Employee Benefit Plans
See Note 6 to the Consolidated Financial Statements for further discussion of Pension Plans and Other Postretirement Benefit Plans.
Defined Benefit Pension Plans
The following table presents the components of cash contributions for the advance-funded and pay-as-you-go plans:
| | | | Three Months Ended September 30, | | Nine Months Ended September 30, | Three Months Ended June 30, | | Six Months Ended June 30, |
| (In millions) | 2016 | | 2015 | | 2016 | | 2015 | 2017 | | 2016 | | 2017 | | 2016 |
| U.S. pay-as-you-go plans | $ | 2.0 |
| | $ | 1.7 |
| | $ | 5.6 |
| | $ | 5.2 |
| $ | 1.8 |
| | $ | 1.8 |
| | $ | 3.7 |
| | $ | 3.6 |
|
| Non-U.S. advance-funded plans | 0.4 |
| | 0.3 |
| | 1.0 |
| | 1.1 |
| 0.2 |
| | 0.4 |
| | 0.5 |
| | 0.6 |
|
| Non-U.S. pay-as-you-go plans | 1.7 |
| | 1.8 |
| | 5.5 |
| | 5.2 |
| 2.0 |
| | 2.1 |
| | 3.6 |
| | 3.8 |
|
| Total Cash Contributions | $ | 4.1 |
| | $ | 3.8 |
| | $ | 12.1 |
| | $ | 11.5 |
| $ | 4.0 |
| | $ | 4.3 |
| | $ | 7.8 |
| | $ | 8.0 |
|
We intend to fund non-U.S. pension plans based upon applicable legal requirements and actuarial and trustee recommendations. We contributed $6.5$4.1 million and $4.4 million to these plans during the ninesix months compared with $6.3 million duringand the prior-year period.
Other Contingencies
See Note 8 to the Consolidated Financial Statements for a discussion of our other contingent matters.
Inflation
We recognize that inflationary pressures may have an adverse effect on us through higher asset replacement costs and higher raw materials and other operating costs. We try to minimize these impacts through effective control of operating expenses and productivity improvements as well as price increases to customers.on our products.
We estimate that the cost of replacing our property and equipment today is greater than its historical cost. Accordingly, our depreciation expense would be greater if the expense were stated on a current cost basis.
Critical Accounting Estimates
See the "Critical Accounting Estimates" heading in Management's Discussion and Analysis of Financial Condition and Results of Operations in our Form 10-K for the year ended December 31, 2015,2016, for a discussion of our critical accounting estimates, incorporated by reference into Item 7 thereof.
Recent Accounting Pronouncements
See Note 1 to the Consolidated Financial Statements for a discussion of recent accounting pronouncements and their effect on us.
Forward Looking Statements
This document contains, and our other public communications may contain, forward-looking statements, that is, information related to future, not past, events. Such statements generally include the words "believes," "plans," "intends," "targets," "will," "expects," "suggests," "anticipates," "outlook," "continues" or similar expressions. Forward-looking statements include, without limitation, expected financial positions; results of operations; cash flows; financing plans; business strategy; operating plans; capital and other expenditures; competitive positions; growth opportunities for existing products; benefits from new technology and cost reduction initiatives, plans and objectives; and markets for securities. For these statements, we claim the protectionprotections of the safe harbor for forward-looking statements contained in Section 27A of the Securities Act and Section 21E of the Exchange Act. Like other businesses, we are subject to risks and uncertainties that could cause our actual results to differ materially from our projections or that could cause other forward-looking statements to prove incorrect. Factors that could cause actual eventsresults to differ materially differ from those contained in the forward-looking statements include,
without limitation: risks related to foreign operations, especially in emerging regions; the cost and availability of raw materials and energy; the effectiveness of Grace's research and development and growth investments; acquisitions and divestitures of assets and gains and losses from dispositions; developments affecting Grace’s outstanding indebtedness; developments affecting Grace's funded and unfunded pension obligations; Grace's legal and environmental proceedings;proceedings and insurance recoveries; uncertainties related to Grace's ability to realize the anticipated benefits of the separation transaction; the inability to establish or maintain certain business relationships and relationships
with customers and suppliers or the inability to retain key personnel; costs of compliance with environmental regulation,regulation; changes in tax laws and regulations; and those additional factors set forth in our most recent Annual Report on Form 10-K, this quarterly report on Form 10-Q and current reports on Form 8-K, which have been filed with the Securities and Exchange Commission and are readily available on the Internet at www.sec.gov. Our reported results should not be considered as an indication of our future performance. Readers are cautioned not to place undue reliance on our projections and forward-looking statements, which speak only as of the date thereof.dates made. We undertake no obligation to release publicly release any revisions to the projections and forward-looking statements contained in this document, or to update them to reflect events or circumstances occurring after the date of this document.
Item 3. QUANTITATIVE AND QUALITATIVE DISCLOSURES ABOUT MARKET RISK
With respect to information disclosed in the "Quantitative and Qualitative Disclosures About Market Risk" section of our Annual Report on Form 10-K for the year ended December 31, 20152016, more recent numerical measures and other information are available in the "Financial Statements" and "Management's Discussion and Analysis of Financial Condition and Results of Operations" sections of this Report. These more recent measures and information are incorporated herein by reference.
Item 4. CONTROLS AND PROCEDURES
EVALUATION OF DISCLOSURE CONTROLS AND PROCEDURES
As of SeptemberJune 30, 20162017, Grace carried out an evaluation of the effectiveness of the design and operation of its disclosure controls and procedures pursuant to Rule 13a-15 under the Securities Exchange Act of 1934, as amended (the "Exchange Act"). Based upon that evaluation, Grace's Chief Executive Officer and Chief Financial Officer concluded that Grace's disclosure controls and procedures are effective to ensure that information required to be disclosed in Grace's Exchange Act reports is recorded, processed, summarized and reported within the time periods specified in the SEC's rules and forms, and that material information relating to Grace is made known to management, including Grace's Chief Executive Officer and Chief Financial Officer, as appropriate to allow timely decisions regarding required disclosure.
CHANGES IN INTERNAL CONTROL OVER FINANCIAL REPORTING
There were no changes in Grace's internal control over financial reporting during the quarter ended SeptemberJune 30, 20162017, that have materially affected, or are reasonably likely to materially affect, Grace's internal control over financial reporting.
PART II. OTHER INFORMATION
Item 1. LEGAL PROCEEDINGS
Note 8 to the interim Consolidated Financial Statements in Part I of this Report is incorporated herein by reference.
Item 1A. RISK FACTORS
In addition to the other information set forth below and elsewhere in this Report, you should carefully consider the risk factors discussed in the "Risk Factors" section of our Annual Report on Form 10-K for the year ended December 31, 2015,2016, which could materially affect our business, financial condition or future results. The risks described in this Report and in our Annual Report on Form 10-K are not the only risks facing Grace. Additional risks and uncertainties not currently known to us or that we currently deem to be immaterial also may materially adversely affect our business, financial condition or future results. With respect to certain risk factors discussed in our Annual Report on Form 10-K, more recent numerical measures and other information are available in the "Financial Statements" and "Management's Discussion and Analysis of Financial Condition and Results of Operations" sections of this Report. These more recent measures and information are incorporated herein by reference.
Item 2. UNREGISTERED SALES OF EQUITY SECURITIES AND USE OF PROCEEDS
Share Repurchase Program
On February 5, 2015, we announced that our Board of Directors had authorized a share repurchase program of up to $500 million. On February 8, 2017, we announced that the Board of Directors had authorized an additional share repurchase program of up to $500$250 million. Repurchases under the programprograms may be made through one or more open market transactions at prevailing market prices; unsolicited or solicited privately negotiated transactions; accelerated share repurchase programs; or through any combination of the foregoing, or in such other manner as determined by management. The timing of the repurchases and the actual amount repurchased will depend on a variety of factors, including the market price of the Company's shares, the strategic deployment of capital, and general market and economic conditions.
The following table presents information regarding the repurchase of Company common stock by Grace or any "affiliated purchaser" of Grace during the three months ended SeptemberJune 30, 2016:2017:
|
| | | | | | | | | | | | |
| Period | | Total number of shares purchased (#) | | Average price paid per share ($/share) | | Total number of shares purchased as part of publicly announced plans or programs (#) | | Approximate dollar value of shares that may yet be purchased under the plans or programs ($ in millions) |
| 7/1/2016 - 7/31/2016 | | 83,490 |
| | 74.97 |
| | 83,490 |
| | 187.5 |
|
| 8/1/2016 - 8/31/2016 | | 92,600 |
| | 76.00 |
| | 92,600 |
| | 180.6 |
|
| 9/1/2016 - 9/30/2016 | | 89,432 |
| | 74.90 |
| | 89,432 |
| | 173.4 |
|
| Total | | 265,522 |
| | 75.31 |
| | 265,522 |
| |
|
|
|
| | | | | | | | | | | | |
| Period | | Total number of shares purchased (#) | | Average price paid per share ($/share) | | Total number of shares purchased as part of publicly announced plans or programs (#) | | Approximate dollar value of shares that may yet be purchased under the plans or programs ($ in millions)(1) |
| 4/1/2017 - 4/30/2017 | | — |
| | — |
| | — |
| | 23.9 |
|
| 5/1/2017 - 5/31/2017 | | 127,265 |
| | 70.37 |
| | 127,265 |
| | 14.9 |
|
| 6/1/2017 - 6/30/2017 | | 156,037 |
| | 70.78 |
| | 156,037 |
| | 3.9 |
|
| Total | | 283,302 |
| | 70.60 |
| | 283,302 |
| |
|
|
| |
| (1) | Approximate dollar value remaining relates only to the currently active share repurchase program. Once that program is complete, Grace expects to begin repurchasing shares under the additional $250 million authorization. |
Item 4. MINE SAFETY DISCLOSURES
Information concerning mine safety violations or other regulatory matters required by Section 1503(a) of the Dodd-Frank Wall Street Reform and Consumer Protection Act and Item 104 of Regulation S-K (17 CFR 229.104) is included in Exhibit 95 to this Report.
Item 6. EXHIBITS
In reviewing the agreements included as exhibits to this and other Reports filed by Grace with the Securities and Exchange Commission, please remember they are included to provide you with information regarding their terms and are not intended to provide any other factual or disclosure information about Grace or other parties to the agreements. The agreements generally contain representations and warranties by each of the parties to the
applicable agreement. These representations and warranties have been made solely for the benefit of the other parties to the applicable agreement. These representations and warranties:
Are not statements of fact, but rather are used to allocate risk to one of the parties if the statements prove to be inaccurate;
May have been qualified by disclosures that were made to the other parties in connection with the negotiation of the applicable agreement, which disclosures are not necessarily reflected in the agreement;
May apply standards of materiality in a way that is different from what may be viewed as material to you or other investors; and
Were made only as of the date of the applicable agreement or such other date or dates as may be specified in the agreement and do not reflect more recent developments.
Accordingly, these representations and warranties may not describe the actual state of affairs as of the date they were made or at any other time. Additional information about Grace may be found elsewhere in this report and Grace's other public filings, which are available without charge through the Securities and Exchange Commission's website at http://www.sec.gov.
The following is a list of Exhibits filed as part of this Quarterly Report on Form 10-Q:
|
| | | | |
| Exhibit No. | | Description of Exhibit | | Location |
2.1 | | Separation and Distribution Agreement dated as of January 27, 2016 by and among W. R. Grace & Co., W. R. Grace & Co.-Conn. and GCP Applied Technologies Inc. | | Exhibit 2.1 to Form 8-K (filed 1/27/16) SEC File No.: 001-13953 |
| 3.1 | | Amended and Restated Certificate of Incorporation. | | Exhibit 3.01 to Form 8-K (filed 2/07/14) SEC File No.: 001-13953 |
| 3.2 | | Amended and Restated By-laws. | | Exhibit 3.01 to Form 8-K (filed 1/23/15) SEC File No.: 001-13953 |
4.1 | | Credit Agreement dated as of February 3, 2016 by and among GCP Applied Technologies Inc., Grace Construction Products Limited, Grace NV, each lender from time to time party thereto, and Deutsche Bank AG, as Administrative Agent. | | Exhibit 10.1 to Form 8-K (filed 2/03/16) SEC File No.: 001-13953 |
4.2 | | Indenture, dated as of January 27, 2016, by and among GCP Applied Technologies Inc., the guarantors party thereto and Wilmington Trust, National Association, as trustee. | | Exhibit 4.1 to Form 8-K (filed 1/27/16) SEC File No.: 001-13953 |
4.3 | | Form of 9.500% Note due 2023 (included as Exhibit A to Exhibit 4.2) | | Exhibit 4.2 (included as Exhibit A to Exhibit 4.2) to Form 8-K (filed 1/27/16) SEC File No.: 001-13953 |
| 15 | | Accountants' Awareness Letter | | Filed herewith |
| 31(i).1 | | Certification of Periodic Report by Chief Executive Officer under Section 302 of the Sarbanes-Oxley Act of 2002 | | Filed herewith |
| 31(i).2 | | Certification of Periodic Report by Chief Financial Officer under Section 302 of the Sarbanes-Oxley Act of 2002 | | Filed herewith |
| 32 | | Certification of Periodic Report by Chief Executive Officer and Chief Financial Officer under Section 906 of the Sarbanes-Oxley Act of 2002 | | Filed herewith |
| 95 | | Mine Safety Disclosure Exhibit | | Filed herewith |
| 101.INS | | XBRL Instance Document | | Filed herewith |
| 101.SCH | | XBRL Taxonomy Extension Schema | | Filed herewith |
| 101.CAL | | XBRL Taxonomy Extension Calculation Linkbase | | Filed herewith |
| 101.DEF | | XBRL Taxonomy Extension Definition Linkbase | | Filed herewith |
| 101.LAB | | XBRL Taxonomy Extension Label Linkbase | | Filed herewith |
| 101.PRE | | XBRL Taxonomy Extension Presentation Linkbase | | Filed herewith |
| |
| * | Management contracts and compensatory plans, contracts or arrangements required to be filed as exhibits to this Report. |
SIGNATURES
Pursuant to the requirements of the Securities Exchange Act of 1934, the Registrant has duly caused this Report to be signed on its behalf by the undersigned thereunto duly authorized.
|
| | |
| | W. R. GRACE & CO. (Registrant) |
| | | |
Date: 11/3/20167/28/2017 | By: | /s/ A. E. FESTA |
| | | A. E. Festa (Chairman and Chief Executive Officer) |
| | | |
Date: 11/3/20167/28/2017 | By: | /s/ THOMAS E. BLASER |
| | | Thomas E. Blaser (Senior Vice President and Chief Financial Officer) |
| | | |
Date: 11/3/20167/28/2017 | By: | /s/ WILLIAM C. DOCKMAN |
| | | William C. Dockman (Vice President and Controller) |
EXHIBIT INDEX
|
| | | | |
| Exhibit No. | | Description of Exhibit | | Location |
2.1 | | Separation and Distribution Agreement dated as of January 27, 2016 by and among W. R. Grace & Co., W. R. Grace & Co.-Conn. and GCP Applied Technologies Inc. | | Exhibit 2.1 to Form 8-K (filed 1/27/16) SEC File No.: 001-13953 |
| 3.1 | | | | Exhibit 3.01 to Form 8-K (filed 2/07/14) SEC File No.: 001-13953 |
| 3.2 | | | | Exhibit 3.01 to Form 8-K (filed 1/23/15) SEC File No.: 001-13953 |
4.1 | | Credit Agreement dated as of February 3, 2016 by and among GCP Applied Technologies Inc., Grace Construction Products Limited, Grace NV, each lender from time to time party thereto, and Deutsche Bank AG, as Administrative Agent. | | Exhibit 10.1 to Form 8-K (filed 2/03/16) SEC File No.: 001-13953 |
4.2 | | Indenture, dated as of January 27, 2016, by and among GCP Applied Technologies Inc., the guarantors party thereto and Wilmington Trust, National Association, as trustee. | | Exhibit 4.1 to Form 8-K (filed 1/27/16) SEC File No.: 001-13953 |
4.3 | | Form of 9.500% Note due 2023 (included as Exhibit A to Exhibit 4.2) | | Exhibit 4.2 (included as Exhibit A to Exhibit 4.2) to Form 8-K (filed 1/27/16) SEC File No.: 001-13953 |
| 15 | | | | Filed herewith |
| 31(i).1 | | | | Filed herewith |
| 31(i).2 | | | | Filed herewith |
| 32 | | | | Filed herewith |
| 95 | | | | Filed herewith |
| 101.INS | | XBRL Instance Document | | Filed herewith |
| 101.SCH | | XBRL Taxonomy Extension Schema | | Filed herewith |
| 101.CAL | | XBRL Taxonomy Extension Calculation Linkbase | | Filed herewith |
| 101.DEF | | XBRL Taxonomy Extension Definition Linkbase | | Filed herewith |
| 101.LAB | | XBRL Taxonomy Extension Label Linkbase | | Filed herewith |
| 101.PRE | | XBRL Taxonomy Extension Presentation Linkbase | | Filed herewith |
| |
| * | Management contracts and compensatory plans, contracts or arrangements required to be filed as exhibits to this Report. |