UNITED STATES
SECURITIES AND EXCHANGE COMMISSION
Washington, D.C. 20549
FORM 10-Q
|
| | |
| ý | | QUARTERLY REPORT PURSUANT TO SECTION 13 OR 15(d) OF THE SECURITIES EXCHANGE ACT OF 1934 |
For the Quarterly Period Ended SeptemberJune 30, 20172018 |
| or |
| o | | TRANSITION REPORT PURSUANT TO SECTION 13 OR 15(d) OF THE SECURITIES EXCHANGE ACT OF 1934 |
| Commission File Number 1-13953 |
W. R. GRACE & CO.
(Exact name of registrant as specified in its charter)
|
| |
Delaware (State or other jurisdiction of incorporation or organization) | 65-0773649 (I.R.S. Employer Identification No.) |
7500 Grace Drive, Columbia, Maryland 21044-4098
(Address of principal executive offices) (Zip Code)code)
(410) 531-4000
(Registrant'sRegistrant’s telephone number, including area code)
Indicate by check mark whether the registrant (1) has filed all reports required to be filed by Section 13 or 15(d) of the Securities Exchange Act of 1934 during the preceding 12 months (or for such shorter period that the registrant was required to file such reports), and (2) has been subject to such filing requirements for the past 90 days. Yes ý No o
Indicate by check mark whether the registrant has submitted electronically and posted on its corporate website, if any, every Interactive Data File required to be submitted and posted pursuant to Rule 405 of Regulation S-T (§232.405 of this chapter) during the preceding 12 months (or for such shorter period that the registrant was required to submit and post such files). Yes ý No o
Indicate by check mark whether the registrant is a large accelerated filer, an accelerated filer, a non-accelerated filer, a smaller reporting company, or an emerging growth company. See the definitions of "large“large accelerated filer," "accelerated” “accelerated filer," "smaller” “smaller reporting company,"” and "emerging“emerging growth company"company” in Rule 12b-2 of the Exchange Act.
|
| | |
Large accelerated filer ý | | Accelerated filer o |
Non-accelerated filer o (Do not check if a smaller reporting company) | | Smaller reporting company o |
Emerging growth company o | | |
If an emerging growth company, indicate by check mark if the registrant has elected not to use the extended transition period for complying with any new or revised financial accounting standards provided pursuant to Section 13(a) of the Exchange Act. o
Indicate by check mark whether the registrant is a shell company (as defined in Rule 12b-2 of the Exchange Act). Yes o No ý
Indicate by check mark whether the registrant has filed all documents and reports required to be filed by Sections 12, 13 or 15(d) of the Securities Exchange Act of 1934 subsequent to the distribution of securities under a plan confirmed by a court. Yes ý No o
Indicate the number of shares outstanding of each of the issuer'sissuer’s classes of common stock, as of the latest practicable date.
|
| | |
| Class | | Outstanding at OctoberJuly 31, 20172018 |
| Common Stock, $0.01 par value per share | | 67,763,20167,238,067 shares |
TABLE OF CONTENTS
GRACE®, the GRACE® logo and, except as otherwise indicated, the other trademarks, service marks or trade names used in the text of this Report are trademarks, service marks, or trade names of operating units of W. R. Grace & Co. or its subsidiaries and/or affiliates. Unless the context indicates otherwise, indicated, in this Report the terms "Grace," "we," "us,"“Grace,” “we,” “us,” or "our"“our” mean W. R. Grace & Co. and/or its consolidated subsidiaries and affiliates, and the term "the Company"the “Company” means W. R. Grace & Co. Unless otherwise indicated, the contents of websites mentioned in this report are not incorporated by reference or otherwise made a part of this Report.
The Financial Accounting Standards Board® is referred to in this Report as the "FASB."“FASB.” The FASB issues, among other things, the FASB Accounting Standards Codifications ("ASC"Codification® (“ASC”) and Accounting Standards Updates ("ASU"(“ASU”).
The U.S. Internal Revenue Service is referred to in this Report as the “IRS.”
PART I. FINANCIAL INFORMATION
Item 1. Financial Statements
Review by Independent Registered Public Accounting Firm
With respect to the interim consolidated financial statements included in this Quarterly Report on Form 10-Q for the quarter ended SeptemberJune 30, 20172018, PricewaterhouseCoopers LLP, the Company'sCompany’s independent registered public accounting firm, has applied limited procedures in accordance with professional auditing standards for a review of such information. Their report on the interim consolidated financial statements, which follows, states that they did not audit and they do not express an opinion on the unaudited interim consolidated financial statements. Accordingly, the degree of reliance on their report on the unaudited interim consolidated financial statements should be restricted in light of the limited nature of the review procedures applied. This report is not considered a "report"“report” within the meaning of Sections 7 and 11 of the Securities Act of 1933, and, therefore, the independent accountants'accountants’ liability under Section 11 does not extend to it.
Report of Independent Registered Public Accounting Firm
To the Shareholders and Board of Directors of W. R. Grace & Co.:
Results of Review of Financial Statements
We have reviewed the accompanying consolidated balance sheet of W. R. Grace & Co. and its subsidiaries as of SeptemberJune 30, 2017,2018, and the related consolidated statements of operations and comprehensive income (loss) for the three-month and nine-monthsix-month periods ended SeptemberJune 30, 20172018 and 20162017 and the consolidated statements of equity and of cash flows and equity for the nine-monthsix-month periods ended SeptemberJune 30, 2018 and 2017, and 2016. Theseincluding the related notes (collectively referred to as the “interim financial statements”). Based on our reviews, we are not aware of any material modifications that should be made to the accompanying interim financial statements arefor them to be in conformity with accounting principles generally accepted in the responsibilityUnited States of the Company’s management.America.
We conducted our reviewhave previously audited, in accordance with the standards of the Public Company Accounting Oversight Board (United States)., the consolidated balance sheet of the Company as of December 31, 2017, and the related consolidated statements of operations, of comprehensive income, of equity, and of cash flows for the year then ended (not presented herein), and in our report dated February 22, 2018, we expressed an unqualified opinion on those consolidated financial statements. In our opinion, the information set forth in the accompanying consolidated balance sheet information as of December 31, 2017, is fairly stated, in all material respects, in relation to the consolidated balance sheet from which it has been derived.
Basis for Review Results
These interim financial statements are the responsibility of the Company’s management. We are a public accounting firm registered with the Public Company Accounting Oversight Board (United States) (“PCAOB”) and are required to be independent with respect to the Company in accordance with the U.S. federal securities laws and the applicable rules and regulations of the Securities and Exchange Commission and the PCAOB. We conducted our review in accordance with the standards of the PCAOB. A review of interim financial information consists principally of applying analytical procedures and making inquiries of persons responsible for financial and accounting matters. It is substantially less in scope than an audit conducted in accordance with the standards of the Public Company Accounting Oversight Board (United States),PCAOB, the objective of which is the expression of an opinion regarding the financial statements taken as a whole. Accordingly, we do not express such an opinion.
Based on our review, we are not aware of any material modifications that should be made to the accompanying consolidated interim financial statements for them to be in conformity with accounting principles generally accepted in the United States of America.
We previously audited, in accordance with the standards of the Public Company Accounting Oversight Board (United States), the consolidated balance sheet as of December 31, 2016, and the related consolidated statements of operations, comprehensive income, equity and of cash flows for the year then ended (not presented herein), and in our report dated February 23, 2017, which included a paragraph describing a change in the manner of accounting for debt issuance costs and stock compensation in 2016, we expressed an unqualified opinion on those consolidated financial statements. In our opinion, the information set forth in the accompanying consolidated balance sheet as of December 31, 2016, is fairly stated in all material respects in relation to the consolidated balance sheet from which it has been derived.
/s/ PricewaterhouseCoopers LLP
Baltimore, Maryland
November 2, 2017August 8, 2018
W. R. Grace & Co. and Subsidiaries
Consolidated Statements of Operations (unaudited)
| | | | Three Months Ended September 30, | | Nine Months Ended September 30, | Three Months Ended June 30, | | Six Months Ended June 30, |
| (In millions, except per share amounts) | 2017 | | 2016 | | 2017 | | 2016 | 2018 | | 2017 | | 2018 | | 2017 |
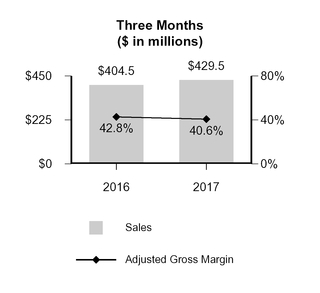
| Net sales | $ | 429.5 |
| | $ | 404.5 |
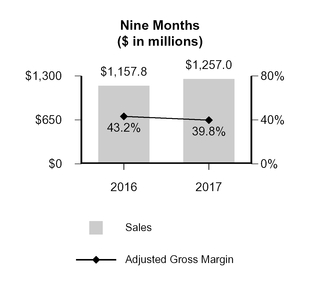
| | $ | 1,257.0 |
| | $ | 1,157.8 |
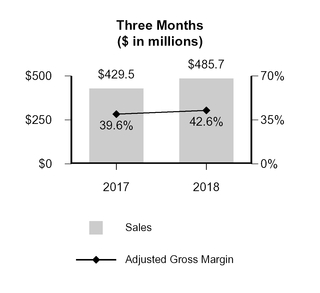
| $ | 485.7 |
| | $ | 429.5 |
| | $ | 917.2 |
| | $ | 827.5 |
|
| Cost of goods sold | 256.2 |
| | 236.3 |
| | 761.2 |
| | 663.7 |
| 287.0 |
| | 262.3 |
| | 549.0 |
| | 507.1 |
|
| Gross profit | 173.3 |
| | 168.2 |
| | 495.8 |
| | 494.1 |
| 198.7 |
| | 167.2 |
| | 368.2 |
| | 320.4 |
|
| Selling, general and administrative expenses | 70.5 |
| | 67.1 |
| | 207.3 |
| | 201.5 |
| 82.2 |
| | 69.3 |
| | 151.5 |
| | 134.8 |
|
| Research and development expenses | 13.3 |
| | 12.1 |
| | 39.4 |
| | 36.2 |
| 16.1 |
| | 13.6 |
| | 30.8 |
| | 27.5 |
|
| Provision for environmental remediation, net | 6.4 |
| | 11.9 |
| | 19.6 |
| | 19.4 |
| 0.5 |
| | 13.2 |
| | 0.6 |
| | 13.2 |
|
| Equity in earnings of unconsolidated affiliate | (4.8 | ) | | (8.5 | ) | | (17.9 | ) | | (18.0 | ) | (8.2 | ) | | (6.1 | ) | | (13.6 | ) | | (13.1 | ) |
| Restructuring and repositioning expenses | 9.3 |
| | 5.6 |
| | 17.0 |
| | 28.6 |
| 18.8 |
| | 5.4 |
| | 24.4 |
| | 7.7 |
|
| Interest expense and related financing costs | 20.1 |
| | 19.8 |
| | 59.7 |
| | 61.6 |
| 19.9 |
| | 20.1 |
| | 39.2 |
| | 39.6 |
|
| Other (income) expense, net | (0.2 | ) | | (0.5 | ) | | (12.0 | ) | | 13.3 |
| 5.8 |
| | (11.4 | ) | | 3.5 |
| | (13.3 | ) |
| Total costs and expenses | 114.6 |
| | 107.5 |
| | 313.1 |
| | 342.6 |
| 135.1 |
| | 104.1 |
| | 236.4 |
| | 196.4 |
|
| Income (loss) from continuing operations before income taxes | 58.7 |
| | 60.7 |
| | 182.7 |
| | 151.5 |
| |
| Income (loss) before income taxes | | 63.6 |
| | 63.1 |
| | 131.8 |
| | 124.0 |
|
| (Provision for) benefit from income taxes | (11.6 | ) |
| (19.4 | ) | | (49.2 | ) | | (62.1 | ) | (25.0 | ) |
| (19.6 | ) | | (49.8 | ) | | (37.6 | ) |
| Income (loss) from continuing operations | 47.1 |
|
| 41.3 |
| | 133.5 |
| | 89.4 |
| |
| Income (loss) from discontinued operations, net of income taxes | — |
| | (1.6 | ) | | — |
| | (10.9 | ) | |
| Net income (loss) | 47.1 |
| | 39.7 |
| | 133.5 |
| | 78.5 |
| 38.6 |
| | 43.5 |
| | 82.0 |
| | 86.4 |
|
| Less: Net (income) loss attributable to noncontrolling interests | 0.3 |
| | (0.1 | ) | | 0.7 |
| | 0.3 |
| 0.2 |
| | 0.4 |
| | 0.4 |
| | 0.4 |
|
| Net income (loss) attributable to W. R. Grace & Co. shareholders | $ | 47.4 |
| | $ | 39.6 |
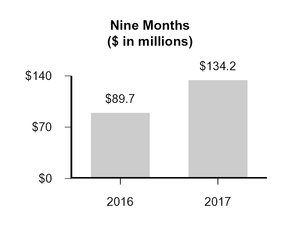
| | $ | 134.2 |
| | $ | 78.8 |
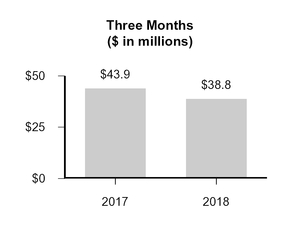
| $ | 38.8 |
| | $ | 43.9 |
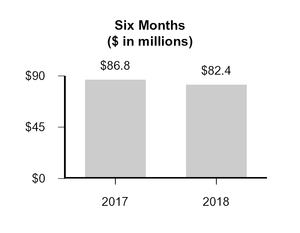
| | $ | 82.4 |
| | $ | 86.8 |
|
| Amounts Attributable to W. R. Grace & Co. Shareholders: | | | | | | | | |
| Income (loss) from continuing operations attributable to W. R. Grace & Co. shareholders | $ | 47.4 |
| | $ | 41.2 |
| | $ | 134.2 |
| | $ | 89.7 |
| |
| Income (loss) from discontinued operations, net of income taxes | — |
| | (1.6 | ) | | — |
| | (10.9 | ) | |
| Net income (loss) attributable to W. R. Grace & Co. shareholders | $ | 47.4 |
| | $ | 39.6 |
| | $ | 134.2 |
| | $ | 78.8 |
| |
| Earnings Per Share Attributable to W. R. Grace & Co. Shareholders | | | | | | | | | | | | | | |
| Basic earnings per share: | | | | | | | | | | | | | | |
| Income (loss) from continuing operations | $ | 0.70 |
| | $ | 0.59 |
| | $ | 1.97 |
| | $ | 1.27 |
| |
| Income (loss) from discontinued operations, net of income taxes | — |
| | (0.03 | ) | | — |
| | (0.15 | ) | |
| Net income (loss) | $ | 0.70 |
| | $ | 0.56 |
| | $ | 1.97 |
| | $ | 1.12 |
| $ | 0.58 |
| | $ | 0.64 |
| | $ | 1.22 |
| | $ | 1.27 |
|
| Weighted average number of basic shares | 67.9 |
|
| 70.3 |
| | 68.2 |
| | 70.5 |
| 67.3 |
|
| 68.3 |
| | 67.4 |
| | 68.3 |
|
| Diluted earnings per share: | | | | | | | | | | | | | | |
| Income (loss) from continuing operations | $ | 0.70 |
| | $ | 0.58 |
| | $ | 1.96 |
| | $ | 1.27 |
| |
| Income (loss) from discontinued operations, net of income taxes | — |
| | (0.02 | ) | | — |
| | (0.16 | ) | |
| Net income (loss) | $ | 0.70 |
| | $ | 0.56 |
| | $ | 1.96 |
| | $ | 1.11 |
| $ | 0.58 |
| | $ | 0.64 |
| | $ | 1.22 |
| | $ | 1.27 |
|
| Weighted average number of diluted shares | 68.0 |
| | 70.7 |
| | 68.3 |
| | 70.9 |
| 67.4 |
| | 68.4 |
| | 67.5 |
| | 68.5 |
|
| Dividends per common share | $ | 0.21 |
| | $ | 0.17 |
| | $ | 0.63 |
| | $ | 0.34 |
| $ | 0.24 |
| | $ | 0.21 |
| | $ | 0.48 |
| | $ | 0.42 |
|
The Notes to Consolidated Financial Statements are an integral part of these statements.
5
W. R. Grace & Co. and Subsidiaries
Consolidated Statements of Comprehensive Income (Loss) (unaudited)
| | | | Three Months Ended September 30, | | Nine Months Ended September 30, | Three Months Ended June 30, | | Six Months Ended June 30, |
| (In millions) | 2017 | | 2016 | | 2017 | | 2016 | 2018 | | 2017 | | 2018 | | 2017 |
| Net income (loss) | $ | 47.1 |
| | $ | 39.7 |
| | $ | 133.5 |
| | $ | 78.5 |
| $ | 38.6 |
| | $ | 43.5 |
| | $ | 82.0 |
| | $ | 86.4 |
|
| Other comprehensive income (loss): | | | | | | | | |
| Defined benefit pension and other postretirement plans, net of income taxes | (0.3 | ) | | (0.3 | ) | | (1.0 | ) | | (1.0 | ) | |
| Currency translation adjustments, net of income taxes | (12.1 | ) | | (2.3 | ) | | (21.8 | ) | | (6.4 | ) | |
| Gain (loss) from hedging activities, net of income taxes | (0.4 | ) | | 0.6 |
| | 0.1 |
| | (2.7 | ) | |
| Total other comprehensive income (loss) attributable to noncontrolling interests | — |
| | — |
| | — |
| | 2.6 |
| |
| Other comprehensive income (loss), net of income taxes: | | | | | | | | |
| Defined benefit pension and other postretirement plans | | (0.2 | ) | | (0.4 | ) | | (0.4 | ) | | (0.7 | ) |
| Currency translation adjustments | | 37.9 |
| | (8.3 | ) | | 19.7 |
| | (9.7 | ) |
| Gain (loss) from hedging activities | | (5.2 | ) | | (0.2 | ) | | (3.4 | ) | | 0.5 |
|
| Total other comprehensive income (loss) | (12.8 | ) | | (2.0 | ) | | (22.7 | ) | | (7.5 | ) | 32.5 |
| | (8.9 | ) | | 15.9 |
| | (9.9 | ) |
| Comprehensive income (loss) | 34.3 |
| | 37.7 |
| | 110.8 |
| | 71.0 |
| 71.1 |
| | 34.6 |
| | 97.9 |
| | 76.5 |
|
| Less: comprehensive (income) loss attributable to noncontrolling interests | 0.3 |
| | (0.1 | ) | | 0.7 |
| | (2.3 | ) | 0.2 |
| | 0.4 |
| | 0.4 |
| | 0.4 |
|
| Comprehensive income (loss) attributable to W. R. Grace & Co. shareholders | $ | 34.6 |
| | $ | 37.6 |
| | $ | 111.5 |
| | $ | 68.7 |
| $ | 71.3 |
| | $ | 35.0 |
| | $ | 98.3 |
| | $ | 76.9 |
|
The Notes to Consolidated Financial Statements are an integral part of these statements.
6
W. R. Grace & Co. and Subsidiaries
Consolidated Statements of Cash Flows (unaudited)
| | | | Nine Months Ended September 30, | Six Months Ended June 30, |
| (In millions) | 2017 | | 2016 | 2018 | | 2017 |
| OPERATING ACTIVITIES | | | | | | |
| Net income (loss) | $ | 133.5 |
| | $ | 78.5 |
| $ | 82.0 |
| | $ | 86.4 |
|
| Less: loss (income) from discontinued operations | — |
| | 10.9 |
| |
| Income from continuing operations | 133.5 |
| | 89.4 |
| |
| Reconciliation to net cash provided by (used for) operating activities from continuing operations: | | | | |
| Reconciliation to net cash provided by (used for) operating activities: | | | | |
| Depreciation and amortization | 82.6 |
| | 73.8 |
| 50.9 |
| | 54.2 |
|
| Equity in earnings of unconsolidated affiliate | (17.9 | ) | | (18.0 | ) | (13.6 | ) | | (13.1 | ) |
| Dividends received from unconsolidated affiliate | 19.0 |
| | 24.8 |
| |
| Costs related to legacy product, environmental and other claims | 25.5 |
|
| 24.2 |
| 4.3 |
|
| 17.0 |
|
| Cash paid for legacy product, environmental and other claims | (50.1 | ) | | (17.3 | ) | (12.6 | ) | | (44.2 | ) |
| Provision for (benefit from) income taxes | 49.2 |
| | 62.1 |
| 49.8 |
| | 37.6 |
|
| Cash paid for income taxes | (44.1 | ) | | (42.4 | ) | (16.7 | ) | | (31.3 | ) |
| Income tax refunds received | 30.2 |
| | 2.3 |
| 0.1 |
| | 29.7 |
|
| Loss on early extinguishment of debt | — |
| | 11.1 |
| 4.8 |
| | — |
|
| Interest expense and related financing costs | 59.7 |
|
| 61.6 |
| 39.2 |
|
| 39.6 |
|
| Cash paid for interest | (40.1 | ) | | (45.5 | ) | (39.6 | ) | | (34.3 | ) |
| Defined benefit pension expense | 11.6 |
| | 8.2 |
| 7.8 |
| | 8.2 |
|
| Cash paid under defined benefit pension arrangements | (12.2 | ) | | (12.1 | ) | (57.9 | ) | | (7.8 | ) |
| Accounts receivable reserve—Venezuela | 10.0 |
| | — |
| |
| Changes in assets and liabilities, excluding effect of currency translation and acquisitions: | | | | | | |
| Trade accounts receivable | 20.7 |
| | 9.7 |
| 14.8 |
| | 4.3 |
|
| Inventories | (4.5 | ) | | (5.8 | ) | (50.8 | ) | | (3.9 | ) |
| Accounts payable | 3.0 |
| | 11.0 |
| 34.0 |
| | 7.4 |
|
| All other items, net | (8.6 | ) | | (29.5 | ) | 22.5 |
| | (9.3 | ) |
| Net cash provided by (used for) operating activities from continuing operations | 267.5 |
| | 207.6 |
| |
| Net cash provided by (used for) operating activities | | 119.0 |
| | 140.5 |
|
| INVESTING ACTIVITIES | | | | | | |
| Capital expenditures | (85.6 | ) | | (89.4 | ) | (90.8 | ) | | (59.1 | ) |
| Business acquired | (3.5 | ) | | (245.1 | ) | |
| Proceeds from sale of assets | 0.6 |
| | 11.3 |
| |
| Business acquired, net of cash acquired | | (420.9 | ) | | — |
|
| Other investing activities | (1.5 | ) | | (1.4 | ) | 12.7 |
| | 0.3 |
|
| Net cash provided by (used for) investing activities from continuing operations | (90.0 | ) | | (324.6 | ) | |
| Net cash provided by (used for) investing activities | | (499.0 | ) | | (58.8 | ) |
| FINANCING ACTIVITIES | | | | | | |
| Borrowings under credit arrangements | 106.3 |
| | 20.6 |
| 983.2 |
| | 98.8 |
|
| Repayments under credit arrangements | (108.9 | ) | | (614.9 | ) | (541.8 | ) | | (61.5 | ) |
| Cash paid for debt financing costs | | (11.8 | ) | | (0.2 | ) |
| Cash paid for repurchases of common stock | (65.0 | ) | | (55.1 | ) | (49.8 | ) | | (30.0 | ) |
| Proceeds from exercise of stock options | 14.8 |
| | 13.3 |
| 6.4 |
| | 12.2 |
|
| Dividends paid | (43.0 | ) | | (24.1 | ) | |
| Distribution from GCP | — |
| | 750.0 |
| |
| Dividends paid to shareholders | | (32.4 | ) | | (28.7 | ) |
| Other financing activities | (3.8 | ) | | (2.4 | ) | (3.5 | ) | | (3.8 | ) |
| Net cash provided by (used for) financing activities from continuing operations | (99.6 | ) | | 87.4 |
| |
| Effect of currency exchange rate changes on cash and cash equivalents | 7.2 |
| | 2.7 |
| |
| Increase (decrease) in cash and cash equivalents from continuing operations | 85.1 |
| | (26.9 | ) | |
| Cash flows from discontinued operations | | | | |
| Net cash provided by (used for) operating activities | — |
| | 23.9 |
| |
| Net cash provided by (used for) investing activities | — |
| | (9.5 | ) | |
| Net cash provided by (used for) financing activities | — |
| | 31.4 |
| 350.3 |
| | (13.2 | ) |
| Effect of currency exchange rate changes on cash and cash equivalents | — |
| | (1.0 | ) | |
| Increase (decrease) in cash and cash equivalents from discontinued operations | — |
| | 44.8 |
| |
| Effect of currency exchange rate changes on cash, cash equivalents, and restricted cash | | (1.0 | ) | | 3.5 |
|
| Net increase (decrease) in cash and cash equivalents | 85.1 |
|
| 17.9 |
| (30.7 | ) |
| 72.0 |
|
| Less: cash and cash equivalents of discontinued operations | — |
| | (143.4 | ) | |
| Cash and cash equivalents, beginning of period | 90.6 |
| | 329.9 |
| |
| Cash and cash equivalents, end of period | $ | 175.7 |
| | $ | 204.4 |
| |
| Cash, cash equivalents, and restricted cash, beginning of period | | 163.5 |
| | 100.6 |
|
| Cash, cash equivalents, and restricted cash, end of period | | $ | 132.8 |
| | $ | 172.6 |
|
| | | | | | | |
| Supplemental disclosure of cash flow information | | | | | | |
| Capital expenditures in accounts payable | $ | 20.2 |
| | $ | 15.2 |
| $ | 38.7 |
| | $ | 17.8 |
|
| Net share settled stock option exercises | 1.2 |
| | 10.4 |
| |
The Notes to Consolidated Financial Statements are an integral part of these statements.
7
W. R. Grace & Co. and Subsidiaries
Consolidated Balance Sheets (unaudited)
| | | (In millions, except par value and shares) | September 30,
2017 | | December 31,
2016 | June 30,
2018 | | December 31,
2017 |
| ASSETS | | | | | | |
| Current Assets | | | | | | |
| Cash and cash equivalents | $ | 175.7 |
| | $ | 90.6 |
| $ | 131.5 |
| | $ | 152.8 |
|
| Restricted cash and cash equivalents | 10.8 |
| | 10.0 |
| 1.3 |
| | 10.7 |
|
| Trade accounts receivable, less allowance of $12.6 (2016—$2.2) | 253.1 |
| | 273.9 |
| |
| Trade accounts receivable, less allowance of $11.7 (2017—$11.7) | | 277.5 |
| | 285.2 |
|
| Inventories | 239.5 |
| | 228.0 |
| 307.4 |
| | 230.9 |
|
| Other current assets | 36.3 |
|
| 52.3 |
| 70.7 |
|
| 49.0 |
|
| Total Current Assets | 715.4 |
| | 654.8 |
| 788.4 |
| | 728.6 |
|
| Properties and equipment, net of accumulated depreciation and amortization of $1,438.2 (2016—$1,327.5) | 762.8 |
| | 729.6 |
| |
| Properties and equipment, net of accumulated depreciation and amortization of $1,482.4 (2017—$1,463.4) | | 955.9 |
| | 799.1 |
|
| Goodwill | 401.7 |
| | 394.2 |
| 541.2 |
| | 402.4 |
|
| Technology and other intangible assets, net | 259.2 |
| | 269.1 |
| 364.5 |
| | 255.4 |
|
| Deferred income taxes | 694.1 |
| | 709.4 |
| 535.4 |
| | 556.5 |
|
| Investment in unconsolidated affiliate | 118.0 |
| | 117.6 |
| 138.7 |
| | 125.9 |
|
| Other assets | 34.7 |
|
| 37.1 |
| 78.1 |
|
| 39.1 |
|
| Total Assets | $ | 2,985.9 |
| | $ | 2,911.8 |
| $ | 3,402.2 |
| | $ | 2,907.0 |
|
| LIABILITIES AND EQUITY | | | | | | |
| Current Liabilities | | | | | | |
| Debt payable within one year | $ | 46.5 |
| | $ | 76.5 |
| $ | 23.3 |
| | $ | 20.1 |
|
| Accounts payable | 195.2 |
| | 195.4 |
| 262.5 |
| | 210.3 |
|
| Other current liabilities | 207.9 |
| | 208.9 |
| 217.3 |
| | 217.8 |
|
| Total Current Liabilities | 449.6 |
| | 480.8 |
| 503.1 |
| | 448.2 |
|
| Debt payable after one year | 1,521.9 |
| | 1,507.6 |
| 1,963.3 |
| | 1,523.8 |
|
| Underfunded and unfunded defined benefit pension plans | 452.1 |
| | 424.3 |
| 452.2 |
| | 502.4 |
|
| Other liabilities | 165.3 |
| | 126.7 |
| 188.7 |
| | 169.3 |
|
| Total Liabilities | 2,588.9 |
| | 2,539.4 |
| 3,107.3 |
| | 2,643.7 |
|
| Commitments and Contingencies—Note 8 | | | |
| |
|
| Equity | | | | | | |
| Common stock issued, par value $0.01; 300,000,000 shares authorized; outstanding: 67,758,485 (2016—68,309,431) | 0.7 |
| | 0.7 |
| |
| Common stock issued, par value $0.01; 300,000,000 shares authorized; outstanding: 67,235,786 (2017—67,780,410) | | 0.7 |
| | 0.7 |
|
| Paid-in capital | 475.4 |
| | 487.3 |
| 472.1 |
| | 474.8 |
|
| Retained earnings | 710.3 |
| | 619.3 |
| 625.5 |
| | 573.1 |
|
| Treasury stock, at cost: shares: 9,698,142 (2016—9,147,196) | (837.2 | ) | | (804.9 | ) | |
| Treasury stock, at cost: shares: 10,220,841 (2017—9,676,217) | | (865.7 | ) | | (832.1 | ) |
| Accumulated other comprehensive income (loss) | 43.7 |
| | 66.4 |
| 55.8 |
| | 39.9 |
|
| Total W. R. Grace & Co. Shareholders' Equity | 392.9 |
| | 368.8 |
| |
| Total W. R. Grace & Co. Shareholders’ Equity | | 288.4 |
| | 256.4 |
|
| Noncontrolling interests | 4.1 |
| | 3.6 |
| 6.5 |
| | 6.9 |
|
| Total Equity | 397.0 |
| | 372.4 |
| 294.9 |
| | 263.3 |
|
| Total Liabilities and Equity | $ | 2,985.9 |
| | $ | 2,911.8 |
| $ | 3,402.2 |
| | $ | 2,907.0 |
|
The Notes to Consolidated Financial Statements are an integral part of these statements.
8
W. R. Grace & Co. and Subsidiaries
Consolidated Statements of Equity (unaudited)
| | | (In millions) | Common Stock and Paid-in Capital | | Retained Earnings | | Treasury Stock | | Accumulated Other Comprehensive Income (Loss) | | Noncontrolling Interests | | Total Equity | Common Stock and Paid-in Capital | | Retained Earnings | | Treasury Stock | | Accumulated Other Comprehensive Income (Loss) | | Noncontrolling Interests | | Total Equity |
| Balance, December 31, 2015 | $ | 496.7 |
| | $ | 436.3 |
| | $ | (658.4 | ) | | $ | (66.8 | ) | | $ | 4.7 |
| | $ | 212.5 |
| |
| Net income (loss) | — |
| | 78.8 |
| | — |
| | — |
| | (0.3 | ) | | 78.5 |
| |
| Repurchase of common stock | — |
| | — |
| | (55.1 | ) | | — |
| | — |
| | (55.1 | ) | |
| Stock-based compensation | 9.2 |
| | — |
| | — |
| | — |
| | — |
| | 9.2 |
| |
| Exercise of stock options | (16.2 | ) | | — |
| | 39.9 |
| | — |
| | — |
| | 23.7 |
| |
| Tax benefit related to stock plans | — |
| | 70.4 |
| | — |
| | — |
| | — |
| | 70.4 |
| |
| Shares issued | 0.7 |
| | — |
| | — |
| | — |
| | — |
| | 0.7 |
| |
| Other comprehensive (loss) income | — |
| | — |
| | — |
| | (10.1 | ) | | 2.6 |
| | (7.5 | ) | |
| Dividends declared | — |
| | (24.1 | ) | | — |
| | — |
| | — |
| | (24.1 | ) | |
| Distribution of GCP | — |
| | 54.7 |
| | — |
| | 135.3 |
| | (3.7 | ) | | 186.3 |
| |
| Balance, September 30, 2016 | $ | 490.4 |
| | $ | 616.1 |
| | $ | (673.6 | ) | | $ | 58.4 |
| | $ | 3.3 |
| | $ | 494.6 |
| |
| Balance, December 31, 2016 | $ | 488.0 |
| | $ | 619.3 |
| | $ | (804.9 | ) | | $ | 66.4 |
| | $ | 3.6 |
| | $ | 372.4 |
| $ | 488.0 |
| | $ | 619.3 |
| | $ | (804.9 | ) | | $ | 66.4 |
| | $ | 3.6 |
| | $ | 372.4 |
|
| Net income (loss) | — |
| | 134.2 |
| | — |
| | — |
| | (0.7 | ) | | 133.5 |
| — |
| | 86.8 |
| | — |
| | — |
| | (0.4 | ) | | 86.4 |
|
| Repurchase of common stock | — |
| | — |
| | (65.0 | ) | | — |
| | — |
| | (65.0 | ) | — |
| | — |
| | (30.0 | ) | | — |
| | — |
| | (30.0 | ) |
| Payments to taxing authorities in consideration of employee tax obligations relative to stock-based compensation arrangements | (2.5 | ) | | — |
| | — |
| | — |
| | — |
| | (2.5 | ) | |
| Payments to taxing authorities in consideration of employee tax obligations related to stock-based compensation arrangements | | (2.4 | ) | | — |
| | — |
| | — |
| | — |
| | (2.4 | ) |
| Stock-based compensation | 8.2 |
| | — |
| | — |
| | — |
| | — |
| | 8.2 |
| 5.4 |
| | — |
| | — |
| | — |
| | — |
| | 5.4 |
|
| Exercise of stock options | (18.3 | ) | | — |
| | 32.7 |
| | — |
| | — |
| | 14.4 |
| (17.0 | ) | | — |
| | 28.8 |
| | — |
| | — |
| | 11.8 |
|
| Shares issued | 0.7 |
| | — |
| | — |
| | — |
| | — |
| | 0.7 |
| 0.7 |
| | — |
| | — |
| | — |
| | — |
| | 0.7 |
|
| Other comprehensive (loss) income | — |
| | — |
| | — |
| | (22.7 | ) | | — |
| | (22.7 | ) | — |
| | — |
| | — |
| | (9.9 | ) | | — |
| | (9.9 | ) |
| Contribution to joint venture | — |
| | — |
| | — |
| | — |
| | 1.2 |
| | 1.2 |
| |
| Dividends declared | — |
| | (43.2 | ) | | — |
| | — |
| | — |
| | (43.2 | ) | — |
| | (28.8 | ) | | — |
| | — |
| | — |
| | (28.8 | ) |
| Balance, September 30, 2017 | $ | 476.1 |
| | $ | 710.3 |
| | $ | (837.2 | ) | | $ | 43.7 |
| | $ | 4.1 |
| | $ | 397.0 |
| |
| Balance, June 30, 2017 | | $ | 474.7 |
| | $ | 677.3 |
| | $ | (806.1 | ) | | $ | 56.5 |
| | $ | 3.2 |
| | $ | 405.6 |
|
| Balance, December 31, 2017 | | $ | 475.5 |
| | $ | 573.1 |
| | $ | (832.1 | ) | | $ | 39.9 |
| | $ | 6.9 |
| | $ | 263.3 |
|
| Net income (loss) | | — |
| | 82.4 |
| | — |
| | — |
| | (0.4 | ) | | 82.0 |
|
| Repurchase of common stock | | — |
| | — |
| | (49.8 | ) | | — |
| | — |
| | (49.8 | ) |
| Payments to taxing authorities in consideration of employee tax obligations related to stock-based compensation arrangements | | (3.0 | ) | | — |
| | — |
| | — |
| | — |
| | (3.0 | ) |
| Stock-based compensation | | 9.6 |
| | — |
| | — |
| | — |
| | — |
| | 9.6 |
|
| Exercise of stock options | | (4.1 | ) | | — |
| | 10.2 |
| | — |
| | — |
| | 6.1 |
|
| Shares issued | | (5.2 | ) | | — |
| | 6.0 |
| | — |
| | — |
| | 0.8 |
|
| Dividends declared | | — |
| | (32.5 | ) | | — |
| | — |
| | — |
| | (32.5 | ) |
| Other comprehensive (loss) income | | — |
| | — |
| | — |
| | 15.9 |
| | — |
| | 15.9 |
|
| Adjustment to retained earnings for adoption of ASC 606 | | — |
| | 2.5 |
| | — |
| | — |
| | — |
| | 2.5 |
|
| Balance, June 30, 2018 | | $ | 472.8 |
| | $ | 625.5 |
| | $ | (865.7 | ) | | $ | 55.8 |
| | $ | 6.5 |
| | $ | 294.9 |
|
The Notes to Consolidated Financial Statements are an integral part of these statements.
9
Notes to Consolidated Financial Statements
1. Basis of Presentation and Summary of Significant Accounting and Financial Reporting Policies
W. R. Grace & Co., through its subsidiaries, is engaged in specialty chemicals and specialty materials businesses on a global basis through two reportable segments: Grace Catalysts Technologies, which includes catalysts and related products and technologies used in refining, petrochemical and other chemical manufacturing applications; and Grace Materials Technologies, which includes specialty materials, including silica-based and silica-alumina-based materials, used in coatings, consumer, industrial, and pharmaceutical applications.
W. R. Grace & Co. conducts all of its business through a single wholly owned subsidiary, W. R. Grace & Co.–Conn. ("(“Grace–Conn."”). Grace–Conn. owns all of the assets, properties and rights of W. R. Grace & Co. on a consolidated basis, either directly or through subsidiaries.
As used in these notes, the term "Company"“Company” refers to W. R. Grace & Co. The term "Grace"“Grace” refers to the Company and/or one or more of its subsidiaries and, in certain cases, their respective predecessors.
Separation Transaction On January 27, 2016, Grace entered into a separation agreement with GCP Applied Technologies Inc., then a wholly-owned subsidiary of Grace ("GCP"), pursuant to which Grace agreed to transfer its Grace Construction Products operating segment and the packaging technologies business of its Grace Materials Technologies operating segment to GCP (the "Separation"). Grace and GCP completed the Separation on February 3, 2016 (the "Distribution Date"), by means of a pro rata distribution to the Company's stockholders of all of the outstanding shares of GCP common stock (the "Distribution"), with one share of GCP common stock distributed for each share of Company common stock held as of the close of business on January 27, 2016. As a result of the Distribution, GCP became an independent public company. GCP’s historical financial results through the Distribution Date are reflected in Grace’s Consolidated Financial Statements as discontinued operations.
Basis of Presentation The interim Consolidated Financial Statements presented herein are unaudited and should be read in conjunction with the Consolidated Financial Statements presented in the Company's 2016Company’s 2017 Annual Report on Form 10-K. Such interim Consolidated Financial Statements reflect all adjustments that, in the opinion of management, are necessary for a fair statement of the results of the interim periods presented; all such adjustments are of a normal recurring nature except for the impacts of adopting new accounting standards as discussed below. All significant intercompany accounts and transactions have been eliminated.
The results of operations for the nine-monthsix-month interim period ended SeptemberJune 30, 2017,2018, are not necessarily indicative of the results of operations to be attained for the year ending December 31, 2017.2018.
Use of Estimates The preparation of financial statements in conformity with U.S. generally accepted accounting principles ("(“U.S. GAAP"GAAP”) requires management to make estimates and assumptions that affect the reported amountamounts of assets and liabilities and disclosure of contingent assets and liabilities at the date of the Consolidated Financial Statements, and the reported amounts of revenues and expenses for the periods presented. Actual amounts could differ from those estimates, and the differences could be material. Changes in estimates are recorded in the period identified. Grace'sGrace’s accounting measurements that are most affected by management'smanagement’s estimates of future events are:
Realization values of net deferred tax assets, which depend on projections of future taxable income (see Note 5);income;
Pension and postretirement liabilities, which depend on assumptions regarding participant life spans, future inflation, discount rates and total returns on invested funds (see Note 6);
Carrying values of goodwill and other intangible assets, which depend on assumptions of future earnings and cash flows; and
Contingent liabilities, which depend on an assessment of the probability of loss and an estimate of ultimate obligation, such as litigation (see Note 8), income taxes (see Note 5), and environmental remediation (see Note 8).
Reclassifications Certain amounts in prior years'years’ Consolidated Financial Statements have been reclassified to conform to the current year presentation. Such reclassifications have not materially affected previously reported amounts in the Consolidated Financial Statements.
Long-Lived Assets During the 2018 first quarter, Grace, with the assistance of an outside accounting firm, completed a study to evaluate the useful lives of its operating machinery and equipment, including a review of historical asset retirement data as well as review and analysis of relevant industry practices. As a result of this study, effective January 1, 2018, Grace revised the accounting useful lives of certain machinery and equipment, which was determined to be a change in accounting estimate and is being applied prospectively. As a result of this change in accounting estimate, Grace’s depreciation expense with respect to such machinery and equipment was reduced by $6.2 million, resulting in an increase to net income of $4.8 million or $0.07 per diluted share, for the three months ended June 30, 2018. For the six months ended June 30, 2018, depreciation expense with respect to such machinery and equipment was reduced by $8.9 million, resulting in an increase to net income of $6.8 million or $0.10 per diluted share. Estimated useful lives for operating machinery and equipment, which previously ranged from 3 to 10 years, now range from 5 to 25 years.
Notes to Consolidated Financial Statements (Continued)
1. Basis of Presentation and Summary of Significant Accounting and Financial Reporting Policies (Continued)
Recently Issued Accounting StandardsIn May 2014, the FASB issued ASU 2014-09 "Revenue from Contracts with Customers." This update is intended to remove inconsistencies and weaknesses in revenue requirements; provide a more robust framework for addressing revenue issues; improve comparability of revenue recognition practices across entities, industries, jurisdictions and capital markets; provide more useful information to users of financial statements through improved disclosure requirements; and simplify the preparation of financial statements by reducing the number of requirements to which an entity must refer. The standard allows for two methods of adoption: (a) full retrospective adoption, meaning the standard is applied to all periods presented, or (b) modified retrospective adoption, meaning the cumulative effect of applying the new standard is recognized as an adjustment to the opening retained earnings balance. Grace has assessed specific areas of the standard and its impact on the Consolidated Financial Statements. Grace will adopt this standard in the 2018 first quarter under the modified retrospective approach and does not expect it to have a material effect on the Consolidated Financial Statements.
In February 2016, the FASB issued ASU 2016-02 "Leases“Leases (Topic 842)."” This update is intended to increase transparency and comparability among organizations by recognizing lease assets and lease liabilities on the balance sheet and disclosing key information about leasing arrangements. The core principle of Topic 842 is that a lessee should recognize the assets and liabilities that arise from leases. A lessee should recognize in the statement of financial position a liability to make lease payments (the lease liability) and a right-of-use asset representing its right to use the underlying asset for the lease term, including optional payments where they are reasonably certain to occur. Currently, as a lessee, Grace is a party to a number of leases which, under existing guidance, are classified as operating leases and not recorded on the balance sheet but are expensed as incurred. Under the new standard, many of these leases will be recorded on the Consolidated Balance Sheets. Grace will adopt the standard in the 2019 first quarter. Grace has begun its implementation of the new standard and at this time cannot reasonably estimate the effect of adoption.
In January 2017, the FASB issued ASU 2017-04 “Intangibles—Goodwill and Other (Topic 350).” This update modifies the concept of impairment from the condition that exists when the carrying amount of goodwill exceeds its implied fair value to the condition that exists when the carrying amount of a reporting unit exceeds its fair value. An entity no longer will determine goodwill impairment by calculating the implied fair value of goodwill by assigning the fair value of a reporting unit to all of its assets and liabilities as if that reporting unit had been acquired in a business combination (“Step 2”). Because these amendments eliminate Step 2 from the goodwill impairment test, they should reduce the cost and complexity of evaluating goodwill for impairment. Grace is required to adopt the amendments in this update on January 1, 2020. Early adoption is permitted. Grace is currently evaluating the timing of adoption and does not expect the update to have a material effect on the Consolidated Financial Statements.
In January 2018, the FASB issued ASU 2018-01 “Leases (Topic 842): Land Easement Practical Expedient for Transition to Topic 842.” This update provides an optional transition practical expedient that allows an entity to elect not to evaluate under Topic 842 existing or expired land easements not previously accounted for as leases. All land easements entered into or modified after the adoption of Topic 842 must be evaluated under Topic 842. Grace, which typically does not account for easements under current lease accounting, will use the transition practical expedient when adopting Topic 842 in the 2019 first quarter and at this time cannot reasonably estimate the effect of adoption.
In February 2018, the FASB issued ASU 2018-02 “Income Statement—Reporting Comprehensive Income (Topic 220).” This update addresses the revaluation of deferred tax assets and liabilities due to the Tax Cuts and Jobs Act of 2017 impacting income from continuing operations, even if the initial income tax effects were recognized in other comprehensive income. The update allows entities to reclassify the tax effects that were originally in other comprehensive income from accumulated other comprehensive income to retained earnings. The update requires entities to disclose whether the election was made and a description of the income tax effects. The update can be: (a) applied to the period of adoption, or (b) applied retrospectively to each period in which the Tax Cuts and Jobs Act of 2017 is in effect. Grace is required to adopt the amendments in this update on January 1, 2019, with early adoption permitted. Grace is currently evaluating the timing and effect of adoption.
Recently Adopted Accounting Standards In November 2016, the FASB issued ASU 2016-18 "Statement“Statement of Cash Flows (Topic 230): Restricted Cash,"” which requires that a statement of cash flows explain the change during the period in the total of cash, cash equivalents, and amounts generally described as restricted cash or restricted cash equivalents. Therefore, amounts generally described as restricted cash and restricted cash equivalents should be included with cash and cash equivalents when reconciling the beginning-of-period and end-of-period total amounts shown on the statement of cash flows. The new requirements are effective for fiscal years beginning after December 15, 2017, and interim periods within those fiscal years, with early adoption permitted. Grace is currently evaluating the timing of adoption and does not expectadopted the update to have a materialin the 2018 first quarter. The table below presents the effect of the adoption of ASU 2016-18 on thepreviously reported amounts.
Notes to Consolidated Financial Statements. AsStatements (Continued)
1. Basis of September 30, 2017,Presentation and December 31, 2016, restricted cash included in the Consolidated Balance Sheets was $10.8 millionSummary of Significant Accounting and $10.0 million, respectively.Financial Reporting Policies (Continued)
|
| | | | | | | | | | | |
| | Six Months Ended June 30, 2017 |
| (In millions) | Previously Reported | | Revised | | Effect of Change |
| Other investing activities | $ | (0.5 | ) | | $ | 0.3 |
| | $ | 0.8 |
|
| Net cash provided by (used for) investing activities | (59.6 | ) | | (58.8 | ) | | 0.8 |
|
| Cash, cash equivalents, and restricted cash, beginning of period | 90.6 |
| | 100.6 |
| | 10.0 |
|
| Cash, cash equivalents, and restricted cash, end of period | 161.8 |
| | 172.6 |
| | 10.8 |
|
In January 2017, the FASB issued ASU 2017-01 "Business“Business Combinations (Topic 805),"” which provides a screen to determine when an integrated set of assets and activities is not a business. The screen requires that when substantially all of the fair value of the gross assets acquired (or disposed of) is concentrated in a single identifiable asset or a group of similar identifiable assets, the set is not a business. This screen reduces the number of transactions that need to be further evaluated. If the screen is not met, the amendments in this update (1) require that to be considered a business, a set must include, at a minimum, an input and a substantive process that together significantly contribute to the ability to create output, and (2) remove the evaluation of whether a market participant could replace missing elements. The amendments in this update also narrow the definition of the term "output"“output” so that the term is consistent with how outputs are described in TopicASC 606. Public business entities are required to apply the amendments in this update to annual periods beginning after December 15, 2017, including interim periods within those periods. Early application is permitted. Grace will evaluate the effect ofadopted the update atin the time2018 first quarter and applied the new definition of any futurea business to the acquisition or disposal.completed during the 2018 second quarter.
In JanuaryMay 2017, the FASB issued ASU 2017-04 "Intangibles—Goodwill and Other2017-09 “Compensation—Stock Compensation (Topic 350)718)."” This update modifiesclarifies the conceptexisting definition of impairment from the condition that exists whenterm “modification,” which is currently defined as “a change in any of the carrying amountterms or conditions of goodwill exceeds its implieda share-based payment award.” The update requires entities to account for modifications of share-based payment awards unless the (1) fair value, (2) vesting conditions, and (3) classification as an equity instrument or a liability instrument of the modified award are the same as the original award before modification. Grace adopted the update in the 2018 first quarter, and it did not have an effect on the Consolidated Financial Statements.
Revenue Recognition
In May 2014, the FASB issued ASU 2014-09 “Revenue from Contracts with Customers (Topic 606)” (“ASC 606”). This update was intended to remove inconsistencies and weaknesses in revenue requirements; provide a more robust framework for addressing revenue issues; improve comparability of revenue recognition practices across entities, industries, jurisdictions and capital markets; provide more useful information to users of financial statements through improved disclosure requirements; and simplify the preparation of financial statements by reducing the number of requirements to which an entity must refer. Grace adopted ASC 606 with a date of initial application of January 1, 2018. Grace applied the standard to all customer contracts. As a result, Grace has changed its accounting policy for revenue recognition as detailed below.
Grace applied ASC 606 using the modified retrospective method, that is, by recognizing the cumulative effect of initially applying ASC 606 as an adjustment to “retained earnings” at the date of initial application. Results for periods beginning after December 31, 2017, are presented under ASC 606, while the comparative information has not been adjusted and continues to be reported in accordance with Grace’s historical accounting under ASC 605 “Revenue Recognition” (“ASC 605”).
Grace generates revenues predominantly from sales of manufactured products to customers and in part from licensing of technology. Under ASC 606, revenue from customer arrangements is recognized when control is transferred to the condition that exists whencustomer.
Product Sales Revenue Recognition
In its implementation of ASC 606, Grace assessed its customer arrangements at the carrying amountoperating segment level, and based on the similarity of a reporting unit exceeds its fair value. An entity no longer will determine goodwill impairment by calculatingarrangements, Grace elected to use the implied fair value of goodwill by assigning the fair value of a reporting unit to all of its assets and liabilities as if that reporting unit had beenportfolio method practical expedient.
Notes to Consolidated Financial Statements (Continued)
1. Basis of Presentation and Summary of Significant Accounting and Financial Reporting Policies (Continued)
acquiredBased on the promises made to customers in product sales arrangements, Grace determined that it has a performance obligation to manufacture and deliver products to its customers. Grace makes certain other promises in its customer arrangements that are immaterial in the context of the contracts. Revenue is recognized at amounts based on agreed upon prices in sales contracts and/or purchase orders. Grace offers various incentives to its product sales customers that result in variable consideration, including but not limited to volume discounts, which reward bulk purchases by lowering the price for future purchases, and volume rebates, which encourage customers to purchase volume levels that would reduce their current prices. These incentives are immaterial in the context of the contracts.
For product sales, control is transferred at the point in time at which risk of loss and title have transferred to the customer, which is determined based on shipping terms. Terms of delivery and terms of payment are generally included in customer contracts of sale, order confirmation documents, and invoices. Payment is generally due within 30 to 60 days of invoicing. Grace defers revenue recognition until no other significant Grace obligations remain. Grace’s customer arrangements do not contain significant acceptance provisions.
Taxes that Grace collects that are assessed by a governmental authority, and that are both imposed on and concurrent with any of its revenue-producing activities, are excluded from revenue. Grace considers shipping and handling activities that it performs as activities to fulfill the sales of its products. Amounts billed for shipping and handling are included in net sales, while costs incurred for shipping and handling are included in cost of sales, in accordance with the practical expedient provided by ASC 606.
Technology Licensing Revenue Recognition
For Grace’s technology licensing business, combination ("Step 2"). BecauseGrace determined that the customer arrangements contain multiple deliverables to enable licensees to realize the full benefit of the technology. These deliverables include licensing the technology itself; developing engineering design packages; and providing training, consulting, and technical services. Under these amendments eliminate Step 2arrangements, the license grant is not a distinct performance obligation, as the licensee only can benefit from the goodwill impairment test, they should reducelicense in conjunction with other integral services such as development of the costengineering design package, training, consulting, or technical services provided over the contract period. Therefore, Grace accounts for the license grant and complexityintegral services as a single performance obligation. Certain deliverables and services not included in the core bundled deliverables are accounted for as separate performance obligations.
The transaction price is specified in the technology licensing agreements and is substantially fixed. Some services are priced on a per-diem basis, but these are not material in the context of evaluating goodwillthe contracts. Grace invoices its technology licensing customers as certain project milestones are achieved. Payment terms are similar to those of Grace’s product sales.
Revenue for impairment.each performance obligation is recognized when control is transferred to the customer, which is generally over a period of time. As a result, Grace generally recognizes revenue for each performance obligation ratably over the period of the contract, which is requiredup to adoptseven years, depending on the amendments in this update for annual or any interim goodwill impairment tests in fiscal years beginning after December 15, 2019. Early adoption is permitted for interim or annual goodwill impairment tests performedscope of the licensee’s project. Based on testing dates after January 1, 2017. Grace is currently evaluating the timing of adoption and does not expectpayments, Grace records deferred revenue related to these agreements. See Note 13.
Impact of Adoption
Except for the updatechanges below, Grace has consistently applied its accounting policy for revenue recognition to have a material effect onall periods presented in the Consolidated Financial Statements.
Grace recorded a net increase to “retained earnings” of $2.5 million as of January 1, 2018, which represents the cumulative impact of adopting ASC 606, with a $3.2 million reduction to “other liabilities” and a $0.7 million reduction to “deferred income taxes.” The cumulative adjustment results from a change in accounting for contingent revenue related to technology licensing arrangements. Under ASC 605, certain revenue was not realized until a contractual contingency was resolved. Upon adoption of ASC 606, Grace estimates all forms of
Notes to Consolidated Financial Statements (Continued)
1. Basis of Presentation and Summary of Significant Accounting and Financial Reporting Policies (Continued)
variable consideration, including contingent amounts, at the inception of the arrangement and recognizes it over the period of performance.
The tables below present the effect of the adoption of ASC 606 on Grace’s Consolidated Statements of Operations and Consolidated Balance Sheets.
Consolidated Statements of Operations
|
| | | | | | | | | | | |
| | Three months ended June 30, 2018 |
| (In millions) | Under ASC 605 | | As Reported (ASC 606) | | Effect of Change |
| Net sales | $ | 485.4 |
| | $ | 485.7 |
| | $ | 0.3 |
|
| Gross profit | 198.4 |
| | 198.7 |
| | 0.3 |
|
| Income (loss) before income taxes | 63.3 |
| | 63.6 |
| | 0.3 |
|
| Provision for income taxes | (24.9 | ) | | (25.0 | ) | | (0.1 | ) |
| Net income (loss) | 38.4 |
| | 38.6 |
| | 0.2 |
|
| Net income (loss) attributable to W. R. Grace & Co. Shareholders | 38.6 |
| | 38.8 |
| | 0.2 |
|
|
| | | | | | | | | | | |
| | Six Months Ended June 30, 2018 |
| (In millions) | Under ASC 605 | | As Reported (ASC 606) | | Effect of Change |
| Net sales | $ | 916.8 |
| | $ | 917.2 |
| | $ | 0.4 |
|
| Gross profit | 367.8 |
| | 368.2 |
| | 0.4 |
|
| Income (loss) before income taxes | 131.4 |
| | 131.8 |
| | 0.4 |
|
| Provision for income taxes | (49.7 | ) | | (49.8 | ) | | (0.1 | ) |
| Net income (loss) | 81.7 |
| | 82.0 |
| | 0.3 |
|
| Net income (loss) attributable to W. R. Grace & Co. Shareholders | 82.1 |
| | 82.4 |
| | 0.3 |
|
Consolidated Balance Sheets
|
| | | | | | | | | | | |
| | June 30, 2018 |
| (In millions) | Under ASC 605 | | As Reported (ASC 606) | | Effect of Change |
| Deferred income taxes | $ | 536.2 |
| | $ | 535.4 |
| | $ | (0.8 | ) |
| Other liabilities | 192.3 |
| | 188.7 |
| | (3.6 | ) |
| Retained earnings | 622.7 |
| | 625.5 |
| | 2.8 |
|
ASU 2017-07 “Compensation—Retirement Benefits (Topic 715)”
In March 2017, the FASB issued ASU 2017-07 "Compensation—“Compensation—Retirement Benefits (Topic 715)."” This update requires that the service cost component of net benefit cost be presented with other compensation costs arising from services rendered. The remaining net benefit cost is either presented as a line item in the statement of operations outside of a subtotal for income from operations, if presented, or disclosed separately. OnlyIn addition, only the service cost component of net benefit expensecost can be capitalized. Grace is currently evaluating the update's effect on the Consolidated Financial Statements and will adoptadopted the update in the 2018 first quarter.
In May 2017,The changes in classification of net benefit costs within the FASB issued ASU 2017-09 "Compensation—Stock Compensation (Topic 718)." This update clarifies the existing definitionConsolidated Statements of the term "modification," which is currently defined as "aOperations have been retrospectively applied to all periods presented. The change in any of the terms or conditions of a share-based payment award." The update requires entities to account for modifications of share-based payment awards unless the (1) fair value, (2) vesting conditions, and (3) classification as an equity instrument or a liability instrument of the modified award are the same as of the original award before modification. Grace is required to adopt the amendments in this update for fiscal years and interim periods beginning after December 15, 2017, with early adoption permitted. Grace does not currently have any modifications of share-based awards and will adopt the update when it becomes effective.
In August 2017, the FASB issued ASU 2017-12 "Derivatives and Hedging (Topic 815)." This update improves the presentation of the results of hedges by requiring the earnings effect of the hedging instrument to be in the same income statement line item as the earnings of the hedged item. This update expands hedge accounting to include hedging relationships involving both financial and nonfinancial risks. Grace is required to adopt the amendments in this update for fiscal years and interim periods beginning after December 15, 2018, with early adoption permitted. Grace is currently evaluating the timing of adoption and does not expect the update to have a material effect on the Consolidated Financial Statements.
Recently Adopted Accounting StandardsIn July 2015, the FASB issued ASU 2015-11 "Simplifying the Measurement of Inventory." This update is part of the FASB's Simplification Initiative and is also intended to enhance convergence with the International Accounting Standards Board's ("IASB") measurement of inventory. The update requires thatcosts capitalizable into inventory be measured at the lower of cost or net realizable value for entities using FIFO (first-in, first-out) or average cost methods. Grace adopted this update in the first quarter of 2017, and it did not have a material effect on the Consolidated Financial Statements.was applied
In August 2016, the FASB issued ASU 2016-15 "Classification of Certain Cash Receipts and Cash Payments." This update is intended to reduce diversity in practice in how certain cash receipts and cash payments are presented and classified in the statement of cash flows. It addresses eight specific issues. Grace adopted this update in the 2017 second quarter, and it did not have a material effect on the Consolidated Financial Statements.
Notes to Consolidated Financial Statements (Continued)
2. Inventories1. Basis of Presentation and Summary of Significant Accounting and Financial Reporting Policies (Continued)
prospectively in accordance with the update. The tables below present the effect of the adoption of ASU 2017-07 on previously reported amounts.
Consolidated Statements of Operations
|
| | | | | | | | | | | |
| | Three Months Ended June 30, 2017 |
| (In millions) | Previously Reported | | Revised | | Effect of Change |
| Cost of goods sold | $ | 260.2 |
| | $ | 262.3 |
| | $ | 2.1 |
|
| Gross profit | 169.3 |
| | 167.2 |
| | (2.1 | ) |
| Selling, general and administrative expenses | 70.3 |
| | 70.8 |
| | 0.5 |
|
| Research and development expenses | 12.9 |
| | 13.6 |
| | 0.7 |
|
| Other (income) expense | (9.6 | ) | | (12.9 | ) | | (3.3 | ) |
|
| | | | | | | | | | | |
| | Six Months Ended June 30, 2017 |
| (In millions) | Previously Reported | | Revised | | Effect of Change |
| Cost of goods sold | $ | 505.0 |
| | $ | 507.1 |
| | $ | 2.1 |
|
| Gross profit | 322.5 |
| | 320.4 |
| | (2.1 | ) |
| Selling, general and administrative expenses | 136.8 |
| | 137.8 |
| | 1.0 |
|
| Research and development expenses | 26.1 |
| | 27.5 |
| | 1.4 |
|
| Other (income) expense | (11.8 | ) | | (16.3 | ) | | (4.5 | ) |
2. Inventories
Inventories are stated at the lower of cost or net realizable value, and cost is determined using FIFO. Inventories consisted of the following at SeptemberJune 30, 2017,2018, and December 31, 2016:2017:
| | | (In millions) | September 30,
2017 | | December 31,
2016 | June 30,
2018 | | December 31,
2017 |
| Raw materials | $ | 53.6 |
| | $ | 57.7 |
| $ | 60.3 |
| | $ | 48.8 |
|
| In process | 34.7 |
| | 33.4 |
| 56.8 |
| | 33.0 |
|
| Finished products | 128.2 |
| | 115.8 |
| 161.3 |
| | 124.7 |
|
| Other | 23.0 |
| | 21.1 |
| 29.0 |
| | 24.4 |
|
| Total inventory | $ | 239.5 |
| | $ | 228.0 |
| $ | 307.4 |
| | $ | 230.9 |
|
Notes to Consolidated Financial Statements (Continued)
3. Debt
Components of Debt
| | | (In millions) | September 30,
2017 | | December 31,
2016 | June 30,
2018 | | December 31,
2017 |
| 5.125% senior notes due 2021, net of unamortized debt issuance costs of $6.2 at September 30, 2017 (2016—$7.3) | $ | 693.8 |
| | $ | 692.7 |
| |
| U.S. dollar term loan, net of unamortized debt issuance costs and discounts of $4.7 at September 30, 2017 (2016—$5.7) | 403.7 |
| | 402.7 |
| |
| 5.625% senior notes due 2024, net of unamortized debt issuance costs of $3.6 at September 30, 2017 (2016—$4.0) | 296.4 |
| | 296.0 |
| |
| Euro term loan, net of unamortized debt issuance costs and discounts of $1.0 at September 30, 2017 (2016—$1.3) | 93.1 |
| | 82.5 |
| |
| 2018 U.S. dollar term loan, net of unamortized debt issuance costs of $9.7 | | $ | 940.3 |
| | $ | — |
|
| 5.125% senior notes due 2021, net of unamortized debt issuance costs of $5.0 (2017—$5.8) | | 695.0 |
| | 694.2 |
|
| 5.625% senior notes due 2024, net of unamortized debt issuance costs of $3.2 (2017—$3.5) | | 296.8 |
| | 296.5 |
|
| Debt payable to unconsolidated affiliate | 41.4 |
| | 39.5 |
| 46.3 |
| | 42.4 |
|
| Deferred payment obligation | — |
| | 30.0 |
| |
| 2014 U.S. dollar term loan, net of unamortized debt issuance costs and discounts (2017—$4.3) | | — |
| | 404.1 |
|
2014 Euro term loan, net of unamortized debt issuance costs and discounts (2017—$1.0) | | — |
| | 94.0 |
|
| Other borrowings(1) | 40.0 |
| | 40.7 |
| 8.2 |
| | 12.7 |
|
| Total debt | 1,568.4 |
| | 1,584.1 |
| 1,986.6 |
| | 1,543.9 |
|
| Less debt payable within one year | 46.5 |
| | 76.5 |
| 23.3 |
| | 20.1 |
|
| Debt payable after one year | $ | 1,521.9 |
| | $ | 1,507.6 |
| $ | 1,963.3 |
| | $ | 1,523.8 |
|
| Weighted average interest rates on total debt | 4.7 | % | | 4.6 | % | 3.8 | % | | 4.7 | % |
(1) Represents borrowings under various lines of credit and other borrowings, primarily by non-U.S. subsidiaries.
See Note 4On April 3, 2018, Grace entered into a Credit Agreement (the “Credit Agreement”), which provides for a discussionnew senior secured credit facilities, consisting of:
| |
| (a) | a $950 million term loan due in 2025, with interest at LIBOR +175 basis points, and |
| |
| (b) | a $400 million revolving credit facility due in 2023, with interest at LIBOR +175 basis points. |
The term loan will amortize in equal quarterly installments in aggregate annual amounts equal to 1.00% of the fair value of Grace's debt.original principal amount thereof, with the first payment due on December 31, 2018.
The Credit Agreement contains customary affirmative covenants, including, but not limited to: (i) maintenance of existence, and compliance with laws; (ii) delivery of consolidated financial statements and other information; (iii) payment of taxes; (iv) delivery of notices of defaults and certain other material events; and (v) maintenance of adequate insurance. The Credit Agreement also contains customary negative covenants, including but not limited to restrictions on: (i) dividends on, and redemptions of, equity interests and other restricted payments; (ii) liens; (iii) loans and investments; (iv) the sale, transfer or disposition of assets and businesses; (v) transactions with affiliates; and (vi) a maximum first lien leverage ratio.
Events of default under the Credit Agreement include, but are not limited to: (i) failure to pay principal, maturities of debt outstanding at September 30, 2017, were as follows:
|
| | | |
| | (In millions) |
| 2017 | $ | 40.4 |
|
| 2018 | 8.8 |
|
| 2019 | 8.3 |
|
| 2020 | 7.0 |
|
| 2021 | 1,196.1 |
|
| Thereafter | 307.8 |
|
| Total debt | $ | 1,568.4 |
|
On February 3, 2017, Grace fundedinterest, fees or other amounts under the PD trust with $30.0 millionCredit Agreement when due, taking into account any applicable grace period; (ii) any representation or warranty proving to have been incorrect in any material respect when made; (iii) failure to perform or observe covenants or other terms of the deferred payment obligation relatingCredit Agreement subject to ZAI PD Claims. (See Note 8.certain grace periods; (iv) a cross-default and cross-acceleration with certain other material debt; (v) bankruptcy events; (vi) certain defaults under ERISA; and (vii) the invalidity or impairment of security interests.
To secure its obligations under the Credit Agreement, Grace and certain of its U.S. subsidiaries have granted security interests in substantially all equity and debt interests in Grace–Conn. or any other Grace subsidiary owned by them and in substantially all their non-real estate assets and property.
The foregoing is a summary of the Credit Agreement. Grace has filed the full text of the Credit Agreement with the Securities and Exchange Commission (the “SEC”), which is readily available on the internet at www.sec.gov.
Notes to Consolidated Financial Statements (Continued)
3. Debt (Continued)
Grace also maintainsused a $300portion of the proceeds to repay in full the borrowings outstanding under its 2014 credit agreement, which was terminated, as well as to make a voluntary $50.0 million revolving credit facility. accelerated contribution to its U.S. qualified pension plans. In connection with the repayment of debt, Grace recorded a $4.8 million loss on early extinguishment of debt. As of SeptemberJune 30, 2017,2018, the available credit under thisthe revolving credit facility was reduced to $265.0$364.3 million by outstanding letters of credit.
DuringSee Note 4 for a discussion of the 2016 first quarter, in connection with the Separation, GCP distributed $750 million to Grace. Grace used $600 millionfair value of those funds to repay $526.9 million of its U.S. dollar term loan and €67.3 million of its euro term loan. As a result, Grace recorded a loss on early extinguishmentGrace’s debt.
The principal maturities of debt of $11.1 million, which is included in "other (income) expense, net" in the Consolidated Statements of Operations.outstanding at June 30, 2018, were as follows:
|
| | | |
| | (In millions) |
| 2018 | $ | 14.0 |
|
| 2019 | 19.1 |
|
| 2020 | 17.9 |
|
| 2021 | 711.4 |
|
| 2022 | 15.5 |
|
| Thereafter | 1,208.7 |
|
| Total debt | $ | 1,986.6 |
|
4. Fair Value Measurements and Risk
Certain of Grace'sGrace’s assets and liabilities are reported at fair value on a gross basis. ASC 820 "Fair“Fair Value Measurements and Disclosures"Disclosures” defines fair value as the value that would be received at the measurement date in the principal or "most advantageous"“most advantageous” market. Grace uses principal market data, whenever available, to value assets and liabilities that are required to be reported at fair value.
Grace has identified the following financial assets and liabilities that are subject to the fair value analysis required by ASC 820:
Fair Value of Debt and Other Financial InstrumentsDebt payable is recorded at carrying value. Fair value is determined based on Level 2 inputs, including expected future cash flows (discounted at market interest rates), estimated current market prices and quotes from financial institutions.
At SeptemberJune 30, 20172018, the carrying amounts and fair values of Grace'sGrace’s debt were as follows:
| | | | September 30, 2017 | | December 31, 2016 | June 30, 2018 | | December 31, 2017 |
| (In millions) | Carrying Amount | | Fair Value | | Carrying Amount | | Fair Value | Carrying Amount | | Fair Value | | Carrying Amount | | Fair Value |
| 5.125% senior notes due 2021(1) | $ | 693.8 |
| | $ | 752.8 |
| | $ | 692.7 |
| | $ | 721.3 |
| |
| U.S. dollar term loan(2) | 403.7 |
| | 405.7 |
| | 402.7 |
| | 408.2 |
| |
| 2018 U.S. dollar term loan(1) | | $ | 940.3 |
| | $ | 939.1 |
| | $ | — |
| | $ | — |
|
| 5.125% senior notes due 2021(2) | | 695.0 |
| | 709.2 |
| | 694.2 |
| | 728.7 |
|
5.625% senior notes due 2024(1)(2) | 296.4 |
| | 325.7 |
| | 296.0 |
| | 311.5 |
| 296.8 |
| | 311.3 |
| | 296.5 |
| | 321.3 |
|
| Euro term loan(2) | 93.1 |
| | 93.2 |
| | 82.5 |
| | 82.0 |
| |
| U.S. dollar term loan(3) | | — |
| | — |
| | 404.1 |
| | 409.7 |
|
| Euro term loan(3) | | — |
| | — |
| | 94.0 |
| | 93.7 |
|
| Other borrowings | 81.4 |
| | 81.4 |
| | 110.2 |
| | 110.2 |
| 54.5 |
| | 54.5 |
| | 55.1 |
| | 55.1 |
|
| Total debt | $ | 1,568.4 |
| | $ | 1,658.8 |
| | $ | 1,584.1 |
| | $ | 1,633.2 |
| $ | 1,986.6 |
| | $ | 2,014.1 |
| | $ | 1,543.9 |
| | $ | 1,608.5 |
|
| |
| (1) | Carrying amounts are net of unamortized debt issuance costs and discounts of $6.2 million and $3.6$9.7 million as of SeptemberJune 30, 2017, and $7.32018. |
| |
| (2) | Carrying amounts are net of unamortized debt issuance costs of $5.0 million and $4.0$3.2 million as of June 30, 2018, and $5.8 million and $3.5 million as of December 31, 2016,2017, related to the 5.125% senior notes due 2021 and 5.625% senior notes due 2024, respectively. |
| |
(2)(3) | Carrying amounts are net of unamortized debt issuance costs and discounts of $4.7$4.3 million and $1.0 million as of September 30, 2017, and $5.7 million and $1.3 million as of December 31, 2016,2017, related to the U.S. dollar term loan and euro term loan, respectively. |
Notes to Consolidated Financial Statements (Continued)
4. Fair Value Measurements and Risk (Continued)
At SeptemberJune 30, 20172018, the recorded values of other financial instruments such as cash equivalents and trade receivables and payables approximated their fair values, based on the short-term maturities and floating rate characteristics of these instruments.
Currency DerivativesBecause Grace operates and/or sells to customers in over 60 countries and in over 30 currencies, its results are exposed to fluctuations in currency exchange rates. Grace seeks to minimize exposure to these fluctuations by matching sales in volatile currencies with expenditures in the same currencies, but it is not always possible to do so. From time to time, Grace will useuses financial instruments such as currency forward contracts, options, swaps, or combinations thereof to reduce the risk of certain specific transactions. However, Grace does not have a policy of hedging all exposures, because management does not believe that such a level of hedging would be cost-effective. Forward contracts with maturities of not more than 1236 months are used and designated as cash flow hedges of forecasted repayments of intercompany loans. The effective portion of gains
Notes to Consolidated Financial Statements (Continued)
4. Fair Value Measurements and Risk (Continued)
and losses on these currency hedges is recorded in "accumulated“accumulated other comprehensive income (loss)"” and reclassified into "other“other (income) expense" whenexpense, net” to offset the remeasurement of the underlying hedged loans. Excluded components (forward points) on these derivatives mature. hedges are amortized to income on a systematic basis.
Grace also enters into foreign currency forward contracts to hedge a portion of its net outstanding monetary assets and liabilities. These forward contracts are not designated as hedging instruments under applicable accounting guidance, and therefore all changes in the fair value of the forward contracts are recorded in “other (income) expense, net,” in the Consolidated Statements of Operations. These forward contracts are intended to offset the foreign currency gains or losses associated with the underlying monetary assets and liabilities.
The valuation of Grace'sGrace’s currency exchange rate forward contracts and swaps is determined using both a market approach and an income approach. Inputs used to value currency exchange rate forward contracts consist of: (1) spot rates, which are quoted by various financial institutions; (2) forward points, which are primarily affected by changes in interest rates; and (3) discount rates used to present value future cash flows, which are based on the London Interbank Offered Rate (LIBOR) curve or overnight indexed swap rates. Total notional amounts for forward contracts outstanding as of June 30, 2018, were $67.1 million.
Cross-Currency Swap Agreements Grace uses cross-currency swaps designated as cash flow hedges to manage fluctuations in currency exchange rates and interest rates on variable rate debt. The effective portion of gains and losses on these cash flow hedges is recorded in “accumulated other comprehensive income (loss)” and reclassified into “other (income) expense, net” and “interest expense and related financing costs” during the hedged interest period.
In April 2018, in connection with the Credit Agreement (see Note 3), Grace entered into new cross-currency swaps beginning on April 3, 2018, and maturing on March 31, 2023, to synthetically convert $600.0 million of U.S. dollar-denominated floating rate debt into €490.1 million of euro-denominated debt fixed at 2.0231%. The valuation of these cross-currency swaps is determined using an income approach, using LIBOR and EURIBOR swap curves, currency basis spreads, and euro/U.S. dollar exchange rates.
Debt and Interest Rate Swap AgreementsGrace uses interest rate swaps designated as cash flow hedges to manage fluctuations in interest rates on variable rate debt. The effective portion of gains and losses on these interest rate cash flow hedges is recorded in "accumulated“accumulated other comprehensive income (loss)"” and reclassified into "interest“interest expense and related financing costs"costs” during the hedged interest period.
In connection with its emergence financing, Grace entered into an interest rate swapswaps beginning on February 3, 2015, and maturing on February 3, 2020, fixing the LIBOR component of the interest on $250$250.0 million of Grace'sGrace’s term debt at a rate of 2.393%. These interest rate swaps were de-designated and terminated in April 2018 in connection with Grace’s entry into a new credit agreement.
In connection with the Credit Agreement (see Note 3), Grace entered into new interest rate swaps beginning on April 3, 2018, and maturing on March 31, 2023, fixing $100.0 million of term debt at 2.775%. The valuation of thisthese interest rate swapswaps is determined using both a market approach and an income approach, using prevailing market interest rates and discount rates to present value future cash flows based on the forward LIBOR yield curves. Credit risk is also incorporated into derivative valuations.
Notes to Consolidated Financial Statements (Continued)
4. Fair Value Measurements and Risk (Continued)
The following tables present the fair value hierarchy for financial assets and liabilities measured at fair value on a recurring basis as of SeptemberJune 30, 20172018, and December 31, 20162017:
| | | | Fair Value Measurements at September 30, 2017, Using | Fair Value Measurements at June 30, 2018, Using |
(In millions) | Total | | Quoted Prices in Active Markets for Identical Assets or Liabilities (Level 1) | | Significant Other Observable Inputs (Level 2) | | Significant Unobservable Inputs (Level 3) | Total | | Quoted Prices in Active Markets for Identical Assets or Liabilities (Level 1) | | Significant Other Observable Inputs (Level 2) | | Significant Unobservable Inputs (Level 3) |
| Assets | | | | | | | | | | | | | | |
| Currency derivatives | $ | 3.3 |
| | $ | — |
| | $ | 3.3 |
| | $ | — |
| $ | 4.0 |
| | $ | — |
| | $ | 4.0 |
| | $ | — |
|
| Interest rate derivatives | | 0.5 |
| | — |
| | 0.5 |
| | — |
|
| Variable-to-fixed cross-currency derivatives | | 21.4 |
| | — |
| | 21.4 |
| | — |
|
| Total Assets | $ | 3.3 |
| | $ | — |
| | $ | 3.3 |
| | $ | — |
| $ | 25.9 |
| | $ | — |
| | $ | 25.9 |
| | $ | — |
|
| Liabilities | | | | | | | | | | | | | | |
| Interest rate derivatives | $ | 4.2 |
| | $ | — |
| | $ | 4.2 |
| | $ | — |
| $ | 0.2 |
| | $ | — |
| | $ | 0.2 |
| | $ | — |
|
| Currency derivatives | 17.9 |
| | — |
| | 17.9 |
| | — |
| 20.9 |
| | — |
| | 20.9 |
| | — |
|
| Total Liabilities | $ | 22.1 |
| | $ | — |
| | $ | 22.1 |
| | $ | — |
| $ | 21.1 |
| | $ | — |
| | $ | 21.1 |
| | $ | — |
|
| | | | Fair Value Measurements at December 31, 2016, Using | Fair Value Measurements at December 31, 2017, Using |
(In millions) | Total | | Quoted Prices in Active Markets for Identical Assets or Liabilities (Level 1) | | Significant Other Observable Inputs (Level 2) | | Significant Unobservable Inputs (Level 3) | Total | | Quoted Prices in Active Markets for Identical Assets or Liabilities (Level 1) | | Significant Other Observable Inputs (Level 2) | | Significant Unobservable Inputs (Level 3) |
| Assets | | | | | | | | | | | | | | |
| Currency derivatives | $ | 8.8 |
| | $ | — |
| | $ | 8.8 |
| | $ | — |
| $ | 3.1 |
| | $ | — |
| | $ | 3.1 |
| | $ | — |
|
| Total Assets | $ | 8.8 |
| | $ | — |
| | $ | 8.8 |
| | $ | — |
| $ | 3.1 |
| | $ | — |
| | $ | 3.1 |
| | $ | — |
|
| Liabilities | | | | | | | | | | | | | | |
| Interest rate derivatives | $ | 6.0 |
| | $ | — |
| | $ | 6.0 |
| | $ | — |
| $ | 1.8 |
| | $ | — |
| | $ | 1.8 |
| | $ | — |
|
| Currency derivatives | 0.9 |
| | — |
| | 0.9 |
| | — |
| 23.8 |
| | — |
| | 23.8 |
| | — |
|
| Total Liabilities | $ | 6.9 |
| | $ | — |
| | $ | 6.9 |
| | $ | — |
| $ | 25.6 |
| | $ | — |
| | $ | 25.6 |
| | $ | — |
|
Notes to Consolidated Financial Statements (Continued)
4. Fair Value Measurements and Risk (Continued)
The following tables present the location and fair values of derivative instruments included in the Consolidated Balance Sheets as of SeptemberJune 30, 20172018, and December 31, 20162017:
| | September 30, 2017
(In millions) | Asset Derivatives | | Liability Derivatives | |
Balance Sheet Location | | Fair Value | | Balance Sheet Location | | Fair Value | |
June 30, 2018
(In millions) | | Asset Derivatives | | Liability Derivatives |
| Balance Sheet Location | | Fair Value | | Balance Sheet Location | | Fair Value |
| Derivatives designated as hedging instruments under ASC 815: | | | | | | | | | | | | | | |
| Currency contracts | Other current assets | | $ | 2.9 |
| | Other current liabilities | | $ | — |
| Other current assets | | $ | 3.3 |
| | Other current liabilities | | $ | — |
|
| Interest rate contracts | Other current assets | | — |
| | Other current liabilities | | 1.7 |
| Other current assets | | — |
| | Other current liabilities | | 0.2 |
|
| Variable-to-fixed cross-currency swaps | | Other current assets | | 12.5 |
| | Other current liabilities | | — |
|
| Currency contracts | Other assets | | — |
| | Other liabilities | | 17.6 |
| Other assets | | 0.1 |
| | Other liabilities | | 19.1 |
|
| Interest rate contracts | Other assets | | — |
| | Other liabilities | | 2.5 |
| Other assets | | 0.5 |
| | Other liabilities | | — |
|
| Variable-to-fixed cross-currency swaps | | Other assets | | 8.9 |
| | Other liabilities | | — |
|
| Derivatives not designated as hedging instruments under ASC 815: | | | | | | | | | | | | | | |
| Currency contracts | Other current assets | | 0.4 |
| | Other current liabilities | | 0.3 |
| Other current assets | | 0.6 |
| | Other current liabilities | | 1.8 |
|
| Total derivatives | | | $ | 3.3 |
| | | | $ | 22.1 |
| | | $ | 25.9 |
| | | | $ | 21.1 |
|
| | December 31, 2016
(In millions) | Asset Derivatives | | Liability Derivatives | |
Balance Sheet Location | | Fair Value | | Balance Sheet Location | | Fair Value | |
December 31, 2017
(In millions) | | Asset Derivatives | | Liability Derivatives |
| Balance Sheet Location | | Fair Value | | Balance Sheet Location | | Fair Value |
| Derivatives designated as hedging instruments under ASC 815: | | | | | | | | | | | | | | |
| Currency contracts | Other current assets | | $ | 4.0 |
| | Other current liabilities | | $ | — |
| Other current assets | | $ | 2.7 |
| | Other current liabilities | | $ | 1.4 |
|
| Interest rate contracts | Other current assets | | — |
| | Other current liabilities | | 2.8 |
| Other current assets | | — |
| | Other current liabilities | | 1.3 |
|
| Currency contracts | Other assets | | 4.0 |
| | Other liabilities | | — |
| Other assets | | — |
| | Other liabilities | | 22.2 |
|
| Interest rate contracts | Other assets | | — |
| | Other liabilities | | 3.2 |
| Other assets | | — |
| | Other liabilities | | 0.5 |
|
| Derivatives not designated as hedging instruments under ASC 815: | | | | | | | | | | | | | | |
| Currency contracts | Other current assets | | 0.8 |
| | Other current liabilities | | 0.9 |
| Other current assets | | 0.4 |
| | Other current liabilities | | 0.2 |
|
| Total derivatives | | | $ | 8.8 |
| | | | $ | 6.9 |
| | | $ | 3.1 |
| | | | $ | 25.6 |
|
The following tables present the location and amount of gains and losses on derivative instruments included in the Consolidated Statements of Operations or, when applicable, gains and losses initially recognized in other comprehensive income (loss) ("OCI"(“OCI”) for the three and ninesix months ended SeptemberJune 30, 20172018 and 20162017:
| | Three Months Ended September 30, 2017
(In millions) | Amount of Gain (Loss) Recognized in OCI on Derivatives (Effective Portion) | | Location of Gain (Loss) Reclassified from Accumulated OCI into Income (Effective Portion) | | Amount of Gain (Loss) Reclassified from OCI into Income (Effective Portion) | |
Three Months Ended June 30, 2018
(In millions) | | Amount of Gain (Loss) Recognized in OCI on Derivatives | | Location of Gain (Loss) Reclassified from Accumulated OCI into Income | | Amount of Gain (Loss) Reclassified from OCI into Income |
| Derivatives in ASC 815 cash flow hedging relationships: | Derivatives in ASC 815 cash flow hedging relationships: | | | | | Derivatives in ASC 815 cash flow hedging relationships: | | | | |
| Interest rate contracts | $ | 0.2 |
| | Interest expense | | $ | (0.7 | ) | $ | 0.3 |
| | Interest expense | | $ | 0.1 |
|
Currency contracts | (0.1 | ) | | Other expense | | 0.1 |
| 10.4 |
| | Other expense | | 10.2 |
|
| Variable-to-fixed cross-currency swaps | | 3.1 |
| | Interest expense | | 3.1 |
|
| Variable-to-fixed cross-currency swaps | | 18.3 |
| | Other expense | | 29.3 |
|
| Total derivatives | $ | 0.1 |
| | | | $ | (0.6 | ) | $ | 32.1 |
| | | | $ | 42.7 |
|
| |
| (1) | Amount of gain (loss) recognized in OCI includes $0.4 million excluded from the assessment of effectiveness for which the difference between changes in fair value and periodic amortization is recorded in OCI. |
Notes to Consolidated Financial Statements (Continued)
4. Fair Value Measurements and Risk (Continued)
|
| | | | | | | | | |
Six Months Ended June 30, 2018
(In millions) | Amount of Gain (Loss) Recognized in OCI on Derivatives | | Location of Gain (Loss) Reclassified from Accumulated OCI into Income | | Amount of Gain (Loss) Reclassified from OCI into Income |
| Derivatives in ASC 815 cash flow hedging relationships: | | | | |
| Interest rate contracts | $ | 1.8 |
| | Interest expense | | $ | (0.1 | ) |
| Currency contracts(1) | 3.8 |
| | Other expense | | 4.1 |
|
| Variable-to-fixed cross-currency swaps | 3.1 |
| | Interest expense | | 3.1 |
|
| Variable-to-fixed cross-currency swaps | 18.3 |
| | Other expense | | 29.3 |
|
| Total derivatives | $ | 27.0 |
| | | | $ | 36.4 |
|
| |
| (1) | Amount of gain (loss) recognized in OCI includes $(0.4) million excluded from the assessment of effectiveness for which the difference between changes in fair value and periodic amortization is recorded in OCI. |
|
| | | | | | | | | |
Three Months Ended June 30, 2017
(In millions) | Amount of Gain (Loss) Recognized in OCI on Derivatives | | Location of Gain (Loss) Reclassified from Accumulated OCI into Income | | Amount of Gain (Loss) Reclassified from OCI into Income |
| Derivatives in ASC 815 cash flow hedging relationships: | | | | |
| Interest rate contracts | $ | (1.1 | ) | | Interest expense | | $ | (0.8 | ) |
| Currency contracts | — |
| | Other expense | | (0.1 | ) |
| Total derivatives | $ | (1.1 | ) | | | | $ | (0.9 | ) |
|
| | | | | | | | | |
Six Months Ended June 30, 2017
(In millions) | Amount of Gain (Loss) Recognized in OCI on Derivatives | | Location of Gain (Loss) Reclassified from Accumulated OCI into Income | | Amount of Gain (Loss) Reclassified from OCI into Income |
| Derivatives in ASC 815 cash flow hedging relationships: | | | | |
| Interest rate contracts | $ | (1.0 | ) | | Interest expense | | $ | (1.7 | ) |
| Currency contracts | (0.1 | ) | | Other expense | | (0.1 | ) |
| Total derivatives | $ | (1.1 | ) | | | | $ | (1.8 | ) |
The following tables present the total amounts of income and expense line items presented in the Consolidated Statements of Operations in which the effects of cash flow hedges are reported.
|
| | | | | | | | | | | | | | | |
| | Three Months Ended June 30, |
| | 2018 | | 2017 |
| (In millions) | Interest expense | | Other income (expense) | | Interest expense | | Other income (expense) |
| Total amounts of income and expense line items in the Consolidated Statements of Operations in which the effects of cash flow hedges are recorded | $ | (19.9 | ) | | $ | (5.8 | ) | | $ | (20.1 | ) | | $ | 11.4 |
|
| Gain (loss) on cash flow hedging relationships in ASC 815 | | | | | | | |
| Interest rate contracts | | | | | | | |
| Amount of gain (loss) reclassified from accumulated OCI into income | $ | 0.1 |
| | $ | — |
| | $ | (0.8 | ) | | $ | — |
|
| Variable-to-fixed cross-currency swaps | | | | | | | |
| Amount of gain (loss) reclassified from accumulated OCI into income | 3.1 |
| | 29.3 |
| | — |
| | — |
|
| Currency contracts | | | | | | | |
| Amount of gain (loss) reclassified from accumulated OCI into income | — |
| | 10.2 |
| | — |
| | (0.1 | ) |
| Amount excluded from effectiveness testing recognized in earnings based on amortization approach (included in above) | — |
| | 0.3 |
| | — |
| | — |
|
Notes to Consolidated Financial Statements (Continued)
4. Fair Value Measurements and Risk (Continued)
|
| | | | | | | | | |
Nine Months Ended September 30, 2017
(In millions) | Amount of Gain (Loss) Recognized in OCI on Derivatives (Effective Portion) | | Location of Gain (Loss) Reclassified from Accumulated OCI into Income (Effective Portion) | | Amount of Gain (Loss) Reclassified from OCI into Income (Effective Portion) |
| Derivatives in ASC 815 cash flow hedging relationships: | | | | |
| Interest rate contracts | $ | (0.8 | ) | | Interest expense | | $ | (2.4 | ) |
| Currency contracts | (0.2 | ) | | Other expense | | — |
|
| Total derivatives | $ | (1.0 | ) | | | | $ | (2.4 | ) |
|
| | | | | | | | | |
Three Months Ended September 30, 2016
(In millions) | Amount of Gain (Loss) Recognized in OCI on Derivatives
(Effective Portion) | | Location of Gain (Loss) Reclassified from Accumulated OCI into Income
(Effective Portion) | | Amount of Gain (Loss) Reclassified from OCI into Income
(Effective Portion) |
| Derivatives in ASC 815 cash flow hedging relationships: | | | | |
| Interest rate contracts | $ | 0.6 |
| | Interest expense | | $ | (1.0 | ) |
| Currency contracts | (0.4 | ) | | Other expense | | 0.3 |
|
| Total derivatives | $ | 0.2 |
| | | | $ | (0.7 | ) |
|
| | | | | | | | | |
Nine Months Ended September 30, 2016
(In millions) | Amount of Gain (Loss) Recognized in OCI on Derivatives
(Effective Portion) | | Location of Gain (Loss) Reclassified from Accumulated OCI into Income
(Effective Portion) | | Amount of Gain (Loss) Reclassified from OCI into Income
(Effective Portion) |
| Derivatives in ASC 815 cash flow hedging relationships: | | | | |
| Interest rate contracts | $ | (5.8 | ) | | Interest expense | | $ | (3.1 | ) |
| Currency contracts | (0.3 | ) | | Other expense | | 0.7 |
|
| Total derivatives | $ | (6.1 | ) | | | | $ | (2.4 | ) |
|
| | | | | | | | | | | | | | | |
| | Six Months Ended June 30, |
| | 2018 | | 2017 |
| (In millions) | Interest expense | | Other income (expense) | | Interest expense | | Other income (expense) |
| Total amounts of income and expense line items in the Consolidated Statements of Operations in which the effects of cash flow hedges are recorded | $ | (39.2 | ) | | $ | (3.5 | ) | | $ | (39.6 | ) | | $ | 13.3 |
|
| Gain (loss) on cash flow hedging relationships in ASC 815 | | | | | | | |
| Interest rate contracts | | | | | | | |
| Amount of gain (loss) reclassified from accumulated OCI into income | $ | (0.1 | ) | | $ | — |
| | $ | (1.7 | ) | | $ | — |
|
| Variable-to-fixed cross-currency swaps | | | | | | | |
| Amount of gain (loss) reclassified from accumulated OCI into income | 3.1 |
| | 29.3 |
| | — |
| | — |
|
| Currency contracts | | | | | | | |
| Amount of gain (loss) reclassified from accumulated OCI into income | — |
| | 4.1 |
| | — |
| | (0.1 | ) |
| Amount excluded from effectiveness testing recognized in earnings based on amortization approach (included in above) | — |
| | 1.1 |
| | — |
| | — |
|
Net Investment HedgesGrace uses cross-currency swaps as derivative hedging instruments in certain net investment hedges of its non-U.S. subsidiaries. The effective portion of gains and losses attributable to these net investment hedges is recorded net of tax to "currency“currency translation adjustments"adjustments” within "accumulated“accumulated other comprehensive income (loss)"” to offset the change in the carrying value of the net investment being hedged. Recognition in earnings of amounts previously recorded to "currency“currency translation adjustments"adjustments” is limited to circumstances such as complete or substantially complete liquidation of the net investment in the hedged foreign operation. At SeptemberJune 30, 2017,2018, the notional amount of €170.0 million of Grace'sGrace’s cross-currency swaps was designated as a hedging instrument of its net investment in its European subsidiaries.
Grace also uses foreign currency denominatedcurrency-denominated debt and deferred intercompany royalties as non-derivative hedging instruments in certain net investment hedges. The effective portion of gains and losses attributable to these net investment hedges is recorded to "currency translation adjustments" within "accumulated other comprehensive income (loss)." Recognition in earnings of amounts previously recorded to "currency translation adjustments" is limited to circumstances such as complete or substantially complete liquidation of the net investment in the hedged foreign operation. At SeptemberJune 30, 2017, €80.12018, €22.5 million of Grace's term loan principal was designated as a hedging instrument of its net investment in its European subsidiaries. At September 30, 2017, €39.0 million of Grace'sGrace’s deferred intercompany royalties was designated as a hedging instrument of its net investment in its European subsidiaries. In April 2018, in connection with the Credit Agreement, Grace de-designated and repaid its euro-denominated term loan principal that had been designated as a hedge of its net investment in its European subsidiaries.
The following tables presenttable presents the location and amount of gains and losses on derivative and non-derivative instruments designated as net investment hedges, recorded to “currency translation adjustments” within “accumulated other comprehensive income (loss)” for the three and ninesix months ended SeptemberJune 30, 20172018 and 2016.2017. There were no reclassifications of the effective portion of net investment hedges out of OCI and into earnings for the periods presented in the tables below.
|
| | | | | | | | | | | | | | | |
| | Three Months Ended June 30, | | Six Months Ended June 30, |
| (In millions) | 2018 |
| 2017 | | 2018 | | 2017 |
| Derivatives in ASC 815 net investment hedging relationships: | | | | | | | |
| Cross-currency swap | $ | 13.3 |
| | $ | (6.1 | ) | | $ | 2.0 |
| | $ | (8.6 | ) |
| Non-derivatives in ASC 815 net investment hedging relationships: | | | | | | |
|
| Foreign currency denominated debt | $ | — |
| | $ | (4.9 | ) | | $ | (4.4 | ) | | $ | (7.2 | ) |
| Foreign currency denominated deferred intercompany royalties | 1.9 |
| | (2.9 | ) | | 0.2 |
| | (4.4 | ) |
| | $ | 1.9 |
| | $ | (7.8 | ) | | $ | (4.2 | ) | | $ | (11.6 | ) |
Credit Risk Grace is exposed to credit risk in its trade accounts receivable. Customers in the petroleum refining industry represent the greatest exposure. Grace’s credit evaluation policies mitigate credit risk exposures, and it has a history of minimal credit losses. Grace does not generally require collateral for its trade accounts
Notes to Consolidated Financial Statements (Continued)
4. Fair Value Measurements and Risk (Continued)
|
| | | |
Three Months Ended September 30, 2017
(In millions) | Amount of Gain (Loss) Recognized in OCI in Currency Translation Adjustments (Effective Portion) |
| Derivatives in ASC 815 net investment hedging relationships: | |
| Cross-currency swap | $ | (7.3 | ) |
| Non-derivatives in ASC 815 net investment hedging relationships: | |
| Foreign currency denominated debt | $ | (3.1 | ) |
| Foreign currency denominated deferred intercompany royalties | (1.7 | ) |
| | $ | (4.8 | ) |
|
| | | |
Nine Months Ended September 30, 2017
(In millions) | Amount of Gain (Loss) Recognized in OCI in Currency Translation Adjustments (Effective Portion) |
| Derivatives in ASC 815 net investment hedging relationships: | |
| Cross-currency swap | $ | (20.5 | ) |
| Non-derivatives in ASC 815 net investment hedging relationships: | |
| Foreign currency denominated debt | $ | (10.3 | ) |
| Foreign currency denominated deferred intercompany royalties | (6.1 | ) |
| | $ | (16.4 | ) |
|
| | | |
Three Months Ended September 30, 2016
(In millions) | Amount of Gain (Loss) Recognized in OCI in Currency Translation Adjustments (Effective Portion) |
| Derivatives in ASC 815 net investment hedging relationships: | |
| Cross-currency swap | $ | (1.8 | ) |
| Non-derivatives in ASC 815 net investment hedging relationships: | |
| Foreign currency denominated debt | $ | (0.8 | ) |
|
| | | |
Nine Months Ended September 30, 2016
(In millions) | Amount of Gain (Loss) Recognized in OCI in Currency Translation Adjustments (Effective Portion) |
| Derivatives in ASC 815 net investment hedging relationships: | |
| Cross-currency swap | $ | (1.7 | ) |
| Non-derivatives in ASC 815 net investment hedging relationships: | |
| Foreign currency denominated debt | $ | (1.2 | ) |
Credit RiskGrace is exposed to credit risk in its trade accounts receivable. Customers in the petroleum refining industry represent the greatest exposure. Grace's credit evaluation policies mitigate credit risk exposures, and it has a history of minimal credit losses. Grace does not generally require collateral for its trade accounts receivable but may require a bank letter of credit in certain instances, particularly when selling to customers in cash-restricted countries.
Notes to Consolidated Financial Statements (Continued)
4. Fair Value Measurements and Risk (Continued)
Grace may also be exposed to credit risk in its derivatives contracts. Grace monitors counterparty credit risk and currently does not anticipate nonperformance by counterparties to its derivatives. Grace'sGrace’s derivative contracts are with internationally recognized commercial financial institutions.
5. Income Taxes
The effective tax rate is 26.6% as of September 30, 2017, compared with 35.6%provision for income taxes for the yearsix months ended December 31, 2016.June 30, 2018 and 2017, was $49.8 million and $37.6 million, respectively. The $12.2 million increase is primarily due to the Tax Cuts and Jobs Act of 2017 (the “Act”) Global Intangible Low Taxed Income (“GILTI”) 2018 tax rate includes discrete benefitscharge of $2.9$12.0 million, for share-based compensation deductions, $2.4 million for return to provision and deferred tax adjustments, $2.0 million for a tax law change in Illinois, and $1.6 million for an increase in research and development credits, partially offset by a charge of $1.1$6.3 million for a tax lawbenefit from the change in Tennessee. The 2016the federal tax rate under the Act. The 2017 first quarter also included $10.1$3.1 million in share-based compensation deductions that did not repeat in 2018.
The provision for income taxes for the three months ended June 30, 2018 and 2017, was $25.0 million and $19.6 million, respectively. The $5.4 million increase was primarily due to the $6.1 million GILTI tax charge and a $1.9 million net increase in discrete charges caused by an increase in the valuation allowance on deferred tax assets,primarily related to stock compensation. These charges were partially offset by a discrete$4.4 million benefit from the change in the federal tax rate.
On December 22, 2017, the Act was signed into law, making significant changes to the Internal Revenue Code. Changes include a federal corporate tax rate decrease from 35% to 21% for tax years beginning after December 31, 2017, the transition of $6.7 millionU.S. international taxation from a worldwide tax system to a territorial system, and a one-time transition tax on the mandatory deemed repatriation of foreign earnings.
On December 22, 2017, the SEC issued Staff Accounting Bulletin No. 118 (“SAB 118”) to address the application of U.S. GAAP in situations when a registrant does not have the necessary information available, prepared, or analyzed (including computations) in reasonable detail to complete the accounting for share-based compensation deductions.
certain income tax effects of the Act. In the third quarter,accordance with SAB 118, Grace recorded an out-of-periodthe provisional income tax effects of the Act. Additional detailed analyses are needed in order to complete the accounting for certain income tax aspects of the Act. Any subsequent adjustment to recognizethese amounts will be recorded to current tax expense in the accumulated deferred tax liability for its euro loan net investment hedge discussed in Note 4. The impactquarter during which the analysis is completed, which is expected to be during the second half of this correction was a reduction in deferred tax assets2018. In January 2018, the FASB released guidance on the consolidated balance sheetaccounting for tax on the GILTI provisions of the Act. Grace has not completed its analysis in order to make a policy decision on accounting for GILTI.
No material adjustments have been recorded to Grace’s provisional SAB 118 tax expense as of SeptemberJune 30, 2017, and a2018. Further detailed analyses are needed in order to complete the accounting for certain income tax chargeaspects of the Act. Any subsequent adjustment to these amounts will be recorded in "other comprehensive income (loss)" of $14.2 million and $16.9 million for the three and nine months ended September 30, 2017, respectively. Grace has assessed the impact of this error and concluded that the amount was not material to any prior-period financial statements and the impact of correcting this errorcurrent tax expense in the current periodquarter during which the analysis is not material.
Grace generated U.S. federal tax deductions relatingcompleted, which is expected to its emergence from bankruptcy in 2014. The deductions generated U.S. federal NOLs, which Grace has carried forward and expects to utilize in subsequent years. Under U.S. federal income tax law, a corporation is generally permitted to carry forward NOLs for a 20-year period for deduction against future taxable income. Grace also generated U.S. federal tax deductions of $30 million upon payment of the ZAI PD obligation in the 2017 first quarter. (See Note 8.)
The following table summarizes the balance of deferred tax assets, net of deferred tax liabilities, at September 30, 2017, of $691.0 million:
|
| | | | | | | | | | | |
| (In millions) | Deferred Tax Asset (Net of Liabilities) | | Valuation Allowance | | Net Deferred Tax Asset |
| United States—Federal | $ | 615.7 |
| | $ | (17.7 | ) | | $ | 598.0 |
|
| United States—States | 54.6 |
| | (11.2 | ) | | 43.4 |
|
| Germany | 44.1 |
| | — |
| | 44.1 |
|
| Other foreign | 8.0 |
| | (2.5 | ) | | 5.5 |
|
| Total | $ | 722.4 |
| | $ | (31.4 | ) | | $ | 691.0 |
|
Grace will need to generate approximately $1,700 million of U.S. federal taxable income by 2035 (or approximately $95 million per yearbe during the carryforward period) to fully realize the U.S. federal net deferred tax assets.
The following table summarizes expiration dates in jurisdictions where Grace has, or will have, material tax loss and credit carryforwards:
|
| |
| Expiration Dates |
United States—Federal (NOLs) | 2034 - 2035 |
United States—Federal (Credits) | 2019 - 2027 |
United States—States (NOLs) | 2017 - 2035 |
In evaluating its ability to realize its deferred tax assets, Grace considers all reasonably available positive and negative evidence, including recent earnings experience, expectationssecond half of future taxable income and the tax
Notes to Consolidated Financial Statements (Continued)
5. Income Taxes (Continued)
character of that income, the period of time over which the temporary differences become deductible and the carryforward and/or carryback periods available to Grace for tax reporting purposes in the related jurisdiction. In estimating future taxable income, Grace relies upon assumptions and estimates about future activities, including the amount of future federal, state and international pretax operating income that Grace will generate; the reversal of temporary differences; and the implementation of feasible and prudent tax planning strategies. Grace records a valuation allowance to reduce deferred tax assets to the amount that it believes is more likely than not to be realized.2018.
6. Pension Plans and Other Postretirement Benefit Plans
Pension Plans The following table presents the funded status of Grace's underfunded and unfundedGrace’s pension plans:
|
| | | | | | | |
| (In millions) | September 30,
2017 | | December 31,
2016 |
| Underfunded defined benefit pension plans | $ | (80.4 | ) | | $ | (83.1 | ) |
| Unfunded defined benefit pension plans | (371.7 | ) | | (341.2 | ) |
| Total underfunded and unfunded defined benefit pension plans | (452.1 | ) | | (424.3 | ) |
| Pension liabilities included in other current liabilities | (15.3 | ) | | (14.4 | ) |
| Net funded status | $ | (467.4 | ) | | $ | (438.7 | ) |
Underfunded plans include a group of advance-funded plans that are underfunded on a projected benefit obligation ("PBO") basis. Unfunded plans include several plans that are funded on a pay-as-you-go basis, and therefore, the entire PBO is unfunded.
Components of Net Periodic Benefit Cost (Income)
|
| | | | | | | | | | | | | | | | | | | | | | | |
| | Three Months Ended September 30, |
| | 2017 | | 2016 |
| | Pension | | Other Post Retirement | | Pension | | Other Post Retirement |
| (In millions) | U.S. | | Non-U.S. | | | U.S. | | Non-U.S. | |
| Service cost | $ | 4.3 |
| | $ | 2.2 |
| | $ | — |
| | $ | 4.5 |
| | $ | 1.7 |
| | $ | — |
|
| Interest cost | 10.5 |
| | 1.1 |
| | — |
| | 10.1 |
| | 1.3 |
| | — |
|
| Expected return on plan assets | (14.4 | ) | | (0.2 | ) | | — |
| | (14.2 | ) | | (0.2 | ) | | — |
|
| Amortization of prior service credit | (0.1 | ) | | — |
| | (0.5 | ) | | (0.1 | ) | | — |
| | (0.5 | ) |
| Amortization of net deferred actuarial loss | — |
| | — |
| | 0.1 |
| | — |
| | — |
| | 0.1 |
|
| Curtailment gain | — |
| | — |
| | — |
| | — |
| | (0.2 | ) | | — |
|
| Net periodic benefit cost (income) from continuing operations | $ | 0.3 |
| | $ | 3.1 |
| | $ | (0.4 | ) | | $ | 0.3 |
| | $ | 2.6 |
| | $ | (0.4 | ) |
|
| | | | | | | |
| (In millions) | June 30,
2018 | | December 31,
2017 |
| Overfunded defined benefit pension plans | $ | 4.2 |
| | $ | — |
|
| Underfunded defined benefit pension plans | (63.4 | ) | | (110.5 | ) |
| Unfunded defined benefit pension plans | (388.8 | ) | | (391.9 | ) |
| Total underfunded and unfunded defined benefit pension plans | (452.2 | ) | | (502.4 | ) |
| Pension liabilities included in other current liabilities | (14.8 | ) | | (15.0 | ) |
| Net funded status | $ | (462.8 | ) | | $ | (517.4 | ) |
Notes to Consolidated Financial Statements (Continued)
6. Pension Plans and Other Postretirement Benefit Plans (Continued)
Underfunded plans include a group of advance-funded plans that are underfunded on a projected benefit obligation (“PBO”) basis. Unfunded plans include several plans that are funded on a pay-as-you-go basis, and therefore, the entire PBO is unfunded.
The following tables present the components of net periodic benefit cost (income).
| | | | Nine Months Ended September 30, | | | | | | | | | |
| | 2017 | | 2016 | Three Months Ended June 30, |
| | Pension | | Other Post Retirement | | Pension | | Other Post Retirement | 2018 | | 2017 |
| (In millions) | U.S. | | Non-U.S. | | U.S. | | Non-U.S. | | U.S. | | Non-U.S. | | U.S. | | Non-U.S. |
| Service cost | $ | 12.9 |
| | $ | 6.2 |
| | $ | — |
| | $ | 13.9 |
| | $ | 5.4 |
| | $ | — |
| $ | 4.9 |
| | $ | 2.5 |
| | $ | 4.3 |
| | $ | 2.0 |
|
| Interest cost | 31.5 |
| | 3.2 |
| | — |
| | 30.8 |
| | 4.6 |
| | — |
| 10.3 |
| | 1.2 |
| | 10.5 |
| | 1.1 |
|
| Expected return on plan assets | (43.2 | ) | | (0.6 | ) | | — |
| | (43.0 | ) | | (1.5 | ) | | — |
| (14.6 | ) | | (0.2 | ) | | (14.4 | ) | | (0.2 | ) |
| Amortization of prior service credit | (0.3 | ) | | — |
| | (1.5 | ) | | (0.2 | ) | | — |
| | (1.7 | ) | (0.1 | ) | | — |
| | (0.1 | ) | | — |
|
| Amortization of net deferred actuarial loss | — |
| | — |
| | 0.3 |
| | — |
| | — |
| | 0.4 |
| |
| Curtailment gain | — |
| | — |
| | — |
| | — |
| | (0.9 | ) | | — |
| |
| Net periodic benefit cost (income) | 0.9 |
| | 8.8 |
| | (1.2 | ) | | 1.5 |
| | 7.6 |
| | (1.3 | ) | $ | 0.5 |
| | $ | 3.5 |
| | $ | 0.3 |
| | $ | 2.9 |
|
| Less: discontinued operations | — |
| | — |
| | — |
| | (0.5 | ) | | (0.2 | ) | | — |
| |
| Net periodic benefit cost (income) from continuing operations | $ | 0.9 |
| | $ | 8.8 |
| | $ | (1.2 | ) | | $ | 1.0 |
| | $ | 7.4 |
| | $ | (1.3 | ) | |
|
| | | | | | | | | | | | | | | |
| | Six Months Ended June 30, |
| | 2018 | | 2017 |
| (In millions) | U.S. | | Non-U.S. | | U.S. | | Non-U.S. |
| Service cost | $ | 9.7 |
| | $ | 4.9 |
| | $ | 8.6 |
| | $ | 4.0 |
|
| Interest cost | 20.6 |
| | 2.5 |
| | 21.0 |
| | 2.1 |
|
| Expected return on plan assets | (29.1 | ) | | (0.5 | ) | | (28.8 | ) | | (0.4 | ) |
| Amortization of prior service credit | (0.3 | ) | | — |
| | (0.2 | ) | | — |
|
| Net periodic benefit cost (income) | $ | 0.9 |
| | $ | 6.9 |
| | $ | 0.6 |
| | $ | 5.7 |
|
Plan Contributions and Funding Grace intends to satisfy its funding obligations under the U.S. qualified pension plans and to comply with all of the requirements of the Employee Retirement Income Security Act of 1974 ("ERISA"(“ERISA”). For ERISA purposes, funded status is calculated on a different basis than under U.S. GAAP. On April 6, 2018, Grace contributed $50.0 million to its U.S. qualified pension plans.
Grace intends to fund non-U.S. pension plans based on applicable legal requirements and actuarial recommendations.
Defined Contribution Retirement Plan Grace sponsors a defined contribution retirement plan for its employees in the United States. This plan is qualified under section 401(k) of the U.S. tax code. Currently, Grace contributes an amount equal to 100% of employee contributions, up to 6% of an individual employee'semployee’s salary or wages. Grace's costsGrace’s cost related to this benefit plan for the three and ninesix months ended SeptemberJune 30, 2017, were $2.82018, was $3.3 million and $8.5$6.1 million compared with $2.9$3.0 million and $8.3$5.7 million for the corresponding prior-year periods.
The U.S. salaried pension plan is closed to new entrants after January 1, 2017. U.S. salaried employees and certain U.S. hourly employees that are hired on or after January 1, 2017, and employees in Germany that are hired on or after January 1, 2016, will participate in additionalenhanced defined contribution plans instead of defined benefit pension plans.
7. Other Balance Sheet Accounts
|
| | | | | | | |
| (In millions) | September 30,
2017 | | December 31,
2016 |
| Other Current Liabilities | | | |
| Accrued compensation | $ | 49.7 |
| | $ | 49.6 |
|
| Accrued interest | 29.9 |
| | 16.2 |
|
| Environmental contingencies | 24.5 |
| | 32.5 |
|
| Deferred revenue | 16.4 |
| | 27.2 |
|
| Pension liabilities | 15.3 |
| | 14.4 |
|
| Income taxes payable | 14.9 |
| | 5.7 |
|
| Other accrued liabilities | 57.2 |
| | 63.3 |
|
| | $ | 207.9 |
| | $ | 208.9 |
|
Accrued compensation includes salaries and wages as well as estimated current amounts due under the annual and long-term incentive programs.
Notes to Consolidated Financial Statements (Continued)
7. Other Balance Sheet Accounts (Continued)
|
| | | | | | | |
| (In millions) | September 30,
2017 | | December 31,
2016 |
| Other Liabilities | | | |
| Environmental contingencies | $ | 46.1 |
| | $ | 33.8 |
|
| Liability to unconsolidated affiliate | 28.0 |
| | 27.0 |
|
| Fair value of currency and interest rate contracts | 20.1 |
| | 3.2 |
|
| Deferred revenue | 9.5 |
| | 2.3 |
|
| Asset retirement obligation | 8.5 |
| | 10.2 |
|
| Postemployment liability | 6.9 |
| | 7.2 |
|
| Other noncurrent liabilities | 46.2 |
| | 43.0 |
|
| | $ | 165.3 |
| | $ | 126.7 |
|
|
| | | | | | | |
| (In millions) | June 30,
2018 | | December 31,
2017 |
| Other Current Liabilities | | | |
| Accrued compensation | $ | 45.2 |
| | $ | 60.7 |
|
| Deferred revenue | 26.0 |
| | 19.5 |
|
| Environmental contingencies | 22.7 |
| | 23.5 |
|
| Income taxes payable | 20.3 |
| | 12.2 |
|
| Pension liabilities | 14.8 |
| | 15.0 |
|
| Accrued interest | 13.3 |
| | 16.5 |
|
| Other accrued liabilities | 75.0 |
| | 70.4 |
|
| | $ | 217.3 |
| | $ | 217.8 |
|
Accrued compensation includes salaries and wages as well as estimated current amounts due under the annual and long-term incentive programs.
|
| | | | | | | |
| (In millions) | June 30,
2018 | | December 31,
2017 |
| Other Liabilities | | | |
| Liability to unconsolidated affiliate | $ | 56.0 |
| | $ | 32.7 |
|
| Environmental contingencies | 38.5 |
| | 46.8 |
|
| Deferred revenue | 22.3 |
| | 14.9 |
|
| Fair value of currency and interest rate contracts | 19.1 |
| | 22.7 |
|
| Asset retirement obligation | 9.1 |
| | 10.4 |
|
| Deferred income taxes | 8.0 |
| | 8.2 |
|
| Postemployment liability | 4.9 |
| | 5.2 |
|
| Other noncurrent liabilities | 30.8 |
| | 28.4 |
|
| | $ | 188.7 |
| | $ | 169.3 |
|
8. Commitments and Contingent Liabilities
Over the years, Grace operated numerous types of businesses that are no longer part of its business portfolio. As Grace divested or otherwise ceased operating these businesses, it retained certain liabilities and obligations, which we referGrace refers to as legacy liabilities. The principal legacy liabilities are product and environmental liabilities. Although the outcome of each of the matters discussed below cannot be predicted with certainty, Grace has assessed its risk and has made accounting estimates as required under U.S. GAAP.
Legacy Product and Environmental Liabilities
Legacy Product Liabilities Grace emerged from an asbestos-related Chapter 11 bankruptcy on February 3, 2014 (the "Effective Date"“Effective Date”). Under its plan of reorganization, all pending and future asbestos-related claims are channeled for resolution to either a personal injury trust (the "PI Trust"“PI Trust”) or a property damage trust (the "PD Trust"“PD Trust”). The trusts are the sole recourse for holders of asbestos-related claims. The channeling injunctions issued by the bankruptcy court prohibit holders of asbestos-related claims from asserting such claims directly against Grace.
Grace has satisfied all of its financial obligations to the PI Trust. Grace has contingent financial obligations remaining to the PD Trust. With respect to property damage claims related to Grace’s former Zonolite attic insulation product installed in the U.S. ("(“ZAI PD Claims"Claims”), the PD Trust was funded with $34.4 million on the Effective Date and $30.0 million on February 3, 2017. Grace is also obligated to make up to 10 contingent deferred payments of $8 million per year to the PD Trust in respect of ZAI PD Claims during the 20-year period beginning on the fifth anniversary of the Effective Date, with each such payment due only if the assets of the PD
Notes to Consolidated Financial Statements (Continued)
8. Commitments and Contingent Liabilities (Continued)
Trust in respect of ZAI PD Claims fall below $10 million during the preceding year. Grace has not accrued for the 10 additional payments as Grace does not currently believehave sufficient information to conclude that they are probable. Grace is not obligated to make additional payments to the PD Trust in respect of ZAI PD Claims beyond the payments described above. Grace has satisfied all of its financial obligations with respect to Canadian ZAI PD Claims.
With respect to other asbestos property damage claims ("(“Other PD Claims"Claims”), claims unresolved as of the Effective Date are to be litigated in the bankruptcy court and any future claims are to be litigated in a federal district court, in each case pursuant to procedures approved by the bankruptcy court. To the extent any such Other PD Claims are determined to be allowed claims, they are to be paid in cash by the PD Trust. Grace is obligated to make a payment to the PD Trust every six months in the amount of any Other PD Claims allowed during the preceding six months plus interest (if applicable) and the amount of PD Trust expenses for the preceding six months (the "PD Obligation"“PD Obligation”). Grace has not paid any Other PD Claims since emergence. Annual expenses have been approximately $0.2 million per year. The aggregate amount to be paid under the PD Obligation is not capped and Grace may be obligated to make additional payments to the PD Trust in respect of the PD Obligation. Grace has accrued for those unresolved Other PD Claims that it believes are probable and estimable. Grace has not accrued for other unresolved or unasserted Other PD Claims as it does not believe that payment is probable.
Notes to Consolidated Financial Statements (Continued)
8. Commitments and Contingent Liabilities (Continued)
All payments to the PD Trust required after the Effective Date are secured by the Company'sCompany’s obligation to issue 77,372,257 shares of Company common stock to the PD Trust in the event of default, subject to customary anti-dilution provisions.
This summary of the commitments and contingencies related to the Chapter 11 proceeding does not purport to be complete and is qualified in its entirety by reference to the plan of reorganization and the exhibits and documents related thereto, which have been filed with the SecuritiesSEC and Exchange Commission (the "SEC").are readily available on the internet at www.sec.gov.
Legacy Environmental Liabilities Grace is subject to loss contingencies resulting from extensive and evolving federal, state, local and foreign environmental laws and regulations relating to its manufacturing operations. Grace has procedures in place to minimize such contingencies; nevertheless, it has liabilities associated with past operations and additional claims may arise in the future. To address its legacy liabilities, Grace accrues for anticipated costs of response efforts where an assessment has indicated that a probable liability has been incurred and the cost can be reasonably estimated. These accruals do not take into account any discounting for the time value of money.
Grace'sGrace’s environmental liabilities are reassessed regularly and adjusted when circumstances become better defined or response efforts and their costs can be better estimated, typically as a matter moves through the life-cycle of environmental investigation and remediation. These liabilities are evaluated based on currently available information, relating to the nature and extent of contamination, risk assessments, feasibility of response actions, and apportionment amongst other potentially responsible parties, all evaluated in light of prior experience.
At SeptemberJune 30, 2017, Grace's2018, Grace’s estimated liability for legacy environmental response costs totaled $70.6$61.2 million, compared with $66.3$70.3 million at December 31, 2016,2017, and was included in "other“other current liabilities"liabilities” and "other liabilities"“other liabilities” in the Consolidated Balance Sheets. These amounts are based on agreements in place or on Grace'sGrace’s estimate of costs where no formal remediation plan exists, yet there is sufficient information to estimate response costs.
Vermiculite-Related Matters
Grace purchased a vermiculite mine in Libby, Montana, in 1963 and operated it until 1990. Vermiculite concentrate from the Libby mine was used in the manufacture of attic insulation and other products. Some of the vermiculite ore contained naturally occurring asbestos.
Grace is engaged with the U.S. Environmental Protection Agency (the "EPA"“EPA”) and other federal, state and local governmental agencies in a remedial investigation and feasibility study ("(“RI/FS"FS”) of the Libby mine and the surrounding area. In its 2017 Annual Project Update for the Libby Asbestos Superfund Site, the EPA announced a narrowing of its focus from the former "OU3 Study Area" to a smallerarea, known as Operable Unit 3 or "OU3." Within this revised area, the(“OU3”). The RI/FS will determine the specific areas within OU3
Notes to Consolidated Financial Statements (Continued)
8. Commitments and Contingent Liabilities (Continued)
requiring remediation and will identify possible remedial action alternatives. Possible remedial actions within OU3 are wide-ranging, from institutional controls such as land use restrictions, to more active measures involving soil removal, containment projects, or other protective measures. Grace expects the RI/FS and a record of decision to be completed by the end of 2019. When meaningful new information becomes available, Grace will reevaluate the estimated liability for the costs for remediation of the mine and surrounding area and adjust its reserves accordingly. Grace expects certain cost information based on the ongoing feasibility study to become available later in 2018 and, based on communications with regulatory agencies, anticipates that the EPA will issue the record of decision in or after 2020.
The EPA is also investigating or remediating formerly owned or operated sites that processed Libby vermiculite into finished products. Grace is cooperating with the EPA on these investigation and remediation activities, and has recorded a liability to the extent that its review has indicated that a probable liability has been incurred and the cost is estimable. These liabilities cover the estimated cost of investigations and, to the extent an assessment has indicated that remediation is necessary, the estimableestimated cost of response actions. Response actions typically involve soil excavation and removal, and replacement with clean fill. The EPA may commence additional investigations in the future at other sites that processed Libby vermiculite, but Grace does not believe, based on its knowledge of prior and current operations and site conditions, that liability for remediation at such other sites is probable.
Notes to Consolidated Financial Statements (Continued)
8. Commitments and Contingent Liabilities (Continued)
Grace accrued $0.5 million in the three months ended September 30, 2017, for future costs related to vermiculite-related matters, which reflects provision for an agreed-upon remedy at a former vermiculite processing site. Grace'sGrace’s total estimated liability for response costs that are currently estimable for the Libby mine and surrounding area, and at vermiculite processing sites outside of Libby, at SeptemberJune 30, 2017,2018, and December 31, 2016,2017, was $25.1$18.1 million and $31.2$25.8 million, respectively. It is probable that Grace'sGrace’s ultimate liability for these vermiculite-related matters will exceed current estimates by material amounts.
Non-Vermiculite-Related Matters
During the three months ended SeptemberAt June 30, 2017, Grace increased an existing reserve by $5.9 million based on refinement of a scope of work for remediation of materials related to a legacy business located at a current manufacturing site. At September 30, 2017,2018, and December 31, 2016, Grace's2017, Grace’s estimated legacy environmental liability for response costs at sites not related to its former vermiculite mining and processing activities was $45.5$43.1 million and $35.1$44.5 million, respectively. This liability relates to Grace'sGrace’s former businesses or operations, including its share of liability at off-site disposal facilities. Grace'sGrace’s estimated liability is based upon regulatory requirements and environmental conditions at each site. As Grace receives new information, its estimated liability may change materially.
Commercial and Financial Commitments and Contingencies
Purchase Commitments Grace uses purchase commitments to ensure supply and to minimize the volatility of major components of direct manufacturing costs including natural gas, certain metals, rare earths, and other materials. Such commitments are for quantities that Grace fully expects to use in its normal operations.
Guarantees and Indemnification Obligations Grace is a party to many contracts containing guarantees and indemnification obligations. These contracts primarily consist of:
Product warranties with respect to certain products sold to customers in the ordinary course of business. These warranties typically provide that products will conform to specifications. Grace accrues a warranty liability on a transaction-specific basis depending on the individual facts and circumstances related to each sale.
Performance guarantees offered to customers under certain licensing arrangements. Grace has not established a liability for these arrangements based on past performance.
Licenses of intellectual property by Grace to third parties in which Grace has agreed to indemnify the licensee against third party infringement claims.
Contracts providing for the sale or spin-off of a former business unit or product line in which Grace has agreed to indemnify the buyer or resulting entity against certain liabilities related to activities prior to the closing of the transaction, including environmental, tax, and employee liabilities.
Contracts related
Notes to the Separation in which Grace has agreed to indemnify GCP against liabilities related to activities prior to the closing of the transaction, including tax, employee,Consolidated Financial Statements (Continued)
8. Commitments and environmental liabilities.Contingent Liabilities (Continued)
Guarantees of real property lease obligations of third parties, typically arising out of (a) leases entered into by former subsidiaries of Grace, or (b) the assignment or sublease of a lease by Grace to a third party.
Financial Assurances Financial assurances have been established for a variety of purposes, including insurance and environmental matters, trade-related commitments and other matters. At SeptemberAs of June 30, 2017,2018, Grace had gross financial assurances issued and outstanding of $121.6$141.3 million, composed of $39.5$67.8 million of surety bonds issued by various insurance companies and $82.1$73.5 million of standby letters of credit and other financial assurances issued by various banks.
Notes to Consolidated Financial Statements (Continued)
9. Restructuring Expenses and Repositioning Expenses
Restructuring ExpensesIn the 2017 third quarter, Grace incurred costs from restructuring actions, primarily related to workforce reductions as a result of changes in the business environment and its business structure, which are included in "restructuring“restructuring and repositioning expenses"expenses” in the Consolidated Statements of Operations. CostsRestructuring costs in the nine months ended September 30, 2016,2018 primarily related to theplant exit of certain non-strategic product linescosts and sales force reorganization. Restructuring costs in the Materials Technologies reportable segment2017 primarily related to workforce reduction programs in the first half of 2016.manufacturing, supply chain, finance and IT.
The following table presents restructuring expenses by reportable segment for the three and ninesix months ended SeptemberJune 30, 2017.2018.
| | | | Three Months Ended September 30, | | Nine Months Ended September 30, | Three Months Ended June 30, | | Six Months Ended June 30, |
| (In millions) | 2017 | | 2016 | | 2017 | | 2016 | 2018 | | 2017 | | 2018 | | 2017 |
| Catalysts Technologies | $ | 2.4 |
| | $ | 1.6 |
| | $ | 2.8 |
| | $ | 2.7 |
| $ | 1.0 |
| | $ | — |
| | $ | 1.5 |
| | $ | 0.4 |
|
| Materials Technologies | 0.2 |
| | (0.1 | ) | | 0.5 |
| | 15.1 |
| — |
| | 0.1 |
| | 0.4 |
| | 0.3 |
|
| Corporate | 2.7 |
| | 0.3 |
| | 6.8 |
| | 0.4 |
| — |
| | 1.9 |
| | 0.1 |
| | 4.1 |
|
| Total restructuring expenses | $ | 5.3 |
| | $ | 1.8 |
| | $ | 10.1 |
| | $ | 18.2 |
| $ | 1.0 |
| | $ | 2.0 |
| | $ | 2.0 |
| | $ | 4.8 |
|
These costs are not included in segment operating income. Substantially all costs related to the restructuring programs are expected to be paid by September 30, 2018.
The following table presents components of the change in the restructuring liability from December 31, 2016,2017, to SeptemberJune 30, 2017.2018.
| | Restructuring Liability (In millions) | Total | |
| Balance, December 31, 2016 | $ | 9.6 |
| |
| | | (In millions) |
| Balance, December 31, 2017 | | $ | 6.7 |
|
| Accruals for severance and other costs | 9.5 |
| 2.0 |
|
| Payments | (10.9 | ) | (5.1 | ) |
| Currency translation adjustments and other | 0.1 |
| 0.1 |
|
| Balance, September 30, 2017 | $ | 8.3 |
| |
| Balance, June 30, 2018 | | $ | 3.7 |
|
Repositioning Expenses Repositioning expenses primarily include third-party costs related to transformative productivity programs. Pretax repositioning expenses included in continuing operations for the three and ninesix months ended SeptemberJune 30, 2017,2018, were $4.0$17.8 million and $6.9$22.4 million, respectively, compared with $3.8$3.3 million and $10.4$2.8 million, respectively, for the corresponding prior-year periods. The expenses
Expenses incurred in 20172018 primarily relate to third-party consulting costs related to productivity initiatives. Substantially allthe 2018 second quarter write-off of these$8.5 million of prior plant engineering costs have been or are expectedas a result of terminating an expansion project no longer necessary due to be settled in cash.the polyolefin catalysts acquisition (see Note 16), and $8.1 million for a multi-year program to transform manufacturing and business processes to extend Grace’s competitive advantages and improve its cost position, of which $4.9 million
Notes to Consolidated Financial Statements (Continued)
9. Restructuring Expenses and Repositioning Expenses (Continued)
was recorded in the 2018 second quarter. Excluding asset write-offs, substantially all of these expenses have been or are expected to be settled in cash.
10. Other (Income) Expense, net
Components of other (income) expense, net are as follows:
| | | | Three Months Ended September 30, | | Nine Months Ended September 30, | Three Months Ended June 30, | | Six Months Ended June 30, |
| (In millions) | 2017 | | 2016 | | 2017 | | 2016 | 2018 | | 2017 | | 2018 | | 2017 |
| Business interruption insurance recovery | $ | (11.9 | ) | | $ | — |
| | $ | (25.0 | ) | | $ | — |
| |
| Accounts receivable reserve—Venezuela | 10.0 |
| | — |
| | 10.0 |
| | — |
| |
| Currency transaction effects | 1.8 |
| | (0.2 | ) | | 3.8 |
| | 0.1 |
| |
| Chapter 11 expenses, net | 0.4 |
| | 0.4 |
| | 1.9 |
| | 2.4 |
| |
| Net (gain) loss on sales of investments and disposals of assets | 0.7 |
| | (0.1 | ) | | 1.5 |
| | 0.1 |
| |
| Defined benefit pension (income) expense other than service cost | | $ | (3.4 | ) | | $ | (3.2 | ) | | (6.8 | ) | | (4.4 | ) |
| Third-party acquisition-related costs | 0.4 |
| | — |
| | 0.4 |
| | 2.5 |
| 5.8 |
| | — |
| | 6.7 |
| | — |
|
| Loss on early extinguishment of debt | — |
| | — |
| | — |
| | 11.1 |
| 4.8 |
| | — |
| | 4.8 |
| | — |
|
| Currency transaction effects | | (2.7 | ) | | 1.5 |
| | (3.1 | ) | | 2.0 |
|
| Net (gain) loss on sales of investments and disposals of assets | | 0.9 |
| | 0.4 |
| | 1.3 |
| | 0.8 |
|
| Chapter 11 expenses, net | | 0.5 |
| | 0.6 |
| | 1.0 |
| | 1.5 |
|
| Business interruption insurance recovery | | — |
| | (10.6 | ) | | — |
| | (13.1 | ) |
| Other miscellaneous (income) expense | (1.6 | ) | | (0.6 | ) | | (4.6 | ) | | (2.9 | ) | (0.1 | ) | | (0.1 | ) | | (0.4 | ) | | (0.1 | ) |
| Total other (income) expense, net | $ | (0.2 | ) | | $ | (0.5 | ) | | $ | (12.0 | ) | | $ | 13.3 |
| $ | 5.8 |
| | $ | (11.4 | ) | | $ | 3.5 |
| | $ | (13.3 | ) |
In January 2017, a Catalysts Technologies customer experienced an explosion and fire resulting in an extended outage. Grace has received $25.0 million in payments from its third-party insurer in 2017, including $10.4 million through SeptemberJune 30, 2017, under its business interruption insurance policy for lost profits as a result of the outage. The policy has a $25 million limit per event.
During the third quarter of 2017, Grace recorded a $10.0 million charge to fully reserve for a trade receivable from a Venezuela-based customer related to increased economic uncertainty and the recent political unrest and sanctions.
See Note 3 for more information related to Grace's 2016 early extinguishment of debt.
11. Other Comprehensive Income (Loss)
The following tables present the pre-tax, tax, and after-tax components of Grace'sGrace’s other comprehensive income (loss) for the three and ninesix months ended SeptemberJune 30, 20172018 and 20162017:
|
| | | | | | | | | | | |
Three Months Ended September 30, 2017
(In millions) | Pre-Tax Amount | | Tax Benefit/ (Expense) | | After-Tax Amount |
| Defined benefit pension and other postretirement plans: | | | | | |
| Amortization of net prior service credit included in net periodic benefit cost | $ | (0.6 | ) | | $ | 0.2 |
| | $ | (0.4 | ) |
| Amortization of net deferred actuarial loss included in net periodic benefit cost | 0.1 |
| | — |
| | 0.1 |
|
| Benefit plans, net | (0.5 | ) | | 0.2 |
| | (0.3 | ) |
| Currency translation adjustments(1) | (3.6 | ) | | (8.5 | ) | | (12.1 | ) |
| Gain (loss) from hedging activities | 0.7 |
| | (1.1 | ) | | (0.4 | ) |
| Other comprehensive income (loss) attributable to W. R. Grace & Co. shareholders | $ | (3.4 | ) | | $ | (9.4 | ) | | $ | (12.8 | ) |
(1) Tax expense relates to Grace's euro loan net investment hedge, and includes an out-of-period adjustment to recognize the accumulated deferred tax liability related to this hedge. See Note 5. |
| | | | | | | | | | | |
Three Months Ended June 30, 2018
(In millions) | Pre-Tax Amount | | Tax Benefit/ (Expense) | | After-Tax Amount |
| Defined benefit pension and other postretirement plans: | | | | | |
| Amortization of net prior service credit included in net periodic benefit cost | $ | (0.4 | ) | | $ | 0.1 |
| | $ | (0.3 | ) |
| Amortization of net deferred actuarial loss included in net periodic benefit cost | 0.1 |
| | — |
| | 0.1 |
|
| Benefit plans, net | (0.3 | ) | | 0.1 |
| | (0.2 | ) |
| Currency translation adjustments | 40.6 |
| | (2.7 | ) | | 37.9 |
|
| Gain (loss) from hedging activities | (8.2 | ) | | 3.0 |
| | (5.2 | ) |
| Other comprehensive income (loss) attributable to W. R. Grace & Co. shareholders | $ | 32.1 |
| | $ | 0.4 |
| | $ | 32.5 |
|
Notes to Consolidated Financial Statements (Continued)
11. Other Comprehensive Income (Loss) (Continued)
| | Nine Months Ended September 30, 2017
(In millions) | Pre-Tax Amount | | Tax Benefit/ (Expense) | | After-Tax Amount | |
Six Months Ended June 30, 2018
(In millions) | | Pre-Tax Amount | | Tax Benefit/ (Expense) | | After-Tax Amount |
| Defined benefit pension and other postretirement plans: | | | | | | | | | | |
| Amortization of net prior service credit included in net periodic benefit cost | $ | (1.8 | ) | | $ | 0.6 |
| | $ | (1.2 | ) | $ | (0.8 | ) | | $ | 0.2 |
| | $ | (0.6 | ) |
| Amortization of net deferred actuarial loss included in net periodic benefit cost | 0.3 |
| | (0.1 | ) | | 0.2 |
| 0.2 |
| | — |
| | 0.2 |
|
| Benefit plans, net | (1.5 | ) | | 0.5 |
| | (1.0 | ) | (0.6 | ) | | 0.2 |
| | (0.4 | ) |
| Currency translation adjustments | (17.9 | ) | | (3.9 | ) | | (21.8 | ) | 19.8 |
| | (0.1 | ) | | 19.7 |
|
| Gain (loss) from hedging activities | 1.5 |
| | (1.4 | ) | | 0.1 |
| (5.6 | ) | | 2.2 |
| | (3.4 | ) |
| Other comprehensive income (loss) attributable to W. R. Grace & Co. shareholders | $ | (17.9 | ) | | $ | (4.8 | ) | | $ | (22.7 | ) | $ | 13.6 |
| | $ | 2.3 |
| | $ | 15.9 |
|
| | Three Months Ended September 30, 2016
(In millions) | Pre-Tax Amount | | Tax Benefit/ (Expense) | | After-Tax Amount | |
Three Months Ended June 30, 2017
(In millions) | | Pre-Tax Amount | | Tax Benefit/ (Expense) | | After-Tax Amount |
| Defined benefit pension and other postretirement plans: | | | | | | | | | | |
| Amortization of net prior service credit included in net periodic benefit cost | $ | (0.6 | ) | | $ | 0.2 |
| | $ | (0.4 | ) | $ | (0.6 | ) | | $ | 0.2 |
| | $ | (0.4 | ) |
| Amortization of net deferred actuarial loss included in net periodic benefit cost | 0.1 |
| | — |
| | 0.1 |
| 0.1 |
| | (0.1 | ) | | — |
|
| Benefit plans, net | (0.5 | ) | | 0.2 |
| | (0.3 | ) | (0.5 | ) | | 0.1 |
| | (0.4 | ) |
| Currency translation adjustments | (2.3 | ) | | — |
| | (2.3 | ) | (8.3 | ) | | — |
| | (8.3 | ) |
| Gain (loss) from hedging activities | 0.9 |
| | (0.3 | ) | | 0.6 |
| (0.2 | ) | | — |
| | (0.2 | ) |
| Other comprehensive income (loss) attributable to W. R. Grace & Co. shareholders | $ | (1.9 | ) | | $ | (0.1 | ) | | $ | (2.0 | ) | $ | (9.0 | ) | | $ | 0.1 |
| | $ | (8.9 | ) |
| | Nine Months Ended September 30, 2016
(In millions) | Pre-Tax Amount | | Tax Benefit/ (Expense) | | After-Tax Amount | |
Six Months Ended June 30, 2017
(In millions) | | Pre-Tax Amount | | Tax Benefit/ (Expense) | | After-Tax Amount |
| Defined benefit pension and other postretirement plans: | | | | | | | | | | |
| Amortization of net prior service credit included in net periodic benefit cost | $ | (1.9 | ) | | $ | 0.7 |
| | $ | (1.2 | ) | $ | (1.2 | ) | | $ | 0.4 |
| | $ | (0.8 | ) |
| Amortization of net deferred actuarial loss included in net periodic benefit cost | 0.4 |
| | (0.2 | ) | | 0.2 |
| 0.2 |
| | (0.1 | ) | | 0.1 |
|
| Benefit plans, net | (1.5 | ) | | 0.5 |
| | (1.0 | ) | (1.0 | ) | | 0.3 |
| | (0.7 | ) |
| Currency translation adjustments | (6.4 | ) | | — |
| | (6.4 | ) | (9.7 | ) | | — |
| | (9.7 | ) |
| Gain (loss) from hedging activities | (4.2 | ) | | 1.5 |
| | (2.7 | ) | 0.7 |
| | (0.2 | ) | | 0.5 |
|
| Other comprehensive income (loss) attributable to W. R. Grace & Co. shareholders | $ | (12.1 | ) | | $ | 2.0 |
| | $ | (10.1 | ) | $ | (10.0 | ) | | $ | 0.1 |
| | $ | (9.9 | ) |
The following tables present the changes in accumulated other comprehensive income (loss), net of tax, for the ninesix months ended SeptemberJune 30, 20172018 and 20162017:
| | Nine Months Ended September 30, 2017
(In millions) | Defined Benefit Pension and Other Postretirement Plans | | Currency Translation Adjustments | | Gain (Loss) from Hedging Activities | | Total | |
Six Months Ended June 30, 2018
(In millions) | | Defined Benefit Pension and Other Postretirement Plans | | Currency Translation Adjustments | | Gain (Loss) from Hedging Activities | | Total |
| Beginning balance | $ | 2.2 |
| | $ | 67.6 |
| | $ | (3.4 | ) | | $ | 66.4 |
| $ | 0.9 |
| | $ | 41.6 |
| | $ | (2.6 | ) | | $ | 39.9 |
|
| Other comprehensive income (loss) before reclassifications | — |
| | (21.8 | ) | | (1.6 | ) | | (23.4 | ) | — |
| | 19.7 |
| | 20.0 |
| | 39.7 |
|
| Amounts reclassified from accumulated other comprehensive income (loss) | (1.0 | ) | | — |
| | 1.7 |
| | 0.7 |
| (0.4 | ) | | — |
| | (23.4 | ) | | (23.8 | ) |
| Net current-period other comprehensive income (loss) | (1.0 | ) | | (21.8 | ) | | 0.1 |
| | (22.7 | ) | (0.4 | ) | | 19.7 |
| | (3.4 | ) | | 15.9 |
|
| Ending balance | $ | 1.2 |
| | $ | 45.8 |
| | $ | (3.3 | ) | | $ | 43.7 |
| $ | 0.5 |
| | $ | 61.3 |
| | $ | (6.0 | ) | | $ | 55.8 |
|
Notes to Consolidated Financial Statements (Continued)
11. Other Comprehensive Income (Loss) (Continued)
| | Nine Months Ended September 30, 2016
(In millions) | Defined Benefit Pension and Other Postretirement Plans | | Currency Translation Adjustments | | Gain (Loss) from Hedging Activities | | Total | |
Six Months Ended June 30, 2017
(In millions) | | Defined Benefit Pension and Other Postretirement Plans | | Currency Translation Adjustments | | Gain (Loss) from Hedging Activities | | Total |
| Beginning balance | $ | 3.0 |
| | $ | (66.1 | ) | | $ | (3.7 | ) | | $ | (66.8 | ) | $ | 2.2 |
| | $ | 67.6 |
| | $ | (3.4 | ) | | $ | 66.4 |
|
| Other comprehensive income (loss) before reclassifications | — |
| | (6.4 | ) | | (4.3 | ) | | (10.7 | ) | — |
| | (9.7 | ) | | (0.7 | ) | | (10.4 | ) |
| Amounts reclassified from accumulated other comprehensive income (loss) | (1.0 | ) | | — |
| | 1.6 |
| | 0.6 |
| (0.7 | ) | | — |
| | 1.2 |
| | 0.5 |
|
| Net current-period other comprehensive income (loss) | (1.0 | ) | | (6.4 | ) | | (2.7 | ) | | (10.1 | ) | (0.7 | ) | | (9.7 | ) | | 0.5 |
| | (9.9 | ) |
| Distribution of GCP | (0.2 | ) | | 135.5 |
| | — |
| | 135.3 |
| |
| Ending balance | $ | 1.8 |
| | $ | 63.0 |
| | $ | (6.4 | ) | | $ | 58.4 |
| $ | 1.5 |
| | $ | 57.9 |
| | $ | (2.9 | ) | | $ | 56.5 |
|
Grace is a global enterprise operating in many countries with local currency generally deemed to be the functional currency for accounting purposes. The currency translation amount represents the adjustments necessary to translate the balance sheets valued in local currencies to the U.S. dollar as of the end of each period presented, and to translate revenues and expenses at average exchange rates for each period presented.
See Note 4 for a discussion of hedging activities. See Note 6 for a discussion of pension plans and other postretirement benefit plans.
Notes to Consolidated Financial Statements (Continued)
12. Earnings Per Share
The following table shows a reconciliation of the numerators and denominators used in calculating basic and diluted earnings per share.
|
| | | | | | | | | | | | | | | |
| | Three Months Ended September 30, | | Nine Months Ended September 30, |
| (In millions, except per share amounts) | 2017 | | 2016 | | 2017 | | 2016 |
| Numerators | | | | | | | |
| Income (loss) from continuing operations attributable to W. R. Grace & Co. shareholders | $ | 47.4 |
| | $ | 41.2 |
| | $ | 134.2 |
| | $ | 89.7 |
|
| Income (loss) from discontinued operations, net of income taxes | — |
| | (1.6 | ) | | — |
| | (10.9 | ) |
| Net income (loss) attributable to W. R. Grace & Co. shareholders | $ | 47.4 |
| | $ | 39.6 |
| | $ | 134.2 |
| | $ | 78.8 |
|
| Denominators | | | | | | | |
| Weighted average common shares—basic calculation | 67.9 |
| | 70.3 |
| | 68.2 |
| | 70.5 |
|
| Dilutive effect of employee stock options | 0.1 |
| | 0.4 |
| | 0.1 |
| | 0.4 |
|
| Weighted average common shares—diluted calculation | 68.0 |
|
| 70.7 |
|
| 68.3 |
|
| 70.9 |
|
| Basic earnings per share attributable to W. R. Grace & Co. shareholders | | | | | | | |
| Income (loss) from continuing operations | $ | 0.70 |
| | $ | 0.59 |
| | $ | 1.97 |
| | $ | 1.27 |
|
| Income (loss) from discontinued operations, net of income taxes | — |
| | (0.03 | ) | | — |
| | (0.15 | ) |
| Net income (loss) | $ | 0.70 |
| | $ | 0.56 |
| | $ | 1.97 |
| | $ | 1.12 |
|
| Diluted earnings per share attributable to W. R. Grace & Co. shareholders | | | | | | | |
| Income (loss) from continuing operations | $ | 0.70 |
| | $ | 0.58 |
| | $ | 1.96 |
| | $ | 1.27 |
|
| Income (loss) from discontinued operations, net of income taxes | — |
| | (0.02 | ) | | — |
| | (0.16 | ) |
| Net income (loss) | $ | 0.70 |
| | $ | 0.56 |
| | $ | 1.96 |
| | $ | 1.11 |
|
|
| | | | | | | | | | | | | | | |
| | Three Months Ended June 30, | | Six Months Ended June 30, |
| (In millions, except per share amounts) | 2018 | | 2017 | | 2018 | | 2017 |
| Numerators | | | | | | | |
| Net income (loss) attributable to W. R. Grace & Co. shareholders | $ | 38.8 |
| | $ | 43.9 |
| | $ | 82.4 |
| | $ | 86.8 |
|
| Denominators | | | | | | | |
| Weighted average common shares—basic calculation | 67.3 |
| | 68.3 |
| | 67.4 |
| | 68.3 |
|
| Dilutive effect of employee stock options | 0.1 |
| | 0.1 |
| | 0.1 |
| | 0.2 |
|
| Weighted average common shares—diluted calculation | 67.4 |
|
| 68.4 |
|
| 67.5 |
|
| 68.5 |
|
| Basic earnings per share | $ | 0.58 |
| | $ | 0.64 |
| | $ | 1.22 |
| | $ | 1.27 |
|
| Diluted earnings per share | $ | 0.58 |
| | $ | 0.64 |
| | 1.22 |
| | 1.27 |
|
There were 1.61.4 million and 1.51.7 million anti-dilutive options outstanding for the three and ninesix months ended SeptemberJune 30, 2017,2018, compared with 1.01.6 million and 1.5 million for the corresponding prior-year periods.
On February 5, 2015, the Company announced that its Board of Directors had authorized a share repurchase program of up to $500 million, which it completed on July 10, 2017. On February 8, 2017, the Company announced that its Board of Directors authorized a newan additional share repurchase program of up to $250 million, expected to be completed over the next 24 to 36 months at the discretion of management. The timing of the repurchases and the actual amount repurchased will depend on a variety of factors, including the market price of the Company'sCompany’s shares, the strategic deployment of capital, and general market and economic conditions. During the ninesix months ended SeptemberJune 30, 20172018 and 2016,2017, the Company repurchased 935,435723,441 shares and 737,922425,673 shares of Company common stock for $65.0$49.8 million and $55.1$30.0 million, respectively, pursuant to the terms of the share repurchase programs. As of SeptemberJune 30, 2017, $218.92018, $169.1 million remained under the current authorization.
Notes to Consolidated Financial Statements (Continued)
13. Revenues
Grace generates revenues from customer arrangements primarily by manufacturing and delivering specialty chemicals and specialty materials through its two reportable segments. See Note 14 for additional information about Grace’s reportable segments.
Disaggregation of Revenue The following tables present Grace's revenues by geography and product group, within its respective reportable segments, for the three and six months ended June 30, 2018 and 2017.
|
| | | | | | | | | | | | | | | | | | | |
Three Months Ended June 30, 2018
(In millions) | North America | | Europe Middle East Africa (EMEA) | | Asia Pacific | | Latin America | | Total |
| Catalysts Technologies: | | | | | | | | | |
| Refining Catalysts | $ | 67.2 |
| | $ | 61.0 |
| | $ | 53.4 |
| | $ | 14.5 |
| | $ | 196.1 |
|
| Polyolefin and Chemical Catalysts | 51.6 |
| | 66.6 |
| | 45.2 |
| | 4.9 |
| | 168.3 |
|
| Total | $ | 118.8 |
| | $ | 127.6 |
| | $ | 98.6 |
| | $ | 19.4 |
| | $ | 364.4 |
|
| Materials Technologies: | | | | | | | | | |
| Coatings | $ | 7.7 |
| | $ | 19.7 |
| | $ | 11.4 |
| | $ | 2.4 |
| | $ | 41.2 |
|
| Consumer/Pharma | 8.9 |
| | 13.5 |
| | 5.9 |
| | 4.7 |
| | 33.0 |
|
| Chemical process | 10.1 |
| | 20.9 |
| | 8.0 |
| | 2.3 |
| | 41.3 |
|
| Other | 1.9 |
| | 3.7 |
| | 0.2 |
| | — |
| | 5.8 |
|
| Total | $ | 28.6 |
| | $ | 57.8 |
| | $ | 25.5 |
| | $ | 9.4 |
| | $ | 121.3 |
|
|
| | | | | | | | | | | | | | | | | | | |
Six Months Ended June 30, 2018
(In millions) | North America | | EMEA | | Asia Pacific | | Latin America | | Total |
| Catalysts Technologies: | | | | | | | | | |
| Refining Catalysts | $ | 137.1 |
| | $ | 122.3 |
| | $ | 92.2 |
| | $ | 27.9 |
| | $ | 379.5 |
|
| Polyolefin and Chemical Catalysts | 83.8 |
| | 125.0 |
| | 83.2 |
| | 8.7 |
| | 300.7 |
|
| Total | $ | 220.9 |
| | $ | 247.3 |
| | $ | 175.4 |
| | $ | 36.6 |
| | $ | 680.2 |
|
| Materials Technologies: | | | | | | | | | |
| Coatings | $ | 14.8 |
| | $ | 40.2 |
| | $ | 23.2 |
| | $ | 4.7 |
| | $ | 82.9 |
|
| Consumer/Pharma | 16.6 |
| | 26.7 |
| | 10.2 |
| | 9.4 |
| | 62.9 |
|
| Chemical process | 17.5 |
| | 41.7 |
| | 15.2 |
| | 4.6 |
| | 79.0 |
|
| Other | 3.6 |
| | 8.2 |
| | 0.3 |
| | 0.1 |
| | 12.2 |
|
| Total | $ | 52.5 |
| | $ | 116.8 |
| | $ | 48.9 |
| | $ | 18.8 |
| | $ | 237.0 |
|
Notes to Consolidated Financial Statements (Continued)
13. Revenues (Continued)
|
| | | | | | | | | | | | | | | | | | | |
Three Months Ended June 30, 2017
(In millions) | North America | | EMEA | | Asia Pacific | | Latin America | | Total |
| Catalysts Technologies: | | | | | | | | | |
| Refining Catalysts | $ | 64.8 |
| | $ | 53.9 |
| | $ | 50.2 |
| | $ | 17.8 |
| | $ | 186.7 |
|
| Polyolefin and Chemical Catalysts | 30.4 |
| | 55.3 |
| | 44.6 |
| | 3.5 |
| | 133.8 |
|
| Total | $ | 95.2 |
| | $ | 109.2 |
| | $ | 94.8 |
| | $ | 21.3 |
| | $ | 320.5 |
|
| Materials Technologies: | | | | | | | | | |
| Coatings | $ | 6.1 |
| | $ | 17.9 |
| | $ | 9.1 |
| | $ | 2.0 |
| | $ | 35.1 |
|
| Consumer/Pharma | 11.1 |
| | 10.4 |
| | 4.2 |
| | 4.4 |
| | 30.1 |
|
| Chemical process | 7.0 |
| | 23.1 |
| | 7.4 |
| | 1.5 |
| | 39.0 |
|
| Other | 1.4 |
| | 3.3 |
| | — |
| | 0.1 |
| | 4.8 |
|
| Total(1) | $ | 25.6 |
| | $ | 54.7 |
| | $ | 20.7 |
| | $ | 8.0 |
| | $ | 109.0 |
|
| |
| (1) | Under the modified retrospective method, prior-period information has not been adjusted and continues to be reported in accordance with Grace’s historical accounting under ASC 605. |
|
| | | | | | | | | | | | | | | | | | | |
Six Months Ended June 30, 2017
(In millions) | North America | | EMEA | | Asia Pacific | | Latin America | | Total |
| Catalysts Technologies: | | | | | | | | | |
| Refining Catalysts | $ | 126.6 |
| | $ | 108.0 |
| | $ | 91.9 |
| | $ | 38.6 |
| | $ | 365.1 |
|
| Polyolefin and Chemical Catalysts | 58.0 |
| | 99.5 |
| | 83.2 |
| | 8.5 |
| | 249.2 |
|
| Total | $ | 184.6 |
| | $ | 207.5 |
| | $ | 175.1 |
| | $ | 47.1 |
| | $ | 614.3 |
|
| Materials Technologies: | | | | | | | | | |
| Coatings | $ | 13.1 |
| | $ | 34.5 |
| | $ | 18.6 |
| | $ | 4.0 |
| | $ | 70.2 |
|
| Consumer/Pharma | 21.4 |
| | 22.6 |
| | 7.4 |
| | 9.2 |
| | 60.6 |
|
| Chemical process | 14.4 |
| | 41.7 |
| | 14.2 |
| | 2.6 |
| | 72.9 |
|
| Other | 3.0 |
| | 6.3 |
| | 0.1 |
| | 0.1 |
| | 9.5 |
|
| Total(1) | $ | 51.9 |
| | $ | 105.1 |
| | $ | 40.3 |
| | $ | 15.9 |
| | $ | 213.2 |
|
| |
| (1) | Under the modified retrospective method, prior-period information has not been adjusted and continues to be reported in accordance with Grace’s historical accounting under ASC 605. |
Contract Balances Grace invoices customers for product sales once performance obligations have been satisfied, generally at the point of delivery, at which point payment becomes unconditional. Accordingly, Grace's product sales contracts generally do not give rise to material contract assets or liabilities under ASC 606; however, from time to time certain customers may pay in advance. In the technology licensing business, Grace invoices licensees based on milestones achieved but has obligations to provide services in future periods, which results in contract liabilities.
The following table presents Grace’s deferred revenue balances as of June 30, 2018, and December 31, 2017:
|
| | | | | | | |
| (In millions) | June 30,
2018 | | December 31,
2017 |
| Current | $ | 26.0 |
| | $ | 19.5 |
|
| Noncurrent | 22.3 |
| | 14.9 |
|
| Total | $ | 48.3 |
| | $ | 34.4 |
|
Notes to Consolidated Financial Statements (Continued)
13. Revenues (Continued)
These amounts are included as deferred revenue in “other current liabilities” and “other liabilities” in Grace's Consolidated Balance Sheets. Grace records deferred revenues when cash payments are received or due in advance of performance. The increase in deferred revenue reflects cash payments from customers received or due in advance of satisfying performance obligations, offset by $10.3 million of revenue recognized that was included in the deferred revenue balance as of December 31, 2017, and the $3.2 million cumulative adjustment recorded to “retained earnings” as part of the adoption of ASC 606.
The noncurrent portion of the technology licensing revenue will be recognized as performance obligations under the technology licensing agreements are satisfied; the noncurrent balance is expected to be recognized over the next four years.
Remaining performance obligations represent the estimated revenue expected to be recognized in the future related to performance obligations that are unsatisfied (or partially unsatisfied). The aggregate amount of the transaction price allocated to remaining performance obligations for such contracts with a duration of more than one year was approximately $92 million as of June 30, 2018, and includes certain amounts reported as deferred revenue above. In accordance with the practical expedient in ASC 606-10-50-14, Grace does not disclose information about remaining performance obligations that have original expected durations of one year or less. Grace expects to recognize revenue related to remaining performance obligations over several years, as follows:
|
| | | |
| Year | | Approximate percentage of revenue related to remaining performance obligations recognized |
| 2018 | | 12 | % |
| 2019 | | 29 | % |
| 2020 | | 23 | % |
| Thereafter through 2024 | | 36 | % |
| | | 100 | % |
For the three and six months ended June 30, 2018, revenue recognized from performance obligations related to prior periods was not material. Grace has not capitalized any costs to obtain or fulfill contracts with customers under ASC 606. No material impairment losses have been recognized on any receivables or contract assets arising from contracts with customers.
13.14. Segment Information
Grace is a global producer of specialty chemicals and specialty materials. Grace'sGrace’s two reportable business segments are Grace Catalysts Technologies and Grace Materials Technologies. Grace Catalysts Technologies includes catalysts and related products and technologies used in refining, petrochemical and other chemical manufacturing applications. Advanced Refining Technologies ("ART"(“ART”), Grace'sGrace’s joint venture with Chevron Products Company, a division of Chevron U.S.A. Inc. ("Chevron"(“Chevron”), is managed in this segment. (See Note 14.15.)
Notes to Consolidated Financial Statements (Continued)
13. Segment Information (Continued)
Grace Catalysts Technologies comprises two operating segments, Grace Refining Technologies and Grace Specialty Catalysts, which are aggregated into one reportable segment based upon similar economic characteristics, the nature of the products and production processes, type and class of customer, and channels of distribution. Grace Materials Technologies includes specialty materials, including silica-based and silica-alumina-based materials, used in coatings, consumer, industrial, and pharmaceutical applications. The table below presents information related to Grace'sGrace’s reportable segments. Only those corporate expenses directly related to the reportable segments are allocated for reporting purposes. All remaining corporate items are reported separately and labeled as such.
Grace excludes defined benefit pension expense from the calculation of segment operating income. Grace believes that the exclusion of defined benefit pension expense provides a better indicator of its reportable segment performance as defined benefit pension expense is not managed at a reportable segment level.
Grace defines Adjusted EBIT to be net income from continuing operations attributable to W. R. Grace & Co. shareholders adjusted for interest income and expense; income taxes; costs related to legacy product, environmental and other claims;
Notes to Consolidated Financial Statements (Continued)
14. Segment Information (Continued)
restructuring and repositioning expenses and asset impairments; pension costs other than service and interest costs, expected returns on plan assets, and amortization of prior service costs/credits; income and expense items related to divested businesses, product lines, and certain other investments; gains and losses on sales of businesses, product lines, and certain other investments; third-party acquisition-related costs and the amortization of acquired inventory fair value adjustment; and certain other items that are not representative of underlying trends.
Reportable Segment Data
| | | | Three Months Ended September 30, | | Nine Months Ended September 30, | Three Months Ended June 30, | | Six Months Ended June 30, |
| (In millions) | 2017 | | 2016 | | 2017 | | 2016 | 2018 | | 2017 | | 2018 | | 2017 |
| Net Sales | | | | | | | | | | | | | | |
| Catalysts Technologies | $ | 317.5 |
| | $ | 295.8 |
| | $ | 931.8 |
| | $ | 834.8 |
| $ | 364.4 |
| | $ | 320.5 |
| | $ | 680.2 |
| | $ | 614.3 |
|
| Materials Technologies | 112.0 |
| | 108.7 |
| | 325.2 |
| | 323.0 |
| 121.3 |
| | 109.0 |
| | 237.0 |
| | 213.2 |
|
| Total | $ | 429.5 |
| | $ | 404.5 |
| | $ | 1,257.0 |
| | $ | 1,157.8 |
| $ | 485.7 |
| | $ | 429.5 |
| | $ | 917.2 |
| | $ | 827.5 |
|
| Adjusted EBIT | | | | | | | | | | | | | | |
| Catalysts Technologies segment operating income | $ | 103.6 |
| | $ | 94.3 |
| | $ | 286.1 |
| | $ | 260.1 |
| $ | 113.7 |
| | $ | 101.3 |
| | $ | 205.8 |
| | $ | 182.5 |
|
| Materials Technologies segment operating income | 26.4 |
| | 26.4 |
| | 75.4 |
| | 75.0 |
| 29.6 |
| | 24.2 |
| | 53.7 |
| | 49.0 |
|
| Corporate costs | (18.5 | ) | | (14.9 | ) | | (52.9 | ) | | (44.4 | ) | (19.8 | ) | | (18.3 | ) | | (36.4 | ) | | (34.4 | ) |
| Certain pension costs | (3.4 | ) | | (3.1 | ) | | (9.7 | ) | | (9.3 | ) | (4.0 | ) | | (3.2 | ) | | (7.8 | ) | | (6.3 | ) |
| Total | $ | 108.1 |
| | $ | 102.7 |
| | $ | 298.9 |
| | $ | 281.4 |
| $ | 119.5 |
| | $ | 104.0 |
| | $ | 215.3 |
| | $ | 190.8 |
|
Corporate costs include corporate support function costs and other corporate costs such as professional fees and insurance premiums. Certain pension costs include only ongoing costs recognized quarterly, which include service and interest costs, expected returns on plan assets, and amortization of prior service costs/credits.
Reconciliation of Reportable Segment Data to Financial Statements Grace Adjusted EBIT for the three and six months ended June 30, 2018 and 2017, is reconciled below to “income (loss) before income taxes” presented in the accompanying Consolidated Statements of Operations.
|
| | | | | | | | | | | | | | | |
| | Three Months Ended June 30, | | Six Months Ended June 30, |
| (In millions) | 2018 | | 2017 | | 2018 | | 2017 |
| Grace Adjusted EBIT | $ | 119.5 |
| | $ | 104.0 |
| | $ | 215.3 |
| | $ | 190.8 |
|
| Restructuring and repositioning expenses | (18.8 | ) | | (5.4 | ) | | (24.4 | ) | | (7.7 | ) |
| Third-party acquisition-related costs | (5.8 | ) | | — |
| | (6.7 | ) | | — |
|
| Loss on early extinguishment of debt | (4.8 | ) | | — |
| | (4.8 | ) | | — |
|
| Amortization of acquired inventory fair value adjustment | (4.6 | ) | | — |
| | (4.6 | ) | | — |
|
| Costs related to legacy product, environmental and other claims | (2.8 | ) | | (14.9 | ) | | (4.3 | ) | | (17.0 | ) |
| Income and expense items related to divested businesses | 0.6 |
| | (0.7 | ) | | 0.1 |
| | (1.0 | ) |
| Pension MTM adjustment and other related costs, net | — |
| | — |
| | — |
| | (1.9 | ) |
| Interest expense, net | (19.5 | ) | | (19.5 | ) | | (38.4 | ) | | (38.8 | ) |
| Net income (loss) attributable to noncontrolling interests | (0.2 | ) | | (0.4 | ) | | (0.4 | ) | | (0.4 | ) |
| Income (loss) before income taxes | $ | 63.6 |
| | $ | 63.1 |
| | $ | 131.8 |
| | $ | 124.0 |
|
Notes to Consolidated Financial Statements (Continued)
13.14. Segment Information (Continued)
Reconciliation of Reportable Segment Data to Financial StatementsGrace Adjusted EBIT for the three and nine months ended September 30, 2017 and 2016, is reconciled below to income from continuing operations before income taxes presented in the accompanying Consolidated Statements of Operations.
|
| | | | | | | | | | | | | | | |
| | Three Months Ended September 30, | | Nine Months Ended September 30, |
| (In millions) | 2017 | | 2016 | | 2017 | | 2016 |
| Grace Adjusted EBIT | $ | 108.1 |
| | $ | 102.7 |
| | $ | 298.9 |
| | $ | 281.4 |
|
| (Costs) benefit related to legacy product, environmental and other claims | (8.5 | ) | | (13.1 | ) | | (25.5 | ) | | (24.2 | ) |
| Restructuring and repositioning expenses | (9.3 | ) | | (5.6 | ) | | (17.0 | ) | | (28.6 | ) |
| Accounts receivable reserve—Venezuela | (10.0 | ) | | — |
| | (10.0 | ) | | — |
|
| Pension MTM adjustment and other related costs, net | — |
| | 0.2 |
| | (1.9 | ) | | 1.1 |
|
| Income and expense items related to divested businesses | (0.3 | ) | | (0.1 | ) | | (1.3 | ) | | (0.3 | ) |
| Third-party acquisition-related costs | (0.4 | ) | | — |
| | (0.4 | ) | | (2.5 | ) |
| Gain (loss) on sale of product line | (0.4 | ) | | — |
| | (0.4 | ) | | 0.7 |
|
| Loss on early extinguishment of debt | — |
| | — |
| | — |
| | (11.1 | ) |
| Amortization of acquired inventory fair value adjustment | — |
| | (4.1 | ) | | — |
| | (4.1 | ) |
| Interest expense, net | (20.2 | ) | | (19.4 | ) | | (59.0 | ) | | (60.6 | ) |
| Net income (loss) attributable to noncontrolling interests | (0.3 | ) | | 0.1 |
| | (0.7 | ) | | (0.3 | ) |
| Income (loss) from continuing operations before income taxes | $ | 58.7 |
| | $ | 60.7 |
| | $ | 182.7 |
| | $ | 151.5 |
|
Geographic Area DataThe table below presents information related to the geographic areas in which Grace operates. Sales are attributed to geographic areas based on customer location.
| | | | Three Months Ended September 30, | | Nine Months Ended September 30, | Three Months Ended June 30, | | Six Months Ended June 30, |
| (In millions) | 2017 | | 2016 | | 2017 | | 2016 | 2018 | | 2017 | | 2018 | | 2017 |
| Net Sales | | | | | | | | | | | | | | |
| United States | $ | 106.7 |
| | $ | 115.8 |
| | $ | 319.3 |
| | $ | 336.4 |
| $ | 138.1 |
| | $ | 108.8 |
| | $ | 250.5 |
| | $ | 212.6 |
|
| Canada | 12.1 |
| | 11.8 |
| | 36.0 |
| | 34.1 |
| 9.3 |
| | 12.0 |
| | 22.9 |
| | 23.9 |
|
| Total North America | 118.8 |
| | 127.6 |
| | 355.3 |
| | 370.5 |
| 147.4 |
| | 120.8 |
| | 273.4 |
| | 236.5 |
|
| Europe Middle East Africa | 173.2 |
| | 171.6 |
| | 485.8 |
| | 472.4 |
| 185.4 |
| | 163.9 |
| | 364.1 |
| | 312.6 |
|
| Asia Pacific | 119.6 |
| | 76.7 |
| | 335.0 |
| | 231.9 |
| 124.1 |
| | 115.5 |
| | 224.3 |
| | 215.4 |
|
| Latin America | 17.9 |
| | 28.6 |
| | 80.9 |
| | 83.0 |
| 28.8 |
| | 29.3 |
| | 55.4 |
| | 63.0 |
|
| Total | $ | 429.5 |
| | $ | 404.5 |
| | $ | 1,257.0 |
| | $ | 1,157.8 |
| $ | 485.7 |
| | $ | 429.5 |
| | $ | 917.2 |
| | $ | 827.5 |
|
14.15. Unconsolidated Affiliate
Grace accounts for its 50% ownership interest in ART, its joint venture with Chevron, using the equity method of accounting. Grace'sGrace’s investment in ART amounted to $118.0138.7 million and $117.6125.9 million as of SeptemberJune 30, 20172018, and December 31, 20162017, respectively, and the amount included in "equity“equity in earnings of unconsolidated affiliate"affiliate” in the accompanying Consolidated Statements of Operations totaled $4.88.2 million and $17.9$13.6 million for the three and ninesix months ended SeptemberJune 30, 20172018, compared with $8.56.1 million and $18.0$13.1 million for the corresponding prior-year periods. ART is a private, limited liability company, taxed as a partnership, and accordingly does not have a quoted market price available.
Notes to Consolidated Financial Statements (Continued)
14. Unconsolidated Affiliate (Continued)
The following summary presents ART'sART’s assets, liabilities and results of operations.
| | | (In millions) | September 30,
2017 | | December 31,
2016 | June 30,
2018 | | December 31,
2017 |
| Summary Balance Sheet information: | | | | | | |
| Current assets | $ | 268.5 |
| | $ | 249.2 |
| $ | 293.0 |
| | $ | 239.8 |
|
| Noncurrent assets | 85.5 |
| | 84.8 |
| 119.6 |
| | 91.5 |
|
| Total assets | $ | 354.0 |
| | $ | 334.0 |
| $ | 412.6 |
| | $ | 331.3 |
|
| | | | | | | |
| Current liabilities | $ | 121.7 |
| | $ | 102.0 |
| $ | 138.6 |
| | $ | 82.4 |
|
| Noncurrent liabilities | — |
| | 0.3 |
| 0.3 |
| | 0.3 |
|
| Total liabilities | $ | 121.7 |
| | $ | 102.3 |
| $ | 138.9 |
| | $ | 82.7 |
|
| | | | Three Months Ended September 30, | | Nine Months Ended September 30, | Three Months Ended June 30, | | Six Months Ended June 30, |
| (In millions) | 2017 | | 2016 | | 2017 | | 2016 | 2018 | | 2017 | | 2018 | | 2017 |
| Summary Statement of Operations information: | | | | | | | | |
| Net sales | $ | 113.5 |
| | $ | 110.1 |
| | $ | 321.4 |
| | $ | 255.8 |
| $ | 103.0 |
| | $ | 110.5 |
| | $ | 188.2 |
| | $ | 207.9 |
|
| Costs and expenses applicable to net sales | 100.1 |
| | 89.8 |
| | 273.7 |
| | 213.2 |
| 84.0 |
| | 94.7 |
| | 154.7 |
| | 173.6 |
|
| Income before income taxes | 10.4 |
| | 18.2 |
| | 37.2 |
| | 37.4 |
| 16.9 |
| | 12.6 |
| | 28.2 |
| | 26.8 |
|
| Net income | 9.6 |
| | 17.0 |
| | 35.8 |
| | 35.9 |
| 16.2 |
| | 12.2 |
| | 27.7 |
| | 26.2 |
|
Grace and ART transact business on a regular basis and maintain several agreements in order to operate the joint venture. These agreements are treated as related party activities with an unconsolidated affiliate. SalesProduct
Notes to Consolidated Financial Statements (Continued)
15. Unconsolidated Affiliate (Continued)
manufactured by Grace for ART areis accounted for on a net basis, with a mark-up, in "cost“cost of goods sold"sold” in the Consolidated Statements of Operations. Grace also receives reimbursement from ART for fixed costs, research and development, selling, general and administrative services, and depreciation. Grace records reimbursements against the respective line items on Grace'sGrace’s Consolidated Statement of Operations. The table below presents summary financial data related to transactions between Grace and ART.
|
| | | | | | | | | | | | | | | |
| | Three Months Ended September 30, | | Nine Months Ended September 30, |
| (In millions) | 2017 | | 2016 | | 2017 | | 2016 |
| Grace sales of catalysts to ART | $ | 54.5 |
| | $ | 56.1 |
| | $ | 159.0 |
| | $ | 156.4 |
|
| Mark-up on Grace's sales to ART included as a reduction of Grace's cost of goods sold | 1.1 |
| | 1.1 |
| | 3.1 |
| | 3.1 |
|
| Charges for fixed costs, research and development, selling, general and administrative services, and depreciation to ART | 10.4 |
| | 6.2 |
| | 31.2 |
| | 18.5 |
|
|
| | | | | | | | | | | | | | | |
| | Three Months Ended June 30, | | Six Months Ended June 30, |
| (In millions) | 2018 | | 2017 | | 2018 | | 2017 |
| Product manufactured for ART | $ | 58.5 |
| | $ | 53.1 |
| | $ | 110.4 |
| | $ | 104.5 |
|
| Mark-up on product manufactured for ART included as a reduction of Grace’s cost of goods sold | 1.2 |
| | 1.0 |
| | 2.2 |
| | 2.0 |
|
| Charges for fixed costs; research and development; selling, general and administrative services; and depreciation to ART | 10.4 |
| | 10.4 |
| | 21.1 |
| | 20.8 |
|
The table below listspresents Grace balances related to ART.
|
| | | | | | | |
| (in millions) | September 30,
2017 | | December 31,
2016 |
| Accounts receivable | $ | 14.5 |
| | $ | 14.9 |
|
| Noncurrent asset | 28.0 |
| | 27.0 |
|
| Accounts payable | 24.5 |
| | 28.7 |
|
| Debt payable within one year | 7.7 |
| | 7.6 |
|
| Debt payable after one year | 33.7 |
| | 31.9 |
|
| Noncurrent liability | 28.0 |
| | 27.0 |
|
Notes to Consolidated Financial Statements (Continued)
14. Unconsolidated Affiliate (Continued)
|
| | | | | | | |
| (in millions) | June 30,
2018 | | December 31,
2017 |
| Accounts receivable | $ | 15.5 |
| | $ | 20.1 |
|
| Noncurrent asset | 56.0 |
| | 32.7 |
|
| Accounts payable | 32.6 |
| | 22.3 |
|
| Debt payable within one year | 8.7 |
| | 8.6 |
|
| Debt payable after one year | 37.6 |
| | 33.8 |
|
| Noncurrent liability | 56.0 |
| | 32.7 |
|
The noncurrent asset and noncurrent liability in the table above represent spending to date related to a planned residue hydroprocessing catalyst production plant that is under construction in Lake Charles, Louisiana. Grace manages the design and construction of the plant, and the asset will continue to be included in "other assets"“other assets” in Grace'sGrace’s Consolidated Balance Sheets until construction is completed. Grace has likewise recorded a liability for the transfer of the asset to ART upon completion, included in "other liabilities"“other liabilities” in the Consolidated Balance Sheets.
Grace and Chevron provide lines of credit in the amount of $15.0 million each at a commitment fee of 0.1% of the credit amount. These agreements have been approved by the ART Executive Committee for renewal until February 24, 2018.2019. No amounts were outstanding at SeptemberJune 30, 2017,2018, and December 31, 2016.2017.
15. Discontinued Operations16. Acquisitions
As a resultOn April 3, 2018, using cash on hand and borrowings under the Credit Agreement, Grace acquired the assets of the Separationpolyolefin catalysts business of Albemarle Corporation for $420.9 million, net of cash acquired. The business is included in the Specialty Catalysts operating segment of the Catalysts Technologies reportable segment. The acquisition is complementary to Grace's existing specialty catalysts business and Distribution, GCP is now an independent public company,strengthens Grace's commercial relationships, catalysts technology portfolio, and its common stock is listed under the symbol "GCP" on the New York Stock Exchange. Grace does not beneficially own any shares of GCP common stock and will not consolidate the financial results of GCP in its future financial reporting, as GCP is no longer a related party to Grace subsequentmanufacturing network.
The acquisition purchase price has been preliminarily allocated to the Separation. GCP’s historical financial results throughtangible and identifiable intangible assets and liabilities acquired based on their estimated fair values at the Distribution Date are reflectedacquisition date in Grace’saccordance with ASC 805 “Business Combinations.” The excess of the purchase price over the fair value of the tangible and intangible assets acquired was recorded as goodwill. The goodwill recognized is attributable to the expected growth and operating synergies that Grace expects to realize from this acquisition. The full $139.7 million of goodwill generated from the acquisition will be deductible for U.S. income tax purposes. Due to the timing of the
Notes to Consolidated Financial Statements as discontinued operations. For a summary(Continued)
16. Acquisitions (Continued)
acquisition closing, Grace has not had adequate time to finalize the purchase price allocation. Adjustments to the allocation, if applicable, will be recorded in the period in which they are identified.
The Consolidated Statements of Operations for the three and six months ended June 30, 2018, includes approximately $28 million of sales attributable to this acquisition. Disclosure of earnings attributable to this acquisition is not practicable due to the integration of operations into Grace’s existing business.
The table below presents the preliminary allocation of the Separation and Distribution Agreement and the related Tax Sharing Agreement, see Note 21, "Discontinued Operations" to the Consolidated Financial Statements in Grace's Form 10-K for the year ended December 31, 2016. Grace has filed the full texts of the Separation and Distribution Agreement and the Tax Sharing Agreement with the SEC, which are readily available on the Internet at www.sec.gov.
GCP's historical financial results through the February 3, 2016, Distribution Date and other effects of the Separation for the nine months ended September 30, 2016, are presented as discontinued operations as summarized below:acquisition purchase price.
|
| | | |
| (In millions) | Nine Months Ended September 30, 2016 |
| Net sales | $ | 99.6 |
|
| Cost of goods sold | 62.6 |
|
| Gross profit | 37.0 |
|
| Selling, general and administrative expenses | 21.6 |
|
| Research and development expenses | 1.7 |
|
| Repositioning expenses | 22.0 |
|
| Interest expense and related financing costs | 0.7 |
|
| Other expense, net | 4.4 |
|
| Total costs and expenses | 50.4 |
|
| (Loss) Income from discontinued operations before income taxes | (13.4 | ) |
| Benefit from (provision for) income taxes | 2.6 |
|
| (Loss) Income from discontinued operations after income taxes | (10.8 | ) |
| Less: Net income attributable to noncontrolling interests | (0.1 | ) |
| Net (loss) income from discontinued operations | $ | (10.9 | ) |
|
| | | |
| | (In millions) |
| Accounts receivable | $ | 13.9 |
|
| Inventories | 28.1 |
|
| Other current assets | 3.5 |
|
| Properties and equipment | 120.2 |
|
| Goodwill | 139.7 |
|
| Intangible assets | 118.2 |
|
| Other assets | 0.5 |
|
| Liabilities assumed | (3.2 | ) |
| Net assets acquired, net of cash acquired | $ | 420.9 |
|
In January 2016, GCP completedThe table below presents the saleintangible assets acquired as part of $525.0 million aggregate principalthe acquisition of the assets of Albemarle’s polyolefin catalysts business and the periods over which they will be amortized.
|
| | | | | |
| | Amount (In millions) | | Weighted Average Amortization Period (in years) |
| Customer Lists | $ | 102.4 |
| | 20.0 |
| Technology | 11.5 |
| | 15.0 |
| Trademarks | 4.3 |
| | 15.0 |
| Total | $ | 118.2 |
| | 19.1 |
The carrying amount of 9.500% Senior Notes due in 2023. GCP used a portion of these proceedsgoodwill attributable to fund a $500.0 million distribution to Grace in connection with the Separationeach reportable segment and the Distribution.changes in those balances during the six months ended June 30, 2018, are as follows:
In February 2016, GCP entered into a credit agreement that provides for new senior secured credit facilities in an aggregate principal amount of $525.0 million, consisting of term loans in an aggregate principal amount of $275.0 million maturing in 2022 and of revolving loans in an aggregate principal amount of $250.0 million maturing in 2021, which were undrawn at closing. GCP used a portion of these proceeds to fund a $250.0 million distribution to Grace in connection with the Separation and the Distribution. |
| | | | | | | | | | | |
| (In millions) | Catalysts Technologies | | Materials Technologies | | Total Grace |
| Balance, December 31, 2017 | $ | 357.7 |
| | $ | 44.7 |
| | $ | 402.4 |
|
| Goodwill acquired during the year | 139.7 |
| | — |
| | 139.7 |
|
| Foreign currency translation | (0.7 | ) | | (0.2 | ) | | (0.9 | ) |
| Balance, June 30, 2018 | $ | 496.7 |
| | $ | 44.5 |
| | $ | 541.2 |
|
ITEM 2. MANAGEMENT'SMANAGEMENT’S DISCUSSION AND ANALYSIS OF FINANCIAL CONDITION AND RESULTS OF OPERATIONS
We generally refer to the quarter ended SeptemberJune 30, 2018, as the “second quarter” and the quarter ended June 30, 2017, as the "third“prior-year quarter,,"” the quarter ended September 30, 2016,March 31, 2018, as the "prior-year“2018 first quarter,"” the quartersix months ended June 30, 2018, as the “six months,” and the six months ended June 30, 2017, as the "2017 second quarter," the quarter ended March 31, 2017, as the "2017 first quarter," the nine months ended September 30, 2017, as the "nine months," and the nine months ended September 30, 2016, as the "prior-year“prior-year period."” See Analysis of Operations for a discussion of our non-GAAP performance measures. Our references to "emerging regions"“emerging regions” refer to emerging and developing regions as defined by the International Monetary Fund.
Results of Operations
ThirdSecond Quarter Performance Summary
Following is a summary of our financial performance for the thirdsecond quarter compared with the prior-year quarter.
Net sales increased 6.2%13.1% to $429.5$485.7 million.
Income from continuing operationsNet income attributable to Grace increased15.0%decreased 11.6% to $47.4$38.8 million.
Adjusted EBIT increased 14.9% to $119.5 million.
Diluted earnings per share from continuing operations increased 20.7%decreased 9.4% to $0.70$0.58 per diluted share.
Adjusted EPS increased 12.5%27.4% to $0.90$1.07 per diluted share.
Adjusted EBIT increased 5.3% to $108.1 million.
Summary Description of Business
We are engaged in specialty chemicals and specialty materials businesses on a worldwide basis through our two reportable segments.
Grace Catalysts Technologies produces and sells catalysts and related products and technologies used in refining, petrochemical and other chemical manufacturing applications, as follows:
Fluid catalytic cracking catalysts, also called FCC catalysts, that help to "crack" the hydrocarbon chain in distilled crude oil to produce transportation fuels, such as gasoline and diesel fuels, and other petroleum-based products; and FCC additives used to reduce sulfur in gasoline, maximize propylene production from refinery FCC units, and reduce emissions of sulfur oxides, nitrogen oxides and carbon monoxide from refinery FCC units.units; and Methanol-to-Olefins (MTO) catalysts, used to convert methanol, often derived from coal, into petrochemical feeds such as ethylene and propylene.
Hydroprocessing catalysts (HPC), most of which are marketed through our Advanced Refining Technologies LLC, or ART, joint venture with Chevron in which we hold a 50% economic interest,Products Company (“Chevron”), that are used in process reactors to upgrade heavy oils into lighter, more useful products that comply with rising environmental standards by removing impurities such as nitrogen, sulfur and heavy metals, allowing less expensive feedstocks to be used in the petroleum refining process (ARTprocess. (We hold a 50% economic interest in ART, which is not consolidated in our financial statements so ART's sales are excluded from our sales).sales.)
Polyolefin catalysts and catalyst supports, also called specialty catalysts (SC), for the production of polypropylene and polyethylene thermoplastic resins, which can be customized to enhance the performance of a wide range of industrial and consumer end-use applications including high pressure pipe, geomembranes, food packaging, automotive parts, medical devices, and textiles; and chemical catalysts used in a variety of industrial, environmental and consumer applications; and gas-phaseapplications.
Gas-phase polypropylene process technology, which provides our licensees with a cost-effective, flexible, and reliable capability to manufacture polypropylene products across a wide spectrum of performance attributes enabling customers to manufacture products for a broad array of end-use applications.
Grace Materials Technologies produces and sells specialty materials, including silica-based and silica-alumina-based materials, used in coatings, consumer, industrial, and pharmaceutical applications, as follows:
Coatings, and print media applications, functional additives for wood and architectural coatings that provide mattingsurface effects and corrosion protection for industrialmetal substrates.
Consumer/Pharma, specialized materials used as additives and consumer coatings and media and paper products to enhance quality in ink jet coatings.
Consumer/Pharma applications, as a free-flow agent, carrier or processing aid inintermediates for pharmaceuticals, nutraceuticals, beer, toothpaste, food and personal care products; as a toothpaste abrasive and thickener; and for the processing and stabilization of edible oils and beverages; as well as pharmaceutical, life science and related applications including silica-based separation media, excipients and pharmaceutical intermediates.cosmetic segments.
Chemical Process applications, such as tires and rubber, plastics, precision investment casting, refractory, insulating glass windows, adsorbentsprocess, functional materials for use in plastics, rubber, tire, metal casting and adsorbent products for petrochemical and natural gas processes and biofuels, various functions such as reinforcement, high temperature binding and moisture scavenging.applications.
Global Scope
We operate our business on a global scale with approximately 72%75% of our annual 20162017 sales and 75%73% of our ninesix months sales to customers located outside the United States. We operate and/or sell to customers in over 60 countries and do business in over 30 currencies. We manage our operating segments on a global basis, to serve global markets. Currency fluctuations affect our reported results of operations, cash flows, and financial position.
Analysis of Operations
We have set forth in the table below our key operating statistics with percentage changes for the thirdsecond quarter and ninesix months compared with the corresponding prior-year periods. Please refer to this Analysis of Operations when reviewing this Management'sManagement’s Discussion and Analysis of Financial Condition and Results of Operations. In the table we present financial information in accordance with U.S. GAAP, as well as the non-GAAP financial information described below. We believe that the non-GAAP financial information provides useful supplemental information about the performance of our businesses, improves period-to-period comparability and provides clarity on the information our management uses to evaluate the performance of our businesses. In the table, we have provided reconciliations of these non-GAAP financial measures to the most directly comparable financial measure calculated and presented in accordance with U.S. GAAP. The non-GAAP financial measures should not be considered as a substitute for financial measures calculated in accordance with U.S. GAAP, and the financial results calculated in accordance with U.S. GAAP and reconciliations from those results should be evaluated carefully.
We define Adjusted EBIT (a non-GAAP financial measure) to be net income from continuing operations attributable to W. R. Grace & Co. shareholders adjusted for interest income and expense; income taxes; costs related to legacy product, environmental and other claims; restructuring and repositioning expenses and asset impairments; pension costs other than service and interest costs, expected returns on plan assets, and amortization of prior service costs/credits; income and expense items related to divested businesses, product lines, and certain other investments; gains and losses on sales of businesses, product lines, and certain other investments; third-party acquisition-related costs and the amortization of acquired inventory fair value adjustment; and certain other items that are not representative of underlying trends.
We define Adjusted EBITDA (a non-GAAP financial measure) to be Adjusted EBIT adjusted for depreciation and amortization.
We define Adjusted EBIT Return On Invested Capital (a non-GAAP financial measure) to be Adjusted EBIT (on a trailing four quarters basis) divided by the sum of net working capital, properties and equipment and certain other assets and liabilities.
We define Adjusted Gross Margin (a non-GAAP financial measure) to be gross margin adjusted for pension-related costs included in cost of goods sold and the amortization of acquired inventory fair value adjustment.
We define Adjusted Earnings Per Share (EPS) (a non-GAAP financial measure) to be diluted EPS from continuing operations adjusted for costs related to legacy product, environmental and other claims; restructuring and repositioning expenses and asset impairments; pension costs other than service and interest costs, expected returns on plan assets, and amortization of prior service costs/credits; income and expense items related to divested businesses, product lines, and certain other investments; gains and losses on sales of businesses, product lines and certain other investments; third-party acquisition-related costs and the amortization of acquired inventory fair value adjustment; certain other items that are not representative of underlying trends; and certain discrete tax items.
We define Net Sales, constant currency (a non-GAAP financial measure) to be the period-over-period change in net sales calculated using the foreign currency exchange rates that were in effect during the previous comparable period.
We use Adjusted EBIT as a performance measure in significant business decisions and in determining certain incentive compensation. We use Adjusted EBIT as a performance measure because it provides improved period-to-period comparability for decision making and compensation purposes, and because it better measures the ongoing earnings results of our strategic and operating decisions by excluding the earnings effects of our legacy product, environmental and other claims; restructuring and repositioning activities; divested businesses; the effects of acquisitions; and certain other items that are not representative of underlying trends.
We use Adjusted EBITDA, Adjusted EBIT Return On Invested Capital, Adjusted Gross Margin, and Adjusted EPS as performance measures and may use these measures in determining certain incentive compensation. We use Adjusted EBIT Return On Invested Capital in making operating and investment decisions and in balancing the growth and profitability of our operations.
We use Net Sales, constant currency as a performance measure to compare current period financial performance to historical financial performance by excluding the impact of foreign currency exchange rate fluctuations that are not representative of underlying business trends and are largely outside of our control.
Adjusted EBIT, Adjusted EBITDA, Adjusted EBIT Return On Invested Capital, Adjusted Gross Margin, and Adjusted EPS, and Net Sales, constant currency do not purport to represent income measures as defined under U.S. GAAP and should not be used as alternatives to such measures as an indicator of our performance. These measures are provided to investors and others to improve the period-to-period comparability and peer-to-peer comparability of our financial results, and to ensure that investors understand the information we use to evaluate the performance of our businesses. They distinguish the operating results of Grace'sGrace’s current business base from the costs of Grace'sGrace’s legacy product, environmental and other claims; restructuring and repositioning activities; divested businesses; and certain other items. These measures may have material limitations due to the exclusion or inclusion of amounts that are included or excluded, respectively, in the most directly comparable measures calculated and presented in accordance with U.S. GAAP and thus investors and others should review carefully the financial results calculated in accordance with U.S. GAAP.
Adjusted EBIT has material limitations as an operating performance measure because it excludes costs related to legacy product, environmental and other claims, and may exclude income and expenses from restructuring and repositioning activities and divested businesses, which historically have been material components of our net income. Adjusted EBITDA also has material limitations as an operating performance measure because it excludes the impact of depreciation and amortization expense. Our business is substantially dependent on the successful deployment of capital, and depreciation and amortization expense is a necessary element of our costs. We compensate for the limitations of these measurements by using these indicators together with net income as measured under U.S. GAAP to present a complete analysis of our results of operations. Adjusted EBIT and Adjusted EBITDA should be evaluated together with net income and net income attributable to Grace shareholders, measured under U.S. GAAP, for a complete understanding of our results of operations.
| | Analysis of Operations (In millions, except per share amounts) | Three Months Ended September 30, | | Nine Months Ended September 30, | Three Months Ended June 30, | | Six Months Ended June 30, |
| 2017 | | 2016 | | % Change | | 2017 | | 2016 | | % Change | 2018 | | 2017 | | % Change | | 2018 | | 2017 | | % Change |
| Net sales: | | | | | | | | | | | | | | | | | | | | | | |
| Catalysts Technologies | $ | 317.5 |
| | $ | 295.8 |
| | 7.3 | % | | $ | 931.8 |
| | $ | 834.8 |
| | 11.6 | % | $ | 364.4 |
| | $ | 320.5 |
| | 13.7 | % | | $ | 680.2 |
| | $ | 614.3 |
| | 10.7 | % |
| Materials Technologies | 112.0 |
| | 108.7 |
| | 3.0 | % | | 325.2 |
| | 323.0 |
| | 0.7 | % | 121.3 |
| | 109.0 |
| | 11.3 | % | | 237.0 |
| | 213.2 |
| | 11.2 | % |
| Total Grace net sales | $ | 429.5 |
| | $ | 404.5 |
| | 6.2 | % | | $ | 1,257.0 |
| | $ | 1,157.8 |
| | 8.6 | % | $ | 485.7 |
| | $ | 429.5 |
| | 13.1 | % | | $ | 917.2 |
| | $ | 827.5 |
| | 10.8 | % |
| Net sales by region: | | | | | | | | | | | | | | | | | | | | | | |
| North America | $ | 118.8 |
| | $ | 127.6 |
| | (6.9 | )% | | $ | 355.3 |
| | $ | 370.5 |
| | (4.1 | )% | $ | 147.4 |
| | $ | 120.8 |
| | 22.0 | % | | $ | 273.4 |
| | $ | 236.5 |
| | 15.6 | % |
| Europe Middle East Africa | 173.2 |
| | 171.6 |
| | 0.9 | % | | 485.8 |
| | 472.4 |
| | 2.8 | % | 185.4 |
| | 163.9 |
| | 13.1 | % | | 364.1 |
| | 312.6 |
| | 16.5 | % |
| Asia Pacific | 119.6 |
| | 76.7 |
| | 55.9 | % | | 335.0 |
| | 231.9 |
| | 44.5 | % | 124.1 |
| | 115.5 |
| | 7.4 | % | | 224.3 |
| | 215.4 |
| | 4.1 | % |
| Latin America | 17.9 |
| | 28.6 |
| | (37.4 | )% | | 80.9 |
| | 83.0 |
| | (2.5 | )% | 28.8 |
| | 29.3 |
| | (1.7 | )% | | 55.4 |
| | 63.0 |
| | (12.1 | )% |
| Total net sales by region | $ | 429.5 |
| | $ | 404.5 |
| | 6.2 | % | | $ | 1,257.0 |
| | $ | 1,157.8 |
| | 8.6 | % | $ | 485.7 |
| | $ | 429.5 |
| | 13.1 | % | | $ | 917.2 |
| | $ | 827.5 |
| | 10.8 | % |
| Performance measures: | | | | | | | | | | | | | | | | | | | | | | |
| Adjusted EBIT(A): | | | | | | | | | | | | | | | | | | | | | | |
| Catalysts Technologies segment operating income | $ | 103.6 |
| | $ | 94.3 |
| | 9.9 | % | | $ | 286.1 |
| | $ | 260.1 |
| | 10.0 | % | $ | 113.7 |
| | $ | 101.3 |
| | 12.2 | % | | $ | 205.8 |
| | $ | 182.5 |
| | 12.8 | % |
| Materials Technologies segment operating income | 26.4 |
| | 26.4 |
| | — | % | | 75.4 |
| | 75.0 |
| | 0.5 | % | 29.6 |
| | 24.2 |
| | 22.3 | % | | 53.7 |
| | 49.0 |
| | 9.6 | % |
| Corporate costs | (18.5 | ) | | (14.9 | ) | | (24.2 | )% | | (52.9 | ) | | (44.4 | ) | | (19.1 | )% | (19.8 | ) | | (18.3 | ) | | (8.2 | )% | | (36.4 | ) | | (34.4 | ) | | (5.8 | )% |
| Certain pension costs(B) | (3.4 | ) | | (3.1 | ) | | (9.7 | )% | | (9.7 | ) | | (9.3 | ) | | (4.3 | )% | (4.0 | ) | | (3.2 | ) | | (25.0 | )% | | (7.8 | ) | | (6.3 | ) | | (23.8 | )% |
| Adjusted EBIT | 108.1 |
| | 102.7 |
| | 5.3 | % | | 298.9 |
| | 281.4 |
| | 6.2 | % | 119.5 |
| | 104.0 |
| | 14.9 | % | | 215.3 |
| | 190.8 |
| | 12.8 | % |
| (Costs) benefit related to legacy product, environmental and other claims | (8.5 | ) | | (13.1 | ) | | | | (25.5 | ) | | (24.2 | ) | | | |
| Restructuring and repositioning expenses | (9.3 | ) | | (5.6 | ) | | | | (17.0 | ) | | (28.6 | ) | | | (18.8 | ) | | (5.4 | ) | | | | (24.4 | ) | | (7.7 | ) | | |
| Accounts receivable reserve—Venezuela | (10.0 | ) | | — |
| | | | (10.0 | ) | | — |
| | | |
| Pension MTM adjustment and other related costs, net | — |
| | 0.2 |
| | | | (1.9 | ) | | 1.1 |
| | | |
| Income and expense items related to divested businesses | (0.3 | ) | | (0.1 | ) | | | | (1.3 | ) | | (0.3 | ) | | | |
| Third-party acquisition-related costs | (0.4 | ) | | — |
| | | | (0.4 | ) | | (2.5 | ) | | | (5.8 | ) | | — |
| | | | (6.7 | ) | | — |
| | |
| Gain (loss) on sale of product line | (0.4 | ) | | — |
| | | | (0.4 | ) | | 0.7 |
| | | |
| Loss on early extinguishment of debt | — |
| | — |
| | | | — |
| | (11.1 | ) | | | (4.8 | ) | | — |
| | | | (4.8 | ) | | — |
| | |
| Amortization of acquired inventory fair value adjustment | — |
| | (4.1 | ) | | | | — |
| | (4.1 | ) | | | (4.6 | ) | | — |
| | | | (4.6 | ) | | — |
| | |
| Costs related to legacy product, environmental and other claims | | (2.8 | ) | | (14.9 | ) | | | | (4.3 | ) | | (17.0 | ) | | |
| Income and expense items related to divested businesses | | 0.6 |
| | (0.7 | ) | | | | 0.1 |
| | (1.0 | ) | | |
| Pension MTM adjustment and other related costs, net | | — |
| | — |
| | | | — |
| | (1.9 | ) | | |
| Interest expense, net | (20.2 | ) | | (19.4 | ) | | (4.1 | )% | | (59.0 | ) | | (60.6 | ) | | 2.6 | % | (19.5 | ) | | (19.5 | ) | | — | % | | (38.4 | ) | | (38.8 | ) | | 1.0 | % |
| (Provision for) benefit from income taxes | (11.6 | ) | | (19.4 | ) | | 40.2 | % | | (49.2 | ) | | (62.1 | ) | | 20.8 | % | (25.0 | ) | | (19.6 | ) | | (27.6 | )% | | (49.8 | ) | | (37.6 | ) | | (32.4 | )% |
| Income (loss) from continuing operations attributable to W. R. Grace & Co. shareholders | $ | 47.4 |
| | $ | 41.2 |
| | 15.0 | % | | $ | 134.2 |
| | $ | 89.7 |
| | 49.6 | % | |
| Diluted EPS from continuing operations | $ | 0.70 |
| | $ | 0.58 |
| | 20.7 | % | | $ | 1.96 |
| | $ | 1.27 |
| | 54.3 | % | |
| Income (loss) attributable to W. R. Grace & Co. shareholders | | $ | 38.8 |
| | $ | 43.9 |
| | (11.6 | )% | | $ | 82.4 |
| | $ | 86.8 |
| | (5.1 | )% |
| Diluted EPS | | $ | 0.58 |
| | $ | 0.64 |
| | (9.4 | )% | | $ | 1.22 |
| | $ | 1.27 |
| | (3.9 | )% |
| Adjusted EPS | $ | 0.90 |
| | $ | 0.80 |
| | 12.5 | % | | $ | 2.42 |
| | $ | 2.15 |
| | 12.6 | % | $ | 1.07 |
| | $ | 0.84 |
| | 27.4 | % | | $ | 1.89 |
| | $ | 1.52 |
| | 24.3 | % |
| | Analysis of Operations (In millions) | Three Months Ended September 30, | | Nine Months Ended September 30, | Three Months Ended June 30, | | Six Months Ended June 30, |
| 2017 | | 2016 | | % Change | | 2017 | | 2016 | | % Change | 2018 | | 2017 | | % Change | | 2018 | | 2017 | | % Change |
| Adjusted performance measures: | |
| | |
| | |
| | | | | | | |
| | |
| | |
| | | | | | |
| Gross Margin: | |
| | |
| | |
| | | | | | | |
| | |
| | |
| | | | | | |
| Catalysts Technologies | 41.4 | % | | 44.6 | % | | (3.2) pts |
| | 40.4 | % | | 44.8 | % | | (4.4) pts |
| 43.5 | % | | 40.4 | % | | 3.1 pts |
| | 42.5 | % | | 39.9 | % | | 2.6 pts |
|
| Materials Technologies | 38.4 | % | | 37.8 | % | | 0.6 pts |
| | 38.3 | % | | 39.3 | % | | (1.0) pts |
| 39.9 | % | | 37.4 | % | | 2.5 pts |
| | 38.2 | % | | 38.2 | % | | 0.0 pts |
|
| Adjusted Gross Margin | 40.6 | % | | 42.8 | % | | (2.2) pts |
| | 39.8 | % | | 43.2 | % | | (3.4) pts |
| 42.6 | % | | 39.6 | % | | 3.0 pts |
| | 41.4 | % | | 39.4 | % | | 2.0 pts |
|
| Amortization of acquired inventory fair value adjustment | — | % | | (1.0 | )% | | 1.0 pts |
| | — | % | | (0.4 | )% | | 0.4 pts |
| (1.0 | )% | | — | % | | (1.0) pts |
| | (0.5 | )% | | — | % | | (0.5) pts |
|
| Pension costs in cost of goods sold | (0.2 | )% | | (0.2 | )% | | 0.0 pts |
| | (0.3 | )% | | (0.1 | )% | | (0.2) pts |
| (0.7 | )% | | (0.2 | )% | | (0.5) pts |
| | (0.8 | )% | | (0.4 | )% | | (0.4) pts |
|
| Total Grace | 40.4 | % | | 41.6 | % | | (1.2) pts |
| | 39.5 | % | | 42.7 | % | | (3.2) pts |
| 40.9 | % | | 39.4 | % | | 1.5 pts |
| | 40.1 | % | | 39.0 | % | | 1.1 pts |
|
| Adjusted EBIT: | |
| | |
| | |
| | |
| | |
| | |
| |
| | |
| | |
| | |
| | |
| | |
|
| Catalysts Technologies | $ | 103.6 |
| | $ | 94.3 |
| | 9.9 | % | | $ | 286.1 |
| | $ | 260.1 |
| | 10.0 | % | $ | 113.7 |
| | $ | 101.3 |
| | 12.2 | % | | $ | 205.8 |
| | $ | 182.5 |
| | 12.8 | % |
| Materials Technologies | 26.4 |
| | 26.4 |
| | — | % | | 75.4 |
| | 75.0 |
| | 0.5 | % | 29.6 |
| | 24.2 |
| | 22.3 | % | | 53.7 |
| | 49.0 |
| | 9.6 | % |
| Corporate, pension, and other | (21.9 | ) | | (18.0 | ) | | (21.7 | )% | | (62.6 | ) | | (53.7 | ) | | (16.6 | )% | (23.8 | ) | | (21.5 | ) | | (10.7 | )% | | (44.2 | ) | | (40.7 | ) | | (8.6 | )% |
| Total Grace | 108.1 |
| | 102.7 |
| | 5.3 | % | | 298.9 |
| | 281.4 |
| | 6.2 | % | 119.5 |
| | 104.0 |
| | 14.9 | % | | 215.3 |
| | 190.8 |
| | 12.8 | % |
| Depreciation and amortization: | |
| | |
| | |
| | |
| | |
| | |
| |
| | |
| | |
| | |
| | |
| | |
|
| Catalysts Technologies | $ | 22.2 |
| | $ | 21.0 |
| | 5.7 | % | | $ | 64.6 |
| | $ | 56.5 |
| | 14.3 | % | $ | 21.3 |
| | $ | 21.1 |
| | 0.9 | % | | $ | 40.7 |
| | $ | 42.4 |
| | (4.0 | )% |
| Materials Technologies | 5.0 |
| | 5.0 |
| | — | % | | 14.5 |
| | 14.7 |
| | (1.4 | )% | 3.7 |
| | 4.8 |
| | (22.9 | )% | | 8.4 |
| | 9.5 |
| | (11.6 | )% |
| Corporate | 1.2 |
| | 1.0 |
| | 20.0 | % | | 3.5 |
| | 2.6 |
| | 34.6 | % | 0.9 |
| | 1.2 |
| | (25.0 | )% | | 1.8 |
| | 2.3 |
| | (21.7 | )% |
| Total Grace | 28.4 |
| | 27.0 |
| | 5.2 | % | | 82.6 |
| | 73.8 |
| | 11.9 | % | 25.9 |
| | 27.1 |
| | (4.4 | )% | | 50.9 |
| | 54.2 |
| | (6.1 | )% |
| Adjusted EBITDA: | |
| | |
| | |
| | |
| | |
| | |
| |
| | |
| | |
| | |
| | |
| | |
|
| Catalysts Technologies | $ | 125.8 |
| | $ | 115.3 |
| | 9.1 | % | | $ | 350.7 |
| | $ | 316.6 |
| | 10.8 | % | $ | 135.0 |
| | $ | 122.4 |
| | 10.3 | % | | $ | 246.5 |
| | $ | 224.9 |
| | 9.6 | % |
| Materials Technologies | 31.4 |
| | 31.4 |
| | — | % | | 89.9 |
| | 89.7 |
| | 0.2 | % | 33.3 |
| | 29.0 |
| | 14.8 | % | | 62.1 |
| | 58.5 |
| | 6.2 | % |
| Corporate, pension, and other | (20.7 | ) | | (17.0 | ) | | (21.8 | )% | | (59.1 | ) | | (51.1 | ) | | (15.7 | )% | (22.9 | ) | | (20.3 | ) | | (12.8 | )% | | (42.4 | ) | | (38.4 | ) | | (10.4 | )% |
| Total Grace | 136.5 |
| | 129.7 |
| | 5.2 | % | | 381.5 |
| | 355.2 |
| | 7.4 | % | 145.4 |
| | 131.1 |
| | 10.9 | % | | 266.2 |
| | 245.0 |
| | 8.7 | % |
| Adjusted EBIT margin: | |
| | |
| | |
| | | | | | | |
| | |
| | |
| | | | | | |
| Catalysts Technologies | 32.6 | % | | 31.9 | % | | 0.7 pts |
| | 30.7 | % | | 31.2 | % | | (0.5) pts |
| 31.2 | % | | 31.6 | % | | (0.4) pts |
| | 30.3 | % | | 29.7 | % | | 0.6 pts |
|
| Materials Technologies | 23.6 | % | | 24.3 | % | | (0.7) pts |
| | 23.2 | % | | 23.2 | % | | 0.0 pts |
| 24.4 | % | | 22.2 | % | | 2.2 pts |
| | 22.7 | % | | 23.0 | % | | (0.3) pts |
|
| Total Grace | 25.2 | % | | 25.4 | % | | (0.2) pts |
| | 23.8 | % | | 24.3 | % | | (0.5) pts |
| 24.6 | % | | 24.2 | % | | 0.4 pts |
| | 23.5 | % | | 23.1 | % | | 0.4 pts |
|
| Adjusted EBITDA margin: | |
| | |
| | |
| | |
| | |
| | |
| |
| | |
| | |
| | |
| | |
| | |
|
| Catalysts Technologies | 39.6 | % | | 39.0 | % | | 0.6 pts |
| | 37.6 | % | | 37.9 | % | | (0.3) pts |
| 37.0 | % | | 38.2 | % | | (1.2) pts |
| | 36.2 | % | | 36.6 | % | | (0.4) pts |
|
| Materials Technologies | 28.0 | % | | 28.9 | % | | (0.9) pts |
| | 27.6 | % | | 27.8 | % | | (0.2) pts |
| 27.5 | % | | 26.6 | % | | 0.9 pts |
| | 26.2 | % | | 27.4 | % | | (1.2) pts |
|
| Total Grace | 31.8 | % | | 32.1 | % | | (0.3) pts |
| | 30.4 | % | | 30.7 | % | | (0.3) pts |
| 29.9 | % | | 30.5 | % | | (0.6) pts |
| | 29.0 | % | | 29.6 | % | | (0.6) pts |
|
| | Analysis of Operations (In millions) | Four Quarters Ended | Four Quarters Ended |
September 30,
2017 | | December 31, 2016 | June 30,
2018 | | June 30,
2017 |
Calculation of Adjusted EBIT Return On Invested Capital (trailing four quarters): | | Adjusted EBIT | $ | 417.8 |
| | $ | 400.3 |
| $ | 438.5 |
| | $ | 412.4 |
|
| Invested Capital: | | | | | | |
| Trade accounts receivable | 253.1 |
| | 273.9 |
| 277.5 |
| | 265.0 |
|
| Inventories | 239.5 |
| | 228.0 |
| 307.4 |
| | 236.5 |
|
| Accounts payable | (195.2 | ) | | (195.4 | ) | (262.5 | ) | | (199.9 | ) |
| | 297.4 |
| | 306.5 |
| 322.4 |
| | 301.6 |
|
| Other current assets (excluding income taxes) | 31.1 |
| | 32.0 |
| 62.2 |
| | 35.7 |
|
| Properties and equipment, net | 762.8 |
| | 729.6 |
| 955.9 |
| | 749.7 |
|
| Goodwill | 401.7 |
| | 394.2 |
| 541.2 |
| | 397.5 |
|
| Technology and other intangible assets, net | 259.2 |
| | 269.1 |
| 364.5 |
| | 261.9 |
|
| Investment in unconsolidated affiliate | 118.0 |
| | 117.6 |
| 138.7 |
| | 131.9 |
|
| Other assets (excluding capitalized financing fees) | 32.9 |
| | 34.9 |
| 74.9 |
| | 31.2 |
|
| Other current liabilities (excluding income taxes, legacy environmental matters, accrued interest, and restructuring) | (129.8 | ) | | (144.4 | ) | (157.0 | ) | | (124.1 | ) |
| Other liabilities (excluding legacy environmental matters) | (118.7 | ) | | (89.3 | ) | |
| Other liabilities (excluding income taxes and legacy environmental matters) | | (149.6 | ) | | (111.6 | ) |
| Total invested capital | $ | 1,654.6 |
| | $ | 1,650.2 |
| $ | 2,153.2 |
| | $ | 1,673.8 |
|
| Adjusted EBIT Return On Invested Capital | 25.3 | % | | 24.3 | % | 20.4 | % | | 24.6 | % |
Amounts may not add due to rounding.
| |
| (A) | Grace'sGrace’s segment operating income includes only Grace'sGrace’s share of income of consolidated and unconsolidated joint ventures. |
| |
| (B) | Certain pension costs include only ongoing costs recognized quarterly, which include service and interest costs, expected returns on plan assets, and amortization of prior service costs/credits. Catalysts Technologies and Materials Technologies segment operating income and corporate costs do not include any amounts for pension expense. Other pension relatedpension-related costs including annual mark-to-market (MTM) adjustments and actuarial gains and losses are excluded from Adjusted EBIT. These amounts are not used by management to evaluate the performance of Grace'sGrace’s businesses and significantly affect the peer-to-peer and period-to-period comparability of our financial results. Mark-to-market adjustments and actuarial gains and losses relate primarily to changes in financial market values and actuarial assumptions and are not directly related to the operation of Grace'sGrace’s businesses. |
Grace Overview
Following is an overview of our financial performance for the thirdsecond quarter and ninesix months compared with the corresponding prior-year periods.
Net Sales and Gross Margin
Sales were $485.7 million and $917.2 million for the second quarter and six months, respectively, compared with $429.5 million and $1,257.0 million for the third quarter and nine months compared with $404.5 million and $1,157.8$827.5 million for the corresponding prior-year periods. Gross margin was 40.4%40.9% and 39.5%40.1% for the thirdsecond quarter and ninesix months, respectively, compared with 41.6%39.4% and 42.7%39.0% for the corresponding prior-year periods. Adjusted Gross Margin was 40.6%42.6% and 39.8%41.4% for the thirdsecond quarter and ninesix months, respectively, compared with 42.8%39.6% and 43.2%39.4% for the corresponding prior-year periods.
The following tables identify the year-over-year increase or decrease in sales attributable to changes in sales volume and/or mix, product price, and the impact of currency translation.
| | | | Three Months Ended September 30, 2017
as a Percentage Increase (Decrease) from
Three Months Ended September 30, 2016 | Three Months Ended June 30, 2018
as a Percentage Increase (Decrease) from
Three Months Ended June 30, 2017 |
| Net Sales Variance Analysis | Volume | | Price | | Currency Translation | | Total | Volume | | Price | | Currency Translation | | Total |
| Catalysts Technologies | 6.8 | % | | (0.5 | )% | | 1.0 | % | | 7.3 | % | 10.0 | % | | 1.7 | % | | 2.0 | % | | 13.7 | % |
| Materials Technologies | 0.2 | % | | 0.1 | % | | 2.7 | % | | 3.0 | % | 5.4 | % | | 1.7 | % | | 4.2 | % | | 11.3 | % |
| Net sales | 5.1 | % | | (0.4 | )% | | 1.5 | % | | 6.2 | % | 8.9 | % | | 1.7 | % | | 2.5 | % | | 13.1 | % |
| By Region: | | | | | | | | | | | | | | |
| North America | (4.8 | )% | | (2.1 | )% | | — | % | | (6.9 | )% | 19.8 | % | | 2.2 | % | | — | % | | 22.0 | % |
| Europe Middle East Africa | (2.0 | )% | | (0.7 | )% | | 3.6 | % | | 0.9 | % | 3.4 | % | | 3.1 | % | | 6.6 | % | | 13.1 | % |
| Asia Pacific | 53.4 | % | | 2.8 | % | | (0.3 | )% | | 55.9 | % | 7.0 | % | | (0.2 | )% | | 0.6 | % | | 7.4 | % |
| Latin America | (38.7 | )% | | 1.1 | % | | 0.2 | % | | (37.4 | )% | 1.6 | % | | (1.3 | )% | | (2.0 | )% | | (1.7 | )% |
Sales for the thirdsecond quarter increased 6.2%13.1%, up 10.6% on constant currency, compared with the prior-year quarter. Higher sales volumes in Catalysts Technologies were primarily due to higher demandthe polyolefin catalysts acquisition. Favorable currency translation, improved pricing, and growth in Asia.the existing businesses drove the remainder of the sales increase in Catalysts Technologies. Sales volumes in Materials Technologies were up primarily driven by favorablegrowth in Asia and North America, partially offset by a decline in EMEA. Favorable currency translation. Sales volumestranslation and improved pricing drove the remainder of the sales increase in Latin America decreased primarily due to discontinued sales in Venezuela and the timing of contract renewals in the region.
Gross margin decreased 120 basis points to 40.4% for the third quarter. Adjusted Gross Margin decreased 220 basis points to 40.6% for the third quarter. The decreases were primarily due to higher manufacturing costs, and product and regional mix.Materials Technologies.
Gross margin increased 150 basis points to 40.9% for the second quarter. Adjusted Gross Margin increased 300 basis points to 42.6% for the second quarter. The increases were primarily due to product and regional mix, improved pricing, and lower depreciation expense, partially offset by higher raw materials and energy costs. Gross margin was unfavorably impacted by the amortization of the step-up to fair value of acquired inventory and by higher pension service costs included in cost of goods sold.
| | | | Nine Months Ended September 30, 2017
as a Percentage Increase (Decrease) from
Nine Months Ended September 30, 2016 | Six Months Ended June 30, 2018
as a Percentage Increase (Decrease) from
Six Months Ended June 30, 2017 |
| Net Sales Variance Analysis | Volume | | Price | | Currency Translation | | Total | Volume | | Price | | Currency Translation | | Total |
| Catalysts Technologies | 11.9 | % | | — | % | | (0.3 | )% | | 11.6 | % | 6.5 | % | | 1.7 | % | | 2.5 | % | | 10.7 | % |
| Materials Technologies | 0.6 | % | | (0.2 | )% | | 0.3 | % | | 0.7 | % | 4.1 | % | | 1.2 | % | | 5.9 | % | | 11.2 | % |
| Net sales | 8.8 | % | | (0.1 | )% | | (0.1 | )% | | 8.6 | % | 5.9 | % | | 1.6 | % | | 3.3 | % | | 10.8 | % |
| By Region: | | | | | | | | | | | | | | |
| North America | (4.0 | )% | | (0.1 | )% | | — | % | | (4.1 | )% | 14.2 | % | | 1.4 | % | | — | % | | 15.6 | % |
| Europe Middle East Africa | 3.4 | % | | (0.3 | )% | | (0.3 | )% | | 2.8 | % | 4.9 | % | | 3.0 | % | | 8.6 | ��% | | 16.5 | % |
| Asia Pacific | 44.2 | % | | 0.6 | % | | (0.3 | )% | | 44.5 | % | 2.4 | % | | 1.1 | % | | 0.6 | % | | 4.1 | % |
| Latin America | (3.4 | )% | | (0.2 | )% | | 1.1 | % | | (2.5 | )% | (7.7 | )% | | (3.5 | )% | | (0.9 | )% | | (12.1 | )% |
Sales for the ninesix months increased 8.6%10.8%, up 7.5% on constant currency, compared with the prior-year period. Higher sales volumes in Catalysts Technologies were primarily due to the 2016 polyolefin catalysts acquisitionacquisition. Favorable currency translation, improved pricing, and growth in the existing businessesbusiness in the Middle East, Africa and North America drove the remainder of the sales increase in Catalysts Technologies. Sales in Materials Technologies were up driven by favorable currency translation, higher demand in Asiasales volumes, and the Middle East. Higher salesimproved pricing. Sales volumes in Materials Technologies were due to higher demandup driven by growth in Asia and Europe,Latin America, partially offset by the effect of product lines exiteda decline in the first half of 2016.EMEA.
Gross margin decreased 320increased 110 basis points to 39.5%40.1% for the ninesix months from 42.7%39.0% for the prior-year period. Adjusted Gross Margin decreased 340increased 200 basis points to 39.8%41.4% for the ninesix months from 43.2%39.4% for the prior-year period. The increases were primarily due to regional and product mix, improved pricing, and lower depreciation expense, partially offset by higher raw materials and energy costs. Gross margin was unfavorably impacted by higher pension service costs included in cost of goods sold and by the amortization of the step-up to fair value of acquired inventory.
During the 2018 first quarter, we completed a study to evaluate the useful lives of our operating machinery and equipment, including a review of historical asset retirement data as well as review and analysis of relevant industry practices. As a result of this study, effective January 1, 2018, we revised the useful lives of certain machinery and equipment. The change was determined to be a change in accounting estimate and is being applied prospectively. As a result of this change in accounting estimate, our depreciation expense with respect to such machinery and equipment was reduced by $6.2 million, resulting in an increase to net income of $4.8 million or $0.07 per diluted share, for the three months ended June 30, 2018. For the six months ended June 30, 2018, depreciation expense with respect to such machinery and equipment was reduced by $8.9 million, resulting in an increase to net income of $6.8 million or $0.10 per diluted share. Depreciation expense with respect to such machinery and equipment is expected to decrease by approximately $23 million for the year ended December 31, 2018. Estimated useful lives for operating machinery and equipment, which previously ranged from 3 to 10 years, now range from 5 to 25 years.
Grace Net Income
Net income attributable to Grace was $38.8 million for the second quarter, a decrease of 11.6% compared with $43.9 million for the prior-year quarter. Net income attributable to Grace was $82.4 million for the six months, a decrease of 5.1% compared with $86.8 million for the prior-year period. The decreases were primarily due to product and regional mix includinghigher repositioning expenses, a higher provision for income taxes, third-party costs incurred related to the effect of the 2016 polyolefin catalysts acquisition, the second-quarter loss on early extinguishment of debt and higher manufacturing costs.
Grace Income From Continuing Operations
Income from continuing operations attributable to Grace was $47.4 million for the third quarter, an increaseamortization of 15.0% compared with $41.2 million for the prior-year quarter. The increase was primarily due tofair value adjustment on acquired inventory, partially offset by higher Catalysts Technologies segment operating income and a lower provision for income taxes, partially offset by an accounts receivable reserve for a customer in Venezuela.
Income from continuing operations attributable to Grace was $134.2 million for the nine months, an increase of 49.6% compared with $89.7 million for the prior-year period. The increase was primarily due to higher Catalysts Technologies segment operating income, a lower provision for income taxes, lower restructuring and repositioning expenses, and the 2016 loss on early extinguishment of debt, partially offset by an accounts receivable reserve for a customer in Venezuela and higher corporate costs.
environmental remediation.
Adjusted EBIT
Adjusted EBIT was $108.1$119.5 million for the thirdsecond quarter, an increase of 5.3%14.9% compared with the prior-year quarter. The increase was due to business interruption insurance recoveries for lost profits as a result of a customer outage and higher sales volumes in Catalysts Technologies, partially offset byincluding the polyolefin catalysts acquisition, higher manufacturing costs, unfavorable productgross margin, favorable currency translation, and regional mix, lowerhigher income from our ART joint venture, partially offset by business interruption insurance recoveries in the prior-year quarter that did not repeat in 2018 and higher operating expenses.expenses in the 2018 second quarter.
Adjusted EBIT was $298.9$215.3 million for the ninesix months, an increase of 6.2%12.8% compared with the prior-year period. The increase was primarily due to higher sales volumes in both segmentsincluding the polyolefin catalysts acquisition, higher gross margin, and favorable currency translation, partially offset by business interruption insurance recoveries partially offset by higher manufacturing costs, unfavorable product and regional mix,in the prior-year period that did not repeat in 2018 and higher operating expenses.expenses in the 2018 six months.
Adjusted EPS
The following table reconciles our Diluted EPS to our Adjusted EPS:
| | | | Three Months Ended September 30, | Three Months Ended June 30, |
| | 2017 | | 2016 | 2018 | | 2017 |
| (In millions, except per share amounts) | Pre- Tax | | Tax Effect | | After- Tax | | Per Share | | Pre- Tax | | Tax Effect | | After- Tax | | Per Share | Pre- Tax | | Tax Effect | | After- Tax | | Per Share | | Pre- Tax | | Tax Effect | | After- Tax | | Per Share |
| Diluted earnings per share from continuing operations | |
| | |
| | |
| | $ | 0.70 |
| | |
| | |
| | |
| | $ | 0.58 |
| |
| Accounts receivable reserve—Venezuela | $ | 10.0 |
| | $ | 3.5 |
| | $ | 6.5 |
| | 0.10 |
| | $ | — |
| | $ | — |
| | $ | — |
| | — |
| |
| Diluted earnings per share | | |
| | |
| | |
| | $ | 0.58 |
| | |
| | |
| | |
| | $ | 0.64 |
|
| Restructuring and repositioning expenses | 9.3 |
| | 2.7 |
| | 6.6 |
| | 0.10 |
| | 5.6 |
| | 1.4 |
| | 4.2 |
| | 0.06 |
| $ | 18.8 |
| | $ | 4.6 |
| | $ | 14.2 |
| | 0.21 |
| | $ | 5.4 |
| | $ | 2.5 |
| | $ | 2.9 |
| | 0.04 |
|
| Costs (benefit) related to legacy product, environmental and other claims | 8.5 |
| | 3.0 |
| | 5.5 |
| | 0.08 |
| | 13.1 |
| | 4.9 |
| | 8.2 |
| | 0.12 |
| |
| Third-party acquisition-related costs | 0.4 |
| | 0.1 |
| | 0.3 |
| | — |
| | — |
| | — |
| | — |
| | — |
| 5.8 |
| | 1.3 |
| | 4.5 |
| | 0.07 |
| | — |
| | — |
| | — |
| | — |
|
| Loss (gain) on sale of product line | 0.4 |
| | 0.1 |
| | 0.3 |
| | — |
| | — |
| | — |
| | — |
| | — |
| |
| Loss on early extinguishment of debt | | 4.8 |
| | 1.1 |
| | 3.7 |
| | 0.05 |
| | — |
| | — |
| | — |
| | — |
|
| Amortization of acquired inventory fair value adjustment | | 4.6 |
| | 1.1 |
| | 3.5 |
| | 0.05 |
| | — |
| | — |
| | — |
| | — |
|
| Costs related to legacy product, environmental and other claims | | 2.8 |
| | 0.6 |
| | 2.2 |
| | 0.03 |
| | 14.9 |
| | 5.6 |
| | 9.3 |
| | 0.14 |
|
| Income and expense items related to divested businesses | 0.3 |
| | 0.1 |
| | 0.2 |
| | — |
| | 0.1 |
| | — |
| | 0.1 |
| | — |
| (0.6 | ) | | (0.1 | ) | | (0.5 | ) | | (0.01 | ) | | 0.7 |
| | 0.3 |
| | 0.4 |
| | 0.01 |
|
| Amortization of acquired inventory fair value adjustment | — |
| | — |
| | — |
| | — |
| | 4.1 |
| | 1.5 |
| | 2.6 |
| | 0.04 |
| |
| Pension MTM adjustment and other related costs, net | — |
| | — |
| | — |
| | — |
| | (0.2 | ) | | (0.1 | ) | | (0.1 | ) | | — |
| |
| Discrete tax items, including adjustments to uncertain tax positions | |
| | 5.3 |
| | (5.3 | ) | | (0.08 | ) | | |
| | (0.3 | ) | | 0.3 |
| | — |
| |
| Discrete tax items: | | | | | | | | | | | | | | | | |
| Income tax expense related to historical tax attributes(1) | | | | (4.7 | ) | | 4.7 |
| | 0.07 |
| | | | — |
| | — |
| | — |
|
| Discrete tax items | | |
| | (1.1 | ) | | 1.1 |
| | 0.02 |
| | |
| | (0.9 | ) | | 0.9 |
| | 0.01 |
|
| Adjusted EPS | |
| | |
| | |
| | $ | 0.90 |
| | |
| | |
| | |
| | $ | 0.80 |
| |
| | |
| | |
| | $ | 1.07 |
| | |
| | |
| | |
| | $ | 0.84 |
|
|
| | | | | | | | | | | | | | | | | | | | | | | | | | | | | | | |
| | Six Months Ended June 30, |
| | 2018 | | 2017 |
| (In millions, except per share amounts) | Pre- Tax | | Tax Effect | | After- Tax | | Per Share | | Pre- Tax | | Tax Effect | | After- Tax | | Per Share |
| Diluted earnings per share | |
| | |
| | |
| | $ | 1.22 |
| | | | | | | | $ | 1.27 |
|
| Restructuring and repositioning expenses | $ | 24.4 |
| | $ | 5.7 |
| | $ | 18.7 |
| | 0.28 |
| | $ | 7.7 |
| | $ | 3.3 |
| | $ | 4.4 |
| | 0.06 |
|
| Third-party acquisition-related costs | 6.7 |
| | 1.6 |
| | 5.1 |
| | 0.08 |
| | — |
| | — |
| | — |
| | — |
|
| Loss on early extinguishment of debt | 4.8 |
| | 1.1 |
| | 3.7 |
| | 0.05 |
| | — |
| | — |
| | — |
| | — |
|
| Amortization of acquired inventory fair value adjustment | 4.6 |
| | 1.1 |
| | 3.5 |
| | 0.05 |
| | — |
| | — |
| | — |
| | — |
|
| Costs related to legacy product, environmental and other claims | 4.3 |
| | 1.0 |
| | 3.3 |
| | 0.05 |
| | 17.0 |
| | 6.4 |
| | 10.6 |
| | 0.15 |
|
| Income and expense items related to divested businesses | (0.1 | ) | | — |
| | (0.1 | ) | | — |
| | 1.0 |
| | 0.4 |
| | 0.6 |
| | 0.01 |
|
| Pension MTM adjustment and other related costs, net | — |
| | — |
| | — |
| | — |
| | 1.9 |
| | 0.7 |
| | 1.2 |
| | 0.02 |
|
| Discrete tax items: | | | | | | | | | | | | | | | |
| Income tax expense related to historical tax attributes(1) | | | (9.4 | ) | | 9.4 |
| | 0.14 |
| | | | — |
| | — |
| | — |
|
| Discrete tax items | | | (1.1 | ) | | 1.1 |
| | 0.02 |
| | | | (0.4 | ) | | 0.4 |
| | 0.01 |
|
| Adjusted EPS | | | | | | | $ | 1.89 |
| | | | | | | | $ | 1.52 |
|
| |
| (1) | Our historical tax attribute carryforwards (net operating losses and tax credits) unfavorably affect our tax expense with respect to certain provisions of the Act. To normalize the effective tax rate, an adjustment is made to eliminate the tax expense impact associated with the historical tax attributes. |
|
| | | | | | | | | | | | | | | | | | | | | | | | | | | | | | | |
| | Nine Months Ended September 30, |
| | 2017 | | 2016 |
| (In millions, except per share amounts) | Pre- Tax | | Tax Effect | | After- Tax | | Per Share | | Pre- Tax | | Tax Effect | | After- Tax | | Per Share |
| Diluted earnings per share from continuing operations | |
| | |
| | |
| | $ | 1.96 |
| | | | | | | | $ | 1.27 |
|
| Costs (benefit) related to legacy product, environmental and other claims | $ | 25.5 |
| | $ | 9.4 |
| | $ | 16.1 |
| | 0.24 |
| | $ | 24.2 |
| | $ | 9.0 |
| | $ | 15.2 |
| | 0.21 |
|
| Restructuring and repositioning expenses | 17.0 |
| | 6.0 |
| | 11.0 |
| | 0.16 |
| | 28.6 |
| | 9.5 |
| | 19.1 |
| | 0.27 |
|
| Accounts receivable reserve—Venezuela | 10.0 |
| | 3.5 |
| | 6.5 |
| | 0.10 |
| | — |
| | — |
| | — |
| | — |
|
| Pension MTM adjustment and other related costs, net | 1.9 |
| | 0.7 |
| | 1.2 |
| | 0.02 |
| | (1.1 | ) | | (0.3 | ) | | (0.8 | ) | | (0.01 | ) |
| Income and expense items related to divested businesses | 1.3 |
| | 0.5 |
| | 0.8 |
| | 0.01 |
| | 0.3 |
| | 0.1 |
| | 0.2 |
| | — |
|
| Third-party acquisition-related costs | 0.4 |
| | 0.1 |
| | 0.3 |
| | — |
| | 2.5 |
| | 0.7 |
| | 1.8 |
| | 0.03 |
|
| Loss (gain) on sale of product line | 0.4 |
| | 0.1 |
| | 0.3 |
| | — |
| | (0.7 | ) | | (0.3 | ) | | (0.4 | ) | | (0.01 | ) |
| Loss on early extinguishment of debt | — |
| | — |
| | — |
| | — |
| | 11.1 |
| | 4.1 |
| | 7.0 |
| | 0.10 |
|
| Amortization of acquired inventory fair value adjustment | — |
| | — |
| | — |
| | — |
| | 4.1 |
| | 1.5 |
| | 2.6 |
| | 0.04 |
|
| Discrete tax items, including adjustments to uncertain tax positions | |
| | 4.9 |
| | (4.9 | ) | | (0.07 | ) | |
|
| | (17.7 | ) | | 17.7 |
| | 0.25 |
|
| Adjusted EPS | |
| | |
| | |
| | $ | 2.42 |
| | |
| | |
| | |
| | $ | 2.15 |
|
Adjusted EBIT Return On Invested Capital
Adjusted EBIT Return On Invested Capital for the thirdsecond quarter was 25.3%decreased to 20.4% on a trailing four quarters basis compared with 24.3%24.6% on the same basis as of December 31, 2016.June 30, 2017, due to the polyolefin catalysts acquisition. That acquisition, which was completed on April 3, 2018, increased invested capital at that date, while Adjusted EBIT includes only one quarter of income from the acquired business.
We manage our operations with the objective of maximizing sales, earnings and cash flow over time. Doing so requires that we successfully balance our growth, profitability and working capital and other investments to support sustainable, long-term financial performance. We use Adjusted EBIT Return On Invested Capital as a performance measure in evaluating operating results, in making operating and investment decisions, and in balancing the growth and profitability of our operations.
Grace Value Model
In March 2018, we introduced investors to the Grace Value Model (“GVM”), our framework for creating and delivering value to customers, investors, and employees. At the company level, we create value through our focused portfolio, strong strategic position, and disciplined capital allocation. At the business level, we create value through customer-driven innovation, commercial excellence, and operating excellence. Great talent, our high-performance culture, and integrated business management processes support all of our activities and are a source of competitive advantage.
The GVM framework also encompasses our multi-year initiatives to transform our manufacturing and business processes to extend our competitive advantages and improve our cost position. We expect to significantly improve our manufacturing performance, reduce our manufacturing costs, and improve our integrated business management capabilities. We also expect to invest significant capital in our manufacturing plants to accelerate growth and improve manufacturing performance. Our investments in commercial excellence are yielding positive results in account management, pipeline management and conversion, and pricing.
Segment Overview—Grace Catalysts Technologies
Following is an overview of the financial performance of Catalysts Technologies for the thirdsecond quarter and ninesix months compared with the corresponding prior-year periods.
Net Sales—Grace Catalysts Technologies
Sales were $317.5$364.4 million for the thirdsecond quarter, an increase of 7.3%13.7%, or 11.7% on constant currency, compared with the prior-year quarter. The increase on a constant currency basis was due to higher sales volumes (+6.8%10.0%) and favorable currency translationimproved pricing (+1.0%), partially offset by lower pricing (-0.5%1.7%). Higher sales volumes were driven by polyolefin catalysts due to the polyolefin catalysts acquisition and higher demand,licensing revenues. Catalysts Technologies also benefited from favorable currency translation as the U.S. dollar weakened against multiple currencies, especially the euro, and improved pricing compared with the prior-year quarter.
Sales were $680.2 million for the six months, an increase of 10.7%, 8.2% on constant currency, compared with the prior-year period. The increase on a constant currency basis was due to higher sales volumes (+6.5%) and improved pricing (+1.7%). Higher sales volumes were driven by polyolefin catalysts primarily due to the polyolefin catalysts acquisition and growth in Asia. Salesthe existing business in the Middle East and North America, partially offset by lower volumes of refining catalysts increased compared with the prior-year quarter, primarily in Asia, due to higher bid business, demand for new products,Latin America, China, and new customer acquisition. Sales volumes of specialty catalysts increased compared with the prior-year quarter primarily due to stronger demand and order timing for polypropylene and polyethylene catalysts in Asia. Specialty catalysts sales volumes were down in North America and Europe compared to the prior-year quarter as both regions were negatively impacted by customer and supplier outages related to hurricane events, which had an unfavorable impact on sales of approximately $7 million. FavorableEurope. Catalysts Technologies also benefited from favorable currency translation affected both product groups as the U.S. dollar weakened against multiple currencies, especially the euro, compared with the prior-year quarter.
Sales were $931.8 million for the nine months, an increase of 11.6% compared with the prior-year period. The increase was due to higher sales volumes (+11.9%), partially offset by unfavorable currency translation (-0.3%). Higher sales volumes primarily related to the 2016 polyolefin catalysts acquisition and organic growth in the existing businesses driven by higher demand in Asia, the Middle East, and Eastern Europe. Sales volumes of refining catalysts increased compared with the prior-year period, primarily in Asia and the Middle East due to bid business, penetration of new products, and new customer acquisition. Sales volumes of specialty catalysts, excluding the sales resulting from the polyolefin catalysts acquisition from the 2017 first half, increased in Asia due to higher demand for polypropylene and polyethylene catalysts and customer order timing of chemical catalysts compared with the prior-year period. Specialty catalysts sales volumes were negatively impacted in the third quarter by customer and supplier outages related to hurricane events. Unfavorable currency translation affected both product groups as the U.S. dollar strengthened against multiple currencies, especially the euro, compared with the prior-year period.
Segment Operating Income (SOI) and Margin—Grace Catalysts Technologies
Gross profit was $131.3$158.4 million for the thirdsecond quarter, a decreasean increase of 0.5%22.2% compared with the prior-year quarter. Gross margin of 41.4% decreased 32043.5% increased 310 basis points from 44.6%40.4% for the prior-year quarter. The decreaseincrease in gross margin was primarily due to product and regional mix, higher manufacturing costs,lower depreciation expense, and lower pricing.improved pricing, partially offset by a 180 basis point increase in raw materials and energy costs.
Operating income was $103.6$113.7 million for the thirdsecond quarter, an increase of 9.9%12.2% compared with the prior-year quarter, primarily due to business interruption insurance recoveriesthe polyolefin catalysts acquisition, higher gross margin, favorable currency translation, and higher sales volumes. Hurricane events had an unfavorable impact on operating income infrom the third quarter of approximately $4 million.ART joint venture. The increase was partially offset by the impactabsence of lower gross marginsbusiness interruption insurance recoveries that were included in the prior-year quarter and lower income from the ART joint venture.higher operating expenses. The ART joint venture contributed $4.8$8.2 million to operating income, a decreasean increase of $3.7$2.1 million compared with the prior-year quarter. Operating margin for the thirdsecond quarter was 32.6%31.2%, an increasea decrease of 7040 basis points compared with the prior-year quarter.
Gross profit was $376.2$289.3 million for the ninesix months, an increase of 0.6%18.1% compared with the prior-year period. Gross margin of 40.4% decreased 44042.5% increased 260 basis points compared with 44.8%39.9% for the prior-year period. The decreaseincrease in gross margin was primarily due to product and regional mix, including the effect of the 2016 polyolefin catalysts acquisition,improved pricing, and lower depreciation expense, partially offset by a 160 basis point increase in higher manufacturingraw materials and energy costs.
Operating income was $286.1$205.8 million for the ninesix months, an increase of 10.0%12.8% compared with the prior-year period, primarily due to higher gross margin, the polyolefin catalysts acquisition, favorable currency translation, and higher income from the ART joint venture. The increase was partially offset by the absence of business interruption insurance recoveries that were included in the prior-year quarter and higher gross profit, partially offset by unfavorable currency translation.operating expenses. The ART joint venture contributed $17.9$13.6 million to operating income, a decreasean increase of $0.1$0.5 million compared with the prior-year period. Operating margin for the ninesix months was 30.7%30.3%, a decreasean increase of 5060 basis points compared with the prior-year period.
In January 2017, a Catalysts Technologies customer experienced an explosion and fire resulting in an extended outage. We have recognized a benefit of and received $25.0 million in payments from our third-party insurer through September 30, 2017, under our business interruption insurance policy for lost profits as a result of the outage. The policy has a $25.0 million limit per event.
In the third quarter, we recorded a $10.0 million charge to fully reserve for a trade receivable from a Venezuela-based customer related to increased economic uncertainty and the recent political unrest and sanctions. This charge has been excluded from Adjusted EBIT due to the nature of the situation.
Segment Overview—Grace Materials Technologies
Following is an overview of the financial performance of Materials Technologies for the thirdsecond quarter and ninesix months compared with the corresponding prior-year periods.
Net Sales—Grace Materials Technologies
Sales were $112.0$121.3 million for the thirdsecond quarter, an increase of 3.0%11.3%, or 7.1% on constant currency, compared with the prior-year quarter. The increase was due to favorableon a constant currency translation (+2.7%), higher sales volumes (+0.2%), and improved pricing (+0.1%). Sales volumes increased due to higher silica sales, primarily in Asia, offset by lower pharma fine chemicals sales.
Sales were $325.2 million for the nine months, an increase of 0.7% compared with the prior-year period, including the negative effect (-3.6%) of product lines exited in 2016. The increasebasis was due to higher sales volumes (+0.6%5.4%) and favorableimproved pricing (+1.7%). Sales volumes increased, primarily driven by higher coatings sales in Asia.
Sales were $237.0 million for the six months, an increase of 11.2%, or 5.3% on constant currency, translationcompared with the prior-year period. The increase on a constant currency basis was due to higher sales volumes (+0.3%4.1%), partially offset and improved pricing (+1.2%). Sales volumes increased, primarily driven by lower pricing (-0.2%).higher coatings sales in Asia and higher chemical process sales in North America and Latin America.
Segment Operating Income (SOI) and Margin—Grace Materials Technologies
Gross profit was $43.0$48.4 million for the thirdsecond quarter, an increase of 4.6%18.9% compared with the prior-year quarter. Gross margin was 38.4%of 39.9% increased 250 basis points compared with 37.8%37.4% for the prior-year quarter. The increase in gross margin was primarily due to product and regional mix with higher pharma fine chemicals sales and lower petrochemical sales, improved pricing, and lower depreciation expense, partially offset by higher manufacturinga 100 basis point increase in raw materials and energy costs.
Operating income was $26.4$29.6 million for the thirdsecond quarter, flatan increase of 22.3% compared with the prior-year quarter. Higherquarter, primarily due to higher gross profitmargin and favorable currency translation, werepartially offset by higher operating expenses. Operating margin for the thirdsecond quarter was 23.6%24.4%, a decreasean increase of 70220 basis points compared with the prior-year quarter.
Gross profit was $124.4$90.4 million for the ninesix months, a decreasean increase of 2.0%11.1% compared with the prior-year period. Gross margin of 38.3% decreased 100 basis points38.2% was flat compared with 39.3% for the prior-year period. The decreaseperiod as favorable product and regional mix and improved pricing were offset by higher manufacturing costs including a 90 basis point increase in gross margin was primarily due to higher manufacturingraw materials and energy costs.
Operating income was $75.4$53.7 million for the ninesix months, an increase of 0.5%9.6% compared with the prior-year period.period, primarily due to favorable currency translation, higher sales volumes, improved pricing, and lower depreciation expense, partially offset by higher operating expenses. Operating margin for the ninesix months was 23.2%22.7%, flata decrease of 30 basis points compared with the prior-year period.
Corporate Costs
Corporate costs include corporate functional costs and other corporate costs such as professional fees and insurance premiums. Corporate costs for the thirdsecond quarter were $18.5$19.8 million, an increase of $3.6$1.5 million from the prior-year quarter, primarily due to the absence of Separation-related transition services income and an unfavorable comparison to loweredhigher accruals for incentive accruals in 2016.
compensation. Corporate costs for the ninesix months were $52.9$36.4 million, an increase of $8.5$2.0 million compared with the prior-year period, primarily due to higher accruals for incentive compensation.
Restructuring and Repositioning Expenses
During the second quarter and six months, we incurred $1.0 million and $2.0 million, respectively, of restructuring expenses primarily related to plant exit costs and business engineering and sales force reorganization, compared with $2.0 million and $4.8 million, respectively, in the corresponding prior-year periods that was related to workforce reduction programs in manufacturing, supply chain, finance and IT. Excluding non-cash 2018 plant exit costs of $1.1 million, substantially all costs related to the restructuring programs are expected to be paid by September 30, 2018.
Pretax repositioning expenses for the second quarter and six months were $17.8 million and $22.4 million, respectively, compared with $3.3 million and $2.8 million, respectively, in the corresponding prior-year periods. Expenses incurred in 2018 primarily related to the second quarter write-off of $8.5 million of prior engineering costs as a favorable settlementresult of terminating an expansion project no longer necessary due to the polyolefin catalysts acquisition, and $8.1 million for a claimmulti-year program to transform manufacturing and business processes to extend our competitive advantages and improve our cost position, of which $4.9 million was recorded in 2016the second quarter. Excluding asset write-offs, substantially all of these expenses have been or are expected to be settled in cash.
The following table presents the major components of restructuring and an unfavorable comparison to lowered incentive accrualsrepositioning expenses recorded in 2016.2018.
|
| | | | | | | |
| (in millions) | Three Months Ended June 30, 2018 | | Six Months Ended June 30, 2018 |
| Write-off of plant equipment and engineering costs | $ | 9.1 |
| | $ | 9.1 |
|
| Third-party costs of manufacturing and business transformation programs | 4.9 |
| | 8.1 |
|
| Employee severance | 2.5 |
| | 3.7 |
|
| Other | 2.3 |
| | 3.5 |
|
| Total restructuring and repositioning expenses | $ | 18.8 |
| | $ | 24.4 |
|
Defined Benefit Pension Expense
Certain pension costs for the thirdsecond quarter and ninesix months were $3.4$4.0 million and $9.7$7.8 million, respectively, compared with $3.1$3.2 million and $9.3$6.3 million, respectively, for the corresponding prior-year periods. The increases were primarily due to a decrease in discount rates.
Interest and Financing Expenses
Net interest and financing expenses were $20.2$19.5 million for the thirdsecond quarter, an increaseflat with the prior-year quarter, and $38.4 million for the six months, a decrease of 4.1%1.0% compared with the prior-year period. During the second quarter, primarily due to borrowingswe incurred a loss on the revolving credit facility. Net interest and financing expenses were $59.0early extinguishment of debt of $4.8 million for the nine months, a decrease of 2.6% compared with the prior-year period, primarily due to voluntary prepayments related to the repayment of our U.S. dollar and euro term loans in February and March 2016.loans. See Note 3 to the Consolidated Financial Statements.
Income Taxes
The income tax provision at the U.S. federal corporate rate of 35% for the third quarter and the prior-year quarter would have been $20.5 million and $21.2 million, respectively, compared with the recorded provision of $11.6 million and $19.4 million, respectively. The income tax provision at the statutory rate of 35% for the nine months and the prior-year period would have been $63.9 million and $53.0 million, respectively, compared with the recorded provision of $49.2 million and $62.1 million, respectively. The primary differences between the tax provision at the U.S. statutory rate and the recorded provision for income taxes arefor the effect of lowersix months ended June 30, 2018 and 2017, was $49.8 million and $37.6 million, respectively. The $12.2 million increase was primarily due to the $12.0 million GILTI tax ratescharge recorded in foreign jurisdictions,2018 under the Act, partially offset by a $6.3 million benefit from the federal tax rate change from 35% to 21%. The 2017 first quarter also included $3.1 million in share-based compensation deductions the impact of state law changes, research and development credits, and other adjustments to deferred tax assets.
We generated U.S. federal tax deductions relating to our emergence from bankruptcy. These deductions generated U.S. federal NOL carryforwardsthat did not repeat in 2014, which we will carry forward and expect to utilize in subsequent
years. Under U.S. federal income tax law, a corporation is generally permitted to carry forward NOLs for a 20-year period for deduction against future taxable income. We also generated U.S. federal tax deductions of $30 million upon payment of the ZAI PD obligation in the 2017 first quarter. (See Note 8.) The total domestic deferred tax assets associated with NOLs, credits, and other tax attributes as of September 30, 2017, was approximately $640 million.
We pay cash taxes in foreign jurisdictions and a limited number of states. Income taxes paid in cash were $44.1 million for the nine months, or approximately 24% of income before income taxes. Income tax refunds received for the nine months were $30.2 million. Income taxes paid in cash for the prior-year period, including payments related to the Separation, were $42.4 million, or approximately 28% of income before taxes. Income tax refunds received for the prior-year period were $2.3 million.2018.
See Note 5 to the Consolidated Financial Statements for additional information regarding income taxes.
Financial Condition, Liquidity, and Capital Resources
Following is an analysis of our financial condition, liquidity and capital resources at SeptemberJune 30, 2017.2018.
Our principal uses of cash are generally capital investments and acquisitions; working capital investments; compensation paid to employees, including contributions to our defined benefit pension plans and defined contribution plans; the repayment of debt;debt and interest payments thereon; and the return of cash to shareholders through repurchase of shares and dividends.
On February 5, 2015, we announced that the Board of Directors had authorized a share repurchase program of up to $500 million, which we completed on July 10, 2017. On February 8, 2017, we announced that the Board of Directors had authorized a new share repurchase program of up to $250 million. Under these programs,this program, during the ninesix months we repurchased 935,435723,441 shares of Company common stock for $65.0$49.8 million. As of SeptemberJune 30, 2017, $218.92018, $169.1 million remained under the current authorization.
InWe paid cash dividends of $32.4 million during the 2016 second quarter, we began to pay a quarterly cash dividend, at an annual rate of $0.68 per share of Company common stock.six months. On February 8, 2017,2018, we announced that the Board of Directors had approved an increase in the annual dividend rate, to $0.84$0.96 per share of Company common stock, which became effective inwith the 2017 first quarter. Wedividend paid cash dividends of $43.0 million during the nine months.March 22, 2018.
We believe that the cash we expect to generate during 20172018 and thereafter, together with other available liquidity and capital resources, are sufficient to finance our operations, growth strategy, share repurchase program and expected dividend payments, and to meet our debt and pension obligations.
On April 3, 2018, we entered into the Credit Agreement, which provides for new secured credit facilities, consisting of:
| |
| (a) | a $950 million term loan due in 2025, with interest at LIBOR +175 basis points, and |
| |
| (b) | a $400 million revolving credit facility due in 2023, with interest at LIBOR +175 basis points. |
We used the proceeds from the term loan to repay in full the outstanding borrowings of $507.0 million under our 2014 credit agreement, to fund the polyolefin catalysts acquisition for $420.9 million, and to make a voluntary $50.0 million accelerated contribution to our U.S. qualified pension plans. See Note 3 to the Consolidated Financial Statements for additional information related to the Credit Agreement.
Cash Resources and Available Credit Facilities
At SeptemberJune 30, 2017,2018, we had available liquidity of $475.5$529.1 million, consisting of $175.7$131.5 million in cash and cash equivalents ($30.357.7 million in the U.S.), $265.0$364.3 million available under our revolving credit facility, and $34.8$33.3 million of available liquidity under various non-U.S. credit facilities. The $300$400 million revolving credit facility includes a $150$100 million sublimit for letters of credit.
Our non-U.S. credit facilities are extended to various subsidiaries that use them primarily to issue bank guarantees supporting trade activity and to provide working capital during occasional cash shortfalls. Our credit facility in Germany is secured by third-party accounts receivable, with availability determined on the basis of eligible outstanding receivables. We generally renew these credit facilities as they expire.
The following table summarizes our non-U.S. credit facilities as of SeptemberJune 30, 2017:2018:
| |
(In millions) | Maximum Borrowing Amount | | Available Liquidity | | Expiration Date | Maximum Borrowing Amount | | Available Liquidity | | Expiration Date |
| Germany | $ | 58.7 |
| | $ | 5.5 |
| | 12/31/2017 | |
| China | | $ | 23.0 |
| | $ | 18.7 |
| | Various through 2023 |
| Other countries | 51.4 |
| | 29.3 |
| | Various through 2020 | 28.4 |
| | 14.6 |
| | Various through 2023, as well as open-ended |
| Total | $ | 110.1 |
| | $ | 34.8 |
| | | $ | 51.4 |
| | $ | 33.3 |
| | |
Analysis of Cash Flows
The following table summarizes our cash flows for the ninesix months and prior-year period:
|
| | | | | | | |
| | Nine Months Ended September 30, |
| (In millions) | 2017 | | 2016 |
| Net cash provided by (used for) operating activities from continuing operations | $ | 267.5 |
| | $ | 207.6 |
|
| Net cash provided by (used for) investing activities from continuing operations | (90.0 | ) | | (324.6 | ) |
| Net cash provided by (used for) financing activities from continuing operations | (99.6 | ) | | 87.4 |
|
| Effect of currency exchange rate changes on cash and cash equivalents | 7.2 |
| | 2.7 |
|
| Increase (decrease) in cash and cash equivalents from continuing operations | 85.1 |
| | (26.9 | ) |
| Increase (decrease) in cash and cash equivalents from discontinued operations | — |
| | 44.8 |
|
| Net increase (decrease) in cash and cash equivalents | 85.1 |
| | 17.9 |
|
| Less: cash and cash equivalents of discontinued operations | — |
| | (143.4 | ) |
| Cash and cash equivalents, beginning of period | 90.6 |
| | 329.9 |
|
| Cash and cash equivalents, end of period | $ | 175.7 |
| | $ | 204.4 |
|
|
| | | | | | | |
| | Six Months Ended June 30, |
| (In millions) | 2018 | | 2017 |
| Net cash provided by (used for) operating activities | $ | 119.0 |
| | $ | 140.5 |
|
| Net cash provided by (used for) investing activities | (499.0 | ) | | (58.8 | ) |
| Net cash provided by (used for) financing activities | 350.3 |
| | (13.2 | ) |
| Effect of currency exchange rate changes on cash, cash equivalents, and restricted cash | (1.0 | ) | | 3.5 |
|
| Net increase (decrease) in cash and cash equivalents | (30.7 | ) | | 72.0 |
|
| Cash, cash equivalents, and restricted cash, beginning of period | 163.5 |
| | 100.6 |
|
| Cash, cash equivalents, and restricted cash, end of period | $ | 132.8 |
| | $ | 172.6 |
|
Net cash provided by operating activities from continuing operations for the ninesix months was $267.5$119.0 million compared with $207.6$140.5 million for the prior-year period. The year-over-year change in cash flow was primarily due to higher income and lower cash paid for repositioning duea $50.0 million accelerated contribution to the completion ofU.S. defined benefit pension plans and cash used for an increase in inventory, which is expected to decline in the Separation in 2016, and an income tax refund,2018 second half, partially offset by the 2017 first quarter payment of $30.0 million payment to fund the PD Trust.Trust in the prior year, lower net cash paid for income taxes in the prior year, and the timing of advance payments from customers in 2018.
Net cash used for investing activities from continuing operations for the ninesix months was $90.0$499.0 million compared with $324.6$58.8 million for the prior-year period. The year-over-year change in cash flow was primarily due to the 2016 second quarter paymentpurchase of $245.1 million for the polyolefin catalysts acquisition, which was partially offset by $11.3business of Albemarle Corporation for $420.9 million, in proceeds fromas well as capital spending of $90.8 million during the sale of assets in the same quarter.
Net cash used for financing activities from continuing operations for the ninesix months was $99.6 million, compared with net cash provided of $87.4 million in the prior-year period. In 2016, we received a $750 million distribution of cash from GCP, of which $600 million was used to pay down our euro and U.S. dollar term loans. In 2017, we paid cash dividends of $43.0 million, compared with $24.1$59.1 million in the prior-year period.
Net cash provided by financing activities for the six months was $350.3 million compared with a use of cash of $13.2 million in the prior-year period. The year-over-year change in cash flow was primarily due to the borrowings under the 2018 credit agreement, offset by the repayment of the outstanding 2014 U.S. dollar and euro term loans.
Included in net cash provided by (used for) operating activities from continuing operations are legacy product, environmental and other claims paid of $50.1$12.6 million and $17.3$44.2 million; repositioning expenses paid of $11.2 million and $2.8 million; and restructuring expenses paid of $10.9$5.1 million and $13.6$7.2 million repositioning expenses paidfor the six months and prior-year period, respectively; and accelerated defined benefit pension plan contributions of $6.3 million and $35.4$50.0 million and cash paid for third-party acquisition-related costs of $0.1 million and $1.6$3.0 million for the nine months and prior-year period, respectively; and cash taxes related to repositioning of $2.6 million for the prior-year period. Included in capital expenditures are $1.8 million related to repositioning for the prior-year period.six months. These cash flows totaled $67.4$81.9 million and $72.3$54.2 million for the ninesix months and prior-year period, respectively. We do not include these cash flows when evaluating the performance of our businesses.
Debt and Other Contractual Obligations
Total debt outstanding at SeptemberJune 30, 2017,2018, was $1,568.4$1,986.6 million. The Credit Agreement we entered into on April 3, 2018, provides for new senior secured credit facilities, consisting of a $950 million term loan due in 2025 and a $400 million revolving credit facility due in 2023. In connection with the Credit Agreement, our previous U.S. dollar and euro term loans were repaid in full.
See Note 8 to the Consolidated Financial Statements for a discussion of Financial Assurances.
Employee Benefit Plans
See Note 6 to the Consolidated Financial Statements for further discussion of Pension Plans and Other Postretirement Benefit Plans.
Defined Benefit Pension Plans
The following table presents the components of cash contributions for the advance-funded and pay-as-you-go plans:
| | | | Three Months Ended September 30, | | Nine Months Ended September 30, | Three Months Ended June 30, | | Six Months Ended June 30, |
| (In millions) | 2017 | | 2016 | | 2017 | | 2016 | 2018 | | 2017 | | 2018 | | 2017 |
| U.S. advance-funded plans | $ | 0.3 |
| | $ | — |
| | $ | 0.3 |
| | $ | — |
| $ | 50.0 |
| | $ | — |
| | $ | 50.0 |
| | $ | — |
|
| U.S. pay-as-you-go plans | $ | 2.1 |
| | $ | 2.0 |
| | $ | 5.8 |
| | $ | 5.6 |
| $ | 1.8 |
| | $ | 1.8 |
| | $ | 3.5 |
| | $ | 3.7 |
|
| Non-U.S. advance-funded plans | 0.2 |
| | 0.4 |
| | 0.7 |
| | 1.0 |
| 0.5 |
| | 0.2 |
| | 0.5 |
| | 0.5 |
|
| Non-U.S. pay-as-you-go plans | 1.8 |
| | 1.7 |
| | 5.4 |
| | 5.5 |
| 1.9 |
| | 2.0 |
| | 3.9 |
| | 3.6 |
|
| Total Cash Contributions | $ | 4.4 |
| | $ | 4.1 |
| | $ | 12.2 |
| | $ | 12.1 |
| $ | 54.2 |
| | $ | 4.0 |
| | $ | 57.9 |
| | $ | 7.8 |
|
We intend to fund non-U.S. pension plans based upon applicable legal requirements and actuarial and trustee recommendations. We contributed $6.1$4.4 million and $6.5$4.1 million to these plans during the ninesix months and the prior-year period.
Other Contingencies
See Note 8 to the Consolidated Financial Statements for a discussion of our other contingent matters.
Inflation
We recognize that inflationary pressures may have an adverse effect on us through higher asset replacement costs and higher raw materials and other operating costs. We experienced raw materials cost inflation during the 2017 second half and expect to see continued inflation in 2018. We try to minimize these impacts through effective control of operating expenses, and productivity improvements, and hedging purchases of certain raw materials, as well as price increases on our products.
We estimate that the cost of replacing our property and equipment today is greater than its historical cost. Accordingly, our depreciation expense would be greater if the expense were stated on a current cost basis.
Critical Accounting Estimates
See the "Critical“Critical Accounting Estimates"Estimates” heading in Management'sManagement’s Discussion and Analysis of Financial Condition and Results of Operations in our Form 10-K for the year ended December 31, 2016,2017, for a discussion of our critical accounting estimates, incorporated by reference into Item 7 thereof.
Recent Accounting Pronouncements
See Note 1 to the Consolidated Financial Statements for a discussion of recent accounting pronouncements and their effect on us.
Forward LookingForward-Looking Statements
This document contains, and our other public communications may contain, forward-looking statements, that is, information related to future, not past, events. Such statements generally include the words "believes," "plans," "intends," "targets," "will," "expects," "suggests," "anticipates," "outlook," "continues"“believes,” “plans,” “intends,” “targets,” “will,” “expects,” “suggests,” “anticipates,” “outlook,” “continues,” or similar expressions. Forward-looking statements include, without limitation, expected financial positions; results of operations; cash flows; financing plans; business strategy; operating plans; capital and other expenditures; competitive positions; growth opportunities for existing products; benefits from new technology and cost reduction initiatives, plans and objectives; and markets for securities. For these statements, we claim the protections of the safe harbor for forward-looking statements contained in Section 27A of the Securities Act and Section 21E of the Exchange Act. Like other businesses, we are subject to risks and uncertainties that could cause our actual results to differ materially from our projections or that could cause other forward-looking statements to prove incorrect. Factors that could cause actual results to differ materially from those contained in the forward-looking statements include, without limitation: risks related to foreign operations, especially in emerging regions; the costcosts and availability of raw materials, energy and transportation; the effectiveness of Grace'sGrace’s research and development and growth investments; acquisitions and divestitures of assets and businesses; developments affecting Grace’s outstanding indebtedness; developments affecting Grace's funded and unfundedGrace’s pension obligations; Grace'sGrace’s legal and
environmental proceedings and insurance recoveries;proceedings; environmental compliance costs; uncertainties related to Grace's ability to realize the anticipated benefits of the separation transaction; the inability to establish or maintain certain business relationships; the inability
to hire or retain key personnel; natural disasters such as storms and floods;floods, and force majeure events; changes in tax laws and regulations; international trade disputes, tariffs, and sanctions; the potential effects of cyberattacks; and those additional factors set forth in our most recent Annual Report on Form 10-K, this quarterly reportreports on Form 10-Q, and current reports on Form 8-K, which have been filed with the Securities and Exchange Commission and are readily available on the Internet at www.sec.gov. Our reported results should not be considered as an indication of our future performance. Readers are cautioned not to place undue reliance on our projections and forward-looking statements, which speak only as of the dates those projections and statements are made. We undertake no obligation to release publicly any revisionsrevision to the projections and forward-looking statements contained in this document, or to update them to reflect events or circumstances occurring after the date of this document.
Item 3. QUANTITATIVE AND QUALITATIVE DISCLOSURES ABOUT MARKET RISK
With respect to information disclosed in the "Quantitative“Quantitative and Qualitative Disclosures About Market Risk"Risk” section of our Annual Report on Form 10-K for the year ended December 31, 20162017, more recent numerical measures and other information are available in the "Financial Statements"“Financial Statements” and "Management's“Management’s Discussion and Analysis of Financial Condition and Results of Operations"Operations” sections of this Report. These more recent measures and information are incorporated herein by reference.
Item 4. CONTROLS AND PROCEDURES
EVALUATION OF DISCLOSURE CONTROLS AND PROCEDURES
As of SeptemberJune 30, 20172018, Grace carried out an evaluation of the effectiveness of the design and operation of its disclosure controls and procedures pursuant to Rule 13a-15 under the Securities Exchange Act of 1934, as amended (the "Exchange Act"“Exchange Act”). Based upon that evaluation, Grace's ChiefGrace’s Principal Executive Officer and ChiefActing Principal Financial Officer concluded that Grace'sGrace’s disclosure controls and procedures are effective to ensure that information required to be disclosed in Grace'sGrace’s Exchange Act reports is recorded, processed, summarized and reported within the time periods specified in the SEC'sSEC’s rules and forms, and that material information relating to Grace is made known to management, including Grace's ChiefGrace’s Principal Executive Officer and ChiefActing Principal Financial Officer, as appropriate to allow timely decisions regarding required disclosure.
CHANGES IN INTERNAL CONTROL OVER FINANCIAL REPORTING
There were no changes in Grace'sGrace’s internal control over financial reporting during the quarter ended SeptemberJune 30, 20172018, that have materially affected, or are reasonably likely to materially affect, Grace'sGrace’s internal control over financial reporting.
PART II. OTHER INFORMATION
Item 1. LEGAL PROCEEDINGS
Note 8 to the interim Consolidated Financial Statements in Part I of this Report is incorporated herein by reference.
Item 1A. RISK FACTORS
In addition to the other information set forth below and elsewhere in this Report, you should carefully consider the risk factors discussed in the "Risk Factors"“Risk Factors” section of our Annual Report on Form 10-K for the year ended December 31, 2016,2017, which could materially affect our business, financial condition or future results. The risks described in this Report and in our Annual Report on Form 10-K are not the only risks facing Grace. Additional risks and uncertainties not currently known to us or that we currently deem to be immaterial also may materially adversely affect our business, financial condition or future results. With respect to certain risk factors discussed in our Annual Report on Form 10-K, more recent numerical measures and other information are available in the "Financial Statements"“Financial Statements” and "Management's“Management’s Discussion and Analysis of Financial Condition and Results of Operations"Operations” sections of this Report. These more recent measures and information are incorporated herein by reference.
The global scope of our operations subjects us to the risks of doing business in foreign countries, and with other parties located in foreign jurisdictions, which could adversely affect our business, financial condition and results of operations.
In addition to the risks and uncertainties that we discussed in our Annual Report on Form 10-K, recent world events have increased the risks posed by international trade disputes, tariffs, and sanctions. We procure a wide spectrum of commodities globally to support our production. For materials sourced from nations that could be impacted by trade disputes, tariffs or sanctions, we could potentially face increased costs, supply disruptions and/or costs associated with securing alternative materials. Additionally, such disputes, tariffs, and sanctions could potentially lead to a reduction in our sales of products, technology, and services. We view geopolitical risk along with other potential supply chain and sales risks, and work actively to diversify and mitigate these potential impacts; however, such events could adversely affect our business, financial condition and results of operations.
Item 2. UNREGISTERED SALES OF EQUITY SECURITIES AND USE OF PROCEEDS
Share Repurchase Program
On February 5, 2015,8, 2017, we announced that our Board of Directors had authorized a share repurchase program of up to $500 million, which we completed on July 10, 2017. On February 8, 2017, we announced that the Board of Directors authorized an additional share repurchase program of up to $250 million. Repurchases under the programsprogram may be made through one or more open market transactions at prevailing market prices; unsolicited or solicited privately negotiated transactions; accelerated share repurchase programs; or through any combination of the foregoing, or in such other manner as determined by management. The timing of the repurchases and the actual amount repurchased will depend on a variety of factors, including the market price of the Company'sCompany’s shares, the strategic deployment of capital, and general market and economic conditions.
The following table presents information regarding the repurchase of Company common stock by or on behalf of Grace or any "affiliated purchaser"“affiliated purchaser” of Grace during the three months ended SeptemberJune 30, 2017:2018:
|
| | | | | | | | | | | | |
| Period | | Total number of shares purchased (#) | | Average price paid per share ($/share) | | Total number of shares purchased as part of publicly announced plans or programs (#) | | Approximate dollar value of shares that may yet be purchased under the plans or programs ($ in millions) |
| 7/1/2017 - 7/31/2017 | | 144,700 |
| | 71.38 |
| | 144,700 |
| | 243.6 |
|
| 8/1/2017 - 8/31/2017 | | 365,062 |
| | 67.58 |
| | 365,062 |
| | 218.9 |
|
| 9/1/2017 - 9/30/2017 | | — |
| | — |
| | — |
| | 218.9 |
|
| Total | | 509,762 |
| | 68.66 |
| | 509,762 |
| |
|
|
|
| | | | | | | | | | | | |
| Period | | Total number of shares purchased (#) | | Average price paid per share ($/share) | | Total number of shares purchased as part of publicly announced plans or programs (#) | | Approximate dollar value of shares that may yet be purchased under the plans or programs ($ in millions) |
| 4/1/2018 - 4/30/2018 | | 61,000 |
| | 66.06 |
| | 61,000 |
| | 179.9 |
|
| 5/1/2018 - 5/31/2018 | | 47,731 |
| | 71.29 |
| | 47,731 |
| | 176.5 |
|
| 6/1/2018 - 6/30/2018 | | 100,569 |
| | 73.00 |
| | 100,569 |
| | 169.1 |
|
| Total | | 209,300 |
| | 70.59 |
| | 209,300 |
| | |
Item 4. MINE SAFETY DISCLOSURES
Information concerning mine safety violations or other regulatory matters required by Section 1503(a) of the Dodd-Frank Wall Street Reform and Consumer Protection Act and Item 104 of Regulation S-K (17 CFR 229.104) is included in Exhibit 95 to this Report.
Item 6. EXHIBITS
In reviewing the agreements included as exhibits to this and other Reports filed by Grace with the Securities and Exchange Commission (the "SEC"“SEC”), please remember they are included to provide you with information regarding their terms and are not intended to provide any other factual or disclosure information about Grace or other parties to the agreements. The agreements generally contain representations and warranties by each of the parties to the applicable agreement. These representations and warranties have been made solely for the benefit of the other parties to the applicable agreement. These representations and warranties:
Are not statements of fact, but rather are used to allocate risk to one of the parties if the statements prove to be inaccurate;
May have been qualified by disclosures that were made to the other parties in connection with the negotiation of the applicable agreement, which disclosures are not necessarily reflected in the agreement;
May apply standards of materiality in a way that is different from what may be viewed as material to you or other investors; and
Were made only as of the date of the applicable agreement or such other date or dates as may be specified in the agreement and do not reflect more recent developments.
Accordingly, these representations and warranties may not describe the actual state of affairs as of the date they were made or at any other time. Additional information about Grace may be found elsewhere in this report and Grace'sGrace’s other public filings, which are available without charge through the SEC'sSEC’s website at http://www.sec.gov.
The following is a list of Exhibits filed as part of this Quarterly Report on Form 10-Q:
|
| | | | |
| Exhibit No. | | Description of Exhibit | | Location |
| 2.1 | | | | Exhibit 2.4 to Form 10-K (filed 2/22/18) SEC File No.: 001-13953 |
| 3.1 | | | | Exhibit 3.01 to Form 8-K (filed 2/07/14) SEC File No.: 001-13953 |
| 3.2 | | | | Exhibit 3.01 to Form 8-K (filed 1/23/15) SEC File No.: 001-13953 |
| 4.1 | | | | Exhibit 4.1 to Form 8-K (filed 4/03/18) SEC File No.: 001-13953 |
| 4.2 | | | | Exhibit 4.2 to Form 10-Q (filed 5/09/18) SEC File No.: 001-13953
|
| 10.1 | | | | Exhibit 10.1 to Form 8-K (filed 5/14/18) SEC File No.: 001-13953* |
| 10.2 | | | | Filed herewith* |
| 10.3 | | | | Filed herewith* |
|
| | | | |
| Exhibit No. | | Description of Exhibit | | Location |
| 10.4 | | | | Filed herewith* |
| 10.5 | | | | Filed herewith* |
| 15 | | | | Filed herewith |
| 31(i).1 | | | | Filed herewith |
| 31(i).2 | | | | Filed herewith |
| 32 | | | | Filed herewith |
| 95 | | | | Filed herewith |
| 101.INS | | XBRL Instance Document | | Filed herewith |
| 101.SCH | | XBRL Taxonomy Extension Schema | | Filed herewith |
| 101.CAL | | XBRL Taxonomy Extension Calculation Linkbase | | Filed herewith |
| 101.DEF | | XBRL Taxonomy Extension Definition Linkbase | | Filed herewith |
| 101.LAB | | XBRL Taxonomy Extension Label Linkbase | | Filed herewith |
| 101.PRE | | XBRL Taxonomy Extension Presentation Linkbase | | Filed herewith |
| |
| * | Management contracts and compensatory plans, contracts or arrangements required to be filed as exhibits to this Report. |
SIGNATURES
Pursuant to the requirements of the Securities Exchange Act of 1934, the Registrant has duly caused this Report to be signed on its behalf by the undersigned thereunto duly authorized.
|
| | |
| | W. R. GRACE & CO. (Registrant) |
| | | |
Date: November 2, 2017August 8, 2018 | By: | /s/ A. E. FESTA |
| | | A. E. Festa (Chairman and Chief Executive Officer
Chief(Principal Executive Officer)
|
| | | |
Date: November 2, 2017August 8, 2018 | By: | /s/ THOMAS E. BLASERHUDSON LA FORCE |
| | | Thomas E. BlaserHudson La Force
(Senior Vice President and Chief Operating Officer
Chief(Acting Principal Financial Officer)
|
| | | |
Date: November 2, 2017August 8, 2018 | By: | /s/ WILLIAM C. DOCKMAN |
| | | William C. Dockman (Vice President and Controller)Controller
(Principal Accounting Officer) |