UNITED STATES
SECURITIES AND EXCHANGE COMMISSION
Washington, D.C. 20549
FORM 10-Q
☑ QUARTERLY REPORT PURSUANT TO SECTION 13 OR 15(d) OF THE SECURITIES EXCHANGE ACT OF 1934
For the Quarterly Period Ended September 30, 20192020
or
☐ TRANSITION REPORT PURSUANT TO SECTION 13 OR 15(d) OF THE SECURITIES EXCHANGE ACT OF 1934
For the transition period from _____ to _____
Commission File Number 1-13953
W. R. GRACE & CO.
(Exact name of registrant as specified in its charter)
|
| |
| Delaware | 65-0773649 |
| (State or other jurisdiction of incorporation or organization) | (I.R.S. Employer Identification No.) |
7500 Grace Drive, Columbia, Maryland 21044-4098
(Address of principal executive offices) (Zip Code)
(410) 531-4000
(Registrant’s telephone number, including area code)
|
| | | | |
| Securities registered pursuant to Section 12(b) of the Act: |
| Title of each class | | Trading Symbol(s) | | Name of each exchange on which registered |
| Common Stock, $0.01 par value per share | | GRA | | New York Stock Exchange |
Indicate by check mark whether the registrant (1) has filed all reports required to be filed by Section 13 or 15(d) of the Securities Exchange Act of 1934 during the preceding 12 months (or for such shorter period that the registrant was required to file such reports), and (2) has been subject to such filing requirements for the past 90 days. Yes ☑ No ☐
Indicate by check mark whether the registrant has submitted electronically every Interactive Data File required to be submitted pursuant to Rule 405 of Regulation S-T (§232.405 of this chapter) during the preceding 12 months (or for such shorter period that the registrant was required to submit such files). Yes ☑ No ☐
Indicate by check mark whether the registrant is a large accelerated filer, an accelerated filer, a non-accelerated filer, a smaller reporting company, or an emerging growth company. See the definitions of “large accelerated filer,” “accelerated filer,” “smaller reporting company,” and “emerging growth company” in Rule 12b-2 of the Exchange Act.
|
| | | | |
| Large accelerated filer | ☑ | | Accelerated filer | ☐ |
| Non-accelerated filer | ☐ | | Smaller reporting company | ☐ |
| | | | Emerging growth company | ☐ |
If an emerging growth company, indicate by check mark if the registrant has elected not to use the extended transition period for complying with any new or revised financial accounting standards provided pursuant to Section 13(a) of the Exchange Act. ☐
Indicate by check mark whether the registrant is a shell company (as defined in Rule 12b-2 of the Exchange Act). Yes ☐ No ☑
Indicate the number of shares outstanding of each of the issuer’s classes of common stock, as of the latest practicable date.
|
| | | |
| Class | | Outstanding at October 31, 20192020 |
| Common Stock, $0.01 par value per share | | 66,735,74566,190,280 | shares |
TABLE OF CONTENTS
Notes on references that we use in this Report. Unless the context indicates otherwise, in this Report, the terms “Grace,” the “Company,” “Grace,” “we,” “us,” or “our” mean (i) W. R. Grace & Co. itself, or (ii) W. R. Grace & Co. and/or one or more of its consolidated subsidiaries and affiliates and, in certain cases, their respective predecessors. Unless otherwise indicated, the contents of websites mentioned in this Reportthat we mention are not incorporated by reference or otherwise made a part of this Report.
We refer to the U.S. Securities and Exchange Commission as the “SEC.” We refer to the Financial Accounting Standards Board as the “FASB.” The FASB issues, among other things, the Accounting Standards Codification (which we refer to as “ASC”) and Accounting Standards Updates (which we refer to as “ASU”). We refer to the U.S. Internal Revenue Service as the “IRS.”
Trademarks and other intellectual property that we discuss in this Report. GRACE®, the GRACE® logo (and any other use of the term “Grace” as a tradename)trade name) as well as the other trademarks, service marks, or trade names used in this Report are trademarks, service marks, or trade names of Grace’sGrace or its operating units, except as otherwise indicated herein.indicated. ART® and ADVANCED REFINING TECHNOLOGIES® are trademarks, registered in the United States and/or other countries, of Advanced Refining Technologies LLC, a Delaware limited liability company, 50% owned by Grace and 50% owned by Chevron U.S.A. Inc.
The Financial Accounting Standards Board is referred to in this Report as the “FASB.” The FASB issues, among other things, Accounting Standards Codifications (which are referred to herein as “ASC”) and Accounting Standards Updates (which are referred to herein as “ASU”). The U.S. Internal Revenue Service is referred to in this Report as the “IRS.”
PART I. FINANCIAL INFORMATION
Item 1. Financial Statements
W. R. Grace & Co. and Subsidiaries
Consolidated Statements of Operations (unaudited)
| | | | Three Months Ended September 30, | | Nine Months Ended September 30, | Three Months Ended September 30, | | Nine Months Ended September 30, |
| (In millions, except per share amounts) | 2019 | | 2018 | | 2019 | | 2018 | 2020 | | 2019 | | 2020 | | 2019 |
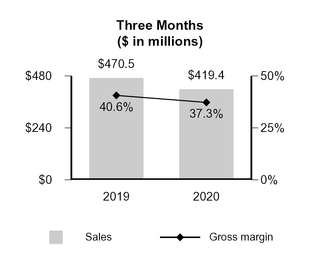
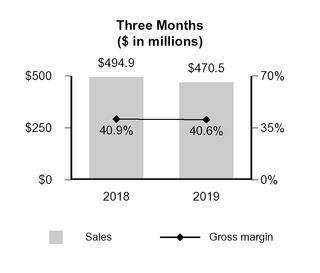
| Net sales | $ | 470.5 |
| | $ | 494.9 |
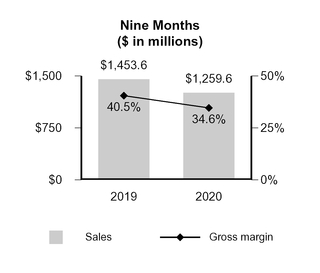
| | $ | 1,453.6 |
| | $ | 1,412.1 |
| $ | 419.4 |
| | $ | 470.5 |
| | $ | 1,259.6 |
| | $ | 1,453.6 |
|
| Cost of goods sold | 279.5 |
| | 292.7 |
| | 864.6 |
| | 841.7 |
| 263.0 |
| | 279.5 |
| | 824.3 |
| | 864.6 |
|
| Gross profit | 191.0 |
| | 202.2 |
| | 589.0 |
| | 570.4 |
| 156.4 |
| | 191.0 |
| | 435.3 |
| | 589.0 |
|
| Selling, general and administrative expenses | 74.2 |
| | 74.7 |
| | 223.7 |
| | 223.5 |
| 68.1 |
| | 74.2 |
| | 211.1 |
| | 223.7 |
|
| Research and development expenses | 14.9 |
| | 15.7 |
| | 48.2 |
| | 46.5 |
| 15.6 |
| | 14.9 |
| | 49.3 |
| | 48.2 |
|
| Costs related to legacy matters | 3.7 |
| | 74.6 |
| | 52.1 |
| | 78.8 |
| 30.6 |
| | 3.7 |
| | 36.1 |
| | 52.1 |
|
| Equity in earnings of unconsolidated affiliate | (3.8 | ) | | (5.9 | ) | | (13.9 | ) | | (19.5 | ) | (1.3 | ) | | (3.8 | ) | | (5.9 | ) | | (13.9 | ) |
| Restructuring and repositioning expenses | 3.4 |
| | 8.4 |
| | 12.1 |
| | 32.8 |
| 2.4 |
| | 3.4 |
| | 29.0 |
| | 12.1 |
|
| Loss on early extinguishment of debt | | 39.4 |
|
| 0 |
|
| 39.4 |
|
| 0 |
|
| Interest expense and related financing costs | 18.6 |
| | 20.4 |
| | 58.2 |
| | 59.6 |
| 19.8 |
| | 18.6 |
| | 57.3 |
| | 58.2 |
|
| Other (income) expense, net | (1.1 | ) | | (2.3 | ) | | (3.2 | ) | | 0.3 |
| 5.3 |
| | (1.1 | ) | | (12.1 | ) | | (3.2 | ) |
| Total costs and expenses | 109.9 |
| | 185.6 |
| | 377.2 |
| | 422.0 |
| 179.9 |
| | 109.9 |
| | 404.2 |
| | 377.2 |
|
| Income (loss) before income taxes | 81.1 |
| | 16.6 |
| | 211.8 |
| | 148.4 |
| (23.5 | ) | | 81.1 |
| | 31.1 |
| | 211.8 |
|
| (Provision for) benefit from income taxes | (27.3 | ) |
| (0.7 | ) | | (57.0 | ) | | (50.5 | ) | 30.2 |
|
| (27.3 | ) | | 8.1 |
| | (57.0 | ) |
| Net income (loss) | 53.8 |
| | 15.9 |
| | 154.8 |
| | 97.9 |
| 6.7 |
| | 53.8 |
| | 39.2 |
| | 154.8 |
|
| Less: Net (income) loss attributable to noncontrolling interests | (0.1 | ) | | 0.2 |
| | (0.2 | ) | | 0.6 |
| 0.3 |
| | (0.1 | ) | | 2.5 |
| | (0.2 | ) |
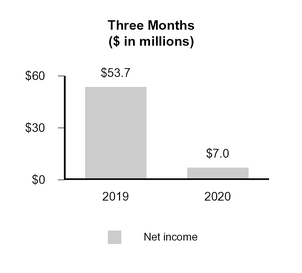
| Net income (loss) attributable to W. R. Grace & Co. shareholders | $ | 53.7 |
| | $ | 16.1 |
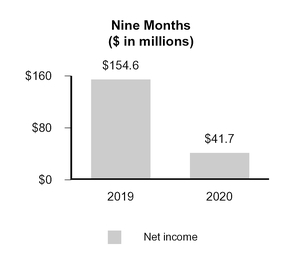
| | $ | 154.6 |
| | $ | 98.5 |
| $ | 7.0 |
| | $ | 53.7 |
| | $ | 41.7 |
| | $ | 154.6 |
|
| Earnings Per Share Attributable to W. R. Grace & Co. Shareholders | | | | | | | | | | | | | | |
| Basic earnings per share: | | | | | | | | | | | | | | |
| Net income (loss) | $ | 0.81 |
| | $ | 0.24 |
| | $ | 2.31 |
| | $ | 1.46 |
| $ | 0.11 |
| | $ | 0.81 |
| | $ | 0.63 |
| | $ | 2.31 |
|
| Weighted average number of basic shares | 66.7 |
|
| 67.1 |
| | 66.8 |
| | 67.3 |
| 66.2 |
|
| 66.7 |
| | 66.3 |
| | 66.8 |
|
| Diluted earnings per share: | | | | | | | | | | | | | | |
| Net income (loss) | $ | 0.80 |
| | $ | 0.24 |
| | $ | 2.31 |
| | $ | 1.46 |
| $ | 0.11 |
| | $ | 0.80 |
| | $ | 0.63 |
| | $ | 2.31 |
|
| Weighted average number of diluted shares | 66.8 |
| | 67.2 |
| | 66.9 |
| | 67.4 |
| 66.2 |
| | 66.8 |
| | 66.3 |
| | 66.9 |
|
| Dividends per common share | $ | 0.27 |
| | $ | 0.24 |
| | $ | 0.81 |
| | $ | 0.72 |
| $ | 0.30 |
| | $ | 0.27 |
| | $ | 0.90 |
| | $ | 0.81 |
|
The Notes to Consolidated Financial Statements are an integral part of these statements.
3
W. R. Grace & Co. and Subsidiaries
Consolidated Statements of Comprehensive Income (Loss) (unaudited)
| | | | Three Months Ended September 30, | | Nine Months Ended September 30, | Three Months Ended September 30, | | Nine Months Ended September 30, |
| (In millions) | 2019 | | 2018 | | 2019 | | 2018 | 2020 | | 2019 | | 2020 | | 2019 |
| Net income (loss) | $ | 53.8 |
| | $ | 15.9 |
| | $ | 154.8 |
| | $ | 97.9 |
| $ | 6.7 |
| | $ | 53.8 |
| | $ | 39.2 |
| | $ | 154.8 |
|
| Other comprehensive income (loss), net of income taxes: | | | | | | | | | | | | | | |
| Defined benefit pension and other postretirement plans | (0.1 | ) | | (0.3 | ) | | (0.3 | ) | | (0.7 | ) | 0 |
| | (0.1 | ) | | (0.2 | ) | | (0.3 | ) |
| Currency translation adjustments | 22.4 |
| | (11.1 | ) | | 27.3 |
| | 8.6 |
| (20.9 | ) | | 22.4 |
| | (25.9 | ) | | 27.3 |
|
| Gain (loss) from hedging activities | (0.5 | ) | | 2.1 |
| | (9.6 | ) | | (1.3 | ) | 3.0 |
| | (0.5 | ) | | 1.2 |
| | (9.6 | ) |
| Total other comprehensive income (loss) | 21.8 |
| | (9.3 | ) | | 17.4 |
| | 6.6 |
| (17.9 | ) | | 21.8 |
| | (24.9 | ) | | 17.4 |
|
| Comprehensive income (loss) | 75.6 |
| | 6.6 |
| | 172.2 |
| | 104.5 |
| (11.2 | ) | | 75.6 |
| | 14.3 |
| | 172.2 |
|
| Less: comprehensive (income) loss attributable to noncontrolling interests | (0.1 | ) | | 0.2 |
| | (0.2 | ) | | 0.6 |
| 0.3 |
| | (0.1 | ) | | 2.5 |
| | (0.2 | ) |
| Comprehensive income (loss) attributable to W. R. Grace & Co. shareholders | $ | 75.5 |
| | $ | 6.8 |
| | $ | 172.0 |
| | $ | 105.1 |
| $ | (10.9 | ) | | $ | 75.5 |
| | $ | 16.8 |
| | $ | 172.0 |
|
The Notes to Consolidated Financial Statements are an integral part of these statements.
4
W. R. Grace & Co. and Subsidiaries
Consolidated Statements of Cash Flows (unaudited)
| | | | Nine Months Ended September 30, | Nine Months Ended September 30, |
| (In millions) | 2019 | | 2018 | 2020 | | 2019 |
| OPERATING ACTIVITIES | | | | | | |
| Net income (loss) | $ | 154.8 |
| | $ | 97.9 |
| $ | 39.2 |
| | $ | 154.8 |
|
| Reconciliation to net cash provided by (used for) operating activities: | | | | | | |
| Depreciation and amortization | 75.3 |
| | 76.1 |
| 77.1 |
| | 75.3 |
|
| Equity in earnings of unconsolidated affiliate | (13.9 | ) | | (19.5 | ) | (5.9 | ) | | (13.9 | ) |
| Dividends received from unconsolidated affiliate | | 10.0 |
| | 0 |
|
| Costs related to legacy matters | 52.1 |
|
| 78.8 |
| 36.1 |
|
| 52.1 |
|
| Cash paid for legacy matters | (13.8 | ) | | (18.1 | ) | (17.1 | ) | | (13.8 | ) |
| Provision for (benefit from) income taxes | 57.0 |
| | 50.5 |
| (8.1 | ) | | 57.0 |
|
| Cash paid for income taxes | (39.6 | ) | | (29.3 | ) | (35.6 | ) | | (39.6 | ) |
| Income tax refunds received | 7.1 |
| | 0.3 |
| 7.6 |
| | 7.1 |
|
| Loss on early extinguishment of debt | — |
| | 4.8 |
| |
| Interest expense and related financing costs | 58.2 |
|
| 59.6 |
| |
| Cash paid for interest | (44.3 | ) | | (46.3 | ) | |
| Defined benefit pension expense | 13.9 |
| | 11.6 |
| 10.2 |
| | 13.9 |
|
| Cash paid under defined benefit pension arrangements | (12.3 | ) | | (61.8 | ) | (13.0 | ) | | (12.3 | ) |
| Loss on early extinguishment of debt | | 39.4 |
| | 0 |
|
| Loss on disposal of assets | | 21.8 |
| | 2.2 |
|
| Changes in assets and liabilities, excluding effect of currency translation and acquisitions: | |
| | |
| |
| | |
|
| Trade accounts receivable | 11.6 |
| | 13.1 |
| 74.6 |
| | 11.6 |
|
| Inventories | (58.0 | ) | | (61.2 | ) | 56.3 |
| | (58.0 | ) |
| Accounts payable | 13.6 |
| | 17.6 |
| (34.3 | ) | | 13.6 |
|
| All other items, net | 6.7 |
| | 59.9 |
| 0.8 |
| | 18.4 |
|
| Net cash provided by (used for) operating activities | 268.4 |
| | 234.0 |
| 259.1 |
| | 268.4 |
|
| INVESTING ACTIVITIES | | | | | | |
| Cash paid for capital expenditures | (142.6 | ) | | (161.7 | ) | (123.8 | ) | | (142.6 | ) |
| Business acquired, net of cash acquired | (22.8 | ) | | (418.0 | ) | (2.0 | ) | | (22.8 | ) |
| Other investing activities, net | (4.4 | ) | | 13.8 |
| (27.9 | ) | | (4.4 | ) |
| Net cash provided by (used for) investing activities | (169.8 | ) | | (565.9 | ) | (153.7 | ) | | (169.8 | ) |
| FINANCING ACTIVITIES | | | | | | |
| Borrowings under credit arrangements | 10.3 |
| | 998.9 |
| 12.2 |
| | 10.3 |
|
| Repayments under credit arrangements | (17.5 | ) | | (558.5 | ) | (31.3 | ) | | (17.5 | ) |
| Proceeds from issuance of notes | | 750.0 |
| | 0 |
|
| Repayment of notes | | (700.0 | ) | | 0 |
|
| Cash paid related to early extinguishment of debt | | (37.9 | ) | | 0 |
|
| Cash paid for debt financing costs | — |
| | (11.8 | ) | (7.9 | ) | | 0 |
|
| Cash paid for repurchases of common stock | (29.8 | ) | | (60.1 | ) | (40.4 | ) | | (29.8 | ) |
| Proceeds from exercise of stock options | 19.1 |
| | 6.7 |
| 0 |
| | 19.1 |
|
| Dividends paid to shareholders | (54.6 | ) | | (48.5 | ) | (60.2 | ) | | (54.6 | ) |
| Other financing activities, net | (4.9 | ) | | (3.5 | ) | (4.2 | ) | | (4.9 | ) |
| Net cash provided by (used for) financing activities | (77.4 | ) | | 323.2 |
| (119.7 | ) | | (77.4 | ) |
| Effect of currency exchange rate changes on cash, cash equivalents, and restricted cash | (3.3 | ) | | (1.5 | ) | 0.3 |
| | (3.3 | ) |
| Net increase (decrease) in cash, cash equivalents, and restricted cash | 17.9 |
|
| (10.2 | ) | (14.0 | ) |
| 17.9 |
|
| Cash, cash equivalents, and restricted cash, beginning of period | 201.0 |
| | 163.5 |
| 282.9 |
| | 201.0 |
|
| Cash, cash equivalents, and restricted cash, end of period | $ | 218.9 |
| | $ | 153.3 |
| $ | 268.9 |
| | $ | 218.9 |
|
| | | | | | | |
| Supplemental disclosure of cash flow information | | | | | | |
| Cash paid for interest, net of amounts capitalized | | $ | 46.1 |
| | $ | 39.1 |
|
| Capital expenditures in accounts payable | $ | 39.4 |
| | $ | 36.8 |
| 23.2 |
| | 39.4 |
|
| Expenditures for other investing activities included in accounts payable | | 0.8 |
| | 16.2 |
|
The Notes to Consolidated Financial Statements are an integral part of these statements.
5
W. R. Grace & Co. and Subsidiaries
Consolidated Balance Sheets (unaudited)
| | | (In millions, except par value and shares) | September 30,
2019 | | December 31,
2018 | September 30,
2020 | | December 31,
2019 |
| ASSETS | | | | | | |
| Current Assets | | | | | | |
| Cash and cash equivalents | $ | 218.5 |
| | $ | 200.5 |
| $ | 268.7 |
| | $ | 282.5 |
|
| Restricted cash and cash equivalents | 0.4 |
| | 0.5 |
| 0.2 |
| | 0.4 |
|
| Trade accounts receivable, less allowance of $13.6 (2018—$11.6) | 265.6 |
| | 288.5 |
| |
| Trade accounts receivable, less allowance of $3.1 (2019—$13.3) | | 239.8 |
| | 307.0 |
|
| Inventories | 336.5 |
| | 281.1 |
| 255.7 |
| | 309.9 |
|
| Other current assets | 230.5 |
|
| 86.7 |
| 69.2 |
|
| 235.1 |
|
| Total Current Assets | 1,051.5 |
| | 857.3 |
| 833.6 |
| | 1,134.9 |
|
| Properties and equipment, net of accumulated depreciation and amortization of $1,488.0 (2018—$1,482.8) | 1,098.8 |
| | 1,011.7 |
| |
| Properties and equipment, net of accumulated depreciation and amortization of $1,509.9 (2019—$1,497.0) | | 1,156.5 |
| | 1,143.8 |
|
| Goodwill | 555.7 |
| | 540.4 |
| 559.0 |
| | 556.9 |
|
| Technology and other intangible assets, net | 348.4 |
| | 356.5 |
| 326.3 |
| | 342.8 |
|
| Deferred income taxes | 505.0 |
| | 529.4 |
| 555.8 |
| | 517.6 |
|
| Investment in unconsolidated affiliate | 168.5 |
| | 156.1 |
| 167.4 |
| | 181.9 |
|
| Other assets | 51.8 |
|
| 113.9 |
| 51.8 |
|
| 54.7 |
|
| Total Assets | $ | 3,779.7 |
| | $ | 3,565.3 |
| $ | 3,650.4 |
| | $ | 3,932.6 |
|
| LIABILITIES AND EQUITY | | | | | | |
| Current Liabilities | | | | | | |
| Debt payable within one year | $ | 22.9 |
| | $ | 22.3 |
| $ | 18.8 |
| | $ | 23.1 |
|
| Accounts payable | 266.4 |
| | 248.6 |
| 210.2 |
| | 302.3 |
|
| Other current liabilities | 415.4 |
| | 243.5 |
| 266.2 |
| | 419.7 |
|
| Total Current Liabilities | 704.7 |
| | 514.4 |
| 495.2 |
| | 745.1 |
|
| Debt payable after one year | 1,959.3 |
| | 1,961.0 |
| 1,985.6 |
| | 1,957.3 |
|
| Unfunded defined benefit pension plans | 355.9 |
| | 366.0 |
| 449.4 |
| | 434.6 |
|
| Underfunded defined benefit pension plans | 68.4 |
| | 67.1 |
| 83.1 |
| | 85.2 |
|
| Other liabilities | 239.7 |
| | 319.8 |
| 316.6 |
| | 308.2 |
|
| Total Liabilities | 3,328.0 |
| | 3,228.3 |
| 3,329.9 |
| | 3,530.4 |
|
| Commitments and Contingencies—Note 8 |
| |
|
| |
|
| Equity | | | | | | |
| Common stock issued, par value $0.01; 300,000,000 shares authorized; outstanding: 66,735,745 (2018—66,792,968) | 0.7 |
| | 0.7 |
| |
| Common stock issued, par value $0.01; 300,000,000 shares authorized; outstanding: 66,190,280 (2019—66,735,913) | | 0.7 |
| | 0.7 |
|
| Paid-in capital | 474.7 |
| | 481.1 |
| 470.4 |
| | 477.9 |
|
| Retained earnings | 776.9 |
| | 676.7 |
| 712.1 |
| | 730.5 |
|
| Treasury stock, at cost: shares: 10,720,888 (2018—10,663,659) | (892.2 | ) | | (895.5 | ) | |
| Treasury stock, at cost: shares: 11,266,353 (2019—10,720,720) | | (920.6 | ) | | (892.2 | ) |
| Accumulated other comprehensive income (loss) | 85.3 |
| | 67.9 |
| 53.9 |
| | 78.8 |
|
| Total W. R. Grace & Co. Shareholders’ Equity | 445.4 |
| | 330.9 |
| 316.5 |
| | 395.7 |
|
| Noncontrolling interests | 6.3 |
| | 6.1 |
| 4.0 |
| | 6.5 |
|
| Total Equity | 451.7 |
| | 337.0 |
| 320.5 |
| | 402.2 |
|
| Total Liabilities and Equity | $ | 3,779.7 |
| | $ | 3,565.3 |
| $ | 3,650.4 |
| | $ | 3,932.6 |
|
The Notes to Consolidated Financial Statements are an integral part of these statements.
6
W. R. Grace & Co. and Subsidiaries
Consolidated Statements of Equity (unaudited)
| | | (In millions) | Common Stock and Paid-in Capital | | Retained Earnings | | Treasury Stock | | Accumulated Other Comprehensive Income (Loss) | | Noncontrolling Interests | | Total Equity | Common Stock and Paid-in Capital | | Retained Earnings | | Treasury Stock | | Accumulated Other Comprehensive Income (Loss) | | Noncontrolling Interests | | Total Equity |
| Balance, December 31, 2018 | $ | 481.8 |
| | $ | 676.7 |
| | $ | (895.5 | ) | | $ | 67.9 |
| | $ | 6.1 |
| | $ | 337.0 |
| |
| Balance, December 31, 2019 | | $ | 478.6 |
| | $ | 730.5 |
| | $ | (892.2 | ) | | $ | 78.8 |
| | $ | 6.5 |
| | $ | 402.2 |
|
| Net income (loss) | — |
| | 24.7 |
| | — |
| | — |
| | (0.1 | ) | | 24.6 |
| 0 |
| | 42.0 |
| | 0 |
| | 0 |
| | 0.1 |
| | 42.1 |
|
| Repurchase of common stock | — |
| | — |
| | (4.8 | ) | | — |
| | — |
| | (4.8 | ) | 0 |
| | 0 |
| | (40.4 | ) | | 0 |
| | 0 |
| | (40.4 | ) |
| Payments in consideration of employee tax obligations related to stock-based compensation | (4.3 | ) | | — |
| | — |
| | — |
| | — |
| | (4.3 | ) | (4.1 | ) | | 0 |
| | 0 |
| | 0 |
| | 0 |
| | (4.1 | ) |
| Stock-based compensation | 1.9 |
| | — |
| | — |
| | — |
| | — |
| | 1.9 |
| 2.9 |
| | 0 |
| | 0 |
| | 0 |
| | 0 |
| | 2.9 |
|
| Exercise of stock options | (2.2 | ) | | — |
| | 11.4 |
| | — |
| | — |
| | 9.2 |
| |
| Shares issued | (7.4 | ) | | — |
| | 7.1 |
| | — |
| | — |
| | (0.3 | ) | (10.3 | ) | | 0 |
| | 10.3 |
| | 0 |
| | 0 |
| | 0 |
|
| Dividends declared | — |
| | (18.1 | ) | | — |
| | — |
| | — |
| | (18.1 | ) | 0 |
| | (20.2 | ) | | 0 |
| | 0 |
| | 0 |
| | (20.2 | ) |
| Other comprehensive (loss) income | — |
| | — |
| | — |
| | 8.6 |
| | — |
| | 8.6 |
| 0 |
| | 0 |
| | 0 |
| | 1.4 |
| | 0 |
| | 1.4 |
|
| Balance, March 31, 2019 | $ | 469.8 |
| | $ | 683.3 |
| | $ | (881.8 | ) | | $ | 76.5 |
| | $ | 6.0 |
| | $ | 353.8 |
| |
| Balance, March 31, 2020 | | $ | 467.1 |
| | $ | 752.3 |
| | $ | (922.3 | ) | | $ | 80.2 |
| | $ | 6.6 |
| | $ | 383.9 |
|
| Net income (loss) | — |
| | 76.2 |
| | — |
| | — |
| | 0.2 |
| | 76.4 |
| 0 |
| | (7.3 | ) | | 0 |
| | 0 |
| | (2.3 | ) | | (9.6 | ) |
| Repurchase of common stock | — |
| | — |
| | (25.0 | ) | | — |
| | — |
| | (25.0 | ) | |
| Payments in consideration of employee tax obligations related to stock-based compensation | (0.6 | ) | | — |
| | — |
| | — |
| | — |
| | (0.6 | ) | |
| Stock-based compensation | 3.7 |
| | — |
| | — |
| | — |
| | — |
| | 3.7 |
| 2.9 |
| | 0 |
| | 0 |
| | 0 |
| | 0 |
| | 2.9 |
|
| Exercise of stock options | (2.4 | ) | | — |
| | 11.2 |
| | — |
| | — |
| | 8.8 |
| |
| Shares issued | (0.5 | ) | | — |
| | 1.9 |
| | — |
| | — |
| | 1.4 |
| (0.7 | ) | | 0 |
| | 1.5 |
| | 0 |
| | 0 |
| | 0.8 |
|
| Dividends declared | — |
| | (18.2 | ) | | — |
| | — |
| | — |
| | (18.2 | ) | 0 |
| | (20.0 | ) | | 0 |
| | 0 |
| | 0 |
| | (20.0 | ) |
| Other comprehensive (loss) income | — |
| | — |
| | — |
| | (13.0 | ) | | — |
| | (13.0 | ) | 0 |
| | 0 |
| | 0 |
| | (8.4 | ) | | 0 |
| | (8.4 | ) |
| Balance, June 30, 2019 | $ | 470.0 |
| | $ | 741.3 |
| | $ | (893.7 | ) | | $ | 63.5 |
| | $ | 6.2 |
| | $ | 387.3 |
| |
| Balance, June 30, 2020 | | $ | 469.3 |
| | $ | 725.0 |
| | $ | (920.8 | ) | | $ | 71.8 |
| | $ | 4.3 |
| | $ | 349.6 |
|
| Net income (loss) | — |
| | 53.7 |
| | — |
| | — |
| | 0.1 |
| | 53.8 |
| 0 |
| | 7.0 |
| | 0 |
| | 0 |
| | (0.3 | ) | | 6.7 |
|
| Stock-based compensation | 5.8 |
| | — |
| | — |
| | — |
| | — |
| | 5.8 |
| 2.0 |
| | 0 |
| | 0 |
| | 0 |
| | 0 |
| | 2.0 |
|
| Exercise of stock options | (0.4 | ) | | — |
| | 1.5 |
| | — |
| | — |
| | 1.1 |
| |
| Shares issued | | (0.2 | ) | | 0 |
| | 0.2 |
| | 0 |
| | 0 |
| | 0 |
|
| Dividends declared | — |
| | (18.1 | ) | | — |
| | — |
| | — |
| | (18.1 | ) | 0 |
| | (19.9 | ) | | 0 |
| | 0 |
| | 0 |
| | (19.9 | ) |
| Other comprehensive (loss) income | — |
| | — |
| | — |
| | 21.8 |
| | — |
| | 21.8 |
| 0 |
| | 0 |
| | 0 |
| | (17.9 | ) | | 0 |
| | (17.9 | ) |
| Balance, September 30, 2019 | $ | 475.4 |
| | $ | 776.9 |
| | $ | (892.2 | ) | | $ | 85.3 |
| | $ | 6.3 |
| | $ | 451.7 |
| |
| Balance, September 30, 2020 | | $ | 471.1 |
| | $ | 712.1 |
| | $ | (920.6 | ) | | $ | 53.9 |
| | $ | 4.0 |
| | $ | 320.5 |
|
The Notes to Consolidated Financial Statements are an integral part of these statements.
7
W. R. Grace & Co. and Subsidiaries
Consolidated Statements of Equity (unaudited) (Continued)
| | | (In millions) | Common Stock and Paid-in Capital | | Retained Earnings | | Treasury Stock | | Accumulated Other Comprehensive Income (Loss) | | Noncontrolling Interests | | Total Equity | Common Stock and Paid-in Capital | | Retained Earnings | | Treasury Stock | | Accumulated Other Comprehensive Income (Loss) | | Noncontrolling Interests | | Total Equity |
| Balance, December 31, 2017 | $ | 475.5 |
| | $ | 573.1 |
| | $ | (832.1 | ) | | $ | 39.9 |
| | $ | 6.9 |
| | $ | 263.3 |
| |
| Balance, December 31, 2018 | | $ | 481.8 |
| | $ | 676.7 |
| | $ | (895.5 | ) | | $ | 67.9 |
| | $ | 6.1 |
| | $ | 337.0 |
|
| Net income (loss) | — |
| | 43.6 |
| | — |
| | — |
| | (0.2 | ) | | 43.4 |
| 0 |
| | 24.7 |
| | 0 |
| | 0 |
| | (0.1 | ) | | 24.6 |
|
| Repurchase of common stock | — |
| | — |
| | (35.0 | ) | | — |
| | — |
| | (35.0 | ) | 0 |
| | 0 |
| | (4.8 | ) | | 0 |
| | 0 |
| | (4.8 | ) |
| Payments in consideration of employee tax obligations related to stock-based compensation | (0.7 | ) | | — |
| | — |
| | — |
| | — |
| | (0.7 | ) | (4.3 | ) | | 0 |
| | 0 |
| | 0 |
| | 0 |
| | (4.3 | ) |
| Stock-based compensation | 3.7 |
| | — |
| | — |
| | — |
| | — |
| | 3.7 |
| 1.9 |
| | 0 |
| | 0 |
| | 0 |
| | 0 |
| | 1.9 |
|
| Exercise of stock options | (0.4 | ) | | — |
| | 1.2 |
| | — |
| | — |
| | 0.8 |
| (2.2 | ) | | 0 |
| | 11.4 |
| | 0 |
| | 0 |
| | 9.2 |
|
| Shares issued | (1.3 | ) | | — |
| | 1.3 |
| | — |
| | — |
| | — |
| (7.4 | ) | | 0 |
| | 7.1 |
| | 0 |
| | 0 |
| | (0.3 | ) |
| Dividends declared | — |
| | (16.2 | ) | | — |
| | — |
| | — |
| | (16.2 | ) | 0 |
| | (18.1 | ) | | 0 |
| | 0 |
| | 0 |
| | (18.1 | ) |
| Other comprehensive (loss) income | — |
| | — |
| | — |
| | (16.6 | ) | | — |
| | (16.6 | ) | 0 |
| | 0 |
| | 0 |
| | 8.6 |
| | 0 |
| | 8.6 |
|
| Effect of adopting ASC 606 | — |
| | 3.2 |
| | — |
| | — |
| | — |
| | 3.2 |
| |
| Balance, March 31, 2018 | $ | 476.8 |
| | $ | 603.7 |
| | $ | (864.6 | ) | | $ | 23.3 |
| | $ | 6.7 |
| | $ | 245.9 |
| |
| Balance, March 31, 2019 | | $ | 469.8 |
| | $ | 683.3 |
| | $ | (881.8 | ) | | $ | 76.5 |
| | $ | 6.0 |
| | $ | 353.8 |
|
| Net income (loss) | — |
| | 38.8 |
| | — |
| | — |
| | (0.2 | ) | | 38.6 |
| 0 |
| | 76.2 |
| | 0 |
| | 0 |
| | 0.2 |
| | 76.4 |
|
| Repurchase of common stock | — |
| | — |
| | (14.8 | ) | | — |
| | — |
| | (14.8 | ) | 0 |
| | 0 |
| | (25.0 | ) | | 0 |
| | 0 |
| | (25.0 | ) |
| Payments in consideration of employee tax obligations related to stock-based compensation | (2.3 | ) | | — |
| | — |
| | — |
| | — |
| | (2.3 | ) | (0.6 | ) | | 0 |
| | 0 |
| | 0 |
| | 0 |
| | (0.6 | ) |
| Stock-based compensation | 5.9 |
| | — |
| | — |
| | — |
| | — |
| | 5.9 |
| 3.7 |
| | 0 |
| | 0 |
| | 0 |
| | 0 |
| | 3.7 |
|
| Exercise of stock options | (3.7 | ) | | — |
| | 9.0 |
| | — |
| | — |
| | 5.3 |
| (2.4 | ) | | 0 |
| | 11.2 |
| | 0 |
| | 0 |
| | 8.8 |
|
| Shares issued | (3.9 | ) | | — |
| | 4.7 |
| | — |
| | — |
| | 0.8 |
| (0.5 | ) | | 0 |
| | 1.9 |
| | 0 |
| | 0 |
| | 1.4 |
|
| Dividends declared | — |
| | (16.3 | ) | | — |
| | — |
| | — |
| | (16.3 | ) | 0 |
| | (18.2 | ) | | 0 |
| | 0 |
| | 0 |
| | (18.2 | ) |
| Other comprehensive (loss) income | — |
| | — |
| | — |
| | 32.5 |
| | — |
| | 32.5 |
| 0 |
| | 0 |
| | 0 |
| | (13.0 | ) | | 0 |
| | (13.0 | ) |
| Effect of adopting ASC 606 | — |
| | (0.7 | ) | | — |
| | — |
| | — |
| | (0.7 | ) | |
| Balance, June 30, 2018 | $ | 472.8 |
| | $ | 625.5 |
| | $ | (865.7 | ) | | $ | 55.8 |
| | $ | 6.5 |
| | $ | 294.9 |
| |
| Balance, June 30, 2019 | | $ | 470.0 |
| | $ | 741.3 |
| | $ | (893.7 | ) | | $ | 63.5 |
| | $ | 6.2 |
| | $ | 387.3 |
|
| Net income (loss) | — |
| | 16.1 |
| | — |
| | — |
| | (0.2 | ) | | 15.9 |
| 0 |
| | 53.7 |
| | 0 |
| | 0 |
| | 0.1 |
| | 53.8 |
|
| Repurchase of common stock | — |
| | — |
| | (10.3 | ) | | — |
| | — |
| | (10.3 | ) | |
| Payments in consideration of employee tax obligations related to stock-based compensation | 0.1 |
| | — |
| | — |
| | — |
| | — |
| | 0.1 |
| |
| Stock-based compensation | 4.9 |
| | — |
| | — |
| | — |
| | — |
| | 4.9 |
| 5.8 |
| | 0 |
| | 0 |
| | 0 |
| | 0 |
| | 5.8 |
|
| Exercise of stock options | (0.1 | ) | | — |
| | 0.4 |
| | — |
| | — |
| | 0.3 |
| (0.4 | ) | | 0 |
| | 1.5 |
| | 0 |
| | 0 |
| | 1.1 |
|
| Shares issued | — |
| | — |
| | (0.1 | ) | | — |
| | — |
| | (0.1 | ) | |
| Dividends declared | — |
| | (16.2 | ) | | — |
| | — |
| | — |
| | (16.2 | ) | 0 |
| | (18.1 | ) | | 0 |
| | 0 |
| | 0 |
| | (18.1 | ) |
| Other comprehensive (loss) income | — |
| | — |
| | — |
| | (9.3 | ) | | — |
| | (9.3 | ) | 0 |
| | 0 |
| | 0 |
| | 21.8 |
| | 0 |
| | 21.8 |
|
| Balance, September 30, 2018 | $ | 477.7 |
| | $ | 625.4 |
| | $ | (875.7 | ) | | $ | 46.5 |
| | $ | 6.3 |
| | $ | 280.2 |
| |
| Balance, September 30, 2019 | | $ | 475.4 |
| | $ | 776.9 |
| | $ | (892.2 | ) | | $ | 85.3 |
| | $ | 6.3 |
| | $ | 451.7 |
|
The Notes to Consolidated Financial Statements are an integral part of these statements.
8
Notes to Consolidated Financial Statements
1. Basis of Presentation and Summary of Significant Accounting and Financial Reporting Policies
W. R. Grace & Co., through its subsidiaries, is engaged in the production and sale of specialty chemicals and specialty materials businesses on a global basis through 2 reportable business segments: Grace Catalysts Technologies, which includes catalysts and related products and technologies used in petrochemical, refining, petrochemical and other chemical manufacturing applications; and Grace Materials Technologies, which includes specialty materials, including silica-based and silica-alumina-based materials, used in consumer/pharma,pharma/consumer, coatings, and chemical process and coatings applications.
W. R. Grace & Co. conducts all of its business through a single wholly owned subsidiary, W. R. Grace & Co.–Conn. (“Grace–Conn.”). Grace–Conn. owns all of the assets, properties and rights of W. R. Grace & Co. on a consolidated basis, either directly or through subsidiaries.
Basis of Presentation The interim Consolidated Financial Statements presented herein are unaudited and should be read in conjunction with the Consolidated Financial Statements presented in the Company’s 20182019 Annual Report on Form 10-K. Such interim Consolidated Financial Statements reflect all adjustments that, in the opinion of management, are necessary for a fair statement of the results of the interim periods presented; all such adjustments are of a normal recurring nature except for the impacts of adopting new accounting standards as discussed below. All significant intercompany accounts and transactions have been eliminated.
The results of operations for the nine-month interim period ended September 30, 2019,2020, are not necessarily indicative of the results of operations to be attained for the year ending December 31, 2019.2020.
Use of Estimates The preparation of financial statements in conformity with U.S. generally accepted accounting principles (“U.S. GAAP”) requires management to make estimates and assumptions that affect the reported amounts of assets and liabilities and disclosure of contingent assets and liabilities at the date of the Consolidated Financial Statements, and the reported amounts of revenues and expenses for the periods presented. Actual amounts could differ from those estimates, and the differences could be material. Changes in estimates are recorded in the period identified. Grace’s accounting measurements that are most affected by management’s estimates of future events are:
The effective tax rate and realization values of net deferred tax assets, which depend on projections of future taxable income;
Pension and postretirement liabilities, which depend on assumptions regarding participant life spans, future inflation, discount rates and total returns on invested funds (see Note 6);
Carrying values of goodwill and other intangible assets, which depend on assumptions of future earnings and cash flows; and
Contingent liabilities, which depend on an assessment of the probability of loss and an estimate of ultimate obligation, such as litigation and arbitration; and product, environmental, remediation, and other legacy liabilities (see Note 8).
Reclassifications Certain amounts in prior years’ Consolidated Financial Statements have been reclassified to conform to the current year presentation. Such reclassifications have not materially affected previously reported amounts in the Consolidated Financial Statements.
Recently Issued Accounting Standards In December 2019, the FASB issued ASU 2019-12 “Income Taxes (Topic 740): Simplifying the Accounting for Income Taxes.” This update clarifies and amends existing guidance, including removing certain exceptions to the general principles in Topic 740, and improves consistent application of and simplifies U.S. GAAP for other areas of Topic 740. This update is effective for Grace on January 1, 2021, with early adoption permitted. Grace is currently evaluating the effect and timing of adoption.
Recently Adopted Accounting Standards In March 2020, the FASB issued ASU 2020-04 “Reference Rate Reform (Topic 848): Facilitation of the Effects of Reference Rate Reform on Financial Reporting.” This update is intended to ease the potential burden in accounting for and recognizing the effects of reference rate reform. It provides optional practical expedients and exceptions for applying U.S. GAAP to contracts, hedging relationships, and other transactions affected by reference rate reform, if certain criteria are met. This update
Notes to Consolidated Financial Statements (Continued)
1. Basis of Presentation and Summary of Significant Accounting and Financial Reporting Policies (Continued)
became effective on March 12, 2020, and is available for use through December 31, 2022. Grace expects to utilize the practical expedients provided by this update in accounting for contract modifications and/or hedging transactions during the effective period. Grace expects the update to significantly reduce the effects of reference rate reform on the Consolidated Financial Statements.
In August 2018, the FASB issued ASU 2018-14 “Compensation—Retirement Benefits—Defined Benefit Plans—General (Subtopic 715-20).” This update revises disclosure requirements related to defined benefit pension and other postretirement plans. ThisGrace adopted this update is effective for Grace on January 1, 2021, with early adoption permitted. Grace is currently evaluatingin the timing of adoption2020 first quarter, and doesit did not expect the update to have a material effect on the Consolidated Financial Statements.
In June 2016, the FASB issued ASU 2016-13 “Financial Instruments—Credit Losses (Topic 326) Measurement of Credit Losses on Financial Instruments.” This update requires companies to implement an impairment model based on expected credit losses, rather than probable incurred losses. This update is effective for Grace on January 1, 2020, with early adoption permitted. Grace will adopt theadopted this update in the 2020 first quarter, and doesit did not expect the update to have a material effect on the Consolidated Financial Statements.
Notes to Consolidated Financial Statements (Continued)
1. Basis of Presentation and Summary of Significant Accounting and Financial Reporting Policies (Continued)
Recently Adopted Accounting Standards In October 2018, the FASB issued ASU 2018-16 “Derivatives and Hedging (Topic 815): Inclusion of the Secured Overnight Financing Rate (SOFR) Overnight Index Swap (OIS) Rate as a Benchmark Interest Rate for Hedge Accounting Purposes.” This update permits use of the OIS rate based on SOFR as a U.S. benchmark interest rate for hedge accounting purposes under Topic 815. Grace currently carries debt and derivatives that rely on the London Interbank Offered Rate (“LIBOR”) as a benchmark rate. LIBOR is expected to be phased out as a benchmark rate by the end of 2021. Grace expects its debt and financial instruments to continue to use LIBOR until the rate is no longer available. To the extent LIBOR ceases to exist, Grace may need to renegotiate any credit agreements and/or derivative contracts that utilize LIBOR as a factor in determining the interest rate. Grace adopted this update in the 2019 first quarter, and it had no effect on Grace’s Consolidated Financial Statements.
Leases (Topic 842)
In February 2016, the FASB issued ASU 2016-02 “Leases (Topic 842).” This update requires registrants to recognize lease assets and lease liabilities on the balance sheet and disclose key information about leasing arrangements. A lessee is now required to recognize in the statement of financial position a liability to make lease payments (the lease liability) and a right-of-use asset representing its right to use the underlying asset for the lease term, including payments to be made in optional periods where they are reasonably certain to occur. In July 2018, the FASB issued ASU 2018-11 “Leases (Topic 842): Targeted Improvements,” which provided an additional transition method permitting entities to initially apply the new standard at the adoption date and recognize a cumulative-effect adjustment to the opening balance of retained earnings in the period of adoption.
Grace adopted these standards in the 2019 first quarter under the modified retrospective approach permitted by ASU 2018-11. Under this approach, the cumulative effect of the adoption of the standard is recorded at the effective date, with no changes to prior periods. The adoption did not result in an impact to retained earnings. Grace elected to utilize the package of transition practical expedients provided by the standard, which among other things, permit Grace not to reassess expired or existing contracts and leases. Additionally, Grace elected to use the practical expedient provided in ASU 2018-01 “Leases (Topic 842): Land Easement Practical Expedient for Transition to Topic 842,” which permits Grace to elect not to evaluate under Topic 842 existing or expired land easements not previously accounted for as leases. Prior to the adoption of Topic 842, Grace typically had not evaluated easements for lease accounting. Grace has elected not to recognize in the Consolidated Balance Sheets short-term leases, which are those with an initial term of 12 months or less. Grace has also elected not to separate lease and nonlease components. These elections apply to all asset classes.
Grace leases certain real estate, office space, vehicles, railcars, and plant and office equipment, substantially all of which are accounted for as operating leases. Finance lease costs and sublease income are not material. Many of Grace’s leases contain renewal options, which are exercisable at Grace’s discretion and may be included in lease terms when they are reasonably certain to be exercised. Grace’s lease agreements do not contain material restrictive covenants or material residual value guarantees. Where available, Grace uses the interest rate implicit in the lease to calculate the estimated present value of lease payment obligations. Where such a rate is not available, Grace uses an incremental borrowing rate based on credit-adjusted and term-specific discount rates, using a third-party yield curve.
Grace recognized operating lease right-of-use assets, net of accumulated amortization, of $31.6 million and operating lease liabilities of $32.2 million as of September 30, 2019.
|
| | | | | |
| (in millions) | Amount | | Balance Sheet Location |
| Operating lease right of use asset | $ | 31.6 |
| | Other assets |
| Operating lease liability—current | 9.5 |
| | Other current liabilities |
| Operating lease liability—noncurrent | 22.7 |
| | Other liabilities |
Notes to Consolidated Financial Statements (Continued)
1. Basis of Presentation and Summary of Significant Accounting and Financial Reporting Policies (Continued)
The following table presents Grace’s costs and cash flow information related to operating leases.
|
| | | | | | | |
| (In millions) | Three Months Ended September 30, 2019 | | Nine Months Ended September 30, 2019 |
| Operating lease cost | $ | 2.9 |
| | $ | 9.0 |
|
| Short-term and variable lease cost | 5.1 |
| | 13.4 |
|
| Total lease cost | $ | 8.0 |
| | $ | 22.4 |
|
| | | | |
| Cash payments related to operating leases | $ | 2.8 |
| | $ | 8.9 |
|
| Right-of-use assets obtained in exchange for new operating lease liabilities | 5.1 |
| | 9.9 |
|
The following table presents the weighted average discount rate and weighted average remaining lease term related to Grace’s operating leases.
|
| | |
| September 30,
2019 |
Weighted average discount rate | 6.6 | % |
Weighted average remaining lease term | 6.9 years |
|
The following maturity analysis presents minimum expected operating lease payments at September 30, 2019.
|
| | | |
| | (In millions) |
| 2019 | $ | 3.0 |
|
| 2020 | 10.4 |
|
| 2021 | 7.4 |
|
| 2022 | 5.0 |
|
| 2023 | 3.1 |
|
| Thereafter | 12.3 |
|
| Total undiscounted lease payments | 41.2 |
|
| Less: imputed interest | 9.0 |
|
| Present value of lease liabilities | $ | 32.2 |
|
Notes to Consolidated Financial Statements (Continued)
2. Inventories
Inventories are stated at the lower of cost or net realizable value, and cost is determined using FIFO. Inventories consisted of the following at September 30, 2019,2020, and December 31, 2018:2019:
| | | (In millions) | September 30,
2019 | | December 31,
2018 | September 30,
2020 | | December 31,
2019 |
| Raw materials | $ | 63.5 |
| | $ | 56.3 |
| $ | 58.6 |
| | $ | 64.2 |
|
| In process | 64.4 |
| | 49.1 |
| 43.0 |
| | 55.7 |
|
| Finished products | 173.6 |
| | 144.5 |
| 120.4 |
| | 154.4 |
|
| Other | 35.0 |
| | 31.2 |
| 33.7 |
| | 35.6 |
|
| Total inventory | $ | 336.5 |
| | $ | 281.1 |
| $ | 255.7 |
| | $ | 309.9 |
|
During the three months ended June 30, 2020, Grace implemented changes to its Refining Technologies manufacturing operations to improve capital and operating efficiencies. This included key organizational changes and optimization of plant and manufacturing processes at Grace’s 3 hydroprocessing catalyst manufacturing sites. As a result of these changes, Grace recorded a pre-tax charge of $19.7 million related to a write-off of inventory now deemed obsolete based on the process changes.
Notes to Consolidated Financial Statements (Continued)
3. Debt
Components of Debt
| | | (In millions) | September 30,
2019 | | December 31,
2018 | September 30,
2020 | | December 31,
2019 |
| 2018 U.S. dollar term loan, net of unamortized debt issuance costs of $7.4 (2018—$8.7) | $ | 933.1 |
| | $ | 938.9 |
| |
| 5.125% senior notes due 2021, net of unamortized debt issuance costs of $3.0 (2018—$4.2) | 697.0 |
| | 695.8 |
| |
| 5.625% senior notes due 2024, net of unamortized debt issuance costs of $2.6 (2018—$3.0) | 297.4 |
| | 297.0 |
| |
| 2018 U.S. dollar term loan, net of unamortized debt issuance costs of $6.3 (2019—$7.2) | | $ | 924.7 |
| | $ | 930.9 |
|
| Senior notes due 2027, net of unamortized debt issuance costs of $10.5 | | 739.5 |
| | 0 |
|
| Senior notes due 2024, net of unamortized debt issuance costs of $2.0 (2019—$2.4) | | 298.0 |
| | 297.6 |
|
| Debt payable to unconsolidated affiliate | 48.2 |
| | 48.1 |
| 35.5 |
| | 47.4 |
|
| Senior notes due 2021, net of unamortized debt issuance costs (2019—$2.7) | | 0 |
| | 697.3 |
|
| Other borrowings | 6.5 |
| | 3.5 |
| 6.7 |
| | 7.2 |
|
| Total debt | 1,982.2 |
| | 1,983.3 |
| 2,004.4 |
| | 1,980.4 |
|
| Less debt payable within one year | 22.9 |
| | 22.3 |
| 18.8 |
| | 23.1 |
|
| Debt payable after one year | $ | 1,959.3 |
| | $ | 1,961.0 |
| $ | 1,985.6 |
| | $ | 1,957.3 |
|
| Weighted average interest rates on total debt | 3.8 | % | | 3.9 | % | 3.4 | % | | 3.8 | % |
See Note 4 for a discussion of the fair value of Grace’s debt.
Grace also maintains a $400 million revolving credit facility. As of September 30, 2019,2020, the available credit under this facility was reduced to $371.1$391.8 million by outstanding letters of credit.
The principal maturities of debt outstanding at September 30, 2019,2020, were as follows:
| | | | (In millions) | (In millions) |
| 2019 | $ | 8.1 |
| |
| 2020 | 20.1 |
| |
| Remainder of 2020 | | $ | 6.6 |
|
| 2021 | 715.8 |
| 17.4 |
|
| 2022 | 18.0 |
| 16.1 |
|
| 2023 | 17.0 |
| 15.7 |
|
| 2024 | | 313.1 |
|
| Thereafter | 1,203.2 |
| 1,635.5 |
|
| Total debt | $ | 1,982.2 |
| $ | 2,004.4 |
|
Senior Notes due 2027 On June 26, 2020, Grace–Conn. (the “Issuer”) and certain of the Company’s existing domestic subsidiaries (together with the Company, the “Guarantors”), completed the sale of $750 million aggregate principal amount of 4.875% Notes due 2027 (the “Senior Notes due 2027”) for net proceeds of $741.6 million. The Senior Notes due 2027 were priced at 100% of par and were offered and sold pursuant to exemptions from registration under the Securities Act of 1933, as amended (the "Securities Act"). The Senior Notes due 2027 were issued pursuant to an indenture, dated as of September 16, 2014 (the “Base Indenture”), as supplemented by that certain third supplemental indenture, dated as of June 26, 2020 (the “Third Supplemental Indenture”), by and among the Issuer, the Guarantors and the trustee thereunder (the “Trustee”). The Base Indenture, together with the Third Supplemental Indenture, are referred to below as the “Indenture.” On July 13, 2020, Grace used the net proceeds, together with cash on hand, to redeem the $700.0 million Senior Notes due 2021 for $748.0 million, including $10.1 million of interest accrued through the date of redemption and a $37.9 million make-whole premium. During the three months ended September 30, 2020, Grace recognized a charge related to the debt refinancing of $39.4 million, including the make-whole premium.
Interest is payable on the Senior Notes due 2027 on each June 15 and December 15, commencing December 15, 2020.
Notes to Consolidated Financial Statements (Continued)
3. Debt (Continued)
Grace may redeem all or a portion of the Senior Notes due 2027 at any time prior to June 15, 2023, at a price equal to 100% of the principal amount of the Senior Notes due 2027 redeemed plus accrued and unpaid interest, if any, to but excluding the redemption date plus a make-whole premium. At any time on or after June 15, 2023, Grace may redeem the Senior Notes due 2027, in whole or in part, at the redemption prices set forth in the Third Supplemental Indenture, in each case plus accrued and unpaid interest, if any, to but excluding the redemption date. The Senior Notes due 2027 will mature on June 15, 2027.
If a change of control of the Company occurs while the Senior Notes due 2027 are rated below investment grade, or is followed by a below investment grade rating, subject to certain exceptions, each holder shall have the right to require that the Issuer repurchase all or a portion of such holder’s Senior Notes due 2027 at a purchase price of 101% of the aggregate principal amount thereof, plus accrued and unpaid interest, if any, on the Senior Notes due 2027 repurchased, to but excluding, the date of repurchase.
The Senior Notes due 2027 and guarantees are senior unsecured obligations of the Issuer and the Guarantors, respectively, and will rank equally with all of the existing and future unsubordinated obligations of the Issuer and the Guarantors, respectively. The Senior Notes due 2027 and the guarantees are effectively subordinated to any secured indebtedness to the extent of the value of the assets securing such indebtedness and structurally subordinated to the debt and other liabilities of the Company’s non-guarantor subsidiaries.
The Senior Notes due 2027 were issued subject to covenants that limit the ability of the Company, the Issuer, and certain of the Company’s subsidiaries to: (i) incur liens on assets; (ii) enter into sale and leaseback transactions larger than the greater of $100 million or 2.5% of total assets; and (iii) merge or consolidate with another company; subject to certain exceptions and qualifications. Grace is in compliance with those covenants.
The Senior Notes due 2027 were issued subject to customary events of default, which include (subject in certain cases to customary grace and cure periods), among others, nonpayment of principal or interest; breach of other agreements in the Indenture; failure to pay certain other indebtedness; failure to discharge a final judgment for payment of the greater of (i) $100 million and (ii) 2.5% of Total Assets (as defined in the Indenture) or more (excluding any amounts covered by insurance or indemnities) rendered against the Issuer or any of its significant subsidiaries; and certain events of bankruptcy or insolvency. Generally, if any event of default occurs, the Trustee or the holders of at least 30% in aggregate principal amount of the then outstanding series of Senior Notes due 2027 may declare all the Senior Notes due 2027 of such series to be due and payable immediately.
The foregoing is a summary of the Senior Notes due 2027 and the related indentures, does not purport to be complete, and is qualified in its entirety by reference to the full texts thereof. Grace has filed the full text of such documents with the SEC, which are readily available on the internet at www.sec.gov.
4. Fair Value Measurements and Risk
Certain of Grace’s assets and liabilities are reported at fair value on a gross basis. ASC 820 “Fair Value Measurements and Disclosures” defines fair value as the value that would be received at the measurement date in the principal or “most advantageous” market. Grace uses principal market data, whenever available, to value assets and liabilities that are required to be reported at fair value.
Grace has identified the following financial assets and liabilities that are subject to the fair value analysis required by ASC 820:
Fair Value of Debt and Other Financial Instruments Debt payable is recorded at carrying value. Fair value is determined based on Level 2 inputs, including expected future cash flows (discounted at market interest rates), estimated current market prices and quotes from financial institutions.
Notes to Consolidated Financial Statements (Continued)
4. Fair Value Measurements and Risk (Continued)
At September 30, 20192020, and December 31, 2018,2019, the carrying amounts, net of unamortized debt issuance costs and discounts (see Note 3), and fair values of Grace’s debt were as follows:
|
| | | | | | | | | | | | | | | |
| | September 30, 2020 | | December 31, 2019 |
| (In millions) | Carrying Amount | | Fair Value | | Carrying Amount | | Fair Value |
| 2018 U.S. dollar term loan | $ | 924.7 |
| | $ | 906.6 |
| | $ | 930.9 |
| | $ | 938.1 |
|
| Senior notes due 2027 | 739.5 |
| | 764.7 |
| | 0 |
| | 0 |
|
| Senior notes due 2024 | 298.0 |
| | 317.4 |
| | 297.6 |
| | 329.2 |
|
| Senior notes due 2021 | 0 |
| | 0 |
| | 697.3 |
| | 727.1 |
|
| Other borrowings | 42.2 |
| | 42.2 |
| | 54.6 |
| | 54.6 |
|
| Total debt | $ | 2,004.4 |
| | $ | 2,030.9 |
| | $ | 1,980.4 |
| | $ | 2,049.0 |
|
|
| | | | | | | | | | | | | | | |
| | September 30, 2019 | | December 31, 2018 |
| (In millions) | Carrying Amount | | Fair Value | | Carrying Amount | | Fair Value |
| 2018 U.S. dollar term loan(1) | $ | 933.1 |
| | $ | 935.3 |
| | $ | 938.9 |
| | $ | 914.8 |
|
| 5.125% senior notes due 2021(2) | 697.0 |
| | 725.9 |
| | 695.8 |
| | 697.5 |
|
| 5.625% senior notes due 2024(2) | 297.4 |
| | 320.5 |
| | 297.0 |
| | 301.8 |
|
| Other borrowings | 54.7 |
| | 54.7 |
| | 51.6 |
| | 51.6 |
|
| Total debt | $ | 1,982.2 |
| | $ | 2,036.4 |
| | $ | 1,983.3 |
| | $ | 1,965.7 |
|
| |
(1) | Carrying amounts are net of unamortized debt issuance costs and discounts of $7.4 million and $8.7 million as of September 30, 2019, and December 31, 2018, respectively. |
| |
(2) | Carrying amounts are net of unamortized debt issuance costs of $3.0 million and $2.6 million as of September 30, 2019, and $4.2 million and $3.0 million as of December 31, 2018, related to the 5.125% senior notes due 2021 and 5.625% senior notes due 2024, respectively. |
At September 30, 20192020, the recorded values of other financial instruments such as cash equivalents and trade receivables and payables approximated their fair values, based on the short-term maturities and floating rate characteristics of these instruments.
Currency Derivatives Because Grace operates and/or sells to customers in over 7060 countries and in over 30 currencies, its results are exposed to fluctuations in currency exchange rates. Grace seeks to minimize exposure to these fluctuations by matching sales with expenditures in the same currencies, but it is not always possible to do so. From time to time, Grace uses financial instruments such as currency forward contracts, options, swaps, or combinations thereof to reduce the risk of certain specific transactions. However, Grace does not have a policy of hedging all exposures, because management does not believe that such a level of hedging would be cost-effective. Forward contracts with maturities of not more than 36 months are used and designated as cash flow hedges of forecasted repayments of intercompany loans. The effective portion of gains and losses on these currency hedges is recorded in “accumulated other comprehensive income (loss)” and reclassified into “other (income) expense, net” to offset the remeasurement of the underlying hedged loans. Excluded components (forward points) on these hedgesForward points are excluded from the assessment of effectiveness and amortized to income on a systematic basis.
Grace also enters into foreign currency forward contracts and swaps to hedge a portion of its net outstanding monetary assets and liabilities. These forward contracts and swaps are not designated as hedging instruments under applicable accounting guidance, and therefore all changes in their fair value are recorded in “other (income) expense, net,” in the Consolidated Statements of Operations. These forward contracts and swaps are intended to offset the foreign currency gains or losses associated with the underlying monetary assets and liabilities.
Notes to Consolidated Financial Statements (Continued)
4. Fair Value Measurements and Risk (Continued)
The valuation of Grace’s currency exchange rate forward contracts and swaps is determined using an income approach. Inputs used to value currency exchange rate forward contracts and swaps consist of: (1) spot rates, which are quoted by various financial institutions; (2) forward points, which are primarily affected by changes in interest rates; and (3) discount rates used to present value future cash flows, which are based on the London Interbank Offered Rate (LIBOR) curve or overnight indexed swap rates. Total notional amounts for forward contracts and swaps outstanding as of September 30, 2019,2020, were $194.4$71.6 million.
Cross-Currency Swap Agreements Grace uses cross-currency swaps designated as cash flow hedges to manage fluctuations in currency exchange rates and interest rates on variable rate debt. The effective portion of gainsGains and losses on these cash flow hedges isare recorded in “accumulated other comprehensive income (loss)” and reclassified into “other (income) expense, net” and “interest expense and related financing costs” during the hedged period.
In connection with the 2018 U.S. dollar term loan, Grace entered into cross-currency swaps beginning on April 3, 2018, and maturing on March 31, 2023, to synthetically convert $600.0 million of U.S. dollar-denominated floating rate debt into €490.1 million of euro-denominated debt fixed at 2.0231%. These cross-currency swaps were de-designated and terminated on November 5, 2018, and replaced with new, at-market cross-currency swaps beginning on November 5, 2018, and maturing on March 31, 2023, to synthetically convert $600.0 million of U.S. dollar-denominated floating rate debt into €525.9 million of euro-denominated debt fixed at 1.785%. The valuation of these cross-currency swaps is determined using an income approach, using LIBOR and EURIBOR (Euro Interbank Offered Rate) swap curves, currency basis spreads, and euro/U.S. dollar exchange rates.
Notes to Consolidated Financial Statements (Continued)
4. Fair Value Measurements and Risk (Continued)
Debt and Interest Rate Swap Agreements Grace uses interest rate swaps designated as cash flow hedges to manage fluctuations in interest rates on variable rate debt. The effective portion of gains and losses on these interest rate cash flow hedges is recorded in “accumulated other comprehensive income (loss)” and reclassified into “interest expense and related financing costs” during the hedged interest period.
In connection with the 2018 U.S. dollar term loan, Grace entered into new interest rate swaps beginning on April 3, 2018, and maturing on March 31, 2023, fixing the LIBOR component of the interest on $100.0 million of term debt at 2.775%. The valuation of these interest rate swaps is determined using an income approach, using prevailing market interest rates and discount rates to present value future cash flows based on the forward LIBOR yield curves. Credit risk is also incorporated into derivative valuations.
The following tables present the fair value hierarchy for financial assets and liabilities measured at fair value on a recurring basis as of September 30, 20192020, and December 31, 20182019:
| | | | Fair Value Measurements at September 30, 2019, Using | Fair Value Measurements at September 30, 2020, Using |
(In millions) | Total | | Quoted Prices in Active Markets for Identical Assets or Liabilities (Level 1) | | Significant Other Observable Inputs (Level 2) | | Significant Unobservable Inputs (Level 3) | Total | | Quoted Prices in Active Markets for Identical Assets or Liabilities (Level 1) | | Significant Other Observable Inputs (Level 2) | | Significant Unobservable Inputs (Level 3) |
| Assets | | | | | | | | |
| Currency derivatives | $ | 11.7 |
| | $ | — |
| | $ | 11.7 |
| | $ | — |
| |
| Variable-to-fixed cross-currency swaps | 10.5 |
| | — |
| | 10.5 |
| | — |
| |
| Total Assets | $ | 22.2 |
| | $ | — |
| | $ | 22.2 |
| | $ | — |
| |
| Liabilities | | | | | | | | | | | | | | |
| Currency derivatives | $ | 0.3 |
| | $ | — |
| | $ | 0.3 |
| | $ | — |
| $ | 7.0 |
| | $ | 0 |
| | $ | 7.0 |
| | $ | 0 |
|
| Interest rate derivatives | 4.1 |
| | — |
| | 4.1 |
| | — |
| 6.0 |
| | 0 |
| | 6.0 |
| | $ | 0 |
|
| Variable-to-fixed cross-currency derivatives | | 19.9 |
| | 0 |
| | 19.9 |
| | 0 |
|
| Total Liabilities | $ | 4.4 |
| | $ | — |
| | $ | 4.4 |
| | $ | — |
| $ | 32.9 |
| | $ | 0 |
| | $ | 32.9 |
| | $ | 0 |
|
|
| | | | | | | | | | | | | | | |
| | Fair Value Measurements at December 31, 2019, Using |
(In millions) | Total | | Quoted Prices in Active Markets for Identical Assets or Liabilities (Level 1) | | Significant Other Observable Inputs (Level 2) | | Significant Unobservable Inputs (Level 3) |
| Assets | | | | | | | |
| Currency derivatives | $ | 6.1 |
| | $ | 0 |
| | $ | 6.1 |
| | $ | 0 |
|
| Variable-to-fixed cross-currency derivatives | 3.4 |
| | 0 |
| | 3.4 |
| | 0 |
|
| Total Assets | $ | 9.5 |
| | $ | 0 |
| | $ | 9.5 |
| | $ | 0 |
|
| Liabilities | | | | | | | |
| Currency derivatives | $ | 0.9 |
| | $ | 0 |
| | $ | 0.9 |
| | $ | 0 |
|
| Interest rate derivatives | 3.4 |
| | 0 |
| | 3.4 |
| | 0 |
|
| Total Liabilities | $ | 4.3 |
| | $ | 0 |
| | $ | 4.3 |
| | $ | 0 |
|
Notes to Consolidated Financial Statements (Continued)
4. Fair Value Measurements and Risk (Continued)
|
| | | | | | | | | | | | | | | |
| | Fair Value Measurements at December 31, 2018, Using |
(In millions) | Total | | Quoted Prices in Active Markets for Identical Assets or Liabilities (Level 1) | | Significant Other Observable Inputs (Level 2) | | Significant Unobservable Inputs (Level 3) |
| Assets | | | | | | | |
| Currency derivatives | $ | 3.7 |
| | $ | — |
| | $ | 3.7 |
| | $ | — |
|
| Total Assets | $ | 3.7 |
| | $ | — |
| | $ | 3.7 |
| | $ | — |
|
| Liabilities | | | | | | | |
| Currency derivatives | $ | 10.5 |
| | $ | — |
| | $ | 10.5 |
| | $ | — |
|
| Interest rate derivatives | 0.8 |
| | — |
| | 0.8 |
| | — |
|
| Variable-to-fixed cross-currency swaps | 3.6 |
| | — |
| | 3.6 |
| | — |
|
| Total Liabilities | $ | 14.9 |
| | $ | — |
| | $ | 14.9 |
| | $ | — |
|
The following tables present the location and fair values of derivative instruments included in the Consolidated Balance Sheets as of September 30, 20192020, and December 31, 20182019:
| | September 30, 2019
(In millions) | Asset Derivatives | | Liability Derivatives | |
Balance Sheet Location | | Fair Value | | Balance Sheet Location | | Fair Value | |
September 30, 2020
(In millions) | | Asset Derivatives | | Liability Derivatives |
| Balance Sheet Location | | Fair Value | | Balance Sheet Location | | Fair Value |
| Derivatives designated as hedging instruments under ASC 815: | | | | | | | | | | | | | | |
| Currency contracts | Other current assets | | $ | 5.4 |
| | Other current liabilities | | $ | — |
| Other current assets | | $ | 0 |
| | Other current assets | | $ | (1.4 | ) |
| Currency contracts | Other assets | | 6.3 |
| | Other liabilities | | — |
| Other assets | | 0 |
| | Other liabilities | | 7.3 |
|
| Interest rate contracts | Other current assets | | — |
| | Other current liabilities | | 1.0 |
| Other current assets | | 0 |
| | Other current liabilities | | 2.5 |
|
| Interest rate contracts | Other assets | | — |
| | Other liabilities | | 3.1 |
| Other assets | | 0 |
| | Other liabilities | | 3.5 |
|
| Variable-to-fixed cross-currency swaps | Other current assets | | 10.9 |
| | Other current liabilities | | — |
| Other current assets | | 0 |
| | Other current assets | | (0.8 | ) |
| Variable-to-fixed cross-currency swaps | Other liabilities | | (0.4 | ) | | Other liabilities | | — |
| Other assets | | 0 |
| | Other liabilities | | 20.7 |
|
| Derivatives not designated as hedging instruments under ASC 815: | | | | | | | | | | | | | | |
| Currency contracts | Other current assets | | — |
| | Other current assets | | (0.2 | ) | Other current assets | | 0 |
| | Other current liabilities | | 1.1 |
|
| Currency contracts | Other current assets | | — |
| | Other current liabilities | | 0.5 |
| |
| Total derivatives | | | $ | 22.2 |
| | | | $ | 4.4 |
| | | $ | 0 |
| | | | $ | 32.9 |
|
|
| | | | | | | | | | | |
December 31, 2019
(In millions) | Asset Derivatives | | Liability Derivatives |
Balance Sheet Location | | Fair Value | | Balance Sheet Location | | Fair Value |
| Derivatives designated as hedging instruments under ASC 815: | | | | | | | |
| Currency contracts | Other current assets | | $ | 2.1 |
| | Other current assets | | $ | (3.1 | ) |
| Currency contracts | Other assets | | 4.0 |
| | Other liabilities | | 4.0 |
|
| Interest rate contracts | Other current assets | | 0 |
| | Other current liabilities | | 1.0 |
|
| Interest rate contracts | Other assets | | 0 |
| | Other liabilities | | 2.4 |
|
| Variable-to-fixed cross-currency swaps | Other current assets | | 10.2 |
| | Other current liabilities | | 0 |
|
| Variable-to-fixed cross-currency swaps | Other liabilities | | (6.8 | ) | | Other liabilities | | 0 |
|
| Derivatives not designated as hedging instruments under ASC 815: | | | | | | | |
| Currency contracts | Other current assets | | 0 |
| | Other current assets | | (0.2 | ) |
| Currency contracts | Other current assets | | 0 |
| | Other current liabilities | | 0.2 |
|
| Total derivatives | | | $ | 9.5 |
| | | | $ | 4.3 |
|
Notes to Consolidated Financial Statements (Continued)
4. Fair Value Measurements and Risk (Continued)
|
| | | | | | | | | | | |
December 31, 2018
(In millions) | Asset Derivatives | | Liability Derivatives |
Balance Sheet Location | | Fair Value | | Balance Sheet Location | | Fair Value |
| Derivatives designated as hedging instruments under ASC 815: | | | | | | | |
| Currency contracts | Other current assets | | $ | 2.4 |
| | Other current assets | | $ | (2.9 | ) |
| Currency contracts | Other assets | | 1.3 |
| | Other liabilities | | 12.9 |
|
| Interest rate contracts | Other current assets | | — |
| | Other current liabilities | | 0.1 |
|
| Interest rate contracts | Other assets | | — |
| | Other liabilities | | 0.7 |
|
| Variable-to-fixed cross-currency swaps | Other current assets | | — |
| | Other current assets | | (15.4 | ) |
| Variable-to-fixed cross-currency swaps | Other assets | | — |
| | Other liabilities | | 19.0 |
|
| Derivatives not designated as hedging instruments under ASC 815: | | | | | | | |
| Currency contracts | Other current assets | | — |
| | Other current assets | | (0.1 | ) |
| Currency contracts | Other current assets | | — |
| | Other current liabilities | | 0.6 |
|
| Total derivatives | | | $ | 3.7 |
| | | | $ | 14.9 |
|
The following tables present the location and amount of gains and losses on derivative instruments included in the Consolidated Statements of Operations or, when applicable, gains and losses initially recognized in other comprehensive income (loss) (“OCI”) for the three and nine months ended September 30, 20192020 and 20182019:
|
| | | | | | | | | |
Three Months Ended September 30, 2020
(In millions) | Amount of Gain (Loss) Recognized in OCI on Derivatives | | Location of Gain (Loss) Reclassified from Accumulated OCI into Income | | Amount of Gain (Loss) Reclassified from OCI into Income |
| Derivatives in ASC 815 cash flow hedging relationships: | | | | |
| Interest rate contracts | $ | (0.3 | ) | | Interest expense | | $ | (0.6 | ) |
| Variable-to-fixed cross-currency swaps | 1.4 |
| | Interest expense | | (0.1 | ) |
| Variable-to-fixed cross-currency swaps | (22.0 | ) | | Other expense | | (22.0 | ) |
| Total derivatives | $ | (20.9 | ) | | | | $ | (22.7 | ) |
| | | | | | |
| | | Location of Gain (Loss) Recognized in Income on Derivatives | | Amount of Gain (Loss) Recognized in Income on Derivatives |
| Derivatives not designated as hedging instruments under ASC 815: | | | | |
| Currency contracts | | Other expense | | $ | (1.4 | ) |
|
| | | | | | | | | |
Nine Months Ended September 30, 2020
(In millions) | Amount of Gain (Loss) Recognized in OCI on Derivatives | | Location of Gain (Loss) Reclassified from Accumulated OCI into Income | | Amount of Gain (Loss) Reclassified from OCI into Income |
| Derivatives in ASC 815 cash flow hedging relationships: | | | | |
| Interest rate contracts | $ | (3.8 | ) | | Interest expense | | $ | (1.2 | ) |
| Currency contracts(1) | 2.7 |
| | Other expense | | 3.2 |
|
| Variable-to-fixed cross-currency swaps | 7.1 |
| | Interest expense | | 4.2 |
|
| Variable-to-fixed cross-currency swaps | (24.6 | ) | | Other expense | | (24.6 | ) |
| Total derivatives | $ | (18.6 | ) | | | | $ | (18.4 | ) |
| | | | | | |
| | | Location of Gain (Loss) Recognized in Income on Derivatives | | Amount of Gain (Loss) Recognized in Income on Derivatives |
| Derivatives not designated as hedging instruments under ASC 815: | | | | |
| Currency contracts | | Other expense | | $ | (2.2 | ) |
| |
| (1) | Amount of gain (loss) recognized in OCI includes $(0.6) million excluded from the assessment of effectiveness for which the difference between changes in fair value and periodic amortization is recorded in OCI. |
Notes to Consolidated Financial Statements (Continued)
4. Fair Value Measurements and Risk (Continued)
|
| | | | | | | | | |
Three Months Ended September 30, 2019
(In millions) | Amount of Gain (Loss) Recognized in OCI on Derivatives | | Location of Gain (Loss) Reclassified from Accumulated OCI into Income | | Amount of Gain (Loss) Reclassified from OCI into Income |
| Derivatives in ASC 815 cash flow hedging relationships: | | | | |
| Interest rate contracts | $ | (0.5 | ) | | Interest expense | | $ | (0.2 | ) |
| Currency contracts(1) | 3.8 |
| | Other expense | | 3.8 |
|
| Variable-to-fixed cross-currency swaps | 2.5 |
| | Interest expense | | 3.2 |
|
| Variable-to-fixed cross-currency swaps | 22.3 |
| | Other expense | | 22.3 |
|
| Total derivatives | $ | 28.1 |
| | | | $ | 29.1 |
|
| | | | | | |
| | | Location of Gain (Loss) Recognized in Income on Derivatives | | Amount of Gain (Loss) Recognized in Income on Derivatives |
| Derivatives not designated as hedging instruments under ASC 815: | | | | |
| Currency contracts | | Other expense | | $ | (1.2 | ) |
| |
| (1) | Amount of gain (loss) recognized in OCI includes $0.7 million excluded from the assessment of effectiveness for which the difference between changes in fair value and periodic amortization is recorded in OCI. |
Notes to Consolidated Financial Statements (Continued)
4. Fair Value Measurements and Risk (Continued)
|
| | | | | | | | | |
Three Months Ended September 30, 2018
(In millions) | Amount of Gain (Loss) Recognized in OCI on Derivatives | | Location of Gain (Loss) Reclassified from Accumulated OCI into Income | | Amount of Gain (Loss) Reclassified from OCI into Income |
| Derivatives in ASC 815 cash flow hedging relationships: | | | | |
| Interest rate contracts | $ | 0.8 |
| | Interest expense | | $ | 0.1 |
|
| Currency contracts(1) | (0.6 | ) | | Other expense | | (0.6 | ) |
| Variable-to-fixed cross-currency swaps | 3.3 |
| | Interest expense | | 3.3 |
|
| Variable-to-fixed cross-currency swaps | (4.1 | ) | | Other expense | | (6.1 | ) |
| Total derivatives | $ | (0.6 | ) | | | | $ | (3.3 | ) |
| | | | | | |
| | | Location of Gain (Loss) Recognized in Income on Derivatives | | Amount of Gain (Loss) Recognized in Income on Derivatives |
| Derivatives not designated as hedging instruments under ASC 815: | | | | |
| Currency contracts | | Other expense | | $ | (0.2 | ) |
| |
(1) | Amount of gain (loss) recognized in OCI includes $0.7 million excluded from the assessment of effectiveness for which the difference between changes in fair value and periodic amortization is recorded in OCI. |
|
| | | | | | | | | |
Nine Months Ended September 30, 2019
(In millions) | Amount of Gain (Loss) Recognized in OCI on Derivatives | | Location of Gain (Loss) Reclassified from Accumulated OCI into Income | | Amount of Gain (Loss) Reclassified from OCI into Income |
| Derivatives in ASC 815 cash flow hedging relationships: | | | | |
| Interest rate contracts | $ | (3.4 | ) | | Interest expense | | $ | (0.2 | ) |
| Currency contracts(1) | 4.6 |
| | Other expense | | 3.8 |
|
| Variable-to-fixed cross-currency swaps | 0.4 |
| | Interest expense | | 10.4 |
|
| Variable-to-fixed cross-currency swaps | 25.3 |
| | Other expense | | 25.3 |
|
| Total derivatives | $ | 26.9 |
| | | | $ | 39.3 |
|
| | | | | | |
| | | Location of Gain (Loss) Recognized in Income on Derivatives | | Amount of Gain (Loss) Recognized in Income on Derivatives |
| Derivatives not designated as hedging instruments under ASC 815: | | | | |
| Currency contracts | | Other expense | | $ | (1.1 | ) |
| |
| (1) | Amount of gain (loss) recognized in OCI includes $2.1 million excluded from the assessment of effectiveness for which the difference between changes in fair value and periodic amortization is recorded in OCI. |
Notes to Consolidated Financial Statements (Continued)
4. Fair Value Measurements and Risk (Continued)
|
| | | | | | | | | |
Nine Months Ended September 30, 2018
(In millions) | Amount of Gain (Loss) Recognized in OCI on Derivatives | | Location of Gain (Loss) Reclassified from Accumulated OCI into Income | | Amount of Gain (Loss) Reclassified from OCI into Income |
| Derivatives in ASC 815 cash flow hedging relationships: | | | | |
| Interest rate contracts | $ | 2.8 |
| | Interest expense | | $ | — |
|
| Currency contracts(1) | 2.5 |
| | Other expense | | 2.9 |
|
| Variable-to-fixed cross-currency swaps | 6.4 |
| | Interest expense | | 6.4 |
|
| Variable-to-fixed cross-currency swaps | 17.3 |
| | Other expense | | 23.2 |
|
| Total derivatives | $ | 29.0 |
| | | | $ | 32.5 |
|
| | | | | | |
| | | Location of Gain (Loss) Recognized in Income on Derivatives | | Amount of Gain (Loss) Recognized in Income on Derivatives |
| Derivatives not designated as hedging instruments under ASC 815: | | | | |
| Currency contracts | | Other expense | | $ | (2.9 | ) |
| |
(1) | Amount of gain (loss) recognized in OCI includes $1.1 million excluded from the assessment of effectiveness for which the difference between changes in fair value and periodic amortization is recorded in OCI. |
The following tables present the total amounts of income and expense line items presented in the Consolidated Statements of Operations in which the effects of cash flow hedges are reported.
| | | | Three Months Ended September 30, | Three Months Ended September 30, |
| | 2019 | | 2018 | 2020 | | 2019 |
| (In millions) | Interest expense | | Other income (expense) | | Interest expense | | Other income (expense) | Interest expense | | Other income (expense) | | Interest expense | | Other income (expense) |
| Total amounts of income and expense line items in the Consolidated Statements of Operations in which the effects of cash flow hedges are recorded | $ | (18.6 | ) | | $ | 1.1 |
| | $ | (20.4 | ) | | $ | 2.3 |
| $ | (19.8 | ) | | $ | (5.3 | ) | | $ | (18.6 | ) | | $ | 1.1 |
|
| Gain (loss) on cash flow hedging relationships in ASC 815 | | | | | | | | | | | | | | |
| Interest rate contracts | | | | | | | | | | | | | | |
| Amount of gain (loss) reclassified from accumulated OCI into income | $ | (0.2 | ) | | $ | — |
| | $ | 0.1 |
| | $ | — |
| |
| Gain (loss) reclassified from accumulated OCI into income | | $ | (0.6 | ) | | $ | 0 |
| | $ | (0.2 | ) | | $ | 0 |
|
| Variable-to-fixed cross-currency swaps | | | | | | | | | | | | | | |
| Amount of gain (loss) reclassified from accumulated OCI into income | 3.2 |
| | 22.3 |
| | 3.3 |
| | (6.1 | ) | |
| Gain (loss) reclassified from accumulated OCI into income | | (0.1 | ) | | (22.0 | ) | | 3.2 |
| | 22.3 |
|
| Currency contracts | | | | | | | | | | | | | | |
| Amount of gain (loss) reclassified from accumulated OCI into income | — |
| | 3.8 |
| | — |
| | (0.6 | ) | |
| Gain (loss) reclassified from accumulated OCI into income | | 0 |
| | 0 |
| | 0 |
| | 3.8 |
|
| Amount excluded from effectiveness testing recognized in earnings based on amortization approach (included in above) | — |
| | 0.7 |
| | — |
| | 0.6 |
| 0 |
| | 0 |
| | 0 |
| | 0.7 |
|
Notes to Consolidated Financial Statements (Continued)
4. Fair Value Measurements and Risk (Continued)
| | | | Nine Months Ended September 30, | Nine Months Ended September 30, |
| | 2019 | | 2018 | 2020 | | 2019 |
| (In millions) | Interest expense | | Other income (expense) | | Interest expense | | Other income (expense) | Interest expense | | Other income (expense) | | Interest expense | | Other income (expense) |
| Total amounts of income and expense line items in the Consolidated Statements of Operations in which the effects of cash flow hedges are recorded | $ | (58.2 | ) | | $ | 3.2 |
| | $ | (59.6 | ) | | $ | (0.3 | ) | $ | (57.3 | ) | | $ | 12.1 |
| | $ | (58.2 | ) | | $ | 3.2 |
|
| Gain (loss) on cash flow hedging relationships in ASC 815 | | | | | | | | | | | | | | |
| Interest rate contracts | | | | | | | | | | | | | | |
| Amount of gain (loss) reclassified from accumulated OCI into income | $ | (0.2 | ) | | $ | — |
| | $ | — |
| | $ | — |
| |
| Gain (loss) reclassified from accumulated OCI into income | | $ | (1.2 | ) | | $ | 0 |
| | $ | (0.2 | ) | | $ | 0 |
|
| Variable-to-fixed cross-currency swaps | | | | | | | | | | | | | | |
| Amount of gain (loss) reclassified from accumulated OCI into income | 10.4 |
| | 25.3 |
| | 6.4 |
| | 23.2 |
| |
| Gain (loss) reclassified from accumulated OCI into income | | 4.2 |
| | (24.6 | ) | | 10.4 |
| | 25.3 |
|
| Currency contracts | | | | | | | | | | | | | | |
| Amount of gain (loss) reclassified from accumulated OCI into income | — |
| | 3.8 |
| | — |
| | 2.9 |
| |
| Gain (loss) reclassified from accumulated OCI into income | | 0 |
| | 3.2 |
| | 0 |
| | 3.8 |
|
| Amount excluded from effectiveness testing recognized in earnings based on amortization approach (included in above) | — |
| | 2.1 |
| | — |
| | 2.3 |
| 0 |
| | 1.1 |
| | 0 |
| | 2.1 |
|
Net Investment Hedges Grace uses cross-currency swaps as derivative hedging instruments in certain net investment hedges of its non-U.S. subsidiaries. The gains and losses attributable to these net investment hedges, adjusted for the impact of excluded components, are recorded net of tax to “currency translation adjustments” within “accumulated other comprehensive income (loss)” to offset the change in the carrying value of the net investment being hedged. Recognition in earnings of amounts previously recorded to “currency translation adjustments” is limited to circumstances such as complete or substantially complete liquidation of the net investment in the hedged foreign operation. Changes in the fair value of the hedging instrument related to time value, which are excluded from the assessment of hedge effectiveness, are recorded directly to interest expense on a systematic basis. These gains were $0.9$0.6 million and $2.5$2.3 million for the three and nine months ended September 30, 2019,2020, and $0.7$0.9 million and $1.5$2.5 million for the corresponding prior-year periods. At September 30, 2019,2020, the notional amount of €170.0 million of Grace’s cross-currency swaps was designated as a hedging instrument of its net investment in its European subsidiaries.
Grace has also used foreign currency-denominated debt and deferred intercompany royalties as non-derivative hedging instruments in certain net investment hedges. As of September 30, 2019, Grace’s deferred intercompany royalties have been fully amortized and de-designated as a hedging instrument of its net investment in its European subsidiaries. In April 2018, in connection with the Credit Agreement, Grace de-designated and repaid its euro-denominated term loan principal that had been designated as a hedge of its net investment in its European subsidiaries.
The following table presents the amount of gains and losses on derivative and non-derivative instruments designated as net investment hedges, recorded to “currency translation adjustments” within “accumulated other comprehensive income (loss)” for the three and nine months ended September 30, 2019 and 2018. There were 0 reclassifications of the effective portion of net investment hedges out of OCI and into earnings for the periods presented.18
Notes to Consolidated Financial Statements (Continued)
4. Fair Value Measurements and Risk (Continued)
The following table presents the amount of gains and losses on derivative instruments designated as net investment hedges, recorded to “currency translation adjustments” within “accumulated other comprehensive income (loss)” for the three and nine months ended September 30, 2020 and 2019. There were 0 reclassifications of the effective portion of net investment hedges out of OCI and into earnings for the periods presented.
|
| | | | | | | | | | | | | | | |
| | Three Months Ended September 30, | | Nine Months Ended September 30, |
| (In millions) | 2019 |
| 2018 | | 2019 | | 2018 |
| Derivatives in ASC 815 net investment hedging relationships: | | | | | | | |
| Cross-currency swaps | $ | 8.1 |
| | $ | (2.9 | ) | | $ | 12.4 |
| | $ | (0.9 | ) |
| Non-derivatives in ASC 815 net investment hedging relationships: | | | | | | |
|
| Foreign currency denominated debt | $ | — |
| | $ | — |
| | $ | — |
| | $ | (4.4 | ) |
| Foreign currency denominated deferred intercompany royalties | — |
| | (0.2 | ) | | 0.1 |
| | — |
|
| | $ | — |
| | $ | (0.2 | ) | | $ | 0.1 |
| | $ | (4.4 | ) |
|
| | | | | | | | | | | | | | | |
| | Three Months Ended September 30, | | Nine Months Ended September 30, |
| (In millions) | 2020 |
| 2019 | | 2020 | | 2019 |
| Derivatives in ASC 815 net investment hedging relationships: | | | | | | | |
| Cross-currency swap | $ | (8.1 | ) | | $ | 8.1 |
| | $ | (5.7 | ) | | $ | 12.4 |
|
Credit Risk Grace is exposed to credit risk in its trade accounts receivable. Grace’s credit evaluation policies mitigate credit risk exposures, and it has a history of minimal credit losses. Grace does not generally require collateral for its trade accounts receivable, but may require a bank letter of credit in certain instances, particularly when selling to customers in cash-restricted countries.
Grace may also be exposed to credit risk in its derivatives contracts. Grace monitors counterparty credit risk and currently does not anticipate nonperformance by counterparties to its derivatives. Grace’s derivative contracts are with internationally recognized commercial financial institutions.
5. Income Taxes
Grace’s effective tax rates for the nine months ended September 30, 2020 and 2019, were (26.0)% and 2018, were 26.9% and 34.0%, respectively.
Grace’s effective tax rate for the nine months ended September 30, 2020, was negative primarily due to the net benefit of the Global Intangible Low-Taxed Income (“GILTI”) High-Tax Exclusion (“HTE”) in the U.S. and was partially offset by income taxed in jurisdictions with higher statutory tax rates than the U.S., recognition of certain state valuation allowances, and the expiration of unexercised stock options, as well as the impact of a write-off of previously capitalized engineering and site costs.
On July 20, 2020, the U.S. Treasury Department released final regulations related to the GILTI HTE. Grace has recognized a benefit in the three and nine months ended September 30, 2020, associated with the GILTI HTE regulations that resulted in a retroactive tax benefit related to 2018 and 2019 of approximately $23 million.
Grace’s effective tax rate for the nine months ended September 30, 2019, differed fromwas higher than the U.S. federal statutory rate primarily due to income taxed in jurisdictions with higher statutory tax rates than the U.S. and the net impact of the Global Intangible Low-Taxed Income (“GILTI”)GILTI tax in the U.S., partially offset by discrete benefits related to changes in tax law and to the favorable resolution of uncertain tax positions, and adjustments to our tax provision related to the filing of the 2018 U.S. federal income tax return. Grace’s effective tax rate for the nine months ended September 30, 2018, was higher than the U.S. federal statutory rate primarily due to the use of net operating loss carryforwards, which limited specific deductions that would have otherwise reduced the GILTI tax. In 2019, Grace is forecasting U.S. federal taxable income in excess of available net operating losses, which will increase the deductions available to reduce the GILTI tax.positions.
As of September 30, 2020, and December 31, 2019, Grace has $296.5had $315.5 million and $302.5 million, respectively, in federal tax credit carryforwards before unrecognized tax benefits.
Notes to Consolidated Financial Statements (Continued)
6. Pension Plans and Other Retirement Plans
Pension Plans The following table presents the funded status of Grace’s pension plans:
| | | (In millions) | September 30,
2019 | | December 31,
2018 | September 30,
2020 | | December 31,
2019 |
| Overfunded defined benefit pension plans | $ | 6.4 |
| | $ | 5.7 |
| $ | 9.5 |
| | $ | 8.5 |
|
| Underfunded defined benefit pension plans | (68.4 | ) | | (67.1 | ) | (83.1 | ) | | (85.2 | ) |
| Unfunded defined benefit pension plans | (355.9 | ) | | (366.0 | ) | (449.4 | ) | | (434.6 | ) |
| Total underfunded and unfunded defined benefit pension plans | (424.3 | ) | | (433.1 | ) | (532.5 | ) | | (519.8 | ) |
| Pension liabilities included in other current liabilities | (14.3 | ) | | (14.7 | ) | (15.1 | ) | | (14.8 | ) |
| Net funded status | $ | (432.2 | ) | | $ | (442.1 | ) | $ | (538.1 | ) | | $ | (526.1 | ) |
Fully-funded plans include several advance-funded plans where the fair value of the plan assets exceeds the projected benefit obligation (“PBO”). Underfunded plans include a group of advance-funded plans that are underfunded on a PBO basis. Unfunded plans include several plans that are funded on a pay-as-you-go basis, and therefore, the entire PBO is unfunded.
Notes to Consolidated Financial Statements (Continued)
6. Pension Plans and Other Retirement Plans (Continued)
The following tables present the components of net periodic benefit cost (income).
| | | | Three Months Ended September 30, | Three Months Ended September 30, |
| | 2019 | | 2018 | 2020 | | 2019 |
| (In millions) | U.S. | | Non-U.S. | | U.S. | | Non-U.S. | U.S. | | Non-U.S. | | U.S. | | Non-U.S. |
| Service cost | $ | 3.9 |
| | $ | 2.2 |
| | $ | 4.9 |
| | $ | 2.3 |
| $ | 4.8 |
| | $ | 2.8 |
| | $ | 3.9 |
| | $ | 2.2 |
|
| Interest cost | 9.6 |
| | 1.4 |
| | 10.3 |
| | 1.3 |
| 7.5 |
| | 1.1 |
| | 9.6 |
| | 1.4 |
|
| Expected return on plan assets | (12.1 | ) | | (0.3 | ) | | (14.5 | ) | | (0.3 | ) | (12.1 | ) | | (0.3 | ) | | (12.1 | ) | | (0.3 | ) |
| Amortization of prior service credit | (0.2 | ) | | — |
| | (0.2 | ) | | — |
| (0.2 | ) | | 0 |
| | (0.2 | ) | | 0 |
|
| Net periodic benefit cost (income) | $ | 1.2 |
| | $ | 3.3 |
| | $ | 0.5 |
| | $ | 3.3 |
| $ | 0 |
| | $ | 3.6 |
| | $ | 1.2 |
| | $ | 3.3 |
|
| | | | Nine Months Ended September 30, | Nine Months Ended September 30, |
| | 2019 | | 2018 | 2020 | | 2019 |
| (In millions) | U.S. | | Non-U.S. | | U.S. | | Non-U.S. | U.S. | | Non-U.S. | | U.S. | | Non-U.S. |
| Service cost | $ | 11.8 |
| | $ | 6.5 |
| | $ | 14.6 |
| | $ | 7.2 |
| $ | 14.2 |
| | $ | 8.2 |
| | $ | 11.8 |
| | $ | 6.5 |
|
| Interest cost | 28.7 |
| | 4.1 |
| | 30.9 |
| | 3.8 |
| 22.6 |
| | 3.1 |
| | 28.7 |
| | 4.1 |
|
| Expected return on plan assets | (36.2 | ) | | (0.7 | ) | | (43.6 | ) | | (0.8 | ) | (36.2 | ) | | (0.8 | ) | | (36.2 | ) | | (0.7 | ) |
| Amortization of prior service credit | (0.5 | ) | | — |
| | (0.5 | ) | | — |
| (0.5 | ) | | 0 |
| | (0.5 | ) | | 0 |
|
| Net periodic benefit cost (income) | $ | 3.8 |
| | $ | 9.9 |
| | $ | 1.4 |
| | $ | 10.2 |
| $ | 0.1 |
| | $ | 10.5 |
| | $ | 3.8 |
| | $ | 9.9 |
|
Plan Contributions and Funding Grace intends to continue to satisfy its funding obligations under the U.S. qualified pension plans and to comply with all of the requirements of the Employee Retirement Income Security Act of 1974 (“ERISA”). For ERISA purposes, funded status is calculated on a different basis than under U.S. GAAP.
Grace intends to continue to fund non-U.S. pension plans based on applicable legal requirements and actuarial recommendations.
Defined Contribution Retirement PlanPlans Grace sponsors a defined contribution retirement plan for its employees in the United States. This plan is qualified under section 401(k) of the U.S. tax code. Currently, Grace contributes an amount equal to 100% of employee contributions, up to 6% of an individual employee’s salary or wages. Grace’s cost related to this benefit plan for the three and nine months ended September 30, 2019,2020, was
Notes to Consolidated Financial Statements (Continued)
6. Pension Plans and Other Retirement Plans (Continued)
$3.7 million and $10.6 million compared with $3.5 million and $10.4 million compared with $3.3 million and $9.4 million for the corresponding prior-year periods.
The U.S. salaried pension plan was closed to new entrants after January 1, 2017. U.S. salaried employees and certain U.S. hourly employees hired on or after January 1, 2017, and employees in Germany hired on or after January 1, 2016, will participate in enhanced defined contribution plans instead of defined benefit pension plans. For the U.S. plan, Grace contributes 4% of an individual employee’s salary or wages. For the German plan, contributions vary based on the individual employee’s contributions and other factors. Grace’s cost related to these enhanced defined contribution plans established in the U.S. and Germany for the three and nine months ended September 30, 2020, was $1.0 million and $3.1 million compared with $0.8 million and $2.3 million for the corresponding prior-year periods.
7. Other Balance Sheet Accounts
| | | (In millions) | September 30,
2019 | | December 31,
2018 | September 30,
2020 | | December 31,
2019 |
| Other Current Assets | | | | | | |
| Non-trade accounts receivable | | $ | 29.9 |
| | $ | 24.1 |
|
| Income taxes receivable | | 5.8 |
| | 4.2 |
|
| Fair value of currency, interest rate, and commodity contracts (see Note 4) | | 2.9 |
| | 15.6 |
|
| Plant under construction—unconsolidated affiliate (see Note 15) | $ | 158.1 |
| | $ | — |
| 0 |
| | 173.9 |
|
| Non-trade accounts receivable | 30.7 |
| | 37.9 |
| |
| Fair value of currency, interest rate, and commodity contracts (see Note 4) | 16.5 |
| | 21.4 |
| |
| Income taxes receivable | 8.0 |
| | 10.1 |
| |
| Other current assets | 17.2 |
| | 17.3 |
| 30.6 |
| | 17.3 |
|
| | $ | 230.5 |
| | $ | 86.7 |
| $ | 69.2 |
| | $ | 235.1 |
|
|
| | | | | | | |
| (In millions) | September 30,
2020 | | December 31,
2019 |
| Other Current Liabilities | | | |
| Accrued compensation | $ | 56.3 |
| | $ | 53.6 |
|
| Deferred revenue (see Note 13) | 35.9 |
| | 35.0 |
|
| Liability for dam spillway replacement (see Note 8) | 20.0 |
| | 4.7 |
|
| Environmental contingencies (see Note 8) | 21.4 |
| | 17.8 |
|
| Accrued interest (see Note 3) | 18.2 |
| | 13.3 |
|
| Pension liabilities (see Note 6) | 15.1 |
| | 14.8 |
|
| Operating lease liabilities | 9.7 |
| | 9.3 |
|
| Income taxes payable (see Note 5) | 8.4 |
| | 8.6 |
|
| Liability to unconsolidated affiliate for plant under construction (see Note 15) | 0 |
| | 173.9 |
|
| Other accrued liabilities | 81.2 |
| | 88.7 |
|
| | $ | 266.2 |
| | $ | 419.7 |
|
Accrued compensation includes salaries and wages as well as estimated current amounts due under the annual and long-term incentive programs.
Notes to Consolidated Financial Statements (Continued)
7. Other Balance Sheet Accounts (Continued)
|
| | | | | | | |
| (In millions) | September 30,
2019 | | December 31,
2018 |
| Other Current Liabilities | | | |
| Liability to unconsolidated affiliate for plant under construction (see Note 15) | $ | 158.1 |
| | $ | — |
|
| Accrued compensation | 48.7 |
| | 62.4 |
|
| Deferred revenue (see Note 13) | 36.1 |
| | 40.6 |
|
| Accrued interest (see Note 3) | 26.4 |
| | 13.3 |
|
| Environmental contingencies (see Note 8) | 18.7 |
| | 19.5 |
|
| Pension liabilities (see Note 6) | 14.3 |
| | 14.7 |
|
| Income taxes payable (see Note 5) | 13.9 |
| | 11.3 |
|
| Operating lease liabilities (see Note 1) | 9.5 |
| | — |
|
| Liability for dam spillway replacement (see Note 8) | 7.7 |
| | — |
|
| Other accrued liabilities | 82.0 |
| | 81.7 |
|
| | $ | 415.4 |
| | $ | 243.5 |
|
Accrued compensation includes salaries and wages as well as estimated current amounts due under the annual and long-term incentive programs.
| | | (In millions) | September 30,
2019 | | December 31,
2018 | September 30,
2020 | | December 31,
2019 |
| Other Liabilities | | | | | | |
| Environmental contingencies (see Note 8) | $ | 99.5 |
| | $ | 106.9 |
| $ | 89.3 |
| | $ | 97.5 |
|
| Liability for dam spillway replacement (see Note 8) | 36.8 |
| | — |
| 69.9 |
| | 61.7 |
|
| Fair value of currency and interest rate contracts (see Note 4) | | 31.5 |
| | 13.2 |
|
| Operating lease liabilities | | 25.5 |
| | 26.2 |
|
| Legacy product liability (see Note 8) | | 24.0 |
| | 24.0 |
|
| Deferred revenue (see Note 13) | 28.8 |
| | 29.2 |
| 21.9 |
| | 29.5 |
|
| Operating lease liabilities (see Note 1) | 22.7 |
| | — |
| |
| Retained obligations of divested businesses | 13.0 |
| | 10.0 |
| 12.4 |
| | 12.7 |
|
| Asset retirement obligation | 9.3 |
| | 8.8 |
| |
| Asset retirement obligations | | 9.5 |
| | 9.4 |
|
| Deferred income taxes | 6.8 |
| | 10.9 |
| 8.0 |
| | 7.5 |
|
| Postemployment liability | 4.4 |
| | 4.7 |
| |
| Fair value of currency and interest rate contracts (see Note 4) | 3.5 |
| | 32.6 |
| |
| Liability to unconsolidated affiliate for plant under construction (see Note 15) | — |
| | 98.8 |
| |
| Unrecognized tax benefits | | 3.9 |
| | 4.1 |
|
| Other noncurrent liabilities | 14.9 |
| | 17.9 |
| 20.7 |
| | 22.4 |
|
| | $ | 239.7 |
| | $ | 319.8 |
| $ | 316.6 |
| | $ | 308.2 |
|
8. Commitments and Contingent Liabilities
Legacy Matters
Over the years, Grace operated numerous types of businesses that are no longer part of its ongoing operations. As Grace divested or otherwise ceased operating these businesses, it retained certain liabilities and obligations, which Grace refers to as legacy liabilities. These liabilities include product, environmental and other liabilities. Although the outcome of each of the matters discussed below cannot be predicted with certainty, Grace has assessed its risk and has recorded estimated liabilities as required under U.S. GAAP.
Legacy Product Liabilities Grace emerged from an asbestos-related Chapter 11 bankruptcy on February 3, 2014 (the “Effective Date”). Under its plan of reorganization, all pending and future asbestos-related claims are channeled for resolution to either a personal injury trust (the “PI Trust”) or a property damage trust (the “PD Trust”). The trusts are the sole recourse for holders of asbestos-related claims. The channeling injunctions issued
Notes to Consolidated Financial Statements (Continued)
8. Commitments and Contingent Liabilities (Continued)
by the bankruptcy court prohibit holders of asbestos-related claims from asserting such claims directly against Grace.
Grace has satisfied all of its financial obligations to the PI Trust. Grace has contingent financial obligations remaining to the PD Trust. With respect to property damage claims related to Grace’s former Zonolite attic insulation product installed in the U.S. (“ZAI PD Claims”), the PD Trust was funded with $34.4$49.4 million on the Effective Date(net of $15 million of attorneys’ fees) to pay claims and $30.0 million on February 3, 2017.expenses. Grace is also obligated to make up to 10 contingent deferred payments of $8 million per year to the PD Trust in respect of ZAI PD Claims during the 20-year period beginning on the fifth anniversary of the Effective Date, with each such payment due only if the assets of the PD Trust in respect of ZAI PD Claims fall below $10 million during the preceding year. TheAs of September 30, 2020, the PD Trust balance washas paid out approximately $30$36 million as of December 31, 2018. Grace expectsin ZAI PD Claims paymentsand expenses, leaving a balance of approximately $19 million, including the benefit of net investment gains.
Due to decline over time but hasthe limited informationclaims history, the unique nature of this product, and the uncertainty of future claims patterns, an actuarial analysis was completed to estimate the amountrange of possible future payments. The analysis was conducted by a third-party actuarial firm directed by Grace and timingusing historical claims data provided by the ZAI trustee. Certain key assumptions employed in the analysis were (1) projections of the future number of filed claims, assuming a percentage increase in claims during earlier years and annual decreases in later years; (2) application of historical percentages of claims closed with indemnity payment compared to total closed claims, applied on a regional basis; and (3) application of the average claim payout, which reflects the average indemnity cost per claim closing with payment. As a result of the analysis and taking into account the relative uncertainty of future claims payments. It isactivity, Grace determined that contingent funding obligations beyond 2024 are not reasonably possible that one or more contingent deferred payments will be made in the future.
Notes to Consolidated Financial Statements (Continued)
8. Commitments and Contingent Liabilities (Continued)
estimable. Grace estimates that the present valuereasonable range of reasonably possiblepayments over the period of 2020 to 2024 is expected to be between $16 million and $24 million and projects that the first payment could be due in 2022. In the 2019 fourth quarter, Grace recorded a $24.0 million liability related to probable future paymentsobligations to range between $0 million and $20 million. Grace has not accrued for any contingent deferred payments as it does not believe that payment is probable. Grace will continue to evaluate new information as it becomes available and will revise its estimate of the amount and timing of future claims payments and any contingent deferred payments at that time.
Grace is not obligated to make additional payments tofund the PD Trust in respect offor ZAI PD Claims beyondClaims. Grace’s maximum financial obligation over the payments described above. Grace has satisfied all of its financial obligations with respect to Canadian ZAI PD Claims.next 19 years is $80.0 million, and no single year’s obligation can exceed $8.0 million.
With respect to other asbestos property damage claims (“Other PD Claims”), claims unresolved as of the Effective Date are to be litigated in the bankruptcy court and any future claims are to be litigated in a federal district court, in each case pursuant to procedures approved by the bankruptcy court. To the extent any such Other PD Claims are determined to be allowed claims, they are to be paid in cash by the PD Trust. Grace is obligated to make a payment to the PD Trust every six months in the amount of any Other PD Claims allowed during the preceding six months plus interest (if applicable) and the amount of PD Trust expenses for the preceding six months (the “PD Obligation”). Grace has not paid any Other PD Claims since emergence. Annual expenses have been approximately $0.2 million per year. The aggregate amount to be paid under the PD Obligation is not capped, and Grace may be obligated to make additional payments to the PD Trust in respect of the PD Obligation. Grace has accrued for those unresolved Other PD Claims that it believes are probable and estimable. Grace has not accrued for other unresolved or unasserted Other PD Claims as it does not believe that payment is probable.
All payments to the PD Trust required after the Effective Date are secured by the Company’s obligation to issue 77,372,257 shares of Company common stock to the PD Trust in the event of default, subject to customary anti-dilution provisions.
This summary of the commitments and contingencies related to the Chapter 11 proceeding does not purport to be complete and is qualified in its entirety by reference to the plan of reorganization and the exhibits and documents related thereto, which have been filed with the Securities and Exchange Commission (the “SEC”)SEC and are readily available on the internet at www.sec.gov.
Legacy Environmental Liabilities Grace is subject to loss contingencies resulting from extensive and evolving federal, state, local and foreign environmental laws and regulations relating to its manufacturing operations. Grace has procedures in place to minimize such contingencies; nevertheless, it has liabilities associated with past operations and additional claims may arise in the future, which may be material. To address its legacy liabilities, Grace accrues for anticipated costs of response efforts where an assessment has indicated that a probable liability has been incurred and the cost can be reasonably estimated. These accruals do not take into account any discounting for the time value of money.
Grace’s environmental liabilities are reassessed regularly and adjusted when circumstances become better defined or response efforts and their costs can be better estimated, typically as a matter moves through the life-cycle of environmental investigation and remediation. These liabilities are evaluated based on currently available
Notes to Consolidated Financial Statements (Continued)
8. Commitments and Contingent Liabilities (Continued)
information relating to the nature and extent of contamination, risk assessments, feasibility of response actions, and apportionment amongst other potentially responsible parties, all evaluated in light of prior experience.
At September 30, 2019,2020, Grace’s estimated liability for legacy environmental response costs totaled $118.2$110.7 million, compared with $126.4$115.3 million at December 31, 2018,2019, and was included in “other current liabilities” and “other liabilities” in the Consolidated Balance Sheets. These amounts are based on agreements in place or on Grace’s estimate of costs where no formal remediation plan or agreement to pay exists, yet there is sufficient information to estimate response costs.
Vermiculite-Related Matters
Grace purchased a vermiculite mine in Libby, Montana, in 1963 and operated it until 1990. Vermiculite concentrate from the Libby mine was used in the manufacture of attic insulation and other products. Some of the vermiculite ore contained naturally occurring asbestos.
Grace is engaged with the U.S. Environmental Protection Agency (the “EPA”) and other federal, state, and local governmental agencies in a remedial investigation and feasibility study (“RI/FS”) of the Libby mine and the
Notes to Consolidated Financial Statements (Continued)
8. Commitments and Contingent Liabilities (Continued)
surrounding area, known as Operable Unit 3 (“OU3”). The RI/FS will determinestudy the specific areas within OU3 requiring remediation and will identify possible remedial action alternatives. Possible remedial actions within OU3 are wide-ranging, from institutional controls such as land use restrictions, to more active measures involving soil removal, containment projects, or other protective measures.
As part of the RI/FS process, Grace contracted an engineering and consulting firm to develop a range of possible remedial alternatives and associated cost estimates for OU3. Based on this work, Grace recorded a pre-tax charge of $70.0 million in the 2018 third quarter for the estimated costs of remediation of OU3. Grace believes that this amount should provide for a protective remedy meeting the statutory requirements of the Comprehensive Environmental Response, Compensation, and Liability Act.
The estimated costs of remediation are preliminary and consist of several components, each of which may vary significantly as the remedial alternatives are further developed. It is reasonably possible that the ultimate costs of remediation could range between $30 million and $170 million. Grace is working closely with the EPA, and the ultimate remedy will be determined by the EPA after the RI/FS is finalized. Such remedy will be set forth in a Record of Decision (“ROD”) that is currently expected to be issued by the EPA during 2021.in 2023. Costs associated with the more active remedial alternatives would be expected to be incurred over a decade or more. Grace will reevaluate its estimated liability as remedial alternatives evolve based on further work by the engineering and consulting firm and discussions with the EPA as the RI/FS process moves toward a ROD. Technical memoranda expected prior to the issuance of the ROD may provide insight into the likely remedial alternatives ultimately selected, allowing Grace to update its cost of remediation estimate. Depending on the remedial alternatives that the EPA selects in the ROD, the total cost of remediating OU3 may exceed Grace’s current estimate by material amounts. The amounts set forth above do not include possible liability for natural resources damage. Based on ecological studies conducted by the EPA, Grace does not believe that natural resources damage has occurred. However, if a party were to be successful in asserting a natural resources damage claim, liability related to such obligation could be material.
TheGrace has cooperated with the EPA is alsoin investigating orand remediating a number of formerly owned or operated sites that processed Libby vermiculite into finished products. Grace is cooperating with the EPA on these investigation and remediation activities and has recorded a liability to the extent that itsfor remaining expected response costs, including costs for EPA oversight and potential future site remediation, where a review has indicated that aliability is probable liability has been incurred and the cost is estimable. These liabilities cover the estimated cost of investigations and, to the extent an assessment has indicated that remediation is necessary, the estimated cost of response actions. Response actions typically involve soil excavation and removal, and replacement with clean fill. The EPA may commence additional investigations in the future at other sites that processed Libby vermiculite,vermiculite. Liability for unaccrued additional investigation and remediation costs is probable but Grace does not believe, based on its knowledge of prioryet estimable, and current operations and site conditions, that liability for remediation at such other sites is probable.could be material.
Grace’s total estimated liability for response costs that are currently estimable for OU3 and vermiculite processing sites outside of Libby at September 30, 2019,2020, and December 31, 2018, was $77.82019, totaled $72.4 million and $81.7$76.0 million, respectively. It is possible that Grace’s ultimate liability for these vermiculite-related matters will exceed current estimates by material amounts.
Notes to Consolidated Financial Statements (Continued)
8. Commitments and Contingent Liabilities (Continued)
Non-Vermiculite-Related Environmental Matters
At September 30, 2019,2020, and December 31, 2018,2019, Grace’s estimated legacy environmental liability for response costs at sites not related to its former vermiculite mining and processing activities was $40.4totaled $38.3 million and $44.7$39.3 million, respectively. This liability relates to Grace’s former businesses or operations, including its share of liability at off-site disposal facilities. Grace’s estimated liability is based upon regulatory requirements and environmental conditions at each site. As Grace receives new information, its estimated liability may change materially.
Other Legacy Liabilities On April 3, 2019,Beginning in 1971, as part of implementing a wet milling process at the Libby, Montana, Department of Natural Resources and Conservation issued a five-year operating permit forvermiculite mine, Grace constructed a dam at the Libby mine site. Grace constructed the dam in 1971 to preventproperty that now prevents vermiculite ore tailings from moving into nearby creeks and rivers. TheOngoing operation of the dam is regulated by the Montana Department of Natural Resources and Conservation (“DNRC”). In April 2019, the DNRC renewed the permit requiresnecessary for operation of the dam. Grace is legally obligated to complete construction ofoperate the dam and construct a new spillway beforein accordance with the latest permit conditions.
Notes to Consolidated Financial Statements (Continued)
8. Commitments and Contingent Liabilities (Continued)
Construction of the new dam spillway at the former mine site is further renewed in five years.a key element of Grace’s overall remediation strategy. The project includes both an upper spillway and a lower spillway that are being managed as two separate projects with different engineering design and construction timelines. In 2019, Grace contracted a third-party engineering and consulting firm to develop aan initial range of cost estimates for the total project. Based on this work, Grace recorded a pre-tax chargeliability of $45.0$68.0 million in the first quarter of 2019 for the estimated costs of the project. These costs arewere preliminary and may vary significantlysubject to change as new information becomes available, including defining the final scope of the projects through the contract bidding process. During the three months ended September 30, 2020, Grace completed a review of contractor bids for the replacement of the upper spillway. Based on a current assessment of the project progresses. Itrequirements, Grace increased its cost estimate for this portion of the project by $27.0 million, bringing the estimate for the total project to $95.0 million. Regarding the lower spillway, final engineering will be completed and submitted to the state of Montana for design approval in 2021, after which Grace will seek contract bids for this portion of the project. Grace believes it is reasonably possible that the ultimate costs of this projectthe two spillway projects could range between $25$80 million and $80$120 million. As Grace receives new information, its estimated liability may change materially. Construction of the new spillwayspillways will begin in 2021 and is expected to take three to four years.
Commercial and Financial Commitments and Contingencies
Purchase Commitments Grace uses purchase commitments to ensure supply and to minimize the volatility of major components of direct manufacturing costs including natural gas, certain metals, rare earths, and other materials. Such commitments are for quantities that Grace fully expects to use in its normal operations.
Guarantees and Indemnification Obligations Grace is a party to many contracts containing guarantees and indemnification obligations. These contracts primarily consist of:
Product warranties with respect to certain products sold to customers in the ordinary course of business. These warranties typically provide that products will conform to specifications. Grace accrues a warranty liability on a transaction-specific basis depending on the individual facts and circumstances related to each sale.
Performance guarantees offered to customers under certain licensing arrangements. Grace has not established a liability for these arrangements based on past performance.
Licenses of intellectual property by Grace to third parties in which Grace has agreed to indemnify the licensee against third party infringement claims.
Contracts providing for the sale or spin-off of a former business unit or product line in which Grace has agreed to indemnify the buyer or resulting entity against certain liabilities related to activities prior to the closing of the transaction, including environmental, tax, and employee liabilities.
GuaranteesIndemnification obligations of Grace as a tenant of real property leases; and guarantees of real property lease obligations of third parties, typically arising out of (a) leases entered into by former subsidiaries of Grace, or (b) the assignment or sublease of a lease by Grace to a third party.
Financial Assurances Financial assurances have been established for a variety of purposes, including insurance and environmental matters, trade-related commitments and other matters. As of September 30, 2019,2020, Grace had gross financial assurances issued and outstanding of $147.3$140.7 million, composed of $68.7$79.6 million of surety bonds issued by various insurance companies and $78.6$61.1 million of standby letters of credit and other financial assurances issued by various banks.
9. Restructuring Expenses and Repositioning Expenses
Restructuring Expenses Restructuring activity in the three and nine months ended September 30, 2020, primarily related to an increase in estimated contractual costs related to a 2018 plant exit. Restructuring activity in the three and nine months ended September 30, 2019, primarily related to severance costs pertaining to the idling of our methanol-to-olefins (“MTO”) manufacturing facility. These costs are included in “restructuring and
Notes to Consolidated Financial Statements (Continued)
9. Restructuring Expenses and Repositioning Expenses (Continued)
Restructuring Expenses Restructuring costs in 2019 primarily related to severance costs pertaining to the idling of our methanol-to-olefins (“MTO”) manufacturing facility in China, which were substantially paid by June 30, 2019. Restructuring costs in 2018 primarily related to plant exit costs and severance costs pertaining to sales force reorganization. These costs are included in “restructuring and repositioning expenses” in the Consolidated Statements of Operations, and are not included in segment operating income.
The following table presents restructuring expenses by reportable segment for the three and nine months ended September 30, 20192020 and 2018.2019.
| | | | Three Months Ended September 30, | | Nine Months Ended September 30, | Three Months Ended September 30, | | Nine Months Ended September 30, |
| (In millions) | 2019 | | 2018 | | 2019 | | 2018 | 2020 | | 2019 | | 2020 | | 2019 |
| Catalysts Technologies | $ | 0.1 |
| | $ | 2.2 |
| | $ | 2.2 |
| | $ | 3.7 |
| $ | 0 |
| | $ | 0.1 |
| | $ | 2.8 |
| | $ | 2.2 |
|
| Materials Technologies | — |
| | 0.1 |
| | 1.2 |
| | 0.5 |
| (0.1 | ) | | 0 |
| | 0.2 |
| | 1.2 |
|
| Corporate | 0.1 |
| | 0.1 |
| | (0.2 | ) | | 0.2 |
| 0 |
| | 0.1 |
| | 0 |
| | (0.2 | ) |
| Total restructuring expenses | $ | 0.2 |
| | $ | 2.4 |
| | $ | 3.2 |
| | $ | 4.4 |
| $ | (0.1 | ) | | $ | 0.2 |
| | $ | 3.0 |
| | $ | 3.2 |
|
The following table presents components of the change in the restructuring liability from December 31, 2018,2019, to September 30, 2019.2020.
|
| | | |
| | (In millions) |
| Balance, December 31, 2018 | $ | 10.7 |
|
| Accruals for severance and other costs | 3.2 |
|
| Payments | (8.3 | ) |
| Currency translation adjustments and other | 0.8 |
|
| Balance, September 30, 2019 | $ | 6.4 |
|
|
| | | |
| | (In millions) |
| Balance, December 31, 2019 | $ | 3.8 |
|
| Accruals for severance and other costs | 3.0 |
|
| Payments | (2.2 | ) |
| Balance, September 30, 2020 | $ | 4.6 |
|
Substantially all costs related to the restructuring programs are expected to be paid by December 31, 2021,June 30, 2023, but could be paid earlier subject to negotiations around certain plant exit costs.
Repositioning Expenses Repositioning expenses for the three and nine months ended September 30, 2019,2020, were $2.5 million and $26.0 million, respectively, compared with $3.2 million and $8.9 million compared with $6.0 million and $28.4 million for the corresponding prior-year periods. These
During the three months ended June 30, 2020, Grace implemented changes to its Refining Technologies manufacturing operations and global footprint to drive capital and operating efficiencies and to support global growth. Grace, in agreement with its local joint venture partner, discontinued the previously announced project to build a full-scale fluid catalytic cracking catalysts plant in the Middle East. As a result, repositioning expenses for the nine months ended September 30, 2020, included a pre-tax charge of $19.7 million ($2.5 million of which is attributable to Grace’s joint venture partner) to write off engineering and site costs.
Repositioning expenses for the three and nine months ended September 30, 2019, primarily related to a multi-year program to transform manufacturing and business processes to extend Grace’s competitive advantages and improve its cost position. Substantially all of these expenses have been or are expected to be settled in cash.
10. Other (Income) Expense, net
Components of other (income) expense, net are as follows:
|
| | | | | | | | | | | | | | | |
| | Three Months Ended September 30, | | Nine Months Ended September 30, |
| (In millions) | 2019 | | 2018 | | 2019 | | 2018 |
| Defined benefit pension (income) expense other than service cost | $ | (1.6 | ) | | $ | (3.5 | ) | | $ | (4.6 | ) | | $ | (10.3 | ) |
| Third-party acquisition-related costs | 1.4 |
| | 0.5 |
| | 2.7 |
| | 7.2 |
|
| Net (gain) loss on sales of investments and disposals of assets | 1.0 |
| | 1.2 |
| | 2.4 |
| | 2.5 |
|
| Currency transaction effects | 0.1 |
| | 0.2 |
| | (0.7 | ) | | (2.7 | ) |
| Loss on early extinguishment of debt | — |
| | — |
| | — |
| | 4.8 |
|
| Other miscellaneous (income) expense | (2.0 | ) | | (0.7 | ) | | (3.0 | ) | | (1.2 | ) |
| Total other (income) expense, net | $ | (1.1 | ) | | $ | (2.3 | ) | | $ | (3.2 | ) | | $ | 0.3 |
|
Notes to Consolidated Financial Statements (Continued)
10. Other (Income) Expense, net
Components of other (income) expense, net are as follows:
|
| | | | | | | | | | | | | | | |
| | Three Months Ended September 30, | | Nine Months Ended September 30, |
| (In millions) | 2020 | | 2019 | | 2020 | | 2019 |
| Business interruption insurance recoveries | $ | 0 |
| | $ | 0 |
| | $ | (16.3 | ) | | $ | 0 |
|
| Defined benefit pension (income) expense other than service cost | (4.0 | ) | | (1.6 | ) | | (11.8 | ) | | (4.6 | ) |
| Hurricane-related costs | 10.6 |
| | 0 |
| | 10.6 |
| | 0 |
|
| Third-party acquisition-related costs | 0.3 |
| | 1.4 |
| | 3.8 |
| | 2.7 |
|
| Net (gain) loss on sales of investments and disposals of assets | 1.0 |
| | 1.0 |
| | 3.6 |
| | 2.4 |
|
| Currency transaction effects | 1.6 |
| | 0.1 |
| | (0.4 | ) | | (0.7 | ) |
| Other miscellaneous (income) expense | (4.2 | ) | | (2.0 | ) | | (1.6 | ) | | (3.0 | ) |
| Total other (income) expense, net | $ | 5.3 |
| | $ | (1.1 | ) | | $ | (12.1 | ) | | $ | (3.2 | ) |
During the three months ended September 30, 2020, Hurricane Laura caused severe and widespread damage to Lake Charles, Louisiana, and surrounding communities, including catastrophic damage to the regional power grid. The hurricane-related costs were primarily due to on-site power generation, incremental operations and logistics costs to supply customers during the outage, temporary housing and employee assistance, and property damage and clean-up. In addition to the amounts shown above, Grace’s equity in earnings from unconsolidated affiliate was reduced by $1.1 million due to hurricane-related costs incurred by the joint venture.
In July 2019, a North American FCC catalysts customer filed for bankruptcy protection after announcing it would not resume refinery operations following a fire in its refinery. Grace received $16.3 million during the six months ended June 30, 2020, under its business interruption insurance policy. Including the $8.0 million received in the 2019 fourth quarter, Grace received $24.3 million of insurance recoveries related to this event, reflecting approximately 8 quarters of the impact of the incident on earnings. This claim has been fully resolved.
11. Other Comprehensive Income (Loss)
The following tables present the pre-tax, tax, and after-tax components of Grace’s other comprehensive income (loss) for the three and nine months ended September 30, 20192020 and 2018:2019:
|
| | | | | | | | | | | |
Three Months Ended September 30, 2019
(In millions) | Pre-Tax Amount | | Tax Benefit/ (Expense) | | After-Tax Amount |
| Defined benefit pension and other postretirement plans: | | | | | |
| Amortization of net prior service credit included in net periodic benefit cost | $ | (0.2 | ) | | $ | 0.1 |
| | $ | (0.1 | ) |
| Amortization of net deferred actuarial loss included in net periodic benefit cost | 0.1 |
| | (0.1 | ) | | — |
|
| Benefit plans, net | (0.1 | ) | | — |
| | (0.1 | ) |
| Currency translation adjustments | 24.2 |
| | (1.8 | ) | | 22.4 |
|
| Gain (loss) from hedging activities | (0.7 | ) | | 0.2 |
| | (0.5 | ) |
| Other comprehensive income (loss) attributable to W. R. Grace & Co. shareholders | $ | 23.4 |
| | $ | (1.6 | ) | | $ | 21.8 |
|
|
| | | | | | | | | | | |
Three Months Ended September 30, 2020
(In millions) | Pre-Tax Amount | | Tax Benefit/ (Expense) | | After-Tax Amount |
| Currency translation adjustments | $ | (22.7 | ) | | $ | 1.8 |
| | $ | (20.9 | ) |
| Gain (loss) from hedging activities | 4.0 |
| | (1.0 | ) | | 3.0 |
|
| Other comprehensive income (loss) attributable to W. R. Grace & Co. shareholders | $ | (18.7 | ) | | $ | 0.8 |
| | $ | (17.9 | ) |
|
| | | | | | | | | | | |
Nine Months Ended September 30, 2019
(In millions) | Pre-Tax Amount | | Tax Benefit/ (Expense) | | After-Tax Amount |
| Defined benefit pension and other postretirement plans: | | | | | |
| Amortization of net prior service credit included in net periodic benefit cost | $ | (0.7 | ) | | $ | 0.2 |
| | $ | (0.5 | ) |
| Amortization of net deferred actuarial loss included in net periodic benefit cost | 0.3 |
| | (0.1 | ) | | 0.2 |
|
| Benefit plans, net | (0.4 | ) | | 0.1 |
| | (0.3 | ) |
| Currency translation adjustments | 30.2 |
| | (2.9 | ) | | 27.3 |
|
| Gain (loss) from hedging activities | (13.7 | ) | | 4.1 |
| | (9.6 | ) |
| Other comprehensive income (loss) attributable to W. R. Grace & Co. shareholders | $ | 16.1 |
| | $ | 1.3 |
| | $ | 17.4 |
|
|
| | | | | | | | | | | |
Nine Months Ended September 30, 2020
(In millions) | Pre-Tax Amount | | Tax Benefit/ (Expense) | | After-Tax Amount |
| Amortization of net prior service credit included in net periodic benefit cost and other costs (credits), net | $ | (0.2 | ) | | $ | 0 |
| | $ | (0.2 | ) |
| Currency translation adjustments | (27.2 | ) | | 1.3 |
| | (25.9 | ) |
| Gain (loss) from hedging activities | 2.0 |
| | (0.8 | ) | | 1.2 |
|
| Other comprehensive income (loss) attributable to W. R. Grace & Co. shareholders | $ | (25.4 | ) | | $ | 0.5 |
| | $ | (24.9 | ) |
|
| | | | | | | | | | | |
Three Months Ended September 30, 2018
(In millions) | Pre-Tax Amount | | Tax Benefit/ (Expense) | | After-Tax Amount |
| Defined benefit pension and other postretirement plans: | | | | | |
| Amortization of net prior service credit included in net periodic benefit cost | $ | (0.4 | ) | | $ | 0.1 |
| | $ | (0.3 | ) |
| Amortization of net deferred actuarial loss included in net periodic benefit cost | 0.1 |
| | (0.1 | ) | | — |
|
| Benefit plans, net | (0.3 | ) | | — |
| | (0.3 | ) |
| Currency translation adjustments | (11.7 | ) | | 0.6 |
| | (11.1 | ) |
| Gain (loss) from hedging activities | 2.7 |
| | (0.6 | ) | | 2.1 |
|
| Other comprehensive income (loss) attributable to W. R. Grace & Co. shareholders | $ | (9.3 | ) | | $ | — |
| | $ | (9.3 | ) |
|
| | | | | | | | | | | |
Nine Months Ended September 30, 2018
(In millions) | Pre-Tax Amount | | Tax Benefit/ (Expense) | | After-Tax Amount |
| Defined benefit pension and other postretirement plans: | | | | | |
| Amortization of net prior service credit included in net periodic benefit cost | $ | (1.2 | ) | | $ | 0.3 |
| | $ | (0.9 | ) |
| Amortization of net deferred actuarial loss included in net periodic benefit cost | 0.3 |
| | (0.1 | ) | | 0.2 |
|
| Benefit plans, net | (0.9 | ) | | 0.2 |
| | (0.7 | ) |
| Currency translation adjustments | 8.5 |
| | 0.1 |
| | 8.6 |
|
| Gain (loss) from hedging activities | (3.5 | ) | | 2.2 |
| | (1.3 | ) |
| Other comprehensive income (loss) attributable to W. R. Grace & Co. shareholders | $ | 4.1 |
| | $ | 2.5 |
| | $ | 6.6 |
|
Notes to Consolidated Financial Statements (Continued)
11. Other Comprehensive Income (Loss) (Continued)
|
| | | | | | | | | | | |
Three Months Ended September 30, 2019
(In millions) | Pre-Tax Amount | | Tax Benefit/ (Expense) | | After-Tax Amount |
| Amortization of net prior service credit included in net periodic benefit cost and other costs (credits), net | $ | (0.1 | ) | | $ | 0 |
| | $ | (0.1 | ) |
| Currency translation adjustments | 24.2 |
| | (1.8 | ) | | 22.4 |
|
| Gain (loss) from hedging activities | (0.7 | ) | | 0.2 |
| | (0.5 | ) |
| Other comprehensive income (loss) attributable to W. R. Grace & Co. shareholders | $ | 23.4 |
| | $ | (1.6 | ) | | $ | 21.8 |
|
|
| | | | | | | | | | | |
Nine Months Ended September 30, 2019
(In millions) | Pre-Tax Amount | | Tax Benefit/ (Expense) | | After-Tax Amount |
| Amortization of net prior service credit included in net periodic benefit cost and other costs (credits), net | $ | (0.4 | ) | | $ | 0.1 |
| | $ | (0.3 | ) |
| Currency translation adjustments | 30.2 |
| | (2.9 | ) | | 27.3 |
|
| Gain (loss) from hedging activities | (13.7 | ) | | 4.1 |
| | (9.6 | ) |
| Other comprehensive income (loss) attributable to W. R. Grace & Co. shareholders | $ | 16.1 |
| | $ | 1.3 |
| | $ | 17.4 |
|
The following tables present the changes in accumulated other comprehensive income (loss), net of tax, for the nine months endedSeptember 30, 20192020 and 2018:2019:
| | Nine Months Ended September 30, 2019
(In millions) | Defined Benefit Pension and Other Postretirement Plans | | Currency Translation Adjustments | | Gain (Loss) from Hedging Activities | | Total | |
| Beginning balance | $ | 0.2 |
| | $ | 76.2 |
| | $ | (8.5 | ) | | $ | 67.9 |
| |
Nine Months Ended September 30, 2020
(In millions) | | Defined Benefit Pension and Other Postretirement Plans | | Currency Translation Adjustments | | Gain (Loss) from Hedging Activities | | Total |
| Balance, December 31, 2019 | | $ | (0.5 | ) | | $ | 92.7 |
| | $ | (13.4 | ) | | $ | 78.8 |
|
| Other comprehensive income (loss) before reclassifications | — |
| | 27.3 |
| | 18.9 |
| | 46.2 |
| 0 |
| | (25.9 | ) | | (10.6 | ) | | (36.5 | ) |
| Amounts reclassified from accumulated other comprehensive income (loss) | (0.3 | ) | | — |
| | (28.5 | ) | | (28.8 | ) | (0.2 | ) | | 0 |
| | 11.8 |
| | 11.6 |
|
| Net current-period other comprehensive income (loss) | (0.3 | ) | | 27.3 |
| | (9.6 | ) | | 17.4 |
| (0.2 | ) | | (25.9 | ) | | 1.2 |
| | (24.9 | ) |
| Ending balance | $ | (0.1 | ) | | $ | 103.5 |
| | $ | (18.1 | ) | | $ | 85.3 |
| |
| Balance, September 30, 2020 | | $ | (0.7 | ) | | $ | 66.8 |
| | $ | (12.2 | ) | | $ | 53.9 |
|
| | Nine Months Ended September 30, 2018
(In millions) | Defined Benefit Pension and Other Postretirement Plans | | Currency Translation Adjustments | | Gain (Loss) from Hedging Activities | | Total | |
| Beginning balance | $ | 0.9 |
| | $ | 41.6 |
| | $ | (2.6 | ) | | $ | 39.9 |
| |
Nine Months Ended September 30, 2019
(In millions) | | Defined Benefit Pension and Other Postretirement Plans | | Currency Translation Adjustments | | Gain (Loss) from Hedging Activities | | Total |
| Balance, December 31, 2018 | | $ | 0.2 |
| | $ | 76.2 |
| | $ | (8.5 | ) | | $ | 67.9 |
|
| Other comprehensive income (loss) before reclassifications | — |
| | 8.6 |
| | 21.0 |
| | 29.6 |
| 0 |
| | 27.3 |
| | 18.9 |
| | 46.2 |
|
| Amounts reclassified from accumulated other comprehensive income (loss) | (0.7 | ) | | — |
| | (22.3 | ) | | (23.0 | ) | (0.3 | ) | | 0 |
| | (28.5 | ) | | (28.8 | ) |
| Net current-period other comprehensive income (loss) | (0.7 | ) | | 8.6 |
| | (1.3 | ) | | 6.6 |
| (0.3 | ) | | 27.3 |
| | (9.6 | ) | | 17.4 |
|
| Ending balance | $ | 0.2 |
| | $ | 50.2 |
| | $ | (3.9 | ) | | $ | 46.5 |
| |
| Balance, September 30, 2019 | | $ | (0.1 | ) | | $ | 103.5 |
| | $ | (18.1 | ) | | $ | 85.3 |
|
Grace is a global enterprise operating in many countries with local currency generally deemed to be the functional currency for accounting purposes. The currency translation amount represents the adjustments necessary to translate the balance sheets valued in local currencies to the U.S. dollar as of the end of each period presented, and to translate revenues and expenses at average exchange rates for each period presented.
presented, as well as amounts related to net investment hedges. See Note 4 for a discussion of hedging activities. See Note 6 for a discussion of pension plans.
Notes to Consolidated Financial Statements (Continued)
12. Earnings Per Share
The following table shows a reconciliation of the numerators and denominators used in calculating basic and diluted earnings per share.
| | | | Three Months Ended September 30, | | Nine Months Ended September 30, | Three Months Ended September 30, | | Nine Months Ended September 30, |
| (In millions, except per share amounts) | 2019 | | 2018 | | 2019 | | 2018 | 2020 | | 2019 | | 2020 | | 2019 |
| Numerators | | | | | | | | | | | | | | |
| Net income (loss) attributable to W. R. Grace & Co. shareholders | $ | 53.7 |
| | $ | 16.1 |
| | $ | 154.6 |
| | $ | 98.5 |
| $ | 7.0 |
| | $ | 53.7 |
| | $ | 41.7 |
| | $ | 154.6 |
|
| Denominators | | | | | | | | | | | | | | |
| Weighted average common shares—basic calculation | 66.7 |
| | 67.1 |
| | 66.8 |
| | 67.3 |
| 66.2 |
| | 66.7 |
| | 66.3 |
| | 66.8 |
|
| Dilutive effect of employee stock options | 0.1 |
| | 0.1 |
| | 0.1 |
| | 0.1 |
| 0 |
| | 0.1 |
| | 0 |
| | 0.1 |
|
| Weighted average common shares—diluted calculation | 66.8 |
|
| 67.2 |
|
| 66.9 |
|
| 67.4 |
| 66.2 |
|
| 66.8 |
|
| 66.3 |
|
| 66.9 |
|
| Basic earnings per share | $ | 0.81 |
| | $ | 0.24 |
| | $ | 2.31 |
| | $ | 1.46 |
| $ | 0.11 |
| | $ | 0.81 |
| | $ | 0.63 |
| | $ | 2.31 |
|
| Diluted earnings per share | $ | 0.80 |
| | $ | 0.24 |
| | $ | 2.31 |
| | $ | 1.46 |
| $ | 0.11 |
| | $ | 0.80 |
| | $ | 0.63 |
| | $ | 2.31 |
|
There were 1.11.5 million and 0.81.7 million anti-dilutive options outstanding for the three and nine months ended September 30, 2019,2020, compared with 1.41.1 million and 0.8 million for the corresponding prior-year periods.
On February 8, 2017, the Company announced that its Board of Directors had authorized a share repurchase program of up to $250 million. On February 28, 2020, Grace announced that its Board of Directors had increased its share repurchase authorization to $250 million, including approximately $83 million remaining under the previously announced program. The timing of the repurchases and the actual amount repurchased will depend on a variety of factors, including the market price of the Company’s shares, strategic priorities for the deployment of capital, and general market and economic conditions. Grace temporarily suspended its share repurchase program in early March 2020 in light of the COVID-19 pandemic. As a result, during the three months ended September 30, 2020, Grace did not repurchase Company common stock. During the nine months ended September 30, 20192020 and 2018,2019, the Company repurchased 409,769673,807 shares and 865,698409,769 shares of Company common stock for $29.8$40.4 million and $60.1$29.8 million, respectively, pursuant to the terms of the share repurchase program. As of September 30, 2019, $109.12020, $235.0 million remained under the current authorization.
Notes to Consolidated Financial Statements (Continued)
13. Revenues
Grace generates revenues from customer arrangements primarily by manufacturing and delivering specialty chemicals and specialty materials, and theby licensing of technology through its 2 reportable segments. See Note 14 for additional information about Grace’s reportable segments.
Disaggregation of Revenue The following tables present Grace's revenues by geography and product group, within its respective reportable segments, for the three and nine months ended September 30, 20192020 and 2018.2019.
| | Three Months Ended September 30, 2019
(In millions) | North America | | Europe Middle East Africa (EMEA) | | Asia Pacific | | Latin America | | Total | |
Three Months Ended September 30, 2020
(In millions) | | North America | | Europe Middle East Africa (EMEA) | | Asia Pacific | | Latin America | | Total |
| Refining Catalysts | $ | 69.9 |
| | $ | 70.3 |
| | $ | 48.1 |
| | $ | 7.6 |
| | $ | 195.9 |
| $ | 46.0 |
| | $ | 74.9 |
| | $ | 21.0 |
| | $ | 6.6 |
| | $ | 148.5 |
|
| Polyolefin and Chemical Catalysts | 41.7 |
| | 71.6 |
| | 48.6 |
| | 3.6 |
| | 165.5 |
| 42.1 |
| | 58.3 |
| | 52.3 |
| | 4.5 |
| | 157.2 |
|
| Total Catalysts Technologies | 111.6 |
| | 141.9 |
| | 96.7 |
| | 11.2 |
| | 361.4 |
| 88.1 |
| | 133.2 |
| | 73.3 |
| | 11.1 |
| | 305.7 |
|
| Pharma/Consumer | | 15.8 |
| | 12.3 |
| | 5.1 |
| | 5.4 |
| | 38.6 |
|
| Coatings | 6.0 |
| | 16.5 |
| | 8.4 |
| | 2.8 |
| | 33.7 |
| 6.2 |
| | 16.4 |
| | 9.8 |
| | 2.9 |
| | 35.3 |
|
| Consumer/Pharma | 8.8 |
| | 12.6 |
| | 5.0 |
| | 4.8 |
| | 31.2 |
| |
| Chemical process | 10.1 |
| | 21.1 |
| | 7.2 |
| | 1.1 |
| | 39.5 |
| 7.4 |
| | 16.7 |
| | 9.4 |
| | 1.0 |
| | 34.5 |
|
| Other | 1.0 |
| | 3.5 |
| | 0.2 |
| | — |
| | 4.7 |
| 1.1 |
| | 4.1 |
| | 0.1 |
| | 0 |
| | 5.3 |
|
| Total Materials Technologies | 25.9 |
| | 53.7 |
| | 20.8 |
| | 8.7 |
| | 109.1 |
| 30.5 |
| | 49.5 |
| | 24.4 |
| | 9.3 |
| | 113.7 |
|
| Total Grace | $ | 137.5 |
| | $ | 195.6 |
| | $ | 117.5 |
| | $ | 19.9 |
| | $ | 470.5 |
| $ | 118.6 |
| | $ | 182.7 |
| | $ | 97.7 |
| | $ | 20.4 |
| | $ | 419.4 |
|
|
| | | | | | | | | | | | | | | | | | | |
Nine Months Ended September 30, 2020
(In millions) | North America | | EMEA | | Asia Pacific | | Latin America | | Total |
| Refining Catalysts | $ | 150.8 |
| | $ | 209.0 |
| | $ | 85.7 |
| | $ | 20.8 |
| | $ | 466.3 |
|
| Polyolefin and Chemical Catalysts | 124.0 |
| | 167.2 |
| | 153.6 |
| | 11.6 |
| | 456.4 |
|
| Total Catalysts Technologies | 274.8 |
| | 376.2 |
| | 239.3 |
| | 32.4 |
| | 922.7 |
|
| Pharma/Consumer | 45.4 |
| | 39.3 |
| | 16.4 |
| | 14.6 |
| | 115.7 |
|
| Coatings | 19.1 |
| | 48.9 |
| | 27.1 |
| | 6.6 |
| | 101.7 |
|
| Chemical process | 21.9 |
| | 50.9 |
| | 27.6 |
| | 4.9 |
| | 105.3 |
|
| Other | 3.0 |
| | 10.9 |
| | 0.3 |
| | 0 |
| | 14.2 |
|
| Total Materials Technologies | 89.4 |
| | 150.0 |
| | 71.4 |
| | 26.1 |
| | 336.9 |
|
| Total Grace | $ | 364.2 |
| | $ | 526.2 |
| | $ | 310.7 |
| | $ | 58.5 |
| | $ | 1,259.6 |
|
|
| | | | | | | | | | | | | | | | | | | |
Three Months Ended September 30, 2019
(In millions) | North America | | EMEA | | Asia Pacific | | Latin America | | Total |
| Refining Catalysts | $ | 69.9 |
| | $ | 70.3 |
| | $ | 48.1 |
| | $ | 7.6 |
| | $ | 195.9 |
|
| Polyolefin and Chemical Catalysts | 41.7 |
| | 71.6 |
| | 48.6 |
| | 3.6 |
| | 165.5 |
|
| Total Catalysts Technologies | 111.6 |
| | 141.9 |
| | 96.7 |
| | 11.2 |
| | 361.4 |
|
| Pharma/Consumer | 8.8 |
| | 12.6 |
| | 5.0 |
| | 4.8 |
| | 31.2 |
|
| Coatings | 6.0 |
| | 16.5 |
| | 8.4 |
| | 2.8 |
| | 33.7 |
|
| Chemical process | 10.1 |
| | 21.1 |
| | 7.2 |
| | 1.1 |
| | 39.5 |
|
| Other | 1.0 |
| | 3.5 |
| | 0.2 |
| | 0 |
| | 4.7 |
|
| Total Materials Technologies | 25.9 |
| | 53.7 |
| | 20.8 |
| | 8.7 |
| | 109.1 |
|
| Total Grace | $ | 137.5 |
| | $ | 195.6 |
| | $ | 117.5 |
| | $ | 19.9 |
| | $ | 470.5 |
|
Notes to Consolidated Financial Statements (Continued)
13. Revenues (Continued)
|
| | | | | | | | | | | | | | | | | | | |
Nine Months Ended September 30, 2019
(In millions) | North America | | EMEA | | Asia Pacific | | Latin America | | Total |
| Refining Catalysts | $ | 214.0 |
| | $ | 210.6 |
| | $ | 133.9 |
| | $ | 27.5 |
| | $ | 586.0 |
|
| Polyolefin and Chemical Catalysts | 140.3 |
| | 222.7 |
| | 145.6 |
| | 12.2 |
| | 520.8 |
|
| Total Catalysts Technologies | 354.3 |
| | 433.3 |
| | 279.5 |
| | 39.7 |
| | 1,106.8 |
|
| Coatings | 20.0 |
| | 53.8 |
| | 26.9 |
| | 6.8 |
| | 107.5 |
|
| Consumer/Pharma | 30.7 |
| | 45.4 |
| | 15.4 |
| | 14.5 |
| | 106.0 |
|
| Chemical process | 28.2 |
| | 60.7 |
| | 23.0 |
| | 4.8 |
| | 116.7 |
|
| Other | 4.7 |
| | 11.1 |
| | 0.6 |
| | 0.2 |
| | 16.6 |
|
| Total Materials Technologies | 83.6 |
| | 171.0 |
| | 65.9 |
| | 26.3 |
| | 346.8 |
|
| Total Grace | $ | 437.9 |
| | $ | 604.3 |
| | $ | 345.4 |
| | $ | 66.0 |
| | $ | 1,453.6 |
|
|
| | | | | | | | | | | | | | | | | | | |
Three Months Ended September 30, 2018
(In millions) | North America | | EMEA | | Asia Pacific | | Latin America | | Total |
| Refining Catalysts | $ | 71.7 |
| | $ | 67.4 |
| | $ | 49.6 |
| | $ | 16.2 |
| | $ | 204.9 |
|
| Polyolefin and Chemical Catalysts | 53.6 |
| | 61.4 |
| | 52.2 |
| | 6.1 |
| | 173.3 |
|
| Total Catalysts Technologies | 125.3 |
| | 128.8 |
| | 101.8 |
| | 22.3 |
| | 378.2 |
|
| Coatings | 7.5 |
| | 19.0 |
| | 9.4 |
| | 1.8 |
| | 37.7 |
|
| Consumer/Pharma | 9.5 |
| | 16.2 |
| | 4.3 |
| | 4.8 |
| | 34.8 |
|
| Chemical process | 9.1 |
| | 19.9 |
| | 8.0 |
| | 1.7 |
| | 38.7 |
|
| Other | 1.5 |
| | 4.0 |
| | — |
| | — |
| | 5.5 |
|
| Total Materials Technologies | 27.6 |
| | 59.1 |
| | 21.7 |
| | 8.3 |
| | 116.7 |
|
| Total Grace | $ | 152.9 |
| | $ | 187.9 |
| | $ | 123.5 |
| | $ | 30.6 |
| | $ | 494.9 |
|
| | Nine Months Ended September 30, 2018
(In millions) | North America | | EMEA | | Asia Pacific | | Latin America | | Total | |
Nine Months Ended September 30, 2019
(In millions) | | North America | | EMEA | | Asia Pacific | | Latin America | | Total |
| Refining Catalysts | $ | 208.8 |
| | $ | 189.7 |
| | $ | 141.8 |
| | $ | 44.1 |
| | $ | 584.4 |
| $ | 214.0 |
| | $ | 210.6 |
| | $ | 133.9 |
| | $ | 27.5 |
| | $ | 586.0 |
|
| Polyolefin and Chemical Catalysts | 137.4 |
| | 186.4 |
| | 135.4 |
| | 14.8 |
| | 474.0 |
| 140.3 |
| | 222.7 |
| | 145.6 |
| | 12.2 |
| | 520.8 |
|
| Total Catalysts Technologies | 346.2 |
| | 376.1 |
| | 277.2 |
| | 58.9 |
| | 1,058.4 |
| 354.3 |
| | 433.3 |
| | 279.5 |
| | 39.7 |
| | 1,106.8 |
|
| Pharma/Consumer | | 30.7 |
| | 45.4 |
| | 15.4 |
| | 14.5 |
| | 106.0 |
|
| Coatings | 22.3 |
| | 59.2 |
| | 32.6 |
| | 6.5 |
| | 120.6 |
| 20.0 |
| | 53.8 |
| | 26.9 |
| | 6.8 |
| | 107.5 |
|
| Consumer/Pharma | 26.1 |
| | 42.9 |
| | 14.5 |
| | 14.2 |
| | 97.7 |
| |
| Chemical process | 26.6 |
| | 61.6 |
| | 23.2 |
| | 6.3 |
| | 117.7 |
| 28.2 |
| | 60.7 |
| | 23.0 |
| | 4.8 |
| | 116.7 |
|
| Other | 5.1 |
| | 12.2 |
| | 0.3 |
| | 0.1 |
| | 17.7 |
| 4.7 |
| | 11.1 |
| | 0.6 |
| | 0.2 |
| | 16.6 |
|
| Total Materials Technologies | 80.1 |
| | 175.9 |
| | 70.6 |
| | 27.1 |
| | 353.7 |
| 83.6 |
| | 171.0 |
| | 65.9 |
| | 26.3 |
| | 346.8 |
|
| Total Grace | $ | 426.3 |
| | $ | 552.0 |
| | $ | 347.8 |
| | $ | 86.0 |
| | $ | 1,412.1 |
| $ | 437.9 |
| | $ | 604.3 |
| | $ | 345.4 |
| | $ | 66.0 |
| | $ | 1,453.6 |
|
Contract Balances Grace invoices customers for product sales once performance obligations have been satisfied, generally at the point of delivery, at which point payment becomes unconditional. Accordingly, Grace'sGrace’s product sales contracts generally do not give rise to material contract assets or liabilities under ASC 606; however, from time to time certain customers may pay in advance.advance, which results in a contract liability. In the technology licensing business, Grace typically invoices licensees based onat the time that contractual milestones achieved but has obligationsare achieved. However, in respect of the milestone billings, Grace is frequently obligated to provide services in future periods, whichand this results in recording contract liabilities.
Notes to Consolidated Financial Statements (Continued)
13. Revenues (Continued)
The following table presents Grace’s deferred revenue balances as of September 30, 2019,2020, and December 31, 2018:2019:
| | | (In millions) | September 30,
2019 | | December 31,
2018 | September 30,
2020 | | December 31,
2019 |
| Current | $ | 36.1 |
| | $ | 40.6 |
| $ | 35.9 |
| | $ | 35.0 |
|
| Noncurrent | 28.8 |
| | 29.2 |
| 21.9 |
| | 29.5 |
|
| Total | $ | 64.9 |
| | $ | 69.8 |
| $ | 57.8 |
| | $ | 64.5 |
|
Grace records deferred revenues when cash payments are received or billed and due in advance of performance. The change in deferred revenue reflects cash payments from customers received or due in advance of satisfying performance obligations, offset by $5.2$6.8 million and $21.8$22.9 million of revenue recognized for the three and nine months ended September 30, 20192020, respectively, that was included in the deferred revenue balance as of December 31, 2018.2019.
The noncurrent portion of deferred revenue will be recognized as performance obligations under the technology licensing agreements are satisfied, which is expected to be over the next four years.
Remaining performance obligations represent the estimated revenue expected to be recognized in the future related to performance obligations that are unsatisfied (or partially unsatisfied). The aggregate amount of the transaction price allocated to remaining performance obligations for such contracts with a duration of more than one year was approximately $137$150 million as of September 30, 2019,2020, and includes certain amounts reported as deferred revenue above. In accordance with the available practical expedient, Grace does not disclose information about remaining performance obligations that have original expected durations of one year or less, which generally relate to customer prepayments on product sales and are generally satisfied in less than one year. Grace expects to recognize revenue related to remaining performance obligations over several years, as follows:
|
| | | |
| Year | | Approximate percentage of revenue related to remaining performance obligations recognized |
| 2019 | | 7 | % |
| 2020 | | 26 | % |
| 2021 | | 24 | % |
| 2022 | | 17 | % |
| Thereafter through 2027 | | 26 | % |
| | | 100 | % |
31
Notes to Consolidated Financial Statements (Continued)
13. Revenues (Continued)
|
| | | |
| Year | | Approximate percentage of revenue related to remaining performance obligations recognized |
| Remainder of 2020 | | 6 | % |
| 2021 | | 26 | % |
| 2022 | | 21 | % |
| 2023 | | 15 | % |
| Thereafter through 2030 | | 32 | % |
For the three and nine months ended September 30, 20192020 and 2018,2019, revenue recognized from performance obligations related to prior periods was not material. Grace has not capitalized any costs to obtain or fulfill contracts with customers under ASC 606. No material impairment losses have been recognized on any receivables or contract assets arising from contracts with customers.
14. Segment Information
Grace is a global producer of specialty chemicals and specialty materials. Grace’s 2 reportable business segments are Grace Catalysts Technologies and Grace Materials Technologies. Grace Catalysts Technologies includes catalysts and related products and technologies used in petrochemical, refining, petrochemical and other chemical manufacturing applications. Advanced Refining Technologies LLC (“ART”), Grace’s joint venture with Chevron Products Company, a division of Chevron U.S.A. Inc. (“Chevron”), is managed in this segment. (See Note 15.) Grace Catalysts Technologies comprises 2 operating segments, Grace Refining Technologies and Grace Specialty Catalysts, which are aggregated into 1 reportable segment based upon similar economic characteristics, the nature of the products and production processes, type and class of customer, and channels of distribution. Grace Materials Technologies includes specialty materials, including silica-based and silica-alumina-
Notes to Consolidated Financial Statements (Continued)
14. Segment Information (Continued)
basedsilica-alumina-based materials, used in consumer/pharma,pharma/consumer, coatings, and chemical process and coatings applications. The table below presents information related to Grace’s reportable segments. Only those corporate expenses directly related to the reportable segments are allocated for reporting purposes. All remaining corporate items are reported separately and labeled as such.
Grace excludes defined benefit pension expense from the calculation of segment operating income. Grace believes that the exclusion of defined benefit pension expense provides a better indicator of its reportable segment performance as defined benefit pension expense is not managed at a reportable segment level.
Grace defines Adjusted EBIT to be net income attributable to W. R. Grace & Co. shareholders adjusted for interest income and expense; income taxes; costs related to legacy matters; restructuring and repositioning expenses and asset impairments; pension costs other than service and interest costs, expected returns on plan assets, and amortization of prior service costs/credits; gains and losses on sales or exits of businesses, product lines, and certain other investments; third-party acquisition-related costs and the amortization of acquired inventory fair value adjustment; gains and losses on modification or extinguishment of debt; the effects of these items on equity in earnings of unconsolidated affiliate; and certain other items that are not representative of underlying trends.
Notes to Consolidated Financial Statements (Continued)
14. Segment Information (Continued)
Reportable Segment Data
| | | | Three Months Ended September 30, | | Nine Months Ended September 30, | Three Months Ended September 30, | | Nine Months Ended September 30, |
| (In millions) | 2019 | | 2018 | | 2019 | | 2018 | 2020 | | 2019 | | 2020 | | 2019 |
| Net Sales | | | | | | | | | | | | | | |
| Catalysts Technologies | $ | 361.4 |
| | $ | 378.2 |
| | $ | 1,106.8 |
| | $ | 1,058.4 |
| $ | 305.7 |
| | $ | 361.4 |
| | $ | 922.7 |
| | $ | 1,106.8 |
|
| Materials Technologies | 109.1 |
| | 116.7 |
| | 346.8 |
| | 353.7 |
| 113.7 |
| | 109.1 |
| | 336.9 |
| | 346.8 |
|
| Total | $ | 470.5 |
| | $ | 494.9 |
| | $ | 1,453.6 |
| | $ | 1,412.1 |
| $ | 419.4 |
| | $ | 470.5 |
| | $ | 1,259.6 |
| | $ | 1,453.6 |
|
| Adjusted EBIT | | | | | | | | | | | | | | |
| Catalysts Technologies segment operating income | $ | 104.7 |
| | $ | 119.5 |
| | $ | 331.3 |
| | $ | 325.3 |
| $ | 67.1 |
| | $ | 105.1 |
| | $ | 220.8 |
| | $ | 332.6 |
|
| Materials Technologies segment operating income | 26.1 |
| | 26.6 |
| | 74.2 |
| | 80.3 |
| 24.3 |
| | 26.1 |
| | 55.9 |
| | 74.2 |
|
| Corporate costs | (18.5 | ) | | (19.7 | ) | | (52.7 | ) | | (56.1 | ) | (18.2 | ) | | (18.5 | ) | | (50.5 | ) | | (52.7 | ) |
| Certain pension costs | (4.5 | ) | | (3.8 | ) | | (13.9 | ) | | (11.6 | ) | (3.6 | ) | | (4.5 | ) | | (10.2 | ) | | (13.9 | ) |
| Total | $ | 107.8 |
| | $ | 122.6 |
| | $ | 338.9 |
| | $ | 337.9 |
| $ | 69.6 |
| | $ | 108.2 |
| | $ | 216.0 |
| | $ | 340.2 |
|
Corporate costs include corporate support functionfunctional costs and other corporate costs such as professional fees, incentive compensation, and insurance premiums. Certain pension costs include only ongoing costs recognized quarterly, which include service and interest costs, expected returns on plan assets, and amortization of prior service costs/credits.
Reconciliation of Reportable Segment Data to Financial Statements Grace Adjusted EBIT for the three and nine months ended September 30, 2020 and 2019, is reconciled below to “income (loss) before income taxes” presented in the accompanying Consolidated Statements of Operations.
|
| | | | | | | | | | | | | | | |
| | Three Months Ended September 30, | | Nine Months Ended September 30, |
| (In millions) | 2020 | | 2019 | | 2020 | | 2019 |
| Grace Adjusted EBIT | $ | 69.6 |
| | $ | 108.2 |
| | $ | 216.0 |
| | $ | 340.2 |
|
| Loss on early extinguishment of debt | (39.4 | ) | | 0 |
| | (39.4 | ) | | 0 |
|
| Costs related to legacy matters | (30.6 | ) | | (3.7 | ) | | (36.1 | ) | | (52.1 | ) |
| Restructuring and repositioning expenses attributable to W. R. Grace & Co. shareholders(1) | (2.4 | ) | | (3.4 | ) | | (26.5 | ) | | (12.1 | ) |
| Inventory write-offs(2) | (0.1 | ) | | 0 |
| | (19.8 | ) | | (3.6 | ) |
| Third-party acquisition-related costs | (0.3 | ) | | (1.4 | ) | | (3.8 | ) | | (2.7 | ) |
| Taxes and interest included in equity in earnings of unconsolidated affiliate | (0.4 | ) | | (0.4 | ) | | (0.6 | ) | | (1.3 | ) |
| Interest expense, net | (19.6 | ) | | (18.3 | ) | | (56.2 | ) | | (56.8 | ) |
| Net income (loss) attributable to noncontrolling interests | (0.3 | ) | | 0.1 |
| | (2.5 | ) | | 0.2 |
|
| Income (loss) before income taxes | $ | (23.5 | ) | | $ | 81.1 |
| | $ | 31.1 |
| | $ | 211.8 |
|
| |
| (1) | Net of restructuring and repositioning expenses attributable to Grace’s Middle East joint venture partner. |
| |
| (2) | Inventory write-off in 2020 related to the changes in hydroprocessing catalysts manufacturing operations (see Note 2). Inventory write-off in 2019 related to the idling of Grace’s methanol-to-olefins (“MTO”) manufacturing facility. |
Notes to Consolidated Financial Statements (Continued)
14. Segment Information (Continued)
Reconciliation of Reportable Segment Data to Financial Statements Grace Adjusted EBIT for the three and nine months ended September 30, 2019 and 2018, is reconciled below to “income (loss) before income taxes” presented in the accompanying Consolidated Statements of Operations.
|
| | | | | | | | | | | | | | | |
| | Three Months Ended September 30, | | Nine Months Ended September 30, |
| (In millions) | 2019 | | 2018 | | 2019 | | 2018 |
| Grace Adjusted EBIT | $ | 107.8 |
| | $ | 122.6 |
| | $ | 338.9 |
| | $ | 337.9 |
|
| Costs related to legacy matters | (3.7 | ) | | (74.6 | ) | | (52.1 | ) | | (78.8 | ) |
| Restructuring and repositioning expenses | (3.4 | ) | | (8.4 | ) | | (12.1 | ) | | (32.8 | ) |
| Write-off of MTO inventory | — |
| | — |
| | (3.6 | ) | | — |
|
| Third-party acquisition-related costs | (1.4 | ) | | (0.5 | ) | | (2.7 | ) | | (7.2 | ) |
| Amortization of acquired inventory fair value adjustment | — |
| | (2.3 | ) | | — |
| | (6.9 | ) |
| Loss on early extinguishment of debt | — |
| | — |
| | — |
| | (4.8 | ) |
| Interest expense, net | (18.3 | ) | | (20.0 | ) | | (56.8 | ) | | (58.4 | ) |
| Net income (loss) attributable to noncontrolling interests | 0.1 |
| | (0.2 | ) | | 0.2 |
| | (0.6 | ) |
| Income (loss) before income taxes | $ | 81.1 |
| | $ | 16.6 |
| | $ | 211.8 |
| | $ | 148.4 |
|
Geographic Area Data The table below presents information related to the geographic areas in which Grace operates. Sales are attributed to geographic areas based on the location to which the product is transported.
| | | | Three Months Ended September 30, | | Nine Months Ended September 30, | Three Months Ended September 30, | | Nine Months Ended September 30, |
| (In millions) | 2019 | | 2018 | | 2019 | | 2018 | 2020 | | 2019 | | 2020 | | 2019 |
| Net Sales | | | | | | | | | | | | | | |
| United States | $ | 124.1 |
| | $ | 140.1 |
| | $ | 395.9 |
| | $ | 390.6 |
| $ | 108.7 |
| | $ | 124.1 |
| | $ | 329.9 |
| | $ | 395.9 |
|
| Canada | 13.4 |
| | 12.8 |
| | 42.0 |
| | 35.7 |
| 9.9 |
| | 13.4 |
| | 34.3 |
| | 42.0 |
|
| Total North America | 137.5 |
| | 152.9 |
| | 437.9 |
| | 426.3 |
| 118.6 |
| | 137.5 |
| | 364.2 |
| | 437.9 |
|
| Europe Middle East Africa | 195.6 |
| | 187.9 |
| | 604.3 |
| | 552.0 |
| 182.7 |
| | 195.6 |
| | 526.2 |
| | 604.3 |
|
| Asia Pacific | 117.5 |
| | 123.5 |
| | 345.4 |
| | 347.8 |
| 97.7 |
| | 117.5 |
| | 310.7 |
| | 345.4 |
|
| Latin America | 19.9 |
| | 30.6 |
| | 66.0 |
| | 86.0 |
| 20.4 |
| | 19.9 |
| | 58.5 |
| | 66.0 |
|
| Total | $ | 470.5 |
| | $ | 494.9 |
| | $ | 1,453.6 |
| | $ | 1,412.1 |
| $ | 419.4 |
| | $ | 470.5 |
| | $ | 1,259.6 |
| | $ | 1,453.6 |
|
15. Related Party Transactions
Unconsolidated Affiliate Grace accounts for its 50% ownership interest in ART, its joint venture with Chevron, using the equity method of accounting. Grace’s investment in ART amounted to $168.5167.4 million and $156.1181.9 million as of September 30, 20192020, and December 31, 20182019, respectively. The amount of ART’s earnings included in “equity in earnings of unconsolidated affiliate” in the accompanying Consolidated Statements of Operations totaled $3.8 million and $13.9 million for the three and nine months ended September 30, 2019, compared with $5.9 million and $19.5 million for the corresponding prior-year periods. ART is a private, limited liability company, taxed as a partnership, and accordingly does not have a quoted market price available. During the three months ended September 30, 2020, Grace received a $10.0 million dividend from ART, and the Consolidated Balance Sheet as of September 30, 2020, includes an additional $10.0 million dividend receivable from ART to be paid in the 2020 fourth quarter.
The table below presents the components of Grace’s “equity in earnings of unconsolidated affiliate” in the Consolidated Statements of Operations.
|
| | | | | | | | | | | | | | | |
| | Three Months Ended September 30, | | Nine Months Ended September 30, |
| (In millions) | 2020 | | 2019 | | 2020 | | 2019 |
| Operating income | $ | 2.8 |
| | $ | 4.4 |
| | $ | 8.4 |
| | $ | 15.6 |
|
| Depreciation and amortization | (1.1 | ) | | (0.2 | ) | | (1.9 | ) | | (0.4 | ) |
| Interest expense and income taxes | (0.4 | ) | | (0.4 | ) | | (0.6 | ) | | (1.3 | ) |
| Equity in earnings of unconsolidated affiliate | $ | 1.3 |
| | $ | 3.8 |
| | $ | 5.9 |
| | $ | 13.9 |
|
Notes to Consolidated Financial Statements (Continued)
15. Related Party Transactions (Continued)
The table below presents summary financial data related to ART’s balance sheet and results of operations.
| | | (In millions) | September 30,
2019 | | December 31,
2018 | September 30,
2020 | | December 31,
2019 |
| Summary Balance Sheet information: | | | | | | |
| Current assets | $ | 273.9 |
| | $ | 307.4 |
| $ | 270.4 |
| | $ | 300.7 |
|
| Noncurrent assets | 220.7 |
| | 160.2 |
| 248.3 |
| | 237.8 |
|
| Total assets | $ | 494.6 |
| | $ | 467.6 |
| $ | 518.7 |
| | $ | 538.5 |
|
| | | | | | | |
| Current liabilities | $ | 160.3 |
| | $ | 158.3 |
| $ | 185.8 |
| | $ | 177.1 |
|
| Noncurrent liabilities | 0.3 |
| | 0.3 |
| 0.3 |
| | 0.3 |
|
| Total liabilities | $ | 160.6 |
| | $ | 158.6 |
| $ | 186.1 |
| | $ | 177.4 |
|
| | | | Three Months Ended September 30, | | Nine Months Ended September 30, | Three Months Ended September 30, | | Nine Months Ended September 30, |
| (In millions) | 2019 | | 2018 | | 2019 | | 2018 | 2020 | | 2019 | | 2020 | | 2019 |
| Summary Statement of Operations information: | | | | | | | | | | | | | | |
| Net sales | $ | 125.7 |
| | $ | 120.2 |
| | $ | 357.2 |
| | $ | 308.4 |
| $ | 109.9 |
| | $ | 125.7 |
| | $ | 309.6 |
| | $ | 357.2 |
|
| Costs and expenses applicable to net sales | 113.3 |
| | 105.0 |
| | 312.8 |
| | 259.7 |
| 100.0 |
| | 113.3 |
| | 281.1 |
| | 312.8 |
|
| Income before income taxes | 8.1 |
| | 12.5 |
| | 30.6 |
| | 40.7 |
| 3.1 |
| | 8.1 |
| | 13.4 |
| | 30.6 |
|
| Net income | 7.6 |
| | 11.8 |
| | 28.8 |
| | 39.5 |
| 2.8 |
| | 7.6 |
| | 11.9 |
| | 28.8 |
|
Grace and ART transact business on a regular basis and maintain several agreements in order to operate the joint venture. These agreements and the resulting transactions are treated as related party activities with an unconsolidated affiliate. Product manufactured by Grace for ART is accounted for on a net basis, with a mark-up, inwhich reduces “cost of goods sold” in the Consolidated Statements of Operations. Grace also receives reimbursement from ART for fixed costs,costs; research and development,development; selling, general and administrative services,services; and depreciation. Grace records reimbursements against the respective line items on Grace’s Consolidated StatementStatements of Operations. The table below presents summary financial data related to transactions between Grace and ART.
| | | | Three Months Ended September 30, | | Nine Months Ended September 30, | Three Months Ended September 30, | | Nine Months Ended September 30, |
| (In millions) | 2019 | | 2018 | | 2019 | | 2018 | 2020 | | 2019 | | 2020 | | 2019 |
| Product manufactured for ART | $ | 64.1 |
| | $ | 58.7 |
| | $ | 190.2 |
| | $ | 169.1 |
| $ | 63.4 |
| | $ | 64.1 |
| | $ | 194.7 |
| | $ | 190.2 |
|
| Mark-up on product manufactured for ART included as a reduction of Grace’s cost of goods sold | 1.2 |
| | 1.1 |
| | 3.7 |
| | 3.3 |
| 1.2 |
| | 1.2 |
| | 3.8 |
| | 3.7 |
|
| Charges for fixed costs; research and development; selling, general and administrative services; and depreciation to ART | 12.4 |
| | 10.5 |
| | 38.0 |
| | 31.6 |
| 13.1 |
| | 12.4 |
| | 40.5 |
| | 38.0 |
|
Notes to Consolidated Financial Statements (Continued)
15. Related Party Transactions (Continued)
The table below presents balances in Grace’s Consolidated Financial Statements related to ART.
|
| | | | | | | |
| (in millions) | September 30,
2019 | | December 31,
2018 |
| Accounts receivable | $ | 8.8 |
| | $ | 16.2 |
|
| Current asset | 158.1 |
| | — |
|
| Noncurrent asset | — |
| | 98.8 |
|
| Accounts payable | 29.6 |
| | 32.0 |
|
| Debt payable within one year | 9.2 |
| | 9.8 |
|
| Debt payable after one year | 39.0 |
| | 38.3 |
|
| Current liability | 158.1 |
| | — |
|
| Noncurrent liability | — |
| | 98.8 |
|
|
| | | | | | | |
| (in millions) | September 30,
2020 | | December 31,
2019 |
| Trade accounts receivable | $ | 23.9 |
| | $ | 17.5 |
|
| Other current assets | 10.0 |
| | 173.9 |
|
| Accounts payable | 23.5 |
| | 37.7 |
|
| Debt payable within one year | 4.8 |
| | 9.9 |
|
| Debt payable after one year | 30.7 |
| | 37.5 |
|
| Other current liabilities | 0 |
| | 173.9 |
|
The other current asset as of September 30, 2020, in the table above represents the dividend receivable from ART to be paid in the 2020 fourth quarter. The current asset and current liability (which were classified as noncurrent as of December 31, 2018) in the table above represent2019, represented spending to date related to a residue hydroprocessing catalyst production plant that is under constructionhas been constructed in Lake Charles, Louisiana. Grace managesmanaged the design and construction of the plant, and the asset will continue to bewas included in “other current assets” in Grace’s Consolidated Balance Sheets until construction iscommissioning and start-up activities were completed. Grace hashad likewise recorded a liability for the transfer of the asset to ART upon completion, included in “other current liabilities” in the Consolidated Balance Sheets. Grace transferred the asset to ART in the 2020 third quarter.
Grace and ART maintain an agreement whereby ART loans Grace funds for maintenance capital expenditures at manufacturing facilities used to produce catalysts for ART. Grace makes principal and interest payments on the loans on a monthly basis. These unsecured loans have repayment terms of up to eight years, unless earlier repayment is demanded by ART. The loans bear interest at the three-month LIBOR plus 1.25%.
Grace and Chevron provide lines of credit in the amount of $15.0 million each at a commitment fee of 0.1% of the credit amount. These agreements have been approved by the ART Executive Committee for renewal until February 2020.2021. NaN amounts were outstanding at September 30, 2019,2020, or December 31, 2018.2019.
Joint Venture Arrangement In 2018, Grace formed a joint venture in a developing country in Asia. The purpose of the joint venture is to establish a logistics facility and catalyst testing laboratory and to be the exclusive FCC catalysts and additives supplier to certain customers in the country. Grace’s joint venture partner is the parent company of the customers. Grace has an 87.5% ownership interest in the joint venture and consolidates the activities of the entity. Grace’s Consolidated Balance Sheets as of September 30, 20192020, and December 31, 2018,2019, include trade accounts receivable of $1.5$0.9 million and $3.7$3.6 million, respectively, from these customers. Grace’s Consolidated Statements of Operations for the three and nine months ended September 30, 20192020, include $1.8$0.7 million and $5.8$6.6 million, respectively, of revenues from these customers, compared with $3.5$1.8 million and $7.4$5.8 million of revenues in the corresponding prior-year periods.
16. Acquisitions
Rive Technology, Inc. On June 17, 2019, Grace completed the acquisition of the business and assets of Rive Technology, Inc. for $22.8 million.million, with an additional $2.0 million holdback payment remitted in the three months ended September 30, 2020. The business is included in the Refining Technologies operating segment of the Catalysts Technologies reportable segment.
Polyolefin catalysts business of Albemarle CorporationOn April 3, 2018, using cash on hand and borrowings under the 2018 U.S. dollar term loan, Grace acquired the assets of the polyolefin catalysts business of Albemarle Corporation. Grace acquired the business for $418.0 million, net of cash acquired and including customary post-closing adjustments. The business is included in the Specialty Catalysts operating segment of the Catalysts Technologies reportable segment. The acquisition is complementaryincluded Rive’s MOLECULAR HIGHWAY® zeolite technology for catalytic processes, which allows Grace to Grace's existing specialty catalysts business and strengthens Grace's commercial relationships, catalysts technology portfolio, and manufacturing network.
Notes to Consolidated Financial Statements (Continued)
16. Acquisitions36
The acquisition purchase price has been allocated to the tangible and identifiable intangible assets and liabilities acquired based on their estimated fair values at the acquisition date in accordance with ASC 805 “Business Combinations.” The excess of the purchase price over the fair value of the tangible and intangible assets acquired was recorded as goodwill. The purchase price allocation has been finalized, and during the measurement period, Grace recorded adjustments related to deferred taxes, working capital, and intangible assets. The goodwill recognized was $140.6 million and is supported by the expected growth and operating synergies that Grace expects to realize from this acquisition. The full amount of goodwill generated will be deductible for U.S. income tax purposes.
ITEM 2. MANAGEMENT’S DISCUSSION AND ANALYSIS OF FINANCIAL CONDITION AND RESULTS OF OPERATIONS
References
We generally refer to the quarter ended September 30, 20192020, as the “third quarter,” the quarter ended September 30, 20182019, as the “prior-year quarter,” the quarter ended March 31, 2019,2020, as the “2019“2020 first quarter,” the quarter ended June 30, 2019,2020, as the “2019“2020 second quarter,” the quarter ending December 31, 2020, as the “2020 fourth quarter,” the nine months ended September 30, 20192020, as the “nine months,” and the nine months ended September 30, 20182019, as the “prior-year period.” Our references to “advanced economies” and “emerging regions” refer to classifications established by the International Monetary Fund. See Analysis of Operations for a discussion of our non-GAAP performance measures.
Results of Operations
Third Quarter Performance Summary
Following is a summary of our financial performance for the third quarter compared with the prior-year quarter.
Net sales decreased 4.9%10.9% to $470.5 million.$419.4 million reflecting the impact of COVID-19.
Net incomeloss attributable to Grace shareholders increased 233.5% to $53.7was $7.0 million.
| |
| • | Adjusted EBIT1 decreased 12.1%35.7% to $107.8$69.6 million. |
Diluted earningsloss per share increased 233.3% to $0.80was $0.11 per diluted share.
| |
| • | Adjusted EPS1 decreased 11.7%42.9% to $0.98$0.56 per diluted share. |
1 Non-GAAP performance measures further discussed below.
Summary Description of Business
We are engaged in specialty chemicals and specialty materials businesses on a worldwide basis through our two reportable segments.
Grace Catalysts Technologies produces and sells catalysts and related products and technologies used in petrochemical, refining, petrochemical and other chemical manufacturing applications, as follows:
| |
| • | Polyolefin catalysts and catalyst supports, also called specialty catalysts (SC), for the production of polyethylene (PE) and polypropylene (PP) thermoplastic resins, which can be customized to enhance the performance of a wide range of industrial and consumer end-use applications including high pressure pipe, geomembranes, food packaging, automotive parts, medical devices, and textiles. High-activity, non-phthalate catalysts allow customers to produce phthalate-free PP and cleaner, clearer PP products. Our catalysts also improve resin properties that allow the use of thinner gauge and lighter weight plastics in end products, as well as increase customer plant throughput and operability. |
| |
| • | Gas-phase polypropylene process technology, which provides our licensees with a cost-effective, flexible, and reliable capability to manufacture polypropylene products having a wide range of performance attributes, enabling customers to manufacture products for a broad array of end-use applications. This capability, coupled with a complete family of catalysts and donors with a suite of value-added solutions, enables our licensees to compete effectively in their markets over the lifetime of the plant. We are the leading independent supplier that provides both PP process technology licenses and catalysts. |
| |
| • | Fluid catalytic cracking catalysts, also called FCC catalysts, that help to “crack” the hydrocarbon chains in distilled crude oil to produce transportation fuels, such as gasoline and diesel fuels, and feeds for production of petrochemicals; and FCC additives used to reduce sulfur in gasoline, maximize propylene production from refinery FCC units, and reduce emissions of sulfur oxides, nitrogen oxides, and carbon monoxide from refinery FCC units. |
| |
| • | Hydroprocessing catalysts (HPC), most of which are marketed through our Advanced Refining Technologies LLC (“ART”) joint venture with Chevron Products CompanyU.S.A. Inc. (“Chevron”), that are used in process reactors to upgrade heavy oils into lighter, more useful products, enabling less expensive feedstock usage in the petroleum refining process, and to produce products that meet more stringent environmental regulations. These catalysts and solutions allow customers to improve their profitability in the production of cleaner petroleum-based fuels to meet regulatory and fuel quality standards. (We hold a 50% economic interest in ART, which is not consolidated in our financial statements so ART'sART’s sales are excluded from our sales.) |
| |
| • | PolyolefinChemical catalysts, which include hydrogenation and dehydrogenation catalyst supports, also called specialtyproducts. These catalysts (SC), for the production of polyethylene and polypropylene thermoplastic resins, which can be customized to enhance the performance of a wide range of industrial and consumer end-use applications including high pressure pipe, geomembranes, food packaging, automotive parts, medical devices, and textiles; and chemical catalysts usedfor use in a variety of petrochemical chain conversions andas well as fine chemical production.
|
| |
• | Gas-phase polypropylene process technology, which provides our licensees with a proven, cost-effective, flexible, and reliable capability to manufacture polypropylene products having a wide spectrum of performance attributes, enabling customers to manufacture products for a broad array of end-use applications.
|
Grace Materials Technologies produces and sells specialty materials, includingwhich are either silica-based and silica-alumina-based materials,or complex organic molecules, that can be used in consumer/pharma,pharma/consumer, coatings, and chemical process and coatings applications, including as follows:
| |
| • | Consumer/Pharma, Pharma/Consumer,specializedspecialty materials used as additives, intermediates and intermediatespurification aids for pharmaceuticals, nutraceuticals, toothpaste, beer, toothpaste, food and cosmetic segments.food. Our Fine Chemicals business specializes in regulatory starting materials and intermediates, especially peptide building blocks, specialty amino acids, chiral boronic acids, and esters.
|
| |
| • | Coatings, functional additives for wood, coil, and architectural coatings that provide surface effects and corrosion protection for metal substrates. |
| |
| • | Chemical process, functional materials for use in plastics, rubber, tire, and metal casting, and adsorbent products for petrochemical, and natural gas, applications. |
| |
• | Coatings, functional additives for wood and architectural coatings that provide surface effects and corrosion protection for metal substrates.more specialized applications.
|
Global Scope
We operate our business on a global scale with approximately 72% of our annual 20182019 sales and 73%74% of our nine months sales to customers located outside the United States. We operate and/or sell to customers in over 7060 countries and do business in over 30 currencies. We manage our operating segments on a global basis, to serve global markets. Currency fluctuations affect our reported results of operations, cash flows, and financial position.
Analysis of Operations
We have set forth in the table below our key operating statistics with percentage changes for the third quarter and nine months compared with the corresponding prior-year periods. Please refer to this Analysis of Operations when reviewing this Management’s Discussion and Analysis of Financial Condition and Results of Operations. In the table we present financial information in accordance with U.S. GAAP, as well as the non-GAAP financial information described below. We believe that the non-GAAP financial information provides useful supplemental information about the performance of our businesses, improves period-to-period comparability, and provides clarity on the information our management uses to evaluate the performance of our businesses. In the table, we have provided reconciliations of these non-GAAP financial measures to the most directly comparable financial measure calculated and presented in accordance with U.S. GAAP. The non-GAAP financial measures should not be considered as a substitutesubstitutes for financial measures calculated in accordance with U.S. GAAP, and the financial results calculated in accordance with U.S. GAAP and reconciliations from those results should be evaluated carefully.
We define Adjusted EBIT (a non-GAAP financial measure) to be net income attributable to W. R. Grace & Co. shareholders adjusted for interest income and expense; income taxes; costs related to legacy matters; restructuring and repositioning expenses and asset impairments; pension costs other than service and interest costs, expected returns on plan assets, and amortization of prior service costs/credits; gains and losses on sales and exits of businesses, product lines, and certain other investments; third-party acquisition-related costs and the amortization of acquired inventory fair value adjustment; gains and losses on modification or extinguishment of debt; the effects of these items on equity in earnings of unconsolidated affiliate; and certain other items that are not representative of underlying trends.
We define Adjusted EBITDA (a non-GAAP financial measure) to be Adjusted EBIT adjusted for depreciation and amortization.amortization, and depreciation and amortization included in equity in earnings of unconsolidated affiliate (collectively, Adjusted Depreciation and Amortization).
We define Adjusted EBIT Return Onon Invested Capital (a non-GAAP financial measure) to be Adjusted EBIT (on a trailing four quarters basis) divided by Adjusted Invested Capital, which is defined as equity adjusted for debt; underfunded and unfunded defined benefit pension plans; liabilities related to legacy matters; cash, cash equivalents, and restricted cash; net income tax assets; and certain other assets and liabilities.
We define Adjusted Gross Margin (a non-GAAP financial measure) to be gross margin adjusted for pension-related costs included in cost of goods sold, the amortization of acquired inventory fair value adjustment, and write-offs of inventory related to exits of businesses and product lines.lines and significant manufacturing process changes.
We define Adjusted Earnings Per Share (EPS) (a non-GAAP financial measure) to be diluted EPS adjusted for costs related to legacy matters; restructuring and repositioning expenses and asset impairments; pension costs other than service and interest costs, expected returns on plan assets, and amortization of prior service costs/credits; gains and losses on sales and exits of businesses, product lines and certain other investments; third-party acquisition-related costs and the amortization of acquired inventory fair value adjustment; gains and losses on modification or extinguishment of debt; certain other
items that are not representative of underlying trends; certain discrete tax items; and income tax expense related to historical tax attributes.
We define Net Sales,the change in net sales on a constant currency basis (a non-GAAP financial measure) to be the period-over-period change in net sales calculated using the foreign currency exchange rates that were in effect during the previous comparable period.
“Legacy matters” include legacy (i) product, (ii) environmental, and (iii) other liabilities, relating to past activities of Grace.
In the 2020 first quarter, the definition of Adjusted EBIT was modified to adjust for the effects of interest and taxes on equity in earnings of unconsolidated affiliate. The definition of Adjusted EBITDA was modified to adjust for the effects of depreciation and amortization on equity in earnings of unconsolidated affiliate. We made these changes to provide clarity about the impacts of these items on our equity in earnings of unconsolidated affiliate and to improve consistency in our application of non-GAAP financial measures. Previously reported amounts were revised to conform to the current presentation.
We use Adjusted EBIT as a performance measure in significant business decisions and in determining certain incentive compensation. We use Adjusted EBIT as a performance measure because it provides improved period-to-period comparability for decision making and compensation purposes, and because it better measures the ongoing earnings results of our strategic and operating decisions by excluding the earnings effects of our legacy matters; restructuring and repositioning activities; certain acquisition-related items; and certain other items that are not representative of underlying trends.
We use Adjusted EBITDA, Adjusted EBIT Return Onon Invested Capital, Adjusted Gross Margin, and Adjusted EPS as performance measures and may use these measures in determining certain incentive compensation. We use Adjusted EBIT Return Onon Invested Capital in making operating and investment decisions and in balancing the growth and profitability of our operations.
We use Net Sales,the change in net sales on a constant currency basis as a performance measure to compare current period financial performance to historical financial performance by excluding the impact of foreign currency exchange rate fluctuations that are not representative of underlying business trends and are largely outside of our control.
Adjusted EBIT, Adjusted EBITDA, Adjusted EBIT Return Onon Invested Capital, Adjusted Gross Margin, Adjusted EPS, and Net Sales,the change in net sales on a constant currency basis are non-GAAP financial measures; do not purport to represent income measures as defined under U.S. GAAP; and should not be used as alternatives to such measures as an indicator of our performance. These measures are provided to investors and others to improve the period-to-period comparability and peer-to-peer comparability of our financial results, and to ensure that investors understand the information we use to evaluate the performance of our businesses. They distinguish the operating results of Grace’s current business base from the costs of Grace’s legacy matters; restructuring and
repositioning activities; and certain other items. These measures may have material limitations due to the exclusion or inclusion of amounts that are included or excluded, respectively, in the most directly comparable measures calculated and presented in accordance with U.S. GAAP, and thus investors and others should review carefully our financial results calculated in accordance with U.S. GAAP.
Adjusted EBIT has material limitations as an operating performance measure because it excludes costs related to legacy matters, and may exclude income and expenses from restructuring, repositioning, and other activities, which historically have been material components of our net income. Adjusted EBITDA also has material limitations as an operating performance measure because it excludes the impact of depreciation and amortization expense. Our business is substantially dependent on the successful deployment of capital, and depreciation and amortization expense is a necessary element of our costs. We compensate for the limitations of these measurements by using these indicators together with net income as measured under U.S. GAAP to present a complete analysis of our results of operations. Adjusted EBIT and Adjusted EBITDA should be evaluated together with net income and net income attributable to Grace shareholders, measured under U.S. GAAP, for a complete understanding of our results of operations.
|
| | | | | | | | | | | | | | | | | | | | | |
Analysis of Operations (In millions, except per share amounts) | Three Months Ended September 30, | | Nine Months Ended September 30, |
| 2020 | | 2019 | | % Change | | 2020 | | 2019 | | % Change |
| Net sales: | | | | | | | | | | | |
| Catalysts Technologies | $ | 305.7 |
| | $ | 361.4 |
| | (15.4 | )% | | $ | 922.7 |
| | $ | 1,106.8 |
| | (16.6 | )% |
| Materials Technologies | 113.7 |
| | 109.1 |
| | 4.2 | % | | 336.9 |
| | 346.8 |
| | (2.9 | )% |
| Total Grace net sales | $ | 419.4 |
| | $ | 470.5 |
| | (10.9 | )% | | $ | 1,259.6 |
| | $ | 1,453.6 |
| | (13.3 | )% |
| Net sales by region: | | | | | | | | | | | |
| North America | $ | 118.6 |
| | $ | 137.5 |
| | (13.7 | )% | | $ | 364.2 |
| | $ | 437.9 |
| | (16.8 | )% |
| Europe Middle East Africa | 182.7 |
| | 195.6 |
| | (6.6 | )% | | 526.2 |
| | 604.3 |
| | (12.9 | )% |
| Asia Pacific | 97.7 |
| | 117.5 |
| | (16.9 | )% | | 310.7 |
| | 345.4 |
| | (10.0 | )% |
| Latin America | 20.4 |
| | 19.9 |
| | 2.5 | % | | 58.5 |
| | 66.0 |
| | (11.4 | )% |
| Total net sales by region | $ | 419.4 |
| | $ | 470.5 |
| | (10.9 | )% | | $ | 1,259.6 |
| | $ | 1,453.6 |
| | (13.3 | )% |
| Performance measures: | | | | | | | | | | | |
| Adjusted EBIT(A): | | | | | | | | | | | |
| Catalysts Technologies segment operating income | $ | 67.1 |
| | $ | 105.1 |
| | (36.2 | )% | | $ | 220.8 |
| | $ | 332.6 |
| | (33.6 | )% |
| Materials Technologies segment operating income | 24.3 |
| | 26.1 |
| | (6.9 | )% | | 55.9 |
| | 74.2 |
| | (24.7 | )% |
| Corporate costs | (18.2 | ) | | (18.5 | ) | | 1.6 | % | | (50.5 | ) | | (52.7 | ) | | 4.2 | % |
| Certain pension costs(B) | (3.6 | ) | | (4.5 | ) | | 20.0 | % | | (10.2 | ) | | (13.9 | ) | | 26.6 | % |
| Adjusted EBIT | 69.6 |
| | 108.2 |
| | (35.7 | )% | | 216.0 |
| | 340.2 |
| | (36.5 | )% |
| Loss on early extinguishment of debt | (39.4 | ) | | — |
| | | | (39.4 | ) | | — |
| | |
| Costs related to legacy matters | (30.6 | ) | | (3.7 | ) | | | | (36.1 | ) | | (52.1 | ) | | |
| Restructuring and repositioning expenses attributable to W. R. Grace & Co. shareholders(C) | (2.4 | ) | | (3.4 | ) | | | | (26.5 | ) | | (12.1 | ) | | |
| Inventory write-offs(D) | (0.1 | ) | | — |
| | | | (19.8 | ) | | (3.6 | ) | | |
| Third-party acquisition-related costs | (0.3 | ) | | (1.4 | ) | | | | (3.8 | ) | | (2.7 | ) | | |
| Taxes and interest included in equity in earnings of unconsolidated affiliate | (0.4 | ) | | (0.4 | ) | | | | (0.6 | ) | | (1.3 | ) | | |
| Interest expense, net | (19.6 | ) | | (18.3 | ) | | (7.1 | )% | | (56.2 | ) | | (56.8 | ) | | 1.1 | % |
| (Provision for) benefit from income taxes | 30.2 |
| | (27.3 | ) | | 210.6 | % | | 8.1 |
| | (57.0 | ) | | 114.2 | % |
| Net income (loss) attributable to W. R. Grace & Co. shareholders | $ | 7.0 |
| | $ | 53.7 |
| | (87.0 | )% | | $ | 41.7 |
| | $ | 154.6 |
| | (73.0 | )% |
| Diluted EPS | $ | 0.11 |
| | $ | 0.80 |
| | (86.3 | )% | | $ | 0.63 |
| | $ | 2.31 |
| | (72.7 | )% |
| Adjusted EPS | $ | 0.56 |
| | $ | 0.98 |
| | (42.9 | )% | | $ | 1.76 |
| | $ | 3.07 |
| | (42.7 | )% |
|
| | | | | | | | | | | | | | | | | | | | | |
Analysis of Operations (In millions, except per share amounts) | Three Months Ended September 30, | | Nine Months Ended September 30, |
| 2019 | | 2018 | | % Change | | 2019 | | 2018 | | % Change |
| Net sales: | | | | | | | | | | | |
| Catalysts Technologies | $ | 361.4 |
| | $ | 378.2 |
| | (4.4 | )% | | $ | 1,106.8 |
| | $ | 1,058.4 |
| | 4.6 | % |
| Materials Technologies | 109.1 |
| | 116.7 |
| | (6.5 | )% | | 346.8 |
| | 353.7 |
| | (2.0 | )% |
| Total Grace net sales | $ | 470.5 |
| | $ | 494.9 |
| | (4.9 | )% | | $ | 1,453.6 |
| | $ | 1,412.1 |
| | 2.9 | % |
| Net sales by region: | | | | | | | | | | | |
| North America | $ | 137.5 |
| | $ | 152.9 |
| | (10.1 | )% | | $ | 437.9 |
| | $ | 426.3 |
| | 2.7 | % |
| Europe Middle East Africa | 195.6 |
| | 187.9 |
| | 4.1 | % | | 604.3 |
| | 552.0 |
| | 9.5 | % |
| Asia Pacific | 117.5 |
| | 123.5 |
| | (4.9 | )% | | 345.4 |
| | 347.8 |
| | (0.7 | )% |
| Latin America | 19.9 |
| | 30.6 |
| | (35.0 | )% | | 66.0 |
| | 86.0 |
| | (23.3 | )% |
| Total net sales by region | $ | 470.5 |
| | $ | 494.9 |
| | (4.9 | )% | | $ | 1,453.6 |
| | $ | 1,412.1 |
| | 2.9 | % |
| Performance measures: | | | | | | | | | | | |
| Adjusted EBIT(A): | | | | | | | | | | | |
| Catalysts Technologies segment operating income | $ | 104.7 |
| | $ | 119.5 |
| | (12.4 | )% | | $ | 331.3 |
| | $ | 325.3 |
| | 1.8 | % |
| Materials Technologies segment operating income | 26.1 |
| | 26.6 |
| | (1.9 | )% | | 74.2 |
| | 80.3 |
| | (7.6 | )% |
| Corporate costs | (18.5 | ) | | (19.7 | ) | | 6.1 | % | | (52.7 | ) | | (56.1 | ) | | 6.1 | % |
| Certain pension costs(B) | (4.5 | ) | | (3.8 | ) | | (18.4 | )% | | (13.9 | ) | | (11.6 | ) | | (19.8 | )% |
| Adjusted EBIT | 107.8 |
| | 122.6 |
| | (12.1 | )% | | 338.9 |
| | 337.9 |
| | 0.3 | % |
| Costs related to legacy matters | (3.7 | ) | | (74.6 | ) | | | | (52.1 | ) | | (78.8 | ) | | |
| Restructuring and repositioning expenses | (3.4 | ) | | (8.4 | ) | | | | (12.1 | ) | | (32.8 | ) | | |
| Write-off of MTO inventory(C) | — |
| | — |
| | | | (3.6 | ) | | — |
| | |
| Third-party acquisition-related costs | (1.4 | ) | | (0.5 | ) | | | | (2.7 | ) | | (7.2 | ) | | |
| Amortization of acquired inventory fair value adjustment | — |
| | (2.3 | ) | | | | — |
| | (6.9 | ) | | |
| Loss on early extinguishment of debt | — |
| | — |
| | | | — |
| | (4.8 | ) | | |
| Interest expense, net | (18.3 | ) | | (20.0 | ) | | 8.5 | % | | (56.8 | ) | | (58.4 | ) | | 2.7 | % |
| (Provision for) benefit from income taxes | (27.3 | ) | | (0.7 | ) | | NM |
| | (57.0 | ) | | (50.5 | ) | | (12.9 | )% |
| Income (loss) attributable to W. R. Grace & Co. shareholders | $ | 53.7 |
| | $ | 16.1 |
| | 233.5 | % | | $ | 154.6 |
| | $ | 98.5 |
| | 57.0 | % |
| Diluted EPS | $ | 0.80 |
| | $ | 0.24 |
| | 233.3 | % | | $ | 2.31 |
| | $ | 1.46 |
| | 58.2 | % |
| Adjusted EPS | $ | 0.98 |
| | $ | 1.11 |
| | (11.7 | )% | | $ | 3.07 |
| | $ | 3.00 |
| | 2.3 | % |
| | Analysis of Operations (In millions) | Three Months Ended September 30, | | Nine Months Ended September 30, | Three Months Ended September 30, | | Nine Months Ended September 30, |
| 2019 | | 2018 | | % Change | | 2019 | | 2018 | | % Change | 2020 | | 2019 | | % Change | | 2020 | | 2019 | | % Change |
| Adjusted performance measures: | |
| | |
| | |
| | | | | | | |
| | |
| | |
| | | | | | |
| Gross Margin: | |
| | |
| | |
| | | | | | | |
| | |
| | |
| | | | | | |
| Catalysts Technologies | 42.0 | % | | 43.4 | % | | (1.4) pts |
| | 42.8 | % | | 42.8 | % | | 0.0 pts |
| 39.2 | % | | 42.0 | % | | (280) bps |
| | 38.8 | % | | 42.8 | % | | (400) bps |
|
| Materials Technologies | 38.6 | % | | 37.6 | % | | 1.0 pts |
| | 37.0 | % | | 38.0 | % | | (1.0) pts |
| 35.7 | % | | 38.6 | % | | (290) bps |
| | 31.9 | % | | 37.0 | % | | (510) bps |
|
| Adjusted Gross Margin | 41.2 | % | | 42.0 | % | | (0.8) pts |
| | 41.4 | % | | 41.6 | % | | (0.2) pts |
| 38.2 | % | | 41.2 | % | | (300) bps |
| | 37.0 | % | | 41.4 | % | | (440) bps |
|
| Amortization of acquired inventory fair value adjustment | — | % | | (0.5 | )% | | 0.5 pts |
| | — | % | | (0.5 | )% | | 0.5 pts |
| |
| Write-off of MTO inventory(C) | — | % | | — | % | | 0.0 pts |
| | (0.3 | )% | | — | % | | (0.3) pts |
| |
| Inventory write-offs(D) | | — | % | | — | % | | 0 bps |
| | (1.6 | )% | | (0.3 | )% | | (130) bps |
|
| Pension costs in cost of goods sold | (0.6 | )% | | (0.6 | )% | | 0.0 pts |
| | (0.6 | )% | | (0.7 | )% | | 0.1 pts |
| (0.9 | )% | | (0.6 | )% | | (30) bps |
| | (0.8 | )% | | (0.6 | )% | | (20) bps |
|
| Total Grace | 40.6 | % | | 40.9 | % | | (0.3) pts |
| | 40.5 | % | | 40.4 | % | | 0.1 pts |
| 37.3 | % | | 40.6 | % | | (330) bps |
| | 34.6 | % | | 40.5 | % | | (590) bps |
|
| Adjusted EBIT: | |
| | |
| | |
| | |
| | |
| | |
| |
| | |
| | |
| | |
| | |
| | |
|
| Catalysts Technologies | $ | 104.7 |
| | $ | 119.5 |
| | (12.4 | )% | | $ | 331.3 |
| | $ | 325.3 |
| | 1.8 | % | $ | 67.1 |
| | $ | 105.1 |
| | (36.2 | )% | | $ | 220.8 |
| | $ | 332.6 |
| | (33.6 | )% |
| Materials Technologies | 26.1 |
| | 26.6 |
| | (1.9 | )% | | 74.2 |
| | 80.3 |
| | (7.6 | )% | 24.3 |
| | 26.1 |
| | (6.9 | )% | | 55.9 |
| | 74.2 |
| | (24.7 | )% |
| Corporate, pension, and other | (23.0 | ) | | (23.5 | ) | | 2.1 | % | | (66.6 | ) | | (67.7 | ) | | 1.6 | % | (21.8 | ) | | (23.0 | ) | | 5.2 | % | | (60.7 | ) | | (66.6 | ) | | 8.9 | % |
| Total Grace | 107.8 |
| | 122.6 |
| | (12.1 | )% | | 338.9 |
| | 337.9 |
| | 0.3 | % | $ | 69.6 |
| | $ | 108.2 |
| | (35.7 | )% | | $ | 216.0 |
| | $ | 340.2 |
| | (36.5 | )% |
| Depreciation and amortization: | |
| | |
| | |
| | |
| | |
| | |
| |
| | |
| | |
| | |
| | |
| | |
|
| Catalysts Technologies depreciation and amortization | | $ | 21.5 |
| | $ | 20.7 |
| | 3.9 | % | | $ | 62.8 |
| | $ | 61.4 |
| | 2.3 | % |
| Depreciation and amortization included in equity in earnings of unconsolidated affiliate | | 1.1 |
| | 0.2 |
| | NM |
| | 1.9 |
| | 0.4 |
| | NM |
|
| Catalysts Technologies | $ | 20.7 |
| | $ | 20.7 |
| | — | % | | $ | 61.4 |
| | $ | 61.4 |
| | — | % | 22.6 |
| | 20.9 |
| | 8.1 | % | | 64.7 |
| | 61.8 |
| | 4.7 | % |
| Materials Technologies | 3.6 |
| | 3.6 |
| | — | % | | 10.7 |
| | 12.0 |
| | (10.8 | )% | 3.6 |
| | 3.6 |
| | — | % | | 10.7 |
| | 10.7 |
| | — | % |
| Corporate | 1.2 |
| | 0.9 |
| | 33.3 | % | | 3.2 |
| | 2.7 |
| | 18.5 | % | 1.2 |
| | 1.2 |
| | — | % | | 3.6 |
| | 3.2 |
| | 12.5 | % |
| Adjusted Depreciation and Amortization | | 27.4 |
| | 25.7 |
| | 6.6 | % | | 79.0 |
| | 75.7 |
| | 4.4 | % |
| Depreciation and amortization included in equity in earnings of unconsolidated affiliate | | (1.1 | ) | | (0.2 | ) | | NM |
| | (1.9 | ) | | (0.4 | ) | | NM |
|
| Total Grace | 25.5 |
| | 25.2 |
| | 1.2 | % | | 75.3 |
| | 76.1 |
| | (1.1 | )% | $ | 26.3 |
| | $ | 25.5 |
| | 3.1 | % | | $ | 77.1 |
| | $ | 75.3 |
| | 2.4 | % |
| Adjusted EBITDA: | |
| | |
| | |
| | |
| | |
| | |
| |
| | |
| | |
| | |
| | |
| | |
|
| Catalysts Technologies | $ | 125.4 |
| | $ | 140.2 |
| | (10.6 | )% | | $ | 392.7 |
| | $ | 386.7 |
| | 1.6 | % | $ | 89.7 |
| | $ | 126.0 |
| | (28.8 | )% | | $ | 285.5 |
| | $ | 394.4 |
| | (27.6 | )% |
| Materials Technologies | 29.7 |
| | 30.2 |
| | (1.7 | )% | | 84.9 |
| | 92.3 |
| | (8.0 | )% | 27.9 |
| | 29.7 |
| | (6.1 | )% | | 66.6 |
| | 84.9 |
| | (21.6 | )% |
| Corporate, pension, and other | (21.8 | ) | | (22.6 | ) | | 3.5 | % | | (63.4 | ) | | (65.0 | ) | | 2.5 | % | (20.6 | ) | | (21.8 | ) | | 5.5 | % | | (57.1 | ) | | (63.4 | ) | | 9.9 | % |
| Total Grace | 133.3 |
| | 147.8 |
| | (9.8 | )% | | 414.2 |
| | 414.0 |
| | — | % | $ | 97.0 |
| | $ | 133.9 |
| | (27.6 | )% | | $ | 295.0 |
| | $ | 415.9 |
| | (29.1 | )% |
| Adjusted EBIT margin: | |
| | |
| | |
| | | | | | | |
| | |
| | |
| | | | | | |
| Catalysts Technologies | 29.0 | % | | 31.6 | % | | (2.6) pts |
| | 29.9 | % | | 30.7 | % | | (0.8) pts |
| 21.9 | % | | 29.1 | % | | (720) bps |
| | 23.9 | % | | 30.1 | % | | (620) bps |
|
| Materials Technologies | 23.9 | % | | 22.8 | % | | 1.1 pts |
| | 21.4 | % | | 22.7 | % | | (1.3) pts |
| 21.4 | % | | 23.9 | % | | (250) bps |
| | 16.6 | % | | 21.4 | % | | (480) bps |
|
| Total Grace | 22.9 | % | | 24.8 | % | | (1.9) pts |
| | 23.3 | % | | 23.9 | % | | (0.6) pts |
| 16.6 | % | | 23.0 | % | | (640) bps |
| | 17.1 | % | | 23.4 | % | | (630) bps |
|
| Net income margin | | 1.7 | % | | 11.4 | % | | (970) bps |
| | 3.3 | % | | 10.6 | % | | (730) bps |
|
| Adjusted EBITDA margin: | |
| | |
| | |
| | |
| | |
| | |
| |
| | |
| | |
| | |
| | |
| | |
|
| Catalysts Technologies | 34.7 | % | | 37.1 | % | | (2.4) pts |
| | 35.5 | % | | 36.5 | % | | (1.0) pts |
| 29.3 | % | | 34.9 | % | | (560) bps |
| | 30.9 | % | | 35.6 | % | | (470) bps |
|
| Materials Technologies | 27.2 | % | | 25.9 | % | | 1.3 pts |
| | 24.5 | % | | 26.1 | % | | (1.6) pts |
| 24.5 | % | | 27.2 | % | | (270) bps |
| | 19.8 | % | | 24.5 | % | | (470) bps |
|
| Total Grace | 28.3 | % | | 29.9 | % | | (1.6) pts |
| | 28.5 | % | | 29.3 | % | | (0.8) pts |
| 23.1 | % | | 28.5 | % | | (540) bps |
| | 23.4 | % | | 28.6 | % | | (520) bps |
|
| | Analysis of Operations (In millions) | Four Quarters Ended September 30, | Four Quarters Ended September 30, |
| 2019 | | 2018 | 2020 | | 2019 |
| Calculation of Adjusted EBIT Return On Invested Capital (trailing four quarters): | |
| Calculation of Adjusted EBIT Return on Invested Capital (trailing four quarters): | | Calculation of Adjusted EBIT Return on Invested Capital (trailing four quarters): |
| Net income (loss) attributable to W. R. Grace & Co. shareholders | $ | 223.7 |
| | $ | (24.5 | ) | $ | 13.4 |
| | $ | 223.7 |
|
| Adjusted EBIT | 457.7 |
| | 453.0 |
| 350.3 |
| | 457.7 |
|
| | | | | |
| Reconciliation to Adjusted Invested Capital: | | | | |
| Total equity | 451.7 |
| | 280.2 |
| 320.5 |
| | 451.7 |
|
| Reconciliation to Invested Capital: | | | | |
| Total debt | 1,982.2 |
| | 1,986.5 |
| 2,004.4 |
| | 1,982.2 |
|
| Underfunded and unfunded defined benefit pension plans | 424.3 |
| | 455.5 |
| 532.5 |
| | 424.3 |
|
| Liabilities related to legacy matters | 163.2 |
| | 129.0 |
| 225.7 |
| | 163.2 |
|
| Cash, cash equivalents, and restricted cash | (218.9 | ) | | (153.3 | ) | (268.9 | ) | | (218.9 | ) |
| Net income tax assets | (491.9 | ) | | (522.6 | ) | |
| Income taxes, net | | (541.3 | ) | | (491.9 | ) |
| Other items | 31.0 |
| | 27.2 |
| 25.9 |
| | 31.0 |
|
| Adjusted Invested Capital | $ | 2,341.6 |
| | $ | 2,202.5 |
| $ | 2,298.8 |
| | $ | 2,341.6 |
|
| | | | | | | |
| Return on equity | 49.5 | % | | (8.7 | )% | 4.2 | % | | 49.5 | % |
| Adjusted EBIT Return On Invested Capital | 19.5 | % | | 20.6 | % | |
| Adjusted EBIT Return on Invested Capital | | 15.2 | % | | 19.5 | % |
Amounts may not add due to rounding.
NM—Not meaningful
| |
| (A) | Grace’s segment operating income includes only Grace’s share of income of consolidated and unconsolidated joint ventures. |
| |
| (B) | Certain pension costs include only ongoing costs recognized quarterly, which include service and interest costs, expected returns on plan assets, and amortization of prior service costs/credits. Catalysts Technologies and Materials Technologies segment operating income and corporate costs do not include any amounts for pension expense. Other pension-related costs including annual mark-to-market (MTM) adjustments and actuarial gains and losses are excluded from Adjusted EBIT. These amounts are not used by management to evaluate the performance of Grace’s businesses and significantly affect the peer-to-peer and period-to-period comparability of our financial results. Mark-to-market adjustments and actuarial gains and losses relate primarily to changes in financial market values and actuarial assumptions and are not directly related to the operation of Grace’s businesses. |
| |
| (C) | In JuneNet of restructuring and repositioning expenses attributable to Grace’s joint venture partner. |
| |
| (D) | Inventory write-off in 2020 related to the changes in hydroprocessing catalysts manufacturing operations. Inventory write-off in 2019 we idled ourrelated to the idling of Grace’s methanol-to-olefins (“MTO”) manufacturing facility in China.facility. |
Grace Overview
Following is an overview of our financial performance for the third quarter and nine months compared with the corresponding prior-year periods.
Discrete Items ImpactingImpact of COVID-19 Pandemic and Recession
While COVID-19 had a significant negative impact on our financial results for the Third Quarternine months, we are well positioned to meet the operational and financial challenges caused by the pandemic until the economy recovers. Our first priority is the health and safety of our employees. We have fully implemented our pandemic response plan, including significant new safety protocols throughout our operations. We are also focused on business continuity to ensure we continue delivering value to all of our customers. Our workforce remains safe and healthy, and we have experienced no business continuity issues in our global operations or supply chain. Approximately 45% of our global workforce shifted to working remotely beginning in March 2020. During the 2020 second quarter, some locations began phased returns to on-site work, as local regulations and medical conditions allowed.
Three discrete items (the “Discrete Items”)We have impactedtaken decisive actions to mitigate the economic effects of the pandemic to ensure we generate strong cash flow this year, including lowering capital spending approximately $40 million, improving working capital to generate $45 to $50 million of cash flow, reducing operating costs by $35 to $40 million, and aligning production volumes to match near-term demand. These reductions are against our original 2020 operating plan.
Understanding near-term demand in our segments is critically important to effectively managing our operations, working capital, and costs. We are triangulating customer information, economic and industry data, inventory levels, and our own experience in prior downturns to plan the fourth quarter. For the fourth quarter, we are planning for:
Specialty catalysts demand to improve sequentially, with polyolefin catalyst demand improving in all regions and non-durable end markets continuing to show strength, particularly in hygiene and packaging applications;
FCC catalysts demand to improve sequentially, as the demand for transportation fuels has stabilized and we are seeing recovery from 2020 second quarter lows. Transportation fuel demand and refinery utilization still remain below normal levels for the industry and the effects of the pandemic are expected to continue to be a headwind until demand more fully recovers; and
Materials Technologies demand to improve sequentially with continued strength in pharma/consumer end markets driven by consumers’ focus on health and personal care needs, higher demand in coatings end markets, and ongoing recovery in wood/coil applications.
Overall, we are planning for 2020 fourth quarter sales to be up 10% to 13% compared with the third quarter. We are using this assumption to set our production plans, sourcing plans, and cost reduction plans. We are planning for 2020 fourth quarter Adjusted Gross Margin to increase approximately 100 basis points sequentially. We expect Adjusted Gross Margin to recover to pre-pandemic levels as demand improves and production rates increase.
See Item 1A. (Risk Factors) in Part II of this Report for more information on the risks we face related to the COVID-19 pandemic. With respect to the above information regarding our expectations for the 2020 fourth quarter and other statements regarding future events, see “Forward-Looking Statements,” below.
Impact of Hurricane Laura
During the third quarter, results:Hurricane Laura caused severe and widespread damage to Lake Charles, Louisiana, and surrounding communities, including catastrophic damage to the regional power grid. To ensure continuity of supply for our customers, our Lake Charles refining catalysts manufacturing facility established a temporary on-site 20MW power generation capability. The site is now fully operational. During the power outage, customer demand was met from inventory in Lake Charles and by shifting FCC and hydroprocessing catalysts production to other manufacturing facilities, which increased our operating costs. This created no significant impact to our customers. While this is an insured event, the total costs do not exceed our deductible, and we do not expect any insurance recoveries.
| |
• | Refining Technologies: an FCC catalysts customer's bankruptcy following an explosion and fire;Event-related costs occurring in the third quarter were approximately $12 million. The costs, included in Catalysts Technologies segment operating income, were primarily related to on-site power generation, incremental operations and logistics costs to supply customers during the outage, temporary housing and employee assistance, and property damage and clean-up. |
| |
• | Specialty Catalysts: a customer-specific inventory correction in the second half of 2019; and
|
| |
• | Materials Technologies: an equipment failure in one of our silicas manufacturing lines (operations fully restored by mid-July).
|
The net effect of these events, including benefits of cost reduction activities, was a reduction to pretax income of approximately $15.5 milliontotal estimated hurricane-related costs for the third quarter.full year are expected to be $18 to $20 million.
Net Sales and Gross Margin
Sales were $470.5 million and $1,453.6 million for the third quarter and nine months, respectively,decreased 10.9%, down 11.4% on constant currency, compared with $494.9 millionthe prior-year quarter primarily due to lower sales volumes from the effects of the pandemic on global transportation fuels demand and $1,412.1 million forrefinery operating rates. Unfavorable pricing was more than offset by favorable currency translation. Sequentially, sales were up slightly compared with the corresponding prior-year periods. The decline2020 second quarter, with demand improving each month during the third quarter. We expect this trend to continue in salesthe 2020 fourth quarter.
Gross margin decreased 330 basis points to 37.3% for the third quarter was due in partquarter. Adjusted Gross Margin decreased 300 basis points to the Discrete Items. Gross margin was 40.6% and 40.5%38.2% for the third quarterquarter. The decreases were primarily driven by under-absorbed fixed costs resulting from lower production volumes and nine months, respectively, compared with 40.9%inventory reductions, partially offset by improved product mix and 40.4% for the corresponding prior-year periods.cost mitigation actions. Strong sequential improvement in gross margin (up 880 basis points) and Adjusted Gross Margin (up 410 basis points) compared with the 2020 second quarter was 41.2% and 41.4%primarily driven by higher production rates.
Sales for the third quarter and nine months respectively,decreased 13.3%, down 12.9% on constant currency, compared with 42.0%the prior-year period. The decrease was primarily due to lower demand for global transportation fuels and 41.6%refinery operating rates driven by the COVID-19 pandemic and recession and a generally weaker manufacturing environment during the 2020 first quarter. Improved pricing was partially offset by unfavorable currency translation.
Gross margin decreased 590 basis points to 34.6% for the corresponding prior-year periods.nine months. Adjusted Gross Margin decreased 440 basis points to 37.0%. The decreases were primarily driven by under-absorbed fixed costs resulting from lower production volumes and inventory reductions, partially offset by cost mitigation actions and improved pricing.
The following tables identify the year-over-year increase or decrease in sales attributable to changes in sales volume and/or mix, product price, and the impact of currency translation.
| | | | Three Months Ended September 30, 2019
as a Percentage Increase (Decrease) from
Three Months Ended September 30, 2018 | Three Months Ended September 30, 2020
as a Percentage Increase (Decrease) from
Three Months Ended September 30, 2019 |
| Net Sales Variance Analysis | Volume | | Price | | Currency Translation | | Total | Volume | | Price | | Currency Translation | | Total |
| Catalysts Technologies | (7.0 | )% | | 3.4 | % | | (0.8 | )% | | (4.4 | )% | (15.4 | )% | | (0.5 | )% | | 0.5 | % | | (15.4 | )% |
| Materials Technologies | (5.5 | )% | | 1.6 | % | | (2.6 | )% | | (6.5 | )% | 3.8 | % | | — | % | | 0.4 | % | | 4.2 | % |
| Net sales | (6.7 | )% | | 3.0 | % | | (1.2 | )% | | (4.9 | )% | (11.0 | )% | | (0.4 | )% | | 0.5 | % | | (10.9 | )% |
| By Region: | | | | | | | | | | | | | | |
| North America | (12.6 | )% | | 2.5 | % | | — | % | | (10.1 | )% | (12.5 | )% | | (1.2 | )% | | — | % | | (13.7 | )% |
| Europe Middle East Africa (EMEA) | 3.4 | % | | 3.4 | % | | (2.7 | )% | | 4.1 | % | (8.9 | )% | | 0.4 | % | | 1.9 | % | | (6.6 | )% |
| Asia Pacific | (7.8 | )% | | 2.9 | % | | — | % | | (4.9 | )% | (16.9 | )% | | — | % | | — | % | | (16.9 | )% |
| Latin America | (36.2 | )% | | 3.5 | % | | (2.3 | )% | | (35.0 | )% | 12.6 | % | | (3.6 | )% | | (6.5 | )% | | 2.5 | % |
|
| | | | | | | | | | | |
| | Nine Months Ended September 30, 2020
as a Percentage Increase (Decrease) from
Nine Months Ended September 30, 2019 |
| Net Sales Variance Analysis | Volume | | Price | | Currency Translation | | Total |
| Catalysts Technologies | (17.2 | )% | | 0.8 | % | | (0.2 | )% | | (16.6 | )% |
| Materials Technologies | (2.1 | )% | | 0.3 | % | | (1.1 | )% | | (2.9 | )% |
| Net sales | (13.6 | )% | | 0.7 | % | | (0.4 | )% | | (13.3 | )% |
| By Region: | | | | | | | |
| North America | (17.2 | )% | | 0.4 | % | | — | % | | (16.8 | )% |
| Europe Middle East Africa | (14.1 | )% | | 1.7 | % | | (0.5 | )% | | (12.9 | )% |
| Asia Pacific | (9.4 | )% | | (0.5 | )% | | (0.1 | )% | | (10.0 | )% |
| Latin America | (6.9 | )% | | (0.7 | )% | | (3.8 | )% | | (11.4 | )% |
Grace Net Income (Loss)
Net income attributable to Grace was $7.0 million for the third quarter, decreased 4.9%, down 3.7% on constant currency, compared with $53.7 million for the prior-year quarter. Lower sales volumes in Catalysts Technologies were driven by declines in the Americas and Asia, partially offset by growth in EMEA. The Discrete Items contributed to the decline in Catalysts sales volumes. Sales volumes in Materials Technologies were down driven by declines in EMEA, North America, and Asia, partially offset by growth in Latin America. Improved pricing benefited both segments anddecrease was partially offset by unfavorable currency translation.
Gross margin decreased 30 basis points to 40.6% for the third quarter. Adjusted Gross Margin decreased 80 basis points to 41.2% for the third quarter. The decreases were primarily due to higher manufacturing costs, partially offset by improved pricinglower gross profit in the third quarter, a $27.0 million charge related to the Libby dam spillway replacement project (see below), and a 50 basis point impact related to lower raw materials and energy costs.$39.4 million loss on early
|
| | | | | | | | | | | |
| | Nine Months Ended September 30, 2019
as a Percentage Increase (Decrease) from
Nine Months Ended September 30, 2018 |
| Net Sales Variance Analysis | Volume | | Price | | Currency Translation | | Total |
| Catalysts Technologies | 3.0 | % | | 2.9 | % | | (1.3 | )% | | 4.6 | % |
| Materials Technologies | 0.2 | % | | 1.9 | % | | (4.1 | )% | | (2.0 | )% |
| Net sales | 2.2 | % | | 2.7 | % | | (2.0 | )% | | 2.9 | % |
| By Region: | | | | | | | |
| North America | (0.2 | )% | | 2.9 | % | | — | % | | 2.7 | % |
| Europe Middle East Africa | 11.0 | % | | 2.7 | % | | (4.2 | )% | | 9.5 | % |
| Asia Pacific | (2.0 | )% | | 1.6 | % | | (0.3 | )% | | (0.7 | )% |
| Latin America | (24.0 | )% | | 5.2 | % | | (4.5 | )% | | (23.3 | )% |
Sales for the nine months increased 2.9%, up 4.9% on constant currency, compared with the prior-year period. Higher sales volumes in Catalysts Technologies were driven by specialty catalysts due to growth in EMEA and Asia in the existing businesses as well as sales from the polyolefin catalysts acquisition completed in 2018, partially offset by the Discrete Items. Sales volumes in Materials Technologies were up driven by growth in the Americas and EMEA,extinguishment of debt, partially offset by a decline in Asia. Improved pricing benefited both segments and was partially offset by unfavorable currency translation.
Gross margin increased 10 basis points to 40.5% for the nine months. Adjusted Gross Margin decreased 20 basis points to 41.4% for the nine months. Higher manufacturing costs, including a 50 basis point impact related to higher raw materials and energy costs, were mostly offset by improved pricing, favorable mix,benefit from income tax attributes (see “Income Taxes” below) and lower depreciation.
Grace Net Income
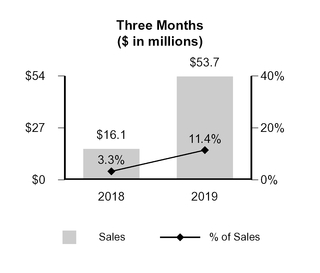
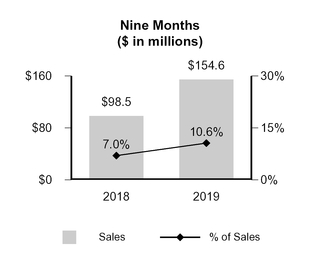
Net income attributable to Grace was $53.7 million for the third quarter, an increase of 233.5% compared with $16.1 million for the prior-year quarter. The increase was primarily due to a pretax charge of $70.0 million in the prior-year quarter for the estimated costs to remediate our former vermiculite mine site, partially offset by a higher provision for income taxes and lower operating income from our Catalysts Technologies segment in the 2019 third quarter.
Net income attributable to Grace was $154.6$41.7 million for the nine months, an increase of 57.0% compared with $98.5$154.6 million for the prior-year period. The increasedecrease was primarily due to lower costs related to legacy matters, lower restructuringgross profit in the nine months including the write-off of obsolete inventory, the loss on early extinguishment of debt, and repositioning expenses, lowera write-off of previously capitalized plant engineering and site costs, related to acquisitions, and higher operating income from our Catalysts Technologies segment, partially offset by a higher provisionbenefit from income tax attributes, $16.3 million in business interruption insurance recoveries, and lower operating expenses.
During the third quarter, we completed a review of contractor bids for income taxes.the replacement of the upper portion of the dam spillway at the former Libby, Montana, mine site. Based on a current assessment of the project requirements, we increased our cost estimate for the total project by $27.0 million, to $95.0 million. The prior-year period included charges of $45.0 million related to these projects. The 2019 fourth quarter included additional charges of $23.0 million related to these projects. See Note 8 to the Consolidated Financial Statements for further discussion.
During the 2020 second quarter, we implemented changes to our Refining Technologies manufacturing operations and global footprint to drive capital and operating efficiencies as well as support global growth.
Hydroprocessing Catalysts Manufacturing Operations: In connection with our ongoing operating excellence initiatives, we have accelerated the implementation of the Grace Manufacturing System at our three hydroprocessing catalyst manufacturing sites, including optimization of plant processes and key organizational changes. These changes are expected to benefit operating margins in our ART joint venture with the savings realized beginning in the third quarter. Any margin benefits will be recognized through our equity earnings in the joint venture.
As a result of these changes, we recorded a pre-tax charge of $19.7 million in the 2020 second quarter, which is reflected in cost of goods sold, related to a write-off of inventory now deemed obsolete based on the process changes. The expected cash costs to dispose of this inventory are approximately $1 million.
Middle East FCC Catalysts Plant: In agreement with our local joint venture partner, we have discontinued the previously announced project to build a full-scale FCC catalysts plant in the Middle East. The decision reflects the rapid advance of FCC catalysts technology and the value of maintaining flexibility in our global manufacturing operations to ensure we can supply the dynamic needs of our customers in a cost and capital efficient way. We will continue to invest in our existing manufacturing network to support new technology development and provide the flexibility required to produce advanced catalyst and additive platforms.
In the 2020 second quarter, we recorded a pre-tax charge of $19.7 million ($2.5 million of which was attributable to our joint venture partner) to write off engineering and site costs. The expected cash costs to implement this change are approximately $1 million.
Adjusted EBIT
Adjusted EBIT
Adjusted EBIT was $107.8$69.6 million for the third quarter, a decrease of 12.1%35.7% compared with the prior-year quarter. The decrease was primarily due to the netlower gross profit, an approximately $12 million impact of the Discrete Itemshurricane-related costs and lower income from our ART joint venture, partially offset by lower operating expenses.
Sequentially, Adjusted EBIT was $338.9up 8.6% compared with the 2020 second quarter driven by improved gross profit. Adjusted EBIT was $216.0 million for the nine months, an increasea decrease of 0.3%36.5% compared with the prior-year period. The increasedecrease was primarily due to higher sales andlower gross profit including the impact of the polyolefin catalysts acquisition, partially offset by the net impact of the Discrete Items,and lower income from our ART joint venture, partially offset by business interruption insurance recoveries and higher amortization expense.lower operating expenses.
Adjusted EPS
The following tables reconcile our Diluted EPS (GAAP) to our Adjusted EPS:EPS (non-GAAP):
|
| | | | | | | | | | | | | | | | | | | | | | | | | | | | | | | |
| | Three Months Ended September 30, |
| | 2019 | | 2018 |
| (In millions, except per share amounts) | Pre-Tax | | Tax Effect | | After-Tax | | Per Share | | Pre-Tax | | Tax Effect | | After-Tax | | Per Share |
| Diluted earnings per share | | | | | | | $ | 0.80 |
| | | | | | | | $ | 0.24 |
|
| Costs related to legacy matters | $ | 3.7 |
| | $ | 0.9 |
| | $ | 2.8 |
| | 0.04 |
| | $ | 74.6 |
| | $ | 17.4 |
| | $ | 57.2 |
| | 0.85 |
|
| Restructuring and repositioning expenses | 3.4 |
| | 1.1 |
| | 2.3 |
| | 0.03 |
| | 8.4 |
| | 2.7 |
| | 5.7 |
| | 0.08 |
|
| Third-party acquisition-related costs | 1.4 |
| | 0.3 |
| | 1.1 |
| | 0.02 |
| | 0.5 |
| | 0.1 |
| | 0.4 |
| | 0.01 |
|
| Amortization of acquired inventory fair value adjustment | — |
| | — |
| | — |
| | — |
| | 2.3 |
| | 0.5 |
| | 1.8 |
| | 0.03 |
|
| Income tax expense related to historical tax attributes(1) | | | (7.7 | ) | | 7.7 |
| | 0.12 |
| | | | (1.9 | ) | | 1.9 |
| | 0.03 |
|
| Discrete tax items | | | 1.7 |
| | (1.7 | ) | | (0.03 | ) | | | | 8.9 |
| | (8.9 | ) | | (0.13 | ) |
| Adjusted EPS | | | | | | | $ | 0.98 |
| | | | | | | | $ | 1.11 |
|
|
| | | | | | | | | | | | | | | | | | | | | | | | | | | | | | | |
| | Three Months Ended September 30, |
| | 2020 | | 2019 |
| (In millions, except per share amounts) | Pre-Tax | | Tax Effect | | After-Tax | | Per Share | | Pre-Tax | | Tax Effect | | After-Tax | | Per Share |
| Diluted earnings per share | | | | | | | $ | 0.11 |
| | | | | | | | $ | 0.80 |
|
| Loss on early extinguishment of debt | $ | 39.4 |
| | $ | 9.8 |
| | $ | 29.6 |
| | 0.45 |
| | $ | — |
| | $ | — |
| | $ | — |
| | — |
|
| Costs related to legacy matters | 30.6 |
| | 8.3 |
| | 22.3 |
| | 0.34 |
| | 3.7 |
| | 0.9 |
| | 2.8 |
| | 0.04 |
|
| Restructuring and repositioning expenses attributable to W. R. Grace & Co. shareholders | 2.4 |
| | 2.4 |
| | — |
| | — |
| | 3.4 |
| | 1.1 |
| | 2.3 |
| | 0.03 |
|
| Third-party acquisition-related costs | 0.3 |
| | 0.3 |
| | — |
| | — |
| | 1.4 |
| | 0.3 |
| | 1.1 |
| | 0.02 |
|
| Inventory write-offs | 0.1 |
| | 1.3 |
| | (1.2 | ) | | (0.02 | ) | | — |
| | — |
| | — |
| | — |
|
| Discrete tax items | | | 21.0 |
| | (21.0 | ) | | (0.32 | ) | | | | 1.7 |
| | (1.7 | ) | | (0.03 | ) |
| Income tax expense related to historical tax attributes(1) | | | — |
| | — |
| | — |
| | | | (7.7 | ) | | 7.7 |
| | 0.12 |
|
| Adjusted EPS | | | | | | | $ | 0.56 |
| | | | | | | | $ | 0.98 |
|
| | | | Nine Months Ended September 30, | Nine Months Ended September 30, |
| | 2019 | | 2018 | 2020 | | 2019 |
| (In millions, except per share amounts) | Pre-Tax | | Tax Effect | | After-Tax | | Per Share | | Pre-Tax | | Tax Effect | | After-Tax | | Per Share | Pre-Tax | | Tax Effect | | After-Tax | | Per Share | | Pre-Tax | | Tax Effect | | After-Tax | | Per Share |
| Diluted earnings per share | |
| | |
| | |
| | $ | 2.31 |
| | | | | | | | $ | 1.46 |
| |
| Diluted EPS | | |
| | |
| | |
| | $ | 0.63 |
| | | | | | | | $ | 2.31 |
|
| Loss on early extinguishment of debt | | $ | 39.4 |
| | $ | 9.8 |
| | $ | 29.6 |
| | 0.45 |
| | $ | — |
| | $ | — |
| | $ | — |
| | — |
|
| Costs related to legacy matters | $ | 52.1 |
| | $ | 14.1 |
| | $ | 38.0 |
| | 0.57 |
| | $ | 78.8 |
| | $ | 18.4 |
| | $ | 60.4 |
| | 0.90 |
| 36.1 |
| | 9.3 |
| | 26.8 |
| | 0.40 |
| | 52.1 |
| | 14.1 |
| | 38.0 |
| | 0.57 |
|
| Restructuring and repositioning expenses | 12.1 |
| | 2.7 |
| | 9.4 |
| | 0.14 |
| | 32.8 |
| | 7.5 |
| | 25.3 |
| | 0.38 |
| |
| Write-off of MTO inventory | 3.6 |
| | — |
| | 3.6 |
| | 0.05 |
| | — |
| | — |
| | — |
| | — |
| |
| Restructuring and repositioning expenses attributable to W. R. Grace & Co. shareholders | | 26.5 |
| | 5.3 |
| | 21.2 |
| | 0.32 |
| | 12.1 |
| | 2.7 |
| | 9.4 |
| | 0.14 |
|
| Inventory write-offs | | 19.8 |
| | 5.1 |
| | 14.7 |
| | 0.22 |
| | 3.6 |
| | — |
| | 3.6 |
| | 0.05 |
|
| Third-party acquisition-related costs | 2.7 |
| | 0.7 |
| | 2.0 |
| | 0.03 |
| | 7.2 |
| | 1.7 |
| | 5.5 |
| | 0.08 |
| 3.8 |
| | 1.0 |
| | 2.8 |
| | 0.04 |
| | 2.7 |
| | 0.7 |
| | 2.0 |
| | 0.03 |
|
| Amortization of acquired inventory fair value adjustment | — |
| | — |
| | — |
| | — |
| | 6.9 |
| | 1.6 |
| | 5.3 |
| | 0.08 |
| |
| Loss on early extinguishment of debt | — |
| | — |
| | — |
| | — |
| | 4.8 |
| | 1.1 |
| | 3.7 |
| | 0.05 |
| |
| Discrete tax items | | | | 20.1 |
| | (20.1 | ) | | (0.30 | ) | | | | 12.0 |
| | (12.0 | ) | | (0.18 | ) |
| Income tax expense related to historical tax attributes(1) | | | (10.0 | ) | | 10.0 |
| | 0.15 |
| | | | (11.3 | ) | | 11.3 |
| | 0.17 |
| | |
|
| | — |
| | — |
| | | | (10.0 | ) | | 10.0 |
| | 0.15 |
|
| Discrete tax items | | | 12.0 |
| | (12.0 | ) | | (0.18 | ) | | | | 7.8 |
| | (7.8 | ) | | (0.12 | ) | |
| Adjusted EPS | | | | | | | $ | 3.07 |
| | | | | | | | $ | 3.00 |
| | | | | | | $ | 1.76 |
| | | | | | | | $ | 3.07 |
|
| |
| (1) | Our historical tax attribute carryforwards (net operating losses and tax credits) unfavorably affected our tax expense with respect to certain provisions of the Tax Cuts and Jobs Act of 2017 (“TCJA”).2017. To normalize the effective tax rate, an adjustment was made to eliminate the tax expense impact associated with the historical tax attributes. |
Return on Equity and Adjusted EBIT Return Onon Invested Capital
Return on equity for the third quarter was 49.5%4.2% on a trailing four quarters basis compared with (8.7)%49.5% on the same basis as of September 30, 2018. Net income on a trailing four quarters basis as of September 30, 2018, includes charges related2019. The decline was primarily due to the TCJA recorded in the 2017 fourth quarter.lower net income. Adjusted EBIT Return Onon Invested Capital for the third quarter was 19.5%15.2% on a trailing four quarters basis, compared with 20.6%19.5% calculated on the same basis as of September 30, 2018.2019. The decline iswas primarily due to increased investment in capital assets that have not yet been placed into service.lower segment operating income.
We manage our operationsbusinesses with the objective of maximizing sales, earnings and cash flow over time. Doing so requires that we successfully balance our growth, profitability and working capital and other investments to support sustainable, long-term financial performance. We use Adjusted EBIT Return On Invested Capital as a performance measure in evaluating operating results, in making operating and investment decisions, and in balancing the growth and profitability of our operations.
Grace Value Model
In March 2018, we introduced investors to the Grace Value Model (“GVM”), our framework for creating and delivering value to customers, investors, and employees. At the company level, we create value through our focused portfolio, strong strategic position, and disciplined capital allocation. At the business level, we create value through customer-driven innovation, commercial excellence, and operating excellence. Great talent, our high-performance culture, and integrated business management processes support all of our activities and are a source of competitive advantage.
The GVM framework also encompasses our multi-year initiatives to transform our manufacturing and business processes to extend our competitive advantages and improve our cost position. We expect to significantly improve our manufacturing performance, reduce our manufacturing costs, and improve our integrated business management capabilities. We also expect to invest significant capital in our manufacturing plants to accelerate growth and improve manufacturing performance. Our investments in commercial excellence are yielding positive results in account management, pipeline management and conversion, and pricing. Our investments in operating excellence are yielding positive results in operating rates, reliability, and cost reductions, including a 75 basis point benefit to gross margin, which is primarily reinvested into the businesses.
Segment Overview—Grace Catalysts Technologies
Following is an overview of the financial performance of Catalysts Technologies for the third quarter and nine months compared with the corresponding prior-year periods.
Net Sales—Grace Catalysts Technologies
Sales were $361.4$305.7 million for the third quarter, a decrease of 4.4%15.4%, or 3.6%down 15.9% on constant currency, compared with the prior-year quarter. The decrease on a constant currency basis was due to lower sales volumes (-7.0%(-15.4%) partially offset by improvedand lower pricing (+3.4%(-0.5%). LowerSpecialty Catalysts sales volumes weredecreased 5.0%, primarily due to a declinelower market demand and customer inventory reductions in response to the Americas, includingCOVID-19 pandemic. Refining Technologies sales decreased 24.2% due to the impacteffects of the Discrete Items,pandemic on global transportation fuels demand and Asia, partially offset by growth in EMEA. Currency refinery operating rates. For the trailing twelve months, FCC catalysts pricing improved approximately 150 bps. Favorable currency
translation had an unfavorable impact on salesbenefited the segment as the U.S. dollar strengthened,weakened, primarily against the euro, compared with the prior-year quarter. Lower
Sequentially, sales were down 1.1% versus the 2020 second quarter. Specialty Catalysts sales decreased 1.6% compared with the 2020 second quarter primarily due to order timing. Refining Technologies sales decreased 0.5% compared with the 2020 second quarter as the decline in transportation fuels demand stabilized but remained well below pre-pandemic operating levels as the ongoing effects of the pandemic continue to impact miles driven and refinery operating rates. In addition, some sales shifted from the third quarter to the 2020 fourth quarter as a result of Hurricane Laura.
Gross profit was $119.7 million for the third quarter, a decrease of 21.3% compared with the prior-year quarter. Gross margin of 39.2% decreased 280 basis points from 42.0% for the prior-year quarter. The decrease in gross margin was primarily driven by under-absorbed fixed costs resulting from lower production volumes and unfavorable currency translation wereinventory reductions, partially offset by improved pricing across all regions.cost reduction actions to align manufacturing costs with demand levels and a 90 basis point benefit from lower raw materials and energy costs. Sequentially, gross margin increased 260 basis points compared with the 2020 second quarter as a result of significant inventory reductions that did not repeat in the third quarter.
Sales were $1,106.8$922.7 million for the nine months, an increasea decrease of 4.6%16.6%, or 5.9%down 16.4% on constant currency, compared with the prior-year period. The increasedecrease on a constant currency basis was due to higherlower sales volumes (+3.0%(-17.2%) andpartially offset by improved pricing (+2.9%0.8%). HigherSpecialty Catalysts sales volumes were drivendecreased 12.4%, primarily by specialty catalysts, which benefited from growthdue to lower market demand and customer inventory reductions in EMEA and Asia inresponse to the existing businessCOVID-19 pandemic, as well as order timing in our chemical catalysts business. Refining Technologies sales decreased 20.4% due to the polyolefin catalysts acquisition. Higher sales volumes in specialty catalysts were partially offset by lower volumes in refining catalysts ineffects of the Americaspandemic on global transportation fuels demand and Asia. Pricing improved across all regions in both product groups.refinery operating rates. Unfavorable currency translation affected both product groupsimpacted the segment as the U.S. dollar strengthened, primarily against the euro, compared with the prior-year period.
Segment Operating Income (SOI) and Margin—Grace Catalysts Technologies
Gross profitOperating income was $152.0$67.1 million for the third quarter, a decrease of 7.4% compared with the prior-year quarter. Gross margin of 42.0% decreased 140 basis points from 43.4% for the prior-year quarter. The decrease in gross margin was primarily due to higher manufacturing costs and the effect of the Discrete Items, partially offset by improved pricing, favorable mix, and a 60 basis point impact related to lower raw materials and energy costs.
Operating income was $104.7 million for the third quarter, a decrease of 12.4%36.2% compared with the prior-year quarter, primarily due to lower gross profit, the approximately $12 million impact of hurricane-related costs, and lower income from our ART joint venture and higher operating expenses. Theincome. Our equity in earnings from the ART joint venture contributed $3.8was $1.3 million, to operating income, a decrease of $2.1$2.5 million compared with the prior-year quarter, primarily due to an increase in expenses charged to the joint venture by the partners compared with the prior-year quarter. Operating margin for the third quarter was 29.0%21.9%, a decrease of 260720 basis points compared with the prior-year quarter.
Gross profit
Operating income was $473.7$220.8 million for the nine months, an increasea decrease of 4.5% compared with the prior-year period. Gross margin of 42.8% remained flat compared with the prior-year period. Improved pricing, favorable mix, higher sales volumes, and lower depreciation were offset by higher manufacturing costs including a 40 basis point impact related to higher raw materials and energy costs.
Operating income was $331.3 million for the nine months, an increase of 1.8%33.6% compared with the prior-year period, primarily due to higherlower gross profit, the hurricane-related costs, and lower ART joint venture income partially offset by lower incomerecoveries from ourbusiness interruption insurance. Our equity in earnings from the ART joint venture primarily due to an increase in expenses charged to the joint venture by the partners compared with the prior-year period, higher operating expenses including the polyolefin catalysts acquisition, and unfavorable effects of currency exchange rates. The ART joint venture contributed $13.9was $5.9 million, to operating income, a decrease of $5.6$8.0 million compared with the prior-year period. Operating margin for the nine months was 29.9%23.9%, a decrease of 80620 basis points compared with the prior-year period.
Segment Overview—Grace Materials Technologies
Following is an overview of the financial performance of Materials Technologies for the third quarter and nine months compared with the corresponding prior-year periods.
Net Sales—Grace Materials Technologies
Sales were $109.1$113.7 million for the third quarter, an increase of 4.2%, up 3.8% on constant currency, compared with the prior-year quarter. The increase on a constant currency basis was due to higher sales volumes (+3.8%). Sales growth was due to continued strength in pharma/consumer end-markets (+23.7%) and more than offset lower demand in industrial end-markets. Sequentially, sales were up 3.6% reflecting steady improvement in most end-markets and geographies. Coatings and chemical process applications saw improved end-market demand while demand in pharma and consumer end-markets remained strong in the third quarter, though below the 2020 second quarter levels that benefited from strong demand in pharma/consumer end markets, including COVID-19 diagnostic and treatment applications. Favorable currency translation benefited the segment as the U.S. dollar weakened, primarily against the euro, compared with the prior-year quarter.
Gross profit was $40.6 million for the third quarter, a decrease of 6.5%3.8% compared with the prior-year quarter. Gross margin of 35.7% decreased 290 basis points compared with 38.6% for the prior-year quarter. The decrease in gross margin was primarily due to under-absorbed fixed costs resulting from lower production volumes and inventory reductions, partially offset by favorable product and regional mix, cost mitigation actions, and a 50 basis point benefit from lower raw materials and energy costs. Sequentially, gross margin increased 880 basis points compared with the 2020 second quarter as a result of higher sales and production volumes as well as significant inventory reductions that did not repeat in the third quarter.
Sales were $336.9 million for the nine months, a decrease of 2.9%, or 3.9%down 1.8% on constant currency, compared with the prior-year quarter.period. The decrease on a constant currency basis was due to lower sales volumes (-5.5%(-2.1%), partially offset by improved pricing (+1.6%0.3%). Lower salesSales volumes were primarily due to lower coatings sales in EMEA, Asia, and North America, and lower consumer/pharma salesdeclined primarily in EMEA due to order timing. Pricing improved across all regions, primarilycoatings and industrial end markets driven by the COVID-19 pandemic, partially offset by strong demand in EMEA. Currencypharma/consumer end
markets, including COVID-19 diagnostic and treatment applications. Unfavorable currency translation had an unfavorable impact on salesimpacted the segment as the U.S. dollar strengthened, primarily against the euro, compared with the prior-year quarter.period.
Sales were $346.8Gross profit was $107.6 million for the nine months, a decrease of 2.0%, or an increase of 2.1% on constant currency, compared with the prior-year period. The increase on a constant currency basis was due to improved pricing (+1.9%) and higher sales volumes (+0.2%). Pricing improved across all regions, driven by EMEA and the Americas. The increase in sales volumes was primarily driven by higher consumer/pharma sales in all regions, partially offset by lower coatings sales in Asia and North America. The pricing improvement and increased sales volumes were more than offset by unfavorable currency translation as the U.S. dollar strengthened, primarily against the euro, compared with the prior-year period. Materials Technologies is our business segment most sensitive to changes in the euro.
Segment Operating Income (SOI) and Margin—Grace Materials Technologies
Gross profit was $42.2 million for the third quarter, a decrease of 3.9% compared with the prior-year quarter. Gross margin of 38.6% increased 100 basis points compared with 37.6% for the prior-year quarter. The increase in gross margin was primarily due to improved pricing and favorable mix, partially offset by costs related to the Discrete Items.
Operating income was $26.1 million for the third quarter, a decrease of 1.9% compared with the prior-year quarter, primarily due to lower gross profit. Operating margin for the third quarter was 23.9%, an increase of 110 basis points compared with the prior-year quarter.
Gross profit was $128.4 million for the nine months, a decrease of 4.4%16.2% compared with the prior-year period. Gross margin of 37.0%31.9% decreased 100510 basis points compared with 37.0% for the prior-year period. The decrease in gross margin was primarily due to higher manufacturingunder-absorbed fixed costs including costs directly related to the Discrete Itemsresulting from lower production volumes and 90inventory reductions, partially offset by a 100 basis points related to higherpoint benefit from lower raw materials and energy costs, partially offset byfavorable product and regional mix, cost mitigation actions, and improved pricingpricing.
Segment Operating Income (SOI) and lower depreciation expense.Margin—Grace Materials Technologies
Operating income was $74.2$24.3 million for the third quarter, a decrease of 6.9% compared with the prior-year quarter, primarily due to lower gross profit partially offset by lower operating expenses. Operating margin for the third quarter was 21.4%, a decrease of 250 basis points compared with the prior-year quarter.
Operating income was $55.9 million for the nine months, a decrease of 7.6%24.7% compared with the prior-year period, primarily due to lower gross profit, and higher operating expenses, partially offset by favorable effects of currency exchange rates.lower operating expenses. Operating margin for the nine months was 21.4%16.6%, a decrease of 130480 basis points compared with the prior-year period.
Corporate Costs
Corporate costs include corporate functional costs and other corporate costs such as professional fees, incentive compensation, and insurance premiums. Corporate costs for the third quarter and nine months were $18.5$18.2 million, and $52.7a decrease of $0.3 million decreases of $1.2 million and $3.4 million, respectively, from the corresponding prior-year periods. The decreases werequarter, primarily due to lower accrualsfunctional expenses. Corporate costs for the nine months were $50.5
million, a decrease of $2.2 million compared with the prior-year period, primarily due to lower incentive compensation.compensation and functional expenses.
Restructuring and Repositioning Expenses
During the third quarter and nine months, we incurred $(0.1) million and $3.0 million, respectively, of restructuring expenses primarily related to changes in estimated contractual costs in connection with a 2018 plant exit. During the corresponding prior-year periods, we incurred $0.2 million and $3.2 million, respectively, of restructuring expenses primarily related to severance costs pertaining to the idling of our methanol-to-olefins (“MTO”) manufacturing facility in China, compared with $2.4 million and $4.4 million, respectively, in the corresponding prior-year periods, which was primarily related to plant exit costs and severance costs pertaining to sales force reorganization. Substantially all costs related to the restructuring programs are expected to be paid by December 31, 2021, but could be paid earlier subject to negotiations around certain plant exit costs.facility.
Pretax repositioningRepositioning expenses for the third quarter and nine months were $2.5 million and $26.0 million, respectively, and for the nine months included a $19.7 million charge to write off engineering and site costs as a result of the decision not to build a full-scale catalysts plant in the Middle East (see “Grace Overview” above). Repositioning expenses for the corresponding prior-year periods were $3.2 million and $8.9 million, respectively, compared with $6.0 million and $28.4 million, respectively, in the corresponding prior-year periods. Expenses primarily related to a multi-year program to transform manufacturing and business processes to extend our competitive advantages and improve our cost position. Substantially all of these expenses have been or are expected to be settled in cash.
The following table presents the major components of restructuring and repositioning expenses recorded in the third quarter and nine months and the corresponding prior-year periods.
| | | | Three Months Ended September 30, | | Nine Months Ended September 30, | Three Months Ended September 30, | | Nine Months Ended September 30, |
| (in millions) | 2019 | | 2018 | | 2019 | | 2018 | |
| (In millions) | | 2020 | | 2019 | | 2020 | | 2019 |
| Write-off of plant engineering and site costs | | $ | — |
| | $ | — |
| | $ | 19.7 |
| | $ | — |
|
| Third-party costs of manufacturing and business transformation programs | $ | 2.1 |
| | $ | 3.6 |
| | $ | 5.5 |
| | $ | 11.7 |
| 0.8 |
| | 2.1 |
| | 4.6 |
| | 5.5 |
|
| Costs related to plant closures | | — |
| | — |
| | 2.8 |
| | — |
|
| Employee severance | 1.3 |
| | 1.1 |
| | 5.2 |
| | 4.8 |
| 1.4 |
| | 1.3 |
| | 4.0 |
| | 5.2 |
|
| Write-off of plant equipment and engineering costs | — |
| | 1.9 |
| | — |
| | 11.0 |
| |
| Other | — |
| | 1.8 |
| | 1.4 |
| | 5.3 |
| 0.2 |
| | — |
| | (2.1 | ) | | 1.4 |
|
| Total restructuring and repositioning expenses | $ | 3.4 |
| | $ | 8.4 |
| | $ | 12.1 |
| | $ | 32.8 |
| 2.4 |
| | 3.4 |
| | 29.0 |
| | 12.1 |
|
| Less: restructuring and repositioning expenses attributable to noncontrolling interest | | — |
| | — |
| | (2.5 | ) | | — |
|
| Restructuring and repositioning expenses attributable to W. R. Grace & Co. shareholders | | $ | 2.4 |
| | $ | 3.4 |
| | $ | 26.5 |
| | $ | 12.1 |
|
Defined Benefit Pension Expense
Certain pension costs for the third quarter and nine months were $4.5$3.6 million and $13.9$10.2 million, respectively, compared with $3.8$4.5 million and $11.6$13.9 million, respectively, for the corresponding prior-year periods. The increases weredecrease was primarily due to lower interest cost partially offset by higher service cost due to a decrease in expected return on assets, partially offset by a decrease in service cost and interest cost due to an increase in discount rates compared with the prior-year period.rates.
Interest and Financing Expenses
Net interest and financing expenses were $18.3$19.6 million for the third quarter, a decreasean increase of 8.5%7.1% from the prior-yearprior year quarter, and $56.8$56.2 million for the nine months, a decrease of 2.7%1.1% compared with the corresponding prior-year period. The decreases are primarily due to higher capitalized interest expense.
Income Taxes
Our effective tax rates for the nine months ended September 30, 2019 and 2018,prior-year period, were 26.9%(26.0)% and 34.0%26.9%, respectively. Our effective tax rate for the nine months ended September 30, 2019,was negative primarily due to the net benefit of the Global Intangible Low-Taxed Income (“GILTI”) High-Tax Exclusion (“HTE”) in the U.S. and was partially offset by income taxed in jurisdictions with higher statutory tax rates than the U.S., recognition of certain state valuation allowances, and the expiration of unexercised stock options, as well as the impact of a write-off of previously capitalized engineering and site costs. Our effective tax rate for the prior-year period differed from the U.S. federal statutory rate primarily due to income taxed in jurisdictions with higher statutory tax rates than the U.S. and the net impact of the Global Intangible Low-Taxed Income (“GILTI”) GILTI
tax in the U.S., partially offset by discrete benefits related to changes in tax law and to the favorable resolution of uncertain tax positions, and adjustments to our tax provision related to the filing of the 2018 U.S. federal income tax return. Our effective tax rate for the nine months ended September 30, 2018, was higher than the U.S. federal statutory rate primarily due to the use of net operating loss carryforwards, which limited specific deductions that would have otherwise reduced the GILTI tax. In 2019, we are forecasting U.S. federal taxable income in excess of available net operating losses, which will increase the deductions available to reduce the GILTI tax.positions.
As of September 30, 2020, and December 31, 2019, Grace has $296.5we had $315.5 million and $302.5 million, respectively, in federal tax credit carryforwards before unrecognized tax benefits.
The Tax Cuts and Jobs Act of 2017 imposed a minimum U.S. tax on GILTI. To arrive at the requisite minimum tax on GILTI, the U.S. tax law provides for a specific deduction that is intended to lower the effective tax rate on the GILTI inclusion. In addition, foreign taxes paid on GILTI are available as a deduction or as a tax credit (subject to certain limitations) to offset U.S. tax liability. The specific deduction and ability to claim a foreign tax credit is limited if a company does not have sufficient U.S. taxable income. Our
On March 27, 2020, the Coronavirus Aid, Relief and Economic Security Act (the “CARES Act”) became law. The CARES Act includes, among other things, provisions relating to refundable payroll tax credits, deferment of employer-side social security payments, alternative minimum tax credit refunds, and technical corrections to tax depreciation methods for qualified improvement property. Although we continue to examine the impacts the CARES Act may have on our business, results of operations, financial condition, and liquidity, we do not expect it to have a material impact on our effective tax rate estimate for 2019 includes a partial benefit from a specific deduction reducing GILTIor our income tax payable and application of foreigndeferred income tax creditspositions.
On July 20, 2020, the U.S. Treasury Department released final regulations related to the GILTI inclusion. InHTE. The final regulations are effective beginning with our 2021 tax year with an option to retroactively apply them to our 2018 we did notthrough 2020 tax years. We have U.S. taxable income after application of net operating losses torecognized a benefit fromin the specific deduction forthird quarter and nine months driven by the GILTI or to claim foreignHTE regulations that resulted in a retroactive tax creditsbenefit related to the GILTI inclusion. We are reflecting the aforementioned benefits in2018 and 2019 of approximately $23 million.
Our provision for income taxes is based on our projections of U.S. federal taxable income. Such projections may change in subsequent quarters, which could change our U.S. GAAP tax expense and net income for 2019.in future periods.
Financial Condition, Liquidity, and Capital Resources
Following is an analysis of our financial condition, liquidity and capital resources at September 30, 2019.2020.
Our principal uses of cash are generally capital investments and acquisitions; working capital investments; compensation paid to employees, including contributions related to our defined benefit pension plans and defined
contribution plans; the repayment of debt and interest payments thereon; and the return of cash to shareholders through the payment of dividends and the repurchase of shares and the payment of dividends.shares.
On February 8, 2017, we announced that the Board of Directors had authorized a share repurchase program of up to $250 million. DuringOn February 28, 2020, we announced that our Board of Directors had increased its share repurchase authorization to $250 million, including approximately $83 million remaining under the third quarter, we did not repurchase Company common stock under this program as we prioritized de-leveraging at this time with a focus on lowering our net leverage to within our target range of 2.0x to 3.0x by the end of 2019.previously announced program. During the nine months we repurchased 409,769673,807 shares of Company common stock for $29.8$40.4 million. As of September 30, 2019, $109.12020, $235.0 million remained under the current authorization. On April 3, 2020, we announced that we temporarily suspended our share repurchase program in light of the COVID-19 pandemic. We believe this action, while conservative, is appropriate given the uncertainty regarding the duration and severity of the pandemic. We expect to reinstate our share repurchase program at the appropriate time.
We paid cash dividends of $54.6$60.2 million during the nine months. On February 8, 2018,7, 2019, we announced that theour Board of Directors had approved an increase in the annual dividend rate, tofrom $0.96 per share of Company common stock, effective with the dividend paid March 22, 2018. On February 7, 2019, we announced that the Board of Directors had approved a further increase to $1.08 per share of Company common stock, effective with the dividend paid March 21, 2019. On February 4, 2020, we announced that our Board of Directors had approved a further increase to $1.20 per share, effective with the dividend paid March 17, 2020. We intend to maintain our dividend.
WeAlthough the duration and severity of the impact from the COVID-19 pandemic on our operations and liquidity depends on future developments that are difficult to accurately predict at this time, we believe that the cash we expect to generate during 20192020 and thereafter, together with other available liquidity and capital resources, are sufficient to finance our operations, growth strategy, share repurchase program and expected dividend payments, and to meet our debt, pension, and pensionlegacy and other obligations.
Debt and Other Contractual Obligations
Total debt outstanding at September 30, 2020, was $2,004.4 million. We have limited debt service requirements, with no material maturities related to our term loans, revolving credit facility, or notes until September 2024. See Note 8 to the Consolidated Financial Statements for a discussion of Financial Assurances.
Cash Resources and Available Credit Facilities
At September 30, 2019,2020, we had available liquidity of $628.7$708.2 million, consisting of $218.5$268.7 million in cash and cash equivalents, ($77.5 million in the U.S.), $371.1$391.8 million available under our revolving credit facility, and $39.1$47.7 million of available liquidity under various non-U.S. credit facilities. The $400 million revolving credit facility includes a $100 million sublimit for letters of credit.
Our non-U.S. credit facilities are extended to various subsidiaries that use them primarily to issue bank guarantees supporting trade activity and to provide working capital during occasional cash shortfalls. We generally renew these credit facilities as they expire.
The following table summarizes our non-U.S. credit facilities as of September 30, 2019:2020:
| |
(In millions) | Maximum Borrowing Amount | | Available Liquidity | | Expiration Date | Maximum Borrowing Amount | | Available Liquidity | | Expiration Date |
| Singapore | $ | 18.0 |
| | $ | 9.8 |
| | April 3, 2023 | $ | 18.0 |
| | $ | 8.1 |
| | April 3, 2023 |
| China | 11.8 |
| | 8.9 |
| | April 3, 2023 | 11.9 |
| | 10.5 |
| | April 3, 2023 |
| United Arab Emirates | | 11.0 |
| | 11.0 |
| | December 31, 2020 |
| Other countries | 21.3 |
| | 20.4 |
| | April 3, 2023, as well as open-ended | 21.3 |
| | 18.1 |
| | April 3, 2023, as well as open-ended |
| Total | $ | 51.1 |
| | $ | 39.1 |
| | | $ | 62.2 |
| | $ | 47.7 |
| | |
Analysis of Cash Flows
The following table summarizes our cash flows for the nine months and prior-year period:
|
| | | | | | | |
| | Nine Months Ended September 30, |
| (In millions) | 2019 | | 2018 |
| Net cash provided by (used for) operating activities | $ | 268.4 |
| | $ | 234.0 |
|
| Net cash provided by (used for) investing activities | (169.8 | ) | | (565.9 | ) |
| Net cash provided by (used for) financing activities | (77.4 | ) | | 323.2 |
|
| Effect of currency exchange rate changes on cash, cash equivalents, and restricted cash | (3.3 | ) | | (1.5 | ) |
| Net increase (decrease) in cash, cash equivalents, and restricted cash | 17.9 |
| | (10.2 | ) |
| Cash, cash equivalents, and restricted cash, beginning of period | 201.0 |
| | 163.5 |
|
| Cash, cash equivalents, and restricted cash, end of period | $ | 218.9 |
| | $ | 153.3 |
|
|
| | | | | | | |
| | Nine Months Ended September 30, |
| (In millions) | 2020 | | 2019 |
| Net cash provided by (used for) operating activities | $ | 259.1 |
| | $ | 268.4 |
|
| Net cash provided by (used for) investing activities | (153.7 | ) | | (169.8 | ) |
| Net cash provided by (used for) financing activities | (119.7 | ) | | (77.4 | ) |
| Effect of currency exchange rate changes on cash, cash equivalents, and restricted cash | 0.3 |
| | (3.3 | ) |
| Net increase (decrease) in cash, cash equivalents, and restricted cash | (14.0 | ) | | 17.9 |
|
| Cash, cash equivalents, and restricted cash, beginning of period | 282.9 |
| | 201.0 |
|
| Cash, cash equivalents, and restricted cash, end of period | $ | 268.9 |
| | $ | 218.9 |
|
Net cash provided by operating activities for the nine months was $268.4$259.1 million compared with $234.0$268.4 million for the prior-year period. The prior-year period includes a $50.0 million accelerated contributionchange was primarily due to the U.S. defined benefit pension plans as well as higher cash paid for third-party acquisition costs and legacy matters,lower net income, partially offset by higher advance payments from customers.improved net working capital performance.
Net cash used for investing activities for the nine months was $169.8$153.7 million compared with $565.9$169.8 million for the prior-year period. The year-over-year change in cash flow was primarily due to the purchasetiming of cash flows related to the polyolefinresidue hydroprocessing catalysts business of Albemarle Corporation for $418.0 million duringplant that was transferred to ART in the prior-year period.third quarter. Cash paid for capital expenditures, primarily related to our strategic growth investments, was $142.6$123.8 million for the nine months compared with $161.7$142.6 million for the prior-year period. We acquired the business and assets of Rive Technology, Inc. for $22.8 million in the prior-year period, with an additional $2.0 million holdback paid in the 2020 third quarter.
Net cash used for financing activities for the nine months was $77.4$119.7 million compared with cash provided by financing activities of $323.2$77.4 million infor the prior-year period. The year-over-year change in cash flow was primarily due to the borrowings under the 2018 credit agreement, offset by the repaymenthigher repayments of the outstanding 2014 U.S. dollar and euro term loans during the 2018 second quarter. Cashdebt, cash paid for repurchases of
common stock, was $29.8 million for the nine monthsand payments of dividends to shareholders compared with $60.1 million forthe prior-year period, as well as higher proceeds from the exercise of stock options in the prior-year period.
Debt and Other Contractual Obligations
Total debt outstanding at September 30, 2019, was $1,982.2 million. See Note 8 to the Consolidated Financial Statements for a discussion of Financial Assurances.
Employee Benefit Plans
See Note 6 to the Consolidated Financial Statements for further discussion of Pension Plans and Other Retirement Plans.
Defined Benefit Pension Plans
The following table presents the components of cash contributions for the advance-funded and pay-as-you-go plans:
| | | | Nine Months Ended September 30, | Nine Months Ended September 30, |
| (In millions) | 2019 | | 2018 | 2020 | | 2019 |
| U.S. advance-funded plans | $ | 0.1 |
| | $ | 50.0 |
| $ | 0.5 |
| | $ | 0.1 |
|
| U.S. pay-as-you-go plans | 5.4 |
| | 5.1 |
| 6.1 |
| | 5.4 |
|
| Non-U.S. advance-funded plans | 1.1 |
| | 0.8 |
| 1.0 |
| | 1.1 |
|
| Non-U.S. pay-as-you-go plans | 5.7 |
| | 5.9 |
| 5.4 |
| | 5.7 |
|
| Total Cash Contributions | $ | 12.3 |
| | $ | 61.8 |
| |
| Total cash contributions | | $ | 13.0 |
| | $ | 12.3 |
|
We intendhave minimal pension funding requirements. Our U.S. qualified pension plans are well funded, with expected cash contributions of approximately $1 million per year for the next three years. Cash contributions related to fundpay-as-you-go unfunded plans and non-U.S. pension plans based upon applicable legal requirementsare expected to be approximately $15 million per year for the next three years.
Defined Contribution Plans
The following table presents cash payments related to our defined contribution plans.
|
| | | | | | | |
| | Nine Months Ended September 30, |
| (In millions) | 2020 | | 2019 |
| U.S. defined contribution plan | $ | 10.6 |
| | $ | 10.4 |
|
| U.S. enhanced defined contribution plan | 2.6 |
| | 2.2 |
|
| Total cash payments | $ | 13.2 |
| | $ | 12.6 |
|
See Note 6 to the Consolidated Financial Statements for further discussion of Pension Plans and actuarial and trustee recommendations. We contributed $6.8 million and $6.7 million to these plans during the nine months and the prior-year period.Other Retirement Plans.
Other Contingencies
See Note 8 to the Consolidated Financial Statements for a discussion of our other contingent matters.
Inflation
We recognize that inflationary pressures may have an adverse effect on us through higher asset replacement costs and higher raw materials and other operating costs. We try to minimize these impacts through effective control of operating expenses,by developing alternative formulations, increasing productivity, improvements, and hedging purchases of certain raw materials, as well as price increases on our products.
Critical Accounting Estimates
See the “Critical Accounting Estimates” heading in Item 7. Management’s Discussion and Analysis of Financial Condition and Results of Operations in our Form 10-K for the year ended December 31, 2018,2019, for a discussion of our critical accounting estimates, incorporated by reference into Item 7 thereof.estimates.
Recent Accounting Pronouncements
See Note 1 to the Consolidated Financial Statements for a discussion of recent accounting pronouncements and their effect on us.
Forward-Looking Statements
This document contains, and our other public communications may contain, forward-looking statements, that is, information related to future, not past, events. Such statements generally include the words “believes,” “plans,” “intends,” “targets,” “will,” “expects,” “suggests,” “anticipates,” “outlook,” “continues,” or similar expressions. Forward-looking statements include, without limitation, expectedstatements regarding future: financial positions; results of operations; cash flows; financing plans; business strategy; operating plans; capital and other expenditures; impact of COVID-19 on our business; competitive positions; growth opportunities for existing products; benefits from new technology andtechnology; benefits from cost reduction initiatives, plans and objectives;initiatives; succession planning; and markets for securities. For these statements, we claim the protections of the safe harbor for forward-looking statements contained in Section 27A of the Securities Act and Section 21E of the Exchange Act. Like other businesses, weWe are subject to risks and uncertainties that could cause our actual results or events to differ materially from our projections or that could cause other forward-looking statements to prove incorrect. Factors that could cause actual results or events to differ materially from those contained in the forward-looking statements include, without limitation: risks related to foreign operations, especially in areas of active conflicts and in emerging regions; the costs and availability of raw materials, energy and transportation; the effectiveness of Grace’sour research and development and growth investments; acquisitions and divestitures of assets and businesses; developments affecting Grace’sour outstanding indebtedness; developments affecting Grace’sour pension obligations; legacy matters (including product, environmental, and other legacy liabilities) relating to past activities of Grace; Grace’sour legal and environmental proceedings; environmental compliance costs;costs (including existing and potential laws and regulations pertaining to climate change); the inability to establish or maintain certain business relationships; the inability to hire or retain key personnel; natural disasters such as storms and floods; fires and force majeure events; the economics of our customers’ industries, including the petroleum refining, petrochemicals, and plastics industries, and shifting consumer preferences; public health and safety concerns, including pandemics and quarantines; changes in tax laws and regulations; international trade disputes, tariffs, and sanctions; the potential effects of cyberattacks; and those additional factors set forth in our most recent Annual Report on Form 10-K, quarterly reports on Form 10-Q, and current reports on Form 8-K, which have been filed with the Securities and Exchange Commission and are readily available on the internet at www.sec.gov. Our reported results should not be considered as an indication of our future performance. Readers are cautioned not to place undue reliance on our projections and forward-looking statements, which speak only as of the dates those projections and statements are made. We undertake no obligation to release publicly any revisionrevisions to theour projections and forward-looking statements, contained in this document, or to update them to reflect events or circumstances occurring after the date of this document.dates those projections and statements are made.
Item 3. QUANTITATIVE AND QUALITATIVE DISCLOSURES ABOUT MARKET RISK
With respect to information disclosed in the “Quantitative and Qualitative Disclosures About Market Risk” section of our Annual Report on Form 10-K for the year ended December 31, 20182019, more recent numerical measures and other information are available in the “Financial Statements” and “Management’s Discussion and Analysis of Financial Condition and Results of Operations” sections of this Report. These more recent measures and information are incorporated herein by reference.
Item 4. CONTROLS AND PROCEDURES
EVALUATION OF DISCLOSURE CONTROLS AND PROCEDURES
As of September 30, 20192020, Grace carried out an evaluation of the effectiveness of the design and operation of its disclosure controls and procedures pursuant to Rule 13a-15 under the Securities Exchange Act of 1934, as amended (the “Exchange Act”). Based upon that evaluation, Grace’s Principal Executive Officer and Principal Financial Officer concluded that Grace’s disclosure controls and procedures are effective to ensure that information required to be disclosed in Grace’s Exchange Act reports is recorded, processed, summarized and reported within the time periods specified in the SEC’s rules and forms, and that material information relating to Grace is made known to management, including Grace’s Principal Executive Officer and Principal Financial Officer, as appropriate to allow timely decisions regarding required disclosure.
CHANGES IN INTERNAL CONTROL OVER FINANCIAL REPORTING
There were no changes in Grace’s internal control over financial reporting during the quarter ended September 30, 20192020, that have materially affected, or are reasonably likely to materially affect, Grace’s internal control over financial reporting.
PART II. OTHER INFORMATION
Item 1. LEGAL PROCEEDINGS
Note 8, “Commitments and Contingent Liabilities,” to the interim Consolidated Financial Statements in Part I of this Report is incorporated herein by reference.
Item 1A. RISK FACTORS
In addition to the other information set forth below and elsewhere in this Report, you should carefully consider the risk factors discussed in the “Risk Factors” section of our Annual Report on Form 10-K for the year ended December 31, 2018,2019, which could materially affect our business, financial condition, or future results. The risks we described in this Report and in our Annual Report on Form 10-K are not the only risks facing Grace. Additional risks and uncertainties not currently known to us, not currently estimable, or that we currently deem to be immaterial, as well as generic business risks not included here, also may materially adversely affect our business, financial condition, or future results. With respect to certain risk factors that we discussed in our Annual Report on Form 10-K, more recent numerical measures and other information are available in the “Financial Statements” and “Management’s Discussion and Analysis of Financial Condition and Results of Operations” sections of this Report, including, without limitation, Note 8, “Commitments and Contingent Liabilities,” to the interim Consolidated Financial Statements in Part I of this Report andReport. In addition, see our cautionary language about Forward-Looking Statements, also in our Current Report on Form 8-K, filed October 1, 2019.Part I of this Report. These more recent measures and information are incorporated herein by reference.
In addition to the risks and uncertainties that we discussed in our Annual Report on Form 10-K and identify elsewhere in this Report, recent world events have exacerbated the risks we face, as updated below.
Updates to Key Business Risks
We are subject to business continuity risks that may adversely affect our business, financial condition and results of operations.
The global COVID-19 pandemic has had a significant negative effect on our financial results and is expected to continue to negatively impact our businesses.
The COVID-19 pandemic has had an unfavorable impact on our results for the nine months and continues to negatively affect our businesses. We expect the significant economic impacts of the COVID-19 pandemic, including lower manufacturing activity and transportation fuel demand, to negatively affect our 2020 full-year results. Even after the COVID-19 outbreak has subsided, we may continue to experience impacts to our business as a result of COVID-19’s global economic impact and the resulting recession that has occurred. While we have taken several actions to mitigate the impact of the virus on our operations, including focusing on the health and safety of our employees, adjusting our global manufacturing operations and supply chain, and providing business continuity for our customers, the COVID-19 pandemic presents us with unprecedented uncertainty. The COVID-19 pandemic has adversely affected and is expected to continue to adversely affect demand for our products and services. We are continuing to evaluate the effects of the COVID-19 pandemic and the policy responses of governments, and while it is not possible to predict with certainty its ongoing effects, the pandemic is expected to materially adversely affect our business, financial condition, and future results.
The COVID-19 pandemic has also heightened risks associated with our internal operations. Although we have closely monitored and followed guidance from public health officials related to personal safety, preventative measures and personal protective equipment, an outbreak among our employee population could have a material adverse effect on our overall business and financial condition. Additionally, a large number of our employees are working remotely as a result of restrictions imposed to control the spread of the virus. This could result in increased cyber-security risk, which could have a material adverse effect on our overall business and financial condition.
The global recession may impact our share price as well as our ability to access the capital markets and our usual sources of liquidity on reasonable terms, or at all.
As we operate worldwide in a competitive environment, global economic and financial market conditions may adversely affect our business, financial condition and results of operations.
The COVID-19 pandemic has negatively affected certain industries to which we supply products and services.
The COVID-19 pandemic has led to significantly lower transportation fuel demand and a reduction in refining activity, which has negatively affected demand for our refining catalysts. Demand for other manufactured products, including polyolefin resins and products made with our specialty silicas, has also declined and negatively affected demand for our polyolefin catalysts and specialty silicas.
The COVID-19 pandemic has significantly increased economic and demand uncertainty. The outbreak of COVID-19 has caused an economic slowdown that has led to a global recession. The recession will likely have a negative impact on demand for our products and may adversely affect our business, financial condition, and future results. There are no comparable recent events that provide guidance as to the effect a global pandemic may have, and, as a result, the ultimate impact of the outbreak is highly uncertain and subject to change. We do not yet know the full extent of the impacts on our business, our operations or the global economy as a whole. However, the effects could have a material adverse effect on our results of operations and precipitate or aggravate many of our known risks described in the “Risk Factors” section of our Annual Report on Form 10-K for the year ended December 31, 2019.
Item 2. UNREGISTERED SALES OF EQUITY SECURITIES AND USE OF PROCEEDS
Share Repurchase Program
On February 8, 2017, we announced that our Board of Directors had authorized a share repurchase program of up to $250 million. On February 28, 2020, we announced that our Board of Directors had increased its share repurchase authorization to $250 million, including approximately $83 million remaining under the previously announced program. Repurchases under the program may be made through one or more open market transactions at prevailing market prices; unsolicited or solicited privately negotiated transactions; accelerated share repurchase programs; or through any combination of the foregoing; or in such other manner as determined by management. The timing of the repurchases and the actual amount repurchased will depend on a variety of factors, including the market price of the Company’s shares, strategic priorities for the deployment of capital, and general market and economic conditions. We temporarily suspended our share repurchase program in early March in light of the COVID-19 pandemic.
During the three months ended September 30, 2019,2020, there were no repurchases of Company common stock by or on behalf of Grace or any “affiliated purchaser,” as reflected in the following table:
|
| | | | | | | | | | | | |
| Period | | Total number of shares purchased (#) | | Average price paid per share ($/share) | | Total number of shares purchased as part of publicly announced plans or programs (#) | | Approximate dollar value of shares that may yet be purchased under the plans or programs ($ in millions) |
7/1/20192020 - 7/31/20192020 | | — |
| | — |
| | — |
| | 109.1235.0 |
|
8/1/20192020 - 8/31/20192020 | | — |
| | — |
| | — |
| | 109.1235.0 |
|
9/1/20192020 - 9/30/20192020 | | — |
| | — |
| | — |
| | 109.1235.0 |
|
| Total | | — |
| | — |
| | — |
| | |
Item 4. MINE SAFETY DISCLOSURES
Information concerning mine safety violations or other regulatory matters required by Section 1503(a) of the Dodd-Frank Wall Street Reform and Consumer Protection Act and Item 104 of Regulation S-K (17 CFR 229.104) is included in Exhibit 95 to this Report.
Item 6. EXHIBITS
In reviewing the agreements included as exhibits to this and other Reports filed by Grace with the SEC, please remember they are included to provide you with information regarding their terms and are not intended to provide any other factual or disclosure information about Grace or other parties to the agreements. The agreements may contain representations and warranties by each of the parties to the applicable agreement. These representations and warranties have been made solely for the benefit of the other parties to the applicable agreement. These representations and warranties:
Are not statements of fact, but rather are used to allocate risk to one of the parties if the statements prove to be inaccurate;
May have been qualified by disclosures that were made to the other parties in connection with the negotiation of the applicable agreement, which disclosures are not necessarily reflected in the agreement;
May apply standards of materiality in a way that is different from what may be viewed as material to you or other investors; and
Were made only as of the date of the applicable agreement or such other date or dates as may be specified in the agreement and do not reflect more recent developments.
Accordingly, these representations and warranties may not describe the actual state of affairs as of the date they were made or at any other time. Additional information about Grace may be found elsewhere in this report and in Grace’s other public filings, which are available without charge through the SEC’s website at http://www.sec.gov.
The following is a list of Exhibits filed as part of this Quarterly Report on Form 10-Q:
|
| | | | |
| Exhibit No. | | Description of Exhibit | | Location |
| 3.1 | | | | Exhibit 3.01 to Form 8-K (filed 2/07/14) SEC File No.: 001-13953 |
| 3.2 | | | | Exhibit 3.01 to Form 8-K (filed 1/23/15) SEC File No.: 001-13953 |
| 4.1 | | | | Exhibit 4.1 to Form 8-K (filed 9/19/14) SEC File No.: 001-13953 |
| 4.2 | | | | Exhibit 4.2 to Form 8-K (filed 6/26/20) SEC File No.: 001-13953 |
| 4.3 | | | | Exhibit 4.3 to Form 8-K (filed 6/26/20) SEC File No.: 001-13953 |
| 31(i).1 | | | | Filed herewith |
| 31(i).2 | | | | Filed herewith |
| 32 | | | | Filed herewith |
| 95 | | | | Filed herewith |
|
| | | | |
| Exhibit No. | | Description of Exhibit | | Location |
| 101.INS | | Inline XBRL Instance Document | | The instance document does not appear in the Interactive Data File because its XBRL tags are embedded within the Inline XBRL document. |
| 101.SCH | | Inline XBRL Taxonomy Extension Schema | | Filed herewith |
| 101.CAL | | Inline XBRL Taxonomy Extension Calculation Linkbase | | Filed herewith |
| 101.DEF | | Inline XBRL Taxonomy Extension Definition Linkbase | | Filed herewith |
| 101.LAB | | Inline XBRL Taxonomy Extension Label Linkbase | | Filed herewith |
|
| | | | |
Exhibit No. | | Description of Exhibit | | Location |
| 101.PRE | | Inline XBRL Taxonomy Extension Presentation Linkbase | | Filed herewith |
| 104 | | Cover Page Interactive Data File (formatted as Inline XBRL and included in Exhibit 101) | | Filed herewith |
| |
| * | Management contracts and compensatory plans, contracts or arrangements required to be filed as exhibits to this Report. |
SIGNATURES
Pursuant to the requirements of the Securities Exchange Act of 1934, the Registrant has duly caused this Report to be signed on its behalf by the undersigned thereunto duly authorized.
|
| | |
| | W. R. GRACE & CO. (Registrant) |
| | | |
Date: November 7, 20194, 2020 | By: | /s/ HUDSON LA FORCE |
| | | Hudson La Force President and Chief Executive Officer (Principal Executive Officer) |
| | | |
Date: November 7, 20194, 2020 | By: | /s/ WILLIAM C. DOCKMAN |
| | | William C. Dockman Senior Vice President and Chief Financial Officer (Principal Financial Officer and Principal Accounting Officer) |