SECURITIES AND EXCHANGE COMMISSION
Washington, D. C. 20549
FORM 10-Q
QUARTERLY REPORT PURSUANT TO SECTION 13 OR 15(d) OF THE SECURITIES EXCHANGE ACT OF 1934 | |
For the quarterly period ended | |
OR | |
o | TRANSITION REPORT PURSUANT TO SECTION 13 OR 15(d) OF THE SECURITIES EXCHANGE ACT OF 1934 |
For the transition period from to | |
Commission file number 1-9924
Citigroup Inc.
(Exact name of registrant as specified in its charter)
| Delaware (State or other jurisdiction of incorporation or organization) | 52-1568099 (I.R.S. Employer Identification No.) |
399 Park Avenue, New York, New York 10043
(Address of principal executive offices) (Zip Code)
(212) 559-1000
(Registrant's telephone number, including area code)
Indicate by check mark whether the registrant (1) has filed all reports required to be filed by Section 13 or 15(d) of the Securities Exchange Act of 1934 during the preceding 12 months (or for such shorter period that the registrant was required to file such reports), and (2) has been subject to such filing requirements for the past 90 days. Yes ý No o
Indicate by check mark whether the registrant is a large accelerated filer, an accelerated filer, or a non-accelerated filer. See definition of "accelerated filer and large accelerated filer" in Rule 12b-2 of the Exchange Act. (Check one):
Large accelerated filer ý Accelerated filer o Non-accelerated filer o
Indicate by check mark whether the registrant is a shell company (as defined in Rule 12b-2 of the Exchange Act). Yes o No ý
Indicate the number of shares outstanding of each of the issuer's classes of common stock as of the latest practicable date:
Common stock outstanding as of September 30, 2006: 4,913,666,826March 31, 2007: 4,946,439,087
Available on the Web at www.citigroup.com
| | | Page No. | ||
|---|---|---|---|---|
| Part I—Financial Information | ||||
Item 1. | Financial Statements: | |||
Consolidated Statement of Income (Unaudited) | ||||
Consolidated Balance | ||||
Consolidated Statement of Changes in Stockholders' Equity (Unaudited) | ||||
Consolidated Statement of Cash Flows (Unaudited) | ||||
Consolidated Balance Sheet—Citibank, N.A. and Subsidiaries | ||||
Notes to Consolidated Financial Statements (Unaudited) | ||||
Item 2. | Management's Discussion and Analysis of Financial Condition and Results of Operations | 4 - | ||
Item 3. | Quantitative and Qualitative Disclosures About Market Risk | 57 - | ||
102 - | ||||
Item 4. | Controls and Procedures | |||
Part II—Other Information | ||||
Item 1. | Legal Proceedings | |||
Item 1A. | Risk Factors | |||
Item 2. | Unregistered Sales of Equity Securities and Use of Proceeds | |||
Item 4. | Submission of Matters to a Vote of Security Holders | 124 | ||
Item 6. | Exhibits | |||
Signatures | ||||
Exhibit Index | ||||
Citigroup Inc. (Citigroup orand, together with its subsidiaries, the Company) is a diversified global financial services holding company whosecompany. Our businesses provide a broad range of financial services to consumer and corporate clients.customers. Citigroup has somemore than 200 million clientcustomer accounts and does business in more than 100 countries. Citigroup was incorporated in 1988 under the laws of the State of Delaware.
The Company is a bank holding company within the meaning of the U.S. Bank Holding Company Act of 1956 registered with, and subject to examination by, the Board of Governors of the Federal Reserve System (FRB). Some of the Company's subsidiaries are subject to supervision and examination by their respective federal and state authorities.
This quarterly report on Form 10-Q should be read in conjunction with Citigroup's 20052006 Annual Report on Form 10-K.
The principal executive offices of the Company are located at 399 Park Avenue, New York, New York 10043,10043. The headquarters' telephone number 212-559-1000.is 212 559 1000. Additional information about Citigroup is available on the Company's Web site atwww.citigroup.com. Citigroup's annual report on Form 10-K, its quarterly reports on Form 10-Q, its current reports on Form 8-K, and all amendments to these reports are available free of charge through the Company's Webweb site by clicking on the "Investor Relations" page and selecting "SEC Filings." The Securities and Exchange Commission (SEC) Webweb site contains reports, proxy and information statements, and other information regarding the Company atwww.sec.gov.
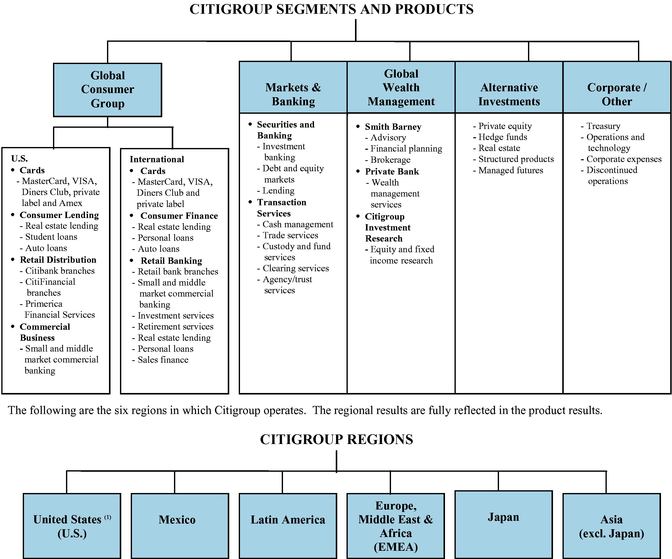
Citigroup is managed along the following segment and product lines:
The following are the six regions in which Citigroup operates. The regional results are fully reflected in the product results.
CITIGROUP INC. AND SUBSIDIARIES
SUMMARY OF SELECTED FINANCIAL DATA
| | Three Months Ended September 30, | | Nine Months Ended September 30, | | Three Months Ended March 31, | | ||||||||||||||||||||
|---|---|---|---|---|---|---|---|---|---|---|---|---|---|---|---|---|---|---|---|---|---|---|---|---|---|---|
| | % Change | % Change | ||||||||||||||||||||||||
In millions of dollars, except per share amounts | Three Months Ended March 31, | % Change | ||||||||||||||||||||||||
| 2006 | 2005(1) | % Change | 2006(1) | 2005(1) | % Change | |||||||||||||||||||||
| Net interest revenue | $ | 9,828 | $ | 9,695 | % | $ | 29,449 | $ | 29,572 | $ | 10,570 | $ | 9,766 | 8 | % | |||||||||||
| Non-interest revenue | 11,594 | 11,803 | (2 | ) | 36,338 | 33,291 | 9 | % | 14,889 | 12,417 | 20 | |||||||||||||||
| Revenues, net of interest expense | $ | 21,422 | $ | 21,498 | — | $ | 65,787 | $ | 62,863 | 5 | % | $ | 25,459 | $ | 22,183 | 15 | % | |||||||||
| Operating expenses | 11,936 | 11,413 | 5 | % | 38,063 | 33,789 | 13 | |||||||||||||||||||
| Restructuring expense | 1,377 | — | — | |||||||||||||||||||||||
| Other operating expenses | 14,194 | 13,358 | 6 | |||||||||||||||||||||||
| Provisions for credit losses and for benefits and claims | 2,117 | 2,840 | (25 | ) | 5,607 | 6,902 | (19 | ) | 2,967 | 1,673 | 77 | |||||||||||||||
| Income from continuing operations before taxes and minority interest | $ | 7,369 | $ | 7,245 | 2 | % | $ | 22,117 | $ | 22,172 | — | $ | 6,921 | $ | 7,152 | (3 | )% | |||||||||
| Income taxes | 2,020 | 2,164 | (7 | ) | 5,860 | 6,827 | (14 | )% | 1,862 | 1,537 | 21 | |||||||||||||||
| Minority interest, net of taxes | 46 | 93 | (51 | ) | 137 | 511 | (73 | ) | 47 | 60 | (22 | ) | ||||||||||||||
| Income from continuing operations | $ | 5,303 | $ | 4,988 | 6 | % | $ | 16,120 | $ | 14,834 | 9 | % | $ | 5,012 | $ | 5,555 | (10 | )% | ||||||||
| Income from discontinued operations, net of taxes(2) | 202 | 2,155 | (91 | ) | 289 | 2,823 | (90 | ) | ||||||||||||||||||
| Income from discontinued operations, net of taxes(1) | — | 84 | NM | |||||||||||||||||||||||
| Net Income | $ | 5,505 | $ | 7,143 | (23 | )% | $ | 16,409 | $ | 17,657 | (7 | )% | $ | 5,012 | $ | 5,639 | (11 | )% | ||||||||
| Earnings per share | ||||||||||||||||||||||||||
| Basic earnings per share: | ||||||||||||||||||||||||||
| Basic: | ||||||||||||||||||||||||||
| Income from continuing operations | $ | 1.08 | $ | 0.98 | 10 | % | $ | 3.28 | $ | 2.90 | 13 | % | $ | 1.02 | $ | 1.13 | (10 | )% | ||||||||
| Net income | 1.13 | 1.41 | (20 | ) | 3.34 | 3.45 | (3 | ) | 1.02 | 1.14 | (11 | ) | ||||||||||||||
| Diluted earnings per share: | ||||||||||||||||||||||||||
| Diluted: | ||||||||||||||||||||||||||
| Income from continuing operations | 1.06 | 0.97 | 9 | 3.22 | 2.85 | 13 | 1.01 | 1.11 | (9 | ) | ||||||||||||||||
| Net income | 1.10 | 1.38 | (20 | ) | 3.28 | 3.39 | (3 | ) | 1.01 | 1.12 | (10 | ) | ||||||||||||||
| Dividends declared per common share | $ | 0.49 | $ | 0.44 | 11 | $ | 1.47 | $ | 1.32 | 11 | $ | 0.54 | $ | 0.49 | 10 | |||||||||||
| At September 30, | ||||||||||||||||||||||||||
| At March 31: | ||||||||||||||||||||||||||
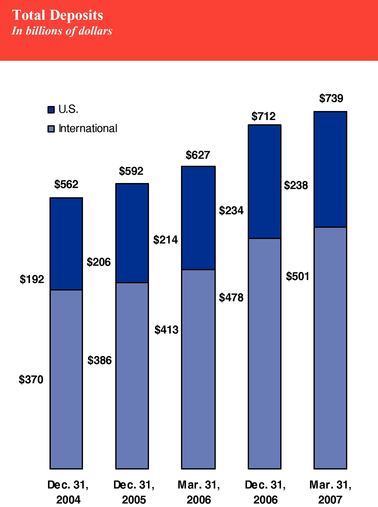
| Total assets | $ | 1,746,248 | $ | 1,472,793 | 19 | % | $ | 2,020,966 | $ | 1,586,201 | 27 | % | ||||||||||||||
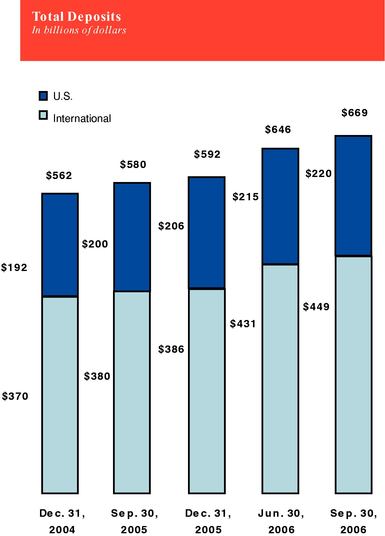
| Total deposits | 669,278 | 580,436 | 15 | 738,521 | 627,358 | 18 | ||||||||||||||||||||
| Long-term debt | 260,089 | 213,894 | 22 | 310,768 | 227,165 | 37 | ||||||||||||||||||||
| Mandatorily redeemable securities of subsidiary trusts | 9,440 | 6,166 | 53 | |||||||||||||||||||||||
| Common stockholders' equity | 116,865 | 110,712 | 6 | 121,083 | 113,418 | 7 | ||||||||||||||||||||
| Total stockholders' equity | 117,865 | 111,837 | 5 | 122,083 | 114,418 | 7 | ||||||||||||||||||||
| Ratios: | ||||||||||||||||||||||||||
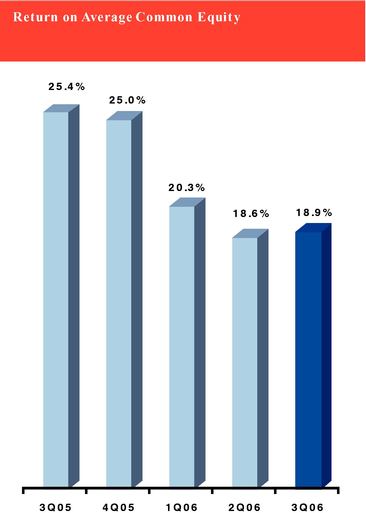
| Return on common stockholders' equity(3) | 18.9 | % | 25.4 | % | 19.3 | % | 21.4 | % | ||||||||||||||||||
| Return on risk capital(4) | 37 | % | 37 | % | 39 | % | 38 | % | ||||||||||||||||||
| Return on invested capital(4) | 19 | % | 25 | % | 19 | % | 21 | % | ||||||||||||||||||
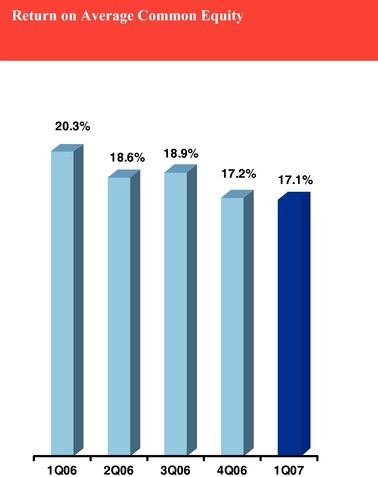
| Return on common stockholders' equity(2) | 17.1 | % | 20.3 | % | ||||||||||||||||||||||
| Return on risk capital(3) | 31 | % | 41 | % | ||||||||||||||||||||||
| Return on invested capital(3) | 17 | % | 20 | % | ||||||||||||||||||||||
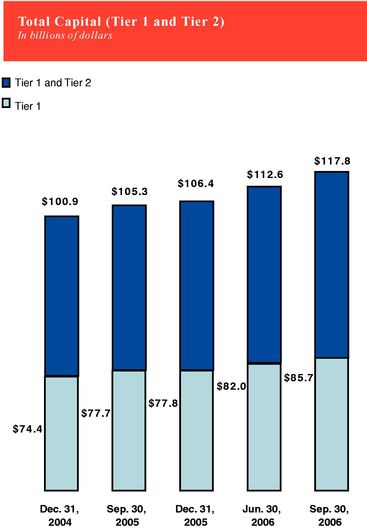
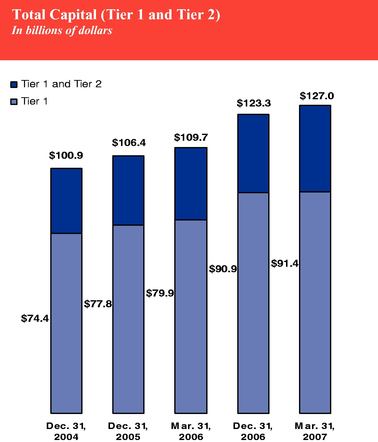
| Tier 1 capital | 8.64 | % | 9.12 | % | 8.64 | % | 9.12 | % | ||||||||||||||||||
| Total capital | 11.88 | % | 12.37 | % | 11.88 | % | 12.37 | % | ||||||||||||||||||
| Leverage(5) | 5.24 | % | 5.53 | % | 5.24 | % | 5.53 | % | ||||||||||||||||||
| Tier 1 Capital | 8.26 | % | 8.60 | % | ||||||||||||||||||||||
| Total Capital | 11.48 | 11.80 | ||||||||||||||||||||||||
| Leverage(4) | 4.84 | 5.22 | ||||||||||||||||||||||||
| Common stockholders' equity to assets | 6.69 | % | 7.52 | % | 5.99 | % | 7.15 | % | ||||||||||||||||||
| Total stockholders' equity to assets | 6.75 | % | 7.59 | % | ||||||||||||||||||||||
| Dividends declared ratio(6) | 44.5 | % | 31.9 | % | 44.8 | % | 38.9 | % | ||||||||||||||||||
| Dividends declared(5) | 53.5 | % | 43.8 | % | ||||||||||||||||||||||
| Ratio of earnings to fixed charges and preferred stock dividends | 1.49x | 1.74x | 1.54x | 1.84x | 1.39x | 1.58x | ||||||||||||||||||||
MANAGEMENT'S DISCUSSION AND ANALYSIS
MANAGEMENT SUMMARY
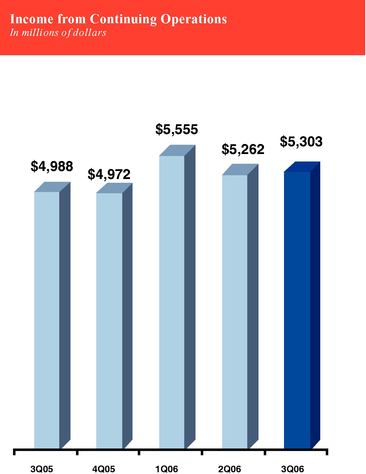
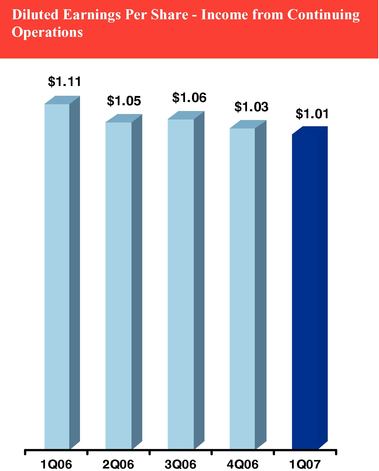
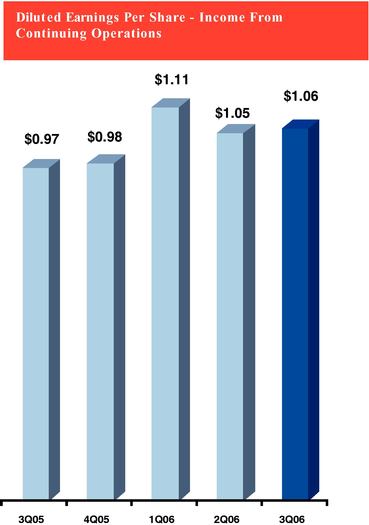
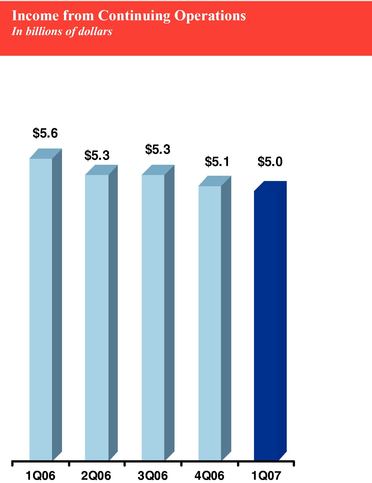
Income from continuing operations of $5.303$5.012 billion in the 2006 thirdfirst quarter of 2007 was up 6%down 10% from the 2005 third quarter.first quarter of 2006. Diluted EPS from continuing operations was updown 9%, with. Results for 2007 include an $871 million after-tax (or $0.17 per share) restructuring charge related to the increment inCompany's Structural Expense Review completed during the growth rate reflecting the benefit from our share repurchase program. Net income, which includes discontinued operations, was $5.505 billion in the quarter, down 23% from the 2005 third quarter.
During the 2006 third quarter, we continued to execute on our key strategic initiatives, including the opening of a record 277 new Citibank and CitiFinancial branches (176 in International and 101 in the U.S.).
Customer volume growth was strong, with average loans up 15%14%, average deposits up 18% and19%, average interest-earning assets up 16%25%, and client assets under fee-based management up 12% from year-ago levels. U.S. debt, equity and equity-related underwriting increased 21% from year-ago levels. Branch activity included the opening of 99 branches during the quarter (48 internationally and 51 in the U.S.).U.S. Cards accounts were up 27%14% and purchase sales were up 9%6%. Citibank Direct,
During the first quarter of 2007, we continued to invest in expanding our Internet bank, has raised almost $8 billion in deposits.distribution and enhancing our technology as we build a broad, strong foundation for future growth. We successfully completed our tender offer to become the majority (over 60%) shareholder of Nikko Cordial and closed several acquisitions, consistent with our efforts to drive growth through a balance of organic investment and targeted acquisitions and to expand internationally.
  |   |
* Excludes Japan Automated Loan Machines (ALMs).
Revenues were approximately even with the 2005 third quarter, at $21.4 billion.a record $25.5 billion, up 15% from a year ago, driven by Markets & Banking, up 23%. Our international operations recorded revenue growth of 11%18% in the quarter, with International Consumer up 9%14%, International CIBMarkets & Banking up 12%20%, and International Global Wealth Management up 33%32%. U.S. Consumer revenues grew 1%6%, while CIB and Alternative Investments revenues declined 6% and 54%, respectively.17%.
Net interest revenue increased 1%8% from last year as higher deposit and loan balances were offset by pressure on net interest margins. Net interest margin in the 2006 thirdfirst quarter of 2007 was 2.62%2.46%, down 3639 basis points from the 2005 thirdfirst quarter and down 11 basis points from theof 2006 second quarter. The largest driver of the decline from the 2006 second quarter was trading activities (see discussion of net interest margin on page 67)63).
Operating expenses increased 5%17% from the 2005 third quarter; this was comprisedfirst quarter of 3 percentage points from an increase2006. Excluding the restructuring charge in investment spending2007 and 2 percentage points due tothe 2006 initial adoption of SFAS 123(R) accruals. Excluding investment spending and SFAS 123(R) accruals,, expenses were flat withup 12% from the prior year. Expenses were down $833 million fromThe relationship between revenue growth and expense growth, excluding the 2006 secondaforementioned impact of restructuring and SFAS 123(R), improved during the quarter. As our Structural Expense Review takes shape, we expect the pace of year-over-year expense growth (excluding acquisitions) to continue to moderate through 2007.
Income was diversified by segment and region, as shown in the charts below.
 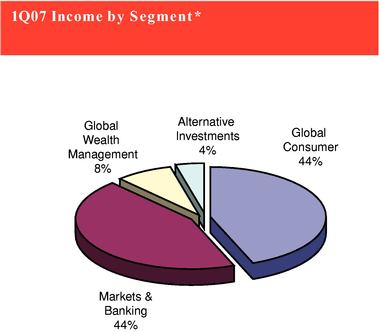 |  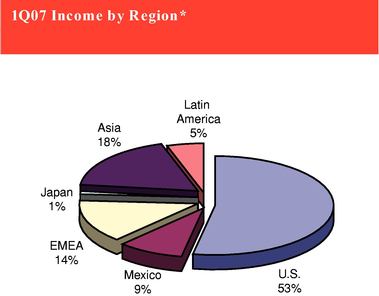 | |
| * Excludes Corporate/ | * Excludes Corporate/Other loss of $912 million and Alternative Investments |
Credit costs increased $1.3 billion from a year ago, primarily driven by an increase in net credit losses of $509 million and a net charge of $597 million to build loan loss reserves. The U.S. credit environment remained stable; this, as well as significantly lower consumer bankruptcy filings,$597 million net build compares to a net reserve release of $154 million in the absenceprior-year period. The build was primarily due to increased reserves to reflect: a change in estimate of loan losses inherent in the initial tenor portion of the 2005 third quarter $490 million pretax charge relatedConsumer Loan Portfolio; portfolio growth, and increased delinquencies in second mortgages, in theU.S. Consumer Lending mortgage portfolio; and portfolio growth in Markets & Banking, which includes higher commitments to the EMEA consumer write-off policy change,leveraged transactions and an asset mix shift, drove a $782 million decreaseincrease in credit costs compared to year-ago levels.average loan tenor. The Global Consumer loss rate was 1.49%1.69%, a 119 basis point decline23 basis-point increase from the 2006 thirdfirst quarter reflecting the absence of the 2005 third quarter $1.153 billion write-off related to the policy change in EMEA and significantly lower bankruptcy filings. Corporate cash-basis loans declined 13% from June 30, 2006 to $692 million.2006.
The effective income tax rate on continuing operations declinedwas 26.9% in the first quarter of 2007, reflecting the impacts of the restructuring charge and $131 million in tax benefits for the initial application under APB 23 relating to 27.4%, primarily reflecting a $237 millioncertain foreign subsidiaries' ability to indefinitely reinvest their earnings abroad. The 21.5% effective tax reserve releaserate in the first quarter of 2006 includes the tax benefit related to the resolution of the New YorkFederal Tax Audits. The effective tax rate for the 2006 third quarter would have been 30.6% without the tax reserve release.Audit.
Our stockholders' equity capital base and trust preferred securities grew to $125.9$131.5 billion at September 30, 2006.March 31, 2007. Stockholders' equity increased by $2.4$2.3 billion during the quarter to $117.9$122.1 billion. We distributed $2.5$2.7 billion in dividends to shareholders and repurchased $2.0 billion$645 million of common stock during the quarter.
As a result of the Company's recent acquisitions, the successful Nikko tender offer, and other growth opportunities, it is anticipated that we will not resume our share repurchase program during the remainder of the year. Return on common equity was 18.9%17.1% for the quarter. Citigroup maintained its "well-capitalized" position with a Tier 1 Capital Ratio of 8.64%8.26% at September 30, 2006. On September 26, 2006, Moody's upgraded Citibank, N.A.'s Credit Rating to "Aaa" from "Aa1."
As we move into the fourth quarter, our priorities remain clear: to execute our strategic initiatives to drive organic revenue and net income growth, to make targeted acquisitions, to maintain expense discipline and to generate superior returns for our owners.
 |  |
EVENTS IN 2006 and 2005March 31, 2007.
Certain of the statements belowabove are forward-looking statements within the meaning of the Private Securities Litigation Reform Act. See "Forward-Looking Statements" on page 84.78.
 |  |
Structural Expense Review
During the first quarter of 2007, the Company completed a review of its structural expense base in a Company-wide effort to create a more streamlined organization, reduce expense growth, and provide investment funds for future growth initiatives.
As a result of the review, a pretax restructuring charge of $1.4 billion ($871 million after-tax) was recorded in Corporate/Other during the first quarter of 2007. Additional pretax restructuring charges of $200 million are anticipated to be recognized by the end of 2007. Separate from the restructuring charge, additional implementation costs of approximately $100 million pretax are expected throughout 2007.
See Note 7 on page 92 for additional information.
Adoption of SFAS 157—Fair Value Measurements
The Company elected to early-adopt SFAS No. 157,"Fair Value Measurements" (SFAS 157), as of January 1, 2007. SFAS 157 defines fair value, establishes a consistent framework for measuring fair value and expands disclosure requirements about fair value measurements. SFAS 157 requires, among other things, Citigroup's valuation techniques used to measure fair value to maximize the use of observable inputs and minimize the use of unobservable inputs. In addition, SFAS 157 precludes the use of block discounts for instruments traded in an active market, which were previously applied to large holdings of publicly-traded equity securities, and requires the recognition of trade-date gains related to certain derivative trades that use unobservable inputs in determining the fair value. This guidance supersedes the guidance in EITF Issue No. 02-3, which prohibited the recognition of day-one gains on certain derivative trades when determining the fair value of instruments not traded in an active market. The cumulative effect of these two changes resulted in an increase to retained earnings of $75 million.
As a result of maximizing observable inputs as required by SFAS 157, Citigroup began to reflect external credit ratings as well as other observable inputs when measuring the fair value of our derivative positions. The cumulative effect of making this derivative valuation adjustment was a gain of $250 million after-tax ($402 million pre-tax, which was recorded in the Markets & Banking business), or $0.05 per diluted share, included in 2007 first quarter earnings. The primary drivers of this change were the requirement that Citigroup include its own credit rating in pricing derivatives and the elimination of a valuation adjustment, which is no longer necessary under SFAS 157.
See Note 16 on page 105 for additional information.
Adoption of SFAS 159—Fair Value Option
In conjunction with the adoption of SFAS 157, the Company early-adopted SFAS 159,"The Fair Value Option for Financial Assets and Financial Liabilities" (SFAS 159), as of January 1, 2007. SFAS 159 provides an option for most financial assets and liabilities to be reported at fair value on an instrument-by-instrument basis with changes in fair value reported in earnings. After the initial adoption, the election is made at the acquisition of a financial asset, financial liability, or a firm commitment and it may not be revoked. Under the SFAS 159 transition provisions, the Company has elected to report certain financial instruments and other items at fair value on a contract-by-contract basis, with future changes in value reported in earnings. SFAS 159 provides an opportunity to mitigate volatility in reported earnings that was caused by measuring hedged assets and liabilities that were previously required to use an accounting method other than fair value, while the related economic hedges were reported at fair value.
The adoption of SFAS 159 resulted in an after-tax decrease to January 1, 2007 retained earnings of $99 million ($157 million pretax).
��See Note 16 on page 105 for additional information.
Sale of MasterCard Shares
During the first quarter of 2007, the Company recorded a $171 million after-tax gain ($268 million pretax) on the sale of approximately 2.955 million of the 4.947 million MasterCard Class B shares which were received by Citigroup as a part of the MasterCard initial public offering completed in June 2006. The after-tax gain was recorded in the following businesses:
| In millions of dollars | Total | ||
|---|---|---|---|
| U.S. Cards | $ | 103 | |
| International Cards | 42 | ||
| International Retail Banking | 26 | ||
| Total | $ | 171 | |
Credit Reserves
During the first quarter of 2007, the Company recorded a net build of $597 million to its credit reserves, consisting of a net build of $311 million in Global Consumer and a net build of $286 million in Markets & Banking.
The build of $311 million in Global Consumer was primarily due to increased reserves to reflect: a change in estimate of loan losses inherent in the initial tenor portion of the Consumer Loan portfolio; increased delinquencies in second mortgages, and portfolio growth in theU.S. Consumer Lending mortgage portfolio. Additionally, market expansion in Mexico Cards and the integration of the Credicard portfolio in Brazil added to the increase.
The build of $286 million in Markets & Banking was primarily inSecurities and Banking, which had a $300 million reserve increase during the quarter due to portfolio growth which includes higher commitments to leveraged transactions and an increase in average loan tenor.
During the first quarter of 2006, the Company recorded a net release/utilization of its credit reserves of $154 million, consisting of a net release/utilization of $187 million in Global Consumer and Global Wealth Management, and a net build of $33 million in Markets & Banking.
Acquisition of Bisys
On May 2, 2007, the Company announced an agreement to acquire Bisys Group, Inc. (Bisys) for $1.45 billion. At closing, Citigroup will sell the Retirement and Insurance Services Divisions of Bisys to affiliates of J.C. Flowers & Co. LLC, making the net cost of the transaction to Citigroup approximately $800 million. Citigroup will retain the Investment Services Division of Bisys, which provides administrative services for hedge funds, mutual funds and private equity funds. The transaction is expected to close in the second half of 2007 and is subject to Bisys shareholder approval and to regulatory approvals in the U.S., Ireland and Bermuda. Bisys will be included within Citigroup'sTransaction Services business.
Tender Offer for Nikko Cordial
On April 26, 2007, Citigroup completed its successful tender offer to become the majority shareholder of Nikko Cordial Corporation in Japan. Approximately 541 million shares were tendered for approximately $7.7 billion. Following the May 9, 2007 scheduled closing date Citigroup will own a total ownership stake in excess of 60%. Once the tender offer is closed, Citigroup will consolidate Nikko and its operations with the minority stake disclosed as Minority Interest.
This acquisition accelerates Citigroup's growth strategy in the world's second largest economy and is intended to provide a broad base of global products and services to Nikko Cordial's client network.
Agreement to Acquire Old Lane Partners, L.P.
On April 13, 2007, the Company announced a definitive agreement to acquire 100% of the outstanding partnership interests in Old Lane Partners, L.P. and Old Lane Partners, GP, LLC (Old Lane). Old Lane is the manager of a global, multi-strategy hedge fund and a private equity fund with total capital under management and private equity commitments of approximately $4.5 billion. Old Lane will operate as part of Citigroup's Alternative Investments (CAI) business. Following the completion of the transaction, Old Lane's Vikram Pandit will become Chief Executive Officer of CAI. The transaction is subject to customary regulatory reviews and is expected to close in the third quarter of 2007.
Acquisition of ABN AMRO Mortgage Group
On March 1, 2007, Citigroup acquired ABN AMRO Mortgage Group (AAMG), a subsidiary of LaSalle Bank Corporation and ABN AMRO Bank N.V. AAMG is a national originator and servicer of prime residential mortgage loans. As part of this acquisition, Citigroup purchased approximately $12 billion in assets, including $3 billion of mortgage servicing rights. The acquisition of AAMG added approximately 1.5 million servicing customers to theU.S. Consumer Lendingportfolio.
Asia Acquisitions
Acquisition of Bank of Overseas Chinese
On April 9, 2007, Citigroup announced the agreement to acquire 100% of Bank of Overseas Chinese (BOOC) in Taiwan for approximately $427 million, subject to certain closing adjustments. BOOC offers a broad suite of corporate banking, consumer and wealth management products and services to more than one million clients through 55 branches in Taiwan.
This transaction will strengthen Citigroup's presence in Asia making it the largest international bank and 13th largest by total assets among all domestic Taiwan banks. Citigroup's acquisition of BOOC is subject to shareholder and U.S. and Taiwanese regulatory approvals and is expected to close during the second half of 2007.
Strategic Investment and Cooperation Agreement with Guangdong Development Bank
On December 17, 2006, a Citigroup-led consortium acquired an 85.6% stake in Guangdong Development Bank ("GDB"). Citigroup's share is 20% of GDB and its investment of approximately $725 million is accounted for under the equity method.
In accordance with the parties' agreement, Citigroup will have significant management influence at GDB to enhance GDB's management team and corporate governance standards, instill operational and lending best practices, improve risk management and internal controls, upgrade GDB's information technology infrastructure, and further develop GDB's customer service and product offerings.
U.K. Market Expansion
Egg
On May 1, 2007, Citigroup completed its acquisition of Egg Banking plc (Egg), the world's largest pure online bank and one of the U.K.'s leading online financial services providers, from Prudential PLC for approximately $1.127 billion. Egg has more than three million customers and offers various financial products and services including online payment and account aggregation services, credit cards, personal loans, savings accounts, mortgages, insurance and investments.
Quilter
On March 1, 2007, the Company completed the acquisition of Quilter, a U.K. wealth advisory firm with over $10.9 billion of assets under management, from Morgan Stanley. Quilter has more than 18,000 clients and 300 staff located in 10 offices throughout the U.K., Ireland and the Channel Islands. Quilter's results are included within Global Wealth Management.
Central American Acquisitions
Grupo Cuscatlan
On December 13, 2006, Citigroup announced the agreement to acquire the subsidiaries of Grupo Cuscatlan for $1.51 billion in cash and stock from Corporacion UBC Internacional S.A. Grupo Cuscatlan is one of the leading financial groups in Central America, with assets of $5.4 billion, loans of $3.5 billion, and deposits of $3.4 billion. Grupo Cuscatlan has operations in El Salvador, Guatemala, Costa Rica, Honduras and Panama. This acquisition is subject to local country regulatory approvals and is expected to close during the second quarter of 2007.
Grupo Financiero Uno
On October 27, 2006,March 5, 2007, Citigroup announced that it had reached a definitive agreement to acquirecompleted its acquisition of Grupo Financiero Uno (GFU), the largest credit card issuer in Central America, and its affiliates.
The acquisition of GFU, with $2.1$2.2 billion in assets, will expandexpands the presence of Citigroup's Latin America consumer franchise, enhancingenhances its credit card business in the region and establishingestablishes a platform for regional growth in consumer financeConsumer Finance and retail banking.Retail Banking.
GFU is privately held and has more than one million retail clients, representing 1.1 million credit card accounts, $1.2$1.3 billion in credit card receivables and $1.3$1.5 billion in deposits in Guatemala, El Salvador, Honduras, Nicaragua, Costa Rica and Panama as of September 30, 2006.Panama. GFU operates a distribution network of 75 branches and more than 100 mini- branchesmini-branches and points of sale.
The transaction, which is subject to regulatory approvals in the United States and each of the six countries, is anticipated to close in the 2007 first quarter.
Sale of AvantelEMEA Expansion
On October 26, 2006, the Company agreed to sell Avantel, a leading telecom service provider in Mexico, to Axtel. The transaction is expected to result in an approximately $140 million after-tax gain ($310 million pretax). The transaction is expected to close in the 2006 fourth quarter, subject to Mexican regulatory and Axtel shareholder approvals. Avantel was acquired by Citigroup as part of its acquisition of Banamex in 2001.
Purchase of 20% Equity Interest in Akbank
On October 17, 2006, the Company announced that it had signed a definitive agreement for theJanuary 9, 2007, Citigroup completed its purchase of a 20% equity interest in Akbank for approximately $3.1 billion. Akbank, the second-largest privately-ownedprivately owned bank by assets in Turkey, is a premier, full-service retail, commercial, corporate and private bank.
Sabanci Holding, a 34% owner of Akbank shares, and its subsidiaries have granted Citigroup a right of first refusal or first offer over the sale of any of their Akbank shares in the future. Subject to certain exceptions, including purchases from Sabanci Holding and its subsidiaries, Citigroup has otherwise agreed not to acquire additional sharesincrease its percentage ownership in Akbank.
The transaction, which is subject to shareholder and regulatory approvals, is expected to close during the 2006 fourth quarter or 2007 first quarter and will be accounted for under the equity method.
Final Payment from the SaleResolution of the Asset Management BusinessFederal Tax Audit
In SeptemberMarch 2006, the Company received a notice from the final closing adjustment payment related toInternal Revenue Service (IRS) that they had concluded the sale of its Asset Management business to Legg Mason, Inc. (Legg Mason). This payment resulted in an additional after-tax gain of $51 million ($83 million pretax), recorded in Discontinued Operations.
Final Settlement of the Travelers Life & Annuity Sale
In July 2006, the Company received the final closing adjustment payment related to the sale of Citigroup's Travelers Life & Annuity and substantially all of its international insurance businesses to MetLife, Inc. (MetLife). This payment resulted in an after-tax gain of $75 million ($115 million pretax), recorded in Discontinued Operations.
Settlement of New York State and New York City Tax Audits
In September 2006, Citigroup reached a settlement agreement with the New York State and New York City taxing authorities regarding various tax liabilitiesaudit for the years 1998 - 20051999 through 2002 (referred to above and hereinafter as the "resolution of the New YorkFederal Tax Audits"Audit").
For the first quarter of 2006, third quarter, the Company released $254a total of $657 million from its tax contingency reserves which resulted in increasesrelated to the resolution of $237 million in after-tax income from continuing operations and $17 million in after-tax income from discontinued operations.the Federal Tax Audit.
The following table summarizes the 2006 thirdfirst quarter tax benefit,benefits, by business, from the resolution of the New YorkFederal Tax Audits:Audit:
| In millions of dollars | 2006 Third Quarter | ||
|---|---|---|---|
| U.S. Cards | $ | 39 | |
| U.S. Retail Distribution | 4 | ||
| U.S. Consumer Lending | 10 | ||
| U.S. Commercial Business | 1 | ||
Total U.S. Consumer | $ | 54 | |
| International Cards | 5 | ||
| International Consumer Finance | 1 | ||
| International Retail Banking | 18 | ||
| Total International Consumer | $ | 24 | |
| Consumer Other | 1 | ||
| Global Consumer | $ | 79 | |
| Capital Markets and Banking | 97 | ||
| Transaction Services | 19 | ||
Corporate & Investment Banking | $ | 116 | |
| Smith Barney | 31 | ||
| Private Bank | 3 | ||
Global Wealth Management | $ | 34 | |
Alternative Investments | — | ||
Corporate/Other | 8 | ||
| Continuing Operations | $ | 237 | |
| Discontinued Operations | 17 | ||
| Total | $ | 254 | |
MasterCard Initial Public Offering
In June 2006, MasterCard conducted a series of transactions consisting of: (i) an IPO of new Class A stock, (ii) an exchange of its old Class A stock held by its member banks for shares of its new Class B and Class M stocks, and (iii) a partial redemption of the new Class B stock held by the member banks. Citigroup, as one of MasterCard's member banks, received 4,946,587 shares of Class B stock, 48 shares of Class M stock, and $123 million in cash as a result of these transactions. An after-tax gain of $78 million ($123 million pretax) was recognized in the 2006 second quarter related to the cash redemption of shares.
Sale of Upstate New York Branches
On June 30, 2006, Citigroup sold the Upstate New York Financial Center Network consisting of 21 branches in Rochester, N.Y. and Buffalo, N.Y. to M&T Bank (referred to hereinafter as the "Sale of New York Branches"). Citigroup received a premium on deposit balances of approximately $1 billion. An after-tax gain of $92 million ($163 million pretax) was recognized in the 2006 second quarter.
Consolidation of Brazil's Credicard
In April 2006, Citigroup and Banco Itau dissolved their joint venture in Credicard, a Brazil consumer credit card business. In accordance with the dissolution agreement, Banco Itau received half of Credicard's assets and customer accounts in exchange for its 50% ownership, leaving Citigroup as the sole owner of Credicard.
Beginning April 30, 2006, Credicard's financial statements were consolidated with Citigroup. Previously, Citigroup reported its interest in Credicard using the equity method of consolidation. Accordingly, our net investment was included in Other assets.
Acquisition of Federated Credit Card Portfolio and Credit Card Agreement With Federated Department Stores
In June 2005, Citigroup announced a long-term agreement with Federated Department Stores, Inc. (Federated) under which the companies partner to manage approximately $6.2 billion of Federated's credit card receivables, including existing and new accounts, executed in three phases.
For the first phase, which closed in October 2005, Citigroup acquired Federated's receivables under management, totaling approximately $3.3 billion. For the second phase, which closed in May 2006, additional Federated receivables totaling approximately $1.9 billion were transferred to Citigroup from the previous provider. For the final phase, in the 2006 third quarter, Citigroup acquired approximately $1.0 billion credit card receivable portfolio of The May Department Stores Company (May), which merged with Federated.
Citigroup paid a premium of approximately 11.5% to acquire these portfolios. The multi-year agreement also provides Federated the ability to participate in the portfolio performance, based on credit sales and certain other performance metrics.
The Federated and May credit card portfolios comprise a total of approximately 17 million active accounts.
| In millions of dollars | Total | ||
|---|---|---|---|
| Global Consumer | $ | 290 | |
| Markets & Banking | 176 | ||
| Global Wealth Management | 13 | ||
| Alternative Investments | 58 | ||
| Corporate/Other | 61 | ||
| Continuing Operations | $ | 598 | |
| Discontinued Operations | 59 | ||
| Total | $ | 657 | |
AdoptionCredit Reserves
During the first quarter of 2007, the Company recorded a net build of $597 million to its credit reserves, consisting of a net build of $311 million in Global Consumer and a net build of $286 million in Markets & Banking.
The build of $311 million in Global Consumer was primarily due to increased reserves to reflect: a change in estimate of loan losses inherent in the initial tenor portion of the AccountingConsumer Loan portfolio; increased delinquencies in second mortgages, and portfolio growth in theU.S. Consumer Lending mortgage portfolio. Additionally, market expansion in Mexico Cards and the integration of the Credicard portfolio in Brazil added to the increase.
The build of $286 million in Markets & Banking was primarily inSecurities and Banking, which had a $300 million reserve increase during the quarter due to portfolio growth which includes higher commitments to leveraged transactions and an increase in average loan tenor.
During the first quarter of 2006, the Company recorded a net release/utilization of its credit reserves of $154 million, consisting of a net release/utilization of $187 million in Global Consumer and Global Wealth Management, and a net build of $33 million in Markets & Banking.
Acquisition of Bisys
On May 2, 2007, the Company announced an agreement to acquire Bisys Group, Inc. (Bisys) for Share-Based Payments$1.45 billion. At closing, Citigroup will sell the Retirement and Insurance Services Divisions of Bisys to affiliates of J.C. Flowers & Co. LLC, making the net cost of the transaction to Citigroup approximately $800 million. Citigroup will retain the Investment Services Division of Bisys, which provides administrative services for hedge funds, mutual funds and private equity funds. The transaction is expected to close in the second half of 2007 and is subject to Bisys shareholder approval and to regulatory approvals in the U.S., Ireland and Bermuda. Bisys will be included within Citigroup'sTransaction Services business.
Tender Offer for Nikko Cordial
On April 26, 2007, Citigroup completed its successful tender offer to become the majority shareholder of Nikko Cordial Corporation in Japan. Approximately 541 million shares were tendered for approximately $7.7 billion. Following the May 9, 2007 scheduled closing date Citigroup will own a total ownership stake in excess of 60%. Once the tender offer is closed, Citigroup will consolidate Nikko and its operations with the minority stake disclosed as Minority Interest.
This acquisition accelerates Citigroup's growth strategy in the world's second largest economy and is intended to provide a broad base of global products and services to Nikko Cordial's client network.
Agreement to Acquire Old Lane Partners, L.P.
On April 13, 2007, the Company announced a definitive agreement to acquire 100% of the outstanding partnership interests in Old Lane Partners, L.P. and Old Lane Partners, GP, LLC (Old Lane). Old Lane is the manager of a global, multi-strategy hedge fund and a private equity fund with total capital under management and private equity commitments of approximately $4.5 billion. Old Lane will operate as part of Citigroup's Alternative Investments (CAI) business. Following the completion of the transaction, Old Lane's Vikram Pandit will become Chief Executive Officer of CAI. The transaction is subject to customary regulatory reviews and is expected to close in the third quarter of 2007.
Acquisition of ABN AMRO Mortgage Group
On March 1, 2007, Citigroup acquired ABN AMRO Mortgage Group (AAMG), a subsidiary of LaSalle Bank Corporation and ABN AMRO Bank N.V. AAMG is a national originator and servicer of prime residential mortgage loans. As part of this acquisition, Citigroup purchased approximately $12 billion in assets, including $3 billion of mortgage servicing rights. The acquisition of AAMG added approximately 1.5 million servicing customers to theU.S. Consumer Lendingportfolio.
Asia Acquisitions
Acquisition of Bank of Overseas Chinese
On April 9, 2007, Citigroup announced the agreement to acquire 100% of Bank of Overseas Chinese (BOOC) in Taiwan for approximately $427 million, subject to certain closing adjustments. BOOC offers a broad suite of corporate banking, consumer and wealth management products and services to more than one million clients through 55 branches in Taiwan.
This transaction will strengthen Citigroup's presence in Asia making it the largest international bank and 13th largest by total assets among all domestic Taiwan banks. Citigroup's acquisition of BOOC is subject to shareholder and U.S. and Taiwanese regulatory approvals and is expected to close during the second half of 2007.
Strategic Investment and Cooperation Agreement with Guangdong Development Bank
On December 17, 2006, a Citigroup-led consortium acquired an 85.6% stake in Guangdong Development Bank ("GDB"). Citigroup's share is 20% of GDB and its investment of approximately $725 million is accounted for under the equity method.
In accordance with the parties' agreement, Citigroup will have significant management influence at GDB to enhance GDB's management team and corporate governance standards, instill operational and lending best practices, improve risk management and internal controls, upgrade GDB's information technology infrastructure, and further develop GDB's customer service and product offerings.
U.K. Market Expansion
Egg
On May 1, 2007, Citigroup completed its acquisition of Egg Banking plc (Egg), the world's largest pure online bank and one of the U.K.'s leading online financial services providers, from Prudential PLC for approximately $1.127 billion. Egg has more than three million customers and offers various financial products and services including online payment and account aggregation services, credit cards, personal loans, savings accounts, mortgages, insurance and investments.
Quilter
On March 1, 2007, the Company completed the acquisition of Quilter, a U.K. wealth advisory firm with over $10.9 billion of assets under management, from Morgan Stanley. Quilter has more than 18,000 clients and 300 staff located in 10 offices throughout the U.K., Ireland and the Channel Islands. Quilter's results are included within Global Wealth Management.
Central American Acquisitions
Grupo Cuscatlan
On December 13, 2006, Citigroup announced the agreement to acquire the subsidiaries of Grupo Cuscatlan for $1.51 billion in cash and stock from Corporacion UBC Internacional S.A. Grupo Cuscatlan is one of the leading financial groups in Central America, with assets of $5.4 billion, loans of $3.5 billion, and deposits of $3.4 billion. Grupo Cuscatlan has operations in El Salvador, Guatemala, Costa Rica, Honduras and Panama. This acquisition is subject to local country regulatory approvals and is expected to close during the second quarter of 2007.
Grupo Financiero Uno
On March 5, 2007, Citigroup completed its acquisition of Grupo Financiero Uno (GFU), the largest credit card issuer in Central America, and its affiliates.
The acquisition of GFU, with $2.2 billion in assets, expands the presence of Citigroup's Latin America consumer franchise, enhances its credit card business in the region and establishes a platform for regional growth in Consumer Finance and Retail Banking.
GFU has more than one million retail clients, representing 1.1 million credit card accounts, $1.3 billion in credit card receivables and $1.5 billion in deposits in Guatemala, El Salvador, Honduras, Nicaragua, Costa Rica and Panama. GFU operates a distribution network of 75 branches and more than 100 mini-branches and points of sale.
EMEA Expansion
Purchase of 20% Equity Interest in Akbank
On January 1, 2006,9, 2007, Citigroup completed its purchase of a 20% equity interest in Akbank for approximately $3.1 billion. Akbank, the Company adopted Statementsecond-largest privately owned bank by assets in Turkey, is a premier, full-service retail, commercial, corporate and private bank.
Sabanci Holding, a 34% owner of Financial Accounting Standards (SFAS) 123 (revised 2004), "Share-Based Payment" (SFAS 123(R)), which replacesAkbank shares, and its subsidiaries have granted Citigroup a right of first refusal or first offer over the existing SFAS 123 and supersedes Accounting Principles Board (APB) 25. SFAS 123(R) requires companies to measure and record compensation expense for stock options and other share-based payments based on the instruments' fair value, reduced by expected forfeitures.
In adopting this standard, the Company conformed to recent accounting guidance that restricted stock awards issued to retirement-eligible employees who meet certain age and service requirements must be either expensed on the grant date or accrued over a service period prior to the grant date. This charge consistedsale of $398 million after-tax ($648 million pretax) for the immediate expensingany of awards granted to retirement-eligible employees in January 2006.
The following table summarizes the SFAS 123(R) impact, by segment, on the 2006 first quarter pretax compensation expense for stock awards granted to retirement-eligible employees in January 2006:
| In millions of dollars | 2006 First Quarter | ||
|---|---|---|---|
| Global Consumer | $ | 121 | |
Corporate and Investment Banking | 354 | ||
Global Wealth Management | 145 | ||
Alternative Investments | 7 | ||
Corporate/Other | 21 | ||
| Total | $ | 648 | |
The following table summarizes the quarterly SFAS 123(R) impact on 2006 pretax compensation expense (and after-tax impact) for the quarterly accrual of the estimated awards that will be granted in January 2007:
| In millions of dollars | Pretax | After-tax | ||||
|---|---|---|---|---|---|---|
| First quarter 2006 | $ | 198 | $ | 122 | ||
| Second quarter 2006 | 168 | 104 | ||||
| Third quarter 2006 | 195 | 127 | ||||
| Year-to-date 2006 | $ | 561 | $ | 353 | ||
The Company changed the plan's retirement eligibility for the January 2007 management awards, which affected the amount of the accrualtheir Akbank shares in the 2006 secondfuture. Subject to certain exceptions, including purchases from Sabanci Holding and third quarters.its subsidiaries, Citigroup has otherwise agreed not to increase its percentage ownership in Akbank.
Additional information can be found in Notes 1 and 8 to the Consolidated Financial Statements on pages 91 and 100, respectively. The Company will continue to accrue for the estimated awards that will be granted in January 2007 in the 2006 fourth quarter.
SettlementResolution of IRSFederal Tax Audit
In March 2006, the Company received a notice from the Internal Revenue Service (IRS) that they had concluded the tax audit for the years 1999 through 2002 (referred to hereinafter as the "resolution of the Federal Tax Audit"). For the 2006 first quarter of 2006, the Company released a total of $657 million from its tax contingency reserves related to the resolution of the Federal Tax Audit.
The following table summarizes the 2006 first quarter tax benefitbenefits, by segment ofbusiness, from the resolution of the Federal Tax Audit:
| In millions of dollars | 2006 First Quarter | ||
|---|---|---|---|
| Global Consumer | $ | 290 | |
Corporate and Investment Banking | 176 | ||
Global Wealth Management | 13 | ||
Alternative Investments | 58 | ||
Corporate/Other | 61 | ||
| Continuing Operations | $ | 598 | |
Discontinued Operations | 59 | ||
| Total | $ | 657 | |
Sale of Asset Management Business
On December 1, 2005, the Company completed the sale of substantially all of its Asset Management Business to Legg Mason in exchange for Legg Mason's broker-dealer business, $2.298 billion of Legg Mason's common and preferred shares (valued as of the closing date), and $500 million in cash. This cash was obtained via a lending facility provided by Citigroup CIB. The transaction did not include Citigroup's asset management business in Mexico, its retirement services business inLatin America (both of which are now included inInternational Retail Banking) or its interest in the CitiStreet joint venture (which is now included inSmith Barney). The total value of the transaction at the time of closing was approximately $4.369 billion, resulting in an after-tax gain to Citigroup of approximately $2.082 billion ($3.404 billion pretax).
Concurrently, Citigroup sold Legg Mason's Capital Markets business to Stifel Financial Corp. (The transactions described in these two paragraphs are referred to as the "Sale of the Asset Management Business.")
Upon completion of the Sale of the Asset Management Business, Citigroup added 1,226 financial advisors in 124 branch offices from Legg Mason to its Global Wealth Management business.
During March 2006, Citigroup sold 10.3 million shares of Legg Mason stock through an underwritten public offering. The net sale proceeds of $1.258 billion resulted in a pretax gain of $24 million.
Additional information can be found in Note 3 to the Consolidated Financial Statements on page 94.
Sale of Travelers Life & Annuity
On July 1, 2005, the Company completed the sale of Citigroup's Travelers Life & Annuity and substantially all of Citigroup's international insurance businesses to MetLife. The businesses sold were the primary vehicles through which Citigroup engaged in the Life Insurance and Annuities business.
Citigroup received $1.0 billion in MetLife equity securities and $10.830 billion in cash, which resulted in an after-tax gain of approximately $2.120 billion ($3.386 billion pretax), which is included in discontinued operations.
In July 2006, Citigroup recognized an $85 million after-tax gain from the sale of MetLife shares. This gain was reported within Income from continuing operations in the Alternative Investments business.
The transaction encompassed Travelers Life & Annuity's U.S. businesses and its international operations, other than Citigroup's life insurance business in Mexico (which is now included withinInternational Retail Banking). (The transaction described in the preceding three paragraphs is referred to as the "Sale of the Life Insurance and Annuities Business").
Additional information can be found in Note 3 to the Consolidated Financial Statements on page 94.
| In millions of dollars | Total | ||
|---|---|---|---|
| Global Consumer | $ | 290 | |
| Markets & Banking | 176 | ||
| Global Wealth Management | 13 | ||
| Alternative Investments | 58 | ||
| Corporate/Other | 61 | ||
| Continuing Operations | $ | 598 | |
| Discontinued Operations | 59 | ||
| Total | $ | 657 | |
Credit Reserves
During the three months ended September 30, 2006,first quarter of 2007, the Company recorded a net build of $597 million to its credit reserves, of $37 million, consisting of a net release/utilizationbuild of $79$311 million in Global Consumer and a net build of $116$286 million in CIB.Markets & Banking.
The net release/utilizationbuild of $311 million in Global Consumer was primarily due to lower bankruptcy filings andincreased reserves to reflect: a continued overall improvementchange in estimate of loan losses inherent in the U.S. consumer portfolio. Partially offsettinginitial tenor portion of the net releases was a build of $112 millionConsumer Loan portfolio; increased delinquencies in second mortgages, and portfolio growth in theJapanU.S. Consumer Lending relatingmortgage portfolio. Additionally, market expansion in Mexico Cards and the integration of the Credicard portfolio in Brazil added to the consumer lending industry (see discussion on page 33).increase.
The net build of $116$286 million in CIBMarkets & Banking was primarily comprised of $109 million inCapital MarketsSecurities and Banking, which includedhad a $48$300 million reserve increase for unfunded lending commitments. The net build reflectedduring the quarter due to portfolio growth which includes higher commitments to leveraged transactions and an increase in loans and unfunded commitments and a change in credit rating of certain counterparties.average loan tenor.
ForDuring the nine months ended September 30,first quarter of 2006, the Company recorded a net release/utilization of $327its credit reserves of $154 million, consisting of a net release/utilization of $594$187 million in Global Consumer and Global Wealth Management, and a net build of $267$33 million in CIB.
Credit Reserve Builds (Releases/Utilization)(1)
| | Three Months Ended September 30, | Nine Months Ended September 30, | |||||||||||
|---|---|---|---|---|---|---|---|---|---|---|---|---|---|
| In millions of dollars | 2006 | 2005 | 2006 | 2005 | |||||||||
| By Product: | |||||||||||||
U.S. Cards | $ | (122 | ) | $ | 30 | $ | (354 | ) | $ | 30 | |||
| U.S. Retail Distribution | (29 | ) | 275 | (115 | ) | 258 | |||||||
| U.S. Consumer Lending | (8 | ) | (56 | ) | (114 | ) | (56 | ) | |||||
| U.S. Commercial Business | (38 | ) | 13 | (84 | ) | (5 | ) | ||||||
International Cards | 59 | 24 | 179 | 37 | |||||||||
| International Consumer Finance | 135 | (10 | ) | 136 | (9 | ) | |||||||
| International Retail Banking | (93 | ) | (649 | ) | (275 | ) | (639 | ) | |||||
Smith Barney | (1 | ) | 7 | (1 | ) | 11 | |||||||
| Private Bank | 17 | 24 | 34 | 14 | |||||||||
| Consumer Other | 1 | — | — | (1 | ) | ||||||||
| Total Consumer | $ | (79 | ) | $ | (342 | ) | $ | (594 | ) | $ | (360 | ) | |
| Capital Markets and Banking | 109 | 158 | 258 | 125 | |||||||||
| Transaction Services | 7 | 9 | 9 | 13 | |||||||||
| Other CIB | — | (3 | ) | — | (3 | ) | |||||||
| Total CIB | $ | 116 | $ | 164 | $ | 267 | $ | 135 | |||||
| Total Citigroup | $ | 37 | $ | (178 | ) | $ | (327 | ) | $ | (225 | ) | ||
| By Region: | |||||||||||||
U.S. | $ | (134 | ) | $ | 407 | $ | (447 | ) | $ | 443 | |||
| Mexico | 6 | 26 | 51 | (69 | ) | ||||||||
| EMEA | 83 | (620 | ) | 41 | (493 | ) | |||||||
| Japan | 115 | 22 | 91 | 22 | |||||||||
| Asia | (70 | ) | 3 | (120 | ) | (43 | ) | ||||||
| Latin America | 37 | (16 | ) | 57 | (85 | ) | |||||||
| Total Citigroup | $ | 37 | $ | (178 | ) | $ | (327 | ) | $ | (225 | ) | ||
Allowance for Credit Losses
| In millions of dollars | Sept. 30, 2006 | Dec. 31, 2005 | Sept. 30, 2005 | ||||||
|---|---|---|---|---|---|---|---|---|---|
| Allowance for loan losses | $ | 8,979 | $ | 9,782 | $ | 10,015 | |||
| Allowance for unfunded lending commitments | 1,100 | 850 | 800 | ||||||
| Total allowance for loan losses and unfunded lending commitments | $ | 10,079 | $ | 10,632 | $ | 10,815 | |||
Hurricane Katrina
In the 2005 third quarter, the Company recorded a $222 million after-tax charge $(357 million pretax) for the estimated probable losses incurred from Hurricane Katrina. This charge consisted primarily of additional credit costs inU.S. Cards,U.S. Commercial Business, U.S. Consumer Lending andU.S. Retail Distribution businesses, based on total credit exposures of approximately $3.6 billion in the Federal Emergency Management Agency (FEMA) Individual Assistance designated areas. This charge did not include an after-tax estimate of $75 million $(109 million pretax) for fees and interest due from related customers that were waived during 2005.
Change in EMEA Consumer Write-off Policy
Prior to the third quarter of 2005, certain Western European consumer portfolios were granted an exception to Citigroup's global write-off policy. The exception extended the write-off period from the standard 120-day policy for personal installment loans, and was granted because of the higher recovery rates experienced in these portfolios. During 2005, Citigroup observed lower actual recovery rates, stemming primarily from a change in bankruptcy and wage garnishment laws in Germany and, as a result, rescinded the exception to the global standard. The net charge was $332 million $(490 million pretax) resulting from the recording of $1.153 billion of write-offs and a corresponding utilization of $663 million of reserves in the 2005 third quarter.
These write-offs did not relate to a change in the portfolio credit quality but rather to a change in environmental factors due to law changes and consumer behavior that led Citigroup to re-evaluate its estimates of future long-term recoveries and their appropriateness to the write-off exception.
United States Bankruptcy Legislation
On October 17, 2005, the Bankruptcy Reform Act (or the Act) became effective. The Act imposes a means test to determine if people who file for Chapter 7 bankruptcy earn more than the median income in their state and could repay at least $6,000 of unsecured debt over five years. Bankruptcy filers who meet this test are required to enter into a repayment plan under Chapter 13, instead of canceling their debt entirely under Chapter 7. As a result of these more stringent guidelines, bankruptcy claims accelerated prior to the effective date. The incremental bankruptcy losses over the Company's estimated baseline in 2005 that was attributable to the Act inU.S. Cards business was approximately $970 million on a managed basis $(550 million in the Company's on-balance portfolio and $420 million in the securitized portfolio). In addition, theU.S. Retail Distribution business incurred incremental bankruptcy losses of approximately $90 million during 2005.
Homeland Investment Act Benefit
The Company's 2005 third quarter results from continuing operations include a $185 million $(198 million for the 2005 full year) tax benefit from the Homeland Investment Act provision of the American Jobs Creation Act of 2004, net of the impact of remitting income earned in 2005 and prior years that would otherwise have been indefinitely invested overseas. The amount of dividends that were repatriated relating to this benefit is approximately $3.2 billion.
Copelco Litigation Settlement
In 2000, Citigroup purchased Copelco Capital, Inc., a leasing business, from Itochu International Inc. and III Holding Inc. (formerly known as Copelco Financial Services Group, Inc.) (collectively referred to herein as "Itochu") for $666 million. During 2001, Citigroup filed a lawsuit asserting breach of representations and warranties, among other causes of action, under the Stock Purchase Agreement entered into between Citigroup and Itochu in March of 2000. During the 2005 third quarter, Citigroup and Itochu signed a settlement agreement that mutually released all claims, and under which Itochu paid Citigroup $185 million.
Mexico Value Added Tax (VAT) Refund
During the 2005 third quarter, Citigroup Mexico received a $182 million refund of VAT taxes from the Mexican Government related to the 2003 and 2004 tax years as a result of a Mexico Supreme Court ruling. The refund was recorded as a reduction of $140 million (pretax) in other operating expense and $42 million (pretax) in other revenue.
Divestiture of the Manufactured Housing Loan Portfolio
On May 1, 2005, Citigroup completed the sale of its manufactured housing loan portfolio, consisting of $1.4 billion in loans, to 21st Mortgage Corp. The Company recognized a $109 million after-tax loss $(157 million pretax) in the 2005 first quarter related to the divestiture.
Repositioning Charges
The Company recorded a $272 million after-tax $(435 million pretax) charge during the 2005 first quarter for repositioning costs. The repositioning charges were predominantly severance-related costs recorded in CIB $(151 million after-tax) and in Global Consumer $(95 million after-tax). These repositioning actions were consistent with the Company's objectives of controlling expenses while continuing to invest in growth opportunities.
Resolution of Glendale Litigation
During the 2005 first quarter, the Company recorded a $72 million after-tax gain $(114 million pretax) following the resolution ofGlendale Federal Bank v. United States,an action brought by Glendale Federal Bank, a predecessor to Citibank (West), FSB, against the United States government.Markets & Banking.
Acquisition of First AmericanBisys
On May 2, 2007, the Company announced an agreement to acquire Bisys Group, Inc. (Bisys) for $1.45 billion. At closing, Citigroup will sell the Retirement and Insurance Services Divisions of Bisys to affiliates of J.C. Flowers & Co. LLC, making the net cost of the transaction to Citigroup approximately $800 million. Citigroup will retain the Investment Services Division of Bisys, which provides administrative services for hedge funds, mutual funds and private equity funds. The transaction is expected to close in the second half of 2007 and is subject to Bisys shareholder approval and to regulatory approvals in the U.S., Ireland and Bermuda. Bisys will be included within Citigroup'sTransaction Services business.
Tender Offer for Nikko Cordial
On April 26, 2007, Citigroup completed its successful tender offer to become the majority shareholder of Nikko Cordial Corporation in Japan. Approximately 541 million shares were tendered for approximately $7.7 billion. Following the May 9, 2007 scheduled closing date Citigroup will own a total ownership stake in excess of 60%. Once the tender offer is closed, Citigroup will consolidate Nikko and its operations with the minority stake disclosed as Minority Interest.
This acquisition accelerates Citigroup's growth strategy in the world's second largest economy and is intended to provide a broad base of global products and services to Nikko Cordial's client network.
Agreement to Acquire Old Lane Partners, L.P.
On April 13, 2007, the Company announced a definitive agreement to acquire 100% of the outstanding partnership interests in Old Lane Partners, L.P. and Old Lane Partners, GP, LLC (Old Lane). Old Lane is the manager of a global, multi-strategy hedge fund and a private equity fund with total capital under management and private equity commitments of approximately $4.5 billion. Old Lane will operate as part of Citigroup's Alternative Investments (CAI) business. Following the completion of the transaction, Old Lane's Vikram Pandit will become Chief Executive Officer of CAI. The transaction is subject to customary regulatory reviews and is expected to close in the third quarter of 2007.
Acquisition of ABN AMRO Mortgage Group
On March 1, 2007, Citigroup acquired ABN AMRO Mortgage Group (AAMG), a subsidiary of LaSalle Bank Corporation and ABN AMRO Bank N.V. AAMG is a national originator and servicer of prime residential mortgage loans. As part of this acquisition, Citigroup purchased approximately $12 billion in assets, including $3 billion of mortgage servicing rights. The acquisition of AAMG added approximately 1.5 million servicing customers to theU.S. Consumer Lendingportfolio.
Asia Acquisitions
Acquisition of Bank of Overseas Chinese
On April 9, 2007, Citigroup announced the agreement to acquire 100% of Bank of Overseas Chinese (BOOC) in Taiwan for approximately $427 million, subject to certain closing adjustments. BOOC offers a broad suite of corporate banking, consumer and wealth management products and services to more than one million clients through 55 branches in Taiwan.
This transaction will strengthen Citigroup's presence in Asia making it the largest international bank and 13th largest by total assets among all domestic Taiwan banks. Citigroup's acquisition of BOOC is subject to shareholder and U.S. and Taiwanese regulatory approvals and is expected to close during the second half of 2007.
Strategic Investment and Cooperation Agreement with Guangdong Development Bank
On March 31, 2005,December 17, 2006, a Citigroup-led consortium acquired an 85.6% stake in Guangdong Development Bank ("GDB"). Citigroup's share is 20% of GDB and its investment of approximately $725 million is accounted for under the equity method.
In accordance with the parties' agreement, Citigroup will have significant management influence at GDB to enhance GDB's management team and corporate governance standards, instill operational and lending best practices, improve risk management and internal controls, upgrade GDB's information technology infrastructure, and further develop GDB's customer service and product offerings.
U.K. Market Expansion
Egg
On May 1, 2007, Citigroup completed its acquisition of FirstEgg Banking plc (Egg), the world's largest pure online bank and one of the U.K.'s leading online financial services providers, from Prudential PLC for approximately $1.127 billion. Egg has more than three million customers and offers various financial products and services including online payment and account aggregation services, credit cards, personal loans, savings accounts, mortgages, insurance and investments.
Quilter
On March 1, 2007, the Company completed the acquisition of Quilter, a U.K. wealth advisory firm with over $10.9 billion of assets under management, from Morgan Stanley. Quilter has more than 18,000 clients and 300 staff located in 10 offices throughout the U.K., Ireland and the Channel Islands. Quilter's results are included within Global Wealth Management.
Central American BankAcquisitions
Grupo Cuscatlan
On December 13, 2006, Citigroup announced the agreement to acquire the subsidiaries of Grupo Cuscatlan for $1.51 billion in Texas (FAB).cash and stock from Corporacion UBC Internacional S.A. Grupo Cuscatlan is one of the leading financial groups in Central America, with assets of $5.4 billion, loans of $3.5 billion, and deposits of $3.4 billion. Grupo Cuscatlan has operations in El Salvador, Guatemala, Costa Rica, Honduras and Panama. This acquisition is subject to local country regulatory approvals and is expected to close during the second quarter of 2007.
Grupo Financiero Uno
On March 5, 2007, Citigroup completed its acquisition of Grupo Financiero Uno (GFU), the largest credit card issuer in Central America, and its affiliates.
The transaction established Citigroup's retail branch presence in Texas, giving Citigroup 106 branches, $4.2acquisition of GFU, with $2.2 billion in assets, and approximately 120,000 new customersexpands the presence of Citigroup's Latin America consumer franchise, enhances its credit card business in the state at the timeregion and establishes a platform for regional growth in Consumer Finance and Retail Banking.
GFU has more than one million retail clients, representing 1.1 million credit card accounts, $1.3 billion in credit card receivables and $1.5 billion in deposits in Guatemala, El Salvador, Honduras, Nicaragua, Costa Rica and Panama. GFU operates a distribution network of the transaction's closing. The results75 branches and more than 100 mini-branches and points of FAB are includedsale.
EMEA Expansion
Purchase of 20% Equity Interest in the Consolidated Financial Statements from March 2005 forward.
Divestiture of CitiCapital's Transportation Finance BusinessAkbank
On January 31, 2005,9, 2007, Citigroup completed its purchase of a 20% equity interest in Akbank for approximately $3.1 billion. Akbank, the Company completedsecond-largest privately owned bank by assets in Turkey, is a premier, full-service retail, commercial, corporate and private bank.
Sabanci Holding, a 34% owner of Akbank shares, and its subsidiaries have granted Citigroup a right of first refusal or first offer over the sale of CitiCapital's Transportation Finance Businessany of their Akbank shares in the future. Subject to certain exceptions, including purchases from Sabanci Holding and its subsidiaries, Citigroup has otherwise agreed not to increase its percentage ownership in Akbank.
Resolution of Federal Tax Audit
In March 2006, the Company received a notice from the Internal Revenue Service (IRS) that they had concluded the tax audit for the years 1999 through 2002 (referred to hereinafter as the "resolution of the Federal Tax Audit"). For the first quarter of 2006, the Company released a total of $657 million from its tax contingency reserves related to the resolution of the Federal Tax Audit.
The following table summarizes the 2006 first quarter tax benefits, by business, from the resolution of the Federal Tax Audit:
| In millions of dollars | Total | ||
|---|---|---|---|
| Global Consumer | $ | 290 | |
| Markets & Banking | 176 | ||
| Global Wealth Management | 13 | ||
| Alternative Investments | 58 | ||
| Corporate/Other | 61 | ||
| Continuing Operations | $ | 598 | |
| Discontinued Operations | 59 | ||
| Total | $ | 657 | |
Adoption of the Accounting for Share-Based Payments
On January 1, 2006, the Company adopted Statement of Financial Accounting Standards (SFAS) No. 123 (revised 2004),"Share-Based Payment" (SFAS 123(R)), which replaced the existing SFAS 123 and superseded Accounting Principles Board (APB) Opinion No. 25. SFAS 123(R) requires companies to measure and record compensation expense for stock options and other share-based payments based in Dallason the instruments' fair value, reduced by expected forfeitures.
In adopting this standard, the Company conformed to recent accounting guidance that restricted or deferred stock awards issued to retirement-eligible employees who meet certain age and Torontoservice requirements must be either expensed on the grant date or accrued over a service period prior to GE Commercial Finance for total cash considerationthe grant date. This charge consisted of approximately $4.6 billion. The sale resulted in an$398 million after-tax gain of $111 million $(161($648 million pretax). for the immediate expensing of awards granted to retirement-eligible employees in January 2006.
The following table summarizes the SFAS 123(R) impact, by segment, on the 2006 first quarter pretax compensation expense for stock awards granted to retirement-eligible employees in January 2006 ("the 2006 initial adoption of SFAS 123(R)"):
| In millions of dollars | 2006 First Quarter | ||
|---|---|---|---|
| Global Consumer | $ | 121 | |
| Markets & Banking | 354 | ||
| Global Wealth Management | 145 | ||
| Alternative Investments | 7 | ||
| Corporate/Other | 21 | ||
| Total | $ | 648 | |
The Company recorded the quarterly accrual for the stock awards that were granted in January 2007 during each of the quarters in 2006. During the first quarter of 2007, the Company recorded the quarterly accrual for the estimated stock awards that will be granted in January 2008.
SEGMENT, PRODUCT AND REGIONAL NET INCOME
The following tables show the net income (loss) for Citigroup's businesses on a segment and product view and on a regional view:
Citigroup Net Income—Segment and Product View
| | | Three Months Ended September 30, | % | Nine Months Ended September 30, | % | | First Quarter | % Change | ||||||||||||||||||||||
|---|---|---|---|---|---|---|---|---|---|---|---|---|---|---|---|---|---|---|---|---|---|---|---|---|---|---|---|---|---|---|
In millions of dollars | In millions of dollars | |||||||||||||||||||||||||||||
| In millions of dollars | 2006 | 2005(1) | Change | 2006 | 2005(1) | Change | 2007 | 2006(1) | 1Q07 vs. 1Q06 | |||||||||||||||||||||
| Global Consumer | Global Consumer | Global Consumer | ||||||||||||||||||||||||||||
| U.S. Cards | $ | 1,085 | $ | 797 | 36 | % | $ | 2,889 | $ | 2,310 | 25 | % | U.S. Cards | $ | 897 | $ | 926 | (3 | )% | |||||||||||
| U.S. Retail Distribution | 481 | 319 | 51 | 1,564 | 1,361 | 15 | U.S. Retail Distribution | 388 | 515 | (25 | ) | |||||||||||||||||||
| U.S. Consumer Lending | 521 | 487 | 7 | 1,428 | 1,480 | (4 | ) | U.S. Consumer Lending | 359 | 437 | (18 | ) | ||||||||||||||||||
| U.S. Commercial Business | 151 | 222 | (32 | ) | 415 | 608 | (32 | ) | U.S. Commercial Business | 121 | 126 | (4 | ) | |||||||||||||||||
| Total U.S. Consumer(2) | $ | 2,238 | $ | 1,825 | 23 | % | $ | 6,296 | $ | 5,759 | 9 | % | Total U.S. Consumer(2) | $ | 1,765 | $ | 2,004 | (12 | )% | |||||||||||
International Cards | $ | 287 | $ | 383 | (25 | )% | $ | 906 | $ | 1,016 | (11 | )% | International Cards | $ | 388 | $ | 291 | 33 | % | |||||||||||
| International Consumer Finance | 50 | 152 | (67 | ) | 391 | 468 | (16 | ) | International Consumer Finance | 25 | 168 | (85 | ) | |||||||||||||||||
| International Retail Banking | 701 | 427 | 64 | 2,092 | 1,518 | 38 | International Retail Banking | 540 | 677 | (20 | ) | |||||||||||||||||||
| Total International Consumer | $ | 1,038 | $ | 962 | 8 | % | $ | 3,389 | $ | 3,002 | 13 | % | Total International Consumer | $ | 953 | $ | 1,136 | (16 | )% | |||||||||||
Other | $ | (81 | ) | $ | (64 | ) | (27 | )% | $ | (240 | ) | $ | (298 | ) | 19 | % | Other | $ | (85 | ) | $ | (67 | ) | (27 | )% | |||||
| Total Global Consumer | $ | 3,195 | $ | 2,723 | 17 | % | $ | 9,445 | $ | 8,463 | 12 | % | Total Global Consumer | $ | 2,633 | $ | 3,073 | (14 | )% | |||||||||||
Corporate and Investment Banking | ||||||||||||||||||||||||||||||
Markets & Banking | Markets & Banking | |||||||||||||||||||||||||||||
| Capital Markets and Banking | $ | 1,344 | $ | 1,424 | (6 | )% | $ | 4,374 | $ | 3,906 | 12 | % | Securities and Banking | $ | 2,173 | $ | 1,618 | 34 | % | |||||||||||
| Transaction Services | 385 | 327 | 18 | 1,048 | 860 | 22 | Transaction Services | 447 | 323 | 38 | ||||||||||||||||||||
| Other | (8 | ) | 46 | NM | (49 | ) | 82 | NM | Other | 1 | (12 | ) | NM | |||||||||||||||||
| Total Corporate and Investment Banking | $ | 1,721 | $ | 1,797 | (4 | )% | $ | 5,373 | $ | 4,848 | 11 | % | Total Markets & Banking | $ | 2,621 | $ | 1,929 | 36 | % | |||||||||||
Global Wealth Management | Global Wealth Management | Global Wealth Management | ||||||||||||||||||||||||||||
| Smith Barney | $ | 294 | $ | 227 | 30 | % | $ | 700 | $ | 663 | 6 | % | Smith Barney | $ | 324 | $ | 168 | 93 | % | |||||||||||
| Private Bank | 105 | 79 | 33 | 333 | 284 | 17 | Private Bank | 124 | �� | 119 | 4 | |||||||||||||||||||
| Total Global Wealth Management | $ | 399 | $ | 306 | 30 | % | $ | 1,033 | $ | 947 | 9 | % | Total Global Wealth Management | $ | 448 | $ | 287 | 56 | % | |||||||||||
Alternative Investments | Alternative Investments | $ | 117 | $ | 339 | (65 | )% | $ | 727 | $ | 1,086 | (33 | )% | Alternative Investments | $ | 222 | $ | 353 | (37 | )% | ||||||||||
Corporate/Other | Corporate/Other | (129 | ) | (177 | ) | 27 | (458 | ) | (510 | ) | 10 | Corporate/Other | (912 | ) | (87 | ) | NM | |||||||||||||
| Income from Continuing Operations | Income from Continuing Operations | $ | 5,303 | $ | 4,988 | 6 | % | $ | 16,120 | $ | 14,834 | 9 | % | Income from Continuing Operations | $ | 5,012 | $ | 5,555 | (10 | )% | ||||||||||
| Income from Discontinued Operations(3) | Income from Discontinued Operations(3) | 202 | 2,155 | (91 | ) | 289 | 2,823 | (90 | ) | Income from Discontinued Operations(3) | — | 84 | NM | |||||||||||||||||
| Total Net Income | Total Net Income | $ | 5,505 | $ | 7,143 | (23 | )% | $ | 16,409 | $ | 17,657 | (7 | )% | Total Net Income | $ | 5,012 | $ | 5,639 | (11 | )% | ||||||||||
Citigroup Net Income—Regional View
| | | Three Months Ended September 30, | % | Nine Months Ended September 30, | % | | First Quarter | % Change | ||||||||||||||||||||||
|---|---|---|---|---|---|---|---|---|---|---|---|---|---|---|---|---|---|---|---|---|---|---|---|---|---|---|---|---|---|---|
In millions of dollars | In millions of dollars | |||||||||||||||||||||||||||||
| In millions of dollars | 2006 | 2005(1) | Change | 2006 | 2005(1) | Change | 2007 | 2006(1) | 1Q07 vs. 1Q06 | |||||||||||||||||||||
| U.S.(2) | U.S.(2) | U.S.(2) | ||||||||||||||||||||||||||||
| Global Consumer | $ | 2,157 | $ | 1,761 | 22 | % | $ | 6,056 | $ | 5,461 | 11 | % | Global Consumer | $ | 1,680 | $ | 1,937 | (13 | )% | |||||||||||
| Corporate and Investment Banking | 540 | 637 | (15 | ) | 1,802 | 1,992 | (10 | ) | Markets & Banking | 999 | 515 | 94 | ||||||||||||||||||
| Global Wealth Management | 342 | 288 | 19 | 860 | 876 | (2 | ) | Global Wealth Management | 361 | 228 | 58 | |||||||||||||||||||
| TotalU.S. | $ | 3,039 | $ | 2,686 | 13 | % | $ | 8,718 | $ | 8,329 | 5 | % | TotalU.S. | $ | 3,040 | $ | 2,680 | 13 | % | |||||||||||
Mexico | Mexico | Mexico | ||||||||||||||||||||||||||||
| Global Consumer | $ | 395 | $ | 511 | (23 | )% | $ | 1,128 | $ | 1,156 | (2 | )% | Global Consumer | $ | 372 | $ | 358 | 4 | % | |||||||||||
| Corporate and Investment Banking | 95 | 177 | (46 | ) | 261 | 336 | (22 | ) | Markets & Banking | 114 | 78 | 46 | ||||||||||||||||||
| Global Wealth Management | 9 | 12 | (25 | ) | 27 | 35 | (23 | ) | Global Wealth Management | 12 | 8 | 50 | ||||||||||||||||||
| TotalMexico | $ | 499 | $ | 700 | (29 | )% | $ | 1,416 | $ | 1,527 | (7 | )% | TotalMexico | $ | 498 | $ | 444 | 12 | % | |||||||||||
Latin America | Latin America | Latin America | ||||||||||||||||||||||||||||
| Global Consumer | $ | 23 | $ | 61 | (62 | )% | $ | 169 | $ | 195 | (13 | )% | Global Consumer | $ | 70 | $ | 58 | 21 | % | |||||||||||
| Corporate and Investment Banking | 168 | 185 | (9 | ) | 508 | 525 | (3 | ) | Markets & Banking | 218 | 202 | 8 | ||||||||||||||||||
| Global Wealth Management | 3 | 1 | NM | 8 | 16 | (50 | ) | Global Wealth Management | 3 | 3 | — | |||||||||||||||||||
| TotalLatin America | $ | 194 | $ | 247 | (21 | )% | $ | 685 | $ | 736 | (7 | )% | TotalLatin America | $ | 291 | $ | 263 | 11 | % | |||||||||||
EMEA | EMEA | EMEA | ||||||||||||||||||||||||||||
| Global Consumer | $ | 213 | $ | (154 | ) | NM | $ | 613 | $ | 92 | NM | Global Consumer | $ | 83 | $ | 185 | (55 | )% | ||||||||||||
| Corporate and Investment Banking | 489 | 358 | 37 | % | 1,466 | 882 | 66 | % | Markets & Banking | 694 | 635 | 9 | ||||||||||||||||||
| Global Wealth Management | 7 | 8 | (13 | ) | 15 | 10 | 50 | Global Wealth Management | 7 | 3 | NM | |||||||||||||||||||
| TotalEMEA | $ | 709 | $ | 212 | NM | $ | 2,094 | $ | 984 | NM | TotalEMEA | $ | 784 | $ | 823 | (5 | )% | |||||||||||||
Japan | Japan | Japan | ||||||||||||||||||||||||||||
| Global Consumer | $ | 79 | $ | 169 | (53 | )% | $ | 445 | $ | 532 | (16 | )% | Global Consumer | $ | 45 | $ | 188 | (76 | )% | |||||||||||
| Corporate and Investment Banking | 38 | 58 | (34 | ) | 195 | 160 | 22 | Markets & Banking | 35 | 85 | (59 | ) | ||||||||||||||||||
| Global Wealth Management | — | (29 | ) | 100 | — | (82 | ) | 100 | Global Wealth Management | — | — | — | ||||||||||||||||||
| TotalJapan | $ | 117 | $ | 198 | (41 | )% | $ | 640 | $ | 610 | 5 | % | TotalJapan | $ | 80 | $ | 273 | (71 | )% | |||||||||||
Asia | Asia | Asia | ||||||||||||||||||||||||||||
| Global Consumer | $ | 328 | $ | 375 | (13 | )% | $ | 1,034 | $ | 1,027 | 1 | % | Global Consumer | $ | 383 | $ | 347 | 10 | % | |||||||||||
| Corporate and Investment Banking | 391 | 382 | 2 | 1,141 | 953 | 20 | Markets & Banking | 561 | 414 | 36 | ||||||||||||||||||||
| Global Wealth Management | 38 | 26 | 46 | 123 | 92 | 34 | Global Wealth Management | 65 | 45 | 44 | ||||||||||||||||||||
| TotalAsia | $ | 757 | $ | 783 | (3 | )% | $ | 2,298 | $ | 2,072 | 11 | % | TotalAsia | $ | 1,009 | $ | 806 | 25 | % | |||||||||||
Alternative Investments | Alternative Investments | $ | 117 | $ | 339 | (65 | )% | $ | 727 | $ | 1,086 | (33 | )% | Alternative Investments | $ | 222 | $ | 353 | (37 | )% | ||||||||||
Corporate/Other | Corporate/Other | (129 | ) | (177 | ) | 27 | (458 | ) | (510 | ) | 10 | Corporate/Other | (912 | ) | (87 | ) | NM | |||||||||||||
Income from Continuing Operations | Income from Continuing Operations | $ | 5,303 | $ | 4,988 | 6 | % | $ | 16,120 | $ | 14,834 | 9 | % | Income from Continuing Operations | $ | 5,012 | $ | 5,555 | (10 | )% | ||||||||||
Income from Discontinued Operations(3) | Income from Discontinued Operations(3) | 202 | 2,155 | (91 | ) | 289 | 2,823 | (90 | ) | Income from Discontinued Operations(3) | — | 84 | NM | |||||||||||||||||
Total Net Income | Total Net Income | $ | 5,505 | $ | 7,143 | (23 | )% | $ | 16,409 | $ | 17,657 | (7 | )% | Total Net Income | $ | 5,012 | $ | 5,639 | (11 | )% | ||||||||||
Total International | Total International | $ | 2,276 | $ | 2,140 | 6 | % | $ | 7,133 | $ | 5,929 | 20 | % | Total International | $ | 2,662 | $ | 2,609 | 2 | % | ||||||||||
SELECTED REVENUE AND EXPENSE ITEMS(THIS PAGE INTENTIONALLY LEFT BLANK)
Selected Revenue Items
Net interest revenue of $9.8 billion for the 2006 third quarter increased $133 million, or 1%, from the 2005 third quarter, as higher customer deposit and loan balances were offset by spread compression.
Total commissions and fees and administration and other fiduciary fees for the third quarter of 2006 of $5.7 million decreased by $670 billion, or 11%, compared to the 2005 third quarter. This was attributable to the mark-to-market of the Consumer Lending's mortgage servicing assets, offset by increased bank card fees in U.S. Cards and International Cards and increased investment banking fees, volumes, and assets under custody in CIB.
Principal transactions revenue of $1.9 billion decreased $23 million, or 1%, from the third quarter of 2005. Realized gains from sales of investments were up $20 million, or 7%, to $304 million in the 2006 third quarter. During the 2006 third quarter, Consumer Lending sold $11 billion of mortgage-backed securities resulting in a $133 million realized gain. This was offset by the absence of a $134 million realized gain in Alternative Investments on the sale of the St. Paul Travelers shares in the third quarter of 2005.
Other revenue of $2.9 billion increased $388 million, or 16%, from the 2005 third quarter. The increase was primarily driven by higher net replenishment gains on previously securitized receivables in U.S. Cards and gains on derivative contracts on Consumer Lending's mortgage servicing assets, offset by the absence of the Copelco Litigation Settlement of $185 million in the 2005 third quarter and a decrease in Alternative Investments driven by lower investment performance.
Operating Expenses
Total operating expenses were $11.9 billion for the 2006 third quarter, up $523 million, or 5%, from the comparable 2005 period. The increase was primarily due to investment spending, SFAS 123(R) accruals, and acquisitions.
Global Consumer reported a 12% increase in total expenses from the 2005 third quarter.U.S. Consumer increased $136 million, or 4%, on increased business volumes and investments in new branches.International Consumer expenses increased $489 million, or 21%, versus the third quarter of 2005, primarily due to investment in branch expansion, the integration of Credicard, and the absence of a value added tax refund inMexico in the prior-year period.
CIB expenses decreased 6% from the 2005 third quarter, primarily due to a decline in incentive compensation accruals.
Global Wealth Management expenses increased 13% compared to the prior-year quarter, primarily related to costs associated with the integration of the financial consultants from Legg Mason and SFAS 123(R) costs. Alternative Investments expenses declined 18% from the 2005 third quarter.
Provisions for Credit Losses and for Benefits and Claims
The provision for credit losses declined $782 million, or 30%, from the 2005 third quarter to $1.8 billion. Policyholder benefits and claims in the 2006 third quarter increased $59 million, or 27%, from the 2005 third quarter.
Global Consumer provisions for loan losses and for benefits and claims of $2.0 billion in the 2006 third quarter were down $776 million, or 28%, from the 2005 third quarter. The declines were mainly due to lower bankruptcy filings, a continued favorable credit environment that drove lower net credit loss ratios and the absence of a $490 million charge to standardize the EMEA consumer loan write-off policies with the global write-off policy in the prior-year period. Total net credit losses were $1.815 billion, and the related loss ratio was 1.49%, in the 2006 third quarter, as compared to $2.926 billion and 2.68% in the 2005 third quarter. The consumer loan delinquency ratio (90 days or more past due) declined to 1.29% at September 30, 2006 from 1.45% at September 30, 2005. See page 57 for a reconciliation of total consumer credit information.
The CIB provision for credit losses in the 2006 third quarter was up $64 million from the 2005 third quarter. CIB's reserve for credit losses was increased by $50 million for unfunded lending commitments in the 2006 third quarter due to higher exposures.
Corporate cash-basis loans at September 30, 2006 and 2005 were $692 million and $1.2 billion, respectively, while the corporate Other Real Estate Owned (OREO) portfolio totaled $193 million and $153 million, respectively. The decline in corporate cash-basis loans from September 30, 2005, was related to improvements in the overall credit environment.
Income Taxes
The Company's effective income tax rate on continuing operations was 27.4% in the 2006 third quarter, compared to 29.9% in the 2005 third quarter. The 2006 third quarter included a $237 million tax benefit related to the resolution of the New York Tax Audits. The 2005 third quarter included a Homeland Investment Act tax benefit of $185 million, net of the impact of remitting income earned in 2005 and prior years that would otherwise have been indefinitely invested overseas.
Regulatory Capital
Total capital (Tier 1 and Tier 2) was $117.8 billion and $106.4 billion, or 11.88% and 12.02% of net risk-adjusted assets at September 30, 2006 and December 31, 2005, respectively. Tier 1 capital was $85.7 billion, or 8.64% of net risk-adjusted assets, at September 30, 2006, compared to $77.8 billion, or 8.79%, at December 31, 2005.
ACCOUNTING CHANGES AND FUTURE APPLICATION OF ACCOUNTING STANDARDS
See Note 1 to the Consolidated Financial Statements on page 91 for a discussion of Accounting Changes and the Future Application of Accounting Standards.
SIGNIFICANT ACCOUNTING POLICIES
The Company's accounting policies are fundamental to understanding management's discussion and analysis of results of operations and financial condition. The Company has identified five policies as being significant because they require management to make subjective and/or complex judgments about matters that are inherently uncertain. These policies relate to Valuations of Financial Instruments, Allowance for Credit Losses, Securitizations, Income Taxes and Legal Reserves. The Company, in consultation with the Audit and Risk Management Committee of the Board of Directors, has reviewed and approved these significant accounting policies, which are further described in the Company's 2005 Annual Report on Form 10-K.
The net income line in the following business segment and operating unit discussions excludes discontinued operations. Income from discontinued operations is included within the Corporate/Other business segment. See Notes 3 and 4 to the Consolidated Financial Statements on pages 94 and 97, respectively.
Certain prior period amounts have been reclassified to conform to the current period's presentation.
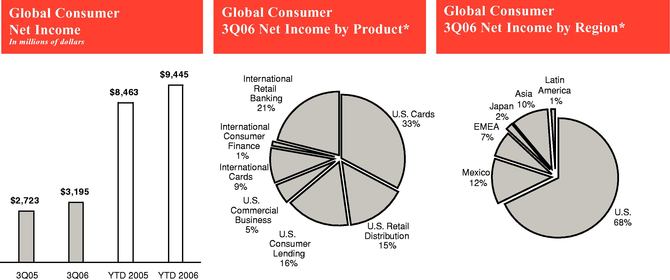 | ||||
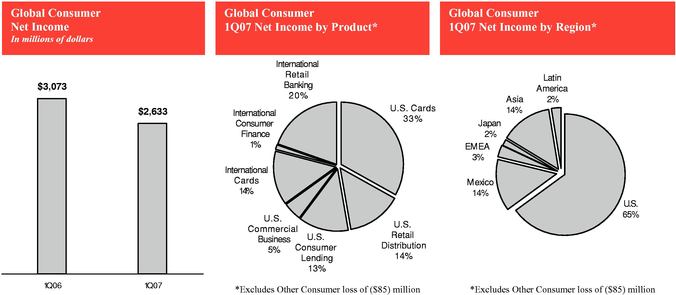
Citigroup's Global Consumer Group provides a wide array of banking, lending, insurance and investment services through a network of 7,9338,140 branches, approximately 18,00019,100 ATMs, approximately 800708 Automated LendingLoan Machines (ALMs), the Internet, telephone and mail, and the Primerica Financial Services salesforce. Global Consumer serves more than 250200 million customer accounts, providing products and services to meet the financial needs of both individuals and small businesses.
| | Three Months Ended September 30, | % Change | Nine Months Ended September 30, | % Change | First Quarter | % Change | ||||||||||||||||||||
|---|---|---|---|---|---|---|---|---|---|---|---|---|---|---|---|---|---|---|---|---|---|---|---|---|---|---|
| In millions of dollars | 2006 | 2005 | 3Q06 vs. 3Q05 | 2006 | 2005 | YTD06 vs. YTD05 | 2007 | 2006 | 1Q07 vs. 1Q06 | |||||||||||||||||
| Net interest revenue | $ | 7,523 | $ | 7,369 | 2 | % | $ | 22,228 | $ | 22,212 | — | $ | 7,644 | $ | 7,224 | 6 | % | |||||||||
| Non-interest revenue | 5,311 | 4,952 | 7 | 15,189 | 14,234 | 7 | % | 5,462 | 4,731 | 15 | ||||||||||||||||
| Revenues, net of interest expense | $ | 12,834 | $ | 12,321 | 4 | % | $ | 37,417 | $ | 36,446 | 3 | % | $ | 13,106 | $ | 11,955 | 10 | % | ||||||||
| Operating expenses | 6,316 | 5,657 | 12 | 19,052 | 17,256 | 10 | 6,760 | 6,357 | 6 | |||||||||||||||||
| Provisions for loan losses and for benefits and claims | 1,994 | 2,770 | (28 | ) | 5,311 | 6,919 | (23 | ) | 2,686 | 1,668 | 61 | |||||||||||||||
| Income before taxes and minority interest | $ | 4,524 | $ | 3,894 | 16 | % | $ | 13,054 | $ | 12,271 | 6 | % | $ | 3,660 | $ | 3,930 | (7 | )% | ||||||||
| Income taxes | 1,312 | 1,153 | 14 | 3,559 | 3,762 | (5 | ) | 1,017 | 847 | 20 | ||||||||||||||||
| Minority interest, net of taxes | 17 | 18 | (6 | ) | 50 | 46 | 9 | 10 | 10 | — | ||||||||||||||||
| Net income | $ | 3,195 | $ | 2,723 | 17 | % | $ | 9,445 | $ | 8,463 | 12 | % | $ | 2,633 | $ | 3,073 | (14 | )% | ||||||||
| Average assets(in billions of dollars) | $ | 620 | $ | 534 | 16 | % | $ | 586 | $ | 529 | 11 | % | $ | 709 | $ | 561 | 26 | % | ||||||||
| Return on assets | 2.04 | % | 2.02 | % | 2.15 | % | 2.14 | % | 1.51 | % | 2.22 | % | ||||||||||||||
| Average risk capital(1) | $ | 27,938 | $ | 27,343 | 2 | % | $ | 27,724 | $ | 27,012 | 3 | % | $ | 31,653 | $ | 27,714 | 14 | % | ||||||||
| Return on risk capital(1) | 45 | % | 40 | % | 46 | % | 42 | % | 34 | % | 45 | % | ||||||||||||||
| Return on invested capital(1) | 21 | % | 18 | % | 21 | % | 19 | % | 17 | % | 21 | % | ||||||||||||||
| Key Indicators—(in billions of dollars) | ||||||||||||||||||||||||||
| Average managed loans | $ | 566.0 | $ | 509.0 | 11 | % | ||||||||||||||||||||
| Average deposits | $ | 273.4 | $ | 243.6 | 12 | % | ||||||||||||||||||||
| EOP AUMs | $ | 222.2 | $ | 199.2 | 12 | % | ||||||||||||||||||||
| Total branches | 8,140 | 7,440 | 9 | % | ||||||||||||||||||||||
U.S. CONSUMER
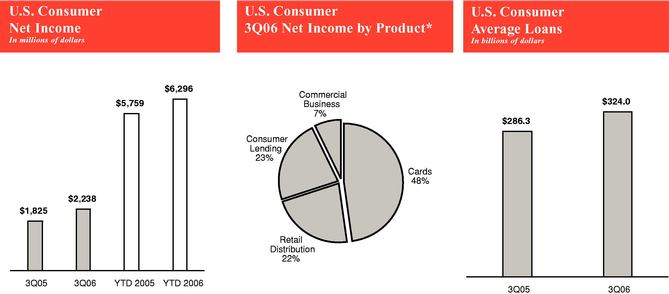 |
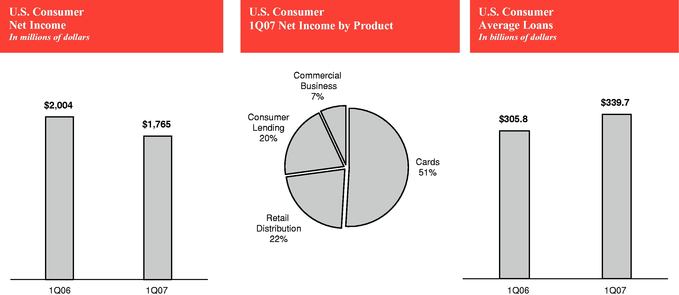
U.S. Consumer is comprisedcomposed of four businesses:Cards, Retail Distribution, Consumer Lending andCommercial Business.
| | Three Months Ended September 30, | % Change | Nine Months Ended September 30, | % Change | First Quarter | % Change | ||||||||||||||||||||
|---|---|---|---|---|---|---|---|---|---|---|---|---|---|---|---|---|---|---|---|---|---|---|---|---|---|---|
In millions of dollars | ||||||||||||||||||||||||||
| 2006 | 2005 | 3Q06 vs. 3Q05 | 2006 | 2005 | YTD06 vs. YTD05 | 2007 | 2006 | 1Q07 vs. 1Q06 | ||||||||||||||||||
| Net interest revenue | $ | 4,141 | $ | 4,422 | (6 | )% | $ | 12,468 | $ | 13,209 | (6 | )% | $ | 4,185 | $ | 4,138 | 1 | % | ||||||||
| Non-interest revenue | 3,663 | 3,279 | 12 | 10,169 | 9,945 | 2 | 3,529 | 3,122 | 13 | |||||||||||||||||
| Revenues, net of interest expense | $ | 7,804 | $ | 7,701 | 1 | % | $ | 22,637 | $ | 23,154 | (2 | )% | $ | 7,714 | $ | 7,260 | 6 | % | ||||||||
| Operating expenses | 3,426 | 3,290 | 4 | 10,546 | 9,985 | 6 | 3,629 | 3,569 | 2 | |||||||||||||||||
| Provisions for loan losses and for benefits and claims | 962 | 1,573 | (39 | ) | 2,690 | 4,319 | (38 | ) | 1,470 | 901 | 63 | |||||||||||||||
| Income before taxes and minority interest | $ | 3,416 | $ | 2,838 | 20 | % | $ | 9,401 | $ | 8,850 | 6 | % | $ | 2,615 | $ | 2,790 | (6 | )% | ||||||||
| Income taxes | 1,162 | 996 | 17 | 3,060 | 3,045 | — | 842 | 777 | 8 | |||||||||||||||||
| Minority interest, net of taxes | 16 | 17 | (6 | ) | 45 | 46 | (2 | ) | 8 | 9 | (11 | ) | ||||||||||||||
| Net income | $ | 2,238 | $ | 1,825 | 23 | % | $ | 6,296 | $ | 5,759 | 9 | % | $ | 1,765 | $ | 2,004 | (12 | )% | ||||||||
| Average assets(in billions of dollars) | $ | 422 | $ | 359 | 18 | % | $ | 398 | $ | 353 | 13 | % | $ | 499 | $ | 379 | 32 | % | ||||||||
| Return on assets | 2.10 | % | 2.02 | % | 2.12 | % | 2.18 | % | 1.43 | % | 2.14 | % | ||||||||||||||
| Average risk capital(1) | $ | 15,312 | $ | 13,767 | 11 | $ | 15,059 | $ | 13,869 | 9 | % | $ | 17,806 | $ | 15,069 | 18 | % | |||||||||
| Return on risk capital(1) | 58 | % | 53 | % | 56 | % | 56 | % | 40 | % | 54 | % | ||||||||||||||
| Return on invested capital(1) | 26 | % | 22 | % | 25 | % | 23 | % | 20 | % | 24 | % | ||||||||||||||
| Key Indicators—(in billions of dollars) | ||||||||||||||||||||||||||
| Average managed loans | $ | 440.0 | $ | 400.8 | 10 | % | ||||||||||||||||||||
| Average deposits | $ | 119.2 | $ | 99.1 | 20 | % | ||||||||||||||||||||
| EOP AUMs | $ | 83.3 | $ | 75.0 | 11 | % | ||||||||||||||||||||
| Total branches | 3,488 | 3,205 | 9 | % | ||||||||||||||||||||||
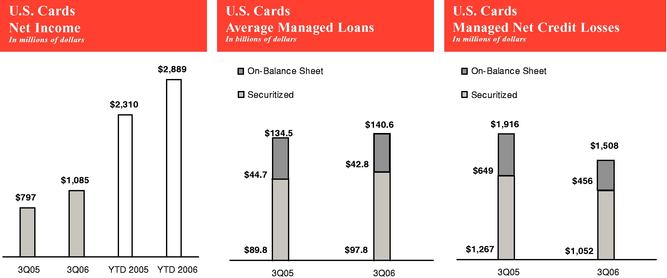 |
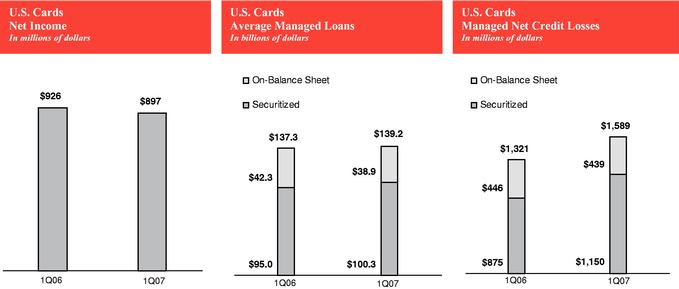
U.S. Cards is one of the largest providers of credit cards in North America, with more than 150 million customer accounts in the United States, Canada and Puerto Rico. In addition to MasterCard (including Diners), Visa, and American Express,U.S. Cards is the largest provider of credit card services to the oil and gas industry and the leading provider of consumer private-label credit cards and commercial accounts on behalf of merchants such as The Home Depot, Federated, Sears, Dell Computer, Radio Shack, Staples and Zales Corporation.
Revenues are primarily generated from net interest revenue on receivables, interchange fees on purchase sales, securitization activities and other delinquency and servicing fees.
| | Three Months Ended September 30, | % Change | Nine Months Ended September 30, | % Change | First Quarter | % Change | ||||||||||||||||||||
|---|---|---|---|---|---|---|---|---|---|---|---|---|---|---|---|---|---|---|---|---|---|---|---|---|---|---|
In millions of dollars | ||||||||||||||||||||||||||
| 2006 | 2005 | 3Q06 vs. 3Q05 | 2006 | 2005 | YTD06 vs. YTD05 | 2007 | 2006 | 1Q07 vs. 1Q06 | ||||||||||||||||||
| Net interest revenue | $ | 1,140 | $ | 1,353 | (16 | )% | $ | 3,500 | $ | 4,004 | (13 | )% | $ | 1,031 | $ | 1,193 | (14 | )% | ||||||||
| Non-interest revenue | 2,312 | 2,028 | 14 | 6,437 | 6,095 | 6 | 2,263 | 2,041 | 11 | |||||||||||||||||
| Revenues, net of interest expense | $ | 3,452 | $ | 3,381 | 2 | % | $ | 9,937 | $ | 10,099 | (2 | )% | $ | 3,294 | $ | 3,234 | 2 | % | ||||||||
| Operating expenses | 1,447 | 1,458 | (1 | ) | 4,533 | 4,461 | 2 | 1,485 | 1,532 | (3 | ) | |||||||||||||||
| Provision for loan losses and for benefits and claims | 360 | 679 | (47 | ) | 1,067 | 2,075 | (49 | ) | 416 | 395 | 5 | |||||||||||||||
| Income before taxes | $ | 1,645 | $ | 1,244 | 32 | % | $ | 4,337 | $ | 3,563 | 22 | % | ||||||||||||||
| Income taxes | 560 | 447 | 25 | 1,448 | 1,253 | 16 | % | |||||||||||||||||||
| Income before taxes and minority interest | $ | 1,393 | $ | 1,307 | 7 | % | ||||||||||||||||||||
| Income taxes and minority interest, net of taxes | 496 | 381 | 30 | |||||||||||||||||||||||
| Net income | $ | 1,085 | $ | 797 | 36 | % | $ | 2,889 | $ | 2,310 | 25 | % | $ | 897 | $ | 926 | (3 | )% | ||||||||
| Average assets(in billions of dollars) | $ | 64 | $ | 63 | 2 | % | $ | 63 | $ | 66 | (5 | )% | $ | 63 | $ | 63 | — | |||||||||
| Return on assets | 6.73 | % | 5.02 | % | 6.13 | % | 4.68 | % | 5.77 | % | 5.96 | % | ||||||||||||||
| Average risk capital(1) | $ | 5,628 | $ | 5,848 | (4 | )% | $ | 5,594 | $ | 5,780 | (3 | )% | $ | 5,452 | $ | 5,563 | (2 | )% | ||||||||
| Return on risk capital(1) | 76 | % | 54 | % | 69 | % | 53 | % | 67 | % | 68 | % | ||||||||||||||
| Return on invested capital(1) | 32 | % | 22 | % | 29 | % | 22 | % | 28 | % | 28 | % | ||||||||||||||
| Key indicators—on a managed basis: (in billions of dollars) | ||||||||||||||||||||||||||
| Return on managed assets | 2.91 | % | 2.20 | % | 2.37 | % | 2.59 | % | ||||||||||||||||||
| Purchase sales | $ | 77.0 | $ | 70.9 | 9 | % | $ | 72.4 | $ | 68.4 | 6 | % | ||||||||||||||
| Managed average yield(2) | 14.00 | % | 13.98 | % | 14.22 | % | 14.16 | % | ||||||||||||||||||
| Managed net interest margin(2) | 10.28 | % | 11.03 | % | 10.11 | % | 10.48 | % | ||||||||||||||||||
U.S. Cards (Continued)
3Q061Q07 vs. 3Q051Q06
Net Interest Revenue decreased 14% reflecting a combinationthe securitization of increased payment rates, higher cost of funds,margin receivables and the mix of receivable balances.net interest margin compression, which was partially offset by higher risk-based fees.Non-Interest Revenue increased as11% primarily reflecting a $161 million pre-tax gain on the positive impactsale of 9%MasterCard shares, 6% growth in purchase sales, increased revenues from previouslyand a higher level of securitized receivables, which includes excess servicing, and the addition of the Federated portfolio in the 2005 fourth quarter more than offset higher rewards program costs and lower asset sales of $37 million. Included in revenues in the 2005 third quarter were the negative impact of Hurricane Katrina and the effect of the new bankruptcy legislation.receivables.
Operating expenses improved,decreased slightly, primarily due to a decline in advertising and marketing expenses, largely reflecting the timing of advertising and marketing campaigns partially offset byand the additionabsence of the Federated portfolio.charge related to the 2006 initial adoption of SFAS 123(R).
Provision for loan losses and for benefits and claims declined, increased, primarily reflecting a decline in net credit losses and alower loan loss reserve release, of $122 million, due to lower bankruptcies and the favorable credit environment.
Net income also reflected a $39 million tax benefit in the 2006 third quarter resulting from the resolution of the New York Tax Audits.
2006 YTD vs. 2005 YTD
Net Interest Revenue decreased, reflecting a combination of increased payment rates, higher cost of funds, and the mix of receivable balances.Non-Interest Revenue increased as the positive impact of growth in purchase sales, increased revenues from previously securitized receivables, and the addition of the Federated portfolio more than offset higher rewards program costs. Included in revenues in the 2006 period were asset sales of $105 million, including the 2006 second quarter gain from the MasterCard initial public offering of $59 million. In the 2005 period, revenues included gains from asset sales of $185 million.
Operating expenses increased, primarily reflecting the addition of the Federated portfolio and the adoption of SFAS 123(R) in the 2006 first quarter; this was partially offset by a declinelower net credit losses. The net credit loss ratio increased 31 basis points to 4.58% primarily reflecting an increase in advertising and marketing expenses, largely reflectingbankruptcy filings over unusually low filing levels experienced in the timingfirst quarter of advertising campaigns.2006.
Provision for loan losses and for benefits and claims declined, primarily reflecting a decline in net credit losses and a loan loss reserve release of $354 million, due to lower bankruptcies and the favorable credit environment.
Net Income also reflected the absence of an $89 million tax benefit resulting from the resolution of the Federal Tax Audit infrom the 2006 first quarter along with a $39 million tax benefit resulting from the resolution of the New York Tax Audits in the 2006 third quarter.2006.
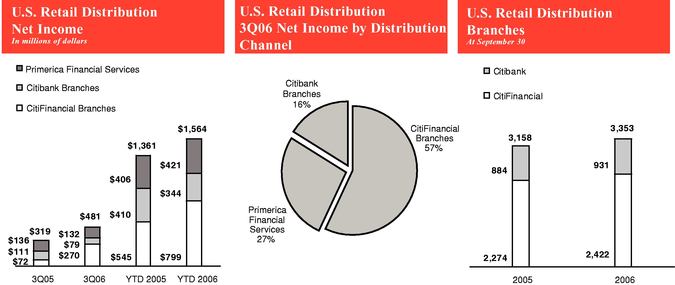  | ||||
| | Three Months Ended September 30, | % Change | Nine Months Ended September 30, | % Change | ||||||||||||||
|---|---|---|---|---|---|---|---|---|---|---|---|---|---|---|---|---|---|---|
| In millions of dollars | 2006 | 2005 | 3Q06 vs. 3Q05 | 2006 | 2005 | YTD06 vs. YTD05 | ||||||||||||
| Net interest revenue | $ | 1,521 | $ | 1,488 | 2 | % | $ | 4,469 | $ | 4,473 | — | |||||||
| Non-interest revenue | 861 | 851 | 1 | 2,708 | 2,683 | 1 | % | |||||||||||
| Revenues, net of interest expense | $ | 2,382 | $ | 2,339 | 2 | % | $ | 7,177 | $ | 7,156 | — | |||||||
| Operating expenses | 1,201 | 1,099 | 9 | 3,622 | 3,291 | 10 | % | |||||||||||
| Provisions for loan losses and for benefits and claims | 446 | 759 | (41 | ) | 1,258 | 1,773 | (29 | ) | ||||||||||
| Income before taxes | $ | 735 | $ | 481 | 53 | % | $ | 2,297 | $ | 2,092 | 10 | % | ||||||
| Income taxes | 254 | 162 | 57 | 733 | 731 | — | ||||||||||||
| Net income | $ | 481 | $ | 319 | 51 | % | $ | 1,564 | $ | 1,361 | 15 | % | ||||||
| Revenues, net of interest expense, by business: | ||||||||||||||||||
| Citibank branches | $ | 765 | $ | 754 | 1 | % | $ | 2,406 | $ | 2,373 | 1 | % | ||||||
| CitiFinancial branches | 1,052 | 1,035 | 2 | 3,097 | 3,142 | (1 | ) | |||||||||||
| Primerica Financial Services | 565 | 550 | 3 | 1,674 | 1,641 | 2 | ||||||||||||
| Total revenues | $ | 2,382 | $ | 2,339 | 2 | % | $ | 7,177 | $ | 7,156 | — | |||||||
| Net income by business: | ||||||||||||||||||
| Citibank branches | $ | 79 | $ | 111 | (29 | )% | $ | 344 | $ | 410 | (16 | )% | ||||||
| CitiFinancial branches | 270 | 72 | NM | 799 | 545 | 47 | ||||||||||||
| Primerica Financial Services | 132 | 136 | (3 | ) | 421 | 406 | 4 | |||||||||||
| Total net income | $ | 481 | $ | 319 | 51 | % | $ | 1,564 | $ | 1,361 | 15 | % | ||||||
| Average assets(in billions of dollars) | $ | 70 | $ | 65 | 8 | % | $ | 68 | $ | 64 | 6 | % | ||||||
| Return on assets | 2.73 | % | 1.95 | % | 3.08 | % | 2.84 | % | ||||||||||
| Average risk capital(1) | $ | 3,591 | $ | 3,003 | 20 | % | $ | 3,523 | $ | 2,975 | 18 | % | ||||||
| Return on risk capital(1) | 53 | % | 42 | % | 59 | % | 61 | % | ||||||||||
| Return on invested capital(1) | 21 | % | 13 | % | 23 | % | 17 | % | ||||||||||
| Key indicators: (in billions of dollars) | ||||||||||||||||||
| Average loans | $ | 45.2 | $ | 40.7 | 11 | % | ||||||||||||
| Average deposits | 134.7 | 119.6 | 13 | |||||||||||||||
| EOP Investment Assets under Management (AUMs) | 76.1 | 70.9 | 7 | |||||||||||||||
U.S. Retail Distribution (Continued)
U.S. Retail Distribution provides banking, lending, investment and insurance products and services to customers through 931993 Citibank branches, 2,4222,495 CitiFinancial branches, the Primerica Financial Services (PFS) salesforce,sales force, the Internet, direct mail and telesales. Revenues are primarily derived from net interest revenue on loans and deposits, and from fees on banking, insurance and investment products.
| | First Quarter | % Change | ||||||||
|---|---|---|---|---|---|---|---|---|---|---|
| In millions of dollars | 2007 | 2006 | 1Q07 vs. 1Q06 | |||||||
| Net interest revenue | $ | 1,529 | $ | 1,451 | 5 | % | ||||
| Non-interest revenue | 897 | 845 | 6 | |||||||
| Revenues, net of interest expense | $ | 2,426 | $ | 2,296 | 6 | % | ||||
| Operating expenses | 1,323 | 1,221 | 8 | |||||||
| Provisions for loan losses and for benefits and claims | 522 | 387 | 35 | |||||||
| Income before taxes | $ | 581 | $ | 688 | (16 | )% | ||||
| Income taxes | 193 | 173 | 12 | |||||||
| Net income | $ | 388 | $ | 515 | (25 | )% | ||||
| Revenues, net of interest expense, by business: | ||||||||||
| Citibank branches | $ | 781 | $ | 737 | 6 | % | ||||
| CitiFinancial branches | 1,064 | 1,008 | 6 | |||||||
| Primerica Financial Services | 581 | 551 | 5 | |||||||
| Total revenues | $ | 2,426 | $ | 2,296 | 6 | % | ||||
| Net income by business: | ||||||||||
| Citibank branches | $ | 42 | $ | 100 | (58 | )% | ||||
| CitiFinancial branches | 215 | 265 | (19 | ) | ||||||
| Primerica Financial Services | 131 | 150 | (13 | ) | ||||||
| Total net income | $ | 388 | $ | 515 | (25 | )% | ||||
| Average assets (in billions of dollars) | $ | 74 | $ | 66 | 12 | % | ||||
| Return on assets | 2.13 | % | 3.16 | % | ||||||
| Average risk capital(1) | $ | 3,414 | $ | 3,459 | (1 | )% | ||||
| Return on risk capital(1) | 46 | % | 60 | % | ||||||
| Return on invested capital(1) | 18 | % | 23 | % | ||||||
| Key indicators: (in billions of dollars) | ||||||||||
| Average loans | $ | 47.6 | $ | 42.5 | 12 | % | ||||
| Average deposits | $ | 98.2 | $ | 80.3 | 22 | % | ||||
| EOP Investment AUMs | $ | 83.3 | $ | 75.0 | 11 | % | ||||
3Q061Q07 vs. 3Q051Q06
Net Interest Revenue increased 2%primarily due to deposit and loan growth of 22% and 12%, as growth in deposits of 13% and growth in loans of 11% were largelyrespectively, which was partially offset by a decrease in net interest margin compression. This was mainly due to a shift in customer liabilities from savings and other demand deposits to certificates of deposit and e-Savings accounts.higher cost deposits.Non-Interest Revenue increased slightly for the quarter due to increasedas a result of higher investment product sales in Citibank branches and strong securities sales in Primerica Financial Services.higher insurance and banking fees.
Operating expense growth was primarily due todriven by higher volume-related expenses, increased investment spending driven by 101related to the 51 new branch openings induring the quarter (and 195 additional net branches since the 2005 third quarter)(21 in Citibank and 30 in CitiFinancial), and advertising costs associated with Citibank Direct. The increase in 2007 was affected favorably by the launchabsence of e-Savings.the charge related to the 2006 initial adoption of SFAS 123(R).
Provisions for loan losses and for benefits and claims declined 41%increased primarily due to higher customer volumes and the absence of a $165 million pretax loan loss reserve buildrelease in the prior year related to the reorganizationfirst quarter of the former Consumer Finance business, a prior-year reserve build related to Hurricane Katrina of $110 million pretax in CitiFinancial branches, and lower overall bankruptcy filings in the current period.2006. The net credit loss ratio declined 58increased 19 basis points to 2.48%2.85%, primarily reflecting the continuing favorable credit environment.
Deposit growth reflected balance increasesan increase in certificates of deposit; e-Savings accounts, which generated $6.2 billion in average deposits; and premium checking and rate-sensitive money market products, as well as the impact of the transfer of approximately $1.8 billion in deposits for certain customer segments, from the U.S. Commercial Business Group, to better serve those customers. Excluding the transfer of $1.8 billion from the U.S. Commercial Business Group, deposits grew 11% from the prior-year quarter.Loan growth reflected improvements in all channels and products.Investment product sales in Citibank branches increased 16%, driven by increased volumes.
2006 YTD vs. 2005 YTD
Net Interest Revenue was flat to the prior-year period as growth in deposits and loans, up 9% and 10%, respectively, were more than offset by net interest margin compression. This was primarily due to a shift in customer liabilities from savings and other demand deposits to certificates of deposit and e-Savings accounts.Non Interest Revenue increased slightly due to the $132 million pretax gain on the Sale of New York Branches, partially offset by the absence of a $110 million gain related to the resolution of the Glendale litigationbankruptcy filings over unusually low filing levels experienced in the 2005 first quarter and other revenue declines.
Operating expense growth was primarily due to higher volume-related expenses, increased investment spending primarily driven by new branch openings, the impact of SFAS 123(R), and advertising costs associated with the launch of e-Savings. The impact of the FAB acquisition also contributed to higher expenses.
Provisions for loan losses and for benefits and claims declined 29% primarily due to the absence of a $165 million pretax loan loss reserve build in the prior year related to the reorganization of the former Consumer Finance business, a prior-year reserve build related to Hurricane Katrina of $110 million and lower overall bankruptcy filings in the current year. The credit environment was favorable during the first three quarters of 2006.
Deposit growth reflected balance increases in certificates of deposit; e-Savings accounts which(which generated $7.8$12.9 billion in end-of-period deposits; premium checking; anddeposits), certificates of deposit, partly rate-sensitive money market products.products and premium checking. Loan growth reflected improvements in all channels and products.Investment product sales increased 26%21%, driven by increased volumes.
Net income in 2006 also reflected the absence of a $51 million tax reserve release resulting from the resolution of the Federal Tax Audit.Audit in the first quarter of 2006.
| | Three Months Ended September 30, | % Change | Nine Months Ended September 30, | % Change | ||||||||||||||
|---|---|---|---|---|---|---|---|---|---|---|---|---|---|---|---|---|---|---|
| In millions of dollars | 2006 | 2005 | 3Q06 vs. 3Q05 | 2006 | 2005 | YTD06 vs. YTD05 | ||||||||||||
| Net interest revenue | $ | 1,185 | $ | 1,209 | (2 | )% | $ | 3,606 | $ | 3,709 | (3 | )% | ||||||
| Non-interest revenue | 296 | 123 | NM | 442 | 372 | 19 | ||||||||||||
| Revenues, net of interest expense | $ | 1,481 | $ | 1,332 | 11 | % | $ | 4,048 | $ | 4,081 | (1 | )% | ||||||
| Operating expenses | 450 | 425 | 6 | 1,347 | 1,249 | 8 | ||||||||||||
| Provisions for loan losses and for benefits and claims | 186 | 114 | 63 | 415 | 444 | (7 | ) | |||||||||||
| Income before taxes and minority interest | $ | 845 | $ | 793 | 7 | % | $ | 2,286 | $ | 2,388 | (4 | )% | ||||||
| Income taxes | 308 | 289 | 7 | 813 | 862 | (6 | ) | |||||||||||
| Minority interest, net of taxes | 16 | 17 | (6 | ) | 45 | 46 | (2 | ) | ||||||||||
| Net income | $ | 521 | $ | 487 | 7 | % | $ | 1,428 | $ | 1,480 | (4 | )% | ||||||
| Revenues, net of interest expense, by business: | ||||||||||||||||||
| Real Estate Lending | $ | 1,000 | $ | 836 | 20 | % | $ | 2,636 | $ | 2,648 | — | |||||||
| Student Loans | 163 | 173 | (6 | ) | 482 | 481 | — | |||||||||||
| Auto | 318 | 323 | (2 | ) | 930 | 952 | (2 | )% | ||||||||||
| Total revenues | $ | 1,481 | $ | 1,332 | 11 | % | $ | 4,048 | $ | 4,081 | (1 | )% | ||||||
| Net income by business: | ||||||||||||||||||
| Real Estate Lending | $ | 389 | $ | 318 | 22 | % | $ | 1,014 | $ | 1,037 | (2 | )% | ||||||
| Student Loans | 58 | 62 | (6 | ) | 171 | 176 | (3 | ) | ||||||||||
| Auto | 74 | 107 | (31 | ) | 243 | 267 | (9 | ) | ||||||||||
| Total net income | $ | 521 | $ | 487 | 7 | % | $ | 1,428 | $ | 1,480 | (4 | )% | ||||||
| Average assets(in billions of dollars) | $ | 244 | $ | 192 | 27 | % | $ | 225 | $ | 185 | 22 | % | ||||||
| Return on assets | 0.85 | % | 1.01 | % | 0.85 | % | 1.07 | % | ||||||||||
| Average risk capital(1) | $ | 3,770 | $ | 3,218 | 17 | % | $ | 3,651 | $ | 3,283 | 11 | % | ||||||
| Return on risk capital(1) | 55 | % | 60 | % | 52 | % | 60 | % | ||||||||||
| Return on invested capital(1) | 31 | % | 31 | % | 28 | % | 34 | % | ||||||||||
U.S. Consumer Lending (Continued)
| | Three Months Ended September 30, | % Change | ||||||||
|---|---|---|---|---|---|---|---|---|---|---|
| In millions of dollars | 2006 | 2005 | 3Q06 vs. 3Q05 | |||||||
| Key indicators: (in billions of dollars) | ||||||||||
| Net interest margin:(2) | ||||||||||
| Real Estate Lending | 1.91 | % | 2.32 | % | ||||||
| Student Loans | 1.50 | 1.90 | ||||||||
| Auto | 8.57 | 10.47 | ||||||||
| Originations: | ||||||||||
| Real Estate Lending | $ | 35.8 | $ | 37.0 | (3 | )% | ||||
| Student Loans | 4.1 | 3.8 | 8 | % | ||||||
| Auto | 2.4 | 1.9 | 26 | % | ||||||
U.S. Consumer Lending provides home mortgages and home equity loans to prime and non-prime customers, auto financing to non-prime consumers and educational loans to students. Loans are originated throughout the United States and Canada through the Citibank, CitiFinancial andSmith Barney branch networks, Primerica Financial Services agents, third-party brokers, direct mail, the Internet and telesales. Loans are also purchased in the wholesale markets.U.S. Consumer Lendingalso provides mortgage servicing to a portfolio of mortgage loans owned by third parties. Revenues are comprisedcomposed of loan fees, net interest revenue and mortgage servicing fees.
| | First Quarter | % Change | ||||||||
|---|---|---|---|---|---|---|---|---|---|---|
| In millions of dollars | 2007 | 2006 | 1Q07 vs. 1Q06 | |||||||
| Net interest revenue | $ | 1,350 | $ | 1,207 | 12 | % | ||||
| Non-interest revenue | 201 | 53 | NM | |||||||
| Revenues, net of interest expense | $ | 1,551 | $ | 1,260 | 23 | % | ||||
| Operating expenses | 491 | 453 | 8 | |||||||
| Provisions for loan losses and for benefits and claims | 503 | 143 | NM | |||||||
| Income before taxes and minority interest | $ | 557 | $ | 664 | (16 | )% | ||||
| Income taxes | 190 | 218 | (13 | ) | ||||||
| Minority interest, net of taxes | 8 | 9 | (11 | ) | ||||||
| Net income | $ | 359 | $ | 437 | (18 | )% | ||||
| Revenues, net of interest expense, by business: | ||||||||||
| Real Estate Lending | $ | 1,090 | $ | 843 | 29 | % | ||||
| Student Loans | 112 | 117 | (4 | ) | ||||||
| Auto | 349 | 300 | 16 | |||||||
| Total revenues | $ | 1,551 | $ | 1,260 | 23 | % | ||||
| Net income by business: | ||||||||||
| Real Estate Lending | $ | 297 | $ | 328 | (9 | )% | ||||
| Student Loans | 29 | 38 | (24 | ) | ||||||
| Auto | 33 | 71 | (54 | ) | ||||||
| Total net income | $ | 359 | $ | 437 | (18 | )% | ||||
| Average assets (in billions of dollars) | $ | 313 | $ | 209 | 50 | % | ||||
| Return on assets | 0.47 | % | 0.85 | % | ||||||
| Average risk capital(1) | $ | 6,256 | $ | 3,732 | 68 | % | ||||
| Return on risk capital(1) | 23 | % | 47 | % | ||||||
| Return on invested capital(1) | 16 | % | 27 | % | ||||||
3Q06U.S. Consumer Lending (Continued)
| | First Quarter | % Change | ||||||||
|---|---|---|---|---|---|---|---|---|---|---|
| | 2007 | 2006 | 1Q07 vs. 1Q06 | |||||||
| Key indicators: (in billions of dollars) | ||||||||||
| Net interest margin:(2) | ||||||||||
| Real Estate Lending(3) | 1.89 | % | 2.13 | % | ||||||
| Student Loans | 1.53 | % | 1.71 | % | ||||||
| Auto | 8.18 | % | 9.22 | % | ||||||
| Originations: | ||||||||||
| Real Estate Lending | $ | 39.6 | $ | 32.4 | 22 | % | ||||
| Student Loans | $ | 2.8 | $ | 2.9 | (3 | )% | ||||
| Auto | $ | 3.1 | $ | 2.0 | 55 | |||||
1Q07 vs. 3Q051Q06
Net Interest Revenue decreased 2%increased primarily due to average loan growth of 16%, reflecting net interest margin compression that was partially offset by a 19% increase in average loan balances.lower net interest margins.Non-Interest Revenue increased due toon higher net servicing fees and higher gains on sales of real estate, student loans and mortgage-backed securities, and higher net mortgage servicing revenues.securities. Average loan growth reflected a strong increase in originations, over the past year, with 26% growthincreases in Auto originations and 8% growth in Student Loans originations in the 2006 third quarter.
During the 2006 third quarter, the U.S. Consumer Lending business initiated a Mortgage-Backed Securities Program.
Operating expenses increased primarily due to higher loan origination volumes and investment spending.
Provisions for loan losses and for benefits and claims increased primarily due to lower loan loss reserve releases of $48 million and higher credit losses in the Real Estate Lending business. The lower loan loss reserve releases reflected the absence of a prior-year loan loss reserve release of $165 million related to the reorganization of theU.S. Consumer Finance businesses and a prior-year loan loss reserve build of $110 million related to the estimated impact of Hurricane Katrina. The 90 days-past-due ratio declined in Real Estate Lending business.
2006 YTD vs. 2005 YTD
Net Interest Revenue declined 3%, reflecting net interest margin compression somewhat offset by a 19% increase in average loan balances.Non-Interest Revenue increased due to higher gains on securitization of real estate and student loans,auto lending of 22% and gains on the sale of securities, somewhat offset by lower servicing revenues. Average loan growth reflected a strong increase in originations across all businesses, driven by an 11% increase in real estate lending.55%, respectively.
Operating expenses increased primarily due to higher loan origination volumes investment spending and. The increase in 2007 was affected favorably by the impactabsence of the charge related to the 2006 initial adoption of SFAS 123(R).
Provisions for loan losses and for benefits and claims declinedincreased primarily as a result of increased net credit losses due to a favorable credit environment, which led to an increase inhigher volumes and portfolio seasoning, increased loan loss reserves to reflect a change in estimate of loan losses inherent in the initial tenor portion of the portfolio, and increased delinquencies in second mortgages. The net credit loss ratio in real estate lending increased 14 basis points to 0.33%
Net income also reflected the absence of a $31 million tax reserve releasesrelease resulting from the resolution of $58 million, driven by the Real Estate Lending business.Federal Tax Audit in the first quarter of 2006.
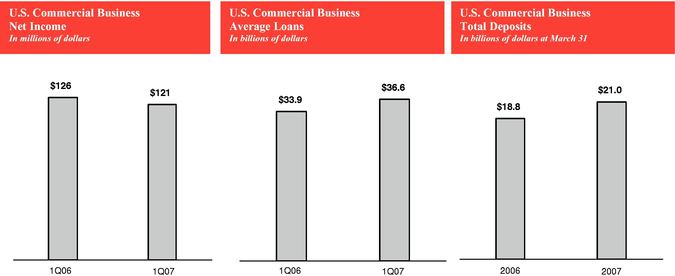
U.S. Commercial Business provides equipment leasing, financing, and banking services to small- and middle-market businesses ($5 million to $500 million in annual revenues) and financing for investor-owned multifamily and commercial properties. Revenues are comprisedcomposed of net interest revenue and fees on loans and leases.
| | Three Months Ended September 30, | % Change | Nine Months Ended September 30, | % Change | First Quarter | % Change | ||||||||||||||||||||
|---|---|---|---|---|---|---|---|---|---|---|---|---|---|---|---|---|---|---|---|---|---|---|---|---|---|---|
In millions of dollars | ||||||||||||||||||||||||||
| 2006 | 2005 | 3Q06 vs. 3Q05 | 2006 | 2005 | YTD06 vs. YTD05 | 2007 | 2006 | 1Q07 vs. 1Q06 | ||||||||||||||||||
| Net interest revenue | $ | 295 | $ | 372 | (21 | )% | $ | 893 | $ | 1,023 | (13 | )% | $ | 275 | $ | 287 | (4 | )% | ||||||||
| Non-interest revenue | 194 | 277 | (30 | ) | 582 | 795 | (27 | ) | 168 | 183 | (8 | ) | ||||||||||||||
| Revenues, net of interest expense | $ | 489 | $ | 649 | (25 | )% | $ | 1,475 | $ | 1,818 | (19 | )% | $ | 443 | $ | 470 | (6 | )% | ||||||||
| Operating expenses | 328 | 308 | 6 | 1,044 | 984 | 6 | 330 | 363 | (9 | ) | ||||||||||||||||
| Provision for loan losses | (30 | ) | 21 | NM | (50 | ) | 27 | NM | 29 | (24 | ) | NM | ||||||||||||||
| Income before taxes | $ | 191 | $ | 320 | (40 | )% | $ | 481 | $ | 807 | (40 | )% | $ | 84 | $ | 131 | (36 | )% | ||||||||
| Income taxes | 40 | 98 | (59 | ) | 66 | 199 | (67 | ) | (37 | ) | 5 | NM | ||||||||||||||
| Net income | $ | 151 | $ | 222 | (32 | )% | $ | 415 | $ | 608 | (32 | )% | $ | 121 | $ | 126 | (4 | )% | ||||||||
| Average assets(in billions of dollars) | $ | 44 | $ | 39 | 13 | % | $ | 42 | $ | 38 | 11 | % | $ | 49 | $ | 41 | 20 | % | ||||||||
| Return on assets | 1.36 | % | 2.26 | % | 1.32 | % | 2.14 | % | 1.00 | % | 1.25 | % | ||||||||||||||
| Average risk capital(1) | $ | 2,323 | $ | 1,698 | 37 | % | $ | 2,291 | $ | 1,831 | 25 | % | $ | 2,684 | $ | 2,315 | 16 | |||||||||
| Return on risk capital(1) | 26 | % | 52 | % | 24 | % | 44 | % | 18 | % | 22 | % | ||||||||||||||
| Return on invested capital(1) | 13 | % | 31 | % | 12 | % | 29 | % | 10 | % | 11 | % | ||||||||||||||
| Key indicators:(in billions of dollars): | ||||||||||||||||||||||||||
| Average earning assets | $ | 36.8 | $ | 33.1 | 11 | % | $ | 36.3 | $ | 32.5 | 12 | % | $ | 38.5 | $ | 35.7 | 8 | % | ||||||||
U.S. Commercial Business (Continued)
3Q061Q07 vs. 3Q051Q06
Net Interest Revenue declined 4% on continued net interest margin compression across several products, partially offset by the benefit of higher volumes. Average loans (excluding the liquidating portfolio) increased 13%,deposits and average deposits,loans increased 12% and 8% respectively, while down 2%, were affectedboth experienced spread compression. Revenues also reflect an increase in tax-advantaged transactions.
Operating expenses declined 9% primarily driven by improved expense controls and the transfer of $1.8 billion in deposits for certain customer segments to the U.S. Retail Distribution business to better service those customers. Excluding this transfer, deposits were up 8%.Non-Interest Revenue declined primarily due to the absenceprior-year impact of the prior-year $162initial adoption of SFAS 123(R) of $10 million.
Provision for loan losses increased primarily reflecting a current period loan loss reserve net build of $10 million legal settlement benefit related to the purchase of Copelco.
Operating expense growth was mainly due toand the absence of a $23 million expense benefit due to the Copelco settlement recorded in the prior year.
Provision for loan losses declined primarily due to higherprior-year loan loss reserve releases resulting from the favorable credit environment and the continued liquidationrelease of non-core portfolios.
Core loan growth reflected strong transaction volumes and growth in loan balances across all business units.
2006 YTD vs. 2005 YTD
Net Interest Revenue declined primarily due to the continuing impact of net interest margin compression, partially offset by strong growth in core loan and deposit balances, up 16% and 10%, respectively, over the prior year.Non-Interest Revenue declined primarily due to the absence of the $162 million legal settlement benefit in the 2005 third quarter related to the purchase of Copelco and the $161 million gain on the sale of the CitiCapital Transportation Finance business in the 2005 first quarter, partly offset by the $31 million pretax gain on the Sale of New York Branches in the 2006 second quarter.
Operating expense growth was primarily due to higher volume-related expenses, the absence of a $23 million expense benefit due to the Copelco settlement recorded in the prior-year period, and the impact of the FAB acquisition and SFAS 123(R), partially offset by lower expenses from the absence of the transportation finance business and severance costs in the prior year.
Provision for loan losses declined primarily due to loan loss reserve releases of $84 million due to a favorable credit environment, and the continued liquidation of non-core portfolios.
Deposit and core loan growth reflected strong transaction volumes and balances across all business units and the impact of the FAB acquisition, partially offset by declines in the liquidating portfolio.$38 million.
(This page has been left blank intentionally.)
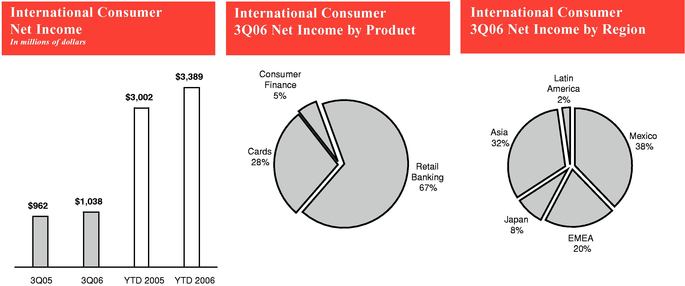 |
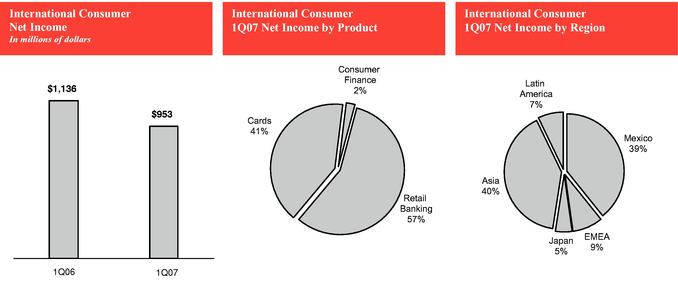
International Consumer is comprised of three businesses:Cards,Consumer Finance andRetail Banking.Banking. International Consumer operates in five geographies:Mexico,Latin America,EMEA,Japan, andAsia.
| | | Three Months Ended September 30, | % Change | Nine Months Ended September 30, | % Change | | First Quarter | % Change | ||||||||||||||||||||
|---|---|---|---|---|---|---|---|---|---|---|---|---|---|---|---|---|---|---|---|---|---|---|---|---|---|---|---|---|
In millions of dollars | In millions of dollars | |||||||||||||||||||||||||||
| In millions of dollars | 2006 | 2005 | 3Q06 vs. 3Q05 | 2006 | 2005 | YTD06 vs. YTD05 | 2007 | 2006 | 1Q07 vs. 1Q06 | |||||||||||||||||||
| Net interest revenue | Net interest revenue | $ | 3,445 | $ | 2,995 | 15 | % | $ | 9,921 | $ | 9,116 | 9 | % | Net interest revenue | $ | 3,489 | $ | 3,133 | 11 | % | ||||||||
| Non-interest revenue | Non-interest revenue | 1,622 | 1,638 | (1 | ) | 4,929 | 4,410 | 12 | Non-interest revenue | 1,899 | 1,576 | 20 | ||||||||||||||||
| Revenues, net of interest expense | Revenues, net of interest expense | $ | 5,067 | $ | 4,633 | 9 | % | $ | 14,850 | $ | 13,526 | 10 | % | Revenues, net of interest expense | $ | 5,388 | $ | 4,709 | 14 | % | ||||||||
| Operating expenses | Operating expenses | 2,769 | 2,280 | 21 | 8,091 | 7,022 | 15 | Operating expenses | 2,976 | 2,621 | 14 | |||||||||||||||||
| Provisions for loan losses and for benefits and claims | Provisions for loan losses and for benefits and claims | 1,032 | 1,197 | (14 | ) | 2,621 | 2,600 | 1 | Provisions for loan losses and for benefits and claims | 1,216 | 767 | 59 | ||||||||||||||||
| Income before taxes and minority interest | Income before taxes and minority interest | $ | 1,266 | $ | 1,156 | 10 | $ | 4,138 | $ | 3,904 | 6 | % | Income before taxes and minority interest | $ | 1,196 | $ | 1,321 | (9 | )% | |||||||||
| Income taxes | Income taxes | 227 | 193 | 18 | 744 | 902 | (18 | ) | Income taxes | 241 | 184 | 31 | ||||||||||||||||
| Minority interest, net of taxes | Minority interest, net of taxes | 1 | 1 | — | 5 | — | NM | Minority interest, net of taxes | 2 | 1 | 100 | |||||||||||||||||
| Net income | Net income | $ | 1,038 | $ | 962 | 8 | % | $ | 3,389 | $ | 3,002 | 13 | % | Net income | $ | 953 | $ | 1,136 | (16 | )% | ||||||||
| Revenues, net of interest expense, by region: | Revenues, net of interest expense, by region: | Revenues, net of interest expense, by region: | ||||||||||||||||||||||||||
| Mexico | $ | 1,238 | $ | 1,139 | 9 | % | $ | 3,579 | $ | 3,154 | 13 | % | Mexico | $ | 1,377 | $ | 1,149 | 20 | % | |||||||||
| Latin America | 485 | 279 | 74 | 1,282 | 817 | 57 | Latin America | 591 | 326 | 81 | ||||||||||||||||||
| EMEA | 1,353 | 1,271 | 6 | 3,983 | 3,775 | 6 | EMEA | 1,446 | 1,270 | 14 | ||||||||||||||||||
| Japan | 782 | 803 | (3 | ) | 2,364 | 2,451 | (4 | ) | Japan | 615 | 775 | (21 | ) | |||||||||||||||
| Asia | 1,209 | 1,141 | 6 | 3,642 | 3,329 | 9 | Asia | 1,359 | 1,189 | 14 | ||||||||||||||||||
| Total revenues | Total revenues | $ | 5,067 | $ | 4,633 | 9 | % | $ | 14,850 | $ | 13,526 | 10 | % | Total revenues | $ | 5,388 | $ | 4,709 | 14 | % | ||||||||
| Net income by region | Net income by region | Net income by region | ||||||||||||||||||||||||||
| Mexico | $ | 395 | $ | 511 | (23 | )% | $ | 1,128 | $ | 1,156 | (2 | )% | Mexico | $ | 372 | $ | 358 | 4 | % | |||||||||
| Latin America | 23 | 61 | (62 | ) | 169 | 195 | (13 | ) | Latin America | 70 | 58 | 21 | ||||||||||||||||
| EMEA | 213 | (154 | ) | NM | 613 | 92 | NM | EMEA | 83 | 185 | (55 | ) | ||||||||||||||||
| Japan | 79 | 169 | (53 | ) | 445 | 532 | (16 | ) | Japan | 45 | 188 | (76 | ) | |||||||||||||||
| Asia | 328 | 375 | (13 | ) | 1,034 | 1,027 | 1 | Asia | 383 | 347 | 10 | |||||||||||||||||
| Total net income | Total net income | $ | 1,038 | $ | 962 | 8 | % | $ | 3,389 | $ | 3,002 | 13 | % | Total net income | $ | 953 | $ | 1,136 | (16 | )% | ||||||||
| Average assets(in billions of dollars) | Average assets(in billions of dollars) | $ | 187 | $ | 166 | 13 | % | $ | 179 | $ | 166 | 8 | % | Average assets(in billions of dollars) | $ | 199 | $ | 173 | 15 | % | ||||||||
| Return on assets | Return on assets | 2.20 | % | 2.30 | % | 2.53 | % | 2.42 | % | Return on assets | 1.94 | % | 2.66 | % | ||||||||||||||
| Average risk capital(1) | Average risk capital(1) | $ | 12,626 | $ | 13,576 | (7 | )% | $ | 12,665 | $ | 13,143 | (4 | )% | Average risk capital(1) | $ | 13,847 | $ | 12,645 | 10 | % | ||||||||
| Return on risk capital(1) | Return on risk capital(1) | 33 | % | 28 | % | 36 | % | 31 | % | Return on risk capital(1) | 28 | % | 36 | % | ||||||||||||||
| Return on invested capital(1) | Return on invested capital(1) | 16 | % | 14 | % | 17 | % | 15 | % | Return on invested capital(1) | 14 | % | 18 | % | ||||||||||||||
| Key indicators—(in billions of dollars) | Key indicators—(in billions of dollars) | |||||||||||||||||||||||||||
| Average managed loans | Average managed loans | $ | 126.0 | $ | 108.2 | 16 | % | |||||||||||||||||||||
| Average deposits | Average deposits | $ | 154.2 | $ | 144.5 | 7 | % | |||||||||||||||||||||
| EOP AUMs | EOP AUMs | $ | 138.9 | $ | 124.2 | 12 | % | |||||||||||||||||||||
| Total branches | Total branches | 4,652 | 4,235 | 10 | % | |||||||||||||||||||||||
NM Not meaningful
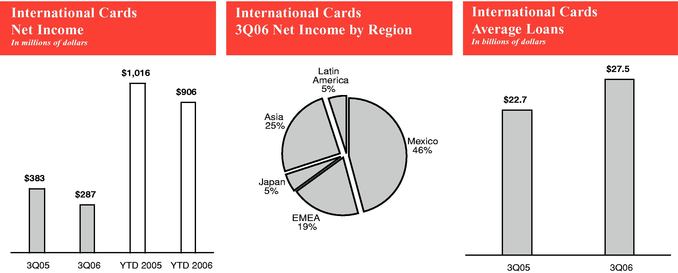 |
International Consumer is comprised of three businesses:Cards, Consumer Finance andRetail Banking.
| | Three Months Ended September 30, | % Change | Nine Months Ended September 30, | % Change | ||||||||||||||
|---|---|---|---|---|---|---|---|---|---|---|---|---|---|---|---|---|---|---|
| In millions of dollars | 2006 | 2005 | 3Q06 vs. 3Q05 | 2006 | 2005 | YTD06 vs. YTD05 | ||||||||||||
| Net interest revenue | $ | 964 | $ | 710 | 36 | % | $ | 2,649 | $ | 2,030 | 30 | % | ||||||
| Non-interest revenue | 555 | 499 | 11 | 1,660 | 1,460 | 14 | ||||||||||||
| Revenues, net of interest expense | $ | 1,519 | $ | 1,209 | 26 | % | $ | 4,309 | $ | 3,490 | 23 | % | ||||||
| Operating expenses | 740 | 561 | 32 | 2,071 | 1,706 | 21 | ||||||||||||
| Provision for loan losses | 406 | 192 | NM | 1,077 | 522 | NM | ||||||||||||
| Income before taxes and minority interest | $ | 373 | $ | 456 | (18 | )% | $ | 1,161 | $ | 1,262 | (8 | )% | ||||||
| Income taxes | 85 | 72 | 18 | 253 | 243 | 4 | ||||||||||||
| Minority interest, net of taxes | 1 | 1 | — | 2 | 3 | (33 | ) | |||||||||||
| Net income | $ | 287 | $ | 383 | (25 | )% | $ | 906 | $ | 1,016 | (11 | )% | ||||||
| Revenues, net of interest expense, by region: | ||||||||||||||||||
| Mexico | $ | 465 | $ | 353 | 32 | % | $ | 1,313 | $ | 929 | 41 | % | ||||||
| Latin America | 252 | 64 | NM | 586 | 217 | NM | ||||||||||||
| EMEA | 328 | 302 | 9 | 949 | 881 | 8 | ||||||||||||
| Japan | 72 | 76 | (5 | ) | 216 | 225 | (4 | ) | ||||||||||
| Asia | 402 | 414 | (3 | ) | 1,245 | 1,238 | 1 | |||||||||||
| Total revenues | $ | 1,519 | $ | 1,209 | 26 | % | $ | 4,309 | $ | 3,490 | 23 | % | ||||||
| Net income by region: | ||||||||||||||||||
| Mexico | $ | 133 | $ | 204 | (35 | )% | $ | 429 | $ | 456 | (6 | )% | ||||||
| Latin America | 13 | 21 | (38 | ) | 117 | 84 | 39 | |||||||||||
| EMEA | 55 | 34 | 62 | 130 | 100 | 30 | ||||||||||||
| Japan | 13 | 17 | (24 | ) | 47 | 51 | (8 | ) | ||||||||||
| Asia | 73 | 107 | (32 | ) | 183 | 325 | (44 | ) | ||||||||||
| Total net income | $ | 287 | $ | 383 | (25 | )% | $ | 906 | $ | 1,016 | (11 | )% | ||||||
| Average assets(in billions of dollars) | $ | 32 | $ | 26 | 23 | % | $ | 30 | $ | 26 | 15 | % | ||||||
| Return on assets | 3.56 | % | 5.84 | % | 4.04 | % | 5.22 | % | ||||||||||
| Average risk capital(1) | $ | 2,185 | $ | 1,855 | 18 | % | $ | 2,153 | $ | 1,736 | 24 | % | ||||||
| Return on risk capital(1) | 52 | % | 82 | % | 56 | % | 78 | % | ||||||||||
| Return on invested capital(1) | 24 | % | 37 | % | 27 | % | 34 | % | ||||||||||
| Key indicators:(in billions of dollars): | ||||||||||||||||||
| Purchase sales | $ | 20.5 | $ | 17.3 | 18 | % | ||||||||||||
| Average yield(2) | 19.20 | % | 18.08 | % | ||||||||||||||
| Net interest margin(2) | 13.91 | % | 12.41 | % | ||||||||||||||
NM Not meaningful
International Cards (Continued)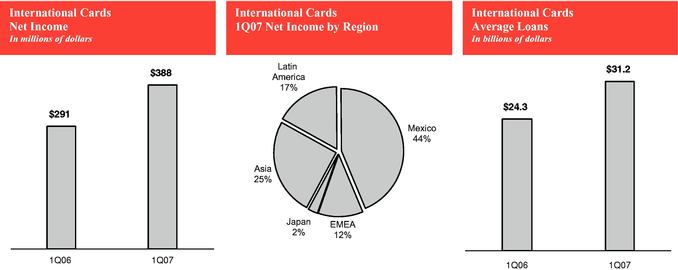
International Cards provides MasterCard, Visa and Diners branded credit and charge cards, as well as private label cards and co-branded cards, to more than 30 million customer accounts in 43 countries outside of the U.S. and Canada. Revenues are primarily generated from net interest revenue on receivables, interchange fees on purchase sales and other delinquency or serviceand servicing fees.
| | First Quarter | % Change | ||||||||
|---|---|---|---|---|---|---|---|---|---|---|
| In millions of dollars | 2007 | 2006 | 1Q07 vs. 1Q06 | |||||||
| Net interest revenue | $ | 1,121 | $ | 773 | 45 | % | ||||
| Non-interest revenue | 618 | 507 | 22 | |||||||
| Revenues, net of interest expense | $ | 1,739 | $ | 1,280 | 36 | % | ||||
| Operating expenses | 819 | 617 | 33 | |||||||
| Provision for loan losses | 406 | 312 | 30 | |||||||
| Income before taxes and minority interest | $ | 514 | $ | 351 | 46 | % | ||||
| Income taxes and minority interest | 126 | 60 | NM | |||||||
| Net income | $ | 388 | $ | 291 | 33 | % | ||||
| Revenues, net of interest expense, by region: | ||||||||||
| Mexico | $ | 530 | $ | 405 | 31 | % | ||||
| Latin America | 326 | 96 | NM | |||||||
| EMEA | 375 | 294 | 28 | |||||||
| Japan | 62 | 70 | (11 | ) | ||||||
| Asia | 446 | 415 | 7 | |||||||
| Total revenues | $ | 1,739 | $ | 1,280 | 36 | % | ||||
| Net income by region: | ||||||||||
| Mexico | $ | 169 | $ | 149 | 13 | % | ||||
| Latin America | 66 | 35 | 89 | |||||||
| EMEA | 46 | 32 | 44 | |||||||
| Japan | 9 | 21 | (57 | ) | ||||||
| Asia | 98 | 54 | 81 | |||||||
| Total net income | $ | 388 | $ | 291 | 33 | % | ||||
| Average assets(in billions of dollars) | $ | 38 | $ | 28 | 36 | % | ||||
| Return on assets | 4.14 | % | 4.21 | % | ||||||
| Average risk capital(1) | $ | 2,537 | $ | 2,073 | 22 | % | ||||
| Return on risk capital(1) | 62 | % | 57 | % | ||||||
| Return on invested capital(1) | 26 | % | 27 | % | ||||||
| Key indicators: (in billions of dollars): | ||||||||||
| Purchase sales | $ | 21.7 | $ | 17.4 | 25 | % | ||||
| Average yield(2) | 19.58 | % | 18.61 | % | ||||||
| Net interest margin(2) | 14.57 | % | 12.90 | % | ||||||
3Q061Q07 vs. 3Q051Q06
Net Interest Revenue increased 45% driven by 21% growth in average receivables, acrossas well as the region and the integration of the CredicardCrediCard portfolio inLatin America., and the impact of the acquisition of Grupo Financiero Uno.Non-Interest Revenue also increased reflecting an 18% increase in22%, primarily due to a $66 million pre-tax gain on the sale of MasterCard shares and higher purchase sales and the integration of the Credicard portfolio.25%, led by growth inLatin America,Asia, andEMEA. The positive impact of foreign currency translation also contributed to increases in revenues.
Operating expenses increased, reflecting the integration of the CredicardCrediCard portfolio and the acquisition of Grupo Financiero Uno, along with volume growth across the regions, continued investment spending, higher customer activity, and the impact of foreign currency translation. The increase in 2007 was favorably affected by the absence of the prior-year refundcharge related to the 2006 initial adoption of Value Added Taxes inMexico, continued investments in organic growth, and volume growth across the regions.SFAS 123(R).
Provision for loan losses increased 30% driven by portfolio growth, and target market expansion inMexico, credit losses relating to and the Credicardintegration of the CrediCard portfolio inLatin America, partially offset by the absence of a 2006 first quarter loan loss reserve build in Taiwan due to the industry-wide credit deterioration in Taiwan, and volume growth in all regions.deterioration.
Net Income was also impacted byreflected the absence of prior-yeara 2006 first quarter $20 million tax creditsbenefit resulting from the Homeland Investment Actresolution of $37 million.the Federal Tax Audit.
Regional Net Income
Mexico income declined, primarily reflecting the absence of a $41 million prior-year tax benefit associated with the Homeland Investment Act and the prior-year refund of Value Added Taxes.Latin America income declined, primarilyincreased due to higher credit costs associated with the Credicard portfolio.EMEA income increased on higher purchase sales, volume growth, and higher tax credits, partially offset by higher expenses and higher credit costs.Asia income declined on lower revenues and an increase in credit costs from the continued impact of industry-wide credit conditions in Taiwan.
2006 YTD vs. 2005 YTD
Net Interest Revenue increased, driven by 17% growth in average receivables across all regions and the integration of the Credicard portfolio inLatin America.Non-Interest Revenue also increased, reflecting an increase in purchase sales, the integration of the Credicard portfolio, and a gain on the sale of MasterCard IPO of $35 million in the 2006 second quarter.
Operating expenses increased, reflecting the integration of the Credicard portfolio, continued investment in organic growth, volume growth across the regions,shares, higher sales volumes, and the adoption of SFAS 123(R). This was partially offset by the absence of 2005 first quarter repositioning expenses of $13 million.
Provision for loan losses increased,average loans driven by portfolio growth and target market expansion, inMexico, the industry-wide credit deterioration in Taiwan, credit losses relating to the Credicard portfolio in Latin America,partially offset by higher expenses and volume growth in all regions.related provision increases.
Regional Net Income
MexicoEMEA income declined primarilyincreased due to lower levels of tax benefits and higher expenses, partially offset by higher sales volumes and average loans, and a gain from the MasterCard IPO of $9 million in the 2006 second quarter.loans.Latin America income increased primarily due to volumethe CrediCard portfolio and purchase sales growth.EMEA income increased on higher purchase sales, volume growth, and higher tax benefits, partially offset by higher net credit losses.the acquisition of Grupo Financiero Uno.Asia income declinedincreased due to an increasehigher average loan volumes and a decrease in credit costs related to credit conditions in Taiwan and costs associated with a Korea labor settlement, partially offset by higher purchase sales and loan growth and a gain from the MasterCard IPO of $7 million in the 2006 second quarter.Taiwan. Japan income declined due to lower revenues.
International Consumer Finance
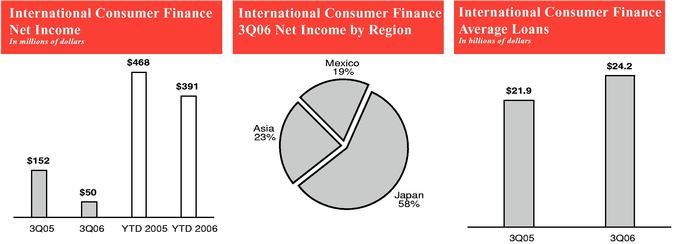 | ||||
| | Three Months Ended September 30, | % Change | Nine Months Ended September 30, | % Change | ||||||||||||||
|---|---|---|---|---|---|---|---|---|---|---|---|---|---|---|---|---|---|---|
| In millions of dollars | 2006 | 2005 | 3Q06 vs. 3Q05 | 2006 | 2005 | YTD06 vs. YTD05 | ||||||||||||
| Net interest revenue | $ | 962 | $ | 910 | 6 | % | $ | 2,854 | $ | 2,760 | 3 | % | ||||||
| Non-interest revenue | 36 | 40 | (10 | ) | 115 | 101 | 14 | |||||||||||
| Revenues, net of interest expense | $ | 998 | $ | 950 | 5 | % | $ | 2,969 | $ | 2,861 | 4 | % | ||||||
| Operating expenses | 406 | 397 | 2 | 1,252 | 1,214 | 3 | ||||||||||||
| Provision for loan losses | 523 | 324 | 61 | 1,167 | 961 | 21 | ||||||||||||
| Income before taxes and minority interest | $ | 69 | $ | 229 | (70 | )% | $ | 550 | $ | 686 | (20 | )% | ||||||
| Income taxes | 19 | 77 | (75 | ) | 159 | 218 | (27 | ) | ||||||||||
| Net income | $ | 50 | $ | 152 | (67 | )% | $ | 391 | $ | 468 | (16 | )% | ||||||
| Revenues, net of interest expense, by region: | ||||||||||||||||||
| Mexico | $ | 62 | $ | 47 | 32 | % | $ | 170 | $ | 134 | 27 | % | ||||||
| Latin America | 38 | 31 | 23 | 112 | 89 | 26 | ||||||||||||
| EMEA | 191 | 185 | 3 | 568 | 559 | 2 | ||||||||||||
| Japan | 587 | 609 | (4 | ) | 1,793 | 1,871 | (4 | ) | ||||||||||
| Asia | 120 | 78 | 54 | 326 | 208 | 57 | ||||||||||||
| Total revenues | $ | 998 | $ | 950 | 5 | % | $ | 2,969 | $ | 2,861 | 4 | % | ||||||
| Net income by region: | ||||||||||||||||||
| Mexico | $ | 12 | $ | 9 | 33 | % | $ | 33 | $ | 26 | 27 | % | ||||||
| Latin America | (1 | ) | 2 | NM | — | 8 | (100 | ) | ||||||||||
| EMEA | (13 | ) | 3 | NM | 9 | 15 | (40 | ) | ||||||||||
| Japan | 37 | 122 | (70 | ) | 306 | 381 | (20 | ) | ||||||||||
| Asia | 15 | 16 | (6 | ) | 43 | 38 | 13 | |||||||||||
| Total net income | $ | 50 | $ | 152 | (67 | )% | $ | 391 | $ | 468 | (16 | )% | ||||||
| Average assets(in billions of dollars) | $ | 28 | $ | 25 | 12 | % | $ | 27 | $ | 26 | 4 | % | ||||||
| Return on assets | 0.71 | % | 2.41 | % | 1.94 | % | 2.41 | % | ||||||||||
| Average risk capital(1) | $ | 1,093 | $ | 919 | 19 | % | $ | 1,100 | $ | 924 | 19 | % | ||||||
| Return on risk capital(1) | 18 | % | 66 | % | 48 | % | 68 | % | ||||||||||
| Return on invested capital(1) | 6 | % | 18 | % | 15 | % | 18 | % | ||||||||||
| Key indicators: | ||||||||||||||||||
| Average yield(2) | 18.49 | % | 18.87 | % | ||||||||||||||
| Net interest margin(2) | 15.77 | % | 16.49 | % | ||||||||||||||
| Number of sales points: | ||||||||||||||||||
| Other branches | 1,483 | 968 | ||||||||||||||||
| Japan branches | 324 | 392 | ||||||||||||||||
| Japan Automated Loan Machines | 809 | 654 | ||||||||||||||||
| Total | 2,616 | 2,014 | ||||||||||||||||
International Consumer Finance (Continued)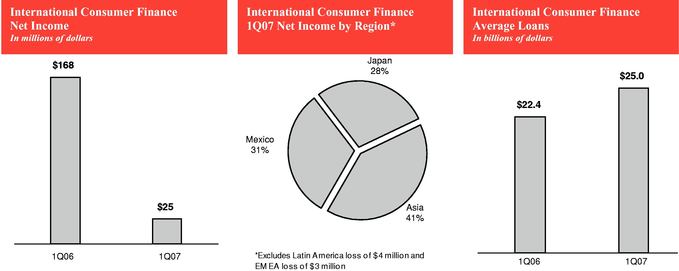
International Consumer Finance provides community-based lending services through itsa branch network, regionalcentralized sales officesplatforms and cross-selling initiatives withInternational Cards andInternational Retail Banking. As of September 30, 2006,March 31, 2007,International Consumer Finance maintained 2,6162,377 sales points comprising 1,807comprised of 1,669 branches in more than 25 countries, and 809 ALMs708 Automated Loan Machines (ALMs) inJapan.International Consumer Finance offers real-estate-secured loans, unsecured or partially secured personal loans, auto loans, and loans to finance consumer-goods purchases. Revenues are primarily derived from net interest revenue and fees on loan products.
3Q06 vs. 3Q05
Net Interest Revenue increased, driven mainly by higher personal and real estate secured loan volumes. This was partly offset by lower average yields and a decline inJapan, primarily due to the impact of foreign currency translation and lower average loans.Non-Interest Revenue declined slightly for the quarter.
Operating expense growth was primarily due to higher volume-related expenses and increased investment spending. There were 110 new branch openings in the quarter (and 447 net new branches over the last 12 months). These increases were partially offset by lower expenses inJapan.
Provision for loan losses increased, primarily due to approximately $160 million in credit costs associated with ongoing legislative and other actions affecting the consumer finance industry inJapan, a loan loss reserve build inEMEA, and higher net credit losses inAsia. The net credit loss ratio increased 35 basis points to 6.38%.
The increase inaverage loans outside ofJapan was mainly driven by growth in the personal-loan and real-estate-secured portfolios. InJapan, average loans declined by 3% due to the impact of foreign currency translation, and were essentially flat excluding the impact of FX.
The current legislative proposals to reform consumer lending laws inJapan, if enacted, will change various aspects of the consumer finance industry. At this point, there is uncertainty with respect to the final outcome of these proposals, including, but not limited to, the level of interest rate caps and the timing for implementation of the new rules and the rules during the transition period.
The uncertainty surrounding the ongoing legislative proposals and certain other actions affecting the consumer finance industry inJapan are negatively affecting the financial performance of the business. The Company continues to evaluate the potential impact of these developments, which may further negatively impact the revenues, expenses and credit costs in the consumer finance lending business.*
2006 YTD vs. 2005 YTD
Net Interest Revenue increased, driven primarily by higher average loan volumes, partially offset by slightly lower net interest margins. A revenue decline inJapan was primarily due to the impact of foreign currency translation and lower average loans.Non-Interest Revenue increased 14% during the period.
Operating expense growth was primarily due to higher volume-related expenses and increased investment spending, driven by 351 new branch openings and the addition of 146 ALMs inJapan in the first nine months of 2006. The growth was partially offset by the absence of the 2005 first quarter repositioning charge inEMEA of $38 million, the absence of the impact resulting from the standardization of write-off policy in Spain and Italy, and declines inJapan due to the closing of branches.
Provision for loan losses was higher than the prior-year period primarily due to the ongoing legislative and other actions affecting the consumer finance industry inJapanand higher net credit losses inAsia andEMEA.
The increase inaverage loans outside ofJapan was mainly driven by growth in the personal-loan and real-estate-secured portfolios. InJapan, loans declined by 7% due to the impact of foreign currency translation and reduced loan demand.
International Retail Banking
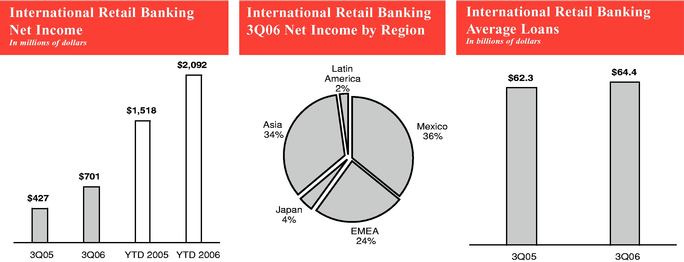
| | | Three Months Ended September 30, | % Change | Nine Months Ended September 30, | % Change | | First Quarter | % Change | |||||||||||||||||||||
|---|---|---|---|---|---|---|---|---|---|---|---|---|---|---|---|---|---|---|---|---|---|---|---|---|---|---|---|---|---|
| In millions of dollars | In millions of dollars | 2006 | 2005 | 3Q06 vs. 3Q05 | 2006 | 2005 | YTD06 vs. YTD05 | In millions of dollars | 2007 | 2006 | 1Q07 vs. 1Q06 | ||||||||||||||||||
| Net interest revenue | Net interest revenue | $ | 1,519 | $ | 1,375 | 10 | % | $ | 4,418 | $ | 4,326 | 2 | % | Net interest revenue | $ | 838 | $ | 921 | (9 | )% | |||||||||
| Non-interest revenue | Non-interest revenue | 1,031 | 1,099 | (6 | ) | 3,154 | 2,849 | 11 | Non-interest revenue | 52 | 41 | 27 | |||||||||||||||||
| Revenues, net of interest expense | Revenues, net of interest expense | $ | 2,550 | $ | 2,474 | 3 | % | $ | 7,572 | $ | 7,175 | 6 | % | Revenues, net of interest expense | $ | 890 | $ | 962 | (7 | )% | |||||||||
| Operating expenses | Operating expenses | 1,623 | 1,322 | 23 | 4,768 | 4,102 | 16 | Operating expenses | 407 | 419 | (3 | ) | |||||||||||||||||
| Provisions for loan losses and for benefits and claims | 103 | 681 | (85 | ) | 377 | 1,117 | (66 | ) | |||||||||||||||||||||
| Provision for loan losses and for benefits and claims | Provision for loan losses and for benefits and claims | 456 | 304 | 50 | |||||||||||||||||||||||||
| Income before taxes and minority interest | Income before taxes and minority interest | $ | 824 | $ | 471 | 75 | % | $ | 2,427 | $ | 1,956 | 24 | % | Income before taxes and minority interest | $ | 27 | $ | 239 | (89 | )% | |||||||||
| Income taxes | Income taxes | 123 | 44 | NM | 332 | 441 | (25 | ) | Income taxes | 2 | 71 | (97 | ) | ||||||||||||||||
| Minority interest, net of taxes | — | — | — | 3 | (3 | ) | NM | ||||||||||||||||||||||
| Net income | Net income | $ | 701 | $ | 427 | 64 | % | $ | 2,092 | $ | 1,518 | 38 | % | Net income | $ | 25 | $ | 168 | (85 | )% | |||||||||
| Revenues, net of interest expense, by region: | Revenues, net of interest expense, by region: | Revenues, net of interest expense, by region: | |||||||||||||||||||||||||||
| Mexico | $ | 711 | 739 | (4 | )% | $ | 2,096 | $ | 2,091 | — | Mexico | $ | 70 | $ | 53 | 32 | % | ||||||||||||
| Latin America | 195 | 184 | 6 | 584 | 511 | 14 | % | EMEA | 203 | 184 | 10 | ||||||||||||||||||
| EMEA | 834 | 784 | 6 | 2,466 | 2,335 | 6 | Asia (excluding Japan) | 140 | 98 | 43 | |||||||||||||||||||
| Japan | 123 | 118 | 4 | 355 | 355 | — | Latin America | 43 | 36 | 19 | |||||||||||||||||||
| Asia | 687 | 649 | 6 | 2,071 | 1,883 | 10 | |||||||||||||||||||||||
| Sub-total | $ | 456 | $ | 371 | 23 | % | |||||||||||||||||||||||
| Japan | $ | 434 | $ | 591 | (27 | )% | |||||||||||||||||||||||
| Total revenues | Total revenues | $ | 2,550 | $ | 2,474 | 3 | % | $ | 7,572 | $ | 7,175 | 6 | % | Total revenues | $ | 890 | $ | 962 | (7 | )% | |||||||||
| Net income by region: | |||||||||||||||||||||||||||||
| Net income (loss) by region: | Net income (loss) by region: | ||||||||||||||||||||||||||||
| Mexico | $ | 10 | $ | 10 | — | ||||||||||||||||||||||||
| EMEA | (3 | ) | 7 | NM | |||||||||||||||||||||||||
| Asia (excluding Japan) | 13 | 16 | (19 | )% | |||||||||||||||||||||||||
| Mexico | $ | 250 | $ | 298 | (16 | )% | $ | 666 | $ | 674 | (1 | )% | Latin America | (4 | ) | — | NM | ||||||||||||
| Latin America | 11 | 38 | (71 | ) | 52 | 103 | (50 | ) | |||||||||||||||||||||
| EMEA | 171 | (191 | ) | NM | 474 | (23 | ) | NM | Sub-total | $ | 16 | $ | 33 | (52 | )% | ||||||||||||||
| Japan | 29 | 30 | (3 | ) | 92 | 100 | (8 | ) | |||||||||||||||||||||
| Asia | 240 | 252 | (5 | ) | 808 | 664 | 22 | Japan | $ | 9 | $ | 135 | (93 | )% | |||||||||||||||
| Total net income | Total net income | $ | 701 | $ | 427 | 64 | % | $ | 2,092 | $ | 1,518 | 38 | % | Total net income | $ | 25 | $ | 168 | (85 | )% | |||||||||
| Average assets(in billions of dollars) | Average assets(in billions of dollars) | $ | 127 | $ | 115 | 10 | % | $ | 122 | $ | 114 | 7 | % | Average assets(in billions of dollars) | $ | 29 | $ | 26 | 12 | % | |||||||||
| Return on assets | Return on assets | 2.19 | % | 1.47 | % | 2.29 | % | 1.78 | % | Return on assets | 0.35 | % | 2.62 | % | |||||||||||||||
| Average risk capital(1) | Average risk capital(1) | $ | 9,348 | $ | 10,802 | (13 | )% | $ | 9,412 | $ | 10,483 | (10 | )% | Average risk capital(1) | $ | 1,187 | $ | 1,165 | 2 | % | |||||||||
| Average return on risk capital(1) | 30 | % | 16 | % | 30 | % | 19 | % | |||||||||||||||||||||
| Return on risk capital(1) | Return on risk capital(1) | 9 | % | 58 | % | ||||||||||||||||||||||||
| Return on invested capital(1) | Return on invested capital(1) | 15 | % | 9 | % | 15 | % | 10 | % | Return on invested capital(1) | 3 | % | 19 | % | |||||||||||||||
| Key indicators:(in billions of dollars): | |||||||||||||||||||||||||||||
| Average deposits | $ | 148.4 | $ | 136.1 | 9 | % | |||||||||||||||||||||||
| Assets under Management (AUMs) (EOP) | 133.8 | 116.3 | 15 | % | |||||||||||||||||||||||||
| Average loans | 64.4 | 62.3 | 3 | % | |||||||||||||||||||||||||
International Retail BankingConsumer Finance (Continued)
| | First Quarter | % Change | ||||||
|---|---|---|---|---|---|---|---|---|
| | 2007 | 2006 | 1Q07 vs. 1Q06 | |||||
| Key indicators: | ||||||||
| Average yield(2) | 17.08 | % | 19.06 | % | ||||
| Net interest margin(2) | 13.59 | % | 16.67 | % | ||||
| Number of sales points: | ||||||||
| Other branches | 1,618 | 1,263 | 28 | % | ||||
| Japan branches | 51 | 325 | (84 | )% | ||||
| Japan Automated Loan Machines | 708 | 731 | (3 | )% | ||||
| Total | 2,377 | 2,319 | 3 | % | ||||
1Q07 vs. 1Q06
Net Interest Revenue declined, driven by lower results inJapan reflecting recent changes in the operating environment and the passage of changes to consumer lending laws in the 2006 fourth quarter. ExcludingJapan,Net Interest Revenue increased, driven by 25% growth in average loans and a stable net interest margin.Non-Interest Revenue increased primarily on higher insurance and other fees and the impact of foreign currency translation.
Operating expense decreased, primarily driven by lower expenses inJapan due to the repositioning of the business that included closing 84 branches and 101 automated loan machines during the quarter. ExcludingJapan, expenses increased reflecting higher volume related expenses, and higher investment spending driven by 29 branch openings.
Provision for loan losses increased primarily due to higher net credit losses inJapan due to legislative and other actions affecting the consumer finance industry. ExcludingJapan, increased credit costs were primarily inEMEA andAsia, driven by higher volumes, increased loan loss reserves due to portfolio growth and the absence of a prior-year release related to a portfolio sale.
The increase inaverage loans across all regions outside ofJapan was mainly driven by higher personal-loan and real-estate-secured portfolios. InJapan, average loans declined 6% due to the impact of foreign currency translation and narrowing of the target market related to the passing of changes to consumer lending laws.
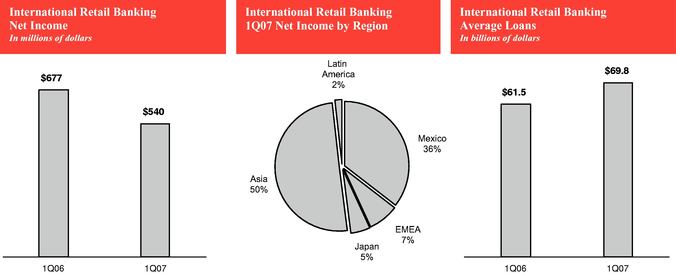
International Retail Banking delivers a wide array of banking, lending, insurance and investment services through a network of local branches and electronic delivery systems, including ATMs, call centers and the Internet.International Retail Bankingserves 4953 million customer accounts for individuals and small businesses. Revenues are primarily derived from net interest revenue on deposits and loans, and fees on mortgage, banking, and investment products.
| | First Quarter | % Change | ||||||||
|---|---|---|---|---|---|---|---|---|---|---|
In millions of dollars | ||||||||||
| 2007 | 2006 | 1Q07 vs. 1Q06 | ||||||||
| Net interest revenue | $ | 1,530 | $ | 1,439 | 6 | % | ||||
| Non-interest revenue | 1,229 | 1,028 | 20 | |||||||
| Revenues, net of interest expense | $ | 2,759 | $ | 2,467 | 12 | % | ||||
| Operating expenses | 1,750 | 1,585 | 10 | |||||||
| Provisions for loan losses and for benefits and claims | 354 | 151 | NM | |||||||
| Income before taxes and minority interest | $ | 655 | $ | 731 | (10 | )% | ||||
| Income taxes and minority interest | 115 | 54 | NM | |||||||
| Net income | $ | 540 | $ | 677 | (20 | )% | ||||
| Revenues, net of interest expense, by region: | ||||||||||
| Mexico | $ | 777 | $ | 691 | 12 | % | ||||
| Latin America | 222 | 194 | 14 | |||||||
| EMEA | 868 | 792 | 10 | |||||||
| Japan | 119 | 114 | 4 | |||||||
| Asia | 773 | 676 | 14 | |||||||
| Total revenues | $ | 2,759 | $ | 2,467 | 12 | % | ||||
| Net income by region: | ||||||||||
| Mexico | $ | 193 | $ | 199 | (3 | )% | ||||
| Latin America | 8 | 23 | (65 | ) | ||||||
| EMEA | 40 | 146 | (73 | ) | ||||||
| Japan | 27 | 32 | �� | (16 | ) | |||||
| Asia | 272 | 277 | (2 | ) | ||||||
| Total net income | $ | 540 | $ | 677 | (20 | )% | ||||
| Average assets(in billions of dollars) | $ | 132 | $ | 119 | 11 | % | ||||
| Return on assets | 1.66 | % | 2.31 | % | ||||||
| Average risk capital(1) | $ | 10,123 | $ | 9,407 | 8 | % | ||||
| Return on risk capital(1) | 22 | % | 29 | % | ||||||
| Return on invested capital(1) | 13 | % | 15 | % | ||||||
3Q06International Retail Banking (Continued)
| | First Quarter | % Change | |||||||
|---|---|---|---|---|---|---|---|---|---|
| | 2007 | 2006 | 1Q07 vs. 1Q06 | ||||||
| Key indicators:(in billions of dollars): | |||||||||
| Average deposits | $ | 154.2 | $ | 144.5 | 7 | % | |||
| AUMs (EOP) | $ | 138.9 | $ | 124.2 | 12 | % | |||
| Average loans | $ | 69.8 | $ | 61.5 | 13 | % | |||
1Q07 vs. 3Q051Q06
Net Interest Revenue increased 6% driven by 7% growth in all regions exceptEMEA. Loan balancesdeposits, and 13% growth in average loans. The deposit growth was led by Asia, which increased 3% over10%, while average loan growth was led by double-digit increases in Asia, EMEA, and Latin America. The Latin America increase includes the 2005 third quarter, as a decline inJapan was more than offset by gains across other regions. Deposits grew 9% reflecting an increase in all regions exceptJapan.impact of the acquisition of Grupo Financiero Uno.Non-Interest Revenue declined primarily due to a decreaseincreased 20% reflecting improvements inMexico that was affected all regions, driven by the absence of the 2005 third quarter value added tax refund. Investmentan increase in investment product sales increased 18% while assets under management increased 15%of 33%, led by growthan increase inAsia of 46%. Additionally, the increase was due to a $41 million pre-tax gain on the sale of MasterCard shares, and the acquisition of Akbank inEMEA.EMEA. Assets under management grew by 12%.
Operating expenses increased ondue to higher investment spending, (including 66which included 19 new branch openings during the quarter),quarter and 85 branches acquired as part of the acquisition of Grupo Financiero Uno, leading towards a net increase of 336 branches from the first quarter of 2006. Higher advertising and marketing costs and higher business volumes additionally drove an increase in expenses. The increase in 2007 was favorably affected by the absence of a 2005 third quarter $93 million value added tax refund inMexico, increases in business volumes, and higher advertising and marketing expenses.the charge related to the 2006 initial adoption of SFAS 123(R).
Provisions for loan losses and for benefits and claims declinedincreased primarily due to portfolio growth, the absence of the 2005 third2006 first quarter $476 million pretax charge to standardize the loan write-off policy in Germany and Belgium with global policies. Additionally, the decline was due to the 2006 third quarter impact of a $68 million pretax gain from the sale of charged-off assets in Germany, a $46 million pretax loan loss reserve release relatedin Korea, and increased loan loss reserves to improvementsreflect a change in estimate of loan losses inherent in the credit environmentinitial tenor portion of the portfolio. Additionally, the increase was due to lower net recoveries. The 90 days past-due ratio fell from 1.21% to 0.88%.
Net Income also reflected the absence of a 2006 first quarter tax benefit inMexico, and loan loss reserve releases in Australia and Korea.
Net income also reflected increased of $72 million related to APB 23 benefits and a 2006 first quarter $55 million benefit from tax benefits inMexico andEMEA and tax benefits of $18 millionreserve releases related to the resolution of the New YorkFederal Tax Audits, partially offset by the absence of a 2005 third quarter Homeland Investment Act tax benefit of $61 million.Audit.
Regional Net Income
Mexico income declined, primarily due todriven by the absence of a 2005 third quarter $79 million value added tax refund, the absence of a 2005 third quarter Homeland Investment Act tax benefit of $66 million, and increased investment spending associated with 19 branch openingsbenefits related to APB 23 in the 2006 thirdfirst quarter, partially offset by lower expenses that included a decrease in profit sharing, higher fee revenues, and 117 net new branches opened sincegain on the 2005 third quarter. Partly offsetting these declines were higher deposit volumes, a $30 million loan loss reserve release related to improvements in the credit environment inMexico, and APB 23 tax benefitssale of $70 million.MasterCard shares.Latin America income declined primarily due to increasedhigher expenses associated with 19 new branches openedgrowth in Brazil inand the absence of 2006 thirdfirst quarter and higher credit costs,tax benefits, partially offset by strong growth in lendingloans and deposit revenues.deposits, up 55% and 21%, respectively.EMEA income increased,declined primarily due to higher expenses driven by increased business volume and investment spending tied to retail bank branch expansion, a reserve build to reflect a change in estimate of loan losses inherent in the absenceinitial tenor portion of the 2005 third quarter $476 million pretax ($323 million after-tax) policy change related to standardizingportfolio, and lower recoveries. Partially offsetting the loan write-off policiesdecline was strong growth in Germanyloans and Belgium with global policies, a 22% increase in deposits, a 34% increase inup 16% and 9%, respectively, stronger investment product sales, and higher loan balances.the impact of foreign currency translation.Japan income declined on higher expenses, mainly due to lower average loans, higher loan loss reserve, and the consolidation and compliance activities resulting fromabsence of 2006 first quarter benefit related to the shutdownresolution of the Japan Private Bank.Federal Tax Audit.Asia income declined primarily due to increased investment spending, partly offset by loan loss reserve releases in Australia and Korea, a 7% increase in deposits, higher loan balances, and higher investment product sales.
2006 YTD vs. 2005 YTD
Net Interest Revenue increased 2%, reflecting increases in all regions exceptEMEA. Loan balances were flat over the prior-year period on declines inEMEA from write-offs in Germany in the third quarter of 2005. Deposits grew 9% reflecting an increase in all regions exceptJapan.Non-Interest Revenue increased 11%, primarily due to improvements inEMEA,Latin America, andAsia, partially offset by a decrease inMexico which was affected by the absence of the 2005 thirda 2006 first quarter value added tax refund. Investment product sales increased 18% while assets under management increased 19%, led by growth inMexico andAsia.
Operating expenses increased due to the impact of the 2005 third quarter value added tax refund effect on expenses inMexico, SFAS 123(R) charges and an increase in compensation costs inMexico. Additionally, the increase was due to higher marketing and advertising spending, higher business volumes, costs associated with a labor settlement in Korea, and continued investments, which included 223 new branch additions in the 2006 nine-month period.
Provisions for loan losses and for benefits and claims declined due to the absence of the 2005 third quarter $476 million pretax credit policy change to standardize the loan write-off policy in Germany and Belgium and the 2005 second quarter increase in the Germany credit reserve to reflect increased experience with the effects of bankruptcy law liberalization of $127 million pretax. Additionally, the decrease was due to a $68 million gain from the sale of charged-off assets in Germany, a $53 million pretax loan loss reserve release related to improvements in the credit environment inMexico, and loan loss reserve releases in Korea, and Australia asincreased loan loss reserves to reflect a resultchange in estimate of an improving credit environment.loan losses inherent in the initial tenor portion of the portfolio, and increased investment spending related to retail bank branch expansion. Partially offsetting the decline was the absence of a 2005 second quarterMexico reserve release of $80 million, which was offsetstrong growth in revenues.
Net income also reflected higher tax benefits inMexicoloans andAsia related to increased APB 23 benefits, a 2006 first quarter $55 million benefit from the resolution of the Federal Tax Audit, deposits, up 14% and 10%, respectively, and an $18 million benefit related to the resolutionincrease in investment product sales of the New York Tax Audits.46%.
International Retail Banking (Continued)
Regional Net Income
Mexico income declined slightly, primarily due to the absence of a $79 million 2005 third quarter value added tax refund, higher expenses from increased investment spending associated with new branch openings, and the absence of a $50 million 2005 second quarter gain from the favorable impact relating to a restructuring of Mexican government notes. Latin America income declined primarily due to increased expenses associated with new branches in Brazil, partly offset by growth in loan, deposit and investment revenues.EMEA income increased, driven primarily by the absence of the 2005 third quarter policy change of standardizing the loan write-off policy, the absence of an $81 million loan loss reserve build from the 2005 second quarter, stronger investment product sales, and higher Germany asset sales; these were partly offset by higher expenses from branch expansion.Japan income declined due to lower deposits, higher expenses (mainly due to the consolidation and compliance activities related to the shutdown of the Japan Private Bank) and the impact of foreign currency translation.Asia income increased, benefiting from higher deposit revenues and investment product sales and loan loss reserve releases in Korea and Australia, partially offset by increased investment spending tied to retail bank branch expansion and costs associated with the labor settlement.
Other Consumer
Other Consumer includes certain treasury and other unallocated staff functions and global marketing.
| | Three Months Ended September 30, | Nine Months Ended September 30, | |||||||||||
|---|---|---|---|---|---|---|---|---|---|---|---|---|---|
| In millions of dollars | 2006 | 2005 | 2006 | 2005 | |||||||||
| Revenues, net of interest expense | $ | (37 | ) | $ | (13 | ) | $ | (70 | ) | $ | (234 | ) | |
| Operating expenses | 121 | 87 | 415 | 249 | |||||||||
| Income (loss) before tax benefits | $ | (158 | ) | $ | (100 | ) | (485 | ) | (483 | ) | |||
| Income taxes (benefits) | (77 | ) | (36 | ) | (245 | ) | (185 | ) | |||||
| Net income (loss) | $ | (81 | ) | $ | (64 | ) | $ | (240 | ) | $ | (298 | ) | |
3Q06 vs. 3Q05
| | First Quarter | ||||||
|---|---|---|---|---|---|---|---|
In millions of dollars | |||||||
| 2007 | 2006 | ||||||
| Net interest revenue | $ | (30 | ) | $ | (47 | ) | |
| Non-interest revenue | 34 | 33 | |||||
| Revenues, net of interest expense | $ | 4 | $ | (14 | ) | ||
| Operating expenses | 155 | 167 | |||||
| Income (loss) before tax benefits | $ | (151 | ) | $ | (181 | ) | |
| Income taxes (benefits) | (66 | ) | (114 | ) | |||
| Net income (loss) | $ | (85 | ) | $ | (67 | ) | |
Revenues andexpenses reflect certain unallocated items that are not reported in the Global Consumer operating segments.
Thenet loss increase was primarily due to higher staff payments, higher legal costs, and lower revenues, partially offset by lower advertising and marketing expenses.
2006 YTD vs. 2005 YTD
Thenet loss decrease was primarily due to the absence of the 2005 first quarter loss on the sale of a Manufactured Housing loan portfolio of $109 million after-tax and the 2006 first quarter tax benefit of $40 million reflecting the resolution of the Federal Tax Audit, partially offset by SFAS 123(R) charges of $22 million after-taxhigher treasury results and higher staff payments and legal costs.lower unallocated expenses.
CORPORATE AND INVESTMENTMARKETS & BANKING
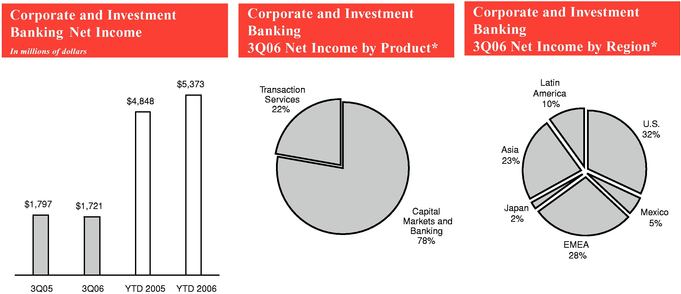 | ||||
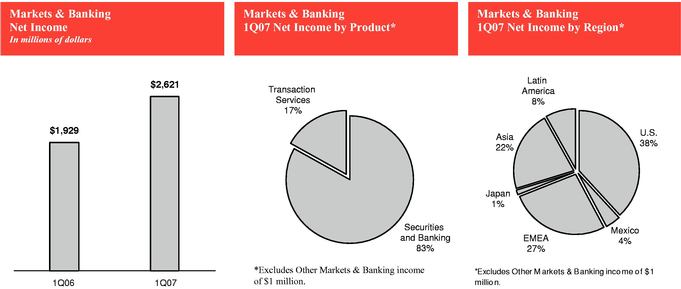
CorporateMarkets & Banking provides a broad range of trading, investment banking, and Investment Banking (CIB) provides corporations,commercial lending products and services to companies, governments, institutions and investors in approximately 100 countries with a broad range of financial products and services. CIBcountries. Markets & Banking includesCapital MarketsSecurities and Banking,Transaction Services andOther CIB.Markets & Banking.
| | | Three Months Ended September 30, | % Change | Nine Months Ended September 30, | % Change | | First Quarter | % Change | ||||||||||||||||||||
|---|---|---|---|---|---|---|---|---|---|---|---|---|---|---|---|---|---|---|---|---|---|---|---|---|---|---|---|---|
In millions of dollars | In millions of dollars | |||||||||||||||||||||||||||
| In millions of dollars | 2006 | 2005 | 3Q06 vs. 3Q05 | 2006 | 2005 | YTD06 vs. YTD05 | 2007 | 2006 | 1Q07 vs. 1Q06 | |||||||||||||||||||
| Net interest revenue | Net interest revenue | $ | 1,913 | $ | 1,916 | — | $ | 6,294 | $ | 6,087 | 3 | % | Net interest revenue | $ | 2,452 | $ | 2,234 | 10 | % | |||||||||
| Non-interest revenue | Non-interest revenue | 4,154 | 4,518 | (8 | )% | 13,813 | 11,540 | 20 | Non-interest revenue | 6,505 | 5,045 | 29 | ||||||||||||||||
| Revenues, net of interest expense | Revenues, net of interest expense | $ | 6,067 | $ | 6,434 | (6 | )% | $ | 20,107 | $ | 17,627 | 14 | % | Revenues, net of interest expense | $ | 8,957 | $ | 7,279 | 23 | % | ||||||||
| Operating expenses | Operating expenses | 3,622 | 3,856 | (6 | ) | 12,537 | 10,892 | 15 | Operating expenses | 5,111 | 4,757 | 7 | ||||||||||||||||
| Provision for credit losses | Provision for credit losses | 107 | 43 | NM | 280 | (27 | ) | NM | Provision for credit losses | 263 | — | NM | ||||||||||||||||
| Income before taxes and minority interest | Income before taxes and minority interest | $ | 2,338 | $ | 2,535 | (8 | )% | $ | 7,290 | $ | 6,762 | 8 | % | Income before taxes and minority interest | $ | 3,583 | $ | 2,522 | 42 | % | ||||||||
| Income taxes | Income taxes | 598 | 704 | (15 | ) | 1,874 | 1,859 | 1 | Income taxes | 947 | 574 | 65 | ||||||||||||||||
| Minority interest, net of taxes | Minority interest, net of taxes | 19 | 34 | (44 | ) | 43 | 55 | (22 | ) | Minority interest, net of taxes | 15 | 19 | (21 | ) | ||||||||||||||
| Net income | Net income | $ | 1,721 | $ | 1,797 | (4 | )% | $ | 5,373 | $ | 4,848 | 11 | % | Net income | $ | 2,621 | $ | 1,929 | 36 | % | ||||||||
| Revenues, net of interest expense, by region: | Revenues, net of interest expense, by region: | Revenues, net of interest expense, by region: | ||||||||||||||||||||||||||
| U.S. | $ | 2,007 | $ | 2,810 | (29 | )% | $ | 7,733 | $ | 7,537 | 3 | % | U.S. | $ | 3,714 | $ | 2,923 | 27 | % | |||||||||
| Mexico | 197 | 236 | (17 | ) | 582 | 565 | 3 | Mexico | 227 | 186 | 22 | |||||||||||||||||
| Latin America | 440 | 372 | 18 | 1,271 | 1,064 | 19 | Latin America | 573 | 446 | 28 | ||||||||||||||||||
| EMEA | 2,166 | 1,801 | 20 | 6,505 | 5,203 | 25 | EMEA | 2,827 | 2,296 | 23 | ||||||||||||||||||
| Japan | 177 | 211 | (16 | ) | 742 | 578 | 28 | Japan | 212 | 296 | (28 | ) | ||||||||||||||||
| Asia | 1,080 | 1,004 | 8 | 3,274 | 2,680 | 22 | Asia | 1,404 | 1,132 | 24 | ||||||||||||||||||
| Total revenues | Total revenues | $ | 6,067 | $ | 6,434 | (6 | )% | $ | 20,107 | $ | 17,627 | 14 | % | Total revenues | $ | 8,957 | $ | 7,279 | 23 | % | ||||||||
| Net income by region: | Net income by region: | Net income by region: | ||||||||||||||||||||||||||
| U.S. | $ | 540 | $ | 637 | (15 | )% | $ | 1,802 | $ | 1,992 | (10 | )% | U.S. | $ | 999 | $ | 515 | 94 | % | |||||||||
| Mexico | 95 | 177 | (46 | ) | 261 | 336 | (22 | ) | Mexico | 114 | 78 | 46 | ||||||||||||||||
| Latin America | 168 | 185 | (9 | ) | 508 | 525 | (3 | ) | Latin America | 218 | 202 | 8 | ||||||||||||||||
| EMEA | 489 | 358 | 37 | 1,466 | 882 | 66 | EMEA | 694 | 635 | 9 | ||||||||||||||||||
| Japan | 38 | 58 | (34 | ) | 195 | 160 | 22 | Japan | 35 | 85 | (59 | ) | ||||||||||||||||
| Asia | 391 | 382 | 2 | 1,141 | 953 | 20 | Asia | 561 | 414 | 36 | ||||||||||||||||||
| Total net income | Total net income | $ | 1,721 | $ | 1,797 | (4 | )% | $ | 5,373 | $ | 4,848 | 11 | % | Total net income | $ | 2,621 | $ | 1,929 | 36 | % | ||||||||
| Average risk capital(1) | Average risk capital(1) | $ | 21,967 | $ | 21,383 | 3 | % | $ | 21,438 | $ | 21,086 | 2 | % | Average risk capital(1) | $ | 24,143 | $ | 20,593 | 17 | % | ||||||||
| Return on risk capital(1) | Return on risk capital(1) | 31 | % | 33 | % | 34 | % | 31 | % | Return on risk capital(1) | 44 | % | 38 | % | ||||||||||||||
| Return on invested capital(1) | Return on invested capital(1) | 23 | % | 25 | % | 25 | % | 23 | % | Return on invested capital(1) | 33 | % | 28 | % | ||||||||||||||
Capital MarketsSecurities and Banking
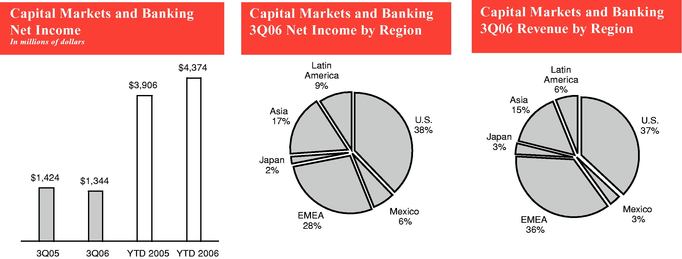

| | Three Months Ended September 30, | % Change | Nine Months Ended September 30, | % Change | ||||||||||||||
|---|---|---|---|---|---|---|---|---|---|---|---|---|---|---|---|---|---|---|
| In millions of dollars | 2006 | 2005 | 3Q06 vs. 3Q05 | 2006 | 2005 | YTD06 vs. YTD05 | ||||||||||||
| Net interest revenue | $ | 1,139 | $ | 1,317 | (14 | )% | $ | 4,118 | $ | 4,435 | (7 | )% | ||||||
| Non-interest revenue | 3,428 | 3,870 | (11 | ) | 11,614 | 9,616 | 21 | |||||||||||
| Revenues, net of interest expense | $ | 4,567 | $ | 5,187 | (12 | )% | $ | 15,732 | $ | 14,051 | 12 | % | ||||||
| Operating expenses | 2,655 | 3,134 | (15 | ) | 9,612 | 8,578 | 12 | |||||||||||
| Provision for credit losses | 98 | 40 | NM | 250 | (26 | ) | NM | |||||||||||
| Income before taxes and minority interest | $ | 1,814 | $ | 2,013 | (10 | )% | $ | 5,870 | $ | 5,499 | 7 | % | ||||||
| Income taxes | 452 | 555 | (19 | ) | 1,454 | 1,539 | (6 | ) | ||||||||||
| Minority interest, net of taxes | 18 | 34 | (47 | ) | 42 | 54 | (22 | ) | ||||||||||
| Net income | $ | 1,344 | $ | 1,424 | (6 | )% | $ | 4,374 | $ | 3,906 | 12 | % | ||||||
| Revenues, net of interest expense, by region: | ||||||||||||||||||
| U.S. | $ | 1,689 | $ | 2,550 | (34 | )% | $ | 6,776 | $ | 6,807 | — | |||||||
| Mexico | 143 | 188 | (24 | ) | 432 | 420 | 3 | % | ||||||||||
| Latin America | 284 | 236 | 20 | 808 | 682 | 18 | ||||||||||||
| EMEA | 1,630 | 1,363 | 20 | 4,945 | 3,897 | 27 | ||||||||||||
| Japan | 150 | 190 | (21 | ) | 662 | 518 | 28 | |||||||||||
| Asia | 671 | 660 | 2 | 2,109 | 1,727 | 22 | ||||||||||||
| Total revenues | $ | 4,567 | $ | 5,187 | (12 | )% | $ | 15,732 | $ | 14,051 | 12 | % | ||||||
| Net income by region: | ||||||||||||||||||
| U.S. | $ | 508 | $ | 571 | (11 | )% | $ | 1,774 | $ | 1,846 | (4 | )% | ||||||
| Mexico | 75 | 151 | (50 | ) | 213 | 275 | (23 | ) | ||||||||||
| Latin America | 120 | 142 | (15 | ) | 356 | 403 | (12 | ) | ||||||||||
| EMEA | 375 | 262 | 43 | 1,141 | 634 | 80 | ||||||||||||
| Japan | 33 | 56 | (41 | ) | 179 | 152 | 18 | |||||||||||
| Asia | 233 | 242 | (4 | ) | 711 | 596 | 19 | |||||||||||
| Total net income | $ | 1,344 | $ | 1,424 | (6 | )% | $ | 4,374 | $ | 3,906 | 12 | % | ||||||
| Average risk capital(1) | $ | 20,450 | $ | 20,143 | 2 | % | $ | 19,915 | $ | 19,727 | 1 | % | ||||||
| Return on risk capital(1) | 26 | % | 28 | % | 29 | % | 26 | % | ||||||||||
| Return on invested capital(1) | 19 | % | 21 | % | 22 | % | 20 | % | ||||||||||
Capital Markets and Banking (Continued)
Capital MarketsSecurities and Banking offers a wide array of investment and commercial banking services and products, including investment banking and advisory services, debt and equity trading, institutional brokerage, foreign exchange, structured products, derivatives, and lending.Capital MarketsSecurities and Banking revenue is generated primarily from fees for investment banking and advisory services, fees and spread on structured products, foreign exchange and derivatives, fees and interest on loans, and income earned on principal transactions.
| | First Quarter | % Change | ||||||||
|---|---|---|---|---|---|---|---|---|---|---|
In millions of dollars | ||||||||||
| 2007 | 2006 | 1Q07 vs. 1Q06 | ||||||||
| Net interest revenue | $ | 1,614 | $ | 1,571 | 3 | % | ||||
| Non-interest revenue | 5,699 | 4,325 | 32 | |||||||
| Revenues, net of interest expense | $ | 7,313 | $ | 5,896 | 24 | % | ||||
| Operating expenses | 4,059 | 3,803 | 7 | |||||||
| Provision for credit losses | 258 | (5 | ) | NM | ||||||
| Income before taxes and minority interest | $ | 2,996 | $ | 2,098 | 43 | % | ||||
| Income taxes | 812 | 461 | 76 | |||||||
| Minority interest, net of taxes | 11 | 19 | (42 | ) | ||||||
| Net income | $ | 2,173 | $ | 1,618 | 34 | % | ||||
| Revenues, net of interest expense, by region: | ||||||||||
| U.S. | $ | 3,382 | $ | 2,610 | 30 | % | ||||
| Mexico | 166 | 138 | 20 | |||||||
| Latin America | 399 | 300 | 33 | |||||||
| EMEA | 2,229 | 1,808 | 23 | |||||||
| Japan | 182 | 271 | (33 | ) | ||||||
| Asia | 955 | 769 | 24 | |||||||
| Total revenues | $ | 7,313 | $ | 5,896 | 24 | % | ||||
| Net income by region: | ||||||||||
| U.S. | $ | 966 | $ | 515 | 88 | % | ||||
| Mexico | 91 | 64 | 42 | |||||||
| Latin America | 161 | 151 | 7 | |||||||
| EMEA | 546 | 530 | 3 | |||||||
| Japan | 27 | 80 | (66 | ) | ||||||
| Asia | 382 | 278 | 37 | |||||||
| Total net income | $ | 2,173 | $ | 1,618 | 34 | % | ||||
| Average risk capital(1) | $ | 22,701 | $ | 19,123 | 19 | % | ||||
| Return on risk capital(1) | 39 | % | 34 | % | ||||||
| Return on invested capital(1) | 30 | % | 26 | % | ||||||
3Q06Securities and Banking (Continued)
| | First Quarter | % Change | |||||||||||
|---|---|---|---|---|---|---|---|---|---|---|---|---|---|
| In millions of dollars | 2007 | 2006 | 1Q07 vs. 1Q06 | ||||||||||
| Revenue details: | |||||||||||||
| Investment banking: | |||||||||||||
| Advisory and other fees | $ | 429 | $ | 295 | 45 | % | |||||||
| Equity underwriting | 523 | 286 | 83 | ||||||||||
| Debt underwriting | 813 | 713 | 14 | ||||||||||
| Gross Investment Banking | $ | 1,765 | $ | 1,294 | 36 | % | |||||||
Revenue allocated to the Global Wealth Management Segment: | |||||||||||||
| Equity underwriting | $ | (136 | ) | $ | (42 | ) | NM | ||||||
| Debt underwriting | (34 | ) | (36 | ) | 6 | % | |||||||
| Total investment banking revenue | $ | 1,595 | $ | 1,216 | 31 | % | |||||||
| Lending | 561 | 411 | 36 | ||||||||||
| Equity markets | 1,483 | 1,179 | 26 | ||||||||||
| Fixed income markets | 3,771 | 3,148 | 20 | ||||||||||
| Other Securities and Banking(1) | (97 | ) | (58 | ) | (67 | ) | |||||||
| Total Securities and Banking Revenue, net of interest expense(1) | $ | 7,313 | $ | 5,896 | 24 | % | |||||||
1Q07 vs. 3Q051Q06
Revenues,net of interest expense, declined on weakerincreased, driven by broad-based volume improvements across products and regions and by the $402 million benefit of the SFAS 157 accounting adoption. Equity Markets revenues increased, driven by strong growth globally, including cash trading, derivatives products, equity finance and prime brokerage. Fixed Income Markets revenues, primarilyrevenue increases were driven by lowerimproved results in commodities,across all products, including interest rate productsrates and foreign exchange. Equity Markets revenues were approximately even with the prior-year period, as improved performance in derivativescurrencies, and equity finance was offset by lower results in convertiblescredit and cash trading.securitized products. Investment Banking revenues were approximately even with the prior-year period, asrevenue growth in debtwas driven by higher equity underwriting revenues and increased advisory fees were offset by a decline in equity underwriting.and other fees.
Operating Expensesexpenses were down, reflecting lower production-based incentive compensation accruals, as well asgrowth was primarily driven by increased staffing and higher business volumes. The growth in 2007 was favorably affected by the absence of a reversal$346 million charge related to the 2006 initial adoption of payroll tax accruals previously recorded.SFAS 123(R).
TheThe provision for credit losses increased driven bydue to a $118net charge of $286 million pretax charge to increase loan loss reserves. The increase in loan loss reserves reflectingwas driven by portfolio growth, which includes higher commitments to leveraged transactions and a changean increase in credit rating of certain counterparties.average loan tenor.
Regional Net Income
Net income in theU.S. declined, primarily due to lower Fixed Income Markets and Equity Markets revenues, as well as lower Lending Revenues, partially offsetincreased, driven by a decrease in compensation expenses (lower production-driven incentive compensation).
Mexico net income was down due to lower Equity Underwriting and Lending revenues. Lower net income also reflected the absence of a $39 million tax benefit from provisions of the Homeland Investment Act as well as a $9 million VAT refund recorded in the prior-year period.
Latin America net income declined on higher investment spending and increased credit costs from lower net recoveries and a loan loss reserve release recorded in the prior-year period. The increased expenses were partially offset bydouble-digit revenue growth in Fixed Income Markets and Underwriting and Equity Markets and Investment Banking.Underwriting as well as Advisory. Compensation expenses were almost flat to last year due to the absence of the 2006 initial adoption of SFAS 123(R).
EMEAMexico net income increased, driven by double-digit revenue growth across several products, including Fixed Income and Equity Markets and Investment Banking.
Net income inJapan declined on lower results in Fixed Income and Equity Markets.
Net income inAsia decreased due to lower results in Equity Markets.
2006 YTD vs. 2005 YTD
Revenues,net of interest expense, increased, driven by broad-based performance across products and regions. Fixed Income Markets revenue increases reflected growth in emerging markets trading, municipals, foreign exchange and credit products. Equity Markets revenues increased, driven by strong growth globally, including cash trading, derivatives products and convertibles. Investment Banking revenue growth was driven by higher debt underwriting revenues and increased advisory fees. Lending revenue declined, as improved credit conditions led to lower hedging results.
Operating expenses were impacted by $589 million of SFAS 123(R) charges and higher production-related incentive compensation, as well as a growth in headcount.
Theprovision for credit losses increased, driven by a $372 million pretax charge to increase loan loss reserves, reflecting growth in loans and unfunded loan commitments and an update to historical data used for certain loss estimates.
Regional Net Income
Net income in theU.S. declined, primarily due to higher compensation expenses (the impact from SFAS 123(R) charges), as well as lower revenues in Commodities and Lending, partially offset by higher Fixed Income and Equity Markets revenues and tax benefits from the resolution of the Federal Tax Audit.
Mexico net income was down, as growth in Fixed Income Markets revenues was partially offset by lowerand equity underwriting and lending revenues. Lower net income also reflected the absence of a $39 million tax benefit from provisions of the Homeland Investment Act, as well as a $9 million VAT refund, higher compensation expense and the absence of loan loss recoveries recorded in the prior-year period.underwriting.
Latin America net income declined on higher investment spending, an increaseincreased, driven by double-digit revenue growth in credit costs (in comparison to the loan loss recoveries recorded in the prior-year period)Fixed Income and the impact of SFAS 123(R) charges. These decreases wereEquity Markets. Revenue growth was partially offset by strong revenue growth in Equity and Fixed Income Markets in Brazil Investment Banking and byhigher taxes due to the absence of prior-year tax benefits from the resolution of the Federal Tax Audit.
EMEA net income increased, ondriven by strong double-digit revenue growth across all major product lines and geographies fromon higher volumes and growth in customer activityactivity. Results also include a $171 million pre-tax increase to loan loss reserves due to portfolio growth, which includes higher commitments to leveraged transactions and tax benefits from the resolution of the Federal Tax Audit. Thean increase in net income was partially offset by higher compensation expense due to staff additions and the impact from SFAS 123(R) charges, and higher credit costs on growth in loans and unfundedaverage loan commitments.tenor.
Net income inJapan increaseddeclined primarily due to strong growthlower results in Fixed Income partially offset by a decrease in equities,Markets and higher expenses.
Equity Underwriting. Net income inAsia increased, driven by broad-based double-digit revenue growth across several products, including Fixed Incomein Investment Banking and Equity Markets and Advisory. The tax benefits from the resolution of the Federal Tax Audit were partially offset by the impact from SFAS 123(R) charges.Lending.
Transaction Services
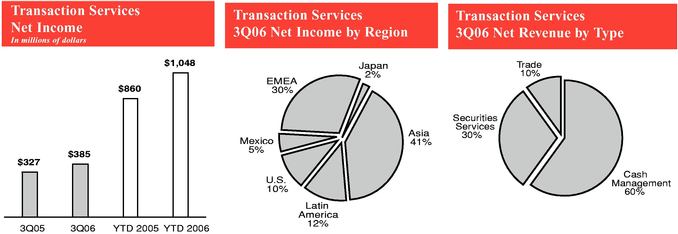
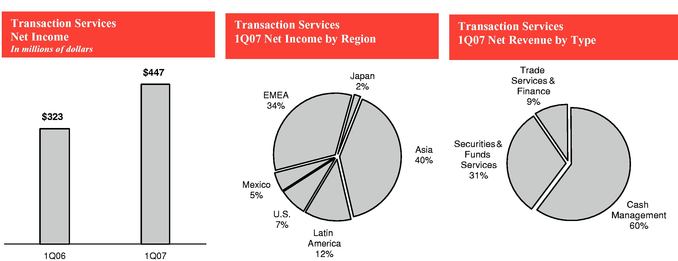
| | Three Months Ended September 30, | % Change | Nine Months Ended September 30, | % Change | ||||||||||||||
|---|---|---|---|---|---|---|---|---|---|---|---|---|---|---|---|---|---|---|
| In millions of dollars | 2006 | 2005 | 3Q06 vs. 3Q05 | 2006 | 2005 | YTD06 vs. YTD05 | ||||||||||||
| Net interest revenue | $ | 774 | $ | 599 | 29 | % | $ | 2,176 | $ | 1,652 | 32 | % | ||||||
| Non-interest revenue | 726 | 647 | 12 | 2,201 | 1,922 | 15 | ||||||||||||
| Revenues, net of interest expense | $ | 1,500 | $ | 1,246 | 20 | % | $ | 4,377 | $ | 3,574 | 22 | % | ||||||
| Operating expenses | 954 | 809 | 18 | 2,892 | 2,392 | 21 | ||||||||||||
| Provision for credit losses | 9 | 6 | 50 | 30 | (1 | ) | NM | |||||||||||
| Income before taxes and minority interest | $ | 537 | $ | 431 | 25 | % | $ | 1,455 | $ | 1,183 | 23 | % | ||||||
| Income taxes | 151 | 104 | 45 | 406 | 322 | 26 | ||||||||||||
| Minority interest, net of taxes | 1 | — | — | 1 | 1 | — | ||||||||||||
| Net income | $ | 385 | $ | 327 | 18 | % | $ | 1,048 | $ | 860 | 22 | % | ||||||
| Revenues, net of interest expense, by region: | ||||||||||||||||||
| U.S. | $ | 317 | $ | 258 | 23 | % | $ | 954 | $ | 729 | 31 | % | ||||||
| Mexico | 54 | 48 | 13 | 150 | 145 | 3 | ||||||||||||
| Latin America | 156 | 137 | 14 | 463 | 381 | 22 | ||||||||||||
| EMEA | 537 | 438 | 23 | 1,560 | 1,306 | 19 | ||||||||||||
| Japan | 27 | 21 | 29 | 80 | 60 | 33 | ||||||||||||
| Asia | 409 | 344 | 19 | 1,170 | 953 | 23 | ||||||||||||
| Total revenues | $ | 1,500 | $ | 1,246 | 20 | % | $ | 4,377 | $ | 3,574 | 22 | % | ||||||
| Net income by region: | ||||||||||||||||||
| U.S. | $ | 38 | $ | 22 | 73 | % | $ | 71 | $ | 63 | 13 | % | ||||||
| Mexico | 20 | 26 | (23 | ) | 52 | 60 | (13 | ) | ||||||||||
| Latin America | 48 | 39 | 23 | 148 | 121 | 22 | ||||||||||||
| EMEA | 115 | 97 | 19 | 327 | 250 | 31 | ||||||||||||
| Japan | 6 | 3 | 100 | 17 | 9 | 89 | ||||||||||||
| Asia | 158 | 140 | 13 | 433 | 357 | 21 | ||||||||||||
| Total net income | $ | 385 | $ | 327 | 18 | % | $ | 1,048 | $ | 860 | 22 | % | ||||||
| Average risk capital(1) | $ | 1,517 | $ | 1,240 | 22 | % | $ | 1,523 | $ | 1,359 | 12 | % | ||||||
| Return on risk capital(1) | 101 | % | 105 | % | 92 | % | 85 | % | ||||||||||
| Return on invested capital(1) | 57 | % | 56 | % | 52 | % | 47 | % | ||||||||||
| Key indicators: | ||||||||||||||||||
| Liability balances(average in billions of dollars) | $ | 180 | $ | 147 | 22 | % | ||||||||||||
| Assets under custody at period end(in trillions of dollars) | 9.6 | 8.4 | 14 | % | ||||||||||||||
Transaction Services (Continued)
Transaction Services comprisesis comprised of Cash Management, Trade Services & Finance (Trade) and Securities & FundsFund Services (SFS). Cash Management and Trade Services provide comprehensive cash management and trade finance for corporations and financial institutions worldwide. SFS provides custody and fund services to investors such as insurance companies and pension funds, clearing services to intermediaries such as broker/dealers,broker-dealers, and depository and agency/trust services to multinationalmulti-national corporations and governments globally. Revenue is generated from fees for transaction processing, net interest revenue on Trade Services loans and deposits in Cash Management and SFS, and fees on assets under custody in SFS.
| | First Quarter | % Change | ||||||||
|---|---|---|---|---|---|---|---|---|---|---|
| In millions of dollars | 2007 | 2006 | 1Q07 vs. 1Q06 | |||||||
| Net interest revenue | $ | 838 | $ | 663 | 26 | % | ||||
| Non-interest revenue | 807 | 719 | 12 | |||||||
| Revenues, net of interest expense | $ | 1,645 | $ | 1,382 | 19 | % | ||||
| Operating expenses | 1,037 | 949 | 9 | |||||||
| Provision for credit losses | 5 | 5 | — | |||||||
| Income before taxes and minority interest | $ | 603 | $ | 428 | 41 | % | ||||
| Income taxes | 152 | 105 | 45 | |||||||
| Minority interest, net of taxes | 4 | — | NM | |||||||
| Net income | $ | 447 | $ | 323 | 38 | % | ||||
| Revenues, net of interest expense, by region: | ||||||||||
| U.S. | $ | 333 | $ | 312 | 7 | % | ||||
| Mexico | 61 | 48 | 27 | |||||||
| Latin America | 174 | 146 | 19 | |||||||
| EMEA | 598 | 488 | 23 | |||||||
| Japan | 30 | 25 | 20 | |||||||
| Asia | 449 | 363 | 24 | |||||||
| Total revenues | $ | 1,645 | $ | 1,382 | 19 | % | ||||
| Net income by region: | ||||||||||
| U.S. | $ | 33 | $ | 12 | NM | |||||
| Mexico | 23 | 14 | 64 | % | ||||||
| Latin America | 54 | 51 | 6 | |||||||
| EMEA | 150 | 105 | 43 | |||||||
| Japan | 8 | 5 | 60 | |||||||
| Asia | 179 | 136 | 32 | |||||||
| Total net income | $ | 447 | $ | 323 | 38 | % | ||||
| Average risk capital(1) | $ | 1,442 | $ | 1,470 | (2 | )% | ||||
| Return on risk capital(1) | 126 | % | 89 | % | ||||||
| Return on invested capital(1) | 67 | % | 50 | % | ||||||
3Q06Transaction Services (Continued)
| | First Quarter | % Change | |||||||
|---|---|---|---|---|---|---|---|---|---|
| | 2007 | 2006 | 1Q07 vs. 1Q06 | ||||||
| Key indicators: | |||||||||
| Average deposits and other customer liability balances(in billions of dollars) | $ | 213 | $ | 170 | 25 | % | |||
| Assets under custody at year-end(in trillions of dollars) | 10.7 | 8.8 | 22 | % | |||||
| Revenue details(in millions of dollars): | |||||||||
| Cash management | $ | 981 | $ | 792 | 24 | % | |||
| Securities and funds services | $ | 507 | $ | 438 | 16 | % | |||
| Trade services & finance | $ | 157 | $ | 152 | 3 | % | |||
| Total revenue, net of interest expense | $ | 1,645 | $ | 1,382 | 19 | % | |||
1Q07 vs. 3Q051Q06
Revenues, net of interest expense, increased, reflecting growth in liability balances, growth in assets under custody, and higher volumesrising interest rates in Cash Management and interest rates.SFS. Average liability balances grew 22%25% to $180$213 billion in the thirdfirst quarter primarily on increases inEMEA andAsia,due to growth across all regions, reflecting higher volumespositive flow from new and existing customers.
Cash Management revenue increased, reflecting growth across all regions, exceptMexico. The growth was attributable to higher liability balances, increased volumes, rising interest rates, and increased revenues from new sales.
Securities & Funds Services revenue increased, reflecting growth across allmost regions exceptMexico. The increase was driven bywith record new sales, increased liability balances, higher assets under custody, increased volumes, higher interest rates, new sales, and the impact of acquisitions.transaction volumes. Assets under custodyCustody reached $9.6$10.7 trillion, an increase of $1.2$1.9 trillion, or 14%22%, on strongcontinued momentum from new sales equity markets, and the inclusion of UNISEN assets under custody.as well as global markets.
Trade revenues increased, reflecting growth inEMEA.Services & Finance This wasrevenue increased primarily due to growth in Asia Pacific, partially offset by a decline inEMEA andLatin America.
The change in theprovision for credit lossesAmerica was $3 million..
Operating expenses increased due to increased volumes, organic business growth, investment spending, and acquisitions.
Cash-basis loans, which are primarily trade finance receivables, were $34 million and $65 million at Sep 30, 2006 and 2005, respectively. The decrease of $31 million was primarily due to declines inMexico.
Regional Net Income
Net income in theU.S. increased, primarily due to revenue growth, partially offset by higher expenses from continued investment spending and acquisitions.
Mexico net income declined, primarily due to the impact of taxes, partially offset by rising interest rates and growth in liability balances and assets under custody.
Latin America net income increased primarily due to growth in liability balances and assets under custody, rising interest rates, and increased revenue from new sales.
EMEA net income increased primarily from increases in liability balances and assets under custody, higher interest rates, increased revenue from new sales, and strong volumes, which drove growth in Cash Management, SFS, and Trade.
Asia net income increased primarily due to growth in liability balances and assets under custody, rising interest rates, higher customer volumes, and increased revenue from new sales.
Japan net income increased on growth in liability balances and assets under custody, increased revenue from new sales, and rising interest rates.
2006 YTD vs. 2005 YTD
Revenues, net of interest expense, increased, reflecting continued growth in customer liabilities and assets under custody. In addition, higher interest rates, increased volumes, and higher sales contributed to the growth.
Cash Management's revenue reflected growth across all regions exceptMexico. The growth was a result of higher liability balances, volumes and new sales. Higher interest rates also contributed to the revenue increase.
Securities & Funds Services experienced growth in revenues across all regions exceptMexico. This was attributable to higher assets under custody, higher volumes, higher interest rates, and the impact of acquisitions. Assets under custody reached $9.6 trillion, an increase of $1.2 trillion, or 14%, on strong momentum from record sales, equity markets, and the inclusion of ABN Amro and UNISEN assets under custody.
Trade revenues increased, principally driven by growth inEMEA and theU.S. This was partially offset by theLatin America region.
The change in theprovision for credit losses of $31 million was primarily attributable to a reserve build of $28 million in 2006.
Operating expenses increased on organic business growth, acquisitions, and investment spending.
Regional Net Income
Net income in theU.S. increased, primarily due to revenue growth, growth in liability balances and rising interest rates, resolution of the Federal Tax Audit and the absence of a severance charge in the prior year, partially offset by continued investment spending.rates.
Mexico net income declinedincreased primarily on higher taxes and expenses, partially offset bydue to growth in liability balances and rising interest rates.
Latin America net income increased primarily ondue to increased revenues from new sales, growth in liability balances and rising interest rates and the resolution of the Federal Tax Audit.rates.
EMEA net income increased primarily due to increased revenue from new sales, growth in liability balances and assets under custody, rising interest rates and strong volumes, which drove growth in Cash Management, SFS, and Trade. The resolution of the Federal Tax Audit also contributed positively to the region's results.Trade Services.
Asia net income increased primarily on higherdue to increased revenue from new sales, higher customer volumes, and growth in liability balances and assets under custody and rising interest rates, and the resolution of the Federal Tax Audit.rates.
Japan net income increased primarily due to increased revenue from new sales, growth in liability balances and assets under custody, and rising interest rates.
Other CIBMarkets & Banking
Other CIBMarkets & Banking includes offsets to certain line items reported in other CIBMarkets & Banking segments, certain non-recurring items and tax amounts not allocated to CIBMarkets & Banking products.
| | Three Months Ended September 30, | Nine Months Ended September 30, | |||||||||||
|---|---|---|---|---|---|---|---|---|---|---|---|---|---|
| In millions of dollars | 2006 | 2005 | 2006 | 2005 | |||||||||
| Revenues, net of interest expense | $ | — | $ | 1 | $ | (2 | ) | $ | 2 | ||||
| Operating expenses | 13 | (87 | ) | 33 | (78 | ) | |||||||
| Provision for credit losses | — | (3 | ) | — | — | ||||||||
| Income (loss) before income taxes (benefits) | $ | (13 | ) | $ | 91 | $ | (35 | ) | $ | 80 | |||
| Income taxes (benefits) | (5 | ) | 45 | 14 | (2 | ) | |||||||
| Net income (loss) | $ | (8 | ) | $ | 46 | $ | (49 | ) | $ | 82 | |||
3Q06 vs. 3Q05
Net income decreased, primarily reflecting the absence of a $54 million after-tax insurance recovery related to Global Crossing and other litigation matters in 2005.
| | First Quarter | ||||||
|---|---|---|---|---|---|---|---|
| In millions of dollars | 2007 | 2006 | |||||
| Net interest revenue | — | — | |||||
| Non-interest revenue | $ | (1 | ) | $ | 1 | ||
| Revenues, net of interest expense | $ | (1 | ) | $ | 1 | ||
| Operating expenses | 15 | 5 | |||||
| Income (loss) before income taxes (benefits) | $ | (16 | ) | $ | (4 | ) | |
| Income taxes (benefits) | (17 | ) | 8 | ||||
| Net income (loss) | $ | 1 | $ | (12 | ) | ||
GLOBAL WEALTH MANAGEMENT
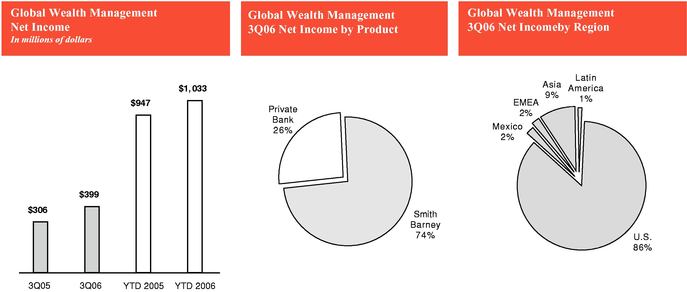
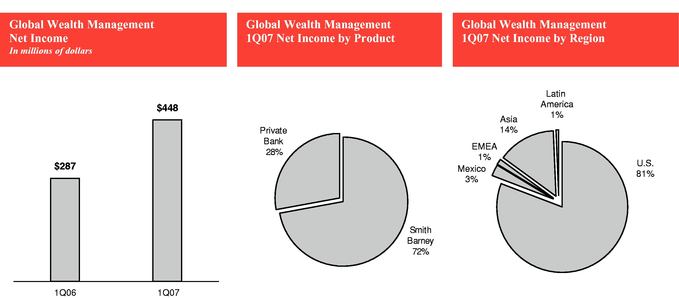
Global Wealth Management is comprised of theSmith Barney Private Client businesses (branded(including Citigroup Wealth Advisors outside the U.S.), CitigroupPrivate Bank, and Citigroup Investment Research.
| | | Three Months Ended September 30, | % Change | Nine Months Ended September 30, | % Change | | First Quarter | % Change | ||||||||||||||||||||
|---|---|---|---|---|---|---|---|---|---|---|---|---|---|---|---|---|---|---|---|---|---|---|---|---|---|---|---|---|
| In millions of dollars | In millions of dollars | 2006 | 2005 | 3Q06 vs. 3Q05 | 2006 | 2005 | YTD06 vs. YTD05 | In millions of dollars | 2007 | 2006 | 1Q07 vs. 1Q06 | |||||||||||||||||
| Net interest revenue | Net interest revenue | $ | 480 | $ | 417 | 15 | % | $ | 1,384 | $ | 1,269 | 9 | % | Net interest revenue | $ | 529 | $ | 460 | 15 | % | ||||||||
| Non-interest revenue | Non-interest revenue | 2,006 | 1,757 | 14 | 6,077 | 5,178 | 17 | Non-interest revenue | 2,289 | 2,023 | 13 | |||||||||||||||||
| Revenues, net of interest expense | Revenues, net of interest expense | $ | 2,486 | $ | 2,174 | 14 | % | $ | 7,461 | $ | 6,447 | 16 | % | Revenues, net of interest expense | $ | 2,818 | $ | 2,483 | 13 | % | ||||||||
| Operating expenses | Operating expenses | 1,894 | 1,673 | 13 | 5,910 | 4,949 | 19 | Operating expenses | 2,102 | 2,055 | 2 | |||||||||||||||||
| Provision for loan losses | Provision for loan losses | 16 | 30 | (47 | ) | 29 | 14 | NM | Provision for loan losses | 17 | 5 | NM | ||||||||||||||||
| Income before taxes | Income before taxes | $ | 576 | $ | 471 | 22 | % | $ | 1,522 | $ | 1,484 | 3 | % | Income before taxes | $ | 699 | $ | 423 | 65 | % | ||||||||
| Income taxes | Income taxes | 177 | 165 | 7 | 489 | 537 | (9 | ) | Income taxes | 251 | 136 | 85 | ||||||||||||||||
| Net income | Net income | $ | 399 | $ | 306 | 30 | % | $ | 1,033 | $ | 947 | 9 | % | Net income | $ | 448 | $ | 287 | 56 | % | ||||||||
| Revenues, net of interest expense by region: | Revenues, net of interest expense by region: | Revenues, net of interest expense by region: | ||||||||||||||||||||||||||
| U.S. | $ | 2,153 | $ | 1,923 | 12 | % | $ | 6,456 | $ | 5,647 | 14 | % | U.S. | $ | 2,385 | $ | 2,154 | 11 | % | |||||||||
| Mexico | 32 | 30 | 7 | 96 | 92 | 4 | Mexico | 36 | 31 | 16 | ||||||||||||||||||
| Latin America | 47 | 48 | (2 | ) | 136 | 156 | (13 | ) | Latin America | 55 | 43 | 28 | ||||||||||||||||
| EMEA | 83 | 79 | 5 | 241 | 221 | 9 | EMEA | 108 | 75 | 44 | ||||||||||||||||||
| Japan | — | (13 | ) | 100 | — | (6 | ) | 100 | Japan | — | — | — | ||||||||||||||||
| Asia | 171 | 107 | 60 | 532 | 337 | 58 | Asia | 234 | 180 | 30 | ||||||||||||||||||
| Total revenues | Total revenues | $ | 2,486 | $ | 2,174 | 14 | % | $ | 7,461 | $ | 6,447 | 16 | % | Total revenues | $ | 2,818 | $ | 2,483 | 13 | % | ||||||||
| Net income (loss) by region: | Net income (loss) by region: | Net income (loss) by region: | ||||||||||||||||||||||||||
| U.S. | $ | 342 | $ | 288 | 19 | % | $ | 860 | $ | 876 | (2 | )% | U.S. | $ | 361 | $ | 228 | 58 | % | |||||||||
| Mexico | 9 | 12 | (25 | ) | 27 | 35 | (23 | ) | Mexico | 12 | 8 | 50 | ||||||||||||||||
| Latin America | 3 | 1 | NM | 8 | 16 | (50 | ) | Latin America | 3 | 3 | — | |||||||||||||||||
| EMEA | 7 | 8 | (13 | ) | 15 | 10 | 50 | EMEA | 7 | 3 | NM | |||||||||||||||||
| Japan | — | (29 | ) | 100 | — | (82 | ) | 100 | Japan | — | — | — | ||||||||||||||||
| Asia | 38 | 26 | 46 | 123 | 92 | 34 | Asia | 65 | 45 | 44 | ||||||||||||||||||
| Total net income | Total net income | $ | 399 | $ | 306 | 30 | % | $ | 1,033 | $ | 947 | 9 | % | Total net income | $ | 448 | $ | 287 | 56 | % | ||||||||
| Average risk capital(1) | Average risk capital(1) | $ | 2,364 | $ | 2,153 | 10 | % | $ | 2,423 | $ | 2,079 | 17 | % | Average risk capital(1) | $ | 2,879 | $ | 2,539 | 13 | % | ||||||||
| Return on risk capital(1) | Return on risk capital(1) | 67 | % | 56 | % | 57 | % | 61 | % | Return on risk capital(1) | 63 | % | 46 | % | ||||||||||||||
| Return on invested capital(1) | Return on invested capital(1) | 41 | % | 46 | % | 35 | % | 50 | % | Return on invested capital(1) | 40 | % | 29 | % | ||||||||||||||
GLOBAL WEALTH MANAGEMENT (Continued)
| | First Quarter | % Change | |||||||
|---|---|---|---|---|---|---|---|---|---|
| | 2007 | 2006 | 1Q07 vs. 1Q06 | ||||||
| Key indicators:(in billions of dollars) | |||||||||
| Total assets under fee-based management | $ | 418 | $ | 369 | 13 | % | |||
| Total client assets | $ | 1,493 | $ | 1,347 | 11 | % | |||
| Net client asset flows | $ | 6 | $ | 3 | 100 | % | |||
| Financial advisors (FA) / bankers(actual number) | 13,605 | 13,837 | (2 | )% | |||||
| Annualized revenue per FA / banker(in thousands of dollars) | $ | 837 | $ | 715 | 17 | % | |||
| Average deposits and other customer liability balances | $ | 113 | $ | 99 | 14 | % | |||
| Average loans | $ | 46 | $ | 40 | 15 | % | |||
(THIS PAGE INTENTIONALLY LEFT BLANK)
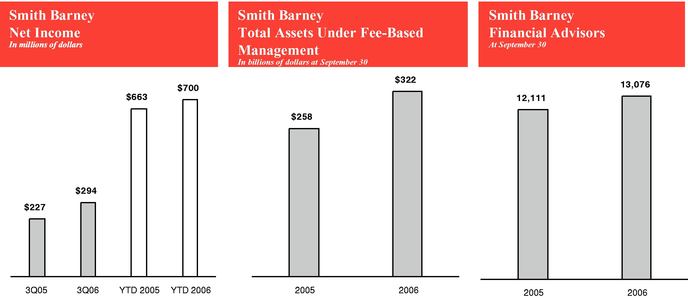
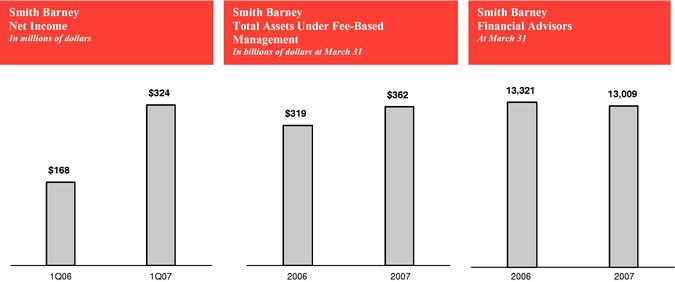
Smith Barney provides investment advice, financial planning and brokerage services to affluent individuals, companies, and non-profits through a network of more than 13,000 Financial Advisors in more than 600 offices, primarily in the U.S.Smith Barney generates revenue from managing client assets, acting as a broker for clients in the purchase and sale of securities, financing customers' securities transactions and other borrowing needs through lending, and through the sale of mutual funds.funds and alternative investments.
| | Three Months Ended September 30, | % Change | Nine Months Ended September 30, | % Change | | First Quarter | % Change | ||||||||||||||||||||
|---|---|---|---|---|---|---|---|---|---|---|---|---|---|---|---|---|---|---|---|---|---|---|---|---|---|---|---|
| In millions of dollars | 2006 | 2005 | 3Q06 vs. 3Q05 | 2006 | 2005 | YTD06 vs. YTD05 | In millions of dollars | 2007 | 2006 | 1Q07 vs. 1Q06 | |||||||||||||||||
| Net interest revenue | $ | 247 | $ | 158 | 56 | % | $ | 659 | $ | 456 | 45 | % | Net interest revenue | $ | 285 | $ | 209 | 36 | % | ||||||||
| Non-interest revenue | 1,747 | 1,570 | 11 | 5,312 | 4,588 | 16 | Non-interest revenue | 1,961 | 1,778 | 10 | |||||||||||||||||
| Revenues, net of interest expense | $ | 1,994 | $ | 1,728 | 15 | % | $ | 5,971 | $ | 5,044 | 18 | % | Revenues, net of interest expense | $ | 2,246 | $ | 1,987 | 13 | % | ||||||||
| Operating expenses | 1,565 | 1,366 | 15 | 4,909 | 3,969 | 24 | Operating expenses | 1,724 | 1,720 | — | |||||||||||||||||
| Provision for loan losses | (1 | ) | 7 | NM | (1 | ) | 11 | NM | |||||||||||||||||||
| Provisions for loan losses | Provisions for loan losses | — | 1 | (100 | ) | ||||||||||||||||||||||
| Income before taxes | $ | 430 | $ | 355 | 21 | % | $ | 1,063 | $ | 1,064 | — | Income before taxes | $ | 522 | $ | 266 | 96 | % | |||||||||
| Income taxes | 136 | 128 | 6 | 363 | 401 | (9 | )% | Income taxes | 198 | 98 | NM | ||||||||||||||||
| Net income | $ | 294 | $ | 227 | 30 | % | $ | 700 | $ | 663 | 6 | % | Net income | $ | 324 | $ | 168 | 93 | % | ||||||||
| Revenues, net of interest expense by region: | Revenues, net of interest expense by region: | ||||||||||||||||||||||||||
| U.S. | $ | 2,184 | $ | 1,943 | 12 | % | |||||||||||||||||||||
| Mexico | — | — | — | ||||||||||||||||||||||||
| Latin America | — | — | — | ||||||||||||||||||||||||
| EMEA | 14 | 5 | NM | ||||||||||||||||||||||||
| Japan | — | — | — | ||||||||||||||||||||||||
| Asia | 48 | 39 | 23 | ||||||||||||||||||||||||
| Total revenues | Total revenues | $ | 2,246 | $ | 1,987 | 13 | % | ||||||||||||||||||||
| Net income (loss) by region: | Net income (loss) by region: | ||||||||||||||||||||||||||
| U.S. | $ | 318 | $ | 162 | 96 | % | |||||||||||||||||||||
| Mexico | — | — | — | ||||||||||||||||||||||||
| Latin America | — | — | — | ||||||||||||||||||||||||
| EMEA | (1 | ) | 1 | NM | |||||||||||||||||||||||
| Japan | — | — | — | ||||||||||||||||||||||||
| Asia | 7 | 5 | 40 | ||||||||||||||||||||||||
| Total net income | Total net income | $ | 324 | $ | 168 | 93 | % | ||||||||||||||||||||
| Average risk capital(1) | $ | 1,436 | $ | 958 | 50 | % | $ | 1,438 | $ | 920 | 56 | % | Average risk capital(1) | $ | 1,743 | $ | 1,457 | 20 | % | ||||||||
| Return on risk capital(1) | 81 | % | 94 | % | 65 | % | 96 | % | Return on risk capital(1) | 75 | % | 47 | % | ||||||||||||||
| Return on invested capital(1) | 41 | % | 67 | % | 33 | % | 68 | % | Return on invested capital(1) | 39 | % | 24 | % | ||||||||||||||
| Key indicators: (in billions of dollars) | |||||||||||||||||||||||||||
| Total assets under fee-based management | $ | 322 | $ | 258 | 25 | % | |||||||||||||||||||||
| Total Smith Barney client assets | $ | 1,173 | $ | 1,015 | 16 | % | |||||||||||||||||||||
Financial advisors (#) | 13,076 | 12,111 | 8 | % | |||||||||||||||||||||||
| Annualized revenue per financial advisor(in thousands of dollars) | $ | 606 | $ | 565 | 7 | % | |||||||||||||||||||||
Smith Barney (Continued)
| | First Quarter | % Change | |||||||
|---|---|---|---|---|---|---|---|---|---|
| | 2007 | 2006 | 1Q07 vs. 1Q06 | ||||||
| Key indicators:(in billions of dollars) | |||||||||
| Total assets under fee-based management | $ | 362 | $ | 319 | 13 | % | |||
| Total client assets | $ | 1,277 | $ | 1,167 | 9 | % | |||
| Financial advisors (FA) (actual numbers) | 13,009 | 13,321 | (2 | )% | |||||
| Annualized revenue per FA (in thousands of dollars) | $ | 697 | $ | 597 | 17 | % | |||
3Q061Q07 vs. 3Q051Q06
Smith Barney net income of $324 million in the first quarter of 2007 increased $156 million, or 93%, from 2006.
Revenues, net of interest expense, of $2.246 billion in the first quarter of 2007 increased $259 million, or 13%, from the prior-year period, primarily due to a 32%17% increase in fee-based and net interest revenues reflecting an advisory-based strategy and a 7% decreaseincrease in transactional revenues reflecting increased customer volumes and the acquisition of the Legg Mason retail brokerage business. The recurring revenue increase can be attributed to the BDP Tiering program, which was launched in September. It was also due to an increase in business volume in Managed Accounts, Mutual Fund and Annuity.
Operating expenses were up mainly due to higher compensation expense, including $59 million of SFAS 123(R) accruals, integration costs of the Legg Mason retail brokerage business and higher legal costs.syndicate sales.
Total assets under fee-based management were $362 billion as of March 31, 2007, up $43 billion, or 13%, from the prior-year period. Assets that increased were both in the Consulting Group and Advisory Accounts and Financial Advisor Managed Accounts aligned with Smith Barney's strategic direction towards advisory business. Total client assets, including assets under fee-based management, of $1,277 billion in the first quarter of 2007 increased $110 billion, or 9%, compared to the prior-year quarter. This reflectedquarter, reflecting organic growth and the addition of Legg MasonQuilter client assets.assets as of March 31, 2007. Net flowsinflows were down$7 billion in the first quarter of 2007 compared to $3 billion in the prior-year quarter due to the attrition ofquarter.Smith Barney had 13,009 financial advisors and market action.
2006 YTD vs. 2005 YTD
Revenues, netas of interest expense,March 31, 2007, compared with 13,321 as of March 31, 2006. Annualized revenue per financial advisor of $697,000 increased primarily due to a 31% increase in fee-based revenues and a 2% increase in transactional revenues, reflecting increased customer volumes and17% from the acquisition of the Legg Mason retail brokerage business. The launch of the BDP Tiering program in September caused a large portion of the revenue increase, along with increased in business volume in products such as Managed Accounts, Mutual Fund and Annuity.prior-year quarter.
Operating expenses of $1.724 billion in the first quarter of 2007 increased mainly due$4 million from the prior-year quarter. The expense increase in 2007 was favorably affected by the absence of the charge related to higher compensation expense, including $286 millionthe 2006 initial adoption of SFAS 123(R) charges, integration costs of $129 million. Excluding this charge, the Legg Mason retail brokerage business, andincrease in expenses was primarily driven by higher legal costs.variable compensation associated with increased revenue.
Net flows were down compared to the prior nine months due to attrition and market action.
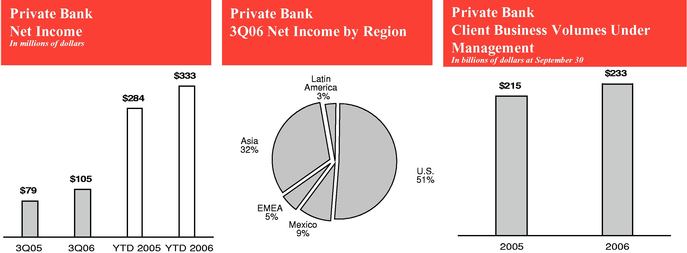
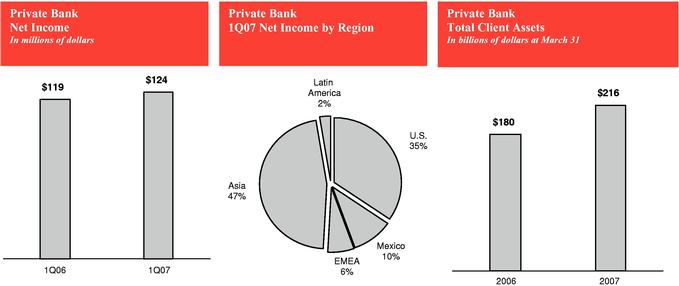
| | Three Months Ended September 30, | % Change | Nine Months Ended September 30, | % Change | ||||||||||||||
|---|---|---|---|---|---|---|---|---|---|---|---|---|---|---|---|---|---|---|
| In millions of dollars | 2006 | 2005 | 3Q06 vs. 3Q05 | 2006 | 2005 | YTD06 vs. YTD05 | ||||||||||||
| Net interest revenue | $ | 233 | $ | 259 | (10 | )% | $ | 725 | $ | 813 | (11 | )% | ||||||
| Non-interest revenue | 259 | 187 | 39 | 765 | 590 | 30 | ||||||||||||
| Revenues, net of interest expense | $ | 492 | $ | 446 | 10 | % | $ | 1,490 | $ | 1,403 | 6 | % | ||||||
| Operating expenses | 329 | 307 | 7 | 1,001 | 980 | 2 | ||||||||||||
| Provision for loan losses | 17 | 23 | (26 | ) | 30 | 3 | NM | |||||||||||
| Income before taxes | $ | 146 | $ | 116 | 26 | % | $ | 459 | $ | 420 | 9 | % | ||||||
| Income taxes | 41 | 37 | 11 | 126 | 136 | (7 | ) | |||||||||||
| Net income | $ | 105 | $ | 79 | 33 | % | $ | 333 | $ | 284 | 17 | % | ||||||
| Revenues, net of interest expense, by region: | ||||||||||||||||||
| U.S. | $ | 204 | $ | 195 | 5 | % | $ | 624 | $ | 603 | 3 | % | ||||||
| Mexico | 32 | 30 | 7 | 97 | 92 | 5 | ||||||||||||
| Latin America | 47 | 48 | (2 | ) | 137 | 156 | (12 | ) | ||||||||||
| EMEA | 76 | 79 | (4 | ) | 220 | 221 | — | |||||||||||
| Japan | — | (13 | ) | 100 | — | (6 | ) | 100 | ||||||||||
| Asia | 133 | 107 | 24 | 412 | 337 | 22 | ||||||||||||
| Total Revenues | $ | 492 | $ | 446 | 10 | % | $ | 1,490 | $ | 1,403 | 6 | % | ||||||
| Net income (loss) by region: | ||||||||||||||||||
| U.S. | $ | 54 | $ | 61 | (11 | )% | $ | 180 | $ | 213 | (15 | )% | ||||||
| Mexico | 9 | 12 | (25 | ) | 27 | 35 | (23 | ) | ||||||||||
| Latin America | 3 | 1 | NM | 8 | 16 | (50 | ) | |||||||||||
| EMEA | 5 | 8 | (38 | ) | 10 | 10 | — | |||||||||||
| Japan | — | (29 | ) | 100 | — | (82 | ) | 100 | ||||||||||
| Asia | 34 | 26 | 31 | 108 | 92 | 17 | ||||||||||||
| Total net income | $ | 105 | $ | 79 | 33 | % | $ | 333 | $ | 284 | 17 | % | ||||||
| Average risk capital(1) | $ | 928 | $ | 1,195 | (22 | )% | $ | 985 | $ | 1,159 | (15 | )% | ||||||
| Return on risk capital(1) | 45 | % | 26 | % | 45 | % | 33 | % | ||||||||||
| Return on invested capital(1) | 41 | % | 24 | % | 42 | % | 31 | % | ||||||||||
| Key indicators:(in billions of dollars) | ||||||||||||||||||
| Client assets under fee-based mgt | $ | 52 | $ | 49 | 6 | % | ||||||||||||
| Other client activity | 181 | 166 | 9 | % | ||||||||||||||
| Total client business volumes | $ | 233 | $ | 215 | 8 | % | ||||||||||||
Private Bank (Continued)
Private Bank provides personalized wealth management services for high-net-worth clients in 33 countries and territories. These services include comprehensive investment management (investment funds management, capital markets solutions, and trust, fiduciary and custody services), investment finance (credit services including real estate financing, commitments and letters of credit) and banking services (deposit, checking and savings accounts, as well as cash management and other traditional banking services).
| | First Quarter | % Change | ||||||||
|---|---|---|---|---|---|---|---|---|---|---|
| In millions of dollars | 2007 | 2006 | 1Q07 vs. 1Q06 | |||||||
| Net interest revenue | $ | 244 | $ | 251 | (3 | )% | ||||
| Non-interest revenue | 328 | 245 | 34 | |||||||
| Revenues, net of interest expense | $ | 572 | $ | 496 | 15 | % | ||||
| Operating expenses | 378 | 335 | 13 | |||||||
| Provision for loan losses | 17 | 4 | NM | |||||||
| Income before taxes | $ | 177 | $ | 157 | 13 | % | ||||
| Income taxes | 53 | 38 | 39 | |||||||
| Net income | $ | 124 | $ | 119 | 4 | % | ||||
| Revenues, net of interest expense, by region: | ||||||||||
| U.S. | $ | 201 | $ | 211 | (4 | )% | ||||
| Mexico | 36 | 31 | 16 | |||||||
| Latin America | 55 | 43 | 28 | |||||||
| EMEA | 94 | 70 | 34 | |||||||
| Japan | — | — | — | |||||||
| Asia | 186 | 141 | 31 | |||||||
| Total revenues | $ | 572 | $ | 496 | 15 | % | ||||
| Net income by region: | ||||||||||
| U.S. | $ | 43 | $ | 66 | (35 | )% | ||||
| Mexico | 12 | 8 | 50 | |||||||
| Latin America | 3 | 3 | — | |||||||
| EMEA | 8 | 2 | NM | |||||||
| Japan | — | — | — | |||||||
| Asia | 58 | 40 | 45 | |||||||
| Total net income | $ | 124 | $ | 119 | 4 | % | ||||
| Average risk capital(1) | $ | 1,136 | $ | 1,082 | 5 | % | ||||
| Return on risk capital(1) | 44 | % | 45 | % | ||||||
| Return on invested capital(1) | 40 | % | 42 | % | ||||||
3Q06Private Bank (Continued)
| | First Quarter | % Change | |||||||
|---|---|---|---|---|---|---|---|---|---|
| | 2007 | 2006 | 1Q07 vs. 1Q06 | ||||||
| Key indicators:(in billions of dollars) | |||||||||
| Total assets under fee-based management | $ | 56 | $ | 50 | 12 | % | |||
| Total client assets | $ | 216 | $ | 180 | 20 | % | |||
| Net client asset flows | $ | (1 | ) | $ | — | — | |||
| Bankers | 596 | 516 | 16 | % | |||||
| Annualized revenue per bankers (in thousands of dollars) | $ | 4,047 | $ | 3,898 | 4 | % | |||
| Average deposits and other customer liability balances | $ | 61 | $ | 48 | 27 | % | |||
| Average loans | $ | 44 | $ | 38 | 16 | % | |||
1Q07 vs. 3Q051Q06
Revenues, net of interest expense, increased ondue to strong growth inacrossAsia, EMEA, Mexico and the absence of prior-year losses related to the closing of the Japan Private Bank.Latin America.
U.S. revenue increased, primarily driven by an increase in banking spreads and lending volumes, partially offset by lending spread compression.
Mexico revenue increased, mainly due to an increase in banking and investment revenue, partially offset by lower lending and trust revenue.
Latin America revenue decreased, primarily driven by lower revenuea decrease in lending and banking and lending products,spreads, partially offset by an increaseincreases in investment revenue.
EMEA revenue decreased, driven by higher investments revenue, partially offset by the transfer of the Citigroup Wealth Advisors (CWA) business to Smith Barney.
Asia revenue increased, reflecting strong capital markets activity.lending and banking volumes.
Operating expenses of $378 million in the first quarter of 2007 increased on$43 million from the prior-year quarter. The expense increase in 2007 was favorably affected by the absence of the charge related to the 2006 initial adoption of SFAS 123(R) of $16 million. Excluding this charge, the increase in expenses was primarily driven by higher professional staffing,incentive compensation from higher revenue and investment spending to expand in on-shore markets and SFAS 123(R) charges of $3 million, partially offset by the absence ofJapan expenses in the 2006 third quarter.markets.
Provision for loan losses includes $14 million from portfolio growth and $3 million on the establishment of a SFAS 114 reserve. The 2005 third quarter includes a $24 million increase to the reserve reflecting increases inJapan, changes in the application of environmental factors and a SFAS 114 specific loan loss reserve increase.
Client business volumesincreased $18 billion, or 8%. Growth was led by $8 billion in banking and fiduciary assets growth, primarily driven byEMEA andAsia. Investment Finance volumes increased $4 billion mainly driven by growth in theU.S. region. Custody assets grew by $3 billion primarily driven byU.S., Asia andEMEA. Managed assets increased by $3 billion due to increases inLatin America and theU.S.
2006 YTD vs. 2005 YTD
Revenues, net of interest expense, increased on strong growth inAsia.
U.S. revenue increased, primarily driven by an increase in banking spreads and lending volumes, partially offset by lending spread compression.
Mexico revenue increased, mainly due to an increase in banking and investment revenue, partially offset by lower lending and trust revenue.
Latin America revenue decreased, primarily driven by lower spreads in discretionary and lending portfolios, lower lending volumes and lower banking revenue.
EMEA revenue decreased slightly, driven by higher capital markets revenue, offset by the transfer of the CWA business to Smith Barney.
Asia revenue increased, reflecting strong capital markets activity.
Operating expenses increased by $21 million as the absence ofJapan expenses was offset by SFAS 123(R) charges, higher expenses due to increased professional staffing and investment spending to expand in on-shore markets in the first nine months of 2006. The first nine months of 2006 include SFAS 123(R) charges of $25 million.
Provision for loan losses was $30 million in the first nine months of 2006 compared to $3 million in the first nine months of 2005. The provision in 2006 is primarily due to reserve buildsportfolio growth.
End of $34 million, partially offset by a $4 million recoveryperiod client assets increased $36 billion, or 20%, while average loans increased $6 billion, or 16%, primarily inAsia. 2005 includes net credit reserve releases and recoveries of $11 million inAsia, EMEA and theU.S offset by a build of $24 million for increased exposure inJapan.U.S.
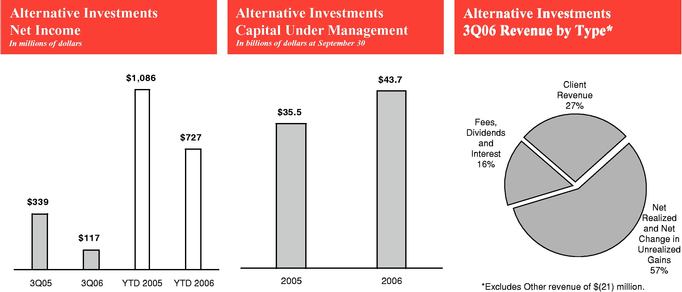
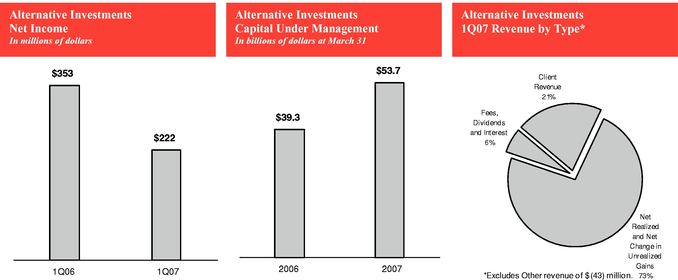
Alternative Investments (AI) manages capital on behalf of Citigroup, as well as for third-party institutional and high-net-worth investors. AI is an integrated alternative investment platform that manages a wide range of products across five asset classes, including private equity, hedge funds, real estate, structured products and managed futures. AI's business model is to enable its 14 investment centers to retain the entrepreneurial qualities required to capitalize on evolving opportunities, while benefiting from the intellectual, operational and financial resources of Citigroup.
| | Three Months Ended September 30, | % Change | Nine Months Ended September 30, | % Change | | First Quarter | % Change | ||||||||||||||||||||
|---|---|---|---|---|---|---|---|---|---|---|---|---|---|---|---|---|---|---|---|---|---|---|---|---|---|---|---|
In millions of dollars | In millions of dollars | ||||||||||||||||||||||||||
| 2006 | 2005 | 3Q06 vs. 3Q05 | 2006 | 2005 | YTD06 vs. YTD05 | 2007 | 2006 | 1Q07 vs. 1Q06 | |||||||||||||||||||
| Net interest revenue | $ | 5 | $ | 83 | (94 | )% | $ | 1 | $ | 217 | (100 | )% | Net interest revenue | $ | (20 | ) | $ | 3 | NM | ||||||||
| Non-interest revenue | 329 | 637 | (48 | ) | 1,592 | 2,481 | (36 | ) | Non-interest revenue | 582 | 672 | (13 | )% | ||||||||||||||
| Total revenues, net of interest expense | $ | 334 | $ | 720 | (54 | )% | $ | 1,593 | $ | 2,698 | (41 | )% | Total revenues, net of interest expense | $ | 562 | $ | 675 | (17 | )% | ||||||||
| Net realized and net change in unrealized gains | $ | 200 | $ | 442 | (55 | )% | $ | 1,238 | $ | 2,091 | (41 | )% | Net realized and net change in unrealized gains | $ | 444 | $ | 563 | (21 | )% | ||||||||
| Fees, dividends and interest | 58 | 194 | (70 | ) | 156 | 361 | (57 | ) | Fees, dividends and interest | 35 | 49 | (29 | ) | ||||||||||||||
| Other | (21 | ) | 3 | NM | (86 | ) | 20 | NM | Other | (43 | ) | (28 | ) | (54 | ) | ||||||||||||
| Total proprietary investment activities revenues | $ | 237 | $ | 639 | (63 | )% | $ | 1,308 | $ | 2,472 | (47 | )% | Total proprietary investment activities revenues | $ | 436 | $ | 584 | (25 | )% | ||||||||
| Client revenues(1) | 97 | 81 | 20 | 285 | 226 | 26 | Client revenues(1) | 126 | 91 | 38 | |||||||||||||||||
| Total revenues, net of interest expense | $ | 334 | $ | 720 | (54 | )% | $ | 1,593 | $ | 2,698 | (41 | )% | Total revenues, net of interest expense | $ | 562 | $ | 675 | (17 | )% | ||||||||
| Operating expenses | 137 | 167 | (18 | ) | 517 | 431 | 20 | Operating expenses | 180 | 181 | (1 | ) | |||||||||||||||
| Provision for loan losses | — | (2 | ) | 100 | (13 | ) | (2 | ) | NM | Provision for loan losses | 1 | — | NM | ||||||||||||||
| Income before taxes and minority interest | $ | 197 | $ | 555 | (65 | )% | $ | 1,089 | $ | 2,269 | (52 | )% | Income before taxes and minority interest | $ | 381 | $ | 494 | (23 | )% | ||||||||
| Income taxes | $ | 70 | $ | 181 | (61 | )% | $ | 319 | $ | 782 | (59 | )% | Income taxes | $ | 138 | $ | 111 | 24 | % | ||||||||
| Minority interest, net of taxes | 10 | 35 | (71 | ) | 43 | 401 | (89 | ) | Minority interest, net of taxes | 21 | 30 | (30 | ) | ||||||||||||||
| Net income | $ | 117 | $ | 339 | (65 | )% | $ | 727 | $ | 1,086 | (33 | )% | Net income | $ | 222 | $ | 353 | (37 | )% | ||||||||
| Average risk capital(2) | Average risk capital(2) | $ | 4,086 | $ | 4,547 | (10 | )% | ||||||||||||||||||||
| Return on risk capital(2) | Return on risk capital(2) | 22 | % | 32 | % | ||||||||||||||||||||||
| Return on invested capital(2) | Return on invested capital(2) | 19 | % | 28 | % | ||||||||||||||||||||||
| Revenue by product: | Revenue by product: | ||||||||||||||||||||||||||
| Client(1) | Client(1) | $ | 126 | $ | 91 | 38 | % | ||||||||||||||||||||
| Private Equity | $ | 361 | $ | 213 | 69 | % | |||||||||||||||||||||
| Hedge Funds | 47 | 107 | (56 | ) | |||||||||||||||||||||||
| Other | 28 | 264 | (89 | ) | |||||||||||||||||||||||
| Proprietary | Proprietary | $ | 436 | $ | 584 | (25 | )% | ||||||||||||||||||||
| Total | Total | $ | 562 | $ | 675 | (17 | )% | ||||||||||||||||||||
ALTERNATIVE INVESTMENTS (Continued)
| | Three Months Ended September 30, | % Change | Nine Months Ended September 30, | % Change | ||||||||||||||
|---|---|---|---|---|---|---|---|---|---|---|---|---|---|---|---|---|---|---|
| In millions of dollars | 2006 | 2005 | 3Q06 vs. 3Q05 | 2006 | 2005 | YTD06 vs. YTD05 | ||||||||||||
| Revenue by product: | ||||||||||||||||||
| Client(1) | $ | 97 | $ | 81 | 20 | % | $ | 285 | $ | 226 | 26 | % | ||||||
| Private equity | 56 | 449 | (88 | ) | 785 | 2,183 | (64 | ) | ||||||||||
| Hedge funds | 1 | 91 | (99 | ) | 65 | 74 | (12 | ) | ||||||||||
| Other | 180 | 99 | 82 | 458 | 215 | NM | ||||||||||||
| Proprietary | 237 | 639 | (63 | ) | 1,308 | 2,472 | (47 | ) | ||||||||||
| Total | $ | 334 | $ | 720 | (54 | ) | $ | 1,593 | $ | 2,698 | (41 | ) | ||||||
| Average risk capital(1) | $ | 4.0 | $ | 4.3 | (7 | )% | $ | 4.2 | $ | 4.2 | — | |||||||
| Return on risk capital(1) | 12 | % | 31 | % | 23 | % | 35 | % | ||||||||||
| Return on invested capital(1) | 8 | % | 29 | % | 20 | % | 32 | % | ||||||||||
| Key indicators:(in billions of dollars) | ||||||||||||||||||
| Capital under management: | ||||||||||||||||||
| Client | $ | 33.5 | $ | 24.8 | 35 | % | ||||||||||||
| Proprietary | 10.2 | 10.7 | (5 | )% | ||||||||||||||
| Total | $ | 43.7 | $ | 35.5 | 23 | % | ||||||||||||
3Q06ALTERNATIVE INVESTMENTS (Continued)
| | First Quarter | % Change | ||||||||
|---|---|---|---|---|---|---|---|---|---|---|
| | 2007 | 2006 | 1Q07 vs. 1Q06 | |||||||
| Key indicators: (in billions of dollars) | ||||||||||
| Capital under management: | ||||||||||
| Client | $ | 42.9 | $ | 28.2 | 52 | % | ||||
| Proprietary | 10.8 | 11.1 | (3 | ) | ||||||
| Total | $ | 53.7 | $ | 39.3 | 37 | % | ||||
1Q07 vs. 3Q051Q06
Total proprietary revenues, net of interest expense,, for the third quarter of 2006 were made upcomposed of revenues from private equity of $361 million, hedge funds of $47 million and other investment activity of $180 million, private equity of $56 million and hedge funds of $1$28 million. Private equity revenue declined $393increased $148 million from the 2005 thirdfirst quarter of 2006, primarily driven by gains from the sale of portfolio assets. Hedge fund revenue declined $60 million due to lower investment performance. Other investment activities revenue decreased $236 million from the first quarter of 2006, largely due to the absence of prior-year gains from the sale of portfolio assets. OtherCitigroup's investment activities revenuein The Travelers Companies shares, partially offset by real estate investment returns. Client revenues increased $81$35 million, from the 2005 third quarter, largely due to realized gains from sales of MetLife shares. Hedge fund revenue declined by $90 million on lower investment performance.Client revenues increased, reflecting increased management fees from a 35%52% growth in average client capital under management.
Operating expenses in the third quarter of 2006 declined, primarily due to decreased performance-driven compensation in private equity portfolios.
Minority interest, net of tax, declined primarily on lowerthe absence of prior-year private equity gains related to underlying investments held by consolidated majority-owned legal entities. The impact of minority interest is reflected in fees, dividends, and interest, and net realized and net change in unrealized gains.
Proprietary capital under management decreased from the third quarter of 2005, primarily driven by the sale of MetLife and St. Paul Travelers (STA) shares. This decline was partially offset by the funding of proprietary investments in private equity, hedge funds and real estate.
Client capital under management increased on inflows from institutional and high-net-worth clients.
Investments held by investment company subsidiaries (including CVC Brazil) are carried at fair value, with the net change in unrealized gains and losses recorded in income. The Company's investment in CVC Brazil is subject to a variety of unresolved matters, including pending litigation involving some of its portfolio companies, which could affect future valuations of these companies.*
The sale of Citigroup's Life Insurance and Annuities business to MetLife, Inc. on July 1, 2005, included $1.0 billion, or 22.4 million shares, in MetLife equity securities in the sale proceeds. On July 3, 2006, the company completed the sale of all 22.4 million shares related to a forward sale agreement previously executed. The Company recorded a gain of $133 million pretax in the third quarter of 2006. The investment in Legg Mason resulted from the sale of Citigroup's Asset Management business to Legg Mason, Inc. on December 1, 2005, which included a combination of Legg Mason common and convertible preferred equity securities valued at $2.298 billion in the sale proceeds. Total equivalent number of common shares was 18.7 million, of which 10.3 million were sold in March 2006. The Legg Mason equity securities are classified on Citigroup's Consolidated Balance Sheet as Investments (available-for-sale).
Alternative Investments (Continued)
2006 YTD vs. 2005 YTD
Total proprietary revenues, net of interest expense, for the nine months of 2006 of $1,308 million, were comprised of revenues from private equity of $785 million, other investment activity of $458 million and hedge funds of $65 million. Private equity revenue declined $1,398 million from the first nine months of 2005, primarily driven by the absence of prior-year gains from the sale of portfolio assets. Other investment activities revenue increased $243 million from the first nine months of 2005, largely due to realized gains from the liquidation of Citigroup's investment in St. Paul shares and MetLife shares. Hedge fund revenue decreased $9 million as lower investment performance was partially offset by an increase in average capital invested. Client revenues increased $59 million, reflecting increased management and performance fees from a 35% growth in average client capital under management.
Operating expenses in the first nine months of 2006 increased from the first nine months of 2005, primarily due to higher employee-related expenses and the impact of SFAS 123(R) charges.
Minority interest, net of tax, declined on absence of prior-year private equity gains related to underlying investments held by consolidated majority-owned legal entities. The impact of minority interest is reflected in fees, dividends, and interest, and net realized gains/(losses) consistent with proceeds received by minority interests.
Net Income reflects higherin the first quarter 2006 reflected a tax benefits includingbenefit of $58 million resulting from the resolution of the Federal Tax Audit inAudit.
Proprietary capital under management decreased $0.3 billion from the first quarter of 2006.2006, primarily driven by the sale of Citigroup's remaining holdings of MetLife shares, which were partially offset by investments in hedge funds, private equity and real estate.
Client capital under management increased $14.7 billion, or 52%, from the first quarter of 2006 due to inflows from institutional and high-net-worth clients in private equity, real estate and hedge funds.
Beginning January 1, 2007, the change in fair value of the Company's Legg Mason Equity Securities
| Company | Type of Ownership | Shares owned on September 30, 2006 | Sale Restriction | Market Value as of September 30, 2006 | Pretax Unrealized Gains (Losses) as of September 30, 2006 | ||||||||
|---|---|---|---|---|---|---|---|---|---|---|---|---|---|
| | | | | ($ millions) | ($ millions) | ||||||||
| Legg Mason, Inc. | Non-voting convertible preferred stock representing approximately 5.9% ownership | 8.4 shares (convertible into 8.4 million shares of common stock upon sale to non-affiliate) | 2.2 million shares may be sold publicly at any time and the remaining 6.2 million shares may be sold after December 1, 2006 | $ | 846 | $ | (183 | )(1) | |||||
| Total | $ | 846 | $ | (183 | ) | ||||||||
Corporate/Other includes treasury results, the 2007 first quarter restructuring charge, unallocated corporate expenses, offsets to certain line-item reclassifications reported in the business segments (inter-segment eliminations), the results of discontinued operations and unallocated taxes.
| | Three Months Ended September 30, | Nine Months Ended September 30, | First Quarter | |||||||||||||||||
|---|---|---|---|---|---|---|---|---|---|---|---|---|---|---|---|---|---|---|---|---|
| In millions of dollars | 2006 | 2005 | 2006 | 2005 | ||||||||||||||||
| Net interest revenue | $ | (93 | ) | $ | (90 | ) | $ | (458 | ) | $ | (213 | ) | ||||||||
| Non-interest revenue | (206 | ) | (61 | ) | (333 | ) | (142 | ) | ||||||||||||
In millions of dollars | 2007 | 2006 | ||||||||||||||||||
| $ | 16 | $ | (209 | ) | ||||||||||||||||
| Restructuring expense | 1,377 | — | ||||||||||||||||||
| Other operating expense | 41 | 8 | ||||||||||||||||||
| Revenues, net of interest expense | $ | (299 | ) | $ | (151 | ) | $ | (791 | ) | $ | (355 | ) | ||||||||
| Operating expenses | (33 | ) | 60 | 47 | 261 | 1,418 | 8 | |||||||||||||
| Provisions for benefits, claims and credit losses | — | (1 | ) | — | (2 | ) | ||||||||||||||
| Income (loss) from continuing operations before taxes and minority interest | $ | (266 | ) | $ | (210 | ) | $ | (838 | ) | $ | (614 | ) | ||||||||
| Loss from continuing operations before taxes and minority interest | $ | (1,402 | ) | $ | (217 | ) | ||||||||||||||
| Income tax benefits | (137 | ) | (39 | ) | (381 | ) | (113 | ) | (491 | ) | (131 | ) | ||||||||
| Minority interest, net of taxes | — | 6 | 1 | 9 | 1 | 1 | ||||||||||||||
| Income (loss) from continuing operations | $ | (129 | ) | $ | (177 | ) | $ | (458 | ) | $ | (510 | ) | ||||||||
| Loss from continuing operations | $ | (912 | ) | $ | (87 | ) | ||||||||||||||
| Income from discontinued operations | 202 | 2,155 | 289 | 2,823 | — | 84 | ||||||||||||||
| Net income (loss) | $ | 73 | $ | 1,978 | $ | (169 | ) | $ | 2,313 | |||||||||||
| Net loss | $ | (912 | ) | $ | (3 | ) | ||||||||||||||
3Q061Q07 vs. 3Q051Q06
Revenues, net of interest expense, declined,increased, primarily due to a gain on lowerthe sale of certain corporate-owned assets and improved treasury results and lower intersegment eliminations. Lower treasury results were primarily driven by higheras long-term funding costs and lower results from risk management activities.rates decreased.
Restructuring expense. See Note 7 on page 92 for details on the 2007 first quarter restructuring charge.
OperatingOther operating expenses declined,increased, primarily due to lower intersegment eliminations and an amendment to the Company's retirement benefit plans. These declines were partially offset by increased staffing and technology costs.
Income tax benefits increased on lower pretax income, lower taxes held at the corporate level and a tax release of $8 million in the 2006 third quarter relating to the resolution of the New York Tax Audits.
2006 YTD vs. 2005 YTD
Revenues, net of interest expense, declined on lower intersegment eliminations and lower treasury results. Higher interest rates and an extension of the debt maturity profile, partially offset by lower funding balances, drove a decline in treasury results.
Operating expenses declined due to lower intersegment eliminations, and an amendment to the Company's retirement benefit plans, partially offset by increased staffing and technology costs.
Income tax benefits increased due to athe higher pretax loss in the current year, offset by a prior-year tax reserve release of $61 million relating to the resolution of the Federal Tax Audit and a release of $8 million relating to the resolution of the New York Tax Audits.
Discontinued OperationsAudit.
Discontinued operations represent the operations in the Company's Sale of the Asset Management Business to Legg Mason Inc., and the Sale of the Life Insurance and Annuities Business. For 2006, income from discontinued operations included gains and tax benefits relating to the final settlement of the Life Insurance and Annuities and Asset Management Sale Transactions and a gain from the Sale of the Asset Management businessBusiness in Poland. Tax benefits includedPoland, as well as a tax reserve release of $59 million relating to the resolution of the Federal Tax Audit and a tax benefit of $17 million related to the resolution of the New York Tax Audits.Audit. See Note 3 to the Consolidated Financial Statements2 on page 94.87.
Citigroup's risk management framework balances strong corporate oversight with well-defined independent risk management functions within each business. The Citigroup risk management framework is described in Citigroup's 20052006 Annual Report on Form 10-K.
The Citigroup Senior Risk Officer is responsible for:
The independent risk managers at the business level are responsible for establishing and implementing risk management policies and practices within their business, for overseeing the risk in their business, and for responding to the needs and issues of their business.
RISK CAPITAL
Risk capital is defined as the amount of capital required to absorb potential unexpected economic losses resulting from extremely severe events over a one-year time period.
Risk Capitalcapital is used in the calculation of return on risk capital (RORC) and return on invested capital (ROIC).
RORC, calculated as annualized income from continuing operations divided by average risk capital, compares business income with the capital required to absorb the risks. This is analogous to a return on tangible equity calculation. It is used to assess businesses' operating performance and to determine incremental allocation of capital for organic growth.
ROIC is calculated using income adjusted to exclude a net internal funding cost Citigroup levies on the goodwill and intangible assets of each business. This adjusted annualized income is divided by the sum of each business'business's average risk capital, goodwill and intangible assets (excluding mortgage servicing rights, which are captured in risk capital). ROIC thus compares business income with the total invested capital—risk capital, goodwill and intangible assets—used to generate that income. ROIC is used to assess returns on potential acquisitions and divestitures, and to compare long-term performance of businesses with differing proportions of organic and acquired growth.
The drivers of "economic losses" are risks, which can be broadly categorized as credit risk (including cross-border risk), market risk operational risk, and insuranceoperational risk:
These risks are measured and aggregated within businesses and across Citigroup to facilitate the understanding of the Company's exposure to extreme downside events.
At September 30, 2006, June 30,March 31, 2007, December 31, 2006, and September 30, 2005,March 31, 2006, risk capital for Citigroup was comprisedcomposed of the following risk types:
| In billions of dollars | Sept. 30, 2006 | June 30, 2006 | Sept. 30, 2005 | Mar. 31, 2007 | Dec. 31, 2006 | Mar. 31, 2006 | ||||||||||||||
|---|---|---|---|---|---|---|---|---|---|---|---|---|---|---|---|---|---|---|---|---|
| Credit risk | $ | 36.1 | $ | 35.7 | $ | 35.9 | $ | 38.3 | $ | 36.7 | $ | 36.3 | ||||||||
| Market risk | 18.8 | 17.6 | 13.5 | 29.1 | 21.5 | 17.4 | ||||||||||||||
| Operational risk | 8.3 | 8.1 | 8.3 | 7.9 | 8.0 | 8.1 | ||||||||||||||
| Insurance risk | 0.2 | 0.2 | 0.2 | |||||||||||||||||
| Intersector diversification(1) | (6.3 | ) | (5.9 | ) | (4.8 | ) | (6.3 | ) | (6.4 | ) | (5.7 | ) | ||||||||
| Total Citigroup | $ | 57.1 | $ | 55.7 | $ | 53.1 | $ | 69.0 | $ | 59.8 | $ | 56.1 | ||||||||
| Return on risk capital (quarter) | 37 | % | 38 | % | 37 | % | ||||||||||||||
| Return on invested capital (quarter) | 19 | % | 19 | % | 25 | % | ||||||||||||||
| Return on risk capital (quarterly) | 31 | % | 35 | % | 41 | % | ||||||||||||||
| Return on invested capital | 17 | % | 17 | % | 20 | % | ||||||||||||||
| Return on risk capital (nine months) | 39 | % | 38 | % | ||||||||||||||||
| Return on invested capital (nine months) | 19 | % | 21 | % | ||||||||||||||||
The increase in Citigroup's risk capital versus September 30, 2005December 31, 2006 was primarily related to the year-end2007 first quarter methodology update for the implementation of SFAS 158, higher interest rate risk, the 2007 first quarter methodology update for market risk for non-trading positions, offset by an increase in the diversification benefit.proprietary investments, credit portfolio growth, and recent acquisitions and investments.
It is expected, due to the evolving nature of risk capital, that these methodologies will continue to be refined.
The increase in Citigroup's risk capital versus June 30, 2006 was primarily related to increases in interest rate exposure in consumer businesses and in credit risk due to higher exposures, offset by an increase in the diversification benefit. It is expected, due to the evolving nature of risk capital, that these methodologies will continue to be refined.
Pages 18 to 49 of this Management's Discussion and Analysis provide disclosures, for each segment and product, of averageAverage risk capital, return on risk capital and return on invested capital.capital are provided for each segment and product and are disclosed on pages 14 - 44.
Average year-over-yearThe increase in average risk capital increased $2.8 billion, from $53.6 billioncompared to $56.4 billion.the first quarter of 2006 was primarily driven by increases in Global Consumer and Markets & Banking. Average risk capital of $15.3$31.7 billion in U.S.Global Consumer increased $1.5$3.9 billion, or 11%14%, driven mostly by the year-endhigher interest rate risk and recent acquisitions and strategic investments. Average risk capital of $24.1 billion in Markets & Banking increased $3.6 billion, or 17%, driven mostly by portfolio growth, updated methodology update for market risk for non-trading positions. Averageproprietary investments, higher interest rate risk, capital of $12.6 billion in International Consumer decreased $950 million or 7%, driven mostly by lower exposure. Average risk capital of $22 billion in Corporate and Investment Banking increased $584 million or 3%, primarily driven by portfolio growth. Average risk capital of $2.4 billion in Global Wealth Management increased $211 million or 10%, primarily driven by the new operational risk methodology. Corporate/Other average risk capital increased $1.8 billion, from ($1.6) billion to $143 million, due to the methodological change in market risk, partially offset by intersector diversification.recent strategic investments.
CREDIT RISK MANAGEMENT PROCESS
Credit risk is the potential for financial loss resulting from the failure of a borrower or counterparty to honor its financial or contractual obligations. Credit risk arises in many of the Company's business activities, including:
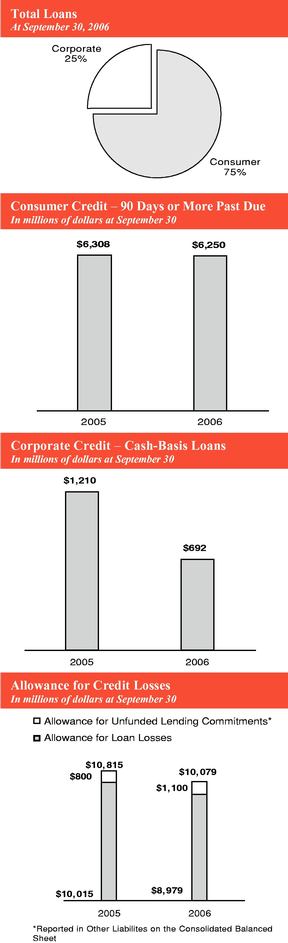
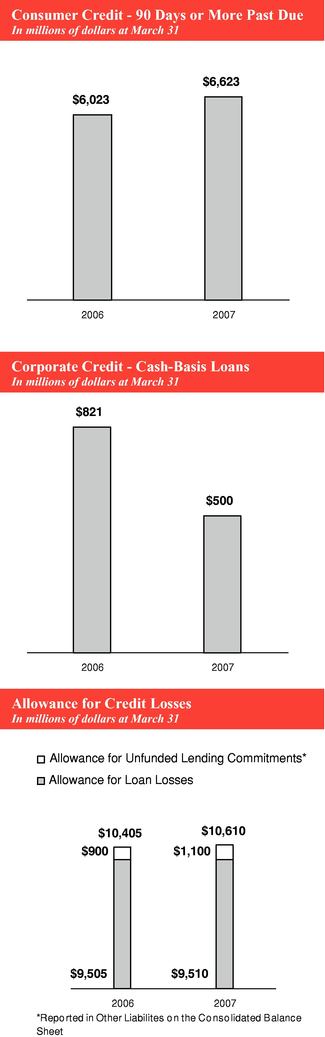
DETAILS OF CREDIT LOSS EXPERIENCE
| In millions of dollars | In millions of dollars | 3rd Qtr. 2006 | 2nd Qtr. 2006 | 1st Qtr. 2006 | 4th Qtr. 2005 | 3rd Qtr. 2005 | In millions of dollars | 1st Qtr. 2007 | 4th Qtr. 2006 | 3rd Qtr. 2006 | 2nd Qtr. 2006 | 1st Qtr. 2006 | ||||||||||||||||||||||
|---|---|---|---|---|---|---|---|---|---|---|---|---|---|---|---|---|---|---|---|---|---|---|---|---|---|---|---|---|---|---|---|---|---|---|
| Allowance for loan losses at beginning of period | Allowance for loan losses at beginning of period | $ | 9,144 | $ | 9,505 | $ | 9,782 | $ | 10,015 | $ | 10,418 | Allowance for loan losses at beginning of period | $ | 8,940 | $ | 8,979 | $ | 9,144 | $ | 9,505 | $ | 9,782 | ||||||||||||
| Provision for loan losses | Provision for loan losses | Provision for loan losses | ||||||||||||||||||||||||||||||||
| Consumer | $ | 1,736 | $ | 1,426 | $ | 1,446 | $ | 1,936 | $ | 2,584 | Consumer | $ | 2,443 | $ | 2,028 | $ | 1,736 | $ | 1,426 | $ | 1,446 | |||||||||||||
| Corporate | 57 | 10 | (50 | ) | (65 | ) | (59 | ) | Corporate | 263 | 85 | 57 | 10 | (50 | ) | |||||||||||||||||||
| $ | 1,793 | $ | 1,436 | $ | 1,396 | $ | 1,871 | $ | 2,525 | $ | 2,706 | $ | 2,113 | $ | 1,793 | $ | 1,436 | $ | 1,396 | |||||||||||||||
| Gross credit losses | Gross credit losses | Gross credit losses | ||||||||||||||||||||||||||||||||
| Consumer | Consumer | Consumer | ||||||||||||||||||||||||||||||||
| In U.S. offices | $ | 1,091 | $ | 1,090 | $ | 1,105 | $ | 1,531 | $ | 1,380 | In U.S. offices | $ | 1,291 | $ | 1,223 | $ | 1,091 | $ | 1,090 | $ | 1,105 | |||||||||||||
| In offices outside the U.S. | 1,227 | 1,145 | 1,037 | 955 | 2,000 | In offices outside the U.S. | 1,341 | 1,309 | 1,227 | 1,145 | 1,037 | |||||||||||||||||||||||
| Corporate | Corporate | Corporate | ||||||||||||||||||||||||||||||||
| In U.S. offices | 6 | 44 | 15 | 68 | $ | 4 | In U.S. offices | 6 | 13 | 6 | 44 | 15 | ||||||||||||||||||||||
| In offices outside the U.S. | 38 | 75 | 26 | 60 | 60 | In offices outside the U.S. | 29 | 97 | 38 | 75 | 26 | |||||||||||||||||||||||
| $ | 2,362 | $ | 2,354 | $ | 2,183 | $ | 2,614 | $ | 3,444 | $ | 2,667 | $ | 2,642 | $ | 2,362 | $ | 2,354 | $ | 2,183 | |||||||||||||||
| Credit recoveries | Credit recoveries | Credit recoveries | ||||||||||||||||||||||||||||||||
| Consumer | Consumer | Consumer | ||||||||||||||||||||||||||||||||
| In U.S. offices | $ | 153 | $ | 183 | $ | 190 | $ | 224 | $ | 242 | In U.S. offices | $ | 214 | $ | 165 | $ | 153 | $ | 183 | $ | 190 | |||||||||||||
| In offices outside the U.S. | 350 | 298 | 319 | 227 | 212 | In offices outside the U.S. | 286 | 307 | 350 | 298 | 319 | |||||||||||||||||||||||
| Corporate | Corporate | Corporate | ||||||||||||||||||||||||||||||||
| In U.S. offices | 5 | 12 | 2 | 94 | 39 | In U.S. offices | 18 | 2 | 5 | 12 | 2 | |||||||||||||||||||||||
| In offices outside the U.S. | 48 | 65 | 72 | 146 | 148 | In offices outside the U.S. | 40 | 26 | 48 | 65 | 72 | |||||||||||||||||||||||
| $ | 556 | $ | 558 | $ | 583 | $ | 691 | $ | 641 | $ | 558 | $ | 500 | $ | 556 | $ | 558 | $ | 583 | |||||||||||||||
| Net credit losses | Net credit losses | Net credit losses | ||||||||||||||||||||||||||||||||
| In U.S. offices | $ | 939 | $ | 939 | $ | 928 | $ | 1,281 | $ | 1,103 | In U.S. offices | $ | 1,065 | $ | 1,069 | $ | 939 | $ | 939 | $ | 928 | |||||||||||||
| In offices outside the U.S. | 867 | 857 | 672 | 642 | 1,700 | In offices outside the U.S. | 1,044 | 1,073 | 867 | 857 | 672 | |||||||||||||||||||||||
| Total | Total | $ | 1,806 | $ | 1,796 | $ | 1,600 | $ | 1,923 | $ | 2,803 | Total | $ | 2,109 | $ | 2,142 | $ | 1,806 | $ | 1,796 | $ | 1,600 | ||||||||||||
| Other—net(1)(2)(3)(4)(5) | Other—net(1)(2)(3)(4)(5) | $ | (152 | ) | $ | (1 | ) | $ | (73 | ) | $ | (181 | ) | $ | (125 | ) | Other—net(1)(2)(3)(4)(5) | $ | (27 | ) | $ | (10 | ) | $ | (152 | ) | $ | (1 | ) | $ | (73 | ) | ||
| Allowance for loan losses at end of period | Allowance for loan losses at end of period | $ | 8,979 | $ | 9,144 | $ | 9,505 | $ | 9,782 | $ | 10,015 | Allowance for loan losses at end of period | $ | 9,510 | $ | 8,940 | $ | 8,979 | $ | 9,144 | $ | 9,505 | ||||||||||||
| Allowance for unfunded lending commitments(6) | Allowance for unfunded lending commitments(6) | $ | 1,100 | $ | 1,050 | $ | 900 | $ | 850 | $ | 800 | Allowance for unfunded lending commitments(6) | $ | 1,100 | $ | 1,100 | $ | 1,100 | $ | 1,050 | $ | 900 | ||||||||||||
| Total allowance for loans and unfunded lending commitments | Total allowance for loans and unfunded lending commitments | $ | 10,079 | $ | 10,194 | $ | 10,405 | $ | 10,632 | $ | 10,815 | Total allowance for loans and unfunded lending commitments | $ | 10,610 | $ | 10,040 | $ | 10,079 | $ | 10,194 | $ | 10,405 | ||||||||||||
| Net consumer credit losses | Net consumer credit losses | $ | 1,815 | $ | 1,754 | $ | 1,633 | $ | 2,035 | $ | 2,926 | Net consumer credit losses | $ | 2,132 | $ | 2,060 | $ | 1,815 | $ | 1,754 | $ | 1,633 | ||||||||||||
| As a percentage of average consumer loans | As a percentage of average consumer loans | 1.49 | % | 1.48 | % | 1.46 | % | 1.82 | % | 2.68 | % | As a percentage of average consumer loans | 1.69 | % | 1.64 | % | 1.49 | % | 1.48 | % | 1.46 | % | ||||||||||||
| Net corporate credit losses/(recoveries) | Net corporate credit losses/(recoveries) | $ | (9 | ) | $ | 42 | $ | (33 | ) | $ | (112 | ) | $ | (123 | ) | Net corporate credit losses/(recoveries) | $ | (23 | ) | $ | 82 | $ | (9 | ) | $ | 42 | $ | (33 | ) | |||||
| As a percentage of average corporate loans | As a percentage of average corporate loans | NM | — | NM | NM | NM | As a percentage of average corporate loans | NM | 0.05 | % | NM | — | NM | |||||||||||||||||||||
CASH-BASIS, RENEGOTIATED, AND PAST DUE LOANS
| In millions of dollars | September 30, 2006 | June 30, 2006 | March 31, 2006 | December 31, 2005 | September 30, 2005 | Mar. 31 2007 | Dec. 31, 2006 | Sept. 30, 2006 | June 30, 2006 | Mar. 31, 2006 | ||||||||||||||||||||
|---|---|---|---|---|---|---|---|---|---|---|---|---|---|---|---|---|---|---|---|---|---|---|---|---|---|---|---|---|---|---|
| Corporate cash-basis loans(1) | ||||||||||||||||||||||||||||||
| Corporate cash-basis loans | ||||||||||||||||||||||||||||||
| Collateral dependent (at lower of cost or collateral value) | $ | 15 | $ | — | $ | — | $ | 6 | $ | 6 | $ | 19 | $ | 19 | $ | 15 | $ | — | $ | — | ||||||||||
| Other | 677 | 799 | 821 | 998 | 1,204 | 481 | 516 | 677 | 799 | 821 | ||||||||||||||||||||
| Total | $ | 692 | $ | 799 | $ | 821 | $ | 1,004 | $ | 1,210 | $ | 500 | $ | 535 | $ | 692 | $ | 799 | $ | 821 | ||||||||||
| Corporate cash-basis loans(1) | ||||||||||||||||||||||||||||||
| Corporate cash-basis loans | ||||||||||||||||||||||||||||||
| In U.S. offices | $ | 23 | $ | 24 | $ | 65 | $ | 81 | $ | 74 | $ | 38 | $ | 58 | $ | 23 | $ | 24 | $ | 65 | ||||||||||
| In offices outside the U.S. | 669 | 775 | 756 | 923 | 1,136 | 462 | 477 | 669 | 775 | 756 | ||||||||||||||||||||
| Total | $ | 692 | $ | 799 | $ | 821 | $ | 1,004 | $ | 1,210 | $ | 500 | $ | 535 | $ | 692 | $ | 799 | $ | 821 | ||||||||||
| Renegotiated loans (includes Corporate and Commercial Business Loans) | $ | 23 | $ | 23 | $ | 30 | $ | 32 | $ | 29 | $ | 26 | $ | 22 | $ | 23 | $ | 23 | $ | 30 | ||||||||||
| Consumer loans on which accrual of interest had been suspended | ||||||||||||||||||||||||||||||
| In U.S. offices | $ | 2,231 | $ | 1,985 | $ | 2,088 | $ | 2,307 | $ | 2,224 | $ | 2,501 | $ | 2,490 | $ | 2,231 | $ | 1,985 | $ | 2,088 | ||||||||||
| In offices outside the U.S. | 1,958 | 1,872 | 1,664 | 1,713 | 1,597 | 2,077 | 2,022 | 1,958 | 1,872 | 1,664 | ||||||||||||||||||||
| Total | $ | 4,189 | $ | 3,857 | $ | 3,752 | $ | 4,020 | $ | 3,821 | $ | 4,578 | $ | 4,512 | $ | 4,189 | $ | 3,857 | $ | 3,752 | ||||||||||
| Accruing loans 90 or more days delinquent | ||||||||||||||||||||||||||||||
| In U.S. offices | $ | 2,576 | $ | 2,403 | $ | 2,531 | $ | 2,886 | $ | 2,823 | $ | 2,374 | $ | 2,260 | $ | 2,576 | $ | 2,403 | $ | 2,531 | ||||||||||
| In offices outside the U.S. | 448 | 431 | 410 | 391 | 457 | 532 | 524 | 448 | 431 | 410 | ||||||||||||||||||||
| Total | $ | 3,024 | $ | 2,834 | $ | 2,941 | $ | 3,277 | $ | 3,280 | $ | 2,906 | $ | 2,784 | $ | 3,024 | $ | 2,834 | $ | 2,941 | ||||||||||
Other Real Estate Owned and Other Repossessed Assets
| In millions of dollars | September 30, 2006 | June 30, 2006 | March 31, 2006 | December 31, 2005 | September 30, 2005 | Mar. 31, 2007 | Dec. 31, 2006 | Sept. 30, 2006 | June 30, 2006 | Mar. 31, 2006 | ||||||||||||||||||||
|---|---|---|---|---|---|---|---|---|---|---|---|---|---|---|---|---|---|---|---|---|---|---|---|---|---|---|---|---|---|---|
| Other real estate owned(1) | ||||||||||||||||||||||||||||||
| Consumer | $ | 356 | $ | 324 | $ | 322 | $ | 279 | $ | 283 | $ | 461 | $ | 385 | $ | 356 | $ | 324 | $ | 322 | ||||||||||
| Corporate | 193 | 171 | 144 | 150 | 153 | 348 | 316 | 193 | 171 | 144 | ||||||||||||||||||||
| Total other real estate owned | $ | 549 | $ | 495 | $ | 466 | $ | 429 | $ | 436 | $ | 809 | $ | 701 | $ | 549 | $ | 495 | $ | 466 | ||||||||||
| Other repossessed assets | $ | 62 | $ | 53 | $ | 52 | $ | 62 | $ | 57 | $ | 77 | $ | 75 | $ | 62 | $ | 53 | $ | 52 | ||||||||||
Citigroup's Consumer Loan portfolio is well diversified by both product and location.
In the Consumer portfolio, credit loss experience is often expressed in terms of annualized net credit losses as a percentage of average loans. Consumer loans are generally written off no later than a predetermined number of days past due on a contractual basis, or earlier in the event of bankruptcy.
U.S. Commercial Business includes loans and leases made principally to small- and middle-market businesses. These are placed on a non-accrual basis when it is determined that the payment of interest or principal is past due for 90 days or more, except when the loan is well secured and in the process of collection.
The following table summarizes delinquency and net credit loss experience in both the managed and on-balance sheet consumer loanConsumer Loan portfolios. The managed loan portfolio includes held-for-sale and securitized credit card receivables. Onlyreceivables, which affects onlyU.S. Cards from a product view andU.S. from a regional view are impacted.view. Although a managed basis presentation is not in conformity with GAAP, the Company believes managed credit statistics provide a representation of performance and key indicators of the credit card business that is consistent with the way management reviews operating performance and allocates resources. For example, theU.S. Cards business considers both on-balance sheet and securitized balances (together, its managed portfolio) when determining capital allocation and general management decisions and compensation. Furthermore, investors use information about the credit quality of the entire managed portfolio, as the results of both the on-balance sheet and securitized portfolios impact the overall performance of theU.S. Cards business. For a further discussion of managed-basis reporting, see Note 14 to the Consolidated Financial Statements13 on page 109.98.
Consumer Loan Delinquency Amounts, Net Credit Losses, and Ratios
| | | Total Loans | 90 Days or More Past Due(1) | Average Loans | Net Credit Losses(1) | | Total Loans | 90 Days or More Past Due(1) | Average Loans | Net Credit Losses(1) | ||||||||||||||||||||||||||||||||||||||||||||
|---|---|---|---|---|---|---|---|---|---|---|---|---|---|---|---|---|---|---|---|---|---|---|---|---|---|---|---|---|---|---|---|---|---|---|---|---|---|---|---|---|---|---|---|---|---|---|---|---|---|---|---|---|---|---|
| Product View: | Sept. 30, 2006 | Sept. 30, 2006 | June 30, 2006 | Sept. 30, 2005 | 3rd Qtr. 2006 | 3rd Qtr. 2006 | 2nd Qtr. 2006 | 3rd Qtr. 2005 | ||||||||||||||||||||||||||||||||||||||||||||||
| | In millions of dollars, except total and average loan amounts in billions | |||||||||||||||||||||||||||||||||||||||||||||||||||||
| In millions of dollars, except total and average loan amounts in billions Product View: | In millions of dollars, except total and average loan amounts in billions Product View: | Mar. 31, 2007 | Mar. 31, 2007 | Dec. 31, 2006 | Mar. 31, 2006 | 1st Qtr. 2007 | 1st Qtr. 2007 | 4th Qtr. 2006 | 1st Qtr. 2006 | |||||||||||||||||||||||||||||||||||||||||||||
| U.S.: | U.S.: | U.S.: | ||||||||||||||||||||||||||||||||||||||||||||||||||||
| U.S. Cards | $ | 41.0 | $ | 736 | $ | 814 | $ | 981 | $ | 42.8 | $ | 456 | $ | 447 | $ | 649 | U.S. Cards | $ | 35.9 | $ | 587 | $ | 718 | $ | 958 | $ | 38.9 | $ | 439 | $ | 439 | $ | 446 | |||||||||||||||||||||
| Ratio | 1.80 | % | 1.87 | % | 2.33 | % | 4.22 | % | 4.11 | % | 5.76 | % | Ratio | 1.63 | % | 1.61 | % | 2.39 | % | 4.58 | % | 4.30 | % | 4.27 | % | |||||||||||||||||||||||||||||
| U.S. Retail Distribution | 46.2 | 780 | 717 | 787 | 45.2 | 282 | 288 | 314 | U.S. Retail Distribution | 48.4 | 847 | 834 | 740 | 47.6 | 335 | 337 | 279 | |||||||||||||||||||||||||||||||||||||
| Ratio | 1.69 | % | 1.62 | % | 1.91 | % | 2.48 | % | 2.65 | % | 3.06 | % | Ratio | 1.75 | % | 1.73 | % | 1.73 | % | 2.85 | % | 2.88 | % | 2.66 | % | |||||||||||||||||||||||||||||
| U.S. Consumer Lending | 203.3 | 2,556 | 2,356 | 2,608 | 201.0 | 193 | 160 | 168 | U.S. Consumer Lending | 218.6 | 3,026 | 2,870 | 2,411 | 216.6 | 286 | 258 | 176 | |||||||||||||||||||||||||||||||||||||
| Ratio | 1.26 | % | 1.19 | % | 1.49 | % | 0.38 | % | 0.33 | % | 0.39 | % | Ratio | 1.38 | % | 1.36 | % | 1.25 | % | 0.53 | % | 0.49 | % | 0.38 | % | |||||||||||||||||||||||||||||
| U.S. Commercial Business | 35.2 | 191 | 116 | 175 | 35.0 | 8 | 12 | 8 | U.S. Commercial Business | 37.6 | 195 | 149 | 151 | 36.6 | 19 | 23 | 14 | |||||||||||||||||||||||||||||||||||||
| Ratio | 0.54 | % | 0.33 | % | 0.54 | % | 0.09 | % | 0.14 | % | 0.10 | % | Ratio | 0.52 | % | 0.41 | % | 0.44 | % | 0.21 | % | 0.25 | % | 0.17 | % | |||||||||||||||||||||||||||||
| International: | International: | International: | ||||||||||||||||||||||||||||||||||||||||||||||||||||
| International Cards | 28.1 | 723 | 643 | 411 | 27.5 | 347 | 333 | 168 | International Cards | 32.2 | 736 | 709 | 535 | 31.2 | 384 | 402 | 218 | |||||||||||||||||||||||||||||||||||||
| Ratio | 2.57 | % | 2.40 | % | 1.78 | % | 5.01 | % | 5.12 | % | 2.94 | % | Ratio | 2.29 | % | 2.29 | % | 2.22 | % | 4.99 | % | 5.39 | % | 3.64 | % | |||||||||||||||||||||||||||||
| International Consumer Finance | 24.2 | 575 | 519 | 467 | 24.2 | 389 | 323 | 334 | International Consumer Finance | 25.3 | 592 | 608 | 437 | 25.0 | 430 | 380 | 319 | |||||||||||||||||||||||||||||||||||||
| Ratio | 2.37 | % | 2.16 | % | 2.13 | % | 6.38 | % | 5.44 | % | 6.03 | % | Ratio | 2.34 | % | 2.43 | % | 1.93 | % | 6.98 | % | 6.05 | % | 5.78 | % | |||||||||||||||||||||||||||||
| International Retail Banking | 65.1 | 679 | 680 | 770 | 64.4 | 141 | 191 | 1,288 | International Retail Banking | 71.3 | 630 | 667 | 736 | 69.8 | 238 | 221 | 184 | |||||||||||||||||||||||||||||||||||||
| Ratio | 1.04 | % | 1.08 | % | 1.26 | % | 0.87 | % | 1.22 | % | 8.20 | % | Ratio | 0.88 | % | 0.97 | % | 1.21 | % | 1.38 | % | 1.29 | % | 1.21 | % | |||||||||||||||||||||||||||||
| Private Bank(2) | 40.7 | 10 | 6 | 58 | 40.7 | — | — | (1 | ) | Private Bank(2) | 44.6 | 10 | 21 | 12 | 43.6 | — | — | (4 | ) | |||||||||||||||||||||||||||||||||||
| Ratio | 0.02 | % | 0.02 | % | 0.15 | % | 0.00 | % | 0.00 | % | (0.01 | )% | Ratio | 0.02 | % | 0.05 | % | 0.03 | % | 0.00 | % | 0.00 | % | (0.04 | )% | |||||||||||||||||||||||||||||
| Other Consumer Loans | Other Consumer Loans | 2.4 | — | — | 51 | 2.3 | (1 | ) | — | (2 | ) | Other Consumer Loans | 2.7 | — | — | 43 | 2.6 | 1 | — | 1 | ||||||||||||||||||||||||||||||||||
| On-Balance Sheet Loans(3) | $ | 486.2 | $ | 6,250 | $ | 5,851 | $ | 6,308 | $ | 483.1 | $ | 1,815 | $ | 1,754 | $ | 2,926 | ||||||||||||||||||||||||||||||||||||||
| On-Balance Sheet in Loans(3) | On-Balance Sheet in Loans(3) | $ | 516.6 | $ | 6,623 | $ | 6,576 | $ | 6,023 | $ | 511.9 | $ | 2,132 | $ | 2,060 | $ | 1,633 | |||||||||||||||||||||||||||||||||||||
| Ratio | 1.29 | % | 1.22 | % | 1.45 | % | 1.49 | % | 1.48 | % | 2.68 | % | Ratio | 1.28 | % | 1.29 | % | 1.31 | % | 1.69 | % | 1.64 | % | 1.46 | % | |||||||||||||||||||||||||||||
| Securitized receivables (all in U.S. Cards) | Securitized receivables (all in U.S. Cards) | $ | 99.2 | $ | 1,519 | $ | 1,421 | $ | 1,299 | $ | 97.3 | $ | 1,051 | $ | 969 | $ | 1,267 | Securitized receivables (all in U.S. Cards) | $ | 98.6 | $ | 1,528 | $ | 1,616 | $ | 1,403 | $ | 97.3 | $ | 1,150 | $ | 1,094 | $ | 871 | ||||||||||||||||||||
| Credit card receivables held-for-sale | Credit card receivables held-for-sale | 0.6 | — | — | — | 0.5 | 1 | — | — | Credit card receivables held-for-sale | 3.0 | 47 | — | — | 3.0 | — | — | 4 | ||||||||||||||||||||||||||||||||||||
| Managed Loans(4) | Managed Loans(4) | $ | 586.0 | $ | 7,769 | $ | 7,272 | $ | 7,607 | $ | 580.9 | $ | 2,867 | $ | 2,723 | $ | 4,193 | Managed Loans(4) | $ | 618.2 | $ | 8,198 | $ | 8,192 | $ | 7,426 | $ | 612.2 | $ | 3,282 | $ | 3,154 | $ | 2,508 | ||||||||||||||||||||
| Ratio | 1.33 | % | 1.26 | % | 1.44 | % | 1.96 | % | 1.92 | % | 3.18 | % | Ratio | 1.33 | % | 1.34 | % | 1.34 | % | 2.17 | % | 2.09 | % | 1.85 | % | |||||||||||||||||||||||||||||
| Regional View: | Regional View: | Regional View: | ||||||||||||||||||||||||||||||||||||||||||||||||||||
| U.S. | U.S. | $ | 355.0 | $ | 4,273 | $ | 4,010 | $ | 4,632 | $ | 352.9 | $ | 937 | $ | 908 | $ | 1,137 | U.S. | $ | 371.5 | $ | 4,663 | $ | 4,584 | $ | 4,312 | $ | 370.2 | $ | 1,080 | $ | 1,058 | $ | 916 | ||||||||||||||||||||
| Ratio | 1.20 | % | 1.14 | % | 1.46 | % | 1.05 | % | 1.05 | % | 1.45 | % | Ratio | 1.26 | % | 1.24 | % | 1.27 | % | 1.18 | % | 1.16 | % | 1.11 | % | |||||||||||||||||||||||||||||
| Mexico | Mexico | 15.4 | 600 | 548 | 576 | 15.2 | 128 | 115 | 68 | Mexico | 16.9 | 507 | 625 | 541 | 16.5 | 182 | 163 | 106 | ||||||||||||||||||||||||||||||||||||
| Ratio | 3.90 | % | 3.76 | % | 4.15 | % | 3.33 | % | 3.16 | % | 1.95 | % | Ratio | 3.00 | % | 3.78 | % | 3.68 | % | 4.47 | % | 3.97 | % | 2.87 | % | |||||||||||||||||||||||||||||
| EMEA | EMEA | 40.1 | 573 | 508 | 518 | 40.3 | 221 | 292 | 1,391 | EMEA | 45.7 | 582 | 574 | 487 | 44.4 | 317 | 303 | 250 | ||||||||||||||||||||||||||||||||||||
| Ratio | 1.43 | % | 1.29 | % | 1.42 | % | 2.18 | % | 2.97 | % | 14.60 | % | Ratio | 1.27 | % | 1.32 | % | 1.32 | % | 2.89 | % | 2.84 | % | 2.77 | % | |||||||||||||||||||||||||||||
| Japan | Japan | 11.6 | 231 | 194 | 195 | 11.7 | 286 | 251 | 254 | Japan | 10.9 | 227 | 235 | 170 | 11.0 | 313 | 273 | 223 | ||||||||||||||||||||||||||||||||||||
| Ratio | 1.99 | % | 1.63 | % | 1.64 | % | 9.65 | % | 8.33 | % | 7.65 | % | Ratio | 2.08 | % | 2.08 | % | 1.48 | % | 11.57 | % | 9.43 | % | 7.83 | % | |||||||||||||||||||||||||||||
| Asia | Asia | 58.3 | 453 | 491 | 356 | 57.3 | 174 | 147 | 84 | Asia | 63.7 | 432 | 439 | 473 | 62.7 | 164 | 186 | 136 | ||||||||||||||||||||||||||||||||||||
| Ratio | 0.78 | % | 0.87 | % | 0.66 | % | 1.21 | % | 1.06 | % | 0.62 | % | Ratio | 0.68 | % | 0.71 | % | 0.87 | % | 1.06 | % | 1.22 | % | 1.01 | % | |||||||||||||||||||||||||||||
| Latin America | Latin America | 5.8 | 120 | 100 | 31 | 5.7 | 69 | 41 | (8 | ) | Latin America | 7.9 | 212 | 119 | 40 | 7.1 | 76 | 77 | 2 | |||||||||||||||||||||||||||||||||||
| Ratio | 2.07 | % | 1.85 | % | 0.84 | % | 4.85 | % | 3.34 | % | (0.90 | )% | Ratio | 2.69 | % | 1.84 | % | 0.99 | % | 4.36 | % | 4.98 | % | 0.21 | % | |||||||||||||||||||||||||||||
| On-Balance Sheet Loans(3) | $ | 486.2 | $ | 6,250 | $ | 5,851 | $ | 6,308 | $ | 483.1 | $ | 1,815 | $ | 1,754 | $ | 2,926 | ||||||||||||||||||||||||||||||||||||||
| On-Balance Sheet in Loans(3) | On-Balance Sheet in Loans(3) | $ | 516.6 | $ | 6,623 | $ | 6,576 | $ | 6,023 | $ | 511.9 | $ | 2,132 | $ | 2,060 | $ | 1,633 | |||||||||||||||||||||||||||||||||||||
| Ratio | 1.28 | % | 1.29 | % | 1.31 | % | 1.69 | % | 1.64 | % | 1.46 | % | ||||||||||||||||||||||||||||||||||||||||||
| Ratio | 1.29 | % | 1.22 | % | 1.45 | % | 1.49 | % | 1.48 | % | 2.68 | % | ||||||||||||||||||||||||||||||||||||||||||
| Securitized receivables (all in U.S. Cards) | Securitized receivables (all in U.S. Cards) | $ | 99.2 | $ | 1,519 | $ | 1,421 | $ | 1,299 | $ | 97.3 | $ | 1,051 | $ | 969 | $ | 1,267 | Securitized receivables (all in U.S. Cards) | $ | 98.6 | $ | 1,528 | $ | 1,616 | $ | 1,403 | $ | 97.3 | $ | 1,150 | $ | 1,094 | $ | 871 | ||||||||||||||||||||
| Credit card receivables held-for-sale | Credit card receivables held-for-sale | 0.6 | — | — | — | 0.5 | 1 | — | — | Credit card receivables held-for-sale | 3.0 | 47 | — | — | 3.0 | — | — | 4 | ||||||||||||||||||||||||||||||||||||
| Managed Loans(4) | Managed Loans(4) | $ | 586.0 | $ | 7,769 | $ | 7,272 | $ | 7,607 | $ | 580.9 | $ | 2,867 | $ | 2,723 | $ | 4,193 | Managed Loans(4) | $ | 618.2 | $ | 8,198 | $ | 8,192 | $ | 7,426 | $ | 612.2 | $ | 3,282 | $ | 3,154 | $ | 2,508 | ||||||||||||||||||||
| Ratio | 1.33 | % | 1.26 | % | 1.44 | % | 1.96 | % | 1.92 | % | 3.18 | % | Ratio | 1.33 | % | 1.34 | % | 1.34 | % | 2.17 | % | 2.09 | % | 1.85 | % | |||||||||||||||||||||||||||||
Consumer Loan Balances, Net of Unearned Income
| | End of Period | Average | End of Period | Average | ||||||||||||||||||||||||||||||||
|---|---|---|---|---|---|---|---|---|---|---|---|---|---|---|---|---|---|---|---|---|---|---|---|---|---|---|---|---|---|---|---|---|---|---|---|---|
| In billions of dollars | Sept. 30, 2006 | June 30, 2006 | Sept. 30, 2005 | 3rd Qtr. 2006 | 2nd Qtr. 2006 | 3rd Qtr. 2005 | Mar. 31, 2007 | Dec. 31, 2006 | Mar. 31, 2006 | 1st Qtr. 2007 | 4th Qtr 2006 | 1st Qtr. 2006 | ||||||||||||||||||||||||
| On-balance sheet(1) | $ | 486.2 | $ | 478.3 | $ | 436.2 | $ | 483.1 | $ | 474.0 | $ | 433.4 | ||||||||||||||||||||||||
| On-balance sheet(1) | $ | 516.6 | $ | 510.8 | $ | 459.4 | $ | 511.9 | $ | 498.0 | $ | 454.8 | ||||||||||||||||||||||||
| Securitized receivables (all inU.S. Cards) | 99.2 | 97.3 | 92.6 | 97.3 | 94.5 | 89.8 | 98.6 | 99.5 | 95.9 | 97.3 | 99.1 | 94.7 | ||||||||||||||||||||||||
| Credit card receivables held-for-sale | 0.6 | — | — | 0.5 | — | — | 3.0 | — | — | 3.0 | 0.2 | 0.3 | ||||||||||||||||||||||||
| Total managed | $ | 586.0 | $ | 575.6 | $ | 528.8 | $ | 580.9 | $ | 568.5 | $ | 523.2 | $ | 618.2 | $ | 610.3 | $ | 555.3 | $ | 612.2 | $ | 597.3 | $ | 549.8 | ||||||||||||
Citigroup's total allowance for loans, leases and unfunded lending commitments of $10.079$10.610 billion is available to absorb probable credit losses inherent in the entire portfolio. For analytical purposes only, the portion of Citigroup's allowance for credit losses attributed to the Consumer portfolio was $6.087$6.338 billion at September 30, 2006, $6.311March 31, 2007, $6.006 billion at June 30,December 31, 2006 and $7.226$6.647 billion at September 30, 2005.March 31, 2006. The decrease in the allowance for credit losses from September 30, 2005March 31, 2006 of $1.139 billion$309 million included:
Offsetting these reductions in the allowance for credit losses was the impact of reserve builds of $654$856 million, primarily related to increased reserves to reflect: a change in estimate of loan losses inherent in the initial tenor portion of the Consumer Loan portfolio; increased delinquencies in second mortgages, and portfolio growth in theMexicoU.S. Consumer Lending; mortgage portfolio. Additionally, market expansion in Mexico Cards, the integration of the Credicard portfolio in Brazil and increased reserves inAsiaJapan, primarily related to industry-wide credit conditions in the Taiwan cards market; increased reserves in Japan, primarily related to legislative proposals which, if enacted, will change various aspects of the Consumer Finance industry; and the impact of the change in bankruptcy legislationthe operating environment in the consumer finance business, and the passage onU.S. Retail Distribution. December 13, 2006, of changes to Japan's consumer lending laws, added to the increase. The acquisition of the CredicardCrediCard portfolio and the Grupo Financiero Uno business increased the allowance for credit losses by $84 million and $75 million, respectively inLatin America.
On-balance sheet consumer loans of $486.2$516.6 billion increased $50.0$57.2 billion, or 11%12%, from September 30, 2005,March 31, 2006, primarily driven by growth in mortgage and other real-estate-secured loans in theU.S. Consumer Lending,U.S. Commercial Business,, andPrivate Bank businesses, andas well as growth inU.S. Retail Distribution. Credit card receivables declined on higher payment rates by customers. and all International businesses.
Net credit losses, delinquencies and the related ratios are affected by the credit performance of the portfolios, including bankruptcies, unemployment, global economic conditions, portfolio growth and seasonal factors, as well as macro-economic and regulatory policies.
CORPORATE CREDIT PORTFOLIORISK
For corporate clients and investment banking activities across the organization, the credit process is grounded in a series of fundamental policies, including:
Credit Exposure Arising from Derivatives and Foreign Exchange
Citigroup uses derivatives as both an end-user for asset/liability management and in its client businesses. In CIB,Markets & Banking, Citigroup enters into derivatives for trading purposes or to enable customers to transfer, modify or reduce their interest rate, foreign exchange and other market risks. In addition, Citigroup uses derivatives and other instruments, primarily interest rate and foreign exchange products, as an end-user to manage interest rate risk relating to specific groups of interest-sensitive assets and liabilities. Also, foreign exchange contracts are used to hedge non-U.S. dollar denominated debt, net capital exposures and foreign exchange transactions.
The Company's credit exposure on derivatives and foreign exchange contracts is primarily to professional counterparties in the financial sector, arising from transactions with banks, investmentsinvestment banks, governments and central banks, and other financial institutions.
For purposes of managing credit exposure on derivative and foreign exchange contracts, particularly when looking at exposure to a single counterparty, the Company measures and monitors credit exposure taking into account the current mark-to-market value of each contract plus a prudent estimate of its potential change in value over its life. This measurement of the potential future exposure for each credit facility is based on a stressed simulation of market rates and generally takes into account legally enforceable risk-mitigating agreements for each obligor such as netting and margining.
For asset/liability management hedges athat are subject to SFAS 133, the hedging derivative must be highly effective in accomplishing the hedge objective of offsetting either changes in the fair value or cash flows of the hedged item for the risk being hedged. Any ineffectiveness present in the hedge relationship is recognized in current earnings. The assessment of effectiveness excludes the changes in the value of the hedged item that are unrelated to the risks being hedged. Similarly, the assessment of effectiveness may exclude changes in the fair value of a derivative related to time value, which, if excluded, is recognized in current earnings.
The following tables summarize by derivative type the notionals, receivables and payables held for trading and asset/liability management hedge purposes as of September 30, 2006March 31, 2007 and December 31, 2005. See2006. A portion of the asset/liability management hedges are accounted for under SFAS 133, and in Note 16 to the Consolidated Financial Statements15 on page 115 for a discussion regarding the accounting for derivatives.102.
Notionals(1)
| | | Trading Derivatives(2) | Asset/Liability Management Hedges(3) | | Trading Derivatives(2) | Asset/Liability Management Hedges(3) | ||||||||||||||||||||
|---|---|---|---|---|---|---|---|---|---|---|---|---|---|---|---|---|---|---|---|---|---|---|---|---|---|---|
| In millions of dollars | In millions of dollars | September 30, 2006 | December 31, 2005 | September 30, 2006 | December 31, 2005 | In millions of dollars | March 31, 2007 | December 31, 2006 | March 31, 2007 | December 31, 2006 | ||||||||||||||||
| Interest rate contracts | Interest rate contracts | Interest rate contracts | ||||||||||||||||||||||||
| Swaps | $ | 13,834,583 | $ | 12,677,814 | $ | 600,387 | $ | 403,576 | Swaps | $ | 15,127,660 | $ | 14,196,404 | $ | 584,647 | $ | 561,376 | |||||||||
| Futures and forwards | 1,852,869 | 2,090,844 | 69,124 | 18,425 | Futures and forwards | 2,115,956 | 1,824,205 | 132,102 | 75,374 | |||||||||||||||||
| Written options | 2,094,351 | 1,949,501 | 12,043 | 5,166 | Written options | 4,018,792 | 3,054,990 | 31,078 | 12,764 | |||||||||||||||||
| Purchased options | 2,160,312 | 1,633,983 | 58,460 | 53,920 | Purchased options | 3,986,488 | 2,953,122 | 62,645 | 35,420 | |||||||||||||||||
| Total interest rate contract notionals | Total interest rate contract notionals | $ | 19,942,115 | $ | 18,352,142 | $ | 740,014 | $ | 481,087 | Total interest rate contract notionals | $ | 25,248,896 | $ | 22,028,721 | $ | 810,472 | $ | 684,934 | ||||||||
| Foreign exchange contracts | Foreign exchange contracts | Foreign exchange contracts | ||||||||||||||||||||||||
| Swaps | $ | 656,055 | $ | 563,888 | $ | 51,638 | $ | 37,418 | Swaps | $ | 770,255 | $ | 722,063 | $ | 60,181 | $ | 53,216 | |||||||||
| Futures and forwards | 1,921,368 | 1,508,754 | 43,152 | 53,757 | Futures and forwards | 2,271,735 | 2,068,310 | 41,955 | 42,675 | |||||||||||||||||
| Written options | 355,578 | 249,725 | 131 | — | Written options | 482,675 | 416,951 | 886 | 1,228 | |||||||||||||||||
| Purchased options | 350,045 | 253,089 | 1,207 | 808 | Purchased options | 458,963 | 404,859 | 761 | 1,246 | |||||||||||||||||
| Total foreign exchange contract notionals | Total foreign exchange contract notionals | $ | 3,283,046 | $ | 2,575,456 | $ | 96,128 | $ | 91,983 | Total foreign exchange contract notionals | $ | 3,983,628 | $ | 3,612,183 | $ | 103,783 | $ | 98,365 | ||||||||
Equity contracts | Equity contracts | Equity contracts | ||||||||||||||||||||||||
| Swaps | $ | 83,853 | $ | 70,188 | $ | — | $ | — | Swaps | $ | 127,252 | $ | 104,320 | $ | — | $ | — | |||||||||
| Futures and forwards | 24,514 | 14,487 | — | — | Futures and forwards | 26,921 | 36,362 | — | — | |||||||||||||||||
| Written options | 262,241 | 213,383 | — | — | Written options | 584,088 | 387,781 | — | — | |||||||||||||||||
| Purchased options | 239,111 | 193,248 | — | — | Purchased options | 541,841 | 355,891 | — | — | |||||||||||||||||
| Total equity contract notionals | Total equity contract notionals | $ | 609,719 | $ | 491,306 | $ | — | $ | — | Total equity contract notionals | $ | 1,280,102 | $ | 884,354 | $ | — | $ | — | ||||||||
| Commodity and other contracts | Commodity and other contracts | Commodity and other contracts | ||||||||||||||||||||||||
| Swaps | $ | 33,617 | $ | 20,486 | $ | — | $ | — | Swaps | $ | 41,146 | $ | 35,611 | $ | — | $ | — | |||||||||
| Futures and forwards | 12,249 | 10,876 | — | — | Futures and forwards | 45,005 | 17,433 | — | — | |||||||||||||||||
| Written options | 15,253 | 9,761 | — | — | Written options | 15,407 | 11,991 | — | — | |||||||||||||||||
| Purchased options | 18,780 | 12,240 | — | — | Purchased options | 16,869 | 16,904 | — | — | |||||||||||||||||
| Total commodity and other contract notionals | Total commodity and other contract notionals | $ | 79,899 | $ | 53,363 | $ | — | $ | — | Total commodity and other contract notionals | $ | 118,427 | $ | 81,939 | $ | — | $ | — | ||||||||
| Credit derivatives | Credit derivatives | $ | 1,591,540 | $ | 1,030,745 | $ | — | $ | — | Credit derivatives | $ | 2,467,859 | $ | 1,944,980 | $ | — | $ | — | ||||||||
| Total derivative notionals | Total derivative notionals | $ | 25,506,319 | $ | 22,503,012 | $ | 836,142 | $ | 573,070 | Total derivative notionals | $ | 33,098,912 | $ | 28,552,177 | $ | 914,255 | $ | 783,299 | ||||||||
Mark-to-Market (MTM) Receivables/Payables
| | | Derivatives Receivables—MTM | Derivatives Payable—MTM | | Derivatives Receivables—MTM | Derivatives Payables—MTM | ||||||||||||||||||||||||
|---|---|---|---|---|---|---|---|---|---|---|---|---|---|---|---|---|---|---|---|---|---|---|---|---|---|---|---|---|---|---|
| In millions of dollars | In millions of dollars | September 30, 2006 | December 31, 2005 | September 30, 2006 | December 31, 2005 | In millions of dollars | March 31, 2007 | December 31, 2006 | March 31, 2007 | December 31, 2006 | ||||||||||||||||||||
| Trading Derivatives(2) | Trading Derivatives(2) | Trading Derivatives(2) | ||||||||||||||||||||||||||||
| Interest rate contracts | $ | 172,204 | $ | 192,761 | $ | 168,238 | $ | 188,182 | Interest rate contracts | $ | 171,536 | $ | 167,521 | $ | 174,217 | $ | 166,119 | |||||||||||||
| Foreign exchange contracts | 41,352 | 42,749 | 37,347 | 41,474 | Foreign exchange contracts | 45,871 | 52,297 | 41,430 | 47,469 | |||||||||||||||||||||
| Equity contracts | 24,342 | 18,633 | 44,467 | 32,313 | Equity contracts | 28,281 | 26,883 | 53,154 | 52,980 | |||||||||||||||||||||
| Commodity and other contracts | 6,358 | 7,332 | 7,159 | 6,986 | Commodity and other contracts | 5,216 | 5,387 | 5,462 | 5,776 | |||||||||||||||||||||
| Credit derivative | 10,201 | 8,106 | 11,115 | 9,279 | Credit derivative | 20,078 | 14,069 | 20,621 | 15,081 | |||||||||||||||||||||
| Total | $ | 254,457 | $ | 269,581 | $ | 268,326 | $ | 278,234 | Total | $ | 270,982 | $ | 266,157 | $ | 294,884 | $ | 287,425 | |||||||||||||
| Less: Netting agreements, cash collateral and market value adjustments | (206,037 | ) | (222,167 | ) | (201,420 | ) | (216,906 | ) | Less: Netting agreements, cash collateral and market value adjustments | (224,516 | ) | (216,616 | ) | (220,693 | ) | (212,621 | ) | |||||||||||||
| Net Receivables/Payables | $ | 48,420 | $ | 47,414 | $ | 66,906 | $ | 61,328 | Net Receivables/Payables | $ | 46,466 | $ | 49,541 | $ | 74,191 | $ | 74,804 | |||||||||||||
| Asset/Liability Management Hedges(3) | Asset/Liability Management Hedges(3) | Asset/Liability Management Hedges(3) | ||||||||||||||||||||||||||||
| Interest rate contracts | $ | 1,798 | $ | 3,775 | $ | 3,042 | $ | 1,615 | Interest rate contracts | $ | 1,837 | $ | 1,801 | $ | 4,816 | $ | 3,327 | |||||||||||||
| Foreign exchange contracts | 2,722 | 1,385 | 1,042 | 1,137 | Foreign exchange contracts | 3,861 | 3,660 | 681 | 947 | |||||||||||||||||||||
| Total | $ | 4,520 | $ | 5,160 | $ | 4,084 | $ | 2,752 | Total | $ | 5,698 | $ | 5,461 | $ | 5,497 | $ | 4,274 | |||||||||||||
GLOBAL CORPORATE PORTFOLIO REVIEW
Corporate loans are identified as impaired and placed on a non-accrual basis (cash-basis) when it is determined that the payment of interest or principal is doubtful or when interest or principal is past due for 90 days or more; the exception is when the loan is well secured and in the process of collection. Impaired corporate loans are written down to the extent that principal is judged to be uncollectible. Impaired collateral-dependent loans are written down to the lower of cost or collateral value, less disposal costs.
The following table summarizes corporate cash-basis loans and net credit losses:
| In millions of dollars | Sept. 30, 2006 | Dec. 31, 2005 | Sept. 30, 2005 | Mar. 31, 2007 | Dec. 31, 2006 | Mar. 31, 2006 | ||||||||||||||
|---|---|---|---|---|---|---|---|---|---|---|---|---|---|---|---|---|---|---|---|---|
| Corporate cash-basis loans | ||||||||||||||||||||
| Capital Markets and Banking | $ | 658 | $ | 923 | $ | 1,145 | ||||||||||||||
| Securities and Banking | $ | 474 | $ | 500 | $ | 745 | ||||||||||||||
| Transaction Services | 34 | 81 | 65 | 26 | 35 | 76 | ||||||||||||||
| Total corporate cash-basis loans(1) | $ | 692 | $ | 1,004 | $ | 1,210 | $ | 500 | $ | 535 | $ | 821 | ||||||||
| Net credit write-offs/losses (recoveries) | ||||||||||||||||||||
| Capital Markets and Banking | $ | (11 | ) | $ | (117 | ) | $ | (118 | ) | |||||||||||
| Net credit losses (recoveries) | ||||||||||||||||||||
| Securities and Banking | $ | (28 | ) | $ | 70 | $ | (34 | ) | ||||||||||||
| Transaction Services | 2 | 5 | (3 | ) | 5 | 6 | 1 | |||||||||||||
| CIB Other | — | — | — | |||||||||||||||||
| Alternative Investments | — | — | (2 | ) | 1 | — | — | |||||||||||||
| Corporate/Other | (1 | ) | 6 | — | ||||||||||||||||
| Total net credit write-offs/ losses (recoveries) | $ | (9 | ) | $ | (112 | ) | $ | (123 | ) | |||||||||||
| Total net credit losses (recoveries) | $ | (23 | ) | $ | 82 | $ | (33 | ) | ||||||||||||
| Corporate allowance for loan losses | $ | 2,892 | $ | 2,860 | $ | 2,789 | $ | 3,172 | $ | 2,934 | $ | 2,858 | ||||||||
| Corporate allowance for credit losses on unfunded lending commitments(2) | 1,100 | 850 | 800 | 1,100 | 1,100 | 900 | ||||||||||||||
| Total corporate allowance for loans and unfunded lending commitments | $ | 3,992 | $ | 3,710 | $ | 3,589 | $ | 4,272 | $ | 4,034 | $ | 3,758 | ||||||||
| As a percentage of total corporate loans(3) | 1.73 | % | 2.22 | % | 2.22 | % | 1.82 | % | 1.76 | % | 2.00 | % | ||||||||
Corporate cash-basisCash-basis loans on September 30, 2006March 31, 2007 decreased $518$321 million as compared to September 30, 2005; $487with March 31, 2006; $271 million of the decrease was inCapital MarketsSecurities and Banking and $31$50 million was inTransaction Services.Capital MarketsSecurities and Banking decreased primarily due to higher charge-offsdecreases in Korea, Russia,KorAm, Europe, Mexico and Australia. The decrease inTransaction Services was primarily related to charge-offs inMexico.the Philippines.
Cash-basis loans decreased $312$35 million as compared to December 31, 20052006 due to decreases of $265$26 million inCapital MarketsSecurities and Banking and $47$9 million inTransaction Services.Capital MarketsServices. Securities and Banking primarily reflected increaseddeclining charge-offs in Russia, Australia, KoreaNorth America, Mexico and India.Transaction Services decreased primarily due to charge-offs inMexico.Poland.
Total corporate Other Real Estate Owned (OREO) was $193$348 million, $150$316 million and $153$144 million at September 30, 2006,March 31, 2007, December 31, 2005,2006, and September 30, 2005,March 31, 2006, respectively. The $43$204 million increase from DecemberMarch 31, 20052006 reflects net foreclosures in the U.S. real estate portfolio.
Total corporate loans outstanding at September 30, 2006March 31, 2007 were $167$174 billion as compared to $129$166 billion and $126$143 billion at December 31, 20052006 and September 30, 2005,March 31, 2006, respectively.
Total corporate net credit recoveriesrecovery of $9$23 million on September 30, 2006March 31, 2007 decreased $114$10 million compared to September 30, 2005,March 31, 2006, primarily attributabledue to reduced recoveriescontinued improvements in the third quarter of 2006.overall credit environment. Total corporate net credit losses increased $103$105 million compared to the 20052006 fourth quarter, primarily due to reduced recoveriesthe absence of write-offs in the thirdfourth quarter of 2006.
Citigroup's total allowance for credit losses for loans, leases and unfunded lending commitments of $10.079$10.610 billion at September 30, 2006 is available to absorb probable credit losses inherent in the entire Company's portfolio. For analytical purposes only, the portion of Citigroup's allowance for credit losses attributed to the corporateCorporate portfolio was $3.992$4.272 billion at September 30, 2006, $3.589March 31, 2007, compared to $3.758 billion at September 30, 2005,March 31, 2006 and $3.710$4.034 billion at December 31, 2005,2006, respectively. The $403$514 million increase in the corporatetotal allowance at September 30,March 31, 2007 from March 31, 2006 from September 30, 2005 primarily reflects reserve builds related to unfunded lending commitments due toand increases in expected losses during the year and the deterioration of the credit quality of the underlying portfolios. The $282year. There was a $238 million increase in the corporatetotal allowance at September 30, 2006March 31, 2007 from December 31, 20052006 primarily reflects an increase in the allowancereserve for unfunded lending commitments$300 million based on portfolio growth in Markets & Banking, which includes higher commitments to leveraged transactions and the deterioration of the underlying portfolio.an increase in average loan tenor. Losses on corporate lending activities and the level of cash-basis loans can vary widely with respect to timing and amount, particularly within any narrowly defined business or loan type.
MARKET RISK MANAGEMENT PROCESS
Market risk encompasses liquidity risk and price risk, both of which arise in the normal course of business of a global financial intermediary. Liquidity risk is the risk that an entity may be unable to meet a financial commitment to a customer, creditor, or investor when due. Liquidity risk is discussed in the "Capital Resources and Liquidity" on page 74.68. Price risk is the earnings risk from changes in interest rates, foreign exchange rates, equity and commodity prices, and in their implied volatilities. Price risk arises in non-trading portfolios, as well as in trading portfolios.
Market risks are measured in accordance with established standards to ensure consistency across businesses and the ability to aggregate like risk at the Citigroup level.risk. Each business is required to establish, with approval from independent market risk management, a market risk limit framework, including risk measures limits and controls, that clearly defines approved risk profiles and is within the parameters of Citigroup's overall risk appetite.
In all cases, the businesses are ultimately responsible for the market risks they take and for remaining within their defined limits.
Non-Trading Portfolios
Interest Rate Risk
One of Citigroup's primary business functions is providing financial products that meet the needs of its customers. Loans and deposits are tailored to the customer's requirements with regard to tenor, index, and rate type. Net Interest Revenue (NIR) is the difference between the yield earned on the non-trading portfolio assets (including customer loans) and rate paid on the liabilities (including customer deposits or company borrowings). The NIR is affected by changes in the level of interest rates. For example:
NIR in the current period is the result of customer transactions and the related contractual rates originated in prior periods as well as new transactions in the current period; those prior period transactions will be impacted by changes in rates on floating rate assets and liabilities in the current period.
Due to the long-term nature of the portfolios, NIR will vary from quarter to quarter even assuming no change in the shape or level of the yield curve as the assets and liabilities reprice. These repricings are a function of implied forward interest rates, which represent the overall market's unbiased estimate of future interest rates and incorporate possible changes in the Federal Funds rate as well as the shape of the yield curve.
Interest Rate Risk Governance
The risks in Citigroup's non-traded portfolios are managedestimated using a common set of standards that define, measure, limit and report the market risk. TheEach business is required to establish, with approval from independent market risk management, a market risk limit framework that clearly defines approved risk profiles and is within the parameters of Citigroup's overall risk appetite. In all cases, the businesses are ultimately responsible for the market risks they take and for remaining within their defined limits. These limits are managed within limits approvedmonitored by independent market risk, management. In addition, there are Citigroup-wide reporting metrics that are common to allcountry and business units, which enable Citigroup to aggregateAsset and compare non-trading risks across businesses. The metrics measure the change in either income or value of the Company's positions under various rate scenarios.
Citigroup's primary focus is providing financial products for its customers. Loans and deposits are tailored to the customer's requirements in terms of maturity and whether the rate is fixed or floating and, if it is floating, how often the rate resets and according to which market index. These customer transactions result in a risk exposure for Citigroup. This exposure may be related to differences in the timing of maturities, and/or rate resetting for assets and liabilities, or it may be due to different positions resetting based on different indices. In some instances it may also be indirectly related to interest rate changes. For example, mortgage prepayment rates vary not only as a result of interest rate changes, but also with the absolute level of rates relative to the rate on the mortgage itself.
One function of Treasury at Citigroup is to understand the risks that arise from customer transactions and to manage them so that unexpected changes in the markets do not adversely impact Citigroup's Net Interest Revenue (NIR). Various market factors are considered, including the market's expectation of future interest rates and any different expectations for rate indices (LIBOR, treasuries, etc.). In order to manage these risks effectively, Citigroup may modify customer pricing, enter into transactions with other institutions that may have opposite risk positions and enter into off-balance sheet transactions, including derivatives.
NIR is a function of the size of the balanceLiability Committees (ALCOs) and the rate that is earned or paid on that balance. NIR in any period is the result of customer transactionsGlobal Finance and the related contractual rates from prior periods, as well as new transactions in the current period; it may be impacted by changes in rates on floating rate assetsAsset and liabilities. Due to the long-term nature of the portfolio, NIR will vary from quarter to quarter even in the absence of changes in interest rates.Liability Committee (FinALCO).
Interest Rate Risk Measurement
Citigroup's principal measure of earnings risk from non-trading portfolios due to interest rates changesNIR is Interest Rate Exposure (IRE). IRE measures the change in expected NIR in each currency that resultsresulting solely from unanticipated changes in market rates of interest; scenarios are run assuming unanticipated instantaneous parallel rate changes, as well as more gradual rate changes. Other factorsforward interest rates. Factors such as changes in volumes, spreads, margins and the impact of prior-period pricing decisions can also change current period interest income, but are not captured by IRE. While IRE assumes that businesses make no additional changes in pricing or balances in response to the unanticipated rate changes.
IRE tests the impact on NIR resulting from unanticipated changes in practice businessesforward interest rates. For example, if the current 90-day LIBOR rate is 3.00% and the one-year forward rate is 5.00% (i.e., the estimated 90-day LIBOR rate in one year), the +100bps IRE scenario measures the impact of the firm's NIR of a 100bps instantaneous change in the 90-day LIBOR, to 6% in one year).
The impact of changing prepayment rates on loan portfolios is incorporated into the results. For example, in the declining interest rate scenarios, it is assumed that mortgage portfolios prepay faster and income is reduced. In addition, in a rising interest rate scenario, portions of the deposit portfolio are assumed to experience rate increases that are less than the change in market interest rates.
Mitigation and Hedging of Risk
All financial institutions' financial performance is subject to some degree of risk due to changes in interest rates. In order to manage these risks effectively, Citigroup may alter their portfolio mix,modify pricing on new customer pricingloans and hedge positions, which could significantly impact reported NIR.deposits, enter into transactions with other institutions or enter into off-balance sheet derivative transactions that have the opposite risk exposures. Therefore, Citigroup regularly assesses the viability of strategies to reduce unacceptable risks to earnings and implements such strategies when the Company believes those actions are prudent. As information becomes available, Citigroup formulates strategies aimed at protecting earnings from the potential negative effects of changes in interest rates.
Citigroup employs additional measurements, including stress testing the impact of non-linear interest rate movements on the value of the balance sheet; the analysis of portfolio duration and volatility, particularly as they relate to mortgagesmortgage
loans and mortgage-backed securities; and the potential impact of the change in the spread between different market indices.
Citigroup Interest Rate Exposure (Impact on Pretax Earnings)
The amountsexposures in the following table below represent the approximate impactannualized risk to Net Interest Revenue on our principal currency exposures over the next 12 months. This impact is based on current balances and pricing that would result fromNIR assuming an unanticipated parallel instantaneous rate100bp change, ofas well as a 100bp and amore gradual 100bp (25bp per quarter) parallel change in rates as compared with the market forward interest rates.rates in selected currencies.
| | September 30, 2006 | June 30, 2006 | September 30, 2005 | March 31, 2007 | December 31, 2006 | March 31, 2006 | ||||||||||||||||||||||||||||||||
|---|---|---|---|---|---|---|---|---|---|---|---|---|---|---|---|---|---|---|---|---|---|---|---|---|---|---|---|---|---|---|---|---|---|---|---|---|---|---|
| In millions of dollars | Increase | Decrease | Increase | Decrease | Increase | Decrease | Increase | Decrease | Increase | Decrease | Increase | Decrease | ||||||||||||||||||||||||||
| U.S. dollar | ||||||||||||||||||||||||||||||||||||||
| Instantaneous change | $ | (375 | ) | $ | 258 | $ | (344 | ) | $ | 436 | $ | (262 | ) | $ | 305 | $ | (677 | ) | $ | 470 | $ | (728 | ) | $ | 627 | $ | (435 | ) | $ | 585 | ||||||||
| Gradual change | $ | (234 | ) | $ | 231 | $ | (247 | ) | $ | 212 | $ | (138 | ) | $ | 115 | $ | (335 | ) | $ | 348 | $ | (349 | ) | $ | 360 | $ | (266 | ) | $ | 271 | ||||||||
| Mexican peso | ||||||||||||||||||||||||||||||||||||||
| Instantaneous change | $ | 46 | $ | (46 | ) | $ | 44 | $ | (44 | ) | $ | 74 | $ | (75 | ) | $ | 21 | $ | (21 | ) | $ | 42 | $ | (43 | ) | $ | 91 | $ | (92 | ) | ||||||||
| Gradual change | $ | 35 | $ | (35 | ) | $ | 32 | $ | (32 | ) | $ | 45 | $ | (45 | ) | $ | 21 | $ | (21 | ) | $ | 41 | $ | (41 | ) | $ | 63 | $ | (63 | ) | ||||||||
| Euro | ||||||||||||||||||||||||||||||||||||||
| Instantaneous change | $ | (80 | ) | $ | 80 | $ | (70 | ) | $ | 70 | $ | (27 | ) | $ | 27 | $ | (123 | ) | $ | 123 | $ | (91 | ) | $ | 91 | $ | (56 | ) | $ | 56 | ||||||||
| Gradual change | $ | (39 | ) | $ | 39 | $ | (33 | ) | $ | 33 | $ | (9 | ) | $ | 9 | $ | (57 | ) | $ | 57 | $ | (38 | ) | $ | 38 | $ | (15 | ) | $ | 15 | ||||||||
| Japanese yen | ||||||||||||||||||||||||||||||||||||||
| Instantaneous change | $ | (14 | ) | NM | $ | (21 | ) | NM | $ | 29 | NM | $ | (38 | ) | NM | $ | (32 | ) | NM | $ | (5 | ) | NM | |||||||||||||||
| Gradual change | $ | (8 | ) | NM | $ | (10 | ) | NM | $ | 16 | NM | $ | (26 | ) | NM | $ | (21 | ) | NM | $ | 5 | NM | ||||||||||||||||
| Pound sterling | ||||||||||||||||||||||||||||||||||||||
| Instantaneous change | $ | (27 | ) | $ | 27 | $ | (32 | ) | $ | 31 | $ | 25 | $ | (26 | ) | $ | (22 | ) | $ | 22 | $ | (41 | ) | $ | 41 | $ | (22 | ) | $ | 21 | ||||||||
| Gradual change | $ | (18 | ) | $ | 18 | $ | (18 | ) | $ | 18 | $ | 19 | $ | (19 | ) | $ | (11 | ) | $ | 11 | $ | (21 | ) | $ | 21 | $ | 5 | $ | (5 | ) | ||||||||
The change in U.S. Dollar Interest Rate Exposure from June 30, 2006 reflects increases in certain asset balances, the impact of declining interest rates and changes in customer pricingthe U.S. dollar interest rate exposures from December 31, 2006 primarily reflects movements in customer-related asset and mix.liability mix, as well as Citigroup's view of prevailing interest rates.
The following table shows the risk to NIR from six different changes in the implied forward rates. Each scenario assumes that the rate change will occur on a gradual basis every three months over the course of one year.
| | Scenario 1 | Scenario 2 | Scenario 3 | Scenario 4 | Scenario 5 | Scenario 6 | |||||||||||||
|---|---|---|---|---|---|---|---|---|---|---|---|---|---|---|---|---|---|---|---|
| Overnight rate change (bp) | — | 100 | 200 | (200 | ) | (100 | ) | — | |||||||||||
| 10-year rate change (bp) | (100 | ) | — | 100 | (100 | ) | — | 100 | |||||||||||
| Impact to net interest revenue | $ | 29 | $ | (380 | ) | $ | (851 | ) | $ | 649 | $ | 383 | $ | (252 | ) | ||||
| (in millions of dollars) | |||||||||||||||||||
Trading Portfolios
Price risk in trading portfolios is monitored using a series of measures, including:
Factor sensitivities are expressed as the change in the value of a position for a defined change in a market risk factor, an example of which is thesuch as a change in the value of a Treasury bill for a one basis point change in interest rates. Citigroup's independent market risk management ensures that factor sensitivities are calculated, monitored and, in most cases, limited, for all relevant risks taken in a trading portfolio.
Value-at-Risk (VAR)VAR estimates the potential decline in the value of a position or a portfolio under normal market conditions. The VAR method incorporates the factor sensitivities of the trading portfolio with the volatilities and correlations of those factors and is expressed as the risk to the Company over a one-day holding period, at a 99% confidence level. Citigroup's VAR is based on the volatilities of and correlations between a multitude of market risk factors as well as factors that track the specific issuer risk in debt and equity securities.
Stress testing is performed on trading portfolios on a regular basis to estimate the impact of extreme market movements. It is performed on both individual trading portfolios, as well as on aggregations of portfolios and businesses. Independent market risk management, in conjunction with the businesses, develops stress scenarios, reviews the output of periodic stress testing exercises, and uses the information to make judgments as to the ongoing appropriateness of exposure levels and limits.
Each trading portfolio has its own market risk limit framework, encompassing these measures and other controls, including permitted product lists and a new product approval process for complex products.
Risk capital for market risk in trading portfolios is based on an annualized VAR figure.
Total revenues of the trading business consist of:
All trading positions are marked-to-market, with the result reflected in earnings.
Citigroup periodically performs extensive back-testing of many hypothetical test portfolios as one check of the accuracy of its VAR. Back-testing is the process byin which the daily VAR of a portfolio is compared to the actual daily change in the market value of its transactions. Back-testing is conducted to confirm that the daily market value losses in excess of 99% confidence level occur, on average, only 1% of the time. The VAR calculation for the hypothetical test portfolios, with different degrees of risk concentration, meets this statistical criteria.
The level of price risk exposure at any given point in time depends on the market environment and expectations of future price and market movements, and will vary from period to period.
For Citigroup's major trading centers, the aggregate pretax VAR in the trading portfolios was $90$122 million, $97$106 million, and $93$106 million at September 30, 2006, June 30,March 31, 2007, December 31, 2006, and September 30, 2005,March 31, 2006, respectively. Daily exposures averaged $86$121 million during the 2006 thirdfirst quarter of 2007 and ranged from $74$100 million to $107$140 million.
The following table summarizes VAR to Citigroup in the trading portfolios at September 30, 2006, June 30,March 31, 2007, December 31, 2006, and September 30, 2005,March 31, 2006, including the Total VAR, the specific risk only component of VAR, and Total—General market factors only, along with the quarterly averages:
| In million of dollars | September 30, 2006 | Third Quarter 2006 Average | June 30, 2006 | Second Quarter 2006 Average | September 30, 2005 | Third Quarter 2005 Average | March 31, 2007 | First Quarter 2007 Average | December 31, 2006 | Fourth Quarter 2006 Average | March 31, 2006 | First Quarter 2006 Average | ||||||||||||||||||||||||||
|---|---|---|---|---|---|---|---|---|---|---|---|---|---|---|---|---|---|---|---|---|---|---|---|---|---|---|---|---|---|---|---|---|---|---|---|---|---|---|
| Interest rate | $ | 89 | $ | 81 | $ | 96 | $ | 103 | $ | 69 | $ | 78 | $ | 99 | $ | 95 | $ | 81 | $ | 79 | $ | 95 | $ | 86 | ||||||||||||||
| Foreign exchange | 28 | 26 | 27 | 29 | 13 | 14 | 29 | 28 | 27 | 30 | 29 | 23 | ||||||||||||||||||||||||||
| Equity | 44 | 42 | 41 | 51 | 54 | 44 | 77 | 70 | 62 | 51 | 43 | 48 | ||||||||||||||||||||||||||
| Commodity | 11 | 13 | 13 | 19 | 13 | 15 | 27 | 28 | 18 | 15 | 15 | 12 | ||||||||||||||||||||||||||
| Covariance adjustment | (82 | ) | (76 | ) | (80 | ) | (87 | ) | (56 | ) | (59 | ) | (110 | ) | (100 | ) | (82 | ) | (79 | ) | (76 | ) | (67 | ) | ||||||||||||||
| Total—All market risk factors, including general and specific risk | $ | 90 | $ | 86 | $ | 97 | $ | 115 | $ | 93 | $ | 92 | ||||||||||||||||||||||||||
| Total — All market risk factors, including general and specific risk | $ | 122 | $ | 121 | $ | 106 | $ | 96 | $ | 106 | $ | 102 | ||||||||||||||||||||||||||
| Specific risk only component | $ | 9 | $ | 10 | $ | 5 | $ | 10 | $ | 8 | $ | 6 | $ | 5 | $ | 12 | $ | 8 | $ | 12 | $ | 10 | $ | 11 | ||||||||||||||
| Total—General market factors only | $ | 81 | $ | 76 | $ | 92 | $ | 105 | $ | 85 | $ | 86 | ||||||||||||||||||||||||||
| Total — General market factors only | $ | 117 | $ | 109 | $ | 98 | $ | 84 | $ | 96 | $ | 91 | ||||||||||||||||||||||||||
The specific risk-onlyrisk only component represents the level of equity and debt issuer-specific risk embedded in VAR. Citigroup's specific risk model conforms to the 4x-multiplier treatment approved by the Federal Reserve and is subject to extensive annual hypothetical back-testing.
The table below provides the range of VAR in each type of trading portfolio that was experienced during the quarters ended:
| | September 30, 2006 | June 30, 2006 | September 30, 2005 | March 31, 2007 | December 31, 2006 | March 31, 2006 | ||||||||||||||||||||||||||||||
|---|---|---|---|---|---|---|---|---|---|---|---|---|---|---|---|---|---|---|---|---|---|---|---|---|---|---|---|---|---|---|---|---|---|---|---|---|
| In millions of dollars | Low | High | Low | High | Low | High | Low | High | Low | High | Low | High | ||||||||||||||||||||||||
| Interest rate | $ | 68 | $ | 106 | $ | 86 | $ | 125 | $ | 62 | $ | 112 | $ | 71 | $ | 125 | $ | 64 | $ | 98 | $ | 69 | $ | 107 | ||||||||||||
| Foreign exchange | 17 | 39 | 21 | 40 | 9 | 20 | 21 | 35 | 23 | 45 | 16 | 34 | ||||||||||||||||||||||||
| Equity | 35 | 49 | 41 | 68 | 32 | 60 | 55 | 85 | 41 | 65 | 42 | 58 | ||||||||||||||||||||||||
| Commodity | 9 | 18 | 12 | 25 | 13 | 17 | 17 | 34 | 11 | 20 | 5 | 18 | ||||||||||||||||||||||||
OPERATIONAL RISK MANAGEMENT PROCESS
Operational risk is the risk of loss resulting from inadequate or failed internal processes, people or systems, or from external events. It includes the reputation and franchise risk associated with business practices or market conduct that the Company undertakes. Operational risk is inherent in Citigroup's global business activities and, as with other risk types, is managed through an overall framework with checks and balances that include:
Framework
Citigroup's approach to operational risk is defined in the Citigroup Risk and Control Self-Assessment (RCSA)/ Operational Risk Policy.
The Operational Risk portion codifiesobjective of the core governing principles and providesPolicy is to establish a consistent, value-added framework for managingassessing and communicating operational risksrisk and the overall effectiveness of the internal control environment across the Company.Citigroup. Each major business segment must establish its ownimplement an operational risk procedures,process consistent with the corporate policy, and an approved governance structure.requirements of this Policy. The policy requires each business to identify its key operational risks as well as the controls established to mitigate those risks and to ensure compliance with laws, regulations, regulatory administrative actions, and Citigroup policies. It also requires that all businesses collect and report theirprocess for operational risk loss data.includes the following steps:
The Operational Risk standards facilitate the effective communication of operational risk both within and across businesses. Information about the businesses' operational risk, historical losses, and the control environment is reported by each major business segment and functional area, and summarized for Senior Management and the Citigroup Board of Directors.
The RCSA portion establishesstandards establish a formal governance structure to provide direction, oversight, and monitoring of Citigroup's RCSA programs. The RCSA standards for risk and control assessment are applicable to all businesses and staff functions. It also establishesThey establish RCSA as the process whereby important risks inherent in a business' activities are identified and the effectiveness of the key controls over those risks are evaluated and monitored. RCSA processes facilitate Citigroup's adherence to regulatory requirements, including Sarbanes-Oxley, FDICIA, the International Convergence of Capital Measurement and Capital Standards (Basel II), and other corporate initiatives, including Operational Risk Management and alignment of capital assessments with risk management objectives. The entire process is subject to audit by Citigroup's ARR, and the results of RCSA are included in periodic management reporting, including reporting to Senior Management and the Audit and Risk Management Committee.
Measurement and Basel II
To support advanced capital modeling and management, the businesses are required to capture relevant operational Risk Capital (RC)risk capital information. An enhanced version of the RCrisk capital model for operational risk has been developed and is being implemented across the major business segments as a step toward readiness for Basel II capital calculations. The RCrisk capital calculation is designed to qualify as an "Advanced Measurement Approach" (AMA) under Basel II. It uses a combination of internal and external loss data to support statistical modeling of capital requirement estimates, which are then adjusted to reflect qualitative data regarding the operational risk and control environment.
Information Security and Continuity of Business
During 2005 and continuing in 2006, Citigroup continues to enhance a strategic framework for Information Security technology initiatives, and the Company beganis implementing enhancements to various Information Security programs across its businesses covering Information Security Risk Management, Security Incident Response and Electronic Transportable Media. The Company also implementedcontinues to implement tools to increase the effectiveness of its data protection and entitlement management programs. Additional monthly Information Security metrics were established to better assist the Information Technology Risk Officer in managing enterprise-wide risk. The Information Security Program complies with the Gramm-Leach- BlileyGramm-Leach-Bliley Act and other regulatory guidance.
During 2005, Citigroup began implementing a new business continuity program that improves risk analysis and provides robust support in case of business interruption. The Corporate Office of Business Continuity, with the support of senior management,Senior Management, continues to coordinate global preparedness and mitigate business continuity risks by reviewing and testing recovery procedures.
COUNTRY AND CROSS-BORDER RISK
MANAGEMENT PROCESS
Country Risk
Country risk is the risk that an event in a foreign country will impair the value of Citigroup assets or will adversely affect the ability of obligors within that country to honor their obligations to Citigroup. Country risk events may include sovereign defaults, banking or currency crises, social instability, and changes in governmental policies (for example, expropriation, nationalization, confiscation of assets and other changes in legislation relating to international ownership). Country risk includes local franchise risk, credit risk, market risk, operational risk, and cross-border risk.
The Country risk management framework at Citigroup includes a number of tools and management processes designed to facilitate the ongoing analysis of individual countries and their risks. These include country risk rating models, scenario planning and stress testing, internal watch lists, and the Country Risk Committee process.
The Citigroup Country Risk Committee is the senior forum to evaluate the Company's total business footprint within a specific country franchise with emphasis on responses to current potential country risk events. The Committee is chaired by the Head of Global Country Risk Management and includes as its members senior risk management officers, senior regional business heads, and senior product heads. The Committee regularly reviews all risk exposures within a country, makes recommendations as to actions, and follows up to ensure appropriate accountability.
Cross-Border Risk
Cross-border risk is the risk that actions taken by a non-U.S. government may prevent the conversion of local currency into non-local currency and/or the transfer of funds outside of the country, thereby impacting the ability of the Company and its customers to transact business across borders. Examples of cross-border risk include actions taken by foreign governments such as exchange controls, debt moratoria, or restrictions on the remittance of funds. These actions might restrict the transfer of funds or the inabilityability of the Company to obtain payment from customers on their contractual obligations.
Management oversight of cross-border risk is performed through a formal review process that includes annual setting of cross-border limits and/or exposures, monitoring of economic conditions globally, and the establishment of internal cross-border risk management policies.
Under Federal Financial Institutions Examination Council (FFIEC) regulatory guidelines, total reported cross-border outstandings include cross-border claims on third parties, as well as investments in and funding of local franchises. Cross-border claims on third parties (trade, short-term, and medium- and long-term claims) include cross-border loans, securities, deposits with banks, investments in affiliates, and other monetary assets, as well as net revaluation gains on foreign exchange and derivative products.
Cross-border outstandings are reported based on the country of the obligor or guarantor. Outstandings backed by cash collateral are assigned to the country in which the collateral is held. For securities received as collateral, cross-border outstandings are reported in the domicile of the issuer of the securities. Cross-border resale agreements are presented based on the domicile of the counterparty in accordance with FFIEC guidelines.
Investments in and funding of local franchises represent the excess of local country assets over local country liabilities. Local country assets are claims on local residents recorded by branches and majority-owned subsidiaries of Citigroup domiciled in the country, adjusted for externally guaranteed claims and certain collateral. Local country liabilities are obligations of non-U.S. branches and majority-owned subsidiaries of Citigroup for which no cross-border guarantee has been issued by another Citigroup office.
The table below shows all countries where total FFIEC cross-border outstandings exceed 0.75% of total Citigroup assets:
| | | | | | | September 30, 2006 | December 31, 2005 | March 31, 2007 | December 31, 2006 | |||||||||||||||||||||||||||||||||||||||||||||||||||
|---|---|---|---|---|---|---|---|---|---|---|---|---|---|---|---|---|---|---|---|---|---|---|---|---|---|---|---|---|---|---|---|---|---|---|---|---|---|---|---|---|---|---|---|---|---|---|---|---|---|---|---|---|---|---|---|---|---|---|---|---|
| | Cross-Border Claims on Third Parties | Investments in and Funding of Local Franchises | | | | | Cross-Border Claims on Third Parties | | | | | | ||||||||||||||||||||||||||||||||||||||||||||||||
| | Total Cross- Border Outstandings | | Total Cross- Border Outstandings | | Investments in and Funding of Local Franchises | Total Cross- Border Out- standings | | Total Cross- Border Out- standings | | |||||||||||||||||||||||||||||||||||||||||||||||||||
| | Banks | Public | Private | Total | Trading and Short-Term Claims(1) | Commitments(2) | Commitments(2) | Banks | Public | Private | Total | Trading and Short- Term Claims(1) | Commit- ments(2) | Commit- ments | ||||||||||||||||||||||||||||||||||||||||||||||
| Germany | $ | 20.4 | $ | 5.7 | $ | 8.4 | $ | 34.5 | $ | 32.0 | $ | — | $ | 34.5 | $ | 41.9 | $ | 14.8 | $ | 25.0 | $ | 19.3 | $ | 11.5 | $ | 8.8 | $ | 39.6 | $ | 35.8 | $ | 2.5 | $ | 42.1 | $ | 46.8 | $ | 38.6 | $ | 43.6 | ||||||||||||||||||||
| India | 0.6 | 0.1 | 7.2 | 7.9 | 6.8 | 13.8 | 21.7 | 0.6 | 6.5 | 0.7 | 1.0 | 0.1 | 8.6 | 9.7 | 7.3 | 17.8 | 27.5 | 8.3 | 24.8 | 0.7 | ||||||||||||||||||||||||||||||||||||||||
| South Korea | 0.7 | 1.0 | 2.8 | 4.5 | 4.4 | 16.2 | 20.7 | 11.9 | 14.8 | 5.2 | ||||||||||||||||||||||||||||||||||||||||||||||||||
| Netherlands | 5.5 | 3.1 | 11.3 | 19.9 | 17.4 | — | 19.9 | 9.7 | 15.8 | 9.2 | 9.9 | 3.2 | 12.7 | 25.8 | 22.9 | — | 25.8 | 13.6 | 20.1 | 10.5 | ||||||||||||||||||||||||||||||||||||||||
| France | 6.9 | 2.0 | 9.2 | 18.1 | 16.2 | — | 18.1 | 47.6 | 14.9 | 33.5 | 7.6 | 5.6 | 12.5 | 25.7 | 23.3 | — | 25.7 | 77.1 | 19.8 | 60.8 | ||||||||||||||||||||||||||||||||||||||||
| United Kingdom | 6.2 | 0.1 | 14.1 | 20.4 | 13.9 | — | 20.4 | 219.9 | 18.4 | 192.8 | ||||||||||||||||||||||||||||||||||||||||||||||||||
| Spain | 1.8 | 4.8 | 5.4 | 12.0 | 11.1 | 3.4 | 15.4 | 3.4 | 7.4 | 2.8 | 3.4 | 6.5 | 6.6 | 16.5 | 15.1 | 3.8 | 20.3 | 6.6 | 19.7 | 6.8 | ||||||||||||||||||||||||||||||||||||||||
| United Kingdom | 5.3 | 0.1 | 8.4 | 13.8 | 10.0 | — | 13.8 | 174.1 | 20.8 | 103.8 | ||||||||||||||||||||||||||||||||||||||||||||||||||
| South Korea | 0.9 | 1.2 | 3.7 | 5.8 | 5.8 | 14.3 | 20.1 | 10.1 | 19.7 | 11.4 | ||||||||||||||||||||||||||||||||||||||||||||||||||
| Italy | 1.0 | 6.5 | 4.9 | 12.4 | 11.6 | — | 12.4 | 3.5 | 10.9 | 3.0 | 2.3 | 9.5 | 4.0 | 15.8 | 15.3 | 0.7 | 16.5 | 4.7 | 18.6 | 4.0 | ||||||||||||||||||||||||||||||||||||||||
| Canada | 1.5 | 0.1 | 2.9 | 4.5 | 4.0 | 7.2 | 11.7 | 8.5 | 9.1 | 2.9 | ||||||||||||||||||||||||||||||||||||||||||||||||||
INTEREST REVENUE/EXPENSE AND YIELDS
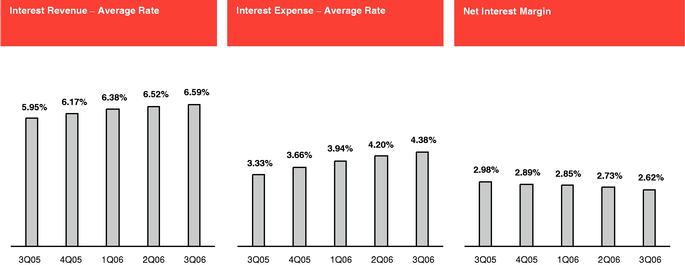
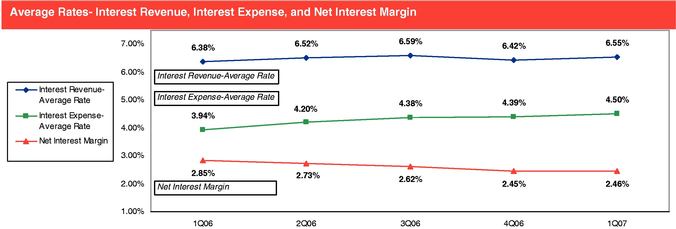
| In millions of dollars | In millions of dollars | 3rd Qtr. 2006 | 2nd Qtr. 2006 | 3rd Qtr. 2005 | % Change 3Q06 vs. 3Q05 | In millions of dollars | 1st Qtr. 2007 | 4th Qtr. 2006(1) | 1st Qtr. 2006 | % Change 1Q07 vs. 1Q06 | ||||||||||||||||
|---|---|---|---|---|---|---|---|---|---|---|---|---|---|---|---|---|---|---|---|---|---|---|---|---|---|---|
| Interest Revenue | Interest Revenue | $ | 24,729 | $ | 23,572 | $ | 19,344 | 28 | % | Interest Revenue | $ | 28,132 | $ | 26,257 | $ | 21,873 | 29 | % | ||||||||
| Interest Expense | Interest Expense | 14,901 | 13,717 | 9,649 | 54 | Interest Expense | 17,562 | 16,218 | 12,107 | 45 | ||||||||||||||||
| Net Interest Revenue | Net Interest Revenue | $ | 9,828 | $ | 9,855 | $ | 9,695 | 1 | % | Net Interest Revenue | $ | 10,570 | $ | 10,039 | $ | 9,766 | 8 | % | ||||||||
| Interest Revenue—Average Rate | Interest Revenue—Average Rate | 6.59 | % | 6.52 | % | 5.95 | % | 64 bps | Interest Revenue—Average Rate | 6.55 | % | 6.42 | % | 6.38 | % | 17 bps | ||||||||||
| Interest Expense—Average Rate | Interest Expense—Average Rate | 4.38 | % | 4.20 | % | 3.33 | % | 105 bps | Interest Expense—Average Rate | 4.50 | % | 4.39 | % | 3.94 | % | 56 bps | ||||||||||
| Net Interest Margin | 2.62 | % | 2.73 | % | 2.98 | % | (36) bps | |||||||||||||||||||
| Net Interest Margin (NIM) | Net Interest Margin (NIM) | 2.46 | % | 2.45 | % | 2.85 | % | (39) bps | ||||||||||||||||||
| Interest Rate Benchmarks: | Interest Rate Benchmarks: | Interest Rate Benchmarks: | ||||||||||||||||||||||||
| Federal Funds Rate—End of Period | Federal Funds Rate—End of Period | 5.25 | % | 5.25 | % | 3.75 | % | 150 bps | Federal Funds Rate—End of Period | 5.25 | % | 5.25 | % | 4.75 | % | 50 bps | ||||||||||
| 2 Year U.S. Treasury Note—Average Rate | 2 Year U.S. Treasury Note—Average Rate | 4.93 | % | 4.99 | % | 3.94 | % | 99 bps | 2 Year U.S. Treasury Note—Average Rate | 4.76 | % | 4.74 | % | 4.60 | % | 16 bps | ||||||||||
| 10 Year U.S. Treasury Note—Average Rate | 10 Year U.S. Treasury Note—Average Rate | 4.89 | % | 5.07 | % | 4.20 | % | 69 bps | 10 Year U.S. Treasury Note—Average Rate | 4.68 | % | 4.63 | % | 4.57 | % | 11 bps | ||||||||||
| 10 Year vs. 2 Year Spread | (4) bps | 8 bps | 26 bps | 10 Year vs. 2 Year Spread | (8) bps | (11) bps | (3) bps | |||||||||||||||||||
A significant portion of the Company's business activities is based upon gathering deposits and borrowing money and then lending or investing those funds, including in market-making activities in tradable securities. Net interest margin is calculated by dividing gross interest revenue less gross interest expense by average interest earning assets.
In theDuring 2006 third quarter,and into 2007, pressure on net interest margin continued, though driven by several factors. Interest expense increased due to both a rise in short-term interest rates and funding actions the Company has taken to lengthen its debt maturity profile.
The average rate on the Company's assets increased, during the period, but by less than the increase in average rates on borrowed funds or deposits. The average rate on loans or investmentsassets reflected a highly competitive loan pricing environment, as well as a shift in the Company's loan portfolio from higher-yielding credit card receivables to assets that carry lower yields, such as mortgages and home equity loans. The shift partially reflects continued high payment rates on credit card receivables. The majority of the sequential decline in net interest margin was due to trading activities inCapital Markets and Banking.
AVERAGE BALANCES AND INTEREST RATES—ASSETS(1) (2) (3) (4)
| | | Average Volume | Interest Revenue | % Average Rate(10) | | Average Volume | Interest Revenue | % Average Rate | ||||||||||||||||||||||||||||||||||||||||||||
|---|---|---|---|---|---|---|---|---|---|---|---|---|---|---|---|---|---|---|---|---|---|---|---|---|---|---|---|---|---|---|---|---|---|---|---|---|---|---|---|---|---|---|---|---|---|---|---|---|---|---|---|---|
| In millions of dollars | In millions of dollars | 3rd Qtr. 2006 | 2nd Qtr. 2006 | 3rd Qtr. 2005 | 3rd Qtr. 2006 | 2nd Qtr. 2006 | 3rd Qtr. 2005 | 3rd Qtr. 2006 | 2nd Qtr. 2006 | 3rd Qtr. 2005 | In millions of dollars | 1st Qtr. 2007 | 4th Qtr. 2006 | 1st Qtr. 2006 | 1st Qtr. 2007 | 4th Qtr. 2006 | 1st Qtr. 2006 | 1st Qtr. 2007 | 4th Qtr. 2006 | 1st Qtr. 2006 | ||||||||||||||||||||||||||||||||
| Assets | Assets | Assets | ||||||||||||||||||||||||||||||||||||||||||||||||||
| Deposits at interest with banks(5) | $ | 37,508 | $ | 38,951 | $ | 35,118 | $ | 713 | $ | 630 | $ | 438 | 7.54 | % | 6.49 | % | 4.95 | % | ||||||||||||||||||||||||||||||||||
| Deposits with banks(5) | Deposits with banks(5) | $ | 45,306 | $ | 40,598 | $ | 34,851 | $ | 709 | $ | 693 | $ | 489 | 6.35 | % | 6.77 | % | 5.69 | % | |||||||||||||||||||||||||||||||||
| Federal funds sold and securities borrowed or purchased under agreements to resell(6) | Federal funds sold and securities borrowed or purchased under agreements to resell(6) | Federal funds sold and securities borrowed or purchased under agreements to resell(6) | ||||||||||||||||||||||||||||||||||||||||||||||||||
| In U.S. offices | In U.S. offices | $ | 166,526 | $ | 163,276 | $ | 160,453 | $ | 2,718 | $ | 2,450 | $ | 1,909 | 6.48 | % | 6.02 | % | 4.72 | % | In U.S. offices | $ | 184,069 | $ | 175,679 | $ | 159,327 | $ | 2,879 | $ | 2,735 | $ | 2,355 | 6.34 | % | 6.18 | % | 5.99 | % | ||||||||||||||
| In offices outside the U.S.(5) | In offices outside the U.S.(5) | 81,145 | 87,806 | 76,474 | 995 | 947 | 732 | 4.86 | 4.33 | 3.80 | In offices outside the U.S.(5) | 109,226 | 90,138 | 81,709 | 1,410 | 1,149 | 850 | 5.24 | 5.06 | 4.22 | ||||||||||||||||||||||||||||||||
| Total | Total | $ | 247,671 | $ | 251,082 | $ | 236,927 | $ | 3,713 | $ | 3,397 | $ | 2,641 | 5.95 | % | 5.43 | % | 4.42 | % | Total | $ | 293,295 | $ | 265,817 | $ | 241,036 | $ | 4,289 | $ | 3,884 | $ | 3,205 | 5.93 | % | 5.80 | % | 5.39 | % | ||||||||||||||
| Trading account assets(7)(8) | ||||||||||||||||||||||||||||||||||||||||||||||||||||
| Trading account assets(7) (8) | Trading account assets(7) (8) | |||||||||||||||||||||||||||||||||||||||||||||||||||
| In U.S. offices | In U.S. offices | $ | 184,099 | $ | 181,415 | $ | 153,342 | $ | 1,801 | $ | 2,036 | $ | 1,302 | 3.88 | % | 4.50 | % | 3.37 | % | In U.S. offices | $ | 236,977 | $ | 213,644 | $ | 176,782 | $ | 2,822 | $ | 2,518 | $ | 1,886 | 4.83 | % | 4.68 | % | 4.33 | % | ||||||||||||||
| In offices outside the U.S.(5) | In offices outside the U.S.(5) | 100,196 | 99,644 | 77,063 | 757 | 852 | 545 | 3.00 | 3.43 | 2.81 | In offices outside the U.S.(5) | 133,274 | 113,730 | 88,967 | 1,108 | 850 | 814 | 3.37 | 2.97 | 3.71 | ||||||||||||||||||||||||||||||||
| Total | Total | $ | 284,295 | $ | 281,059 | $ | 230,405 | $ | 2,558 | $ | 2,888 | $ | 1,847 | 3.57 | % | 4.12 | % | 3.18 | % | Total | $ | 370,251 | $ | 327,374 | $ | 265,749 | $ | 3,930 | $ | 3,368 | $ | 2,700 | 4.30 | % | 4.08 | % | 4.12 | % | ||||||||||||||
| Investments(1) | Investments(1) | Investments(1) | ||||||||||||||||||||||||||||||||||||||||||||||||||
| In U.S. offices | In U.S. offices | In U.S. offices | ||||||||||||||||||||||||||||||||||||||||||||||||||
| Taxable | $ | 105,713 | $ | 85,292 | $ | 80,670 | $ | 1,177 | $ | 873 | $ | 703 | 4.42 | % | 4.11 | % | 3.46 | % | Taxable | $ | 160,372 | $ | 148,601 | $ | 84,938 | $ | 2,000 | $ | 1,965 | $ | 784 | 5.06 | % | 5.25 | % | 3.74 | % | |||||||||||||||
| Exempt from U.S. income tax | 12,285 | 15,470 | 11,562 | 153 | 182 | 122 | 4.94 | 4.72 | 4.19 | Exempt from U.S. income tax | 16,810 | 14,229 | 14,108 | 190 | 173 | 153 | 4.58 | 4.82 | 4.40 | |||||||||||||||||||||||||||||||||
| In offices outside the U.S.(5) | In offices outside the U.S.(5) | 100,999 | 97,138 | 79,540 | 1,276 | 1,200 | 989 | 5.01 | 4.95 | 4.93 | In offices outside the U.S.(5) | 107,079 | 103,993 | 92,431 | 1,350 | 1,344 | 1,119 | 5.11 | 5.13 | 4.91 | ||||||||||||||||||||||||||||||||
| Total | Total | $ | 218,997 | $ | 197,900 | $ | 171,772 | $ | 2,606 | $ | 2,255 | $ | 1,814 | 4.72 | % | 4.57 | % | 4.19 | % | Total | $ | 284,261 | $ | 266,823 | $ | 191,477 | $ | 3,540 | $ | 3,482 | $ | 2,056 | 5.05 | % | 5.18 | % | 4.35 | % | ||||||||||||||
| Loans (net of unearned income)(9) | Loans (net of unearned income)(9) | Loans (net of unearned income)(9) | ||||||||||||||||||||||||||||||||||||||||||||||||||
| Consumer loans | Consumer loans | Consumer loans | ||||||||||||||||||||||||||||||||||||||||||||||||||
| In U.S. offices | In U.S. offices | $ | 345,064 | $ | 339,997 | $ | 307,180 | $ | 7,264 | $ | 7,071 | $ | 6,368 | 8.35 | % | 8.34 | % | 8.22 | % | In U.S. offices | $ | 362,860 | $ | 353,174 | $ | 327,026 | $ | 7,458 | $ | 7,475 | $ | 6,662 | 8.34 | % | 8.40 | % | 8.26 | % | ||||||||||||||
| In offices outside the U.S.(5) | In offices outside the U.S.(5) | 140,594 | 136,648 | 130,420 | 3,870 | 3,834 | 3,628 | 10.92 | 11.25 | 11.04 | In offices outside the U.S.(5) | 151,523 | 147,304 | 131,365 | 4,033 | 3,379 | 3,690 | 10.79 | 9.10 | 11.39 | ||||||||||||||||||||||||||||||||
| Total consumer loans | Total consumer loans | $ | 485,658 | $ | 476,645 | $ | 437,600 | $ | 11,134 | $ | 10,905 | $ | 9,996 | 9.10 | % | 9.18 | % | 9.06 | % | Total consumer loans | $ | 514,383 | $ | 500,478 | $ | 458,391 | $ | 11,491 | $ | 10,854 | $ | 10,352 | 9.06 | % | 8.60 | % | 9.16 | % | ||||||||||||||
| Corporate loans | Corporate loans | Corporate loans | ||||||||||||||||||||||||||||||||||||||||||||||||||
| In U.S. offices | In U.S. offices | $ | 28,604 | $ | 25,740 | $ | 20,009 | $ | 528 | $ | 440 | $ | 285 | 7.32 | % | 6.86 | % | 5.65 | % | In U.S. offices | $ | 28,685 | $ | 30,928 | $ | 27,181 | $ | 538 | $ | 542 | $ | 431 | 7.61 | % | 6.95 | % | 6.43 | % | ||||||||||||||
| In offices outside the U.S.(5) | In offices outside the U.S.(5) | 130,212 | 122,944 | 101,204 | 2,728 | 2,298 | 1,754 | 8.31 | 7.50 | 6.88 | In offices outside the U.S.(5) | 136,103 | 132,729 | 111,961 | 2,906 | 2,775 | 2,035 | 8.66 | 8.29 | 7.37 | ||||||||||||||||||||||||||||||||
| Total corporate loans | Total corporate loans | $ | 158,816 | $ | 148,684 | $ | 121,213 | $ | 3,256 | $ | 2,738 | $ | 2,039 | 8.13 | % | 7.39 | % | 6.67 | % | Total corporate loans | $ | 164,788 | $ | 163,657 | $ | 139,142 | $ | 3,444 | $ | 3,317 | $ | 2,466 | 8.48 | % | 8.04 | % | 7.19 | % | ||||||||||||||
| Total loans | Total loans | $ | 644,474 | $ | 625,329 | $ | 558,813 | $ | 14,390 | $ | 13,643 | $ | 12,035 | 8.86 | % | 8.75 | % | 8.54 | % | Total loans | $ | 679,171 | $ | 664,135 | $ | 597,533 | $ | 14,935 | $ | 14,171 | $ | 12,818 | 8.92 | % | 8.47 | % | 8.70 | % | ||||||||||||||
| Other interest-earning assets | Other interest-earning assets | $ | 56,717 | $ | 55,081 | $ | 56,060 | $ | 749 | $ | 759 | $ | 569 | 5.24 | % | 5.53 | % | 4.03 | % | Other interest-earning assets | $ | 68,379 | $ | 58,881 | $ | 59,208 | $ | 729 | $ | 659 | $ | 605 | 4.32 | % | 4.44 | % | 4.14 | % | ||||||||||||||
| Total interest-earning assets | Total interest-earning assets | $ | 1,489,662 | $ | 1,449,402 | $ | 1,289,095 | $ | 24,729 | $ | 23,572 | $ | 19,344 | 6.59 | % | 6.52 | % | 5.95 | % | Total interest-earning assets | $ | 1,740,663 | $ | 1,623,628 | $ | 1,389,854 | $ | 28,132 | $ | 26,257 | $ | 21,873 | 6.55 | % | 6.42 | % | 6.38 | % | ||||||||||||||
| Non-interest-earning assets(7) | Non-interest-earning assets(7) | 194,550 | 195,670 | 165,833 | Non-interest-earning assets(7) | 204,255 | 193,135 | 182,280 | ||||||||||||||||||||||||||||||||||||||||||||
| Total assets from discontinued operations | Total assets from discontinued operations | — | — | 1,527 | Total assets from discontinued operations | — | — | — | ||||||||||||||||||||||||||||||||||||||||||||
| Total assets | Total assets | $ | 1,684,212 | $ | 1,645,072 | $ | 1,456,455 | Total assets | $ | 1,944,918 | $ | 1,816,763 | $ | 1,572,134 | ||||||||||||||||||||||||||||||||||||||
Reclassified to conform to the current period's presentation.
AVERAGE BALANCES AND INTEREST RATES—LIABILITIES AND EQUITY,
AND NET INTEREST REVENUE(1)(2)(3)(4)
| | | Average Volume | Interest Expense | % Average Rate(12) | | Average Volume | Interest Expense | % Average Rate | ||||||||||||||||||||||||||||||||||||||||||||
|---|---|---|---|---|---|---|---|---|---|---|---|---|---|---|---|---|---|---|---|---|---|---|---|---|---|---|---|---|---|---|---|---|---|---|---|---|---|---|---|---|---|---|---|---|---|---|---|---|---|---|---|---|
| In millions of dollars | In millions of dollars | 3rd Qtr. 2006 | 2nd Qtr. 2006 | 3rd Qtr. 2005 | 3rd Qtr. 2006 | 2nd Qtr. 2006 | 3rd Qtr. 2005 | 3rd Qtr. 2006 | 2nd Qtr 2006 | 3rd Qtr. 2005 | In millions of dollars | 1st Qtr. 2007 | 4th Qtr. 2006 | 1st Qtr. 2006 | 1st Qtr. 2007 | 4th Qtr. 2006 | 1st Qtr. 2006 | 1st Qtr. 2007 | 4th Qtr. 2006 | 1st Qtr. 2006 | ||||||||||||||||||||||||||||||||
| Liabilities | Liabilities | Liabilities | ||||||||||||||||||||||||||||||||||||||||||||||||||
| Deposits | Deposits | Deposits | ||||||||||||||||||||||||||||||||||||||||||||||||||
| In U. S. offices Savings deposits(5) | $ | 134,486 | $ | 133,958 | $ | 128,046 | $ | 1,092 | $ | 1,002 | $ | 655 | 3.22 | % | 3.00 | % | 2.03 | % | ||||||||||||||||||||||||||||||||||
| In U. S. offices | In U. S. offices | |||||||||||||||||||||||||||||||||||||||||||||||||||
| Other time deposits | 51,158 | 45,292 | 36,735 | 678 | 579 | 380 | 5.26 | 5.13 | 4.10 | Savings deposits(5) | $ | 145,259 | $ | 138,332 | $ | 132,268 | $ | 1,170 | $ | 1,094 | $ | 868 | 3.27 | % | 3.14 | % | 2.66 | % | ||||||||||||||||||||||||
| Other time deposits | Other time deposits | 54,946 | 55,374 | 42,410 | 807 | 715 | 499 | 5.96 | 5.12 | 4.77 | ||||||||||||||||||||||||||||||||||||||||||
| In offices outside the U.S.(6) | In offices outside the U.S.(6) | 416,084 | 394,805 | 344,158 | 4,001 | 3,623 | 2,581 | 3.81 | 3.68 | 2.98 | In offices outside the U.S.(6) | 448,074 | 433,273 | 370,421 | 4,581 | 4,368 | 3,138 | 4.15 | 4.00 | 3.44 | ||||||||||||||||||||||||||||||||
| Total | Total | $ | 601,728 | $ | 574,055 | $ | 508,939 | $ | 5,771 | $ | 5,204 | $ | 3,616 | 3.81 | % | 3.64 | % | 2.82 | % | Total | $ | 648,279 | $ | 626,979 | $ | 545,099 | $ | 6,558 | $ | 6,177 | $ | 4,505 | 4.10 | % | 3.91 | % | 3.35 | % | ||||||||||||||
| Federal funds purchased and securities loaned or sold under agreements to repurchase(7) | Federal funds purchased and securities loaned or sold under agreements to repurchase(7) | Federal funds purchased and securities loaned or sold under agreements to repurchase(7) | ||||||||||||||||||||||||||||||||||||||||||||||||||
| In U.S. offices | In U.S. offices | $ | 188,052 | $ | 187,346 | $ | 174,735 | $ | 2,992 | $ | 2,955 | $ | 2,067 | 6.31 | % | 6.33 | % | 4.69 | % | In U.S. offices | $ | 237,732 | $ | 218,357 | $ | 185,147 | $ | 3,541 | $ | 3,234 | $ | 2,676 | 6.04 | % | 5.88 | % | 5.86 | % | ||||||||||||||
| In offices outside the U.S. (6) | 93,032 | 97,408 | 70,372 | 1,404 | 1,364 | 1,060 | 5.99 | 5.62 | 5.98 | |||||||||||||||||||||||||||||||||||||||||||
| In offices outside the U.S.(6) | In offices outside the U.S.(6) | 128,641 | 105,222 | 88,086 | 1,942 | 1,600 | 1,223 | 6.12 | 6.03 | 5.63 | ||||||||||||||||||||||||||||||||||||||||||
| Total | Total | $ | 281,084 | $ | 284,754 | $ | 245,107 | $ | 4,396 | $ | 4,319 | $ | 3,127 | 6.20 | % | 6.08 | % | 5.06 | % | Total | $ | 366,373 | $ | 323,579 | $ | 273,233 | $ | 5,483 | $ | 4,834 | $ | 3,899 | 6.07 | % | 5.93 | % | 5.79 | % | ||||||||||||||
| Trading account liabilities(8)(9) | ||||||||||||||||||||||||||||||||||||||||||||||||||||
| Trading account liabilities(8) (9) | Trading account liabilities(8) (9) | |||||||||||||||||||||||||||||||||||||||||||||||||||
| In U.S. offices | In U.S. offices | $ | 37,601 | $ | 35,503 | $ | 34,462 | $ | 39 | $ | 48 | $ | 20 | 0.41 | % | 0.54 | % | 0.23 | % | In U.S. offices | $ | 42,319 | $ | 39,557 | $ | 35,270 | $ | 235 | $ | 229 | $ | 192 | 2.25 | % | 2.30 | % | 2.21 | % | ||||||||||||||
| In offices outside the U.S. (6) | In offices outside the U.S. (6) | 35,644 | 39,364 | 40,048 | 17 | 14 | 12 | 0.19 | 0.14 | 0.12 | In offices outside the U.S. (6) | 45,340 | 39,716 | 36,485 | 72 | 65 | 51 | 0.64 | 0.65 | 0.57 | ||||||||||||||||||||||||||||||||
| Total | Total | $ | 73,245 | $ | 74,867 | $ | 74,510 | $ | 56 | $ | 62 | $ | 32 | 0.30 | % | 0.33 | % | 0.17 | % | Total | $ | 87,659 | $ | 79,273 | $ | 71,755 | $ | 307 | $ | 294 | $ | 243 | 1.42 | % | 1.47 | % | 1.37 | % | ||||||||||||||
| Short-term borrowings | Short-term borrowings | Short-term borrowings | ||||||||||||||||||||||||||||||||||||||||||||||||||
| In U.S. offices | In U.S. offices | $ | 121,503 | $ | 118,686 | $ | 89,960 | $ | 1,379 | $ | 1,151 | $ | 641 | 4.50 | % | 3.89 | % | 2.83 | % | In U.S. offices | $ | 143,544 | $ | 126,950 | $ | 113,351 | $ | 1,262 | $ | 1,283 | $ | 765 | 3.57 | % | 4.01 | % | 2.74 | % | ||||||||||||||
| In offices outside the U.S. (6) | In offices outside the U.S. (6) | 23,446 | 25,501 | 17,409 | 139 | 197 | 204 | 2.35 | 3.10 | 4.65 | In offices outside the U.S. (6) | 40,835 | 32,238 | 18,179 | 202 | 159 | 200 | 2.01 | 1.96 | 4.46 | ||||||||||||||||||||||||||||||||
| Total | Total | $ | 144,949 | $ | 144,187 | $ | 107,369 | $ | 1,518 | $ | 1,348 | $ | 845 | 4.15 | % | 3.75 | % | 3.12 | % | Total | $ | 184,379 | $ | 159,188 | $ | 131,530 | $ | 1,464 | $ | 1,442 | $ | 965 | 3.22 | % | 3.59 | % | 2.98 | % | ||||||||||||||
| Long-term debt | Long-term debt | Long-term debt | ||||||||||||||||||||||||||||||||||||||||||||||||||
| In U.S. offices | In U.S. offices | $ | 218,766 | $ | 201,917 | $ | 182,772 | $ | 2,802 | $ | 2,476 | $ | 1,736 | 5.08 | % | 4.92 | % | 3.77 | % | In U.S. offices | $ | 263,894 | $ | 244,445 | $ | 195,640 | $ | 3,385 | $ | 3,129 | $ | 2,189 | 5.20 | % | 5.08 | % | 4.54 | % | ||||||||||||||
| In offices outside the U.S. (6) | In offices outside the U.S. (6) | 29,620 | 29,933 | 30,345 | 358 | 308 | 293 | 4.80 | 4.13 | 3.83 | In offices outside the U.S. (6) | 32,591 | 30,630 | 29,546 | 365 | 342 | 306 | 4.54 | 4.43 | 4.20 | ||||||||||||||||||||||||||||||||
| Total | Total | $ | 248,386 | $ | 231,850 | $ | 213,117 | $ | 3,160 | $ | 2,784 | $ | 2,029 | 5.05 | % | 4.82 | % | 3.78 | % | Total | $ | 296,485 | $ | 275,075 | $ | 225,186 | $ | 3,750 | $ | 3,471 | $ | 2,495 | 5.13 | % | 5.01 | % | 4.49 | % | ||||||||||||||
| Total interest-bearing liabilities | Total interest-bearing liabilities | $ | 1,349,392 | $ | 1,309,713 | $ | 1,149,042 | $ | 14,901 | $ | 13,717 | $ | 9,649 | 4.38 | % | 4.20 | % | 3.33 | % | Total interest-bearing liabilities | $ | 1,583,175 | $ | 1,464,094 | $ | 1,246,803 | $ | 17,562 | $ | 16,218 | $ | 12,107 | 4.50 | % | 4.39 | % | 3.94 | % | ||||||||||||||
| Demand deposits in U.S. offices | Demand deposits in U.S. offices | 11,127 | 11,827 | 10,060 | Demand deposits in U.S. offices | 11,157 | 10,979 | 10,044 | ||||||||||||||||||||||||||||||||||||||||||||
| Other non-interest bearing liabilities(8) | Other non-interest bearing liabilities(8) | 207,623 | 209,100 | 184,028 | Other non-interest bearing liabilities(8) | 230,834 | 223,051 | 202,164 | ||||||||||||||||||||||||||||||||||||||||||||
| Total liabilities from discontinued operations | Total liabilities from discontinued operations | — | — | 720 | Total liabilities from discontinued operations | — | — | — | ||||||||||||||||||||||||||||||||||||||||||||
| Total liabilities | Total liabilities | $ | 1,568,142 | $ | 1,530,640 | $ | 1,343,850 | Total liabilities | $ | 1,825,166 | $ | 1,698,124 | $ | 1,459,011 | ||||||||||||||||||||||||||||||||||||||
| Total stockholders' equity(10) | Total stockholders' equity(10) | $ | 116,070 | $ | 114,432 | $ | 112,605 | Total stockholders' equity(10) | $ | 119,752 | $ | 118,639 | $ | 113,123 | ||||||||||||||||||||||||||||||||||||||
| Total liabilities and stockholders' equity | Total liabilities and stockholders' equity | $ | 1,684,212 | $ | 1,645,072 | $ | 1,456,455 | Total liabilities and stockholders' equity | $ | 1,944,918 | $ | 1,816,763 | $ | 1,572,134 | ||||||||||||||||||||||||||||||||||||||
| Net interest revenue as a percentage of average interest-earning assets(11) | Net interest revenue as a percentage of average interest-earning assets(11) | Net interest revenue as a percentage of average interest-earning assets(11) | ||||||||||||||||||||||||||||||||||||||||||||||||||
| In U.S. offices | In U.S. offices | $ | 892,120 | $ | 859,063 | $ | 779,869 | $ | 4,559 | $ | 4,673 | $ | 5,436 | 2.03 | % | 2.18 | % | 2.77 | % | In U.S. offices | $ | 1,049,574 | $ | 987,247 | $ | 837,085 | $ | 4,976 | $ | 5,219 | $ | 4,940 | 1.92 | % | 2.10 | % | 2.39 | % | ||||||||||||||
| In offices outside the U.S.(6) | In offices outside the U.S.(6) | 597,542 | 590,339 | 509,226 | 5,269 | 5,182 | 4,259 | 3.50 | 3.52 | 3.32 | In offices outside the U.S.(6) | 691,089 | 636,381 | 552,769 | 5,594 | 4,820 | 4,826 | 3.28 | 3.00 | 3.54 | ||||||||||||||||||||||||||||||||
| Total | Total | $ | 1,489,662 | $ | 1,449,402 | $ | 1,289,095 | $ | 9,828 | $ | 9,855 | $ | 9,695 | 2.62 | % | 2.73 | % | 2.98 | % | Total | $ | 1,740,663 | $ | 1,623,628 | $ | 1,389,854 | $ | 10,570 | $ | 10,039 | $ | 9,766 | 2.46 | % | 2.45 | % | 2.85 | % | ||||||||||||||
Reclassified to conform to the current period's presentation.
AVERAGE BALANCES AND INTEREST RATES—ASSETS(1) (2) (3) (4)
| | Average Volume | Interest Revenue | % Average Rate(10) | |||||||||||||||
|---|---|---|---|---|---|---|---|---|---|---|---|---|---|---|---|---|---|---|
| In millions of dollars | Nine Months 2006 | Nine Months 2005 | Nine Months 2006 | Nine Months 2005 | Nine Months 2006 | Nine Months 2005 | ||||||||||||
| Assets | ||||||||||||||||||
| Deposits at interest with banks(5) | $ | 37,103 | $ | 33,558 | $ | 1,928 | $ | 1,200 | 6.95 | % | 4.78 | % | ||||||
| Federal funds sold and securities borrowed or purchased under agreements to resell(6) | ||||||||||||||||||
| In U.S. offices | $ | 163,043 | $ | 151,797 | $ | 7,523 | $ | 4,764 | 6.17 | % | 4.20 | % | ||||||
| In offices outside the U.S.(5) | 83,553 | 73,638 | 2,792 | 1,937 | 4.47 | 3.52 | ||||||||||||
| Total | $ | 246,596 | $ | 225,435 | $ | 10,315 | $ | 6,701 | 5.59 | % | 3.97 | % | ||||||
| Trading account assets(7)(8) | ||||||||||||||||||
| In U.S. offices | $ | 180,765 | $ | 149,976 | $ | 5,603 | $ | 3,776 | 4.14 | % | 3.37 | % | ||||||
| In offices outside the U.S.(5) | 96,269 | 82,620 | 2,402 | 1,854 | 3.34 | 3.00 | ||||||||||||
| Total | $ | 277,034 | $ | 232,596 | $ | 8,005 | $ | 5,630 | 3.86 | % | 3.24 | % | ||||||
| Investments(1) | ||||||||||||||||||
| In U.S. offices | ||||||||||||||||||
| Taxable | $ | 91,981 | $ | 75,754 | $ | 2,834 | $ | 1,902 | 4.12 | % | 3.36 | % | ||||||
| Exempt from U.S. income tax | 13,954 | 10,443 | 488 | 347 | 4.68 | 4.44 | ||||||||||||
| In offices outside the U.S.(5) | 96,856 | 81,378 | 3,595 | 3,239 | 4.96 | % | 5.32 | |||||||||||
| Total | $ | 202,791 | $ | 167,575 | $ | 6,917 | $ | 5,488 | 4.56 | % | 4.38 | % | ||||||
| Loans (net of unearned income)(9) | ||||||||||||||||||
| Consumer loans | ||||||||||||||||||
| In U.S. offices | $ | 337,362 | $ | 302,719 | $ | 20,997 | $ | 18,357 | 8.32 | % | 8.11 | % | ||||||
| In offices outside the U.S.(5) | 136,203 | 130,976 | 11,394 | 10,641 | 11.18 | 10.86 | ||||||||||||
| Total consumer loans | $ | 473,565 | $ | 433,695 | $ | 32,391 | $ | 28,998 | 9.14 | % | 8.94 | % | ||||||
| Corporate loans | ||||||||||||||||||
| In U.S. offices | $ | 27,175 | $ | 18,237 | $ | 1,399 | $ | 732 | 6.88 | % | 5.37 | % | ||||||
| In offices outside the U.S.(5) | 121,706 | 100,077 | 7,061 | 5,031 | 7.76 | 6.72 | ||||||||||||
| Total corporate loans | $ | 149,881 | $ | 118,314 | $ | 8,460 | $ | 5,763 | 7.60 | % | 6.51 | % | ||||||
| Total loans | $ | 623,446 | $ | 552,009 | $ | 40,851 | $ | 34,761 | 8.77 | % | 8.42 | % | ||||||
| Other interest-earning assets | $ | 57,003 | $ | 55,309 | $ | 2,158 | $ | 1,533 | 5.06 | % | 3.71 | % | ||||||
| Total interest-earning assets | $ | 1,442,973 | $ | 1,266,482 | $ | 70,174 | $ | 55,313 | 6.50 | % | 5.84 | % | ||||||
| Non-interest-earning assets(7) | 190,833 | 165,369 | ||||||||||||||||
| Total assets from discontinued operations | — | 68,027 | ||||||||||||||||
| Total assets | $ | 1,633,806 | $ | 1,499,878 | ||||||||||||||
Reclassified to conform to the current period's presentation
AVERAGE BALANCES AND INTEREST RATES—LIABILITIES AND EQUITY,AND NET INTEREST REVENUE(1)(2)(3)(4)
| | Average Volume | Interest Expense | % Average Rate(12) | |||||||||||||||
|---|---|---|---|---|---|---|---|---|---|---|---|---|---|---|---|---|---|---|
| In millions of dollars | Nine Months 2006 | Nine Months 2005 | Nine Months 2006 | Nine Months 2005 | Nine Months 2006 | Nine Months 2005 | ||||||||||||
| Liabilities | ||||||||||||||||||
| Deposits | ||||||||||||||||||
| In U. S. offices | ||||||||||||||||||
| Savings deposits(5) | $ | 133,571 | $ | 127,060 | $ | 2,962 | $ | 1,647 | 2.96 | % | 1.73 | % | ||||||
| Other time deposits | 46,286 | 34,598 | 1,756 | 877 | 5.07 | 3.39 | ||||||||||||
| In offices outside the U.S.(6) | 393,770 | 339,974 | 10,762 | 7,004 | 3.65 | 2.75 | ||||||||||||
| Total | $ | 573,627 | $ | 501,632 | $ | 15,480 | $ | 9,528 | 3.61 | % | 2.54 | % | ||||||
| Federal funds purchased and securities loaned or sold under agreements to repurchase(7) | ||||||||||||||||||
| In U.S. offices | $ | 186,848 | $ | 169,727 | $ | 8,623 | $ | 5,157 | 6.17 | % | 4.06 | % | ||||||
| In offices outside the U.S.(6) | 92,842 | 70,184 | 3,991 | 2,996 | 5.75 | 5.71 | ||||||||||||
| Total | $ | 279,690 | $ | 239,911 | $ | 12,614 | $ | 8,153 | 6.03 | % | 4.54 | % | ||||||
| Trading account liabilities(8)(9) | ||||||||||||||||||
| In U.S. offices | $ | 36,125 | $ | 35,823 | $ | 126 | $ | 60 | 0.47 | % | 0.22 | % | ||||||
| In offices outside the U.S.(6) | 37,164 | 39,644 | 45 | 26 | 0.16 | 0.09 | ||||||||||||
| Total | $ | 73,289 | $ | 75,467 | $ | 171 | $ | 86 | 0.31 | % | 0.15 | % | ||||||
| Short-term borrowings | ||||||||||||||||||
| In U.S. offices | $ | 117,847 | $ | 92,690 | $ | 3,448 | $ | 1,807 | 3.91 | % | 2.61 | % | ||||||
| In offices outside the U.S.(6) | 22,375 | 18,125 | 573 | 541 | 3.42 | 3.99 | ||||||||||||
| Total | $ | 140,222 | $ | 110,815 | $ | 4,021 | $ | 2,348 | 3.83 | % | 2.83 | % | ||||||
| Long-term debt | ||||||||||||||||||
| In U.S. offices | $ | 205,441 | $ | 178,150 | $ | 7,467 | $ | 4,768 | 4.86 | % | 3.58 | % | ||||||
| In offices outside the U.S.(6) | 29,700 | 33,113 | 972 | 858 | 4.38 | 3.46 | ||||||||||||
| Total | $ | 235,141 | $ | 211,263 | $ | 8,439 | $ | 5,626 | 4.80 | % | 3.56 | % | ||||||
| Total interest-bearing liabilities | $ | 1,301,969 | $ | 1,139,088 | $ | 40,725 | $ | 25,741 | 4.18 | % | 3.02 | % | ||||||
| Demand deposits in U.S. offices | 10,999 | 10,069 | ||||||||||||||||
| Other non-interest bearing liabilities(8) | 206,296 | 178,370 | ||||||||||||||||
| Total liabilities from discontinued operations | — | 61,222 | ||||||||||||||||
| Total liabilities | $ | 1,519,264 | $ | 1,388,749 | ||||||||||||||
| Total stockholders' equity(10) | $ | 114,542 | $ | 111,129 | ||||||||||||||
| Total liabilities and stockholders' equity | $ | 1,633,806 | $ | 1,499,878 | ||||||||||||||
| Net interest revenue as a percentage of average interest-earning assets(11) | ||||||||||||||||||
| In U.S. offices | $ | 862,756 | $ | 755,384 | $ | 14,172 | $ | 16,197 | 2.20 | % | 2.87 | % | ||||||
| In offices outside the U.S.(6) | 580,217 | 511,098 | 15,277 | 13,375 | 3.52 | 3.50 | ||||||||||||
| Total | $ | 1,442,973 | $ | 1,266,482 | $ | 29,449 | $ | 29,572 | 2.73 | % | 3.12 | % | ||||||
Reclassified to conform to the current period's presentation.
ANALYSIS OF CHANGES IN INTEREST REVENUE, INTEREST EXPENSE, AND NET INTEREST REVENUE(1)(2)(3)
| | 3rd Qtr. 2006 vs. 2nd Qtr. 2006 | 3rd Qtr. 2006 vs. 3rd Qtr. 2005 | 1st Qtr. 2007 vs. 4th Qtr. 2006 | 1st Qtr. 2007 vs. 1st Qtr. 2006 | |||||||||||||||||||||||||||||||||
|---|---|---|---|---|---|---|---|---|---|---|---|---|---|---|---|---|---|---|---|---|---|---|---|---|---|---|---|---|---|---|---|---|---|---|---|---|---|
| | Increase (Decrease) Due to Change in: | Increase (Decrease) Due to Change in: | Increase (Decrease) Due to Change in: | | Increase (Decrease) Due to Change in: | | |||||||||||||||||||||||||||||||
| In millions of dollars | Average Volume | Average Rate | Net Change(2) | Average Volume | Average Rate | Net Change(2) | Average Volume | Average Rate | Net Change(2) | Average Volume | Average Rate | Net Change(2) | |||||||||||||||||||||||||
| Deposits at interest with banks(4) | $ | (24 | ) | $ | 107 | $ | 83 | $ | 32 | $ | 243 | $ | 275 | ||||||||||||||||||||||||
| Deposits with banks(4) | $ | 76 | $ | (60 | ) | $ | 16 | $ | 159 | $ | 61 | $ | 220 | ||||||||||||||||||||||||
| Federal funds sold and securities borrowed or purchased under agreements to resell | |||||||||||||||||||||||||||||||||||||
| In U.S. offices | $ | 50 | $ | 218 | $ | 268 | $ | 75 | $ | 734 | $ | 809 | $ | 131 | $ | 13 | $ | 144 | $ | 381 | $ | 143 | $ | 524 | |||||||||||||
| In offices outside the U.S.(4) | (75 | ) | 123 | 48 | 47 | 216 | 263 | 246 | 15 | 261 | 326 | 234 | 560 | ||||||||||||||||||||||||
| Total | $ | (25 | ) | $ | 341 | $ | 316 | $ | 122 | $ | 950 | $ | 1,072 | $ | 377 | $ | 28 | $ | 405 | $ | 707 | $ | 377 | $ | 1,084 | ||||||||||||
| Trading account assets(5) | |||||||||||||||||||||||||||||||||||||
| In U.S. offices | $ | 30 | $ | (265 | ) | $ | (235 | ) | $ | 284 | $ | 215 | $ | 499 | $ | 278 | $ | 26 | $ | 304 | $ | 698 | $ | 238 | $ | 936 | |||||||||||
| In offices outside the U.S.(4) | 5 | (100 | ) | (95 | ) | 173 | 39 | 212 | 156 | 102 | 258 | 374 | (80 | ) | 294 | ||||||||||||||||||||||
| Total | $ | 35 | $ | (365 | ) | $ | (330 | ) | $ | 457 | $ | 254 | $ | 711 | $ | 434 | $ | 128 | $ | 562 | $ | 1,072 | $ | 158 | $ | 1,230 | |||||||||||
| Investments(1) | |||||||||||||||||||||||||||||||||||||
| In U.S. Offices | $ | 190 | $ | 85 | $ | 275 | $ | 262 | $ | 243 | $ | 505 | |||||||||||||||||||||||||
| In U.S. offices | $ | 182 | $ | (130 | ) | $ | 52 | $ | 902 | $ | 351 | $ | 1,253 | ||||||||||||||||||||||||
| In offices outside the U.S.(4) | 48 | 28 | 76 | 271 | 16 | 287 | 39 | (33 | ) | 6 | 184 | 47 | 231 | ||||||||||||||||||||||||
| Total | $ | 238 | $ | 113 | $ | 351 | $ | 533 | $ | 259 | $ | 792 | $ | 221 | $ | (163 | ) | $ | 58 | $ | 1,086 | $ | 398 | $ | 1,484 | ||||||||||||
| Loans—consumer | |||||||||||||||||||||||||||||||||||||
| In U.S. offices | $ | 106 | $ | 87 | $ | 193 | $ | 796 | $ | 100 | $ | 896 | $ | 202 | $ | (219 | ) | $ | (17 | ) | $ | 736 | $ | 60 | $ | 796 | |||||||||||
| In offices outside the U.S.(4) | 109 | (73 | ) | 36 | 280 | (38 | ) | 242 | 99 | 555 | 654 | 544 | (201 | ) | 343 | ||||||||||||||||||||||
| Total | $ | 215 | $ | 14 | $ | 229 | $ | 1,076 | $ | 62 | $ | 1,138 | $ | 301 | $ | 336 | $ | 637 | $ | 1,280 | $ | (141 | ) | $ | 1,139 | ||||||||||||
| Loans—corporate | |||||||||||||||||||||||||||||||||||||
| In U.S. offices | $ | 51 | $ | 37 | $ | 88 | $ | 144 | $ | 99 | $ | 243 | $ | (41 | ) | $ | 37 | $ | (4 | ) | $ | 25 | $ | 82 | $ | 107 | |||||||||||
| In offices outside the U.S.(4) | 141 | 289 | 430 | 563 | 411 | 974 | 72 | 59 | 131 | 481 | 390 | 871 | |||||||||||||||||||||||||
| Total | $ | 192 | $ | 326 | $ | 518 | $ | 707 | $ | 510 | $ | 1,217 | $ | 31 | $ | 96 | $ | 127 | $ | 506 | $ | 472 | $ | 978 | |||||||||||||
| Total loans | $ | 407 | $ | 340 | $ | 747 | $ | 1,783 | $ | 572 | $ | 2,355 | $ | 332 | $ | 432 | $ | 764 | $ | 1,786 | $ | 331 | $ | 2,117 | |||||||||||||
| Other interest-earning assets | $ | 22 | $ | (32 | ) | $ | (10 | ) | $ | 7 | $ | 173 | $ | 180 | $ | 102 | $ | (32 | ) | $ | 70 | $ | 97 | $ | 27 | $ | 124 | ||||||||||
| Total interest revenue | $ | 653 | $ | 504 | $ | 1,157 | $ | 2,934 | $ | 2,451 | $ | 5,385 | $ | 1,542 | $ | 333 | $ | 1,875 | $ | 4,907 | $ | 1,352 | $ | 6,259 | |||||||||||||
| Deposits | |||||||||||||||||||||||||||||||||||||
| In U.S. offices | $ | 58 | $ | 131 | $ | 189 | $ | 144 | $ | 591 | $ | 735 | |||||||||||||||||||||||||
| In offices outside the U.S.(4) | 200 | 178 | 378 | 604 | 816 | 1,420 | |||||||||||||||||||||||||||||||
| Total | $ | 258 | $ | 309 | $ | 567 | $ | 748 | $ | 1,407 | $ | 2,155 | |||||||||||||||||||||||||
| Federal funds purchased and securities loaned or sold under agreements to repurchase | |||||||||||||||||||||||||||||||||||||
| In U.S. offices | $ | 11 | $ | 26 | $ | 37 | $ | 167 | $ | 758 | $ | 925 | |||||||||||||||||||||||||
| In offices outside the U.S.(4) | (63 | ) | $ | 103 | 40 | 342 | 2 | 344 | |||||||||||||||||||||||||||||
| Total | $ | (52 | ) | $ | 129 | $ | 77 | $ | 509 | $ | 760 | $ | 1,269 | ||||||||||||||||||||||||
| Trading account liabilities(5) | |||||||||||||||||||||||||||||||||||||
| In U.S. offices | $ | 3 | $ | (12 | ) | $ | (9 | ) | $ | 2 | $ | 17 | $ | 19 | |||||||||||||||||||||||
| In offices outside the U.S.(4) | (1 | ) | 4 | 3 | (1 | ) | 6 | 5 | |||||||||||||||||||||||||||||
| Total | $ | 2 | $ | (8 | ) | $ | (6 | ) | $ | 1 | $ | 23 | $ | 24 | |||||||||||||||||||||||
| Short-term borrowings | |||||||||||||||||||||||||||||||||||||
| In U.S. offices | $ | 28 | $ | 200 | $ | 228 | $ | 274 | $ | 464 | $ | 738 | |||||||||||||||||||||||||
| In offices outside the U.S.(4) | (15 | ) | (43 | ) | (58 | ) | 56 | (121 | ) | (65 | ) | ||||||||||||||||||||||||||
| Total | $ | 13 | $ | 157 | $ | 170 | $ | 330 | $ | 343 | $ | 673 | |||||||||||||||||||||||||
| Long-term debt | |||||||||||||||||||||||||||||||||||||
| In U.S. offices | $ | 213 | $ | 113 | $ | 326 | $ | 385 | $ | 681 | $ | 1,066 | |||||||||||||||||||||||||
| In offices outside the U.S.(4) | (3 | ) | 53 | 50 | (7 | ) | 72 | 65 | |||||||||||||||||||||||||||||
| Total | $ | 210 | $ | 166 | $ | 376 | $ | 378 | $ | 753 | $ | 1,131 | |||||||||||||||||||||||||
| Total interest expense | $ | 431 | $ | 753 | $ | 1,184 | $ | 1,966 | $ | 3,286 | $ | 5,252 | |||||||||||||||||||||||||
| Net interest revenue | $ | 222 | $ | (249 | ) | $ | (27 | ) | $ | 968 | $ | (835 | ) | $ | 133 | ||||||||||||||||||||||
ANALYSIS OF CHANGES IN INTEREST REVENUE, INTEREST EXPENSE AND NET INTEREST REVENUE(1)(2)(3)
| | Nine Months 2006 vs. Nine Months 2005 | 1st Qtr. 2007 vs. 4th Qtr. 2006 | 1st Qtr. 2007 vs. 1st Qtr. 2006 | |||||||||||||||||||||||||
|---|---|---|---|---|---|---|---|---|---|---|---|---|---|---|---|---|---|---|---|---|---|---|---|---|---|---|---|---|
| | Increase (Decrease) Due to Change in: | | Increase (Decrease) Due to Change in: | | Increase (Decrease) Due to Change in: | | ||||||||||||||||||||||
| In millions of dollars | Average Volume | Average Rate | Net Change(2) | Average Volume | Average Rate | Net Change(2) | Average Volume | Average Rate | Net Change(2) | |||||||||||||||||||
| Deposits at interest with banks(4) | $ | 138 | $ | 590 | $ | 728 | ||||||||||||||||||||||
| Federal funds sold and securities borrowed or purchased under agreements to resell | ||||||||||||||||||||||||||||
| In U.S. offices | $ | 376 | $ | 2,383 | $ | 2,759 | ||||||||||||||||||||||
| In offices outside the U.S.(4) | 284 | 571 | 855 | |||||||||||||||||||||||||
| Total | $ | 660 | $ | 2,954 | $ | 3,614 | ||||||||||||||||||||||
| Trading account assets(5) | ||||||||||||||||||||||||||||
| In U.S. offices | $ | 859 | $ | 968 | $ | 1,827 | ||||||||||||||||||||||
| In offices outside the U.S.(4) | 327 | 221 | 548 | |||||||||||||||||||||||||
| Total | $ | 1,186 | $ | 1,189 | $ | 2,375 | ||||||||||||||||||||||
| Investments(1) | ||||||||||||||||||||||||||||
| In U.S. offices | $ | 570 | $ | 503 | $ | 1,073 | ||||||||||||||||||||||
| In offices outside the U.S.(4) | 585 | (229 | ) | 356 | ||||||||||||||||||||||||
| Total | $ | 1,155 | $ | 274 | $ | 1,429 | ||||||||||||||||||||||
| Loans—consumer | ||||||||||||||||||||||||||||
| In U.S. offices | $ | 2,146 | $ | 494 | $ | 2,640 | ||||||||||||||||||||||
| In offices outside the U.S.(4) | 432 | 321 | 753 | |||||||||||||||||||||||||
| Total | $ | 2,578 | $ | 815 | $ | 3,393 | ||||||||||||||||||||||
| Loans—corporate | ||||||||||||||||||||||||||||
| In U.S. offices | $ | 423 | $ | 244 | $ | 677 | ||||||||||||||||||||||
| In offices outside the U.S.(4) | 1,185 | 845 | 2,030 | |||||||||||||||||||||||||
| Total | $ | 1,608 | $ | 1,089 | $ | 2,697 | ||||||||||||||||||||||
| Total loans | $ | 4,186 | $ | 1,904 | $ | 6,090 | ||||||||||||||||||||||
| Other interest-earning assets | $ | 48 | $ | 577 | $ | 625 | ||||||||||||||||||||||
| Total interest revenue | $ | 7,373 | $ | 7,488 | $ | 14,861 | ||||||||||||||||||||||
| Deposits | ||||||||||||||||||||||||||||
| In U.S. offices | $ | 312 | $ | 1,882 | $ | 2,194 | $ | 62 | $ | 106 | $ | 168 | $ | 219 | $ | 391 | $ | 610 | ||||||||||
| In offices outside the U.S.(4) | 1,226 | 2,532 | 3,758 | 151 | 62 | 213 | 726 | 717 | 1,443 | |||||||||||||||||||
| Total | $ | 1,538 | $ | 4,414 | $ | 5,952 | $ | 213 | $ | 168 | $ | 381 | $ | 945 | $ | 1,108 | $ | 2,053 | ||||||||||
| Federal funds purchased and securities loaned or sold under agreements to repurchase | ||||||||||||||||||||||||||||
| In U.S. offices | $ | 564 | $ | 2,902 | $ | 3,466 | $ | 288 | $ | 19 | $ | 307 | $ | 781 | $ | 84 | $ | 865 | ||||||||||
| In offices outside the U.S.(4) | 974 | 21 | 995 | 354 | (12 | ) | 342 | 604 | 115 | 719 | ||||||||||||||||||
| Total | $ | 1,538 | $ | 2,923 | $ | 4,461 | $ | 642 | $ | 7 | $ | 649 | $ | 1,385 | $ | 199 | $ | 1,584 | ||||||||||
| Trading account liabilities(5) | ||||||||||||||||||||||||||||
| In U.S. offices | $ | 1 | $ | 65 | $ | 66 | $ | 16 | $ | (10 | ) | $ | 6 | $ | 39 | $ | 4 | $ | 43 | |||||||||
| In offices outside the U.S.(4) | (2 | ) | 21 | 19 | 9 | (2 | ) | 7 | 14 | 7 | 21 | |||||||||||||||||
| Total | $ | (1 | ) | $ | 86 | $ | 85 | $ | 25 | $ | (12 | ) | $ | 13 | $ | 53 | $ | 11 | $ | 64 | ||||||||
| Short-term borrowings | ||||||||||||||||||||||||||||
| In U.S. offices | $ | 577 | $ | 1,064 | $ | 1,641 | $ | 157 | $ | (178 | ) | $ | (21 | ) | $ | 233 | $ | 264 | $ | 497 | ||||||||
| In offices outside the U.S.(4) | 115 | (83 | ) | 32 | 42 | 1 | 43 | 154 | (152 | ) | 2 | |||||||||||||||||
| Total | $ | 692 | $ | 981 | $ | 1,673 | $ | 199 | $ | (177 | ) | $ | 22 | $ | 387 | $ | 112 | $ | 499 | |||||||||
| Long-term debt | ||||||||||||||||||||||||||||
| In U.S. offices | $ | 809 | $ | 1,890 | $ | 2,699 | $ | 249 | $ | 7 | $ | 256 | $ | 842 | $ | 354 | $ | 1,196 | ||||||||||
| In offices outside the U.S.(4) | (95 | ) | 209 | 114 | 22 | 1 | 23 | 33 | 26 | 59 | ||||||||||||||||||
| Total | $ | 714 | $ | 2,099 | $ | 2,813 | $ | 271 | $ | 8 | $ | 279 | $ | 875 | $ | 380 | $ | 1,255 | ||||||||||
| Total interest expense | $ | 4,481 | $ | 10,503 | $ | 14,984 | $ | 1,350 | $ | (6 | ) | $ | 1,344 | $ | 3,645 | $ | 1,810 | $ | 5,455 | |||||||||
| Net interest revenue | $ | 2,892 | $ | (3,015 | ) | $ | (123 | ) | $ | 192 | $ | 339 | $ | 531 | $ | 1,262 | $ | (458 | ) | $ | 804 | |||||||
CAPITAL RESOURCES AND LIQUIDITY
CAPITAL RESOURCES
Overview
Capital is generated principally generated via earnings, issuance of common and preferred stock and subordinated debt, and equity issued as a result of employee benefit plans. It is used primarily to support asset growth in the Company's businesses and to fund acquisition activity.businesses. Excess capital is used to pay dividends to shareholders, support acquisitions, and repurchase stock, and fund acquisitions.stock.
Citigroup's capital management framework is designed to ensure that Citigroup and its principal subsidiaries maintain sufficient capital consistent with the Company's risk profile, all applicable regulatory standards and guidelines, and external rating agency considerations. The capital management process is centrally overseen by senior management and is frequently reviewed at the entity and country level.
Senior management oversees the capital management process of Citigroup and its principal subsidiaries mainly through Citigroup's Global Finance and Asset and Liability Committee (FinALCO). This Committee includes Citigroup's Chairman and Chief Executive Officer, Chief Financial Officer, Head of Corporate Finance and Treasury, Senior Risk Officer, the business segment CEOs, and other senior business managers. The Committee's responsibilities include: determining the financial structure of Citigroup and its principal subsidiaries; ensuring that Citigroup and its regulated entities are adequately capitalized; reviewing the funding and capital markets plan for Citigroup; monitoring interest rate risk, corporate and bank liquidity, and the impact of currency translation on non-U.S. earnings and capital; and reviewing and recommending share repurchase levels and dividends on commonpreferred and preferredcommon stock. The FinALCO establisheshas established capital targets for Citigroup and for significant subsidiaries. These targets exceed the regulatory standards.
Capital Ratios
Citigroup is subject to risk-based capital ratio guidelines issued by the FRB. Capital adequacy is measured via two risk-based ratios, Tier 1 and Total Capital (Tier 1 + Tier 2 Capital). Tier 1 Capital is considered core capital while Total Capital also includes other items such as subordinated debt and loan loss reserves. Both measures of capital are stated as a percent of risk-adjusted assets. Risk-adjusted assets are measured primarily on their perceived credit risk and include certain off-balance sheet exposures, such as unfunded loan commitments and letters of credit and the notional amounts of derivative and foreign exchange contracts. Citigroup is also subject to the Leverage Ratio requirement, a non-risk-based asset ratio, which is defined as Tier 1 Capital as a percentage of adjusted average assets.
To be "well capitalized" under federal bank regulatory agency definitions, a bank holding company must have a Tier 1 Capital Ratio of at least 6%, a Total Capital Ratio of at least 10%, and a Leverage Ratio of at least 3%, and not be subject to an FRB directive to maintain higher capital levels.
Historically, Citigroup has maintained a Leverage Ratio above 5%. As Citigroup adds low risk-weighted, secured financing assets in the CIB business, the Leverage Ratio at the holding company level is expected to decline below 5%, but remain above 4%. The Leverage Ratio at each of the regulated U.S. banks is not expected to decline below 5%. The addition of these assets is not expected to materially affect any of Citigroup's risk-based capital ratios. These statements are forward-looking statements within the meaning of the Private Securities Litigation Reform Act. See "Forward-Looking Statements" on page 84.
As noted in the following table, Citigroup maintained a "well capitalized" position during the first ninethree months of 20062007 and the full year of 2005.2006.
Citigroup Regulatory Capital RatiosRatios(1)
| | Sept. 30, 2006 | June 30, 2006 | Dec. 31, 2005 | March 31, 2007(3) | December 31, 2006 | |||||||
|---|---|---|---|---|---|---|---|---|---|---|---|---|
| Tier 1 Capital | 8.64 | % | 8.51 | % | 8.79 | % | 8.26 | % | 8.59 | % | ||
| Total Capital (Tier 1 and Tier 2) | 11.88 | 11.68 | 12.02 | 11.48 | 11.65 | |||||||
| Leverage(2) | 5.24 | 5.19 | 5.35 | 4.84 | 5.16 | |||||||
| Common stockholders' Equity | 6.69 | 7.04 | 7.46 | |||||||||
Components of Capital Under Regulatory Guidelines
| In millions of dollars | In millions of dollars | Sept. 30, 2006 | June 30, 2006 | Dec. 31, 2005 | In millions of dollars | March 31, 2007 | December 31, 2006 | ||||||||||||
|---|---|---|---|---|---|---|---|---|---|---|---|---|---|---|---|---|---|---|---|
| Tier 1 Capital | Tier 1 Capital | Tier 1 Capital | |||||||||||||||||
| Common stockholders' equity | Common stockholders' equity | $ | 116,865 | $ | 114,428 | $ | 111,412 | Common stockholders' equity | $ | 121,083 | $ | 118,783 | |||||||
| Qualifying perpetual preferred stock | Qualifying perpetual preferred stock | 1,000 | 1,000 | 1,125 | Qualifying perpetual preferred stock | 1,000 | 1,000 | ||||||||||||
| Qualifying mandatorily redeemable securities of subsidiary trusts | Qualifying mandatorily redeemable securities of subsidiary trusts | 7,992 | 6,572 | 6,264 | Qualifying mandatorily redeemable securities of subsidiary trusts | 9,440 | 9,579 | ||||||||||||
| Minority interest | Minority interest | 583 | 571 | 512 | Minority interest | 1,124 | 1,107 | ||||||||||||
| Less: Net unrealized (gains) and losses on securities available-for-sale(1) | (1,001 | ) | 246 | (1,084 | ) | ||||||||||||||
| Less: Accumulated net (gains) losses on cash flow hedges, net of tax | 68 | (1,123 | ) | (612 | ) | ||||||||||||||
| Less: Net unrealized gains on securities available-for-sale(1) | Less: Net unrealized gains on securities available-for-sale(1) | (1,251 | ) | (943 | ) | ||||||||||||||
| Less: Accumulated net losses on cash flow hedges, net of tax | Less: Accumulated net losses on cash flow hedges, net of tax | 500 | 61 | ||||||||||||||||
| Less: Pension liability adjustment, net of tax(2) | Less: Pension liability adjustment, net of tax(2) | 1,570 | 1,647 | ||||||||||||||||
| Less: Cumulative effect included in fair value of financial liabilities attributable to creditworthiness, net of tax(3) | Less: Cumulative effect included in fair value of financial liabilities attributable to creditworthiness, net of tax(3) | (222 | ) | — | |||||||||||||||
| Less: Intangible assets: | Less: Intangible assets: | Less: Intangible assets: | |||||||||||||||||
| Goodwill | (33,169 | ) | (32,910 | ) | (33,130 | ) | Goodwill | (34,380 | ) | (33,415 | ) | ||||||||
| Other disallowed intangible assets | (6,072 | ) | (6,143 | ) | (6,163 | ) | Other disallowed intangible assets | (6,589 | ) | (6,127 | ) | ||||||||
| Other | Other | (606 | ) | (593 | ) | (500 | ) | Other | (853 | ) | (793 | ) | |||||||
| Total Tier 1 Capital | Total Tier 1 Capital | $ | 85,660 | $ | 82,048 | $ | 77,824 | Total Tier 1 Capital | $ | 91,422 | $ | 90,899 | |||||||
| Tier 2 Capital | Tier 2 Capital | Tier 2 Capital | |||||||||||||||||
| Allowance for credit losses(2) | 10,050 | 10,165 | 10,602 | ||||||||||||||||
| Qualifying debt(3) | 21,613 | 20,026 | 17,368 | ||||||||||||||||
| Allowance for credit losses(4) | Allowance for credit losses(4) | $ | 10,604 | $ | 10,034 | ||||||||||||||
| Qualifying debt(5) | Qualifying debt(5) | 24,447 | 21,891 | ||||||||||||||||
| Unrealized marketable equity securities gains(1) | Unrealized marketable equity securities gains(1) | 469 | 369 | 608 | Unrealized marketable equity securities gains(1) | 562 | 436 | ||||||||||||
| Total Tier 2 Capital | Total Tier 2 Capital | $ | 32,132 | $ | 30,560 | $ | 28,578 | Total Tier 2 Capital | $ | 35,613 | $ | 32,361 | |||||||
| Total Capital (Tier 1 and Tier 2) | Total Capital (Tier 1 and Tier 2) | $ | 117,792 | $ | 112,608 | $ | 106,402 | Total Capital (Tier 1 and Tier 2) | $ | 127,035 | $ | 123,260 | |||||||
| Risk-Adjusted Assets(4) | $ | 991,483 | $ | 963,750 | $ | 885,472 | |||||||||||||
| Risk-Adjusted Assets(6) | Risk-Adjusted Assets(6) | $ | 1,106,961 | $ | 1,057,872 | ||||||||||||||
Common stockholders' equity increased approximately $2.3 billion during the first three months of 2007 to $121.1 billion at March 31, 2007, representing 6.0% of assets. This compares to $118.8 billion and 6.3% at year-end 2006.
Common Equity
Common stockholders' equity increased approximately $5.5 billion during the first nine months of 2006 to $116.9 billion at September 30, 2006, representing 6.7% of assets (common stockholders' equity ratio). This compares to $111.4 billion and 7.5% at year-end 2005.
The table below summarizes the change in common stockholders' equity duringequity:
In billions of dollars | | |||
|---|---|---|---|---|
| Common Equity, December 31, 2006 | $ | 118.8 | ||
| Adjustment to opening retained earnings balance, net of tax(1) | (0.2 | ) | ||
| Adjustment to opening Accumulated other comprehensive income (loss) balance, net of tax(2) | 0.1 | |||
| Net income | 5.0 | |||
| Employee benefit plans and other activities | 1.0 | |||
| Dividends | (2.7 | ) | ||
| Treasury stock acquired | (0.6 | ) | ||
| Net change in Accumulated other comprehensive income (loss), net of tax | (0.3 | ) | ||
| Common Equity, March 31, 2007 | $ | 121.1 | ||
See Note 1 and Note 16 on pages 85 and 105, respectively.
| In billions of dollars | | |||
|---|---|---|---|---|
| Common Equity, December 31, 2005 | $ | 111.4 | ||
| Net income | 16.4 | |||
| Employee benefit plans and other activities | 2.8 | |||
| Dividends | (7.4 | ) | ||
| Treasury stock acquired | (6.0 | ) | ||
| After-tax net change in equity from nonowner sources | (0.3 | ) | ||
| Common Equity, September 30, 2006 | $ | 116.9 | ||
The decrease in the common stockholders' equity ratio during the first ninethree months of 2006ended March 31, 2007 reflected the above items and a 16.9%7.3% increase in total assets.
Additionally, on February 15, 2006, Citigroup redeemed for cash all the outstanding shares of its Fixed/Adjustable Rate Cumulative Preferred Stock, Series V. The redemption price was $50.00 per depositary share, plus accrued dividends to the date of redemption. At the date of redemption, the value of the Series V Preferred Stock was $125 million.
On April 13,17, 2006, the Board of Directors authorized up to an additional $10 billion in share repurchases. As of March 31, 2007, $6.8 billion remained under authorized repurchase programs after the repurchase of $645 million and $7.0 billion in shares during the three months ended March 31, 2007 and full year 2006, respectively. As a result of the Company's recent acquisitions, the successful Nikko tender offer, and other growth opportunities, it is anticipated that the Company will not resume its share repurchase program for the remainder of the year. This is a forward-looking statement within the meaning of the Private Securities Litigation Reform Act. See "Forward-Looking Statements" on page 78. For further details, see "Unregistered Sales of Equity Securities and Use of Proceeds" on page 123.
The table below summarizes the Company's repurchase activity:
| In millions, except per share amounts | Total Common Shares Repurchased | Dollar Value of Shares Repurchased | Average Price Paid per Share | Dollar Value of Remaining Authorized Repurchase Program | ||||||||
|---|---|---|---|---|---|---|---|---|---|---|---|---|
| First quarter 2005 | 19.0 | $ | 906 | $ | 47.65 | $ | 1,300 | |||||
| Second quarter 2005 | 41.8 | 1,965 | 47.06 | 14,335 | ||||||||
| Third quarter 2005 | 124.2 | 5,500 | 44.27 | 8,835 | ||||||||
| Fourth quarter 2005 | 92.9 | 4,423 | 47.60 | 4,412 | ||||||||
| Total 2005 | 277.9 | $ | 12,794 | $ | 46.03 | $ | 4,412 | |||||
| First quarter 2006 | 42.9 | $ | 2,000 | $ | 46.58 | $ | 2,412 | |||||
| Second quarter 2006 | 40.8 | 2,000 | 48.98 | 10,412 | (1) | |||||||
| Third quarter 2006 | 40.9 | 2,000 | 48.90 | 8,412 | ||||||||
| Total year-to-date 2006 | 124.6 | $ | 6,000 | $ | 48.12 | $ | 8,412 | |||||
In millions, except per share amounts | Total Common Shares Repurchased | Dollar Value of Shares Repurchased | Average Price Paid per Share | Dollar Value of Remaining Authorized Repurchase Program | ||||||||
|---|---|---|---|---|---|---|---|---|---|---|---|---|
| First quarter 2006 | 42.9 | $ | 2,000 | $ | 46.58 | $ | 2,412 | |||||
| Second quarter 2006 | 40.8 | 2,000 | 48.98 | 10,412 | (1) | |||||||
| Third quarter 2006 | 40.9 | 2,000 | 48.90 | 8,412 | ||||||||
| Fourth quarter 2006 | 19.4 | 1,000 | 51.66 | 7,412 | ||||||||
| Total 2006 | 144.0 | $ | 7,000 | $ | 48.60 | $ | 7,412 | |||||
| First quarter 2007(2) | 12.1 | $ | 645 | $ | 53.37 | $ | 6,767 | |||||
Mandatorily Redeemable Securities of Subsidiary Trusts
Total mandatorily redeemable securities of subsidiary trusts (trust preferred securities), which qualify as Tier 1 Capital, were $7.992$9.440 billion at September 30, 2006,March 31, 2007, as compared to $6.264$9.579 billion at December 31, 2005. In September 2006,2006. On March 18, 2007 and March 26, 2007, Citigroup redeemed for cash all of the $23 million and $25 million Trust Preferred Securities of Adam Statutory Trust I and Adam Statutory Trust II, respectively, at the redemption price of $1,000 per preferred security plus any accrued distribution up to but excluding the date of redemption.
On March 6, 2007, Citigroup issued $1.185$1.000 billion of Enhanced Trust Preferred Securities (Citigroup Capital XV). In June 2006, Citigroup issued $500 million of Enhanced Trust Preferred Securities (Citigroup Capital XIV)XVII). An additional $65$100 million was issued, related to this Trust, in July 2006.on March 14, 2007. See Note 13 to the Consolidated Financial Statements12 on page 10695 for details on Citigroup Capital XIVXVII.
On February 15, 2007, Citigroup redeemed for cash all of the $300 million Trust Preferred Securities of Citicorp Capital I, $450 million of Citicorp Capital II, and $400 million of Citigroup Capital XV.II, at the redemption price of $1,000 per preferred security plus any accrued distribution up to, but excluding, the date of redemption.
On April 23, 2007, Citigroup redeemed for cash all of the $22 million Trust Preferred Securities of Adam Capital Trust II at the redemption price of $1,000 per preferred security plus any accrued distribution up to but excluding the date of redemption.
The FRB has issued thea final rule, with an effective date of April 11, 2005, which retains trust preferred securities in Tier 1 Capital of Bank Holding Companies (BHCs), but with stricter quantitative limits and clearer qualitative standards. Under the rule, after a five-year transition period, the aggregate amount of trust preferred securities and certain other capital elements included in Tier 1 Capital of internationally active banking organizations, such as Citigroup, would be limited to 25%15% of Tier 1 Capital elements, net of goodwill less any associated deferred tax liability. The amount of trust preferred securities and certain other elements in excess of the limit could be included in Tier 2 Capital, subject to restrictions. Under this rule, Citigroup currently would have less than 11%12% against the limit. The FRB has granted interim capital relief for the impact of adopting SFAS 158.
The FRB and the FFIEC may propose amendments to, and issue interpretations of, risk-based capital guidelines and reporting instructions. These may affect reported capital ratios and net risk-adjusted assets.*
*Capital Resources of Citigroup's Depository Institutions
Bank Consolidation Project: During 2006, Citigroup began and completed the majority of its bank consolidation project, which called for the merger of its twelve U.S.-insured depository institutions into four, as well as the reorganization of its U.S. mortgage banking business. The first phase of this project was completed in July 2006, when CitiFinancial Credit Company (CCC), an indirect wholly owned subsidiary of Citigroup, transferred its ownership of Citicorp Trust Bank, fsb to Citigroup. The second phase occurred in October 2006, when Citigroup reduced its overall number of U.S.-insured depository institutions from twelve to five. Also during this phase, Citibank, N.A. Ratiostransferred its investment in Citibank (South Dakota), N.A. (the Company's primary banking entity responsible for U.S. credit card activities) to Citigroup. In addition, a majority of the Company's U.S. consumer mortgage lending activity was consolidated within Citibank, N.A. as Citibank (West), FSB, Citibank Texas, N.A., Citibank, FSB and Citibank Delaware were merged into Citibank, N.A. The final phase of this consolidation project is expected to be completed at a later date with the merger of Citibank (Banamex USA) into Citibank, N.A.
Benefits achieved from reducing the number of depository institutions included optimized capital efficiency, enhanced flexibility of operations as a result of Citibank, N.A.'s larger capital base, reduced regulatory complexity and improved customer relationships.
Capital Ratios of Depository Institutions: Citigroup's subsidiary depository institutions in the United States are subject to risk-based capital guidelines issued by their respective primary federal bank regulatory agencies, which are similar to the FRB's guidelines. To be "well capitalized" under federal bank regulatory agency definitions, Citigroup's depository institutions must have a Tier 1 Capital Ratio of at least 6%, a Total Capital (Tier 1 + Tier 2 Capital) Ratio of at least 10% and a Leverage Ratio of at least 5%, and not be subject to a regulatory directive to meet and maintain higher capital levels. At September 30, 2006,March 31, 2007, all of Citigroup's subsidiary depository institutions were "well capitalized" under the federal regulatory agencies' definitions, including Citigroup's primary depository institution, Citibank, N.A., as noted in the following table:
Citibank, N.A. Regulatory Capital Ratios
| | Sept. 30, 2006 | June 30, 2006 | Dec. 31, 2005 | ||||
|---|---|---|---|---|---|---|---|
| Tier 1 Capital(1) | 8.35 | % | 8.25 | % | 8.41 | % | |
| Total Capital (Tier 1 and Tier 2)(1) | 12.50 | 12.44 | 12.55 | ||||
| Leverage(2) | 6.29 | 6.43 | 6.45 | ||||
| Common stockholder's equity | 7.64 | 7.76 | 7.96 | ||||
Citibank, N.A. Components of Capital Under Regulatory Guidelinesnext page.
| In billions of dollars | Sept. 30, 2006 | June 30, 2006 | Dec. 31, 2005 | ||||||
|---|---|---|---|---|---|---|---|---|---|
| Tier 1 Capital | $ | 50.6 | $ | 48.7 | $ | 44.7 | |||
| Total Capital (Tier 1 and Tier 2) | 75.7 | 73.5 | 66.8 | ||||||
Citibank had net income for the third quarter of 2006 and for the nine months ended September 30, 2006 of $2.3 billion and $7.6 billion, respectively. During the third quarter of 2006 and the nine months ended September 30, 2006, Citibank paid dividends of $0.6 billion and $2.6 billion, respectively.
During the first nine months of 2006 and full year 2005, Citibank issued an additional $2.9 billion and $1.4 billion, respectively, of subordinated notes to Citigroup that qualify for inclusion in Citibank's Tier 2 Capital. Total subordinated notes issued to Citigroup that were outstanding at September 30, 2006 and December 31, 2005 and included in Citibank's Tier 2 capital amounted to $18.1 billion and $15.3 billion, respectively. Following the merger of Citicorp into Citigroup on August 1, 2005, all of Citibank's subordinated debt was assigned to Citigroup. See "Funding" on page 79 for further details of the merger.
Citibank, N.A. Regulatory Capital Ratios(1)
| | Mar. 31, 2007(3) | Dec. 31, 2006 | |||
|---|---|---|---|---|---|
| Tier 1 Capital | 8.13 | % | 8.32 | % | |
| Total Capital (Tier 1 and Tier 2) | 12.05 | 12.39 | |||
| Leverage(2) | 5.97 | 6.09 | |||
Broker/DealerCitibank, N.A. Components of Capital Under Regulatory Guidelines(1)
| In billions of dollars | Mar. 31, 2007(2) | Dec. 31, 2006 | ||||
|---|---|---|---|---|---|---|
| Tier 1 Capital | $ | 62.2 | $ | 59.9 | ||
| Total Capital (Tier 1 and Tier 2) | 92.2 | 89.1 | ||||
Citibank, N.A. had net income for the first three months ended March 31, 2007 amounting to $2.2 billion.
Citibank, N.A. did not issue any additional subordinated notes during the first quarter of 2007. For the full year 2006, Citibank, N.A. issued an additional $7.8 billion of subordinated notes that qualify for inclusion in Citibank, N.A.'s Tier 2 Capital. Total subordinated notes that were outstanding at March 31, 2007 and December 31, 2006 and included in Citibank, N.A.'s Tier 2 Capital amounted to $23.0 billion.
Broker-Dealer Subsidiaries
The Company's broker/dealerbroker-dealer subsidiaries—including Citigroup Global Markets Inc. (CGMI), an indirect wholly owned subsidiary of Citigroup Global Markets Holdings Inc. (CGMHI)—are subject to various securities and commodities regulations and capital adequacy requirements of the regulatory and exchange authorities of the countries in which they operate. The Company's U.S. registered broker/dealerbroker-dealer subsidiaries are subject to the Securities and Exchange Commission's Net Capital Rule, Rule 15c3-1 (the Net Capital Rule) under the Exchange Act. In August
As a registered broker-dealer, CGMI is subject to the SEC's Net Capital Rule. Under the Net Capital Rule, CGMI is required to maintain minimum net capital equal to 2% of aggregate debit items, as defined. Under NYSE regulations, CGMI may be required to reduce its business if its net capital is less than 4% of aggregate debit items and may also be prohibited from expanding its business or paying cash dividends if resulting net capital would be less than 5% of aggregate debit items. Furthermore, the Net Capital Rule does not permit withdrawal of equity or subordinated capital if the resulting net capital would be less than 5% of aggregate debit items.
During the third quarter of 2006, CGMI was approved by the SEC granted CGMI approval to use the alternative method of computingcompute net capital contained in accordance with the provisions of Appendix E of Rule 15c3-1.the Net Capital Rule. This methodology allows CGMI to compute market risk capital charges using internal value-at-riskValue-at-Risk models. Under Appendix E, CGMI is also required to hold tentative net capital in excess of $1 billion and net capital in excess of $500 million. The Net Capital Rule requiresfirm is also required to notify the maintenance of a defined amount of minimumSEC in the event that its tentative net capital. The Net Capital Rule also limits the ability of broker/dealers to transfer large amounts of capital to parent companies and other affiliates.is less than $5 billion.
Compliance with the Net Capital Rule could limit those operations of the CompanyCGMI that require the intensive use of capital, such as underwriting and trading activities and the financing of customer account balances. It couldbalances, and also restrict CGMHI's ability to withdraw capital from its broker/dealerbroker-dealer subsidiaries, which in turn could limit CGMHI's ability to pay dividends and make payments on its debt. CGMHI monitors its leverage and
At March 31, 2007, CGMI had net capital, ratios on a daily basis.computed in accordance with the Net Capital Rule, of $7.5 billion, which exceeded the minimum requirement by $6.8 billion.
In addition, certain of the Company's broker/dealerbroker-dealer subsidiaries are subject to regulation in the other countries in which they do business, including requirements to maintain specified levels of net capital or its equivalent. The Company's broker/dealerbroker-dealer subsidiaries were in compliance with their capital requirements at September 30, 2006.March 31, 2007.
Regulatory Capital and Accounting Standards Developments
Citigroup generally supports the move to a new set of risk-based regulatory capital standards, published on June 26, 2004 (and subsequently amended in November 2005) by the Basel Committee on Banking Supervision (the Basel Committee), consisting of central banks and bank supervisors from 13 countries. The international version of the Basel II framework will allow Citigroup to leverage internal risk models used to measure credit, operational, and market risk exposures to drive regulatory capital calculations. On September 30, 2005, the U.S. banking regulators delayed the U.S. implementation of Basel II by one year. The current U.S. implementation timetable consists of parallel calculations under the current regulatory capital regime (Basel I) and Basel II, starting January 1, 2008, and an implementation transition period, starting January 1, 2009 through year-end 2011 or possibly later. The U.S. regulators have also reserved the right to change how Basel II is applied in the U.S., and retain the existing Prompt Corrective Action and leverage capital requirements applicable to U.S. banking organizations. The new timetable, clarifications, and other proposals are set forth in a notice of proposed rulemaking (NPR) issued on September 25, 2006, which contains a number of material differences from the international version of Basel II.
Citigroup continues to monitor, analyze and comment on the developing capital standards in the U.S. and in countries where Citigroup has significant presence, in order to assess their collective impact and allocate project management and funding resources accordingly.
LIQUIDITY
Overview
At the Holding Company level for Citigroup, for CGMHI, and for the Combined Holding Company and CGMHI, Citigroup maintains sufficient liquidity to meet all maturing unsecured debt obligations due within a one-year time horizon without accessing the unsecured markets.
Management of Liquidity
Management of liquidity at Citigroup is the responsibility of the Head of Corporate Finance and Treasury. A uniform liquidity risk management policy exists for Citigroup and its major operating subsidiaries. Under this policy, there is a single set of standards for the measurement of liquidity risk in order to ensure consistency across businesses, stability in methodologies and transparency of risk. Management of liquidity at each operating subsidiary and/or country is performed on a daily basis and is monitored by Corporate Treasury and independent risk management.
The basis of Citigroup's liquidity management is strong decentralized liquidity management at each of its principal operating subsidiaries and in each of its countries, combined with an active corporate oversight function. As discussed in "Capital Resources"Resources and Liquidity" on page 74,68, Citigroup's FinALCO undertakes this oversight responsibility, along with the Head of Corporate Finance and Treasury. One of the objectives of the FinALCO is to monitor and review the overall liquidity and balance sheet positions of Citigroup and its principal subsidiaries. Similarly, Asset and Liability Committees are also established for each country and/or major line of business.
Monitoring Liquidity
Each principal operating subsidiary and/or country must prepare an annual funding and liquidity plan for review by the Head of Corporate Finance and Treasury and approval by independent risk management. The funding and liquidity plan includes analysis of the balance sheet, as well as the economic and business conditions impacting the liquidity of the major operating subsidiary and/or country. As part of the funding and liquidity plan, liquidity limits, liquidity ratios, market triggers, and assumptions for periodic stress tests are established and approved.
Liquidity Limits
Liquidity limits establish boundaries for market access in business-as-usual conditions and are monitored against the liquidity position on a daily basis. These limits are established based on the size of the balance sheet, depth of the market, experience level of local management, stability of the liabilities, and liquidity of the assets. Finally, the limits are subject to the evaluation of the entities' stress test results. Generally, limits are established such that in stress scenarios, entities are self-funded or net providers of liquidity.
Liquidity Ratios
A series of standard corporate-wide liquidity ratios have been established to monitor the structural elements of Citigroup's liquidity. For bank entities, these include cash capital (defined as core deposits, long-term debt, and capital compared with illiquid assets), liquid assets against liquidity gaps, core deposits to loans, long-term assets to long-term liabilities, and deposits to loans. Several measures exist to review potential concentrations of funding by individual name, product, industry, or geography. At the Holding Company level for Citigroup, for CGMHI and for the Combined Holding Company and CGMHI, ratios are established for liquid assets against short-term obligations. Triggers for management discussion, which may result in other actions, have been established against these ratios. In addition, each individual major operating subsidiary or country establishes targets against these ratios and may monitor other ratios as approved in its funding and liquidity plan.
Market Triggers
Market triggers are internal or external market or economic factors that may imply a change to market liquidity or Citigroup's access to the markets. Citigroup market triggers are monitored by the Head of Corporate Finance and Treasury and the Head of Risk ArchitectureOversight and are discussed in the FinALCO. Appropriate market triggers are also established and monitored for each major operating subsidiary and/or country as part of the funding and liquidity plans. Local triggers are reviewed with the local country or business ALCO and independent risk management.
Stress Testing
Simulated liquidity stress testing is periodically performed for each major operating subsidiary and/or country. The scenarios include assumptions about significant changes in key funding sources, credit ratings, contingent uses of funding, and political and economic conditions in certain countries. The results of stress tests of individual countries and operating subsidiaries are reviewed to ensure that each individual major operating subsidiary or country is either self-funded or a net provider of liquidity. In addition, a Contingency Funding Plan is prepared on a periodic basis for Citigroup. The plan includes detailed policies, procedures, roles and responsibilities, and the results of corporate stress tests. The product of these stress tests is a series of alternatives that can be used by the Head of Corporate Finance and Treasury in a liquidity event.
CGMHI monitors liquidity by tracking asset levels, collateral and funding availability to maintain flexibility to meet its financial commitments. As a policy, CGMHI attempts to maintain sufficient capital and funding sources in order to have the capacity to finance itself on a fully collateralized basis in the event that its access to uncollateralized financing is temporarily impaired. This is documented in CGMHI's contingency funding plan. This plan is reviewed periodically to keep the funding options current and in line with market conditions. The management of this plan includes an analysis used to determine CGMHI's ability to withstand varying levels of stress, including rating downgrades, which could impact its liquidation horizons and required margins. CGMHI maintains liquidity reserves of cash and loan value of unencumbered securities in excess of its outstanding short-term uncollateralized liabilities. This is monitored on a daily basis. CGMHI also ensures that long-term illiquid assets are funded with long-term liabilities.
FUNDING
Overview
As a financial holding company, substantially all of Citigroup's net earnings are generated within its operating subsidiaries. These subsidiaries make funds available to Citigroup, primarily in the form of dividends. Certain subsidiaries' dividend paying abilities may be limited by covenant restrictions in credit agreements, regulatory requirements and/or rating agency requirements that also impact their capitalization levels.
Banking Subsidiaries
There are various legal limitations on the ability of Citigroup's subsidiary depository institutions to extend credit, pay dividends or otherwise supply funds to Citigroup and its nonbank subsidiaries. The approval of the Office of the Comptroller of the Currency, in the case of national banks, or the Office of Thrift Supervision, in the case of federal savings banks, is required if total dividends declared in any calendar year exceed amounts specified by the applicable agency's regulations. State-chartered depository institutions are subject to dividend limitations imposed by applicable state law.
As of September 30, 2006,March 31, 2007, Citigroup's subsidiary depository institutions can declare dividends to their parent companies, without regulatory approval, of approximately $19.9$13.2 billion. In determining the dividends, each depository institution must also consider its effect on applicable risk-based capital and Leverage Ratio requirements, as well as policy statements of the federal regulatory agencies that indicate that banking organizations should generally pay dividends out of current operating earnings. Consistent with these considerations, Citigroup estimates that, as of September 30, 2006,March 31, 2007, its subsidiary depository institutions can distribute dividends to Citigroup of approximately $13.5$10.1 billion of the available $19.9$13.2 billion.
Non-Banking Subsidiaries
Citigroup also receives dividends from its nonbank subsidiaries. These nonbank subsidiaries are generally not subject to regulatory restrictions on dividends.
As discussed in "Capital Resources"Resources and Liquidity" on page 74,68, the ability of CGMHI to declare dividends can be restricted by capital considerations of its broker/dealerbroker-dealer subsidiaries.
During 2006,2007, it is not anticipated that any restrictions on the subsidiaries' dividending capability will restrict Citigroup's ability to meet its obligations as and when they become due.*
Sources of LiquidityFunding
Primary sources of liquidityfunding for Citigroup and its principal subsidiaries include:
Citigroup and its principal subsidiaries also generate funds through securitizing financial assets, including credit card receivables and single-family or multi-family residences. See Note 14 to the Consolidated Financial Statements13 on page 10998 for additional information about securitization activities. Finally, Citigroup's net earnings provide a significant source of funding to the corporation.
Citigroup's funding sources are well diversified across funding types and geography, a benefit of the strength of the global franchise. Funding for the parent and its major operating subsidiaries includes a large geographically diverse retail and corporate deposit base of $669.3$738.5 billion. A significant portion of these deposits has been, and is expected to be, long-term and stable and is considered core.
Citigroup and its subsidiaries have a significant presence in the global capital markets. During the 2005 second quarter, Citigroup consolidatedprimarily conducts its capital markets funding activities intowithin two legal entities: (i) Citigroup Inc., which issues long-term debt, medium-term notes, trust preferred securities, and preferred and common stock; and (ii) Citigroup Funding Inc. (CFI), a first-tier subsidiary of Citigroup, which issues commercial paper, medium-termmedium- term notes and structured equity-linked and credit-linked notes, all of which are guaranteed by Citigroup. As part of the funding consolidation,
Citigroup also guaranteed and continues to guaranteeguarantees various debt obligations of CGMHI, as well as all of the outstanding debt obligations under CGMHI's publicly-issued securities.
In August 2005, Citigroup merged its two intermediate bank holding companies, Citigroup Holdings Company and Citicorp, into Citigroup Inc. Coincident with this merger, Citigroup assumed all existing indebtedness and outstanding guarantees of Citicorp. As a result, Citigroup also guaranteed various debt obligations of Associates and of CitiFinancial Credit Company, each anthe latter two being indirect subsidiarysubsidiaries of Citigroup. In addition, Citigroup guaranteedguarantees various debt obligations of Citigroup Finance Canada Inc. (CFCI), a wholly owned subsidiary of Associates. CFCI continues to issue debt in the Canadian market supported by a Citigroup guarantee. See Note 20 to the Consolidated Financial Statements on page 122115 for further discussions. Other significant elements of long-term debt in the Consolidated Balance Sheet include collateralized advances from the Federal Home Loan Bank system, asset-backed outstandings, related to the purchase of Sears, and certain borrowings of foreign subsidiaries.
CGMHI's consolidated balance sheet is highly liquid, with the vast majority of its assets consisting of marketable securities and collateralized short-term financing agreements arising from securities transactions. The highly liquid nature of these assets provides CGMHI with flexibility in financing and managing its business. CGMHI monitors and evaluates the adequacy of its capital and borrowing base on a daily basis to maintain liquidity, and to ensure that its capital base supports the regulatory capital requirements of its subsidiaries.
Citigroup uses its funding to service debt obligations, to pay dividends to its stockholders, to support organic growth, to fund acquisitions and to repurchase its shares, pursuant to Board of Directors approved plans.
Each of Citigroup's major operating subsidiaries finances its operations on a basis consistent with its capitalization, regulatory structure and the environment in which it operates. Particular attention is paid to those businesses that for tax, sovereign risk, or regulatory reasons cannot be freely and readily funded in the international markets.
Citigroup's borrowings are diversified by geography, investor, instrument and currency. Decisions regarding the ultimate currency and interest rate profile of liquidityfunding generated through these borrowings can be separated from the actual issuance through the use of derivative financial products.
At September 30, 2006,March 31, 2007, long-term debt and commercial paper outstanding for Citigroup Parent Company, CGMHI, Citigroup Funding Inc. and Citigroup's Subsidiariesother subsidiaries were as follows:
| In billions of dollars | Citigroup Parent Company | CGMHI | Citigroup Funding Inc. | Other Citigroup Subsidiaries | Citigroup Parent Company | CGMHI | Citigroup Funding Inc. | Other Citigroup Subsidiaries | ||||||||||||||||||
|---|---|---|---|---|---|---|---|---|---|---|---|---|---|---|---|---|---|---|---|---|---|---|---|---|---|---|
| Long-term debt | $ | 114.3 | $ | 31.0 | $ | 15.3 | $ | 99.5 | (1) | $ | 134.9 | $ | 28.4 | $ | 24.5 | $ | 123.0 | (1) | ||||||||
| Commercial paper | $ | — | $ | — | $ | 33.7 | $ | 0.8 | — | — | $ | 39.7 | $ | 0.9 | ||||||||||||
See Note 13 to the Consolidated Financial Statements12 on page 10695 for further detail on long-term debt and commercial paper outstanding.
Citigroup's ability to access the capital markets and other sources of wholesale funds, as well as the cost of these funds, is highly dependent on its credit ratings. The accompanying chart indicates the current ratings for Citigroup.
Citigroup's Debt Ratings as of September 30, 2006March 31, 2007
| | Citigroup Inc. | Citigroup Funding Inc. | Citibank, N.A. | |||||||||||||||||||
|---|---|---|---|---|---|---|---|---|---|---|---|---|---|---|---|---|---|---|---|---|---|---|
| | Senior Debt | Subordinated Debt | Commercial Paper | Senior Debt | Subordinated Debt | Commercial Paper | Term | Short- Term | ||||||||||||||
| Fitch Ratings | AA+ | AA | F1+ | AA+ | AA | F1+ | AA+ | F1+ | ||||||||||||||
| Moody's Investors Service | Aal | Aa2 | Aa1 | Aa2 | Aaa | |||||||||||||||||
| Standard & Poor's | AA | A-1+ | AA+ | A-1+ | ||||||||||||||||||
On September 26, 2006, Moody's Investors Service upgraded Citibank, N.A.'s long-term rating to "Aaa" from "Aa1."February 14, 2007, Standard & Poor's placed itsupgraded the ratings onof Citigroup and itscertain rated subsidiaries on credit watch with "positive implications" on November 1, 2006.subsidiaries. The senior debt ratings of Citigroup and Citigroup Funding Inc. (CFI) were upgraded to "AA" from "AA-." The subordinated debt ratings of Citigroup and Citigroup Funding Inc. (CFI) were upgraded to "AA-" from "A+." The long-term rating of Citibank, N.A. was upgraded to "AA+" from "AA." The outlook for all of Citigroup's ratings is "stable."
Some of Citigroup's nonbank subsidiaries, including CGMHI, have credit facilities with Citigroup's subsidiary depository institutions, including Citibank, N.A. Borrowings under these facilities must be secured in accordance with Section 23A of the Federal Reserve Act. There are various legal restrictions on the extent to which a bank holding company and certain of its nonbank subsidiaries can borrow or obtain credit from Citigroup's subsidiary depository institutions or engage in certain other transactions with them. In general, these restrictions require that transactions be on arm's-length terms and be secured by designated amounts of specified collateral. See Note 13 to the Consolidated Financial Statements12 on page 106.
Citigroup uses its liquidity to service debt obligations, to pay dividends to its stockholders, to support organic growth, to fund acquisitions and to repurchase its shares, pursuant to Board of Directors approved plans.
Each of Citigroup's major operating subsidiaries finances its operations on a basis consistent with its capitalization, regulatory structure and the environment in which it operates. Particular attention is paid to those businesses that for tax, sovereign risk, or regulatory reasons cannot be freely and readily funded in the international markets.95.
OFF-BALANCE SHEET ARRANGEMENTS
Overview
Citigroup and its subsidiaries are involved with several types of off-balance sheet arrangements, including special purpose entities (SPEs), lines and letters of credit, and loan commitments.
The securitization process enhances the liquidity of the financial markets, may spread credit risk among several market participants, and makes new funds available to extend credit to consumers and commercial entities.
Uses of SPEs
In order to execute securitizations, the Company uses SPEs. An SPE is an entity in the form of a trust or other legal vehicle designed to fulfill a specific limited need of the company that organized it.
The principal uses of SPEs are to obtain liquidity and favorable capital treatment by securitizing certain of Citigroup's financial assets, to assist clients in securitizing their financial assets, and to create investment products for clients. SPEs may be organized as trusts, partnerships, or corporations. In a securitization, the company transferring assets to an SPE converts those assets into cash before they would have been realized in the normal course of business, through the SPE's issuing debt and equity instruments, certificates, commercial paper, and other notes of indebtedness. Investors usually have recourse to the assets in the SPE and often benefit from other credit enhancements, such as a collateral account or overcollateralization in the form of excess assets in the SPE, or from a liquidity facility, such as a line of credit or asset purchase agreement. Accordingly, the SPE can typically obtain a more favorable credit rating from rating agencies than the transferor could obtain for its own debt issuances, resulting in less expensive financing costs. The SPE may also enter into derivative contracts in order to convert the yield or currency of the underlying assets to match the needs of the SPE investors, or to limit or change the credit risk of the SPE. Citigroup may be the counterparty to these derivatives.
SPEs may be Qualifying SPEs (QSPEs) or variable interest entities (VIEs) or neither. A VIE is a type of SPE that does not have sufficient equity to finance its activities without additional subordinated financial support from third parties; itsparties. Its investors may not have the power to make significant decisions about the entity's operations;operations, or investors may not share pro rata in the entity's expected returns or losses. The Company's credit card receivable and mortgage loan securitizations are organized as QSPEs and are, therefore, not VIEs subject to FASB Interpretation No. 46, "Consolidation of Variable Interest Entities (revised December 2003)," (FIN 46-R). When an entity is deemed a VIE under FIN 46-R, the entity in question must be consolidated by the primary beneficiary; however, the Company is not the primary beneficiary of most of these entities and as such does not consolidate most of them.
Securitization of Citigroup's Assets
In some of these off-balance sheet arrangements, including credit card receivable and mortgage loan securitizations, Citigroup is securitizing assets that were previously recorded on its Consolidated Balance Sheet. A summary of certain cash flows received from and paid to securitization trusts is included in Note 14 to the Consolidated Financial Statements13 on page 109.98.
Credit Card Receivables
Credit card receivables are securitized through trusts, which are established to purchase the receivables. Citigroup sells receivables into the trusts on a non-recourse basis. Credit card securitizations are revolving securitizations; that is, as customers pay their credit card balances, the cash proceeds are used to purchase new receivables and replenish the receivables in the trust. CGMI is one of several underwriters that distribute securities issued by the trusts to investors. The Company relies on securitizations to fund a significant portion of its managedU.S. Cards business.business, which includes both on-balance sheet and securitized receivables.
The following table reflects amounts related to the Company's securitized credit card receivables at September 30, 2006March 31, 2007 and December 31, 2005:2006:
| In billions of dollars | Sept. 30, 2006 | Dec. 31, 2005 | ||||
|---|---|---|---|---|---|---|
| Total assets in trusts | $ | 108.4 | $ | 107.7 | ||
| Amounts sold to investors via trust-issued securities | 93.3 | 92.1 | ||||
| Remaining seller's interest: | ||||||
| Recorded as consumer loans | 10.3 | 11.6 | ||||
| Recorded as available-for- sale securities (AFS) | 4.9 | 4.0 | ||||
| Amounts receivable from trusts | 4.5 | 1.0 | ||||
| Amounts payable to trusts | 1.6 | 1.6 | ||||
| Interest-only strip | 2.3 | 2.1 | ||||
| In billions of dollars | Mar. 31, 2007 | Dec. 31, 2006 | ||||
|---|---|---|---|---|---|---|
| Principal amount of credit card receivables in trusts | $ | 108.9 | $ | 112.4 | ||
| Ownership interests in principal amount of trust credit card receivables: | ||||||
| Sold to investors via trust-issued securities | 93.8 | 93.1 | ||||
| Retained by Citigroup as trust-issued securities | 3.3 | 5.1 | ||||
| Retained by Citigroup via non-certificated interest recorded as consumer loans | 11.8 | 14.2 | ||||
| Total ownership interests in principal amount of trust credit card receivables | $ | 108.9 | $ | 112.4 | ||
| Other amounts recorded on the balance sheet related to interests retained in the trusts: | ||||||
| Amounts receivable from trusts | $ | 4.5 | $ | 4.5 | ||
| Amounts payable to trusts | 1.8 | 1.7 | ||||
| Residual interest retained in trust cash flows | 2.7 | 2.5 | ||||
TheIn the first quarters of 2007 and 2006, the Company recorded net gains from securitization of credit card receivables of $0.1 billion$248 million and $0.3 billion during the third quarters of 2006 and 2005, respectively, and recorded net gains of $0.6 billion and $0.8 billion during the first nine months of 2006 and 2005,$171 million, respectively. Net gains reflect the following:
See Note 14 to the Consolidated Financial Statements13 on page 10998 for additional information regarding the Company's securitization activities.
Mortgages and Other Assets
The Company provides a wide range of mortgage and other loan products to its customers. In addition to providing a source of liquidity and less expensive funding, securitizing these assets also reduces the Company's credit exposure to the borrowers. The Company's mortgage loan securitizations are primarily non-recourse, thereby effectively transferring the risk of future credit losses to the purchasers of the securities issued by the trust. In addition to servicing rights, the Company also retains a residual interest in its auto loan, student loan and other asset securitizations, consisting of securities and interest-only strips that arise from the calculation of gain or loss at the time assets are sold to the SPE. The Company recognized gains related to the securitization of mortgages and other assets of $110$44 million and $71$51 million in the three months ended September 30,first quarters of 2007 and 2006, and 2005, respectively, and $263 million and $214 million during the first nine months of 2006 and 2005, respectively.
Securitization of Client Assets
The Company acts as an intermediary for its corporate clients, assisting them in obtaining liquidity by selling their trade receivables or other financial assets to an SPE.
In addition, Citigroup administers several third-party-owned, special purpose, multi-seller finance companies that purchase pools of trade receivables, credit cards,card receivables, and other financial assets from its clients. As administrator, the Company provides accounting, funding, and operations services to these conduits but has no ownership interest. Generally, the clients continue to service the transferred assets. The conduits' asset purchases are funded by issuing commercial paper and medium-term notes. Clients absorb the first losses of the conduits by providing collateral in the form of excess assets or holding a residual interest. The Company, along with other financial institutions, provides liquidity facilities, such as commercial paper backstop lines of credit to the conduits. The Company also provides loss enhancement in the form of letters of credit and other guarantees. All fees are charged on a market basis. During 2003 many of the conduits issued "first loss" subordinated notes to third-party investors so that such investors in each conduit would be deemed the primary beneficiary under FIN 46-R, and would consolidate that conduit.
At September 30, 2006March 31, 2007 and December 31, 2005,2006, total assets and liabilities in the unconsolidated conduits were $69.5$74 billion and $55$66 billion, respectively.
Creation of Other Investment and Financing Products
The Company packages and securitizes assets purchased in the financial markets in order to create new security offerings, including arbitrage collateralized debt obligations (CDOs) and synthetic CDOs for institutional clients and retail customers, which match the clients' investment needs and preferences. Typically these instruments diversify investors' risk to a pool of assets as compared with investments in individual assets. The VIEs, which are issuers of CDO securities, are generally organized as limited liability corporations. The Company typically receives fees for structuring and/or distributing the securities sold to investors. In some cases, the Company may repackage the investment with higher-rated debt CDO securities or U.S. Treasury securities to provide a greater or a very high degree of certainty of the return of invested principal. A third-party manager is typically retained by the VIE to select collateral for inclusion in the pool and then actively manage it, or, in other cases, only to manage work-out credits. The Company may also provide other financial services and/or products to the VIEs for market-rate fees. These may include: the provision of liquidity or contingent liquidity facilities, interest rate or foreign exchange hedges and credit derivative instruments, as well as the purchasing and warehousing of securities until they are sold to the SPE. The Company is not the primary beneficiary of these VIEs under FIN 46-R due to its limited continuing involvement and, as a result, we do not consolidate their assets and liabilities in our financial statements.
See Note 14 to the Consolidated Financial Statements13 on page 10998 for additional information about off-balance sheet arrangements.
Credit Commitments and Lines of Credit
The table below summarizes Citigroup's credit commitments as of September 30, 2006March 31, 2007 and December 31, 2005.2006.
| In millions of dollars | September 30, 2006 | December. 31, 2005 | March 31, 2007 | December 31, 2006 | ||||||||
|---|---|---|---|---|---|---|---|---|---|---|---|---|
Financial standby letters of credit and foreign office guarantees | $ | 70,432 | $ | 52,384 | $ | 83,568 | $ | 72,548 | ||||
Performance standby letters of credit and foreign office guarantees | 15,540 | 13,946 | 15,861 | 15,802 | ||||||||
Commercial and similar letters of credit | 7,669 | 5,790 | 7,969 | 7,861 | ||||||||
One- to four-family residential mortgages | 3,958 | 3,343 | 5,669 | 3,457 | ||||||||
Revolving open-end loans secured by one- to four-family residential properties | 30,973 | 25,089 | 33,528 | 32,449 | ||||||||
Commercial real estate, construction and land development | 3,949 | 2,283 | 4,875 | 4,007 | ||||||||
Credit card lines(1) | 960,930 | 859,504 | 1,006,204 | 987,409 | ||||||||
Commercial and other Consumer loan commitments(2) | 418,576 | 346,444 | ||||||||||
| Commercial and other consumer loan commitments(2) | 469,403 | 439,931 | ||||||||||
Total | $ | 1,512,027 | $ | 1,308,783 | $ | 1,627,077 | $ | 1,563,464 | ||||
CORPORATE GOVERNANCE AND CONTROLS AND PROCEDURES
Corporate governanceGovernance
Citigroup has a Code of Conduct that reflectsmaintains the Company's commitment to the highest standards of conduct. The Company has established an ethics hotline for employees. The Code of Conduct is supplemented by a Code of Ethics for Financial Professionals (including finance, accounting, treasury, tax and investor relations professionals) that applies worldwide.
Both the Code of Conduct and the Code of Ethics for Financial Professionals can be found on the Citigroup Web site, www.citigroup.com, by clicking on the "Corporate Governance" page. The Company's Corporate Governance Guidelines and the charters for the Audit and Risk Management Committee, the Nomination and Governance Committee, the Personnel and Compensation Committee, and the Public Affairs Committee of the Board are also available under the "Corporate Governance" page, or by writing to Citigroup Inc., Corporate Governance, 425 Park Avenue, 2nd floor,Floor, New York, New York 10043.
Controls and proceduresProcedures
Disclosure
The Company's disclosure controls and procedures are designed to ensure that information required to be disclosed under the Exchange Act securities laws is accumulated and communicated to management, including the Chief Executive Officer (CEO) and Chief Financial Officer (CFO), to allow for timely decisions regarding required disclosure and appropriate SEC filings.
The Company's Disclosure Committee is responsible for ensuring that there is an adequate and effective process for establishing, maintaining and evaluating disclosure controls and procedures for the Company's external disclosures.
The Company's management, with the participation of the Company's CEO and CFO, has evaluated the effectiveness of the Company's disclosure controls and procedures (as defined in Rule 13a-15(e) under the Exchange Act) as of September 30, 2006March 31, 2007 and, based on that evaluation, the CEO and CFO have concluded that at that date the Company's disclosure controls and procedures were effective.
Financial reportingReporting
The Company'sinternal control over financial reporting is a process under the supervision of the CEO and CFO, and effected by Citigroup's Board of Directors, management and other personnel, to provide reasonable assurance regarding the reliability of financial reporting and the preparation of financial statements in accordance with generally accepted accounting principles. These controls include policies and procedures thatthat:
Citigroup has had a longstanding process whereby business and financial officers throughout the Company attest to the accuracy of financial information reported in corporate systems as well as the effectiveness of internal controls over financial reporting and disclosure processes.
Company management is responsible for establishing and maintaining adequate internal control over financial reporting. Management maintains a comprehensive system of controls intended to ensure that transactions are executed in accordance with management's authorization, assets are safeguarded, and financial records are reliable. Management also takes steps to see that information and communication flows are effective and to monitor performance, including performance of internal control procedures.
All internal control systems, no matter how well designed, have inherent limitations. Therefore, even those systems determined to be effective can provide only reasonable assurance with respect to financial statement preparation and presentation.
There were no changes in the Company's internal control over financial reporting during the fiscal quarter ended September 30, 2006March 31, 2007 that materially affected, or are reasonably likely to materially affect, the Company's internal control over financial reporting.
FORWARD-LOOKING STATEMENTS
In this Quarterly Report on Form 10-Q, the Company uses certain forward-looking statements when describing future business conditions. The Company's actual results may differ materially from those included in the forward-looking statements and are indicated by words such as "believe," "expect," "anticipate," "intend," "estimate," "may increase," "may fluctuate," and similar expressions, or future or conditional verbs such as "will," "should," "would," and "could."
These forward-looking statements involve external risks and uncertainties including, but not limited, to those described in the Company's 20052006 Annual Report on Form 10-K section entitled "Risk Factors": economic conditions,conditions; credit, market and liquidity risk, competition,risk; competition; country risk,risk; operational risk,risk; U.S. fiscal policies, reputationpolicies; reputational and legal riskrisk; and certain regulatory considerations. Risks and uncertainties disclosed in this 10-Q include, but are not limited to:
| Page No. | |||
|---|---|---|---|
Financial Statements: | |||
Consolidated Statement of Income (Unaudited)—Three | 80 | ||
Consolidated Balance Sheet— | 81 | ||
Consolidated Statement of Changes in Stockholders' Equity (Unaudited)— | 82 | ||
Consolidated Statement of Cash Flows (Unaudited)— | 83 | ||
Consolidated Balance Sheet—Citibank, N.A. and Subsidiaries and December 31, | 84 | ||
Notes to Consolidated Financial Statements (Unaudited): | |||
Note 1—Basis of Presentation | 85 | ||
Note 2—Discontinued Operations | 87 | ||
Note | 89 | ||
Note 4— | |||
90 | |||
Note | 90 | ||
Note 6—Retirement Benefits | 91 | ||
Note 7— | 92 | ||
Note 8— | |||
93 | |||
Note | 93 | ||
Note | 94 | ||
Note 11—Investments | 95 | ||
Note 12— | 95 | ||
Note 13— | |||
98 | |||
Note 14—Changes in Accumulated Other Comprehensive Income (Loss) | 102 | ||
Note 15— | 102 | ||
Note 16—Fair Value | 105 | ||
Note | 111 | ||
Note 18—Contingencies | 113 | ||
Note 19—Citibank, N.A. and Subsidiaries Statement of Changes in Stockholder's Equity | 114 | ||
Note 20—Condensed Consolidating Financial Statement Schedules | 115 | ||
CONSOLIDATED FINANCIAL STATEMENTS
CITIGROUP INC. AND SUBSIDIARIES
CONSOLIDATED STATEMENT OF INCOME (Unaudited)
| | Three Months Ended September 30, | Nine Months Ended September 30, | Three Months Ended March 31, | ||||||||||||||||
|---|---|---|---|---|---|---|---|---|---|---|---|---|---|---|---|---|---|---|---|
| In millions of dollars, except per share amounts | 2006 | 2005(1) | 2006(1) | 2005(1) | 2007 | 2006(1) | |||||||||||||
| Revenues | |||||||||||||||||||
| Interest revenue | $ | 24,729 | $ | 19,344 | $ | 70,174 | $ | 55,313 | $ | 28,132 | $ | 21,873 | |||||||
| Interest expense | 14,901 | 9,649 | 40,725 | 25,741 | 17,562 | 12,107 | |||||||||||||
| Net interest revenue | $ | 9,828 | $ | 9,695 | $ | 29,449 | $ | 29,572 | $ | 10,570 | $ | 9,766 | |||||||
| Insurance premiums | $ | 819 | $ | 743 | $ | 2,389 | $ | 2,271 | |||||||||||
| Commissions and fees | 4,007 | 4,825 | 14,526 | 13,012 | $ | 5,773 | $ | 5,188 | |||||||||||
| Principal transactions | 1,927 | 1,950 | 5,747 | 5,009 | 2,997 | 2,117 | |||||||||||||
| Administration and other fiduciary fees | 1,670 | 1,522 | 5,082 | 4,518 | 1,949 | 1,705 | |||||||||||||
| Realized gains (losses) from sales of investments | 304 | 284 | 985 | 982 | 473 | 379 | |||||||||||||
| Insurance premiums | 838 | 770 | |||||||||||||||||
| Other revenue | 2,867 | 2,479 | 7,609 | 7,499 | 2,859 | 2,258 | |||||||||||||
| Total non-interest revenues | $ | 11,594 | $ | 11,803 | $ | 36,338 | $ | 33,291 | $ | 14,889 | $ | 12,417 | |||||||
| Total revenues, net of interest expense | $ | 21,422 | $ | 21,498 | $ | 65,787 | $ | 62,863 | $ | 25,459 | $ | 22,183 | |||||||
| Provision for credit losses and for benefits and claims | |||||||||||||||||||
| Provision for loan losses | $ | 1,793 | $ | 2,525 | $ | 4,625 | $ | 6,058 | $ | 2,706 | $ | 1,396 | |||||||
| Policyholder benefits and claims | 274 | 215 | 732 | 644 | 261 | 227 | |||||||||||||
| Provision for unfunded lending commitments | 50 | 100 | 250 | 200 | — | 50 | |||||||||||||
| Total provision for credit losses and for benefits and claims | $ | 2,117 | $ | 2,840 | $ | 5,607 | $ | 6,902 | $ | 2,967 | $ | 1,673 | |||||||
| Operating expenses | |||||||||||||||||||
| Compensation and benefits | $ | 6,718 | $ | 6,792 | $ | 22,355 | $ | 19,311 | $ | 8,699 | $ | 8,263 | |||||||
| Net occupancy expense | 1,435 | 1,270 | 4,228 | 3,782 | 1,529 | 1,382 | |||||||||||||
| Technology/communication expense | 948 | 892 | 2,768 | 2,642 | 979 | 886 | |||||||||||||
| Advertising and marketing expense | 574 | 587 | 1,829 | 1,848 | 617 | 603 | |||||||||||||
| Restructuring expense | 1,377 | — | |||||||||||||||||
| Other operating expenses | 2,261 | 1,872 | 6,883 | 6,206 | 2,370 | 2,224 | |||||||||||||
| Total operating expenses | $ | 11,936 | $ | 11,413 | $ | 38,063 | $ | 33,789 | $ | 15,571 | $ | 13,358 | |||||||
| Income from continuing operations before income taxes and minority interest | $ | 7,369 | $ | 7,245 | $ | 22,117 | $ | 22,172 | $ | 6,921 | $ | 7,152 | |||||||
| Provision for income taxes | 2,020 | 2,164 | 5,860 | 6,827 | 1,862 | 1,537 | |||||||||||||
| Minority interest, net of taxes | 46 | 93 | 137 | 511 | 47 | 60 | |||||||||||||
| Income from continuing operations | $ | 5,303 | $ | 4,988 | $ | 16,120 | $ | 14,834 | $ | 5,012 | $ | 5,555 | |||||||
| Discontinued operations | |||||||||||||||||||
| Income from discontinued operations | $ | 26 | $ | 49 | $ | 27 | $ | 1,025 | $ | — | $ | 1 | |||||||
| Gain on sale | 198 | 3,386 | 219 | 3,386 | — | 21 | |||||||||||||
| Provision (benefit) for income taxes and minority interest, net of taxes | 22 | 1,280 | (43 | ) | 1,588 | — | (62 | ) | |||||||||||
| Income from discontinued operations, net of taxes | $ | 202 | $ | 2,155 | $ | 289 | $ | 2,823 | $ | — | $ | 84 | |||||||
| Net income | $ | 5,505 | $ | 7,143 | $ | 16,409 | $ | 17,657 | $ | 5,012 | $ | 5,639 | |||||||
| Basic earnings per share(2) | |||||||||||||||||||
| Income from continuing operations | $ | 1.08 | $ | 0.98 | $ | 3.28 | $ | 2.90 | $ | 1.02 | $ | 1.13 | |||||||
| Income from discontinued operations, net of taxes | 0.04 | 0.43 | 0.06 | 0.55 | — | 0.02 | |||||||||||||
| Net Income | $ | 1.13 | $ | 1.41 | $ | 3.34 | $ | 3.45 | $ | 1.02 | $ | 1.14 | |||||||
| Weighted average common shares outstanding | 4,875.5 | 5,058.3 | 4,898.4 | 5,103.6 | 4,877.0 | 4,920.7 | |||||||||||||
| Diluted earnings per share | |||||||||||||||||||
| Diluted earnings per share(2) | |||||||||||||||||||
| Income from continuing operations | $ | 1.06 | $ | 0.97 | $ | 3.22 | $ | 2.85 | $ | 1.01 | $ | 1.11 | |||||||
| Income from discontinued operations, net of taxes | 0.04 | 0.41 | 0.06 | 0.54 | — | 0.02 | |||||||||||||
| Net income | $ | 1.10 | $ | 1.38 | $ | 3.28 | $ | 3.39 | $ | 1.01 | $ | 1.12 | |||||||
| Adjusted weighted average common shares outstanding | 4,978.6 | 5,146.0 | 4,992.2 | 5,193.4 | 4,967.9 | 5,007.9 | |||||||||||||
See Notes to the Unaudited Consolidated Financial Statements.
CITIGROUP INC. AND SUBSIDIARIES
CONSOLIDATED BALANCE SHEET
| In millions of dollars, except shares | In millions of dollars, except shares | September 30, 2006 (Unaudited) | December 31, 2005(1) | In millions of dollars, except shares | March 31, 2007 (Unaudited) | December 31, 2006 | ||||||||||
|---|---|---|---|---|---|---|---|---|---|---|---|---|---|---|---|---|
| Assets | Assets | Assets | ||||||||||||||
| Cash and due from banks (including segregated cash and other deposits) | Cash and due from banks (including segregated cash and other deposits) | $ | 22,543 | $ | 23,632 | Cash and due from banks (including segregated cash and other deposits) | $ | 24,421 | $ | 26,514 | ||||||
| Deposits at interest with banks | 33,939 | 31,645 | ||||||||||||||
| Federal funds sold and securities borrowed or purchased under agreements to resell | 262,627 | 217,464 | ||||||||||||||
| Deposits with banks | Deposits with banks | 44,906 | 42,522 | |||||||||||||
| Federal funds sold and securities borrowed or purchased under agreements to resell (including $78,113 at fair value as of March 31, 2007) | Federal funds sold and securities borrowed or purchased under agreements to resell (including $78,113 at fair value as of March 31, 2007) | 303,925 | 282,817 | |||||||||||||
| Brokerage receivables | Brokerage receivables | 40,970 | 42,823 | Brokerage receivables | 51,976 | 44,445 | ||||||||||
| Trading account assets (including $104,375 and $92,495 pledged to creditors at September 30, 2006 and December 31, 2005, respectively) | 351,149 | 295,820 | ||||||||||||||
| Investments (including $18,221 and $15,819 pledged to creditors at September 30, 2006 and December 31, 2005, respectively) | 251,748 | 180,597 | ||||||||||||||
| Trading account assets (including $167,214 and $125,231 pledged to creditors at March 31, 2007 and December 31, 2006, respectively) | Trading account assets (including $167,214 and $125,231 pledged to creditors at March 31, 2007 and December 31, 2006, respectively) | 460,065 | 393,925 | |||||||||||||
| Investments (including $21,018 and $16,355 pledged to creditors as of March 31, 2007 and December 31, 2006, respectively) | Investments (including $21,018 and $16,355 pledged to creditors as of March 31, 2007 and December 31, 2006, respectively) | 286,567 | 273,591 | |||||||||||||
| Loans, net of unearned income | Loans, net of unearned income | Loans, net of unearned income | ||||||||||||||
| Consumer | 488,673 | 454,620 | Consumer | 519,105 | 512,921 | |||||||||||
| Corporate (including $491 at September 30, 2006 at fair value) | 166,709 | 128,883 | Corporate (including $1,832 and $384 at fair value as of March 31, 2007 and December 31, 2006, respectively) | 174,239 | 166,271 | |||||||||||
| Loans, net of unearned income | Loans, net of unearned income | $ | 655,382 | $ | 583,503 | Loans, net of unearned income | $ | 693,344 | $ | 679,192 | ||||||
| Allowance for loan losses | (8,979 | ) | (9,782 | ) | ||||||||||||
| Allowance for loan losses | (9,510 | ) | (8,940 | ) | ||||||||||||
| Total loans, net | Total loans, net | $ | 646,403 | $ | 573,721 | Total loans, net | $ | 683,834 | $ | 670,252 | ||||||
| Goodwill | Goodwill | 33,169 | 33,130 | Goodwill | 34,380 | 33,415 | ||||||||||
| Intangible assets | Intangible assets | 15,725 | 14,749 | Intangible assets | 19,330 | 15,901 | ||||||||||
| Other assets | 87,975 | 80,456 | ||||||||||||||
| Other assets (including $13,375 at fair value as of March 31, 2007) | Other assets (including $13,375 at fair value as of March 31, 2007) | 111,562 | 100,936 | |||||||||||||
| Total assets | Total assets | $ | 1,746,248 | $ | 1,494,037 | Total assets | $ | 2,020,966 | $ | 1,884,318 | ||||||
| Liabilities | Liabilities | Liabilities | ||||||||||||||
| Non-interest-bearing deposits in U.S. offices | $ | 36,358 | $ | 36,638 | Non-interest-bearing deposits in U.S. offices | $ | 39,296 | $ | 38,615 | |||||||
| Interest-bearing deposits in U.S. offices (including $238 at September 30, 2006 at fair value) | 183,467 | 169,277 | Interest-bearing deposits in U.S. offices (including $584 and $366 at fair value As of March 31, 2007 and December 31, 2006, respectively) | 198,840 | 195,002 | |||||||||||
| Non-interest-bearing deposits in offices outside the U.S. | 32,721 | 32,614 | Non-interest-bearing deposits in offices outside the U.S. | 36,328 | 35,149 | |||||||||||
| Interest-bearing deposits in offices outside the U.S. (including $296 at September 30, 2006 at fair value) | 416,732 | 353,299 | Interest-bearing deposits in offices outside the U.S. (including $1,470 and $472 at fair value at March 31, 2007 and December 31, 2006, respectively) | 464,057 | 443,275 | |||||||||||
| Total deposits | Total deposits | $ | 669,278 | $ | 591,828 | Total deposits | $ | 738,521 | $ | 712,041 | ||||||
| Federal funds purchased and securities loaned or sold under agreements to repurchase | 320,095 | 242,392 | ||||||||||||||
| Federal funds purchased and securities loaned or sold under agreements to repurchase (including $180,846 at fair value as of March 31, 2007) | Federal funds purchased and securities loaned or sold under agreements to repurchase (including $180,846 at fair value as of March 31, 2007) | 393,670 | 349,235 | |||||||||||||
| Brokerage payables | Brokerage payables | 97,229 | 70,994 | Brokerage payables | 88,722 | 85,119 | ||||||||||
| Trading account liabilities | Trading account liabilities | 138,876 | 121,108 | Trading account liabilities | 173,902 | 145,887 | ||||||||||
| Short-term borrowings (including $2,558 at September 30, 2006 at fair value) | 70,501 | 66,930 | ||||||||||||||
| Long-term debt (including $12,048 at September 30, 2006 at fair value) | 260,089 | 217,499 | ||||||||||||||
| Other liabilities | 72,315 | 70,749 | ||||||||||||||
| Short-term borrowings (including $14,304 and $2,012 at fair value as of March 31, 2007 and December 31, 2006, respectively) | Short-term borrowings (including $14,304 and $2,012 at fair value as of March 31, 2007 and December 31, 2006, respectively) | 111,179 | 100,833 | |||||||||||||
| Long-term debt (including $31,237 and $9,439 at fair value as of March 31, 2007 and December 31, 2006, respectively) | Long-term debt (including $31,237 and $9,439 at fair value as of March 31, 2007 and December 31, 2006, respectively) | 310,768 | 288,494 | |||||||||||||
| Other liabilities (including $962 at fair value as of March 31, 2007) | Other liabilities (including $962 at fair value as of March 31, 2007) | 82,121 | 82,926 | |||||||||||||
| Total liabilities | Total liabilities | $ | 1,628,383 | $ | 1,381,500 | Total liabilities | $ | 1,898,883 | $ | 1,764,535 | ||||||
| Stockholders' equity | Stockholders' equity | Stockholders' equity | ||||||||||||||
| Preferred stock ($1.00 par value; authorized shares: 30 million), at aggregate liquidation value | Preferred stock ($1.00 par value; authorized shares: 30 million), at aggregate liquidation value | $ | 1,000 | $ | 1,125 | Preferred stock ($1.00 par value; authorized shares: 30 million), at aggregate liquidation value | $ | 1,000 | $ | 1,000 | ||||||
| Common stock ($.01 par value; authorized shares: 15 billion), issued shares-5,477,416,086 shares at September 30, 2006 and at December 31, 2005 | 55 | 55 | ||||||||||||||
| Common stock ($.01 par value; authorized shares: 15 billion), issued shares—5,477,416,086 shares at March 31, 2007 and at December 31, 2006 | Common stock ($.01 par value; authorized shares: 15 billion), issued shares—5,477,416,086 shares at March 31, 2007 and at December 31, 2006 | 55 | 55 | |||||||||||||
| Additional paid-in capital | Additional paid-in capital | 17,825 | 17,483 | Additional paid-in capital | 17,341 | 18,253 | ||||||||||
| Retained earnings | Retained earnings | 126,544 | 117,555 | Retained earnings | 131,395 | 129,267 | ||||||||||
| Treasury stock, at cost:September 30, 2006—563,749,260 shares and December 31, 2005—497,192,288 shares | (24,737 | ) | (21,149 | ) | ||||||||||||
| Accumulated other changes in equity from nonowner sources | (2,822 | ) | (2,532 | ) | ||||||||||||
| Treasury stock, at cost:March 31, 2007—530,976,999 shares and December 31, 2006—565,422,301 shares | Treasury stock, at cost:March 31, 2007—530,976,999 shares and December 31, 2006—565,422,301 shares | (23,833 | ) | (25,092 | ) | |||||||||||
| Accumulated other comprehensive income (loss) | Accumulated other comprehensive income (loss) | (3,875 | ) | (3,700 | ) | |||||||||||
| Total stockholders' equity | Total stockholders' equity | $ | 117,865 | $ | 112,537 | Total stockholders' equity | $ | 122,083 | $ | 119,783 | ||||||
| Total liabilities and stockholders' equity | Total liabilities and stockholders' equity | $ | 1,746,248 | $ | 1,494,037 | Total liabilities and stockholders' equity | $ | 2,020,966 | $ | 1,884,318 | ||||||
See Notes to the Unaudited Consolidated Financial Statements.
CITIGROUP INC. AND SUBSIDIARIES
CONSOLIDATED STATEMENT OF CHANGES IN STOCKHOLDERS' EQUITY (Unaudited)
| | Three Months Ended March 31, | ||||||
|---|---|---|---|---|---|---|---|
| In millions of dollars, except shares in thousands | 2007 | 2006 | |||||
| Preferred stock at aggregate liquidation value | |||||||
| Balance, beginning of period | $ | 1,000 | $ | 1,125 | |||
| Redemption or retirement of preferred stock | — | (125 | ) | ||||
| Balance, end of period | $ | 1,000 | $ | 1,000 | |||
| Common stock and additional paid-in capital | |||||||
| Balance, beginning of period | $ | 18,308 | $ | 17,538 | |||
| Employee benefit plans | (913 | ) | (365 | ) | |||
| Other | 1 | 1 | |||||
| Balance, end of period | $ | 17,396 | $ | 17,174 | |||
| Retained earnings | |||||||
| Balance, beginning of period | $ | 129,267 | $ | 117,555 | |||
| Adjustment to opening balance, net of tax(1) | (186 | ) | — | ||||
| Adjusted balance, beginning of period | $ | 129,081 | $ | 117,555 | |||
| Net income | 5,012 | 5,639 | |||||
| Common dividends(2) | (2,682 | ) | (2,474 | ) | |||
| Preferred dividends | (16 | ) | (17 | ) | |||
| Balance, end of period | $ | 131,395 | $ | 120,703 | |||
| Treasury stock, at cost | |||||||
| Balance, beginning of period | $ | (25,092 | ) | $ | (21,149 | ) | |
| Issuance of shares pursuant to employee benefit plans | 1,904 | 1,391 | |||||
| Treasury stock acquired(3) | (645 | ) | (2,000 | ) | |||
| Other | — | 5 | |||||
| Balance, end of period | $ | (23,833 | ) | $ | (21,753 | ) | |
| Accumulated other comprehensive income (loss) | |||||||
| Balance, beginning of period | $ | (3,700 | ) | $ | (2,532 | ) | |
| Adjustment to opening balance, net of tax(4) | 149 | — | |||||
| Adjusted balance, beginning of period | $ | (3,551 | ) | $ | (2,532 | ) | |
| Net change in unrealized gains and losses on investment securities, net of tax | 159 | (356 | ) | ||||
| Net change in cash flow hedges, net of tax | (439 | ) | 206 | ||||
| Net change in foreign currency translation adjustment, net of tax | (121 | ) | (28 | ) | |||
| Pension liability adjustment, net of tax | 77 | 4 | |||||
| Net change in Accumulated other comprehensive income (loss) | $ | (324 | ) | $ | (174 | ) | |
| Balance, end of period | $ | (3,875 | ) | $ | (2,706 | ) | |
| Total common stockholders' equity (shares outstanding: 4,946,439 at March 31, 2007 and 4,971,241 at December 31, 2006) | $ | 121,083 | $ | 113,418 | |||
| Total stockholders' equity | $ | 122,083 | $ | 114,418 | |||
| Comprehensive income | |||||||
| Net income | $ | 5,012 | $ | 5,639 | |||
| Net change in Accumulated other comprehensive income (loss) | (324 | ) | (174 | ) | |||
| Total comprehensive income | $ | 4,688 | $ | 5,465 | |||
See Note 1 and Note 16 on pages 85 and 105, respectively.
See Notes to the Unaudited Consolidated Financial Statements.
CITIGROUP INC. AND SUBSIDIARIES
CONSOLIDATED STATEMENT OF CASH FLOWS (Unaudited)
| | Three Months Ended March 31, | |||||||
|---|---|---|---|---|---|---|---|---|
| In millions of dollars | 2007 | 2006(1) | ||||||
| Cash flows from operating activities of continuing operations | ||||||||
| Net income | $ | 5,012 | $ | 5,639 | ||||
| Income from discontinued operations, net of taxes and minority interest | — | 84 | ||||||
| Income from continuing operations | $ | 5,012 | $ | 5,555 | ||||
| Adjustments to reconcile net income to net cash (used in) provided by operating activities of continuing operations | ||||||||
| Amortization of deferred policy acquisition costs and present value of future profits | 79 | 70 | ||||||
| Additions to deferred policy acquisition costs | (110 | ) | (88 | ) | ||||
| Depreciation and amortization | 573 | 599 | ||||||
| Provision for credit losses | 2,706 | 1,446 | ||||||
| Change in trading account assets | (66,140 | ) | (32,315 | ) | ||||
| Change in trading account liabilities | 28,015 | 23,780 | ||||||
| Change in federal funds sold and securities borrowed or purchased under agreements to resell | (21,108 | ) | (22,088 | ) | ||||
| Change in federal funds purchased and securities loaned or sold under agreements to repurchase | 44,435 | 37,148 | ||||||
| Change in brokerage receivables net of brokerage payables | (3,928 | ) | (526 | ) | ||||
| Net gains from sales of investments | (473 | ) | (379 | ) | ||||
| Change in loans held for sale | (1,513 | ) | (1,725 | ) | ||||
| Other, net | (5,965 | ) | (8,307 | ) | ||||
| Total adjustments | $ | (23,429 | ) | $ | (2,385 | ) | ||
| Net cash (used in) provided by operating activities of continuing operations | $ | (18,417 | ) | $ | 3,170 | |||
| Cash flows from investing activities of continuing operations | ||||||||
| Change in deposits at interest with banks | $ | (2,384 | ) | $ | (1,575 | ) | ||
| Change in loans | (72,413 | ) | (85,820 | ) | ||||
| Proceeds from sales and securitizations of loans | 61,333 | 63,397 | ||||||
| Purchases of investments | (81,229 | ) | (63,425 | ) | ||||
| Proceeds from sales of investments | 39,017 | 17,444 | ||||||
| Proceeds from maturities of investments | 34,393 | 32,402 | ||||||
| Other investments, primarily short-term, net | — | (44 | ) | |||||
| Capital expenditures on premises and equipment | (784 | ) | (875 | ) | ||||
| Proceeds from sales of premises and equipment, subsidiaries and affiliates, and repossessed assets | 516 | 525 | ||||||
| Business acquisitions | (2,353 | ) | — | |||||
| Net cash used in investing activities of continuing operations | $ | (23,904 | ) | $ | (37,971 | ) | ||
| Cash flows from financing activities of continuing operations | ||||||||
| Dividends paid | $ | (2,698 | ) | $ | (2,491 | ) | ||
| Issuance of common stock | 394 | 258 | ||||||
| Redemption or retirement of preferred stock | — | (125 | ) | |||||
| Treasury stock acquired | (645 | ) | (2,000 | ) | ||||
| Stock tendered for payment of withholding taxes | (819 | ) | (569 | ) | ||||
| Issuance of long-term debt | 34,760 | 25,040 | ||||||
| Payments and redemptions of long-term debt | (25,393 | ) | (14,425 | ) | ||||
| Change in deposits | 24,902 | 35,530 | ||||||
| Change in short-term borrowings | 9,718 | (8,800 | ) | |||||
| Net cash provided by financing activities of continuing operations | $ | 40,219 | $ | 32,418 | ||||
| Effect of exchange rate changes on cash and cash equivalents | $ | 9 | $ | 162 | ||||
| Change in cash and due from banks | $ | (2,093 | ) | $ | (2,221 | ) | ||
| Cash and due from banks at beginning of period | $ | 26,514 | $ | 23,632 | ||||
| Cash and due from banks at end of period | $ | 24,421 | 21,411 | |||||
| Supplemental disclosure of cash flow information for continuing operations | ||||||||
| Cash paid during the period for income taxes | $ | 1,826 | $ | 1,017 | ||||
| Cash paid during the period for interest | $ | 15,332 | 11,150 | |||||
| Non-cash investing activities | ||||||||
| Transfers to repossessed assets | $ | 453 | $ | 358 | ||||
See Notes to the Unaudited Consolidated Financial Statements.
CITIGROUP INC.CITIBANK, N.A. AND SUBSIDIARIES
CONSOLIDATED STATEMENT OF CHANGES IN STOCKHOLDERS' EQUITY (Unaudited)BALANCE SHEET
| | Nine Months Ended September 30, | ||||||
|---|---|---|---|---|---|---|---|
| In millions of dollars, except shares in thousands | 2006 | 2005(1) | |||||
| Preferred stock at aggregate liquidation value | |||||||
| Balance, beginning of period | $ | 1,125 | $ | 1,125 | |||
| Redemption or retirement of preferred stock | (125 | ) | — | ||||
| Balance, end of period | $ | 1,000 | $ | 1,125 | |||
| Common stock and additional paid-in capital | |||||||
| Balance, beginning of period | $ | 17,538 | $ | 16,960 | |||
| Employee benefit plans | 341 | 679 | |||||
| Other | 1 | 52 | |||||
| Balance, end of period | $ | 17,880 | $ | 17,691 | |||
| Retained earnings | |||||||
| Balance, beginning of period | $ | 117,555 | $ | 102,154 | |||
| Net income | 16,409 | 17,657 | |||||
| Common dividends(2) | (7,371 | ) | (6,892 | ) | |||
| Preferred dividends | (49 | ) | (51 | ) | |||
| Balance, end of period | $ | 126,544 | $ | 112,868 | |||
| Treasury stock, at cost | |||||||
| Balance, beginning of period | $ | (21,149 | ) | $ | (10,644 | ) | |
| Issuance of shares pursuant to employee benefit plans | 2,406 | 1,639 | |||||
| Treasury stock acquired(3) | (6,000 | ) | (8,371 | ) | |||
| Other | 6 | 86 | |||||
| Balance, end of period | $ | (24,737 | ) | $ | (17,290 | ) | |
| Accumulated other changes in equity from nonowner sources | |||||||
| Balance, beginning of period | $ | (2,532 | ) | $ | (304 | ) | |
| Net change in unrealized gains and losses on investment securities, net of tax | (83 | ) | (1,603 | ) | |||
| Net change in cash flow hedges, net of tax | (680 | ) | 297 | ||||
| Net change in foreign currency translation adjustment, net of tax | 474 | (842 | ) | ||||
| Minimum pension liability adjustment, net of tax | (1 | ) | (105 | ) | |||
| Balance, end of period | $ | (2,822 | ) | $ | (2,557 | ) | |
| Total common stockholders' equity (shares outstanding: 4,913,667 in 2006 and 5,058,979 in 2005) | $ | 116,865 | $ | 110,712 | |||
| Total stockholders' equity | $ | 117,865 | $ | 111,837 | |||
| Summary of changes in equity from nonowner sources | |||||||
| Net income | $ | 16,409 | $ | 17,657 | |||
| Other changes in equity from nonowner sources, net of tax | (290 | ) | (2,253 | ) | |||
| Total changes in equity from nonowner sources | $ | 16,119 | $ | 15,404 | |||
| In millions of dollars, except shares | March 31, 2007 (Unaudited) | December 31, 2006(1) | ||||||
|---|---|---|---|---|---|---|---|---|
| Assets | ||||||||
| Cash and due from banks | $ | 17,516 | $ | 18,917 | ||||
| Deposits with banks | 40,777 | 38,377 | ||||||
| Federal funds sold and securities purchased under agreements to resell | 10,869 | 9,219 | ||||||
| Trading account assets (including $241 and $117 pledged to creditors at March 31, 2007 and December 31, 2006, respectively) | 105,980 | 103,945 | ||||||
| Investments (including $2,154 and $1,953 pledged to creditors at March 31, 2007 and December 31, 2006, respectively) | 227,860 | 215,222 | ||||||
| Loans, net of unearned income | 579,223 | 558,952 | ||||||
| Allowance for loan losses | (5,854 | ) | (5,152 | ) | ||||
| Total loans, net | $ | 573,369 | $ | 553,800 | ||||
| Goodwill | 14,938 | 13,799 | ||||||
| Intangible assets | 10,631 | 6,984 | ||||||
| Premises and equipment, net | 7,235 | 7,090 | ||||||
| Interest and fees receivable | 8,054 | 7,354 | ||||||
| Other assets | 59,720 | 44,790 | ||||||
| Total assets | $ | 1,076,949 | $ | 1,019,497 | ||||
Liabilities | ||||||||
| Non-interest-bearing deposits in U.S. offices | $ | 39,463 | $ | 38,663 | ||||
| Interest-bearing deposits in U.S. offices | 165,774 | 167,015 | ||||||
| Non-interest-bearing deposits in offices outside the U.S. | 32,762 | 31,169 | ||||||
| Interest-bearing deposits in offices outside the U.S. | 452,806 | 428,896 | ||||||
| Total deposits | $ | 690,805 | $ | 665,743 | ||||
| Trading account liabilities | 44,774 | 43,136 | ||||||
| Purchased funds and other borrowings | 90,784 | 73,081 | ||||||
| Accrued taxes and other expense | 10,448 | 10,777 | ||||||
| Long-term debt and subordinated notes | 124,139 | 115,833 | ||||||
| Other liabilities | 38,697 | 37,774 | ||||||
| Total liabilities | $ | 999,647 | $ | 946,344 | ||||
Stockholder's equity | ||||||||
| Capital stock ($20 par value) outstanding shares: 37,534,553 in each period | $ | 751 | $ | 751 | ||||
| Surplus | 45,794 | 43,753 | ||||||
| Retained earnings | 32,399 | 30,358 | ||||||
| Accumulated other comprehensive income (loss)(2) | (1,642 | ) | (1,709 | ) | ||||
| Total stockholder's equity | $ | 77,302 | $ | 73,153 | ||||
| Total liabilities and stockholder's equity | $ | 1,076,949 | $ | 1,019,497 | ||||
See Notes to the Unaudited Consolidated Financial Statements.
CITIBANK, N.A. AND SUBSIDIARIES
CONSOLIDATED STATEMENT OF CASH FLOWS (UNAUDITED)
| | Nine Months Ended September 30, | |||||||
|---|---|---|---|---|---|---|---|---|
| In millions of dollars | 2006 | 2005(1) | ||||||
| Cash flows from operating activities of continuing operations | ||||||||
| Net income | $ | 16,409 | $ | 17,657 | ||||
| Income from discontinued operations, net of tax and minority interest | 150 | 703 | ||||||
| Gain on sale, net of tax and minority interest | 139 | 2,120 | ||||||
| Income from continuing operations | $ | 16,120 | $ | 14,834 | ||||
| Adjustments to reconcile net income to net cash provided by operating activities of continuing operations | ||||||||
| Depreciation and amortization | $ | 1,833 | $ | 1,718 | ||||
| Provision for credit losses | 4,875 | 6,258 | ||||||
| Provision for policyholders benefits and claims | 732 | 644 | ||||||
| Amortization of deferred policy acquisition costs and present value of future profits | 212 | 204 | ||||||
| Additions to deferred policy acquisition costs | (279 | ) | (284 | ) | ||||
| Change in trading account assets | (55,329 | ) | (13,995 | ) | ||||
| Change in trading account liabilities | 17,768 | 5,321 | ||||||
| Change in federal funds sold and securities borrowed or purchased under agreements to resell | (45,163 | ) | (35,366 | ) | ||||
| Change in federal funds purchased and securities loaned or sold under agreements to repurchase | 77,703 | 35,235 | ||||||
| Change in brokerage receivables net of brokerage payables | 28,088 | 4,389 | ||||||
| Realized gains from sales of investments | (985 | ) | (982 | ) | ||||
| Change in loans held for sale | (1,674 | ) | 1,826 | |||||
| Proceeds from collections reinvested in new receivables | 161,800 | 143,500 | ||||||
| Venture capital activity | (344 | ) | 451 | |||||
| Other, net | (5,887 | ) | (3,640 | ) | ||||
| Total adjustments | $ | 183,350 | $ | 145,279 | ||||
| Net cash provided by operating activities of continuing operations | $ | 199,470 | $ | 160,113 | ||||
| Cash flows from investing activities of continuing operations | ||||||||
| Change in deposits at interest with banks | $ | (2,294 | ) | $ | (7,813 | ) | ||
| Change in loans | (257,099 | ) | (190,487 | ) | ||||
| Proceeds from sales and securitizations of loans | 18,627 | 23,440 | ||||||
| Purchases of investments | (212,486 | ) | (152,062 | ) | ||||
| Proceeds from sales of investments | 53,740 | 69,321 | ||||||
| Proceeds from maturities of investments | 90,163 | 73,723 | ||||||
| Other investments, primarily short-term, net | — | (303 | ) | |||||
| Capital expenditures on premises and equipment | (2,713 | ) | (2,757 | ) | ||||
| Proceeds from sales of premises and equipment, subsidiaries and affiliates, and repossessed assets | 1,126 | 17,062 | ||||||
| Business acquisitions | — | (602 | ) | |||||
| Net cash used in investing activities of continuing operations | $ | (310,936 | ) | $ | (170,478 | ) | ||
| Cash flows from financing activities of continuing operations | ||||||||
| Dividends paid | $ | (7,420 | ) | $ | (6,943 | ) | ||
| Issuance of common stock | 1,210 | 895 | ||||||
| Redemption or retirement of preferred stock | (125 | ) | — | |||||
| Treasury stock acquired | (6,000 | ) | (8,371 | ) | ||||
| Stock tendered for payment of withholding taxes | (659 | ) | (627 | ) | ||||
| Issuance of long-term debt | 74,719 | 48,028 | ||||||
| Payments and redemptions of long-term debt | (33,705 | ) | (35,991 | ) | ||||
| Change in deposits | 78,440 | 16,321 | ||||||
| Change in short-term borrowings | 3,571 | 1,457 | ||||||
| Contractholder fund deposits | 248 | 252 | ||||||
| Contractholder fund withdrawals | (277 | ) | (255 | ) | ||||
| Net cash provided by financing activities of continuing operations | $ | 110,002 | $ | 14,766 | ||||
| Effect of exchange rate changes on cash and cash equivalents | $ | 375 | $ | (346 | ) | |||
| Change in cash and due from banks | $ | (1,089 | ) | $ | 4,055 | |||
| Cash and due from banks at beginning of period | 23,632 | 20,613 | ||||||
| Cash and due from banks at end of period | $ | 22,543 | $ | 24,668 | ||||
| Supplemental disclosure of cash flow information for continuing operations | ||||||||
| Cash paid during the period for income taxes | $ | 5,387 | $ | 6,252 | ||||
| Cash paid during the period for interest | 37,235 | 23,057 | ||||||
| Non-cash investing activities | ||||||||
| Transfers to repossessed assets | $ | 1,017 | $ | 936 | ||||
See Notes to the Unaudited Consolidated Financial Statements.
CITIBANK, N.A. AND SUBSIDIARIES
CONSOLIDATED BALANCE SHEET
| In millions of dollars, except shares | September 30, 2006 | December 31, 2005(1) | ||||||
|---|---|---|---|---|---|---|---|---|
| | (Unaudited) | | ||||||
| Assets | ||||||||
| Cash and due from banks | $ | 16,265 | $ | 15,706 | ||||
| Deposits at interest with banks | 26,129 | 22,704 | ||||||
| Federal funds sold and securities purchased under agreements to resell | 27,288 | 15,187 | ||||||
| Trading account assets (including $425 and $600 pledged to creditors at September 30, 2006 and December 31, 2005, respectively) | 99,234 | 86,966 | ||||||
| Investments (including $2,155 and $2,122 pledged to creditors at September 30, 2006 and December 31, 2005, respectively) | 156,398 | 124,147 | ||||||
| Loans, net of unearned income (including $491 at September 30, 2006 at fair value) | 426,970 | 386,565 | ||||||
| Allowance for loan losses | (5,888 | ) | (6,307 | ) | ||||
| Total loans, net | $ | 421,082 | $ | 380,258 | ||||
| Goodwill | 9,493 | 9,093 | ||||||
| Intangible assets | 11,897 | 10,644 | ||||||
| Premises and equipment, net | 6,083 | 5,873 | ||||||
| Interest and fees receivable | 5,913 | 5,722 | ||||||
| Other assets | 36,580 | 30,197 | ||||||
| Total assets | $ | 816,362 | $ | 706,497 | ||||
| Liabilities | ||||||||
| Non-interest-bearing deposits in U.S. offices | $ | 22,162 | $ | 22,820 | ||||
| Interest-bearing deposits in U.S. offices | 116,735 | 112,264 | ||||||
| Non-interest-bearing deposits in offices outside the U.S. (including $238 at September 30, 2006 at fair value) | 29,376 | 28,738 | ||||||
| Interest-bearing deposits in offices outside the U.S. (including $296 at September 30, 2006 at fair value) | 393,048 | 321,524 | ||||||
| Total deposits | $ | 561,321 | $ | 485,346 | ||||
| Trading account liabilities | 45,401 | 46,812 | ||||||
| Purchased funds and other borrowings (including $548 at September 30, 2006 at fair value) | 64,978 | 48,653 | ||||||
| Brokerage payable | 7,200 | — | ||||||
| Accrued taxes and other expense | 10,158 | 9,047 | ||||||
| Long-term debt and subordinated notes (including $4,163 at September 30, 2006 at fair value) | 37,194 | 34,404 | ||||||
| Other liabilities | 27,713 | 25,971 | ||||||
| Total liabilities | $ | 753,965 | $ | 650,233 | ||||
Stockholder's equity | ||||||||
| Capital stock ($20 par value) standing shares: 37,534,553 in each period | $ | 751 | $ | 751 | ||||
| Surplus | 27,367 | 27,244 | ||||||
| Retained earnings | 35,602 | 30,651 | ||||||
| Accumulated other changes in equity from nonowner sources(2) | (1,323 | ) | (2,382 | ) | ||||
| Total stockholder's equity | $ | 62,397 | $ | 56,264 | ||||
| Total liabilities and stockholder's equity | $ | 816,362 | $ | 706,497 | ||||
See Notes to the Unaudited Consolidated Financial Statements.
CITIGROUP INC. AND SUBSIDIARIES
NOTES TO CONSOLIDATED FINANCIAL STATEMENTS (Unaudited)
1. Basis of Presentation
The accompanying unaudited consolidated financial statements as of September 30, 2006March 31, 2007 and for the three-and nine-month periodsthree-month period ended September 30, 2006March 31, 2007 include the accounts of Citigroup Inc. (Citigroup) and its subsidiaries (collectively, the Company). In the opinion of management, all adjustments, consisting of normal recurring adjustments, necessary for a fair presentation, have been reflected. The accompanying unaudited consolidated financial statements should be read in conjunction with the consolidated financial statements and related notes included in Citigroup's 20052006 Annual Report on Form 10-K.
Certain financial information that is normally included in annual financial statements prepared in accordance with U.S. generally accepted accounting principles, but is not required for interim reporting purposes, has been condensed or omitted.
Management must make estimates and assumptions that affect the Consolidated Financial Statements and the related footnote disclosures. While management makes its best judgment, actual results could differ from those estimates.
Certain reclassifications have been made to the prior-period's financial statements to conform to the current period's presentation.
Significant Accounting Policies
The Company's accounting policies are fundamental to understanding management's discussion and analysis of results of operations and financial condition. The Company has identified five policies as being significant because they require management to make subjective and/or complex judgments about matters that are inherently uncertain. These policies relate to Valuations of Financial Instruments, Allowance for Credit Losses, Securitizations, Income Taxes and Legal Reserves. The Company, in consultation with the Audit and Risk Management Committee of the Board of Directors, has reviewed and approved these significant accounting policies, which are further described in the Company's 2006 Annual Report on Form 10-K.
Accounting Changes
Fair Value Measurements (SFAS 157)
The Company elected to early-adopt SFAS 157, "Fair Value Measurements" (SFAS 157), as of January 1, 2007. SFAS 157 defines fair value, establishes a consistent framework for measuring fair value and expands disclosure requirements about fair value measurements. SFAS 157 requires, among other things, Citigroup's valuation techniques used to measure fair value to maximize the use of observable inputs and minimize the use of unobservable inputs. In addition, SFAS 157 precludes the use of block discounts for instruments traded in an active market, which were previously applied to large holdings of publicly-traded equity securities, and requires the recognition of trade-date gains related to certain derivative trades that use unobservable inputs in determining the fair value. This guidance supersedes the guidance in EITF Issue No. 02-3, which prohibited the recognition of day-one gains on certain derivative trades when determining the fair value of instruments not traded in an active market. The cumulative effect of these two changes resulted in an increase to January 1, 2007 retained earnings of $75 million.
In moving to maximize the use of observable inputs as required by SFAS 157, Citigroup began to reflect external credit ratings as well as other observable inputs when measuring the fair value of our derivative positions. The cumulative effect of making this derivative valuation adjustment was a gain of $250 million after-tax ($402 million pre-tax, which was recorded in the Markets & Banking business), or $0.05 per diluted share, included in 2007 first quarter earnings. The primary drivers of this change were the requirement that Citigroup include its own credit rating in pricing derivatives and the elimination of a valuation adjustment, which is no longer necessary under SFAS 157.
See Note 16 on page 105 for additional information.
Fair Value Option (SFAS 159)
In conjunction with the adoption of SFAS 157, the Company early-adopted SFAS 159, "The Fair Value Option for Financial Assets and Financial Liabilities" (SFAS 159), as of January 1, 2007. SFAS 159 provides an option for most financial assets and liabilities to be reported at fair value on an instrument-by-instrument basis with changes in fair value reported in earnings. After the initial adoption, the election is made at the acquisition of a financial asset, financial liability, or a firm commitment and it may not be revoked. Under the SFAS 159 transition provisions, the Company has elected to report certain financial instruments and other items at fair value on a contract-by-contract basis, with future changes in value reported in earnings. SFAS 159 provides an opportunity to mitigate volatility in reported earnings that was caused by measuring hedged assets and liabilities that were previously required to use an accounting method other than fair value, while the related economic hedges were reported at fair value.
The adoption of SFAS 159 resulted in a decrease to January 1, 2007 retained earnings of $99 million.
See Note 16 on page 105 for additional information.
Accounting for Uncertainty in Income Taxes
In July 2006, the FASB issued FIN 48, "Accounting for Uncertainty in Income Taxes" (FIN 48), which sets out a framework for preparers to use to determine the appropriate level of tax reserves to maintain for uncertain tax positions. This interpretation of FASB Statement No. 109 uses a two-step approach wherein a tax benefit is recognized if a position is more likely than not to be sustained. The amount of the benefit is then measured to be the highest tax benefit that is greater than 50 percent likely to be realized. FIN 48 also sets out disclosure requirements to enhance transparency of an entity's tax reserves.
Citigroup adopted FIN 48 as of January 1, 2007 that resulted in a decrease to January 1, 2007 retained earnings of $14 million.
The total unrecognized tax benefits as of January 1, 2007 is $3.1 billion. There was no material change to this balance during the first quarter of 2007. The total amount of unrecognized tax benefits as of January 1, 2007 that would affect the effective tax rate is $1.0 billion. The remaining $2.1 billion represents temporary differences or amounts for which offsetting deductions or credits are available in a different taxing jurisdiction. The total amount of interest and penalties recognized in the Consolidated Balance Sheet at January 1, 2007 is approximately $510 million ($320 million net of tax). There was no material change to this balance during the first quarter of 2007. The Company classifies interest and penalties as income tax expense. The Company is currently under audit by the IRS and other major taxing jurisdictions around the world. It is thus reasonably possible that significant changes in the gross balance of unrecognized tax benefits may occur within the next 12 months (an estimate of the range of such gross changes cannot be made), but the Company does not expect such audits to result in amounts that would cause a significant change to its effective tax rate.
The following are the major tax jurisdictions in which the Company and its affiliates operate and the earliest tax year subject to examination:
| Jurisdiction | Tax year | ||
|---|---|---|---|
| United States | 2003 | ||
| Mexico | 2004 | ||
| New York State and City | 2005 | (1) | |
| United Kingdom | 1998 | ||
| Germany | 2000 | ||
| Korea | 2001 |
Leveraged Leases
On January 1, 2007, the Company adopted FASB Staff Position, "Accounting for a Change or Projected Change in the Timing of Cash Flows Relating to Income Taxes Generated by a Leverage Lease Transaction" (FSP 13-2), which provides guidance regarding changes or projected changes in the timing of cash flows relating to income taxes generated by a leveraged lease transaction.
Leveraged leases can provide significant tax benefits to the lessor, primarily as a result of the timing of tax payments. Since changes in the timing and/or amount of these tax benefits may have a significant effect on the cash flows of a lease transaction, a lessor, in accordance with FSP 13-2, will be required to perform a recalculation of a leveraged lease when there is a change or projected change in the timing of the realization of tax benefits generated by that lease. Previously, Citigroup did not recalculate the tax benefits if only the timing of cash flows has changed.
The adoption of FSP 13-2 resulted in a decrease to January 1, 2007 retained earnings of $148 million. This decrease to retained earnings will be recognized in earnings over the remaining lives of the leases as tax benefits are realized.
Stock-Based Compensation
On January 1, 2006, the Company adopted Statement of Financial Accounting Standards (SFAS)SFAS No. 123 (revised 2004), "Share-Based"Share-Based Payment" (SFAS 123(R)), which replacesreplaced the existing SFAS 123 and APB 25, "Accounting"Accounting for Stock Issued to Employees." SFAS 123(R) requires companies to measure compensation expense for stock options and other share-based payments based on the instruments' grant date fair value, and to record expense based on that fair value reduced by expected forfeitures.
The Company adopted this standard by using the modified prospective approach. Beginning January 1, 2006, Citigroup recorded incremental expense for stock options granted prior to January 1, 2003 (the date the Company adopted SFAS 123). That expense will equal the remaining unvested portion of the grant-date fair value of those stock options, reduced by estimated forfeitures. The Company recorded incremental compensation expense of $19 million in the 2006 first quarter, $12 million in the 2006 second quarter, and $6 million in the 2006 third quarter. Based on current estimates, the incremental charges for the remaining quarter of 2006 and all of 2007 are pretax $6 million and $11 million, respectively.
The Company maintains a number of incentive programs in which equity awards are granted to eligible employees. The most significant of the programs offered is the Capital Accumulation Program (CAP). Under the CAP program, the Company grants deferred and restricted shares to eligible employees. The program provides that employees who meet certain age plus years-of-service requirements (retirement-eligible employees) may terminate active employment and continue vesting in their awards provided they comply with specified non-compete provisions. For awards granted to retirement-eligible employees prior to the adoption of SFAS 123(R), the Company has been and will continue to amortize the compensation cost of these awards over the full vesting periods. Awards granted to retirement-eligible employees after the adoption of SFAS 123(R) must be either expensed on the grant date or accrued in the year prior to the grant date.
The impact to the 2006 first quarter results was a charge of $846 million ($520 million after-tax). This charge consisted of $648 million ($398 million after-tax) for the immediate expensing of awards granted to retirement-eligible employees in January 2006, and $198$824 million ($122526 million after-tax) for the quarterly accrual of the estimated awards that will bewere granted in January 2007. In the 2006 second quarter, the accrual for estimated January 2007 awards was $168 million ($104 million after-tax). In the 2006 third quarter, the accrual for estimated January 2007 awards was $195 million ($127 million after-tax). The Company has changed the plan's retirement eligibility for the January 2007 management awards, which impacted the amount of the accrual in the 2006 second and third quarters. The Company will continue to accrue for the estimated awards that will be granted through January 2007 in the fourth quarter of 2006.
In adopting SFAS 123(R), the Company began to recognize compensation expense for restricted or deferred stock awards net of estimated forfeitures. Previously, the effects of forfeitures were recorded as they occurred.
Accounting for Certain Hybrid Financial Instruments
On January 1, 2006, the Company elected to early-adopt, primarily on a prospective basis, SFAS No. 155, "Accounting"Accounting for Certain Hybrid Financial Instruments."Instruments" (SFAS 155). In accordance with this standard, hybrid financial instruments—such as structured notes containing embedded derivatives that otherwise would require bifurcation, as well as interest-only instruments—may be accounted for at fair value withif the changeCompany makes an irrevocable election to do so on an instrument-by-instrument basis. The changes in fair value are recorded in current earnings. The impact of adopting this standard was not material.
Accounting for Servicing of Financial Assets
On January 1, 2006, Thethe Company elected to early-adopt SFAS No. 156, "Accounting" Accounting for Servicing of Financial Assets."Assets"(SFAS 156). This pronouncement requires all servicing rights to be initially recognized at fair value. Subsequent to initial recognition, it permits ana one-time irrevocable election to remeasure each class of servicing rights at fair value, with the changes in the fair value being recorded in current earnings. The companyclasses of servicing rights are identified based on the availability of market inputs used in determining their fair values and the methods for managing their risks. The Company has elected to adopt this standardfair value accounting for its U.S. prime mortgage and student loan classes of servicing rights. The impact of adopting this standard was not material.
Accounting for Conditional Asset Retirement Obligations
On December 31, 2005, the Company adopted Financial Accounting Standards Board (FASB) Interpretation No. 47, "Accounting for Conditional Asset Retirement Obligations" (FIN 47). The Interpretation requires entities to estimate and recognize a liability for costs associated with the retirement or removal of an asset from service, regardless of the uncertainty of timing or whether performance will be required. For Citigroup, this applies to certain real estate restoration activities in the Company's branches and office space, most of which is rented under operating lease agreements.
Local market practices and requirements with regard to restoration activity under a real estate lease agreement differ by region. Based on a review of active lease terms and conditions, historical costs of past restorations activities, and local market practices, an estimate of the expected real estate restoration costs for some of the Company's branches and office space was determined. Each region applied local inflation and discount rates to determine the present value of the liability and capitalized asset amounts.
The impact of adopting this interpretation was an increase to total liabilities and total assets of $150 million and $122 million, respectively. The increase in total assets is net of an increase in accumulated depreciation of $52 million. In addition, a $49 million after-tax ($80 million pretax) charge to earnings, which was reported on the Consolidated Statement of Income as the cumulative effect of an accounting change, was recorded in the 2005 fourth quarter.
Accounting for Certain Loans or Debt Securities Acquired in a Transfer
On January 1, 2005, Statement of Position (SOP) No. 03-3, "Accounting for Certain Loans or Debt Securities Acquired in a Transfer" (SOP 03-3), was adopted for loan acquisitions. SOP 03-3 requires acquired loans to be recorded at fair value and prohibits carrying over valuation allowances in the initial accounting for acquired impaired loans. Loans carried at fair value, mortgage loans held for sale, and loans to borrowers in good standing under revolving credit agreements are excluded from the scope of SOP 03-3.
SOP 03-3 limits the yield that may be accreted to the excess of the undiscounted expected cash flows over the investor's initial investment in the loan. The excess of the contractual cash flows over expected cash flows may not be recognized as an adjustment of yield. Subsequent increases in cash flows expected to be collected are recognized prospectively through an adjustment of the loan's yield over its remaining life. Decreases in expected cash flows are recognized as impairments.
Determining the Variability in a Potential VIE
The FASB issued FASB Staff Position FIN 46(R)-6, "Determining the Variability to Be Considered in Applying FASB Interpretation No. 46(R)" (FSP FIN 46(R)-6), in April 2006. FSP FIN 46(R)-6 addresses the application of FIN 46(R), "Consolidation of Variable Interest Entities," in determining whether certain contracts or arrangements with a variable interest entity (VIE) are variable interests by requiring companies to base such evaluations on an analysis of the VIE's purpose and design, rather than its legal form or accounting classification.
FSP FIN 46(R)-6 is required to be applied for all reporting periods beginning after June 15, 2006. The adoption of the FSP did not result in material differences from Citigroup's existing accounting policies regarding the consolidation of VIEs.
Future Application of Accounting Standards
Accounting for Uncertainty in Income Taxes
In July 2006, the FASB issued FIN 48, "Accounting for Uncertainty in Income Taxes," which attempts to set out a consistent framework for preparers to use to determine the appropriate level of tax reserves to maintain for uncertain tax positions. This interpretation of FASB Statement No. 109 uses a two-step approach wherein a tax benefit is recognized if a position is more-likely-than-not to be sustained. The amount of the benefit is then measured to be the highest tax benefit which is greater than fifty percent likely to be realized. FIN 48 also sets out disclosure requirements to enhance transparency of an entity's tax reserves. Citigroup will be required to adopt this Interpretation as of January 1, 2007. The Company is still evaluating the impact of the adoption of FIN 48.
Leveraged Leases
On July 13, 2006, the FASB issued a Staff Position, "Accounting for a Change or Projected Change in the Timing of Cash Flows Relating to Income Taxes Generated by a Leverage Lease Transaction" (FSP 13-2), which provides guidance regarding changes or projected changes in the timing of cash flows relating to income taxes generated by a leveraged lease transaction.
Leveraged leases can provide significant tax benefits to the lessor. Since changes in the timing and/or amount of these tax benefits may have a material effect on the cash flows of a lease transaction, a lessor, in accordance with FSP 13-2, will be required to perform a recalculation of a leveraged lease when there is a change or projected change in the timing of the realization of tax benefits generated by that lease. Currently, Citigroup does not recalculate the tax benefits if only the timing of cash receipts has changed.
The effective date of FSP 13-2 for Citigroup is January 1, 2007. Citigroup expects the cumulative effect of adopting FSP 13-2 to be a decrease to retained earnings of $152 million after-tax ($255 million pretax).
Fair Value Measurements (SFAS 157)
In September 2006, the FASB issued SFAS No. 157, "Fair Value Measurements" (SFAS No. 157). This Standard defines fair value, establishes a consistent framework for measuring fair value and expands disclosure requirements about fair value measurements. In addition, SFAS No. 157 disallows the use of block discounts and supercedes the guidance in EITF 02-3, which prohibited the recognition of day-1 gains on certain derivative trades when determining the fair value of instruments traded in an active market. With the adoption of this Standard, these changes will be reflected as a cumulative effect adjustment to the opening balance of retained earnings. The Standard also requires Citigroup to reflect its own credit standing when measuring the fair value of debt it has issued, including derivatives, prospectively from the date of adoption.
SFAS No. 157 is effective for Citigroup's fiscal year beginning January 1, 2008, with earlier adoption permitted for the Company's fiscal year beginning January 1, 2007. The Company is currently evaluating the potential impact of adopting this Standard.
Accounting for Defined Benefit Pensions and Other Postretirement Benefits
In September 2006, the FASB issued SFAS No. 158, "Employer's Accounting for Defined Benefit Pensions and Other Postretirement Benefits" (SFAS No. 158). In accordance with SFAS No. 158, effective December 31, 2006, Citigroup must record the funded status of each of its defined benefit pension and postretirement plans on its balance sheet with the corresponding offset, net of taxes, recorded in Accumulated Other Changes in Equity From Nonowner Sources within Stockholders' Equity. It is estimated that the impact of adopting this standard will be a reduction of approximately $2.2 billion in Citigroup's year-end Stockholders' Equity.
EITF Issues Relating To Insurance Assets and Liabilities
The EITF has recently issued EITF 06-5, "Accounting for Purchases of Life Insurance—Determining the Amount That Could Be Realized in Accordance with FASB Technical Bulletin No. 85-4,Accounting for Purchases of Life Insurance." Although the Company is currently evaluating the impact of adopting this Standard, it is not expected to be significant.
Potential Amendments to Various Current Accounting Standards
The FASB is currently working on amendments to the existing accounting standards governing asset transfers and fair value measurements in business combinations and impairment tests. Upon completion of these standards, the Company will need to reevaluate its accounting and disclosures. Due to the ongoing deliberations of the standard setters, the Company is unable to accurately determine the effect of future amendments or proposals at this time.
2. Business Developments
Acquisition of Grupo Financiero Uno
On October 27, 2006, Citigroup announced that it had reached a definitive agreement to acquire Grupo Financiero Uno (GFU), the largest credit card issuer in Central America, and its affiliates. The acquisition of GFU, with $2.1 billion in assets, will expand the presence of Citigroup's Latin America consumer franchise, enhancing its credit card business in the region and establishing a platform for regional growth in consumer finance and retail banking.
GFU is privately held and has more than one million retail clients, representing 1.1 million credit card accounts, $1.2 billion in credit card receivables and $1.3 billion in deposits in Guatemala, El Salvador, Honduras, Nicaragua, Costa Rica and Panama as of September 30, 2006. GFU operates a distribution network of 75 branches and more than 100 mini-branches and points of sale.
The transaction, which is subject to regulatory approvals in the United States and each of the five countries, is anticipated to close in the 2007 first quarter.
Purchase of 20% Equity Interest in Akbank
On October 17, 2006, the Company announced that it had signed a definitive agreement for the purchase of a 20% equity interest in Akbank for approximately $3.1 billion. Akbank, the second-largest privately-owned bank by assets in Turkey, is a premier, full-service retail, commercial, corporate and private bank.
Sabanci Holding, a 34% owner of Akbank shares, and its subsidiaries have granted Citigroup a right of first refusal or first offer over the sale of any of their Akbank shares in the future. Subject to certain exceptions, Citigroup has agreed not to acquire additional shares in Akbank.
The transaction, which is subject to shareholder and regulatory approvals, is expected to close during the 2006 fourth quarter or 2007 first quarter and will be accounted for under the equity method.
Consolidation of Brazil's Credicard
In April 2006, Citigroup and Banco Itau dissolved their joint venture in Credicard, a Brazil consumer credit card business. In accordance with the dissolution agreement, Banco Itau received half of Credicard's assets and customer accounts in exchange for its 50% ownership, leaving Citigroup as the sole owner of Credicard.
Beginning April 30, 2006, Credicard's financial statements were consolidated with Citigroup. Previously, Citigroup reported its interest in Credicard using the equity method of consolidation. Accordingly, our net investment was included in Other assets.
Acquisition of Federated Credit Card Portfolio and Credit Card Agreement With Federated Department Stores
In June 2005, Citigroup announced a long-term agreement with Federated Department Stores, Inc. (Federated) under which the companies partner to manage approximately $6.2 billion of Federated's credit card receivables, including existing and new accounts, executed in three phases.
For the first phase, which closed in October 2005, Citigroup acquired Federated's receivables under management, totaling approximately $3.3 billion. For the second phase, which closed in May 2006, additional Federated receivables totaling approximately $1.9 billion were transferred to Citigroup from the previous provider. For the final phase, in the 2006 third quarter, Citigroup acquired approximately $1.0 billion credit card receivable portfolio of The May Department Stores Company (May), which merged with Federated.
Citigroup paid a premium of approximately 11.5% to acquire these portfolios. The multi-year agreement also provides Federated the ability to participate in the portfolio performance, based on credit sales and certain other performance metrics.
The Federated and May credit card portfolios comprise a total of approximately 17 million active accounts.
3. Discontinued Operations
Sale of the Asset Management Business
On December 1, 2005, the Company completed the sale of substantially all of its Asset Management Business, which had total assets of approximately $1.4 billion and liabilities of approximately $0.6 billion at the closing date, to Legg Mason, Inc. (Legg Mason) in exchange for Legg Mason's broker-dealer business,and capital markets businesses, $2.298 billion of Legg Mason's common and preferred shares (valued as of the closing date), and $500 million in cash. This cash was obtained via a lending facility provided by Citigroup Corporate and Investment Banking.Markets & Banking business. The transaction did not include Citigroup's asset management business inMexico, its retirement services business inLatin America (both of which are now included inInternational Retail Banking) or its interest in the CitiStreet joint venture (which is now included inSmith Barney). The total value of the transaction at the time of closing was approximately $4.369 billion, resulting in an after-tax gain to Citigroup of approximately $2.082 billion ($3.404 billion pretax)pretax, which was reported in discontinued operations).
Concurrently, Citigroup sold Legg Mason's Capital Marketscapital markets business to Stifel Financial Corp. The business consisted of areas in which Citigroup already had full capabilities, including investment banking, institutional equity sales and trading, taxable fixed income sales and trading, and research. No gain or loss was recognized from this transaction. (The transactions described in these two paragraphs are referred to as the "Sale of the Asset Management Business.")
In connection with this sale, Citigroup and Legg Mason entered into a three-year agreement under which Citigroup will continue to offer its clients Asset Management's products, will become the primary retail distributor of the Legg Mason funds managed by Legg Mason Capital Management Inc., and may also distribute other Legg Mason products. These products will be offered primarily through Citigroup's Global Wealth Management businesses,Smith Barney andPrivate Bank, as well as through Primerica and Citibank. The distribution of these products will be subject to applicable requirements of law and Citigroup's suitability standards and product requirements.
Upon completion of the Sale of the Asset Management Business, Citigroup added 1,226 financial advisors in 124 branch offices from Legg Mason to its Global Wealth Management Business.
Results for all of the businesses included in the Sale of the Asset Management Business, including the gain, are reported as Discontinued Operations for all periods presented. Changes in the market value of the Legg Mason common and preferred shares since the closing of the transaction are included in the Consolidated Statement of Changes in Stockholders' Equity within Accumulated Other Changes in Equity from Nonowner Sources (net change in unrealized gains and losses on investment securities, net of tax). Any effects on the Company's current earnings related to these securities, such as dividend revenue, are included in the results of Alternative Investments.
The following is summarized financial information for discontinued operations, including cash flows, related to the Sale of the Asset Management Business:
| | Three Months Ended September 30, | Nine Months Ended September 30, | ||||||||||
|---|---|---|---|---|---|---|---|---|---|---|---|---|
| In millions of dollars | 2006 | 2005 | 2006 | 2005 | ||||||||
| Total revenues, net of interest expense | $ | 83 | $ | 324 | $ | 104 | $ | 984 | ||||
| Income (loss) from discontinued operations | $ | — | $ | 100 | $ | (1 | ) | $ | 285 | |||
| Gain on sale | 83 | — | 104 | — | ||||||||
| Provision for income taxes and minority interest, net of taxes | 17 | 34 | 24 | 104 | ||||||||
| Income from discontinued operations, net of taxes | $ | 66 | $ | 66 | $ | 79 | $ | 181 | ||||
| | Nine Months Ended September 30, | |||||||
|---|---|---|---|---|---|---|---|---|
| In millions of dollars | 2006 | 2005 | ||||||
| Cash flows from: | ||||||||
| Operating activities | $ | — | $ | (243 | ) | |||
| Investing activities | — | 192 | ||||||
| Financing activities | — | — | ||||||
| Net cash used in discontinued operations | $ | — | $ | (51 | ) | |||
The following is a summary of the assets and liabilities of discontinued operations related to the Sale of the Asset Management Business as of December 1, 2005:
| In millions of dollars | December 1, 2005 | ||
|---|---|---|---|
| Assets | |||
| Cash and due from banks | $ | 96 | |
| Investments | 3 | ||
| Intangible assets | 776 | ||
| Other assets | 563 | ||
| Total assets | $ | 1,438 | |
| Liabilities | |||
| Other liabilities | $ | 575 | |
| Total liabilities | $ | 575 | |
On January 31, 2006, the Company completed the sale of its Asset Management Business within Bank Handlowy (an indirect banking subsidiary of Citigroup located in Poland) to Legg Mason, Inc.Mason. This transaction, which was originally part of the overall Asset Management Business sold to Legg Mason Inc. on December 1, 2005, was postponed due to delays in obtaining local regulatory approval. A gain from this sale of $18 million after-tax and minority interest ($3031 million pretax and minority interest) was recognized in the 2006 first quarter of 2006 within Discontinued Operations.discontinued operations.
During March 2006, Citigroupthe Company sold 10.3 million shares of Legg Mason stock through an underwritten public offering. The net sale proceeds of $1.258 billion resulted in a pretax gain of $24 million.million in Alternative Investments.
In September 2006, the Company received from Legg Mason the final closing adjustment payment related to this sale. This payment resulted in an additional after-tax gain of $51 million ($83 million pretax), recorded in Discontinued Operations.discontinued operations.
Results for all of the businesses included in the Sale of the Asset Management Business, including the gain, are reported as discontinued operations for all periods presented. In connection with the adoption of SFAS 159, changes in the market value of the Legg Mason shares are recorded in Trading account assets and in current earnings. Prior to the adoption of this pronouncement, changes in the market value of the Legg Mason shares were included in the Consolidated Statement of Changes in Stockholders' Equity within Accumulated other comprehensive income (net change in unrealized gains and losses on investment securities, net of taxes). Any effects on the Company's current earnings related to these securities, such as dividend revenue, are included in the results of Alternative Investments.
The following is summarized financial information for discontinued operations related to the Sale of the Asset Management Business:
| | Three Months Ended March 31, | ||||||
|---|---|---|---|---|---|---|---|
| In millions of dollars | 2007 | 2006 | |||||
| Total revenues, net of interest expense | $ | — | $ | 21 | |||
| Income (loss) from discontinued operations | $ | — | $ | (1 | ) | ||
| Gain on sale | — | 21 | |||||
| Provision for income taxes and minority interest, net of taxes | — | 10 | |||||
| Income from discontinued operations, net of taxes | $ | — | $ | 10 | |||
Sale of the Life Insurance & Annuities Business
On July 1, 2005, the Company completed the sale of Citigroup's Travelers Life & Annuity and substantially all of Citigroup's international insurance businesses to MetLife, Inc. (MetLife). The businesses sold were the primary vehicles through which Citigroup engaged in the Life Insurance & Annuities Business, which had total assets of approximately $93.2 billion and Annuities business.liabilities of approximately $83.8 billion.
Citigroup received $1.0 billion in MetLife equity securities and $10.830 billion in cash, which resulted in an after-tax gain of approximately $2.120 billion ($3.386 billion pretax). In July 2006, Citigroup recognized an $85 million after-tax gain from the sale of MetLife shares. This gain, which was reported within Income from Continuing Operations within Alternative Investments.
In July 2006, the Company received the final closing adjustment payment related to this sale. This payment resulted in an after-tax gain of $75 million ($115 million pretax), recorded in Discontinued Operations.discontinued operations.
This transaction encompassed Travelers Life & Annuity's U.S. businesses and its international operations other than Citigroup's life insurance business inMexico (which is now included withinInternational Retail Banking). International operations included wholly owned insurance companies in the United Kingdom, Belgium, Australia, Brazil, Argentina, and Poland; joint ventures in Japan and Hong Kong; and offices in China. This transaction also included Citigroup's Argentine pension business. (The transaction described in the preceding three paragraphs is referred to as the "Sale of the Life Insurance and& Annuities Business.")
In connection with the Sale of the Life Insurance and& Annuities Business, Citigroup and MetLife entered into ten-year10-year agreements under which Travelers Life & Annuity and MetLife products will be made available through certain Citigroup distribution channels.
Results for all of the businesses included in the Sale of the Life Insurance and Annuities Business are reported as Discontinued Operations for all periods presented.
During the 2006 first quarter of 2006, $15 million of the total $657 million federal tax contingency reserve release was reported within Discontinued Operationsdiscontinued operations as it related to the Life Insurance & Annuities Business sold to MetLife.
In July 2006, Citigroup recognized an $85 million after-tax gain from the sale of MetLife shares. This gain was reported within income from continuing operations in the Alternative Investments business.
In July 2006, the Company received the final closing adjustment payment related to this sale, resulting in an after-tax gain of $75 million ($115 million pretax), which was recorded in discontinued operations.
In addition, during the 2006 third quarter, a release of $42 million of deferred tax liabilities was reported within Discontinued Operationsdiscontinued operations as it related to the Life Insurance & Annuities Business sold to MetLife.
Summarized financial information Results for discontinued operations, including cash flows, related toall of the businesses included in the Sale of the Life Insurance and& Annuities Business isare reported as follows:discontinued operations for all periods presented.
| | Three Months Ended September 30, | Nine Months Ended September 30, | ||||||||||
|---|---|---|---|---|---|---|---|---|---|---|---|---|
| In millions of dollars | 2006 | 2005 | 2006 | 2005 | ||||||||
| Total revenues, net of interest expense | $ | 115 | $ | 3,386 | $ | 115 | $ | 6,128 | ||||
| Income (loss) from discontinued operations | $ | 26 | $ | (51 | ) | $ | 28 | $ | 740 | |||
| Gain on sale | 115 | 3,386 | 115 | 3,386 | ||||||||
| Provision (benefit) for income taxes | 5 | 1,246 | (23 | ) | 1,484 | |||||||
| Income from discontinued operations, net of taxes | $ | 136 | $ | 2,089 | $ | 166 | $ | 2,642 | ||||
| | Nine Months Ended September 30, | |||||||
|---|---|---|---|---|---|---|---|---|
| In millions of dollars | 2006 | 2005 | ||||||
| Cash flows from: | ||||||||
| Operating activities | $ | — | $ | (2,989 | ) | |||
| Investing activities | — | 2,248 | ||||||
| Financing activities | — | 763 | ||||||
| Net cash provided by discontinued operations | $ | — | $ | 22 | ||||
The following is a summary of the assets and liabilities ofSummarized financial information for discontinued operations related to the Sale of the Life Insurance and& Annuities Business is as of July 1, 2005, the date of the distribution:follows:
| In millions of dollars | July 1, 2005 | ||
|---|---|---|---|
| Assets | |||
| Cash and due from banks | $ | 158 | |
| Investments | 48,860 | ||
| Intangible assets | 86 | ||
| Other assets(1) | 44,123 | ||
| Total assets | $ | 93,227 | |
| Liabilities | |||
| Federal funds purchased and securities loaned or sold under agreements to repurchase | $ | 971 | |
| Other liabilities(2) | 82,842 | ||
| Total liabilities | $ | 83,813 | |
| | Three Months Ended March 31, | ||||||
|---|---|---|---|---|---|---|---|
| In millions of dollars | 2007 | 2006 | |||||
| Total revenues, net of interest expense | $ | — | $ | — | |||
| Income from discontinued operations | $ | — | $ | 2 | |||
| Provision (benefit) for income taxes | — | (28 | ) | ||||
| Income from discontinued operations, net of taxes | $ | — | $ | 30 | |||
The Spin-offSpin-Off of Travelers Property Casualty Corp. (TPC)
During the 2006 first quarter of 2006, releases from various tax contingency reserves were recorded as the IRS concluded their tax audits for the years 1999 through 2002. Included in these releases was $44 million related to Travelers Property Casualty Corp., which the Company spun off during 2002. This release has been included in the provision for income taxes within the results for discontinued operations.
Combined Results for Discontinued Operations
Summarized financial information for the Life Insurance and Annuities Business, the Asset Management Business, and TPC:Travelers Property Casualty Corp. is as follows:
| | Three Months Ended September 30, | Nine Months Ended September 30, | Three Months Ended March 31, | ||||||||||||||||
|---|---|---|---|---|---|---|---|---|---|---|---|---|---|---|---|---|---|---|---|
| In millions of dollars | 2006 | 2005 | 2006 | 2005 | 2007 | 2006 | |||||||||||||
| Total revenues, net of interest expense | $ | 198 | $ | 3,710 | $ | 219 | $ | 7,112 | $ | — | $ | 21 | |||||||
| Income from discontinued operations | $ | 26 | $ | 49 | $ | 27 | $ | 1,025 | $ | — | $ | 1 | |||||||
| Gain on sale | 198 | 3,386 | 219 | 3,386 | — | 21 | |||||||||||||
| Provision (benefit) for income taxes and minority interest, net of taxes | 22 | 1,280 | (43 | ) | 1,588 | — | (62 | ) | |||||||||||
| Income from discontinued operations, net of taxes | $ | 202 | $ | 2,155 | $ | 289 | $ | 2,823 | $ | — | $ | 84 | |||||||
4.3. Business Segments
The following table presents certain information regarding the Company's continuing operations by segment:
| | Revenues, Net of Interest Expense | Provision (Benefit) for Income Taxes(1) | Income (Loss) from Continuing Operations(2) | Identifiable Assets | ||||||||||||||||||||
|---|---|---|---|---|---|---|---|---|---|---|---|---|---|---|---|---|---|---|---|---|---|---|---|---|
| | Three Months Ended September 30, | | | |||||||||||||||||||||
| | Sept. 30, 2006 | Dec. 31, 2005 | ||||||||||||||||||||||
| In millions of dollars, except identifiable assets in billions | 2006 | 2005 | 2006 | 2005 | 2006 | 2005 | ||||||||||||||||||
| Global Consumer | $ | 12,834 | $ | 12,321 | $ | 1,312 | $ | 1,153 | $ | 3,195 | $ | 2,723 | $ | 659 | $ | 559 | ||||||||
| Corporate and Investment Banking | 6,067 | 6,434 | 598 | 704 | 1,721 | 1,797 | 994 | 839 | ||||||||||||||||
| Global Wealth Management | 2,486 | 2,174 | 177 | 165 | 399 | 306 | 62 | 63 | ||||||||||||||||
| Alternative Investments | 334 | 720 | 70 | 181 | 117 | 339 | 11 | 13 | ||||||||||||||||
| Corporate/Other | (299 | ) | (151 | ) | (137 | ) | (39 | ) | (129 | ) | (177 | ) | 20 | 20 | ||||||||||
| Total | $ | 21,422 | $ | 21,498 | $ | 2,020 | $ | 2,164 | $ | 5,303 | $ | 4,988 | $ | 1,746 | $ | 1,494 | ||||||||
| | Revenues, Net of Interest Expense | Provision (Benefit) for Income Taxes(1) | Income (Loss) from Continuing Operations(2) | ||||||||||||||||
|---|---|---|---|---|---|---|---|---|---|---|---|---|---|---|---|---|---|---|---|
| | Nine Months Ended September 30, | ||||||||||||||||||
| In millions of dollars | 2006 | 2005 | 2006 | 2005 | 2006 | 2005 | |||||||||||||
| Global Consumer | $ | 37,417 | $ | 36,446 | $ | 3,559 | $ | 3,762 | $ | 9,445 | $ | 8,463 | |||||||
| Corporate and Investment Banking | 20,107 | 17,627 | 1,874 | 1,859 | 5,373 | 4,848 | |||||||||||||
| Global Wealth Management | 7,461 | 6,447 | 489 | 537 | 1,033 | 947 | |||||||||||||
| Alternative Investments | 1,593 | 2,698 | 319 | 782 | 727 | 1,086 | |||||||||||||
| Corporate/Other | (791 | ) | (355 | ) | (381 | ) | (113 | ) | (458 | ) | (510 | ) | |||||||
| Total | $ | 65,787 | $ | 62,863 | $ | 5,860 | $ | 6,827 | $ | 16,120 | $ | 14,834 | |||||||
| | Revenues, Net of Interest Expense | Provision (Benefit) for Income Taxes | Income (Loss) from Continuing Operations(1) | Identifiable Assets | ||||||||||||||||||||
|---|---|---|---|---|---|---|---|---|---|---|---|---|---|---|---|---|---|---|---|---|---|---|---|---|
| In millions of dollars, except identifiable assets in billions | First Quarter | Mar. 31, | Dec. 31, | |||||||||||||||||||||
| 2007 | 2006 | 2007 | 2006(2) | 2007 | 2006(2) | 2007 | 2006 | |||||||||||||||||
| Global Consumer | $ | 13,106 | $ | 11,955 | $ | 1,017 | $ | 847 | $ | 2,633 | $ | 3,073 | $ | 736 | $ | 702 | ||||||||
| Markets & Banking | 8,957 | 7,279 | 947 | 574 | 2,621 | 1,929 | 1,180 | 1,078 | ||||||||||||||||
| Global Wealth Management | 2,818 | 2,483 | 251 | 136 | 448 | 287 | 70 | 66 | ||||||||||||||||
| Alternative Investments | 562 | 675 | 138 | 111 | 222 | 353 | 12 | 12 | ||||||||||||||||
| Corporate/Other(3) | 16 | (209 | ) | (491 | ) | (131 | ) | (912 | ) | (87 | ) | 23 | 26 | |||||||||||
| Total | $ | 25,459 | $ | 22,183 | $ | 1,862 | $ | 1,537 | $ | 5,012 | $ | 5,555 | $ | 2,021 | $ | 1,884 | ||||||||
5.4. Interest Revenue and Expense
For the three-month and nine-month periods ending September 30,March 31, 2007 and 2006, and 2005, interest revenue and expense consisted of the following:
| | Three Months Ended September 30, | Nine Months Ended September 30, | Three Months Ended March 31, | |||||||||||||||
|---|---|---|---|---|---|---|---|---|---|---|---|---|---|---|---|---|---|---|
| In millions of dollars | 2006 | 2005(1) | 2006(1) | 2005(1) | 2007 | 2006(1) | ||||||||||||
| Interest revenue | ||||||||||||||||||
| Loan interest, including fees | $ | 14,390 | $ | 12,035 | $ | 40,851 | $ | 34,761 | $ | 14,935 | $ | 12,818 | ||||||
| Deposits with banks | 713 | 438 | 1,928 | 1,200 | 709 | 489 | ||||||||||||
| Federal funds sold and securities purchased under agreements to resell | 3,713 | 2,641 | 10,315 | 6,701 | 4,289 | 3,205 | ||||||||||||
| Investments, including dividends | 2,606 | 1,814 | 6,917 | 5,488 | 3,540 | 2,056 | ||||||||||||
| Trading account assets(2) | 2,558 | 1,847 | 8,005 | 5,630 | 3,930 | 2,700 | ||||||||||||
| Other interest | 749 | 569 | 2,158 | 1,533 | 729 | 605 | ||||||||||||
| Total interest revenue | $ | 24,729 | $ | 19,344 | $ | 70,174 | $ | 55,313 | $ | 28,132 | $ | 21,873 | ||||||
| Interest expense | ||||||||||||||||||
| Deposits | $ | 5,771 | $ | 3,616 | $ | 15,480 | $ | 9,528 | $ | 6,558 | $ | 4,505 | ||||||
| Trading account liabilities(2) | 56 | 32 | 171 | 86 | 307 | 243 | ||||||||||||
| Short-term debt and other liabilities | 5,914 | 3,972 | 16,635 | 10,501 | 6,947 | 4,864 | ||||||||||||
| Long-term debt | 3,160 | 2,029 | 8,439 | 5,626 | 3,750 | 2,495 | ||||||||||||
| Total interest expense | $ | 14,901 | $ | 9,649 | $ | 40,725 | $ | 25,741 | $ | 17,562 | $ | 12,107 | ||||||
| Net interest revenue | $ | 9,828 | $ | 9,695 | $ | 29,449 | $ | 29,572 | $ | 10,570 | $ | 9,766 | ||||||
| Provision for loan losses | 1,793 | 2,525 | 4,625 | 6,058 | 2,706 | 1,396 | ||||||||||||
| Net interest revenue after provision for loan losses | $ | 8,035 | $ | 7,170 | $ | 24,824 | $ | 23,514 | $ | 7,864 | $ | 8,370 | ||||||
6.5. Commissions and Fees
Commissions and fees revenuesrevenue includes charges to customers for credit and bank cards, including transaction-processing fees and annual fees; advisory, and equity and debt underwriting services; lending and deposit-related transactions, such as loan commitments, standby letters of credit, and other deposit and loan servicing activities; investment management-related fees including brokerage services, and custody and trust services; insurance fees and commissions.
The following table presents commissions and fees revenue for the three-month and nine-month periods ended September 30, 2006 and 2005.March 31,
| | Three Months Ended September 30, | Nine Months Ended September 30, | ||||||||||||||||
|---|---|---|---|---|---|---|---|---|---|---|---|---|---|---|---|---|---|---|
| In millions of dollars | 2006 | 2005 | 2006 | 2005 | 2007 | 2006(1) | ||||||||||||
| Credit cards and bank cards | $ | 1,328 | $ | 1,225 | $ | 3,897 | $ | 3,749 | $ | 1,270 | $ | 1,266 | ||||||
| Investment banking | 1,011 | 956 | 3,119 | 2,689 | 1,561 | 1,010 | ||||||||||||
| Smith Barney | 702 | 588 | 2,184 | 1,717 | 774 | 717 | ||||||||||||
| CIB trading-related | 527 | 579 | 1,887 | 1,693 | ||||||||||||||
| Markets & Banking trading-related | 686 | 655 | ||||||||||||||||
| Checking-related | 257 | 254 | 756 | 748 | 287 | 248 | ||||||||||||
| Transaction services | 218 | 185 | 636 | 550 | 231 | 209 | ||||||||||||
| Corporate finance | 139 | 122 | 511 | 328 | 295 | 170 | ||||||||||||
| Loan servicing(1) | (431 | ) | 424 | 573 | 326 | |||||||||||||
| Loan servicing(2) | 261 | 568 | ||||||||||||||||
| Primerica | 96 | 100 | 298 | 271 | 116 | 96 | ||||||||||||
| Other Consumer | 103 | 180 | 439 | 585 | 216 | 159 | ||||||||||||
| Other CIB | 57 | 99 | 183 | 261 | ||||||||||||||
| Other Markets & Banking | 57 | 56 | ||||||||||||||||
| Other | — | 113 | 43 | 95 | 19 | 34 | ||||||||||||
| Total commissions and fees | $ | 4,007 | $ | 4,825 | $ | 14,526 | $ | 13,012 | $ | 5,773 | $ | 5,188 | ||||||
The Company has several non-contributory defined benefit pension plans covering substantially all U.S. employees and has various defined benefit pension and termination indemnity plans covering employees outside the United States. The U.S. defined benefit plan usesprovides benefits under a cash balance formula. Employees satisfying certain age and service requirements remain covered by a prior final pay formula. The Company also offers postretirement health care and life insurance benefits to certain eligible U.S. retired employees, as well as to certain eligible employees outside the United States. For information on the Company's Retirement Benefit Plans and Pension Assumptions, see Citigroup's 20052006 Annual Report on Form 10-K.
The following table below summarizes the components of the net expense (benefit) recognized in the Consolidated Statement of Income for the three and nine months ended September 30, 2006March 31, 2007 and 2005.2006.
Net Expense (Benefit)
| | Three Months Ended September 30, | |||||||||||||||||||
|---|---|---|---|---|---|---|---|---|---|---|---|---|---|---|---|---|---|---|---|---|
| | Pension Plans | Postretirement Benefit Plans(2) | ||||||||||||||||||
| | U.S. Plans(1) | Plans Outside U.S. | U.S. Plans | |||||||||||||||||
| In millions of dollars | 2006 | 2005 | 2006 | 2005 | 2006 | 2005 | ||||||||||||||
| Benefits earned during the period | $ | 60 | $ | 58 | $ | 33 | $ | 43 | $ | — | $ | 1 | ||||||||
| Interest cost on benefit obligation | 158 | 149 | 67 | 73 | 16 | 16 | ||||||||||||||
| Expected return on plan assets | (210 | ) | (201 | ) | (118 | ) | (93 | ) | (4 | ) | (4 | ) | ||||||||
| Curtailment gain associated with plan amendments | (80 | ) | — | — | — | — | — | |||||||||||||
| Amortization of unrecognized: | ||||||||||||||||||||
| Net transition obligation | — | — | 1 | 1 | — | — | ||||||||||||||
| Prior service cost | (2 | ) | (6 | ) | — | 1 | (1 | ) | (1 | ) | ||||||||||
| Net actuarial loss | 52 | 50 | 10 | 27 | — | 4 | ||||||||||||||
| Net expense (benefit) | $ | (22 | ) | $ | 50 | $ | (7 | ) | $ | 52 | $ | 11 | $ | 16 | ||||||
| | Nine Months Ended September 30, | |||||||||||||||||||
|---|---|---|---|---|---|---|---|---|---|---|---|---|---|---|---|---|---|---|---|---|
| | Pension Plans | Postretirement Benefit Plans(2) | ||||||||||||||||||
| | U.S. Plans(1) | Plans Outside U.S. | U.S. Plans | |||||||||||||||||
| In millions of dollars | 2006 | 2005 | 2006 | 2005 | 2006 | 2005 | ||||||||||||||
| Benefits earned during the period | $ | 195 | $ | 193 | $ | 121 | $ | 126 | $ | 1 | $ | 2 | ||||||||
| Interest cost on benefit obligation | 473 | 449 | 203 | 193 | 46 | 47 | ||||||||||||||
| Expected return on plan assets | (634 | ) | (605 | ) | (286 | ) | (232 | ) | (10 | ) | (11 | ) | ||||||||
| Curtailment gain associated with plan amendments | (80 | ) | — | — | — | — | — | |||||||||||||
| Amortization of unrecognized: | ||||||||||||||||||||
| Net transition obligation | — | — | 1 | 2 | — | — | ||||||||||||||
| Prior service cost | (14 | ) | (18 | ) | 1 | 1 | (3 | ) | (3 | ) | ||||||||||
| Net actuarial loss | 139 | 121 | 38 | 54 | 6 | 10 | ||||||||||||||
| Net expense | $ | 79 | $ | 140 | $ | 78 | $ | 144 | $ | 40 | $ | 45 | ||||||||
| | Three Months Ended March 31, | |||||||||||||||||||||||||
|---|---|---|---|---|---|---|---|---|---|---|---|---|---|---|---|---|---|---|---|---|---|---|---|---|---|---|
| | Pension Plans | Postretirement Benefit Plans | ||||||||||||||||||||||||
| | U.S. Plans(1) (2) | Plans Outside U.S. | U.S. Plans | Plans Outside U.S. | ||||||||||||||||||||||
| In millions of dollars | 2007 | 2006 | 2007 | 2006 | 2007 | 2006 | 2007 | 2006 | ||||||||||||||||||
| Benefits earned during the period | $ | 67 | $ | 68 | $ | 44 | $ | 43 | $ | 1 | $ | 1 | $ | 6 | $ | 4 | ||||||||||
| Interest cost on benefit obligation | 163 | 157 | 74 | 68 | 15 | 16 | 18 | 14 | ||||||||||||||||||
| Expected return on plan assets | (222 | ) | (212 | ) | (107 | ) | (84 | ) | (3 | ) | (3 | ) | (24 | ) | (14 | ) | ||||||||||
| Amortization of unrecognized: | ||||||||||||||||||||||||||
| Net transition obligation | — | — | 1 | — | — | — | — | — | ||||||||||||||||||
| Prior service cost | (1 | ) | (6 | ) | — | 1 | (1 | ) | (1 | ) | — | — | ||||||||||||||
| Net actuarial loss | 27 | 44 | 13 | 14 | 1 | 3 | 2 | 2 | ||||||||||||||||||
| Net expense | $ | 34 | $ | 51 | $ | 25 | $ | 42 | $ | 13 | $ | 16 | $ | 2 | $ | 6 | ||||||||||
Employer Contributions
Citigroup's pension funding policy for U.S. plans and non-U.S. pension plans is generally to fund to applicable minimum funding requirements, rather than to the amounts of accumulated benefit obligations. For the U.S. plans, the Company may increase its contributions above the minimum required contribution under the Employee Retirement Income Security Act of 1974 (ERISA), if appropriate to its tax and cash position and the plan's funded position. At September 30, 2006March 31, 2007 and December 31, 2005,2006, there were no minimum required contributions and no discretionary cash or non-cash contributions are currently planned for the U.S. plans. However, in 2005, the Company contributed $160 million to the U.S. pension plan to avoid an additional minimum liability at December 31, 2005. For the non-U.S. plans, the Company contributed $268$43 million for the nine months ended September 30, 2006.as of March 31, 2007. Citigroup presently anticipates contributing an additional $88$120 million to fund its non-U.S. plans in 20062007 for a total of $356$163 million.
The Company has adopted a number of equity compensation plans under which it administers stock options, restricted or deferred stock and stock purchase programs. The award programs are used to attract, retain and motivate officers and employees, to compensate them for their contributions to the Company, and to encourage employee stock ownership. The plans are administered by the Personnel and Compensation Committee of the Citigroup Board of Directors, which is comprised entirely of independent non-employee directors. At September 30, 2006, approximately 316 million shares were authorized and available for grant under Citigroup's stock incentive and stock purchase plans. These shares would be issued out of Treasury stock.
The following compensation expense relates to the Company's stock-based compensation programs as recorded during the 2006 and 2005 third quarters and year-to-date 2006 and 2005:
| | Three Months Ended September 30, | Nine Months Ended September 30, | ||||||||||
|---|---|---|---|---|---|---|---|---|---|---|---|---|
| In millions of dollars | 2006 | 2005 | 2006 | 2005 | ||||||||
| SFAS 123(R) charges for January 2006 awards issued to retirement-eligible employees | $ | — | $ | — | $ | 648 | $ | — | ||||
SFAS 123(R) quarterly accrual for estimated awards to be granted through January 2007 to retirement-eligible employees | 195 | — | 561 | — | ||||||||
Quarterly Option Expense | 25 | 30 | 95 | 128 | ||||||||
Quarterly amortization of Restricted and Deferred Stock awards(1) | 565 | 435 | 1,446 | 1,322 | ||||||||
Total | $ | 785 | $ | 465 | $ | 2,750 | $ | 1,450 | ||||
For Statement of Cash Flows purposes, these amounts are included within Other, net.
Stock Award Programs
The Company, primarily through its Capital Accumulation Program (CAP), issues shares of Citigroup common stock in the form of restricted or deferred stock to participating officers and employees. For all stock award programs, during the applicable vesting period, the shares awarded cannot be sold or transferred by the participant, and the award is subject to cancellation if the participant's employment is terminated. After the award vests, the shares become freely transferable (subject to the stock ownership commitment of senior executives). From the date of award, the recipient of a restricted stock award can direct the vote of the shares and receive regular dividends. Recipients of deferred stock awards receive dividend equivalents and cannot vote.
Stock awards granted in January 2006 and 2005 generally vest 25% per year over four years, except for certain employees atSmith Barney whose awards vest after two years. Stock awards granted in 2003 and 2004 generally vest after a two- or three-year vesting period. CAP participants may elect to receive all or part of their award in stock options. The figures presented in the stock option program tables include options granted under CAP. Unearned compensation expense associated with the stock awards represents the market value of Citigroup common stock at the date of grant and is recognized as a charge to income ratably over the full vesting period, except for those awards granted to retirement-eligible employees. The charge to income for awards made to retirement-eligible employees is accelerated based on the dates the retirement rules are met.
CAP and certain other awards provide that participants who meet certain age and years of service conditions, and agree not to compete with Citigroup, may continue to vest in all or a portion of the award without remaining employed by the Company during the entire vesting period. Beginning in 2006, awards for these retirement-eligible employees are recognized in the year prior to the grant in the same manner as cash incentive compensation is accrued. However, the award granted in 2006 was required to be expensed in its entirety at the date of grant. Prior to 2006, such awards were recognized ratably over the stated vesting period. See Note 1 to the Consolidated Financial Statements on page 91 for the impact of adopting SFAS 123(R).
In 2003, special equity awards were issued to certain employees in the Corporate and Investment Banking, Global Wealth Management and Citigroup International businesses. The awards vest over a three-year term beginning on July 12, 2003, with one-sixth of the award vesting every six months. During the vesting period, the stock cannot be sold or transferred by the participant, and is subject to total or partial cancellation if the participant's employment is terminated. These awards were fully vested in January 2006.
From 2003 to 2006, Citigroup granted restricted or deferred shares under the Citigroup Ownership Program (COP) to eligible employees. This program replaces the WealthBuilder, CitiBuilder, and Citigroup Ownership stock option programs. Employees are issued either restricted or deferred shares of Citigroup common stock that vest after three years. Unearned compensation expense associated with the stock grants represents the market value of Citigroup common stock at the date of grant and is recognized as a charge to income ratably over the vesting period, except for those awards granted to retirement-eligible employees. The
7. Restructuring
During the first quarter of 2007, the Company completed a review of its structural expense base in a Company-wide effort to create a more streamlined organization, reduce expense growth and provide investment funds for future growth initiatives.
The primary goals of the 2007 Structural Expense Review are as follow:
In March 2007, Citigroup recorded a pre-tax restructuring charge of $1.377 billion in accordance with SFAS No. 146,"Accounting for Costs Associated with Exit or Disposal Activities" (SFAS 146). This pronouncement permits charges recorded under other accounting standards to income for awards made to retirement-eligible employees is accelerated basedbe presented along with those recorded under SFAS 146 in a separate line, Restructuring expense, on the datesConsolidated Statement of Income, provided those costs are incurred in connection with a restructuring event. The charge included $961 million related to employee severance, of which $950 million is accounted for in accordance with SFAS No. 112,"Employer's Accounting for Post Employment Benefits" (SFAS 112), and $11 million accounted for in accordance with SFAS 146, $352 million related to the retirement rules are met.
A summary of the status of Citigroup's unvested stock awards as of September 30, 2006, and changes during the nine months ended September 30, 2006, is presented below:
| Unvested Stock Awards | Shares | Weighted Average Grant Date Fair Value | |||
|---|---|---|---|---|---|
| Unvested at January 1, 2006 | 117,623,501 | $ | 44.12 | ||
| Awards | 63,894,657 | $ | 48.52 | ||
| Cancels | (6,394,127 | ) | $ | 46.99 | |
| Deletes | (260,707 | ) | $ | 46.70 | |
| Vestings | (47,533,427 | ) | $ | 39.50 | |
| Unvested at September 30, 2006 | 127,329,897 | $ | 47.90 | ||
The marketwrite-down to estimated salvage value of assets available for disposal accounted for in accordance with SFAS No. 144,"Accounting for the vestings during the 2006 first nine months was approximately $47.25 per share.
AsImpairment or Disposal of September 30, 2006, there was $3.3 billion of total unrecognized compensation costLong-Lived Assets" (SFAS 144), $25 million related to unvested stock awards. That cost is expectedexiting leasehold and other contractual obligations, and $39 million related to be recognized over a weighted-average period of 2.7 years.
Stock Option Programsother costs (including employee termination costs). The severance costs reflect the accrual to eliminate approximately 17,300 positions, after considering attrition and redeployment within the Company.
The Company has a numberimplementation of stock option programs for its directors, officersthese restructuring initiatives also caused certain related premises and employees. Generally, since January 2005, stock options have been granted onlyequipment assets to CAP participants who elect to receive stock options in lieubecome redundant. The remaining depreciable lives of restricted or deferred stock awards,these assets were shortened, and to non-employee directors who elect to receive their compensationaccelerated depreciation charges will begin in the formsecond quarter of a stock option grant. All stock options2007 in addition to normal scheduled depreciation.
Additional charges totaling approximately $200 million, pre-tax, are granted on Citigroup common stock with exercise prices equalanticipated to be recorded by the end of 2007.
Separate from the restructuring charge, additional implementation costs related to these initiatives of approximately $100 million pretax are expected throughout 2007.
The status of the 2007 Structural Expense Review is summarized in the following table:
Restructuring Reserve Activity
| In millions of dollars | | |||
|---|---|---|---|---|
| Original restructuring charge | $ | 1,377 | ||
| First quarter 2007 utilization | (268 | ) | ||
| Reserve balance at March 31, 2007 | $ | 1,109 | ||
The utilization of the 2007 restructuring reserve resulted from non-cash charges related to the fair market value at the timewrite-off of grant. Options granted since 2003 have six-year terms; directors' options vest after two years and all other options granted since January 2005 typically vest 25% each year over four years. Options granted in 2004 and 2003 typically vest in thirds each year over three years, with the first vesting date occurring 17 months after the grant date. The sale of underlying shares acquired through the exercise of employee stock options granted since January 2003 is restricted for a two-year period (and the shares are subject to the stock ownership commitment of senior executives thereafter). Prior to 2003, Citigroup options, including options granted since the date of the merger of Citicorp and Travelers Group, Inc., generally vested at a rate of 20% per year over five years, with the first vesting date occurring 12 to 18 months following the grant date. Certain options, mostly granted prior to January 1, 2003, permit an employee exercising an option under certain conditions to be granted new options (reload options) in an amount equal to the number of common shares used to satisfy the exercise price and the withholding taxes due upon exercise. The reload options are granted for the remaining term of the related original option and vest after six months. An option may not be exercised using the reload method unless the market price on the date of exercise is at least 20% greater than the option exercise price.
To further encourage employee stock ownership, the Company's eligible employees participate in WealthBuilder, CitiBuilder, or the Citigroup Ownership Program. Options granted under the WealthBuilder and the Citigroup Ownership programs vest over a five-year period, whereas options granted under the CitiBuilder program vest after five years. These options do not have a reload feature. Options have not been granted under these programs since 2002.assets, primarily intangible assets.
Information with respect to stock option activity under Citigroup stock option plans for the nine months ended September 30, 2006, and year ended December 31, 2005 is as follows:
| | 2006 | 2005 | ||||||||||||||
|---|---|---|---|---|---|---|---|---|---|---|---|---|---|---|---|---|
| | Options | Weighted Average Exercise Price | Intrinsic Value Per Share | Options | Weighted Average Exercise Price | Intrinsic Value Per Share | ||||||||||
| Outstanding, beginning of period | 277,255,935 | $ | 40.27 | $ | 8.26 | 330,910,779 | $ | 39.28 | $ | 8.90 | ||||||
| Granted—original | 3,259,638 | $ | 48.87 | — | 5,279,863 | 47.45 | — | |||||||||
| Granted—reload | 2,650,505 | $ | 49.66 | — | 3,013,384 | 48.85 | — | |||||||||
| Forfeited or exchanged | (12,627,126 | ) | $ | 45.87 | 2.26 | (17,726,910 | ) | 44.29 | 2.33 | |||||||
| Expired | (2,009,369 | ) | $ | 44.96 | 3.17 | (2,572,189 | ) | 47.70 | — | |||||||
| Exercised | (33,991,965 | ) | $ | 33.10 | 15.03 | (41,648,992 | ) | 31.72 | 14.90 | |||||||
| Outstanding, end of period | 234,537,618 | $ | 41.16 | $ | 8.51 | 277,255,935 | $ | 40.27 | $ | 8.26 | ||||||
| Exercisable at end of period | 208,790,019 | 221,497,294 | ||||||||||||||
The following table summarizes the information about stock options outstanding under Citigroup stock option plans at September 30, 2006:
| | Options Outstanding | Options Exercisable | ||||||||||
|---|---|---|---|---|---|---|---|---|---|---|---|---|
| Range of Exercise Prices | Number Outstanding | Weighted Average Contractual Life Remaining | Weighted Average Exercise Price | Number Exercisable | Weighted Average Exercise Price | |||||||
| $7.77–$9.99 | 6,972 | 4.9 years | $ | 7.77 | 6,972 | $ | 7.77 | |||||
| $10.00–$19.99 | 2,452,568 | 1.1 years | $ | 18.94 | 2,450,201 | $ | 18.94 | |||||
| $20.00–$29.99 | 27,664,730 | 1.7 years | $ | 22.84 | 27,583,637 | $ | 22.83 | |||||
| $30.00–$39.99 | 38,370,384 | 3.2 years | $ | 33.06 | 36,199,395 | $ | 32.96 | |||||
| $40.00–$49.99 | 154,978,814 | 4.0 years | $ | 46.03 | 131,907,543 | $ | 45.94 | |||||
| $50.00–$56.83 | 11,064,150 | 2.7 years | $ | 51.88 | 10,642,271 | $ | 51.94 | |||||
| 234,537,618 | 3.5 years | $ | 41.16 | 208,790,019 | $ | 40.62 | ||||||
As of September 30, 2006, there was $55.6 million of total unrecognized compensation cost related to stock options; this cost is expected to be recognized over a weighted average period of 1.12 years.
Fair Value Assumptions
SFAS 123(R) requires that reload options be treated as separate grants from the related original grants. Pursuant to the terms of currently outstanding reloadable options, upon exercise of an option, if employees use previously owned shares to pay the exercise price and surrender shares otherwise to be received for related tax withholding, they will receive a reload option covering the same number of shares used for such purposes, but only if the market price on the date of exercise is at least 20% greater than the option exercise price. Reload options vest at the end of a six-month period and carry the same expiration date as the option that gave rise to the reload grant. The exercise price of a reload grant is the market price on the date the underlying option was exercised. Reload options are intended to encourage employees to exercise options at an earlier date and to retain the shares acquired. The result of this program is that employees generally will exercise options as soon as they are able and, therefore, these options have shorter expected lives. Shorter option lives result in lower valuations. However, such values are expensed more quickly due to the shorter vesting period of reload options. In addition, since reload options are treated as separate grants, the existence of the reload feature results in a greater number of options being valued. Shares received through option exercises under the reload program, as well as certain other options granted, are subject to restrictions on sale.
Additional valuation and related assumption information for Citigroup option plans is presented below. Since 2004, Citigroup has used a binomial model to value stock options.
| For Options Granted During | 2006 | 2005 | ||||||
|---|---|---|---|---|---|---|---|---|
| Weighted average per share fair value | $ | 6.91 | $ | 7.23 | ||||
Weighted averaged expected life | ||||||||
| Original grants | 4.57 yrs. | 5.26 yrs. | ||||||
| Reload grants | 2.30 yrs. | 3.29 yrs. | ||||||
Valuation assumptions | ||||||||
| Expected volatility | 20.48 | % | 25.06 | % | ||||
| Risk-free interest rate | 4.54 | % | 3.66 | % | ||||
| Expected dividend yield | 3.88 | % | 3.35 | % | ||||
| Expected annual forfeitures | ||||||||
| Original and reload grants | 7 | % | 7 | % | ||||
The following reflectsis a reconciliation of the income and share data used in the basic and diluted earnings per share computations for the three and nine months ended September 30, 2006March 31, 2007 and 2005:2006:
| | Three Months Ended September 30, | Nine Months Ended September 30, | ||||||||||||||||||
|---|---|---|---|---|---|---|---|---|---|---|---|---|---|---|---|---|---|---|---|---|
| In millions, except per share amounts | 2006 | 2005 | 2006 | 2005 | March 31, 2007 | March 31, 2006 | ||||||||||||||
| Income from continuing operations | $ | 5,303 | $ | 4,988 | $ | 16,120 | $ | 14,834 | $ | 5,012 | $ | 5,555 | ||||||||
| Discontinued operations | 202 | 2,155 | 289 | 2,823 | — | 84 | ||||||||||||||
| Preferred dividends | (16 | ) | (17 | ) | (48 | ) | (51 | ) | (16 | ) | (16 | ) | ||||||||
| Income available to common stockholders for basic EPS | 5,489 | 7,126 | 16,361 | 17,606 | 4,996 | 5,623 | ||||||||||||||
| Effect of dilutive securities | — | — | — | — | — | — | ||||||||||||||
| Income available to common stockholders for diluted EPS | $ | 5,489 | $ | 7,126 | $ | 16,361 | $ | 17,606 | $ | 4,996 | $ | 5,623 | ||||||||
| Weighted average common shares outstanding applicable to basic EPS | 4,875.5 | 5,058.3 | 4,898.4 | 5,103.6 | 4,877.0 | 4,920.7 | ||||||||||||||
| Effect of dilutive securities: | ||||||||||||||||||||
| Options | 25.7 | 28.3 | 27.0 | 34.3 | 26.7 | 27.3 | ||||||||||||||
| Restricted and deferred stock | 77.4 | 59.4 | 66.8 | 55.5 | 64.2 | 59.9 | ||||||||||||||
| Adjusted weighted average common shares outstanding applicable to diluted EPS | 4,978.6 | 5,146.0 | 4,992.2 | 5,193.4 | 4,967.9 | 5,007.9 | ||||||||||||||
| Basic earnings per share(1) | ||||||||||||||||||||
| Basic earnings per share(1) | ||||||||||||||||||||
| Income from continuing operations | $ | 1.08 | $ | 0.98 | $ | 3.28 | $ | 2.90 | $ | 1.02 | $ | 1.13 | ||||||||
| Discontinued operations, net | 0.04 | 0.43 | 0.06 | 0.55 | ||||||||||||||||
| Discontinued operations | — | 0.02 | ||||||||||||||||||
| Net income | $ | 1.13 | $ | 1.41 | $ | 3.34 | $ | 3.45 | $ | 1.02 | $ | 1.14 | ||||||||
| Diluted earnings per share | ||||||||||||||||||||
Diluted earnings per share(1) | ||||||||||||||||||||
| Income from continuing operations | $ | 1.06 | $ | 0.97 | $ | 3.22 | $ | 2.85 | $ | 1.01 | $ | 1.11 | ||||||||
| Discontinued operations, net | 0.04 | 0.41 | 0.06 | 0.54 | ||||||||||||||||
| Discontinued operations | — | 0.02 | ||||||||||||||||||
| Net income | $ | 1.10 | $ | 1.38 | $ | 3.28 | $ | 3.39 | $ | 1.01 | $ | 1.12 | ||||||||
10.9. Trading Account Assets and Liabilities
Trading account assets and liabilities, at marketfair value, consisted of the following:
| In millions of dollars | Sept. 30, 2006 | Dec. 31, 2005 | March 31, 2007 | December 31, 2006 | ||||||||
|---|---|---|---|---|---|---|---|---|---|---|---|---|
| Trading account assets | ||||||||||||
| U.S. Treasury and Federal agency securities | $ | 38,938 | $ | 38,771 | ||||||||
| U.S. Treasury and federal agency securities | $ | 60,885 | $ | 44,661 | ||||||||
| State and municipal securities | 12,560 | 17,856 | 17,099 | 17,358 | ||||||||
| Foreign government securities | 34,436 | 21,266 | 46,978 | 33,057 | ||||||||
| Corporate and other debt securities | 78,873 | 60,137 | 98,771 | 93,891 | ||||||||
| Derivatives(1) | 48,420 | 47,414 | ||||||||||
| Derivatives(1) | 46,466 | 49,541 | ||||||||||
| Equity securities | 82,360 | 64,553 | 106,203 | 92,518 | ||||||||
| Mortgage loans and collateralized mortgage securities | 32,060 | 27,852 | 45,814 | 37,104 | ||||||||
| Other | 23,502 | 17,971 | 37,849 | 25,795 | ||||||||
| Total trading account assets | $ | 351,149 | $ | 295,820 | $ | 460,065 | $ | 393,925 | ||||
| Trading account liabilities | ||||||||||||
| Securities sold, not yet purchased | $ | 71,970 | $ | 59,780 | $ | 99,711 | $ | 71,083 | ||||
| Derivatives(1) | 66,906 | 61,328 | ||||||||||
| Derivatives(1) | 74,191 | 74,804 | ||||||||||
| Total trading account liabilities | $ | 138,876 | $ | 121,108 | $ | 173,902 | $ | 145,887 | ||||
11.10. Goodwill and Intangible Assets
The changes in goodwill during the first ninethree months of 20062007 were as follows:
| In millions of dollars | Goodwill | |||
|---|---|---|---|---|
| Balance at December 31, 2005 | $ | 33,130 | ||
Purchase accounting adjustment—Legg Mason acquisition | 24 | |||
| Purchase accounting adjustment—FAB acquisition | 19 | |||
| Foreign exchange translation and other | (240 | ) | ||
Balance at March 31, 2006 | $ | 32,933 | ||
Consolidation of Credicard business | 270 | |||
| Partial disposition of ownership interest in Bank Handlowy | (33 | ) | ||
| Sale of New York Branches | (23 | ) | ||
| Foreign exchange translation and other | (237 | ) | ||
Balance at June 30, 2006 | $ | 32,910 | ||
Adjustment to consolidation of Credicard business | (7 | ) | ||
| Partial disposition of ownership interest in Bank Handlowy | (6 | ) | ||
| Purchase accounting adjustment—Unisen acquisition | (8 | ) | ||
| Foreign exchange translation and other | 280 | |||
Balance at September 30, 2006 | $ | 33,169 | ||
In millions of dollars | Goodwill | |||
|---|---|---|---|---|
| Balance at December 31, 2006 | $ | 33,415 | ||
Acquisition of Grupo Financiero Uno | 865 | |||
| Acquisition of Quilter | 268 | |||
| Foreign exchange translation and other | (168 | ) | ||
| Balance at March 31, 2007 | $ | 34,380 | ||
During the first three quartersquarter of 2006,2007, no goodwill was written off due to impairment.
The changes in intangible assets during the first ninethree months of 20062007 were as follows:
| In millions of dollars | Intangible Assets (Net Carrying Amount) | |||
|---|---|---|---|---|
| Balance at December 31, 2005 | $ | 14,749 | ||
Changes in capitalized MSRs(1) | 613 | |||
| Foreign exchange translation and other | (2 | ) | ||
| Amortization expense | (268 | ) | ||
Balance at March 31, 2006 | $ | 15,092 | ||
Changes in capitalized MSRs(1) | $ | 611 | ||
| Federated receivables acquisition—purchased credit card relationships | 320 | |||
| Consolidation of Credicard business—purchased credit card relationships | 75 | |||
| Servicing rights on Student Loan securitizations | 30 | |||
| Foreign exchange translation and other | (7 | ) | ||
| Amortization expense | (271 | ) | ||
Balance at June 30, 2006 | $ | 15,850 | ||
Changes in capitalized MSRs(1) | $ | (109 | ) | |
| Federated receivables acquisition—purchased credit card relationships | 150 | |||
| Adjustment to consolidation of Credicard business—purchased credit card relationships | 7 | |||
| Acquisition of U.K. Shell Credit Card portfolio—purchased credit card relationships | 22 | |||
| Servicing rights on Student Loan securitizations | 35 | |||
| Foreign exchange translation and other | 16 | |||
| Amortization expense | (246 | ) | ||
Balance at September 30, 2006 | $ | 15,725 | ||
In millions of dollars | Net Carrying Amount at December 31, 2006 | Acquisitions | Amortization | FX & Other(1) | Impairments(2) | Net Carrying Amount at March 31, 2007 | ||||||||||||
|---|---|---|---|---|---|---|---|---|---|---|---|---|---|---|---|---|---|---|
| Purchased credit card relationships | $ | 4,879 | $ | 92 | $ | (151 | ) | $ | 7 | $ | (35 | ) | $ | 4,792 | ||||
| Core deposit intangibles | 734 | 45 | (22 | ) | 14 | — | 771 | |||||||||||
| Other customer relationships | 389 | — | (16 | ) | (23 | ) | (127 | ) | 223 | |||||||||
| Present value of future profits | 181 | — | (1 | ) | — | — | 180 | |||||||||||
| Indefinite-lived intangible assets | 639 | — | — | (5 | ) | (73 | ) | 561 | ||||||||||
| Other | 3,640 | 387 | (62 | ) | 6 | — | 3,971 | |||||||||||
| Intangible assets carried at fair value(3) | 5,439 | 3,119 | — | 274 | — | 8,832 | ||||||||||||
| Total intangible assets | $ | 15,901 | $ | 3,643 | $ | (252 | ) | $ | 273 | $ | (235 | ) | $ | 19,330 | ||||
The components of intangible assets were as follows:
| | September 30, 2006 | December 31, 2005 | March 31, 2007 | December 31, 2006 | ||||||||||||||||||||||||||||||||
|---|---|---|---|---|---|---|---|---|---|---|---|---|---|---|---|---|---|---|---|---|---|---|---|---|---|---|---|---|---|---|---|---|---|---|---|---|
| In millions of dollars | Gross Carrying Amount | Accumulated Amortization(1) | Net Carrying Amount | Gross Carrying Amount | Accumulated Amortization(1) | Net Carrying Amount | Gross Carrying Amount | Accumulated Amortization | Net Carrying Amount | Gross Carrying Amount | Accumulated Amortization | Net Carrying Amount | ||||||||||||||||||||||||
| Purchased credit card relationships | $ | 8,132 | $ | 3,389 | $ | 4,743 | $ | 7,541 | $ | 2,929 | $ | 4,612 | $ | 8,488 | $ | 3,696 | $ | 4,792 | $ | 8,391 | $ | 3,512 | $ | 4,879 | ||||||||||||
| Mortgage servicing rights(1) | 5,456 | — | 5,456 | 8,808 | 4,469 | 4,339 | ||||||||||||||||||||||||||||||
| Core deposit intangibles | 1,207 | 458 | 749 | 1,248 | 424 | 824 | 1,295 | 524 | 771 | 1,223 | 489 | 734 | ||||||||||||||||||||||||
| Other customer relationships | 1,038 | 636 | 402 | 1,065 | 596 | 469 | 860 | 637 | 223 | 1,044 | 655 | 389 | ||||||||||||||||||||||||
| Present value of future profits | 427 | 242 | 185 | 429 | 229 | 200 | 427 | 247 | 180 | 428 | 247 | 181 | ||||||||||||||||||||||||
| Other(2) | 4,440 | 703 | 3,737 | 4,455 | 647 | 3,808 | ||||||||||||||||||||||||||||||
| Other(1) | 4,836 | 865 | 3,971 | 4,445 | 805 | 3,640 | ||||||||||||||||||||||||||||||
| Total amortizing intangible assets | $ | 20,700 | $ | 5,428 | $ | 15,272 | $ | 23,546 | $ | 9,294 | $ | 14,252 | $ | 15,906 | $ | 5,969 | $ | 9,937 | $ | 15,531 | $ | 5,708 | $ | 9,823 | ||||||||||||
Indefinite-lived intangible assets | 453 | 497 | 561 | N/A | 561 | 639 | N/A | 639 | ||||||||||||||||||||||||||||
| Intangible assets carried at fair value(2) | $ | 8,832 | N/A | 8,832 | $ | 5,439 | N/A | 5,439 | ||||||||||||||||||||||||||||
| Total intangible assets | $ | 15,725 | $ | 14,749 | $ | 25,299 | $ | 5,969 | $ | 19,330 | $ | 21,609 | $ | 5,708 | $ | 15,901 | ||||||||||||||||||||
12.11. Investments
| In millions of dollars | September 30, 2006 | December 31, 2005 | March 31, 2007 | December 31, 2006 | ||||||||
|---|---|---|---|---|---|---|---|---|---|---|---|---|
| Fixed income securities, substantially all available-for-sale at fair value | $ | 234,189 | $ | 163,177 | $ | 266,399 | $ | 254,107 | ||||
| Equity securities | 14,163 | 14,368 | 20,131 | 19,447 | ||||||||
| Venture capital, at fair value | 3,188 | 2,844 | ||||||||||
| Short-term and other | 208 | 208 | ||||||||||
| Other | 37 | 37 | ||||||||||
| Total | $ | 251,748 | $ | 180,597 | $ | 286,567 | $ | 273,591 | ||||
The amortized cost and fair value of investments in fixed income and equity securities at September 30, 2006March 31, 2007 and December 31, 20052006 were as follows:
| | September 30, 2006 | December 31, 2005(1) | March 31, 2007 | December 31, 2006(1)(2) | ||||||||||||||||||||||||||||||||
|---|---|---|---|---|---|---|---|---|---|---|---|---|---|---|---|---|---|---|---|---|---|---|---|---|---|---|---|---|---|---|---|---|---|---|---|---|
| In millions of dollars | Amortized Cost | Gross Unrealized Gains | Gross Unrealized Losses | Fair Value | Amortized Cost | Fair Value | Amortized Cost | Gross Unrealized Gains | Gross Unrealized Losses | Fair Value | Amortized Cost | Fair Value | ||||||||||||||||||||||||
| Fixed income securities held to maturity | $ | 1 | $ | — | $ | — | $ | 1 | $ | 2 | $ | 2 | $ | 1 | $ | — | $ | — | $ | 1 | $ | 1 | $ | 1 | ||||||||||||
Fixed income securities available-for-sale | ||||||||||||||||||||||||||||||||||||
| Mortgage-backed securities, principally obligations of U.S. Federal agencies | 66,605 | 294 | 246 | 66,653 | 13,157 | 12,937 | $ | 89,051 | $ | 268 | $ | 231 | $ | 89,088 | $ | 82,443 | $ | 82,413 | ||||||||||||||||||
| U.S. Treasury and Federal agencies | 27,956 | 31 | 309 | 27,678 | 28,448 | 28,034 | 22,616 | 16 | 239 | 22,393 | 24,872 | 24,531 | ||||||||||||||||||||||||
| State and municipal | 12,219 | 474 | 4 | 12,689 | 13,090 | 13,581 | 18,054 | 436 | 34 | 18,456 | 15,152 | 15,654 | ||||||||||||||||||||||||
| Foreign government | 72,056 | 409 | 489 | 71,976 | 67,823 | 67,874 | 81,069 | 579 | 479 | 81,169 | 73,943 | 73,783 | ||||||||||||||||||||||||
| U.S. corporate | 32,567 | 414 | 247 | 32,734 | 25,050 | 25,055 | 32,407 | 312 | 227 | 32,492 | 32,311 | 32,455 | ||||||||||||||||||||||||
| Other debt securities | 22,451 | 68 | 61 | 22,458 | 15,665 | 15,694 | 22,758 | 78 | 36 | 22,800 | 25,071 | 25,270 | ||||||||||||||||||||||||
| Total fixed income securities available-for-sale(3) | $ | 233,855 | $ | 1,690 | $ | 1,356 | $ | 234,189 | $ | 163,235 | $ | 163,177 | ||||||||||||||||||||||||
| Total fixed income securities available-for-sale(4) | $ | 265,956 | $ | 1,689 | $ | 1,246 | $ | 266,399 | $ | 253,793 | $ | 254,107 | ||||||||||||||||||||||||
Equity securities(4) | $ | 13,121 | $ | 1,274 | $ | 232 | $ | 14,163 | $ | 13,017 | $ | 14,368 | ||||||||||||||||||||||||
| Equity securities(5)(6) | $ | 18,882 | $ | 1,252 | $ | 3 | $ | 20,131 | $ | 18,477 | $ | 19,447 | ||||||||||||||||||||||||
Realizedgainsloss on these securities was reclassified to retained earnings and losses related to the venture capital investmentsshares are classifiednow included in other revenue as the mark-to-market of these investments is recognizedTrading account assets in earnings. The net gains reflected in earnings from these venture capital investments were $39 millionaccordance with SFAS 159. See Note 14 and $430 millionNote 16 on pages 102 and 105, respectively, for the three months and nine months ended September 30, 2006, and $131 million and $1,462 million for the three and nine months ended September 30, 2005, respectively. The total carrying value and cost for the venture capital investments on September 30, 2006 were as follows:
| In millions of dollars | 2006 | 2005 | ||||
|---|---|---|---|---|---|---|
| Carrying value | $ | 3,187 | $ | 3,355 | ||
| Cost | 1,838 | 2,571 | ||||
The CompanyCitigroup invests in certain complex investment company structures known as master-feederMaster-Feeder funds by making direct investments in the Feeder funds. Each feederFeeder fund records its net investment in the masterMaster fund, which is the sole or principal investment of the feeder fund. The CompanyFeeder fund, and does not consolidate the Master Fund. Citigroup consolidates feederFeeder funds where it has a controlling interest. At September 30, 2006,March 31, 2007, the total assets of Citigroup's consolidated feederFeeder funds amounted to approximately $1.9$3.6 billion. The CompanyCitigroup has not consolidated the assets and liabilities of the master funds. As such, Citigroup's balance sheet excludes approximately $8.1$8.0 billion of additional assets and liabilities recorded in the related master funds'Master Funds' financial statements.
13.12. Debt
Short-term borrowings consist of commercial paper and other short-term borrowings as follows:
| In millions of dollars | In millions of dollars | September 30, 2006 | December 31, 2005 | In millions of dollars | March 31, 2007 | December 31, 2006 | ||||||||
|---|---|---|---|---|---|---|---|---|---|---|---|---|---|---|
| Commercial paper | Commercial paper | Commercial paper | ||||||||||||
| Citigroup Funding Inc. | $ | 33,732 | $ | 32,581 | Citigroup Funding Inc. | $ | 39,745 | $ | 41,767 | |||||
| Other Citigroup Subsidiaries | 739 | 1,578 | Other Citigroup Subsidiaries | 866 | 1,928 | |||||||||
| $ | 34,471 | $ | 34,159 | $ | 40,611 | $ | 43,695 | |||||||
| Other short-term borrowings | Other short-term borrowings | 36,030 | 32,771 | Other short-term borrowings | 70,568 | 57,138 | ||||||||
| Total short-term borrowings | Total short-term borrowings | $ | 70,501 | $ | 66,930 | Total short-term borrowings | $ | 111,179 | $ | 100,833 | ||||
Borrowings under bank lines of credit may be at interest rates based on LIBOR, CD rates, the prime rate, or bids submitted by the banks. Citigroup issues commercial paper directly to investors. Citigroup maintains liquidity reservespays commitment fees for its lines of cash and securities as part of a broad liquidity management framework in support of commercial paper issuance.credit.
Some of Citigroup's nonbank subsidiaries have credit facilities with Citigroup's subsidiary depository institutions, including Citibank, N.A. Borrowings under these facilities must be securedcollateralized in accordance with Section 23A of the Federal Reserve Act.
CGMHI has a syndicated five-year committed uncollateralized revolving line of credit facility with unaffiliated banks totaling $3.0 billion maturing in 2011. CGMHI also has three-and five-year bilateral facilities totaling $575 million with unaffiliated banks with borrowings maturing on various dates in 2007, 2009, and 2011. These facilities are guaranteed by Citigroup. CGMHI may borrow under these revolving credit facilities at various interest rate options (LIBOR, Fed Funds or base rate) and compensate the banks for these facilities through facilities fees. At September 30, 2006, there were no outstanding borrowings under these facilities.
CGMHI also has committed long-term financing facilities with unaffiliated banks. At September 30, 2006, CGMHI had drawn down the full $1.78 billion available under these facilities, of which $1.08 billion is guaranteed by Citigroup. A bank can terminate these facilities by giving CGMHI prior notice (generally one year). Under all of these facilities, CGMHI is required to maintain a certain level of consolidated adjusted net worth (as defined in the agreements). At September 30, 2006, this requirement was exceeded by approximately $9.1 billion. CGMHI also has substantial borrowing arrangements consisting of facilities that CGMHI has been advised are available, but where no contractual lending obligation exists. These arrangements are reviewed on an ongoing basis to ensure flexibility in meeting CGMHI's short-term requirements.
Long-term debt, including its current portion, consisted of the following:
| In millions of dollars | September 30, 2006 | December 31, 2005 | March 31, 2007 | December 31, 2006 | ||||||||
|---|---|---|---|---|---|---|---|---|---|---|---|---|
| Citigroup Parent Company | $ | 114,299 | $ | 100,600 | $ | 134,915 | $ | 125,350 | ||||
| Other Citigroup Subsidiaries(1) | 99,050 | 71,139 | 122,969 | 115,578 | ||||||||
| Citigroup Global Markets Holdings Inc.(2) | 31,019 | 39,214 | 28,419 | 28,719 | ||||||||
| Citigroup Funding Inc. | 15,265 | 5,963 | 24,465 | 18,847 | ||||||||
| Other | 456 | 583 | ||||||||||
| Total long-term debt | $ | 260,089 | $ | 217,499 | $ | 310,768 | $ | 288,494 | ||||
CGMHI has a syndicated five-year committed uncollateralized revolving line of credit facility with unaffiliated banks totaling $3.0 billion, which matures in 2011. CGMHI also has three-year bilateral facilities totaling $575 million with unaffiliated banks with borrowings maturing on various dates in 2009. At March 31, 2007 there were no outstanding borrowings under these facilities.
CGMHI also has committed long-term financing facilities with unaffiliated banks. At March 31, 2007, CGMHI had drawn down the full $1.78 billion available under these facilities, of which $1.08 billion is guaranteed by Citigroup. A bank can terminate these facilities by giving CGMHI prior notice (generally one year). CGMHI also has substantial borrowing arrangements consisting of facilities that CGMHI has been advised are available, but where no contractual lending obligation exists. These arrangements are reviewed on an ongoing basis to ensure flexibility in meeting CGMHI's short-term requirements.
The Company issues both fixed and variable rate debt in a range of currencies. It uses derivative contracts, primarily interest rate swaps, to effectively convert a portion of its fixed rate debt to variable rate debt and variable rate debt to fixed rate debt. The maturity structure of the derivatives generally corresponds to the maturity structure of the debt being hedged. In addition, the Company uses other derivative contracts to manage the foreign exchange impact of certain debt issuances.
Long-term debt at September 30, 2006March 31, 2007 and December 31, 20052006 includes $8,189$9,601 million and $6,459$9,775 million, respectively, of junior subordinated debt. The Company formed statutory business trusts under the laws of the state of Delaware, which exist for the exclusive purposes of (i) issuing Trust Securities representing undivided beneficial interests in the assets of the Trust; (ii) investing the gross proceeds of the Trust securities in junior subordinated deferrable interest debentures (subordinated debentures) of its parent; and (iii) engaging in only those activities necessary or incidental thereto. Upon approval from the Federal Reserve, Citigroup has the right to redeem these securities.
Citigroup has contractually agreed not to redeem or repurchasepurchase (i) the 6.50% Enhanced Trust Preferred Securities of Citigroup Capital XV before September 15, 2056, (ii) the 6.45% Enhanced Trust Preferred Securities of Citigroup Capital XVI before December 31, 2046 and (iii) the 6.35% Enhanced Trust Preferred Securities of Citigroup Capital XVII before March 15, 2057 unless certain conditions, described in Exhibit 4.03 to Citigroup's Current Report on Form 8-K filed on September 18, 2006, in Exhibit 4.02 to Citigroup's Current Report on Form 8-K filed on November 28, 2006 and in Exhibit 4.02 to Citigroup's Current Report on Form 8-K filed on March 8, 2007, respectively, are met. This agreement isThese agreements are for the benefit of the holders of Citigroup's 6.00% Junior Subordinated Deferrable Interest Debentures due 2034.
For Regulatory Capital purposes, these Trust Securities remain a component of Tier 1 Capital. See "Capital Resources and Liquidity" on page 74.68.
Citigroup owns all of the voting securities of thethese subsidiary trusts. TheThese subsidiary trusts have no assets, operations, revenues or cash flows other than those related to the issuance, administration, and repayment of the subsidiary trusts and the subsidiary trusts' common and preferred securities. TheThese subsidiary trusts' obligations are fully and unconditionally guaranteed by Citigroup.
The following table summarizes the financial structure of each of the Company's subsidiary trusts at September 30, 2006:March 31, 2007:
| Trust Securities with distributions Guaranteed by Citigroup: | | | | | | Junior Subordinated Debentures Owned by Trust | ||||||||||||
|---|---|---|---|---|---|---|---|---|---|---|---|---|---|---|---|---|---|---|
| | | | | Common Shares Issued to Parent | ||||||||||||||
| Issuance Date | Securities Issued | Liquidation Value | Coupon Rate | Amount(1) | Maturity | Redeemable by Issuer Beginning | ||||||||||||
| In millions of dollars, except share amounts | ||||||||||||||||||
| Citicorp Capital I(2) | Dec. 1996 | 300,000 | $ | 300 | 7.933 | % | 9,000 | $ | 309 | Feb. 15, 2027 | Feb. 15, 2007 | |||||||
| Citicorp Capital II(2) | Jan. 1997 | 450,000 | 450 | 8.015 | % | 13,500 | 464 | Feb. 15, 2027 | Feb. 15, 2007 | |||||||||
| Citigroup Capital II | Dec. 1996 | 400,000 | 400 | 7.750 | % | 12,372 | 412 | Dec. 1, 2036 | Dec. 1, 2006 | |||||||||
| Citigroup Capital III | Dec. 1996 | 200,000 | 200 | 7.625 | % | 6,186 | 206 | Dec. 1, 2036 | Not redeemable | |||||||||
| Citigroup Capital VII | July 2001 | 46,000,000 | 1,150 | 7.125 | % | 1,422,681 | 1,186 | July 31, 2031 | July 31, 2006 | |||||||||
| Citigroup Capital VIII | Sept. 2001 | 56,000,000 | 1,400 | 6.950 | % | 1,731,959 | 1,443 | Sept. 15, 2031 | Sept. 17, 2006 | |||||||||
| Citigroup Capital IX | Feb. 2003 | 44,000,000 | 1,100 | 6.000 | % | 1,360,825 | 1,134 | Feb. 14, 2033 | Feb. 13, 2008 | |||||||||
| Citigroup Capital X | Sept. 2003 | 20,000,000 | 500 | 6.100 | % | 618,557 | 515 | Sept. 30, 2033 | Sept. 30, 2008 | |||||||||
| Citigroup Capital XI | Sept. 2004 | 24,000,000 | 600 | 6.000 | % | 742,269 | 619 | Sept. 27, 2034 | Sept. 27, 2009 | |||||||||
| Citigroup Capital XIV | June 2006 | 22,600,000 | 565 | 6.875 | % | 40,000 | 566 | June 30, 2066 | June 30, 2011 | |||||||||
| Citigroup Capital XV | Sept. 2006 | 47,400,000 | 1,185 | 6.500 | % | 40,000 | 1,186 | Sept. 15, 2066 | Sept. 15, 2011 | |||||||||
| Adam Capital Trust I(3) | Nov. 2001 | 25,000 | 25 | 6 mo. LIB +375 bp. | 774 | 26 | Dec. 08, 2031 | Dec. 08, 2006 | ||||||||||
| Adam Statutory Trust I(3) | Dec. 2001 | 23,000 | 23 | 3 mo. LIB +360 bp. | 712 | 24 | Dec. 18, 2031 | Dec. 18, 2006 | ||||||||||
| Adam Capital Trust II(3) | Apr. 2002 | 22,000 | 22 | 6 mo. LIB +370 bp. | 681 | 23 | Apr. 22, 2032 | Apr. 22, 2007 | ||||||||||
| Adam Statutory Trust II(3) | Mar. 2002 | 25,000 | 25 | 3 mo. LIB +360 bp. | 774 | 26 | Mar. 26, 2032 | Mar. 26, 2007 | ||||||||||
| Adam Capital Trust III(3) | Dec. 2002 | 17,500 | 18 | 3 mo. LIB +335 bp. | 542 | 18 | Jan. 07, 2033 | Jan. 07, 2008 | ||||||||||
| Adam Statutory Trust III(3) | Dec. 2002 | 25,000 | 25 | 3 mo. LIB +325 bp. | 774 | 26 | Dec. 26, 2032 | Dec. 26, 2007 | ||||||||||
| Adam Statutory Trust IV(3) | Sept. 2003 | 40,000 | 40 | 3 mo. LIB +295 bp. | 1,238 | 41 | Sept. 17, 2033 | Sept. 17, 2008 | ||||||||||
| Adam Statutory Trust V(3) | Mar. 2004 | 35,000 | 35 | 3 mo. LIB +279 bp. | 1,083 | 36 | Mar. 17, 2034 | Mar. 17, 2009 | ||||||||||
| Total obligated | $ | 8,063 | $ | 8,260 | ||||||||||||||
| | | | | | | Junior Subordinated Debentures Owned by Trust | ||||||||||||
|---|---|---|---|---|---|---|---|---|---|---|---|---|---|---|---|---|---|---|
| Trust Securities with Distributions Guaranteed by Citigroup: | | | | | Common Shares Issued to Parent | |||||||||||||
| Issuance Date | Securities Issued | Liquidation Value | Coupon Rate | Amount(1) | Maturity | Redeemable by Issuer Beginning | ||||||||||||
| In millions of dollars, except share amounts | ||||||||||||||||||
| Citigroup Capital III | Dec. 1996 | 200,000 | $ | 200 | 7.625 | % | 6,186 | $ | 206 | Dec. 1, 2036 | Not redeemable | |||||||
| Citigroup Capital VII | July 2001 | 46,000,000 | 1,150 | 7.125 | % | 1,422,681 | 1,186 | July 31, 2031 | July 31, 2006 | |||||||||
| Citigroup Capital VIII | Sept. 2001 | 56,000,000 | 1,400 | 6.950 | % | 1,731,959 | 1,443 | Sept. 15, 2031 | Sept. 17, 2006 | |||||||||
| Citigroup Capital IX | Feb. 2003 | 44,000,000 | 1,100 | 6.000 | % | 1,360,825 | 1,134 | Feb. 14, 2033 | Feb. 13, 2008 | |||||||||
| Citigroup Capital X | Sept. 2003 | 20,000,000 | 500 | 6.100 | % | 618,557 | 515 | Sept. 30, 2033 | Sept. 30, 2008 | |||||||||
| Citigroup Capital XI | Sept. 2004 | 24,000,000 | 600 | 6.000 | % | 742,269 | 619 | Sept. 27, 2034 | Sept. 27, 2009 | |||||||||
| Citigroup Capital XIV | June 2006 | 22,600,000 | 565 | 6.875 | % | 40,000 | 566 | June 30, 2066 | June 30, 2011 | |||||||||
| Citigroup Capital XV | Sept. 2006 | 47,400,000 | 1,185 | 6.500 | % | 40,000 | 1,186 | Sept. 15, 2066 | Sept. 15, 2011 | |||||||||
| Citigroup Capital XVI | Nov. 2006 | 64,000,000 | 1,600 | 6.450 | % | 20,000 | 1,601 | Dec. 31, 2066 | Dec. 31, 2011 | |||||||||
| Citigroup Capital XVII | Mar. 2007 | 44,000,000 | 1,100 | 6.350 | % | 20,000 | 1,101 | Mar. 15, 2067 | Mar. 15, 2012 | |||||||||
Adam Capital Trust II(2) | Apr. 2002 | 22,000 | 22 | 6 mo. LIB +370 bp. | 681 | 23 | Apr. 22, 2032 | Apr. 22, 2007 | ||||||||||
| Adam Capital Trust III(2) | Dec. 2002 | 17,500 | 18 | 3 mo. LIB +335 bp. | 542 | 18 | Jan. 07, 2033 | Jan. 07, 2008 | ||||||||||
| Adam Statutory Trust III(2) | Dec. 2002 | 25,000 | 25 | 3 mo. LIB +325 bp. | 774 | 26 | Dec. 26, 2032 | Dec. 26, 2007 | ||||||||||
| Adam Statutory Trust IV(2) | Sept. 2003 | 40,000 | 40 | 3 mo. LIB +295 bp. | 1,238 | 41 | Sept. 17, 2033 | Sept. 17, 2008 | ||||||||||
| Adam Statutory Trust V(2) | Mar. 2004 | 35,000 | 35 | 3 mo. LIB +279 bp. | 1,083 | 36 | Mar. 17, 2034 | Mar. 17, 2009 | ||||||||||
| Total obligated | $ | 9,540 | $ | 9,701 | ||||||||||||||
In each case, the coupon rate on the debentures is the same as that on the Trust Securities.trust securities. Distributions on the Trust Securitiestrust securities and interest on the debentures are payable quarterly, except for Citigroup Capital II and III Citicorp Capital I and II, and Adam Capital Trust I and II, on which distributions are payable semiannually.
On March 18, 2007 and March 26, 2007, Citigroup redeemed for cash all of the $23 million and $25 million Trust Preferred Securities of Adam Statutory Trust I and Adam Statutory Trust II, respectively, at the redemption price of $1,000 per preferred security plus any accrued distribution up to but excluding the date of redemption.
On March 6, 2007, Citigroup issued $1.000 billion of Enhanced Trust Preferred Securities (Citigroup Capital XVII). An additional $100 million was issued, related to this Trust, on March 14, 2007.
On February 15, 2007, Citigroup redeemed for cash all of the $300 million Trust Preferred Securities of Citicorp Capital I, $450 million of Citicorp Capital II, and $400 million of Citigroup Capital II, at the redemption price of $1,000 per preferred security plus any accrued distribution up to but excluding the date of redemption.
On April 23, 2007, Citigroup redeemed for cash all of the $22 million Trust Preferred Securities of Adam Capital Trust II at the redemption price of $1,000 per preferred security plus any accrued distribution up to but excluding the date of redemption.
14.13. Securitizations and Variable Interest Entities
The Company primarily securitizes credit card receivables and mortgages. Other types of assets securitized include corporate debt securities, auto loans, and student loans.
After securitization of credit card receivables, the Company continues to maintain credit card customer account relationships and provides servicing for receivables transferred to the trusts. The Company also arranges for third parties to provide credit enhancement to the trusts, including cash collateral accounts, subordinated securities, and letters of credit. As specified in some of the sale agreements, the net revenue collected each month is accumulated up to a predetermined maximum amount, and is available over the remaining term of that transaction to make payments of yield, fees, and transaction costs in the event that net cash flows from the receivables are not sufficient. Once the predetermined amount is reached, net revenue is recognized by the Citigroup subsidiary that sold the receivables.
The Company provides a wide range of mortgage and other loan products to a diverse customer base. In connection with the securitization of these loans, the servicing rights entitle the Company to a future stream of cash flows based on the outstanding principal balances of the loans and the contractual servicing fee. Failure to service the loans in accordance with contractual requirements may lead to a termination of the servicing rights and the loss of future servicing fees. In non-recourse servicing, the principal credit risk to the Company is the cost of temporary advances of funds. In recourse servicing, the servicer agrees to share credit risk with the owner of the mortgage loans such as FNMA or FHLMC or with a private investor, insurer, or guarantor. Losses on recourse servicing occur primarily when foreclosure sale proceeds of the property underlying a defaulted mortgage are less than the outstanding principal balance and accrued interest of the loan and the cost of holding and disposing of the underlying property. The Company's mortgage loan securitizations are primarily non-recourse, thereby effectively transferring the risk of future credit losses to the purchaser of the securities issued by the trust.
The Company also originates and sells first mortgage loans in the ordinary course of its mortgage banking activities. The Company sells some of these loans to the Government National Mortgage Association (GNMA) with the servicing rights retained. GNMA has the primary recourse obligation on the individual loans; however, GNMA's recourse obligation is capped at a fixed amount per loan. Any losses above that fixed amount are borne by Citigroup as the seller/servicer.
The following table summarizes certain cash flows received from and paid to securitization trusts during the three and nine months ended September 30, 2006March 31, 2007 and 2005:2006:
| | Three Months Ended September 30, 2006 | Three Months Ended September 30, 2005 | ||||||||||||||||
|---|---|---|---|---|---|---|---|---|---|---|---|---|---|---|---|---|---|---|
| In billions of dollars | Credit Cards | Mortgages | Other(1) | Credit Cards | Mortgages | Other(1) | ||||||||||||
| Proceeds from new securitizations | $ | 2.5 | $ | 24.7 | $ | 11.8 | $ | 5.1 | $ | 25.0 | $ | 7.1 | ||||||
| Proceeds from collections reinvested in new receivables | 54.8 | 0.5 | — | 51.7 | 0.5 | — | ||||||||||||
| Contractual servicing fees received | 0.5 | 0.3 | — | 0.5 | 0.2 | — | ||||||||||||
| Cash flows received on retained interests and other net cash flows | 2.1 | — | — | 1.8 | — | — | ||||||||||||
| | Nine Months Ended September 30, 2006 | Nine Months Ended September 30, 2005 | ||||||||||||||||
|---|---|---|---|---|---|---|---|---|---|---|---|---|---|---|---|---|---|---|
| In billions of dollars | Credit Cards | Mortgages | Other(1) | Credit Cards | Mortgages | Other(1) | ||||||||||||
| Proceeds from new securitizations | $ | 16.9 | $ | 69.0 | $ | 28.7 | $ | 14.4 | $ | 62.3 | $ | 24.9 | ||||||
| Proceeds from collections reinvested in new receivables | 161.8 | 0.9 | — | 143.5 | 0.8 | — | ||||||||||||
| Contractual servicing fees received | 1.6 | 0.7 | — | 1.4 | 0.7 | — | ||||||||||||
| Cash flows received on retained interests and other net cash flows | 6.5 | 0.1 | — | 5.0 | 0.1 | 0.1 | ||||||||||||
| | Three Months Ended March 31, 2007 | ||||||||||||||
|---|---|---|---|---|---|---|---|---|---|---|---|---|---|---|---|
| In billions of dollars | Credit Cards | U.S. Consumer Mortgages | Markets & Banking Mortgages | Markets & Banking Other | Other(1) | ||||||||||
| Proceeds from new securitizations | $ | 6.3 | $ | 26.9 | $ | 16.5 | $ | 13.1 | $ | — | |||||
| Proceeds from collections reinvested in new receivables | 51.9 | — | — | — | 0.5 | ||||||||||
| Contractual servicing fees received | 0.5 | 0.3 | — | — | — | ||||||||||
| Cash flows received on retained interests and other net cash flows | 2.1 | — | — | — | — | ||||||||||
| | Three Months Ended March 31, 2006 | ||||||||||||||
|---|---|---|---|---|---|---|---|---|---|---|---|---|---|---|---|
| In billions of dollars | Credit Cards | U.S. Consumer Mortgages | Markets & Banking Mortgages | Markets & Banking Other | Other(1) | ||||||||||
| Proceeds from new securitizations | $ | 6.8 | $ | 12.1 | $ | 5.1 | $ | 7.6 | $ | 0.1 | |||||
| Proceeds from collections reinvested in new receivables | 53.9 | — | — | — | 0.1 | ||||||||||
| Contractual servicing fees received | 0.5 | 0.2 | — | — | — | ||||||||||
| Cash flows received on retained interests and other net cash flows | 2.4 | — | — | — | — | ||||||||||
The Company recognized gains on securitizations of U.S. Consumer mortgages of $37$31 million and $21$30 million for the three-month periods ended September 30,March 31, 2007 and 2006, and 2005, respectively, and $98 million and $134 million during the first nine months of 2006 and 2005, respectively. In the thirdfirst quarter of 20062007 and 2005,2006, the Company recorded net gains of $0.1 billion$248 million and $0.3 billion, respectively,$171 million related to the securitization of credit card receivables, and $0.6 billion and $0.8 billion for the nine months ended September 30, 2006 and 2005, respectively.receivables. Gains recognized on the securitization of Markets & Banking and other assets during the third quarterfirst three months of 2007 and 2006 and 2005 were $74$13 million and $50$21 million, respectively, and were $165 million and $80 million during the first nine months of 2006 and 2005, respectively.
Key assumptions used for securitizations of credit cards, mortgages, and other assetsasset securitizations during the three months ended September 30,March 31, 2007 and 2006 and 2005 in measuring the fair value of retained interests at the date of sale or securitization follow:
| | Three Months Ended | |||||||||||||
|---|---|---|---|---|---|---|---|---|---|---|---|---|---|---|
| | Credit Cards | U.S. Consumer Mortgages | Banking Mortgages | Other | Other(1) | |||||||||
| Discount rate | 12.8% to 16.2% | N/A | ||||||||||||
| Constant prepayment rate | N/A | |||||||||||||
| Anticipated net credit losses | 0.0% | N/A | ||||||||||||
| Three Months Ended March 31, 2006 | ||||||||||
|---|---|---|---|---|---|---|---|---|---|---|
| Credit Cards | U.S. Consumer Mortgages | Markets & Banking Mortgages | Markets & Banking Other | Other(1) | ||||||
| Discount rate | 12.0% to 15.0% | 8.6% to 9.6% | 5.0% to 26.0% | 0.4% to 21.0% | N/A | |||||
| Constant prepayment rate | 8.5% to 20.1% | 7.8% to 10.4% | 9.0% to 43.0% | 14.0% to 33.0% | N/A | |||||
| Anticipated net credit losses | 4.2% to 6.0% | 0.0% | 0.0% to 40.0% | N/A | N/A | |||||
As required by SFAS No. 140, "Accounting for Transfers and Servicing of Financial Assets and Extinguishments of Liabilities" (SFAS 140), the effect of two negative changes in each of the key assumptions used to determine the fair value of retained interests must be disclosed. The negative effect of each change must be calculated independently, holding all other assumptions constant. Because the key assumptions may not in fact be independent, the net effect of simultaneous adverse changes in the key assumptions may be less than the sum of the individual effects shown below.
At September 30, 2006,March 31, 2007, the key assumptions used to value retained interests and the sensitivity of the fair value to adverse changes of 10% and 20% in each of the key assumptions were as follows:
Key assumptions at September 30, 2006March 31, 2007
| | March 31, 2007 | |||||||||
|---|---|---|---|---|---|---|---|---|---|---|
| | Credit Cards | U.S. Consumer Mortgages(1) | Markets & Banking Mortgages | Markets & Banking Other | Other(2) | |||||
| Discount rate | 12.8% to 16.2% | 11.0% | 4.1% to 27.9% | 5.6% to 27.9% | 6.0% to 10.7% | |||||
| Constant prepayment rate | 6.7% to 21.0% | 11.7% | 15.0% to 52.5% | 10.0% to 26.0% | 5.6% to 20.1% | |||||
| Anticipated net credit losses | 3.7% to 5.9% | 0.0% | 24.0% to 100.0% | N/A | 1.1% | |||||
| Weighted average life years | 11 to 12 Months | 6.1 years | 6.5 to 21.2 | 6.5 to 9.8 | 7 years | |||||
| | | September 30, 2006 | | March 31, 2007 | |||||||||||||||||||||
|---|---|---|---|---|---|---|---|---|---|---|---|---|---|---|---|---|---|---|---|---|---|---|---|---|---|
| In millions of dollars | In millions of dollars | Credit Cards | Mortgages and Other | In millions of dollars | Credit Cards | U.S. Consumer Mortgages | Markets & Banking Mortgages | Markets & Banking Other | Other(1) | ||||||||||||||||
| Carrying value of retained interests | Carrying value of retained interests | $ | 8,510 | $ | 13,172 | Carrying value of retained interests | $ | 7,246 | $ | 9,842 | $ | 3,559 | $ | 7,587 | $ | 1,372 | |||||||||
| Discount rate | |||||||||||||||||||||||||
| Discount Rates | Discount Rates | ||||||||||||||||||||||||
| 10% | $ | (62 | ) | $ | (199 | ) | 10% | $ | (66 | ) | $ | (260 | ) | $ | (28 | ) | $ | (19 | ) | $ | (24 | ) | |||
| 20% | (122 | ) | (388 | ) | 20% | (130 | ) | (505 | ) | (54 | ) | (37 | ) | (47 | ) | ||||||||||
| Constant prepayment rate | Constant prepayment rate | Constant prepayment rate | |||||||||||||||||||||||
| 10% | $ | (145 | ) | $ | (321 | ) | 10% | $ | (235 | ) | $ | (474 | ) | $ | (10 | ) | $ | (1 | ) | $ | (15 | ) | |||
| 20% | (274 | ) | (608 | ) | 20% | (443 | ) | (903 | ) | (25 | ) | (1 | ) | (28 | ) | ||||||||||
| Anticipated net credit losses | Anticipated net credit losses | Anticipated net credit losses | |||||||||||||||||||||||
| 10% | $ | (397 | ) | $ | (11 | ) | 10% | $ | (396 | ) | $ | (8 | ) | $ | (36 | ) | N/A | $ | (5 | ) | |||||
| 20% | (791 | ) | (90 | ) | 20% | (789 | ) | (15 | ) | (67 | ) | N/A | (10 | ) | |||||||||||
Managed Loans
After securitization of credit card receivables, the Company continues to maintain credit card customer account relationships and provides servicing for receivables transferred to the trusts. As a result, the Company considers the securitized credit card receivables to be part of the business it manages.
The following tables present a reconciliation between the managed basis and on-balance sheet credit card portfolios and the related delinquencies (loans which are 90 days or more past due) at September 30, 2006March 31, 2007 and December 31, 2005,2006, and credit losses, net of recoveries for the three- and nine-monththree-month periods ended September 30, 2006March 31, 2007 and 2005.2006.
| In millions of dollars, except principal amounts in billions | Sept. 30, 2006 | Dec. 31, 2005 | ||||
|---|---|---|---|---|---|---|
| Principal amounts, at period end | ||||||
| On-balance sheet | $ | 69.1 | $ | 69.5 | ||
| Securitized amounts | 99.2 | 96.2 | ||||
| Loans held-for-sale | 0.6 | — | ||||
| Total managed | $ | 168.9 | $ | 165.7 | ||
| Delinquencies, at period end | ||||||
| On balance sheet | $ | 1,459 | $ | 1,630 | ||
| Securitized amounts | 1,519 | 1,314 | ||||
| Loans held-for-sale | — | — | ||||
| Total managed | $ | 2,978 | $ | 2,944 | ||
| | Three Months Ended Sept. 30, | Nine Months Ended Sept. 30, | |||||||||||
|---|---|---|---|---|---|---|---|---|---|---|---|---|---|
| Credit losses, net of recoveries(In millions of dollars) | |||||||||||||
| 2006 | 2005 | 2006 | 2005 | ||||||||||
| On-balance sheet | $ | 803 | $ | 817 | $ | 2,247 | $ | 2,530 | |||||
| Securitized amounts | 1,051 | 1,267 | 2,891 | 3,736 | |||||||||
| Loans held-for-sale | 1 | — | 5 | 13 | |||||||||
| Total managed | $ | 1,855 | $ | 2,084 | $ | 5,143 | $ | 6,279 | |||||
| In millions of dollars, except loans in billions | Mar. 31, 2007 | Dec. 31, 2006 | ||||
|---|---|---|---|---|---|---|
| Principal amounts, at period end | ||||||
| On-balance sheet loans | $ | 68.1 | $ | 75.5 | ||
| Securitized amounts | 98.6 | 99.5 | ||||
| Loans held-for-sale | 3.0 | — | ||||
| Total managed | $ | 169.7 | $ | 175.0 | ||
| Delinquencies, at period end | ||||||
| On balance sheet loans | $ | 1,323 | $ | 1,427 | ||
| Securitized amounts | 1,528 | 1,616 | ||||
| Loans held-for-sale | 47 | — | ||||
| Total managed | $ | 2,898 | $ | 3,043 | ||
| | Three Months Ended March 31, | ||||||
|---|---|---|---|---|---|---|---|
| Credit losses, net of recoveries | 2007 | 2006 | |||||
| On-balance sheet loans | $ | 823 | $ | 664 | |||
| Securitized amounts | 1,150 | 871 | |||||
| Loans held-for-sale | — | 4 | |||||
| Total managed | $ | 1,973 | $ | 1,539 | |||
Mortgage Servicing Rights
The carryingfair value of capitalized mortgage loan servicing rights (MSRs) was $5.5$8.8 billion, $4.3$5.4 billion and $4.2$5.0 billion at September 30, 2006,March 31, 2007, December 31, 20052006 and September 30, 2005,March 31, 2006, respectively. With
The following table summarizes the changes in capitalized MSRs:
| | Three Months Ended March 31, | ||||||
|---|---|---|---|---|---|---|---|
| In millions of dollars | 2007 | 2006 | |||||
| Balance, beginning of period | $ | 5,439 | $ | 4,339 | |||
| Originations | 427 | 176 | |||||
| Purchases | 3,119 | 162 | |||||
| Changes in fair value of MSRs due to changes in inputs and assumptions | 125 | 515 | |||||
| Other changes(1) | (278 | ) | (237 | ) | |||
| Balance, end of period | $ | 8,832 | $ | 4,955 | |||
The market for MSRs is not sufficiently liquid to provide participants with quoted market prices. Therefore, the Company electinguses an option-adjusted spread valuation approach to early-adopt SFAS 156, "Accounting for Servicing of Financial Assets", as of January 1, 2006, MSRs are accounted for at fair value, with changes in value recorded as fee revenue in current earnings. Previously, only the portion of the MSR portfolio that was hedged with instruments qualifying for hedge accounting under SFAS 133 was recorded at fair value. The remaining portion, which was hedged with instruments that did not qualify for hedge accounting under SFAS 133, was accounted for at the lower-of-cost-or-market and included within other revenue. The impact of this change to Citigroup's financial statements was not material.
The Company determinesdetermine the fair value of MSRs by discounting projected netMSRs. This approach consists of projecting servicing cash flows under multiple interest rate scenarios, and discounting these cash flows using risk-adjusted discount rates. The key assumptions used in the valuation of MSRs include mortgage prepayment speeds and discount rates. The model assumptions and the remaining servicing portfolioMSRs' fair value estimates are compared to observable trades of similar MSR portfolios and considering market loaninterest-only security portfolios, as well as to MSR broker valuations and industry surveys. The cash flow model and underlying prepayment predictions and other economic factors.interest rate models used to value these MSRs are subject to validation in accordance with the Company's model validation policies. Refer to key assumptions at March 31, 2007 on page 99 for the key assumptions used in the MSR valuation process.
The fair value of the MSRs is primarily affected by changes in prepayments that result from shifts in mortgage interest rates. In managing this risk, the Company hedges a significant portion of the value of its MSRs through the use of interest rate derivative contracts, forward purchase commitments of mortgage-backed securities, and purchased securities classified as available-for-sale or trading (primarily fixed income debt, such as U.S. governmenttrading. The amount of contractually specified servicing fees, late fees and agencies obligations,ancillary fees earned were $287 million, $16 million and mortgage-backed securities including principal-only strips).
The following table summarizes$12 million, respectively, for the changes in capitalized MSRs:
| | Three Months Ended Sept. 30, | Nine Months Ended Sept. 30, | |||||||||||
|---|---|---|---|---|---|---|---|---|---|---|---|---|---|
| In millions of dollars | 2006 | 2005 | 2006 | 2005 | |||||||||
| Balance, beginning of period | $ | 5,565 | $ | 3,410 | $ | 4,339 | $ | 4,149 | |||||
Originations | 294 | 213 | 778 | 595 | |||||||||
| Purchases | 345 | 105 | 673 | 107 | |||||||||
| Gain (loss) on change in value of MSRs | (748 | ) | 308 | (334 | ) | (153 | ) | ||||||
| Amortization(1) | — | (212 | ) | — | (613 | ) | |||||||
| Provision for impairments(1) | — | 356 | — | 95 | |||||||||
| Balance, end of period | $ | 5,456 | $ | 4,180 | $ | 5,456 | $ | 4,180 | |||||
Variable Interest Entities
The following table represents the carrying amounts and classification of consolidated assets that are collateral for VIE obligations, including VIEs that were consolidated prior to the implementation of FIN 46-R under existing guidance and VIEs that the Company became involved with after July 1, 2003:
| In billions of dollars | September 30, 2006 | December 31, 2005 | March 31, 2007 | December 31, 2006 | ||||||||
|---|---|---|---|---|---|---|---|---|---|---|---|---|
| Cash | $ | 0.3 | $ | 0.4 | $ | 0.6 | $ | 0.5 | ||||
| Trading account assets | 28.1 | 29.7 | 33.8 | 31.6 | ||||||||
| Investments | 4.9 | 3.2 | 11.7 | 10.1 | ||||||||
| Loans | 8.0 | 9.5 | 6.9 | 6.8 | ||||||||
| Other assets | 5.3 | 4.7 | 5.8 | 5.7 | ||||||||
| Total assets of consolidated VIEs | $ | 46.6 | $ | 47.5 | $ | 58.8 | $ | 54.7 | ||||
The consolidated VIEs included in the table above represent hundreds of separate entities with which the Company is involved and include VIEs consolidated as a result of adopting FIN 46-R and FIN 46. Of the $46.6$58.8 billion and $47.5$54.7 billion of total assets of VIEs consolidated by the Company at September 30, 2006March 31, 2007 and December 31, 2005,2006, respectively, $36.0$23.2 billion and $37.2$39.2 billion represent structured transactions where the Company packages and securitizes assets purchased in the financial markets or from clients in order to create new security offerings and financing opportunities for clients; $8.2$33.4 billion and $7.6$13.1 billion represent investment vehicles that were established to provide a return to the investors in the vehicles; and $2.4$2.2 billion and $2.7$2.4 billion represent vehicles that hold lease receivables and equipment as collateral to issue debt securities, thus obtaining secured financing at favorable interest rates.
The Company may provide various products and services to the VIEs. It may provide liquidity facilities, may be a party to derivative contracts with VIEs, may provide loss enhancement in the form of letters of credit and other guarantees to the VIEs, may be the investment manager, and
may also have an ownership interest or other investment in certain VIEs. In general, the investors in the obligations of consolidated VIEs have recourse only to the assets of the VIEs and do not have recourse to the Company, except where the Company has provided a guarantee to the investors or is the counterparty to a derivative transaction involving the VIE.
In addition to the VIEs that are consolidated in accordance with FIN 46-R, the Company has significant variable interests in certain other VIEs that are not consolidated because the Company is not the primary beneficiary. These include multi-seller finance companies, collateralized debt obligations (CDOs), structured finance transactions, and numerous investment funds. In addition to these VIEs, the Company issues preferred securities to third- party investors through trust vehicles as a source of funding and regulatory capital, which were deconsolidated during the 2004 first quarter of 2004.quarter. The Company's liabilities to the deconsolidated trust are included in long-term debt.
The Company administers several third-party-owned, special purpose, multi-seller finance companies that purchase pools of trade receivables, credit cards, and other financial assets from third-party clients of the Company. As administrator, the Company provides accounting, funding, and operations services to these conduits. Generally, the Company has no ownership interest in the conduits. The sellers continue to service the transferred assets. The conduits' asset purchases are funded by issuing commercial paper and medium-term notes. The sellers absorb the first losses of the conduits by providing collateral in the form of excess assets. The Company, along with other financial institutions, provides liquidity facilities, such as commercial paper backstop lines of credit to the conduits. The Company also provides loss enhancement in the form of letters of credit and other guarantees. All fees are charged on a market basis.
During 2003, to comply with FIN 46-R, many of the conduits issued "first loss" subordinated notes such that one third-party investor in each conduit would be deemed the primary beneficiary and would consolidate the conduit. At September 30, 2006March 31, 2007 and December 31, 2005,2006, total assets in unconsolidated conduits were $69.5$74.3 billion and $55.3$66.3 billion, respectively.
The Company also packages and securitizes assets purchased in the financial markets in order to create new security offerings, including arbitrage CDOs and synthetic CDOs for institutional clients and retail customers, that match the clients' investment needs and preferences. Typically, these instruments diversify investors' risk to a pool of assets as compared with investments in an individual asset. The
VIEs, which are issuers of CDO securities, are generally organized as limited liability corporations. The Company typically receives fees for structuring and/or distributing the securities sold to investors. In some cases, the Company may repackage the investment with higher rated debt CDO securities or U.S. Treasury securities to provide a greater or a very high degree of certainty of the return of invested principal. A third-party manager is typically retained by the VIE to select collateral for inclusion in the pool and then actively manage it, or, in other cases, only to manage work-out credits. The Company may also provide other financial services and/or products to the VIEs for market-rate fees. These may include: the provision of liquidity or contingent liquidity facilities; interest rate or foreign exchange hedges and credit derivative instruments; and the purchasing and warehousing of securities until they are sold to the SPE. The Company is not the primary beneficiary of these VIEs under FIN 46-R due to its limited continuing involvement and, as a result, does not consolidate their assets and liabilities in its financial statements.
In addition to the conduits discussed above, the following table represents the assets of unconsolidated VIEs where the Company has significant involvement:
| In billions of dollars | September 30, 2006 | December 31, 2005 | ||||
|---|---|---|---|---|---|---|
| CDO-type transactions | $ | 41.7 | $ | 40.7 | ||
| Investment-related transactions | 78.2 | 61.1 | ||||
| Trust preferred securities | 8.2 | 6.5 | ||||
| Mortgage-related transactions | 1.2 | 3.1 | ||||
| Structured finance and other | 38.1 | 60.5 | ||||
| Total assets of significant unconsolidated VIEs | $ | 167.4 | $ | 171.9 | ||
| In billions of dollars | March 31, 2007 | December 31, 2006 | ||||
|---|---|---|---|---|---|---|
| CDO-type transactions | $ | 67.2 | $ | 52.1 | ||
| Investment-related transactions | 135.1 | 122.1 | ||||
| Trust preferred securities | 9.6 | 9.8 | ||||
| Mortgage-related transactions | 1.9 | 2.7 | ||||
| Structured finance and other | 35.6 | 41.1 | ||||
| Total assets of significant unconsolidated VIEs | $ | 249.4 | $ | 227.8 | ||
The Company has also established a number of investment funds as opportunities for qualified employees to invest in venture capital investments. The Company acts as investment manager to these funds and may provide employees with financing on both a recourse and non-recourse basis for a portion of the employees' investment commitments.
In addition, the Company administers numerous personal estate trusts. The Company may act as trustee and may also be the investment manager for the trust assets.
As mentioned above, the Company may, along with other financial institutions, provide liquidity facilities, such as commercial paper backstop lines of credit to the VIEs. The Company may be a party to derivative contracts with VIEs, may provide loss enhancement in the form of letters of credit and other guarantees to the VIEs, may be the investment manager, and may also have an ownership interest in certain VIEs. Although actual losses are not expected to be material, the Company's maximum exposure to loss as a result of its involvement with VIEs that are not consolidated was $93$108 billion and $91$109 billion at September 30, 2006March 31, 2007 and December 31, 2005,2006, respectively. For this purpose, maximum exposure is considered to be the notional amounts of credit lines, guarantees, other credit support, and liquidity facilities, the notional amounts of credit default swaps and certain total return swaps, and the amount invested where Citigroup has an ownership interest in the VIEs. In addition, the Company may be party to other derivative contracts with VIEs. Exposures that are considered to be guarantees are also included in Note 17 to the Consolidated Financial Statements on page 118.111.
15.14. Changes in Equity from Nonowner SourcesAccumulated Other Comprehensive Income (Loss) ("AOCI")
Changes in each component of Accumulated Other Changes in Equity from Nonowner SourcesAOCI for the three- and nine-month periodsthree-month period ended September 30, 2006 areMarch 31, 2007 were as follows:
| In millions of dollars | Net Unrealized Gains (Losses) on Investment Securities | Foreign Currency Translation Adjustment | Cash Flow Hedges | Minimum Pension Liability Adjustment | Accumulated Other Changes in Equity from Nonowner Sources | |||||||||||
|---|---|---|---|---|---|---|---|---|---|---|---|---|---|---|---|---|
| Balance, December 31, 2005 | $ | 1,084 | $ | (4,090 | ) | $ | 612 | $ | (138 | ) | $ | (2,532 | ) | |||
| Decrease in net unrealized gains on investment securities, net of tax | (110 | ) | — | — | — | (110 | ) | |||||||||
| Less: Reclassification adjustment for gains included in net income, net of tax(1) | (246 | ) | — | — | — | (246 | ) | |||||||||
| Foreign currency translation adjustment, net of tax(2) | — | (28 | ) | — | — | (28 | ) | |||||||||
| Cash flow hedges, net of tax | — | — | 206 | — | 206 | |||||||||||
| Minimum pension liability adjustment, net of tax(3) | — | — | — | 4 | 4 | |||||||||||
| Change | $ | (356 | ) | $ | (28 | ) | $ | 206 | $ | 4 | $ | (174 | ) | |||
| Balance, March 31, 2006 | $ | 728 | $ | (4,118 | ) | $ | 818 | $ | (134 | ) | $ | (2,706 | ) | |||
| Increase in net unrealized losses on investment securities, net of tax | (778 | ) | — | — | — | (778 | ) | |||||||||
| Less: Reclassification adjustment for gains included in net income, net of tax | (196 | ) | — | — | — | (196 | ) | |||||||||
| Foreign currency translation adjustment, net of tax(2) | — | 27 | — | — | 27 | |||||||||||
| Cash flow hedges, net of tax | — | — | 305 | — | 305 | |||||||||||
| Minimum pension liability adjustment, net of tax(3) | — | — | — | (3 | ) | (3 | ) | |||||||||
| Change | $ | (974 | ) | $ | 27 | $ | 305 | $ | (3 | ) | $ | (645 | ) | |||
| Balance, June 30, 2006 | $ | (246 | ) | $ | (4,091 | ) | $ | 1,123 | $ | (137 | ) | $ | (3,351 | ) | ||
| Increase in net unrealized gains on investment securities, net of tax(4) | 1,445 | — | — | — | 1,445 | |||||||||||
| Less: Reclassification adjustment for gains included in net income, net of tax | (198 | ) | — | — | — | (198 | ) | |||||||||
| Foreign currency translation adjustment, net of tax(5) | — | 475 | — | — | 475 | |||||||||||
| Cash flow hedges, net of tax(6) | — | — | (1,191 | ) | — | (1,191 | ) | |||||||||
| Minimum pension liability adjustment, net of tax(3) | — | — | — | (2 | ) | (2 | ) | |||||||||
| Current period change | $ | 1,247 | $ | 475 | $ | (1,191 | ) | $ | (2 | ) | $ | 529 | ||||
| Balance, September 30, 2006 | $ | 1,001 | $ | (3,616 | ) | $ | (68 | ) | $ | (139 | ) | $ | (2,822 | ) | ||
| In millions of dollars | Net Unrealized Gains on Investment Securities | Foreign Currency Translation Adjustment | Cash Flow Hedges | Pension Liability Adjustment | Accumulated Other Comprehensive Income (Loss) | |||||||||||
|---|---|---|---|---|---|---|---|---|---|---|---|---|---|---|---|---|
| Balance, December 31, 2006(1) | $ | 943 | $ | (2,796 | ) | $ | (61 | ) | $ | (1,786 | ) | $ | (3,700 | ) | ||
| Adjustment to opening balance, net of tax(2) | 149 | — | — | — | 149 | |||||||||||
| Adjusted balance, beginning of year | $ | 1,092 | $ | (2,796 | ) | $ | (61 | ) | $ | (1,786 | ) | $ | (3,551 | ) | ||
| Increase in net unrealized gains on investment securities, net of tax | 466 | — | — | — | 466 | |||||||||||
| Less: Reclassification adjustment for gains included in net income, net of tax | (307 | ) | — | — | — | (307 | ) | |||||||||
| Foreign currency translation adjustment, net of tax | — | (121 | ) | — | — | (121 | ) | |||||||||
| Cash flow hedges, net of tax(3) | — | — | (439 | ) | — | (439 | ) | |||||||||
| Pension liability adjustment, net of tax | — | — | — | 77 | 77 | |||||||||||
| Current period change | $ | 159 | $ | (121 | ) | $ | (439 | ) | $ | 77 | $ | (324 | ) | |||
| Balance, March 31, 2007 | $ | 1,251 | $ | (2,917 | ) | $ | (500 | ) | $ | (1,709 | ) | $ | (3,875 | ) | ||
16.15. Derivatives and Other Activities
In the ordinary course of business, Citigroup enters into various types of derivative transactions. These derivative transactions include:
Citigroup enters into these derivative contracts for the following reasons:
payments to a net variable-rate basis. This strategy is the most common form of an interest rate hedge, as it minimizes interest cost in certain yield curve environments. Derivatives are also used to manage risks inherent in specific groups of on-balance sheet assets and liabilities, including investments, corporate and consumer loans, deposit liabilities, other interest-sensitive assets and liabilities, as well as credit card securitizations, redemptions and sales. In addition, foreign exchange contracts are used to hedge non-U.S. dollar denominated debt, available-for-sale securities, net capital exposures and foreign exchange transactions.
Citigroup accounts for its hedging activity in accordance with SFAS 133. As a general rule, SFAS 133 hedge accounting is permitted for those situations where the Company is exposed to a particular risk, such as interest rate or foreign exchange risk, that causes changes in the fair value of an asset or liability, or variability in the expected future cash flows of an existing asset, liability, or a forecasted transaction.
Derivative contracts hedging the risks associated with the changes in fair value are referred to asfair value hedges, while
contracts hedging the risks affecting the expected future cash flows are calledcash flow hedges. Hedges that utilize derivatives to manage the foreign exchange risk associated with equity investments in non-USnon-U.S. dollar functional currency foreign subsidiaries are callednet investment hedges.hedges.
All derivatives are reported on the balance sheet at fair value. If certain hedging criteria specified in SFAS 133 are met, including testing for hedging effectiveness, special hedge accounting may be applied. The hedge effectiveness assessment methodologies for similar hedges are performed in a similar manner and are used consistently throughout the hedging relationships. For fair value hedges, the changes in value of the hedging derivative, as well as the changes in value of the related hedged item, due to the risk being hedged, are reflected in current earnings. For cash flow hedges and net investment hedges, the changes in value of the hedging derivative are reflected in Accumulated other changes in equity from nonowner sourcescomprehensive income (loss) in stockholders' equity, to the extent the hedge was effective. Hedge ineffectiveness, in either case, is reflected in current earnings.
Continuing with the example referred to above, the fixed rate long-term note is recorded at amortized cost under current U.S. GAAP. However, by electing to use SFAS 133 hedge accounting, the carrying value of this note is adjusted for changes in the benchmark floating rate, with any changes in fair value recorded in current earnings. The related interest rate swap is also recorded on the balance sheet at fair value, with any changes in fair value attributable to changes in interest rates reflected in earnings. Thus, any ineffectiveness resulting from the hedging relationship is recorded in current earnings. Alternatively, an economic-basis hedge, which does not meet the SFAS 133 hedging criteria, would involve only recording the derivative at fair value on the balance sheet, with its associated changes in value recorded in earnings. The note would continue to be carried at amortized cost, and therefore, current earnings would be impacted only by the interest rate shifts that cause the change in the swap's value. This type of hedge is undertaken when SFAS 133 hedge requirements cannot be achieved in an efficient and cost-effective manner.
Fair value hedges
Citigroup also hedges exposure to changes in the fair value of fixed-rate assets, including available-for-sale securities, reverse repurchase agreements and inter-bank placements. The hedging instruments mainly used are receive-variable, pay-fixed interest rate swaps for the remaining hedged asset categories. Most of these fair value hedging relationships use dollar-offset ratio analysis to assess whether the hedging relationships are highly effective at inception and on an ongoing basis, while others use regression analysis.
For a limited number of fair value hedges of benchmark interest rate risk, Citigroup uses the "shortcut" method as SFAS 133 allows the Company to assume no ineffectiveness if the hedging relationship involves an interest-bearing financial asset or liability and an interest rate swap. In order to assume no ineffectiveness, Citigroup ensures that all the shortcut method requirements of SFAS 133 for these types of hedging relationships are met.
Cash flow hedges
Citigroup also hedges variable cash flows resulting from investments in floating-rate available-for-sale securities, loans and receivables.receivables, as well as rollovers of short-term certificates of deposit. Variable cash flows from those assets are converted to fixed-rate cash flows by entering into receive-fixed, pay-variable interest rate swaps. These cash flow hedging relationships use regression or dollar-offset ratio analysis to assess whether the hedging relationships are highly effective at inception and on an
ongoing basis. Efforts are made initially to align the terms of the derivatives to those hedged forecasted cash flows. As a result, the amount of hedge ineffectiveness is not significant.
Citigroup also hedges the forecasted purchase of mortgage-backed securities and designates the overall change in the purchase price as a hedged risk. The assessment of effectiveness is based on ensuring that the critical terms of the hedging instrument and the hedged item match exactly.
Net investment hedges
Consistent with SFAS No. 52, "Foreign Currency TranslationTranslation" (SFAS 52), SFAS 133 allows hedging of the foreign currency risk of a net investment in a foreign operation. Citigroup primarily uses foreign currency forward contracts, short-term borrowings, and to a lesser extent foreign currency future contracts and foreign-currency-denominated debt instruments, to manage the foreign exchange risk associated with Citigroup's equity investments in several non-USnon-U.S. dollar functional currency foreign subsidiaries. In accordance with SFAS 52, Citigroup records the change in the carrying amount of these investments in the cumulative translation adjustment account within Accumulated other changes in equity from nonowner sources.comprehensive income (loss). Simultaneously, the effective portion of the hedge of this exposure is also recorded in the cumulative translation adjustment account, and any ineffective portion of net investment hedges is immediately recorded in earnings.
Achieving hedge accounting in compliance with SFAS 133 guidelines is extremely complex, and therefore Citigroup implemented SFAS 133 hedge accounting policies wherein associated hedges are subject to a periodic review process by qualified staff.complex. Key aspects of achieving SFAS 133 hedge accounting are documentation of hedging strategy and hedge effectiveness at the hedge inception and substantiating hedge effectiveness on an ongoing basis. A derivative must be highly effective in accomplishing the hedge objective of offsetting either changes in the fair value or cash flows of the hedged item for the risk being hedged. Any ineffectiveness in the hedge relationship is recognized in current earnings. The assessment of effectiveness excludes changes in the value of the hedged item that are unrelated to the risks being hedged. Similarly, the assessment of effectiveness may exclude changes in the fair value of a derivative related to time value that, if excluded, are recognized in current earnings.
The following table summarizes certain information related to the Company's hedging activities for the three-three months ended March 31, 2007 and nine-month periods ended September 30, 2006 and 2005:2006:
| | | Three Months Ended September 30, | Nine Months Ended September 30, | | Three Months Ended March 31, | |||||||||||||||||
|---|---|---|---|---|---|---|---|---|---|---|---|---|---|---|---|---|---|---|---|---|---|---|
| In millions of dollars | In millions of dollars | 2006 | 2005 | 2006 | 2005 | In millions of dollars | 2007 | 2006 | ||||||||||||||
| Fair value hedges | Fair value hedges | Fair value hedges | ||||||||||||||||||||
| Hedge ineffectiveness recognized in earnings | $ | (2 | ) | $ | 176 | $ | 287 | $ | 149 | Hedge ineffectiveness recognized in earnings | $ | 17 | $ | 66 | ||||||||
| Net gain (loss) excluded from assessment of effectiveness | 69 | 231 | 194 | (45 | ) | Net gain excluded from assessment of effectiveness | 82 | 19 | ||||||||||||||
| Cash flow hedges | Cash flow hedges | Cash flow hedges | ||||||||||||||||||||
| Hedge ineffectiveness recognized in earnings | — | (2 | ) | (18 | ) | (13 | ) | Hedge ineffectiveness recognized in earnings | — | (10 | ) | |||||||||||
| Net gain excluded from assessment of effectiveness | — | — | — | 1 | Net gain excluded from assessment of effectiveness | — | — | |||||||||||||||
| Net investment hedges | Net investment hedges | Net investment hedges | ||||||||||||||||||||
| Net gain (loss) included in foreign currency translation adjustment within Accumulated other changes in equity from nonowner sources | $ | (178 | ) | $ | 35 | $ | (320 | ) | $ | 394 | Net loss included in foreign currency translation adjustment within Accumulated other comprehensive income (loss) | $ | (23 | ) | $ | (114 | ) | |||||
The change in Accumulated other changes in equity from nonowner sourcescomprehensive income (loss) from cash flow hedges for the three-three months ended March 31, 2007 and nine-month periods ended September 30, 2006 and 2005 can be summarized as follows (after-tax):
| In millions of dollars | 2006 | 2005 | 2007 | 2006 | ||||||||||
|---|---|---|---|---|---|---|---|---|---|---|---|---|---|---|
| Balance at January 1, | $ | 612 | $ | 173 | $ | (61 | ) | $ | 612 | |||||
| Net gain (loss) from cash flow hedges | 317 | 187 | (347 | ) | 317 | |||||||||
| Net amounts reclassified to earnings | (111 | ) | (23 | ) | (92 | ) | (111 | ) | ||||||
| Balance at March 31, | $ | 818 | $ | 337 | $ | (500 | ) | $ | 818 | |||||
| Net gain (loss) from cash flow hedges | 456 | (120 | ) | |||||||||||
| Net amounts reclassified to earnings | (151 | ) | (37 | ) | ||||||||||
| Balance at June 30, | $ | 1,123 | $ | 180 | ||||||||||
| Net gain (loss) from cash flow hedges | (1,088 | ) | 388 | |||||||||||
| Net amounts reclassified to earnings | (103 | ) | (98 | ) | ||||||||||
| Balance at September 30, | $ | (68 | ) | $ | 470 | |||||||||
Derivatives may expose Citigroup to market, credit or liquidity risks in excess of the amounts recorded on the Consolidated Balance Sheet. Market risk on a derivative product is the exposure created by potential fluctuations in interest rates, foreign exchange rates and other values, and is a function of the type of product, the volume of transactions, the tenor and terms of the agreement, and the underlying volatility. Credit risk is the exposure to loss in the event of nonperformance by the other party to the transaction where the value of any collateral held is not adequate to cover such losses. The recognition in earnings of unrealized gains on these transactions is subject to management's assessment as to collectibility. Liquidity risk is the potential exposure that arises when the size of the derivative position may not be able to be rapidly adjusted in periods of high volatility and financial stress at a reasonable cost.
16. Fair Value
See "Corporate Credit Portfolio"Effective January 1, 2007, the Company adopted SFAS 157 and SFAS 159. Both standards address aspects of the expanding application of fair value accounting.
Fair Value Measurements (SFAS 157)
SFAS 157 defines fair value, establishes a consistent framework for measuring fair value and expands disclosure requirements about fair value measurements. SFAS 157, among other things, requires the Company to maximize the use of observable inputs and minimize the use of unobservable inputs when measuring fair value. In addition, SFAS 157 precludes the use of block discounts when measuring the fair value of instruments traded in an active market, which were previously applied to large holdings of publicly traded equity securities. It also requires recognition of trade-date gains related to certain derivative transactions whose fair value has been determined using unobservable market inputs. This guidance supersedes the guidance in Emerging Issues Task Force Issue No. 02-3, "Issues Involved in Accounting for Derivative Contracts Held for Trading Purposes and Contracts Involved in Energy Trading and Risk Management Activities" (EITF Issue 02-3), which prohibited the recognition of trade-date gains for such derivative transactions when determining the fair value of instruments not traded in an active market. The cumulative effect of these two changes resulted in an increase to January 1, 2007 retained earnings of $75 million after-tax.
In moving to maximize the use of observable inputs as required by SFAS 157, the Company has made some amendments to the techniques used in measuring the fair value of derivative positions. These amendments change the way that the probability of default of a counterparty is factored into the valuation of derivative positions, include for the first time the impact of Citigroup's own credit standing, and also eliminate the portfolio servicing adjustment that is no longer necessary under SFAS 157. The cumulative effect of these amendments to derivative valuation techniques was a gain of $250 million after-tax $(402 million pretax) included in 2007 first quarter earnings, all of which was recorded in the Markets & Banking business.
The Company holds fixed income and equity securities, derivatives, investments in private equity, a limited number of loan portfolios and certain other financial instruments, which are carried at fair value. The Company determines fair value based upon quoted prices when available or through the use of alternative approaches, such as matrix or model pricing, when market quotes are not readily accessible or available. More specifically, for fixed income securities and derivatives, the Company's alternative approach when market prices are not available is to discount the expected cash flows using market interest rates commensurate with the credit quality and duration of the investment. There is no allowance for loan losses relating to loans carried at fair value.
The Company carries a number of its liabilities at fair value including certain structured notes and derivative liabilities. In determining the fair value of the Company's obligations, various factors are considered including: closing
exchange or over-the-counter market price quotations; time value and volatility factors underlying options, warrants, and
derivatives; price activity for equivalent or synthetic instruments; the potential impact on page 59market prices or fair value of liquidating the Company's positions in an orderly manner over a reasonable period of time under current market conditions, and Citigroup's own-credit standing.
These valuation techniques are based upon observable and unobservable inputs. Observable inputs reflect market data obtained from independent sources, while unobservable inputs reflect the Company's market assumptions. These two types of inputs create the following fair value hierarchy:
The following table presents for each of these hierarchy levels, the Company's assets and liabilities that are measured at fair value at March 31, 2007.
| In millions of dollars | Level 1 | Level 2 | Level 3 | Netting(1) | Net balance | |||||||||||
|---|---|---|---|---|---|---|---|---|---|---|---|---|---|---|---|---|
| Assets | ||||||||||||||||
| Federal funds sold and securities borrowed or purchased under agreements to resell(1) | $ | — | $ | 158,808 | $ | 16 | $ | (80,711 | ) | $ | 78,113 | |||||
| Trading account assets | ||||||||||||||||
| Trading securities | 174,885 | 203,369 | 35,345 | — | 413,599 | |||||||||||
| Derivatives | 6,796 | 257,551 | 6,635 | (224,516 | ) | 46,466 | ||||||||||
| Investments | 102,832 | 165,298 | 12,653 | — | 280,783 | |||||||||||
| Loans and leases(2) | — | 1,832 | — | — | 1,832 | |||||||||||
| Other financial assets | ||||||||||||||||
| Measured on a recurring basis | — | 4,456 | 8,919 | — | 13,375 | |||||||||||
| Measured on a non-recurring basis(3) | — | 12,612 | 3,568 | — | 16,180 | |||||||||||
| Liabilities | ||||||||||||||||
| Interest-bearing deposits | — | 1,947 | 107 | — | 2,054 | |||||||||||
| Federal funds purchased and securities loaned or sold under agreements to repurchase(1) | — | 255,387 | 6,278 | (80,819 | ) | 180,846 | ||||||||||
| Trading account liabilities | ||||||||||||||||
| Securities sold not yet purchased | 98,021 | 1,256 | 434 | — | 99,711 | |||||||||||
| Derivatives | 9,955 | 279,528 | 5,401 | (220,693 | ) | 74,191 | ||||||||||
| Short-term borrowings | — | 12,415 | 1,889 | — | 14,304 | |||||||||||
| Long-term debt | — | 29,888 | 1,349 | — | 31,237 | |||||||||||
| Other financial liabilities | ||||||||||||||||
| Measured on a recurring basis | — | 954 | 8 | — | 962 | |||||||||||
The following table presents the changes in the Level 3 fair value category for the three months ended March 31, 2007:
| | | Net realized/unrealized gains(losses) included in | | | | | |||||||||||||||||
|---|---|---|---|---|---|---|---|---|---|---|---|---|---|---|---|---|---|---|---|---|---|---|---|
| | | Transfers in and/or out of Level 3 | Purchases, issuances and settlements | | Unrealized gains (losses) still held(3) | ||||||||||||||||||
| In millions of dollars | Dec. 31, 2006 | Principal transactions | Other(1)(2) | March 31, 2007 | |||||||||||||||||||
| Assets | |||||||||||||||||||||||
| Securities purchased under agreements to resell | $ | 16 | $ | — | $ | — | $ | — | $ | — | $ | 16 | $ | — | |||||||||
| Trading account assets | |||||||||||||||||||||||
| Trading securities | 21,727 | 1,866 | 80 | 7,651 | 4,021 | 35,345 | 832 | ||||||||||||||||
| Derivatives (gross) | 9,136 | 4,884 | — | (3,385 | ) | (4,000 | ) | 6,635 | 4,014 | ||||||||||||||
| Investments | 11,468 | — | 183 | 580 | 422 | 12,653 | 27 | ||||||||||||||||
| Other financial assets | |||||||||||||||||||||||
| Measured on a recurring basis | 5,558 | — | 269 | (418 | ) | 3,510 | 8,919 | 265 | |||||||||||||||
Liabilities | |||||||||||||||||||||||
| Interest-bearing deposits | 60 | — | 1 | — | 46 | 107 | 2 | ||||||||||||||||
| Securities sold under agreements to repurchase | 6,350 | (72 | ) | — | — | (144 | ) | 6,278 | (72 | ) | |||||||||||||
| Trading account liabilities | |||||||||||||||||||||||
| Securities sold not yet purchased | 467 | (12 | ) | — | (2,285 | ) | 2,240 | 434 | (15 | ) | |||||||||||||
| Derivatives (gross) | 7,768 | (1,222 | ) | — | (3,778 | ) | 189 | 5,401 | (687 | ) | |||||||||||||
| Short-term borrowings | 397 | 8 | — | — | 1,500 | 1,889 | 2 | ||||||||||||||||
| Long-term debt | 1,693 | — | — | — | (344 | ) | 1,349 | — | |||||||||||||||
| Other financial liabilities measured on a recurring basis | — | — | — | — | 8 | 8 | — | ||||||||||||||||
Fair Value Option for Financial Assets and Financial Liabilities (SFAS 159)
On February 15, 2007, the FASB issued SFAS No. 159, "The Fair Value Option for Financial Assets and Financial Liabilities" (SFAS 159 or fair value option accounting). Under SFAS 159, the Company may elect to report most financial instruments and certain other items at fair value on an instrument-by-instrument basis with derivatives,changes in fair value reported in earnings. After the initial adoption, the election is made at the acquisition of an eligible financial asset, financial liability, or firm commitment or when certain specified reconsideration events occur. The fair value election may not be revoked once an election is made.
Additionally, the transition provisions of SFAS 159 permit a one-time election for existing positions at the adoption date with a cumulative-effect adjustment included in opening retained earnings and future changes in fair value reported in earnings.
Impact to retained earnings for certain fair value elections
Effective January 1, 2007, the Company early adopted SFAS 159 for certain eligible financial instruments. Detailed below are the December 31, 2006 carrying values prior to adoption, the transition adjustments booked to opening retained earnings and the fair values (that is, the carrying values at January 1, 2007 after adoption) for those items that were selected for fair value option accounting and that had an impact on retained earnings:
| In millions of dollars | December 31, 2006 (Carrying value prior to adoption) | Cumulative-effect Adjustment to January 1, 2007 Retained earnings-gain (loss) | January 1, 2007 Fair Value (Carrying value after adoption) | ||||||
|---|---|---|---|---|---|---|---|---|---|
| Legg Mason convertible preferred equity securities originally classified as available-for-sale(1) | $ | 797 | $ | (232 | ) | $ | 797 | ||
| Selected portfolios of securities purchased under agreements to resell | 167,525 | 25 | 167,550 | ||||||
| Selected portfolios of securities sold under agreements to repurchase | 237,788 | 40 | 237,748 | ||||||
| Selected non-collateralized short-term borrowings | 3,284 | (7 | ) | 3,291 | |||||
| Selected letters of credit hedged by credit default swaps or participation notes | — | 14 | 14 | ||||||
| Various miscellaneous eligible items(1) | 96 | 3 | 96 | ||||||
| Pretax cumulative effect of adopting fair value option accounting | $ | (157 | ) | ||||||
| After-tax cumulative effect of adopting fair value option accounting | $ | (99 | ) | ||||||
Additional information regarding each of these items follows.
Legg Mason convertible preferred equity securities
The Legg Mason convertible preferred equity securities (Legg shares) were acquired in connection with the sale of Citigroup's Asset Management business in December 2005. We hold these shares as a table presentingnon-strategic investment for long-term appreciation and, therefore, selected fair value option accounting in anticipation of the notionalsJanuary 2008 implementation of the proposed Investment Company Audit Guide Statement of Position, "Clarification of the Scope of Audit and receivables/ payables balancesAccounting GuideAudits of Investment Companies and Accounting by Parent Companies and Equity Method Investors for deriviative contractsInvestment Companies" (SOP).
Under the current investment company accounting model, investments held in investment company vehicles are recorded at full fair value and are not subject to consolidation guidelines. Under the proposed SOP, non-strategic investments not held in investment companies, which are deemed similar to non-strategic investments held in Citigroup's investment companies, must be accounted for tradingat full fair value in order for Citigroup to retain investment company accounting in the Company's Consolidated Financial Statements. If investment company accounting requirements cannot be met (for example, if we failed to account for similar non-strategic investments at fair value with changes in value recorded in earnings), Citigroup would be required to account for each investment in the investment company under other relevant accounting standards, including consolidation of majority-owned or controlled investees. We believe that Citigroup's consolidation of non-strategic investments would not provide meaningful information and asset/liability management hedging purposes.would confuse readers of our financial statements. Therefore, we have utilized the fair value option to migrate the Legg shares from available-for-sale (where changes in fair value are recorded in Accumulated other comprehensive income (loss)) to a full fair value model (where changes in value are recorded in earnings). On a prospective basis, as we acquire non-strategic public or private equity investments, we will consider electing fair value accounting for investments that are similar to those held in our investment companies.
Prior to the election of fair value option accounting, these shares were classified as available-for-sale securities with the unrealized loss of $232 million as of December 31, 2006 included in Accumulated other comprehensive income (loss). In connection with the Company's adoption of SFAS 159, this unrealized loss was recorded as a reduction of January 1, 2007 retained earnings as part of the cumulative-effect adjustment. We have no intention of selling the Legg shares prior to our previously estimated recovery period. The Legg shares are now included in Trading account assets on Citigroup's Consolidated Balance Sheet. The decrease in market value for the 2007 first quarter of $7 million pretax was reported with Principal transactions in the Company's Consolidated Statement of Income. Dividends are included in Interest revenue.
Selected portfolios of securities purchased under agreements to resell, securities sold under agreements to repurchase, and certain non-collateralized short-term borrowings
The Company has elected the fair value option for our United States and United Kingdom portfolios of fixed income securities purchased under agreements to resell, and fixed income securities sold under agreements to repurchase (and related non-collateralized short-term borrowings) because these positions are managed on a fair value basis. Specifically, related interest rate risk is managed on a portfolio basis, primarily with derivative instruments that are accounted for at fair value through earnings. Previously, these positions were accounted for on the accrual basis.
The cumulative effect of $58 million pretax ($37 million after-tax) from adopting the fair value option was recorded as an increase in the January 1, 2007 retained earnings balance. $25 million pretax of that cumulative effect related to
securities purchased under agreements to resell, while $40 million pretax related to securities sold under agreements to repurchase, offset by a reduction of $7 million pretax for non-collateralized short-term borrowings. The change in fair value for the first quarter of 2007, a $111 million pretax gain, was recorded in Principal transactions on the Company's Consolidated Statement of Income, $137 million gain related to securities purchased under agreement to resell, offset by a $23 million loss for securities sold under an agreement to repurchase, and a $3 million loss for related non-collateralized short-term borrowings.
The related interest income and interest expense are measured based on the contractual rates specified in the transactions and are reported as interest revenue and expense in the Consolidated Statement of Income.
The March 31, 2007 gross balance of $159 billion for securities purchased under agreements to resell and $262 billion for securities sold under agreements to repurchase are included in their respective accounts in the Consolidated Balance Sheet. Furthermore, uncollateralized short-term borrowings of $4 billion are recorded in that account in the Consolidated Balance Sheet.
Selected letters of credit and revolving loans hedged by credit default swaps or participation notes
The Company has elected fair value option accounting for certain letters of credit that are hedged with derivative instruments or participation notes. Upon electing the fair value option, the related portions of the allowance for loan losses and the allowance for unfunded lending commitments were reversed. Citigroup elected the fair value option for these transactions because the risk is managed on a fair value basis, and to mitigate accounting mismatches
The cumulative effect of $14 million pretax ($9 million after-tax) from adopting fair value option accounting was recorded as an increase in the January 1, 2007 retained earnings balance. The 2007 first quarter change in fair value for these items was a pretax gain of $1.7 million. This change in fair value as well as the receipt of related fees was reported as Principal transactions in the Company's Consolidated Statement of Income
The notional amount of these unfunded letters of credit was $1.9 billion as of March 31, 2007. The amount funded was insignificant and, accordingly, no amounts were 90 days past due or on non-accrual status at March 31, 2007.
These items have been classified in Trading account assets or Trading account liabilities on the Consolidated Balance Sheet.
Various miscellaneous eligible items
Several miscellaneous eligible items currently classified as available-for-sale securities were selected for fair value option accounting. These items were selected in preparation for the adoption of the Investment Company Audit Guide SOP, as discussed above.
Other items for which the fair value option was selected
The Company has elected fair value option for the following eligible items, which did not affect opening retained earnings but may impact future earnings:
Certain loan products
Citigroup has elected the fair value option for certain originated and purchased loans, including certain unfunded loan products, such as guarantees and letters of credit, executed by Citigroup's trading businesses. Significant groups of transactions include loans and unfunded loan products that will either be sold or securitized in the near term, or where the economic risks are hedged with derivative instruments. Citigroup has elected the fair value option to mitigate accounting mismatches in cases where hedge accounting is complex or inappropriate; to align accounting with the transaction's business purpose; and to achieve operational simplifications. Fair value was not elected for most lending transactions across the Company, including where those management objectives would not be met.
The balances for these loan products, which are classified with Trading account assets or Loans, were $15.7 billion and $1.1 billion as of March 31, 2007, respectively. The aggregate fair value exceeded the aggregate unpaid principal balance by $61 million as of March 31, 2007. $137 million of these loans were 90 days or more past due, while none were on a non-accrual basis. Upon electing the fair value option, the related portion of the Allowance for loan losses was reversed.
The change in fair value for the selected loans, which was a pretax gain of $247 million during the 2007 first quarter, was recorded in Principal transactions in the Company's Consolidated Statement of Income. $224 million related to those loans classified in Trading account assets and $23 million to those classified in Loans. $185 million of this gain was offset by fair value losses recognized with hedging derivatives, which were primarily total return swaps. Substantially all of the $224 million change in fair value related to loans in Trading account assets is considered to be related to specific credit risk as substantially all of the related loans are floating rate, while none of the $23 million change applicable to those loans classified as such related to specific credit risk.
Related interest income continues to be measured based on the contractual interest rates and reported as interest income on trading account assets or loans depending on their balance sheet classifications.
Certain investments in private equity and real estate ventures
Citigroup invests in private equity and real estate ventures for the purpose of earning investment returns and for capital appreciation. The Company has elected the fair value option for certain of these ventures in anticipation of the January 2008 implementation of the Investment Company Audit Guide SOP, because such investments are considered similar to many private equity or hedge fund activities in our investment companies, which are reported at full fair value. See discussion of the SOP above. The fair value option brings
consistency in the accounting and evaluation of certain of these investments. As required by SFAS 159, all investments (debt and equity) in such real estate entities are accounted for at fair value.
These investments, which totaled $288 million as of March 31, 2007, are classified as Investments on Citigroup's Consolidated Balance Sheet. Changes in the fair value of these investments during the 2007 first quarter were classified in Other revenue as a loss of $3 million in the Company's Consolidated Statement of Income.
Certain structured liabilities
The Company has elected the fair value option for certain structured liabilities whose performance is linked to structured interest rates, inflation or currency risks ("structured liabilities"), but do not qualify for the fair value election under SFAS 155. This election is applicable only to structured liabilities originated after January 1, 2007.
The Company has elected fair value option for structured liabilities, because these exposures are considered to be trading-related positions and, therefore, are managed on a fair value basis. These positions will continue to be classified as debt, deposits or derivatives according to their legal structure on the Company's Consolidated Balance Sheet. The outstanding balance for these structured liabilities accounted for under the fair value option, which are classified as long-term debt on the Consolidated Balance Sheet, is $199 million as of March 31, 2007.
The change in fair value for structured liabilities for which the fair value option has been elected was a pretax gain of $9 million during the 2007 first quarter. This gain was reported in Principal transactions in the Company's Consolidated Statement of Income.
Related interest expense continues to be measured based on the contractual interest rates and reported as such in the Consolidated Income Statement.
The difference between the aggregate fair value of structured liabilities for which the fair value option has been elected and the aggregate unpaid principal balance of such instruments is $9 million as of March 31, 2007.
Certain equity method investments
Citigroup adopted fair value accounting for various non-strategic investments in leveraged buyout funds and other hedge funds that previously were required to be accounted for under the equity method. Management elected fair value accounting to reduce operational and accounting complexity, in particular related to the expected implementation of the Investment Company Audit Guide SOP. Because the funds account for all of their underlying assets at full fair value, the impact of applying the equity method to Citigroup's investment in these funds was equivalent to fair value accounting (that is, the net investment in the funds reported on Citigroup's Consolidated Balance Sheet will result in equal fair values for the investment in the fund on the balance sheet. In addition, Citigroup's proportionate share of the net income or loss of each fund reported on Citigroup's Consolidated Statement of Income in each period as equity income recognized under the equity method will equal the mark-to-market earnings on the income statement under fair value accounting). Thus, the fair value election had no impact on opening retained earnings.
These fund investments, which totaled $961 million, are classified as Other Assets on the Consolidated Balance Sheet. Changes in fair value of these investments during the 2007 first quarter were classified in Other revenue as a pretax gain of $39 million in the Consolidated Statement of Income.
The Company provides a variety of guarantees and indemnifications to Citigroup customers to enhance their credit standing and enable them to complete a wide variety of business transactions. The following table summarizes at September 30, 2006March 31, 2007 and December 31, 20052006 all of the Company's guarantees and indemnifications, where management believes the guarantees and indemnifications are related to an asset, liability, or equity security of the guaranteed parties at the inception of the contract. The maximum potential amount of future payments represents the notional amounts that could be lost under the guarantees and indemnifications if there were a total default by the guaranteed parties, without consideration of possible recoveries under recourse provisions or from collateral held or pledged. Such amounts bear no relationship to the anticipated losses on these guarantees and indemnifications and greatly exceed anticipated losses.
The following tables present information about the Company's guarantees at September 30, 2006March 31, 2007 and December 31, 2005:2006:
| | Maximum Potential Amount of Future Payments | | ||||||||||
|---|---|---|---|---|---|---|---|---|---|---|---|---|
| In billions of dollars at September 30, except carrying value in millions | Expire Within 1 Year | Expire After 1 Year | Total Amount Outstanding | Carrying Value (in millions) | ||||||||
| 2006 | ||||||||||||
| Financial standby letters of credit | $ | 47.0 | $ | 23.4 | $ | 70.4 | $ | 180.2 | ||||
| Performance guarantees | 11.3 | 4.2 | 15.5 | 21.2 | ||||||||
| Derivative instruments | 46.7 | 749.1 | 795.8 | 15,261.1 | ||||||||
| Guarantees of collection of contractual cash flows(1) | — | — | — | — | ||||||||
| Loans sold with recourse | — | 1.4 | 1.4 | 56.2 | ||||||||
| Securities lending indemnifications(1) | 101.5 | — | 101.5 | — | ||||||||
| Credit card merchant processing(1) | 31.2 | — | 31.2 | — | ||||||||
| Custody indemnifications(1) | — | 49.0 | 49.0 | — | ||||||||
| Total | $ | 237.7 | $ | 827.1 | $ | 1,064.8 | $ | 15,518.7 | ||||
| | Maximum Potential Amount of Future Payments | | ||||||||||
|---|---|---|---|---|---|---|---|---|---|---|---|---|
| In billions of dollars at December 31, except carrying value in millions | Expire Within 1 Year | Expire After 1 Year | Total Amount Outstanding | Carrying Value (in millions) | ||||||||
| 2005 | ||||||||||||
| Financial standby letters of credit | $ | 30.6 | $ | 21.8 | $ | 52.4 | $ | 175.2 | ||||
| Performance guarantees | 10.0 | 3.9 | 13.9 | 18.2 | ||||||||
| Derivative instruments | 40.5 | 477.7 | 518.2 | 14,425.2 | ||||||||
| Guarantees of collection of contractual cash flows(1) | — | 0.1 | 0.1 | — | ||||||||
| Loans sold with recourse | — | 1.3 | 1.3 | 58.4 | ||||||||
| Securities lending indemnifications(1) | 68.4 | — | 68.4 | — | ||||||||
| Credit card merchant processing(1) | 28.1 | — | 28.1 | — | ||||||||
| Custody indemnifications(1) | — | 27.0 | 27.0 | — | ||||||||
| Total | $ | 177.6 | $ | 531.8 | $ | 709.4 | $ | 14,677.0 | ||||
| | Maximum Potential Amount of Future Payments | | ||||||||||
|---|---|---|---|---|---|---|---|---|---|---|---|---|
| In billions of dollars at March 31, except carrying value in millions | Expire Within 1 Year | Expire After 1 Year | Total Amount Outstanding | Carrying Value (in millions) | ||||||||
| 2007 | ||||||||||||
| Financial standby letters of credit | $ | 57.9 | $ | 25.7 | $ | 83.6 | $ | 117.4 | ||||
| Performance guarantees | 11.3 | 4.6 | 15.9 | 47.5 | ||||||||
| Derivative instruments | 29.8 | 982.7 | 1,012 | 21,630 | ||||||||
| Loans sold with recourse | — | 1.6 | 1.6 | 50.9 | ||||||||
| Securities lending indemnifications(1) | 144.2 | — | 144.2 | — | ||||||||
| Credit card merchant processing(1) | 54.2 | — | 54.2 | — | ||||||||
| Custody indemnifications(1) | — | 55.6 | 55.6 | — | ||||||||
| Total | $ | 297.4 | $ | 1,070.2 | $ | 1,367.6 | $ | 21,845.8 | ||||
| | Maximum Potential Amount of Future Payments | | ||||||||||
|---|---|---|---|---|---|---|---|---|---|---|---|---|
| In billions of dollars at December 31, except carrying value in millions | Expire Within 1 Year | Expire After 1 Year | Total Amount Outstanding | Carrying Value (in millions) | ||||||||
| 2006 | ||||||||||||
| Financial standby letters of credit(2) | $ | 46.7 | $ | 25.8 | $ | 72.5 | $ | 179.3 | ||||
| Performance guarantees(2) | 11.2 | 4.6 | 15.8 | 47.2 | ||||||||
| Derivative instruments | 42.0 | 916.6 | 958.6 | 16,836.0 | ||||||||
| Loans sold with recourse | — | 1.6 | 1.6 | 51.9 | ||||||||
| Securities lending indemnifications(1) | 110.7 | — | 110.7 | — | ||||||||
| Credit card merchant processing(1) | 52.3 | — | 52.3 | — | ||||||||
| Custody indemnifications(1) | — | 54.4 | 54.4 | — | ||||||||
| Total | $ | 262.9 | $ | 1,003.0 | $ | 1,265.9 | $ | 17,114.4 | ||||
Financial standby letters of credit include guarantees of payment of insurance premiums and reinsurance risks that support industrial revenue bond underwriting and settlement of payment obligations to clearing houses, and that support options and purchases of securities or in lieu of escrow deposit accounts. Financial standbys also backstop loans, credit facilities, promissory notes and trade acceptances. Performance guarantees and letters of credit are issued to guarantee a customer's tender bid on a construction or systems installation project or to guarantee completion of such projects in accordance with contract terms. They are also issued to support a customer's obligation to supply specified products, commodities, or maintenance or warranty services to a third party.
Derivative instruments include credit default swaps, total return swaps, written foreign exchange options, written put options, and written equity warrants. Guarantees of collection of contractual cash flows protect investors in credit card receivables securitization trusts from loss of interest relating to insufficient collections on the underlying receivables in the trusts. Loans sold with recourse represent the Company's obligations to reimburse the buyers for loan losses under certain circumstances. Securities lending indemnifications are issued to guarantee that a securities lending customer will be made whole in the event that the security borrower does not return the security subject to the lending agreement and collateral held is insufficient to cover the market value of the security. Credit card merchant processing guarantees represent the Company's indirect obligations in connection with the processing of private label and bankcard transactions on behalf of merchants. Custody indemnifications are issued to guarantee that custody clients will be made whole in the event that a third-party subcustodian fails to safeguard clients' assets. Beginning with the 2006 third quarter, the scope of the custody indemnifications was broadened to cover all clients' assets held by third-party subcustodians.
At September 30, 2006 and December 31, 2005, the Company's maximum potential amount of future payments under these guarantees was approximately $1.1 trillion and $709 billion, respectively. For this purpose, the maximum potential amount of future payments is considered to be the notional amounts of letters of credit, guarantees, written credit default swaps, written total return swaps, indemnifications, and recourse provisions of loans sold with recourse, and the fair values of foreign exchange options and other written put options, warrants, caps and floors.
Citigroup's primary credit card business is the issuance of credit cards to individuals. In addition, the Company provides transaction processing services to various merchants with respect to bankcard and private label cards. In the third quarter of 2005, the Company entered into a partnership under which a third party processes bankcard transactions. As a result, in the event of a billing dispute with respect to a bankcard transaction between a merchant and a cardholder, that is ultimately resolved in the cardholder's favor, the third party holds the primary
contingent liability to credit or refund the amount to the cardholder and charge back the transaction to the merchant. If the third party is unable to collect this amount from the merchant, it bears the loss for the amount of the credit or refund paid to the cardholder.
The Company continues to have the primary contingent liability with respect to its portfolio of private label merchants. The risk of loss is mitigated as the cash flows between the third party or the Company and the merchant are settled on a net basis and the third party or the Company has the right to offset any payments with cash flows otherwise due to the merchant. To further mitigate this risk, the third party or the Company may require a merchant to make an escrow deposit, delay settlement, or include event triggers to provide the third party or the Company with more financial and operational control in the event of the financial deterioration of the merchant, or require various credit enhancements (including letters of credit and bank guarantees). In the unlikely event that a private label merchant is unable to deliver products, services or a refund to its private label cardholders, Citigroup is contingently liable to credit or refund cardholders. In addition, although a third party holds the primary contingent liability with respect to the processing of bankcard transactions, in the event that the third party does not have sufficient collateral from the merchant or sufficient financial resources of its own to provide the credit or refunds to the cardholders, Citigroup would be liable to credit or refund the cardholders.
The Company's maximum potential contingent liability related to both bankcard and private label merchant processing services is estimated to be the total volume of credit card transactions that meet the requirements to be valid chargeback transactions at any given time. At September 30, 2006March 31, 2007 and December 31, 2005,2006, this maximum potential exposure was estimated to be $31$54 billion and $28$52 billion, respectively.
However, the Company believes that the maximum exposure is not representative of the actual potential loss exposure, based on the Company's historical experience and its position as a secondary guarantor (in the case of bankcards). In most cases, this contingent liability is unlikely to arise, as most products and services are delivered when purchased and amounts are refunded when items are returned to merchants. The Company assesses the probability and amount of its contingent liability related to merchant processing based on the financial strength of the primary guarantor (in the case of bankcards) and the extent and nature of unresolved chargebacks and its historical loss experience. At September 30, 2006March 31, 2007 and December 31, 2005,2006, the estimated losses incurred and the carrying amounts of the Company's contingent obligations related to merchant processing activities were immaterial.
In addition, the Company, through its credit card business, provides various cardholder protection programs on several of its card products, including programs that provide insurance coverage for rental cars, coverage for certain losses associated with purchased products, price protection for certain purchases and protection for lost luggage. These guarantees are not included in the table above, since the total outstanding amount of the guarantees and the Company's maximum exposure to loss cannot be quantified. The protection is limited to certain types of purchases and certain types of losses and it is not possible to quantify the purchases that would qualify for these benefits at any given time. Actual losses related to these programs were not material during the third quarterfirst quarters of 20062007 and 2005.2006. The Company assesses the probability and amount of its potential liability related to these programs based on the extent and nature of its historical loss experience. At September 30, 2006,March 31, 2007, the estimated losses incurred and the carrying value of the Company's obligations related to these programs were immaterial.
In the normal course of business, the Company provides standard representations and warranties to counterparties in contracts in connection with numerous transactions and also provides indemnifications that protect the counterparties to the contracts in the event that additional taxes are owed due either to a change in the tax law or an adverse interpretation of the tax law. Counterparties to these transactions provide the Company with comparable indemnifications. While such representations, warranties and tax indemnifications are essential components of many contractual relationships, they do not represent the underlying business purpose for the transactions. The indemnification clauses are often standard contractual terms related to the Company's own performance under the terms of a contract and are entered into in the normal course of business based on an assessment that the risk of loss is remote. Often these clauses are intended to ensure that terms of a contract are met at inception (for example, that loans transferred to a counterparty in a sales transaction did in fact meet the conditions specified in the contract at the transfer date). No compensation is received for these standard representations and warranties, and it is not possible to determine their fair value because they rarely, if ever, result in a payment. In many cases, there are no stated or notional amounts included in the indemnification clauses and the contingencies potentially triggering the obligation to indemnify have not occurred and are not expected to occur. There are no amounts reflected on the Consolidated Balance Sheet as of September 30, 2006March 31, 2007 and December 31, 2005,2006, related to these indemnifications and they are not included in the table above.
In addition, the Company is a member of or shareholder in hundreds of value transfer networks (VTNs) (payment, clearing and settlement systems as well as securities exchanges) around the world. As a condition of membership, many of these VTNs require that members stand ready to
backstop the net effect on the VTNs of a member's default on its obligations. The Company's potential obligations as a shareholder or member of VTN associations are excluded from the scope of FIN 45, since the shareholders and members represent subordinated classes of investors in the VTNs. Accordingly, the Company's participation in VTNs is not reported in the table above and there are no amounts reflected on the Consolidated Balance Sheet as of September 30, 2006March 31, 2007 or December 31, 20052006 for potential obligations that could arise from the Company's involvement with VTN associations.
At September 30, 2006March 31, 2007 and December 31, 2005,2006, the carrying amounts of the liabilities related to the guarantees and indemnifications included in the table above amounted to approximately $16$22 billion and $15$17 billion, respectively. The carrying value of derivative instruments is included in either trading liabilities or other liabilities, depending upon whether the derivative was entered into for trading or non-trading purposes. The carrying value of financial and performance guarantees is included in other liabilities. For loans sold with
recourse, the carrying value of the liability is included in other liabilities. In addition, at September 30, 2006March 31, 2007 and December 31, 2005,2006, other liabilities on the Consolidated Balance Sheet include an allowance for credit losses of $1.1 billion, and $850 million, respectively, relating to letters of credit and unfunded lending commitments.
In addition to the collateral available in respect of the credit card merchant processing contingent liability discussed above, the Company has collateral available to reimburse potential losses on its other guarantees. Cash collateral available to the Company to reimburse losses realized under these guarantees and indemnifications amounted to $79$105 billion and $55$92 billion at September 30, 2006March 31, 2007 and December 31, 2005,2006, respectively. Securities and other marketable assets held as collateral amounted to $39$55 billion and $24$42 billion and letters of credit in favor of the Company held as collateral amounted to $42$160 million and $681$142 million at September 30, 2006March 31, 2007 and December 31, 2005,2006, respectively. Other property may also be available to the Company to cover losses under certain guarantees and indemnifications; however, the value of such property has not been determined.
18. Contingencies
As described in the "Legal Proceedings" discussion on page 131,122, the Company ishas been a defendant in numerous lawsuits and other legal proceedings arising out of alleged misconduct in connection with:
�� As of September 30, 2006,March 31, 2007, the Company's litigation reserve for these matters, net of amounts previously paid or not yet paid but committed to be paid in connection with the Enron class action settlement and other settlements arising out of these matters, was approximately $3.2 billion.
The Company believes that this reserve is adequate to meet all of its remaining exposure for these matters. However, in view of the large number of these matters, the uncertainties of the timing and outcome of this type of litigation, the novel issues presented, and the significant amounts involved, it is possible that the ultimate costs of these matters may exceed or be below the reserve. The Company will continue to defend itself vigorously in these cases, and seek to resolve them in the manner management believes is in the best interests of the Company.
In addition, in the ordinary course of business, Citigroup and its subsidiaries are defendants or co-defendants or parties in various litigation and regulatory matters incidental to and typical of the businesses in which they are engaged. In the opinion of the Company's management, the ultimate resolution of these legal and regulatory proceedings would not be likely to have a material adverse effect on the consolidated financial condition of the Company but, if involving monetary liability, may be material to the Company's operating results for any particular period.
19. Citibank, N.A. and Subsidiaries
Statement of Changes in Stockholder's Equity
| | Nine Months Ended September 30, | Three Months Ended March 31, | ||||||||||||
|---|---|---|---|---|---|---|---|---|---|---|---|---|---|---|
| In millions of dollars, except shares | 2006 | 2005 | 2007 | 2006(1) | ||||||||||
| Preferred stock ($100 par value) | ||||||||||||||
| Balance, beginning of period | $ | — | $ | 1,950 | ||||||||||
| Redemption or retirement of preferred stock | — | — | ||||||||||||
| Common stock ($20 par value) | ||||||||||||||
| Balance, beginning of period — Shares: 37,534,553 in 2007 and 2006 | $ | 751 | $ | 751 | ||||||||||
| Balance, end of period | $ | — | $ | 1,950 | ||||||||||
| Common stock ($20 par value) | ||||||||||||||
| Balance, beginning of period—Shares: 37,534,553 in 2006 and 2005 | $ | 751 | $ | 751 | ||||||||||
| Balance, end of period—Shares: 37,534,553 in 2006 and 2005 | $ | 751 | $ | 751 | ||||||||||
| Balance, end of period — Shares: 37,534,553 in 2007 and 2006 | $ | 751 | $ | 751 | ||||||||||
| Surplus | ||||||||||||||
| Balance, beginning of period | $ | 27,244 | $ | 25,972 | $ | 43,753 | $ | 37,978 | ||||||
| Capital contribution from parent company | 3 | — | 2,030 | 170 | ||||||||||
| Employee benefit plans | 114 | 127 | 11 | 36 | ||||||||||
| Other | 6 | 63 | — | 4 | ||||||||||
| Balance, end of period | $ | 27,367 | $ | 26,162 | $ | 45,794 | $ | 38,188 | ||||||
| Retained earnings | ||||||||||||||
| Balance, beginning of period | $ | 30,651 | $ | 25,935 | $ | 30,358 | $ | 24,062 | ||||||
| Adjustment to opening balance, net of tax(2) | (96 | ) | — | |||||||||||
| Adjusted balance, beginning of period | $ | 30,262 | $ | 24,062 | ||||||||||
| Net income | 7,579 | 6,795 | 2,155 | 2,632 | ||||||||||
| Dividends paid | (2,628 | ) | (4,028 | ) | (18 | ) | (1,308 | ) | ||||||
| Balance, end of period | $ | 35,602 | $ | 28,702 | $ | 32,399 | $ | 25,386 | ||||||
| Accumulated other changes in equity from nonowner sources | ||||||||||||||
| Accumulated other comprehensive income (loss) | ||||||||||||||
| Balance, beginning of period | $ | (2,382 | ) | $ | (467 | ) | $ | (1,709 | ) | $ | (2,550 | ) | ||
| Adjustment to opening balance, net of tax(3) | (1 | ) | — | |||||||||||
| Adjusted balance, beginning of period | $ | (1,710 | ) | $ | (2,550 | ) | ||||||||
| Net change in unrealized gains (losses) on investment securities, available-for-sale, net of tax | 137 | (401 | ) | 130 | (130 | ) | ||||||||
| Net change in foreign currency translation adjustment, net of tax | 1,158 | (1,243 | ) | 141 | 313 | |||||||||
| Net change for cash flow hedges, net of tax | (234 | ) | 145 | (270 | ) | 144 | ||||||||
| Minimum pension liability adjustment, net of tax | (2 | ) | (64 | ) | ||||||||||
| Pension liability adjustment, net of tax | 67 | 4 | ||||||||||||
| Net change in Accumulated other comprehensive income | $ | 68 | $ | 331 | ||||||||||
| Balance, end of period | $ | (1,323 | ) | $ | (2,030 | ) | ($ | 1,642 | ) | ($ | 2,219 | ) | ||
| Total stockholder's equity | ||||||||||||||
| Balance, beginning of period | $ | 56,264 | $ | 54,141 | $ | 73,153 | $ | 60,241 | ||||||
| Changes during the year, net | 6,133 | 1,394 | ||||||||||||
| Adjustment to opening balance, net of tax(2) (3) | (97 | ) | — | |||||||||||
| Adjusted balance, beginning of period | $ | 73,056 | $ | 60,241 | ||||||||||
| Changes during the period, net | 4,246 | 1,865 | ||||||||||||
| Balance, end of period | $ | 62,397 | $ | 55,535 | $ | 77,302 | $ | 62,106 | ||||||
| Summary of changes in equity from nonowner sources | ||||||||||||||
| Comprehensive income | ||||||||||||||
| Net income | $ | 7,579 | $ | 6,795 | $ | 2,155 | $ | 2,632 | ||||||
| Other changes in equity from nonowner sources, net of tax | 1,059 | (1,563 | ) | |||||||||||
| Net change in Accumulated other comprehensive income (loss) | 68 | 331 | ||||||||||||
| Total changes in equity from nonowner sources | $ | 8,638 | $ | 5,232 | ||||||||||
| Total comprehensive income | $ | 2,223 | $ | 2,963 | ||||||||||
See Note 1 and Note 16 on pages 85 and 105, respectively.
20. Condensed Consolidating Financial Statement Schedules
These condensed consolidating financial statement schedules are presented for purposes of additional analysis but should be considered in relation to the consolidated financial statements of Citigroup taken as a whole.
Bank Consolidation Project
InDuring 2006, Citigroup began and completed a majority of its bank consolidation project, which called for the merger of its 12 U.S.-insured depository institutions into four, as well as the reorganization of its U.S. mortgage banking business. The first phase of this project was completed in July 2006, when CitiFinancial Credit Company (CCC), an indirect wholly owned subsidiary of Citigroup, transferred its ownership of Citicorp Trust Bank, Federal Savings Bankfsb to Citigroup. This transfer was part of the Company's overall plan to consolidate its twelve U.S.-insured depository institutions into four, as well as to reorganize its U.S. mortgage business. InThe second phase occurred in October 2006, when Citigroup reduced theits overall number of U.S.-insured depository institutions from twelve to five. Also during this phase, Citibank, N.A. transferred its investment in Citibank (South Dakota), N.A. (the Company's primary banking entity responsible for U.S. credit card activities) to Citigroup. In addition, a majority of the Company's U.S. consumer mortgage lending activity was consolidated within Citibank, N.A. as Citibank (West), FSB, Citibank Texas, N.A., Citibank, FSB and Citibank Delaware were merged into Citibank, N.A. The final phase of this consolidation project is expected to be completed in 2007.
Merger of Bank Holding Companies
In August 2005, Citigroup merged its two intermediate bank holding companies, Citigroup Holdings Company and Citicorp, into Citigroup Inc. Coincident with this merger, Citigroup assumed all existing indebtedness and outstanding guarantees of Citicorp.
During the 2005 second quarter, Citigroup consolidated its capital markets funding activities into two legal entities:
As part of the funding consolidation, Citigroup also guaranteed and continues to guarantee various debt obligations of Citigroup Global Markets Holdings Inc. (CGMHI) as well as all of the outstanding debt obligations under CGMHI's publicly-issued securities. CGMHI no longer files periodic reportslater date with the SEC and continues to be rated on the basismerger of a guarantee of its financial obligations by Citigroup.Citibank (Banamex USA) into Citibank, N.A.
The condensed financial statements on pages 123 -130, which were restated, where applicable, to reflect the above reorganizations, include the financial results of the following Citigroup entities:
Citigroup Parent Company
The holding company, Citigroup Inc.
Citigroup Global Markets Holdings Inc. (CGMHI)
Citigroup guarantees various debt obligations of CGMHI as well as all of the outstanding debt obligations under CGMHI's publicly-issued debt.
Citigroup Funding Inc. (CFI)
CFI is a first-tier subsidiary of Citigroup, which issues commercial paper, medium-term notes and structured equity-linked and credit-linked notes, all of which are guaranteed by Citigroup.
CitiFinancial Credit Company (CCC)
An indirect wholly owned subsidiary of Citigroup. CCC is a wholly owned subsidiary of Associates. Citigroup has issued a full and unconditional guarantee of the outstanding indebtedness of CCC.
Associates First Capital Corporation (Associates)
A wholly owned subsidiary of Citigroup. Citigroup has issued a full and unconditional guarantee of the outstanding long-term debt securities and commercial paper of Associates. In addition, Citigroup guaranteed various debt obligations of Citigroup Finance Canada Inc. (CFCI), a wholly owned subsidiary of Associates. CFCI continues to issue debt in the Canadian market supported by a Citigroup guarantee. Associates is the immediate parent company of CCC.
Other Citigroup Subsidiaries
Includes all other subsidiaries of Citigroup, intercompany eliminations, and income/loss from discontinued operations.
Consolidating Adjustments
Includes Citigroup parent company elimination of distributed and undistributed income of subsidiaries, investment in subsidiaries and the elimination of CCC, which is included in the Associates column.
CONDENSED CONSOLIDATING STATEMENT OF INCOME
| | Three Months Ended September 30, 2006 | |||||||||||||||||||||||
|---|---|---|---|---|---|---|---|---|---|---|---|---|---|---|---|---|---|---|---|---|---|---|---|---|
| In millions of dollars | Citigroup parent company | CGMHI | CFI | CCC | Associates | Other Citigroup subsidiaries, eliminations and income from discontinued operations | Consolidating adjustments | Citigroup Consolidated | ||||||||||||||||
| Revenues | ||||||||||||||||||||||||
| Dividends from subsidiary banks and bank holding companies | $ | 5,202 | $ | — | $ | — | $ | — | $ | — | $ | — | $ | (5,202 | ) | $ | — | |||||||
Interest revenue | $ | 132 | $ | 5,847 | $ | — | $ | 1,518 | $ | 1,800 | $ | 16,950 | $ | (1,518 | ) | $ | 24,729 | |||||||
| Interest revenue—intercompany | 1,096 | 136 | 892 | 54 | 121 | (2,245 | ) | (54 | ) | — | ||||||||||||||
| Interest expense | 1,537 | 4,827 | 593 | 45 | 182 | 7,762 | (45 | ) | 14,901 | |||||||||||||||
| Interest expense—intercompany | 2 | 767 | 210 | 480 | 673 | (1,652 | ) | (480 | ) | — | ||||||||||||||
| Net interest revenue | $ | (311 | ) | $ | 389 | $ | 89 | $ | 1,047 | $ | 1,066 | $ | 8,595 | $ | (1,047 | ) | $ | 9,828 | ||||||
Commissions and fees | $ | — | $ | 2,239 | $ | — | $ | 17 | $ | 39 | $ | 1,729 | $ | (17 | ) | $ | 4,007 | |||||||
| Commissions and fees—intercompany | — | 89 | — | 13 | 12 | (101 | ) | (13 | ) | — | ||||||||||||||
| Principal transactions | (8 | ) | 2,127 | (106 | ) | — | 1 | (87 | ) | — | 1,927 | |||||||||||||
| Principal transactions—intercompany | (30 | ) | (1,166 | ) | 69 | — | — | 1,127 | — | — | ||||||||||||||
| Other income | (29 | ) | 584 | (63 | ) | 108 | 159 | 5,009 | (108 | ) | 5,660 | |||||||||||||
| Other income—intercompany | 17 | 546 | 84 | 6 | 6 | (653 | ) | (6 | ) | — | ||||||||||||||
| Total non-interest revenues | $ | (50 | ) | $ | 4,419 | $ | (16 | ) | $ | 144 | $ | 217 | $ | 7,024 | $ | (144 | ) | $ | 11,594 | |||||
| Total revenues, net of interest expense | $ | 4,841 | $ | 4,808 | $ | 73 | $ | 1,191 | $ | 1,283 | $ | 15,619 | $ | (6,393 | ) | $ | 21,422 | |||||||
Provisions for credit losses and for benefits and claims | $ | — | $ | 6 | $ | — | $ | 294 | $ | 350 | $ | 1,761 | $ | (294 | ) | $ | 2,117 | |||||||
Expenses | ||||||||||||||||||||||||
| Compensation and benefits | $ | 29 | $ | 2,232 | $ | — | $ | 195 | $ | 247 | $ | 4,210 | $ | (195 | ) | $ | 6,718 | |||||||
| Compensation and benefits—intercompany | 2 | 1 | — | 32 | 33 | (36 | ) | (32 | ) | — | ||||||||||||||
| Other expense | 38 | 829 | — | 126 | 175 | 4,176 | (126 | ) | 5,218 | |||||||||||||||
| Other expense—intercompany | 44 | 396 | 18 | 44 | 61 | (519 | ) | (44 | ) | — | ||||||||||||||
| Total operating expenses | $ | 113 | $ | 3,458 | $ | 18 | $ | 397 | $ | 516 | $ | 7,831 | $ | (397 | ) | $ | 11,936 | |||||||
| Income from continuing operations before taxes, minority interest and equity in undistributed income of subsidiaries | $ | 4,728 | $ | 1,344 | $ | 55 | $ | 500 | $ | 417 | $ | 6,027 | $ | (5,702 | ) | $ | 7,369 | |||||||
| Income taxes (benefits) | (189 | ) | 415 | 20 | 185 | 149 | 1,625 | (185 | ) | 2,020 | ||||||||||||||
| Minority interest, net of taxes | — | — | — | — | — | 46 | — | 46 | ||||||||||||||||
| Equities in undistributed income of subsidiaries | 588 | — | — | — | — | — | (588 | ) | — | |||||||||||||||
| Income from continuing operations | $ | 5,505 | $ | 929 | $ | 35 | $ | 315 | $ | 268 | $ | 4,356 | $ | (6,105 | ) | $ | 5,303 | |||||||
Income from discontinued operations, net of taxes | — | 69 | — | — | — | 133 | — | 202 | ||||||||||||||||
| Net income | $ | 5,505 | $ | 998 | $ | 35 | $ | 315 | $ | 268 | $ | 4,489 | $ | (6,105 | ) | $ | 5,505 | |||||||
CONDENSED CONSOLIDATING STATEMENT OF INCOME
| | Three Months Ended September 30, 2005 | Three Months Ended March 31, 2007 | ||||||||||||||||||||||||||||||||||||||||||||||
|---|---|---|---|---|---|---|---|---|---|---|---|---|---|---|---|---|---|---|---|---|---|---|---|---|---|---|---|---|---|---|---|---|---|---|---|---|---|---|---|---|---|---|---|---|---|---|---|---|
| In millions of dollars | Citigroup parent company | CGMHI | CFI | CCC | Associates | Other Citigroup subsidiaries, eliminations and income from discontinued operations | Consolidating adjustments | Citigroup Consolidated | Citigroup parent company | CGMHI | CFI | CCC | Associates | Other Citigroup subsidiaries, eliminations and income from discontinued operations | Consolidating adjustments | Citigroup Consolidated | ||||||||||||||||||||||||||||||||
| Revenues | ||||||||||||||||||||||||||||||||||||||||||||||||
| Dividends from subsidiary banks and bank holding companies | $ | 10,989 | $ | — | $ | — | $ | — | $ | — | $ | — | $ | (10,989 | ) | $ | — | $ | 2,805 | $ | — | $ | — | $ | — | $ | — | $ | — | $ | (2,805 | ) | $ | — | ||||||||||||||
Interest revenue | $ | 84 | $ | 4,242 | $ | — | $ | 1,402 | $ | 1,671 | $ | 13,347 | $ | (1,402 | ) | $ | 19,344 | 97 | 7,282 | — | 1,524 | 1,791 | 18,962 | (1,524 | ) | 28,132 | ||||||||||||||||||||||
| Interest revenue—intercompany | 764 | 113 | 257 | (25 | ) | 60 | (1,194 | ) | 25 | — | 1,284 | 295 | 1,245 | 37 | 123 | (2,947 | ) | (37 | ) | — | ||||||||||||||||||||||||||||
| Interest expense | 1,032 | 3,374 | 166 | 49 | 157 | 4,920 | (49 | ) | 9,649 | 1,790 | 5,722 | 891 | 46 | 181 | 8,978 | (46 | ) | 17,562 | ||||||||||||||||||||||||||||||
| Interest expense—intercompany | — | 243 | 91 | 333 | 449 | (783 | ) | (333 | ) | — | (13 | ) | 1,170 | 191 | 496 | 660 | (2,008 | ) | (496 | ) | — | |||||||||||||||||||||||||||
| Net interest revenue | $ | (184 | ) | $ | 738 | $ | — | $ | 995 | $ | 1,125 | $ | 8,016 | $ | (995 | ) | $ | 9,695 | $ | (396 | ) | $ | 685 | $ | 163 | $ | 1,019 | $ | 1,073 | $ | 9,045 | $ | (1,019 | ) | $ | 10,570 | ||||||||||||
Commissions and fees | $ | — | $ | 2,123 | $ | — | $ | — | $ | 12 | $ | 2,690 | $ | — | $ | 4,825 | $ | — | $ | 3,018 | $ | — | $ | 18 | $ | 41 | $ | 2,714 | $ | (18 | ) | $ | 5,773 | |||||||||||||||
| Commissions and fees—intercompany | — | 72 | — | 7 | 7 | (79 | ) | (7 | ) | — | — | 25 | — | 5 | 5 | (30 | ) | (5 | ) | — | ||||||||||||||||||||||||||||
| Principal transactions | (12 | ) | 380 | (46 | ) | — | — | 1,628 | — | 1,950 | 6 | 895 | (128 | ) | — | — | 2,224 | — | 2,997 | |||||||||||||||||||||||||||||
| Principal transactions—intercompany | 23 | 522 | 43 | — | — | (588 | ) | — | — | 3 | 112 | 1 | — | — | (116 | ) | — | — | ||||||||||||||||||||||||||||||
| Other income | 26 | 825 | 20 | 118 | 138 | 4,019 | (118 | ) | 5,028 | 26 | 1,120 | 52 | 107 | 146 | 4,775 | (107 | ) | 6,119 | ||||||||||||||||||||||||||||||
| Other income—intercompany | 16 | 42 | (21 | ) | 4 | 6 | (43 | ) | (4 | ) | — | 41 | 382 | (44 | ) | 7 | (16 | ) | (363 | ) | (7 | ) | — | |||||||||||||||||||||||||
| Total non-interest revenues | $ | 53 | $ | 3,964 | $ | (4 | ) | $ | 129 | $ | 163 | $ | 7,627 | $ | (129 | ) | $ | 11,803 | $ | 76 | $ | 5,552 | $ | (119 | ) | $ | 137 | $ | 176 | $ | 9,204 | $ | (137 | ) | $ | 14,889 | ||||||||||||
| Total revenues, net of interest expense | $ | 10,858 | $ | 4,702 | $ | (4 | ) | $ | 1,124 | $ | 1,288 | $ | 15,643 | $ | (12,113 | ) | $ | 21,498 | $ | 2,485 | $ | 6,237 | $ | 44 | $ | 1,156 | $ | 1,249 | $ | 18,249 | $ | (3,961 | ) | $ | 25,459 | |||||||||||||
Provisions for credit losses and for benefits and claims | $ | — | $ | 16 | $ | — | $ | 512 | $ | 569 | $ | 2,255 | $ | (512 | ) | $ | 2,840 | $ | — | $ | 7 | $ | — | $ | 426 | $ | 478 | $ | 2,482 | $ | (426 | ) | $ | 2,967 | ||||||||||||||
Expenses | ||||||||||||||||||||||||||||||||||||||||||||||||
| Compensation and benefits | $ | 25 | $ | 2,660 | $ | — | $ | 182 | $ | 216 | $ | 3,891 | $ | (182 | ) | $ | 6,792 | $ | 21 | $ | 3,613 | $ | — | $ | 160 | $ | 214 | $ | 4,851 | $ | (160 | ) | $ | 8,699 | ||||||||||||||
| Compensation and benefits—intercompany | 2 | 3 | — | 32 | 34 | (39 | ) | (32 | ) | — | 2 | — | — | 40 | 41 | (43 | ) | (40 | ) | — | ||||||||||||||||||||||||||||
| Other expense | 50 | 661 | 1 | 123 | 155 | 3,754 | (123 | ) | 4,621 | 114 | 988 | — | 155 | 206 | 5,564 | (155 | ) | 6,872 | ||||||||||||||||||||||||||||||
| Other expense—intercompany | 27 | 323 | 3 | 46 | 67 | (420 | ) | (46 | ) | — | 26 | 425 | 21 | 77 | 95 | (567 | ) | (77 | ) | — | ||||||||||||||||||||||||||||
| Total operating expenses | $ | 104 | $ | 3,647 | $ | 4 | $ | 383 | $ | 472 | $ | 7,186 | $ | (383 | ) | $ | 11,413 | $ | 163 | $ | 5,026 | $ | 21 | $ | 432 | $ | 556 | $ | 9,805 | $ | (432 | ) | $ | 15,571 | ||||||||||||||
Income from continuing operations before taxes, minority interest and equity in undistributed income of subsidiaries | $ | 10,754 | $ | 1,039 | $ | (8 | ) | $ | 229 | $ | 247 | $ | 6,202 | $ | (11,218 | ) | $ | 7,245 | $ | 2,322 | $ | 1,204 | $ | 23 | $ | 298 | $ | 215 | $ | 5,962 | $ | (3,103 | ) | $ | 6,921 | |||||||||||||
| Income taxes (benefits) | (92 | ) | 372 | (3 | ) | 75 | 80 | 1,807 | (75 | ) | 2,164 | (241 | ) | 361 | 9 | 106 | 64 | 1,669 | (106 | ) | 1,862 | |||||||||||||||||||||||||||
| Minority interest, net of taxes | — | — | — | — | — | 93 | 93 | — | — | — | — | — | 47 | — | 47 | |||||||||||||||||||||||||||||||||
| Equities in undistributed income of subsidiaries | (3,703 | ) | — | — | — | — | — | 3,703 | — | 2,449 | — | — | — | — | — | (2,449 | ) | — | ||||||||||||||||||||||||||||||
| Income from continuing operations | $ | 7,143 | $ | 667 | $ | (5 | ) | $ | 154 | $ | 167 | $ | 4,302 | $ | (7,440 | ) | $ | 4,988 | $ | 5,012 | $ | 843 | $ | 14 | $ | 192 | $ | 151 | $ | 4,246 | $ | (5,446 | ) | $ | 5,012 | |||||||||||||
Income from discontinued operations, net of taxes | — | 87 | — | — | — | 2,068 | — | 2,155 | — | — | — | — | — | — | — | — | ||||||||||||||||||||||||||||||||
Net income | $ | 7,143 | $ | 754 | $ | (5 | ) | $ | 154 | $ | 167 | $ | 6,370 | $ | (7,440 | ) | $ | 7,143 | $ | 5,012 | $ | 843 | $ | 14 | $ | 192 | $ | 151 | $ | 4,246 | $ | (5,446 | ) | $ | 5,012 | |||||||||||||
CONDENSED CONSOLIDATING STATEMENT OF INCOME
| | Nine Months Ended September 30, 2006 | |||||||||||||||||||||||
|---|---|---|---|---|---|---|---|---|---|---|---|---|---|---|---|---|---|---|---|---|---|---|---|---|
| In millions of dollars | Citigroup parent company | CGMHI | CFI | CCC | Associates | Other Citigroup subsidiaries, eliminations and income from discontinued operations | Consolidating adjustments | Citigroup Consolidated | ||||||||||||||||
| Revenues | ||||||||||||||||||||||||
| Dividends from subsidiary banks and bank holding companies | $ | 9,165 | $ | — | $ | — | $ | — | $ | — | $ | — | $ | (9,165 | ) | $ | — | |||||||
Interest revenue | $ | 325 | $ | 17,187 | $ | — | $ | 4,384 | $ | 5,199 | $ | 47,463 | $ | (4,384 | ) | $ | 70,174 | |||||||
| Interest revenue—intercompany | 3,028 | 357 | 2,219 | 44 | 287 | (5,891 | ) | (44 | ) | — | ||||||||||||||
| Interest expense | 4,219 | 13,597 | 1,524 | 145 | 546 | 20,839 | (145 | ) | 40,725 | |||||||||||||||
| Interest expense—intercompany | 2 | 1,964 | 550 | 1,227 | 1,784 | (4,300 | ) | (1,227 | ) | — | ||||||||||||||
| Net interest revenue | $ | (868 | ) | $ | 1,983 | $ | 145 | $ | 3,056 | $ | 3,156 | $ | 25,033 | $ | (3,056 | ) | $ | 29,449 | ||||||
Commissions and fees | $ | — | $ | 7,186 | $ | — | $ | 48 | $ | 119 | $ | 7,221 | $ | (48 | ) | $ | 14,526 | |||||||
| Commissions and fees—intercompany | — | 233 | — | 35 | 34 | (267 | ) | (35 | ) | — | ||||||||||||||
| Principal transactions | 28 | 3,456 | (96 | ) | — | 5 | 2,354 | — | 5,747 | |||||||||||||||
| Principal transactions—intercompany | — | (853 | ) | 62 | — | — | 791 | — | — | |||||||||||||||
| Other income | (61 | ) | 2,586 | 88 | 331 | 446 | 13,006 | (331 | ) | 16,065 | ||||||||||||||
| Other income—intercompany | 65 | 921 | (57 | ) | 16 | 13 | (942 | ) | (16 | ) | — | |||||||||||||
| Total non-interest revenues | $ | 32 | $ | 13,529 | $ | (3 | ) | $ | 430 | $ | 617 | $ | 22,163 | $ | (430 | ) | $ | 36,338 | ||||||
| Total revenues, net of interest expense | $ | 8,329 | $ | 15,512 | $ | 142 | $ | 3,486 | $ | 3,773 | $ | 47,196 | $ | (12,651 | ) | $ | 65,787 | |||||||
Provisions for credit losses and for benefits and claims | $ | — | $ | 33 | $ | — | $ | 879 | $ | 1,016 | $ | 4,558 | $ | (879 | ) | $ | 5,607 | |||||||
| Expenses | ||||||||||||||||||||||||
| Compensation and benefits | $ | 90 | $ | 8,445 | $ | — | $ | 575 | $ | 730 | $ | 13,090 | $ | (575 | ) | $ | 22,355 | |||||||
| Compensation and benefits—intercompany | 6 | 1 | — | 104 | 105 | (112 | ) | (104 | ) | — | ||||||||||||||
| Other expense | 62 | 2,670 | 1 | 387 | 509 | 12,466 | (387 | ) | 15,708 | |||||||||||||||
| Other expense—intercompany | 117 | 1,198 | 32 | 137 | 188 | (1,535 | ) | (137 | ) | — | ||||||||||||||
| Total operating expenses | $ | 275 | $ | 12,314 | $ | 33 | $ | 1,203 | $ | 1,532 | $ | 23,909 | $ | (1,203 | ) | $ | 38,063 | |||||||
Income from continuing operations before taxes, minority interest and equity in undistributed income of subsidiaries | $ | 8,054 | $ | 3,165 | $ | 109 | $ | 1,404 | $ | 1,225 | $ | 18,729 | $ | (10,569 | ) | $ | 22,117 | |||||||
| Income taxes (benefits) | (706 | ) | 965 | 43 | 499 | 377 | 5,181 | (499 | ) | 5,860 | ||||||||||||||
| Minority interest, net of taxes | — | — | — | — | — | 137 | — | 137 | ||||||||||||||||
| Equities in undistributed income of subsidiaries | 7,649 | — | — | — | — | — | (7,649 | ) | — | |||||||||||||||
| Income from continuing operations | $ | 16,409 | $ | 2,200 | $ | 66 | $ | 905 | $ | 848 | $ | 13,411 | $ | (17,719 | ) | $ | 16,120 | |||||||
Income from discontinued operations, net of taxes | — | 84 | — | — | — | 205 | — | 289 | ||||||||||||||||
| Net income | $ | 16,409 | $ | 2,284 | $ | 66 | $ | 905 | $ | 848 | $ | 13,616 | $ | (17,719 | ) | $ | 16,409 | |||||||
CONDENSED CONSOLIDATING STATEMENT OF INCOME
| | Nine Months Ended September 30, 2005 | |||||||||||||||||||||||
|---|---|---|---|---|---|---|---|---|---|---|---|---|---|---|---|---|---|---|---|---|---|---|---|---|
| In millions of dollars | Citigroup parent company | CGMHI | CFI | CCC | Associates | Other Citigroup subsidiaries, eliminations and income from discontinued operations | Consolidating adjustments | Citigroup Consolidated | ||||||||||||||||
| Revenues | ||||||||||||||||||||||||
| Dividends from subsidiary banks and bank holding companies | $ | 15,258 | $ | — | $ | — | $ | — | $ | — | $ | — | $ | (15,258 | ) | $ | — | |||||||
| Interest revenue | $ | 249 | $ | 11,507 | $ | — | $ | 4,153 | $ | 4,973 | $ | 38,584 | $ | (4,153 | ) | $ | 55,313 | |||||||
| Interest revenue— intercompany | 2,163 | 284 | 282 | (53 | ) | 149 | (2,878 | ) | 53 | — | ||||||||||||||
| Interest expense | 2,753 | 8,710 | 184 | 167 | 524 | 13,570 | (167 | ) | 25,741 | |||||||||||||||
| Interest expense— intercompany | — | 559 | 98 | 972 | 1,155 | (1,812 | ) | (972 | ) | — | ||||||||||||||
| Net interest revenue | $ | (341 | ) | $ | 2,522 | $ | — | $ | 2,961 | $ | 3,443 | $ | 23,948 | $ | (2,961 | ) | $ | 29,572 | ||||||
| Commissions and fees | $ | — | $ | 6,095 | $ | — | $ | 8 | $ | 46 | $ | 6,871 | $ | (8 | ) | $ | 13,012 | |||||||
| Commissions and fees— intercompany | — | 163 | — | 9 | 9 | (172 | ) | (9 | ) | — | ||||||||||||||
| Principal transactions | 290 | 4,037 | (39 | ) | — | (8 | ) | 729 | — | 5,009 | ||||||||||||||
| Principal transactions—intercompany | 14 | (2,263 | ) | 36 | 1 | 1 | 2,212 | (1 | ) | — | ||||||||||||||
| Other income | (15 | ) | 2,484 | 20 | 415 | 287 | 12,494 | (415 | ) | 15,270 | ||||||||||||||
| Other income—intercompany | 52 | 263 | (21 | ) | 12 | 18 | (312 | ) | (12 | ) | — | |||||||||||||
| Total non-interest revenues | $ | 341 | $ | 10,779 | $ | (4 | ) | $ | 445 | $ | 353 | $ | 21,822 | $ | (445 | ) | $ | 33,291 | ||||||
| Total revenue, net of interest expense | $ | 15,258 | $ | 13,301 | $ | (4 | ) | $ | 3,406 | $ | 3,796 | $ | 45,770 | $ | (18,664 | ) | $ | 62,863 | ||||||
| Provisions for credit losses and for benefits and claims | $ | — | $ | 16 | $ | — | $ | 1,330 | $ | 1,472 | $ | 5,414 | $ | (1,330 | ) | $ | 6,902 | |||||||
| Expenses | ||||||||||||||||||||||||
| Compensation and benefits | $ | 70 | $ | 7,160 | $ | — | $ | 539 | $ | 640 | $ | 11,441 | $ | (539 | ) | $ | 19,311 | |||||||
| Compensation and benefits— intercompany | 4 | 4 | — | 96 | 98 | (106 | ) | (96 | ) | — | ||||||||||||||
| Other expense | 181 | 2,070 | 1 | 366 | 462 | 11,764 | (366 | ) | 14,478 | |||||||||||||||
| Other expense— intercompany | 74 | 1,011 | 3 | 122 | 160 | (1,248 | ) | (122 | ) | — | ||||||||||||||
| Total operating expenses | $ | 329 | $ | 10,245 | $ | 4 | $ | 1,123 | $ | 1,360 | $ | 21,851 | $ | (1,123 | ) | $ | 33,789 | |||||||
| Income from continuing operations before taxes, minority interest and equity in undistributed income of subsidiaries | $ | 14,929 | $ | 3,040 | $ | (8 | ) | $ | 953 | $ | 964 | $ | 18,505 | $ | (16,211 | ) | $ | 22,172 | ||||||
| Income taxes (benefits) | (98 | ) | 988 | (3 | ) | 340 | 342 | 5,598 | (340 | ) | 6,827 | |||||||||||||
| Minority interest, net of taxes | — | — | — | — | — | 511 | — | 511 | ||||||||||||||||
| Equities in undistributed income of subsidiaries | 2,630 | — | — | — | — | — | (2,630 | ) | — | |||||||||||||||
| Income from continuing operations | $ | 17,657 | $ | 2,052 | $ | (5 | ) | $ | 613 | $ | 622 | $ | 12,396 | $ | (18,501 | ) | $ | 14,834 | ||||||
| Income from discontinued operations, net of taxes | — | 230 | — | — | — | 2,593 | — | 2,823 | ||||||||||||||||
| Net income | $ | 17,657 | $ | 2,282 | $ | (5 | ) | $ | 613 | $ | 622 | $ | 14,989 | $ | (18,501 | ) | $ | 17,657 | ||||||
CONDENSED CONSOLIDATING BALANCE SHEET
| | September 30, 2006 | ||||||||||||||||||||||||
|---|---|---|---|---|---|---|---|---|---|---|---|---|---|---|---|---|---|---|---|---|---|---|---|---|---|
| In millions of dollars | Citigroup parent company | CGMHI | CFI | CCC | Associates | Other Citigroup subsidiaries and eliminations | Consolidating adjustments | Citigroup Consolidated | |||||||||||||||||
| Assets | |||||||||||||||||||||||||
| Cash and due from banks | $ | — | $ | 3,485 | $ | — | $ | 166 | $ | 253 | $ | 18,805 | $ | (166 | ) | $ | 22,543 | ||||||||
| Cash and due from banks—intercompany | 139 | 883 | 1 | 178 | 191 | (1,214 | ) | (178 | ) | — | |||||||||||||||
| Federal funds sold and resale agreements | — | 250,371 | — | — | — | 12,256 | — | 262,627 | |||||||||||||||||
| Federal funds sold and resale agreements— intercompany | — | 4,204 | — | — | — | (4,204 | ) | — | — | ||||||||||||||||
| Trading account assets | — | 246,063 | 14 | — | 34 | 105,038 | — | 351,149 | |||||||||||||||||
| Trading account assets —intercompany | — | 2,483 | 231 | — | 8 | (2,722 | ) | — | — | ||||||||||||||||
| Investments | 10,125 | — | — | 2,593 | 3,343 | 238,280 | (2,593 | ) | 251,748 | ||||||||||||||||
| Loans, net of unearned income | — | 1,089 | — | 42,335 | 51,315 | 602,978 | (42,335 | ) | 655,382 | ||||||||||||||||
| Loans, net of unearned income—intercompany | — | — | 68,304 | 8,672 | 9,589 | (77,893 | ) | (8,672 | ) | — | |||||||||||||||
| Allowance for loan losses | — | (48 | ) | — | (1,060 | ) | (1,214 | ) | (7,717 | ) | 1,060 | (8,979 | ) | ||||||||||||
| Total loans, net | $ | — | $ | 1,041 | $ | 68,304 | $ | 49,947 | $ | 59,690 | $ | 517,368 | (49,947 | ) | $ | 646,403 | |||||||||
| Advances to subsidiaries | 82,738 | — | — | — | — | (82,738 | ) | — | — | ||||||||||||||||
| Investments in subsidiaries | 140,958 | — | — | — | — | — | (140,958 | ) | — | ||||||||||||||||
| Other assets | 9,380 | 61,407 | 37 | 4,806 | 6,398 | 134,556 | (4,806 | ) | 211,778 | ||||||||||||||||
| Other assets— intercompany | — | 12,940 | 3,818 | 264 | 413 | (17,171 | ) | (264 | ) | — | |||||||||||||||
| Total assets | $ | 243,340 | $ | 582,877 | $ | 72,405 | $ | 57,954 | $ | 70,330 | $ | 918,254 | $ | (198,912 | ) | $ | 1,746,248 | ||||||||
| Liabilities and stockholders' equity | |||||||||||||||||||||||||
| Deposits | $ | — | $ | — | $ | — | $ | — | $ | — | $ | 669,278 | $ | — | $ | 669,278 | |||||||||
| Federal funds purchased and securities loaned or sold | — | 265,265 | — | — | — | 54,830 | — | 320,095 | |||||||||||||||||
| Federal funds purchased and securities loaned or sold—intercompany | — | 1,967 | — | — | — | (1,967 | ) | — | — | ||||||||||||||||
| Trading account liabilities | — | 97,486 | 151 | — | — | 41,239 | — | 138,876 | |||||||||||||||||
| Trading account liabilities— intercompany | — | 1,867 | 246 | — | — | (2,113 | ) | — | — | ||||||||||||||||
| Short-term borrowings | — | 9,329 | 35,515 | — | 745 | 24,912 | — | 70,501 | |||||||||||||||||
| Short-term borrowings —intercompany | — | 38,369 | 20,176 | 7,496 | 20,037 | (78,582 | ) | (7,496 | ) | — | |||||||||||||||
| Long-term debt | 114,299 | 31,019 | 15,265 | 2,695 | 13,374 | 86,132 | (2,695 | ) | 260,089 | ||||||||||||||||
| Long-term debt— intercompany | — | 22,625 | — | 35,321 | 27,432 | (50,057 | ) | (35,321 | ) | — | |||||||||||||||
| Other liabilities | 5,338 | 89,061 | 98 | 1,545 | 1,420 | 73,627 | (1,545 | ) | 169,544 | ||||||||||||||||
| Other liabilities — intercompany | 5,838 | 5,722 | 66 | 459 | 220 | (11,846 | ) | (459 | ) | — | |||||||||||||||
| Stockholders' equity | 117,865 | 20,167 | 888 | 10,438 | 7,102 | 112,801 | (151,396 | ) | 117,865 | ||||||||||||||||
| Total liabilities and stockholders' equity | $ | 243,340 | $ | 582,877 | $ | 72,405 | $ | 57,954 | $ | 70,330 | $ | 918,254 | $ | (198,912 | ) | $ | 1,746,248 | ||||||||
| | Three Months Ended March 31, 2006 | |||||||||||||||||||||||
|---|---|---|---|---|---|---|---|---|---|---|---|---|---|---|---|---|---|---|---|---|---|---|---|---|
| In millions of dollars | Citigroup parent company | CGMHI | CFI | CCC | Associates | Other Citigroup subsidiaries, eliminations and income from discontinued operations | Consolidating adjustments | Citigroup Consolidated | ||||||||||||||||
| Revenues | ||||||||||||||||||||||||
| Dividends from subsidiary banks and bank holding companies | $ | 2,453 | $ | — | $ | — | $ | — | $ | — | $ | — | $ | (2,453 | ) | $ | — | |||||||
Interest revenue | 91 | 5,409 | — | 1,399 | 1,659 | 14,714 | (1,399 | ) | 21,873 | |||||||||||||||
| Interest revenue—intercompany | 927 | 109 | 569 | (18 | ) | 79 | (1,684 | ) | 18 | — | ||||||||||||||
| Interest expense | 1,329 | 4,094 | 428 | 52 | 181 | 6,075 | (52 | ) | 12,107 | |||||||||||||||
| Interest expense—intercompany | (33 | ) | 561 | 130 | 350 | 524 | (1,182 | ) | (350 | ) | — | |||||||||||||
| Net interest revenue | $ | (278 | ) | $ | 863 | $ | 11 | $ | 979 | $ | 1,033 | $ | 8,137 | $ | (979 | ) | $ | 9,766 | ||||||
Commissions and fees | $ | — | $ | 2,377 | $ | — | $ | 14 | $ | 38 | $ | 2,773 | $ | (14 | ) | $ | 5,188 | |||||||
| Commissions and fees—intercompany | — | 77 | — | 11 | 11 | (88 | ) | (11 | ) | — | ||||||||||||||
| Principal transactions | 16 | 1,466 | (123 | ) | — | — | 758 | — | 2,117 | |||||||||||||||
| Principal transactions—intercompany | 15 | (336 | ) | 130 | — | — | 191 | — | — | |||||||||||||||
| Other income | 503 | 1,073 | 65 | 113 | 162 | 3,309 | (113 | ) | 5,112 | |||||||||||||||
| Other income—intercompany | (434 | ) | 214 | (68 | ) | 5 | 3 | 285 | (5 | ) | — | |||||||||||||
| Total non-interest revenues | $ | 100 | $ | 4,871 | $ | 4 | $ | 143 | $ | 214 | $ | 7,228 | $ | (143 | ) | $ | 12,417 | |||||||
| Total revenues, net of interest expense | $ | 2,275 | $ | 5,734 | $ | 15 | $ | 1,122 | $ | 1,247 | $ | 15,365 | $ | (3,575 | ) | $ | 22,183 | |||||||
Provisions for credit losses and for benefits and claims | $ | — | $ | 21 | $ | — | $ | 295 | $ | 337 | $ | 1,315 | $ | (295 | ) | $ | 1,673 | |||||||
Expenses | ||||||||||||||||||||||||
| Compensation and benefits | $ | (5 | ) | $ | 3,467 | $ | — | $ | 198 | $ | 247 | $ | 4,554 | $ | (198 | ) | $ | 8,263 | ||||||
| Compensation and benefits—intercompany | 2 | — | — | 35 | 36 | (38 | ) | (35 | ) | — | ||||||||||||||
| Other expense | 36 | 907 | — | 149 | 191 | 3,961 | (149 | ) | 5,095 | |||||||||||||||
| Other expense—intercompany | 34 | 443 | 20 | 45 | 62 | (559 | ) | (45 | ) | — | ||||||||||||||
| Total operating expenses | $ | 67 | $ | 4,817 | $ | 20 | $ | 427 | $ | 536 | $ | 7,918 | $ | (427 | ) | $ | 13,358 | |||||||
Income from continuing operations before taxes, minority interest and equity in undistributed income of subsidiaries | $ | 2,208 | $ | 896 | $ | (5 | ) | $ | 400 | $ | 374 | $ | 6,132 | $ | (2,853 | ) | $ | 7,152 | ||||||
| Income taxes (benefits) | (206 | ) | 265 | (2 | ) | 125 | 66 | 1,414 | (125 | ) | 1,537 | |||||||||||||
| Minority interest, net of taxes | — | — | — | — | — | 60 | — | 60 | ||||||||||||||||
| Equities in undistributed income of subsidiaries | 3,225 | — | — | — | — | — | (3,225 | ) | — | |||||||||||||||
| Income from continuing operations | $ | 5,639 | $ | 631 | $ | (3 | ) | $ | 275 | $ | 308 | $ | 4,658 | $ | (5,953 | ) | $ | 5,555 | ||||||
Income from discontinued operations, net of taxes | — | (6 | ) | — | — | — | 90 | — | 84 | |||||||||||||||
Net income | $ | 5,639 | $ | 625 | $ | (3 | ) | $ | 275 | $ | 308 | $ | 4,748 | $ | (5,953 | ) | $ | 5,639 | ||||||
CONDENSED CONSOLIDATING BALANCE SHEET
| | December 31, 2005(1) | ||||||||||||||||||||||||
|---|---|---|---|---|---|---|---|---|---|---|---|---|---|---|---|---|---|---|---|---|---|---|---|---|---|
| In millions of dollars | Citigroup parent company | CGMHI | CFI | CCC | Associates | Other Citigroup subsidiaries and eliminations | Consolidating adjustments | Citigroup Consolidated | |||||||||||||||||
| Assets | |||||||||||||||||||||||||
| Cash and due from banks | $ | — | $ | 3,525 | $ | — | $ | 206 | $ | 331 | $ | 19,776 | $ | (206 | ) | $ | 23,632 | ||||||||
| Cash and due from banks—intercompany | 300 | 388 | 1 | 481 | 545 | (1,234 | ) | (481 | ) | — | |||||||||||||||
| Federal funds sold and resale agreements | — | 204,371 | — | — | — | 13,093 | — | 217,464 | |||||||||||||||||
| Federal funds sold and resale agreements—intercompany | — | 5,870 | — | — | — | (5,870 | ) | — | — | ||||||||||||||||
| Trading account assets | — | 207,682 | — | — | 40 | 88,098 | — | 295,820 | |||||||||||||||||
| Trading account assets—intercompany | — | 2,350 | — | — | 17 | (2,367 | ) | — | — | ||||||||||||||||
| Investments | 8,215 | — | — | 2,469 | 3,216 | 169,166 | (2,469 | ) | 180,597 | ||||||||||||||||
| Loans, net of unearned income | — | 1,120 | — | 39,934 | 48,751 | 533,632 | (39,934 | ) | 583,503 | ||||||||||||||||
| Loans, net of unearned income—intercompany | — | — | 18,057 | 6,058 | 8,581 | (26,638 | ) | (6,058 | ) | — | |||||||||||||||
| Allowance for loan losses | — | (66 | ) | — | (1,274 | ) | (1,429 | ) | (8,287 | ) | 1,274 | (9,782 | ) | ||||||||||||
| Total loans, net | $ | — | $ | 1,054 | $ | 18,057 | $ | 44,718 | $ | 55,903 | $ | 498,707 | (44,718 | ) | $ | 573,721 | |||||||||
| Advances to subsidiaries | 71,784 | — | — | — | — | (71,784 | ) | — | — | ||||||||||||||||
| Investments in subsidiaries | 132,214 | — | — | — | — | — | (132,214 | ) | — | ||||||||||||||||
| Other assets | 8,751 | 65,451 | 8 | 6,427 | 8,049 | 120,544 | (6,427 | ) | 202,803 | ||||||||||||||||
| Other assets—intercompany | — | 9,075 | 32,872 | 239 | 367 | (42,314 | ) | (239 | ) | — | |||||||||||||||
| Total assets | $ | 221,264 | $ | 499,766 | $ | 50,938 | $ | 54,540 | $ | 68,468 | $ | 785,815 | $ | (186,754 | ) | $ | 1,494,037 | ||||||||
Liabilities and stockholders' equity | |||||||||||||||||||||||||
| Deposits | $ | — | $ | — | $ | — | $ | 1 | $ | 1 | $ | 591,827 | $ | (1 | ) | $ | 591,828 | ||||||||
| Federal funds purchased and securities loaned or sold | — | 202,490 | — | — | — | 39,902 | — | 242,392 | |||||||||||||||||
| Federal funds purchased and securities loaned or sold—intercompany | — | 1,734 | — | — | — | (1,734 | ) | — | — | ||||||||||||||||
| Trading account liabilities | — | 79,020 | 97 | — | — | 41,991 | — | 121,108 | |||||||||||||||||
| Trading account liabilities—intercompany | — | 2,572 | 85 | — | — | (2,657 | ) | — | — | ||||||||||||||||
| Short-term borrowings | — | 10,391 | 33,440 | 1,520 | 3,103 | 19,996 | (1,520 | ) | 66,930 | ||||||||||||||||
| Short-term borrowings—intercompany | — | 29,579 | 11,209 | 5,989 | 8,815 | (49,603 | ) | (5,989 | ) | — | |||||||||||||||
| Long-term debt | 100,600 | 39,214 | 5,963 | 3,785 | 14,032 | 57,690 | (3,785 | ) | 217,499 | ||||||||||||||||
| Long-term debt—intercompany | — | 17,671 | — | 32,089 | 35,211 | (52,882 | ) | (32,089 | ) | — | |||||||||||||||
| Other liabilities | 4,436 | 89,774 | 31 | 1,233 | 1,089 | 46,413 | (1,233 | ) | 141,743 | ||||||||||||||||
| Other liabilities—intercompany | 3,691 | 5,778 | 42 | 617 | 202 | (9,713 | ) | (617 | ) | — | |||||||||||||||
| Stockholders' equity | 112,537 | 21,543 | 71 | 9,306 | 6,015 | 104,585 | (141,520 | ) | 112,537 | ||||||||||||||||
| Total liabilities and stockholders' equity | $ | 221,264 | $ | 499,766 | $ | 50,938 | $ | 54,540 | $ | 68,468 | $ | 785,815 | $ | (186,754 | ) | $ | 1,494,037 | ||||||||
| | March 31, 2007 | ||||||||||||||||||||||||
|---|---|---|---|---|---|---|---|---|---|---|---|---|---|---|---|---|---|---|---|---|---|---|---|---|---|
| In millions of dollars | Citigroup parent company | CGMHI | CFI | CCC | Associates | Other Citigroup subsidiaries and eliminations | Consolidating adjustments | Citigroup Consolidated | |||||||||||||||||
| Assets | |||||||||||||||||||||||||
| Cash and due from banks | $ | — | $ | 4,206 | $ | 17 | $ | 184 | $ | 286 | $ | 19,912 | $ | (184 | ) | $ | 24,421 | ||||||||
| Cash and due from banks—intercompany | 29 | 534 | — | 147 | 157 | (720 | ) | (147 | ) | — | |||||||||||||||
| Federal funds sold and resale agreements | — | 292,729 | — | — | — | 11,196 | — | 303,925 | |||||||||||||||||
| Federal funds sold and resale agreements—intercompany | — | 9,124 | — | — | — | (9,124 | ) | — | — | ||||||||||||||||
| Trading account assets | 37 | 342,504 | — | — | 37 | 117,487 | — | 460,065 | |||||||||||||||||
| Trading account assets—intercompany | 352 | 6,755 | 766 | — | 8 | (7,881 | ) | — | — | ||||||||||||||||
| Investments | 8,604 | — | — | 2,348 | 2,883 | 275,080 | (2,348 | ) | 286,567 | ||||||||||||||||
| Loans, net of unearned income | — | 945 | — | 44,900 | 53,765 | 638,634 | (44,900 | ) | 693,344 | ||||||||||||||||
| Loans, net of unearned income—intercompany | — | — | 35,623 | 7,996 | 10,234 | (45,857 | ) | (7,996 | ) | — | |||||||||||||||
| Allowance for loan losses | — | (63 | ) | — | (959 | ) | (1,106 | ) | (8,341 | ) | 959 | (9,510 | ) | ||||||||||||
| Total loans, net | $ | — | $ | 882 | $ | 35,623 | $ | 51,937 | $ | 62,893 | $ | 584,436 | $ | (51,937 | ) | $ | 683,834 | ||||||||
| Advances to subsidiaries | 94,225 | — | — | — | — | (94,225 | ) | — | — | ||||||||||||||||
| Investments in subsidiaries | 151,077 | — | — | — | — | — | (151,077 | ) | — | ||||||||||||||||
| Other assets | 8,770 | 70,692 | 59 | 5,193 | 6,702 | 175,931 | (5,193 | ) | 262,154 | ||||||||||||||||
| Other assets—intercompany | 4,461 | 15,091 | 62,415 | 270 | 392 | (82,359 | ) | (270 | ) | — | |||||||||||||||
| Total assets | $ | 267,555 | $ | 742,517 | $ | 98,880 | $ | 60,079 | $ | 73,358 | $ | 989,733 | $ | (211,156 | ) | $ | 2,020,966 | ||||||||
| Liabilities and stockholders' equity | |||||||||||||||||||||||||
| Deposits | $ | — | $ | — | $ | — | $ | — | $ | — | $ | 738,521 | $ | — | $ | 738,521 | |||||||||
| Federal funds purchased and securities loaned or sold | — | 347,232 | — | — | — | 46,438 | — | 393,670 | |||||||||||||||||
| Federal funds purchased and securities loaned or sold—intercompany | 1,624 | 3,454 | — | — | — | (5,078 | ) | — | — | ||||||||||||||||
| Trading account liabilities | 5 | 131,093 | 196 | — | — | 42,608 | — | 173,902 | |||||||||||||||||
| Trading account liabilities—intercompany | 90 | 3,081 | 222 | — | — | (3,393 | ) | — | — | ||||||||||||||||
| Short-term borrowings | 28 | 18,997 | 41,681 | 266 | 1,196 | 49,277 | (266 | ) | 111,179 | ||||||||||||||||
| Short-term borrowings—intercompany | — | 59,595 | 28,458 | 10,526 | 27,054 | (115,107 | ) | (10,526 | ) | — | |||||||||||||||
| Long-term debt | 134,915 | 28,419 | 24,465 | 2,776 | 13,422 | 109,547 | (2,776 | ) | 310,768 | ||||||||||||||||
| Long-term debt—intercompany | 30 | 26,170 | 2,106 | 33,258 | 22,298 | (50,604 | ) | (33,258 | ) | — | |||||||||||||||
| Advances from subsidiaries | 528 | — | — | — | — | (528 | ) | — | — | ||||||||||||||||
| Other liabilities | 7,013 | 96,796 | 121 | 1,892 | 1,665 | 65,248 | (1,892 | ) | 170,843 | ||||||||||||||||
| Other liabilities—intercompany | 1,239 | 7,772 | 207 | 438 | 231 | (9,449 | ) | (438 | ) | — | |||||||||||||||
| Stockholders' equity | 122,083 | 19,908 | 1,424 | 10,923 | 7,492 | 122,253 | (162,000 | ) | 122,083 | ||||||||||||||||
| Total liabilities and stockholders' equity | $ | 267,555 | $ | 742,517 | $ | 98,880 | $ | 60,079 | $ | 73,358 | $ | 989,733 | $ | (211,156 | ) | $ | 2,020,966 | ||||||||
CONDENSED CONSOLIDATING BALANCE SHEET
| | December 31, 2006 | ||||||||||||||||||||||||
|---|---|---|---|---|---|---|---|---|---|---|---|---|---|---|---|---|---|---|---|---|---|---|---|---|---|
| In millions of dollars | Citigroup parent company | CGMHI | CFI | CCC | Associates | Other Citigroup subsidiaries and eliminations | Consolidating adjustments | Citigroup Consolidated | |||||||||||||||||
| Assets | |||||||||||||||||||||||||
| Cash and due from banks | $ | — | $ | 3,752 | $ | — | $ | 216 | $ | 313 | $ | 22,449 | $ | (216 | ) | $ | 26,514 | ||||||||
| Cash and due from banks—intercompany | 21 | 669 | — | 172 | 190 | (880 | ) | (172 | ) | — | |||||||||||||||
| Federal funds sold and resale agreements | — | 269,949 | — | — | — | 12,868 | — | 282,817 | |||||||||||||||||
| Federal funds sold and resale agreements—intercompany | — | 5,720 | — | — | — | (5,720 | ) | — | — | ||||||||||||||||
| Trading account assets | 38 | 281,290 | — | — | 36 | 112,561 | — | 393,925 | |||||||||||||||||
| Trading account assets—intercompany | 224 | 6,257 | 1 | — | 9 | (6,491 | ) | — | — | ||||||||||||||||
| Investments | 9,088 | — | — | 2,290 | 2,808 | 261,695 | (2,290 | ) | 273,591 | ||||||||||||||||
| Loans, net of unearned income | — | 932 | — | 44,809 | 53,614 | 624,646 | (44,809 | ) | 679,192 | ||||||||||||||||
| Loans, net of unearned income—Intercompany | — | — | 36,206 | 8,116 | 11,234 | (47,440 | ) | (8,116 | ) | — | |||||||||||||||
| Allowance for loan losses | — | (60 | ) | — | (954 | ) | (1,099 | ) | (7,781 | ) | 954 | (8,940 | ) | ||||||||||||
| Total loans, net | $ | — | $ | 872 | $ | 36,206 | $ | 51,971 | $ | 63,749 | $ | 569,425 | $ | (51,971 | ) | $ | 670,252 | ||||||||
| Advances to subsidiaries | 90,112 | — | — | — | — | (90,112 | ) | — | — | ||||||||||||||||
| Investments in subsidiaries | 146,904 | — | — | — | — | — | (146,904 | ) | — | ||||||||||||||||
| Other assets | 8,234 | 66,761 | 552 | 4,708 | 6,208 | 155,464 | (4,708 | ) | 237,219 | ||||||||||||||||
| Other assets—intercompany | 2,969 | 16,153 | 51,343 | 260 | 388 | (70,853 | ) | (260 | ) | — | |||||||||||||||
| Total assets | $ | 257,590 | $ | 651,423 | $ | 88,102 | $ | 59,617 | $ | 73,701 | $ | 960,406 | $ | (206,521 | ) | $ | 1,884,318 | ||||||||
Liabilities and stockholders' equity | |||||||||||||||||||||||||
| Deposits | $ | — | $ | — | $ | — | $ | — | $ | — | $ | 712,041 | $ | — | $ | 712,041 | |||||||||
| Federal funds purchased and securities loaned or sold | — | 304,470 | — | — | — | 44,765 | — | 349,235 | |||||||||||||||||
| Federal funds purchased and securities loaned or sold—intercompany | 1,910 | 2,283 | — | — | — | (4,193 | ) | — | — | ||||||||||||||||
| Trading account liabilities | 5 | 106,174 | 51 | — | — | 39,657 | — | 145,887 | |||||||||||||||||
| Trading account liabilities—Intercompany | 128 | 2,829 | 93 | — | — | (3,050 | ) | — | — | ||||||||||||||||
| Short-term borrowings | 32 | 14,102 | 43,345 | 1,201 | 3,137 | 40,217 | (1,201 | ) | 100,833 | ||||||||||||||||
| Short-term borrowings—intercompany | — | 47,178 | 22,494 | 9,739 | 24,130 | (93,802 | ) | (9,739 | ) | — | |||||||||||||||
| Long-term debt | 125,350 | 28,719 | 18,847 | 2,904 | 13,222 | 102,356 | (2,904 | ) | 288,494 | ||||||||||||||||
| Long-term debt—intercompany | 399 | 24,038 | 1,644 | 33,050 | 24,349 | (50,430 | ) | (33,050 | ) | — | |||||||||||||||
| Advances from subsidiaries | 2,565 | — | — | — | — | (2,565 | ) | — | — | ||||||||||||||||
| Other liabilities | 6,246 | 95,113 | 139 | 1,362 | 1,194 | 65,353 | (1,362 | ) | 168,045 | ||||||||||||||||
| Other liabilities—intercompany | 1,172 | 6,498 | 179 | 628 | 334 | (8,183 | ) | (628 | ) | — | |||||||||||||||
| Stockholders' equity | 119,783 | 20,019 | 1,310 | 10,733 | 7,335 | 118,240 | (157,637 | ) | 119,783 | ||||||||||||||||
| Total liabilities and stockholders' equity | $ | 257,590 | $ | 651,423 | $ | 88,102 | $ | 59,617 | $ | 73,701 | $ | 960,406 | $ | (206,521 | ) | $ | 1,884,318 | ||||||||
Condensed Consolidating Statements of Cash Flows
| | Three Months Ended March 31, 2007 | ||||||||||||||||||||||||
|---|---|---|---|---|---|---|---|---|---|---|---|---|---|---|---|---|---|---|---|---|---|---|---|---|---|
| In millions of dollars | Citigroup parent company | CGMHI | CFI | CCC | Associates | Other Citigroup subsidiaries and eliminations | Consolidating adjustments | Citigroup Consolidated | |||||||||||||||||
| Net cash provided by (used in) operating activities of continuing operations | $ | 849 | $ | (17,858 | ) | $ | 73 | $ | 710 | $ | 1,255 | $ | (2,736 | ) | $ | (710 | ) | $ | (18,417 | ) | |||||
| Cash flows from investing activities | |||||||||||||||||||||||||
| Change in loans | $ | — | $ | (13 | ) | $ | — | $ | (769 | ) | $ | (883 | ) | $ | (71,517 | ) | $ | 769 | $ | (72,413 | ) | ||||
| Proceeds from sales and securitizations of loans | — | — | — | — | — | 61,333 | — | 61,333 | |||||||||||||||||
| Purchases of investments | (4,147 | ) | — | — | (173 | ) | (401 | ) | (76,681 | ) | 173 | (81,229 | ) | ||||||||||||
| Proceeds from sales of investments | 1,688 | — | — | 50 | 121 | 37,208 | (50 | ) | 39,017 | ||||||||||||||||
| Proceeds from maturities of investments | 2,966 | — | — | 71 | 218 | 31,209 | (71 | ) | 34,393 | ||||||||||||||||
| Changes in investments and advances—intercompany | (4,113 | ) | — | (10,537 | ) | 121 | 606 | 14,044 | (121 | ) | — | ||||||||||||||
| Business acquisitions | — | — | — | — | — | (2,353 | ) | — | (2,353 | ) | |||||||||||||||
| Other investing activities | — | 1,757 | — | — | — | (4,409 | ) | — | (2,652 | ) | |||||||||||||||
| Net cash (used in) provided by investing activities | $ | (3,606 | ) | $ | 1,744 | $ | (10,537 | ) | $ | (700 | ) | $ | (339 | ) | $ | (11,166 | ) | $ | 700 | $ | (23,904 | ) | |||
| Cash flows from financing activities | |||||||||||||||||||||||||
| Dividends paid | $ | (2,698 | ) | $ | — | $ | — | $ | — | $ | — | $ | — | $ | — | $ | (2,698 | ) | |||||||
| Dividends paid—intercompany | — | (1,036 | ) | — | — | — | 1,036 | — | — | ||||||||||||||||
| Issuance of common stock | 394 | — | — | — | — | — | — | 394 | |||||||||||||||||
| Treasury stock acquired | (645 | ) | — | — | — | — | — | — | (645 | ) | |||||||||||||||
| Proceeds/(Repayments) from issuance of long-term debt—third-party, net | 8,943 | (1,967 | ) | 6,080 | (128 | ) | 195 | (3,884 | ) | 128 | 9,367 | ||||||||||||||
| Proceeds/(Repayments) from issuance of long-term debt—intercompany, net | (369 | ) | 2,124 | — | 208 | (2,051 | ) | 296 | (208 | ) | — | ||||||||||||||
| Change in deposits | — | — | — | — | — | 24,902 | — | 24,902 | |||||||||||||||||
| Net change in short-term borrowings and other investment banking and brokerage borrowings—third-party | (4 | ) | 4,895 | (2,019 | ) | (934 | ) | (1,941 | ) | 8,787 | 934 | 9,718 | |||||||||||||
| Net change in short-term borrowings and other advances—intercompany | (2,037 | ) | 12,417 | 6,320 | 787 | 2,821 | (19,521 | ) | (787 | ) | — | ||||||||||||||
| Capital contributions from parent | — | — | 100 | — | — | (100 | ) | — | — | ||||||||||||||||
| Other financing activities | (819 | ) | — | — | — | — | — | — | (819 | ) | |||||||||||||||
| Net cash provided by (used in) financing activities | $ | 2,765 | $ | 16,433 | $ | 10,481 | $ | (67 | ) | $ | (976 | ) | $ | 11,516 | $ | 67 | $ | 40,219 | |||||||
| Effect of exchange rate changes on cash and due from banks | $ | — | $ | — | $ | — | $ | — | $ | — | $ | 9 | $ | — | $ | 9 | |||||||||
| Net increase (decrease) in cash and due from banks | $ | 8 | $ | 319 | $ | 17 | $ | (57 | ) | $ | (60 | ) | $ | (2,377 | ) | $ | 57 | $ | (2,093 | ) | |||||
| Cash and due from banks at beginning of period | 21 | 4,421 | — | 388 | 503 | 21,569 | (388 | ) | 26,514 | ||||||||||||||||
| Cash and due from banks at end of period from continuing operations | $ | 29 | $ | 4,740 | $ | 17 | $ | 331 | $ | 443 | $ | 19,192 | $ | (331 | ) | $ | 24,421 | ||||||||
| Supplemental disclosure of cash flow information | |||||||||||||||||||||||||
| Cash paid during the year for: | |||||||||||||||||||||||||
| Income taxes | $ | (61 | ) | $ | 644 | $ | (20 | ) | $ | 34 | $ | 25 | $ | 1,238 | $ | (34 | ) | $ | 1,826 | ||||||
| Interest | 1,718 | 6,921 | 1,078 | 738 | 116 | 5,499 | (738 | ) | 15,332 | ||||||||||||||||
| Non-cash investing activities: | |||||||||||||||||||||||||
| Transfers to repossessed assets | $ | — | $ | — | $ | — | $ | 308 | $ | 315 | $ | 138 | $ | (308 | ) | $ | 453 | ||||||||
Condensed Consolidating Statements of Cash Flows
| | Nine Months Ended September 30, 2006 | ||||||||||||||||||||||||
|---|---|---|---|---|---|---|---|---|---|---|---|---|---|---|---|---|---|---|---|---|---|---|---|---|---|
| In millions of dollars | Citigroup parent company | CGMHI | CFI | CCC | Associates | Other Citigroup subsidiaries and eliminations | Consolidating adjustments | Citigroup Consolidated | |||||||||||||||||
| Net cash provided by (used in) operating activities of continuing operations | $ | 8,427 | $ | (66 | ) | $ | (153 | ) | $ | 4,128 | $ | 4,524 | $ | 186,738 | $ | (4,128 | ) | $ | 199,470 | ||||||
| Cash flows from investing activities | |||||||||||||||||||||||||
| Change in loans | $ | — | $ | 31 | $ | — | $ | (4,122 | ) | $ | (4,443 | ) | $ | (252,687 | ) | $ | 4,122 | $ | (257,099 | ) | |||||
| Proceeds from sales and securitizations of loans | — | — | — | — | — | 18,627 | — | 18,627 | |||||||||||||||||
| Purchases of investments | (13,499 | ) | — | — | (4,147 | ) | (5,523 | ) | (193,464 | ) | 4,147 | (212,486 | ) | ||||||||||||
| Proceeds from sales of investments | 3,543 | — | — | 636 | 1,076 | 49,121 | (636 | ) | 53,740 | ||||||||||||||||
| Proceeds from maturities of investments | 8,173 | — | — | 3,378 | 4,331 | 77,659 | (3,378 | ) | 90,163 | ||||||||||||||||
| Changes in investments and advances—intercompany | (9,849 | ) | — | (20,942 | ) | (2,614 | ) | (1,008 | ) | 31,799 | 2,614 | — | |||||||||||||
| Business acquisitions | — | (9 | ) | — | — | — | 9 | — | — | ||||||||||||||||
| Other investing activities | — | (45 | ) | — | — | — | (3,836 | ) | — | (3,881 | ) | ||||||||||||||
| Net cash used in investing activities | $ | (11,632 | ) | $ | (23 | ) | $ | (20,942 | ) | $ | (6,869 | ) | $ | (5,567 | ) | $ | (272,772 | ) | $ | 6,869 | $ | (310,936 | ) | ||
| Cash flows from financing activities | |||||||||||||||||||||||||
| Dividends paid | $ | (7,420 | ) | $ | — | $ | — | $ | — | $ | — | $ | — | $ | — | $ | (7,420 | ) | |||||||
| Dividends paid-intercompany | — | (3,666 | ) | — | — | (160 | ) | 3,826 | — | — | |||||||||||||||
| Issuance of common stock | 1,210 | — | — | — | — | — | — | 1,210 | |||||||||||||||||
| Redemption or retirement of preferred stock | (125 | ) | — | — | — | — | — | — | (125 | ) | |||||||||||||||
| Treasury stock acquired | (6,000 | ) | — | — | — | — | — | — | (6,000 | ) | |||||||||||||||
| Proceeds/(Repayments) from issuance of long-term debt—third-party, net | 12,161 | (8,485 | ) | 10,708 | (1,090 | ) | (658 | ) | 27,288 | 1,090 | 41,014 | ||||||||||||||
| Proceeds/(Repayments) from issuance of long-term debt—intercompany, net | — | 4,968 | — | 3,232 | (7,779 | ) | 2,811 | (3,232 | ) | — | |||||||||||||||
| Change in deposits | — | — | — | (1 | ) | — | 78,440 | 1 | 78,440 | ||||||||||||||||
| Net change in short-term borrowings and other investment banking and brokerage borrowings—third-party | — | (1,062 | ) | 670 | (1,520 | ) | (2,368 | ) | 6,331 | 1,520 | 3,571 | ||||||||||||||
| Net change in short-term borrowings and other advances—intercompany | 3,877 | 8,789 | 8,967 | 1,507 | 11,273 | (32,906 | ) | (1,507 | ) | — | |||||||||||||||
| Capital contributions from parent | — | — | 750 | — | 301 | (1,051 | ) | — | — | ||||||||||||||||
| Other financing activities | (659 | ) | — | — | 270 | 2 | (31 | ) | (270 | ) | (688 | ) | |||||||||||||
| Net cash provided by financing activities | $ | 3,044 | $ | 544 | $ | 21,095 | $ | 2,398 | $ | 611 | $ | 84,708 | $ | (2,398 | ) | $ | 110,002 | ||||||||
| Effect of exchange rate changes on cash and due from banks | $ | — | $ | — | $ | — | $ | — | $ | — | $ | 375 | $ | — | $ | 375 | |||||||||
| Net (decrease)/increase in cash and due from banks | $ | (161 | ) | $ | 455 | $ | — | $ | (343 | ) | $ | (432 | ) | $ | (951 | ) | $ | 343 | $ | (1,089 | ) | ||||
| Cash and due from banks at beginning of period | 300 | 3,913 | 1 | 687 | 876 | 18,542 | (687 | ) | 23,632 | ||||||||||||||||
| Cash and due from banks at end of period from continuing operations | $ | 139 | $ | 4,368 | $ | 1 | $ | 344 | $ | 444 | $ | 17,591 | $ | (344 | ) | $ | 22,543 | ||||||||
| Supplemental disclosure of cash flow information | |||||||||||||||||||||||||
| Cash paid during the year for: | |||||||||||||||||||||||||
| Income taxes | $ | (690 | ) | $ | 1,489 | $ | 29 | $ | 483 | $ | 64 | $ | 4,495 | $ | (483 | ) | $ | 5,387 | |||||||
| Interest | $ | 4,009 | $ | 15,069 | $ | 2,027 | $ | 138 | $ | 369 | $ | 15,761 | $ | (138 | ) | 37,235 | |||||||||
| Non-cash investing activities: | |||||||||||||||||||||||||
| Transfers to repossessed assets | $ | — | $ | — | $ | — | $ | 779 | $ | 799 | $ | 218 | $ | (779 | ) | $ | 1,017 | ||||||||
Condensed Consolidating Statements of Cash Flows
| | Nine Months Ended September 30, 2005 | Three Months Ended March 31, 2006 | ||||||||||||||||||||||||||||||||||||||||||||||||
|---|---|---|---|---|---|---|---|---|---|---|---|---|---|---|---|---|---|---|---|---|---|---|---|---|---|---|---|---|---|---|---|---|---|---|---|---|---|---|---|---|---|---|---|---|---|---|---|---|---|---|
| In millions of dollars | Citigroup parent company | CGMHI | CFI | CCC | Associates | Other Citigroup subsidiaries and eliminations | Consolidating adjustments | Citigroup Consolidated | Citigroup parent company | CGMHI | CFI | CCC | Associates | Other Citigroup subsidiaries and eliminations | Consolidating adjustments | Citigroup Consolidated | ||||||||||||||||||||||||||||||||||
| Net cash provided by (used in) operating activities of continuing operations | $ | 12,381 | $ | (12,999 | ) | $ | 161 | $ | 2,448 | $ | 3,718 | $ | 156,852 | $ | (2,448 | ) | $ | 160,113 | $ | 1,781 | $ | 4,101 | $ | (103 | ) | $ | 897 | $ | 1,591 | $ | (4,200 | ) | $ | (897 | ) | $ | 3,170 | |||||||||||||
| Cash flows from investing activities | ||||||||||||||||||||||||||||||||||||||||||||||||||
| Change in loans | $ | — | $ | 31 | — | $ | (2,153 | ) | $ | (1,678 | ) | $ | (188,840 | ) | $ | 2,153 | $ | (190,487 | ) | $ | — | $ | (97 | ) | $ | — | $ | 300 | $ | 357 | $ | (86,080 | ) | $ | (300 | ) | $ | (85,820 | ) | |||||||||||
| Proceeds from sales and securitizations of loans | — | — | — | — | 493 | 22,947 | — | 23,440 | — | — | — | — | — | 63,397 | — | 63,397 | ||||||||||||||||||||||||||||||||||
| Purchases of investments | (8,802 | ) | — | — | (6,390 | ) | (7,658 | ) | (135,602 | ) | 6,390 | (152,062 | ) | (8,136 | ) | — | — | (2,054 | ) | (2,630 | ) | (52,659 | ) | 2,054 | (63,425 | ) | ||||||||||||||||||||||||
| Proceeds from sales of investments | 6,716 | — | — | 4,994 | 5,343 | 57,262 | (4,994 | ) | 69,321 | 520 | — | — | 341 | 542 | 16,382 | (341 | ) | 17,444 | ||||||||||||||||||||||||||||||||
| Proceeds from maturities of investments | 2,900 | — | — | 1,349 | 2,234 | 68,589 | (1,349 | ) | 73,723 | 6,000 | — | — | 1,634 | 2,083 | 24,319 | (1,634 | ) | 32,402 | ||||||||||||||||||||||||||||||||
| Changes in investments and advances—intercompany | (6,320 | ) | — | (41,656 | ) | 86 | (1,744 | ) | 49,720 | (86 | ) | — | (2,509 | ) | — | (3,234 | ) | 7 | 345 | 5,398 | (7 | ) | — | |||||||||||||||||||||||||||
| Business acquisitions | — | — | — | — | — | (602 | ) | — | (602 | ) | — | (9 | ) | — | — | — | 9 | — | — | |||||||||||||||||||||||||||||||
| Other investing activities | — | (3,876 | ) | — | — | — | 10,065 | — | 6,189 | — | (481 | ) | — | — | — | (1,488 | ) | — | (1,969 | ) | ||||||||||||||||||||||||||||||
| Net cash used in investing activities | $ | (5,506 | ) | $ | (3,845 | ) | $ | (41,656 | ) | $ | (2,114 | ) | $ | (3,010 | ) | $ | (116,461 | ) | $ | 2,114 | $ | (170,478 | ) | |||||||||||||||||||||||||||
| Net cash (used in) provided by investing activities | $ | (4,125 | ) | $ | (587 | ) | $ | (3,234 | ) | $ | 228 | $ | 697 | $ | (30,722 | ) | $ | (228 | ) | $ | (37,971 | ) | ||||||||||||||||||||||||||||
| Cash flows from financing activities | ||||||||||||||||||||||||||||||||||||||||||||||||||
| Dividends paid | $ | (6,943 | ) | $ | — | $ | — | $ | — | $ | — | $ | — | $ | — | $ | (6,943 | ) | $ | (2,491 | ) | $ | — | $ | — | $ | — | $ | — | $ | — | $ | — | $ | (2,491 | ) | ||||||||||||||
| Dividends paid-intercompany | — | (1,197 | ) | — | — | — | 1,197 | — | — | — | (620 | ) | — | — | (35 | ) | 655 | — | — | |||||||||||||||||||||||||||||||
| Issuance of common stock | 895 | — | — | — | — | — | — | 895 | 258 | — | — | — | — | — | — | 258 | ||||||||||||||||||||||||||||||||||
| Redemption or retirement of preferred stock | (125 | ) | — | — | — | — | — | — | (125 | ) | ||||||||||||||||||||||||||||||||||||||||
| Treasury stock acquired | (8,371 | ) | — | — | — | — | — | — | (8,371 | ) | (2,000 | ) | — | — | — | — | — | — | (2,000 | ) | ||||||||||||||||||||||||||||||
| Proceeds/(Repayments) from issuance of long-term debt-third party, net | 7,913 | (2,341 | ) | 4,116 | (733 | ) | (3,180 | ) | 5,529 | 733 | 12,037 | |||||||||||||||||||||||||||||||||||||||
| Proceeds/(Repayments) from issuance of long-term debt debt-intercompany, net | — | 930 | — | 3,724 | (411 | ) | (519 | ) | (3,724 | ) | — | |||||||||||||||||||||||||||||||||||||||
| Proceeds/(Repayments) from issuance of long-term debt—third-party, net | 6,222 | (4,353 | ) | 5,126 | (119 | ) | (114 | ) | 3,734 | 119 | 10,615 | |||||||||||||||||||||||||||||||||||||||
| Proceeds/(Repayments) from issuance of long-term debt—intercompany, net | 516 | 1,725 | — | (420 | ) | (1,398 | ) | (843 | ) | 420 | — | |||||||||||||||||||||||||||||||||||||||
| Change in deposits | — | — | — | — | — | 16,321 | — | 16,321 | — | — | — | (1 | ) | — | 35,530 | 1 | 35,530 | |||||||||||||||||||||||||||||||||
| Net change in short-term borrowings and other investment banking and brokerage borrowings—third party | (1,057 | ) | (11,971 | ) | 24,691 | (20 | ) | 76 | (10,282 | ) | 20 | 1,457 | ||||||||||||||||||||||||||||||||||||||
| Net change in short-term borrowings and other investment banking and brokerage borrowings—third-party | (1 | ) | (2,457 | ) | (7,766 | ) | (1,520 | ) | (1,208 | ) | 2,632 | 1,520 | (8,800 | ) | ||||||||||||||||||||||||||||||||||||
| Net change in short-term borrowings and other advances—intercompany | 1,533 | 30,872 | 12,614 | (3,205 | ) | 2,899 | (47,918 | ) | 3,205 | — | 397 | 1,700 | 5,495 | 767 | 343 | (7,935 | ) | (767 | ) | — | ||||||||||||||||||||||||||||||
| Capital contributions from parent | - | 1,000 | 75 | — | 175 | (1,250 | ) | — | — | — | — | 482 | 108 | 35 | (517 | ) | (108 | ) | — | |||||||||||||||||||||||||||||||
| Other financing activities | (627 | ) | — | — | 185 | 4 | (7 | ) | (185 | ) | (630 | ) | (569 | ) | — | — | 1 | 1 | (1 | ) | (1 | ) | (569 | ) | ||||||||||||||||||||||||||
| Net cash (used in) provided by financing activities | $ | (6,657 | ) | $ | 17,293 | $ | 41,496 | $ | (49 | ) | $ | (437 | ) | $ | (36,929 | ) | $ | 49 | $ | 14,766 | ||||||||||||||||||||||||||||||
| Net cash provided by (used in) financing activities | $ | 2,207 | $ | (4,005 | ) | $ | 3,337 | $ | (1,184 | ) | $ | (2,376 | ) | $ | 33,255 | $ | 1,184 | $ | 32,418 | |||||||||||||||||||||||||||||||
| Effect of exchange rate changes on cash and due from banks | $ | — | $ | — | $ | — | $ | — | $ | — | $ | (346 | ) | $ | — | $ | (346 | ) | $ | — | $ | — | $ | — | $ | — | $ | — | $ | 162 | $ | — | $ | 162 | ||||||||||||||||
| Net increase in cash and due from banks | $ | 218 | $ | 449 | $ | 1 | $ | 285 | $ | 271 | $ | 3,116 | $ | (285 | ) | $ | 4,055 | |||||||||||||||||||||||||||||||||
| Net decrease in cash and due from banks | $ | (137 | ) | $ | (491 | ) | $ | — | $ | (59 | ) | $ | (88 | ) | $ | (1,505 | ) | $ | 59 | $ | (2,221 | ) | ||||||||||||||||||||||||||||
| Cash and due from banks at beginning of period | 28 | 3,233 | — | 401 | 584 | 16,768 | (401 | ) | 20,613 | 247 | 3,913 | 1 | 687 | 876 | 18,595 | (687 | ) | 23,632 | ||||||||||||||||||||||||||||||||
| Cash and due from banks at end of period from continuing operations | $ | 246 | $ | 3,682 | $ | 1 | $ | 686 | $ | 855 | $ | 19,884 | $ | (686 | ) | $ | 24,668 | $ | 110 | $ | 3,422 | $ | 1 | $ | 628 | $ | 788 | $ | 17,090 | $ | (628 | ) | $ | 21,411 | ||||||||||||||||
| Supplemental disclosure of cash flow information | ||||||||||||||||||||||||||||||||||||||||||||||||||
| Cash paid during the year for: | ||||||||||||||||||||||||||||||||||||||||||||||||||
| Income taxes | $ | (160 | ) | $ | 426 | $ | — | $ | 546 | $ | 87 | $ | 5,899 | $ | (546 | ) | $ | 6,252 | $ | 33 | $ | 1,526 | $ | — | $ | (23 | ) | $ | (10 | ) | $ | (532 | ) | $ | 23 | $ | 1,017 | |||||||||||||
| Interest | $ | 2,850 | $ | 8,981 | $ | 199 | $ | 160 | $ | 329 | $ | 10,698 | $ | (160 | ) | $ | 23,057 | 1,206 | 4,478 | 524 | 167 | 122 | 4,820 | (167 | ) | 11,150 | ||||||||||||||||||||||||
| Non-cash investing activities: | ||||||||||||||||||||||||||||||||||||||||||||||||||
| Transfers to repossessed assets | $ | — | $ | — | $ | — | $ | 741 | $ | 764 | $ | 172 | $ | (741 | ) | $ | 936 | $ | — | $ | — | $ | — | $ | 278 | $ | 284 | $ | 74 | $ | (278 | ) | $ | 358 | ||||||||||||||||
Item 1. Legal Proceedings
The following information supplements and amends our discussion set forth under Part I, Item 3 "Legal Proceedings" in our Annual Report on Form 10-K for the fiscal year ended December 31, 2005, as updated by our Quarterly Reports on Form 10-Q for the quarters ended March 31, 2006 and June 30, 2006.
Enron Corp.
In light Following the decision of the settlementCourt of Appeals for the Fifth Circuit on March 19, 2007, reversing the District Court's certification of a class in NEWBY, et al. v. ENRON CORP., et al., the District Court, on March 20, 2007, stayed all actions coordinated or consolidated with NEWBY in which plaintiffs asserted claims under Section 10(b) of the securities class action (NEWBY, ET AL. V. ENRON CORP., ET AL.), the plaintiffs have agreed to dismiss the following lawsuitsSecurities Exchange Act of 1934 against Citigroup: CALIFORNIA PUBLIC EMPLOYEES' RETIREMENT SYSTEM V. BANC OF AMERICA SECURITIES LLC, ET AL.; HEADWATERS CAPITAL LLC V. LAY ET AL.; and VARIABLE ANNUITY LIFE INS. CO. V. CREDIT SUISSE FIRST BOSTON CORP., ET AL. Plaintiffs in two other cases, which are not part of the NEWBY class, have also voluntarily dismissed their claims against Citigroup: STEINER V. ENRON CORP., ET AL. and TOWN OF NEW HARTFORD V. LAY, ET AL.
WorldCom, Inc.
On September 11, 2006, Citigroup settled HOLTSBERG V. CITIGROUP, ET AL. and 25 related cases pending in Palm Beach Circuit Court brought by individuals who opted out of the WorldCom securities class action settlement. The settlement was covered by existing reserves.
On October 13, 2006, the United States District Court for the Southern District of New York dismissed with prejudice the claims in HOLMES, ET AL. V. GRUBMAN, ET AL., an action brought by an individual and entities who opted out of the WorldCom securities class action settlement.financial institutions.
Research
Telecommunications Research Class Actions.
On August 17, 2006,March 23, 2007, the United States District Court for the Southern District of New York approved Citigroup's settlement of a putative class action, settlement of IN RE SALOMON ANALYST AT&T LITIGATION, and on September 29, 2006 that same court approved Citigroup's class action settlements in IN RE SALOMON ANALYST LEVEL 3 LITIGATION, IN RE SALOMON ANALYST XO LITIGATION, and IN RE SALOMON ANALYST WILLIAMS LITIGATION.
On September 14, 2006, Citigroup settled all claims asserted against the company by claimants in STURM, ET AL.LOS ANGELES CITY EMPLOYEES RETIREMENT ASSOCIATION v. CITIGROUP, ET AL. The settlement was covered by existing reserves.which asserted claims under the Securities Exchange Act of 1934 concerning Salomon Smith Barney's equity research coverage of Focal Communications.
Customer Class Actions.
On October 6, 2006,In DISHER V. CITIGROUP GLOBAL MARKETS INC., on March 2, 2007, the United StatesDistrict Court of Appeals granted interlocutory review ofvacated its 2005 order dismissing the district court's decision certifying a plaintiff class in IN RE SALOMON ANALYST METROMEDIA LITIGATION.case and remanded the action to Illinois state court.
Parmalat
In BONDI v. CITIGROUP, on September 19, 2006,On March 9, 2007, the New Jersey Superior Court, Appellate Division, denied Citigroup's motion for leave to appeal the denial of its renewed motion to dismiss the complaint in BONDI V. CITIGROUP on the ground of forum non conveniens. On March 26, 2007, Citigroup filed a motion for leave to appeal with the New Jersey Supreme Court; that motion is pending.
IPO Securities Litigation
On April 6, 2007, the Second Circuit panel that reversed the district court's class certification decision denied plaintiffs' petition for rehearing. The companion petition for rehearing en banc remains pending before the Second Circuit.
Other
In IN RE: CITIGROUP PENSION PLAN ERISA LITIGATION, on April 4, 2007, the District Court denied defendants' motion for leaveentry of a partial final judgment, for permission to file an interlocutory appeal from the Appellate Division's affirmancesummary judgment order, and for a stay of the trial court's denial of defendants' motion to dismiss.
Adelphia Communications Corporation
Defendant banks in IN RE ADELPHIA COMMUNICATIONS CORPORATION SECURITIES AND DERIVATIVE LITIGATION, including the Citigroup Parties, have entered into settlement agreements with the Los Angeles County Employees Retirement Association and with The Division of Investment of the New Jersey Department of Treasury. The Citigroup Parties' share of the settlement was covered by existing reserves.
Otherproceedings.
In CARROLL v. WEILL, ET AL., in September 2006, the New York Supreme Court scheduled aheld fairness hearinghearings on the proposed settlement for December 14, 2006.on February 28 and March 1, 2007.
Item 1A. Risk Factors
There are no material changes from the risk factors set forth under Part I, Item 1A. "Risk Factors" in our Annual Report on Form 10-K for the fiscal year ended December 31, 2005.2006.
Item 2. Unregistered Sales of Equity Securities and Use of Proceeds.Proceeds
(a) In connection with the November 2002 acquisition by the Company of Golden State Bancorp Inc., on September 20, 2006, the Company issued to GSB Investments Corp., a Delaware corporation (GSB Investments), and Hunter's Glen/Ford, Ltd., a limited partnership organized under the laws of the State of Texas (HG/F), respectively, 23,352 and 5,838 shares of Company common stock. These shares were issued in satisfaction of the rights of GSB Investments and HG/F to receive shares of Company common stock in respect of $1,433,903 of federal income tax benefits realized by the Company.
The September 20, 2006 issuance was made in reliance upon an exemption from the registration requirements of the Securities Act of 1933 provided by Section 4(2) thereof. GSB Investments and HG/F made certain representations to the Company as to investment intent and that they possessed a sufficient level of financial sophistication. The unregistered shares are subject to restrictions on transfer absent registration under or in compliance with the Securities Act of 1933.
(c) Share Repurchases
Under its long-standing repurchase program (which was expanded by $10 billion in the 2006 second quarter as noted below), the Company buys back common shares in the market or otherwise from time to time. The share repurchases areprogram is used for many purposes, including to offset dilution from stock-based compensation programs.
The following table summarizes the Company's share repurchases during the first ninethree months of 2006:2007:
| In millions, except per share amounts | Total Shares Repurchased | Average Price Paid per Share | Dollar Value of Remaining Authorized Repurchase Program | ||||||
|---|---|---|---|---|---|---|---|---|---|
| First quarter 2006 | |||||||||
| Open market repurchases(1) | 42.9 | $ | 46.58 | $ | 2,412 | ||||
| Employee transactions(2) | 8.7 | $ | 46.40 | N/A | |||||
| Total first quarter 2006 | 51.6 | $ | 46.55 | $ | 2,412 | ||||
Second quarter 2006 | |||||||||
| Open market repurchases(1) | 40.8 | $ | 48.98 | $ | 10,412 | ||||
| Employee transactions | 2.8 | $ | 49.71 | N/A | |||||
| Total second quarter 2006 | 43.6 | $ | 49.02 | $ | 10,412 | ||||
| July 2006 | |||||||||
| Open market repurchases | 4.8 | $ | 47.44 | $ | 10,184 | ||||
| Employee transactions | 0.9 | $ | 48.48 | N/A | |||||
| August 2006 | |||||||||
| Open market repurchases | 15.8 | $ | 48.66 | $ | 9,415 | ||||
| Employee transactions | 0.3 | $ | 48.51 | N/A | |||||
| September 2006 | |||||||||
| Open market repurchases | 20.3 | $ | 49.43 | $ | 8,412 | ||||
| Employee transactions | 0.3 | $ | 49.68 | N/A | |||||
| Third quarter 2006 | |||||||||
| Open market repurchases | 40.9 | $ | 48.90 | $ | 8,412 | ||||
| Employee transactions | 1.5 | $ | 48.75 | N/A | |||||
| Total third quarter 2006 | 42.4 | $ | 48.89 | $ | 8,412 | ||||
Year-to-date 2006 | |||||||||
| Open market repurchases | 124.6 | $ | 48.12 | $ | 8,412 | ||||
| Employee transactions | 13.0 | $ | 47.39 | N/A | |||||
| Total year-to-date 2006 | 137.6 | $ | 48.06 | $ | 8,412 | ||||
| In millions, except per share amounts | Total Shares Repurchased | Average Price Paid per Share | Dollar Value of Remaining Authorized Repurchase Program | ||||||
|---|---|---|---|---|---|---|---|---|---|
| January 2007 | |||||||||
| Open market repurchases(1) | 2.9 | $ | 54.49 | $ | 7,254 | ||||
| Employee transactions(2) | 6.8 | $ | 54.53 | N/A | |||||
February 2007 | |||||||||
| Open market repurchases | 7.3 | $ | 53.71 | $ | 6,860 | ||||
| Employee transactions | 0.4 | $ | 54.29 | N/A | |||||
March 2007 | |||||||||
| Open market repurchases | 1.9 | $ | 50.29 | $ | 6,767 | ||||
| Employee transactions | 0.9 | $ | 54.76 | N/A | |||||
First Quarter 2007 | |||||||||
| Open market repurchases | 12.1 | $ | 53.37 | $ | 6,767 | ||||
| Employee transactions | 8.1 | $ | 54.55 | N/A | |||||
| Total First Quarter 2007 | 20.2 | $ | 53.85 | $ | 6,767 | ||||
N/A Not applicable
Item 4. Submission of Matters to a Vote of Security Holders
Citigroup's Annual Meeting of Stockholders was held on April 17, 2007. At the meeting:
The number of votes cast for, against or withheld, and the number of abstentions with respect to each such matter is set forth below, as are the number of broker non-votes, where applicable.
| | FOR | AGAINST | ABSTAIN | BROKER NON-VOTES | ||||
|---|---|---|---|---|---|---|---|---|
| (1) Election of Directors: | ||||||||
NOMINEE | ||||||||
C. Michael Armstrong | 4,150,454,249 | 120,163,488 | 46,861,332 | |||||
| Alain J.P. Belda | 4,160,910,252 | 109,707,763 | 46,866,535 | |||||
| George David | 4,202,727,104 | 67,919,899 | 46,837,554 | |||||
| Kenneth T. Derr | 4,134,957,833 | 162,251,923 | 20,274,788 | |||||
| John M. Deutch | 4,152,146,631 | 117,721,359 | 47,616,561 | |||||
| Roberto Hernández Ramirez | 4,169,798,806 | 100,482,090 | 47,203,847 | |||||
| Klaus Kleinfeld | 4,175,239,630 | 95,279,329 | 46,965,638 | |||||
| Andrew N. Liveris | 4,202,761,803 | 67,658,587 | 47,064,399 | |||||
| Anne Mulcahy | 4,177,473,457 | 94,917,447 | 45,093,864 | |||||
| Richard D. Parsons | 4,005,464,792 | 266,702,615 | 45,319,797 | |||||
| Charles Prince | 4,119,288,816 | 152,244,657 | 45,951,307 | |||||
| Judith Rodin | 4,195,276,630 | 75,715,601 | 46,492,549 | |||||
| Robert E. Rubin | 4,165,193,389 | 109,962,087 | 42,327,965 | |||||
| Franklin A. Thomas | 4,156,669,331 | 112,119,979 | 48,689,224 | |||||
(2) Ratification of Independent Registered Public Accounting Firm | 4,172,091,417 | 107,811,429 | 37,583,440 | |||||
(3) Stockholder Proposal Requesting a Report on Prior Governmental Service of Certain Individuals | 171,435,798 | 2,826,567,343 | 479,202,952 | 840,272,976 | ||||
(4) Stockholder Proposal Requesting a Report on Political Contributions | 875,138,389 | 2,008,231,317 | 593,887,347 | 840,222,016 |
| | FOR | AGAINST | ABSTAIN | BROKER NON-VOTES | ||||
|---|---|---|---|---|---|---|---|---|
| (5) Stockholder Proposal Requesting a Report on Charitable Contributions | 264,111,642 | 2,677,424,647 | 535,670,167 | 840,272,613 | ||||
(6) Stockholder Proposal Requesting an Advisory Resolution to Ratify Executive Compensation | 1,474,115,104 | 1,713,686,408 | 238,551,235 | 891,126,322 | ||||
(7) Stockholder Proposal Requesting that the Chairman of the Board Have no Management Duties, Titles or Responsibilities | 716,308,894 | 2,709,442,838 | 51,502,618 | 840,224,719 | ||||
(8) Stockholder Proposal Requesting Cumulative Voting | 622,349,193 | 2,800,531,750 | 54,388,525 | 840,209,601 | ||||
(9) Stockholder Proposal Requesting that Stockholders Have the Right to Call Special Shareholder Meetings | 2,071,546,407 | 1,245,612,951 | 160,087,812 | 840,231,899 |
Item 6. Exhibits
See Exhibit Index.
Pursuant to the requirements of the Securities Exchange Act of 1934, the Registrant has duly caused this report to be signed on its behalf by the undersigned, thereunto duly authorized, on the 3rd4th day of November, 2006.May, 2007.
| CITIGROUP INC. (Registrant) | ||||
By | /s/ Chief Financial Officer (Principal Financial Officer) | |||
By | /s/ JOHN C. GERSPACH John C. Gerspach Controller and Chief Accounting Officer (Principal Accounting Officer) | |||
| Exhibit Number | Description of Exhibit | |
|---|---|---|
3.01.1 | Restated Certificate of Incorporation of Citigroup Inc. (the Company), incorporated by reference to Exhibit 4.01 to the Company's Registration Statement on Form S-3 filed December 15, 1998 (No. 333-68949). | |
3.01.2 | Certificate of Designation of 5.321% Cumulative Preferred Stock, Series YY, of the Company, incorporated by reference to Exhibit 4.45 to Amendment No. 1 to the Company's Registration Statement on Form S-3 filed January 22, 1999 (No. 333-68949). | |
3.01.3 | Certificate of Amendment to the Restated Certificate of Incorporation of the Company dated April 18, 2000, incorporated by reference to Exhibit 3.01.3 to the Company's Quarterly Report on Form 10-Q for the fiscal quarter ended March 31, 2000 (File No. 1-9924). | |
3.01.4 | Certificate of Amendment to the Restated Certificate of Incorporation of the Company dated April 17, 2001, incorporated by reference to Exhibit 3.01.4 to the Company's Quarterly Report on Form 10-Q for the fiscal quarter ended March 31, 2001 (File No. 1-9924). | |
3.01.5 | Certificate of Designation of 6.767% Cumulative Preferred Stock, Series YYY, of the Company, incorporated by reference to Exhibit 3.01.5 to the Company's Annual Report on Form 10-K for the fiscal year ended December 31, 2001 (File | |
3.01.6 | Certificate of Amendment to the Restated Certificate of Incorporation of the Company dated April 18, 2006, incorporated by reference to Exhibit 3.01.6 to the Company's Quarterly Report on Form 10-Q for the fiscal quarter ended March 31, 2006 (File No. 1-9924). | |
3.02 | By-Laws of the Company, as amended, effective January | |
Calculation of Ratio of Income to Fixed Charges. | ||
Calculation of Ratio of Income to Fixed Charges (including preferred stock dividends). | ||
Certification of principal executive officer pursuant to Section 302 of the Sarbanes-Oxley Act of 2002. | ||
Certification of principal financial officer pursuant to Section 302 of the Sarbanes-Oxley Act of 2002. | ||
Certification pursuant to 18 U.S.C. Section 1350, as adopted pursuant to Section 906 of the Sarbanes-Oxley Act of 2002. | ||
Residual Value Obligation Certificate. |
The total amount of securities authorized pursuant to any instrument defining rights of holders of long-term debt of the Company does not exceed 10% of the total assets of the Company and its consolidated subsidiaries. The Company will furnish copies of any such instrument to the Securities and Exchange Commission upon request.
+