NOTES TO THE FINANCIAL STATEMENTS (UNAUDITED)
General
These combined notes accompany and form an integral part of the separate interim consolidated financial statements of each of the two2 separate registrants: Consolidated Edison, Inc. and its subsidiaries (Con Edison) and Consolidated Edison Company of New York, Inc. and its subsidiaries (CECONY). CECONY is a subsidiary of Con Edison and as such its financial condition and results of operations and cash flows, which are presented separately in the CECONY consolidated financial statements, are also consolidated, along with those of Orange and Rockland Utilities, Inc. (O&R), Con Edison Clean Energy Businesses, Inc. (together with its subsidiaries, the Clean Energy Businesses) and Con Edison Transmission, Inc. (together with its subsidiaries, Con Edison Transmission) in Con Edison’s consolidated financial statements. The term “Utilities” is used in these notes to refer to CECONY and O&R.
As used in these notes, the term “Companies” refers to Con Edison and CECONY and, except as otherwise noted, the information in these combined notes relates to each of the Companies. However, CECONY makes no representation as to information relating to Con Edison or the subsidiaries of Con Edison other than itself.
The separate interim consolidated financial statements of each of the Companies are unaudited but, in the opinion of their respective managements, reflect all adjustments (which include only normally recurring adjustments) necessary for a fair presentationstatement of the results for the interim periods presented. The Companies’ separate interim consolidated financial statements should be read together with their separate audited financial statements (including the combined notes thereto) included in Item 8 of their combined Annual Report on Form 10-K for the year ended December 31, 20162020 and their separate unaudited financial statements (including the combined notes thereto) included in Part 1, Item 1 of their combined Quarterly ReportReports on Form 10-Q for the quarterly periods ended March 31, 20172021 and June 30, 2017. Certain prior period amounts have been reclassified to conform to the current period presentation.2021.
Con Edison has two2 regulated utility subsidiaries: CECONY and O&R. CECONY provides electric service and gas service in New York City and Westchester County. The company also provides steam service in parts of Manhattan. O&R, along with its regulated utility subsidiary, provides electric service in southeastern New York and northern New Jersey and gas service in southeastern New York. Con Edison Clean Energy Businesses, Inc. has three subsidiaries: Consolidated Edison Development, Inc. (Con Edison Development), a company thatthrough its subsidiaries, develops, owns and operates renewable and sustainable energy infrastructure projects; Consolidated Edison Energy, Inc. (Con Edison Energy), a company thatprojects and provides energy-related products and services to wholesale customers; and Consolidated Edison Solutions, Inc. (Con Edison Solutions), a company that provides energy-related products and services to retail customers. Con Edison Transmission, Inc. invests in and seeks to develop electric transmission facilitiesprojects through its subsidiary, Consolidated Edison Transmission, LLC (CET Electric), and investsmanages, through joint ventures, investments in gas pipeline and storage facilities through its subsidiary Con Edison Gas Pipeline and Storage, LLC (CET Gas). See “Investments” in Note A and Note R.
Note A – Summary of Significant Accounting Policies and Other Matters
Accounting Policies
The accounting policies of Con Edison and its subsidiaries conform to generally accepted accounting principles in the United States of America (GAAP). For the Utilities, these accounting principles include the accounting rules for regulated operations and the accounting requirements of the Federal Energy Regulatory Commission (FERC) and the state regulators having jurisdiction.
Investments
Con Edison's investments consist primarily of the investments of Con Edison Transmission that are accounted for under the equity method and the fair value of the Utilities' supplemental retirement income plan and deferred income plan assets.
Partial Impairment of Investment in Stagecoach Gas Services LLC (Stagecoach)
In May 2021, a subsidiary of Con Edison Gas Pipeline and Storage, LLC (CET Gas) entered into a purchase and sale agreement pursuant to which the subsidiary and its joint venture partner agreed to sell their combined interests in Stagecoach Gas Services LLC (Stagecoach) for a total of $1,225 million, of which $612.5 million will be CET Gas' portion for its 50 percent interest, subject to closing adjustments. The purchase and sale agreement contemplates a two-stage closing, the first of which was completed in July 2021 for a sale price of $1,195 million, of which $614 million, including working capital, was attributed to CET Gas. The second closing for the remaining $30 million, of which $15 million will be attributed to CET Gas, subject to closing adjustments, is to occur following approval by the New York State Public Service Commission, which is expected later this year or during the first quarter of 2022, subject to customary closing conditions.
As a result of information made available to Stagecoach as part of the sale process, Stagecoach performed impairment tests that resulted in Stagecoach recording impairment charges of $414 million for the nine months ended September 30, 2021. Accordingly, Con Edison recorded pre-tax impairment losses on its 50 percent interest
20
in Stagecoach of $211 million ($147 million after-tax), including working capital and transaction cost adjustments, within "Investment income/(loss)" on Con Edison's consolidated income statement for the nine months ended September 30, 2021. These charges reduced the carrying value of Con Edison’s investment in Stagecoach to $630 million at June 30, 2021.
Stagecoach’s impairment charges and information obtained from the sales process constituted triggering events for Con Edison's investment in Stagecoach as of March 31, 2021 and June 30, 2021. Con Edison evaluated the carrying value of its investment in Stagecoach for other-than-temporary declines in value using income and market-based approaches. Con Edison determined that the carrying value of its investment in Stagecoach of $667 million and $630 million as of March 31, 2021 and June 30, 2021, respectively, was not impaired. The carrying value of $630 million at June 30, 2021 approximates the final sales price received in July 2021 and the remaining amount expected to be received, including closing adjustments.
The accounting rules require Con Edison to evaluate its investments periodically to determine whether they are impaired. The standard for determining whether an impairment exists and must be recorded is whether an other-than-temporary decline in carrying value has occurred. Changes in economic conditions, forecasted cash flows and the regulatory environment, among other factors, could require equity method investments to recognize a decrease in carrying value for an other-than-temporary decline. When management believes such a decline may have occurred, the fair value of the investment is estimated using market inputs, when observable, or a market valuation model such as a discounted cash flow analysis. The fair value is compared to the carrying value of the investment in order to determine the amount of impairment to record, if any.
The evaluation and measurement of impairments involve uncertainties. The judgments that Con Edison makes to estimate the fair value of its equity method investments are based on assumptions that management believes are reasonable, and variations in these estimates or the underlying assumptions, or the receipt of additional market information, could have a material impact on whether a triggering event is determined to exist or the amount of any such impairment. Additionally, if the projects in which Con Edison holds these investments recognize an impairment, Con Edison may record a share of that impairment loss and would evaluate its investment for an other-than-temporary decline in carrying value as described above.
Reclassification
Certain prior period amounts have been reclassified to conform with current period presentation.
Earnings Per Common Share
Con Edison presents basic and diluted earnings per share (EPS) on the face of its consolidated income statement. Basic EPS is calculated by dividing earnings available to common shareholders (“Net income”income for common stock” on Con Edison’s consolidated income statement) by the weighted average number of Con Edison common shares outstanding during the period. In the calculation of diluted EPS, weighted average shares outstanding areis increased for additional shares that would be outstanding if potentially dilutive securities were converted to common stock.
Potentially dilutive securities for Con Edison consist of restricted stock units and deferred stock units and stock options for which the average market price of the common shares for the period was greater than the exercise price.
For the three and nine months ended September 30, 20172021 and 2016,2020, basic and diluted EPS for Con Edison arewere calculated as follows:
| For the Three Months Ended September 30, | For the Nine Months Ended September 30, | |||||||||||||
| (Millions of Dollars, except per share amounts/Shares in Millions) | 2021 | 2020 | 2021 | 2020 | ||||||||||
| Net income for common stock | $538 | $493 | $1,122 | $1,058 | ||||||||||
| Weighted average common shares outstanding – basic | 353.4 | 334.5 | 346.8 | 334.1 | ||||||||||
| Add: Incremental shares attributable to effect of potentially dilutive securities | 0.7 | 0.9 | 0.7 | 0.9 | ||||||||||
| Adjusted weighted average common shares outstanding – diluted | 354.1 | 335.4 | 347.5 | 335.0 | ||||||||||
| Net Income per common share – basic | $1.52 | $1.47 | $3.23 | $3.17 | ||||||||||
| Net Income per common share – diluted | $1.52 | $1.47 | $3.23 | $3.16 | ||||||||||
The computation of diluted EPS for the three and nine months ended September 30, 2021 and 2020 excludes immaterial amounts of performance share awards that were not included because of their anti-dilutive effect.
21
| For the Three Months Ended September 30, | For the Nine Months Ended September 30, | |||
| (Millions of Dollars, except per share amounts/Shares in Millions) | 2017 | 2016 | 2017 | 2016 |
| Net income | $457 | $497 | $1,020 | $1,039 |
| Weighted average common shares outstanding – basic | 307.8 | 304.5 | 306.2 | 299.1 |
| Add: Incremental shares attributable to effect of potentially dilutive securities | 1.5 | 1.4 | 1.5 | 1.4 |
| Adjusted weighted average common shares outstanding – diluted | 309.3 | 305.9 | 307.7 | 300.5 |
| Net Income per common share – basic | $1.48 | $1.63 | $3.33 | $3.47 |
| Net Income per common share – diluted | $1.48 | $1.62 | $3.31 | $3.46 |
Changes in Accumulated Other Comprehensive Income/(Loss) by Component
For the three and nine months ended September 30, 20172021 and 2016,2020, changes to accumulated other comprehensive income/(loss) (OCI) for Con Edison and CECONY arewere as follows:
| For the Three Months Ended September 30, | ||||||||||||||
| Con Edison | CECONY | |||||||||||||
| (Millions of Dollars) | 2021 | 2020 | 2021 | 2020 | ||||||||||
| Beginning balance, accumulated OCI, net of taxes (a) | $(19) | $(14) | $(7) | $(4) | ||||||||||
Amounts reclassified from accumulated OCI related to pension plan liabilities, net of tax of $(1) for Con Edison in 2021 and 2020 (a)(b) | 2 | 2 | — | — | ||||||||||
| Current period OCI, net of taxes | 2 | 2 | — | — | ||||||||||
| Ending balance, accumulated OCI, net of taxes (a) | $(17) | $(12) | $(7) | $(4) | ||||||||||
| For the Nine Months Ended September 30, | ||||||||||||||
| Con Edison | CECONY | |||||||||||||
| (Millions of Dollars) | 2021 | 2020 | 2021 | 2020 | ||||||||||
| Beginning balance, accumulated OCI, net of taxes (a) | $(25) | $(19) | $(7) | $(6) | ||||||||||
| OCI before reclassifications, net of tax of $(1) for Con Edison in 2021 and 2020 | 2 | 4 | — | — | ||||||||||
| Amounts reclassified from accumulated OCI related to pension plan liabilities, net of tax of $(2) for Con Edison in 2021 and 2020 (a)(b) | 6 | 3 | — | 2 | ||||||||||
| Current period OCI, net of taxes | 8 | 7 | — | 2 | ||||||||||
| Ending balance, accumulated OCI, net of taxes (a) | $(17) | $(12) | $(7) | $(4) | ||||||||||
(a) Tax reclassified from accumulated OCI is reported in the income tax expense line item of the consolidated income statement.
(b)For the portion of unrecognized pension and other postretirement benefit costs relating to the Utilities, costs are recorded into, and amortized out of, regulatory assets and liabilities instead of OCI. The net actuarial losses and prior service costs recognized during the period are included in the computation of total periodic pension and other postretirement benefit costs. See Notes E and F.
Reconciliation of Cash, Temporary Cash Investments and Restricted Cash
Cash, temporary cash investments and restricted cash are presented on a combined basis in the Companies’ consolidated statements of cash flows. At September 30, 2021 and 2020, cash, temporary cash investments and restricted cash for Con Edison and CECONY were as follows:
| At September 30, | ||||||||||||||
| Con Edison | CECONY | |||||||||||||
| (Millions of Dollars) | 2021 | 2020 | 2021 | 2020 | ||||||||||
| Cash and temporary cash investments | $66 | $153 | $18 | $23 | ||||||||||
| Restricted cash (a) | 149 | 161 | — | — | ||||||||||
| Total cash, temporary cash investments and restricted cash | $215 | $314 | $18 | $23 | ||||||||||
(a)Restricted cash included cash of the Clean Energy Businesses' renewable electric production project subsidiaries ($149 million and $161 million at September 30, 2021 and 2020, respectively) that, under the related project debt agreements, is restricted to being used for normal operating expenses and capital expenditures, debt service, and required reserves until the various maturity dates of the project debt.
| For the Three Months Ended September 30, | |||||
| Con Edison | CECONY | ||||
| (Millions of Dollars) | 2017 | 2016 | 2017 | 2016 | |
| Beginning balance, accumulated OCI, net of taxes (a) | $(27) | $(33) | $(7) | $(8) | |
| Amounts reclassified from accumulated OCI related to pension plan liabilities, net of tax of $(1) for Con Edison in 2017 and 2016 (a)(b) | 1 | 1 | 1 | — | |
| Current period OCI, net of taxes | 1 | 1 | 1 | — | |
| Ending balance, accumulated OCI, net of taxes | $(26) | $(32) | $(6) | $(8) | |
| For the Nine Months Ended September 30, | ||||||
| Con Edison | CECONY | |||||
| (Millions of Dollars) | 2017 | 2016 | 2017 | 2016 | ||
| Beginning balance, accumulated OCI, net of taxes (a) | $(27) | $(34) | $(7) | $(9) | ||
| OCI before reclassifications, net of tax of $1 for Con Edison in 2017 and 2016 | (2) | (1) | — | — | ||
| Amounts reclassified from accumulated OCI related to pension plan liabilities, net of tax of $(2) for Con Edison in 2017 and 2016 (a)(b) | 3 | 3 | 1 | 1 | ||
| Current period OCI, net of taxes | 1 | 2 | 1 | 1 | ||
| Ending balance, accumulated OCI, net of taxes | $(26) | $(32) | $(6) | $(8) | ||
Note B —– Regulatory Matters
Rate Plans
In October 2021, O&R, the New York State Department of Public Service (NYSDPS) and other parties entered into a Joint Proposal for new electric and gas rate plans for the three-year period January 2022 through December 2024 (the Joint Proposal). The Joint Proposal is subject to NYSPSC approval. The Joint Proposal includes certain COVID-19 provisions, such as: recovery of 2020 late payment charges over 3 years ($2.8 million); reconciliation of late payment charges to amounts reflected in rates for years 2021 through 2024, with full recovery/refund via surcharge/sur-credit once the annual variance equals or exceeds 5 basis points of return on equity; and reconciliation of write-offs of customer accounts receivable balances to amounts reflected in rates from January 1, 2020 through December 31, 2024, with full recovery/refund via surcharge/sur-credit once the annual variance equals or exceeds 5 basis points of return on equity. The following tables contain a summary of the proposed rate plans.
| O&R New York – Electric | |||||
| Effective period | January 2022 – December 2024 (c) | ||||
| Base rate changes | Yr. 1 – $4.9 million (a) Yr. 2 – $16.2 million (a) Yr. 3 – $23.1 million (a) | ||||
| Amortizations to income of net regulatory (assets) and liabilities (b) | Yr. 1 – $11.8 million Yr. 2 – $13.5 million Yr. 3 – $15.2 million | ||||
| Other revenue sources | Potential earnings adjustment mechanism incentives for energy efficiency and other potential incentives of up to: Yr. 1 – $3.3 million Yr. 2 – $2.3 million Yr. 3 – $4.0 million | ||||
| Revenue decoupling mechanisms | Continuation of reconciliation of actual to authorized electric delivery revenues. | ||||
| Recoverable energy costs | Continuation of current rate recovery of purchased power and fuel costs. | ||||
| Negative revenue adjustments | Potential charges if certain performance targets relating to service, reliability, safety and other matters are not met: Yr. 1 – $4.3 million Yr. 2 – $4.4 million Yr. 3 – $5.1 million | ||||
| Cost reconciliations | Reconciliation of expenses for pension and other postretirement benefits, environmental remediation costs, property taxes (d), energy efficiency program (e), major storms, and certain other costs to amounts reflected in rates. | ||||
| Net utility plant reconciliations | Target levels reflected in rates: Electric average net plant target Yr. 1 – $1,175 million Yr. 2 – $1,198 million Yr. 3 – $1,304 million | ||||
| Average rate base | Yr. 1 – $1,021 million Yr. 2 – $1,044 million Yr. 3 – $1,144 million | ||||
| Weighted average cost of capital (after-tax) | Yr. 1 – 6.77 percent Yr. 2 – 6.73 percent Yr. 3 – 6.72 percent | ||||
| Authorized return on common equity | 9.2 percent | ||||
| Earnings sharing | Most earnings above an annual earnings threshold of 9.7 percent are to be applied to reduce regulatory assets for environmental remediation and other costs accumulated in the rate year. | ||||
| Cost of long-term debt | Yr. 1 – 4.58 percent Yr. 2 – 4.51 percent Yr. 3 – 4.49 percent | ||||
| Common equity ratio | 48 percent | ||||
(a) The Joint Proposal recommends that these base rate changes may be implemented with increases of: Yr. 1 - $11.7 million; Yr. 2 - $11.7 million; and Yr. 3 - $11.7 million.
(b) Reflects amortization of, among other things, previously incurred incremental deferred storm costs over a five-year period. See "Other Regulatory Matters," below.
(c) If at the end of any year, Con Edison’s investments in its non-utility businesses exceed 15 percent of Con Edison’s total consolidated revenues, assets or cash flow, or if the ratio of holding company debt to total consolidated debt rises above 20 percent, O&R is required to notify the NYSPSC and submit a ring-fencing plan or a demonstration why additional ring-fencing measures are not necessary.
(d) Deferrals for property taxes are limited to 90 percent of the difference from amounts reflected in rates, subject to an annual maximum for the remaining difference of not more than a maximum number of basis points impact on return on common equity: Yr. 1 - 10.0 basis points; Yr. 2 - 7.5 basis points; and Yr. 3 - 5.0 basis points.
(e) Energy efficiency costs are expensed as incurred. Such costs are subject to a cumulative reconciliation that is evenly distributed over the term of the rate plan subject to the caps set forth in the January 2020 NYSPSC New Efficiency New York (“NENY”) order. If the NYSPSC modifies O&R's NENY budgets during the rate term, such modifications will be reflected at the time of the cumulative reconciliations.
23
| O&R New York – Gas | |||||
| Effective period | January 2022 – December 2024 (b) | ||||
| Base rate changes | Yr. 1 – $0.7 million (a) Yr. 2 – $7.4 million (a) Yr. 3 – $9.9 million (a) | ||||
| Amortization to income of net regulatory (assets) and liabilities | Yr. 1 – $0.8 million Yr. 2 – $0.7 million Yr. 3 – $0.3 million | ||||
| Other revenue sources | Potential earnings adjustment mechanism incentives for energy efficiency and other potential incentives of up to: Yr. 1 - $0.2 million Yr. 2 - $0.2 million Yr. 3 - $0.4 million Potential positive rate adjustment for gas safety and performance of up to: Yr. 1 – $1.2 million Yr. 2 – $1.3 million Yr. 3 – $1.4 million | ||||
| Revenue decoupling mechanisms | Continuation of reconciliation of actual to authorized gas delivery revenues. | ||||
| Recoverable energy costs | Continuation of current rate recovery of purchased gas costs. | ||||
| Negative revenue adjustments | Potential charges if performance targets relating to service, safety and other matters are not met: Yr. 1 – $6.3 million Yr. 2 – $6.7 million Yr. 3 – $7.3 million | ||||
| Cost reconciliations | Reconciliation of expenses for pension and other postretirement benefits, environmental remediation costs, property taxes (c), energy efficiency program (d), major storms and certain other costs to amounts reflected in rates. | ||||
| Net utility plant reconciliations | Target levels reflected in rates: Gas average net plant target Yr. 1 – $720 million Yr. 2 – $761 million Yr. 3 – $803 million | ||||
| Average rate base | Yr. 1 – $566 million Yr. 2 – $607 million Yr. 3 – $649 million | ||||
| Weighted average cost of capital (after-tax) | Yr. 1 – 6.77 percent Yr. 2 – 6.73 percent Yr. 3 – 6.72 percent | ||||
| Authorized return on common equity | 9.2 percent | ||||
| Earnings sharing | Most earnings above an annual earnings threshold of 9.7 percent are to be applied to reduce regulatory assets for environmental remediation and other costs accumulated in the rate year. | ||||
| Cost of long-term debt | Yr. 1 – 4.58 percent Yr. 2 – 4.51 percent Yr. 3 – 4.49 percent | ||||
| Common equity ratio | 48 percent | ||||
(a) The Joint Proposal recommends that these base rate changes may be implemented with increases of: Yr. 1 – $4.4 million; Yr. 2 - $4.4 million; and Yr. 3 - $4.4 million.
(b) If at the end of any year, Con Edison’s investments in its non-utility businesses exceed 15 percent of Con Edison’s total consolidated revenues, assets or cash flow, or if the ratio of holding company debt to total consolidated debt rises above 20 percent, O&R is required to notify the NYSPSC and submit a ring-fencing plan or a demonstration why additional ring-fencing measures are not necessary.
(c) Deferrals for property taxes are limited to 90 percent of the difference from amounts reflected in rates, subject to an annual maximum for the remaining difference of not more than a maximum number of basis points impact on return on common equity: Yr. 1 - 10.0 basis points; Yr. 2 - 7.5 basis points; and Yr. 3 - 5.0 basis points.
(d) Energy efficiency costs are expensed as incurred. Such costs are subject to a cumulative reconciliation that is evenly distributed over the term of the rate plan subject to the caps set forth in the January 2020 NYSPSC New Efficiency New York (“NENY”) order. If the NYSPSC modifies O&R’s NENY budgets during the rate term, such modifications will be reflected at the time of the cumulative reconciliations.
24
Rockland Electric Company (RECO)
In February 2017,May 2021, RECO filed a request with the New Jersey Board of Public Utilities (NJBPU) approved a stipulation of settlement for a RECOan electric rate plan commencing March 2017. The following table contains a summaryincrease of the electric rate plan.
In September 2021, RECO requested authorization from the NJBPU to defer $3.7 million in incremental storm preparation costs for Tropical Storm Henri.
COVID-19 Regulatory Matters
Governors, public utility commissions and other regulatory agencies in the states in which the Utilities operate have issued orders related to the COVID-19 pandemic that impact the Utilities as described below.
New York State Regulation
In March 2020, former New York State Governor Cuomo declared a State Disaster Emergency for the State of New York due to the COVID-19 pandemic and signed the "New York State on PAUSE" executive order that temporarily closed all non-essential businesses statewide. The former Governor then lifted these closures over time and ended the emergency declaration in June 2021. As a result of the emergency declaration, and due to economic conditions, the NYSPSC and the Utilities have worked to mitigate the potential impact of the COVID-19 pandemic on the Utilities, their customers and other stakeholders.
In March 2020, the Utilities began suspending service disconnections, certain collection notices, final bill collection agency activity, new late payment charges and certain other fees for all customers. The Utilities also began providing payment extensions for all customers that were scheduled to be disconnected prior to the start of the COVID-19 pandemic. In June 2020, the state of New York enacted a law prohibiting New York utilities, including CECONY and O&R, from disconnecting residential customers, and starting in May 2021 small business customers, during the COVID-19 state of emergency, which ended in June 2021. In addition, such prohibitions will apply for an additional 180 days after the state of emergency ends (December 21, 2021) for residential and small business customers who have experienced a change in financial circumstances due to the COVID-19 pandemic. For the three and nine months ended September 30, 2021, the estimated late payment charges and fees that were not billed were approximately $11��million and $46 million lower than the amounts that were approved to be collected pursuant to CECONY's rate plans, respectively, and $1 million and $3 million lower than the amounts that were approved to be collected pursuant to O&R's rate plans, respectively (see Note K). For the three and nine months ended September 30, 2020, the estimated late payment charges and fees that were not billed were approximately $17 million and $36 million lower than the amounts that were approved to be collected pursuant to CECONY's rate plans, respectively, and $1 million and $2 million lower than the amounts that were approved to be collected pursuant to O&R's rate plans, respectively (see Note K). In April 2021, CECONY filed a petition with the NYSPSC to timely establish a surcharge recovery mechanism to collect $52 million of late payment charges and fees, offset for related savings, for the year ended December 31, 2020 to begin in September 2021 and end in December 2022. The petition also requested a surcharge recovery or surcredit mechanism for any fee deferrals for 2021 and 2022 starting in January of the subsequent year over a twelve-month period, respectively. Public comments in response to the petition were filed in August 2021. CECONY resumed late payment charges for commercial and residential customers who have not experienced a change in financial circumstances due to the COVID-19 pandemic on September 3, 2021 and October 1, 2021, respectively.O&R resumed late payment charges for commercial and residential customers who have not experienced a change in financial circumstances due to the COVID-19 pandemic on October 1, 2021.
25
The Utilities’ New York rate plans allow them to defer costs resulting from a change in legislation, regulation and related actions that have taken effect during the term of the rate plans once the costs exceed a specified threshold. The total reserve increases to the allowance for uncollectible accounts from January 1, 2020 through September 30, 2021 reflecting the impact of the COVID-19 pandemic for CECONY electric and gas operations and O&R electric and gas operations were $235 million and $7 million, respectively, and were deferred pursuant to the legislative, regulatory and related actions provisions of the rate plans as a result of the New York State on PAUSE and related executive orders, that have since been lifted, as described above. The Utilities’ New York rate plans also provide for an allowance for write-offs of customer accounts receivable balances. The above amounts deferred pursuant to the legislative, regulatory and related actions provisions were reduced by the amount that the actual write-offs of customer accounts receivable balances were below the allowance reflected in rates which differences were $12 million and $2 million for CECONY and O&R, respectively, from March 1, 2020 through September 30, 2021.
In June 2020, the NYSPSC directed CECONY to implement a summer cooling credit program to help mitigate the cost of staying home and operating air conditioning for health-vulnerable low-income customers due to the limited availability of public cooling facilities as a result of the COVID-19 social distancing measures. The $63.4 million cost of the program is being recovered over a five-year period that began January 2021.
In June 2020, the NYSPSC established a generic proceeding on the impacts of the COVID-19 pandemic and sought comment on a variety of COVID-19 related issues. In July 2020, the Utilities submitted joint comments with other large utilities in New York State that included a formal request to defer all COVID-19 related costs and for a surcharge mechanism to collect such deferrals based upon the individual utility's need. In January 2021, the NYSDPS provided guidance to New York utilities that no additional mechanisms are required because there are already established mechanisms for utility recovery of unexpected material expenses through rate plan change in legislation, regulation and related actions provisions of their respective rate plans and the filing of individual deferral petitions. The guidance further provided that utilities deferring COVID-19 related costs pursuant to the provisions that allow deferral of costs resulting from a change in legislation, regulation and related actions must comply with the provisions of their rate plans, be able to demonstrate the nexus between the changes in law or regulation and the specific revenue and expense items, and consider any offsetting cost savings due to the pandemic.
As of December 31, 2020, CECONY deferred, for New York City residential customers, $54.9 million of higher summer generation capacity supply costs. CECONY recovered such costs from customers as of October 31, 2021.
In April 2021, New York State passed a law that creates a program that allows eligible residential renters in New York State who require assistance with rent and utility bills to have up to twelve months of electric and gas utility bill arrears forgiven, provided that such arrears were accrued on or after March 13, 2020. The program will be administered by the State Office of Temporary Disability Assistance in coordination with the NYSDPS. Under the program, CECONY and O&R would qualify for a refundable tax credit for New York State gross-receipts tax equal to the amount of arrears waived by the Utilities in the year that the arrears are waived and certified by the NYSPSC.
In May 2021, CECONY and O&R, along with other large New York utilities, submitted joint comments to the NYSDPS' February 2021 report on New York State’s Energy Affordability Policy. The report recommends, among other things, that residential and commercial customers’ late payment fees and interest on deferred payment agreements be waived until two years after the expiration of the New York State moratorium on utility terminations (the moratorium will expire on December 21, 2021) and each utility develop an arrears management program to mitigate the financial burdens of the COVID-19 pandemic on New York households and that program costs be shared, perhaps equally, between shareholders and customers.The May 2021 joint comments stated that it is not necessary for the NYSPSC to adopt the report’s COVID-19 related recommendations because New York State already passed laws that address the issues in the report, as described above.
The Utilities’ rate plans have revenue decoupling mechanisms in their New York electric and gas businesses that largely reconcile actual energy delivery revenues to the authorized delivery revenues approved by the NYSPSC per month and accumulate the deferred balances semi-annually under CECONY's electric rate plan (January through June and July through December, respectively) and annually under CECONY's gas rate plan and O&R's New York electric and gas rate plans (January through December). Differences are accrued with interest each month for CECONY's and O&R's New York electric customers and after the annual deferral period ends for CECONY's and O&R's New York gas customers for refund to, or recovery from customers, as applicable. Generally, the refund to or recovery from customers begins August and February of each year over an ensuing six-month period for CECONY's electric customers and February of each year over an ensuing twelve-month period for CECONY's gas and O&R's New York electric and gas customers.
26
New Jersey State Regulation
In March 2020, New Jersey Governor Murphy declared a Public Health Emergency and State of Emergency for the State of New Jersey. In June 2021, the Governor ended the emergency declaration. As a result of the emergency declaration, and due to economic conditions, the NJBPU and RECO have worked to mitigate the potential impact of the COVID-19 pandemic on RECO, its customers and other stakeholders. In March 2020, RECO began suspending late payment charges, terminations for non-payment, and no access fees during the COVID-19 pandemic. The suspension of these fees continued through July 31, 2021 and are not material.
In July 2020, the NJBPU authorized RECO and other New Jersey utilities to create a COVID-19-related regulatory asset by deferring prudently incurred incremental costs related to the COVID-19 pandemic beginning on March 9, 2020, and has extended such deferrals through December 31, 2022. RECO deferred net incremental COVID-19 related costs of $0.9 million through September 30, 2021.
Other Regulatory Matters
CECONY, under its electric rate plan that was approved in January 2020, is amortizing its TCJA net benefits prior to January 1, 2019 allocable to its electric customers ($377 million) over a three-year period, the “protected” portion of its net regulatory liability for future income taxes related to certain accelerated tax depreciation benefits allocable to its electric customers ($1,663 million) over the remaining lives of the related assets and the remainder, or “unprotected” portion of the net regulatory liability allocable to its electric customers ($784 million) over a five-year period. CECONY, under its gas rate plan that was approved in January 2020, is amortizing its remaining TCJA net benefits prior to January 1, 2019 allocable to its gas customers ($63 million) over a two-year period, the protected portion of its net regulatory liability for future income taxes allocable to its gas customers ($725 million) over the remaining lives of the related assets and the unprotected portion of the net regulatory liability allocable to its gas customers ($107 million) over a five-year period.
CECONY's net benefits prior to October 1, 2018 allocable to the company’s steam customers ($15 million) are being amortized over a three-year period. CECONY’s net regulatory liability for future income taxes, including both the protected and unprotected portions, allocable to the company’s steam customers ($185 million) is being amortized over the remaining lives of the related assets (with the amortization period for the unprotected portion subject to review in its next steam rate proceeding).
O&R, under its current electric and gas rate plans, has reflected its TCJA net benefits in its electric and gas rates beginning as of January 1, 2019. Under the rate plans, O&R is amortizing its net benefits prior to January 1, 2019 ($22 million) over a three-year period, the protected portion of its net regulatory liability for future income taxes ($123 million) over the remaining lives of the related assets and the unprotected portion ($30 million) over a fifteen-year period. Pursuant to the October 2021 Joint Proposal, O&R will amortize the remaining unprotected portion of its net regulatory liability for future income taxes ($34 million) over a six-year period beginning January 1, 2022.
In January 2018, the NYSPSC issued an order in its proceeding investigating an April 21, 2017 Metropolitan Transportation Authority (MTA) subway power outage. The order indicated that the investigation determined that the outage was caused byinitiating a failure of CECONY’s electricity supply to a subway station, which led to a lossfocused operations audit of the subway signals, and that oneUtilities’ financial accounting for income taxes. The audit is investigating the Utilities’ inadvertent understatement of a portion, the secondary services to the MTA facility had been improperly rerouted andamount of which may be material, of their calculation of total federal income tax expense for ratemaking purposes. The understatement was not properly documented by the company. The order also indicated that the loss of power to the subway station affected multiple subway lines and caused widespread delays across the subway system. Pursuant to the order, the company is required to take certain actions, including performing inspections of electrical equipment that serves the MTA system, analyzing power supply and power quality events affecting the MTA’s signaling services, providing new monitoring and other equipment and filing monthly reports with the NYSPSC on all of the company's activities related to the MTA system. In July 2017,calculation of plant retirement-related cost of removal. As a result of such understatement, the ChairmanUtilities accumulated significant income tax regulatory assets that were not reflected in O&R’s rate plans prior to 2014, CECONY’s electric and gas rate plans prior to 2015 and 2016, respectively, and is currently not reflected in CECONY’s steam rate plan. As part of the NYSPSC notifiedaudit, the companyUtilities plan to pursue a private letter ruling from the Internal Revenue Service (IRS) that the April 21, 2017 subway power outage incident will likely resultis expected to confirm, among other things, that in order to comply with IRS normalization rules, such understatement may not be corrected through a prudence reviewwrite-down of a portion of the reasonablenessregulatory asset and must be corrected through an increase in future years’ revenue requirements. The regulatory asset ($1,180 million and $26 million for CECONY and O&R, respectively, as of CECONY's actionsSeptember 30, 2021 and conduct.$1,200 million and $29 million for CECONY and O&R, respectively, as of December 31, 2020) is netted against the future income tax regulatory liability on the Companies’ consolidated balance sheet. The order did not commence a prudence review or address cost recovery. Under the New York State Administrative Procedure Act, the order could not remain in effect for more than 90 days without further action by the NYSPSC because it was adopted on an emergency basis. At its October 19, 2017 meeting, the NYSPSC approved another order in this proceeding. The NYSPSC has not yet issued this other order. The company isUtilities are unable to estimate the amount or range of itstheir possible costsloss, if any, related to this matter. At September 30, 2021, the Utilities have not accrued a liability related to this matter.
27
In October 2020, the NYSPSC issued an order instituting a proceeding to consider requiring New York’s large, investor-owned utilities, including CECONY and O&R, to annually disclose what risks climate change poses to their companies, investors and customers going forward. The order notes that some holding companies, including Con Edison, already disclose climate change risks at the holding company level, but states that the NYSPSC believes that climate-related risk disclosures should be issued specific to the operating companies in New York, such as CECONY and O&R, and that such climate-related risk disclosures should be included annually with the utilities’ financial reports. In December 2020, CECONY and O&R, along with other large New York utilities, filed comments supporting climate change risk disclosures in annual reports filed with the NYSPSC and recommended the use of Contentsan industry-specific template.
In May 2020, the president of the United States issued the "Securing the United States Bulk-Power System" executive order. The executive order declares threats to the bulk-power system by foreign adversaries constitute a national emergency and prohibits the acquisition, importation, transfer or installation of certain bulk-power system electric equipment that is sourced from foreign adversaries. In January 2021, the president of the United States suspended the May 2020 executive order for 90 days. In April 2021, the executive order was reinstated (and expired shortly thereafter) and the Department of Energy (DOE) subsequently issued a request for information to assist the DOE in developing additional orders and/or regulations to secure the United States’ critical electric infrastructure. In September 2021, the Cybersecurity and Infrastructure Security Agency and the National Institute of Standards and Technology issued preliminary cybersecurity goals for critical infrastructure control systems, with final goals to be issued by September 2022. The Companies are unable to predict the impact on them of any orders or regulations that may be adopted regarding critical infrastructure.
In July 2021, the NYSPSC approved a settlement agreement among CECONY, O&R and the NYSDPS that fully resolves all issues and allegations that have been raised or could have been raised by the NYSPSC against CECONY and O&R with respect to: (1) the July 2018 rupture of a CECONY steam main located on Fifth Avenue and 21st Street in Manhattan (the “2018 Steam Incident”); (2) the July 2019 electric service interruptions to approximately 72,000 CECONY customers on the west side of Manhattan and to approximately 30,000 CECONY customers primarily in the Flatbush area of Brooklyn (the “2019 Manhattan and Brooklyn Outages”); (3) the August 2020 electric service interruptions to approximately 330,000 CECONY customers and approximately 200,000 O&R customers following Tropical Storm Isaias (the “Tropical Storm Isaias Outages”) and (4) the August 2020 electric service interruptions to approximately 190,000 customers resulting from faults at CECONY’s Rainey substation following Tropical Storm Isaias (the “Rainey Outages”). Pursuant to the settlement agreement, CECONY and O&R agreed to a total settlement amount of $75.1 million and $7.0 million, respectively. CECONY and O&R agreed to forgo recovery from customers of $25 million and $2.5 million, respectively, associated with the return on existing storm hardening assets beginning with the next rate plan for each utility (over a period of 35 years). CECONY and O&R also agreed to incur ongoing operations and maintenance costs of up to $15.8 million and $2.9 million, respectively, for, among other things, costs to maintain a certain level of contractor and vehicle storm emergency support and storm preparation audits. For CECONY, the settlement agreement includes previously incurred or accrued costs of $34.3 million, including negative revenue adjustments of $5 million for the Rainey Outages and $15 million for the 2019 Manhattan and Brooklyn Outages and $14.3 million in costs to reimburse customers for food and medicine spoilage and other previously incurred expenses related to Tropical Storm Isaias and the 2018 Steam Incident. For O&R, the settlement agreement includes previously incurred costs of $1.6 million to reimburse customers for food and medicine spoilage and other expenses related to the Tropical Storm Isaias Outages.
Additional information relating to the 2018 Steam Incident, 2019 Manhattan and Brooklyn Outages and Tropical Storm Isaias Outages follow.
2018 Steam Incident: In July 2018, the NYSPSC commenced an investigation into the rupture of a CECONY steam main located on Fifth Avenue and 21st Street in Manhattan. Debris from the incident included dirt and mud containing asbestos. The response to the incident required the closing of buildings and streets for various periods. As of June 30, 2021, with respect to the incident, the company incurred operating costs of $17 million for property damage, clean-up and other response costs and invested $9 million in capital and retirement costs. During the second quarter of 2020, the company accrued a $3 million liability related to this matter. As described above, in July 2021, CECONY entered into a settlement agreement that fully resolves all issues and allegations with respect to this matter.
2019 Manhattan and Brooklyn Outages:In July 2019, electric service was interrupted to approximately 72,000 CECONY customers on the west side of Manhattan. Also in July 2019, electric service was interrupted to approximately 30,000 CECONY customers primarily in the Flatbush area of Brooklyn. In November 2020, the NYSPSC issued an order in its proceedings investigating these July 2019 power outages ordering CECONY to
28
show cause why the NYSPSC should not commence a review of the prudency of CECONY’s actions and/or omissions prior to, during, and after the July 2019 outages in Manhattan and Brooklyn, and pursue civil or administrative penalties in the amount of up to $24.8 million for CECONY’s alleged failure to comply with certain requirements. The order further indicated that should the NYSPSC confirm some or all of the apparent violations identified in the order or other orders issued by the NYSPSC in the future in connection with this proceeding, and should such confirmed violations be classified as findings of repeated violations of the Public Service Law or rules or regulations adopted pursuant thereto that demonstrate a failure of CECONY to continue to provide safe and adequate service, the NYSPSC would be authorized to commence a proceeding under Public Service Law Section 68(2) to revoke or modify CECONY’s certificate as it relates to its service territory or any portion thereof.
In December 2020, CECONY filed a response to the NYSPSC order demonstrating why the NYSPSC should not commence a penalty or prudence action against CECONY. CECONY stated that the NYSPSC order misapplied Section 25-a of the Public Service Law by ignoring the reasonable compliance standard under the statute and instead, was imposing a strict liability standard. For both outages, CECONY presented evidence that it either had complied or reasonably complied with NYSPSC requirements. With respect to the Manhattan outage, CECONY stated that a prudency proceeding was not justified because CECONY’s actions with respect to the Manhattan outage were reasonable based on the information the company had at the time. With respect to the Brooklyn outage, the company stated that the order failed to allege that improper company actions caused the outage. During 2019, CECONY recorded negative revenue adjustments associated with reliability performance provisions of $15 million in aggregate primarily related to these outages. As described above, in July 2021, CECONY entered into a settlement agreement that fully resolves all issues and allegations with respect to this matter.
Tropical Storm Isaias Outages:In August 2020, Tropical Storm Isaias caused significant damage to the Utilities’ electric distribution systems and interrupted service to approximately 330,000 CECONY electric customers and approximately 200,000 O&R electric customers. As of September 30, 2021, CECONY incurred costs for Tropical Storm Isaias of $175 million (including $84 million of operation and maintenance expenses charged against a storm reserve pursuant to its electric rate plan, $64 million of capital expenditures and $27 million (including $7.5 million for food and medicine spoilage claims) of operation and maintenance expenses). As of September 30, 2021, O&R incurred costs for Tropical Storm Isaias of $26.5 million (including $19.2 million of operation and maintenance expenses charged against a storm reserve pursuant to its New York electric rate plan, $5.7 million of capital expenditures and $1.6 million for food and medicine spoilage claims). As of September 30, 2021, RECO incurred costs for Tropical Storm Isaias of $11.3 million (including $7.5 million of operation and maintenance expenses charged against a storm reserve pursuant to its rate plan, $2.5 million of capital expenditures and $1.3 million for food and medicine spoilage claims). The Utilities’ electric rate plans provide for recovery of operating costs and capital expenditures under different provisions. The Utilities’ incremental operating costs attributable to storms are to be deferred for recovery as a regulatory asset under their electric rate plans, while capital expenditures, up to specified levels, are reflected in rates under their electric rate plans. The provisions of the Utilities’ New York electric rate plans that impose negative revenue adjustments for operating performance provide for exceptions for major storms and catastrophic events beyond the control of the companies, including natural disasters such as hurricanes and floods.
In November 2020, the NYSPSC issued an order in its proceedings investigating the New York utilities’ preparation for and response to Tropical Storm Isaias that ordered the Utilities to show cause why (i) civil penalties or appropriate injunctive relief should not be imposed against CECONY (in the amount of up to $102.3 million relating to 33 alleged violations) and against O&R (in the amount of up to $19 million relating to 38 alleged violations) to remedy such noncompliance, and (ii) a prudence proceeding should not be commenced against the Utilities for potentially imprudent expenditures of ratepayer funds related to the matter. The order stated that given the continuing nature of the investigation of this matter by the NYSDPS, the NYSPSC may amend the order to include any subsequently determined apparent violations identified by the NYSDPS. In addition, the order indicated that should the NYSPSC confirm some or all of the apparent violations identified in the order or other orders issued by the NYSPSC in the future in connection with this proceeding, and should such respective confirmed violations be classified as findings of repeated violations of the Public Service Law or rules or regulations adopted pursuant thereto that demonstrate a failure of CECONY and/or O&R to continue to provide safe and adequate service, the NYSPSC would be authorized to commence a proceeding under Public Service Law Section 68(2) to revoke or modify CECONY’s and/or O&R’s certificate as it relates to its service territory or any portion thereof.
In December 2020, CECONY and O&R filed responses to the NYSPSC order demonstrating why the NYSPSC should not commence penalty or prudence actions against them. The Utilities stated that the NYSPSC orders misapplied Section 25-a of the Public Service Law by ignoring the reasonable compliance standard under the statute and instead, was imposing a strict liability standard. CECONY and O&R also presented evidence that the order either misrepresented the applicable requirements or ignored that the Utilities were acting pursuant to
29
practices approved by the NYSPSC. Finally, CECONY and O&R stated that there was no basis to commence a prudence proceeding because the Utilities acted reasonably based on the information available and the circumstances at the time. As described above, in July 2021, CECONY and O&R entered into a settlement agreement that fully resolves all issues and allegations with respect to this matter.
30
Regulatory Assets and Liabilities
Regulatory assets and liabilities at September 30, 20172021 and December 31, 20162020 were comprised of the following items:
| Con Edison | CECONY | ||||||||||||||||
| (Millions of Dollars) | 2021 | 2020 | 2021 | 2020 | |||||||||||||
| Regulatory assets | |||||||||||||||||
| Unrecognized pension and other postretirement costs | $2,527 | $3,241 | $2,394 | $3,065 | |||||||||||||
| Environmental remediation costs | 846 | 865 | 780 | 791 | |||||||||||||
| Pension and other postretirement benefits deferrals | 438 | 315 | 382 | 272 | |||||||||||||
| Revenue taxes | 385 | 356 | 369 | 342 | |||||||||||||
| COVID-19 pandemic deferrals | 274 | 115 | 269 | 113 | |||||||||||||
| Deferred storm costs | 277 | 195 | 155 | 83 | |||||||||||||
| Property tax reconciliation | 245 | 241 | 245 | 239 | |||||||||||||
| MTA power reliability deferral | 152 | 188 | 152 | 188 | |||||||||||||
| System peak reduction and energy efficiency programs | 145 | 124 | 145 | 124 | |||||||||||||
| Deferred derivative losses - long term | 136 | 120 | 124 | 111 | |||||||||||||
| Municipal infrastructure support costs | 49 | 62 | 49 | 62 | |||||||||||||
| Brooklyn Queens demand management program | 35 | 36 | 35 | 36 | |||||||||||||
| Meadowlands heater odorization project | 30 | 32 | 30 | 32 | |||||||||||||
| Preferred stock redemption | 20 | 21 | 20 | 21 | |||||||||||||
| Non-wire alternative projects | 23 | 18 | 23 | 18 | |||||||||||||
| Unamortized loss on reacquired debt | 17 | 21 | 15 | 19 | |||||||||||||
| Recoverable REV demonstration project costs | 15 | 20 | 14 | 18 | |||||||||||||
| Gate station upgrade project | 15 | 25 | 15 | 25 | |||||||||||||
| Other | 274 | 200 | 257 | 186 | |||||||||||||
| Regulatory assets – noncurrent | 5,903 | 6,195 | 5,473 | 5,745 | |||||||||||||
| Deferred derivative losses - short term | 166 | 190 | 155 | 177 | |||||||||||||
| Recoverable energy costs | 39 | 76 | 32 | 67 | |||||||||||||
| Regulatory assets – current | 205 | 266 | 187 | 244 | |||||||||||||
| Total Regulatory Assets | $6,108 | $6,461 | $5,660 | $5,989 | |||||||||||||
| Regulatory liabilities | |||||||||||||||||
| Future income tax | $2,040 | $2,207 | $1,896 | $2,062 | |||||||||||||
| Allowance for cost of removal less salvage | 1,114 | 1,090 | 950 | 932 | |||||||||||||
| Net unbilled revenue deferrals | 184 | 198 | 184 | 198 | |||||||||||||
| TCJA net benefits* | 167 | 295 | 164 | 286 | |||||||||||||
| Net proceeds from sale of property | 111 | 137 | 111 | 137 | |||||||||||||
| Deferred derivative gains - long term | 110 | 5 | 101 | 4 | |||||||||||||
| Pension and other postretirement benefit deferrals | 98 | 85 | 53 | 46 | |||||||||||||
| System benefit charge carrying charge | 71 | 64 | 63 | 57 | |||||||||||||
| Property tax refunds | 35 | 36 | 35 | 35 | |||||||||||||
| BQDM and REV Demo reconciliations | 26 | 27 | 22 | 25 | |||||||||||||
| Sales and use tax refunds | 18 | 16 | 17 | 16 | |||||||||||||
| Energy efficiency portfolio standard unencumbered funds | 17 | 1 | 19 | — | |||||||||||||
| Earnings sharing - electric, gas and steam | 13 | 15 | 10 | 10 | |||||||||||||
| Unrecognized other postretirement costs | 12 | 11 | — | — | |||||||||||||
| Settlement of gas proceedings | 11 | 21 | 11 | 21 | |||||||||||||
| Settlement of prudence proceeding | 6 | 5 | 6 | 5 | |||||||||||||
| Workers' compensation | 5 | 3 | 5 | 3 | |||||||||||||
| Other | 341 | 297 | 294 | 257 | |||||||||||||
| Regulatory liabilities – noncurrent | 4,379 | 4,513 | 3,941 | 4,094 | |||||||||||||
| Deferred derivative gains - short term | 451 | 8 | 423 | 7 | |||||||||||||
| Refundable energy costs | 31 | 28 | 5 | 4 | |||||||||||||
| Revenue decoupling mechanism | 8 | — | — | — | |||||||||||||
| Regulatory liabilities – current | 490 | 36 | 428 | 11 | |||||||||||||
| Total Regulatory Liabilities | $4,869 | $4,549 | $4,369 | $4,105 | |||||||||||||
* See "Other Regulatory Matters," above.
The recognition of the return on regulatory assets is determined by the Utilities’ rate plans or orders issued by state regulators. In general, the Utilities receive or are being credited with a return at the Other Customer-Provided
31
| Con Edison | CECONY | ||||||
| (Millions of Dollars) | 2017 | 2016 | 2017 | 2016 | |||
| Regulatory assets | |||||||
| Unrecognized pension and other postretirement costs | $2,626 | $2,874 | $2,476 | $2,730 | |||
| Future income tax | 2,419 | 2,439 | 2,308 | 2,325 | |||
| Environmental remediation costs | 803 | 823 | 690 | 711 | |||
| Revenue taxes | 341 | 295 | 325 | 280 | |||
| Deferred derivative losses | 88 | 48 | 78 | 42 | |||
| Pension and other postretirement benefits deferrals | 70 | 38 | 45 | 7 | |||
| Municipal infrastructure support costs | 57 | 44 | 57 | 44 | |||
| Deferred storm costs | 43 | 56 | — | 3 | |||
| Unamortized loss on reacquired debt | 39 | 43 | 37 | 41 | |||
| Indian Point Energy Center program costs | 32 | 50 | 32 | 50 | |||
| O&R property tax reconciliation | 29 | 37 | — | — | |||
| Brooklyn Queens demand management program | 28 | 29 | 28 | 29 | |||
| Preferred stock redemption | 24 | 25 | 24 | 25 | |||
| Surcharge for New York State assessment | 18 | 28 | 16 | 26 | |||
| Net electric deferrals | 13 | 24 | 13 | 24 | |||
| Workers’ compensation | 12 | 13 | 12 | 13 | |||
| O&R transition bond charges | 10 | 15 | — | — | |||
| Recoverable energy costs | 4 | 42 | 4 | 38 | |||
| Other | 113 | 101 | 103 | 85 | |||
| Regulatory assets – noncurrent | 6,769 | 7,024 | 6,248 | 6,473 | |||
| Deferred derivative losses | 81 | 91 | 75 | 86 | |||
| Recoverable energy costs | 28 | 9 | 25 | 4 | |||
| Regulatory assets – current | 109 | 100 | 100 | 90 | |||
| Total Regulatory Assets | $6,878 | $7,124 | $6,348 | $6,563 | |||
| Regulatory liabilities | |||||||
| Allowance for cost of removal less salvage | $798 | $755 | $671 | $641 | |||
| Pension and other postretirement benefit deferrals | 202 | 193 | 174 | 162 | |||
| Net unbilled revenue deferrals | 166 | 145 | 166 | 145 | |||
| Property tax reconciliation | 140 | 178 | 140 | 178 | |||
| Unrecognized other postretirement costs | 84 | 60 | 84 | 60 | |||
| Settlement of prudence proceeding | 73 | 95 | 73 | 95 | |||
| Carrying charges on repair allowance and bonus depreciation | 49 | 68 | 48 | 67 | |||
| New York State income tax rate change | 48 | 61 | 48 | 60 | |||
| Variable-rate tax-exempt debt – cost rate reconciliation | 36 | 55 | 32 | 48 | |||
| Property tax refunds | 28 | 1 | 28 | 1 | |||
| Settlement of gas proceedings | 27 | 27 | 27 | 27 | |||
| Base rate change deferrals | 26 | 40 | 26 | 40 | |||
| Earnings sharing - electric, gas and steam | 24 | 39 | 15 | 28 | |||
| Net utility plant reconciliations | 11 | 16 | 8 | 15 | |||
| Other | 161 | 172 | 133 | 145 | |||
| Regulatory liabilities – noncurrent | 1,873 | 1,905 | 1,673 | 1,712 | |||
| Refundable energy costs | 29 | 29 | 9 | 5 | |||
| Revenue decoupling mechanism | 27 | 71 | 27 | 61 | |||
| Deferred derivative gains | 2 | 28 | 2 | 24 | |||
| Regulatory liabilities – current | 58 | 128 | 38 | 90 | |||
| Total Regulatory Liabilities | $1,931 | $2,033 | $1,711 | $1,802 | |||
In general, the Utilities are receiving or being credited with a return on their regulatory assets for which a cash outflow has been made ($2,027 million and $1,696 million for Con Edison, and $1,817 million and $1,509 million for CECONY at September 30, 2021 and December 31, 2020, respectively). Regulatory assets of RECO for which a cash outflow has been made ($24 million and $31 million at September 30, 2021 and December 31, 2020, respectively) are not receiving or being credited with a return. RECO recovers regulatory assets over a period of up to four years or until they are addressed in its next base rate case in accordance with the rate provisions approved by the New Jersey Board of Public Utilities. Regulatory liabilities are treated in a consistent manner.
Regulatory assets that represent future financial obligations and were deferred in accordance with the Utilities’ rate plans or orders issued by state regulators do not earn a return until such time as a cash outlay has been made. Regulatory liabilities are treated in a consistent manner. At September 30, 2021 and December 31, 2020, regulatory assets for Con Edison and CECONY that did not earn a return consisted of the following items:
Regulatory Assets Not Earning a Return*
| Con Edison | CECONY | |||||||||||||
| (Millions of Dollars) | 2021 | 2020 | 2021 | 2020 | ||||||||||
| Unrecognized pension and other postretirement costs | $2,527 | $3,241 | $2,394 | $3,065 | ||||||||||
| Environmental remediation costs | 832 | 855 | 765 | 781 | ||||||||||
| Revenue taxes | 364 | 336 | 349 | 323 | ||||||||||
| Deferred derivative losses - long term | 136 | 120 | 124 | 111 | ||||||||||
| Other | 56 | 24 | 56 | 24 | ||||||||||
| Deferred derivative losses - current | 166 | 190 | 155 | 177 | ||||||||||
| Total | $4,081 | $4,766 | $3,843 | $4,481 | ||||||||||
*This table includes regulatory assets not earning a return for which no cash outlay has been made.
The recovery periods for regulatory assets for which a cash outflow has not been made and that do not earn a return have not yet been determined, except as noted below, and are expected to be determined pursuant to the Utilities’ future rate plans to be filed or orders issued by the state regulators in connection therewith.
The Utilities recover unrecognized pension and other postretirement costs over 10 years pursuant to NYSPSC policy.
The deferral for revenue taxes represents the New York State metropolitan transportation business tax surcharge on the cumulative temporary differences between the book and tax basis of assets and liabilities of the Utilities, as well as the difference between taxes collected and paid by the Utilities to fund mass transportation. The Utilities recover the majority of the revenue taxes over the remaining book lives of the electric and gas plant assets, as well as the steam plant assets for CECONY.
The Utilities recover deferred derivative losses – current within one year, and noncurrent generally within three years.
32
Note C —– Capitalization
In February 2021, a subsidiary of the Clean Energy Businesses borrowed $250 million at a variable-rate, due 2028, secured by equity interests in 4 of the company’s solar electric production projects, the interest rate for which was swapped to a fixed rate of 3.39 percent.
In February 2021, a subsidiary of the Clean Energy Businesses entered into an agreement with a tax equity investor for the financing of a portfolio of 3 of the Clean Energy Businesses’ solar electric production projects (CED Nevada Virginia). Under the financing, the tax equity investor acquired a noncontrolling interest in the portfolio and will receive a percentage of earnings, tax attributes and cash flows. As of September 30, 2021, the tax equity investor fully funded its $263 million financing obligation. The Clean Energy Businesses will continue to consolidate this entity and will report the noncontrolling tax equity investor’s interest in the tax equity arrangement. See Note P.
In March 2017, Con Edison issued $4002021, a subsidiary of the Clean Energy Businesses agreed to issue $229 million aggregate principal amount of 3.77 percent senior notes, due 2046, secured by equity interests in CED Nevada Virginia, all of which had been issued at September 30, 2021.
During the first quarter of 2021, Con Edison optionally prepaid the remaining $675 million outstanding under a February 2019 term loan prior to its maturity in June 2021.
In May 2021, Con Edison redeemed at maturity $500 million of 2.00 percent debentures, due 2020, and prepaid the $4005-year debentures.
In June 2021, CECONY redeemed at maturity $640 million variableof floating rate term loan that was to mature in 2018. Also, in March 2017, a Con Edison3-year debentures.
In August 2017,June 2021, Con Edison issued 4.1 million10,100,000 shares of its common sharesstock resulting in net proceeds of $343approximately $775 million, after issuance expenses, that were invested by Con Edison in its subsidiaries, principally CECONY andexpenses.
In June 2021, as part of the Clean Energy Businesses, for fundingBusinesses’ sale of their construction expendituresa renewable electric production project, $104 million of 4.52 percent senior notes, due 2032 and for other general corporate purposes.$37 million of floating rate loans, due 2024 and loan-related interest rate swaps were assumed by the buyer pursuant to the sale agreement. See Notes N and R.
In September 2021, O&R agreed to issue in December 2021 $45 million aggregate principal amount of 2.31 percent debentures, due 2031 and $30 million aggregate principal amount of 3.17 percent debentures, due 2051.
The carrying amounts and fair values of long-term debt at September 30, 20172021 and December 31, 20162020 were:
| (Millions of Dollars) | 2021 | 2020 | ||||||||||||
| Long-Term Debt (including current portion) (a) | Carrying Amount | Fair Value | Carrying Amount | Fair Value | ||||||||||
| Con Edison | $22,280 | $25,655 | $22,349 | $26,808 | ||||||||||
| CECONY | $17,637 | $20,774 | $16,789 | $20,974 | ||||||||||
| (Millions of Dollars) | 2017 | 2016 | ||
| Long-Term Debt (including current portion) (a) | Carrying Amount | Fair Value | Carrying Amount | Fair Value |
| Con Edison | $15,338 | $17,195 | $14,774 | $16,093 |
| CECONY | $12,571 | $14,213 | $12,073 | $13,268 |
(a)Amounts shown are net of unamortized debt expense and unamortized debt discount of $221 million and $188 million for Con Edison and CECONY, respectively, as of September 30, 2021 and $215 million and $176 million for Con Edison and CECONY, respectively, as of December 31, 2020.
The fair values of the Companies' long-term debt have been estimated primarily using available market information. For Con Edison, $16,559 millioninformation and $636 million of the fair value of long-term debt at September 30, 20172021 are classified as Level 2 and Level 3, respectively. For CECONY, $13,577 million and $636 million of the fair value of long-term debt at September 30, 2017 are classified as Level 2 and Level 3, respectivelyliabilities (see Note L)O). The $636 million of long-term debt classified as Level 3 is CECONY’s tax-exempt, auction-rate securities for which the market is highly illiquid and there is a lack of observable inputs.
Note D —– Short-Term Borrowing
At September 30, 2017,2021, Con Edison had $356$1,036 million of commercial paper outstanding of which $147$942 million was outstanding under CECONY’s program. The weighted average interest rate at September 30, 20172021 was 1.30.1 percent for both Con Edison and CECONY. At December 31, 2016,2020, Con Edison had $1,054$1,705 million of commercial paper outstanding of which $600$1,660 million was outstanding under CECONY’s program. The weighted average interest rate at December 31, 20162020 was 1.00.3 percent for both Con Edison and CECONY.
33
At September 30, 20172021 and December 31, 2016,2020, no loans were outstanding under the Companies' December 2016 credit agreement (Credit Agreement). An immaterial amount and $2 million (including $2 million for CECONY) of letters of credit were outstanding under the Credit Agreement as of September 30, 20172021 and December 31, 2020.
In August 2021, a subsidiary of the Clean Energy Businesses prepaid in full $249 million of borrowings outstanding under, and terminated, a $613 million variable-rate construction loan facility that was secured by and used to fund construction costs for CED Nevada Virginia. At December 31, 2020, the banks’ commitments under the construction loan facility were $613 million, and $165 million of borrowings were outstanding under the construction loan facility.
In April 2021, Con Edison entered into a credit agreement (April 2021 Credit Agreement) under which banks were committed until May 18, 2021, subject to certain conditions, to provide to Con Edison a $500 million variable-rate 364-day term loan. In May 2021, Con Edison borrowed $500 million under the April 2021 Credit Agreement to repay in full all of Con Edison’s outstanding 2.00 percent debentures, Series 2016 respectively.A, that matured on May 15, 2021. In July 2021, Con Edison prepaid in full the $500 million borrowing under the April 2021 Credit Agreement with a portion of the cash proceeds received from the substantial completion of the sale of Stagecoach. See Note R.
Note E —– Pension Benefits
Total Periodic Benefit Cost
The components of the Companies’ total periodic benefit costscost for the three and nine months ended September 30, 20172021 and 20162020 were as follows:
| For the Three Months Ended September 30, | ||||||||||||||
| Con Edison | CECONY | |||||||||||||
| (Millions of Dollars) | 2021 | 2020 | 2021 | 2020 | ||||||||||
| Service cost – including administrative expenses | $85 | $73 | $80 | $69 | ||||||||||
| Interest cost on projected benefit obligation | 118 | 137 | 111 | 129 | ||||||||||
| Expected return on plan assets | (274) | (258) | (260) | (245) | ||||||||||
| Recognition of net actuarial loss | 197 | 175 | 187 | 165 | ||||||||||
| Recognition of prior service credit | (4) | (4) | (5) | (5) | ||||||||||
| TOTAL PERIODIC BENEFIT COST | $122 | $123 | $113 | $113 | ||||||||||
| Cost capitalized | (41) | (34) | (39) | (32) | ||||||||||
| Reconciliation to rate level | (54) | (62) | (52) | (59) | ||||||||||
| Total expense recognized | $27 | $27 | $22 | $22 | ||||||||||
| For the Three Months Ended September 30, | |||||
| Con Edison | CECONY | ||||
| (Millions of Dollars) | 2017 | 2016 | 2017 | 2016 | |
| Service cost – including administrative expenses | $66 | $69 | $61 | $65 | |
| Interest cost on projected benefit obligation | 148 | 149 | 139 | 140 | |
| Expected return on plan assets | (243) | (237) | (229) | (225) | |
| Recognition of net actuarial loss | 149 | 149 | 141 | 141 | |
| Recognition of prior service costs | (4) | 1 | (5) | — | |
| TOTAL PERIODIC BENEFIT COST | $116 | $131 | $107 | $121 | |
| Cost capitalized | (40) | (51) | (37) | (49) | |
| Reconciliation to rate level | (14) | 10 | (16) | 13 | |
| Cost charged to operating expenses | $62 | $90 | $54 | $85 | |
| For the Nine Months Ended September 30, | ||||||||||||||
| Con Edison | CECONY | |||||||||||||
| (Millions of Dollars) | 2021 | 2020 | 2021 | 2020 | ||||||||||
| Service cost – including administrative expenses | $257 | $220 | $241 | $206 | ||||||||||
| Interest cost on projected benefit obligation | 353 | 412 | 332 | 387 | ||||||||||
| Expected return on plan assets | (822) | (775) | (779) | (735) | ||||||||||
| Recognition of net actuarial loss | 590 | 524 | 559 | 496 | ||||||||||
| Recognition of prior service credit | (12) | (12) | (15) | (15) | ||||||||||
| TOTAL PERIODIC BENEFIT COST | $366 | $369 | $338 | $339 | ||||||||||
| Cost capitalized | (120) | (98) | (113) | (93) | ||||||||||
| Reconciliation to rate level | (165) | (188) | (158) | (179) | ||||||||||
| Total expense recognized | $81 | $83 | $67 | $67 | ||||||||||
Components of net periodic benefit cost other than service cost are presented outside of operating income on the Companies' consolidated income statements, and only the service cost component is eligible for capitalization. Accordingly, the service cost component is included in the line "Other operations and maintenance" and the non-service cost components are included in the line "Other deductions" in the Companies' consolidated income statements.
| For the Nine Months Ended September 30, | ||||
| Con Edison | CECONY | |||
| (Millions of Dollars) | 2017 | 2016 | 2017 | 2016 |
| Service cost – including administrative expenses | $197 | $207 | $184 | $194 |
| Interest cost on projected benefit obligation | 444 | 447 | 416 | 419 |
| Expected return on plan assets | (726) | (711) | (689) | (674) |
| Recognition of net actuarial loss | 446 | 447 | 423 | 424 |
| Recognition of prior service costs | (13) | 3 | (14) | 1 |
| TOTAL PERIODIC BENEFIT COST | $348 | $393 | $320 | $364 |
| Cost capitalized | (134) | (157) | (125) | (148) |
| Reconciliation to rate level | (28) | 35 | (32) | 39 |
| Cost charged to operating expenses | $186 | $271 | $163 | $255 |
Expected Contributions
Based on estimates as of September 30, 2017,2021, the Companies expect to make contributions to the pension plans during 20172021 of $450$467 million (of which $412$429 million is to be contributedmade by CECONY). The Companies’ policy is to fund the total periodic benefit cost of the qualified plan to the extent tax deductible and to also contribute to the non-qualified supplemental plans. During the first nine months of 2017,2021, the Companies contributed $446$465 million to the pension plans, (of$428 million of which $409 million was contributed by CECONY).CECONY. CECONY also contributed $14$22 million to itsthe external
trust for its non-qualified supplemental plans.plan.
Note F —– Other Postretirement Benefits
Total Periodic Benefit Cost
The components of the Companies’ total periodic other postretirement benefit costscost/(credit) for the three and nine months ended September 30, 20172021 and 20162020 were as follows:
| For the Three Months Ended September 30, | ||||||||||||||
| Con Edison | CECONY | |||||||||||||
| (Millions of Dollars) | 2021 | 2020 | 2021 | 2020 | ||||||||||
| Service cost - including administrative expenses | $2 | $5 | $1 | $4 | ||||||||||
| Interest cost on projected other postretirement benefit obligation | 7 | 9 | 6 | 8 | ||||||||||
| Expected return on plan assets | (17) | (16) | (14) | (14) | ||||||||||
| Recognition of net actuarial loss | 4 | 3 | 3 | 3 | ||||||||||
| Recognition of prior service credit | — | (1) | — | — | ||||||||||
| TOTAL PERIODIC OTHER POSTRETIREMENT BENEFIT COST | $(4) | $— | $(4) | $1 | ||||||||||
| Cost capitalized | (3) | (2) | (3) | (2) | ||||||||||
| Reconciliation to rate level | 7 | 2 | 6 | — | ||||||||||
| Total credit recognized | $— | $— | $(1) | $(1) | ||||||||||
| For the Three Months Ended September 30, | |||||
| Con Edison | CECONY | ||||
| (Millions of Dollars) | 2017 | 2016 | 2017 | 2016 | |
| Service cost | $5 | $4 | $3 | $3 | |
| Interest cost on accumulated other postretirement benefit obligation | 11 | 12 | 9 | 10 | |
| Expected return on plan assets | (17) | (19) | (15) | (17) | |
| Recognition of net actuarial loss | 1 | 1 | — | 1 | |
| Recognition of prior service cost | (5) | (5) | (3) | (3) | |
| TOTAL PERIODIC OTHER POSTRETIREMENT BENEFIT COST | $(5) | $(7) | $(6) | $(6) | |
| Cost capitalized | 2 | 2 | 2 | 2 | |
| Reconciliation to rate level | (1) | 7 | — | 6 | |
| Cost charged to operating expenses | $(4) | $2 | $(4) | $2 | |
| For the Nine Months Ended September 30, | ||||||||||||||
| Con Edison | CECONY | |||||||||||||
| (Millions of Dollars) | 2021 | 2020 | 2021 | 2020 | ||||||||||
| Service cost - including administrative expenses | $15 | $16 | $11 | $12 | ||||||||||
| Interest cost on projected other postretirement benefit obligation | 23 | 28 | 19 | 23 | ||||||||||
| Expected return on plan assets | (51) | (49) | (41) | (41) | ||||||||||
| Recognition of net actuarial loss | 17 | 34 | 13 | 32 | ||||||||||
| Recognition of prior service credit | (2) | (3) | (1) | (1) | ||||||||||
| TOTAL PERIODIC OTHER POSTRETIREMENT BENEFIT COST | $2 | $26 | $1 | $25 | ||||||||||
| Cost capitalized | (9) | (7) | (7) | (5) | ||||||||||
| Reconciliation to rate level | 7 | (19) | 2 | (24) | ||||||||||
| Total credit recognized | $— | $— | $(4) | $(4) | ||||||||||
| For the Nine Months Ended September 30, | ||||
| Con Edison | CECONY | |||
| (Millions of Dollars) | 2017 | 2016 | 2017 | 2016 |
| Service cost | $15 | $13 | $10 | $10 |
| Interest cost on accumulated other postretirement benefit obligation | 34 | 36 | 28 | 30 |
| Expected return on plan assets | (52) | (58) | (45) | (50) |
| Recognition of net actuarial loss/(gain) | 2 | 4 | (2) | 2 |
| Recognition of prior service cost | (13) | (15) | (9) | (11) |
| TOTAL PERIODIC OTHER POSTRETIREMENT BENEFIT COST | $(14) | $(20) | $(18) | $(19) |
| Cost capitalized | 6 | 5 | 7 | 5 |
| Reconciliation to rate level | (3) | 20 | (1) | 19 |
| Cost charged to operating expenses | $(11) | $5 | $(12) | $5 |
Contributions
During the first nine months of 2017, Con Edison2021, the Companies contributed $16$2 million (all of which $8 million was contributedmade by CECONY,CECONY) to the other postretirement benefit plans. The Companies' policy is to fund the total periodic benefit cost of the plans to the extent tax deductible.
Note G —– Environmental Matters
Superfund Sites
Hazardous substances, such as asbestos, polychlorinated biphenyls (PCBs) and coal tar, have been used or generated in the course of operations of the Utilities and their predecessors and are present at sites and in facilities and equipment they currently or previously owned, including sites at which gas was manufactured or stored.
The Federal Comprehensive Environmental Response, Compensation and Liability Act of 1980 and similar state statutes (Superfund) impose joint and several liability, regardless of fault, upon generators of hazardous substances
35
for investigation and remediation costs (which include costs of demolition, removal, disposal, storage, replacement, containment and monitoring) and natural resource damages. Liability under these laws can be material and may be imposed for contamination from past acts, even though such past acts may have been lawful at the time they occurred. The sites at which the Utilities have been asserted to have liability under these laws, including their manufactured gas plant sites and any neighboring areas to which contamination may have migrated, are referred to herein as “Superfund Sites.”
For Superfund Sites where there are other potentially responsible parties and the Utilities are not managing the site investigation and remediation, the accrued liability represents an estimate of the amount the Utilities will need to pay to investigate and, where determinable, discharge their related obligations. For Superfund Sites (including the manufactured gas plant sites) for which one of the Utilities is managing the investigation and remediation, the accrued liability represents an estimate of the company’s share of the undiscounted cost to investigate the sites and, for sites that have been investigated in whole or in part, the cost to remediate the sites, if remediation is necessary and if a reasonable estimate of such cost can be made. Remediation costs are estimated in light of the information available, applicable remediation standards and experience with similar sites.
The accrued liabilities and regulatory assets related to Superfund Sites at September 30, 20172021 and December 31, 20162020 were as follows:
| Con Edison | CECONY | |||||||||||||
| (Millions of Dollars) | 2021 | 2020 | 2021 | 2020 | ||||||||||
| Accrued Liabilities: | ||||||||||||||
| Manufactured gas plant sites | $737 | $752 | $662 | $676 | ||||||||||
| Other Superfund Sites | 104 | 105 | 103 | 104 | ||||||||||
| Total | $841 | $857 | $765 | $780 | ||||||||||
| Regulatory assets | $846 | $865 | $780 | $791 | ||||||||||
| Con Edison | CECONY | |||
| (Millions of Dollars) | 2017 | 2016 | 2017 | 2016 |
| Accrued Liabilities: | ||||
| Manufactured gas plant sites | $659 | $664 | $563 | $567 |
| Other Superfund Sites | 86 | 89 | 85 | 88 |
| Total | $745 | $753 | $648 | $655 |
| Regulatory assets | $803 | $823 | $690 | $711 |
Most of the accrued Superfund Site liability relates to sites that have been investigated, in whole or in part. However, for some of the sites, the extent and associated cost of the required remediation has not yet been determined. As investigations progress and information pertaining to the required remediation becomes available, the Utilities expect that additional liability may be accrued, the amount of which is not presently determinable but may be material. The Utilities are permitted to recover or defer as regulatory assets (for subsequent recovery through rates) prudently incurred site investigation and remediation costs.
Environmental remediation costs incurred related to Superfund Sites for the three and nine months ended September 30, 20172021 and 20162020 were as follows:
| For the Three Months Ended September 30, | ||||||||||||||
| Con Edison | CECONY | |||||||||||||
| (Millions of Dollars) | 2021 | 2020 | 2021 | 2020 | ||||||||||
| Remediation costs incurred | $7 | $8 | $7 | $8 | ||||||||||
| For the Three Months Ended September 30, | ||||
| Con Edison | CECONY | |||
| (Millions of Dollars) | 2017 | 2016 | 2017 | 2016 |
| Remediation costs incurred | $4 | $8 | $3 | $5 |
| For the Nine Months Ended September 30, | ||||||||||||||
| Con Edison | CECONY | |||||||||||||
| (Millions of Dollars) | 2021 | 2020 | 2021 | 2020 | ||||||||||
| Remediation costs incurred | $21 | $17 | $20 | $16 | ||||||||||
| For the Nine Months Ended September 30, | ||||
| Con Edison | CECONY | |||
| (Millions of Dollars) | 2017 | 2016 | 2017 | 2016 |
| Remediation costs incurred | $18 | $20 | $13 | $10 |
Insurance and other third-party recoveries received by Con Edison or CECONY were immaterial for the three and nine months ended September 30, 2017. Con Edison2021 and CECONY received $1 million in insurance recoveries for the three and nine months ended September 30, 2016.2020.
In 2016,2020, Con Edison and CECONY estimated that for their manufactured gas plant sites (including CECONY’s Astoria site), the aggregate undiscounted potential liability for the investigation and remediation of coal tar and/or other environmental contaminants could range up to $2.8$2.7 billion and $2.6 billion, respectively. These estimates were based on the assumption that there is contamination at all sites, including those that have not yet been fully investigated and additional assumptions about the extent of the contamination and the type and extent of the remediation that may be required. Actual experience may be materially different.
36
Asbestos Proceedings
Suits have been brought in New York State and federal courts against the Utilities and many other defendants, wherein a large number of plaintiffs sought large amounts of compensatory and punitive damages for deaths and injuries allegedly caused by exposure to asbestos at various premises of the Utilities. The suits that have been resolved, which are many, have been resolved without any payment by the Utilities, or for amounts that were not, in the aggregate, material to them. The amounts specified in all the remaining thousands of suits total billions of dollars; however, the Utilities believe that these amounts are greatly exaggerated, based on the disposition of previous claims. At September 30, 2017,2021, Con Edison and CECONY have accrued their estimated aggregate undiscounted potential liabilities for these suits and additional suits that may be brought over the next 15 years as shown in the following table. These estimates were based upon a combination of modeling, historical data analysis and risk factor assessment. Courts have begun, and unless otherwise determined on appeal may continue, to apply different standards for determining liability in asbestos suits than the standard that applied historically. As a result, the Companies currently believe that there is a reasonable possibility of an exposure to loss in excess of the liability accrued for the suits. The Companies are unable to estimate the amount or range of such loss. In addition, certain current and former employees have claimed or are claiming workers’ compensation benefits based on alleged disability from exposure to asbestos. CECONY is permitted to defer as regulatory assets (for subsequent recovery through rates) costs incurred for its asbestos lawsuits and workers’ compensation claims.
The accrued liability for asbestos suits and workers’ compensation proceedings (including those related to asbestos exposure) and the amounts deferred as regulatory assets or liabilities for the Companies at September 30, 20172021 and December 31, 20162020 were as follows:
| Con Edison | CECONY | |||||||||||||
| (Millions of Dollars) | 2021 | 2020 | 2021 | 2020 | ||||||||||
| Accrued liability – asbestos suits | $8 | $8 | $7 | $7 | ||||||||||
| Regulatory assets – asbestos suits | $8 | $8 | $7 | $7 | ||||||||||
| Accrued liability – workers’ compensation | $68 | $72 | $65 | $68 | ||||||||||
| Regulatory liability – workers’ compensation | $5 | $3 | $5 | $3 | ||||||||||
| Con Edison | CECONY | |||
| (Millions of Dollars) | 2017 | 2016 | 2017 | 2016 |
| Accrued liability – asbestos suits | $8 | $8 | $7 | $7 |
| Regulatory assets – asbestos suits | $8 | $8 | $7 | $7 |
| Accrued liability – workers’ compensation | $87 | $88 | $83 | $83 |
| Regulatory assets – workers’ compensation | $12 | $13 | $12 | $13 |
Note H —– Other Material Contingencies
Manhattan Explosion and Fire
On March 12, 2014, two2 multi-use five-story tall buildings located on Park Avenue between 116th and 117th Streets in Manhattan were destroyed by an explosion and fire. CECONY had delivered gas to the buildings through service lines from a distribution main located below ground on Park Avenue. EightNaN people died and more than 50 people were injured. Additional buildings were also damaged. The National Transportation Safety Board (NTSB) investigated. The parties to the investigation included the company, the City of New York, the Pipeline and Hazardous Materials Safety Administration and the NYSPSC. In June 2015, the NTSB issued a final report concerning the incident, its probable cause and safety recommendations. The NTSB determined that the probable cause of the incident was (1) the failure of a defective fusion joint at a service tee (which joined a plastic service line to a plastic distribution main) installed by the company that allowed gas to leak from the distribution main and migrate into a building where it ignited and (2) a breach in a City sewer line that allowed groundwater and soil to flow into the sewer, resulting in a loss of support for the distribution main, which caused it to sag and overstressed the defective fusion joint. The NTSB also made safety recommendations, including recommendations to the company that addressed its procedures for the preparation and examination of plastic fusions, training of its staff on conditions for notifications to the City’s Fire Department and extension of its gas main isolation valve installation program. In February 2017, the NYSPSC approved a settlement agreement with the company related to the NYSPSC's investigations of the incident and the practices of qualifying persons to perform plastic fusions. Pursuant to the agreement, the company will not recover from customers $126 million of costs it incurred for gas emergency response activities in 2014, 2015 and 2016 in excess of the amounts reflected in its gas rate plan and will provideis providing $27 million of future benefits to customers (for which it has accrued a regulatory liability, see Note B).liability) and will not recover from customers $126 million of costs for gas emergency response activities that it had previously incurred and expensed. Approximately eighty80 suits are pending against the company seeking generally unspecified damages and, in some cases, punitive damages, for wrongful death, personal injury, property damage and business interruption. The company has notified its insurers of the incident and believes that the policies in force at the time of the incident will cover the company’s costs, in excess of a required retention (the amount of which is not material), to satisfy any liability it may have for damages in connection with the incident. The company In the company’s estimation, there is unablenot a reasonable possibility that an exposure to estimateloss exists for the amount or rangesuits that is materially in excess of its possible loss for damages related to the incident.estimated liability accrued. At September 30, 2017,2021 and December 31, 2020, the company had not accrued aits estimated liability for damages related to the incident.suits of $40 million and an insurance receivable in the same amount.
37
Other Contingencies
Guarantees
Con Edison and its subsidiaries enterhave entered into various agreements providing financial or performance assurance primarily to third parties on behalf of their subsidiaries. Maximum amounts guaranteed by Con Edison and its subsidiaries under these agreements totaled $2,162$2,210 million and $2,370$2,042 million at September 30, 20172021 and December 31, 2016,2020, respectively.
A summary, by type and term, of amounts guaranteed by Con Edison’s total guaranteesEdison and its subsidiaries under these agreements at September 30, 20172021 is as follows:
| Guarantee Type | 0 – 3 years | 4 – 10 years | > 10 years | Total | ||||||||||
| (Millions of Dollars) | ||||||||||||||
| Con Edison Transmission | $547 | $— | $— | $547 | ||||||||||
| Energy transactions | 475 | 33 | 323 | 831 | ||||||||||
| Renewable electric production projects | 320 | 64 | 378 | 762 | ||||||||||
| Other | 70 | — | — | 70 | ||||||||||
| Total | $1,412 | $97 | $701 | $2,210 | ||||||||||
| Guarantee Type | 0 – 3 years | 4 – 10 years | > 10 years | Total | |||
| (Millions of Dollars) | |||||||
| Con Edison Transmission | $643 | $404 | $— | $1,047 | |||
| Energy transactions | 459 | 30 | 211 | 700 | |||
| Renewable electric production projects | 268 | — | 19 | 287 | |||
| Other | 128 | — | — | 128 | |||
| Total | $1,498 | $434 | $230 | $2,162 | |||
Con Edison Transmission — Con Edison has guaranteed payment by CET Electric of the contributions CET Electric agreed to make to New York Transco LLC (NY Transco). CET Electric acquiredowns a 45.7 percent interest in NY Transco when it was formed in 2014.Transco. In May 2016, the transmission owners transferred certain projects to NY Transco, for which CET Electric made its required contributions. NY Transco has proposed other transmission projects inApril 2019, the New York Independent System Operator's competitive bidding process. These otherOperator (NYISO) selected a transmission project that was jointly proposed by National Grid and NY Transco. The siting, construction and operation of the project will require approvals and permits from appropriate governmental agencies and authorities, including the NYSPSC. The NYISO indicated it will work with the developers to enter into agreements for the development and operation of the projects, are subject to certain authorizations from the NYSPSC, the FERC and, as applicable, other federal, state and local agencies.including a schedule for entry into service by December 2023. Guarantee amount shown is forincludes the maximum possible required amount of CET Electric’s contributions for these other projectsthis project as calculated based on the assumptions that the projects areproject is completed at 175 percent of theirits estimated costs and NY Transco does not use any debt financing for the projects.project. Guarantee termamount shown is assumed as the selection of the projects and resulting timing of the contributions is not certain. Also included within the table above isalso includes a $7 million guarantee for $25 million from Con Edison Transmission on behalf of a subsidiary of CET Gas related to the completion of the sale of Stagecoach. See "Investments" in relation to a proposed gas transmission project in West VirginiaNote A and Virginia.Note R.
Energy Transactions — Con Edison guaranteesand the Clean Energy Businesses guarantee payments on behalf of the Clean Energy Businessestheir subsidiaries in order to facilitate physical and financial transactions in electricity, gas, pipeline capacity, transportation, oil, renewable energy credits and energy services. To the extent that liabilities exist under the contracts subject to these guarantees, such liabilities are included in Con Edison’s consolidated balance sheet.
Renewable Electric Production Projects — Con Edison Con Edison Development, and Con Edison Solutionsthe Clean Energy Businesses guarantee payments on behalf of their wholly-owned subsidiaries associated with their investment in, or development for others of, solar and wind energy facilities.
Other — Other guarantees include $70 million in guarantees provided by Con Edison to Travelers Insurance Company for indemnity agreements for surety bonds in connection with the operation of solar energy facilities and energy service projects of Con Edison Development and Con Edison Solutions, respectively. Other guarantees also includes Con Edison's guarantee (subject to a $53 million maximum amount) of certain obligations of Con Edison Solutions under the agreement pursuant to which it sold its retail electric supply business. In addition, Con Edison issued a guarantee estimated at $5 million to the Public Utility Commission of Texas covering obligations of Con Edison Solutions as a retail electric provider. As part of the sale agreement for the retail electric supply business discussed above, the purchaser has agreed to pay Con Edison Solutions for draws on the guarantee to the Public Utility Commission of Texas.Clean Energy Businesses.
Note I —– Leases
Operating lease cost and cash paid for amounts included in the measurement of lease liabilities for the three and nine months ended September 30, 2021 and 2020 were as follows:
| For the Three Months Ended September 30, | ||||||||||||||
| Con Edison | CECONY | |||||||||||||
| (Millions of Dollars) | 2021 | 2020 | 2021 | 2020 | ||||||||||
| Operating lease cost | $22 | $21 | $16 | $16 | ||||||||||
| Operating lease cash flows | $10 | $10 | $6 | $6 | ||||||||||
38
| For the Nine Months Ended September 30, | ||||||||||||||
| Con Edison | CECONY | |||||||||||||
| (Millions of Dollars) | 2021 | 2020 | 2021 | 2020 | ||||||||||
| Operating lease cost | $65 | $63 | $49 | $48 | ||||||||||
| Operating lease cash flows | $26 | $27 | $15 | $13 | ||||||||||
As of September 30, 2021, assets recorded as finance leases were $2 million for Con Edison and $1 million for CECONY, and the accumulated amortization associated with finance leases for Con Edison and CECONY were $3 million and $2 million, respectively. As of December 31, 2020, assets recorded as finance leases were $3 million for Con Edison and $2 million for CECONY, and the accumulated amortization associated with finance leases for Con Edison and CECONY were $3 million and $1 million, respectively.
For the three and nine months ended September 30, 2021 and 2020, finance lease costs and cash flows for Con Edison and CECONY were immaterial.
Right-of-use assets obtained in exchange for operating lease obligations for Con Edison and CECONY were $15 million and $5 million, respectively, for the three months ended September 30, 2021 and $32 million and $7 million, respectively for the nine months ended September 30, 2021. Right-of-use assets obtained in exchange for operating lease obligations for Con Edison and CECONY were $8 million and $2 million, respectively, for the three months ended September 30, 2020 and $13 million and $3 million, respectively for the nine months ended September 30, 2020.
Other information related to leases for Con Edison and CECONY at September 30, 2021 and December 31, 2020 were as follows:
| Con Edison | CECONY | |||||||||||||
| 2021 | 2020 | 2021 | 2020 | |||||||||||
| Weighted Average Remaining Lease Term: | ||||||||||||||
| Operating leases | 18.5 years | 19.1 years | 12.4 years | 13.0 years | ||||||||||
| Finance leases | 7.1 years | 7.3 years | 3.3 years | 4.0 years | ||||||||||
| Weighted Average Discount Rate: | ||||||||||||||
| Operating leases | 4.3% | 4.3% | 3.6% | 3.6% | ||||||||||
| Finance leases | 1.8% | 1.8% | 1.2% | 1.3% | ||||||||||
Future minimum lease payments under non-cancellable leases at September 30, 2021 were as follows:
| (Millions of Dollars) | Con Edison | CECONY | ||||||||||||
| Year Ending September 30, | Operating Leases | Finance Leases | Operating Leases | Finance Leases | ||||||||||
| 2022 | $82 | $1 | $59 | $1 | ||||||||||
| 2023 | 76 | — | 58 | — | ||||||||||
| 2024 | 75 | — | 57 | — | ||||||||||
| 2025 | 76 | — | 58 | — | ||||||||||
| 2026 | 75 | — | 58 | — | ||||||||||
| All years thereafter | 937 | 1 | 446 | — | ||||||||||
| Total future minimum lease payments | $1,321 | $2 | $736 | $1 | ||||||||||
| Less: imputed interest | (452) | — | (144) | — | ||||||||||
| Total | $869 | $2 | $592 | $1 | ||||||||||
| Reported as of September 30, 2021 | ||||||||||||||
| Operating lease liabilities (current) | $113 | $— | $85 | $— | ||||||||||
| Operating lease liabilities (noncurrent) | 756 | — | 507 | — | ||||||||||
| Other current liabilities | — | 1 | — | — | ||||||||||
| Other noncurrent liabilities | — | 1 | — | 1 | ||||||||||
| Total | $869 | $2 | $592 | $1 | ||||||||||
At September 30, 2021, the Companies did not have material obligations under operating or finance leases that had not yet commenced.
39
The Companies are lessors under certain leases whereby the Companies own real estate and distribution poles and lease portions of them to others. Revenue under such leases was immaterial for Con Edison and CECONY for the three and nine months ended September 30, 2021 and 2020.
Note J – Income Tax
Con Edison’s income tax expense decreasedincreased to $270$127 million for the three months ended September 30, 20172021 from $314$119 million for the three months ended September 30, 2016. Con Edison's effective2020. The increase in income tax rate for the three months ended September 30, 2017 and 2016 was 37 percent and 39 percent, respectively. The decrease in Con Edison's effective tax rateexpense is primarily due to lower state income taxes,attributable to non-controlling interests, offset in part by lower income before income tax expense, lower state income taxes, an increase in the amortization of excess deferred federal income taxes due to the TCJA and a decreasehigher favorable tax adjustment for the prior year tax return primarily due to an increase in the general business tax benefits for plant-related flow through items.credit compared with last year.
CECONY’s income tax expense increaseddecreased to $242$90 million for the three months ended September 30, 20172021 from $226$97 million for the three months ended September 30, 2016. CECONY's effective2020. The decrease in income tax expense is primarily due to an increase in the amortization of excess deferred federal income taxes due to the TCJA and a higher favorable tax adjustment for the prior year tax return primarily due to an increase in the general business tax credit compared with last year, offset in part by higher income before income tax expense and lower flow-through tax benefits in 2021 for plant-related items.
Reconciliation of the difference between income tax expense and the amount computed by applying the prevailing statutory income tax rate to income before income taxes for the three months ended September 30, 20172021 and 2016 was 38 percent and 37 percent, respectively. The increase in CECONY's effective tax rate2020 is primarily due to a decrease in tax benefits for plant-related flow through items and lower research and development credits, offset in part by lower state income taxes.as follows:
| Con Edison | CECONY | |||||||||||||
| (% of Pre-tax income) | 2021 | 2020 | 2021 | 2020 | ||||||||||
| STATUTORY TAX RATE | ||||||||||||||
| Federal | 21 | % | 21 | % | 21 | % | 21 | % | ||||||
| Changes in computed taxes resulting from: | ||||||||||||||
| State income tax, net of federal income tax benefit | 5 | 6 | 5 | 5 | ||||||||||
| Amortization of excess deferred federal income taxes | (7) | (7) | (8) | (8) | ||||||||||
| Taxes attributable to non-controlling interests | 4 | (1) | — | — | ||||||||||
| Cost of removal | 1 | 1 | 1 | 2 | ||||||||||
| Other plant-related items | (1) | (1) | (1) | (1) | ||||||||||
| Renewable energy credits | (1) | (1) | — | — | ||||||||||
| Injuries and damages reserve | — | — | 1 | — | ||||||||||
| Prior period federal income tax return adjustments | (1) | — | (1) | — | ||||||||||
| Other | — | 1 | — | — | ||||||||||
| Effective tax rate | 21 | % | 19 | % | 18 | % | 19 | % | ||||||
Con Edison’s income tax expense decreasedincreased to $599$194 million for the nine months ended September 30, 20172021 from $602$183 million for the nine months ended September 30, 2016. Con Edison's effective2020. The increase in income tax rate for the nine months ended September 30, 2017 and 2016 was 37 percent. The effectiveexpense is primarily due to lower income attributable to non-controlling interests, offset in part by lower income before income tax rate remained unchanged asexpense, lower state income taxes, were offset byan increase in the amortization of excess deferred federal income taxes due to the TCJA and a decreasehigher favorable tax adjustment for the prior year tax return primarily due to an increase in the general business tax benefits for plant-related flow through items.credit compared with last year.
CECONY’s income tax expense increaseddecreased to $551$188 million for the nine months ended September 30, 20172021 from $491$199 million for the nine months ended September 30, 2016. CECONY's effective2020. The decrease in income tax expense is primarily due to an increase in the amortization of excess deferred federal income taxes due to the TCJA, a higher favorable tax adjustment for the prior year tax return primarily due to an increase in the general business tax credit compared with last year, the absence of the amortization of excess deferred state income taxes in 2021, offset in part by higher income before income tax expense and lower flow-through tax benefits in 2021 for plant-related items.
Reconciliation of the difference between income tax expense and the amount computed by applying the prevailing
statutory income tax rate to income before income taxes for the nine months ended September 30, 20172021 and 20162020 is as follows:
40
| Con Edison | CECONY | |||||||||||||
| (% of Pre-tax income) | 2021 | 2020 | 2021 | 2020 | ||||||||||
| STATUTORY TAX RATE | ||||||||||||||
| Federal | 21 | % | 21 | % | 21 | % | 21 | % | ||||||
| Changes in computed taxes resulting from: | ||||||||||||||
| State income tax, net of federal income tax benefit | 5 | 5 | 5 | 5 | ||||||||||
| Amortization of excess deferred federal income taxes | (11) | (10) | (11) | (10) | ||||||||||
| Taxes attributable to non-controlling interests | 3 | (1) | — | — | ||||||||||
| Cost of removal | 2 | 2 | 2 | 2 | ||||||||||
| Other plant-related items | (1) | (1) | (1) | (2) | ||||||||||
| Renewable energy credits | (2) | (2) | — | — | ||||||||||
| Other | (1) | — | — | 1 | ||||||||||
| Effective tax rate | 16 | % | 14 | % | 16 | % | 17 | % | ||||||
In response to the economic impacts of the COVID-19 pandemic, the Coronavirus Aid, Relief, and Economic Security Act (CARES Act) was 38signed into law on March 27, 2020. The CARES Act provides relief to corporate taxpayers by permitting a five-year carryback of net operating losses (NOLs) for tax years 2018, 2019 and 2020, temporarily removing the 80 percent limitation when applying the NOLs to carryback years, increasing the 30 percent limitation on interest deductibility to 50 percent of adjusted taxable income for tax years 2019 and 36 percent, respectively. The increase2020, and provides for certain employee retention tax credits and refunds for eligible employers.
Under the CARES Act, Con Edison carried back its $29 million NOL from tax year 2018 to tax year 2013 generating a $2.5 million net tax refund for which a tax receivable was established in CECONY's effective2020. In addition, Con Edison recognized a discrete income tax benefit of $4 million in 2020, due to the higher federal statutory tax rate is primarily due to a decrease in tax benefits for plant-related flow through items2013. The 2018 federal NOL was recorded at 21 percent and lower research and development tax credits, offset in part by lower state income taxes.
Pursuant to CECONY’s electric rate plan that went into effect in January 2020, the deferral of its net benefits for its electric service ceased and is included in rates. Additionally, the unprotected excess deferred federal income taxes for its electric and gas services is being amortized over a five-year period, which decreased the income tax assetexpense for thesethe nine months ended September 30, 2021 and 2020. See “Other Regulatory Matters” in Note B.
In April 2021, New York State passed a law that increased the corporate franchise tax attribute carryforwards was recorded,rate on business income from 6.5% to 7.25%, retroactive to January 1, 2021, for taxpayers with taxable income greater than $5 million. The law also reinstated the business capital tax at 0.1875%, not to exceed an annual maximum tax liability of $5 million per taxpayer. New York State requires a corporate franchise taxpayer to calculate and no valuation allowance has been provided, as it is more likely thanpay the highest amount of tax under the three alternative methods: a tax on business income; a tax on business capital; or a fixed dollar minimum. The provisions to increase the corporate franchise tax rate and reinstate a business capital tax are scheduled to expire after 2023 and are not thatexpected to have a material impact on the deferred tax asset will be realized.Companies’ financial position, results of operations or liquidity.
Uncertain Tax Positions
At September 30, 2017,2021, the estimated liability for uncertain tax positions for Con Edison was $41$17 million ($216 million for CECONY). Con Edison reasonably expects to resolve approximately $35 million ($24 million, net of federal taxes) of its uncertain tax positions within the next twelve months including $21approximately $3 million ($15 million, net of various federal taxes),and state uncertainties due to the expected completion of ongoing tax examinations, of which the entire amount, if recognized, would reduce Con Edison’sEdison's effective tax rate. The amount related to CECONY is approximately $18 million ($13 million, net of federal taxes), including $4$1 million, which, if recognized, would reduce CECONY’s effective tax rate. The total amount of unrecognized tax benefits, if recognized, that would reduce Con Edison’s effective tax rate is $25$17 million ($1816 million, net of federal taxes). with $6 million attributable to CECONY.
The Companies recognize interest on liabilities for uncertain tax positions in interest expense and would recognize penalties, if any, in operating expenses in the Companies’ consolidated income statements. InFor the three and nine months ended September 30, 2017,2021, the Companies recognized an immaterial amount of interest expense and no penalties for uncertain tax positions in their consolidated income statements. At September 30, 20172021 and December 31, 2016,2020, the Companies recognized an immaterial amount of accrued interest on their consolidated balance sheets.
41
Note J —K – Revenue Recognition
The following table presents, for the three and nine months ended September 30, 2021 and 2020, revenue from contracts with customers as defined in Accounting Standards Codification Topic 606, "Revenue from Contracts with Customers," as well as additional revenue from sources other than contracts with customers, disaggregated by major source.
| For the Three Months Ended September 30, 2021 | For the Three Months Ended September 30, 2020 | |||||||||||||||||||||||||
| (Millions of Dollars) | Revenues from contracts with customers | Other revenues (a) | Total operating revenues | Revenues from contracts with customers | Other revenues (a) | Total operating revenues | ||||||||||||||||||||
| CECONY | ||||||||||||||||||||||||||
| Electric | $2,776 | $(46) | $2,730 | $2,594 | $(32) | $2,562 | ||||||||||||||||||||
| Gas | 305 | 2 | 307 | 248 | 11 | 259 | ||||||||||||||||||||
| Steam | 52 | 3 | 55 | 50 | 1 | 51 | ||||||||||||||||||||
| Total CECONY | $3,133 | $(41) | $3,092 | $2,892 | $(20) | $2,872 | ||||||||||||||||||||
| O&R | ||||||||||||||||||||||||||
| Electric | 229 | (6) | 223 | 210 | (2) | 208 | ||||||||||||||||||||
| Gas | 32 | 2 | 34 | 27 | 3 | 30 | ||||||||||||||||||||
| Total O&R | $261 | $(4) | $257 | $237 | $1 | $238 | ||||||||||||||||||||
| Clean Energy Businesses | ||||||||||||||||||||||||||
| Renewables | 199 | — | 199 | 194 | — | 194 | ||||||||||||||||||||
| Energy services | 65 | — | 65 | 14 | — | 14 | ||||||||||||||||||||
| Other | — | — | — | — | 14 | 14 | ||||||||||||||||||||
| Total Clean Energy Businesses | $264 | $0 | $264 | $208 | $14 | $222 | ||||||||||||||||||||
| Con Edison Transmission | 1 | — | 1 | 1 | — | 1 | ||||||||||||||||||||
| Other (b) | — | (1) | (1) | — | — | — | ||||||||||||||||||||
| Total Con Edison | $3,659 | $(46) | $3,613 | $3,338 | $(5) | $3,333 | ||||||||||||||||||||
(a) For the Utilities, this includes revenue from alternative revenue programs, such as the revenue decoupling mechanisms under their New York electric and gas rate plans.For the Clean Energy Businesses, this includes revenue from wholesale services
(b) Parent company and consolidation adjustments.
| For the Nine Months Ended September 30, 2021 | For the Nine Months Ended September 30, 2020 | |||||||||||||||||||||||||
| (Millions of Dollars) | Revenues from contracts with customers | Other revenues (a) | Total operating revenues | Revenues from contracts with customers | Other revenues (a) | Total operating revenues | ||||||||||||||||||||
| CECONY | ||||||||||||||||||||||||||
| Electric | $6,695 | $(34) | $6,661 | $6,108 | $70 | $6,178 | ||||||||||||||||||||
| Gas | 1,699 | 31 | 1,730 | 1,480 | 29 | 1,509 | ||||||||||||||||||||
| Steam | 383 | 10 | 393 | 375 | 10 | 385 | ||||||||||||||||||||
| Total CECONY | $8,777 | $7 | $8,784 | $7,963 | $109 | $8,072 | ||||||||||||||||||||
| O&R | ||||||||||||||||||||||||||
| Electric | 535 | (13) | 522 | 478 | 5 | 483 | ||||||||||||||||||||
| Gas | 184 | (7) | 177 | 156 | 8 | 164 | ||||||||||||||||||||
| Total O&R | $719 | $(20) | $699 | $634 | $13 | $647 | ||||||||||||||||||||
| Clean Energy Businesses | ||||||||||||||||||||||||||
| Renewables | 545 | — | 545 | 487 | — | 487 | ||||||||||||||||||||
| Energy services | 168 | — | 168 | 36 | — | 36 | ||||||||||||||||||||
| Other | — | 66 | 66 | — | 43 | 43 | ||||||||||||||||||||
| Total Clean Energy Businesses | $713 | $66 | $779 | $523 | $43 | $566 | ||||||||||||||||||||
| Con Edison Transmission | 3 | — | 3 | 3 | — | 3 | ||||||||||||||||||||
| Other (b) | — | (4) | (4) | — | (2) | (2) | ||||||||||||||||||||
| Total Con Edison | $10,212 | $49 | $10,261 | $9,123 | $163 | $9,286 | ||||||||||||||||||||
(a) For the Utilities, this includes revenue from alternative revenue programs, such as the revenue decoupling mechanisms under their New York electric and gas rate plans.For the Clean Energy Businesses, this includes revenue from wholesale services.
(b) Parent company and consolidation adjustments.
42
| 2021 | 2020 | |||||||||||||||||||
| (Millions of Dollars) | Unbilled contract revenue (a) | Unearned revenue (b) | Unbilled contract revenue (a) | Unearned revenue (b) | ||||||||||||||||
| Beginning balance as of January 1, | $11 | $41 | $29 | $17 | ||||||||||||||||
| Additions (c) | 174 | — | 74 | 31 | ||||||||||||||||
| Subtractions (c) | 127 | 31 | (d) | 90 | 4 | (d) | ||||||||||||||
| Ending balance as of September 30, | $58 | $10 | $13 | $44 | ||||||||||||||||
(a)Unbilled contract revenue represents accumulated incurred costs and earned profits on contracts (revenue arrangements), which have been recorded as revenue, but have not yet been billed to customers, and which represent contract assets as defined in Topic 606. Substantially all accrued unbilled contract revenue is expected to be collected within one year. Unbilled contract revenue arises from the cost-to-cost method of revenue recognition. Unbilled contract revenue from fixed-price type contracts is converted to billed receivables when amounts are invoiced to customers according to contractual billing terms, which generally occur when deliveries or other performance milestones are completed.
(b)Unearned revenue represents a liability for billings to customers in excess of earned revenue, which are contract liabilities as defined in Topic 606.
(c)Additions for unbilled contract revenue and subtractions for unearned revenue represent additional revenue earned. Additions for unearned revenue and subtractions for unbilled contract revenue represent billings. Activity also includes appropriate balance sheet classification for the period.
(d)Of the subtractions from unearned revenue, $31 million and $4 million were included in the balances as of January 1, 2021 and 2020, respectively.
As of September 30, 2021, the aggregate amount of the remaining fixed performance obligations of the Clean Energy Businesses under contracts with customers for energy services is $187 million, of which $148 million will be recognized within the next two years, and the remaining $39 million will be recognized pursuant to long-term service and maintenance agreements.
In March 2020, the Utilities began suspending new late payment charges and certain other fees for all customers. For the three months ended September 30, 2021, the estimated late payment charges and fees that were not billed by Con Edison and CECONY were approximately $12 million and $11 million lower than the amounts that were approved to be collected pursuant to the Utilities’ rate plans, respectively. For the nine months ended September 30, 2021, the estimated late payment charges and fees that were not billed by Con Edison and CECONY were approximately $49 million and $46 million lower than the amounts that were approved to be collected pursuant to the Utilities’ rate plans, respectively. For the three months ended September 30, 2020, the estimated late payment charges and fees that were not billed by Con Edison and CECONY were approximately $18 million and $17 million lower than the amounts that were approved to be collected pursuant to the Utilities’ rate plans, respectively. For the nine months ended September 30, 2020, the estimated late payment charges and fees that were not billed by Con Edison and CECONY were approximately $38 million and $36 million lower than the amounts that were approved to be collected pursuant to the Utilities’ rate plans, respectively. The Utilities also began providing payment extensions for all customers that were scheduled to be disconnected prior to the start of the COVID-19 pandemic. In April 2021, CECONY filed a petition with the NYSPSC to timely establish a surcharge recovery mechanism for $52 million of late payment charges and fees, offset for related savings, for the year ended December 31, 2020 to begin in September 2021 and end in December 2022. The petition also requests a surcharge recovery or surcredit mechanism for any fee deferrals for 2021 and 2022 starting in January of the subsequent year over a twelve-month period, respectively. See "COVID-19 Regulatory Matters" in Note B.
Note L – Current Expected Credit Losses
In January 2020, the Companies adopted Accounting Standards Update (ASU) 2016-13, “Financial Instruments-Credit Losses (Topic 326): Measurement of Credit Losses on Financial Instruments”.
Allowance for Uncollectible Accounts
The Utilities’ “Account receivable – customers” balance consists of utility bills due (bills are generally due the month following billing) from customers who have energy delivered, generated, or services provided by the Utilities. The balance also reflects the Utilities’ purchase of receivables from energy service companies to support the retail choice programs.
“Other receivables” balance generally reflects costs billed by the Utilities for goods and services provided to external parties, such as accommodation work for private parties and certain governmental entities, real estate rental and pole attachments. The Clean Energy Businesses’ other receivables balance includes bills related to the sale of energy from renewable electric production projects.
43
The Clean Energy Businesses’ customer accounts receivable balance generally reflects the management of energy supply assets, energy-efficiency services to government and commercial customers, and the engineering, procurement, and construction services of renewable energy projects. The Clean Energy Businesses calculate an allowance for uncollectible accounts related to their energy services customers based on an aging and customer-specific analysis. The amount of such reserves was not material at September 30, 2021 or December 31, 2020.
The Companies develop expected loss estimates using past events data and consider current conditions and future reasonable and supportable forecasts. Changes to the Utilities’ reserve balances that result in write-offs of customer accounts receivable balances above existing rate allowances are not reflected in rates during the term of the current rate plans. For the Utilities’ customer accounts receivable allowance for uncollectible accounts, past events considered include write-offs relative to customer accounts receivable; current conditions include macro-and micro-economic conditions related to trends in the local economy and bankruptcy rates and aged customer accounts receivable balances, among other factors; and forecasts about the future include assumptions related to the level of write-offs and recoveries. Generally, the Utilities write off customer accounts receivable as uncollectible 90 days after the account is turned off for non-payment, or the account is closed during the collection process. See "COVID-19 Regulatory Matters" in Note B.
Other receivables allowance for uncollectible accounts is calculated based on a historical average of collections relative to total other receivables, including current receivables. Current macro- and micro-economic conditions are also considered when calculating the current reserve. Probable outcomes of pending litigation, whether favorable or unfavorable to the Companies, are also included in the consideration.
Starting in 2020, the potential economic impact of the COVID-19 pandemic was also considered in forward-looking projections related to write-off and recovery rates and resulted in increases to the allowance for uncollectible accounts. The increases to the allowance for uncollectible customer accounts for Con Edison and CECONY were $38 million for the three months ended September 30, 2021 and $165 million and $162 million, respectively, for the nine months ended September 30, 2021. The increases to the allowance for uncollectible customer accounts for Con Edison and CECONY were $31 million and $30 million, respectively, for the three months ended September 30, 2020 and $48 million and $46 million, respectively, for the nine months ended September 30, 2020.
Customer accounts receivable and the associated allowance for uncollectible accounts are included in the line “Accounts receivable – customers” on the Companies’ consolidated balance sheets. Other receivables and the associated allowance for uncollectible accounts are included in “Other receivables” on the consolidated balance sheets.
The table below presents a rollforward by major portfolio segment type for the three and nine months ended September 30, 2021 and 2020:
| For the Three Months Ended September 30, | ||||||||||||||||||||||||||
| Con Edison | CECONY | |||||||||||||||||||||||||
| Accounts receivable - customers | Other receivables | Accounts receivable - customers | Other receivables | |||||||||||||||||||||||
| (Millions of Dollars) | 2021 | 2020 | 2021 | 2020 | 2021 | 2020 | 2021 | 2020 | ||||||||||||||||||
| Allowance for credit losses | ||||||||||||||||||||||||||
| Beginning Balance at July 1, | $275 | $87 | $7 | $5 | $262 | $81 | $4 | $3 | ||||||||||||||||||
| Recoveries | 3 | 2 | — | — | 3 | 2 | — | — | ||||||||||||||||||
| Write-offs | (24) | (4) | — | — | (23) | (3) | — | — | ||||||||||||||||||
| Reserve adjustments | 59 | 33 | — | 1 | 58 | 31 | 1 | 1 | ||||||||||||||||||
| Ending Balance September 30, | $313 | $118 | $7 | $6 | $300 | $111 | $5 | $4 | ||||||||||||||||||
44
| For the Nine Months Ended September 30, | ||||||||||||||||||||||||||
| Con Edison | CECONY | |||||||||||||||||||||||||
| Accounts receivable - customers | Other receivables | Accounts receivable - customers | Other receivables | |||||||||||||||||||||||
| (Millions of Dollars) | 2021 | 2020 | 2021 | 2020 | 2021 | 2020 | 2021 | 2020 | ||||||||||||||||||
| Allowance for credit losses | ||||||||||||||||||||||||||
| Beginning Balance at January 1, | $148 | $70 | $7 | $4 | $138 | $65 | $4 | $3 | ||||||||||||||||||
| Recoveries | 9 | 6 | — | — | 8 | 6 | — | — | ||||||||||||||||||
| Write-offs | (66) | (37) | (1) | (1) | (62) | (35) | — | — | ||||||||||||||||||
| Reserve adjustments | 222 | 79 | 1 | 3 | 216 | 75 | 1 | 1 | ||||||||||||||||||
| Ending Balance September 30, | $313 | $118 | $7 | $6 | $300 | $111 | $5 | $4 | ||||||||||||||||||
Note M – Financial Information by Business Segment
Con Edison’s principal business segments are CECONY’s regulated utility activities, O&R’s regulated utility activities, the Clean Energy Businesses and Con Edison Transmission. CECONY’s principal business segments are its regulated electric, gas and steam utility activities. The financial data for the business segments for the three and nine months ended September 30, 20172021 and 20162020 were as follows:
| For the Three Months Ended September 30, | ||||||||||||||||||||||||||
| Operating revenues | Inter-segment revenues | Depreciation and amortization | Operating income/(loss) | |||||||||||||||||||||||
| (Millions of Dollars) | 2021 | 2020 | 2021 | 2020 | 2021 | 2020 | 2021 | 2020 | ||||||||||||||||||
| CECONY | ||||||||||||||||||||||||||
| Electric | $2,730 | $2,562 | $5 | $4 | $324 | $305 | $834 | $813 | ||||||||||||||||||
| Gas | 307 | 259 | 2 | 2 | 82 | 74 | (48) | (34) | ||||||||||||||||||
| Steam | 55 | 51 | 18 | 18 | 23 | 22 | (58) | (57) | ||||||||||||||||||
| Consolidation adjustments | — | — | (25) | (24) | — | — | — | — | ||||||||||||||||||
| Total CECONY | $3,092 | $2,872 | $— | $— | $429 | $401 | $728 | $722 | ||||||||||||||||||
| O&R | ||||||||||||||||||||||||||
| Electric | $223 | $208 | $— | $— | $18 | $17 | $55 | $58 | ||||||||||||||||||
| Gas | 34 | 30 | — | — | 6 | 6 | (8) | (9) | ||||||||||||||||||
| Total O&R | $257 | $238 | $— | $— | $24 | $23 | $47 | $49 | ||||||||||||||||||
| Clean Energy Businesses | $264 | $222 | $— | $— | $58 | $58 | $79 | $92 | ||||||||||||||||||
| Con Edison Transmission | 1 | 1 | — | — | — | — | (2) | (2) | ||||||||||||||||||
| Other (a) | (1) | — | — | — | 1 | — | (2) | (1) | ||||||||||||||||||
| Total Con Edison | $3,613 | $3,333 | $— | $— | $512 | $482 | $850 | $860 | ||||||||||||||||||
| For the Three Months Ended September 30, | ||||||||||||||||||
Operating revenues | Inter-segment revenues | Depreciation and amortization | Operating income/(loss) | |||||||||||||||
| (Millions of Dollars) | 2017 | 2016 | 2017 | 2016 | 2017 | 2016 | 2017 | 2016 | ||||||||||
| CECONY | ||||||||||||||||||
| Electric | $2,469 | $2,557 | $4 | $5 | $232 | $217 | $855 | $841 | ||||||||||
| Gas | 268 | 208 | 2 | 1 | 47 | 41 | (12) | (28) | ||||||||||
| Steam | 62 | 63 | 19 | 22 | 21 | 20 | (43) | (47) | ||||||||||
| Consolidation adjustments | — | — | (25) | (28) | — | — | — | — | ||||||||||
| Total CECONY | $2,799 | $2,828 | $— | $— | $300 | $278 | $800 | $766 | ||||||||||
| O&R | ||||||||||||||||||
| Electric | $206 | $213 | $— | $— | $13 | $12 | $56 | $55 | ||||||||||
| Gas | 28 | 27 | — | — | 5 | 5 | (11) | (7) | ||||||||||
| Total O&R | $234 | $240 | $— | $— | $18 | $17 | $45 | $48 | ||||||||||
| Clean Energy Businesses | $177 | $350 | $— | $(2) | $19 | $11 | $29 | $125 | ||||||||||
| Con Edison Transmission | 1 | — | — | — | — | — | (2) | (1) | ||||||||||
| Other (a) | — | (1) | — | 2 | — | (1) | 1 | 2 | ||||||||||
| Total Con Edison | $3,211 | $3,417 | $— | $— | $337 | $305 | $873 | $940 | ||||||||||
| For the Nine Months Ended September 30, | ||||||||||||||||||
Operating revenues | Inter-segment revenues | Depreciation and amortization | Operating income/(loss) | |||||||||||||||
| (Millions of Dollars) | 2017 | 2016 | 2017 | 2016 | 2017 | 2016 | 2017 | 2016 | ||||||||||
| CECONY | ||||||||||||||||||
| Electric | $6,079 | $6,222 | $12 | $13 | $690 | $645 | $1,477 | $1,487 | ||||||||||
| Gas | 1,421 | 1,113 | 5 | 4 | 137 | 118 | 362 | 273 | ||||||||||
| Steam | 448 | 406 | 55 | 65 | 64 | 62 | 52 | 39 | ||||||||||
| Consolidation adjustments | — | — | (72) | (82) | — | — | — | — | ||||||||||
| Total CECONY | $7,948 | $7,741 | $— | $— | $891 | $825 | $1,891 | $1,799 | ||||||||||
| O&R | ||||||||||||||||||
| Electric | $495 | $497 | $— | $— | $38 | $37 | $83 | $86 | ||||||||||
| Gas | 172 | 133 | — | — | 15 | 13 | 33 | 28 | ||||||||||
| Total O&R | $667 | $630 | $— | $— | $53 | $50 | $116 | $114 | ||||||||||
| Clean Energy Businesses | $460 | $998 | $— | $7 | $54 | $30 | $63 | $184 | ||||||||||
| Con Edison Transmission | 1 | — | — | — | — | — | (6) | (1) | ||||||||||
| Other (a) | (4) | (1) | — | (7) | — | — | 2 | 1 | ||||||||||
| Total Con Edison | $9,072 | $9,368 | $— | $— | $998 | $905 | $2,066 | $2,097 | ||||||||||
(a)Parent company and consolidation adjustments. Other does not represent a business segment.
| For the Nine Months Ended September 30, | ||||||||||||||||||||||||||
| Operating revenues | Inter-segment revenues | Depreciation and amortization | Operating income/(loss) | |||||||||||||||||||||||
| (Millions of Dollars) | 2021 | 2020 | 2021 | 2020 | 2021 | 2020 | 2021 | 2020 | ||||||||||||||||||
| CECONY | ||||||||||||||||||||||||||
| Electric | $6,661 | $6,178 | $14 | $13 | $959 | $904 | $1,337 | $1,413 | ||||||||||||||||||
| Gas | 1,730 | 1,509 | 6 | 5 | 239 | 216 | 490 | 440 | ||||||||||||||||||
| Steam | 393 | 385 | 55 | 56 | 69 | 67 | 9 | 1 | ||||||||||||||||||
| Consolidation adjustments | — | — | (75) | (74) | — | — | — | — | ||||||||||||||||||
| Total CECONY | $8,784 | $8,072 | $— | $— | $1,267 | $1,187 | $1,836 | $1,854 | ||||||||||||||||||
| O&R | ||||||||||||||||||||||||||
| Electric | $522 | $483 | $— | $— | $52 | $48 | $78 | $86 | ||||||||||||||||||
| Gas | 177 | 164 | — | — | 19 | 19 | 30 | 28 | ||||||||||||||||||
| Total O&R | $699 | $647 | $— | $— | $71 | $67 | $108 | $114 | ||||||||||||||||||
| Clean Energy Businesses | $779 | $566 | $— | $— | $172 | $173 | $196 | $188 | ||||||||||||||||||
| Con Edison Transmission | 3 | 3 | — | — | 1 | 1 | (7) | (6) | ||||||||||||||||||
| Other (a) | (4) | (2) | — | — | — | — | (4) | (3) | ||||||||||||||||||
| Total Con Edison | $10,261 | $9,286 | $— | $— | $1,511 | $1,428 | $2,129 | $2,147 | ||||||||||||||||||
(a) Parent company and consolidation adjustments. Other does not represent a business segment.
Note K —N – Derivative Instruments and Hedging Activities
Con Edison’s subsidiaries hedge market price fluctuations associated with physical purchases and sales of electricity, natural gas, steam and, to a lesser extent, refined fuels by using derivative instruments including futures, forwards, basis swaps, options, transmission congestion contracts and financial transmission rights contracts. These are economic hedges, for which the Utilities and the Clean Energy Business do not elect hedge accounting. The Clean Energy Businesses use interest rate swaps to manage the risks associated with interest rates related to outstanding and expected future debt issuances and borrowings. Derivatives are recognized on the consolidated balance sheet at fair value (see Note L)O), unless an exception is available under the accounting rules for derivatives and hedging. Qualifying derivative contracts that have been designated as normal purchases or normal sales contracts are not reported at fair value under the accounting rules.
46
The fair values of the Companies’ commodity derivatives including the offsetting of assets and liabilities on the consolidated balance sheet at September 30, 20172021 and December 31, 20162020 were:
| (Millions of Dollars) | 2021 | 2020 | ||||||||||||||||||||||||
| Balance Sheet Location | Gross Amounts of Recognized Assets/(Liabilities) | Gross Amounts Offset | Net Amounts of Assets/ (Liabilities) (a) | Gross Amounts of Recognized Assets/(Liabilities) | Gross Amounts Offset | Net Amounts of Assets/ (Liabilities) (a) | ||||||||||||||||||||
| Con Edison | ||||||||||||||||||||||||||
| Fair value of derivative assets | ||||||||||||||||||||||||||
| Current | $652 | $(375) | $277 | (b) | $44 | $14 | $58 | (b) | ||||||||||||||||||
| Noncurrent | 140 | (15) | 125 | (c) | 22 | 35 | 57 | |||||||||||||||||||
| Total fair value of derivative assets | $792 | $(390) | $402 | $66 | $49 | $115 | ||||||||||||||||||||
| Fair value of derivative liabilities | ||||||||||||||||||||||||||
| Current | $(428) | $265 | $(163) | (c) | $(225) | $(13) | $(238) | (d) | ||||||||||||||||||
| Noncurrent | (183) | 17 | (166) | (c) | (207) | (33) | (240) | (d) | ||||||||||||||||||
| Total fair value of derivative liabilities | $(611) | $282 | $(329) | $(432) | $(46) | $(478) | ||||||||||||||||||||
| Net fair value derivative assets/(liabilities) | $181 | ($108) | $73 | $(366) | $3 | $(363) | ||||||||||||||||||||
| CECONY | ||||||||||||||||||||||||||
| Fair value of derivative assets | ||||||||||||||||||||||||||
| Current | $407 | $(183) | $224 | (b) | $20 | $(12) | $8 | (b) | ||||||||||||||||||
| Noncurrent | 114 | (28) | 86 | 16 | (8) | 8 | ||||||||||||||||||||
| Total fair value of derivative assets | $521 | $(211) | $310 | $36 | $(20) | $16 | ||||||||||||||||||||
| Fair value of derivative liabilities | ||||||||||||||||||||||||||
| Current | $(158) | $44 | $(114) | $(174) | $11 | $(163) | ||||||||||||||||||||
| Noncurrent | (125) | 28 | (97) | (114) | 9 | (105) | ||||||||||||||||||||
| Total fair value of derivative liabilities | $(283) | $72 | $(211) | $(288) | $20 | $(268) | ||||||||||||||||||||
| Net fair value derivative assets/(liabilities) | $238 | $(139) | $99 | $(252) | $— | $(252) | ||||||||||||||||||||
| (Millions of Dollars) | 2017 | 2016 | ||||||
| Balance Sheet Location | Gross Amounts of Recognized Assets/(Liabilities) | Gross Amounts Offset | Net Amounts of Assets/ (Liabilities) (a) | Gross Amounts of Recognized Assets/(Liabilities) | Gross Amounts Offset | Net Amounts of Assets/ (Liabilities) (a) | ||
| Con Edison | ||||||||
| Fair value of derivative assets | ||||||||
| Current | $77 | $(67) | $10 | (b) | $81 | $(64) | $17 | (b) |
| Noncurrent | 64 | (61) | 3 | 49 | (43) | 6 | ||
| Total fair value of derivative assets | $141 | $(128) | $13 | $130 | $(107) | $23 | ||
| Fair value of derivative liabilities | ||||||||
| Current | $(141) | $71 | $(70) | $(138) | $61 | $(77) | ||
| Noncurrent | (143) | 60 | (83) | (91) | 52 | (39) | (c) | |
| Total fair value of derivative liabilities | $(284) | $131 | $(153) | $(229) | $113 | $(116) | ||
| Net fair value derivative assets/(liabilities) | $(143) | $3 | $(140) | (b) | $(99) | $6 | $(93) | (b) (c) |
| CECONY | ||||||||
| Fair value of derivative assets | ||||||||
| Current | $55 | $(53) | $2 | (b) | $52 | $(45) | $7 | (b) |
| Noncurrent | 57 | (55) | 2 | 41 | (35) | 6 | ||
| Total fair value of derivative assets | $112 | $(108) | $4 | $93 | $(80) | $13 | ||
| Fair value of derivative liabilities | ||||||||
| Current | $(116) | $57 | $(59) | $(111) | $45 | $(66) | ||
| Noncurrent | (127) | 54 | (73) | (77) | 44 | (33) | ||
| Total fair value of derivative liabilities | $(243) | $111 | $(132) | $(188) | $89 | $(99) | ||
| Net fair value derivative assets/(liabilities) | $(131) | $3 | $(128) | (b) | $(95) | $9 | $(86) | (b) |
(b)At September 30, 2021, immaterial amounts of margin deposits for Con Edison and CECONY were classified as derivative assets on the consolidated balance sheet, but not included in the table. At December 31, 2020, margin deposits for Con Edison and CECONY of $3 million were classified as derivative assets on the consolidated balance sheet, but not included in the table. Margin is collateral, typically cash, that the holder of a derivative instrument is required to deposit in order to transact on an exchange and to cover its potential losses with its broker or the exchange.
(c)Includes amounts for interest rate swaps of $5 million in noncurrent assets, $(26) millionin current liabilities and $(39) million in noncurrent liabilities. At September 30, 2021, the Clean Energy Businesses had interest rate swaps with notional amounts of $1,046 million. The expiration dates of the swaps range from 2025-2041. In June 2021, as part of the Clean Energy Businesses' sale of a renewable electric project, interest rate swaps terminating in 2024 were assumed by the buyer.
(d)Includes amounts for interest rate swaps of $(24) million in current liabilities and $(82) million in noncurrent liabilities. At December 31, 2020, the Clean Energy Businesses had interest rate swaps with notional amounts of $863 million. The expiration dates of the swaps ranged from 2024-2041.
The Utilities generally recover their prudently incurred fuel, purchased power and gas costs, including hedging gains and losses, in accordance with rate provisions approved by the applicable state utility regulators. In accordance with the accounting rules for regulated operations, the Utilities record a regulatory asset or regulatory liability to defer recognition of unrealized gains and losses on their electric and gas derivatives. As gains and losses are realized in future periods, they will be recognized as purchased power, gas and fuel costs in the Companies’ consolidated income statements.
The Clean Energy Businesses record realized and unrealized gains and losses on their derivative contracts in purchased power, gas purchased for resale and non-utility revenue in the reporting period in which they occur. The Clean Energy Businesses record changes in the fair value of their interest rate swaps in other interest expense at the end of each reporting period. Management believes that these derivative instruments represent economic hedges that mitigate exposure to fluctuations in commodity prices.prices and interest rates.
47
The following table presents the realized and unrealized gains or losses on commodity derivatives that have been deferred or recognized in earnings for the three and nine months ended September 30, 20172021 and 2016:2020:
| For the Three Months Ended September 30, | ||||||||||||||||||||
| Con Edison | CECONY | |||||||||||||||||||
| (Millions of Dollars) | Balance Sheet Location | 2021 | 2020 | 2021 | 2020 | |||||||||||||||
| Pre-tax gains/(losses) deferred in accordance with accounting rules for regulated operations: | ||||||||||||||||||||
| Current | Deferred derivative gains | $296 | $26 | $279 | $24 | |||||||||||||||
| Noncurrent | Deferred derivative gains | 70 | 17 | 66 | 16 | |||||||||||||||
| Total deferred gains/(losses) | $366 | $43 | $345 | $40 | ||||||||||||||||
| Current | Deferred derivative losses | $(4) | $(9) | $(3) | $(11) | |||||||||||||||
| Current | Recoverable energy costs | 17 | (23) | 13 | (19) | |||||||||||||||
| Noncurrent | Deferred derivative losses | (61) | (15) | (55) | (12) | |||||||||||||||
| Total deferred gains/(losses) | ($48) | $(47) | $(45) | $(42) | ||||||||||||||||
| Net deferred gains/(losses) | $318 | $(4) | $300 | $(2) | ||||||||||||||||
| Income Statement Location | ||||||||||||||||||||
| Pre-tax gains/(losses) recognized in income | ||||||||||||||||||||
| Gas purchased for resale | $2 | $— | $— | $— | ||||||||||||||||
| Non-utility revenue | (23) | (2) | — | — | ||||||||||||||||
| Other operations and maintenance expense | 1 | — | 1 | — | ||||||||||||||||
| Other interest expense | 11 | 7 | — | — | ||||||||||||||||
| Total pre-tax gains/(losses) recognized in income | $(9) | $5 | $1 | $— | ||||||||||||||||
| For the Three Months Ended September 30, | |||||||||||||
| Con Edison | CECONY | ||||||||||||
| (Millions of Dollars) | Balance Sheet Location | 2017 | 2016 | 2017 | 2016 | ||||||||
| Pre-tax gains/(losses) deferred in accordance with accounting rules for regulated operations: | |||||||||||||
| Current | Deferred derivative gains | $(4) | $(1) | $(3) | $(3) | ||||||||
| Noncurrent | Deferred derivative gains | 1 | (2) | 1 | — | ||||||||
| Total deferred gains/(losses) | $(3) | $(3) | $(2) | $(3) | |||||||||
| Current | Deferred derivative losses | $(11) | $(19) | $(9) | $(18) | ||||||||
| Current | Recoverable energy costs | (40) | (39) | (38) | (35) | ||||||||
| Noncurrent | Deferred derivative losses | (12) | (17) | (8) | (14) | ||||||||
| Total deferred gains/(losses) | $(63) | $(75) | $(55) | $(67) | |||||||||
| Net deferred gains/(losses) | $(66) | $(78) | $(57) | $(70) | |||||||||
| Income Statement Location | |||||||||||||
| Pre-tax gains/(losses) recognized in income | |||||||||||||
| Purchased power expense | $— | $(37) | (b) | $— | $— | ||||||||
| Gas purchased for resale | (47) | (38) | — | — | |||||||||
| Non-utility revenue | 5 | (a) | (2) | (b) | — | — | |||||||
| Total pre-tax gains/(losses) recognized in income | $(42) | $(77) | $— | $— | |||||||||
| For the Nine Months Ended September 30, | |||||||||||||
| Con Edison | CECONY | ||||||||||||
| (Millions of Dollars) | Balance Sheet Location | 2017 | 2016 | 2017 | 2016 | ||||||||
| Pre-tax gains/(losses) deferred in accordance with accounting rules for regulated operations: | |||||||||||||
| Current | Deferred derivative gains | $(26) | $6 | $(22) | $2 | ||||||||
| Noncurrent | Deferred derivative gains | (2) | (1) | (2) | (1) | ||||||||
| Total deferred gains/(losses) | $(28) | $5 | $(24) | $1 | |||||||||
| Current | Deferred derivative losses | $10 | $19 | $11 | $16 | ||||||||
| Current | Recoverable energy costs | (125) | (163) | (116) | (148) | ||||||||
| Noncurrent | Deferred derivative losses | (40) | (5) | (36) | (3) | ||||||||
| Total deferred gains/(losses) | $(155) | $(149) | $(141) | $(135) | |||||||||
| Net deferred gains/(losses) | $(183) | $(144) | $(165) | $(134) | |||||||||
| Income Statement Location | |||||||||||||
| Pre-tax gains/(losses) recognized in income | |||||||||||||
| Purchased power expense | $— | $(106) | (b) | $— | $— | ||||||||
| Gas purchased for resale | (161) | (72) | — | — | |||||||||
| Non-utility revenue | 11 | (a) | 15 | (b) | — | — | |||||||
| Total pre-tax gains/(losses) recognized in income | $(150) | $(163) | $— | $— | |||||||||
| For the Nine Months Ended September 30, | ||||||||||||||||||||
| Con Edison | CECONY | |||||||||||||||||||
| (Millions of Dollars) | Balance Sheet Location | 2021 | 2020 | 2021 | 2020 | |||||||||||||||
| Pre-tax gains/(losses) deferred in accordance with accounting rules for regulated operations: | ||||||||||||||||||||
| Current | Deferred derivative gains | $443 | $23 | $415 | $20 | |||||||||||||||
| Noncurrent | Deferred derivative gains | 106 | 15 | 97 | 14 | |||||||||||||||
| Total deferred gains/(losses) | $549 | $38 | $512 | $34 | ||||||||||||||||
| Current | Deferred derivative losses | $25 | $12 | $22 | $9 | |||||||||||||||
| Current | Recoverable energy costs | (30) | (163) | (29) | (144) | |||||||||||||||
| Noncurrent | Deferred derivative losses | (16) | (73) | (13) | (70) | |||||||||||||||
| Total deferred gains/(losses) | $(21) | $(224) | $(20) | $(205) | ||||||||||||||||
| Net deferred gains/(losses) | $528 | $(186) | $492 | $(171) | ||||||||||||||||
| Income Statement Location | ||||||||||||||||||||
| Pre-tax gains/(losses) recognized in income | ||||||||||||||||||||
| Gas purchased for resale | $4 | $(3) | $— | $— | ||||||||||||||||
| Non-utility revenue | (22) | 3 | — | — | ||||||||||||||||
| Other operations and maintenance expense | 5 | (5) | 5 | (5) | ||||||||||||||||
| Other interest expense | 45 | (82) | — | — | ||||||||||||||||
| Total pre-tax gains/(losses) recognized in income | $32 | $(87) | $5 | $(5) | ||||||||||||||||
The following table presents the hedged volume of Con Edison’s and CECONY’s commodity derivative transactions at September 30, 2017:2021:
| Electric Energy (MWh) (a)(b) | Capacity (MW) (a) | Natural Gas (Dt) (a)(b) | Refined Fuels (gallons) | |||||||||||
| Con Edison | 23,870,400 | 39,914 | 280,838,997 | 4,704,000 | ||||||||||
| CECONY | 21,401,150 | 29,700 | 261,010,000 | 4,704,000 | ||||||||||
(a)Volumes are reported net of long and short positions, except natural gas collars where the volumes of long positions are reported.
(b)Excludes electric congestion and gas basis swap contracts, which are associated with electric and gas contracts and hedged volumes.
48
Electric Energy (MWh) (a)(b) | Capacity (MW) (a) | Natural Gas (Dt) (a)(b) | Refined Fuels (gallons) | |||||
| Con Edison | 32,596,372 | 6,790 | 166,913,644 | 672,000 | ||||
| CECONY | 30,492,575 | 3,000 | 158,500,000 | 672,000 | ||||
The Companies are exposed to credit risk related to transactions entered into primarily for the various energy supply and hedging activities by the Utilities and the Clean Energy Businesses. Credit risk relates to the loss that may result from a counterparty’s nonperformance. The Companies use credit policies to manage this risk, including an established credit approval process, monitoring of counterparty limits, netting provisions within agreements, collateral or prepayment arrangements, credit insurance and credit default swaps. The Companies measure credit risk exposure as the replacement cost for open energy commodity and derivative positions plus amounts owed from counterparties for settled transactions. The replacement cost of open positions represents unrealized gains, net of any unrealized losses where the Companies have a legally enforceable right to offset.
At September 30, 2017,2021, Con Edison and CECONY had $80$689 million and $8$424 million of credit exposure in connection with open energy supply net receivables and hedging activities, net of collateral, respectively. Con Edison’s net credit exposure consisted of $23$95 million with investment-grade counterparties, $23independent system operators, $103 million with non-investment grade/non-rated counterparties, $19 million with independent system operators and $15$160 million with commodity exchange brokers.brokers, and $331 million with investment-grade counterparties. CECONY’s net credit exposure consisted of $7$131 million with commodity exchange brokers and $1$293 million with investment-grade counterparties.
The collateral requirements associated with, and settlement of, derivative transactions are included in net cash flows from operating activities in the Companies’ consolidated statement of cash flows. Most derivative instrument contracts contain provisions that may require a party to provide collateral on its derivative instruments that are in a net liability position. The amount of collateral to be provided will depend on the fair value of the derivative instruments and the party’s credit ratings.
The following table presents the aggregate fair value of the Companies’ derivative instruments with credit-risk-related contingent features that are in a net liability position, the collateral posted for such positions and the additional collateral that would have been required to be posted had the lowest applicable credit rating been reduced one level and to below investment grade at September 30, 2017:2021:
| (Millions of Dollars) | Con Edison (a) | CECONY (a) | ||||||||||||
| Aggregate fair value – net liabilities | $211 | $176 | ||||||||||||
| Collateral posted | 170 | 165 | ||||||||||||
| Additional collateral (b) (downgrade one level from current ratings) | 24 | 4 | ||||||||||||
| Additional collateral (b) (downgrade to below investment grade from current ratings) | 83 | (c) | 54 | (c) | ||||||||||
| (Millions of Dollars) | Con Edison (a) | CECONY (a) | ||
| Aggregate fair value – net liabilities | $148 | $131 | ||
| Collateral posted | 61 | 56 | ||
| Additional collateral (b) (downgrade one level from current ratings) | 23 | 22 | ||
| Additional collateral (b) (downgrade to below investment grade from current ratings) | 101 | (c) | 88 | (c) |
| (a)Non-derivative transactions for the purchase and sale of electricity and gas and qualifying derivative instruments, which have been designated as normal purchases or normal sales, are excluded from the table. These transactions primarily include purchases of electricity from independent system operators. In the event the Utilities and |
(b)The Companies measure the collateral requirements by taking into consideration the fair value amounts of derivative instruments that terminatescontain credit-risk-related contingent features that are in June 2024, pursuanta net liability position plus amounts owed to which it pays a fixed-rate of 2.0855 percentcounterparties for settled transactions and receives a LIBOR-based variable rate.amounts required by counterparties for minimum financial security. The fair value amounts represent unrealized losses, net of this interest rate swap was immaterial as ofany unrealized gains where the Companies have a legally enforceable right to offset.
(c)Derivative instruments that are net assets have been excluded from the table. At September 30, 2017 and a liability2021, if Con Edison had been downgraded to below investment grade, it would have been required to post additional collateral for such derivative instruments of $1 million as of December 31, 2016 on Con Edison’s consolidated balance sheet.$72 million.
Note L —O – Fair Value Measurements
The accounting rules for fair value measurements and disclosures define fair value as the price that would be received to sell an asset or paid to transfer a liability in an orderly transaction between market participants at the measurement date in a principal or most advantageous market. Fair value is a market-based measurement that is determined based on inputs, which refer broadly to assumptions that market participants use in pricing assets or liabilities. These inputs can be readily observable, market corroborated, or generally unobservable firm inputs. The Companies often make certain assumptions that market participants would use in pricing the asset or liability, including assumptions about risk, and the risks inherent in the inputs to valuation techniques. The Companies use valuation techniques that maximize the use of observable inputs and minimize the use of unobservable inputs.
The accounting rules for fair value measurements and disclosures established a fair value hierarchy, which prioritizes the inputs to valuation techniques used to measure fair value in three broad levels. The rules require that assets and liabilities be classified in their entirety based on the level of input that is significant to the fair value measurement. Assessing the significance of a particular input may require judgment considering factors specific to the asset or liability and may affect the valuation of the asset or liability and their placement within the fair value
49
hierarchy. The Companies classify fair value balances based on the fair value hierarchy defined by the accounting rules for fair value measurements and disclosures as follows:
•Level 1 – Consists of assets or liabilities whose value is based on unadjusted quoted prices in active markets at the measurement date. An active market is one in which transactions for assets or liabilities occur with sufficient frequency and volume to provide pricing information on an ongoing basis. This category includes contracts traded on active exchange markets valued using unadjusted prices quoted directly from the exchange.
•Level 2 – Consists of assets or liabilities valued using industry standard models and based on prices, other than quoted prices within Level 1, that are either directly or indirectly observable as of the measurement date. The industry standard models consider observable assumptions including time value, volatility factors and current market and contractual prices for the underlying commodities, in addition to other economic measures. This category includes contracts traded on active exchanges or in over-the-counter markets priced with industry standard models.
•Level 3 – Consists of assets or liabilities whose fair value is estimated based on internally developed models or methodologies using inputs that are generally less readily observable and supported by little, if any, market activity at the measurement date. Unobservable inputs are developed based on the best available information and subject to cost benefit constraints. This category includes contracts priced using models that are internally developed and contracts placed in illiquid markets. It also includes contracts that expire after the period of time for which quoted prices are available and internal models are used to determine a significant portion of the value.
Assets and liabilities measured at fair value on a recurring basis as of September 30, 20172021 and December 31, 20162020 are summarized below.
| 2021 | 2020 | |||||||||||||||||||||||||||||||
| (Millions of Dollars) | Level 1 | Level 2 | Level 3 | Netting Adjustment (e) | Total | Level 1 | Level 2 | Level 3 | Netting Adjustment (e) | Total | ||||||||||||||||||||||
| Con Edison | ||||||||||||||||||||||||||||||||
| Derivative assets: | ||||||||||||||||||||||||||||||||
| Commodity (a)(b)(c) | $215 | $533 | $29 | $(380) | $397 | $19 | $42 | $4 | $53 | $118 | ||||||||||||||||||||||
| Interest rate swaps (a)(b)(c) | — | 5 | — | — | 5 | — | — | — | — | — | ||||||||||||||||||||||
| Other (a)(b)(d) | 479 | 136 | — | — | 615 | 431 | 126 | — | — | 557 | ||||||||||||||||||||||
| Total assets | $694 | $674 | $29 | $(380) | $1,017 | $450 | $168 | $4 | $53 | $675 | ||||||||||||||||||||||
| Derivative liabilities: | ||||||||||||||||||||||||||||||||
| Commodity (a)(b)(c) | $40 | $462 | $34 | $(272) | $264 | $7 | $296 | $23 | $46 | $372 | ||||||||||||||||||||||
| Interest rate swaps (a)(b)(c) | — | 65 | — | — | 65 | — | 106 | — | — | 106 | ||||||||||||||||||||||
| Total liabilities | $40 | $527 | $34 | $(272) | $329 | $7 | $402 | $23 | $46 | $478 | ||||||||||||||||||||||
| CECONY | ||||||||||||||||||||||||||||||||
| Derivative assets: | ||||||||||||||||||||||||||||||||
| Commodity (a)(b)(c) | $142 | $367 | $2 | $(201) | $310 | $15 | $20 | $— | $(16) | $19 | ||||||||||||||||||||||
| Other (a)(b)(d) | 460 | 128 | — | — | 588 | 411 | 120 | — | — | 531 | ||||||||||||||||||||||
| Total assets | $602 | $495 | $2 | $(201) | $898 | $426 | $140 | $— | $(16) | $550 | ||||||||||||||||||||||
| Derivative liabilities: | ||||||||||||||||||||||||||||||||
| Commodity (a)(b)(c) | $— | $253 | $19 | $(61) | $211 | $3 | $274 | $10 | $(19) | $268 | ||||||||||||||||||||||
(a)The Companies’ policy is to review the fair value hierarchy and recognize transfers into and transfers out of the levels at the end of each reporting period. Con Edison and CECONY had no transfers between levels 1, 2, and 3 during the nine months ended September 30, 2021. Con Edison and CECONY had $1 million of commodity derivative liabilities transferred from level 3 to level 2 during the year ended December 31, 2020 because of availability of observable market data due to the decrease in the terms of certain contracts from beyond three years as of September 30, 2020 to less than three years as of December 31, 2020.
(b)Level 2 assets and liabilities include investments held in the deferred compensation plan and/or non-qualified retirement plans, exchange-traded contracts where there is insufficient market liquidity to warrant inclusion in Level 1, and certain over-the-counter derivative instruments for electricity, refined products and natural gas. Derivative instruments classified as Level 2 are valued using industry standard models that incorporate corroborated observable inputs, such as pricing services or prices from similar instruments that trade in liquid markets, time value and volatility factors.
(c)The accounting rules for fair value measurements and disclosures require consideration of the impact of nonperformance risk (including credit risk) from a market participant perspective in the measurement of the fair value of assets and liabilities. At September 30, 2021 and December 31, 2020, the Companies determined that nonperformance risk would have no material impact on their financial position or results of operations.
50
| 2017 | 2016 | ||||||||||||||||||
| (Millions of Dollars) | Level 1 | Level 2 | Level 3 | Netting Adjustment (e) | Total | Level 1 | Level 2 | Level 3 | Netting Adjustment (e) | Total | |||||||||
| Con Edison | |||||||||||||||||||
| Derivative assets: | |||||||||||||||||||
| Commodity (a)(b)(c) | $6 | $28 | $2 | $(18) | $18 | $14 | $33 | $7 | $(24) | $30 | |||||||||
| Other (a)(b)(d) | 271 | 118 | — | — | 389 | 222 | 111 | — | — | 333 | |||||||||
| Total assets | $277 | $146 | $2 | $(18) | $407 | $236 | $144 | $7 | $(24) | $363 | |||||||||
| Derivative liabilities: | |||||||||||||||||||
| Commodity (a)(b)(c) | $2 | $155 | $22 | $(26) | $153 | $4 | $144 | $6 | $(38) | $116 | |||||||||
| Interest Rate Swap (a)(b)(c) | — | — | — | — | — | — | 1 | — | — | 1 | |||||||||
| Total liabilities | $2 | $155 | $22 | $(26) | $153 | $4 | $145 | $6 | $(38) | $117 | |||||||||
| CECONY | |||||||||||||||||||
| Derivative assets: | |||||||||||||||||||
| Commodity (a)(b)(c) | $5 | $12 | $1 | $(9) | $9 | $10 | $19 | $1 | $(10) | $20 | |||||||||
| Other (a)(b)(d) | 248 | 113 | — | — | 361 | 200 | 106 | — | — | 306 | |||||||||
| Total assets | $253 | $125 | $1 | $(9) | $370 | $210 | $125 | $1 | $(10) | $326 | |||||||||
| Derivative liabilities: | |||||||||||||||||||
| Commodity (a)(b)(c) | $1 | $133 | $15 | $(17) | $132 | $1 | $124 | $— | $(26) | $99 | |||||||||
(e)Amounts represent the impact of legally-enforceable master netting agreements that allow the Companies to net gain and loss positions and cash collateral held or placed with the same counterparties.
The employees in the Companies’ risk management group develop and maintain the Companies’ valuation policies and procedures for, and verify pricing and fair value valuation of, commodity derivatives.derivatives and interest rate swaps. Under the Companies’ policies and procedures, multiple independent sources of information are obtained for forward price curves used to value commodity derivatives.derivatives and interest rate swaps. Fair value and changes in fair value of commodity derivatives and interest rate swaps are reported on a monthly basis to the Companies’ risk committees, comprised of officers and employees of the Companies that oversee energy hedging at the Utilities and the Clean Energy Businesses. The risk management group reports to the Companies’ Vice President and Treasurer.
| Fair Value of Level 3 at September 30, 2017 | Valuation Techniques | Unobservable Inputs | Range | |
| (Millions of Dollars) | ||||
| Con Edison – Commodity | ||||
| Electricity | $(21) | Discounted Cash Flow | Forward energy prices (a) | $19.00-$76.25 per MWh |
| Discounted Cash Flow | Forward capacity prices (a) | $1.26-$9.47 per kW-month | ||
| Transmission Congestion Contracts/Financial Transmission Rights | 1 | Discounted Cash Flow | Discount to adjust auction prices for inter-zonal forward price curves (b) | 50.0% |
| Inter-zonal forward price curves adjusted for historical zonal losses (b) | $0.50-$6.75 per MWh | |||
| Total Con Edison—Commodity | $(20) | |||
| CECONY – Commodity | ||||
| Electricity | $(15) | Discounted Cash Flow | Forward energy prices (a) | $20.50-$76.25 per MWh |
| Transmission Congestion Contracts | 1 | Discounted Cash Flow | Discount to adjust auction prices for inter-zonal forward price curves (b) | 50.0% |
| Total CECONY—Commodity | $(14) | |||
| Valuation Techniques | Unobservable Inputs | Range | ||||||||||||
| (Millions of Dollars) | ||||||||||||||
| Con Edison – Commodity | ||||||||||||||
| Electricity | $11 | Discounted Cash Flow | Forward energy prices (a) | $15.00-$130.75 per MWh | ||||||||||
| (17) | Discounted Cash Flow | Forward capacity prices (a) | $0.26-$12.93 per kW-month | |||||||||||
| Transmission Congestion Contracts/Financial Transmission Rights | 1 | Discounted Cash Flow | Inter-zonal forward price curves adjusted for historical zonal losses (b) | $(4.21)-$10.11 per MWh | ||||||||||
| Total Con Edison—Commodity | $(5) | |||||||||||||
| CECONY – Commodity | ||||||||||||||
| Electricity | $(9) | Discounted Cash Flow | Forward energy prices (a) | $26.80-$98.51 per MWh | ||||||||||
| (10) | Discounted Cash Flow | Forward capacity prices (a) | $0.70-$12.93 per kW-month | |||||||||||
| Transmission Congestion Contracts | 2 | Discounted Cash Flow | Inter-zonal forward price curves adjusted for historical zonal losses (b) | $0.63-$5.63 per MWh | ||||||||||
| Total CECONY—Commodity | $(17) | |||||||||||||
(a)Generally, increases/(decreases) in this input in isolation would result in a higher/(lower) fair value measurement.
(b)Generally, increases/(decreases) in this input in isolation would result in a lower/(higher) fair value measurement.
The table listed below provides a reconciliation of the beginning and ending net balances for assets and liabilities measured at fair value as of September 30, 20172021 and 20162020 and classified as Level 3 in the fair value hierarchy:
| For the Three Months Ended September 30, | ||||||||||||||
| Con Edison | CECONY | |||||||||||||
| (Millions of Dollars) | 2021 | 2020 | 2021 | 2020 | ||||||||||
| Beginning balance as of July 1, | $(9) | $(14) | $(7) | $(7) | ||||||||||
| Included in earnings | 21 | — | 1 | — | ||||||||||
| Included in regulatory assets and liabilities | (17) | (3) | (11) | (1) | ||||||||||
| Settlements | — | — | — | (1) | ||||||||||
| Ending balance as of September 30, | $(5) | $(17) | $(17) | $(9) | ||||||||||
| For the Three Months Ended September 30, | ||||||||
| �� Con Edison | CECONY | |||||||
| (Millions of Dollars) | 2017 | 2016 | 2017 | 2016 | ||||
| Beginning balance as of July 1, | $(10) | $5 | $(6) | $2 | ||||
| Included in earnings | 7 | (4) | 1 | — | ||||
| Included in regulatory assets and liabilities | (13) | (5) | (8) | (3) | ||||
| Sales | — | 4 | — | — | ||||
| Settlements | (4) | 1 | (1) | 1 | ||||
| Ending balance as of September 30, | $(20) | $1 | $(14) | $— | ||||
| For the Nine Months Ended September 30, | ||||||||||||||
| Con Edison | CECONY | |||||||||||||
| (Millions of Dollars) | 2021 | 2020 | 2021 | 2020 | ||||||||||
| Beginning balance as of January 1, | $(19) | $(16) | $(10) | $(6) | ||||||||||
| Included in earnings | 20 | (7) | (2) | (3) | ||||||||||
| Included in regulatory assets and liabilities | (9) | (3) | (7) | (3) | ||||||||||
| Settlements | 3 | 9 | 2 | 3 | ||||||||||
| Ending balance as of September 30, | $(5) | $(17) | $(17) | $(9) | ||||||||||
| For the Nine Months Ended September 30, | ||||||||
| Con Edison | CECONY | |||||||
| (Millions of Dollars) | 2017 | 2016 | 2017 | 2016 | ||||
| Beginning balance as of January 1, | $1 | $6 | $1 | $8 | ||||
| Included in earnings | 8 | (1) | 1 | (1) | ||||
| Included in regulatory assets and liabilities | (21) | (11) | (14) | (6) | ||||
| Purchases | 1 | 2 | 1 | 1 | ||||
| Sales | — | 4 | — | — | ||||
| Settlements | (9) | 1 | (3) | (2) | ||||
| Ending balance as of September 30, | $(20) | $1 | $(14) | $— | ||||
For the Utilities, realized gains and losses on Level 3 commodity derivative assets and liabilities are reported as part of purchased power, gas and fuel costs. The Utilities generally recover these costs in accordance with rate provisions approved by the applicable state public utilities regulators. Unrealized gains and losses for commodity derivatives are generally deferred on the consolidated balance sheet in accordance with the accounting rules for regulated operations.
51
For the Clean Energy Businesses, realized and unrealized gains and losses on Level 3 commodity derivative assets and liabilities are reported in non-utility revenues (immaterial for both periods) and purchased power costs ($4 million gain and $5 million loss) on the consolidated income statement for the three months ended September 30, 20172021 and 2016, respectively.2020 ($20 million gain and $1 million gain, respectively). Realized and unrealized gains and losses on Level 3 commodity derivative assets and liabilities are reported in non-utility revenues (immaterial for both periods) and purchased power costs ($3 million gain and $6 million loss) on the consolidated income statement for the nine months ended September 30, 20172021 and 2016, respectively. The change in fair value relating to Level 3 commodity derivative assets and liabilities held at September 30, 2017 and 2016 is included in non-utility revenues (immaterial for both periods) and purchased power costs2020 ($4 million gain and $4 million loss) on the consolidated income statement for the three months ended
Note M —P – Variable Interest Entities
The Companies enter into arrangements including leases, partnerships and electricity purchase agreements, with various entities. As a result of these arrangements, Con Edison retainsthe Companies retain or may retain a variable interest in these entities.
CECONY
CECONY has an ongoing long-term electricity purchase agreement with Brooklyn Navy Yard Cogeneration Partners, LP, a potential variable interest entity (VIE).VIE. In April 2017, CECONY's long-term electricity purchase agreement with Cogen Technologies Linden Venture, LP, another potential VIE, expired. In 2016, requests were2020, a request was made of these counterpartiesthis counterparty for information necessary to determine whether the entity was a VIE and whether CECONY is the primary beneficiary; however, the information was not made available. The payments for these contractsthis contract constitute CECONY’s maximum exposure to loss with respect to the potential VIEs.VIE.
In June 2021, a subsidiary of the VIEsClean Energy Businesses sold substantially all of its membership interest in a renewable electric project, and retained an equity interest of $11 million in the project which, Con Edison Development has entered into as of September 30, 2017:
| Project Name (a) | Generating Capacity (b) (MW AC) | Power Purchase Agreement Term (in Years) | Year of Initial Investment | Location | Maximum Exposure to Loss (Millions of Dollars) (c) |
| Copper Mountain Solar 3 | 128 | 20 | 2014 | Nevada | $175 |
| Mesquite Solar 1 | 83 | 20 | 2013 | Arizona | 102 |
| Copper Mountain Solar 2 | 75 | 25 | 2013 | Nevada | 83 |
| California Solar | 55 | 25 | 2012 | California | 64 |
| Broken Bow II | 38 | 25 | 2014 | Nebraska | 44 |
| Texas Solar 4 | 32 | 25 | 2014 | Texas | 47 |
In February 2021, a subsidiary of the Clean Energy Businesses entered into an agreement relating to certain projects (CED Nevada Virginia) with a noncontrolling tax equity investor to which a percentage of earnings, tax attributes and cash flows will be allocated. CED Nevada Virginia is a consolidated entity in which Con Edison Development and third parties. Con Edison’s ownership interest in Texas Solar 4 is 80has less than a 100 percent and is consolidated in the financial statements.membership interest. Con Edison is the primary beneficiary since the power to direct the activities that most significantly impact the economics of Texas Solar 4CED Nevada Virginia during construction of the projects, and upon commercial operation, is held by the Clean Energy Businesses.
For the three months ended September 30, 2021, the hypothetical liquidation at book value (HLBV) method of accounting for CED Nevada Virginia resulted in a $74 million loss ($56 million, after-tax) for the tax equity investor and an equivalent amount of income for Con Edison.
For the nine months ended September 30, 2021, the HLBV method of accounting for CED Nevada Virginia resulted in a $127 million loss ($96 million, after tax) for the tax equity investor and an equivalent amount of income for Con Edison.
In December 2018,the Clean Energy Businesses completed its acquisition of Sempra Solar Holdings, LLC. Included in the acquisition were certain operating projects (Tax Equity Projects) with a noncontrolling tax equity investor to which a percentage of earnings, tax attributes and cash flows are allocated. The Tax Equity Projects are consolidated entities in which Con Edison Development.
52
Equity Projects is held by the Clean Energy Businesses. Electricity generated by the Tax Equity Projects is sold to utilities and municipalities pursuant to long-term power purchase agreements.
For the three months ended September 30, 2021, the HLBV method of accounting for the Tax Equity Projects resulted in an immaterial amount of income for the tax equity investor and $14 million of income ($11 million, after-tax) for Con Edison. For the three months ended September 30, 2020, the HLBV method of accounting for the Tax Equity Projects resulted in $9 million of income ($7 million, after-tax) for the tax equity investor and $7 million of income ($5 million, after-tax) for Con Edison.
For the nine months ended September 30, 2021, the HLBV method of accounting for the Tax Equity Projects resulted in $8 million of income ($6 million, after tax) for the tax equity investor and $27 million of income ($20 million, after tax) for Con Edison. For the nine months ended September 30, 2020, the HLBV method of accounting for the Tax Equity Projects resulted in $38 million of income ($29 million, after tax) for the tax equity investor and a $3 million loss ($2 million, after tax) for Con Edison.
Con Edison has determined that the use of HLBV accounting is reasonable and appropriate to attribute income and loss to the tax equity investors. Using the HLBV method, the company's earnings from the projects are adjusted to reflect the income or loss allocable to the tax equity investors calculated based on how the project would allocate and distribute its cash if it were to sell all of its assets for their carrying amounts and liquidate at a particular point in time. Under the HLBV method, the company calculates the liquidation value allocable to the tax equity investors at the beginning and end of each period based on the contractual liquidation waterfall and adjusts its income for the period to reflect the change in the project.
At September 30, 2021 and December 31, 2020, Con Edison’s consolidated balance sheet. For consolidated investments, such as Texas Solar 4, maximum exposure is equal tosheet included the netfollowing amounts associated with its VIEs:
| Tax Equity Projects | |||||||||||||||||
| Great Valley Solar (c)(d) | Copper Mountain - Mesquite Solar (c)(e) | CED Nevada Virginia (c)(h) | |||||||||||||||
| (Millions of Dollars) | 2021 | 2020 | 2021 | 2020 | 2021 | ||||||||||||
| Non-utility property, less accumulated depreciation (f)(g) | $278 | $284 | $435 | $446 | $647 | ||||||||||||
| Other assets | 40 | 39 | 174 | 176 | 57 | ||||||||||||
| Total assets (a) | $318 | $323 | $609 | $622 | $704 | ||||||||||||
| Other liabilities | 14 | 13 | 79 | 71 | 328 | ||||||||||||
| Total liabilities (b) | $14 | $13 | $79 | $71 | $328 | ||||||||||||
(a)The assets of the project onTax Equity Projects and CED Nevada Virginia represent assets of a consolidated VIE that can be used only to settle obligations of the consolidated balance sheet less any applicable noncontrolling interest ($7 millionVIE.
(b)The liabilities of the Tax Equity Projects and CED Nevada Virginia represent liabilities of a consolidated VIE for Texas Solar 4). which creditors do not have recourse to the general credit of the primary beneficiary.
(c)Con Edison did not provide any financial or other support during the three and nine months ended September 30, 2017year that was not previously contractually required.
(d)Great Valley Solar consists of the Great Valley Solar 1, Great Valley Solar 2, Great Valley Solar 3 and Great Valley Solar 4 projects, for which the noncontrolling interest of the tax equity investor was $88 million and $82 million at September 30, 2021 and December 31, 2020, respectively.
(e)Copper Mountain - Mesquite Solar consists of the Copper Mountain Solar 4, Mesquite Solar 2 and Mesquite Solar 3 projects for which the noncontrolling interest of the tax equity investor was $122 million and $134 million at September 30, 2021 and December 31, 2020, respectively.
(f)Non-utility property is reduced by accumulated depreciation of $24 million for Great Valley Solar, $40 million for Copper Mountain - Mesquite Solar, and $5 million for CED Nevada Virginia at September 30, 2021.
(g)Non-utility property is reduced by accumulated depreciation of $18 million for Great Valley Solar and $30 million for Copper Mountain - Mesquite Solar at December 31, 2020.
(h)CED Nevada Virginia consists of the Copper Mountain Solar 5, Battle Mountain Solar and Water Strider Solar projects for which the noncontrolling interest of the tax equity investor was $128 million at September 30, 2021.
Note N —Q – New Financial Accounting Standards
In May 2014, the Financial Accounting Standards Board (FASB) and the International Accounting Standards Board jointly issued a revenue recognition standard that will supersede the revenue recognition requirements within Accounting Standards Codification Topic 605, “Revenue Recognition,” and most industry-specific guidance under the Codification through Accounting Standards Update (ASU) No. 2014-09, “Revenue from Contracts with Customers (Topic 606).” The purpose of the new guidance is to create a consistent framework for revenue recognition. The guidance clarifies how to measure and recognize revenue arising from customer contracts to depict the transfer of goods or services in an amount that reflects the consideration the entity expects to receive. Amendments were issued subsequently to clarify key areas including principal/agent considerations, performance obligations, licensing, sales taxes, noncash consideration, and contracts. The new standard is effective for reporting periods beginning after December 15, 2017. Early adoption is permitted for reporting periods beginning after December 15, 2016, however, the Companies plan to adopt the new standard for reporting periods beginning after December 15, 2017.
53
December 31, 2021 for one-week and liquidity.
two-month U.S. Dollar LIBOR tenors, and after June 30, 2023 for all other U.S. Dollar LIBOR tenors. ASU 2020-04 provides entities with optional expedients and exceptions for applying generally accepted accounting principles to contract modifications and hedging relationships, subject to meeting certain criteria, that reference LIBOR or another reference rate expected to be discontinued. In January 2017,2021, the FASB issued amendments to the guidance for Business Combinations through ASU 2017-01, “Business Combinations (Topic 805): Clarifying the Definition of a Business.”2021-01 to include all contract modifications and hedging relationships affected by reference rate reform, including those that do not directly reference LIBOR or another reference rate expected to be discontinued, and clarify which optional expedients may be applied to them. The amendments in this update clarify the definition of a businessguidance can be applied prospectively. The optional relief is temporary and provide guidance on evaluating whether transactions shouldgenerally cannot be accounted for as acquisitions (or disposals) of assetsapplied to contract modifications and hedging relationships entered into or businesses. For public entities, the amendments are effective for reporting periods beginningevaluated after December 15, 2017. Early adoption is permitted.31, 2022. The application of thisCompanies do not expect the new guidance is not expected to have a material impact on the Companies’their financial position, results of operations andor liquidity.
Note R – Dispositions
In January 2017, the FASB issued amendments to the guidance for the subsequent measurement of goodwill through ASU 2017-04, “Intangibles-Goodwill and Other (Topic 350): Simplifying the Test for Goodwill Impairment.” The amendments in this update simplify goodwill impairment testing by eliminating Step 2April 2021, a subsidiary of the goodwill impairment test whereinClean Energy Businesses entered into an entity hasagreement to compute the implied fair value of goodwill by performing procedures to determine the fair valuesell substantially all of its assetsmembership interests in a renewable electric project that it developed and liabilities. Under the new guidance, an entity should recognize an impairment charge for the amount by which the carrying amount exceeds the reporting unit’s fair value up to the total amountalso all of goodwill allocated to that reporting unit. For public entities, the amendments are effective for reporting periods beginning after December 15, 2019. Early adoption is permitted. The application of this guidance is not expected to haveits membership interests in a material impact on the Companies’ financial position, results of operations and liquidity.
In July 2021, a subsidiary of CET Gas and its joint venture partner completed the first of two closings for the sale of their combined interests in Stagecoach. The first closing was completed for a total sale price of $1,195 million, of which is expected$614 million, including working capital, was attributed to be substantially completedCET Gas. See "Investments" in 2018.
Note A.
Item 2: Management’s Discussion and Analysis of Financial Condition and Results of Operations
This combined management’s discussion and analysis of financial condition and results of operations (MD&A) relates to the consolidated financial statements (the Third Quarter Financial Statements) included in this report of two separate registrants: Consolidated Edison, Inc. (Con Edison) and Consolidated Edison Company of New York, Inc. (CECONY). As used in this report, the term the “Companies” refers to Con Edison and CECONY. CECONY is a subsidiary of Con Edison and, as such, information in this management’s discussion and analysis about CECONY applies to Con Edison.
This MD&A should be read in conjunction with the Third Quarter Financial Statements and the notes thereto and the MD&A in Item 7 of the Companies’ combined Annual Report on Form 10-K for the year ended December 31, 20162020 (File Nos. 1-14514 and 1-1217, the Form 10-K) and the MD&A in Part 1, Item 2 of the Companies' combined Quarterly Reports on Form 10-Q for the quarterly periods ended March 31, 20172021 and June 30, 20172021 (File Nos. 1-14514 and 1-1217).
Information in any item of this report referred to in this discussion and analysis is incorporated by reference herein. The use of terms such as “see” or “refer to” shall be deemed to incorporate by reference into this discussion and analysis the information to which reference is made.
Con Edison, incorporated in New York State in 1997, is a holding company that owns all of the outstanding common stock of CECONY, Orange and Rockland Utilities, Inc. (O&R), Con Edison Clean Energy Businesses, Inc. and Con Edison Transmission, Inc. As used in this report, the term the “Utilities” refers to CECONY and O&R.
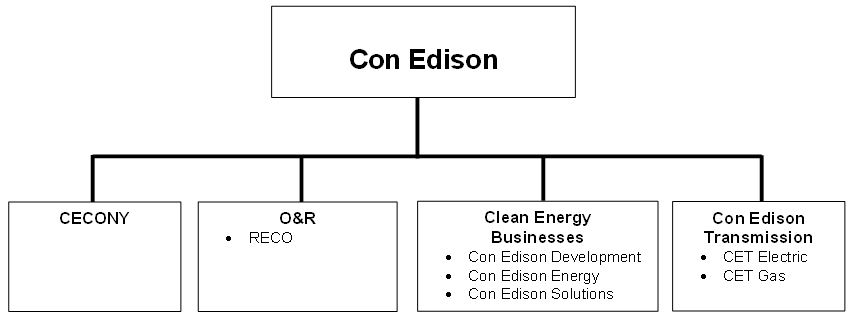
| Con Edison | ||||||||||||||||||||||||||||||||
| CECONY | O&R | Clean Energy Businesses | Con Edison Transmission | |||||||||||||||||||||||||||||
•RECO | •CET Electric | |||||||||||||||||||||||||||||||
•CET Gas | ||||||||||||||||||||||||||||||||
Con Edison’s principal business operations are those of CECONY, O&R, the Clean Energy Businesses and Con Edison Transmission. CECONY’s principal business operations are its regulated electric, gas and steam delivery businesses. O&R’s principal business operations are its regulated electric and gas delivery businesses. The Clean Energy Businesses develop, own and operate renewable and sustainable energy infrastructure projects and provide energy-related products and services to wholesale and retail customers. Con Edison Transmission invests in and seeks to develop electric transmission facilitiesprojects and manages, through joint ventures, both electric and gas pipelineassets. CET Gas and storage facilities.CECONY are considering strategic alternatives with respect to their interests in Honeoye Storage Corporation (Honeoye), of which CET owns a 71.2 percent interest and CECONY owns a 28.8 percent interest.
Con Edison seeks to provide shareholder value through continued dividend growth, supported by earnings growth in regulated utilities and contracted electric and gas assets. The company invests to provide reliable, resilient, safe and clean energy critical for its New York City’s growing economy.customers. The company is an industry leading owner and operator of contracted, large-scale solar generation in the United States. Con Edison is a responsible neighbor, helping the communities it serves become more sustainable.
CECONY
Electric
CECONY provides electric service to approximately 3.43.5 million customers in all of New York City (except a part of Queens) and most of Westchester County, an approximately 660 square mile service area with a population of more than nine million.
55
Electric Supply
In 2019, the New York State Department of Environmental Conservation (NYSDEC) issued regulations that may require the retirement or seasonal unavailability of fossil-fueled electric generating units owned by CECONY and others in New York City. The NYSDEC rule limits nitrous oxides (NOx) emissions during the ozone season from May through September and affects older peaking units that are generally located downstate and needed during periods of high electric demand or for local reliability purposes. Compliance with the rule will require affected units (approximately 1,400 MW in CECONY's service territory, of which 65 MW is owned by CECONY) to cease operation during the ozone season, install emission controls, repower, or retire by 2023 or 2025. The NYISO, in its 2020 Reliability Needs Assessment study that was approved by the NYISO board, reported local and bulk transmission system reliability needs that are expected to be caused by the retirement or unavailability of some of the impacted units. In January 2021, CECONY updated its Local Transmission Plan (LTP) to address the identified reliability needs on its local system through the construction of three transmission projects, the Reliable Clean City (RCC) projects. In addition, CECONY continues to monitor forecasted system voltage performance and if a need for support persists in the forecast, CECONY will propose solutions in a subsequent LTP update. CECONY estimates that the costs of the RCC projects to solve the local reliability needs to be approximately $780 million over four years. In April 2021, the NYSPSC approved CECONY’s December 2020 petition to recover $780 million of costs to construct the RCC projects to solve the local reliability needs.
During the summer of 2017,2021, electric peak demand in CECONY's service area was 12,32112,039 MW (which occurred on July 20, 2017)June 30, 2021). At design conditions, electric peak demand in the company's service area would have been approximately 13,27012,336 MW in 20172021 compared to the company's forecast of 13,47012,880 MW. The company'slower peak demand at design conditions as compared to the forecast was primarily due to the slower than expected recovery of electric demand in CECONY's territory during the emergence from the COVID-19 pandemic. The company decreased its five-year forecast of average annual growth of thechange in electric peak demand in its service area at design conditions isfrom approximately 0.10.8 percent for 2018(for 2021 to 2022 (as compared2025) to approximately 0.20.4 percent for 2017(for 2022 to 2021)2026).
Gas
CECONY delivers gas to approximately 1.1 million customers in Manhattan, the Bronx, parts of Queens and most of Westchester County.
In May 2017, the company2021, CECONY decreased its five-year forecast of average annual growth of the firm peak gas demand in its service area at design conditions from approximately 2.31.4 percent (for 20172021 to 2021)2025) to 1.6approximately 1.3 percent (for 20182022 to 2022)2026). The slight decrease reflects among other things,the negative impact that the current economy and lingering effects of the COVID-19 pandemic is expected to have on large new construction, usage from existing large customers, as well as the projected number of applications for firm gas service in rolling the forecast forward a year, another yearCECONY's service territory. The decrease also reflects an expected increase in customers’ energy efficiency measures and electrification of oil-to-gas conversions has been completed and fewer opportunities to convert remain.space heating.
Steam
CECONY operates the largest steam distribution system in the United States by producing and delivering approximately 19,50016,981 MMlb of steam annually to approximately 1,6401,558 customers in parts of Manhattan.
In June 2021, CECONY changed its five-year forecast of average annual growth in the peak steam demand in its service area at design conditions from a 0.4 percent decrease to a 0.1 percent increase (for 2022 to 2026), as steam sales are expected to recover from the decrease in customer usage during the COVID-19 pandemic.
O&R
Electric
O&R and its utility subsidiary, Rockland Electric Company (RECO) (together referred to herein as O&R) provide electric service to approximately 0.3 million customers in southeastern New York and northern New Jersey, an approximately 1,300 square mile service area.
During the summer of 2017,2021, electric peak demand in O&R's service area was 1,4101,520 MW (which occurred on June 13, 2017)30, 2021). At design conditions, electric peak demand in the company's service area would have been approximately 1,6151,575 MW in 20172021 compared to the company's forecast of 1,6251,530 MW. The company’sdifference at design conditions is higher than expected due to a decrease in residential vacancies and faster recovery of electric demand in O&R's service territory during the emergence from the COVID-19 pandemic. The company increased its five-year
56
forecast of average annual growth of thechange in electric peak demand in its service area at design conditions is flat for 2018from approximately (0.5) percent (for 2021 to 2022 (as compared2025) to approximately (0.1)(0.3) percent for 2017(for 2022 to 2021)2026).
Gas
O&R delivers gas to over 0.1 million customers in southeastern New York.
In May 2021, O&R decreased its five-year forecast of average annual growth of the firm peak gas demand in its service area at design conditions from approximately 0.2 percent (for 2021 to 2025) to approximately 0.1 percent (for 2022 to 2026). The decrease reflects an expected increase in customers' energy efficiency measures and electrification of space heating.
Clean Energy Businesses
Con Edison Clean Energy Businesses, Inc. has three wholly-owned subsidiaries: Consolidated Edison Development, Inc. (Con Edison Development), Consolidated Edison Energy, Inc. (Con Edison Energy) and Consolidated Edison Solutions, Inc. (Con Edison Solutions). Con Edison Clean Energy Businesses, Inc., together with theseits subsidiaries, (which were formerly referred to as the competitive energy businesses), are referred to in this report as the Clean Energy Businesses.
Con Edison Transmission
Con Edison Transmission, Inc. invests in electric transmission projects and manages, through joint ventures, both electric and gas assets while seeking to develop electric transmission projects through its wholly-owned subsidiaries, Consolidated Edison Transmission, LLC (CET Electric) and Con Edison Gas Pipeline and Storage, LLC (CET Gas). CET Electric owns a 45.7 percent interest in New York Transco LLC, which owns and is proposinghas been selected to build additional electric transmission assets in New York. In May 2021, a CET Gas owns, through subsidiaries,subsidiary entered into a purchase and sale agreement pursuant to which it agreed to sell its 50 percent interest in Stagecoach Gas Services LLC (Stagecoach), a joint venture that owns, operatesowned and will further developoperated an existing gas pipeline and storage business located in northernnortheastern Pennsylvania and the southern tier of New York.York, and in July 2021 the transaction was substantially completed. See "Investments" in Note A and Note R to the Third Quarter Financial Statements. Also, CET Gas and CECONY own 71.2 percent and 28.8 percent interests, respectively, in Honeoye, Storage Corporation which operates a gas storage businessfacility in upstate New York. CET Gas and CECONY are considering strategic alternatives with respect to their interests in Honeoye. At September 30, 2021, the consolidated carrying value of Honeoye was $25 million. In addition, CET Gas owns a 12.510.6 percent interest (that is expected to be reduced to 8.5 percent based on the current project cost estimate and CET Gas’ previous capping of its cash contributions to the joint venture) in Mountain Valley Pipeline LLC (MVP), a joint venture developing a proposed 300 mile300-mile gas transmission project in West Virginia and Virginia (Mountain Valley Pipeline).Virginia. Con Edison Transmission, Inc., together with CET Electric and CET Gas, are referred to in this report as Con Edison Transmission.
Certain financial data of Con Edison’s businesses are presented below:
| For the Three Months Ended September 30, 2021 | For the Nine Months Ended September 30, 2021 | At September 30, 2021 | ||||||||||||||||||||||||||||||
| (Millions of Dollars, except percentages) | Operating Revenues | Net Income for Common Stock | Operating Revenues | Net Income for Common Stock | Assets | |||||||||||||||||||||||||||
| CECONY | $3,092 | 86 | % | $418 | 78 | % | $8,784 | 85 | % | $1,011 | 90 | % | $52,178 | 83 | % | |||||||||||||||||
| O&R | 257 | 7 | 26 | 5 | 699 | 7 | 53 | 5 | 3,344 | 5 | ||||||||||||||||||||||
| Total Utilities | 3,349 | 93 | 444 | 83 | 9,483 | 92 | 1,064 | 95 | 55,522 | 88 | ||||||||||||||||||||||
| Clean Energy Businesses (a) | 264 | 7 | 106 | 20 | 779 | 8 | 223 | 20 | 6,604 | 10 | ||||||||||||||||||||||
Con Edison Transmission (b) | 1 | — | 1 | — | 3 | — | (142) | (13) | 493 | 1 | ||||||||||||||||||||||
Other (c) | (1) | — | (13) | (3) | (4) | — | (23) | (2) | 319 | 1 | ||||||||||||||||||||||
| Total Con Edison | $3,613 | 100 | % | $538 | 100 | % | $10,261 | 100 | % | $1,122 | 100 | % | $62,938 | 100 | % | |||||||||||||||||
(a)Net income for common stock from the Clean Energy Businesses for the three and nine months ended September 30, 2021 includes $(9) million and $20 million, respectively, of net after-tax mark-to-market income/(loss) and reflects $52 million (after-tax) and $87 million (after-tax), respectively, of income attributable to the non-controlling interest of a tax equity investor in renewable electric production projects accounted for under the HLBV method of accounting. Net income for common stock from the Clean Energy Businesses for the nine months ended September 30, 2021 includes $(3) million (after-tax) for the loss from the sale of a renewable electric production project. See Note P to the Third Quarter Financial Statements.
(b)Net income for common stock from Con Edison Transmission for the nine months ended September 30, 2021 includes $(153) million of a net after-tax impairment loss related to its investment in Stagecoach. See Note A to the Third Quarter Financial Statements.
(c)Other includes parent company and consolidation adjustments. Net income for common stock for the three and nine months ended September 30, 2021 includes $(4) million (after-tax) and $(7) million (after-tax), respectively, of loss attributable to the non-controlling interest of a tax equity investor in renewable electric production projects accounted for under the HLBV method of accounting. Net income for common stock for the nine months ended September 30, 2021 includes $6 million of income tax impact for the impairment loss related to Con Edison's investment in Stagecoach and $(2) million of net after-tax mark-to-market loss.
57
| For the Three Months Ended September 30, 2017 | For the Nine Months Ended September 30, 2017 | At September 30, 2017 | ||||||||||||||
| (Millions of Dollars, except percentages) | Operating Revenues | Net Income | Operating Revenues | Net Income | Assets | |||||||||||
| CECONY | $2,799 | 87 | % | $401 | 88 | % | $7,948 | 88 | % | $883 | 87 | % | $41,647 | 85 | % | |
| O&R | 234 | 7 | 22 | 5 | 667 | 7 | 53 | 5 | 2,832 | 6 | ||||||
| Total Utilities | 3,033 | 94 | 423 | 93 | 8,615 | 95 | 936 | 92 | 44,479 | 91 | ||||||
| Clean Energy Businesses (a) | 177 | 6 | 26 | 5 | 460 | 5 | 54 | 5 | 2,811 | 6 | ||||||
| Con Edison Transmission | 1 | — | 9 | 2 | 1 | — | 25 | 2 | 1,210 | 2 | ||||||
| Other (b) | — | — | (1) | — | (4) | — | 5 | 1 | 746 | 1 | ||||||
| Total Con Edison | $3,211 | 100 | % | $457 | 100 | % | $9,072 | 100 | % | $1,020 | 100 | % | $49,246 | 100 | % | |
The Companies continue to respond to the Coronavirus Disease 2019 (COVID-19) global pandemic by working to reduce the potential risks posed by its spread to employees, customers and other stakeholders. The Companies continue to employ an incident command structure led by a pandemic planning team. The Companies support employee health and facility hygiene through regular cleaning and disinfecting of all work and common areas, promoting social distancing, allowing employees to work remotely and directing employees to stay at home if they are experiencing COVID or flu-like symptoms. Employees who test positive for COVID-19 are directed to quarantine at home and are evaluated for close, prolonged contact with other employees that would require those employees to quarantine at home. Following the Centers for Disease Control and Prevention guidelines, sick or quarantined employees return to work when they can safely do so. The Utilities continue to provide critical electric, gas and steam service to customers during the pandemic. Additional safety protocols have been implemented to protect employees, customers and the public, when work at customer premises is required.
On October 22, 2021, in response to President Biden's Executive Order 14042, the Companies announced that they are committed to complying with the mandate for employees of federal contractors and subcontractors to be fully vaccinated against COVID-19 by the federally-required deadline (January 4, 2022), unless employees are legally entitled to an accommodation. The Companies are continuing to monitor the situation closely and are implementing appropriate measures to mitigate any workforce and cost impacts that may occur.
Below is additional information related to the effects of the COVID-19 pandemic and the Companies’ actions. Also, see “COVID-19 Regulatory Matters” in Note B to the Third Quarter Financial Statements.
Impact of CARES Act and 2021 Appropriations Act on Accounting for Income Taxes
In response to the economic impacts of the COVID-19 pandemic, the Coronavirus Aid, Relief, and Economic Security (CARES) Act became law on March 27, 2020. The CARES Act has several key business tax relief measures that may present potential cash benefits and/or refund opportunities for Con Edison and its subsidiaries, including permitting a five-year carryback of a net operating loss (NOL) for tax years 2018, 2019 and 2020, temporary removal of the 80 percent limitation of NOL carryforwards against taxable income for tax years before 2021, temporary relaxation of the limitations on interest deductions, Employee Retention Tax Credit and deferral of payments of employer payroll taxes.
Con Edison carried back its NOL of $29 million from tax year 2018 to tax year 2013. This allowed Con Edison, mostly at the Clean Energy Businesses, to receive a $2.5 million net tax refund and to recognize a discrete income tax benefit of $4 million in 2020, due to the higher federal statutory tax rate in 2013. See "Income Tax" in Note J. Con Edison and its subsidiaries did not have a federal NOL in tax years 2019 or 2020.
Con Edison and its subsidiaries benefited by the increase in the percentage for calculating the limitation on the interest expense deduction from 30 percent of Adjusted Taxable Income (ATI) to 50 percent of ATI in 2019 and 2020, which allowed the Companies to deduct 100 percent of their interest expense. For 2021, the limitation on interest expense for computing ATI has reverted back to 30 percent.
The Companies qualify for an employee retention tax credit created under the CARES Act for "eligible employers" related to governmental authorities imposing restrictions that partially suspended their operations for a portion of their workforce due to the COVID-19 pandemic and the Companies continued to pay them. For the year ended December 31, 2020, Con Edison and CECONY recognized a tax benefit to Taxes, other than income taxes of $10 million and $7 million, respectively.
The CARES Act also allows employers to defer payments of the employer share of Social Security payroll taxes that would have otherwise been owed from March 27, 2020 through December 31, 2020. The Companies deferred the payment of employer payroll taxes for the period April 1, 2020 through December 31, 2020 of approximately $71 million ($63 million of which is for CECONY). The Companies will repay half of this liability by December 31, 2021 and the other half by December 31, 2022.
In December 2020, the Consolidated Appropriations Act, 2021 (the 2021 Appropriations Act) was signed into law. The 2021 Appropriations Act, among other things, extends the expiring employee retention tax credit to include qualified wages paid in the first two quarters of 2021, increases the qualified wages paid to an employee from 50 percent up to $10,000 annually in 2020 to 70 percent up to $10,000 per quarter in 2021 and increases the maximum employee retention tax credit amount an employer can take per employee from $5,000 in 2020 to $14,000 in the first two quarters of 2021. In March 2021, the American Rescue Plan Act was signed into law that expanded the
58
2021 Appropriations Act to extend the period for eligible employers to receive the employer retention credit from June 30, 2021 to December 31, 2021.
Supply Chain Matters
The Utilities have been impacted, and may continue to be impacted, by global and U.S. supply chain disruptions causing shortages of, and increased pricing pressure on, among other things, certain raw materials, labor, microprocessors and microchips. The Utilities have used mitigation strategies in an effort to minimize these supply chain issues, such as increasing inventory and storage of specified materials, identifying alternate distributors and maintaining regular communications with key suppliers. These supply chain disruptions have not had a material impact on the Utilities’ net income, cash flows and financial condition, but have resulted in increased prices and lead times for certain orders of materials and equipment needed by the Utilities in their operations.
Accounting Considerations
Due to the COVID-19 pandemic and subsequent New York State on PAUSE and related executive orders (that have since been lifted), decline in business, bankruptcies, layoffs and furloughs, among other factors, both commercial and residential customers have had and may continue to have increased difficulty paying their utility bills. In June 2020, the state of New York enacted a law prohibiting New York utilities, including CECONY and O&R, from disconnecting residential customers, and starting in May 2021 small business customers, during the COVID-19 state of emergency, which ended in June 2021. In addition, such prohibitions will apply for an additional 180 days after the state of emergency ends (December 21, 2021) for residential and small business customers who have experienced a change in financial circumstances due to the COVID-19 pandemic. CECONY and O&R have existing allowances for uncollectible accounts established against their customer accounts receivable balances that are reevaluated each quarter and updated accordingly. Changes to the Utilities’ reserve balances that result in write-offs of customer accounts receivable balances are not reflected in rates during the term of the current rate plans. During the third quarter of 2021, the potential economic impact of the COVID-19 pandemic was also considered in forward-looking projections related to write-off and recovery rates, resulting in increases to the customer allowance for uncollectible accounts as detailed herein. CECONY’s and O&R’s allowances for uncollectible customer accounts reserve increased from $138 million and $8.7 million at December 31, 2020 to $300 million and $12.6 million at September 30, 2021, respectively. See "COVID-19 Regulatory Matters" in Note B and Note L to the Third Quarter Financial Statements.
The Companies test goodwill for impairment at least annually or whenever there is a triggering event, and test long-lived and intangible assets for recoverability when events or changes in circumstances indicate that the carrying value of long-lived or intangible assets may not be recoverable. The Companies identified no triggering events or changes in circumstances related to the COVID-19 pandemic that would indicate that the carrying value of goodwill, long-lived or intangible assets may not be recoverable at September 30, 2021.
New York State Legislation
In April 2021, New York State passed a law that increases the corporate franchise tax rate on business income from 6.5% to 7.25%, retroactive to January 1, 2021, for taxpayers with taxable income greater than $5 million. The law also reinstates the business capital tax at 0.1875%, not to exceed a maximum tax liability of $5 million per taxpayer. New York State requires a corporate franchise taxpayer to calculate and pay the highest amount of tax under the three alternative methods: a tax on business income; a tax on business capital; or a fixed dollar minimum. The provisions to increase the corporate franchise tax rate and reinstate a capital tax are scheduled to expire after 2023 and are not expected to have a material impact on the Companies’ financial position, results of operations or liquidity. In addition, the new law created a program that allows eligible residential renters in New York State who require assistance with rent and utility bills to have up to twelve months of electric and gas utility bill arrears forgiven, provided that such arrears were accrued on or after March 13, 2020. The program will be administered by the State Office of Temporary Disability Assistance in coordination with the New York State Department of Public Service and the NYSPSC. Under the program, CECONY and O&R would qualify for a refundable tax credit for New York State gross-receipts tax equal to the amount of arrears waived by the Utilities in the year that the arrears are waived and certified by the NYSPSC. See "COVID-19 Regulatory Matters” in Note B to the Third Quarter Financial Statements.
Liquidity and Financing
The Companies continue to monitor the impacts of the COVID-19 pandemic on the financial markets closely, including borrowing rates and daily cash collections. The Companies have been able to access the capital markets as needed since the start of the COVID-19 pandemic in March 2020. See Notes C and D to the Third Quarter Financial Statements. However, a continued economic downturn as a result of the COVID-19 pandemic has increased the amount of capital needed by the Utilities and could impact the costs of such capital.
59
The decline in business activity in the Utilities’ service territory as a result of the COVID-19 pandemic and subsequent New York State on PAUSE and related executive orders (that have since been lifted), resulted in a slower recovery in cash of outstanding customer accounts receivable balances in 2020 and for the nine months ended September 30, 2021. These trends will likely continue through the remainder of 2021.
The Utilities’ rate plans have revenue decoupling mechanisms in their New York electric and gas businesses that largely reconcile actual energy delivery revenues to the authorized delivery revenues approved by the NYSPSC per month and accumulate the deferred balances semi-annually under CECONY's electric rate plan (January through June and July through December, respectively) and annually under CECONY's gas rate plan and O&R New York's electric and gas rate plans (January through December). Differences are accrued with interest each month for CECONY's and O&R New York’s electric customers and after the annual deferral period ends for CECONY's and O&R New York’s gas customers for refund to, or recovery from customers, as applicable. Generally, the refund to or recovery from customers begins August and February of each year over an ensuing six-month period for CECONY's electric customers and February of each year over an ensuing twelve-month period for CECONY's gas and O&R New York's electric and gas customers. Although these revenue decoupling mechanisms are in place, lower billed sales revenues and higher uncollectible accounts have reduced and are expected to continue to reduce liquidity at the Utilities. Also, in March 2020, the Utilities began suspending service disconnections, certain collection notices, final bill collection agency activity, new late payment charges and certain other fees for all customers and such suspensions may continue through 2021.
For the nine months ended September 30, 2021, the estimated late payment charges and fees that were not billed by CECONY and O&R were approximately $46 million and $3 million lower than the amounts that were approved to be collected pursuant to their rate plans, respectively. These unbilled amounts have reduced and may continue to reduce liquidity at the Utilities. See "COVID-19 Regulatory Matters" in Note B and Note K to the Third Quarter Financial Statements.
Con Edison and the Utilities have a $2,250 million credit agreement (Credit Agreement) in place under which banks are committed to provide loans on a revolving credit basis until December 2023 ($2,200 million of commitments from December 2022). Con Edison and the Utilities have not entered into any loans under the Credit Agreement. See Note D to the Third Quarter Financial Statements.
Results of Operations
Net income for common stock and earnings per share for the three and nine months ended September 30, 20172021 and 20162020 were as follows:
| For the Three Months Ended September 30, | For the Nine Months Ended September 30, | |||||||||||||||||||||||||
| 2021 | 2020 | 2021 | 2020 | 2021 | 2020 | 2021 | 2020 | |||||||||||||||||||
| (Millions of Dollars, except per share amounts) | Net Income for Common Stock | Earnings per Share | Net Income for Common Stock | Earnings per Share | ||||||||||||||||||||||
| CECONY | $418 | $405 | $1.19 | $1.21 | $1,011 | $963 | $2.92 | $2.88 | ||||||||||||||||||
| O&R | 26 | 27 | 0.07 | 0.08 | 53 | 57 | 0.15 | 0.17 | ||||||||||||||||||
| Clean Energy Businesses (a) | 106 | 56 | 0.30 | 0.17 | 223 | 8 | 0.64 | 0.03 | ||||||||||||||||||
Con Edison Transmission (b) | 1 | 15 | — | 0.04 | (142) | 42 | (0.40) | 0.13 | ||||||||||||||||||
Other (c) | (13) | (10) | (0.04) | (0.03) | (23) | (12) | (0.08) | (0.04) | ||||||||||||||||||
Con Edison (d) | $538 | $493 | $1.52 | $1.47 | $1,122 | $1,058 | $3.23 | $3.17 | ||||||||||||||||||
| For the Three Months Ended September 30, | For the Nine Months Ended September 30, | |||||||||||||||
| 2017 | 2016 | 2017 | 2016 | 2017 | 2016 | 2017 | 2016 | |||||||||
| (Millions of Dollars, except per share amounts) | Net Income | Earnings per Share | Net Income | Earnings per Share | ||||||||||||
| CECONY | $401 | $388 | $1.30 | $1.27 | $883 | $859 | $2.88 | $2.87 | ||||||||
| O&R | 22 | 27 | 0.07 | 0.09 | 53 | 55 | 0.18 | 0.18 | ||||||||
| Clean Energy Businesses (a) | 26 | 78 | 0.08 | 0.26 | 54 | 120 | 0.18 | 0.40 | ||||||||
| Con Edison Transmission | 9 | 10 | 0.03 | 0.03 | 25 | 11 | 0.08 | 0.04 | ||||||||
| Other (b) | (1) | (6) | — | (0.02 | ) | 5 | (6) | 0.01 | (0.02 | ) | ||||||
| Con Edison (c) | $457 | $497 | $1.48 | $1.63 | $1,020 | $1,039 | $3.33 | $3.47 | ||||||||
(b)Net income for common stock from Con Edison Transmission for the nine months ended September 30, 2021 includes $(153) million or $(0.44) a share of net after-tax impairment loss related to its investment in Stagecoach. See Note A to the Third Quarter Financial Statements.
60
(c)Other includes parent company and consolidation adjustments. Net income for common stock for the three and nine months ended September 30, 2017 period2021 includes $(4) million (after-tax) or $(0.01) a share (after-tax) and $(7) million (after-tax) or $(0.02) a share (after-tax), respectively, of loss attributable to the non-controlling interest of a tax equity investor in renewable electric production projects accounted for under the HLBV method of accounting. Net income for common stock for the nine months ended September 30, 2021 includes $6 million or $0.01 a share of income tax impact for the impairment loss related to Con Edison Transmission’s investment in Stagecoach and $(2) million or $(0.01) a share of net after-tax mark-to-market loss. See Note A to the Third Quarter Financial Statements. Net income for common stock for the three and nine months ended September 30, 2020 includes $1 million (after-tax) and $2 million or $0.01 a share (after-tax), respectively, of income attributable to the non-controlling interest of a tax equity investor in renewable electric production projects accounted for under the HLBV method of accounting. Net income for common stock from the Clean Energy Businesses for the nine months ended September 30, 2020 includes $5 million or $0.01 a share of net after-tax mark-to-market income.
(d)Earnings per share on a diluted basis were $1.52 a share and $1.47 a share for the three months ended September 30, 2021 and 2020, respectively, and $3.23 a share and $3.16 a share for the nine months ended September 30, 2021 and 2020, respectively.
The following tables present the estimated effect of major factors on earnings per share and net income for common stock for the three and nine months ended September 30, 2021 as compared with 2016 period, resulting from these and other major factors:the 2020 period.
61
| Three Months Variation | Nine Months Variation | ||||||
| (Millions of Dollars, except per share amounts) | Earnings per Share Variation | Net Income Variation | Earnings per Share Variation | Net Income Variation | |||
| CECONY (a) | |||||||
| Changes in rate plans and regulatory charges (b) | $0.12 | $35 | $0.29 | $87 | |||
| Weather impact on steam revenues | — | (1) | 0.01 | 4 | |||
| Other operations and maintenance expenses (c) | 0.07 | 22 | 0.24 | 73 | |||
| Depreciation, property taxes and other tax matters (d) | (0.10) | (30) | (0.36) | (108) | |||
| Other (e) | (0.06) | (13) | (0.17) | (32) | |||
| Total CECONY | 0.03 | 13 | 0.01 | 24 | |||
| O&R (a) | |||||||
| Changes in rate plans and regulatory charges | — | 1 | 0.04 | 12 | |||
| Other operations and maintenance expenses (f) | (0.01) | (2) | (0.03) | (9) | |||
| Depreciation and property taxes | (0.01) | (4) | (0.02) | (6) | |||
| Other (e) | — | — | 0.01 | 1 | |||
| Total O&R | (0.02) | (5) | — | (2) | |||
| Clean Energy Businesses | |||||||
| Operating revenues less energy costs (g) | 0.10 | 32 | 0.10 | 31 | |||
| Other operations and maintenance expenses (h) | (0.08) | (23) | (0.10) | (30) | |||
| Depreciation | (0.02) | (5) | (0.05) | (15) | |||
| Net interest expense | (0.01) | (3) | (0.02) | (6) | |||
| Other (e) (i) | (0.17) | (53) | (0.15) | (46) | |||
| Total Clean Energy Businesses | (0.18) | (52) | (0.22) | (66) | |||
| Con Edison Transmission (e) (j) | — | (1) | 0.04 | 14 | |||
| Other, including parent company expenses (e) (k) | 0.02 | 5 | 0.03 | 11 | |||
| Total variations | $(0.15) | $(40) | $(0.14) | $(19) | |||
| Variation for the Three Months Ended September 30, 2021 vs. 2020 | ||||||||
| Net Income for Common Stock (Millions of Dollars) | Earnings per Share | |||||||
| CECONY (a) | ||||||||
| Higher electric rate base | $21 | $0.06 | ||||||
| Lower healthcare costs | 5 | 0.02 | ||||||
| Lower stock based compensation costs | 5 | 0.01 | ||||||
| Uncollected late payment charges and certain other fees associated with COVID-19 | 4 | 0.01 | ||||||
| Higher uncollectibles written off and increase to reserve for uncollectibles, net of deferrals (that began in the third quarter of 2020) for uncollectibles associated with the Coronavirus Disease (COVID-19) pandemic | (18) | (0.05) | ||||||
| Higher storm-related costs | (3) | (0.01) | ||||||
| Dilutive effect of stock issuances | — | (0.07) | ||||||
| Other | (1) | 0.01 | ||||||
| Total CECONY | 13 | (0.02) | ||||||
| O&R (a) | ||||||||
| Higher storm-related costs | (4) | (0.01) | ||||||
| Other | 3 | — | ||||||
| Total O&R | (1) | (0.01) | ||||||
| Clean Energy Businesses | ||||||||
| HLBV effects | 59 | 0.17 | ||||||
| Net mark-to-market effects | (14) | (0.04) | ||||||
| Dilutive effect of stock issuances | — | (0.02) | ||||||
| Other | 5 | 0.02 | ||||||
| Total Clean Energy Businesses | 50 | 0.13 | ||||||
| Con Edison Transmission | ||||||||
| Foregoing Allowance for Funds Used During Construction income starting in January 2021 until significant construction resumes on the Mountain Valley Pipeline | (11) | (0.03) | ||||||
| Other | (3) | (0.01) | ||||||
| Total Con Edison Transmission | (14) | (0.04) | ||||||
| Other, including parent company expenses | ||||||||
| HLBV effects | (4) | (0.01) | ||||||
| Other | 1 | — | ||||||
| Total Other, including parent company expenses | (3) | (0.01) | ||||||
| Total Reported (GAAP basis) | $45 | $0.05 | ||||||
| a. Under the revenue decoupling mechanisms in the Utilities’ New York electric and gas rate plans and the weather-normalization clause applicable to their gas businesses, revenues are generally not affected by changes in delivery volumes from levels assumed when rates were approved. In general, the Utilities recover on a current basis the fuel, gas purchased for resale and purchased power costs they incur in supplying energy to their full-service customers. Accordingly, such costs do not generally affect Con Edison’s results of operations. | ||||||||
62
| Variation for the Nine Months Ended September 30, 2021 vs. 2020 | ||||||||
| Net Income for Common Stock (Millions of Dollars) | Earnings per Share | |||||||
| CECONY (a) | ||||||||
| Higher electric rate base | $34 | $0.10 | ||||||
| Higher gas rate base | 24 | 0.07 | ||||||
| Weather impact on steam revenues | 15 | 0.05 | ||||||
| Lower incremental costs associated with the COVID-19 pandemic | 8 | 0.02 | ||||||
| Lower stock based compensation costs | 3 | 0.01 | ||||||
| Estimated food and medicine spoilage claims related to outages caused by Tropical Storm Isaias in 2020 | 4 | 0.01 | ||||||
| Higher costs related to heat and storm-related events | (29) | (0.09) | ||||||
| Uncollected late payment charges and certain other fees associated with the COVID-19 pandemic | (7) | (0.02) | ||||||
| Higher uncollectibles written off and increase to reserve for uncollectibles, net of deferrals (that began in the third quarter of 2020) for uncollectibles associated with the COVID-19 pandemic | (2) | (0.01) | ||||||
| Dilutive effect of stock issuances | — | (0.11) | ||||||
| Other | (2) | 0.01 | ||||||
| Total CECONY | 48 | 0.04 | ||||||
| O&R (a) | ||||||||
| Higher storm-related costs | (8) | (0.02) | ||||||
| Other | 4 | — | ||||||
| Total O&R | (4) | (0.02) | ||||||
| Clean Energy Businesses | ||||||||
| Higher revenues | 155 | 0.47 | ||||||
| HLBV effects | 116 | 0.33 | ||||||
| Net mark-to-market effects | 80 | 0.24 | ||||||
| Gain on sale of a renewable electric project | 4 | 0.01 | ||||||
| Higher operations and maintenance expenses | (134) | (0.40) | ||||||
| Loss from sale of a renewable electric production project | (3) | (0.01) | ||||||
| Dilutive effect of stock issuances | — | (0.02) | ||||||
| Other | (3) | (0.01) | ||||||
| Total Clean Energy Businesses | 215 | 0.61 | ||||||
| Con Edison Transmission | ||||||||
| Impairment losses on Stagecoach | (153) | (0.44) | ||||||
| Foregoing Allowance for Funds Used During Construction income starting in January 2021 until significant construction resumes on the Mountain Valley Pipeline | (33) | (0.10) | ||||||
| Other | 2 | — | ||||||
| Total Con Edison Transmission | (184) | (0.54) | ||||||
| Other, including parent company expenses | ||||||||
| HLBV effects | (7) | (0.02) | ||||||
| Net mark-to-market effects | (2) | (0.01) | ||||||
| Impairment tax benefits on Stagecoach | 6 | 0.01 | ||||||
| Other | (8) | (0.01) | ||||||
| Total Other, including parent company expenses | (11) | (0.03) | ||||||
| Total Reported (GAAP basis) | $64 | $0.06 | ||||||
| a. Under the revenue decoupling mechanisms in the Utilities’ New York electric and gas rate plans and the weather-normalization clause applicable to their gas businesses, revenues are generally not affected by changes in delivery volumes from levels assumed when rates were approved. In general, the Utilities recover on a current basis the fuel, gas purchased for resale and purchased power costs they incur in supplying energy to their full-service customers. Accordingly, such costs do not generally affect Con Edison’s results of operations. | ||||||||
63
The Companies’ other operations and maintenance expenses for the three and nine months ended September 30, 20172021 and 20162020 were as follows:
| For the Three Months Ended September 30, | For the Nine Months Ended September 30, | |||||||||||||
| (Millions of Dollars) | 2021 | 2020 | 2021 | 2020 | ||||||||||
| CECONY | ||||||||||||||
| Operations | $445 | $423 | $1,283 | $1,210 | ||||||||||
| Pensions and other postretirement benefits | (6) | (20) | (23) | (83) | ||||||||||
| Health care and other benefits | 42 | 49 | 134 | 115 | ||||||||||
| Regulatory fees and assessments (a) | 99 | 94 | 252 | 253 | ||||||||||
| Other | 70 | 51 | 202 | 219 | ||||||||||
| Total CECONY | 650 | 597 | 1,848 | 1,714 | ||||||||||
| O&R | 83 | 79 | 240 | 232 | ||||||||||
| Clean Energy Businesses | 114 | 59 | 348 | 165 | ||||||||||
| Con Edison Transmission | 3 | 2 | 9 | 8 | ||||||||||
| Other (b) | (1) | (1) | (2) | (3) | ||||||||||
| Total other operations and maintenance expenses | $849 | $736 | $2,443 | $2,116 | ||||||||||
(a)Includes Demand Side Management, System Benefit Charges and Public Service Law 18A assessments which are collected in revenues.
| For the Three Months Ended September 30, | For the Nine Months Ended September 30, | |||
| (Millions of Dollars) | 2017 | 2016 | 2017 | 2016 |
| CECONY | ||||
| Operations | $386 | $381 | $1,147 | $1,109 |
| Pensions and other postretirement benefits | 51 | 87 | 152 | 261 |
| Health care and other benefits | 45 | 47 | 127 | 124 |
| Regulatory fees and assessments (a) | 142 | 135 | 355 | 361 |
| Other | 67 | 74 | 211 | 250 |
| Total CECONY | 691 | 724 | 1,992 | 2,105 |
| O&R | 80 | 77 | 236 | 220 |
| Clean Energy Businesses | 79 | 40 | 174 | 124 |
| Con Edison Transmission | 3 | 1 | 7 | 1 |
| Other (b) | (1) | (2) | (3) | (3) |
| Total other operations and maintenance expenses | $852 | $840 | $2,406 | $2,447 |
A discussion of the results of operations by principal business segment for the three and nine months ended September 30, 20172021 and 20162020 follows. For additional business segment financial information, see Note JM to the Third Quarter Financial Statements.
The Companies’ results of operations in 2017 compared with 2016 were:for the three months ended September 30, 2021 and 2020 were as follows:
| CECONY | O&R | Clean Energy Businesses | Con Edison Transmission | Other (a) | Con Edison (b) | |||||||||||||||||||||||||||||||||
| (Millions of Dollars) | 2021 | 2020 | 2021 | 2020 | 2021 | 2020 | 2021 | 2020 | 2021 | 2020 | 2021 | 2020 | ||||||||||||||||||||||||||
| Operating revenues | $3,092 | $2,872 | $257 | $238 | $264 | $222 | $1 | $1 | $(1) | $— | $3,613 | $3,333 | ||||||||||||||||||||||||||
| Purchased power | 481 | 447 | 68 | 56 | — | — | — | — | (1) | — | 548 | 503 | ||||||||||||||||||||||||||
| Fuel | 44 | 24 | — | — | — | — | — | — | — | — | 44 | 24 | ||||||||||||||||||||||||||
| Gas purchased for resale | 61 | 38 | 13 | 9 | 9 | 8 | — | — | — | — | 83 | 55 | ||||||||||||||||||||||||||
| Other operations and maintenance | 650 | 597 | 83 | 79 | 114 | 59 | 3 | 2 | (1) | (1) | 849 | 736 | ||||||||||||||||||||||||||
| Depreciation and amortization | 429 | 401 | 24 | 23 | 58 | 58 | — | — | 1 | — | 512 | 482 | ||||||||||||||||||||||||||
| Taxes, other than income taxes | 699 | 643 | 22 | 22 | 4 | 5 | — | 1 | 2 | 2 | 727 | 673 | ||||||||||||||||||||||||||
| Operating income | 728 | 722 | 47 | 49 | 79 | 92 | (2) | (2) | (2) | (1) | 850 | 860 | ||||||||||||||||||||||||||
| Other income (deductions) | (23) | (38) | (4) | (4) | — | 3 | 5 | 27 | — | (1) | (22) | (13) | ||||||||||||||||||||||||||
| Net interest expense | 197 | 182 | 10 | 10 | 18 | 22 | 1 | 4 | 6 | 8 | 232 | 226 | ||||||||||||||||||||||||||
| Income before income tax expense | 508 | 502 | 33 | 35 | 61 | 73 | 2 | 21 | (8) | (10) | 596 | 621 | ||||||||||||||||||||||||||
| Income tax expense | 90 | 97 | 7 | 8 | 24 | 8 | 1 | 6 | 5 | — | 127 | 119 | ||||||||||||||||||||||||||
| Net income | $418 | $405 | $26 | $27 | $37 | $65 | $1 | $15 | $(13) | $(10) | $469 | $502 | ||||||||||||||||||||||||||
| Income (loss) attributable to non-controlling interest | — | — | — | — | (69) | 9 | — | — | — | — | (69) | 9 | ||||||||||||||||||||||||||
| Net income for common stock | $418 | $405 | $26 | $27 | $106 | $56 | $1 | $15 | $(13) | $(10) | $538 | $493 | ||||||||||||||||||||||||||
(a)Includes parent company and consolidation adjustments.
(b)Represents the consolidated results of operations of Con Edison and its businesses.
65
| CECONY | O&R | Clean Energy Businesses | Con Edison Transmission | Other (a) | Con Edison (b) | ||||||||||||||||||
| (Millions of Dollars) | Increases (Decreases) Amount | Increases (Decreases) Percent | Increases (Decreases) Amount | Increases (Decreases) Percent | Increases (Decreases) Amount | Increases (Decreases) Percent | Increases (Decreases) Amount | Increases (Decreases) Percent | Increases (Decreases) Amount | Increases (Decreases) Percent | Increases (Decreases) Amount | Increases (Decreases) Percent | |||||||||||
| Operating revenues | $(29) | (1.0 | )% | $(6) | (2.5 | )% | $(173) | (49.4 | )% | $1 | — | % | $1 | Large | $(206) | (6.0 | )% | ||||||
| Purchased power | (95) | (19.2 | ) | (9) | (13.0 | ) | (234) | Large | — | — | — | — | (338) | (42.4 | ) | ||||||||
| Fuel | 1 | 3.4 | — | — | — | — | — | — | — | — | 1 | 3.4 | |||||||||||
| Gas purchased for resale | 24 | 70.6 | 2 | 25.0 | 8 | 20.5 | — | — | — | — | 34 | 42.0 | |||||||||||
| Other operations and maintenance | (33) | (4.6 | ) | 3 | 3.9 | 39 | 97.5 | 2 | Large | 1 | (50.0 | ) | 12 | 1.4 | |||||||||
| Depreciation and amortization | 22 | 7.9 | 1 | 5.9 | 8 | 72.7 | — | — | 1 | Large | 32 | 10.5 | |||||||||||
| Taxes, other than income taxes | 18 | 3.6 | — | — | (2) | (40.0 | ) | — | — | — | — | 16 | 3.0 | ||||||||||
| Gain on sale of retail electric supply business (2016) | — | — | — | — | (104) | Large | — | — | — | — | (104) | Large | |||||||||||
| Operating income | 34 | 4.4 | (3) | (6.3 | ) | (96) | (76.8 | ) | (1) | Large | (1) | (50.0 | ) | (67) | (7.1 | ) | |||||||
| Other income less deductions | (2) | Large | (1) | Large | (9) | (33.3 | ) | 1 | 5.0 | 1 | Large | (10) | (20.4 | ) | |||||||||
| Net interest expense | 3 | 1.9 | — | — | 5 | 71.4 | 1 | 33.3 | (2) | (40.0 | ) | 7 | 3.9 | ||||||||||
| Income before income tax expense | 29 | 4.7 | (4) | (10.0 | ) | (110) | (75.9 | ) | (1) | (6.3 | ) | 2 | 50.0 | (84) | (10.4 | ) | |||||||
| Income tax expense | 16 | 7.1 | 1 | 7.7 | (58) | (86.6 | ) | — | — | (3) | Large | (44) | (14.0 | ) | |||||||||
| Net income | $13 | 3.4 | % | $(5) | (18.5 | )% | $(52) | (66.7 | )% | $(1) | (10.0 | )% | $5 | 83.3 | % | $(40) | (8.0 | )% | |||||
CECONY
| For the Three Months Ended September 30, 2021 | For the Three Months Ended September 30, 2020 | ||||||||||||||||||||||||||||
| (Millions of Dollars) | Electric | Gas | Steam | 2021 Total | Electric | Gas | Steam | 2020 Total | 2021-2020 Variation | ||||||||||||||||||||
| Operating revenues | $2,730 | $307 | $55 | $3,092 | $2,562 | $259 | $51 | $2,872 | $220 | ||||||||||||||||||||
| Purchased power | 473 | — | 8 | 481 | 443 | — | 4 | 447 | 34 | ||||||||||||||||||||
| Fuel | 39 | — | 5 | 44 | 18 | — | 6 | 24 | 20 | ||||||||||||||||||||
| Gas purchased for resale | — | 61 | — | 61 | — | 38 | — | 38 | 23 | ||||||||||||||||||||
| Other operations and maintenance | 516 | 92 | 42 | 650 | 469 | 87 | 41 | 597 | 53 | ||||||||||||||||||||
| Depreciation and amortization | 324 | 82 | 23 | 429 | 305 | 74 | 22 | 401 | 28 | ||||||||||||||||||||
| Taxes, other than income taxes | 544 | 120 | 35 | 699 | 514 | 94 | 35 | 643 | 56 | ||||||||||||||||||||
| Operating income | $834 | $(48) | $(58) | $728 | $813 | $(34) | $(57) | $722 | $6 | ||||||||||||||||||||
| For the Three Months Ended September 30, 2017 | For the Three Months Ended September 30, 2016 | ||||||||||||||
| (Millions of Dollars) | Electric | Gas | Steam | 2017 Total | Electric | Gas | Steam | 2016 Total | 2017-2016 Variation | ||||||
| Operating revenues | $2,469 | $268 | $62 | $2,799 | $2,557 | $208 | $63 | $2,828 | $(29) | ||||||
| Purchased power | 393 | — | 7 | 400 | 486 | — | 9 | 495 | (95) | ||||||
| Fuel | 24 | — | 6 | 30 | 21 | — | 8 | 29 | 1 | ||||||
| Gas purchased for resale | — | 58 | — | 58 | — | 34 | — | 34 | 24 | ||||||
| Other operations and maintenance | 547 | 104 | 40 | 691 | 578 | 102 | 44 | 724 | (33) | ||||||
| Depreciation and amortization | 232 | 47 | 21 | 300 | 217 | 41 | 20 | 278 | 22 | ||||||
| Taxes, other than income taxes | 418 | 71 | 31 | 520 | 414 | 59 | 29 | 502 | 18 | ||||||
| Operating income | $855 | $(12) | $(43) | $800 | $841 | $(28) | $(47) | $766 | $34 | ||||||
Electric
CECONY’s results of electric operations for the three months ended September 30, 20172021 compared with the 20162020 period iswere as follows:
| For the Three Months Ended | |||||||||||
| (Millions of Dollars) | September 30, 2021 | September 30, 2020 | Variation | ||||||||
| Operating revenues | $2,730 | $2,562 | $168 | ||||||||
| Purchased power | 473 | 443 | 30 | ||||||||
| Fuel | 39 | 18 | 21 | ||||||||
| Other operations and maintenance | 516 | 469 | 47 | ||||||||
| Depreciation and amortization | 324 | 305 | 19 | ||||||||
| Taxes, other than income taxes | 544 | 514 | 30 | ||||||||
| Electric operating income | $834 | $813 | $21 | ||||||||
| For the Three Months Ended | |||
| (Millions of Dollars) | September 30, 2017 | September 30, 2016 | Variation |
| Operating revenues | $2,469 | $2,557 | $(88) |
| Purchased power | 393 | 486 | (93) |
| Fuel | 24 | 21 | 3 |
| Other operations and maintenance | 547 | 578 | (31) |
| Depreciation and amortization | 232 | 217 | 15 |
| Taxes, other than income taxes | 418 | 414 | 4 |
| Electric operating income | $855 | $841 | $14 |
CECONY’s electric sales and deliveries for the three months ended September 30, 20172021 compared with the 20162020 period were:
| Millions of kWh Delivered | Revenues in Millions (a) | ||||||||||||||||||||||||||||
| For the Three Months Ended | For the Three Months Ended | ||||||||||||||||||||||||||||
| Description | September 30, 2021 | September 30, 2020 | Variation | Percent Variation | September 30, 2021 | September 30, 2020 | Variation | Percent Variation | |||||||||||||||||||||
| Residential/Religious (b) | 3,905 | 4,001 | (96) | (2.4 | %) | $1,025 | $995 | $30 | 3.0 | % | |||||||||||||||||||
| Commercial/Industrial | 2,645 | 2,627 | 18 | 0.7 | 652 | 556 | 96 | 17.3 | |||||||||||||||||||||
| Retail choice customers | 6,274 | 6,294 | (20) | (0.3) | 861 | 784 | 77 | 9.8 | |||||||||||||||||||||
| NYPA, Municipal Agency and other sales | 2,466 | 2,532 | (66) | (2.6) | 228 | 217 | 11 | 5.1 | |||||||||||||||||||||
| Other operating revenues (c) | — | — | — | — | (36) | 10 | (46) | Large | |||||||||||||||||||||
| Total | 15,290 | 15,454 | (164) | (1.1) | % | (d) | $2,730 | $2,562 | $168 | 6.6 | % | ||||||||||||||||||
(a)Revenues from electric sales are subject to a revenue decoupling mechanism, as a result of which delivery revenues generally are not affected by changes in delivery volumes from levels assumed when rates were approved.
(b)“Residential/Religious” generally includes single-family dwellings, individual apartments in multi-family dwellings, religious organizations and certain other not-for-profit organizations.
(c)Other electric operating revenues generally reflect changes in the revenue decoupling mechanism current asset or regulatory liability and changes in regulatory assets and liabilities in accordance with other provisions of the company’s rate plans.
(d)After adjusting for variations, primarily weather and billing days, electric delivery volumes in CECONY’s service area increased 2.3 percent in the three months ended September 30, 2021 compared with the 2020 period. See “Coronavirus Disease 2019 (COVID-19) Impacts,” above.
Operating revenues increased $168 million in the three months ended September 30, 2021 compared with the 2020 period primarily due to an increase in revenues from the electric rate plan ($95 million), higher purchased power expenses ($30 million) and higher fuel expenses ($21 million).
| Millions of kWh Delivered | Revenues in Millions (a) | |||||||||||||
| For the Three Months Ended | For the Three Months Ended | |||||||||||||
| Description | September 30, 2017 | September 30, 2016 | Variation | Percent Variation | September 30, 2017 | September 30, 2016 | Variation | Percent Variation | ||||||
| Residential/Religious (b) | 3,237 | 3,653 | (416 | ) | (11.4 | )% | $805 | $883 | $(78) | (8.8 | )% | |||
| Commercial/Industrial | 2,570 | 2,749 | (179 | ) | (6.5 | ) | 534 | 551 | (17) | (3.1 | ) | |||
| Retail choice customers | 7,510 | 8,136 | (626 | ) | (7.7 | ) | 867 | 918 | (51) | (5.6 | ) | |||
| NYPA, Municipal Agency and other sales | 2,705 | 2,764 | (59 | ) | (2.1 | ) | 207 | 204 | 3 | 1.5 | ||||
| Other operating revenues (c) | — | — | — | — | 56 | 1 | 55 | Large | ||||||
| Total | 16,022 | 17,302 | (1,280 | ) | (7.4 | )% | (d) | $2,469 | $2,557 | $(88) | (3.4 | )% | ||
Fuel expenses ($93 million), offset by higher revenues from the electric rate plan ($27 million).
Other operations and unit costs ($27 million).
Depreciation and amortizationincreased $15$19 million in the three months ended September 30, 20172021 compared with the 20162020 period primarily due primarily to higher electric utility plant balances.
Taxes, other than income taxes increased $4$30 million in the three months ended September 30, 20172021 compared with the 20162020 period primarily due primarily to higher property taxes ($1118 million), offset by lowerhigher state and local taxes ($56 million) and lower deferral of under-collected property taxes ($6 million).
Gas
CECONY’s results of gas operations for the three months ended September 30, 20172021 compared with the 20162020 period iswere as follows:
| For the Three Months Ended | |||||||||||
| (Millions of Dollars) | September 30, 2021 | September 30, 2020 | Variation | ||||||||
| Operating revenues | $307 | $259 | $48 | ||||||||
| Gas purchased for resale | 61 | 38 | 23 | ||||||||
| Other operations and maintenance | 92 | 87 | 5 | ||||||||
| Depreciation and amortization | 82 | 74 | 8 | ||||||||
| Taxes, other than income taxes | 120 | 94 | 26 | ||||||||
| Gas operating income | $(48) | $(34) | $(14) | ||||||||
| For the Three Months Ended | |||
| (Millions of Dollars) | September 30, 2017 | September 30, 2016 | Variation |
| Operating revenues | $268 | $208 | $60 |
| Gas purchased for resale | 58 | 34 | 24 |
| Other operations and maintenance | 104 | 102 | 2 |
| Depreciation and amortization | 47 | 41 | 6 |
| Taxes, other than income taxes | 71 | 59 | 12 |
| Gas operating income | $(12) | $(28) | $16 |
CECONY’s gas sales and deliveries, excluding off-system sales, for the three months ended September 30, 20172021 compared with the 20162020 period were:
| Thousands of Dt Delivered | Revenues in Millions (a) | ||||||||||||||||||||||||||||
| For the Three Months Ended | For the Three Months Ended | ||||||||||||||||||||||||||||
| Description | September 30, 2021 | September 30, 2020 | Variation | Percent Variation | September 30, 2021 | September 30, 2020 | Variation | Percent Variation | |||||||||||||||||||||
| Residential | 4,158 | 4,314 | (156) | (3.6 | %) | $128 | $117 | $11 | 9.4 | % | |||||||||||||||||||
| General | 4,133 | 3,504 | 629 | 18.0 | 59 | 35 | 24 | 68.6 | |||||||||||||||||||||
| Firm transportation | 8,943 | 8,668 | 275 | 3.2 | 80 | 70 | 10 | 14.3 | |||||||||||||||||||||
| Total firm sales and transportation | 17,234 | 16,486 | 748 | 4.5 | (b) | 267 | 222 | 45 | 20.3 | ||||||||||||||||||||
| Interruptible sales (c) | 1,198 | 1,882 | (684) | (36.3) | 6 | 4 | 2 | 50.0 | |||||||||||||||||||||
| NYPA | 15,187 | 13,701 | 1,486 | 10.8 | 1 | 1 | — | — | |||||||||||||||||||||
| Generation plants | 14,955 | 19,658 | (4,703) | (23.9) | 7 | 7 | — | — | |||||||||||||||||||||
| Other | 4,193 | 4,457 | (264) | (5.9) | 6 | 6 | — | — | |||||||||||||||||||||
| Other operating revenues (d) | — | — | — | — | 20 | 19 | 1 | 5.3 | |||||||||||||||||||||
| Total | 52,767 | 56,184 | (3,417) | (6.1 | %) | $307 | $259 | $48 | 18.5 | % | |||||||||||||||||||
(a)Revenues from gas sales are subject to a weather normalization clause and a revenue decoupling mechanism, as a result of which delivery revenues are generally not affected by changes in delivery volumes from levels assumed when rates were approved.
(b)After adjusting for variations, primarily billing days, firm gas sales and transportation volumes in the company’s service area decreased 3.1 percent in the three months ended September 30, 2021 compared with the 2020 period. See “Coronavirus Disease 2019 (COVID-19) Impacts,” above.
(c)Includes 572 thousand and 676 thousand of Dt for the 2021 and 2020 periods, respectively, which are also reflected in firm transportation and other.
| Thousands of Dt Delivered | Revenues in Millions (a) | ||||||||||||||
| For the Three Months Ended | For the Three Months Ended | ||||||||||||||
| Description | September 30, 2017 | September 30, 2016 | Variation | Percent Variation | September 30, 2017 | September 30, 2016 | Variation | Percent Variation | |||||||
| Residential | 4,731 | 4,335 | 396 | 9.1 | % | $104 | $88 | $16 | 18.2 | % | |||||
| General | 4,292 | 3,963 | 329 | 8.3 | 49 | 41 | 8 | 19.5 | |||||||
| Firm transportation | 8,766 | 8,305 | 461 | 5.6 | 67 | 53 | 14 | 26.4 | |||||||
| Total firm sales and transportation | 17,789 | 16,603 | 1,186 | 7.1 | (b) | 220 | 182 | 38 | 20.9 | ||||||
| Interruptible sales (c) | 2,108 | 1,664 | 444 | 26.7 | 8 | 4 | 4 | Large | |||||||
| NYPA | 10,148 | 12,800 | (2,652 | ) | (20.7 | ) | 1 | 1 | — | — | |||||
| Generation plants | 24,068 | 35,745 | (11,677 | ) | (32.7 | ) | 7 | 7 | — | — | |||||
| Other | 4,487 | 4,975 | (488 | ) | (9.8 | ) | 6 | 6 | — | — | |||||
| Other operating revenues (d) | — | — | — | — | 26 | 8 | 18 | Large | |||||||
| Total | 58,600 | 71,787 | (13,187 | ) | (18.4 | )% | $268 | $208 | $60 | 28.8 | % | ||||
(d)Other gas operating revenues generally reflect changes in the revenue decoupling mechanism and weather normalization clause current asset or regulatory liability and changes in regulatory assets and liabilities in accordance with other provisions of Contents
the company’s rate plans.Operating revenues increased $60$48 million in the three months ended September 30, 20172021 compared with the 20162020 period primarily due primarily to higheran increase in revenues from the gas rate plan and growth in the number of customers ($2924 million) and higher gas purchased for resale expense ($2423 million).
Gas purchased for resale increased $24$23 million in the three months ended September 30, 20172021 compared with the 20162020 period due to higher unit costs ($20 million) and purchased volumes ($4 million).
| For the Three Months Ended | |||
| (Millions of Dollars) | September 30, 2017 | September 30, 2016 | Variation |
| Operating revenues | $62 | $63 | $(1) |
| Purchased power | 7 | 9 | (2) |
| Fuel | 6 | 8 | (2) |
| Other operations and maintenance | 40 | 44 | (4) |
| Depreciation and amortization | 21 | 20 | 1 |
| Taxes, other than income taxes | 31 | 29 | 2 |
| Steam operating income | $(43) | $(47) | $4 |
| Millions of Pounds Delivered | Revenues in Millions | |||||||||||||||
| For the Three Months Ended | For the Three Months Ended | |||||||||||||||
| Description | September 30, 2017 | September 30, 2016 | Variation | Percent Variation | September 30, 2017 | September 30, 2016 | Variation | Percent Variation | ||||||||
| General | 13 | 10 | 3 | 30.0 | % | $2 | $2 | $— | — | % | ||||||
| Apartment house | 748 | 776 | (28 | ) | (3.6 | ) | 15 | 15 | — | — | ||||||
| Annual power | 2,439 | 2,950 | (511 | ) | (17.3 | ) | 42 | 49 | (7) | (14.3 | ) | |||||
| Other operating revenues (a) | — | — | — | — | 3 | (3) | 6 | Large | ||||||||
| Total | 3,200 | 3,736 | (536 | ) | (14.3 | )% | (b) | $62 | $63 | $(1) | (1.6 | )% | ||||
| For the Three Months Ended September 30, 2017 | For the Three Months Ended September 30, 2016 | |||||||||||
| (Millions of Dollars) | Electric | Gas | 2017 Total | Electric | Gas | 2016 Total | 2017-2016 Variation | |||||
| Operating revenues | $206 | $28 | $234 | $213 | $27 | $240 | $(6) | |||||
| Purchased power | 60 | — | 60 | 69 | — | 69 | (9) | |||||
| Gas purchased for resale | — | 10 | 10 | — | 8 | 8 | 2 | |||||
| Other operations and maintenance | 63 | 17 | 80 | 63 | 14 | 77 | 3 | |||||
| Depreciation and amortization | 13 | 5 | 18 | 12 | 5 | 17 | 1 | |||||
| Taxes, other than income taxes | 14 | 7 | 21 | 14 | 7 | 21 | — | |||||
| Operating income | $56 | $(11) | $45 | $55 | $(7) | $48 | $(3) | |||||
| For the Three Months Ended | |||||
| (Millions of Dollars) | September 30, 2017 | September 30, 2016 | Variation | ||
| Operating revenues | $206 | $213 | $(7) | ||
| Purchased power | 60 | 69 | (9) | ||
| Other operations and maintenance | 63 | 63 | — | ||
| Depreciation and amortization | 13 | 12 | 1 | ||
| Taxes, other than income taxes | 14 | 14 | — | ||
| Electric operating income | $56 | $55 | $1 | ||
| Millions of kWh Delivered | Revenues in Millions (a) | ||||||||||||||
| For the Three Months Ended | For the Three Months Ended | ||||||||||||||
| Description | September 30, 2017 | September 30, 2016 | Variation | Percent Variation | September 30, 2017 | September 30, 2016 | Variation | Percent Variation | |||||||
| Residential/Religious (b) | 500 | 585 | (85 | ) | (14.5 | )% | $105 | $109 | $(4) | (3.7 | )% | ||||
| Commercial/Industrial | 206 | 216 | (10 | ) | (4.6 | ) | 34 | 35 | (1) | (2.9 | ) | ||||
| Retail choice customers | 818 | 925 | (107 | ) | (11.6 | ) | 64 | 70 | (6) | (8.6 | ) | ||||
| Public authorities | 31 | 31 | — | — | 3 | 2 | 1 | 50.0 | |||||||
| Other operating revenues (c) | — | — | — | — | — | (3) | 3 | Large | |||||||
| Total | 1,555 | 1,757 | (202 | ) | (11.5 | )% | (d) | $206 | $213 | $(7) | (3.3 | )% | |||
| For the Three Months Ended | ||||
| (Millions of Dollars) | September 30, 2017 | September 30, 2016 | Variation | |
| Operating revenues | $28 | $27 | $1 | |
| Gas purchased for resale | 10 | 8 | 2 | |
| Other operations and maintenance | 17 | 14 | 3 | |
| Depreciation and amortization | 5 | 5 | — | |
| Taxes, other than income taxes | 7 | 7 | — | |
| Gas operating income | $(11) | $(7) | $(4) | |
| Thousands of Dt Delivered | Revenues in Millions (a) | ||||||||||||||||
| For the Three Months Ended | For the Three Months Ended | ||||||||||||||||
| Description | September 30, 2017 | September 30, 2016 | Variation | Percent Variation | September 30, 2017 | September 30, 2016 | Variation | Percent Variation | |||||||||
| Residential | 579 | 550 | 29 | 5.3 | % | $11 | $9 | $2 | 22.2 | % | |||||||
| General | 198 | 177 | 21 | 11.9 | 2 | 2 | — | — | |||||||||
| Firm transportation | 898 | 884 | 14 | 1.6 | 8 | 8 | — | — | |||||||||
| Total firm sales and transportation | 1,675 | 1,611 | 64 | 4.0 | (b) | 21 | 19 | 2 | 10.5 | ||||||||
| Interruptible sales | 819 | 893 | (74 | ) | (8.3 | ) | 1 | — | 1 | — | |||||||
| Generation plants | 5 | 3 | 2 | 66.7 | — | — | — | — | |||||||||
| Other | 74 | 70 | 4 | 5.7 | — | — | — | — | |||||||||
| Other gas revenues | — | — | — | — | 6 | 8 | (2) | (25.0 | ) | ||||||||
| Total | 2,573 | 2,577 | (4 | ) | (0.2 | )% | $28 | $27 | $1 | 3.7 | % | ||||||
| For the Three Months Ended | ||||
| (Millions of Dollars) | September 30, 2017 | September 30, 2016 | Variation | |
| Operating revenues | $177 | $350 | $(173) | |
| Purchased power | — | 234 | (234) | |
| Gas purchased for resale | 47 | 39 | 8 | |
| Other operations and maintenance | 79 | 40 | 39 | |
| Depreciation and amortization | 19 | 11 | 8 | |
| Taxes, other than income taxes | 3 | 5 | (2) | |
| Gain on sale of retail electric supply business (2016) | — | (104) | 104 | |
| Operating income | $29 | $125 | $(96) | |
Other operations and maintenance expenses increased $39 million in the three months ended September 30, 2017 compared with the 2016 period due primarily to Upton 2 engineering, procurement and construction costs (see Note O to the Third Quarter Financial Statements) and an increase in energy services costs.
| CECONY | O&R | Clean Energy Businesses | Con Edison Transmission | Other (a) | Con Edison (b) | ||||||||||||||||||
| (Millions of Dollars) | Increases (Decreases) Amount | Increases (Decreases) Percent | Increases (Decreases) Amount | Increases (Decreases) Percent | Increases (Decreases) Amount | Increases (Decreases) Percent | Increases (Decreases) Amount | Increases (Decreases) Percent | Increases (Decreases) Amount | Increases (Decreases) Percent | Increases (Decreases) Amount | Increases (Decreases) Percent | |||||||||||
| Operating revenues | $207 | 2.7 | % | $37 | 5.9 | % | $(538) | (53.9 | )% | $1 | — | % | $(3) | Large | $(296) | (3.2 | )% | ||||||
| Purchased power | (106) | (8.7 | ) | (6) | (3.9 | ) | (679) | Large | — | — | (3) | Large | (794) | (38.8 | ) | ||||||||
| Fuel | 36 | 27.1 | — | — | — | — | — | — | — | — | 36 | 27.1 | |||||||||||
| Gas purchased for resale | 155 | 71.4 | 20 | 62.5 | 89 | Large | — | — | — | — | 264 | 82.5 | |||||||||||
| Other operations and maintenance | (113) | (5.4 | ) | 16 | 7.3 | 50 | 40.3 | 6 | Large | — | — | (41) | (1.7 | ) | |||||||||
| Depreciation and amortization | 66 | 8.0 | 3 | 6.0 | 24 | 80.0 | — | — | — | — | 93 | 10.3 | |||||||||||
| Taxes, other than income taxes | 77 | 5.3 | 2 | 3.3 | (4) | (25.0 | ) | — | — | (1) | Large | 74 | 4.9 | ||||||||||
Gain on sale of retail electric supply business (2016) and solar electric production project (2017) | — | — | — | — | (103) | Large | — | — | — | — | (103) | Large | |||||||||||
| Operating income | 92 | 5.1 | 2 | 1.8 | (121) | (65.8 | ) | (5) | Large | 1 | Large | (31) | (1.5 | ) | |||||||||
| Other income less deductions | 4 | Large | (1) | Large | (2) | (5.7 | ) | 37 | Large | (1) | — | 37 | 60.7 | ||||||||||
| Net interest expense | 12 | 2.7 | (1) | (3.6 | ) | 11 | 47.8 | 8 | Large | (2) | (18.2 | ) | 28 | 5.4 | |||||||||
| Income before income tax expense | 84 | 6.2 | 2 | 2.3 | (134) | (68.4 | ) | 24 | Large | 2 | (20.0 | ) | (22) | (1.3 | ) | ||||||||
| Income tax expense | 60 | 12.2 | 4 | 12.5 | (68) | (89.5 | ) | 10 | Large | (9) | Large | (3) | (0.5 | ) | |||||||||
| Net income | $24 | 2.8 | % | $(2) | (3.6 | )% | $(66) | (55.0 | )% | $14 | Large | $11 | Large | $(19) | (1.8 | )% | |||||||
| For the Nine Months Ended September 30, 2017 | For the Nine Months Ended September 30, 2016 | ||||||||||||||
| (Millions of Dollars) | Electric | Gas | Steam | 2017 Total | Electric | Gas | Steam | 2016 Total | 2017-2016 Variation | ||||||
| Operating revenues | $6,079 | $1,421 | $448 | $7,948 | $6,222 | $1,113 | $406 | $7,741 | $207 | ||||||
| Purchased power | 1,084 | — | 26 | 1,110 | 1,191 | — | 25 | 1,216 | (106) | ||||||
| Fuel | 95 | — | 74 | 169 | 81 | — | 52 | 133 | 36 | ||||||
| Gas purchased for resale | — | 372 | — | 372 | — | 217 | — | 217 | 155 | ||||||
| Other operations and maintenance | 1,528 | 330 | 134 | 1,992 | 1,659 | 307 | 139 | 2,105 | (113) | ||||||
| Depreciation and amortization | 690 | 137 | 64 | 891 | 645 | 118 | 62 | 825 | 66 | ||||||
| Taxes, other than income taxes | 1,205 | 220 | 98 | 1,523 | 1,159 | 198 | 89 | 1,446 | 77 | ||||||
| Operating income | $1,477 | $362 | $52 | $1,891 | $1,487 | $273 | $39 | $1,799 | $92 | ||||||
| For the Nine Months Ended | |||
| (Millions of Dollars) | September 30, 2017 | September 30, 2016 | Variation |
| Operating revenues | $6,079 | $6,222 | $(143) |
| Purchased power | 1,084 | 1,191 | (107) |
| Fuel | 95 | 81 | 14 |
| Other operations and maintenance | 1,528 | 1,659 | (131) |
| Depreciation and amortization | 690 | 645 | 45 |
| Taxes, other than income taxes | 1,205 | 1,159 | 46 |
| Electric operating income | $1,477 | $1,487 | $(10) |
| Millions of kWh Delivered | Revenues in Millions (a) | |||||||||||||
| For the Nine Months Ended | For the Nine Months Ended | |||||||||||||
| Description | September 30, 2017 | September 30, 2016 | Variation | Percent Variation | September 30, 2017 | September 30, 2016 | Variation | Percent Variation | ||||||
| Residential/Religious (b) | 7,576 | 8,130 | (554 | ) | (6.8 | )% | $1,925 | $2,017 | $(92) | (4.6 | )% | |||
| Commercial/Industrial | 6,965 | 7,220 | (255 | ) | (3.5 | ) | 1,393 | 1,381 | 12 | 0.9 | ||||
| Retail choice customers | 19,748 | 20,404 | (656 | ) | (3.2 | ) | 2,092 | 2,114 | (22) | (1.0 | ) | |||
| NYPA, Municipal Agency and other sales | 7,548 | 7,641 | (93 | ) | (1.2 | ) | 483 | 474 | 9 | 1.9 | ||||
| Other operating revenues (c) | — | — | — | — | 186 | 236 | (50) | (21.2 | ) | |||||
| Total | 41,837 | 43,395 | (1,558 | ) | (3.6 | )% | (d) | $6,079 | $6,222 | $(143) | (2.3 | )% | ||
| For the Nine Months Ended | |||
| (Millions of Dollars) | September 30, 2017 | September 30, 2016 | Variation |
| Operating revenues | $1,421 | $1,113 | $308 |
| Gas purchased for resale | 372 | 217 | 155 |
| Other operations and maintenance | 330 | 307 | 23 |
| Depreciation and amortization | 137 | 118 | 19 |
| Taxes, other than income taxes | 220 | 198 | 22 |
| Gas operating income | $362 | $273 | $89 |
| Thousands of Dt Delivered | Revenues in Millions (a) | |||||||||||||||
| For the Nine Months Ended | For the Nine Months Ended | |||||||||||||||
| Description | September 30, 2017 | September 30, 2016 | Variation | Percent Variation | September 30, 2017 | September 30, 2016 | Variation | Percent Variation | ||||||||
| Residential | 39,814 | 35,565 | 4,249 | 11.9 | % | $613 | $506 | $107 | 21.1 | % | ||||||
| General | 23,427 | 20,962 | 2,465 | 11.8 | 255 | 200 | 55 | 27.5 | ||||||||
| Firm transportation | 53,952 | 51,333 | 2,619 | 5.1 | 390 | 332 | 58 | 17.5 | ||||||||
| Total firm sales and transportation | 117,193 | 107,860 | 9,333 | 8.7 | (b) | 1,258 | 1,038 | 220 | 21.2 | |||||||
| Interruptible sales (c) | 6,526 | 7,587 | (1,061 | ) | (14.0 | ) | 30 | 29 | 1 | 3.4 | ||||||
| NYPA | 30,233 | 31,970 | (1,737 | ) | (5.4 | ) | 2 | 2 | — | — | ||||||
| Generation plants | 48,989 | 70,895 | (21,906 | ) | (30.9 | ) | 19 | 19 | — | — | ||||||
| Other | 16,756 | 16,442 | 314 | 1.9 | 24 | 25 | (1) | (4.0 | ) | |||||||
| Other operating revenues (d) | — | — | — | — | 88 | — | 88 | — | ||||||||
| Total | 219,697 | 234,754 | (15,057 | ) | (6.4 | )% | $1,421 | $1,113 | $308 | 27.7 | % | |||||
| For the Nine Months Ended | |||
| (Millions of Dollars) | September 30, 2017 | September 30, 2016 | Variation |
| Operating revenues | $448 | $406 | $42 |
| Purchased power | 26 | 25 | 1 |
| Fuel | 74 | 52 | 22 |
| Other operations and maintenance | 134 | 139 | (5) |
| Depreciation and amortization | 64 | 62 | 2 |
| Taxes, other than income taxes | 98 | 89 | 9 |
| Steam operating income | $52 | $39 | $13 |
| Millions of Pounds Delivered | Revenues in Millions | |||||||||||||
| For the Nine Months Ended | For the Nine Months Ended | |||||||||||||
| Description | September 30, 2017 | September 30, 2016 | Variation | Percent Variation | September 30, 2017 | September 30, 2016 | Variation | Percent Variation | ||||||
| General | 364 | 345 | 19 | 5.5 | % | $20 | $18 | $2 | 11.1 | % | ||||
| Apartment house | 4,248 | 4,251 | (3 | ) | (0.1 | ) | 119 | 107 | 12 | 11.2 | ||||
| Annual power | 10,074 | 10,640 | (566 | ) | (5.3 | ) | 300 | 284 | 16 | 5.6 | ||||
| Other operating revenues (a) | — | — | — | — | 9 | (3) | 12 | Large | ||||||
| Total | 14,686 | 15,236 | (550 | ) | (3.6 | )% | (b) | $448 | $406 | $42 | 10.3 | % | ||
| For the Nine Months Ended September 30, 2017 | For the Nine Months Ended September 30, 2016 | ||||||||||
| (Millions of Dollars) | Electric | Gas | 2017 Total | Electric | Gas | 2016 Total | 2017-2016 Variation | ||||
| Operating revenues | $495 | $172 | $667 | $497 | $133 | $630 | $37 | ||||
| Purchased power | 148 | — | 148 | 154 | — | 154 | (6) | ||||
| Gas purchased for resale | — | 52 | 52 | — | 32 | 32 | 20 | ||||
| Other operations and maintenance | 185 | 51 | 236 | 180 | 40 | 220 | 16 | ||||
| Depreciation and amortization | 38 | 15 | 53 | 37 | 13 | 50 | 3 | ||||
| Taxes, other than income taxes | 41 | 21 | 62 | 40 | 20 | 60 | 2 | ||||
| Operating income | $83 | $33 | $116 | $86 | $28 | $114 | $2 | ||||
| For the Nine Months Ended | |||
| (Millions of Dollars) | September 30, 2017 | September 30, 2016 | Variation |
| Operating revenues | $495 | $497 | $(2) |
| Purchased power | 148 | 154 | (6) |
| Other operations and maintenance | 185 | 180 | 5 |
| Depreciation and amortization | 38 | 37 | 1 |
| Taxes, other than income taxes | 41 | 40 | 1 |
| Electric operating income | $83 | $86 | $(3) |
| Millions of kWh Delivered | Revenues in Millions (a) | |||||||||||||
| For the Nine Months Ended | For the Nine Months Ended | |||||||||||||
| Description | September 30, 2017 | September 30, 2016 | Variation | Percent Variation | September 30, 2017 | September 30, 2016 | Variation | Percent Variation | ||||||
| Residential/Religious (b) | 1,208 | 1,307 | (99 | ) | (7.6 | )% | $242 | $240 | $2 | 0.8 | % | |||
| Commercial/Industrial | 574 | 607 | (33 | ) | (5.4 | ) | 88 | 89 | (1) | (1.1 | ) | |||
| Retail choice customers | 2,255 | 2,434 | (179 | ) | (7.4 | ) | 155 | 166 | (11) | (6.6 | ) | |||
| Public authorities | 79 | 76 | 3 | 3.9 | 7 | 6 | 1 | 16.7 | ||||||
| Other operating revenues (c) | — | — | — | — | 3 | (4) | 7 | Large | ||||||
| Total | 4,116 | 4,424 | (308 | ) | (7.0 | )% | (d) | $495 | $497 | $(2) | (0.4 | )% | ||
Depreciation and amortization increased $1$8 million in the ninethree months ended September 30, 20172021 compared with the 20162020 period primarily due primarily to higher electricgas utility plant balances.
Taxes, other than income taxes increased $1$26 million in the ninethree months ended September 30, 20172021 compared with the 20162020 period primarily due primarily to lower deferral of under-collected property taxes ($16 million), higher property taxes.taxes ($8 million), and higher state and local taxes ($2 million).
| For the Three Months Ended | |||||||||||
| (Millions of Dollars) | September 30, 2021 | September 30, 2020 | Variation | ||||||||
| Operating revenues | $55 | $51 | $4 | ||||||||
| Purchased power | 8 | 4 | 4 | ||||||||
| Fuel | 5 | 6 | (1) | ||||||||
| Other operations and maintenance | 42 | 41 | 1 | ||||||||
| Depreciation and amortization | 23 | 22 | 1 | ||||||||
| Taxes, other than income taxes | 35 | 35 | — | ||||||||
| Steam operating income | $(58) | $(57) | $(1) | ||||||||
| For the Nine Months Ended | |||
| (Millions of Dollars) | September 30, 2017 | September 30, 2016 | Variation |
| Operating revenues | $172 | $133 | $39 |
| Gas purchased for resale | 52 | 32 | 20 |
| Other operations and maintenance | 51 | 40 | 11 |
| Depreciation and amortization | 15 | 13 | 2 |
| Taxes, other than income taxes | 21 | 20 | 1 |
| Gas operating income | $33 | $28 | $5 |
| Millions of Pounds Delivered | Revenues in Millions | ||||||||||||||||||||||||||||
| For the Three Months Ended | For the Three Months Ended | ||||||||||||||||||||||||||||
| Description | September 30, 2021 | September 30, 2020 | Variation | Percent Variation | September 30, 2021 | September 30, 2020 | Variation | Percent Variation | |||||||||||||||||||||
| General | 4 | 7 | (3) | (42.9 | %) | $2 | $1 | $1 | Large | ||||||||||||||||||||
| Apartment house | 588 | 617 | (29) | (4.7) | 13 | 12 | 1 | 8.3 | |||||||||||||||||||||
| Annual power | 1,904 | 2,023 | (119) | (5.9) | 34 | 33 | 1 | 3.0 | |||||||||||||||||||||
| Other operating revenues (a) | — | — | — | — | 6 | 5 | 1 | 20.0 | |||||||||||||||||||||
| Total | 2,496 | 2,647 | (151) | (5.7) | % | (b) | $55 | $51 | $4 | 7.8 | % | ||||||||||||||||||
(a)Other steam operating revenues generally reflect changes in regulatory assets and liabilities in accordance with the company’s rate plan.
| Thousands of Dt Delivered | Revenues in Millions (a) | ||||||||||||||||
| For the Nine Months Ended | For the Nine Months Ended | ||||||||||||||||
| Description | September 30, 2017 | September 30, 2016 | Variation | Percent Variation | September 30, 2017 | September 30, 2016 | Variation | Percent Variation | |||||||||
| Residential | 5,556 | 5,266 | 290 | 5.5 | % | $79 | $55 | $24 | 43.6 | % | |||||||
| General | 1,447 | 1,224 | 223 | 18.2 | 16 | 10 | 6 | 60.0 | |||||||||
| Firm transportation | 6,543 | 7,188 | (645 | ) | (9.0 | ) | 50 | 49 | 1 | 2.0 | |||||||
| Total firm sales and transportation | 13,546 | 13,678 | (132 | ) | (1.0 | ) | (b) | 145 | 114 | 31 | 27.2 | ||||||
| Interruptible sales | 2,966 | 3,020 | (54 | ) | (1.8 | ) | 5 | 2 | 3 | Large | |||||||
| Generation plants | 6 | 15 | (9 | ) | (60.0 | ) | — | — | — | — | |||||||
| Other | 589 | 583 | 6 | 1.0 | 1 | — | 1 | — | |||||||||
| Other gas revenues | — | — | — | — | 21 | 17 | 4 | 23.5 | % | ||||||||
| Total | 17,107 | 17,296 | (189 | ) | (1.1 | )% | $172 | $133 | $39 | 29.3 | % | ||||||
Operating revenues from the New York gas rate plan ($14 million).
Purchased power increased $4 million in the three months ended September 30, 2021 compared with the 2020 period due to higher purchased volumes ($123 million) and unit costs ($81 million).
68
Fuel decreased $1 million in the ninethree months ended September 30, 20172021 compared with the 20162020 period due primarily to higher pensionlower unit costs.
| For the Nine Months Ended | |||
| (Millions of Dollars) | September 30, 2017 | September 30, 2016 | Variation |
| Operating revenues | $460 | $998 | $(538) |
| Purchased power | (3) | 676 | (679) |
| Gas purchased for resale | 161 | 72 | 89 |
| Other operations and maintenance | 174 | 124 | 50 |
| Depreciation and amortization | 54 | 30 | 24 |
| Taxes, other than income taxes | 12 | 16 | (4) |
| Gain on sale of retail electric supply business (2016) and solar electric production project (2017) (a) | (1) | (104) | 103 |
| Operating income | $63 | $184 | $(121) |
Other Income (Deductions)
Other income (deductions)deductions decreased $2$15 million in the nine monthsthree months ended September 30, 20172021 compared with the 20162020 period due primarily to earnings from equity investments.
Net Interest Expense
Net Interest Expense increased $15 million in the three months ended September 30, 2021 compared with the 2020 period primarily due to higher interest on long-term debt ($15 million).
Income Tax Expense
Income taxes decreased $7 million in the three months ended September 30, 2021 compared with the 2020 period primarily due to an increase in the amortization of excess deferred federal income taxes due to the TCJA ($4 million) and a higher favorable tax adjustment for the 2020 tax return primarily due to an increase in the general business tax credit ($5 million), offset in part by higher income before income tax expense ($1 million) and lower flow-through tax benefits in 2021 for plant-related items ($1 million).
O&R
| For the Three Months Ended September 30, 2021 | For the Three Months Ended September 30, 2020 | ||||||||||||||||||||||
| (Millions of Dollars) | Electric | Gas | 2021 Total | Electric | Gas | 2020 Total | 2021-2020 Variation | ||||||||||||||||
| Operating revenues | $223 | $34 | $257 | $208 | $30 | $238 | $19 | ||||||||||||||||
| Purchased power | 68 | — | 68 | 56 | — | 56 | 12 | ||||||||||||||||
| Gas purchased for resale | — | 13 | 13 | — | 9 | 9 | 4 | ||||||||||||||||
| Other operations and maintenance | 67 | 16 | 83 | 62 | 17 | 79 | 4 | ||||||||||||||||
| Depreciation and amortization | 18 | 6 | 24 | 17 | 6 | 23 | 1 | ||||||||||||||||
| Taxes, other than income taxes | 15 | 7 | 22 | 15 | 7 | 22 | — | ||||||||||||||||
| Operating income | $55 | $(8) | $47 | $58 | $(9) | $49 | $(2) | ||||||||||||||||
Electric
O&R’s results of electric operations for the three months ended September 30, 2021 compared with the 2020 period were as follows:
| For the Three Months Ended | |||||||||||
| (Millions of Dollars) | September 30, 2021 | September 30, 2020 | Variation | ||||||||
| Operating revenues | $223 | $208 | $15 | ||||||||
| Purchased power | 68 | 56 | 12 | ||||||||
| Other operations and maintenance | 67 | 62 | 5 | ||||||||
| Depreciation and amortization | 18 | 17 | 1 | ||||||||
| Taxes, other than income taxes | 15 | 15 | — | ||||||||
| Electric operating income | $55 | $58 | $(3) | ||||||||
69
O&R’s electric sales and deliveries for the three months ended September 30, 2021 compared with the 2020 period were:
| Millions of kWh Delivered | Revenues in Millions (a) | ||||||||||||||||||||||||||||
| For the Three Months Ended | For the Three Months Ended | ||||||||||||||||||||||||||||
| Description | September 30, 2021 | September 30, 2020 | Variation | Percent Variation | September 30, 2021 | September 30, 2020 | Variation | Percent Variation | |||||||||||||||||||||
| Residential/Religious (b) | 581 | 647 | (66) | (10.2 | %) | $114 | $110 | $4 | 3.6 | % | |||||||||||||||||||
| Commercial/Industrial | 221 | 230 | (9) | (3.9) | 32 | 35 | (3) | (8.6) | |||||||||||||||||||||
| Retail choice customers | 820 | 741 | 79 | 10.7 | 75 | 62 | 13 | 21.0 | |||||||||||||||||||||
| Public authorities | 32 | 32 | — | — | 4 | 3 | 1 | 33.3 | |||||||||||||||||||||
| Other operating revenues (c) | — | — | — | — | (2) | (2) | — | — | |||||||||||||||||||||
| Total | 1,654 | 1,650 | 4 | 0.2 | % | (d) | $223 | $208 | $15 | 7.2 | % | ||||||||||||||||||
(a)O&R’s New York electric delivery revenues are subject to a revenue decoupling mechanism, as a result of which delivery revenues are generally not affected by changes in delivery volumes from levels assumed when rates were approved. O&R’s electric sales in New Jersey are not subject to a decoupling mechanism, and as a result, changes in such volumes do impact revenues.
(b)“Residential/Religious” generally includes single-family dwellings, individual apartments in multi-family dwellings, religious organizations and certain other not-for-profit organizations.
(c)Other electric operating revenues generally reflect changes in regulatory assets and liabilities in accordance with the company’s electric rate plan.
(d)After adjusting for weather and other variations, electric delivery volumes in O&R’s service area increased 2.9 percent in the three months ended September 30, 2021 compared with the 2020 period. See “Coronavirus Disease 2019 (COVID-19) Impacts,” above.
Operating revenues increased $15 million in the three months ended September 30, 2021 compared with the 2020 period primarily due to higher purchased power expenses ($12 million) and higher revenues from the New York electric rate plan ($1 million).
Purchased power expenses increased $12 million in the three months ended September 30, 2021 compared with the 2020 period due to higher unit costs ($23 million), offset in part by lower purchased volumes ($10 million).
Other operations and maintenance expenses increased $5 million in the three months ended September 30, 2021 compared with the 2020 period primarily due to higher storm-related costs.
Depreciation and amortization increased $1 million in the three months ended September 30, 2021 compared with the 2020 period primarily due to higher electric utility plant balances.
Gas
O&R’s results of gas operations for the three months ended September 30, 2021 compared with the 2020 period were as follows:
| For the Three Months Ended | |||||||||||
| (Millions of Dollars) | September 30, 2021 | September 30, 2020 | Variation | ||||||||
| Operating revenues | $34 | $30 | $4 | ||||||||
| Gas purchased for resale | 13 | 9 | 4 | ||||||||
| Other operations and maintenance | 16 | 17 | (1) | ||||||||
| Depreciation and amortization | 6 | 6 | — | ||||||||
| Taxes, other than income taxes | 7 | 7 | — | ||||||||
| Gas operating income | $(8) | $(9) | $1 | ||||||||
70
O&R’s gas sales and deliveries, excluding off-system sales, for the three months ended September 30, 2021 compared with the 2020 period were:
| Thousands of Dt Delivered | Revenues in Millions (a) | ||||||||||||||||||||||||||||
| For the Three Months Ended | For the Three Months Ended | ||||||||||||||||||||||||||||
| Description | September 30, 2021 | September 30, 2020 | Variation | Percent Variation | September 30, 2021 | September 30, 2020 | Variation | Percent Variation | |||||||||||||||||||||
| Residential | 900 | 724 | 176 | 24.3 | % | $18 | $13 | $5 | 38.5 | % | |||||||||||||||||||
| General | 258 | 218 | 40 | 18.3 | 4 | 2 | 2 | Large | |||||||||||||||||||||
| Firm transportation | 736 | 804 | (68) | (8.5) | 6 | 7 | (1) | (14.3) | |||||||||||||||||||||
| Total firm sales and transportation | 1,894 | 1,746 | 148 | 8.5 | (b) | 28 | 22 | 6 | 27.3 | ||||||||||||||||||||
| Interruptible sales | 844 | 787 | 57 | 7.2 | — | 1 | (1) | Large | |||||||||||||||||||||
| Generation plants | 13 | 21 | (8) | (38.1) | — | — | — | — | |||||||||||||||||||||
| Other | 26 | 30 | (4) | (13.3) | 1 | — | 1 | — | |||||||||||||||||||||
| Other gas revenues | — | — | — | — | 5 | 7 | (2) | (28.6) | |||||||||||||||||||||
| Total | 2,777 | 2,584 | 193 | 7.5 | % | $34 | $30 | $4 | 13.3 | % | |||||||||||||||||||
(a)Revenues from New York gas sales are subject to a weather normalization clause and a revenue decoupling mechanism as a result of which delivery revenues are generally not affected by changes in delivery volumes from levels assumed when rates were approved.
(b)After adjusting for weather and other variations, total firm sales and transportation volumes increased 2.7 percent in the three months ended September 30, 2021 compared with the 2020 period. See “Coronavirus Disease 2019 (COVID-19) Impacts,” above.
Operating revenues increased $4 million in the three months ended September 30, 2021 compared with the 2020 period primarily due to higher gas purchased for resale ($4 million).
Gas purchased for resale increased $4 million in the three months ended September 30, 2021 compared with the 2020 period due to higher unit costs ($2 million) and higher purchased volumes ($1 million).
Other operations and maintenance expenses decreased $1 million in the three months ended September 30, 2021 compared with the 2020 period primarily due to lower uncollectible accounts and lower pension costs.
Income Tax Expense
Income taxes decreased $1 million in the three months ended September 30, 2021 compared with the 2020 period primarily due to lower income before income tax expense.
Clean Energy Businesses
The Clean Energy Businesses’ results of operations for the three months ended September 30, 2021 compared with the 2020 period were as follows:
| For the Three Months Ended | |||||||||||
| (Millions of Dollars) | September 30, 2021 | September 30, 2020 | Variation | ||||||||
| Operating revenues | $264 | $222 | $42 | ||||||||
| Gas purchased for resale | 9 | 8 | 1 | ||||||||
| Other operations and maintenance | 114 | 59 | 55 | ||||||||
| Depreciation and amortization | 58 | 58 | — | ||||||||
| Taxes, other than income taxes | 4 | 5 | (1) | ||||||||
| Operating income | $79 | $92 | $(13) | ||||||||
Operating revenues increased $42 million in the three months ended September 30, 2021 compared with the 2020 period primarily due to higher revenue from renewable electric production projects ($48 million), higher wholesale revenues ($9 million) and higher energy services revenues ($8 million), offset in part by net mark-to-market values ($23 million).
Gas purchased for resale increased $1 million in the three months ended September 30, 2021 compared with the 2020 period due to higher purchased volumes.
Other operations and maintenance expenses increased $55 million in the three months ended September 30, 2021 compared with the 2020 period primarily due to higher costs from engineering, procurement and construction of renewable electric projects for customers.
71
Net Interest Expense
Net interest expense decreased $4 million in the three months ended September 30, 2021 compared with the 2020 period due to higher unrealized gains on interest rate swaps in the 2021 period.
Income Tax Expense
Income taxes increased $16 million in the three months ended September 30, 2021 compared with the 2020 period primarily due to lower income attributable to non-controlling interest ($19 million), offset in part by lower income before income tax expense ($3 million).
Income (Loss) Attributable to Non-Controlling Interest
Income attributable to non-controlling interest decreased $78 million to a loss of $69 million in the three months ended September 30, 2021 compared with the 2020 period primarily due to lower income attributable in the 2021 period to a tax equity investor in renewable electric projects accounted for under the HLBV method of accounting. See Note P to the Third Quarter Financial Statements.
Con Edison Transmission
Other Income (Deductions)
Other income decreased $22 million in the three months ended September 30, 2021 compared with the 2020 period primarily due to the substantial completion of the sale of Stagecoach and CET Gas foregoing AFUDC income from MVP starting January 2021 until significant construction resumes. See "Investments" in Note A and R to the Third Quarter Financial Statements.
Income Tax Expense
Income taxes decreased $5 million in the three months ended September 30, 2021 compared with the 2020 period primarily due to lower income before income tax expense ($4 million) and lower state income taxes ($1 million).
Other
Income Tax Expense
Income taxes increased $5 million in the three months ended September 30, 2021 compared with the 2020 period primarily due to lower consolidated state income tax benefits.
72
The Companies’ results of operations for the nine months ended September 30, 2021 and 2020 were as follows:
| CECONY | O&R | Clean Energy Businesses | Con Edison Transmission | Other (a) | Con Edison (b) | |||||||||||||||||||||||||||||||||
| (Millions of Dollars) | 2021 | 2020 | 2021 | 2020 | 2021 | 2020 | 2021 | 2020 | 2021 | 2020 | 2021 | 2020 | ||||||||||||||||||||||||||
| Operating revenues | $8,784 | $8,072 | $699 | $647 | $779 | $566 | $3 | $3 | $(4) | $(2) | $10,261 | $9,286 | ||||||||||||||||||||||||||
| Purchased power | 1,294 | 1,065 | 157 | 127 | — | — | — | — | (3) | — | 1,448 | 1,192 | ||||||||||||||||||||||||||
| Fuel | 166 | 124 | — | — | — | — | — | — | — | — | 166 | 124 | ||||||||||||||||||||||||||
| Gas purchased for resale | 357 | 298 | 56 | 43 | 49 | 24 | — | — | (1) | (1) | 461 | 364 | ||||||||||||||||||||||||||
| Other operations and maintenance | 1,848 | 1,714 | 240 | 232 | 348 | 165 | 9 | 8 | (2) | (3) | 2,443 | 2,116 | ||||||||||||||||||||||||||
| Depreciation and amortization | 1,267 | 1,187 | 71 | 67 | 172 | 173 | 1 | 1 | — | — | 1,511 | 1,428 | ||||||||||||||||||||||||||
| Taxes, other than income taxes | 2,016 | 1,830 | 67 | 64 | 14 | 16 | — | — | 6 | 5 | 2,103 | 1,915 | ||||||||||||||||||||||||||
| Operating income | 1,836 | 1,854 | 108 | 114 | 196 | 188 | (7) | (6) | (4) | (3) | 2,129 | 2,147 | ||||||||||||||||||||||||||
| Other income (deductions) (c) | (70) | (138) | (9) | (11) | — | 4 | (178) | 78 | (2) | (5) | (259) | (72) | ||||||||||||||||||||||||||
| Net interest expense | 567 | 554 | 32 | 30 | 44 | 183 | 8 | 14 | 18 | 16 | 669 | 797 | ||||||||||||||||||||||||||
| Income before income tax expense | 1,199 | 1,162 | 67 | 73 | 152 | 9 | (193) | 58 | (24) | (24) | 1,201 | 1,278 | ||||||||||||||||||||||||||
| Income tax expense | 188 | 199 | 14 | 16 | 44 | (36) | (51) | 16 | (1) | (12) | 194 | 183 | ||||||||||||||||||||||||||
| Net income | $1,011 | $963 | $53 | $57 | $108 | $45 | $(142) | $42 | $(23) | $(12) | $1,007 | $1,095 | ||||||||||||||||||||||||||
| Income (loss) attributable to non-controlling interest | — | — | — | — | (115) | 37 | — | — | — | — | (115) | 37 | ||||||||||||||||||||||||||
| Net income for common stock | $1,011 | $963 | $53 | $57 | $223 | $8 | $(142) | $42 | $(23) | $(12) | $1,122 | $1,058 | ||||||||||||||||||||||||||
(a)Includes parent company and consolidation adjustments.
(b)Represents the consolidated results of operations of Con Edison and its businesses.
(c)For the nine months ended September 30, 2021, Con Edison Transmission recorded pre-tax impairment losses of $211 million ($147 million, after-tax) on its investment in Stagecoach. See “Investments” in Note A to the Third Quarter Financial Statements.
73
CECONY
| For the Nine Months Ended September 30, 2021 | For the Nine Months Ended September 30, 2020 | ||||||||||||||||||||||||||||
| (Millions of Dollars) | Electric | Gas | Steam | 2021 Total | Electric | Gas | Steam | 2020 Total | 2021-2020 Variation | ||||||||||||||||||||
| Operating revenues | $6,661 | $1,730 | $393 | $8,784 | $6,178 | $1,509 | $385 | $8,072 | $712 | ||||||||||||||||||||
| Purchased power | 1,267 | — | 27 | 1,294 | 1,046 | — | 19 | 1,065 | 229 | ||||||||||||||||||||
| Fuel | 107 | — | 59 | 166 | 56 | — | 68 | 124 | 42 | ||||||||||||||||||||
| Gas purchased for resale | — | 357 | — | 357 | — | 298 | — | 298 | 59 | ||||||||||||||||||||
| Other operations and maintenance | 1,450 | 277 | 121 | 1,848 | 1,322 | 269 | 123 | 1,714 | 134 | ||||||||||||||||||||
| Depreciation and amortization | 959 | 239 | 69 | 1,267 | 904 | 216 | 67 | 1,187 | 80 | ||||||||||||||||||||
| Taxes, other than income taxes | 1,541 | 367 | 108 | 2,016 | 1,437 | 286 | 107 | 1,830 | 186 | ||||||||||||||||||||
| Operating income | $1,337 | $490 | $9 | $1,836 | $1,413 | $440 | $1 | $1,854 | $(18) | ||||||||||||||||||||
Electric
CECONY’s results of electric operations for the nine months ended September 30, 2021 compared with the 2020 period were as follows:
| For the Nine Months Ended | |||||||||||
| (Millions of Dollars) | September 30, 2021 | September 30, 2020 | Variation | ||||||||
| Operating revenues | $6,661 | $6,178 | $483 | ||||||||
| Purchased power | 1,267 | 1,046 | 221 | ||||||||
| Fuel | 107 | 56 | 51 | ||||||||
| Other operations and maintenance | 1,450 | 1,322 | 128 | ||||||||
| Depreciation and amortization | 959 | 904 | 55 | ||||||||
| Taxes, other than income taxes | 1,541 | 1,437 | 104 | ||||||||
| Electric operating income | $1,337 | $1,413 | $(76) | ||||||||
CECONY’s electric sales and deliveries for the nine months ended September 30, 2021 compared with the 2020 period were:
| Millions of kWh Delivered | Revenues in Millions (a) | ||||||||||||||||||||||||||||
| For the Nine Months Ended | For the Nine Months Ended | ||||||||||||||||||||||||||||
| Description | September 30, 2021 | September 30, 2020 | Variation | Percent Variation | September 30, 2021 | September 30, 2020 | Variation | Percent Variation | |||||||||||||||||||||
| Residential/Religious (b) | 8,828 | 8,638 | 190 | 2.2 | % | $2,415 | $2,220 | $195 | 8.8 | % | |||||||||||||||||||
| Commercial/Industrial | 6,981 | 7,145 | (164) | (2.3) | 1,657 | 1,407 | 250 | 17.8 | |||||||||||||||||||||
| Retail choice customers | 16,310 | 17,014 | (704) | (4.1) | 2,008 | 1,838 | 170 | 9.2 | |||||||||||||||||||||
| NYPA, Municipal Agency and other sales | 6,854 | 6,972 | (118) | (1.7) | 536 | 506 | 30 | 5.9 | |||||||||||||||||||||
| Other operating revenues (c) | — | — | — | — | 45 | 207 | (162) | (78.3) | |||||||||||||||||||||
| Total | 38,973 | 39,769 | (796) | (2.0) | % | (d) | $6,661 | $6,178 | $483 | 7.8 | % | ||||||||||||||||||
(a)Revenues from electric sales are subject to a revenue decoupling mechanism, as a result of which delivery revenues generally are not affected by changes in delivery volumes from levels assumed when rates were approved.
(b)“Residential/Religious” generally includes single-family dwellings, individual apartments in multi-family dwellings, religious organizations and certain other not-for-profit organizations.
(c)Other electric operating revenues generally reflect changes in the revenue decoupling mechanism current asset or regulatory liability and changes in regulatory assets and liabilities in accordance with other provisions of the company’s rate plans.
(d)After adjusting for variations, primarily weather and billing days, electric delivery volumes in CECONY’s service area decreased 1.3 percent in the nine months ended September 30, 2021 compared with the 2020 period. See “Coronavirus Disease 2019 (COVID-19) Impacts,” above.
Operating revenues increased $483 million in the nine months ended September 30, 2021 compared with the 2020 period primarily due to an increase in revenues from the electric rate plan ($177 million), higher purchased power expenses ($221 million) and higher fuel expenses ($51 million).
74
Purchased power expenses increased $221 million in the nine months ended September 30, 2021 compared with the 2020 period due to higher purchased volumes ($157 million) and higher unit costs ($64 million).
Fuel expenses increased $51 million in the nine months ended September 30, 2021 compared with the 2020 period due to higher unit costs.
Other operations and maintenance expenses increased $128 million in the nine months ended September 30, 2021 compared with the 2020 period primarily due to higher costs for pension and other postretirement benefits ($46 million), higher costs related to heat and storm-related events ($40 million), higher uncollectible expense ($6 million) and higher healthcare costs ($10 million).
Depreciation and amortization increased $55 million in the nine months ended September 30, 2021 compared with the 2020 period primarily due to higher electric utility plant balances.
Taxes, other than income taxes increased $104 million in the nine months ended September 30, 2021 compared with the 2020 period primarily due to higher property taxes ($70 million), higher state and local taxes ($17 million) and lower deferral of under-collected property taxes ($14 million).
Gas
CECONY’s results of gas operations for the nine months ended September 30, 2021 compared with the 2020 period were as follows:
| For the Nine Months Ended | |||||||||||
| (Millions of Dollars) | September 30, 2021 | September 30, 2020 | Variation | ||||||||
| Operating revenues | $1,730 | $1,509 | $221 | ||||||||
| Gas purchased for resale | 357 | 298 | 59 | ||||||||
| Other operations and maintenance | 277 | 269 | 8 | ||||||||
| Depreciation and amortization | 239 | 216 | 23 | ||||||||
| Taxes, other than income taxes | 367 | 286 | 81 | ||||||||
| Gas operating income | $490 | $440 | $50 | ||||||||
CECONY’s gas sales and deliveries, excluding off-system sales, for the nine months ended September 30, 2021 compared with the 2020 period were:
| Thousands of Dt Delivered | Revenues in Millions (a) | ||||||||||||||||||||||||||||
| For the Nine Months Ended | For the Nine Months Ended | ||||||||||||||||||||||||||||
| Description | September 30, 2021 | September 30, 2020 | Variation | Percent Variation | September 30, 2021 | September 30, 2020 | Variation | Percent Variation | |||||||||||||||||||||
| Residential | 39,231 | 37,161 | 2,070 | 5.6 | % | $789 | $691 | $98 | 14.2 | % | |||||||||||||||||||
| General | 23,663 | 22,551 | 1,112 | 4.9 | 313 | 237 | 76 | 32.1 | |||||||||||||||||||||
| Firm transportation | 58,783 | 58,697 | 86 | 0.1 | 523 | 487 | 36 | 7.4 | |||||||||||||||||||||
| Total firm sales and transportation | 121,677 | 118,409 | 3,268 | 2.8 | (b) | 1,625 | 1,415 | 210 | 14.8 | ||||||||||||||||||||
| Interruptible sales (c) | 4,747 | 6,869 | (2,122) | (30.9) | 22 | 23 | (1) | (4.3) | |||||||||||||||||||||
| NYPA | 36,601 | 29,403 | 7,198 | 24.5 | 2 | 2 | — | — | |||||||||||||||||||||
| Generation plants | 32,653 | 40,073 | (7,420) | (18.5) | 18 | 17 | 1 | 5.9 | |||||||||||||||||||||
| Other | 15,872 | 16,481 | (609) | (3.7) | 27 | 27 | — | — | |||||||||||||||||||||
| Other operating revenues (d) | — | — | — | — | 36 | 25 | 11 | 44.0 | |||||||||||||||||||||
| Total | 211,550 | 211,235 | 315 | 0.1 | % | $1,730 | $1,509 | $221 | 14.6 | % | |||||||||||||||||||
(a)Revenues from gas sales are subject to a weather normalization clause and a revenue decoupling mechanism as a result of which delivery revenues are generally not affected by changes in delivery volumes from levels assumed when rates were approved.
(b)After adjusting for variations, primarily billing days, firm gas sales and transportation volumes in the company’s service area decreased 0.9 percent in the nine months ended September 30, 2021 compared with the 2020 period. See “Coronavirus Disease 2019 (COVID-19) Impacts,” above.
(c)Includes 1,700 thousand and 2,961 thousand of Dt for the 2021 and 2020 periods, respectively, which are also reflected in firm transportation and other.
(d)Other gas operating revenues generally reflect changes in the revenue decoupling mechanism and weather normalization clause current asset or regulatory liability and changes in regulatory assets and liabilities in accordance with other provisions of the company’s rate plans.
75
Operating revenues increased $221 million in the nine months ended September 30, 2021 compared with the 2020 period primarily due to an increase in revenues from the gas rate plan ($154 million) and higher gas purchased for resale expense ($59 million).
Gas purchased for resale increased $59 million in the nine months ended September 30, 2021 compared with the 2020 period due to higher unit costs ($43 million) and higher purchased volumes ($15 million).
Other operations and maintenance expenses increased $8 million in the nine months ended September 30, 20172021 compared with the 20162020 period primarily due primarily to a new debt issuancehigher costs for pension and other postretirement benefits ($10 million) and higher surcharges for assessments and fees that are collected in 2016.revenues from customers ($7 million), offset in part by municipal infrastructure support ($10 million).
Taxes, other than income taxes increased $81 million in the nine months ended September 30, 2021 compared with the 2020 period primarily due to earnings from equity investmentslower deferral of under-collected property taxes ($46 million), higher property taxes ($28 million) and higher state and local taxes ($6 million).
Steam
CECONY’s results of steam operations for the nine months ended September 30, 2021 compared with the 2020 period were as follows:
| For the Nine Months Ended | |||||||||||
| (Millions of Dollars) | September 30, 2021 | September 30, 2020 | Variation | ||||||||
| Operating revenues | $393 | $385 | $8 | ||||||||
| Purchased power | 27 | 19 | 8 | ||||||||
| Fuel | 59 | 68 | (9) | ||||||||
| Other operations and maintenance | 121 | 123 | (2) | ||||||||
| Depreciation and amortization | 69 | 67 | 2 | ||||||||
| Taxes, other than income taxes | 108 | 107 | 1 | ||||||||
| Steam operating income | $9 | $1 | $8 | ||||||||
CECONY’s steam sales and deliveries for the nine months ended September 30, 2021 compared with the 2020 period were:
| Millions of Pounds Delivered | Revenues in Millions | ||||||||||||||||||||||||||||
| For the Nine Months Ended | For the Nine Months Ended | ||||||||||||||||||||||||||||
| Description | September 30, 2021 | September 30, 2020 | Variation | Percent Variation | September 30, 2021 | September 30, 2020 | Variation | Percent Variation | |||||||||||||||||||||
| General | 396 | 334 | 62 | 18.6 | % | $19 | $17 | $2 | 11.8 | % | |||||||||||||||||||
| Apartment house | 3,768 | 3,830 | (62) | (1.6) | 100 | 103 | (3) | (2.9) | |||||||||||||||||||||
| Annual power | 8,888 | 8,462 | 426 | 5.0 | 256 | 245 | 11 | 4.5 | |||||||||||||||||||||
| Other operating revenues (a) | — | — | — | — | 18 | 20 | (2) | (10.0) | |||||||||||||||||||||
| Total | 13,052 | 12,626 | 426 | 3.4 | % | (b) | $393 | $385 | $8 | 2.1 | % | ||||||||||||||||||
(a)Other steam operating revenues generally reflect changes in Stagecoach Gas Services, LLC, substantially all of which were maderegulatory assets and liabilities in June 2016.accordance with the company’s rate plan.
(b)After adjusting for variations, primarily weather and billing days, steam sales and deliveries decreased 3.3 percent in the nine months ended September 30, 2021 compared with the 2020 period. See “Coronavirus Disease 2019 (COVID-19) Impacts,” above.
Purchased power expenses increased $8 million in the nine months ended September 30, 2021 compared with the 2020 period due to higher unit costs ($6 million) and purchased volumes ($2 million).
76
Fuel expenses decreased $9 million in the nine months ended September 30, 2021 compared with the 2020 period due to lower unit costs ($14 million), offset in part by higher purchased volumes from the company’s steam generating facilities ($4 million).
Other operations and maintenance expenses decreased $2 million in the nine months ended September 30, 2021 compared with the 2020 period primarily due to lower municipal infrastructure support.
Depreciation and amortization increased $2 million in the nine months ended September 30, 2021 compared with the 2020 period due to higher steam utility plant balances.
Taxes, other than income taxes increased $1 million in the nine months ended September 30, 2021 compared with the 2020 period primarily due to higher property taxes.
Other Income (Deductions)
Other deductions decreased $68 million in the nine months ended September 30, 2021 compared with the 2020 period primarily due to lower costs associated with components of pension and other postretirement benefits other than service cost ($60 million).
Net Interest Expense
Net interest expense increased $13 million in the nine months ended September 30, 2021 compared with the 2020 period primarily due to higher interest expense for long-term debt ($28 million), offset in part by lower interest accrued on the system benefit charge liability ($4 million), lower interest on short-term debt ($4 million), lower interest accrued on deferred storm costs ($2 million) and lower interest on deposits ($2 million).
Income Tax Expense
Income taxes decreased $11 million in the nine months ended September 30, 2021 compared with the 2020 period primarily due to an increase in the amortization of excess deferred federal income taxes due to the TCJA ($11 million), a higher favorable tax adjustment for the 2020 tax return primarily due to an increase in the general business tax credit ($5 million) and the absence of the amortization of excess deferred state income taxes in 2021 ($5 million), offset in part by higher income before income tax expense ($8 million) and lower flow-through tax benefits in 2021 for plant-related items ($3 million).
O&R
| For the Nine Months Ended September 30, 2021 | For the Nine Months Ended September 30, 2020 | ||||||||||||||||||||||
| (Millions of Dollars) | Electric | Gas | 2021 Total | Electric | Gas | 2020 Total | 2021-2020 Variation | ||||||||||||||||
| Operating revenues | $522 | $177 | $699 | $483 | $164 | $647 | $52 | ||||||||||||||||
| Purchased power | 157 | — | 157 | 127 | — | 127 | 30 | ||||||||||||||||
| Gas purchased for resale | — | 56 | 56 | — | 43 | 43 | 13 | ||||||||||||||||
| Other operations and maintenance | 193 | 47 | 240 | 181 | 51 | 232 | 8 | ||||||||||||||||
| Depreciation and amortization | 52 | 19 | 71 | 48 | 19 | 67 | 4 | ||||||||||||||||
| Taxes, other than income taxes | 43 | 24 | 67 | 41 | 23 | 64 | 3 | ||||||||||||||||
| Operating income | $77 | $31 | $108 | $86 | $28 | $114 | $(6) | ||||||||||||||||
Electric
O&R’s results of electric operations for the nine months ended September 30, 2021 compared with the 2020 period were as follows:
77
| For the Nine Months Ended | |||||||||||
| (Millions of Dollars) | September 30, 2021 | September 30, 2020 | Variation | ||||||||
| Operating revenues | $522 | $483 | $39 | ||||||||
| Purchased power | 157 | 127 | 30 | ||||||||
| Other operations and maintenance | 193 | 181 | 12 | ||||||||
| Depreciation and amortization | 52 | 48 | 4 | ||||||||
| Taxes, other than income taxes | 43 | 41 | 2 | ||||||||
| Electric operating income | $77 | $86 | $(9) | ||||||||
O&R’s electric sales and deliveries for the nine months ended September 30, 2021 compared with the 2020 period were:
| Millions of kWh Delivered | Revenues in Millions (a) | ||||||||||||||||||||||||||||
| For the Nine Months Ended | For the Nine Months Ended | ||||||||||||||||||||||||||||
| Description | September 30, 2021 | September 30, 2020 | Variation | Percent Variation | September 30, 2021 | September 30, 2020 | Variation | Percent Variation | |||||||||||||||||||||
| Residential/Religious (b) | 1,366 | 1,414 | (48) | (3.4 | %) | $257 | $247 | $10 | 4.0 | % | |||||||||||||||||||
| Commercial/Industrial | 625 | 612 | 13 | 2.1 | 83 | 88 | (5) | (5.7) | |||||||||||||||||||||
| Retail choice customers | 2,201 | 1,995 | 206 | 10.3 | 176 | 144 | 32 | 22.2 | |||||||||||||||||||||
| Public authorities | 83 | 82 | 1 | 1.2 | 8 | 6 | 2 | 33.3 | |||||||||||||||||||||
| Other operating revenues (c) | — | — | — | — | (2) | (2) | — | — | |||||||||||||||||||||
| Total | 4,275 | 4,103 | 172 | 4.2 | % | (d) | $522 | $483 | $39 | 8.1 | % | ||||||||||||||||||
(a)O&R’s New York electric delivery revenues are subject to a revenue decoupling mechanism, as a result of which delivery revenues are generally not affected by changes in delivery volumes from levels assumed when rates were approved. O&R’s electric sales in New Jersey are not subject to a decoupling mechanism, and as a result, changes in such volumes do impact revenues.
(b)“Residential/Religious” generally includes single-family dwellings, individual apartments in multi-family dwellings, religious organizations and certain other not-for-profit organizations.
(c)Other electric operating revenues generally reflect changes in regulatory assets and liabilities in accordance with the company’s electric rate plan.
(d)After adjusting for weather and other variations, electric delivery volumes in O&R’s service area increased 2.4 percent in the nine months ended September 30, 2021 compared with the 2020 period. See “Coronavirus Disease 2019 (COVID-19) Impacts,” above.
Operating revenues increased $39 million in the nine months ended September 30, 2021 compared with the 2020 period primarily due to higher purchased power expenses ($30 million) and higher revenues from the New York electric rate plan ($7 million).
Purchased power expenses increased $30 million in the nine months ended September 30, 2021 compared with the 2020 period primarily due to higher unit costs ($28 million) and higher purchased volumes ($2 million).
Other operations and maintenance expenses increased $12 million in the nine months ended September 30, 2021 compared with the 2020 period primarily due to higher storm-related costs.
Depreciation and amortization increased $4 million in the nine months ended September 30, 2021 compared with the 2020 period primarily due to higher electric utility plant balances.
Taxes, other than income taxes increased $2 million in the nine months ended September 30, 2021 compared with the 2020 period primarily due to higher property taxes.
Gas
O&R’s results of gas operations for the nine months ended September 30, 2021 compared with the 2020 period were as follows:
78
| For the Nine Months Ended | |||||||||||
| (Millions of Dollars) | September 30, 2021 | September 30, 2020 | Variation | ||||||||
| Operating revenues | $177 | $164 | $13 | ||||||||
| Gas purchased for resale | 56 | 43 | 13 | ||||||||
| Other operations and maintenance | 47 | 51 | (4) | ||||||||
| Depreciation and amortization | 19 | 19 | — | ||||||||
| Taxes, other than income taxes | 24 | 23 | 1 | ||||||||
| Gas operating income | $31 | $28 | $3 | ||||||||
O&R’s gas sales and deliveries, excluding off-system sales, for the nine months ended September 30, 2021 compared with the 2020 period were:
| Thousands of Dt Delivered | Revenues in Millions (a) | ||||||||||||||||||||||||||||
| For the Nine Months Ended | For the Nine Months Ended | ||||||||||||||||||||||||||||
| Description | September 30, 2021 | September 30, 2020 | Variation | Percent Variation | September 30, 2021 | September 30, 2020 | Variation | Percent Variation | |||||||||||||||||||||
| Residential | 7,784 | 6,484 | 1,300 | 20.0 | % | $108 | $83 | $25 | 30.1 | % | |||||||||||||||||||
| General | 1,729 | 1,443 | 286 | 19.8 | 19 | 14 | 5 | 35.7 | |||||||||||||||||||||
| Firm transportation | 5,514 | 5,799 | (285) | (4.9) | 41 | 45 | (4) | (8.9) | |||||||||||||||||||||
| Total firm sales and transportation | 15,027 | 13,726 | 1,301 | 9.5 | (b) | 168 | 142 | 26 | 18.3 | ||||||||||||||||||||
| Interruptible sales | 3,002 | 2,723 | 279 | 10.2 | 4 | 4 | — | — | |||||||||||||||||||||
| Generation plants | 24 | 24 | — | — | — | — | — | — | |||||||||||||||||||||
| Other | 271 | 529 | (258) | (48.8) | 1 | 1 | — | — | |||||||||||||||||||||
| Other gas revenues | — | — | — | — | 4 | 17 | (13) | (76.5) | |||||||||||||||||||||
| Total | 18,324 | 17,002 | 1,322 | 7.8 | % | $177 | $164 | $13 | 7.9 | % | |||||||||||||||||||
(a)Revenues from New York gas sales are subject to a weather normalization clause and a revenue decoupling mechanism as a result of which delivery revenues are generally not affected by changes in delivery volumes from levels assumed when rates were approved.
(b)After adjusting for weather and other variations, total firm sales and transportation volumes increased 0.6 percent in the nine months ended September 30, 2021 compared with 2020 period. See “Coronavirus Disease 2019 (COVID-19) Impacts,” above.
Operating revenues increased $13 million in the nine months ended September 30, 2021 compared with the 2020 period primarily due to an increase in gas purchased for resale ($13 million).
Gas purchased for resale increased $13 million in the nine months ended September 30, 2021 compared with the 2020 period primarily due to higher purchased volumes ($11 million) and higher unit costs ($3 million).
Other operations and maintenance expenses decreased $4 million in the nine months ended September 30, 2021 compared with the 2020 period primarily due to lower spending on gas programs ($2 million), lower pension costs ($1 million) and lower uncollectible accounts ($1 million).
Taxes, other than income taxes increased $1 million in the nine months ended September 30, 2021 compared with the 2020 period primarily due to higher property taxes.
Income Tax Expense
Income taxes decreased $2 million in the nine months ended September 30, 2021 compared with the 2020 period primarily due to lower income before income tax expense.
79
Clean Energy Businesses
The Clean Energy Businesses’ results of operations for the nine months ended September 30, 2021 compared with the 2020 period were as follows:
| For the Nine Months Ended | |||||||||||
| (Millions of Dollars) | September 30, 2021 | September 30, 2020 | Variation | ||||||||
| Operating revenues | $779 | $566 | $213 | ||||||||
| Gas purchased for resale | 49 | 24 | 25 | ||||||||
| Other operations and maintenance | 348 | 165 | 183 | ||||||||
| Depreciation and amortization | 172 | 173 | (1) | ||||||||
| Taxes, other than income taxes | 14 | 16 | (2) | ||||||||
| Operating income | $196 | $188 | $8 | ||||||||
Operating revenues increased $213 million in the nine months ended September 30, 2021 compared with the 2020 period primarily due to higher revenue from renewable electric production projects ($158 million), higher wholesale revenues ($43 million), higher energy services revenues ($34 million), offset in part by net mark-to-market values ($22 million).
Gas purchased for resale increased $25 million in the nine months ended September 30, 2021 compared with the 2020 period primarily due to higher purchased volumes.
Other operations and maintenance expenses increased $183 million in the nine months ended September 30, 2021 compared with the 2020 period primarily due to higher costs from engineering, procurement and construction of renewable electric projects for customers.
Net Interest Expense
Net interest expense decreased $139 million in the nine months ended September 30, 2021 compared with the 2020 period primarily due to higher unrealized gains on interest rate swaps in the 2021 period.
Income Tax Expense
Income taxes increased $80 million in the nine months ended September 30, 2021 compared with the 2020 period primarily due to higher income before income tax expense.expense ($30 million), lower income attributable to non-controlling interests ($38 million), higher state income taxes ($5 million) and the absence of a tax benefit in the 2021 period due to the change in the federal corporate income tax rate recognized for a loss carryback from the 2018 tax year to the 2013 tax year as allowed under the CARES Act that was signed into law during the first quarter of 2020 ($4 million).
Income (Loss) Attributable to Non-Controlling Interest
Income attributable to non-controlling interest decreased $152 million to a loss of $115 million in the nine months ended September 30, 2021 compared with the 2020 period primarily due to lower income attributable in the 2021 period to a tax equity investor in renewable electric projects accounted for under the HLBV method of accounting. See Note P to the Third Quarter Financial Statements.
Con Edison Transmission
Net Interest Expense
Net interest expense decreased $6 million in the nine months ended September 30, 2021 compared with the 2020 period primarily due to the repayment of an intercompany loan from the parent company from a portion of the proceeds from the substantial completion of the sale of Stagecoach. See Note R to the Third Quarter Financial Statements.
Other Income (Deductions)
Other income (deductions) decreased $256 million from $78 million of other income to $178 million of other deductions in the nine months ended September 30, 2021 compared with the 2020 period primarily due to pre-tax impairment losses of $211 million related to Con Edison Transmission's investment in Stagecoach and CET Gas foregoing AFUDC income from MVP starting January 2021 until significant construction resumes. See "Investments" in Note A to the Third Quarter Financial Statements.
80
Income Tax Expense
Income taxes decreased $67 million in the nine months ended September 30, 2021 compared with the 2020 period primarily due to lower income before income tax expense ($53 million) and lower state income taxes ($16 million).
Other
Income taxes increased $11 million in the nine months ended September 30, 2021 compared with the 2020 period primarily due to lower consolidated state income tax benefits.
Liquidity and Capital Resources
The Companies’ liquidity reflects cash flows from operating, investing and financing activities, as shown on their respective consolidated statement of cash flows and as discussed below.
81
The Companies’ cash, and temporary cash investments and restricted cash resulting from operating, investing and financing activities for the nine months ended September 30, 20172021 and 20162020 are summarized as follows:
| For the Nine Months Ended September 30, | ||||||||||||||||||||||||||||||||||||||
| CECONY | O&R | Clean Energy Businesses | Con Edison Transmission | Other (a) | Con Edison (b) | |||||||||||||||||||||||||||||||||
| (Millions of Dollars) | 2021 | 2020 | 2021 | 2020 | 2021 | 2020 | 2021 | 2020 | 2021 | 2020 | 2021 | 2020 | ||||||||||||||||||||||||||
| Operating activities | $1,251 | $959 | $106 | $82 | $56 | $810 | $43 | $(8) | $256 | $(475) | $1,712 | $1,368 | ||||||||||||||||||||||||||
Investing activities | (2,782) | (2,412) | (157) | (150) | (106) | (438) | 608 | 16 | — | — | (2,437) | (2,984) | ||||||||||||||||||||||||||
| Financing activities | 482 | 543 | 39 | 50 | 34 | (440) | (651) | (8) | (400) | 568 | (496) | 713 | ||||||||||||||||||||||||||
| Net change for the period | (1,049) | (910) | (12) | (18) | (15) | (68) | — | — | (145) | 93 | (1,221) | (903) | ||||||||||||||||||||||||||
| Balance at beginning of period | 1,067 | 933 | 37 | 32 | 187 | 251 | — | — | 145 | 1 | 1,436 | 1,217 | ||||||||||||||||||||||||||
| Balance at end of period (c) | $18 | $23 | $25 | $14 | $172 | $183 | $— | $— | $— | $94 | $215 | $314 | ||||||||||||||||||||||||||
(a) Includes parent company and consolidation adjustments.
(b) Represents the consolidated results of operations of Con Edison and its businesses.
(c) See "Reconciliation of Cash, Temporary Cash Investments and Restricted Cash" in Note A to the Third Quarter Financial Statements.
82
| For the Nine Months Ended September 30, | ||||||||||
| Con Edison | CECONY | |||||||||
| (Millions of Dollars) | 2017 | 2016 | Variation | 2017 | 2016 | Variation | ||||
| Operating activities | $2,227 | $2,336 | $(109) | $1,790 | $2,017 | $(227) | ||||
| Investing activities | (2,572) | (3,717) | 1,145 | (2,197) | (1,943) | (254) | ||||
| Financing activities | (362) | 583 | (945) | (278) | (891) | 613 | ||||
| Net change for the period | (707) | (798) | 91 | (685) | (817) | 132 | ||||
| Balance at beginning of period | 776 | 944 | (168) | 702 | 843 | (141) | ||||
| Balance at end of period | $69 | $146 | $(77) | $17 | $26 | $(9) | ||||
| Less: Change in cash balances held for sale | — | (4) | 4 | — | — | — | ||||
| Balance at end of period excluding held for sale | $69 | $150 | $(81) | $17 | $26 | $(9) | ||||
Cash Flows from Operating Activities
The Utilities’ cash flows from operating activities primarily reflect primarily their energy sales and deliveries and cost of operations. The volume of energy sales and deliveries is primarily affected primarily by factors external to the Utilities, such as growth of customer demand, weather, market prices for energy and economic conditions. Measures that promote distributed energy resources, such as distributed generation, demand reduction and energy efficiency, also affect the volume of energy sales and deliveries. In addition, the decline in business activity in the Utilities’ service territory due to the COVID-19 pandemic resulted and may continue to result in a slower recovery of cash from outstanding customer accounts receivable balances and increases to the allowance for uncollectible accounts, that may further result in increases to write-offs of customer accounts. Under the revenue decoupling mechanisms in the Utilities’ New York electric and gas rate plans, changes in delivery volumes from levels assumed when rates were approved may affect the timing of cash flows, but generallylargely not net income. The prices at which the Utilities provide energy to their customers are determined in accordance with their rate plans. However, increases in electric and gas commodity prices, coupled with the decline in business activity due to the COVID-19 pandemic, may further contribute to a slower recovery of cash from outstanding customer accounts receivable balances and increases to the allowance for uncollectible accounts, and may result in increases to write-offs of customer accounts receivable balances. In general, changes in the Utilities’ cost of purchased power, fuel and gas may affect the timing of cash flows, but not net income, because the costs are recovered in accordance with rate plans. The Utilities’ New York rate plans allow them to defer costs resulting from a change in legislation, regulation and related actions that have taken effect during the term of the rate plans once the costs exceed a specified threshold. Increases to the allowance for uncollectible accounts related to the COVID-19 pandemic have been deferred pursuant to the legislative, regulatory and related actions provisions of their rate plans. Pursuant to their rate plans, the Utilities have recovered from customers a portion of the tax liability they will pay in the future as a result of temporary differences between the book and tax basis of assets and liabilities. These temporary differences affect the timing of cash flows, but not net income, as the Companies are required to record deferred tax assets and liabilities at the current corporate tax rate for the temporary differences. For the Utilities, credits to their customers of the net benefits of the TCJA, including the reduction of the corporate tax rate to 21 percent, decrease cash flows from operating activities. See “COVID-19 Regulatory Matters” and “Other Regulatory Matters” in Note B to the Third Quarter Financial Statements and “Coronavirus Disease 2019 (COVID-19) Impacts - Liquidity and Financing,” above.
Net income is the result of cash and non-cash (or accrual) transactions. Only cash transactions affect the Companies’ cash flows from operating activities. Principal non-cash charges or credits include depreciation, deferred income tax expense, and amortizations of certain regulatory assets and liabilities.liabilities, and accrued unbilled revenue. Non-cash charges or credits may also be accrued under the revenue decoupling and cost reconciliation mechanisms in the Utilities’ New York electric and gas rate plans. For Con Edison, net income for the nine months ended September 30, 2021 also included non-cash losses recognized with respect to an impairment of Con Edison Transmission’s investment in Stagecoach. See “Investments” in Note A to the Third Quarter Financial Statements.
Net cash flows from operating activities for the nine months ended September 30, 20172021 for Con Edison and CECONY were $109$344 million and $227$292 million lower,higher, respectively, than in the 20162020 period. The changechanges in net cash flows for Con Edison and CECONY reflects primarily higherreflect a change in pension and retiree benefit obligations ($56 million and $65 million, respectively), lower other receivables and other current assets ($113 million and $32 million, respectively), lower system benefit charge ($59 million and $56 million, respectively), change in pension and retiree benefit contributions ($7 million and $4 million, respectively), for Con Edison, lower cash paid for income taxes, in the 2017 period as compared with the 2016 period of $110 million and $226 million, respectively, net of refunds received. The income tax refund received ($40 million) and lower taxes receivable ($24 million), and for CECONY, a decrease in 2016 reflected the extension of bonus depreciation in late 2015, resulting in a refund of the 2015 estimated federal tax payments.accounts receivables from affiliated companies ($101 million).
The change in net cash flows also reflects the timing of payments for and recovery of energy costs. This timing is reflected within changes to accounts receivable – customers and recoverable and refundable energy costs within other regulatory assets and liabilities and accounts payable balances.
Cash Flows Used in Investing Activities
Net cash flows used in investing activities for Con Edison and CECONY were $1,145$547 million lower and $254$370 million higher, respectively, for the nine months ended September 30, 20172021 compared with the 20162020 period. The change for Con Edison primarily reflects primarily lower new investments in electric and gas transmission projectsproceeds from the substantial completion of the sale of Stagecoach ($1,011614 million) and renewable electric production projects ($240 million), and a decrease in non-utility construction expenditures at the Clean Energy Businesses($148125 million) and proceeds from the divestiture of renewable electric projects at the Clean Energy Businesses ($183 million), offset in part by lower proceeds from sale of assets ($216 million). The change for CECONY primarily reflects absence of proceeds from the transfer of assets to NY Transcoan increase in 2016 ($122 million) and increased utility construction expenditures at CECONY ($88345 million) and O&R ($6 million).
83
Cash Flows from Financing Activities
Net cash flows from financing activities for Con Edison and CECONY were $945$1,209 million lower and $613$61 million higher,lower, respectively, in the nine months ended September 30, 20172021 compared with the 20162020 period.
In August 2017,June 2021, Con Edison issued 4.1 million10,100,000 shares of its common sharesstock resulting in net proceeds of $343approximately $775 million, after issuance expenses, thatexpenses. The net proceeds from the sale of the common shares were invested by Con Edison in its subsidiaries, principally CECONY, and the Clean Energy Businesses, for funding of theirits construction expenditures and for its other general corporate purposes. See Note C to the Third Quarter Financial Statements.
In May 2021, Con Edison redeemed at maturity $500 million of 2.00 percent 5-year debentures. See Note C to the Third Quarter Financial Statements.
During the first quarter of 2021, Con Edison optionally prepaid the remaining $675 million outstanding under a February 2019 term loan prior to its maturity in June 2021.
In July 2020, Con Edison borrowed $820 million pursuant to an April 2020 credit agreement that was amended in June 2020 (as amended, the Supplemental Credit Agreement). Con Edison used the proceeds from the borrowing for general corporate purposes, including repayment of short-term debt bearing interest at variable rates.
In January 2020, Con Edison issued 1,050,000 shares of its common stock for $88 million upon physical settlement of the remaining shares subject to its May 2019 forward sale agreement.
In June 2017,2021, CECONY redeemed at maturity $640 million of floating rate 3-year debentures. See Note C to the Third Quarter Financial Statements.
In June 2021, CECONY issued $500$750 million aggregate principal amount of 3.8752.40 percent debentures, due 2047,2031, the net proceeds from the sale of which were used to repay short-term borrowingsredeem at maturity its $640 million floating rate 3-year debentures and for other general corporate purposes.
In March 2017, Con EdisonJune 2021 CECONY also issued $400$750 million aggregate principal amount of 2.003.60 percent debentures, due 2020, and prepaid the June 2016 $400 million variable rate term loan that was to mature in 2018.
In September 2016,June 2020, CECONY redeemed at maturity $400$350 million of 5.504.45 percent 10-year debentures.
In June 2016, a Con Edison Solutions subsidiary borrowed $2 million pursuant to a loan agreement with a New Jersey utility. The borrowing matures in 2026, bears interest of 11.18 percent and may be repaid in cash or project Solar Renewable Energy Certificates.
In May 2016, a Con Edison Development subsidiary issued $95September 2021, O&R agreed to issue in December 2021 $45 million aggregate principal amount of 4.072.31 percent senior notes,debentures, due 2036, secured by the company's California Holdings 3 solar project.
In September 2020, O&R issued $35 million aggregate principal amount of 2.02 percent debentures, due 2030 and $40 million aggregate principal amount of 3.24 percent debentures, due 2050.
In March 2021, a subsidiary of the Clean Energy Businesses agreed to issue $229 million aggregate principal amount of 3.77 percent senior notes, due 2041,2046, secured by equity interests in CED Nevada Virginia, all of which had been issued at September 30, 2021. See Notes C and D to the company's Texas Solar 7Third Quarter Financial Statements.
84
In February 2021, a subsidiary of the Clean Energy Businesses borrowed $250 million at a variable rate, due 2028, secured by equity interests in four of the company’s solar project.electric production projects, the interest rate for which was swapped to a fixed rate of 3.39 percent. See Note C to the Third Quarter Financial Statements.
In February 2021, a subsidiary of the Clean Energy Businesses entered into an agreement with a tax equity investor for the financing of a portfolio of three of the Clean Energy Businesses’ solar electric production projects (CED Nevada Virginia). Under the financing, the tax equity investor acquired a noncontrolling interest in the portfolio and will receive a percentage of earnings, tax attributes and cash flows. As of September 30, 2021, the tax equity investor fully funded its $263 million financing obligation. The Clean Energy Businesses will continue to consolidate this entity and will report the noncontrolling tax equity investor’s interest in the tax equity arrangement. See Notes C and P to the Third Quarter Financial Statements.
Con Edison’s cash flows from financing for the nine months ended September 30, 20172021 and 20162020 also reflect the proceeds, and reduction in cash used for reinvested dividends, resulting from the issuance of common shares under the company’s dividend reinvestment, stock purchase and long-term incentive plans of $74$82 million and $77$79 million, respectively.
Cash flows used in financing activities of the Companies also reflect commercial paper issuances and repayments. The commercial paper amounts outstanding at September 30, 20172021 and 20162020 and the average daily balances for the nine months ended September 30, 20172021 and 20162020 for Con Edison and CECONY were as follows:
| 2021 | 2020 | |||||||||||||
| (Millions of Dollars, except Weighted Average Yield) | Outstanding at September 30, | Daily average | Outstanding at September 30, | Daily average | ||||||||||
| Con Edison | $1,036 | $1,294 | $1,009 | $1,027 | ||||||||||
| CECONY | $942 | $1,194 | $991 | $633 | ||||||||||
| Weighted average yield | 0.1 | % | 0.2 | % | 0.2 | % | 1.2 | % | ||||||
| 2017 | 2016 | |||
| (Millions of Dollars, except Weighted Average Yield) | Outstanding at September 30, | Daily average | Outstanding at September 30, | Daily average |
| Con Edison | $356 | $645 | $601 | $813 |
| CECONY | $147 | $323 | $480 | $385 |
| Weighted average yield | 1.3 | 1.1 | 0.7 | 0.6 |
Capital Requirements and Resources
During the third quarter of 2021, Con Edison has decreasedincreased its estimate for capital requirements in 2021 from $6,015 million to $6,065 million. The increase reflects additional investments by the Clean Energy Businesses. During the first quarter of 2021, Con Edison increased its estimates for capital requirements for 2021, 2022 and 2023 from $5,985 million to $6,015 million, $4,380 million to $4,644 million and $5,137 million to $5,385 million, respectively. The increase reflects additional investments for the retirementReliable Clean City (RCC) projects approved by the NYSPSC in April 2021. See “CECONY” – “Electric” – “Electric Supply,” above. The company plans to meet its capital requirements for 2021 through 2023, through internally-generated funds and the issuance of long-term debt and common equity. The company's plans include the issuance of between $1,900 million and $2,600 million of long-term debt, including for maturing securities, for 2018 from $1,688primarily at the Utilities, in 2021 and approximately $1,400 million in aggregate of long-term debt at the Utilities during 2022 and 2023. The planned debt issuance is in addition to $1,288 million.the issuance of long-term debt secured by the Clean Energy Businesses’ renewable electric production projects. The decrease reflectscompany's plans also include the $400issuance of up to $800 million prepayment of a variable rate term loan that wascommon equity in 2021 and approximately $700 million in aggregate of common equity during 2022 and 2023, in addition to mature in 2018.equity under its dividend reinvestment, employee stock purchase and long-term incentive plans. See Note C to the Third Quarter Financial Statements.Statements and “Liquidity and Capital Resources - Cash Flows from Financing Activities,” above.
| Ratio of Earnings to Fixed Charges | |||
| For the Nine Months Ended September 30, 2017 | For the Nine Months Ended September 30, 2016 | For the Twelve Months Ended December 31, 2016 | |
| Con Edison | 3.8 | 4.0 | 3.6 |
| CECONY | 3.9 | 3.8 | 3.6 |
Capital Resources
For each of the Companies, the common equity ratio at September 30, 20172021 and December 31, 20162020 was:
| Common Equity Ratio (Percent of total capitalization) | ||||||||
| September 30, 2021 | December 31, 2020 | |||||||
| Con Edison | 48.3 | 48.3 | ||||||
| CECONY | 47.9 | 47.9 | ||||||
85
Common Equity Ratio (Percent of total capitalization) | ||
| September 30, 2017 | December 31, 2016 | |
| Con Edison | 50.8 | 49.3 |
| CECONY | 50.9 | 49.5 |
The following table shows changes in certainCompanies' assets, liabilities, and liabilitiesequity at September 30, 2017, compared with2021 and December 31, 2016.2020 are summarized as follows.
| CECONY | O&R | Clean Energy Businesses | Con Edison Transmission | Other (a) | Con Edison (b) | |||||||||||||||||||||||||||||||||
| (Millions of Dollars) | 2021 | 2020 | 2021 | 2020 | 2021 | 2020 | 2021 | 2020 | 2021 | 2020 | 2021 | 2020 | ||||||||||||||||||||||||||
| ASSETS | ||||||||||||||||||||||||||||||||||||||
Current assets | $4,349 | $4,407 | $306 | $277 | $510 | $485 | $8 | $42 | $(77) | $90 | $5,096 | $5,301 | ||||||||||||||||||||||||||
| Investments | 597 | 541 | 27 | 26 | 7 | — | 454 | 1,256 | (7) | (7) | 1,078 | 1,816 | ||||||||||||||||||||||||||
| Net plant | 40,985 | 39,554 | 2,550 | 2,469 | 4,396 | 4,515 | 17 | 17 | (1) | — | 47,947 | 46,555 | ||||||||||||||||||||||||||
| Other noncurrent assets | 6,247 | 6,465 | 461 | 475 | 1,691 | 1,848 | 14 | 33 | 404 | 402 | 8,817 | 9,223 | ||||||||||||||||||||||||||
| Total Assets | $52,178 | $50,967 | $3,344 | $3,247 | $6,604 | $6,848 | $493 | $1,348 | $319 | $485 | $62,938 | $62,895 | ||||||||||||||||||||||||||
| LIABILITIES AND SHAREHOLDERS' EQUITY | ||||||||||||||||||||||||||||||||||||||
| Current liabilities | $4,127 | $5,247 | $420 | $356 | $990 | $1,330 | $92 | $111 | $(374) | $310 | $5,255 | $7,354 | ||||||||||||||||||||||||||
| Noncurrent liabilities | 14,194 | 14,722 | 1,168 | 1,191 | 121 | 211 | (15) | 28 | (3) | (58) | 15,465 | 16,094 | ||||||||||||||||||||||||||
| Long-term debt | 17,637 | 16,149 | 893 | 893 | 2,664 | 2,776 | — | 500 | 647 | 64 | 21,841 | 20,382 | ||||||||||||||||||||||||||
| Equity | 16,220 | 14,849 | 863 | 807 | 2,829 | 2,531 | 416 | 709 | 49 | 169 | 20,377 | 19,065 | ||||||||||||||||||||||||||
| Total Liabilities and Equity | $52,178 | $50,967 | $3,344 | $3,247 | $6,604 | $6,848 | $493 | $1,348 | $319 | $485 | $62,938 | $62,895 | ||||||||||||||||||||||||||
(a) Includes parent company and consolidation adjustments.
| Con Edison | CECONY | ||
| (Millions of Dollars) | 2017 vs. 2016 Variation | 2017 vs. 2016 Variation | |
| Assets | |||
| Prepayments | $433 | $398 | |
| Non-utility property, less accumulated depreciation | 204 | — | |
| Regulatory asset - Unrecognized pension and other postretirement costs | (248) | (254) | |
| Liabilities | |||
| Pension and retiree benefits | $(404) | $(394) | |
| Deferred income taxes and unamortized investment tax credits | 539 | 610 | |
| System benefit charge | 194 | 175 | |
CECONY
Current assets at September 30, 2021 were $58 million lower than at December 31, 2020. The change in current assets primarily reflects a decrease in cash and temporary cash investments ($1,049 million), primarily the portion allocabledue to the 2017 fourth quarter of CECONY's July 20172021 payment of its New York City semi-annual property taxes.
The decrease is offset in part by an increase in non-utilityprepayments reflecting primarily the July 2021 payment of New York City semi-annual property taxes, offset in part by three months of amortization, while the December 2020 balance reflects the amortization of the entire previous semi-annual payment ($555 million), an increase in accounts receivables, less allowance for uncollectible accounts ($221 million) (see “COVID-19 Regulatory Matters” in Note B to the Third Quarter Financial Statements and “Coronavirus Disease 2019 (COVID-19) Impacts - Accounting Considerations” and “Liquidity and Financing,” above) and an increase in the fair value of short-term derivative assets ($213 million).
Investments at September 30, 2021 were $56 million higher than at December 31, 2020. The change in investments primarily reflects an increase in supplemental retirement income plan assets. See Note E to the Third Quarter Financial Statements.
Net plant at September 30, 2021 was $1,431 million higher than at December 31, 2020. The change in net plant primarily reflects an increase in electric ($1,040 million), gas ($983 million), steam ($77 million) and general ($192 million) plant balances, offset in part by an increase in accumulated depreciation for Con Edison($664 million) and a decrease in construction work in progress ($197 million).
Other noncurrent assets at September 30, 2021 were $218 million lower than at December 31, 2020. The change in other noncurrent assets primarily reflects the completion of construction of Con Edison Development's Upton County Solar renewable electric production project (see Con Edison Development, below).
Current liabilities at September 30, 2021 were $1,120 million lower than at December 31, 2020. The change in current liabilities primarily reflects decreases in notes payable ($718 million), long-term debt due within one year
86
($640 million), accounts payable ($131 million), offset in part by an increase in the regulatory liability for deferred derivative gains ($416 million).
Noncurrent liabilities at September 30, 2021 were $528 million lower than at December 31, 2020. The change in noncurrent liabilities primarily reflects a decrease in the liability for pension and retiree benefits ($764 million) that primarily reflects in part contributions tothe final actuarial valuation, as measured at December 31, 2020, of the plans made byin accordance with the Utilities in 2017.accounting rules for retirement benefits. See Notes E and F to the Third Quarter Financial Statements.
The increasechange also reflects a decrease in the regulatory liability for future income tax ($166 million). These decreases are offset in part by a change in deferred income taxes and unamortized investment tax credits for Con Edison($359 million) that primarily reflects accelerated tax depreciation, repair deductions and CECONY reflects primarily bonus depreciation in 2017, partially offset by the increase in deferred income tax assets associated with the federal tax attribute carryforwards related to the net operating loss and general business tax credits.prepayment of New York City property taxes. See Note IJ to the Third Quarter Financial Statements.
Equity at September 30, 2021 was $1,371 million higher than at December 31, 2020. The change in equity primarily reflects capital contributions from parent ($1,101 million) in 2021 and net income for the nine months ended September 30, 2021 ($1,011 million), offset in part by common stock dividends to parent ($741 million) in 2021.
O&R
Current assets at September 30, 2021 were $29 million higher than at December 31, 2020. The change in current assets primarily reflects increases in other receivables, less allowance for uncollectible accounts ($11 million) and accounts receivables, less allowance for uncollectible accounts ($11 million).
Net plant at September 30, 2021 was $81 million higher than at December 31, 2020. The change in net plant primarily reflects an increase in electric ($91 million), gas ($39 million), and general ($19 million) plant balances, offset in part by an increase in accumulated depreciation ($55 million) and a decrease in construction work in progress ($13 million).
Other noncurrent assets at September 30, 2021 were $14 million lower than at December 31, 2020. The change in other noncurrent assets primarily reflects a decrease in the regulatory asset for unrecognized pension and other postretirement costs to reflect the final actuarial valuation, as measured at December 31, 2020, of the pension and other retiree benefit plans in accordance with the accounting rules for retirement benefits ($43 million). See Notes B, E and F to the Third Quarter Financial Statements. The change in the regulatory asset also reflects the year's amortization of accounting costs. This decrease is offset in part by an increase in the regulatory asset for deferred pension and other postretirement benefits ($13 million) and an increase in deferred storm costs ($10 million).
Current liabilities at September 30, 2021 were $64 million higher than at December 31, 2020. The change in current liabilities primarily reflects higher notes payable ($43 million), an increase in the regulatory liability for deferred derivative gains ($27 million), offset in part by lower accounts payables ($9 million).
Noncurrent liabilities at September 30, 2021 were $23 million lower than at December 31, 2020. The change in noncurrent liabilities primarily reflects a decrease in the liability for pension and retiree benefits ($69 million), offset in part by deferred income taxes and unamortized investment tax credits ($15 million), primarily due to accelerated tax depreciation and repair deductions, an increase in the systemregulatory liability for long-term deferred derivative gains ($8 million) and deferred other retiree benefit chargeplans rate ($4 million), and an increase in other deferred credits ($16 million).
87
Equity at September 30, 2021 was $56 million higher than at December 31, 2020. The change in equity primarily reflects amounts collectednet income for the nine months ended September 30, 2021 ($53 million), capital contributions from parent ($35 million) in 2021 and an increase in other comprehensive income ($7 million) offset in part by common stock dividends to parent ($39 million) in 2021.
Clean Energy Businesses
Current assets at September 30, 2021 were $25 million higher than at December 31, 2020. The change in current assets primarily reflects an increase in accrued unbilled revenue ($74 million), offset in part by a decrease in restricted cash ($15 million) and a decrease in other currents assets ($35 million).
Investments at September 30, 2021 were $7 million higher than at December 31, 2020. The change in investments primarily reflects a tax equity investment.
Net plant at September 30, 2021 was $119 million lower than at December 31, 2020. The change in net plant primarily reflects the Utilitiesdivestiture of renewable electric projects. See Note R to the Third Quarter Financial Statements.
Other noncurrent assets at September 30, 2021 were $157 million lower than at December 31, 2020. The change in other noncurrent assets primarily reflects the divestiture of renewable electric projects. See Note R to the Third Quarter Financial Statements.
Current liabilities at September 30, 2021 were $340 million lower than at December 31, 2020. The change in current liabilities primarily reflects new borrowing offset in part by a decrease in borrowings under a term loan. See Note D to the Third Quarter Financial Statements.
Noncurrent liabilities at September 30, 2021 were $90 million lower than at December 31, 2020. The change in noncurrent liabilities primarily reflects the change in the fair value of derivative liabilities and the change in deferred taxes.
Long-term debt at September 30, 2021 was $112 million lower than at December 31, 2020. The change in long-term debt primarily reflects the repayment of an intercompany loan from their customersthe parent company ($375 million), offset in part by a net increase in project debt ($464 million). See Note C to the Third Quarter Financial Statements.
Equity at September 30, 2021 was $298 million higher than at December 31, 2020. The change in equity primarily reflects an increase in net income for the nine months ended September 30, 2021 ($223 million) and a noncontrolling tax equity interest ($122 million) (see Note P to the Third Quarter Financial Statements), offset in part by common stock dividends to parent ($48 million) in 2021.
Con Edison Transmission
Current assets at September 30, 2021 were $34 million lower than at December 31, 2020. The change in current assets primarily reflects the agreement between Crestwood and a subsidiary of CET Gas that will be requiredprovides for payments from Crestwood to bethe subsidiary of CET Gas for shortfalls in meeting certain earnings growth performance targets. Payments totaled $57 million ($19 million of which was paid in the first quarter 2021 and was recorded as a receivable by CET Gas in March 2020, and the remainder of which, plus interest was paid by Crestwood in July 2021). See "Con Edison Transmission - CET Gas," below.
Investments at September 30, 2021 were $802 million lower than at December 31, 2020. The decrease in investments primarily reflects the substantial completion of the sale of Stagecoach ($828 million), offset in part by additional investment in and income from NY Transco ($27 million). See "Investments" in Note A and Note R to the Third Quarter Financial Statements.
Other noncurrent assets were $19 million lower than at December 31, 2020. The change in noncurrent assets primarily reflects a reduction in accounts receivable due to the noncurrent portion of the $57 million payment from Crestwood described above.
88
Current liabilities at September 30, 2021 were $19 million lower than at December 31, 2020. The change in current liabilities primarily reflects the repayment of short-term borrowings under an intercompany capital funding facility with a portion of the proceeds from the substantial completion of the sale of Stagecoach. See Note R to the Third Quarter Financial Statements.
Noncurrent liabilities at September 30, 2021 were $43 million lower than at December 31, 2020. The change in noncurrent liabilities reflects primarily a decrease in deferred income taxes and unamortized investment tax credits that reflects primarily timing differences associated with investments in partnerships and the tax loss on the substantial completion of the sale of Stagecoach. See "Investments" in Note A and Note R to the Third Quarter Financial Statements.
Long-term debt at September 30, 2021 was $500 million lower than at December 31, 2020. The change in long-term debt reflects the repayment of a $500 million intercompany loan from the parent company.
Equity at September 30, 2021 was $293 million lower than at December 31, 2020. The change in equity primarily reflects net loss for the nine months ended September 30, 2021 ($142 million) and a reduction to retained earnings due to a dividend paid to NYSERDA.CEI ($150 million).
Off-Balance Sheet Arrangements
Regulatory Matters
For additional information about the Utilities’ regulatory matters, see Note B to the Third Quarter Financial Statements.
Environmental Matters
In May 2017,July 2021, a transformerfeeder failure at a CECONY substation dischargedled to the discharge of thousands of gallons of transformer oil intodielectric fluid from a street manhole in New Rochelle, New York. Dielectric fluid reached nearby streets, properties and the soil. Some of the transformer oil, which contained small amounts of polychlorinated biphenyls (PCBs), leaked into the East River. The company,New Rochelle Harbor. CECONY, the U.S. Coast Guard, the New York State Department of Environmental Conservation and other agencies responded to the incident. The company stopped the feeder leak on the same day that the discharge occurred and has replacedsubstantially completed the transformer,spill recovery operations. In coordination with federal and state regulators, CECONY is continuingevaluating certain shoreline areas for the potential presence of residual dielectric fluid and the extent to remediate and monitorwhich additional cleaning in such areas may be necessary. In addition, the site, thecompany has received third-party damage claims. The costs of whichassociated with this matter are not expected to have a material adverse effect on itsthe company’s financial condition, results of operations or liquidity. In connection with the incident, the company may incur monetary sanctions of more than $0.1$0.3 million for violations of certain provisions regulating the discharge of materials into, and for the protection of, the environment.
For additional information about the Companies’ environmental matters, see Note G to the Third Quarter Financial Statements.
Clean Energy Businesses
The following table provides information about the Clean Energy Businesses' renewable electric production projects Con Edison Development ownedthat are in operation and/or in construction at September 30, 2017:2021:
| Project Name | Generating Capacity (MW AC) | Power Purchase Agreement (PPA) Term (In Years) (a) | Actual/Expected In-Service Date (b) | State | PPA Counterparty (c) | ||||||||||||
| Utility Scale | |||||||||||||||||
| Solar | |||||||||||||||||
| PJM assets | 73 | (d) | 2011/2013 | New Jersey/Pennsylvania | Various | ||||||||||||
| New England assets | 24 | Various | 2011/2017 | Massachusetts/Rhode Island | Various | ||||||||||||
| California Solar (e) | 110 | 25 | 2012/2013 | California | PG&E | ||||||||||||
| Mesquite Solar 1 (e) | 165 | 20 | 2013 | Arizona | PG&E | ||||||||||||
| Copper Mountain Solar 2 (e) | 150 | 25 | 2013/2015 | Nevada | PG&E | ||||||||||||
| Copper Mountain Solar 3 (e) | 255 | 20 | 2014/2015 | Nevada | SCPPA | ||||||||||||
| California Solar 2 (e) | 80 | 20 | 2014/2016 | California | SCE/PG&E | ||||||||||||
| Texas Solar 4 (e) | 40 | 25 | 2014 | Texas | City of San Antonio | ||||||||||||
| Texas Solar 5 (e) | 100 | 25 | 2015 | Texas | City of San Antonio | ||||||||||||
| Texas Solar 7 (e) | 112 | 25 | 2016 | Texas | City of San Antonio | ||||||||||||
| California Solar 3 (e) | 110 | 20 | 2016/2017 | California | SCE/PG&E | ||||||||||||
| Upton Solar (e) | 158 | 25 | 2017 | Texas | City of Austin | ||||||||||||
| California Solar 4 (e) | 240 | 20 | 2017/2018 | California | SCE | ||||||||||||
| Copper Mountain Solar 1 (e) | 58 | 12 | 2018 | Nevada | PG&E | ||||||||||||
| Copper Mountain Solar 4 (e) (f) | 94 | 20 | 2018 | Nevada | SCE | ||||||||||||
| Mesquite Solar 2 (e) (f) | 100 | 18 | 2018 | Arizona | SCE | ||||||||||||
| Mesquite Solar 3 (e) (f) | 150 | 23 | 2018 | Arizona | WAPA (U.S. Navy) | ||||||||||||
| Great Valley Solar (e) (f) | 200 | 17 | 2018 | California | MCE/SMUD/PG&E/SCE | ||||||||||||
| Water Strider Solar (e) (f) (g) | 80 | 20 | 2021 | Virginia | VEPCO | ||||||||||||
| Battle Mountain Solar/Battery Energy Storage System (e) (f) (g) | 101 | 25 | 2021 | Nevada | SPP | ||||||||||||
| Copper Mountain Solar 5 (e) (f) (g) | 250 | 25 | 2021 | Nevada | NPC | ||||||||||||
| Other | 26 | Various | Various | Various | Various | ||||||||||||
| Total Solar | 2,676 | ||||||||||||||||
| Wind | |||||||||||||||||
| Broken Bow II (e) | 75 | 25 | 2014 | Nebraska | NPPD | ||||||||||||
| Wind Holdings (e) | 180 | Various | Various | South Dakota/ Montana | NWE/Basin Electric | ||||||||||||
| Adams Rose Wind (e) | 23 | 7 | 2016 | Minnesota | Dairyland | ||||||||||||
| Other | 34 | Various | Various | Various | Various | ||||||||||||
| Total Wind | 312 | ||||||||||||||||
| Total MW (AC) in Operation | 2,988 | ||||||||||||||||
| Total MW (AC) in Construction | 16 | ||||||||||||||||
| Total MW (AC) Utility Scale | 3,004 | ||||||||||||||||
| Behind the Meter | |||||||||||||||||
| Total MW (AC) in Operation | 62 | ||||||||||||||||
| Total MW (AC) in Construction | 10 | ||||||||||||||||
| Total MW Behind the Meter | 72 | ||||||||||||||||
| Project Name | Production Technology | Generating Capacity (a) (MW AC) | Purchased Power Agreement (PPA)Term (In Years) (b) | Actual/Expected In-Service Date (c) | Location (State) |
| Wholly owned projects | |||||
| Pilesgrove | Solar | 18 | (d) | 2011 | New Jersey |
| Flemington Solar | Solar | 8 | (d) | 2011 | New Jersey |
| Frenchtown I, II and III | Solar | 14 | (d) | 2011-13 | New Jersey |
| PA Solar | Solar | 10 | 2012 | Pennsylvania | |
| California Solar 2 (e) | Solar | 80 | 20 | 2014-16 | California |
| Oak Tree Wind | Wind | 20 | 20 | 2014 | South Dakota |
| Texas Solar 3 | Solar | 6 | 25 | 2015 | Texas |
| Texas Solar 5 (e) | Solar | 95 | 25 | 2015 | Texas |
| Campbell County Wind | Wind | 95 | 30 | 2015 | South Dakota |
| Texas Solar 7 (e) | Solar | 106 | 25 | 2016 | Texas |
| California Solar 3 (e) | Solar | 110 | 20 | 2016 | California |
| Adams Wind (e) | Wind | 23 | 7 | 2016 | Minnesota |
| Valley View (e) | Wind | 10 | 14 | 2016 | Minnesota |
| Coram (e) | Wind | 102 | 16 | 2016 | California |
| Upton County Solar (e) | Solar | 158 | 25 | 2017 | Texas |
| Projects of less than 5 MW | Solar / Wind | 25 | Various | Various | Various |
| Jointly owned projects (e) (f) | |||||
| California Solar | Solar | 55 | 25 | 2012-13 | California |
| Mesquite Solar 1 | Solar | 83 | 20 | 2013 | Arizona |
| Copper Mountain Solar 2 | Solar | 75 | 25 | 2013-15 | Nevada |
| Copper Mountain Solar 3 | Solar | 128 | 20 | 2014-15 | Nevada |
| Broken Bow II | Wind | 38 | 25 | 2014 | Nebraska |
| Texas Solar 4 | Solar | 32 | 25 | 2014 | Texas |
| Total MW (AC) in Operation | 1,291 | ||||
| Panoche Valley | Solar | 240 | 20 | 2018 | California |
| Total MW (AC) in Construction | 240 | ||||
| Total MW (AC), All Projects | 1,531 | ||||
(a) Represents Con Edison Development’s ownership interest in the project.
(c)PPA Counterparties include: Pacific Gas and Electric Company (PG&E), Southern California Public Power Authority (SCPPA), Southern California Edison Company (SCE), Western Area Power Administration (WAPA), Marin Clean Energy (MCE), Sacramento Municipal Utility District (SMUD), Nebraska Public Power District (NPPD), NorthWestern Energy (NWE), Virginia Electric Power Company (VEPCO), Sierra Pacific Power (SPP), and Nevada Power Company (NPC).
(d) Have Solar Renewable Energy Creditrenewable energy credit hedges are in place, in lieu of PPAs, out to 2020.through 2025.
(e)Project has been pledged to secure financingas security for the project.project debt financing.
(f) All of the jointly-owned projectsProjects are 50 percent owned, except for Texas Solar 4 (which is 80 percent owned). financed with tax equity. See Note MP to the Third
Quarter Financial Statements.
(g)Battle Mountain, Water Strider, and Copper Mountain 5 are a portfolio of three solar electric production projects referred to as CED Nevada Virginia. See Notes C, D and P to the Third Quarter Financial Statements.
90
Renewable Electric Generation
Renewable electric production volumes generatedfrom utility scale assets for the three and nine months ended September 30, 20172021 compared with the 20162020 period were:
| Millions of kWh | ||||||||||||||||||||||||||
| For the Three Months Ended | For the Nine Months Ended | |||||||||||||||||||||||||
| Description | September 30, 2021 | September 30, 2020 | Variation | Percent Variation | September 30, 2021 | September 30, 2020 | Variation | Percent Variation | ||||||||||||||||||
| Renewable electric production projects | ||||||||||||||||||||||||||
| Solar | 1,932 | 1,667 | 265 | 15.9% | 4,998 | 4,606 | 392 | 8.5% | ||||||||||||||||||
| Wind | 257 | 303 | (46) | (15.2)% | 978 | 1,042 | (64) | (6.1%) | ||||||||||||||||||
| Total | 2,189 | 1,970 | 219 | 11.1% | 5,976 | 5,648 | 328 | 5.8% | ||||||||||||||||||
CET Gas
In May 2021, a subsidiary of Contents
CET Gas entered into a purchase and sale agreementpursuant to which CET Gas and Crestwood agreed to sell their combined interests in Stagecoach to a subsidiary of Kinder Morgan Inc. for a total of $1,225 million, subject to certain adjustments, of which $612.5 million will be Con Edison's portion for its 50 percent interest, subject to closing adjustments. The purchase and sale agreement contemplates a two-stage closing, the first of which was completed in July 2021 for a sale price of $1,195 million, of which $614 million, including working capital, was attributed to CET Gas. The second closing for the remaining $30 million, of which $15 million will be attributed to CET Gas, subject to closing adjustments, is to occur following approval by the NYSPSC, which is expected later this year or during the first quarter of 2022, subject to customary closing conditions. See Note R to the Third Quarter Financial Statements.As a result of information made available to Stagecoach as part of the sale process, Stagecoach performed impairment tests that resulted in Stagecoach recording impairment charges of $414 million for the nine months ended September 30, 2021. Accordingly, Con Edison recorded pre-tax impairment losses on its 50 percent interest in Stagecoach of $211 million ($147 million after-tax), including working capital and transaction cost adjustments, within "Investment income/(loss)" on Con Edison's consolidated income statement for the nine months ended September 30, 2021. These charges reduced the carrying value of Con Edison’s investment in Stagecoach to $630 million at June 30, 2021. See "Investments" in Note A to the Third Quarter Financial Statements.
| Millions of kWh Generated | |||||||||||||
| For the Three Months Ended | For the Nine Months Ended | ||||||||||||
| Description | September 30, 2017 | September 30, 2016 | Variation | Percent Variation | September 30, 2017 | September 30, 2016 | Variation | Percent Variation | |||||
| Renewable electric production projects | |||||||||||||
| Solar | 668 | 458 | 210 | 45.9 | % | 1,679 | 1,215 | 464 | 38.2 | % | |||
| Wind | 217 | 137 | 80 | 58.4 | % | 734 | 464 | 270 | 58.2 | % | |||
| Total | 885 | 595 | 290 | 48.7 | % | 2,413 | 1,679 | 734 | 43.7 | % | |||
In May 2021, the operator of the Mountain Valley Pipeline, which is being constructed by a joint venture in which CET Gas owns a 10.6 percent interest (that is expected to be reduced to 8.5 percent based on the current project cost estimate and CET Gas’ previous capping of its cash contributions to the joint venture) indicated that, subject to receipt of certain authorizations and resolution of certain challenges, it is now targeting an in-service date for the project of summer 2022 at an overall project cost of approximately $6,200 million excluding allowance for funds used during construction. For the year ended December 31, 2020, CET Gas recorded a pre-tax impairment loss of $320 million ($223 million after-tax) that reduced the carrying value of its investment in Mountain Valley Pipeline LLC from $662 million to $342 million. At September 30, 2021, CET Gas’ cash contributions to the joint venture amounted to $530 million.
CET Gas and CECONY own 71.2 percent and 28.8 percent interests, respectively, in Honeoye, which operates a gas storage facility in upstate New York. CET Gas and CECONY are in the process of considering strategic alternatives regarding their interests in Honeoye. At September 30, 2021, the consolidated carrying value of CET Gas’ and CECONY’s investments in Honeoye was $25 million.
Financial and Commodity Market Risks
The Companies are subject to various risks and uncertainties associated with financial and commodity markets. The most significant market risks include interest rate risk, commodity price risk credit risk and investment risk.
Interest Rate Risk
The Companies’ interest rate risk relates primarily to variable rate debt andrelates to new debt financing needed to fund capital requirements, including the construction expenditures of the Utilities and maturing debt securities.securities, and variable-rate debt. Con
91
Edison and its businessessubsidiaries manage interest rate risk through the issuance of mostly fixed-rate debt with varying maturities and through opportunistic refinancing of debt. The Clean Energy Businesses use interest rate swaps to exchange variable-rate project financed debt for a fixed interest rate. See Note N to the Third Quarter Financial Statements. Con Edison and CECONY estimate that at September 30, 2017,2021, a 10 percent increase in interest rates applicable to its variable rate debt would result in an immaterial increase in annual interest expense of $2 million.expense. Under CECONY’s current electric, gas and steam rate plans, variations in actual variable rate tax-exempt debt interest expense, including costs associated with the refinancing of the variable-rate tax-exempt debt, are reconciled to levels reflected in rates.
Commodity Price Risk
Con Edison’s commodity price risk primarily relates primarily to the purchase and sale of electricity, gas and related derivative instruments. The Utilities and the Clean Energy Businesses apply risk management strategies to mitigate their related exposures. See Note KN to the Third Quarter Financial Statements.
Con Edison estimates that, as of September 30, 2017,2021, a 10 percent decline in market prices would result in a decline in fair value of $66$149 million for the derivative instruments used by the Utilities to hedge purchases of electricity and gas, of which $60$139 million is for CECONY and $6$10 million is for O&R. Con Edison expects that any such change in fair value would be largely offset by directionally opposite changes in the cost of the electricity and gas purchased. In accordance with provisions approved by state regulators, the Utilities generally recover from customers the costs they incur for energy purchased for their customers, including gains and losses on certain derivative instruments used to hedge energy purchased and related costs. However, increases in electric and gas commodity prices may contribute to a slower recovery of cash from outstanding customer accounts receivable balances and increases to the allowance for uncollectible accounts, and may result in increases to write-offs of customer accounts receivable balances.
The Clean Energy Businesses use a value-at-risk (VaR) model to assess the market price risk of their portfolio of electricity and gas commodity fixed-price purchase and sales commitments, physical forward contracts, generating assets and commodity derivative instruments. VaR represents the potential change in fair value of the portfolio due to changes in market prices, for a specified time period and confidence level. These businesses estimate VaR across their portfolio using a delta-normal variance/covariance model with a 95 percent confidence level, and compare the measured VaR results against performance due to actual prices and stress test the portfolio each quarter using an assumed 30 percent price change from forecast. Since the VaR calculation involves complex methodologies and estimates and assumptions that are based on past experience, it is not necessarily indicative of future results. VaR for the portfolio, assuming a one-day holding period, for the nine months ended September 30, 20172021 and the year ended December 31, 2016,2020, respectively, was as follows:
| 95% Confidence Level, One-Day Holding Period | September 30, 2021 | December 31, 2020 | ||||||
| (Millions of Dollars) | ||||||||
| Average for the period | $— | $— | ||||||
| High | 2 | — | ||||||
| Low | — | — | ||||||
| 95% Confidence Level, One-Day Holding Period | September 30, 2017 | December 31, 2016 | ||
| (Millions of Dollars) | ||||
| Average for the period | $— | $2 | ||
| High | 1 | 4 | ||
| Low | — | 1 | ||
Investment Risk
The Companies’ investment risk relates to the investment of plan assets for their pension and other postretirement benefit plans andplans. Con Edison's investment risk also relates to the investments of the Clean Energy Businesses and Con Edison Transmission that are accounted for under the equity method. See "Investments" in Note A to the Third Quarter Financial Statements.
The Companies’ current investment policy for pension plan assets includes investment targets of 5345 to 6355 percent equitiesequity securities, 33 to 43 percent debt securities and 3510 to 4914 percent fixed income and other securities.real estate. At September 30, 2017,2021, the pension plan investments consisted of 5850 percent equity securities, 39 percent debt securities and 4211 percent fixed income and other securities.real estate.
For the Utilities’ pension and other postretirement benefit plans, regulatory accounting treatment is generally applied in accordance with the accounting rules for regulated operations. In accordance with the Statement of Policy issued by the NYSPSC and its current electric, gas and steam rate plans, CECONY defers for payment to or recovery from customers the difference between the pension and other postretirement benefit expenses and the amounts for such expenses reflected in rates. Generally, O&R also defers such difference pursuant to its New York rate plans.
Material Contingencies
For information concerning potential liabilities arising from the Companies’ material contingencies, see "Other Regulatory Matters" in Note B and Notes G and H to the Third Quarter Financial Statements.
93
Item 3: Quantitative and Qualitative Disclosures About Market Risk
For information about the Companies’ primary market risks associated with activities in derivative financial instruments, other financial instruments and derivative commodity instruments, see “Financial and Commodity Market Risks,” in Part I, Item 2 of this report, which information is incorporated herein by reference.
Item 4: Controls and Procedures
The Companies maintain disclosure controls and procedures designed to provide reasonable assurance that the information required to be disclosed in the reports that they submit to the Securities and Exchange Commission (SEC) is recorded, processed, summarized and reported within the time periods specified in the rules and forms of the SEC. Disclosure controls and procedures include, without limitation, controls and procedures designed to ensure that information required to be disclosed by an issuer in the reports that it files or submits under the Securities Exchange Act of 1934, as amended, is accumulated and communicated to the issuer’s management, including its principal executive and principal financial officers, or persons performing similar functions, as appropriate to allow timely decisions regarding required disclosure. For each of the Companies, its management, with the participation of its principal executive officer and principal financial officer, has evaluated its disclosure controls and procedures as of the end of the period covered by this report and, based on such evaluation, has concluded that the controls and procedures are effective to provide such reasonable assurance. Reasonable assurance is not absolute assurance, however, and there can be no assurance that any design of controls or procedures would be effective under all potential future conditions, regardless of how remote.
There was no change in the Companies’ internal control over financial reporting that occurred during the Companies’ most recent fiscal quarter that has materially affected, or is reasonably likely to materially affect, the Companies’ internal control over financial reporting.
94
Part II Other Information
Item 1: Legal Proceedings
For information about certain legal proceedings affecting the Companies, see "Other Regulatory Matters" in Note B and Notes G and H to the financial statements in Part I, Item 1 of this report and "Environmental Matters" in Part I, Item 2 of this report, which information is incorporated herein by reference.
Item 1A: Risk Factors
There were no material changes in the Companies’ risk factors compared to those disclosed in Item 1A of the Form 10-K.
Item 6: Exhibits
Con Edison
| Exhibit 101.INS | XBRL Instance | ||||
| Exhibit 101.SCH | XBRL Taxonomy Extension Schema. | ||||
| Exhibit 101.CAL | XBRL Taxonomy Extension Calculation Linkbase. | ||||
| Exhibit 101.DEF | XBRL Taxonomy Extension Definition Linkbase. | ||||
| Exhibit 101.LAB | XBRL Taxonomy Extension Label Linkbase. | ||||
| Exhibit 101.PRE | XBRL Taxonomy Extension Presentation Linkbase. | ||||
| Exhibit 104 | Cover Page Interactive Data File - the cover page XBRL tags are embedded within the Inline XBRL document. | ||||
CECONY
| Exhibit 101.INS | XBRL Instance | ||||
| Exhibit 101.SCH | XBRL Taxonomy Extension Schema. | ||||
| Exhibit 101.CAL | XBRL Taxonomy Extension Calculation Linkbase. | ||||
| Exhibit 101.DEF | XBRL Taxonomy Extension Definition Linkbase. | ||||
| Exhibit 101.LAB | XBRL Taxonomy Extension Label Linkbase. | ||||
| Exhibit 101.PRE | XBRL Taxonomy Extension Presentation Linkbase. | ||||
| Exhibit 104 | Cover Page Interactive Data File - the cover page XBRL tags are embedded within the Inline XBRL document. | ||||
Pursuant to Item 601(b)(4)(iii)(A) of Regulation S-K, instruments defining the rights of holders of long-term debt of Con Edison’s subsidiaries other than CECONY, the total amount of which does not exceed ten percent of the total assets of Con Edison and its subsidiaries on a consolidated basis, are not filed as exhibits to Con Edison’s Form 10-K or Form 10-Q. Con Edison agrees to furnish to the SEC upon request a copy of any such instrument.
95
Signatures
Pursuant to the requirements of the Securities Exchange Act of 1934, each Registrant has duly caused this report to be signed on its behalf by the undersigned thereunto duly authorized.
| Consolidated Edison, Inc. | ||||||||
| Consolidated Edison Company of New York, Inc. | ||||||||
| Date: November | By | /s/ Robert Hoglund | ||||||
Robert Hoglund Senior Vice President, Chief Financial Officer and Duly Authorized Officer | ||||||||