UNITED STATES
SECURITIES AND EXCHANGE COMMISSION
Washington, D.C. 20549
FORM 10-Q
|
| | |
| (Mark One) |
| ☒ | QUARTERLY REPORT PURSUANT TO SECTION 13 OR 15(d) OF THE SECURITIES EXCHANGE ACT OF 1934 |
For the quarterly period ended June 30, 20192020
OR
|
| | |
| ☐ | TRANSITION REPORT PURSUANT TO SECTION 13 OR 15(d) OF THE SECURITIES EXCHANGE ACT OF 1934 |
|
For the transition period from to
Commission file number 001-14157
|
| | |
| TELEPHONE AND DATA SYSTEMS, INC. |
| (Exact name of Registrant as specified in its charter) |
| Delaware | | 36-2669023 |
| (State or other jurisdiction of incorporation or organization) | | (IRS Employer Identification No.) |
30 North LaSalle Street, Suite 4000, Chicago, Illinois 60602
(Address of principal executive offices) (Zip code)
Registrant's telephone number, including area code: (312) 630-1900
|
| | | | | | |
| Securities registered pursuant to Section 12(b) of the Act: |
| Title of each class | | Trading Symbol | | Name of each exchange on which registered |
| Common Shares, $.01 par value | | TDS | | New York Stock Exchange |
| 6.625% Senior Notes due 2045 | | TDI | | New York Stock Exchange |
| 6.875% Senior Notes due 2059 | | TDE | | New York Stock Exchange |
| 7.000% Senior Notes due 2060 | | TDJ | | New York Stock Exchange |
| 5.875% Senior Notes due 2061 | | TDA | | New York Stock Exchange |
|
| | | | | | | |
| Indicate by check mark whether the registrant (1) has filed all reports required to be filed by Section 13 or 15(d) of the Securities Exchange Act of 1934 during the preceding 12 months (or for such shorter period that the registrant was required to file such reports), and (2) has been subject to such filing requirements for the past 90 days. | Yes | ☒ | No | ☐ |
| | | | | | | | |
| Indicate by check mark whether the registrant has submitted electronically every Interactive Data File required to be submitted pursuant to Rule 405 of Regulation S-T during the preceding 12 months (or for such shorter period that the registrant was required to submit such files). | Yes | ☒ | No | ☐ |
| | | | | | | | |
| Indicate by check mark whether the registrant is a large accelerated filer, an accelerated filer, a non-accelerated filer, a smaller reporting company, or an emerging growth company. See the definitions of “large accelerated filer,” “accelerated filer,” “smaller reporting company,” and “emerging growth company” in Rule 12b-2 of the Exchange Act. |
| Large accelerated filer | ☒ | | Accelerated filer | ☐ |
| Non-accelerated filer | ☐ | | Smaller reporting company | ☐ |
| | | | Emerging growth company | ☐ |
| | | | | | | | |
| If an emerging growth company, indicate by check mark if the registrant has elected not to use the extended transition period for complying with any new or revised financial accounting standards provided pursuant to Section 13(a) of the Exchange Act. | ☐ |
| Indicate by check mark whether the registrant is a shell company (as defined in Rule 12b-2 of the Exchange Act). | Yes | ☐ | No | ☒ |
|
| | | | | | |
Securities registered pursuant to Section 12(b) of the Act: |
Title of each class | | Trading Symbol | | Name of each exchange on which registered |
Common Shares, $.01 par value | | TDS | | New York Stock Exchange |
6.625% Senior Notes due 2045 | | TDI | | New York Stock Exchange |
6.875% Senior Notes due 2059 | | TDE | | New York Stock Exchange |
7.000% Senior Notes due 2060 | | TDJ | | New York Stock Exchange |
5.875% Senior Notes due 2061 | | TDA | | New York Stock Exchange |
The number of shares outstanding of each of the issuer's classes of common stock, as of June 30, 2019,2020, is 107,218,500107,034,900 Common Shares, $.01 par value, and 7,293,8007,260,800 Series A Common Shares, $.01 par value.
Telephone and Data Systems, Inc.
Quarterly Report on Form 10-Q
For the Period Ended June 30, 20192020
|
| |
| Telephone and Data Systems, Inc. Management’s Discussion and Analysis of Financial Condition and Results of Operations |
Executive Overview
The following discussion and analysis compares Telephone and Data Systems, Inc.’s (TDS) financial results for the three and six months ended June 30, 2019,2020, to the three and six months ended June 30, 2018.2019. It should be read in conjunction with TDS’ interim consolidated financial statements and notes included herein, and with the description of TDS’ business, its audited consolidated financial statements and Management's Discussion and Analysis (MD&A) of Financial Condition and Results of Operations (MD&A) included in TDS’ Annual Report on Form 10-K (Form 10-K) for the year ended December 31, 2018.2019. Certain numbers included herein are rounded to millions for ease of presentation; however, certain calculated amounts and percentages are determined using the unrounded numbers.
This report contains statements that are not based on historical facts, including the words “believes,” “anticipates,” “estimates,” “expects,” “plans,” “intends,” “projects” and similar expressions. These statements constitute and represent “forward looking statements” as this term is defined in the Private Securities Litigation Reform Act of 1995. Such forward looking statements involve known and unknown risks, uncertainties and other factors that may cause actual results, events or developments to be significantly different from any future results, events or developments expressed or implied by such forward looking statements. See Private Securities Litigation Reform Act of 1995 Safe Harbor Cautionary Statement for additional information.
TDS uses certain “non-GAAP financial measures” and each such measure is identified in the MD&A. A discussion of the reason TDS determines these metrics to be useful and a reconciliation of these measures to their most directly comparable measures determined in accordance with accounting principles generally accepted in the United States of America (GAAP) are included in the Supplemental Information Relating to Non-GAAP Financial Measures section within the MD&A of this Form 10-Q Report.
General
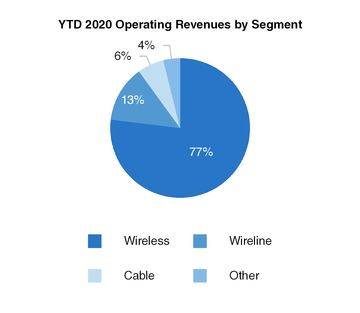
TDS is a diversified telecommunications company that provides high-quality communications services to approximately 6 million connections nationwide. TDS provides wireless services through its 82%-owned subsidiary, United States Cellular Corporation (U.S. Cellular). TDS also provides wireline and cable services through its wholly-owned subsidiary, TDS Telecommunications LLC (TDS Telecom). TDS' segments operate entirely in the United States. See Note 1112 — Business Segment Information in the Notes to Consolidated Financial Statements for additional information about TDS' segments.
The impact of the global spread of coronavirus (COVID-19) on TDS' future operations is uncertain. There are many factors, including the severity and duration of the outbreak, as well as other direct and indirect impacts, that are expected to negatively impact TDS.
See the following areas within this MD&A for additional discussion of the impacts of COVID-19:
Results of Operations — Income tax expense
Business Overview — U.S. Cellular
Operational Overview — U.S. Cellular
Business Overview — TDS Telecom
Financial Overview — TDS Telecom
Liquidity and Capital Resources
Risk Factors
TDS Mission and Strategy
TDS’ mission is to provide outstanding communications services to its customers and meet the needs of its shareholders, its people, and its communities. In pursuing this mission, TDS seeks to grow its businesses, create opportunities for its associates and employees, and build value over the long-term for its shareholders. Across all of its businesses, TDS is focused on providing exceptional customer experiences through best-in-class services and products and superior customer service.
TDS’ long-term strategy calls for the majority of its capital to be reinvested in its operating businesses to strengthen their competitive positions and financial performance, while also returning value to TDS shareholders primarily through the payment of a regular quarterly cash dividend.
In 2019, TDS is workingplans to build shareholder value by continuing to execute on its strategies to build strong, competitive businesses providing high-quality, data-focused services and products. Strategic efforts include:
| |
| ▪ | U.S. Cellular continues to offeroffers economical and competitively priced service plans and devices to its customers and is focused on increasing revenues from sales of related products such as accessories and device protection plans and from new services such as fixed wireless broadband.home internet. In addition, U.S. Cellular is focused on expanding its solutions available to business and government customers, including a growing suite of connected machine-to-machine solutions and software applications across various categories.customers. |
| |
| ▪ | U.S. Cellular continues to devote efforts to enhance its network capabilities. VoLTE technology has been launched successfully in California, Iowa, Oregon, Washington and Wisconsin,is now available to nearly 90% of U.S Cellular's subscribers, and deployments in additional operating markets are expected later in 2019.2020. VoLTE technology allows customers to utilize a 4G LTE network for both voice and data services and offers enhanced services such as high definition voice and simultaneous voice and data sessions. In addition, the deployment of VoLTE technology expands U.S. Cellular’s ability to offer roaming services to other wireless carriers. |
| |
| ▪ | U.S. Cellular also is committedhas launched commercial 5G services in Iowa and Wisconsin and will continue to continuous technology innovationlaunch in additional areas throughout 2020 and has begun to deploybeyond. 5G technology which is expected to help address customers’customers' growing demand for data services as well as create opportunities for new services requiring high speed, reliability and low latency. In addition to the deployment of 5G technology, U.S. Cellular is working with leading companies in the wireless infrastructure and handset ecosystem to provide rich 5G experiences for customers, initially focused on mobility services and usingalso modernizing its low band spectrum. At the same time, as discussed below, U.S. Cellular has been seeking to acquire wireless spectrum licenses in the 28 GHz and 24 GHz bands to enable the delivery of additional 5G services in the future. In the markets where U.S. Cellular commercially deploys 5G technology, customers using U.S. Cellular’s 4G LTE network will experience increased network speed due to U.S. Cellular's network modernization efforts.further enhance 4G LTE speeds. |
| |
| ▪ | U.S. Cellular assesses its existing wireless interests on an ongoing basis with a goal of improving the competitiveness of its operations and maximizing its long-term return on capital. As part of this strategy, and to be able to expand its 5G service offerings, U.S. Cellular actively seeks attractive opportunities to acquire wireless spectrum, licenses, including pursuant to FCC auctions. On June 3, 2019, the FCC announced by way of public notice that U.S. Cellular was the provisional winning bidder for 408 wireless spectrum licenses in its 28 GHz auction (Auction 101)auctions such as Auctions 103 and 282 wireless spectrum licenses in its 24 GHz auction (Auction 102) for an aggregate purchase price of $256 million. 105. |
| |
| ▪ | TDS Telecom’s Wireline business continues to focus on driving growth in its broadband and video services by investing in fiber deployment in new out-of-territory markets and insidein existing markets. Construction has beguncontinues in two newthe out-of-territory clusters mid-centralin Wisconsin and Idaho.the Pacific Northwest. With support from the FCC’sFCC's A-CAM program and state broadband grants, Wireline is also deploying higher speed broadband to moreunserved and under-served service addresses in rural areas.areas within its current markets. |
| |
| ▪ | TDS Telecom’s Cable business continues to increase its broadband penetration by making network capacity investments, including upgrading to DOCSIS 3.1, and by offering more advanced services in its markets. |
| |
| ▪ | TDS Telecom's Wireline and Cable businesses are investingcontinue to invest in a next generation cloud-based video platform called TDS TV+ to enhance video services. TDS Telecom has rolled out this service in certain Wireline and Cable markets in the second quarter and has plans to roll out to additional markets throughout the remainder of 2020. |
Terms Used by TDS
The following is a list of definitions of certain industry terms that are used throughout this document:
| |
| ▪ | 4G LTE – fourth generation Long-Term Evolution, which is a wireless technology that enables more network capacity for more data per user as well as faster access to data compared to third generation (3G) technology. |
| |
| ▪ | 5G – fifth generation wireless technology that is expected to help address customers’ growing demand for data services as well as create opportunities for new services requiring high speed and reliability as well as low latency. |
| |
| ▪ | Account – represents an individual or business financially responsible for one or multiple associated connections. An account may include a variety of types of connections such as handsets and connected devices. |
| |
| ▪ | Alternative Connect America Cost Model (A-CAM) – a USF support mechanism for rate-of-return carriers, which provides revenue support through 2028. This support comes with an obligation to build defined broadband speeds to a certain number of locations. |
| |
| ▪ | Auctions 103 and 105 – Auction 103 is an FCC auction of 37, 39, and 47 GHz wireless spectrum licenses that started in December 2019 and concluded in March 2020. Auction 105 is an FCC auction of 3.5 GHz wireless spectrum licenses and bidding commenced in July 2020. |
| |
| ▪ | Broadband Connections – refers to the number of Wireline customers provided high-capacity data circuits via various technologies, including DSL and dedicated internet circuit technologies or the Cable billable number of lines into a building for high-speed data services. |
| |
| ▪ | Churn Rate – represents the percentage of the connections that disconnect service each month. These rates represent the average monthly churn rate for each respective period. |
| |
| ▪ | Connected Devices – non-handset devices that connect directly to the U.S. Cellular network. Connected devices include products such as tablets, wearables, modems, and hotspots. |
| |
| ▪ | Coronavirus Aid, Relief, and Economic Security (CARES) Act – economic relief package signed into law on March 27, 2020 to address the public health and economic impacts of COVID-19, including a variety of tax provisions. |
| |
| ▪ | DOCSIS – Data Over Cable Service Interface Specification is an international telecommunications standard that permits the addition of high-bandwidth data transfer to an existing cable TV (CATV) system. DOCSIS 3.1 is a system specification that increases data transmission rates. |
| |
| ▪ | EBITDA – refers to earnings before interest, taxes, depreciation, amortization and accretion and is used in the non-GAAP metric Adjusted EBITDA throughout this document. See Supplemental Information Relating to Non-GAAP Financial Measures within this MD&A for additional information. |
| |
| ▪ | FCC Keep Americans Connected Pledge – voluntary FCC initiative in response to the COVID-19 pandemic to ensure that Americans do not lose their broadband or telephone connectivity as a result of the exceptional circumstance. |
| |
| ▪ | Fiber Out-of-Territory Builds – represents construction of facilities-based market expansions outside of TDS' ILEC and CLEC footprint. |
| |
| ▪ | Free Cash Flow – non-GAAP metric defined as Cash flows from operating activities less Cash paid for additions to property, plant and equipment. See Supplemental Information Relating to Non-GAAP Financial Measures within this MD&A for additional information. |
| |
| ▪ | Gross Additions – represents the total number of new connections added during the period, without regard to connections that were terminated during that period. |
| |
▪ | IPTV Connections – represents the number of Wireline customers provided video services using IP networking technology.
|
| |
▪ | Machine-to-Machine (M2M) – technology that involves the transmission of data between networked devices, as well as the performance of actions by devices without human intervention. U.S. Cellular sells and supports M2M solutions to customers, provides connectivity for M2M solutions via the U.S. Cellular network, and has agreements with device manufacturers and software developers which offer M2M solutions.
|
| |
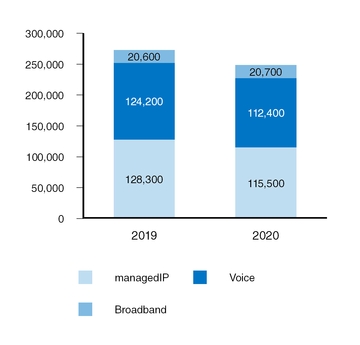
| ▪ | ManagedIP Connections – refers to the number of telephone handsets, data lines and IP trunks providing communications using IP networking technology. |
| |
| ▪ | Net Additions (Losses) – represents the total number of new connections added during the period, net of connections that were terminated during that period. |
| |
| ▪ | OIBDA – refers to operating income before depreciation, amortization and accretion and is used in the non-GAAP metric Adjusted OIBDA throughout this document. See Supplemental Information Relating to Non-GAAP Financial Measures within this MD&A for additional information. |
| |
▪ | Partial Economic Areas – service areas of certain FCC licenses based on geography.
|
| |
| ▪ | Postpaid Average Revenue per Account (Postpaid ARPA) – metric which is calculated by dividing total postpaid service revenues by the average number of postpaid accounts and by the number of months in the period. |
| |
| ▪ | Postpaid Average Revenue per User (Postpaid ARPU) – metric which is calculated by dividing total postpaid service revenues by the average number of postpaid connections and by the number of months in the period. |
| |
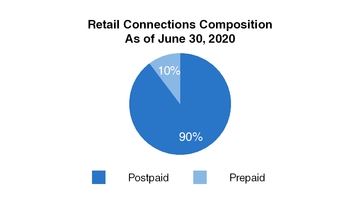
| ▪ | Retail Connections – the sum of U.S. Cellular postpaid connections and U.S. Cellular prepaid connections. |
| |
| ▪ | Universal Service Fund (USF) – a system of telecommunications collected fees and support payments managed by the FCC intended to promote universal access to telecommunications services in the United States. |
| |
| ▪ | U.S. Cellular Connections – individual lines of service associated with each device activated by a customer. Connections include all types of devices that connect directly to the U.S. Cellular network. |
| |
| ▪ | Video Connections – represents the number of Wireline customers provided video services. For Cable, generally, a home or business receiving video programming counts as one video connection. In counting bulk residential or commercial connections, such as an apartment building or a hotel, connections are counted based on the number of units/rooms within the building receiving service. |
| |
| ▪ | Voice Connections – refers to the individual circuits connecting a customer to Wireline’s central office facilities that provide voice services or the Cable billable number of lines into a building for voice services. |
| |
| ▪ | VoLTE – Voice over Long-Term Evolution is a technology specification that defines the standards and procedures for delivering voice communications and related services over 4G LTE networks. |
| |
| ▪ | Wireline Residential Revenue per Connection – is calculated by dividing total Wireline residential revenue by the average number of Wireline residential connections and by the number of months in the period. |
Results of Operations — TDS Consolidated
| | | | Three Months Ended
June 30, | | Six Months Ended
June 30, | Three Months Ended
June 30, | | Six Months Ended
June 30, |
| | 2019 | | 2018 | | 2019 vs. 2018 | | 2019 | | 2018 | | 2019 vs. 2018 | 2020 | | 2019 | | 2020 vs. 2019 | | 2020 | | 2019 | | 2020 vs. 2019 |
| (Dollars in millions) | | | | | | | | | | | | | | | | | | | | | | |
| Operating revenues | | | | | | | | | | | | | | | | | | | | | | |
| U.S. Cellular | $ | 973 |
| | $ | 974 |
| | – |
| | $ | 1,939 |
| | $ | 1,915 |
| | 1 | % | $ | 973 |
| | $ | 973 |
| | – |
| | $ | 1,937 |
| | $ | 1,939 |
| | – |
|
| TDS Telecom | 233 |
| | 230 |
| | 1 | % | | 464 |
| | 461 |
| | 1 | % | 241 |
| | 233 |
| | 3 | % | | 481 |
| | 464 |
| | 4 | % |
All other1 | 55 |
| | 51 |
| | 6 | % | | 115 |
| | 104 |
| | 11 | % | 49 |
| | 55 |
| | (10 | )% | | 106 |
| | 115 |
| | (7 | )% |
| Total operating revenues | 1,261 |
| | 1,255 |
| | – |
| | 2,518 |
| | 2,480 |
| | 2 | % | 1,263 |
| | 1,261 |
| | – |
| | 2,524 |
| | 2,518 |
| | – |
|
| Operating expenses | | | | | | | | | | | | | | | | | | | | | | |
| U.S. Cellular | 943 |
| | 918 |
| | 3 | % | | 1,844 |
| | 1,794 |
| | 3 | % | 920 |
| | 943 |
| | (2 | )% | | 1,833 |
| | 1,844 |
| | (1 | )% |
| TDS Telecom | 204 |
| | 212 |
| | (4 | )% | | 398 |
| | 417 |
| | (5 | )% | 210 |
| | 204 |
| | 3 | % | | 422 |
| | 398 |
| | 6 | % |
All other1 | 66 |
| | 64 |
| | 2 | % | | 134 |
| | 128 |
| | 5 | % | 55 |
| | 66 |
| | (17 | )% | | 118 |
| | 134 |
| | (11 | )% |
| Total operating expenses | 1,213 |
| | 1,194 |
| | 2 | % | | 2,376 |
| | 2,339 |
| | 2 | % | 1,185 |
| | 1,213 |
| | (2 | )% | | 2,373 |
| | 2,376 |
| | – |
|
| Operating income (loss) | |
| | |
| | |
| | | | | | | |
| | |
| | |
| | | | | | |
| U.S. Cellular | 30 |
| | 56 |
| | (45 | )% | | 95 |
| | 121 |
| | (21 | )% | 53 |
| | 30 |
| | 74 | % | | 104 |
| | 95 |
| | 9 | % |
| TDS Telecom | 29 |
| | 18 |
| | 60 | % | | 66 |
| | 43 |
| | 52 | % | 31 |
| | 29 |
| | 6 | % | | 59 |
| | 66 |
| | (10 | )% |
All other1 | (11 | ) | | (13 | ) | | 14 | % | | (19 | ) | | (23 | ) | | 20 | % | (6 | ) | | (11 | ) | | 51 | % | | (12 | ) | | (19 | ) | | 35 | % |
| Total operating income | 48 |
| | 61 |
| | (21 | )% | | 142 |
| | 141 |
| | 1 | % | 78 |
| | 48 |
| | 63 | % | | 151 |
| | 142 |
| | 6 | % |
| Investment and other income (expense) | | | | | | | | | | | | | | | | | | | | | | |
| Equity in earnings of unconsolidated entities | 41 |
| | 40 |
| | 2 | % | | 85 |
| | 78 |
| | 9 | % | 44 |
| | 41 |
| | 8 | % | | 90 |
| | 85 |
| | 5 | % |
| Interest and dividend income | 9 |
| | 6 |
| | 43 | % | | 17 |
| | 11 |
| | 51 | % | 2 |
| | 9 |
| | (76 | )% | | 8 |
| | 17 |
| | (53 | )% |
| Interest expense | (43 | ) | | (43 | ) | | 1 | % | | (86 | ) | | (86 | ) | | 1 | % | (38 | ) | | (43 | ) | | 10 | % | | (75 | ) | | (86 | ) | | 12 | % |
| Other, net | — |
| | 1 |
| | N/M |
| | 1 |
| | 2 |
| | N/M |
| — |
| | — |
| | 59 | % | | (1 | ) | | 1 |
| | (57 | )% |
| Total investment and other income | 7 |
| | 4 |
| | 54 | % | | 17 |
| | 5 |
| | N/M |
| 8 |
| | 7 |
| | 22 | % | | 22 |
| | 17 |
| | 34 | % |
| | | | | | | | | | | | | | | | | | | | | | | |
| Income before income taxes | 55 |
| | 65 |
| | (16 | )% | | 159 |
| | 146 |
| | 9 | % | 86 |
| | 55 |
| | 58 | % | | 173 |
| | 159 |
| | 9 | % |
| Income tax expense | 16 |
| | 21 |
| | (23 | )% | | 50 |
| | 45 |
| | 12 | % | 8 |
| | 16 |
| | (47 | )% | | 12 |
| | 50 |
| | (76 | )% |
| | | | | | | | | | | | | | | | | | | | | | | |
| Net income | 39 |
| | 44 |
| | (12 | )% | | 109 |
| | 101 |
| | 8 | % | 78 |
| | 39 |
| | N/M |
| | 161 |
| | 109 |
| | 47 | % |
| Less: Net income attributable to noncontrolling interests, net of tax | 6 |
| | 11 |
| | (44 | )% | | 17 |
| | 29 |
| | (41 | )% | 13 |
| | 6 |
| | 100 | % | | 26 |
| | 17 |
| | 53 | % |
| Net income attributable to TDS shareholders | $ | 33 |
| | $ | 33 |
| | (2 | )% | | $ | 92 |
| | $ | 72 |
| | 28 | % | $ | 65 |
| | $ | 33 |
| | N/M |
| | $ | 135 |
| | $ | 92 |
| | 46 | % |
| | | | | | | | | | | | | | | | | | | | | | | |
Adjusted OIBDA (Non-GAAP)2 | $ | 287 |
| | $ | 272 |
| | 5 | % | | $ | 598 |
| | $ | 568 |
| | 5 | % | $ | 318 |
| | $ | 287 |
| | 11 | % | | $ | 629 |
| | $ | 598 |
| | 5 | % |
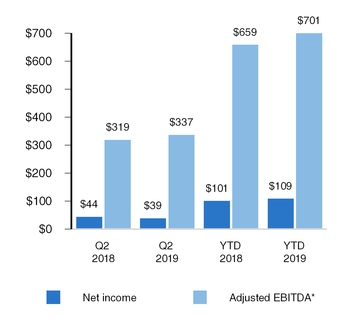
Adjusted EBITDA (Non-GAAP)2 | $ | 337 |
| | $ | 319 |
| | 5 | % | | $ | 701 |
| | $ | 659 |
| | 6 | % | $ | 364 |
| | $ | 337 |
| | 8 | % | | $ | 726 |
| | $ | 701 |
| | 4 | % |
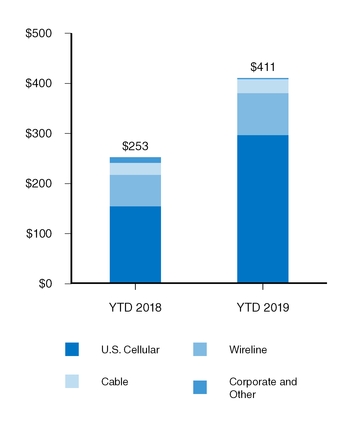
| Capital expenditures | $ | 264 |
| | $ | 138 |
| | 91 | % | | $ | 411 |
| | $ | 253 |
| | 62 | % | |
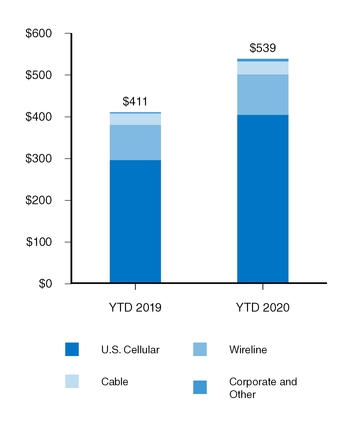
Capital expenditures3 | | $ | 247 |
| | $ | 264 |
| | (7 | )% | | $ | 539 |
| | $ | 411 |
| | 31 | % |
N/M - Percentage change not meaningful
| |
1 | Consists of corporate and other operations and intercompany eliminations. |
| |
2 | Refer to Supplemental Information Relating to Non-GAAP Financial Measures within this MD&A for a reconciliation of this measure. |
| |
3 | Refer to Liquidity and Capital Resources within this MD&A for additional information on Capital expenditures. |
Refer to individual segment discussions in this MD&A for additional details on operating revenues and expenses at the segment level.
Equity in earnings of unconsolidated entities
Equity in earnings of unconsolidated entities represents TDS’ share of net income from entities in which it has a noncontrolling interest and that are accounted for byusing the equity method. TDS’ investment in the Los Angeles SMSA Limited Partnership (LA Partnership) contributed $19pretax income of $20 million and $20$19 million for the three months ended June 30, 20192020 and 2018,2019, respectively and $40$42 million and $38$40 million for the six months ended June 30, 2020 and 2019, and 2018, respectively, to Equity in earnings of unconsolidated entities.respectively. See Note 78 — Investments in Unconsolidated Entities in the Notes to Consolidated Financial Statements for additional information.
Income tax expense
The effective tax rate on Income before income taxes for the three months ended June 30, 2020 and 2019, was 9.6% and 2018, was 28.8% and 31.5%, respectively. The effective tax rate on Income before income taxes for the six months ended June 30, 2020 and 2019, was 6.9% and 2018, was 31.3% and 30.5%, respectively. The lower effective tax rates forrate in 2020 as compared to 2019 is due primarily to the threeincome tax benefits of the CARES Act enacted on March 27, 2020.
The CARES Act provides retroactive eligibility of bonus depreciation on qualified improvement property put into service after December 31, 2017 and six month periods primarily reflect a normalized combined5-year carryback of net operating losses generated in years 2018-2020. As the statutory federal tax rate applicable to certain years within the carryback period is 35%, carryback to those years provides a tax benefit in excess of the current federal statutory rate of federal21%, resulting in a reduction of income tax expense. TDS projects that the income tax effects of the CARES Act will result in a reduction of income tax expense recognized throughout the 2020 tax year as part of the estimated annual effective tax rate, and statea cash refund in 2021 of taxes adjusted for impacts of nondeductible expenses.paid in prior years.
Net income attributable to noncontrolling interests, net of tax
| | | | Three Months Ended
June 30, | | Six Months Ended
June 30, | Three Months Ended
June 30, | | Six Months Ended
June 30, |
| | 2019 | | 2018 | | 2019 | | 2018 | 2020 | | 2019 | | 2020 | | 2019 |
| (Dollars in millions) | | | | | | | | | | | | | | |
| U.S. Cellular noncontrolling public shareholders’ | $ | 6 |
| | $ | 8 |
| | $ | 16 |
| | $ | 16 |
| $ | 12 |
| | $ | 6 |
| | $ | 24 |
| | $ | 16 |
|
| Noncontrolling shareholders’ or partners’ | — |
| | 3 |
| | 1 |
| | 13 |
| 1 |
| | — |
| | 2 |
| | 1 |
|
| Net income attributable to noncontrolling interests, net of tax | $ | 6 |
| | $ | 11 |
| | $ | 17 |
| | $ | 29 |
| $ | 13 |
| | $ | 6 |
| | $ | 26 |
| | $ | 17 |
|
Net income attributable to noncontrolling interests, net of tax includes the noncontrolling public shareholders’ share of U.S. Cellular’s net income, and the noncontrolling shareholders’ or partners’ share of certain U.S. Cellular subsidiaries’ net income.
Net income attributable toand other TDS noncontrolling interests, net of tax decreased during the six months ended June 30, 2019, due primarily to an out-of-period adjustment recorded in the first quarter of 2018. TDS determined that this adjustment was not material to any of the periods impacted. See Note 9 — Variable Interest Entities in the Notes to Consolidated Financial Statements for additional information.
Earnings
(Dollars in millions)
Three Months Ended
Net income decreasedincreased due primarily to higher depreciation in 2019lower operating expenses and gains on license exchanges recorded in 2018, partially offset by higher revenues and lower costthe impact of equipment sold.the CARES Act reducing income tax expense. Adjusted EBITDA increased due primarily to higher revenues combined with lower cost of equipment sold.operating expenses.
Six Months Ended
Net income increased due primarily to higher revenues, partially offset by higher depreciation in 2019 and gains on license exchanges recorded in 2018.the impact of the CARES Act reducing income tax expense. Adjusted EBITDA increased due primarily to higher revenues.lower Cost of equipment and products.
*Represents a non-GAAP financial measure. Refer to Supplemental Information Relating to Non-GAAP Financial Measures within this MD&A for a reconciliation of this measure.
Business Overview
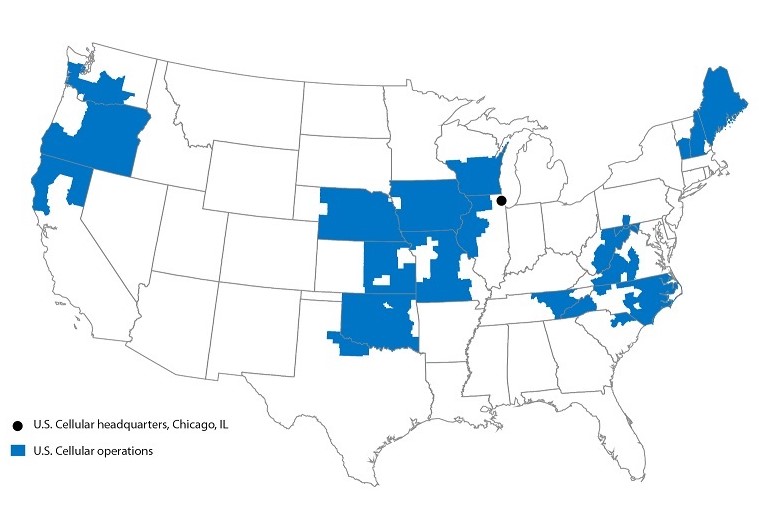
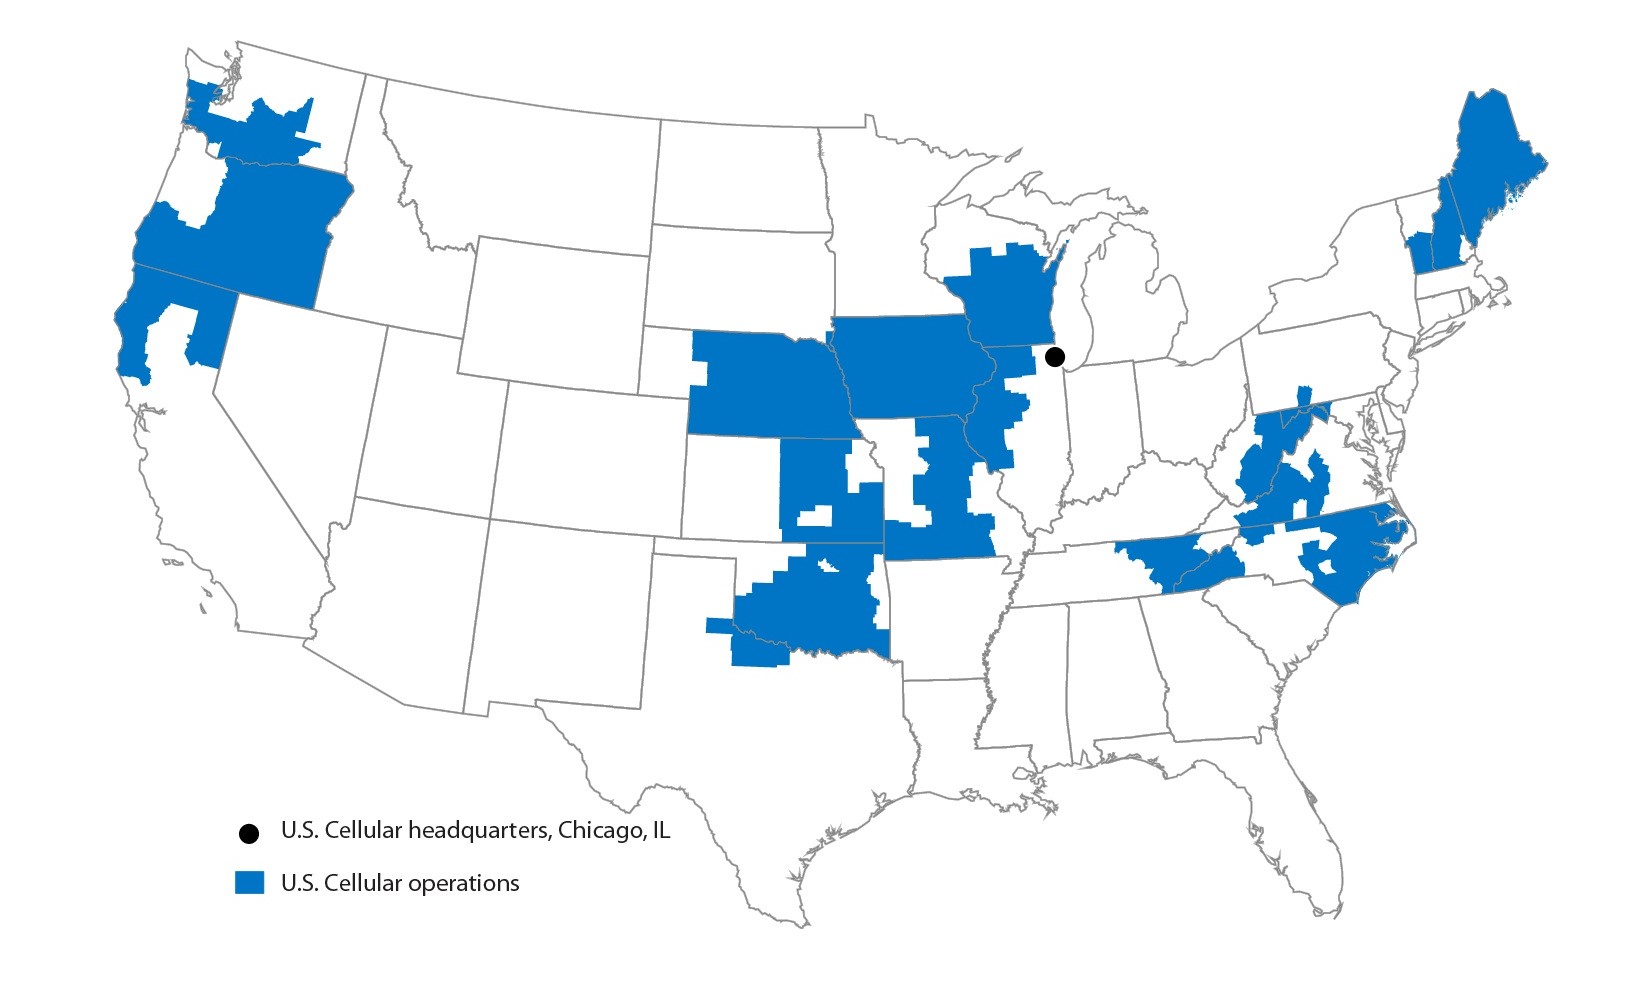
U.S. Cellular owns, operates, and invests in wireless markets throughout the United States. U.S. Cellular is an 82%-owned subsidiary of TDS. U.S. Cellular’s strategy is to attract and retain wireless customers through a value proposition comprised of a high-quality network, outstanding customer service, and competitive devices, plans, and pricing, all provided with a localcommunity focus.
COVID-19 considerations
COVID-19 impacts on U.S. Cellular's business for the six months ended June 30, 2020 include a reduction in service revenues and equipment sales, and a reduction in handset subscriber gross additions and defections. The impacts of COVID-19 on this and future periods are expected to negatively affect U.S. Cellular’s results of operations, cash flows and financial position. The extent and duration of these impacts are uncertain due to many factors and could be material. Certain impacts on and actions by U.S. Cellular related to COVID-19 include, but are not limited to, the following:
| |
| • | Taking action to keep associates safe, including implementing a work-from-home strategy for employees whose jobs can be performed remotely. In addition, to keep associates, customers, and communities safe, U.S. Cellular temporarily closes retail stores for enhanced cleanings, continues to operate with reduced store hours, and provides associates with personal protective equipment to be worn during customer interactions. U.S. Cellular has also implemented a daily health check process for associates and requires social distancing and mask wearing in all company facilities, including stores. Throughout this period of change, U.S. Cellular has continued serving its customers and ensuring its wireless network remains fully operational. |
| |
| • | Participated in the FCC Keep Americans Connected Pledge, through June 30, 2020, to not turn-off service or charge late fees due to a customer’s inability to pay their bill due to circumstances related to COVID-19. This resulted in a reduction in non-pay defections, as well as reduced service revenues, for the six months ended June 30, 2020. Non-pay defections are expected to increase in future periods as the FCC Keep Americans Connected Pledge ended on June 30, 2020 and certain accounts that were part of the Pledge are expected to terminate due to non-payment. |
| |
| • | Waiving overage charges and certain other charges. This resulted in reduced service revenues during the three and six months ended June 30, 2020. |
| |
| • | Supporting the communities in which U.S. Cellular operates. Through U.S. Cellular’s partnership with the Boys & Girls Clubs, U.S. Cellular has contributed to the Boys & Girls Clubs’ COVID-19 Relief Fund to support children, families and communities. These funds are dispersed directly to more than 50 clubs in U.S. Cellular’s service regions to support the most immediate needs of youth in areas of importance such as providing food for children who rely on their Boys & Girls Clubs for their dinner, care for children of essential workers and first responders, and digital learning resources. In additional to monetary donations, in-person volunteerism has been replaced by virtual volunteerism, with associates participating in events such as reading for the visually impaired and mentoring for students. |
| |
| • | Recognizing income tax benefits associated with the enactment of the CARES Act. This legislation resulted in a reduction to income tax expense for the three and six months ended June 30, 2020. The CARES Act is also projected to result in a reduction of income tax expense recognized throughout the 2020 tax year as part of the estimated annual effective tax rate, and a cash refund in 2021 of taxes paid in prior years. |
| |
| • | Monitoring its supply chain to assess impacts to availability and costs of device inventory and network equipment and services, including monitoring the dependency on third parties to continue network related projects. Various states' stay-at-home orders could cause delays in municipal permitting and other contractor work. At this time, U.S. Cellular expects to be able to meet customer demand for devices and services and to be able to continue its 4G LTE network modernization and 5G deployment with no significant disruptions. |
| |
| • | Tracking increased customer usage and the impact of the removal of data caps. At this time, U.S. Cellular believes its network capacity is sufficient to accommodate expected increased usage. |
| |
| • | Monitoring roaming behaviors. Both inbound and outbound roaming traffic have been dampened by COVID-19 as wireless customers are reducing travel. The extent to which roaming traffic will be impacted by the pandemic in the future will depend upon governmental mandates and customer behavior in response to the outbreak. |
OPERATIONS
| |
| ▪ | Serves customers with 5.04.9 million connections including 4.4 million postpaid, 0.5 million prepaid and 0.1 million reseller and other connections |
| |
| ▪ | Employs approximately 5,6005,400 associates |
| |
| ▪ | 6,673 cell sites including 4,116 owned towers in service |
Operational Overview
| | | | | | | | | |
| | | | | | | |
| As of June 30, | As of June 30, | | 2019 | | 2018 | As of June 30, | | 2020 | | 2019 |
| Retail Connections – End of Period | Retail Connections – End of Period | | Retail Connections – End of Period | |
| | Postpaid | | 4,414,000 |
| | 4,468,000 | Postpaid | | 4,372,000 |
| | 4,414,000 |
| | Prepaid | | 500,000 |
| | 527,000 | Prepaid | | 496,000 |
| | 500,000 |
| | Total | | 4,914,000 |
| | 4,995,000 | Total | | 4,868,000 |
| | 4,914,000 |
| | | | | | | | | |
| | | | | | | |
| | | | Q2 2019 | | Q2 2018 | | Q2 2019 vs. Q2 2018 | | YTD 2019 | | YTD 2018 | YTD 2019 vs.
YTD 2018 | Q2 2020 | | Q2 2019 | | Q2 2020 vs. Q2 2019 | | YTD 2020 | | YTD 2019 | YTD 2020 vs. YTD 2019 |
| Postpaid Activity and Churn | Postpaid Activity and Churn | | Postpaid Activity and Churn | |
| Gross Additions | | | | | | | | | | | | | | | | | | |
| Handsets | 102,000 |
| | 111,000 |
| | (8 | )% | | 203,000 |
| | 207,000 |
| (2 | )% | 85,000 |
| | 102,000 |
| | (17 | )% | | 175,000 |
| | 203,000 |
| (14 | )% |
| Connected Devices | 35,000 |
| | 35,000 |
| | – |
| | 70,000 |
| | 68,000 |
| 3 | % | 44,000 |
| | 35,000 |
| | 26 | % | | 86,000 |
| | 70,000 |
| 23 | % |
| Total Gross Additions | 137,000 |
| | 146,000 |
| | (6 | )% | | 273,000 |
| | 275,000 |
| (1 | )% | 129,000 |
| | 137,000 |
| | (6 | )% | | 261,000 |
| | 273,000 |
| (4 | )% |
| Net Additions (Losses) | | | | | | | | | | | | | | | | | | |
| Handsets | (11,000 | ) | | 5,000 |
| | N/M |
| | (25,000 | ) | | (11,000 | ) | N/M |
| 3,000 |
| | (11,000 | ) | | N/M |
| | (17,000 | ) | | (25,000 | ) | 32 | % |
| Connected Devices | (15,000 | ) | | (18,000 | ) | | 17 | % | | (33,000 | ) | | (39,000 | ) | 15 | % | 9,000 |
| | (15,000 | ) | | N/M |
| | 3,000 |
| | (33,000 | ) | N/M |
|
| Total Net (Losses) | (26,000 | ) | | (13,000 | ) | | (100 | )% | | (58,000 | ) | | (50,000 | ) | (16 | )% | |
| Total Net Additions (Losses) | | 12,000 |
| | (26,000 | ) | | N/M |
| | (14,000 | ) | | (58,000 | ) | 76 | % |
| Churn | | | | | | | | | | | | | | | | | | |
| Handsets | 0.97 | % | | 0.92 | % | | | | 0.98 | % | | 0.94 | % | | 0.71 | % | | 0.97 | % | | | | 0.83 | % | | 0.98 | % | |
| Connected Devices | 3.01 | % | | 2.85 | % | | | | 3.05 | % | | 2.82 | % | | 2.24 | % | | 3.01 | % | | | | 2.67 | % | | 3.05 | % | |
| Total Churn | 1.23 | % | | 1.19 | % | | | | 1.24 | % | | 1.21 | % | | 0.89 | % | | 1.23 | % | | | | 1.05 | % | | 1.24 | % | |
N/M - Percentage change not meaningful
Total postpaid grosshandset net additions decreasedincreased for the three and six months ended June 30, 2019,2020, when compared to the same period last year, dueyear. Handset defections decreased as a result of lower consumer switching activity related to COVID-19, as well as a reduction in non-pay defections related to the FCC Keep Americans Connected Pledge. Partially offsetting the decrease in defections were lower gross additions resulting from lower consumer switching activity.
Total postpaid handset net additions increased for the six months ended June 30, 2020, when compared to the same period last year. Handset defections decreased as a result of lower consumer switching activity related to COVID-19, as well as a reduction in non-pay defections related to the FCC Keep Americans Connected Pledge. Partially offsetting the decrease in defections were lower gross additions resulting from aggressive industry-wide promotionalcompetition in the first quarter of 2020 and lower consumer switching activity on handsets.in the second quarter of 2020.
Total postpaid churnconnected device net additions increased for the three and six months ended June 30, 2019,2020, when compared to the same period last year. The increase is due primarily to aggressive industry-wide handset promotional activity(i) a decrease in tablet defections and (ii) an increase in defections of connected wearables, which were launched late in the second quarter of 2018.demand for internet related products given a need for remote connectivity related to COVID-19.
Non-pay defections are expected to increase in future periods as the FCC Keep Americans Connected Pledge ended on June 30, 2020 and certain accounts that were part of the Pledge are expected to terminate due to non-payment.
Postpaid Revenue
| | | | Three Months Ended
June 30, | | Six Months Ended
June 30, | Three Months Ended
June 30, | | Six Months Ended
June 30, |
| | 2019 | | 2018 | | 2019 | | 2018 | 2020 | | 2019 | | 2020 vs. 2019 | | 2020 | | 2019 | | 2020 vs. 2019 |
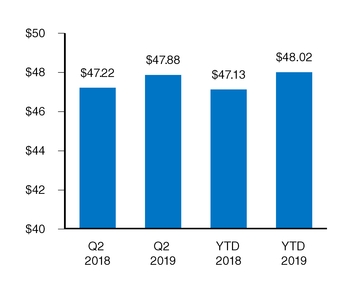
| Average Revenue Per User (ARPU) | $ | 45.90 |
| | $ | 44.74 |
| | $ | 45.66 |
| | $ | 44.54 |
| $ | 46.24 |
| | $ | 45.90 |
| | 1 | % | | $ | 46.72 |
| | $ | 45.66 |
| | 2 | % |
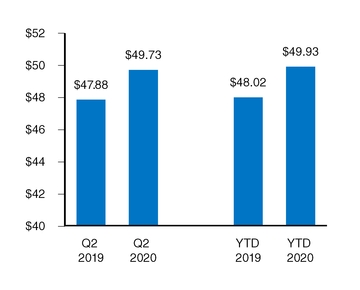
| Average Revenue Per Account (ARPA) | $ | 119.46 |
| | $ | 118.57 |
| | $ | 119.15 |
| | $ | 118.38 |
| $ | 120.70 |
| | $ | 119.46 |
| | 1 | % | | $ | 121.80 |
| | $ | 119.15 |
| | 2 | % |
Postpaid ARPU and Postpaid ARPA increased for the three and six months ended June 30, 2019,2020, when compared to the same period last year, due primarily to several factors including: a shift in mix to higher-priced service plans;(i) having proportionately more handsetfewer tablet connections, which on a per-unit basis contribute moreless revenue than connected device connections;smartphone devices, (ii) an increase in regulatory recovery revenues, and (iii) an increase in device protection plan revenues. These increases were partially offset by the impact of waiving overage charges, a measure U.S. Cellular has taken to assist customers during the COVID-19 pandemic.
Financial Overview - U.S. Cellular
| | | | Three Months Ended
June 30, | | Six Months Ended
June 30, | Three Months Ended
June 30, | | Six Months Ended
June 30, |
| | 2019 | | 2018 | | 2019 vs. 2018 | | 2019 | | 2018 | | 2019 vs. 2018 | 2020 | | 2019 | | 2020 vs. 2019 | | 2020 | | 2019 | | 2020 vs. 2019 |
| (Dollars in millions) | | | | | | | | | | | | | | | | | | | | | | |
| Retail service | $ | 662 |
| | $ | 652 |
| | 2 | % | | $ | 1,322 |
| | $ | 1,301 |
| | 2 | % | $ | 658 |
| | $ | 662 |
| | (1 | )% | | $ | 1,329 |
| | $ | 1,322 |
| | 1 | % |
| Inbound roaming | 44 |
| | 39 |
| | 13 | % | | 78 |
| | 66 |
| | 17 | % | 41 |
| | 44 |
| | (8 | )% | | 77 |
| | 78 |
| | – |
|
| Other | 51 |
| | 50 |
| | 2 | % | | 98 |
| | 98 |
| | 2 | % | 54 |
| | 51 |
| | 7 | % | | 109 |
| | 98 |
| | 10 | % |
| Service revenues | 757 |
| | 741 |
| | 2 | % | | 1,498 |
| | 1,465 |
| | 2 | % | 753 |
| | 757 |
| | (1 | )% | | 1,515 |
| | 1,498 |
| | 1 | % |
| Equipment sales | 216 |
| | 233 |
| | (7 | )% | | 441 |
| | 450 |
| | (2 | )% | 220 |
| | 216 |
| | 2 | % | | 422 |
| | 441 |
| | (4 | )% |
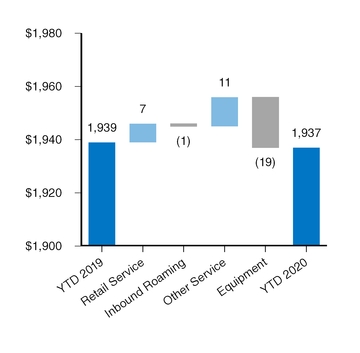
| Total operating revenues | 973 |
| | 974 |
| | – |
| | 1,939 |
| | 1,915 |
| | 1 | % | 973 |
| | 973 |
| | – |
| | 1,937 |
| | 1,939 |
| | – |
|
| | | | | | | | | | | | | | | | | | | | | | | |
| System operations (excluding Depreciation, amortization and accretion reported below) | 193 |
| | 187 |
| | 3 | % | | 369 |
| | 365 |
| | 1 | % | 197 |
| | 193 |
| | 2 | % | | 377 |
| | 369 |
| | 2 | % |
| Cost of equipment sold | 224 |
| | 240 |
| | (6 | )% | | 458 |
| | 459 |
| | – |
| 218 |
| | 224 |
| | (3 | )% | | 435 |
| | 458 |
| | (5 | )% |
| Selling, general and administrative | 344 |
| | 342 |
| | 1 | % | | 669 |
| | 668 |
| | – |
| 323 |
| | 344 |
| | (6 | )% | | 659 |
| | 669 |
| | (2 | )% |
| Depreciation, amortization and accretion | 177 |
| | 159 |
| | 11 | % | | 345 |
| | 317 |
| | 8 | % | 178 |
| | 177 |
| | 1 | % | | 354 |
| | 345 |
| | 3 | % |
| (Gain) loss on asset disposals, net | 5 |
| | 1 |
| | N/M |
| | 7 |
| | 2 |
| | N/M |
| 4 |
| | 5 |
| | (19 | )% | | 8 |
| | 7 |
| | 7 | % |
| (Gain) loss on sale of business and other exit costs, net | — |
| | — |
| | N/M |
| | (2 | ) | | — |
| | N/M |
| — |
| | — |
| | N/M |
| | — |
| | (2 | ) | | N/M |
|
| (Gain) loss on license sales and exchanges, net | — |
| | (11 | ) | | N/M |
| | (2 | ) | | (17 | ) | | 88 | % | — |
| | — |
| | N/M |
| | — |
| | (2 | ) | | N/M |
|
| Total operating expenses | 943 |
| | 918 |
| | 3 | % | | 1,844 |
| | 1,794 |
| | 3 | % | 920 |
| | 943 |
| | (2 | )% | | 1,833 |
| | 1,844 |
| | (1 | )% |
| | | | | | | | | | | | | | | | | | | | | | | |
| Operating income | $ | 30 |
| | $ | 56 |
| | (45 | )% | | $ | 95 |
| | $ | 121 |
| | (21 | )% | $ | 53 |
| | $ | 30 |
| | 74 | % | | $ | 104 |
| | $ | 95 |
| | 9 | % |
| | | | | | | | | | | | | | | | | | | | | | | |
| Net income | $ | 32 |
| | $ | 52 |
| | (38 | )% | | $ | 90 |
| | $ | 107 |
| | (15 | )% | $ | 69 |
| | $ | 32 |
| | N/M |
| | $ | 141 |
| | $ | 90 |
| | 56 | % |
Adjusted OIBDA (Non-GAAP)1 | $ | 212 |
| | $ | 205 |
| | 4 | % | | $ | 443 |
| | $ | 423 |
| | 5 | % | $ | 235 |
| | $ | 212 |
| | 11 | % | | $ | 466 |
| | $ | 443 |
| | 5 | % |
Adjusted EBITDA (Non-GAAP)1 | $ | 257 |
| | $ | 248 |
| | 3 | % | | $ | 537 |
| | $ | 507 |
| | 6 | % | $ | 280 |
| | $ | 257 |
| | 9 | % | | $ | 560 |
| | $ | 537 |
| | 4 | % |
| Capital expenditures | $ | 195 |
| | $ | 86 |
| | N/M |
| | $ | 297 |
| | $ | 155 |
| | 91 | % | |
Capital expenditures2 | | $ | 168 |
| | $ | 195 |
| | (14 | )% | | $ | 405 |
| | $ | 297 |
| | 36 | % |
N/M - Percentage change not meaningful
| |
1 | Refer to Supplemental Information Relating to Non-GAAP Financial Measures within this MD&A for a reconciliation of this measure. |
| |
2 | Refer to Liquidity and Capital Resources within this MD&A for additional information on Capital expenditures. |
Operating Revenues
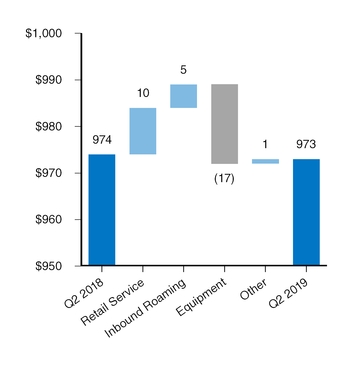
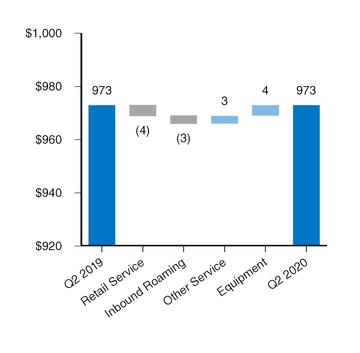
Three Months Ended June 30, 20192020 and 20182019
(Dollars in millions)
Operating Revenues
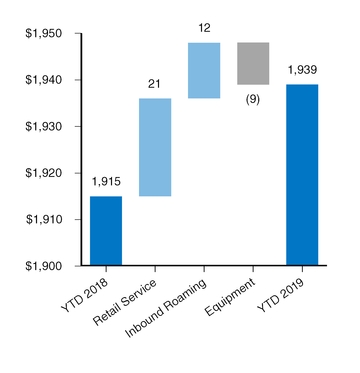
Six Months Ended June 30, 20192020 and 20182019
(Dollars in millions)
Service revenues consist of:
| |
| ▪ | Retail Service - Charges for access, airtime,voice, data and value-added services and recovery of regulatory costs and value added services, including data services and products |
| |
| ▪ | Inbound Roaming - Charges to other wireless carriers whose customers use U.S. Cellular’s wireless systems when roaming |
| |
| ▪ | Other Service - Amounts received from the Federal USF, tower rental revenues, and miscellaneous other service revenues |
Equipment revenues consist of:
| |
| ▪ | Sales of wireless devices and related accessories to new and existing customers, agents, and third-party distributors |
Key components of changes in the statement of operations line items were as follows:
Total operating revenues
Retail service revenues increaseddecreased for the three andmonths ended June 30, 2020, primarily as a result of a decline in the average number of subscribers compared to the second quarter of 2019, partially offset by the increase in Postpaid ARPU as previously discussed in the Operational Overview section. Retail service revenues increased for the six months ended June 30, 2019,2020, primarily as a result of the increase in Postpaid ARPU, which was previously discussedpartially offset by a decline in the Operational Overview section.subscribers.
Inbound roaming revenues decreased for the three and six months ended June 30, 2020, primarily driven by lower data revenues, with lower rates partially offset by higher usage.
Other service revenues increased for the three and six months ended June 30, 2019,2020, largely due to an increase in tower rental revenues.
Equipment sales revenues increased for the three months ended June 30, 2020, due primarily driven by higher data usage,to an increase in device sales volumes. This was partially offset by lower rates.
average revenue per device and a decrease in accessory sales. Equipment sales revenues decreased for the three and six months ended June 30, 2019,2020, due primarily to lower average revenue per device and a decrease in the number of devices sold,accessory sales, partially offset by an increase in the average revenue per device sold.sales volumes.
System operations expenses
System operations expenses increased for the three and six months ended June 30, 2019,2020, due to (i) higher maintenance andincreases in cell site rent expenses as U.S. Cellular continuesexpense, non-capitalizable costs to add network capacity, and enhance quality and (ii) an increasecosts to decommission network assets. Such factors were partially offset by a decrease in roaming expense as a result of lower data rates, partially offset by higher data roaming usage, partially offset by lower rates. Such factors were offset by lower customer usage expenses driven primarily by decreased circuit costs.usage.
Cost of equipment sold
Cost of equipment sold decreased for the three and six months ended June 30, 2019,2020, due primarily to decrease in the number of devices sold, partially offset by a higher(i) lower average cost per device, (ii) a shift in mix from new device sales to used device sales, (iii) a decrease in accessory sales and (iv) a decrease in charges recorded to reduce inventory to its net realizable value. These decreases were partially offset by an increase in volume of devices sold.
Selling, general and administrative expenses
Selling, general and administrative expenses decreased for the three and six months ended June 30, 2020, driven primarily by decreases in bad debts expense, advertising expense and employee related expense.
Depreciation, amortization and accretion
Depreciation, amortization, and accretion increased for the three and six months ended June 30, 2019,2020, due to (i) additional network assets being placed into service and (ii) accelerated depreciation of certain assets due to changes in network technology, which will continue throughout the remainder of 20192020 and beyond.
Business Overview
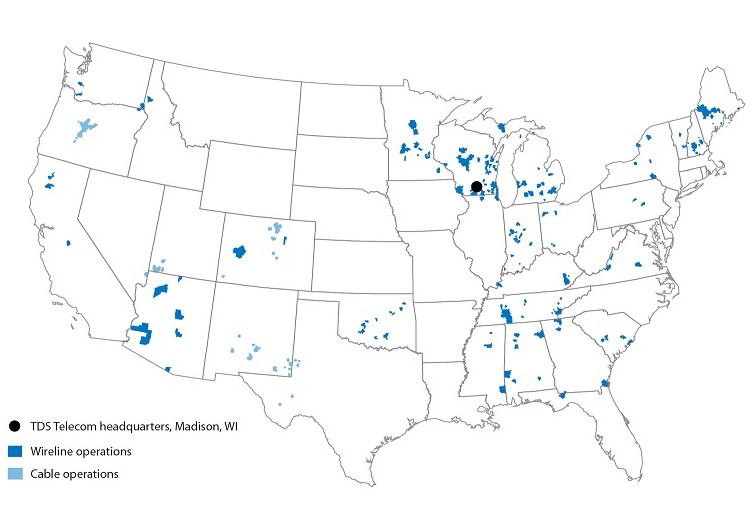
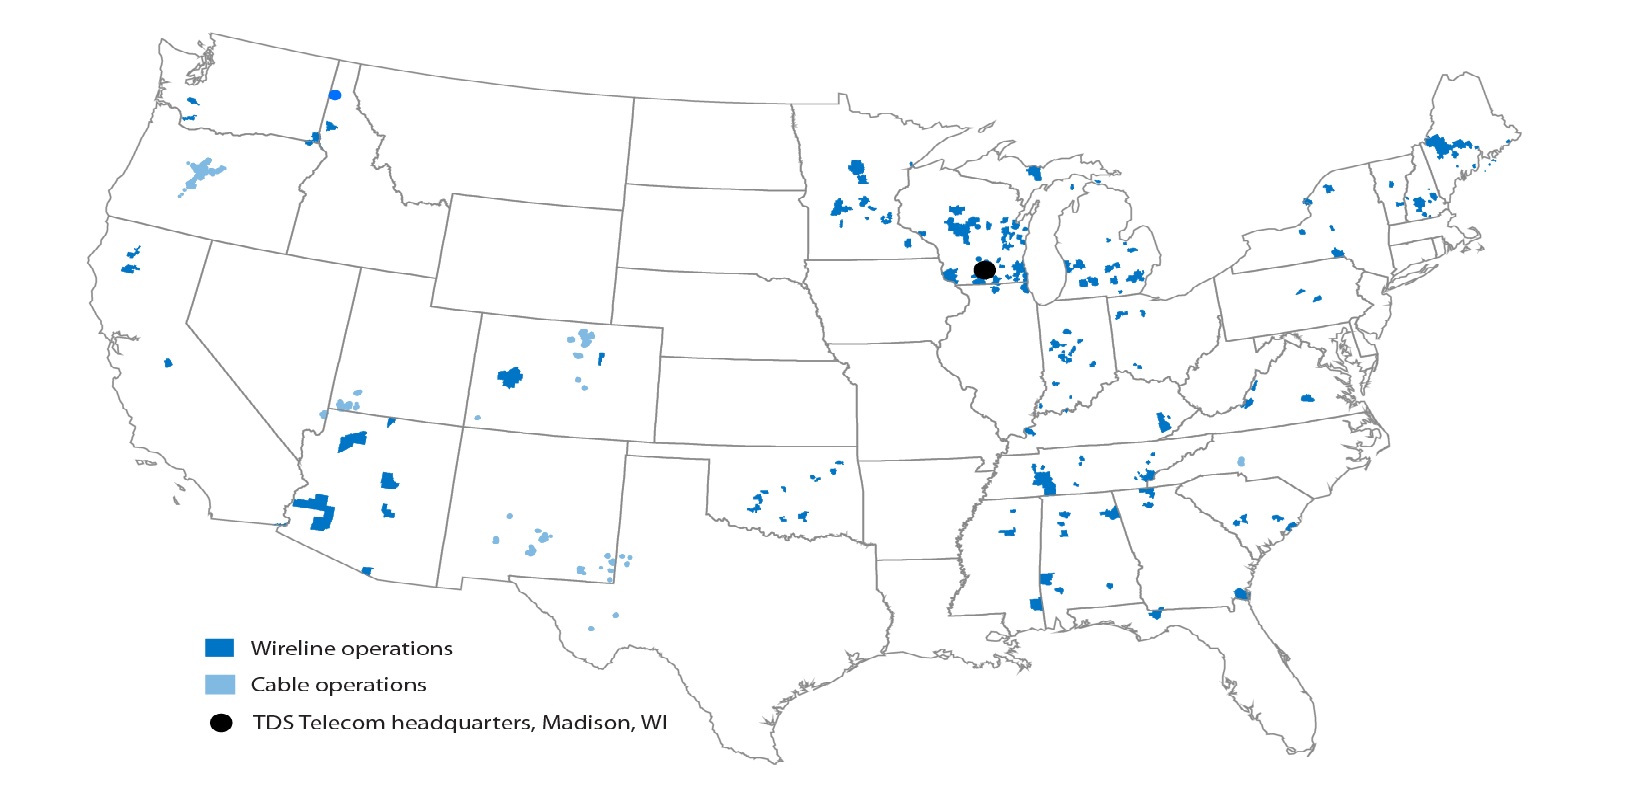
TDS Telecom operates in two segments: Wireline and Cable. TDS Telecom’s business objective is to provideprovides a wide range of communications services to both residential and commercial customers. TDS Telecom operates in two segments: Wireline, which includes fiber deployments into new markets, and Cable.
On December 31, 2019, TDS acquired substantially all of the assets of MI Connection Communications System, dba Continuum. Continuum is a cable company that passes approximately 40,000 service addresses in North Carolina and offers broadband, video and voice services, which complement the TDS Telecom portfolio of products.
COVID-19 considerations
COVID-19 impacts on TDS Telecom's business for the six months ended June 30, 2020 include a reduction in service revenues and reduced churn. The future impacts of COVID-19 are uncertain due to many factors and could be material to TDS Telecom's results of operations, cash flows and financial position. Certain impacts on and actions by TDS Telecom related to COVID-19 include, but are not limited to, the following:
Taking action to keep employees safe, including implementing a work-from-home policy for employees whose jobs can be performed remotely. In addition, to keep employees, customers, and communities safe, TDS Telecom closed certain retail stores and temporarily ceased door-to-door selling. Retail stores that remain open have implemented social distancing and enhanced cleaning measures. In addition, TDS Telecom has expanded safety protocols for front line workers, including the direct salesforce as they returned to door-to-door selling in the second quarter. Throughout this period of change, TDS Telecom has continued serving its customers and ensuring its network remains fully operational.
Supporting the communities in which TDS Telecom operates. TDS Telecom has donated to food pantries that serve its regional areas. Food banks across the country are seeing huge increases in demand as a result of the COVID-19 pandemic and TDS Telecom is helping those organizations serving those in need.
Participated in the FCC Keep Americans Connected Pledge, through June 30, 2020, to not turn-off service or charge late fees due to a customer's inability to pay their bill due to circumstances related to COVID-19. This resulted in reduced service revenues in the six months ended June 30, 2020. In addition, TDS Telecom is complying with certain states that have extended no-disconnect orders past the expiration of the FCC Pledge. These actions may result in negative impacts to TDS Telecom's future financial results.
Offered 60 days of free broadband service to new customers who are low-income and/or families with children or college age students. This could increase both revenues and bad debts expense in the future after the 60-day free service period expires in June 2020, depending on the intent of customers taking the free service. A total of 2,700 customers signed up for the free service. Early indications suggest the majority of customers are prioritizing their services and making arrangements to stay connected.
Recognizing income tax benefits associated with the enactment of the CARES Act. This legislation resulted in a reduction to income tax expense for the three and six months ended June 30, 2020. The CARES Act is also projected to result in a reduction of income tax expense recognized throughout the 2020 tax year as part of the estimated annual effective tax rate, and a cash refund of taxes paid in prior years.
Tracking increased customer demand for broadband and voice services. The demand may fluctuate depending on the severity and duration of the pandemic. At this time, TDS Telecom's network capacity has been sufficient for increased usage.
Increasing online sales and marketing activities as door-to-door sales activity in new out-of-territory markets has been considerably impacted. A significant reduction in pre-sales activity could result in a slowing of construction activity.
Monitoring its supply chain to assess impacts to availability of network equipment. At this time, TDS Telecom expects to be able to meet customer demand for on-premise equipment, and to maintain its expected investment levels in fiber and other broadband deployments.
Monitoring the dependency on third parties to continue work on out-of-territory market construction. Various state municipal and vendor restrictions related to COVID-19 could cause delays in municipal permitting, power company aerial make-ready work, and other contractor work that could slow down construction plans.
OPERATIONS
| |
| ▪ | Provides broadband, video and voice services toServes 1.2 million connections in 3132 states.
|
| |
| ▪ | Employs approximately 2,8002,900 employees. |
| |
| ▪ | Wireline operates incumbent local exchange carriers (ILEC) and, competitive local exchange carriers (CLEC) and out-of-territory builds in 27 states. |
| |
| ▪ | Cable operates primarily in Colorado, New Mexico, North Carolina, Oregon, Texas Utah, and Oregon.Utah. |
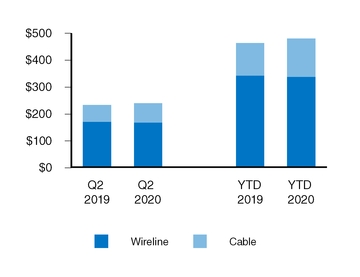
Financial Overview — TDS Telecom
| | | | Three Months Ended
June 30, | | Six Months Ended
June 30, | Three Months Ended
June 30, | | Six Months Ended
June 30, |
| | 2019 | | 2018 | | 2019 vs. 2018 | | 2019 | | 2018 | | 2019 vs. 2018 | 2020 | | 2019 | | 2020 vs. 2019 | | 2020 | | 2019 | | 2020 vs. 2019 |
| (Dollars in millions) | | | | | | | | | | | | | | | | | | | | | | |
| Operating revenues | | | | | | | | | | | | | | | | | | | | | | |
| Wireline | $ | 172 |
| | $ | 174 |
| | (1 | )% | | $ | 343 |
| | $ | 349 |
| | (2 | )% | $ | 169 |
| | $ | 172 |
| | (2 | )% | | $ | 339 |
| | $ | 343 |
| | (1 | )% |
| Cable | 62 |
| | 57 |
| | 9 | % | | 121 |
| | 112 |
| | 8 | % | 71 |
| | 62 |
| | 16 | % | | 142 |
| | 121 |
| | 17 | % |
TDS Telecom operating revenues1 | 233 |
| | 230 |
| | 1 | % | | 464 |
| | 461 |
| | 1 | % | 241 |
| | 233 |
| | 3 | % | | 481 |
| | 464 |
| | 4 | % |
| Operating expenses | | | | | | | | | | | | | | | | | | | | | | |
| Wireline | 145 |
| | 153 |
| | (5 | )% | | 282 |
| | 302 |
| | (7 | )% | 143 |
| | 145 |
| | (2 | )% | | 289 |
| | 282 |
| | 3 | % |
| Cable | 59 |
| | 59 |
| | – |
| | 117 |
| | 116 |
| | 1 | % | 67 |
| | 59 |
| | 13 | % | | 133 |
| | 117 |
| | 14 | % |
TDS Telecom operating expenses1 | 204 |
| | 212 |
| | (4 | )% | | 398 |
| | 417 |
| | (5 | )% | 210 |
| | 204 |
| | 3 | % | | 422 |
| | 398 |
| | 6 | % |
| | | | | | | | | | | | | | | | | | | | | | | |
| TDS Telecom operating income | $ | 29 |
| | $ | 18 |
| | 60 | % | | $ | 66 |
| | $ | 43 |
| | 52 | % | $ | 31 |
| | $ | 29 |
| | 6 | % | | $ | 59 |
| | $ | 66 |
| | (10 | )% |
| | | | | | | | | | | | | | | | | | | | | | | |
| Net income | $ | 25 |
| | $ | 16 |
| | 60 | % | | $ | 56 |
| | $ | 37 |
| | 52 | % | $ | 28 |
| | $ | 25 |
| | 10 | % | | $ | 56 |
| | $ | 56 |
| | – |
|
Adjusted OIBDA (Non-GAAP)2 | $ | 78 |
| | $ | 73 |
| | 8 | % | | $ | 159 |
| | $ | 152 |
| | 4 | % | $ | 82 |
| | $ | 78 |
| | 5 | % | | $ | 162 |
| | $ | 159 |
| | 2 | % |
Adjusted EBITDA (Non-GAAP)2 | $ | 82 |
| | $ | 75 |
| | 9 | % | | $ | 165 |
| | $ | 156 |
| | 6 | % | $ | 83 |
| | $ | 82 |
| | 2 | % | | $ | 165 |
| | $ | 165 |
| | – |
|
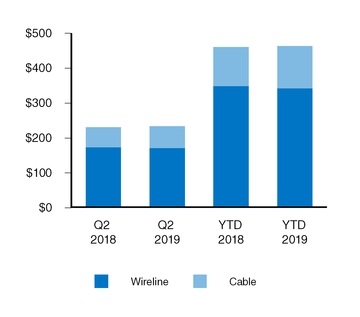
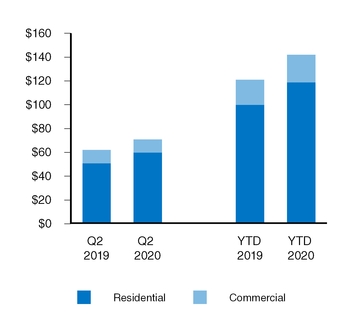
| Capital expenditures | $ | 70 |
| | $ | 46 |
| | 51 | % | | $ | 112 |
| | $ | 87 |
| | 30 | % | |
Capital expenditures3 | | $ | 75 |
| | $ | 70 |
| | 7 | % | | $ | 128 |
| | $ | 112 |
| | 15 | % |
Numbers may not foot due to rounding.
| |
1 | Includes eliminations between the Wireline and Cable segments. |
| |
2 | Refer to Supplemental Information Relating to Non-GAAP Financial Measures within this MD&A for a reconciliation of this measure. |
| |
3 | Refer to Liquidity and Capital Resources within this MD&A for additional information on Capital expenditures. |
Operating Revenues
(Dollars in millions)
Total operating revenues
Operating revenues increased for the three and six months ended June 30, 2019. Price increases,2020, due primarily to the acquisition of Continuum, Wireline and Cable and Wireline broadband growth and Wireline video connection growth and higher Wireline support revenue provided through the A-CAM program increased revenues.which were partially offset by declines in Wireline residential and commercial voice and otherCLEC commercial product revenues continued to decline.
Total operating expenses
Operating expenses decreasedincreased for the three and six months ended June 30, 2019,2020, due primarily to decreased employee-related expenses related to the addition of Continuum, increased plant maintenance and building expenses, as well as a gain on the sale of assets that was recorded in the first quarter.quarter of 2019.
Business Overview
TDS Telecom’s Wireline business provides broadband, video and voice services. These services are provided to residential, commercial, and wholesale customers in a mix of rural, small town and suburban markets, with the largest concentration of its customers in the Upper Midwest and the Southeast. TDS Telecom’s residential strategy is to offer its residential customersfocus on broadband bundled with video and voice services through value-added bundling.services. In its commercial business, TDS Telecom’s focus is on small- to medium-sized businesses and its sales efforts emphasize advanced IP-basedproviding broadband with voice and video collaboration services.
Operational Overview
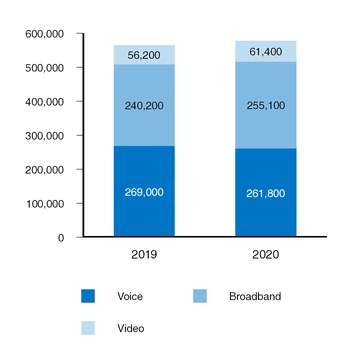
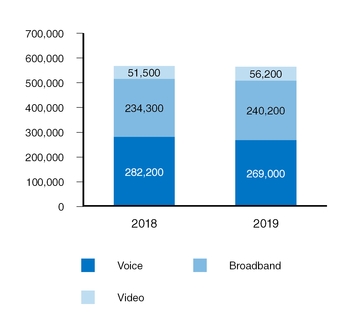
ILEC Residential Connections
As of June 30,
Total residential connections grew 2% as growth in broadband and video connections grew 6% and 9%, respectively, which was partially offset by the decline in voice connections of 3%. This does include 1,100 connections related to the 60-day free service period and lower voice and broadband disconnects related to the FCC Pledge. Non-pay defections are expected to increase in future periods as the FCC Pledge ended on June 30, 2020, and certain accounts that were part of the Pledge are expected to terminate due to non-payment.
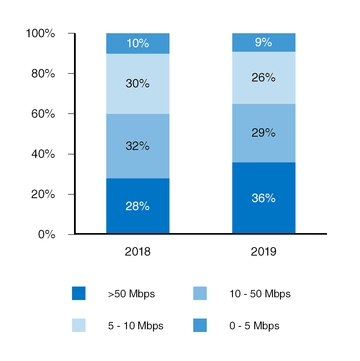
Residential Broadband
Connections by Speeds1
As of June 30,
Residential broadband customers are increasingly choosing higher speeds in ILEC markets with 65%70% choosing speeds of 10 Mbps or greater and 36%32% choosing speeds of 50100 Mbps or greater.
Wireline Residential Revenue per
Connection
Increases in broadband connections1Includes ILEC and speeds, and video connection growth drove increases in average residential revenue per connection.out-of-territory
Residential ConnectionsRevenue per Connection
As of
Residential revenue per connection increased 4% for the three and six months ended June 30,
Total residential connections were relatively flat 2020, due to video and broadband connection growth as declines in voice connections offset the growthwell as an increase in broadband speeds and video connections.price increases.
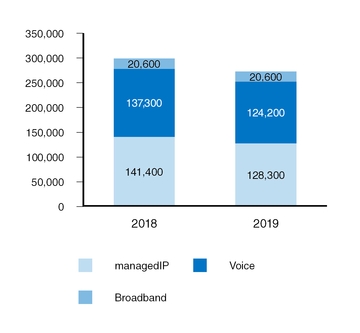
Commercial Connections
As of June 30,
Total commercial connections decreased by 9% due primarily to declines in connections in CLEC markets.
Financial Overview — Wireline
| | | | Three Months Ended
June 30, | | Six Months Ended
June 30, | Three Months Ended
June 30, | | Six Months Ended
June 30, |
| | 2019 | | 2018 | | 2019 vs. 2018 | | 2019 | | 2018 | | 2019 vs. 2018 | 2020 | | 2019 | | 2020 vs. 2019 | | 2020 | | 2019 | | 2020 vs. 2019 |
| (Dollars in millions) | | | | | | | | | | | | | | | | | | | | | | |
| Residential | $ | 81 |
| | $ | 80 |
| | 1 | % | | $ | 162 |
| | $ | 160 |
| | 1 | % | $ | 85 |
| | $ | 81 |
| | 6 | % | | $ | 170 |
| | $ | 162 |
| | 5 | % |
| Commercial | 42 |
| | 46 |
| | (8 | )% | | 86 |
| | 94 |
| | (9 | )% | 38 |
| | 42 |
| | (10 | )% | | 77 |
| | 86 |
| | (10 | )% |
| Wholesale | 49 |
| | 46 |
| | 5 | % | | 94 |
| | 94 |
| | 1 | % | 46 |
| | 49 |
| | (6 | )% | | 91 |
| | 94 |
| | (3 | )% |
| Service revenues | 172 |
| | 173 |
| | (1 | )% | | 342 |
| | 348 |
| | (2 | )% | 169 |
| | 172 |
| | (2 | )% | | 338 |
| | 342 |
| | (1 | )% |
| Equipment and product sales | — |
| | — |
| | (36 | )% | | 1 |
| | 1 |
| | (28 | )% | — |
| | — |
| | (48 | )% | | — |
| | 1 |
| | (45 | )% |
| Total operating revenues | 172 |
| | 174 |
| | (1 | )% | | 343 |
| | 349 |
| | (2 | )% | 169 |
| | 172 |
| | (2 | )% | | 339 |
| | 343 |
| | (1 | )% |
| | | | | | | | | | | | | | | | | | | | | | | |
| Cost of services (excluding Depreciation, amortization and accretion reported below) | 64 |
| | 67 |
| | (3 | )% | | 127 |
| | 131 |
| | (3 | )% | 63 |
| | 64 |
| | (3 | )% | | 128 |
| | 127 |
| | 1 | % |
| Cost of equipment and products | — |
| | — |
| | (44 | )% | | 1 |
| | 1 |
| | (33 | )% | — |
| | — |
| | (10 | )% | | — |
| | 1 |
| | (33 | )% |
| Selling, general and administrative | 49 |
| | 50 |
| | (1 | )% | | 96 |
| | 97 |
| | (1 | )% | 48 |
| | 49 |
| | (2 | )% | | 97 |
| | 96 |
| | 1 | % |
| Depreciation, amortization and accretion | 33 |
| | 36 |
| | (8 | )% | | 66 |
| | 72 |
| | (9 | )% | 32 |
| | 33 |
| | (3 | )% | | 64 |
| | 66 |
| | (4 | )% |
| (Gain) loss on asset disposals, net | (1 | ) | | 1 |
| | N/M |
| | (8 | ) | | 1 |
| | N/M |
| — |
| | (1 | ) | | N/M |
| | — |
| | (8 | ) | | N/M |
|
| Total operating expenses | 145 |
| | 153 |
| | (5 | )% | | 282 |
| | 302 |
| | (7 | )% | 143 |
| | 145 |
| | (2 | )% | | 289 |
| | 282 |
| | 3 | % |
| | | | | | | | | | | | | | | | | | | | | | | |
| Operating income | $ | 27 |
| | $ | 21 |
| | 29 | % | | $ | 61 |
| | $ | 47 |
| | 30 | % | $ | 27 |
| | $ | 27 |
| | (1 | )% | | $ | 50 |
| | $ | 61 |
| | (18 | )% |
| |
|
| |
|
| |
|
| |
|
| |
|
| |
|
|
|
| |
|
| |
|
| |
|
| |
|
| |
|
|
| Income before income taxes | $ | 30 |
| | $ | 24 |
| | 29 | % | | $ | 68 |
| | $ | 52 |
| | 31 | % | $ | 28 |
| | $ | 30 |
| | (7 | )% | | $ | 55 |
| | $ | 68 |
| | (20 | )% |
Adjusted OIBDA (Non-GAAP)1 | $ | 59 |
| | $ | 57 |
| | 3 | % | | $ | 119 |
| | $ | 120 |
| | (1 | )% | $ | 58 |
| | $ | 59 |
| | (1 | )% | | $ | 114 |
| | $ | 119 |
| | (5 | )% |
Adjusted EBITDA (Non-GAAP)1 | $ | 62 |
| | $ | 59 |
| | 4 | % | | $ | 125 |
| | $ | 124 |
| | – |
| $ | 59 |
| | $ | 62 |
| | (4 | )% | | $ | 116 |
| | $ | 125 |
| | (7 | )% |
| Capital expenditures | $ | 55 |
| | $ | 33 |
| | 64 | % | | $ | 84 |
| | $ | 62 |
| | 35 | % | |
Capital expenditures2 | | $ | 58 |
| | $ | 55 |
| | 6 | % | | $ | 97 |
| | $ | 84 |
| | 15 | % |
Numbers may not foot due to rounding.
N/M - Percentage change not meaningful
| |
1 | Refer to Supplemental Information Relating to Non-GAAP Financial Measures within this MD&A for a reconciliation of this measure. |
| |
2 | Refer to Liquidity and Capital Resources within this MD&A for additional information on Capital expenditures. |
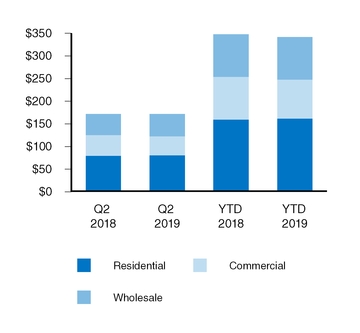
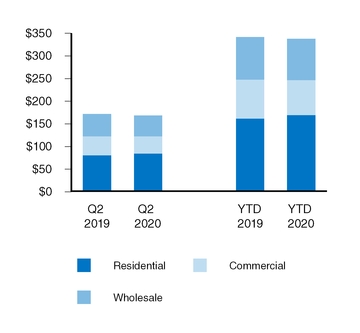
Operating Revenues
(Dollars in millions)
Residential revenues consist of:
| |
| ▪ | Broadband services, including fiber-basedfiber- and other digital, premiumcopper-based high-speed internet, security and enhanced datasupport services |
| |
| ▪ | Video services, including IPTV and satellite offerings |
Commercial revenues consist of:
| |
| ▪ | High-speed and dedicated business internet services |
Wholesale revenues consist of:
| |
| ▪ | Network access services primarily to interexchange and wireless carriers for carrying data and voice traffic on TDS Telecom’s network |
| |
| ▪ | Federal and state USF support, including A-CAM support |
Key components of changes in the statement of operations items were as follows:
Total operating revenues
Residential revenues increased for the three and six months ended June 30, 2019,2020, due primarily to growth in broadband and video and broadband connections, andas well as price increases, partially offset by declinesa decline in voice connections. Average video connections grew 9% while average voice connections declined 5%.
Commercial revenues decreased for the three and six months ended June 30, 2019,2020, due primarily to declining connections mostly in CLEC markets.
Wholesale revenues increaseddecreased for the three and six months ended June 30, 2019,2020, due primarily to increased A-CAM support payments including $2 million of additional support received indecreased access revenues. In the second quarter of which2019, an additional $1 million wasof retroactive funding from January 1, 2019 to March 31, 2019. The additional funding increased Wireline's broadband speed deployment obligations under the existing FCC A-CAM program.support payments were received.
Cost of services
Cost of services decreased for the three months ended June 30, 2020, due primarily to lower employee-related expenses and the capitalization of new modems, partially offset by increases in storm damage repair costs and higher video programming costs. Cost of services increased for the six months ended June 30, 2019,2020, due primarily to lower employee expensesincreases in storm damage repair costs and decreases in thehigher video programming costs, of purchasing unbundled network elements and provisioning circuits, partially offset by increasesa decrease in programming charges.expenses related to the capitalization of new modems. See depreciation, amortization and accretion section below for more details related to the capitalization of modems.
Selling, general and administrative
Selling, general and administrative expenses decreased for the three months ended June 30, 2020, due primarily to lower employee-related expenses. Selling, general and administrative expenses increased for the six months ended June 30, 2020, due primarily to increased advertising costs in the out-of-territory markets, partially offset by decreases in legal costs.
Depreciation, amortization and accretion
Depreciation, amortization and accretion decreased asfor the three and six months ended June 30, 2020, due primarily to certain assets becamebecoming fully depreciated.depreciated, partially offset by depreciation on new fiber assets.
Effective January 1, 2020, the cost of most modems, along with associated installation costs, is being capitalized. These costs, which are estimated to be $14 million for the full year of 2020, were previously expensed as a cost of service.
(Gain) loss on asset disposals, net
(Gain) lossGain on asset disposals net increaseddecreased for the six months ended June 30, 2019,2020, due to a gain related to the sale of fiber assets in certain CLEC markets during the first quarter.quarter of 2019.
Business Overview
TDS Telecom’s Cable strategy is to expand its broadband services and leverage that growth by bundling with video and voice services. TDS Telecom seeks to be the leading provider of broadband services in its targeted markets by leveraging its core competencies in network management and customer focus.
Operational Overview
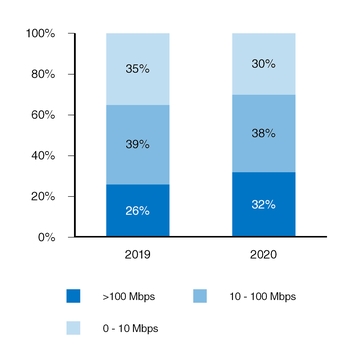
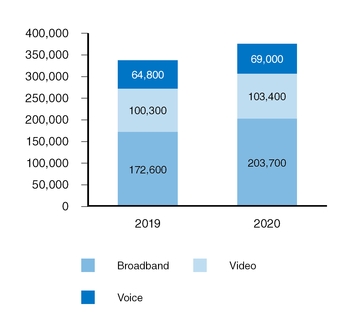
Cable Connections
As of June 30,
Cable connections grew 5%12% due primarily to an 8% increase in broadband connections.connections and the acquisition of Continuum, which included 15,800 broadband connections, 9,400 video connections and 5,800 voice connections as of December 31, 2019. The total includes 1,600 connections related to the 60-day free service period and lower voice and broadband disconnects related to the FCC Pledge.
Financial Overview — Cable
| | | | Three Months Ended
June 30, | | Six Months Ended
June 30, | Three Months Ended
June 30, | | Six Months Ended
June 30, |
| | 2019 | | 2018 | | 2019 vs. 2018 | | 2019 | | 2018 | | 2019 vs. 2018 | 2020 | | 2019 | | 2020 vs. 2019 | | 2020 | | 2019 | | 2020 vs. 2019 |
| (Dollars in millions) | | | | | | | | | | | | | | | | | | | | | | |
| Residential | $ | 51 |
| | $ | 47 |
| | 8 | % | | $ | 100 |
| | $ | 92 |
| | 8 | % | $ | 60 |
| | $ | 51 |
| | 19 | % | | $ | 119 |
| | $ | 100 |
| | 19 | % |
| Commercial | 11 |
| | 10 |
| | 9 | % | | 21 |
| | 20 |
| | 8 | % | 11 |
| | 11 |
| | 3 | % | | 23 |
| | 21 |
| | 7 | % |
| Total operating revenues | 62 |
| | 57 |
| | 9 | % | | 121 |
| | 112 |
| | 8 | % | 71 |
| | 62 |
| | 16 | % | | 142 |
| | 121 |
| | 17 | % |
| |
|
| |
|
| |
|
| |
|
| |
|
| |
|
|
|
| |
|
| |
|
| |
|
| |
|
| |
|
|
| Cost of services (excluding Depreciation, amortization and accretion reported below) | 27 |
| | 27 |
| | – |
| | 52 |
| | 52 |
| | – |
| 30 |
| | 27 |
| | 12 | % | | 60 |
| | 52 |
| | 14 | % |
| Selling, general and administrative | 15 |
| | 15 |
| | 5 | % | | 30 |
| | 28 |
| | 6 | % | 17 |
| | 15 |
| | 14 | % | | 34 |
| | 30 |
| | 15 | % |
| Depreciation, amortization and accretion | 17 |
| | 18 |
| | (4 | )% | | 34 |
| | 35 |
| | (3 | )% | 20 |
| | 17 |
| | 15 | % | | 39 |
| | 34 |
| | 15 | % |
| (Gain) loss on asset disposals, net | — |
| | — |
| | (54 | )% | | 1 |
| | 1 |
| | (4 | )% | — |
| | — |
| | 6 | % | | — |
| | 1 |
| | (62 | )% |
| Total operating expenses | 59 |
| | 59 |
| | – |
| | 117 |
| | 116 |
| | 1 | % | 67 |
| | 59 |
| | 13 | % | | 133 |
| | 117 |
| | 14 | % |
| |
|
| |
|
| |
|
| |
|
| |
|
| |
|
|
|
| |
|
| |
|
| |
|
| |
|
| |
|
|
| Operating income (loss) | $ | 2 |
| | $ | (3 | ) | | N/M |
| | $ | 5 |
| | $ | (4 | ) | | N/M |
| |
| Operating income | | $ | 4 |
| | $ | 2 |
| | 78 | % | | $ | 9 |
| | $ | 5 |
| | 90 | % |
| |
|
| |
|
| |
|
| |
|
| |
|
| |
|
|
|
| |
|
| |
|
| |
|
| |
|
| |
|
|
| Income (loss) before income taxes | $ | 3 |
| | $ | (2 | ) | | N/M |
| | $ | 6 |
| | $ | (4 | ) | | N/M |
| |
| Income before income taxes | | $ | 4 |
| | $ | 3 |
| | 54 | % | | $ | 10 |
| | $ | 6 |
| | 70 | % |
Adjusted OIBDA (Non-GAAP)1 | $ | 20 |
| | $ | 16 |
| | 27 | % | | $ | 39 |
| | $ | 32 |
| | 24 | % | $ | 24 |
| | $ | 20 |
| | 23 | % | | $ | 49 |
| | $ | 39 |
| | 23 | % |
Adjusted EBITDA (Non-GAAP)1 | $ | 20 |
| | $ | 16 |
| | 29 | % | | $ | 40 |
| | $ | 32 |
| | 26 | % | $ | 24 |
| | $ | 20 |
| | 20 | % | | $ | 49 |
| | $ | 40 |
| | 21 | % |
| Capital expenditures | $ | 15 |
| | $ | 13 |
| | 17 | % | | $ | 28 |
| | $ | 24 |
| | 16 | % | |
Capital expenditures2 | | $ | 17 |
| | $ | 15 |
| | 9 | % | | $ | 31 |
| | $ | 28 |
| | 12 | % |
Numbers may not foot due to rounding.
N/M - Percentage change not meaningful
| |
1 | Refer to Supplemental Information Relating to Non-GAAP Financial Measures within this MD&A for a reconciliation of this measure. |
| |
2 | Refer to Liquidity and Capital Resources within this MD&A for additional information on Capital expenditures. |
Operating Revenues
(Dollars in millions)
Residential and Commercial revenues consist of:
| |
| ▪ | Broadband services, including high-speed internet, security and support services |
| |
| ▪ | Video services, including premium programming in HD, multi-room and TV Everywhere offerings |
Key components of changes in the statement of operations items were as follows:
Total operating revenues
Residential and commercial revenues increased for the three and six months ended June 30, 2019,2020, due primarily to the acquisition of Continuum ($5 million and $11 million, respectively), as well as growth in broadband connections and price increases.
Cost of services
Cost of services increased for the three and six months ended June 30, 2020, due primarily to the acquisition of Continuum ($3 million and $6 million, respectively) and increases in employee-related and programming expense.
Selling, general and administrative
Selling, general and administrative expenses increased for the three and six months ended June 30, 2019,2020, due primarily to increasedthe acquisition of Continuum ($1 million for each period) and increases in employee-related expenses.
Depreciation, amortization and accretion
Depreciation, amortization and accretion increased for the three and six months ended June 30, 2020, due primarily to the acquisition of Continuum.
Liquidity and Capital Resources
Sources of Liquidity
TDS and its subsidiaries operate capital-intensive businesses. Historically, TDS has used internally-generated funds and also has obtained substantial funds from external sources for general corporate purposes. In the past, TDS’ existing cash and investment balances, funds available under its revolving credit and receivables securitization agreements, funds from other financing sources, including a term loanloans and other long-term debt, and cash flows from operating and certain investing and financing activities, including sales of assets or businesses, provided sufficient liquidity and financial flexibility for TDS to meet its normal day-to-day operating needs and debt service requirements, to finance the build-out and enhancement of markets and to fund acquisitions. There is no assurance that this will be the case in the future. See Market Risk for additional information regarding maturities of long-term debt.
Although TDS currently has a significant cash balance, TDS has incurred negative free cash flow at times in the past and this could occur in the future.future, and forecasting future cash flow is more challenging with the various risks and uncertainties related to COVID-19. However, TDS believes that existing cash and investment balances, funds available under its revolving credit, term loan and receivables securitization agreements, and expected cash flows from operating and investing activities will provide sufficient liquidity for TDS to meet its normal day-to-day operating needs and debt service requirements for the coming year. TDS will continue to monitor the rapidly changing business and market conditions and plans to take appropriate actions, as necessary, to meet its liquidity needs.
TDS may require substantial additional capital for, among other uses, funding day-to-day operating needs including working capital, acquisitions of providers of cable, wireless or wireline telecommunications services, IT services or other businesses, wireless spectrum license or system acquisitions, capital expenditures, debt service requirements, the repurchase of shares, the payment of dividends, or making additional investments. TDS, through U.S. Cellular, made payments related to wireless spectrum license auctions during 2019 (see Regulatory Matters - Millimeter Wave Spectrum Auctions),investments, including new technologies and expects capital expenditures in 2019 to be higher than in 2018, due primarily to investments at U.S. Cellular to enhance network speed and capacity and to deploy 5G technology, as well as increased levels of fiber investments at TDS Telecom.out-of-territory builds. It may be necessary from time to time to increase the size of the existing revolving credit agreements, to put in place new credit agreements, or to obtain other forms of financing in order to fund potential expenditures. TDS, through U.S. Cellular, made payments related to wireless spectrum auctions in 2020 (see Regulatory Matters - Spectrum Auctions). TDS also expects annual capital expenditures in 2020 to be higher than in 2019, due primarily to investments at U.S. Cellular to enhance network speed and capacity and to continue deploying VoLTE and 5G technology in its network, and at TDS Telecom to increase levels of fiber investment. TDS’ liquidity would be adversely affected if, among other things, TDS is unable to obtain short- or long-term financing on acceptable terms, TDS makes significant wireless spectrum license purchases, TDS makes significant business acquisitions, the LA Partnership discontinuesdistributions from unconsolidated entities are discontinued or significantly reduces distributionsreduced compared to historical levels, or Federal USF and/or other regulatory support payments decline.
TDS’ credit rating currently is sub-investment grade. There can be no assurance that sufficient funds will continue to be available to TDS or its subsidiaries on terms or at prices acceptable to TDS. Insufficient cash flows from operating activities, changes in TDS' credit ratings, defaults of the terms of debt or credit agreements, uncertainty of access to capital, deterioration in the capital markets, reduced regulatory capital at banks which in turn limits their ability to borrow and lend, other changes in the performance of TDS or in market conditions or other factors could limit or restrict the availability of financing on terms and prices acceptable to TDS, which could require TDS to reduce its acquisition, capital expenditure and business development programs, reduce the acquisition of wireless spectrum licenses, and/or reduce or cease share repurchases and/or the payment of dividends. Any of the foregoing developments would have an adverse impact on TDS' businesses, financial condition or results of operations. TDS cannot provide assurance that circumstances that could have a material adverse effect on its liquidity or capital resources will not occur.
Cash and Cash Equivalents
Cash and cash equivalents include cash and money market investments. The primary objective of TDS’ Cash and cash equivalents investment activities is to preserve principal. Cash held by U.S. Cellular is for use in its operational needsoperations and acquisition, capital expenditure and business development programs.programs including the purchase of wireless spectrum licenses. TDS does not have direct access to U.S. Cellular cash unless U.S. Cellular pays a dividend on its common stock. U.S. Cellular has no current intention to pay a dividend to its shareholders.
Cash and Cash Equivalents
(Dollars in millions)
At June 30, 2019,2020, TDS' consolidated Cash and cash equivalents totaled $834$565 million compared to $921$465 million at December 31, 2018.2019.
The majority of TDS’ Cash and cash equivalents isare held in bank deposit accounts and in money market funds that purchase only debt issued by the U.S. Treasury or U.S. government agencies across a range of eligible money market investments that may include, but are not limited to, government agency repurchase agreements, government agency debt, U.S. Treasury repurchase agreements, U.S. Treasury debt, and other securities collateralized by U.S. government obligations. TDS monitors the financial viability of the money market funds and the financial institutions with which TDS has deposits and believes that the credit risk associated with these is low.agencies.
Financing
In March 2020, TDS entered into a new $400 million unsecured revolving credit agreement with certain lenders and other parties and U.S. Cellular haveentered into a new $300 million unsecured revolving credit agreements available for general corporate purposes including acquisitions, wireless spectrum license purchasesagreement with certain lenders and capital expenditures. Theseother parties. Amounts under the new revolving credit agreements maturemay be borrowed, repaid and reborrowed from time to time until maturity in March 2025. As a result of the new agreements, TDS' and U.S. Cellular's previous revolving credit agreements due to expire in May 2023.2023 were terminated. As of June 30, 2019,2020, there were no outstanding borrowings under the revolving credit agreements, except for letters of credit, and TDS’ and U.S. Cellular’s unused capacity under their revolving credit agreements was $400$399 million and $298 million, respectively.
In March 2019,2020, TDS and U.S. Cellular amended itstheir senior term loan credit agreementagreements in order to reduceconform the interest rate.agreements with their revolving credit agreements. There were no changes to the maturity date and no significant changes to other key terms of the senior term loan credit agreements. In March 2020, TDS borrowed $50 million under its senior term loan credit agreement. In June 2020, U.S. Cellular amended and restated its senior term loan agreement and increased its borrowing capacity to $300 million. There were no significant changes to other key terms of the U.S. Cellular senior term loan credit agreement.
U.S. Cellular, through its subsidiaries, also has a receivables securitization agreement to permit securitized borrowings using its equipment installment plan receivables. In April 2020, U.S. Cellular borrowed $125 million under its receivables securitization agreement. The unused capacity under this agreement was $75 million as of June 30, 2020, subject to sufficient collateral to satisfy the asset borrowing base provisions of the agreement.
TDS and U.S. Cellular believe they were in compliance with all of the financial covenants and requirements set forth in their revolving credit agreements, and the senior term loan credit agreements and receivables securitization agreement as of June 30, 2019.
U.S. Cellular, through its subsidiaries, also has a receivables securitization agreement to permit securitized borrowings for general corporate purposes using its equipment installment plan receivables. The unused capacity under this agreement was $200 million as of June 30, 2019, subject to sufficient collateral to satisfy the asset borrowing base provisions of the agreement. U.S. Cellular believes that it was in compliance with all of the financial covenants and requirements set forth in its receivables securitization agreement as of that date.2020.
TDS and U.S. Cellular have in place effective shelf registration statements on Form S-3 to issue senior or subordinated debt securities.
Long-term debt payments due for the remainder of 2019 and the next four years are $199 million, which represent 8% of the total gross long-term debt obligation at June 30, 2019.
Capital Expenditures
Capital expenditures (i.e., additions to property, plant and equipment and system development expenditures)expenditures; excludes wireless spectrum license additions), which include the effects of accruals and capitalized interest, for the six months ended June 30, 20192020 and 2018,2019, were as follows:
Capital Expenditures
(Dollars in millions)
U.S. Cellular’s capital expenditures for the six months ended June 30, 2020 and 2019, and 2018, were $297$405 million and $155$297 million, respectively.
Capital expenditures for the full year 20192020 are expected to be between $625$850 million and $725$950 million. These expenditures are expected to be used principally for the following purposes:
| |
| ▪ | Enhance and maintain U.S. Cellular's network coverage, including continuing to deploy VoLTE technology in certain markets and providing additional speed and capacity to accommodate increased data usage by current customers; |
| |
| ▪ | BeginContinue deploying 5G technology;technology in its network; and |
| |
| ▪ | Invest in information technology to support existing and new services and products. |
TDS Telecom’s capital expenditures for the six months ended June 30, 2020 and 2019, and 2018, were $112$128 million and $87$112 million, respectively.
Capital expenditures for the full year 20192020 are expected to be between $300 million and $350 million. These expenditures are expected to be used principally for the following purposes:
| |
| ▪ | Expand fiber deployment inside and outside of current footprint; |
| |
| ▪ | Maintain and enhance existing infrastructure including build-out requirements to meet state broadband and A-CAM programs; |
| |
| ▪ | Upgrade broadband capacity and speeds; |
| |
| ▪ | Support success-based spending to sustain IPTV,for broadband and Cablevideo growth; and |
| |
| ▪ | BuildDeploy TDS TV+, a cloud-based video platformplatform. |
TDS intends to finance its capital expenditures for 20192020 using primarily Cash flows from operating activities, existing cash balances and, if required, additional debt financing from its receivables securitization and/oragreement, senior term loan credit agreements, revolving credit agreements.agreements and/or other forms of financing.
Acquisitions, Divestitures and Exchanges
TDS may be engaged from time to time in negotiations (subject to all applicable regulations) relating to the acquisition, divestiture or exchange of companies, properties, wireless spectrum licenses (including pursuant to FCC auctions) and other possible businesses. In general, TDS may not disclose such transactions until there is a definitive agreement. TDS assesses its business interests on an ongoing basis with a goal of improving the competitiveness of its operations and its long-term return on capital. As part of this strategy, TDS reviews attractive opportunities to acquire additional wireless operating markets and wireless spectrum licenses, including pursuant to FCC auctions; and telecommunications, cable or other possible businesses. TDS also may seek to divest outright or include in exchanges for other interests those interests that are not strategic to its long-term success.
In June 2019,March 2020, the FCC announced by way of public notice that U.S. Cellular was the provisional winning bidder for 408237 wireless spectrum licenses in its 28the 37, 39 and 47 GHz auctionbands (Auction 101) and 282 wireless spectrum licenses in its 24 GHz auction (Auction 102)103) for an aggregate purchase price of $256$146 million. U.S. Cellular paid $24 million of this amount in the three months ended March 31, 2020 and substantially all of the $256 millionremainder in April 2020. In June 2020, the first half of 2019. The wireless spectrum licenses are expected to befrom Auction 103 were granted by the FCC during 2019.FCC.
Variable Interest Entities
TDS consolidates certain “variable interest entities” as defined under GAAP. See Note 910 — Variable Interest Entities in the Notes to Consolidated Financial Statements for additional information related to these variable interest entities. TDS may elect to make additional capital contributions and/or advances to these variable interest entities in future periods in order to fund their operations.
Common Share Repurchase Programs
TDS and U.S. Cellular have repurchased their Common Shares and U.S. Cellular expects to continue to repurchase its Common Shares, subject to any available repurchase program. However, there were no share repurchases made under these programs inDuring the six months ended June 30, 2019, or in the year ended December 31, 2018.
2020, TDS repurchased 879,409 Common Shares for $14 million at an average cost per share of $15.53. As of June 30, 2019,2020, the maximum dollar value of TDS Common Shares that may yet be purchasedrepurchased under TDS’ program was $199$185 million. For additional information related to the current TDS repurchase authorization, see Unregistered Sales of Equity Securities and Use of Proceeds.
During the six months ended June 30, 2020, U.S. Cellular also has arepurchased 803,836 Common Shares for $23 million at an average cost per share repurchase authorization.of $29.00. As of June 30, 2019,2020, the total cumulative amount of U.S. Cellular Common Shares authorized to be purchasedrepurchased is 5,901,000.4,507,000.
Contractual and Other Obligations
There were no material changes outside the ordinary course of business between December 31, 20182019 and June 30, 2019,2020, to the Contractual and Other Obligations disclosed in Management’s Discussion and Analysis of Financial Condition and Results of OperationsMD&A included in TDS’ Form 10-K for the year ended December 31, 2018.2019. In March 2020, TDS borrowed $50 million under its senior term loan credit agreement. In April 2020, U.S. Cellular borrowed $125 million under its receivables securitization agreement.
Off-Balance Sheet Arrangements
TDS had no transactions, agreements or other contractual arrangements with unconsolidated entities involving “off-balance sheet arrangements,” as defined by SEC rules, that had or are reasonably likely to have a material current or future effect on its financial condition, results of operations, liquidity, capital expenditures or capital resources.
Consolidated Cash Flow Analysis
TDS operates a capital- and marketing-intensivecapital-intensive business. TDS makes substantial investments to acquire wireless spectrum licenses and properties and to construct and upgrade communications networks and facilities as a basis for creating long-term value for shareholders. In recent years, rapid changes in technology and new opportunities have required substantial investments in potentially revenue‑enhancing and cost-saving upgrades to TDS’ networks. TDS utilizes cash on hand, cash from operating activities, cash proceeds from divestitures and dispositions of investments, and short-term and long-term debt financing to fund its acquisitions (including wireless spectrum licenses), construction costs, operating expenses and share repurchases. Cash flows may fluctuate from quarter to quarter and year to year due to seasonality, the timing of acquisitions and divestitures, capital expenditures and other factors. The following discussion summarizes TDS' cash flow activities for the six months ended June 30, 20192020 and 2018.2019.
2020 Commentary
TDS’ Cash, cash equivalents and restricted cash increased $112 million. Net cash provided by operating activities was $806 million due to net income of $161 million adjusted for non-cash items of $612 million and distributions received from unconsolidated entities of $91 million, including $43 million in distributions from the LA Partnership. This was offset by changes in working capital items which decreased net cash by $58 million. The working capital changes were primarily influenced by tax impacts from the CARES Act and annual employee bonus payments, partially offset by the timing of vendor payments and collections of customer and agent receivables.
Cash flows used for investing activities were $769 million. Cash paid for additions to property, plant and equipment totaled $610 million. Cash payments for wireless spectrum license acquisitions were $144 million.
Cash flows provided by financing activities were $75 million, due primarily to cash received from the U.S. Cellular receivables securitization agreement and TDS term loan borrowing, partially offset by the repurchase of TDS and U.S. Cellular Common Shares and the payment of dividends.
2019 Commentary
TDS’ Cash, cash equivalents and restricted cash decreased $86 million. Net cash provided by operating activities was $592 million due to net income of $109 million plus non-cash items of $497 million and distributions received from unconsolidated entities of $76 million, including $33$33 million in distributions from the LA Partnership. This was offset by changes in working capital items which decreased net cash by $90 million. The primary working capital changes were a reduction in accrued compensation reflecting annual employee bonus payments and a decline in the amounts due to agents driven by lower sales volume.
Cash flows used for investing activities were $616 million. Cash paid for additions to property, plant and equipment totaled $393 million. Cash payments for wireless spectrum license acquisitions were $255 million.$255 million. These were partially offset by Cash received from divestitures and exchanges of $32 million.
Cash flows used for financing activities were $62 million, reflecting ordinary activity such as the payment of dividends and the scheduled repayments of debt.
2018 Commentary
TDS’ Cash, cash equivalents and restricted cash increased $255 million. Net cash provided by operating activities was $463 million due primarily to net income of $101 million plus non-cash items of $442 million and distributions received from unconsolidated entities of $70 million, including $33 million in distributions from the LA Partnership. This was partially offset by changes in working capital items which decreased net cash by $150 million. The working capital changes were primarily influenced by an increase in equipment installment plan receivables and the timing of annual employee bonus, vendor and tax payments, partially offset by collections of customer and agent receivables.
Cash flows used for investing activities were $161 million. Cash paid for additions to property, plant and equipment totaled $275 million. Cash paid for acquisitions and licenses was $10 million. This was partially offset by cash received from the redemption of short-term Treasury bills of $100 million and Cash received from divestitures and exchanges of $21 million.
Cash flows used for financing activities were $47 million, reflecting ordinary activity such as the payment of dividends and the scheduled repayments of debt.
Consolidated Balance Sheet Analysis
The following discussion addresses certain captions in the consolidated balance sheet and changes therein. This discussion is intended to highlight the significant changes and is not intended to fully reconcile the changes. Changes in financial condition during 20192020 were as follows:
Assets held for saleIncome taxes receivable
Assets held for sale decreased $54 million. Certain sale and exchange agreements that U.S. Cellular entered into in 2018 closed in the first quarter of 2019.
Licenses
LicensesIncome taxes receivable increased $283$124 million due primarily to wireless spectrum license rights acquired through FCC auctions. See Note 6 — Intangible Assets in the Notes to Consolidated Financial Statements for additional information.
Operating lease right-of-use assets
Operating lease right-of-use assets increased $963 million duereflecting future tax refunds attributable to the adoptionexpected carryback of Accounting Standards Codification (ASC) 842. See Note 8 — Leases2020 net operating losses, as allowed under the CARES Act which was enacted in the Notes to Consolidated Financial Statements for additional information.March 2020.
Accrued compensation
Accrued compensation decreased $50$36 million due primarily to employee bonus payments in March 2019.2020.
Short-term operating lease liabilitiesDeferred income tax liability, net
Short-term operating lease liabilitiesDeferred income tax liability, net increased $112 million due to the adoption of ASC 842. See Note 8 — Leases in the Notes to Consolidated Financial Statements for additional information.
Other current liabilities
Other current liabilities decreased by $29$149 million due primarily to a declinefull deductibility for tax purposes of qualified property placed in service during the amounts due to agents driven by lower sales volume.
Long-term operating lease liabilities
Long-term operating lease liabilities increased $927 million due to the adoption of ASC 842. See Note 8 — Leases in the Notes to Consolidated Financial Statements for additional information.
Other deferred liabilities and credits
Other deferred liabilities and credits decreased $91 million due primarily to the adoption of ASC 842. See Note 8 — Leases in the Notes to Consolidated Financial Statements for additional information.current year.
Supplemental Information Relating to Non-GAAP Financial Measures
TDS sometimes uses information derived from consolidated financial information but not presented in its financial statements prepared in accordance with U.S. GAAP to evaluate the performance of its business. Specifically, TDS has referred to the following measures in this Form 10-Q Report:
Certain of these measures are considered “non-GAAP financial measures” under U.S. Securities and Exchange Commission Rules. Following are explanations of each of these measures.
EBITDA, Adjusted EBITDA and Adjusted OIBDA
EBITDA, Adjusted EBITDA and Adjusted OIBDA are defined as net income adjusted for the items set forth in the reconciliation below. EBITDA, Adjusted EBITDA and Adjusted OIBDA are not measures of financial performance under GAAP and should not be considered as alternatives to Net income or Cash flows from operating activities, as indicators of cash flows or as measures of liquidity. TDS does not intend to imply that any such items set forth in the reconciliation below are non-recurring, infrequent or unusual; such items may occur in the future.
Adjusted EBITDA is a segment measure reported to the chief operating decision maker for purposes of making decisions about allocating resources to the segments and assessing their performance. See Note 1112 — Business Segment Information in the Notes to Consolidated Financial Statements for additional information.
Management uses Adjusted EBITDA and Adjusted OIBDA as measurements of profitability, and therefore reconciliations to applicable GAAP income measures are deemed appropriate. Management believes Adjusted EBITDA and Adjusted OIBDA are useful measures of TDS’ operating results before significant recurring non-cash charges, gains and losses, and other items as presented below as they provide additional relevant and useful information to investors and other users of TDS’ financial data in evaluating the effectiveness of its operations and underlying business trends in a manner that is consistent with management’s evaluation of business performance. Adjusted EBITDA shows adjusted earnings before interest, taxes, depreciation, amortization and accretion, and gains and losses, while Adjusted OIBDA reduces this measure further to exclude Equity in earnings of unconsolidated entities and Interest and dividend income in order to more effectively show the performance of operating activities excluding investment activities. The following tables reconcile EBITDA, Adjusted EBITDA and Adjusted OIBDA to the corresponding GAAP measures, Net income or Income (loss) before income taxes and Operating income (loss).income. Income tax expense is not provided at the individual segment level for Wireline and Cable. TDS calculates income tax expense (benefit) for TDS Telecom in total.
| | | | Three Months Ended
June 30, | | Six Months Ended
June 30, | Three Months Ended
June 30, | | Six Months Ended
June 30, |
| TDS - CONSOLIDATED | 2019 | | 2018 | | 2019 | | 2018 | 2020 | | 2019 | | 2020 | | 2019 |
| (Dollars in millions) | | | | | | | | | | | | | | |
| Net income (GAAP) | $ | 39 |
| | $ | 44 |
| | $ | 109 |
| | $ | 101 |
| $ | 78 |
| | $ | 39 |
| | $ | 161 |
| | $ | 109 |
|
| Add back: |
|
| |
|
| |
|
| |
|
|
|
| |
|
| |
|
| |
|
|
| Income tax expense | 16 |
| | 21 |
| | 50 |
| | 45 |
| 8 |
| | 16 |
| | 12 |
| | 50 |
|
| Interest expense | 43 |
| | 43 |
| | 86 |
| | 86 |
| 38 |
| | 43 |
| | 75 |
| | 86 |
|
| Depreciation, amortization and accretion | 234 |
| | 220 |
| | 460 |
| | 441 |
| 236 |
| | 234 |
| | 470 |
| | 460 |
|
| EBITDA (Non-GAAP) | 332 |
| | 328 |
| | 705 |
| | 673 |
| 360 |
| | 332 |
| | 718 |
| | 705 |
|
| Add back or deduct: |
|
| |
|
| |
|
| |
|
|
|
| |
|
| |
|
| |
|
|
| (Gain) loss on asset disposals, net | 5 |
| | 2 |
| | — |
| | 3 |
| 4 |
| | 5 |
| | 8 |
| | — |
|
| (Gain) loss on sale of business and other exit costs, net | — |
| | — |
| | (2 | ) | | — |
| — |
| | — |
| | — |
| | (2 | ) |
| (Gain) loss on license sales and exchanges, net | — |
| | (11 | ) | | (2 | ) | | (17 | ) | — |
| | — |
| | — |
| | (2 | ) |
| Adjusted EBITDA (Non-GAAP) | 337 |
| | 319 |
| | 701 |
| | 659 |
| 364 |
| | 337 |
| | 726 |
| | 701 |
|
| Deduct: |
|
| |
|
| |
|
| |
|
|
|
| |
|
| |
|
| |
|
|
| Equity in earnings of unconsolidated entities | 41 |
| | 40 |
| | 85 |
| | 78 |
| 44 |
| | 41 |
| | 90 |
| | 85 |
|
| Interest and dividend income | 9 |
| | 6 |
| | 17 |
| | 11 |
| 2 |
| | 9 |
| | 8 |
| | 17 |
|
| Other, net | — |
| | 1 |
| | 1 |
| | 2 |
| — |
| | — |
| | (1 | ) | | 1 |
|
| Adjusted OIBDA (Non-GAAP) | 287 |
| | 272 |
| | 598 |
| | 568 |
| 318 |
| | 287 |
| | 629 |
| | 598 |
|
| Deduct: |
|
| |
|
| |
|
| |
|
|
|
| |
|
| |
|
| |
|
|
| Depreciation, amortization and accretion | 234 |
| | 220 |
| | 460 |
| | 441 |
| 236 |
| | 234 |
| | 470 |
| | 460 |
|
| (Gain) loss on asset disposals, net | 5 |
| | 2 |
| | — |
| | 3 |
| 4 |
| | 5 |
| | 8 |
| | — |
|
| (Gain) loss on sale of business and other exit costs, net | — |
| | — |
| | (2 | ) | | — |
| — |
| | — |
| | — |
| | (2 | ) |
| (Gain) loss on license sales and exchanges, net | — |
| | (11 | ) | | (2 | ) | | (17 | ) | — |
| | — |
| | — |
| | (2 | ) |
| Operating income (GAAP) | $ | 48 |
| | $ | 61 |
| | $ | 142 |
| | $ | 141 |
| $ | 78 |
| | $ | 48 |
| | $ | 151 |
| | $ | 142 |
|
| | | | Three Months Ended
June 30, | | Six Months Ended
June 30, | Three Months Ended
June 30, | | Six Months Ended
June 30, |
| U.S. CELLULAR | 2019 | | 2018 | | 2019 | | 2018 | 2020 | | 2019 | | 2020 | | 2019 |
| (Dollars in millions) | | | | | | | | | | | | | | |
| Net income (GAAP) | $ | 32 |
| | $ | 52 |
| | $ | 90 |
| | $ | 107 |
| $ | 69 |
| | $ | 32 |
| | $ | 141 |
| | $ | 90 |
|
| Add back: |
|
| |
|
| |
|
| |
|
|
|
| |
|
| |
|
| |
|
|
| Income tax expense | 14 |
| | 18 |
| | 41 |
| | 40 |
| 4 |
| | 14 |
| | 8 |
| | 41 |
|
| Interest expense | 29 |
| | 29 |
| | 58 |
| | 58 |
| 25 |
| | 29 |
| | 49 |
| | 58 |
|
| Depreciation, amortization and accretion | 177 |
| | 159 |
| | 345 |
| | 317 |
| 178 |
| | 177 |
| | 354 |
| | 345 |
|
| EBITDA (Non-GAAP) | 252 |
| | 258 |
| | 534 |
| | 522 |
| 276 |
| | 252 |
| | 552 |
| | 534 |
|
| Add back or deduct: |
|
| |
|
| |
|
| |
|
|
|
| |
|
| |
|
| |
|
|
| (Gain) loss on asset disposals, net | 5 |
| | 1 |
| | 7 |
| | 2 |
| 4 |
| | 5 |
| | 8 |
| | 7 |
|
| (Gain) loss on sale of business and other exit costs, net | — |
| | — |
| | (2 | ) | | — |
| — |
| | — |
| | — |
| | (2 | ) |
| (Gain) loss on license sales and exchanges, net | — |
| | (11 | ) | | (2 | ) | | (17 | ) | — |
| | — |
| | — |
| | (2 | ) |
| Adjusted EBITDA (Non-GAAP) | 257 |
| | 248 |
| | 537 |
| | 507 |
| 280 |
| | 257 |
| | 560 |
| | 537 |
|
| Deduct: | | | | |
|
| |
|
| | | | |
|
| |
|
|
| Equity in earnings of unconsolidated entities | 40 |
| | 40 |
| | 84 |
| | 78 |
| 44 |
| | 40 |
| | 89 |
| | 84 |
|
| Interest and dividend income | 5 |
| | 3 |
| | 11 |
| | 7 |
| 1 |
| | 5 |
| | 5 |
| | 11 |
|
| Other, net | — |
| | — |
| | (1 | ) | | (1 | ) | — |
| | — |
| | — |
| | (1 | ) |
| Adjusted OIBDA (Non-GAAP) | 212 |
| | 205 |
| | 443 |
| | 423 |
| 235 |
| | 212 |
| | 466 |
| | 443 |
|
| Deduct: |
|
| |
|
| |
|
| |
|
|
|
| |
|
| |
|
| |
|
|
| Depreciation, amortization and accretion | 177 |
| | 159 |
| | 345 |
| | 317 |
| 178 |
| | 177 |
| | 354 |
| | 345 |
|
| (Gain) loss on asset disposals, net | 5 |
| | 1 |
| | 7 |
| | 2 |
| 4 |
| | 5 |
| | 8 |
| | 7 |
|
| (Gain) loss on sale of business and other exit costs, net | — |
| | — |
| | (2 | ) | | — |
| — |
| | — |
| | — |
| | (2 | ) |
| (Gain) loss on license sales and exchanges, net | — |
| | (11 | ) | | (2 | ) | | (17 | ) | — |
| | — |
| | — |
| | (2 | ) |
| Operating income (GAAP) | $ | 30 |
| | $ | 56 |
| | $ | 95 |
| | $ | 121 |
| $ | 53 |
| | $ | 30 |
| | $ | 104 |
| | $ | 95 |
|
| | | | Three Months Ended
June 30, | | Six Months Ended
June 30, | Three Months Ended
June 30, | | Six Months Ended
June 30, |
| TDS TELECOM | 2019 | | 2018 | | 2019 | | 2018 | 2020 | | 2019 | | 2020 | | 2019 |
| (Dollars in millions) | | | | | | | | | | | | | | |
| Net income (GAAP) | $ | 25 |
| | $ | 16 |
| | $ | 56 |
| | $ | 37 |
| $ | 28 |
| | $ | 25 |
| | $ | 56 |
| | $ | 56 |
|
| Add back: | | | | |
|
| |
|
| | | | |
|
| |
|
|
| Income tax expense | 8 |
| | 5 |
| | 18 |
| | 12 |
| 5 |
| | 8 |
| | 8 |
| | 18 |
|
| Interest expense | (1 | ) | | — |
| | (1 | ) | | (1 | ) | (1 | ) | | (1 | ) | | (2 | ) | | (1 | ) |
| Depreciation, amortization and accretion | 50 |
| | 53 |
| | 100 |
| | 107 |
| 51 |
| | 50 |
| | 103 |
| | 100 |
|
| EBITDA (Non-GAAP) | 82 |
| | 74 |
| | 173 |
| | 155 |
| 83 |
| | 82 |
| | 165 |
| | 173 |
|
| Add back or deduct: |
|
| |
|
| |
|
| |
|
|
|
| |
|
| |
|
| |
|
|
| (Gain) loss on asset disposals, net | (1 | ) | | 1 |
| | (8 | ) | | 1 |
| — |
| | (1 | ) | | — |
| | (8 | ) |
| Adjusted EBITDA (Non-GAAP) | 82 |
| | 75 |
| | 165 |
| | 156 |
| 83 |
| | 82 |
| | 165 |
| | 165 |
|
| Deduct: |
|
| |
|
| |
|
| |
|
|
|
| |
|
| |
|
| |
|
|
| Interest and dividend income | 3 |
| | 2 |
| | 6 |
| | 3 |
| 1 |
| | 3 |
| | 4 |
| | 6 |
|
| Other, net | — |
| | 1 |
| | — |
| | 1 |
| — |
| | — |
| | (1 | ) | | — |
|
| Adjusted OIBDA (Non-GAAP) | 78 |
| | 73 |
| | 159 |
| | 152 |
| 82 |
| | 78 |
| | 162 |
| | 159 |
|
| Deduct: |
|
| |
|
| |
|
| |
|
|
|
| |
|
| |
|
| |
|
|
| Depreciation, amortization and accretion | 50 |
| | 53 |
| | 100 |
| | 107 |
| 51 |
| | 50 |
| | 103 |
| | 100 |
|
| (Gain) loss on asset disposals, net | (1 | ) | | 1 |
| | (8 | ) | | 1 |
| — |
| | (1 | ) | | — |
| | (8 | ) |
| Operating income (GAAP) | $ | 29 |
| | $ | 18 |
| | $ | 66 |
| | $ | 43 |
| $ | 31 |
| | $ | 29 |
| | $ | 59 |
| | $ | 66 |
|
Numbers may not foot due to rounding.
| | | | Three Months Ended
June 30, | | Six Months Ended
June 30, | Three Months Ended
June 30, | | Six Months Ended
June 30, |
| WIRELINE | 2019 | | 2018 | | 2019 | | 2018 | 2020 | | 2019 | | 2020 | | 2019 |
| (Dollars in millions) | | | | | | | | | | | | | | |
| Income before income taxes (GAAP) | $ | 30 |
| | $ | 24 |
| | $ | 68 |
| | $ | 52 |
| $ | 28 |
| | $ | 30 |
| | $ | 55 |
| | $ | 68 |
|
| Add back: |
|
| |
|
| |
|
| |
|
|
|
| |
|
| |
|
| |
|
|
| Interest expense | (1 | ) | | — |
| | (1 | ) | | (1 | ) | (1 | ) | | (1 | ) | | (2 | ) | | (1 | ) |
| Depreciation, amortization and accretion | 33 |
| | 36 |
| | 66 |
| | 72 |
| 32 |
| | 33 |
| | 64 |
| | 66 |
|
| EBITDA (Non-GAAP) | 62 |
| | 59 |
| | 133 |
| | 124 |
| 59 |
| | 62 |
| | 116 |
| | 133 |
|
| Add back or deduct: | | | | |
|
| |
|
| | | | |
|
| |
|
|
| (Gain) loss on asset disposals, net | (1 | ) | | 1 |
| | (8 | ) | | 1 |
| — |
| | (1 | ) | | — |
| | (8 | ) |
| Adjusted EBITDA (Non-GAAP) | 62 |
| | 59 |
| | 125 |
| | 124 |
| 59 |
| | 62 |
| | 116 |
| | 125 |
|
| Deduct: | | | | |
|
| |
|
| | | | |
|
| |
|
|
| Interest and dividend income | 3 |
| | 2 |
| | 5 |
| | 3 |
| 1 |
| | 3 |
| | 3 |
| | 5 |
|
| Other, net | — |
| | 1 |
| | — |
| | 1 |
| — |
| | — |
| | (1 | ) | | — |
|
| Adjusted OIBDA (Non-GAAP) | 59 |
| | 57 |
| | 119 |
| | 120 |
| 58 |
| | 59 |
| | 114 |
| | 119 |
|
| Deduct: |
|
| |
|
| |
|
| |
|
|
|
| |
|
| |
|
| |
|
|
| Depreciation, amortization and accretion | 33 |
| | 36 |
| | 66 |
| | 72 |
| 32 |
| | 33 |
| | 64 |
| | 66 |
|
| (Gain) loss on asset disposals, net | (1 | ) | | 1 |
| | (8 | ) | | 1 |
| — |
| | (1 | ) | | — |
| | (8 | ) |
| Operating income (GAAP) | $ | 27 |
| | $ | 21 |
| | $ | 61 |
| | $ | 47 |
| $ | 27 |
| | $ | 27 |
| | $ | 50 |
| | $ | 61 |
|
Numbers may not foot due to rounding.
| | | | Three Months Ended
June 30, | | Six Months Ended
June 30, | Three Months Ended
June 30, | | Six Months Ended
June 30, |
| CABLE | 2019 | | 2018 | | 2019 | | 2018 | 2020 | | 2019 | | 2020 | | 2019 |
| (Dollars in millions) | | | | | | | | | | | | | | |
| Income (loss) before income taxes (GAAP) | $ | 3 |
| | $ | (2 | ) | | $ | 6 |
| | $ | (4 | ) | |
| Income before income taxes (GAAP) | | $ | 4 |
| | $ | 3 |
| | $ | 10 |
| | $ | 6 |
|
| Add back: |
|
| |
|
| |
|
| |
|
|
|
| |
|
| |
|
| |
|
|
| Depreciation, amortization and accretion | 17 |
| | 18 |
| | 34 |
| | 35 |
| 20 |
| | 17 |
| | 39 |
| | 34 |
|
| EBITDA (Non-GAAP) | 20 |
| | 15 |
| | 40 |
| | 32 |
| 24 |
| | 20 |
| | 49 |
| | 40 |
|
| Add back or deduct: |
|
| |
|
| |
|
| |
|
|
|
| |
|
| |
|
| |
|
|
| (Gain) loss on asset disposals, net | — |
| | — |
| | 1 |
| | 1 |
| — |
| | — |
| | — |
| | 1 |
|
| Adjusted EBITDA (Non-GAAP) | 20 |
| | 16 |
| | 40 |
| | 32 |
| 24 |
| | 20 |
| | 49 |
| | 40 |
|
| Deduct: | | | | |
|
| |
|
| | | | |
|
| |
|
|
| Interest and dividend income | — |
| | — |
| | 1 |
| | — |
| — |
| | — |
| | 1 |
| | 1 |
|
| Adjusted OIBDA (Non-GAAP) | 20 |
| | 16 |
| | 39 |
| | 32 |
| 24 |
| | 20 |
| | 49 |
| | 39 |
|
| Deduct: | | | | |
|
| |
|
| | | | |
|
| |
|
|
| Depreciation, amortization and accretion | 17 |
| | 18 |
| | 34 |
| | 35 |
| 20 |
| | 17 |
| | 39 |
| | 34 |
|
| (Gain) loss on asset disposals, net | — |
| | — |
| | 1 |
| | 1 |
| — |
| | — |
| | — |
| | 1 |
|
| Operating income (loss) (GAAP) | $ | 2 |
| | $ | (3 | ) | | $ | 5 |
| | $ | (4 | ) | |
| Operating income (GAAP) | | $ | 4 |
| | $ | 2 |
| | $ | 9 |
| | $ | 5 |
|
Numbers may not foot due to rounding.
Free Cash Flow
The following table presents Free cash flow, which is defined as Cash flows from operating activities less Cash paid for additions to property, plant and equipment. Free cash flow is a non-GAAP financial measure which TDS believes may be useful to investors and other users of its financial information in evaluating liquidity, specifically, the amount of net cash generated by business operations after deducting Cash paid for additions to property, plant and equipment.
| | | | Six Months Ended
June 30, | Six Months Ended
June 30, |
| | 2019 | | 2018 | 2020 | | 2019 |
| (Dollars in millions) | | | | | | |
| Cash flows from operating activities (GAAP) | $ | 592 |
| | $ | 463 |
| $ | 806 |
| | $ | 592 |
|
| Less: Cash paid for additions to property, plant and equipment | 393 |
| | 275 |
| 610 |
| | 393 |
|
| Free cash flow (Non-GAAP) | $ | 199 |
| | $ | 188 |
| $ | 196 |
| | $ | 199 |
|
Application of Critical Accounting Policies and Estimates
TDS prepares its consolidated financial statements in accordance with GAAP. TDS’ significant accounting policies are discussed in detail in Note 1 — Summary of Significant Accounting Policies and Recent Accounting Pronouncements, and Note 2 — Revenue Recognition and Note 11 — Leases in the Notes to Consolidated Financial Statements and TDS’ Application of Critical Accounting Policies and Estimates is discussed in detail in Management’s Discussion and Analysis of Financial Condition and Results of Operations, both of which are included in TDS’ Form 10-K for the year ended December 31, 2018.2019.
Recent Accounting Pronouncements
See Note 1 — Basis of Presentation and Note 8 — Leases in the Notes to Consolidated Financial Statements for information on recent accounting pronouncements.
Regulatory Matters
USTelecom Forbearance Petition5G Fund
On July 12, 2019,Issuance of a Notice of Proposed Rulemaking (NPRM) was approved at the FCC's Open Meeting on April 23, 2020, seeking comment on a proposal to create a new fund for 5G deployment in responserural areas. The proposal includes a 5G fund for rural areas, which would be implemented through a two-phase competitive process, using multi-round auctions to award support to the USTelecom Forbearance Petition,provider willing to serve each area at required performance levels for the lowest amount of support. The proposed funding is $9 billion to be disbursed over ten years. The proposal seeks comments on the timing for the auction, the approach for determining eligible areas, minimum speed requirements, and a transition plan from legacy support to 5G fund support. The NPRM proposes that the 5G fund be in lieu of the previously proposed fund (the Phase II Connect America Mobility Fund) for the development of 4G LTE.
U.S. Cellular cannot predict at this time when the 5G fund auction will occur, if ever, when the phase down period for its existing legacy support from the Federal USF will commence, or whether the 5G fund auction will provide opportunities to U.S. Cellular to offset any loss in existing support.
FCC Rulemaking - Restoring Internet Freedom
In December 2017, the FCC approved rules reversing or revising decisions made in the FCC’s 2015 Open Internet and Title II Order (Restoring Internet Freedom). The 2017 action reversed the FCC’s 2015 decision to reclassify Broadband Internet Access Services as telecommunications services subject to regulation under Title II of the Telecommunications Act. The 2017 action also reversed the FCC’s 2015 restrictions on blocking, throttling and paid prioritization, and modified transparency rules relating to such practices. Several parties filed suit in federal court challenging the 2017 actions. On October 1, 2019, the Court of Appeals for the D.C. Circuit issued an order reaffirming the FCC in most respects, but limiting the FCC's ability to preempt state and local net neutrality laws. On February 19, 2020, the FCC issued an Order granting partial forbearance relief from rulesa Public Notice seeking comment on three issues under further consideration by the FCC based on a recent D.C. Circuit decision.
A number of states, including certain states in which TDS operates, have adopted pursuantor considered laws intended to reinstate aspects of the Telecommunications Act of 1996. These rules require ILECs to provide dedicated transport facilities between wire centers to their competitors on an unbundled basis at regulated rates. Itforegoing net neutrality regulations that were reversed or revised by the FCC in 2017. To the extent such laws are enacted, it is expected that legal proceedings will be pursued challenging such laws, subject now to the FCC will addressDC Circuit ruling limiting the remainder ofFCC's preemptive authority in this matter. TDS cannot predict the Forbearance Petition seeking the unbundling of local loops by August 2, 2019. As a resultoutcome of these petitions, CLECs could potentially see increased prices forproceedings or the use of facilities currently purchased from other ILECs. TDS Telecom is exploring the options available to it should the petition be granted.
FCC Connect America Fund
In December 2018, the FCC authorized additional funding for companies that elected Alternative Connect America Model (A–CAM) support. On February 25, 2019, as directed within the order, the Wireline Competition Bureau (the Bureau) released a public notice offering TDS Telecom an additional $198 million in funding along with additional buildout obligations and extended the term of the revised offer by two years until December 31, 2028, which TDS Telecom accepted. On April 29, 2019, the Bureau authorized and directed the Universal Service Administrative Company (USAC) to obligate and disburse this revised support to those carriers that accept this revised offer. The offer provides A-CAM support up to $200 per location which increases annual support under the program to $82 million excluding transitional amounts, retroactive to January 1, 2019, and extending through 2028.impact on its business.
Millimeter Wave Spectrum Auctions
At its open meeting on August 2, 2018,On July 11, 2019, the FCC adoptedreleased a public noticePublic Notice establishing procedures for two auctions of wireless spectrum licenses in the 28 GHz and 24 GHz bands. The 28 GHz auction (Auction 101) commenced on November 14, 2018 and closed on January 24, 2019. Auction 101 offered two 425 MHz licenses in the 28 GHz band over portions of the United States that do not have incumbent licensees. The 24 GHz auction (Auction 102) commenced on March 14, 2019 and closed on May 28, 2019. Auction 102 offered up to seven 100 MHz licenses in the 24 GHz band in Partial Economic Areas covering most of the United States. On June 3, 2019, the FCC announced by way of public notice that U.S. Cellular was the provisional winning bidder for 408 wireless spectrum licenses in Auction 101 and 282 wireless spectrum licenses in Auction 102 for an aggregate purchase price of $256 million. The licenses are expected to be granted by the FCC during 2019.
At the open meeting on August 2, 2018, the FCC also adopted a Further Notice of Proposed Rulemaking in preparation for an additional Millimeter Wave auction offering wireless spectrum licenses in the 37, 39 and 47 GHz bands (Auction 103). On July 11, 2019,March 12, 2020, the FCC announced by public notice that U.S. Cellular was the provisional winning bidder for 237 wireless spectrum licenses for a purchase price of $146 million. In June 2020, the wireless spectrum licenses from Auction 103 were granted by the FCC.
On March 2, 2020, the FCC released a Public Notice establishing procedures for Auction 103. Applicationsan auction offering wireless spectrum licenses in the 3.5 GHz band (Auction 105). On May 5, 2020, U.S. Cellular filed an application to participate in Auction 103 are due105 and on September 9, 2019, upfront payments are dueJuly 1, 2020, the FCC announced that U.S. Cellular was a qualified bidder for the auction. Bidding commenced on July 23, 2020.
Rural Digital Opportunity Fund
On January 30, 2020, the FCC adopted the Rural Digital Opportunity Fund Report and Order, which establishes the framework for the Rural Digital Opportunity Fund (Auction 904). Auction 904 is a two phase reverse auction to provide funding for high speed fixed broadband service in underserved rural areas. Phase I is scheduled to begin on October 22, 2019, and bidding will commence on December 10, 2019.29, 2020. On July 15, 2020, U.S. Cellular filed an application to participate in Auction 904.
Private Securities Litigation Reform Act of 1995
Safe Harbor Cautionary Statement
This Form 10-Q, including exhibits, contains statements that are not based on historical facts and represent forward-looking statements, as this term is defined in the Private Securities Litigation Reform Act of 1995. All statements, other than statements of historical facts, that address activities, events or developments that TDS intends, expects, projects, believes, estimates, plans or anticipates will or may occur in the future are forward-looking statements. The words “believes,” “anticipates,” “estimates,” “expects,” “plans,” “intends,” “projects” and similar expressions are intended to identify these forward-looking statements, but are not the exclusive means of identifying them. Such forward-looking statements involve known and unknown risks, uncertainties and other factors that may cause actual results, events or developments to be significantly different from any future results, events or developments expressed or implied by such forward-looking statements. Such risks, uncertainties and other factors include, but are not limited to, those set forth below, as more fully described under “Risk Factors” in TDS’ Form 10-K for the year ended December 31, 2018.2019 and in this Form 10-Q. Each of the following risks could have a material adverse effect on TDS’ business, financial condition or results of operations. However, such factors are not necessarily all of the important factors that could cause actual results, performance or achievements to differ materially from those expressed in, or implied by, the forward-looking statements contained in this document. Other unknown or unpredictable factors also could have material adverse effects on future results, performance or achievements. TDS undertakes no obligation to update publicly any forward-looking statements whether as a result of new information, future events or otherwise. You should carefully consider the Risk Factors in TDS’ Form 10-K for the year ended December 31, 2018,2019, the following factors and other information contained in, or incorporated by reference into, this Form 10-Q to understand the material risks relating to TDS’ business, financial condition or results of operations.
| |
| ▪ | The impact of the COVID-19 pandemic on TDS' business is uncertain, but depending on its duration and severity it could have a material adverse effect on TDS' business, financial condition or results of operations. |
| |
| ▪ | Intense competition in the markets in which TDS operates could adversely affect TDS’ revenues or increase its costs to compete. |
| |
| ▪ | A failure by TDS to successfully execute its business strategy (including planned acquisitions, spectrum acquisitions, fiber builds, divestitures and exchanges) or allocate resources or capital effectively could have an adverse effect on TDS’ business, financial condition or results of operations. |
| |
| ▪ | Uncertainty in TDS’ future cash flow and liquidity or the inability to access capital, deterioration in the capital markets, other changes in TDS’ performance or market conditions, changes in TDS’ credit ratings or other factors could limit or restrict the availability of financing on terms and prices acceptable to TDS, which could require TDS to reduce its construction, development or acquisition programs, reduce the amount of wireless spectrum licenses acquired, and/or reduce or cease share repurchases and/or the payment of dividends. |
| |
| ▪ | TDS has a significant amount of indebtedness which could adversely affect its financial performance and in turn adversely affect its ability to make payments on its indebtedness, comply with terms of debt covenants and incur additional debt. |
| |
| ▪ | Changes in roaming practices or other factors could cause TDS’ roaming revenues to decline from current levels, roaming expenses to increase from current levels and/or impact TDS’ ability to service its customers in geographic areas where TDS does not have its own network, which could have an adverse effect on TDS’ business, financial condition or results of operations. |
| |
| ▪ | A failure by TDS to obtain access to adequate radio spectrum to meet current or anticipated future needs and/or to accurately predict future needs for radio spectrum could have an adverse effect on TDS’ business, financial condition or results of operations. |
| |
| ▪ | To the extent conducted by the FCC, TDS may participate in FCC auctions for additional spectrum or for funding in certain Universal Service programs in the future directly or indirectly and, during certain periods, will be subject to the FCC’s anti-collusion rules, which could have an adverse effect on TDS. |
| |
| ▪ | Failure by TDS to timely or fully comply with any existing applicable legislative and/or regulatory requirements or changes thereto could adversely affect TDS’ business, financial condition or results of operations. |
| |
| ▪ | An inability to attract people of outstanding talent throughout all levels of the organization, to develop their potential through education and assignments, and to retain them by keeping them engaged, challenged and properly rewarded could have an adverse effect on TDS' business, financial condition or results of operations. |
| |
| ▪ | TDS’ assets and revenue are concentrated primarily in the U.S. telecommunications industry. Consequently, its operating results may fluctuate based on factors related primarily to conditions in this industry. |
| |
| ▪ | TDS’ smaller scale relative to larger competitors that may have greater financial and other resources than TDS could cause TDS to be unable to compete successfully, which could adversely affect its business, financial condition or results of operations. |
| |
| ▪ | Changes in various business factors, including changes in demand, customerconsumer preferences and perceptions, price competition, churn from customer switching activity and other factors, could have an adverse effect on TDS’ business, financial condition or results of operations. |
| |
| ▪ | Advances or changes in technology could render certain technologies used by TDS obsolete, could put TDS at a competitive disadvantage, could reduce TDS’ revenues or could increase its costs of doing business. |
| |
| ▪ | Complexities associated with deploying new technologies present substantial risk and TDS’ investments in unproven technologies may not produce the benefits that TDS expects. |
| |
| ▪ | TDS receives regulatory support and is subject to numerous surcharges and fees from federal, state and local governments, and the applicability and the amount of the support and fees are subject to great uncertainty, which could have an adverse effect on TDS’ business, financial condition or results of operations. |
| |
| ▪ | Performance under device purchase agreements could have a material adverse impact on TDS' business, financial condition or results of operations.
|
| |
▪ | Changes in TDS’ enterprise value, changes in the market supply or demand for wireless spectrum licenses, wireline or cable markets or IT service providers, adverse developments in the businesses or the industries in which TDS is involved and/or other factors could require TDS to recognize impairments in the carrying value of its wireless spectrum licenses, goodwill, franchise rights and/or physical assets or require re-evaluation of the indefinite-lived nature of such assets. |
| |
| ▪ | Costs, integration problems or other factors associated with acquisitions, divestitures or exchanges of properties or wireless spectrum licenses and/or expansion of TDS’ businesses could have an adverse effect on TDS’ business, financial condition or results of operations. |
| |
| ▪ | A failure by TDS to complete significant network construction and systems implementation activities as part of its plans to improve the quality, coverage, capabilities and capacity of its network, support and other systems and infrastructure could have an adverse effect on its operations. |
| |
| ▪ | Difficulties involving third parties with which TDS does business, including changes in TDS’ relationships with or financial or operational difficulties of key suppliers or independent agents and third party national retailers who market TDS’ services, could adversely affect TDS’ business, financial condition or results of operations. |
| |
| ▪ | TDS has significant investments in entities that it does not control. Losses in the value of such investments could have an adverse effect on TDS’ financial condition or results of operations. |
| |
| ▪ | A failure by TDS to maintain flexible and capable telecommunication networks or information technology, or a material disruption thereof, could have an adverse effect on TDS’ business, financial condition or results of operations. |
| |
| ▪ | TDS has experienced, and in the future expects to experience, cyber-attacks or other breaches of network or information technology security of varying degrees on a regular basis, which could have an adverse effect on TDS' business, financial condition or results of operations. |
| |
| ▪ | Changes in facts or circumstances, including new or additional information, could require TDS to record adjustments to amounts reflected in the financial statements, which could have an adverse effect on TDS’ business, financial condition or results of operations. |
| |
| ▪ | Disruption in credit or other financial markets, a deterioration of U.S. or global economic conditions or other events could, among other things, impede TDS’ access to or increase the cost of financing its operating and investment activities and/or result in reduced revenues and lower operating income and cash flows, which would have an adverse effect on TDS’ business, financial condition or results of operations. |
| |
| ▪ | Settlements, judgments, restraints on its current or future manner of doing business and/or legal costs resulting from pending and future litigation could have an adverse effect on TDS’ business, financial condition or results of operations. |
| |
| ▪ | The possible development of adverse precedent in litigation or conclusions in professional studies to the effect that radio frequency emissions from wireless devices and/or cell sites cause harmful health consequences, including cancer or tumors, or may interfere with various electronic medical devices such as pacemakers, could have an adverse effect on TDS’ wireless business, financial condition or results of operations. |
| |
| ▪ | Claims of infringement of intellectual property and proprietary rights of others, primarily involving patent infringement claims, could prevent TDS from using necessary technology to provide products or services or subject TDS to expensive intellectual property litigation or monetary penalties, which could have an adverse effect on TDS’ business, financial condition or results of operations. |
| |
| ▪ | Certain matters, such as control by the TDS Voting Trust and provisions in the TDS Restated Certificate of Incorporation, may serve to discourage or make more difficult a change in control of TDS or have other consequences. |
| |
| ▪ | The market price of TDS’ Common Shares is subject to fluctuations due to a variety of factors. |
| |
| ▪ | Any of the foregoing events or other events could cause revenues, earnings, capital expenditures and/or any other financial or statistical information to vary from TDS’ forward-looking estimates by a material amount. |
Risk Factors
In addition to the information set forth in this Form 10-Q, you should carefully consider the factors discussed in Part I, “Item 1A. Risk Factors” in TDS’ Annual Report on Form 10-K for the year ended December 31, 2018,2019, which could materially affect TDS’ business, financial condition or future results. The risks described in this Form 10-Q and the Form 10-K for the year ended December 31, 2018,2019, may not be the only risks that could affect TDS. Additional unidentified or unrecognized risks and uncertainties could materially adversely affect TDS’ business, financial condition and/or operating results. Subject to the foregoing and other than the risk factor set forth below, TDS has not identified for disclosure any material changes to the risk factors as previously disclosed in TDS’ Annual Report on Form 10-K for the year ended December 31, 2018.2019.
The impact of the COVID-19 pandemic on TDS' business is uncertain, but depending on its duration and severity it could have a material adverse effect on TDS' business, financial condition or results of operations.
The impact of the recent global spread of COVID-19 on TDS' future operations is uncertain. Public health emergencies, such as COVID-19, pose the risk that TDS or its associates, agents, partners and suppliers may be unable to conduct business activities for an extended period of time and/or provide the level of service expected. TDS' ability to attract customers, maintain an adequate supply chain and execute on its business strategies and initiatives could be negatively impacted by this outbreak. Additionally, COVID-19 has caused and could continue to cause increased unemployment, economic downturn and credit market deterioration, all of which could negatively impact TDS. The extent of the impact of COVID-19 on TDS' business, financial condition and results of operations will depend on future circumstances, including the severity of the disease, the duration of the outbreak, actions taken by governmental authorities and other possible direct and indirect consequences, all of which are uncertain and cannot be predicted.
Quantitative and Qualitative Disclosures about Market Risk
Market Risk
Refer to the disclosure under Market Risk in TDS’ Form 10-K for the year ended December 31, 2018,2019, for additional information, including information regarding required principal payments and the weighted average interest rates related to TDS’ Long-term debt. There have been no material changes to such information sincebetween December 31, 2018.2019 and June 30, 2020. In March 2020, TDS borrowed $50 million under its senior term loan credit agreement. In April 2020, U.S. Cellular borrowed $125 million under its receivables securitization agreement.
See Note 3 — Fair Value Measurements in the Notes to Consolidated Financial Statements for additional information related to the fair value of TDS’ Long-term debt as of June 30, 2019.2020.
Financial Statements
Telephone and Data Systems, Inc.
Consolidated Statement of Operations
(Unaudited)
|
| | | | | | | | | | | | | | | |
| | Three Months Ended
June 30, | | Six Months Ended
June 30, |
| | 2019 | | 2018 | | 2019 | | 2018 |
| (Dollars and shares in millions, except per share amounts) | | | | | | | |
| Operating revenues | | | | | | | |
| Service | $ | 1,013 |
| | $ | 993 |
| | $ | 2,008 |
| | $ | 1,970 |
|
| Equipment and product sales | 248 |
| | 262 |
| | 510 |
| | 510 |
|
| Total operating revenues | 1,261 |
| | 1,255 |
| | 2,518 |
| | 2,480 |
|
| | | | | | | | |
| Operating expenses | | | | | | | |
| Cost of services (excluding Depreciation, amortization and accretion reported below) | 304 |
| | 300 |
| | 588 |
| | 587 |
|
| Cost of equipment and products | 249 |
| | 266 |
| | 513 |
| | 512 |
|
| Selling, general and administrative | 421 |
| | 417 |
| | 819 |
| | 813 |
|
| Depreciation, amortization and accretion | 234 |
| | 220 |
| | 460 |
| | 441 |
|
| (Gain) loss on asset disposals, net | 5 |
| | 2 |
| | — |
| | 3 |
|
| (Gain) loss on sale of business and other exit costs, net | — |
| | — |
| | (2 | ) | | — |
|
| (Gain) loss on license sales and exchanges, net | — |
| | (11 | ) | | (2 | ) | | (17 | ) |
| Total operating expenses | 1,213 |
| | 1,194 |
| | 2,376 |
| | 2,339 |
|
| | | | | | | | |
| Operating income | 48 |
|
| 61 |
|
| 142 |
|
| 141 |
|
| | | | | | | | |
| Investment and other income (expense) | | | | | | | |
| Equity in earnings of unconsolidated entities | 41 |
| | 40 |
| | 85 |
| | 78 |
|
| Interest and dividend income | 9 |
| | 6 |
| | 17 |
| | 11 |
|
| Interest expense | (43 | ) | | (43 | ) | | (86 | ) | | (86 | ) |
| Other, net | — |
| | 1 |
| | 1 |
| | 2 |
|
| Total investment and other income | 7 |
|
| 4 |
|
| 17 |
|
| 5 |
|
| | | | | | | | |
| Income before income taxes | 55 |
|
| 65 |
|
| 159 |
|
| 146 |
|
| Income tax expense | 16 |
| | 21 |
| | 50 |
| | 45 |
|
| Net income | 39 |
|
| 44 |
|
| 109 |
|
| 101 |
|
| Less: Net income attributable to noncontrolling interests, net of tax | 6 |
| | 11 |
| | 17 |
| | 29 |
|
| Net income attributable to TDS shareholders | $ | 33 |
| | $ | 33 |
| | $ | 92 |
| | $ | 72 |
|
| | | | | | | | |
| Basic weighted average shares outstanding | 114 |
| | 112 |
| | 114 |
| | 112 |
|
| Basic earnings per share attributable to TDS shareholders | $ | 0.29 |
| | $ | 0.30 |
| | $ | 0.81 |
| | $ | 0.65 |
|
|
|
| |
|
| |
|
| |
|
|
| Diluted weighted average shares outstanding | 116 |
| | 113 |
| | 116 |
| | 113 |
|
| Diluted earnings per share attributable to TDS shareholders | $ | 0.28 |
| | $ | 0.29 |
| | $ | 0.78 |
| | $ | 0.63 |
|
|
| | | | | | | | | | | | | | | |
| | Three Months Ended
June 30, | | Six Months Ended
June 30, |
| | 2020 | | 2019 | | 2020 | | 2019 |
| (Dollars and shares in millions, except per share amounts) | | | | | | | |
| Operating revenues | | | | | | | |
| Service | $ | 1,016 |
| | $ | 1,013 |
| | $ | 2,042 |
| | $ | 2,008 |
|
| Equipment and product sales | 247 |
| | 248 |
| | 482 |
| | 510 |
|
| Total operating revenues | 1,263 |
| | 1,261 |
| | 2,524 |
| | 2,518 |
|
| | | | | | | | |
| Operating expenses | | | | | | | |
| Cost of services (excluding Depreciation, amortization and accretion reported below) | 306 |
| | 304 |
| | 599 |
| | 588 |
|
| Cost of equipment and products | 241 |
| | 249 |
| | 487 |
| | 513 |
|
| Selling, general and administrative | 398 |
| | 421 |
| | 809 |
| | 819 |
|
| Depreciation, amortization and accretion | 236 |
| | 234 |
| | 470 |
| | 460 |
|
| (Gain) loss on asset disposals, net | 4 |
| | 5 |
| | 8 |
| | — |
|
| (Gain) loss on sale of business and other exit costs, net | — |
| | — |
| | — |
| | (2 | ) |
| (Gain) loss on license sales and exchanges, net | — |
| | — |
| | — |
| | (2 | ) |
| Total operating expenses | 1,185 |
| | 1,213 |
| | 2,373 |
| | 2,376 |
|
| | | | | | | | |
| Operating income | 78 |
|
| 48 |
|
| 151 |
|
| 142 |
|
| | | | | | | | |
| Investment and other income (expense) | | | | | | | |
| Equity in earnings of unconsolidated entities | 44 |
| | 41 |
| | 90 |
| | 85 |
|
| Interest and dividend income | 2 |
| | 9 |
| | 8 |
| | 17 |
|
| Interest expense | (38 | ) | | (43 | ) | | (75 | ) | | (86 | ) |
| Other, net | — |
| | — |
| | (1 | ) | | 1 |
|
| Total investment and other income | 8 |
|
| 7 |
|
| 22 |
|
| 17 |
|
| | | | | | | | |
| Income before income taxes | 86 |
|
| 55 |
|
| 173 |
|
| 159 |
|
| Income tax expense | 8 |
| | 16 |
| | 12 |
| | 50 |
|
| Net income | 78 |
|
| 39 |
|
| 161 |
|
| 109 |
|
| Less: Net income attributable to noncontrolling interests, net of tax | 13 |
| | 6 |
| | 26 |
| | 17 |
|
| Net income attributable to TDS shareholders | $ | 65 |
| | $ | 33 |
| | $ | 135 |
| | $ | 92 |
|
| | | | | | | | |
| Basic weighted average shares outstanding | 114 |
| | 114 |
| | 115 |
| | 114 |
|
| Basic earnings per share attributable to TDS shareholders | $ | 0.57 |
| | $ | 0.29 |
| | $ | 1.18 |
| | $ | 0.81 |
|
|
|
| |
|
| |
|
| |
|
|
| Diluted weighted average shares outstanding | 115 |
| | 116 |
| | 115 |
| | 116 |
|
| Diluted earnings per share attributable to TDS shareholders | $ | 0.56 |
| | $ | 0.28 |
| | $ | 1.15 |
| | $ | 0.78 |
|
The accompanying notes are an integral part of these consolidated financial statements.
Telephone and Data Systems, Inc.
Consolidated Statement of Comprehensive Income
(Unaudited)
|
| | | | | | | | | | | | | | | |
| | Three Months Ended
June 30, | | Six Months Ended
June 30, |
| | 2019 | | 2018 | | 2019 | | 2018 |
| (Dollars in millions) | | | | | | | |
| Net income | $ | 39 |
| | $ | 44 |
| | $ | 109 |
| | $ | 101 |
|
| Net change in accumulated other comprehensive income |
|
| |
|
| |
|
| |
|
|
| Change related to retirement plan |
|
| |
|
| |
|
| | |
| Amounts included in net periodic benefit cost for the period |
|
| |
|
| |
|
| |
|
|
| Amortization of prior service cost | — |
| | — |
| | — |
| | (1 | ) |
| Comprehensive income | 39 |
| | 44 |
| | 109 |
| | 100 |
|
| Less: Net income attributable to noncontrolling interests, net of tax | 6 |
| | 11 |
| | 17 |
| | 29 |
|
| Comprehensive income attributable to TDS shareholders | $ | 33 |
| | $ | 33 |
| | $ | 92 |
| | $ | 71 |
|
|
| | | | | | | | | | | | | | | |
| | Three Months Ended
June 30, | | Six Months Ended
June 30, |
| | 2020 | | 2019 | | 2020 | | 2019 |
| (Dollars in millions) | | | | | | | |
| Net income | $ | 78 |
| | $ | 39 |
| | $ | 161 |
| | $ | 109 |
|
| Net change in accumulated other comprehensive income |
|
| |
|
| |
|
| |
|
|
| Change related to retirement plan |
|
| |
|
| |
|
| | |
| Amounts included in net periodic benefit cost for the period |
|
| |
|
| |
|
| |
|
|
| Amortization of prior service cost | 1 |
| | — |
| | 2 |
| | — |
|
| Comprehensive income | 79 |
| | 39 |
| | 163 |
| | 109 |
|
| Less: Net income attributable to noncontrolling interests, net of tax | 13 |
| | 6 |
| | 26 |
| | 17 |
|
| Comprehensive income attributable to TDS shareholders | $ | 66 |
| | $ | 33 |
| | $ | 137 |
| | $ | 92 |
|
The accompanying notes are an integral part of these consolidated financial statements.
Telephone and Data Systems, Inc.
Consolidated Statement of Cash Flows
| | | | Six Months Ended
June 30, | Six Months Ended
June 30, |
| | 2019 | | 2018 | 2020 | | 2019 |
| (Dollars in millions) | | | | | | |
| Cash flows from operating activities | | | | | | |
| Net income | $ | 109 |
| | $ | 101 |
| $ | 161 |
| | $ | 109 |
|
| Add (deduct) adjustments to reconcile net income to net cash flows from operating activities | | | | | | |
| Depreciation, amortization and accretion | 460 |
| | 441 |
| 470 |
| | 460 |
|
| Bad debts expense | 50 |
| | 43 |
| 48 |
| | 50 |
|
| Stock-based compensation expense | 33 |
| | 23 |
| 25 |
| | 33 |
|
| Deferred income taxes, net | 40 |
| | 25 |
| 150 |
| | 40 |
|
| Equity in earnings of unconsolidated entities | (85 | ) | | (78 | ) | (90 | ) | | (85 | ) |
| Distributions from unconsolidated entities | 76 |
| | 70 |
| 91 |
| | 76 |
|
| (Gain) loss on asset disposals, net | — |
| | 3 |
| 8 |
| | — |
|
| (Gain) loss on sale of business and other exit costs, net | (2 | ) | | — |
| — |
| | (2 | ) |
| (Gain) loss on license sales and exchanges, net | (2 | ) | | (17 | ) | — |
| | (2 | ) |
| Other operating activities | 3 |
| | 2 |
| 1 |
| | 3 |
|
| Changes in assets and liabilities from operations | | | | | | |
| Accounts receivable | (2 | ) | | 51 |
| 21 |
| | (2 | ) |
| Equipment installment plans receivable | (11 | ) | | (47 | ) | 22 |
| | (11 | ) |
| Inventory | (4 | ) | | (8 | ) | 15 |
| | (4 | ) |
| Accounts payable | (9 | ) | | (50 | ) | 49 |
| | (9 | ) |
| Customer deposits and deferred revenues | 8 |
| | (25 | ) | (8 | ) | | 8 |
|
| Accrued taxes | 2 |
| | (5 | ) | (115 | ) | | 2 |
|
| Accrued interest | | — |
| | 2 |
|
| Other assets and liabilities | (74 | ) | | (66 | ) | (42 | ) | | (76 | ) |
| Net cash provided by operating activities | 592 |
| | 463 |
| 806 |
| | 592 |
|
| | | | | | | |
| Cash flows from investing activities | | | | | | |
| Cash paid for additions to property, plant and equipment | (393 | ) | | (275 | ) | (610 | ) | | (393 | ) |
| Cash paid for acquisitions and licenses | (255 | ) | | (10 | ) | |
| Cash paid for licenses | | (144 | ) | | (255 | ) |
| Cash received from investments | 11 |
| | 100 |
| 1 |
| | 11 |
|
| Cash paid for investments | (11 | ) | | — |
| (1 | ) | | (11 | ) |
| Cash received from divestitures and exchanges | 32 |
| | 21 |
| 1 |
| | 32 |
|
| Other investing activities | — |
| | 3 |
| |
| Advance payments for license acquisitions | | (16 | ) | | — |
|
| Net cash used in investing activities | (616 | ) | | (161 | ) | (769 | ) | | (616 | ) |
| | | | | | | |
| Cash flows from financing activities | | | | | | |
| Issuance of long-term debt | | 175 |
| | — |
|
| Repayment of long-term debt | (11 | ) | | (10 | ) | (5 | ) | | (11 | ) |
| TDS Common Shares reissued for benefit plans, net of tax payments | (6 | ) | | 7 |
| (3 | ) | | (6 | ) |
| U.S. Cellular Common Shares reissued for benefit plans, net of tax payments | (8 | ) | | — |
| (8 | ) | | (8 | ) |
| Repurchase of TDS Common Shares | | (14 | ) | | — |
|
| Repurchase of U.S. Cellular Common Shares | | (23 | ) | | — |
|
| Dividends paid to TDS shareholders | (38 | ) | | (36 | ) | (39 | ) | | (38 | ) |
| Payment of debt issuance costs | | (7 | ) | | — |
|
| Distributions to noncontrolling interests | (2 | ) | | (4 | ) | (1 | ) | | (2 | ) |
| Other financing activities | 3 |
| | (4 | ) | — |
| | 3 |
|
| Net cash used in financing activities | (62 | ) | | (47 | ) | |
| Net cash provided by (used in) financing activities | | 75 |
| | (62 | ) |
| | | | | | | |
| Net increase (decrease) in cash, cash equivalents and restricted cash | (86 | ) | | 255 |
| 112 |
| | (86 | ) |
| | | | | | | |
| Cash, cash equivalents and restricted cash | | | | | | |
| Beginning of period | 927 |
| | 622 |
| 474 |
| | 927 |
|
| End of period | $ | 841 |
| | $ | 877 |
| $ | 586 |
| | $ | 841 |
|
The accompanying notes are an integral part of these consolidated financial statements.
Telephone and Data Systems, Inc.
Consolidated Balance Sheet — Assets
(Unaudited)
| | | | June 30, 2019 | | December 31, 2018 | June 30, 2020 | | December 31, 2019 |
| (Dollars in millions) | | | | | | |
| Current assets | | | | | | |
| Cash and cash equivalents | $ | 834 |
| | $ | 921 |
| $ | 565 |
| | $ | 465 |
|
| Short-term investments | 18 |
| | 17 |
| |
| Accounts receivable | | | | | | |
| Customers and agents, less allowances of $70 and $71, respectively | 969 |
| | 992 |
| |
| Customers and agents, less allowances of $76 and $74, respectively | | 958 |
| | 1,005 |
|
| Other, less allowances of $2 and $2, respectively | 113 |
| | 107 |
| 106 |
| | 119 |
|
| Inventory, net | 154 |
| | 150 |
| 152 |
| | 169 |
|
| Prepaid expenses | 95 |
| | 103 |
| 106 |
| | 98 |
|
| Income taxes receivable | 17 |
| | 12 |
| 160 |
| | 36 |
|
| Other current assets | 28 |
| | 28 |
| 39 |
| | 29 |
|
| Total current assets | 2,228 |
| | 2,330 |
| 2,086 |
| | 1,921 |
|
| | | | | | | |
| Assets held for sale | — |
| | 54 |
| |
| | | | | |
| Licenses | 2,478 |
| | 2,195 |
| 2,630 |
| | 2,480 |
|
| | | | | | | |
| Goodwill | 509 |
| | 509 |
| 547 |
| | 547 |
|
| | | | | | | |
| Other intangible assets, net of accumulated amortization of $180 and $168, respectively | 241 |
| | 253 |
| |
| Other intangible assets, net of accumulated amortization of $176 and $167, respectively | | 226 |
| | 239 |
|
| | | | | | | |
| Investments in unconsolidated entities | 490 |
| | 480 |
| 486 |
| | 488 |
|
| | | | | | | |
| Property, plant and equipment | | | | | | |
| In service and under construction | 12,348 |
| | 12,074 |
| 13,160 |
| | 12,864 |
|
| Less: Accumulated depreciation and amortization | 9,030 |
| | 8,728 |
| 9,545 |
| | 9,337 |
|
| Property, plant and equipment, net | 3,318 |
| | 3,346 |
| 3,615 |
| | 3,527 |
|
| | | | | | | |
| Operating lease right-of-use assets | 963 |
| | — |
| 985 |
| | 972 |
|
| | | | | | | |
| Other assets and deferred charges | 568 |
| | 616 |
| 586 |
| | 607 |
|
| | | | | | | |
Total assets1 | $ | 10,795 |
| | $ | 9,783 |
| $ | 11,161 |
| | $ | 10,781 |
|
The accompanying notes are an integral part of these consolidated financial statements.
Telephone and Data Systems, Inc.
Consolidated Balance Sheet — Liabilities and Equity
(Unaudited)
| | | | June 30, 2019 | | December 31, 2018 | June 30, 2020 | | December 31, 2019 |
| (Dollars and shares in millions, except per share amounts) | | | | | | |
| Current liabilities | | | | | | |
| Current portion of long-term debt | $ | 21 |
| | $ | 21 |
| $ | 5 |
| | $ | 10 |
|
| Accounts payable | 367 |
| | 365 |
| 349 |
| | 374 |
|
| Customer deposits and deferred revenues | 205 |
| | 197 |
| 181 |
| | 189 |
|
| Accrued interest | 13 |
| | 11 |
| 11 |
| | 11 |
|
| Accrued taxes | 45 |
| | 44 |
| 41 |
| | 41 |
|
| Accrued compensation | 77 |
| | 127 |
| 85 |
| | 121 |
|
| Short-term operating lease liabilities | 112 |
| | — |
| 124 |
| | 116 |
|
| Other current liabilities | 85 |
| | 114 |
| 86 |
| | 100 |
|
| Total current liabilities | 925 |
| | 879 |
| 882 |
| | 962 |
|
| | | | | |
| Liabilities held for sale | — |
| | 1 |
| |
| | | | | | | |
| Deferred liabilities and credits | | | | | | |
| Deferred income tax liability, net | 681 |
| | 640 |
| 825 |
| | 676 |
|
| Long-term operating lease liabilities | 927 |
| | — |
| 938 |
| | 931 |
|
| Other deferred liabilities and credits | 450 |
| | 541 |
| 515 |
| | 481 |
|
| | | | | | | |
| Long-term debt, net | 2,409 |
| | 2,418 |
| 2,487 |
| | 2,316 |
|
| | | | | | | |
| Commitments and contingencies |
|
| |
|
|
|
| |
|
|
| | | | | | | |
| Noncontrolling interests with redemption features | 10 |
| | 11 |
| 11 |
| | 11 |
|
| | | | | | | |
| Equity | | | | | | |
| TDS shareholders’ equity | | | | | | |
| Series A Common and Common Shares | | | | | | |
| Authorized 290 shares (25 Series A Common and 265 Common Shares) | | | | | | |
| Issued 133 shares (7 Series A Common and 126 Common Shares) | | | | | | |
| Outstanding 114 shares (7 Series A Common and 107 Common Shares) | | | | |
| Outstanding 114 shares (7 Series A Common and 107 Common Shares) and 115 shares (7 Series A Common and 108 Common Shares), respectively | | | | |
| Par Value ($.01 per share) | 1 |
| | 1 |
| 1 |
| | 1 |
|
| Capital in excess of par value | 2,438 |
| | 2,432 |
| 2,472 |
| | 2,468 |
|
| Treasury shares, at cost, 18 and 19 Common Shares, respectively | (488 | ) | | (519 | ) | |
| Treasury shares, at cost, 19 and 18 Common Shares, respectively | | (479 | ) | | (479 | ) |
| Accumulated other comprehensive loss | (10 | ) | | (10 | ) | (7 | ) | | (9 | ) |
| Retained earnings | 2,684 |
| | 2,656 |
| 2,751 |
| | 2,672 |
|
| Total TDS shareholders' equity | 4,625 |
| | 4,560 |
| 4,738 |
| | 4,653 |
|
| | | | | | | |
| Noncontrolling interests | 768 |
| | 733 |
| 765 |
| | 751 |
|
| | | | | | | |
| Total equity | 5,393 |
| | 5,293 |
| 5,503 |
| | 5,404 |
|
| | | | | | | |
Total liabilities and equity1 | $ | 10,795 |
| | $ | 9,783 |
| $ | 11,161 |
| | $ | 10,781 |
|
The accompanying notes are an integral part of these consolidated financial statements.
| |
1 | The consolidated total assets as of June 30, 20192020 and December 31, 20182019, include assets held by consolidated variable interest entities (VIEs) of $9031,085 million and $848915 million, respectively, which are not available to be used to settle the obligations of TDS. The consolidated total liabilities as of June 30, 20192020 and December 31, 20182019, include certain liabilities of consolidated VIEs of $1719 million and $2120 million, respectively, for which the creditors of the VIEs have no recourse to the general credit of TDS. See Note 910 — Variable Interest Entities for additional information. |
Telephone and Data Systems, Inc.
Consolidated Statement of Changes in Equity
(Unaudited)
| | | | TDS Shareholders | | | | | TDS Shareholders | | | | |
| | Series A Common and Common shares | | Capital in excess of par value | | Treasury shares | | Accumulated other comprehensive income (loss) | | Retained earnings | | Total TDS shareholders' equity | | Noncontrolling interests | | Total equity | Series A Common and Common shares | | Capital in excess of par value | | Treasury shares | | Accumulated other comprehensive income (loss) | | Retained earnings | | Total TDS shareholders' equity | | Noncontrolling interests | | Total equity |
| (Dollars in millions) | | | | | | | | | | | | | | | | | | | | | | | | | | | | | | |
| March 31, 2019 | $ | 1 |
| | $ | 2,442 |
| | $ | (505 | ) | | $ | (10 | ) | | $ | 2,683 |
| | $ | 4,611 |
| | $ | 746 |
| | $ | 5,357 |
| |
| March 31, 2020 | | $ | 1 |
| | $ | 2,489 |
| | $ | (480 | ) | | $ | (8 | ) | | $ | 2,718 |
| | $ | 4,720 |
| | $ | 729 |
| | $ | 5,449 |
|
| Cumulative effect of accounting change | — |
| | — |
| | — |
| | — |
| | 2 |
| | 2 |
| | — |
| | 2 |
| — |
| | — |
| | — |
| | — |
| | (1 | ) | | (1 | ) | | — |
| | (1 | ) |
| Net income attributable to TDS shareholders | — |
| | — |
| | — |
| | — |
| | 33 |
| | 33 |
| | — |
| | 33 |
| �� |
| | — |
| | — |
| | — |
| | 65 |
| | 65 |
| | — |
| | 65 |
|
| Net income attributable to noncontrolling interests classified as equity | — |
| | — |
| | — |
| | — |
| | — |
| | — |
| | 6 |
| | 6 |
| — |
| | — |
| | — |
| | — |
| | — |
| | — |
| | 13 |
| | 13 |
|
| TDS Common and Series A Common share dividends ($0.165 per share) | — |
| | — |
| | — |
| | — |
| | (19 | ) | | (19 | ) | | — |
| | (19 | ) | |
| Dividend reinvestment plan | — |
| |
|
| | 6 |
| | — |
| | (1 | ) | | 5 |
| | — |
| | 5 |
| |
| Other comprehensive loss | | — |
| | — |
| | — |
| | 1 |
| | — |
| | 1 |
| | — |
| | 1 |
|
| TDS Common and Series A Common share dividends ($0.170 per share) | | — |
| | — |
| | — |
| | — |
| | (20 | ) | | (20 | ) | | — |
| | (20 | ) |
| Repurchase of Common Shares | | — |
| | — |
| | (8 | ) | | — |
| | — |
| | (8 | ) | | — |
| | (8 | ) |
| Incentive and compensation plans | — |
| | — |
| | 11 |
| | — |
| | (14 | ) | | (3 | ) | | — |
| | (3 | ) | — |
| | — |
| | 9 |
| | — |
| | (11 | ) | | (2 | ) | | — |
| | (2 | ) |
| Adjust investment in subsidiaries for repurchases, issuances and other compensation plans | — |
| | (8 | ) | | — |
| | — |
| | — |
| | (8 | ) | | 17 |
| | 9 |
| — |
| | (22 | ) | | — |
| | — |
| | — |
| | (22 | ) | | 23 |
| | 1 |
|
| Stock-based compensation awards | — |
| | 4 |
| | — |
| | — |
| | — |
| | 4 |
| | — |
| | 4 |
| — |
| | 5 |
| | — |
| | — |
| | — |
| | 5 |
| | — |
| | 5 |
|
| Distributions to noncontrolling interests | — |
| | — |
| | — |
| | — |
| | — |
| | — |
| | (1 | ) | | (1 | ) | |
| June 30, 2019 | $ | 1 |
| | $ | 2,438 |
| | $ | (488 | ) | | $ | (10 | ) | | $ | 2,684 |
| | $ | 4,625 |
| | $ | 768 |
| | $ | 5,393 |
| |
| June 30, 2020 | | $ | 1 |
| | $ | 2,472 |
| | $ | (479 | ) | | $ | (7 | ) | | $ | 2,751 |
| | $ | 4,738 |
| | $ | 765 |
| | $ | 5,503 |
|
The accompanying notes are an integral part of these consolidated financial statements.
Telephone and Data Systems, Inc.
Consolidated Statement of Changes in Equity
(Unaudited)
| | | | TDS Shareholders | | | | | TDS Shareholders | | | | |
| | Series A Common and Common shares | | Capital in excess of par value | | Treasury shares | | Accumulated other comprehensive income (loss) | | Retained earnings | | Total TDS shareholders' equity | | Noncontrolling interests | | Total equity | Series A Common and Common shares | | Capital in excess of par value | | Treasury shares | | Accumulated other comprehensive income (loss) | | Retained earnings | | Total TDS shareholders' equity | | Noncontrolling interests | | Total equity |
| (Dollars in millions) | | | | | | | | | | | | | | | | | | | | | | | | | | | | | | |
| March 31, 2018 | $ | 1 |
| | $ | 2,421 |
| | $ | (643 | ) | | $ | (3 | ) | | $ | 2,696 |
| | $ | 4,472 |
| | $ | 667 |
| | $ | 5,139 |
| |
| March 31, 2019 | | $ | 1 |
| | $ | 2,442 |
| | $ | (505 | ) | | $ | (10 | ) | | $ | 2,683 |
| | $ | 4,611 |
| | $ | 746 |
| | $ | 5,357 |
|
| Cumulative effect of accounting changes | — |
| | — |
| | — |
| | — |
| | (1 | ) | | (1 | ) | | — |
| | (1 | ) | — |
| | — |
| | — |
| | — |
| | 2 |
| | 2 |
| | — |
| | 2 |
|
| Net income attributable to TDS shareholders | — |
| | — |
| | — |
| | — |
| | 33 |
| | 33 |
| | — |
| | 33 |
| — |
| | — |
| | — |
| | — |
| | 33 |
| | 33 |
| | — |
| | 33 |
|
| Net income attributable to noncontrolling interests classified as equity | — |
| | — |
| | — |
| | — |
| | — |
| | — |
| | 10 |
| | 10 |
| — |
| | — |
| | — |
| | — |
| | — |
| | — |
| | 6 |
| | 6 |
|
| TDS Common and Series A Common share dividends ($0.160 per share) | — |
| | — |
| | — |
| | — |
| | (18 | ) | | (18 | ) | | — |
| | (18 | ) | |
| TDS Common and Series A Common share dividends ($0.165 per share) | | — |
| | — |
| | — |
| | — |
| | (19 | ) | | (19 | ) | | — |
| | (19 | ) |
| Dividend reinvestment plan | — |
| | — |
| | 6 |
| | — |
| | (4 | ) | | 2 |
| | — |
| | 2 |
| — |
| | — |
| | 6 |
| | — |
| | (1 | ) | | 5 |
| | — |
| | 5 |
|
| Incentive and compensation plans | — |
| | — |
| | 13 |
| | — |
| | (14 | ) | | (1 | ) | | — |
| | (1 | ) | — |
| | — |
| | 11 |
| | — |
| | (14 | ) | | (3 | ) | | — |
| | (3 | ) |
| Adjust investment in subsidiaries for repurchases, issuances and other compensation plans | — |
| | (6 | ) | | — |
| | — |
| | — |
| | (6 | ) | | 12 |
| | 6 |
| — |
| | (8 | ) | | — |
| | — |
| | — |
| | (8 | ) | | 17 |
| | 9 |
|
| Stock-based compensation awards | — |
| | 3 |
| | — |
| | — |
| | — |
| | 3 |
| | — |
| | 3 |
| — |
| | 4 |
| | — |
| | — |
| | — |
| | 4 |
| | — |
| | 4 |
|
| Distributions to noncontrolling interests | — |
| | — |
| | — |
| | — |
| | — |
| | — |
| | (1 | ) | | (1 | ) | — |
| | — |
| | — |
| | — |
| | — |
| | — |
| | (1 | ) | | (1 | ) |
| June 30, 2018 | $ | 1 |
| | $ | 2,418 |
| | $ | (624 | ) | | $ | (3 | ) | | $ | 2,692 |
| | $ | 4,484 |
| | $ | 688 |
| | $ | 5,172 |
| |
| June 30, 2019 | | $ | 1 |
| | $ | 2,438 |
| | $ | (488 | ) | | $ | (10 | ) | | $ | 2,684 |
| | $ | 4,625 |
| | $ | 768 |
| | $ | 5,393 |
|
The accompanying notes are an integral part of these consolidated financial statements.
Telephone and Data Systems, Inc.
Consolidated Statement of Changes in Equity
(Unaudited)
|
| | | | | | | | | | | | | | | | | | | | | | | | | | | | | | | |
| | TDS Shareholders | | | | |
| | Series A Common and Common shares | | Capital in excess of par value | | Treasury shares | | Accumulated other comprehensive income (loss) | | Retained earnings | | Total TDS shareholders' equity | | Noncontrolling interests | | Total equity |
| (Dollars in millions) | | | | | | | | | | | | | | | |
| December 31, 2019 | $ | 1 |
| | $ | 2,468 |
| | $ | (479 | ) | | $ | (9 | ) | | $ | 2,672 |
| | $ | 4,653 |
| | $ | 751 |
| | $ | 5,404 |
|
| Cumulative effect of accounting changes | — |
| | — |
| | — |
| | — |
| | (1 | ) | | (1 | ) | | — |
| | (1 | ) |
| Net income attributable to TDS shareholders | — |
| | — |
| | — |
| | — |
| | 135 |
| | 135 |
| | — |
| | 135 |
|
| Net income attributable to noncontrolling interests classified as equity | — |
| | — |
| | — |
| | — |
| | — |
| | — |
| | 26 |
| | 26 |
|
| Other comprehensive loss | — |
| | — |
| | — |
| | 2 |
| | — |
| | 2 |
| | — |
| | 2 |
|
| TDS Common and Series A Common share dividends ($0.340 per share) | — |
| | — |
| | — |
| | — |
| | (39 | ) | | (39 | ) | | — |
| | (39 | ) |
| Repurchase of Common Shares | — |
| | — |
| | (14 | ) | | — |
| | — |
| | (14 | ) | | — |
| | (14 | ) |
| Dividend reinvestment plan | — |
| | — |
| | 1 |
| | — |
| | — |
| | 1 |
| | — |
| | 1 |
|
| Incentive and compensation plans | — |
| | — |
| | 13 |
| | — |
| | (16 | ) | | (3 | ) | | — |
| | (3 | ) |
| Adjust investment in subsidiaries for repurchases, issuances and other compensation plans | — |
| | (4 | ) | | — |
| | — |
| | — |
| | (4 | ) | | (11 | ) | | (15 | ) |
| Stock-based compensation awards | — |
| | 8 |
| | — |
| | — |
| | — |
| | 8 |
| | — |
| | 8 |
|
| Distributions to noncontrolling interests | — |
| | — |
| | — |
| | — |
| | — |
| | — |
| | (1 | ) | | (1 | ) |
| June 30, 2020 | $ | 1 |
|
| $ | 2,472 |
|
| $ | (479 | ) |
| $ | (7 | ) |
| $ | 2,751 |
|
| $ | 4,738 |
|
| $ | 765 |
|
| $ | 5,503 |
|
The accompanying notes are an integral part of these consolidated financial statements.
Telephone and Data Systems, Inc.
Consolidated Statement of Changes in Equity
(Unaudited)
|
| | | | | | | | | | | | | | | | | | | | | | | | | | | | | | | |
| | TDS Shareholders | | | | |
| | Series A Common and Common shares | | Capital in excess of par value | | Treasury shares | | Accumulated other comprehensive income (loss) | | Retained earnings | | Total TDS shareholders' equity | | Noncontrolling interests | | Total equity |
| (Dollars in millions) | | | | | | | | | | | | | | | |
| December 31, 2018 | $ | 1 |
| | $ | 2,432 |
| | $ | (519 | ) | | $ | (10 | ) | | $ | 2,656 |
| | $ | 4,560 |
| | $ | 733 |
| | $ | 5,293 |
|
| Cumulative effect of accounting changes | — |
| | — |
| | — |
| | — |
| | 2 |
| | 2 |
| | — |
| | 2 |
|
| Net income attributable to TDS shareholders | — |
| | — |
| | — |
| | — |
| | 92 |
| | 92 |
| | — |
| | 92 |
|
| Net income attributable to noncontrolling interests classified as equity | — |
| | — |
| | — |
| | — |
| | — |
| | — |
| | 17 |
| | 17 |
|
| TDS Common and Series A Common share dividends ($0.330 per share) | — |
| | — |
| | — |
| | — |
| | (38 | ) | | (38 | ) | | — |
| | (38 | ) |
| Dividend reinvestment plan | — |
| | — |
| | 11 |
| | — |
| | (2 | ) | | 9 |
| | — |
| | 9 |
|
| Incentive and compensation plans | — |
| | — |
| | 20 |
| | — |
| | (26 | ) | | (6 | ) | | — |
| | (6 | ) |
| Adjust investment in subsidiaries for repurchases, issuances and other compensation plans | — |
| | (2 | ) | | — |
| | — |
| | — |
| | (2 | ) | | 20 |
| | 18 |
|
| Stock-based compensation awards | — |
| | 8 |
| | — |
| | — |
| | — |
| | 8 |
| | — |
| | 8 |
|
| Distributions to noncontrolling interests | — |
| | — |
| | — |
| | — |
| | — |
| | — |
| | (2 | ) | | (2 | ) |
| June 30, 2019 | $ | 1 |
| | $ | 2,438 |
| | $ | (488 | ) | | $ | (10 | ) | | $ | 2,684 |
| | $ | 4,625 |
| | $ | 768 |
| | $ | 5,393 |
|
The accompanying notes are an integral part of these consolidated financial statements.
Telephone and Data Systems, Inc.
Consolidated Statement of Changes in Equity
(Unaudited)
|
| | | | | | | | | | | | | | | | | | | | | | | | | | | | | | | |
| | TDS Shareholders | | | | |
| | Series A Common and Common shares | | Capital in excess of par value | | Treasury shares | | Accumulated other comprehensive income (loss) | | Retained earnings | | Total TDS shareholders' equity | | Noncontrolling interests | | Total equity |
| (Dollars in millions) | | | | | | | | | | | | | | | |
| December 31, 2017 | $ | 1 |
| | $ | 2,413 |
| | $ | (669 | ) | | $ | (1 | ) | | $ | 2,525 |
| | $ | 4,269 |
| | $ | 623 |
| | $ | 4,892 |
|
| Cumulative effect of accounting changes | — |
| | — |
| | — |
| | (1 | ) | | 163 |
| | 162 |
| | 31 |
| | 193 |
|
| Net income attributable to TDS shareholders | — |
| | — |
| | — |
| | — |
| | 72 |
| | 72 |
| | — |
| | 72 |
|
| Net income attributable to noncontrolling interests classified as equity | — |
| | — |
| | — |
| | — |
| | — |
| | — |
| | 16 |
| | 16 |
|
| Other comprehensive loss | — |
| | — |
| | — |
| | (1 | ) | | — |
| | (1 | ) | | — |
| | (1 | ) |
| TDS Common and Series A Common share dividends ($0.320 per share) | — |
| | — |
| | — |
| | — |
| | (36 | ) | | (36 | ) | | — |
| | (36 | ) |
| Dividend reinvestment plan | — |
| | — |
| | 13 |
| | — |
| | (7 | ) | | 6 |
| | — |
| | 6 |
|
| Incentive and compensation plans | — |
| | — |
| | 32 |
| | — |
| | (25 | ) | | 7 |
| | — |
| | 7 |
|
| Adjust investment in subsidiaries for repurchases, issuances and other compensation plans | — |
| | (1 | ) | | — |
| | — |
| | — |
| | (1 | ) | | 19 |
| | 18 |
|
| Stock-based compensation awards | — |
| | 6 |
| | — |
| | — |
| | — |
| | 6 |
| | — |
| | 6 |
|
| Distributions to noncontrolling interests | — |
| | — |
| | — |
| | — |
| | — |
| | — |
| | (1 | ) | | (1 | ) |
| June 30, 2018 | $ | 1 |
| | $ | 2,418 |
| | $ | (624 | ) | | $ | (3 | ) | | $ | 2,692 |
| | $ | 4,484 |
| | $ | 688 |
| | $ | 5,172 |
|
The accompanying notes are an integral part of these consolidated financial statements.
Telephone and Data Systems, Inc.
Notes to Consolidated Financial Statements
Note 1 Basis of Presentation
The accounting policies of Telephone and Data Systems, Inc. (TDS) conform to accounting principles generally accepted in the United States of America (GAAP) as set forth in the Financial Accounting Standards Board (FASB) Accounting Standards Codification (ASC). Unless otherwise specified, references to accounting provisions and GAAP in these notes refer to the requirements of the FASB ASC. The consolidated financial statements include the accounts of TDS and subsidiaries in which it has a controlling financial interest, including TDS’ 82%-owned subsidiary, United States Cellular Corporation (U.S. Cellular) and TDS’ wholly-owned subsidiary, TDS Telecommunications LLC (TDS Telecom). In addition, the consolidated financial statements include certain entities in which TDS has a variable interest that requirerequires consolidation under GAAP. All material intercompanyIntercompany accounts and transactions have been eliminated.
TDS’ business segments reflected in this Quarterly Report on Form 10-Q for the period ended June 30, 2019,2020, are U.S. Cellular, Wireline, and Cable. TDS’ non-reportable other business activities are presented as “Corporate, Eliminations and Other”, which includes the operations of TDS’ wholly-owned hosted and managed services (HMS) subsidiary, which operates under the OneNeck IT Solutions brand, and its wholly-owned subsidiary Suttle-Straus, Inc. (Suttle-Straus). HMS’ and Suttle-Straus’ financial results were not significant to TDS’ operations. All of TDS’ segments operate only in the United States. See Note 1112 — Business Segment Information for summary financial information on each business segment.
The unaudited consolidated financial statements included herein have been prepared by TDS pursuant to the rules and regulations of the Securities and Exchange Commission (SEC). Certain information and disclosures normally included in annual financial statements prepared in accordance with GAAP have been condensed or omitted pursuant to such rules and regulations. However, TDS believes that the disclosures included herein are adequate to make the information presented not misleading. Certain numbers included herein are rounded to millions for ease of presentation; however, certain calculated amounts and percentages are determined using the unrounded numbers. These unaudited consolidated financial statements should be read in conjunction with the consolidated financial statements and the notes thereto included in TDS’ Annual Report on Form 10-K (Form 10-K) for the year ended December 31, 2018.2019.
The accompanying unaudited consolidated financial statements contain all adjustments (consisting of normal recurring items, unless otherwise disclosed) necessary for the fair statement of TDS’ financial position as of June 30, 20192020 and December 31, 2018,2019 and its results of operations, comprehensive income and changes in equity for the three and six months ended June 30, 20192020 and 2018,2019, and its cash flows for the six months ended June 30, 20192020 and 2018.2019. These results are not necessarily indicative of the results to be expected for the full year. TDS has not changed its significant accounting and reporting policies from those disclosed in its Form 10-K for the year ended December 31, 2018,2019 except as disclosed in Note 8 — Leases.noted below for the estimation of credit losses.
Restricted Cash
TDS presents restricted cash with cash and cash equivalents in the Consolidated Statement of Cash Flows. The following table provides a reconciliation of Cash and cash equivalents and restricted cash reported in the Consolidated Balance Sheet to the total of the amounts in the Consolidated Statement of Cash Flows as of June 30, 20192020 and December 31, 2018.2019.
| | | | June 30, 2019 | | December 31, 2018 | June 30, 2020 | | December 31, 2019 |
| (Dollars in millions) | | | | | | |
| Cash and cash equivalents | $ | 834 |
| | $ | 921 |
| $ | 565 |
| | $ | 465 |
|
| Restricted cash included in Other current assets | 7 |
| | 6 |
| 21 |
| | 9 |
|
| Cash, cash equivalents and restricted cash in the statement of cash flows | $ | 841 |
| | $ | 927 |
| $ | 586 |
| | $ | 474 |
|
Recently IssuedAdopted Accounting Pronouncements Not Yet Adopted
In June 2016, the FASB issued Accounting Standards Update 2016-13, Financial Instruments - Credit Losses: Measurement of Credit Losses on Financial Instruments(ASU 2016-13). ASU 2016-13 and subsequently amended the standard with additional Accounting Standards Updates, collectively referred to as ASC 326. This standard requires entities to use a new forward-looking, expected loss model to estimate credit losses. It alsolosses and requires additional disclosuredisclosures relating to the credit quality of trade and other receivables, including information relating to management’s estimatereceivables. TDS adopted the provisions of credit allowances. TDS is required to adopt ASU 2016-13ASC 326 on January 1, 2020, using thea modified retrospective approach. Early adoption is permitted; however,method. Under this method, TDS doesapplied the new accounting standard only to the most recent period presented, recognizing the cumulative effect of the accounting change, if any, as an adjustment to the beginning balance of retained earnings. Accordingly, prior periods have not intendbeen recast to adopt early. TDS is evaluatingreflect the effects that adoptionnew accounting standard. The cumulative effect of ASU 2016-13 will haveapplying the provisions of ASC 326 had no material impact on its financial position, results of operations and disclosures.retained earnings.
U.S. Cellular’s accounts receivable consist primarily of amounts owed by customers for wireless services and equipment sales, including sales of certain devices and accessories under installment plans, by agents and third-party distributors for sales of equipment to them, by third party vendors and by other wireless carriers whose customers have used U.S. Cellular’s wireless systems.
TDS Telecom’s accounts receivable primarily consist of amounts owed by customers for services and products provided, by state and federal governments for grants and support funds, and by interexchange carriers for long-distance and data traffic, which TDS Telecom carries on its network.
TDS estimates expected credit losses related to accounts receivable balances based on a review of available and relevant information including current economic conditions, projected economic conditions, historical loss experience, account aging, and other factors that could affect collectability. Expected credit losses are determined for each pool of accounts receivable balances that share similar risk characteristics. The allowance for doubtful accounts is the best estimate of the amount of expected credit losses related to existing accounts receivable. TDS does not have any off-balance sheet credit exposure related to its customers.
In August 2018, the FASB issued Accounting Standards Update 2018-15, Intangibles - Goodwill and Other - Internal-Use Software: Customer's Accounting for Implementation Costs Incurred in a Cloud Computing Arrangement That Is a Service Contract (ASU 2018-15). ASU 2018-15 aligns the requirements for capitalizing implementation costs incurred in a hosting arrangement that is a service contract with the existing guidance for capitalizing implementation costs for an arrangement that has a software license. The service element of a hosting arrangement will continue to be expensed as incurred. Any capitalized implementation costs will be amortized over the period of the service contract. TDS' hosting arrangements that are service contracts consist primarily of software used to perform administrative functions. TDS adopted ASU 2018-15 on January 1, 2020, using the prospective method. The adoption of ASU 2018-15 did not have a significant impact on TDS' financial position or results of operations.
Note 2 Revenue Recognition
Disaggregation of Revenue
In the following table, revenue isTDS' revenues are disaggregated by type of service, which represents the relevant categorization of revenues for TDS' reportable segments, and timing of revenue recognition. Service revenues are recognized over time and Equipment sales are point in time.
| | | | | | TDS Telecom | | | | | | | TDS Telecom | | | | |
| Three Months Ended June 30, 2019 | U.S. Cellular | | Wireline | | Cable | | TDS Telecom Total1 | | Corporate, Eliminations and Other | | Total | |
| Three Months Ended June 30, 2020 | | U.S. Cellular | | Wireline | | Cable | | TDS Telecom Total1 | | Corporate, Eliminations and Other | | Total |
| (Dollars in millions) | | | | | | | |
| | |
| | |
| | | | | | | |
| | |
| | |
|
| Revenues from contracts with customers: | | | | | | | |
| | |
| | |
| | | | | | | |
| | |
| | |
|
| Type of service: | | | | | |
| | |
| | |
| | |
| | | | | |
| | |
| | |
| | |
|
| Retail service | $ | 662 |
| | $ | — |
| | $ | — |
| | $ | — |
| | $ | — |
| | $ | 662 |
| $ | 658 |
| | $ | — |
| | $ | — |
| | $ | — |
| | $ | — |
| | $ | 658 |
|
| Inbound roaming | 44 |
| | — |
| | — |
| | — |
| | — |
| | 44 |
| 41 |
| | — |
| | — |
| | — |
| | — |
| | 41 |
|
| Residential | — |
| | 81 |
| | 51 |
| | 131 |
| | — |
| | 131 |
| — |
| | 85 |
| | 60 |
| | 145 |
| | — |
| | 145 |
|
| Commercial | — |
| | 42 |
| | 11 |
| | 54 |
| | — |
| | 54 |
| — |
| | 38 |
| | 11 |
| | 49 |
| | — |
| | 49 |
|
| Wholesale | — |
| | 48 |
| | — |
| | 48 |
| | — |
| | 48 |
| — |
| | 45 |
| | — |
| | 45 |
| | — |
| | 45 |
|
| Other service | 35 |
| | — |
| | — |
| | — |
| | 16 |
| | 51 |
| 35 |
| | — |
| | — |
| | — |
| | 17 |
| | 52 |
|
| Service revenues from contracts with customers | 741 |
| | 172 |
| | 62 |
| | 233 |
| | 16 |
| | 990 |
| 734 |
| | 169 |
| | 71 |
| | 239 |
| | 17 |
| | 990 |
|
| Equipment and product sales | 216 |
| | — |
| | — |
| | — |
| | 32 |
| | 248 |
| 220 |
| | — |
| | — |
| | — |
| | 27 |
| | 247 |
|
Total revenues from contracts with customers2 | $ | 957 |
| | $ | 172 |
| | $ | 62 |
| | $ | 233 |
| | $ | 48 |
| | $ | 1,238 |
| |
| Total revenues from contracts with customers | | 954 |
| | 169 |
| | 71 |
| | 240 |
| | 43 |
| | 1,237 |
|
| Operating lease income | | 19 |
| | 1 |
| | — |
| | 1 |
| | 6 |
| | 26 |
|
| Total operating revenues | | $ | 973 |
| | $ | 169 |
| | $ | 71 |
| | $ | 241 |
| | $ | 49 |
| | $ | 1,263 |
|
|
| | | | | | | | | | | | | | | | | | | | | | | |
| | | | TDS Telecom | | | | |
| Three Months Ended June 30, 2018 | U.S. Cellular | | Wireline | | Cable | | TDS Telecom Total1 | | Corporate, Eliminations and Other | | Total |
| (Dollars in millions) | | | | | | | |
| | |
| | |
|
| Revenues from contracts with customers: | | | | | | | |
| | |
| | |
|
| Type of service: | | | | | |
| | |
| | |
| | |
|
| Retail service | $ | 652 |
| | $ | — |
| | $ | — |
| | $ | — |
| | $ | — |
| | $ | 652 |
|
| Inbound roaming | 39 |
| | — |
| | — |
| | — |
| | — |
| | 39 |
|
| Residential | — |
| | 80 |
| | 47 |
| | 127 |
| | — |
| | 127 |
|
| Commercial | — |
| | 46 |
| | 10 |
| | 57 |
| | — |
| | 57 |
|
| Wholesale | — |
| | 46 |
| | — |
| | 46 |
| | — |
| | 46 |
|
| Other service | 33 |
| | — |
| | — |
| | — |
| | 18 |
| | 51 |
|
| Service revenues from contracts with customers | 724 |
| | 173 |
| | 57 |
| | 229 |
| | 18 |
| | 971 |
|
| Equipment and product sales | 233 |
| | — |
| | — |
| | 1 |
| | 28 |
| | 262 |
|
Total revenues from contracts with customers2 | $ | 957 |
| | $ | 173 |
| | $ | 57 |
| | $ | 230 |
| | $ | 46 |
| | $ | 1,233 |
|
|
| | | | | | | | | | | | | | | | | | | | | | | |
| | | | TDS Telecom | | | | |
| Six Months Ended June 30, 2019 | U.S. Cellular | | Wireline | | Cable | | TDS Telecom Total1 | | Corporate, Eliminations and Other | | Total |
| (Dollars in millions) | | | | | | | |
| | |
| | |
|
| Revenues from contracts with customers: | | | | | | | |
| | |
| | |
|
| Type of service: | | | | | |
| | |
| | |
| | |
|
| Retail service | $ | 1,322 |
| | $ | — |
| | $ | — |
| | $ | — |
| | $ | — |
| | $ | 1,322 |
|
| Inbound roaming | 78 |
| | — |
| | — |
| | — |
| | — |
| | 78 |
|
| Residential | — |
| | 162 |
| | 100 |
| | 262 |
| | — |
| | 262 |
|
| Commercial | — |
| | 86 |
| | 21 |
| | 107 |
| | — |
| | 107 |
|
| Wholesale | — |
| | 94 |
| | — |
| | 94 |
| | — |
| | 94 |
|
| Other service | 66 |
| | — |
| | — |
| | (1 | ) | | 35 |
| | 100 |
|
| Service revenues from contracts with customers | 1,466 |
| | 342 |
| | 121 |
| | 462 |
| | 35 |
| | 1,963 |
|
| Equipment and product sales | 441 |
| | 1 |
| | — |
| | 1 |
| | 68 |
| | 510 |
|
Total revenues from contracts with customers2 | $ | 1,907 |
| | $ | 342 |
| | $ | 121 |
| | $ | 463 |
| | $ | 103 |
| | $ | 2,473 |
|
|
| | | | | | | | | | | | | | | | | | | | | | | |
| | | | TDS Telecom | | | | |
| Three Months Ended June 30, 2019 | U.S. Cellular | | Wireline | | Cable | | TDS Telecom Total1 | | Corporate, Eliminations and Other | | Total |
| (Dollars in millions) | | | | | | | |
| | |
| | |
|
| Revenues from contracts with customers: | | | | | | | |
| | |
| | |
|
| Type of service: | | | | | |
| | |
| | |
| | |
|
| Retail service | $ | 662 |
| | $ | — |
| | $ | — |
| | $ | — |
| | $ | — |
| | $ | 662 |
|
| Inbound roaming | 44 |
| | — |
| | — |
| | — |
| | — |
| | 44 |
|
| Residential | — |
| | 81 |
| | 51 |
| | 131 |
| | — |
| | 131 |
|
| Commercial | — |
| | 42 |
| | 11 |
| | 54 |
| | — |
| | 54 |
|
| Wholesale | — |
| | 48 |
| | — |
| | 48 |
| | — |
| | 48 |
|
| Other service | 35 |
| | — |
| | — |
| | — |
| | 16 |
| | 51 |
|
| Service revenues from contracts with customers | 741 |
| | 172 |
| | 62 |
| | 233 |
| | 16 |
| | 990 |
|
| Equipment and product sales | 216 |
| | — |
| | — |
| | — |
| | 32 |
| | 248 |
|
| Total revenues from contracts with customers | 957 |
| | 172 |
| | 62 |
| | 233 |
| | 48 |
| | 1,238 |
|
| Operating lease income | 16 |
| | — |
| | — |
| | — |
| | 7 |
| | 23 |
|
| Total operating revenues | $ | 973 |
| | $ | 172 |
| | $ | 62 |
| | $ | 233 |
| | $ | 55 |
| | $ | 1,261 |
|
| | | | | | TDS Telecom | | | | | | | TDS Telecom | | | | |
| Six Months Ended June 30, 2018 | U.S. Cellular | | Wireline | | Cable | | TDS Telecom Total1 | | Corporate, Eliminations and Other | | Total | |
| Six Months Ended June 30, 2020 | | U.S. Cellular | | Wireline | | Cable | | TDS Telecom Total1 | | Corporate, Eliminations and Other | | Total |
| (Dollars in millions) | | | | | | | |
| | |
| | |
| | | | | | | |
| | |
| | |
|
| Revenues from contracts with customers: | | | | | | | |
| | |
| | |
| | | | | | | |
| | |
| | |
|
| Type of service: | | | | | |
| | |
| | |
| | |
| | | | | |
| | |
| | |
| | |
|
| Retail service | $ | 1,301 |
| | $ | — |
| | $ | — |
| | $ | — |
| | $ | — |
| | $ | 1,301 |
| $ | 1,329 |
| | $ | — |
| | $ | — |
| | $ | — |
| | $ | — |
| | $ | 1,329 |
|
| Inbound roaming | 66 |
| | — |
| | — |
| | — |
| | — |
| | 66 |
| 77 |
| | — |
| | — |
| | — |
| | — |
| | 77 |
|
| Residential | — |
| | 160 |
| | 92 |
| | 253 |
| | — |
| | 253 |
| — |
| | 170 |
| | 119 |
| | 289 |
| | — |
| | 289 |
|
| Commercial | — |
| | 94 |
| | 20 |
| | 114 |
| | — |
| | 114 |
| — |
| | 77 |
| | 22 |
| | 99 |
| | — |
| | 99 |
|
| Wholesale | — |
| | 93 |
| | — |
| | 93 |
| | — |
| | 93 |
| — |
| | 91 |
| | — |
| | 91 |
| | — |
| | 91 |
|
| Other service | 65 |
| | — |
| | — |
| | (1 | ) | | 34 |
| | 98 |
| 71 |
| | — |
| | — |
| | — |
| | 35 |
| | 106 |
|
| Service revenues from contracts with customers | 1,432 |
| | 348 |
| | 112 |
| | 459 |
| | 34 |
| | 1,925 |
| 1,477 |
| | 338 |
| | 141 |
| | 479 |
| | 35 |
| | 1,990 |
|
| Equipment and product sales | 450 |
| | 1 |
| | — |
| | 1 |
| | 59 |
| | 510 |
| 422 |
| | — |
| | — |
| | 1 |
| | 59 |
| | 482 |
|
Total revenues from contracts with customers2 | $ | 1,882 |
| | $ | 349 |
| | $ | 112 |
| | $ | 460 |
| | $ | 93 |
| | $ | 2,435 |
| |
| Total revenues from contracts with customers | | 1,899 |
| | 338 |
| | 142 |
| | 479 |
| | 94 |
| | 2,472 |
|
| Operating lease income | | 38 |
| | 1 |
| | 1 |
| | 2 |
| | 12 |
| | 52 |
|
| Total operating revenues | | $ | 1,937 |
| | $ | 339 |
| | $ | 142 |
| | $ | 481 |
| | $ | 106 |
| | $ | 2,524 |
|
|
| | | | | | | | | | | | | | | | | | | | | | | |
| | | | TDS Telecom | | | | |
| Six Months Ended June 30, 2019 | U.S. Cellular | | Wireline | | Cable | | TDS Telecom Total1 | | Corporate, Eliminations and Other | | Total |
| (Dollars in millions) | | | | | | | |
| | |
| | |
|
| Revenues from contracts with customers: | | | | | | | |
| | |
| | |
|
| Type of service: | | | | | |
| | |
| | |
| | |
|
| Retail service | $ | 1,322 |
| | $ | — |
| | $ | — |
| | $ | — |
| | $ | — |
| | $ | 1,322 |
|
| Inbound roaming | 78 |
| | — |
| | — |
| | — |
| | — |
| | 78 |
|
| Residential | — |
| | 162 |
| | 100 |
| | 262 |
| | — |
| | 262 |
|
| Commercial | — |
| | 86 |
| | 21 |
| | 107 |
| | — |
| | 107 |
|
| Wholesale | — |
| | 94 |
| | — |
| | 94 |
| | — |
| | 94 |
|
| Other service | 66 |
| | — |
| | — |
| | (1 | ) | | 35 |
| | 100 |
|
| Service revenues from contracts with customers | 1,466 |
| | 342 |
| | 121 |
| | 462 |
| | 35 |
| | 1,963 |
|
| Equipment and product sales | 441 |
| | 1 |
| | — |
| | 1 |
| | 68 |
| | 510 |
|
| Total revenues from contracts with customers | 1,907 |
| | 342 |
| | 121 |
| | 463 |
| | 103 |
| | 2,473 |
|
| Operating lease income | 32 |
| | — |
| | — |
| | 1 |
| | 12 |
| | 45 |
|
| Total operating revenues | $ | 1,939 |
| | $ | 343 |
| | $ | 121 |
| | $ | 464 |
| | $ | 115 |
| | $ | 2,518 |
|
Numbers may not foot due to rounding.
| |
1 | TDS Telecom Total includes eliminations between the Wireline and Cable segments. |
| |
2
| Revenue line items in this table will not agree to amounts presented in the Consolidated Statement of Operations as the amounts in this table only include revenue resulting from contracts with customers. |
Contract Balances
The accounts receivable balance related to amounts billed and not paid on contracts with customers, net of allowances, is shown in the table below.
|
| | | | | | | |
| | June 30, 2019 | | December 31, 2018 |
| (Dollars in millions) | | | |
| Accounts receivable | | | |
| Customer and agents | $ | 965 |
| | $ | 987 |
|
| Other | 91 |
| | 73 |
|
Total1 | $ | 1,056 |
| | $ | 1,060 |
|
| |
1
| Accounts receivable line items presented in this table will not agree to amounts presented in the Consolidated Balance Sheet as the amounts in this table only include receivables resulting from contracts with customers. |
The following table provides a rollforward ofbalances for contract assets from contracts with customers, which are recorded in Other current assets and Other assets and deferred charges in the Consolidated Balance Sheet.
|
| | | |
| | Contract Assets |
| (Dollars in millions) | |
| Balance at December 31, 2018 | $ | 11 |
|
| Contract additions | 7 |
|
| Reclassified to receivables | (9 | ) |
| Balance at June 30, 2019 | $ | 9 |
|
The following table provides a rollforward ofSheet, and contract liabilities from contracts with customers, which are recorded in Customer deposits and deferred revenues and Other deferred liabilities and credits in the Consolidated Balance Sheet.
|
| | | |
| | Contract Liabilities |
| (Dollars in millions) | |
| Balance at December 31, 2018 | $ | 203 |
|
| Contract additions | 118 |
|
| Terminated contracts | (3 | ) |
| Revenue recognized | (108 | ) |
| Balance at June 30, 2019 | $ | 210 |
|
|
| | | | | | | |
| | June 30, 2020 | | December 31, 2019 |
| (Dollars in millions) | | | |
| Contract assets | $ | 11 |
| | $ | 10 |
|
| Contract liabilities | $ | 195 |
| | $ | 197 |
|
Revenue recognized related to contract liabilities existing at January 1, 2020 was $145 million for the six months ended June 30, 2020.
Transaction price allocated to the remaining performance obligations
The following table includes estimated service revenuerevenues expected to be recognized related to performance obligations that are unsatisfied (or partially unsatisfied) at the end of the reporting period. These estimates represent service revenuerevenues to be recognized when services are delivered to customers pursuant to service plan contracts and under certain roaming agreements with other carriers. These estimates are based on contracts in place as of June 30, 2019,2020 and may vary from actual results due to future contract modifications.results. As a practical expedient,expedients, revenue related to contracts of less than one year, generally month-to-month contracts, and contracts with a fixed per-unit price and variable quantity, are excluded from these estimates.
| | | | Service Revenue | Service Revenues |
| (Dollars in millions) | | |
| Remainder of 2019 | $ | 277 |
| |
| 2020 | 207 |
| |
| Remainder of 2020 | | $ | 261 |
|
| 2021 | | 217 |
|
| Thereafter | 306 |
| 234 |
|
| Total | $ | 790 |
| $ | 712 |
|
TDS has certain contracts at U.S. Cellular and TDS Telecom in which it bills an amount equal to a fixed per-unit price multiplied by a variable quantity (e.g., certain roaming agreements with other carriers). Because TDS invoices for such items in an amount that corresponds directly with the value
Contract Cost Assets
TDS expects that incremental commission fees paid as a result of obtaining contracts are recoverable and, therefore, TDS capitalizesdefers and amortizes these costs. As a practical expedient, costs with an amortization period of one year or less are not capitalized.expensed as incurred. TDS also incurs fulfillment costs, such as installation costs, where there is an expectation that a future benefit will be realized. CapitalizedDeferred commission fees and fulfillment costs are amortized based on the timing of transfer of the goods or services to which the assets relate, typically the contract term which ranges from fifteen months to thirty-nine months.term. Contract cost asset balances, which are recorded in Other assets and deferred charges in the Consolidated Balance Sheet, were as follows:
| | | | June 30, 2019 | | December 31, 2018 | June 30, 2020 | | December 31, 2019 |
| (Dollars in millions) | | | | | | |
| Costs to obtain contracts | |
| | | |
| | |
| Sales commissions | $ | 145 |
| | $ | 154 |
| $ | 137 |
| | $ | 146 |
|
| Fulfillment costs | | | | | | |
| Installation costs | 11 |
| | 10 |
| 10 |
| | 11 |
|
| Other costs | | 1 |
| | — |
|
| Total contract cost assets | $ | 156 |
| | $ | 164 |
| $ | 148 |
| | $ | 157 |
|
Amortization of contract cost assets was $30 million and $61 million for the three and six months ended June 30, 2020, respectively, and $32 million and $64 million for the three and six months ended June 30, 2019, respectively, and $30 million and $62 million for the three and six months ended June 30, 2018, respectively, and was included in Selling, general and administrative expense.expenses and Cost of services expenses.
Note 3 Fair Value Measurements
As of June 30, 20192020 and December 31, 2018,2019, TDS did not have any material financial or nonfinancial assets or liabilities that were required to be recorded at fair value in its Consolidated Balance Sheet in accordance with GAAP.
The provisions of GAAP establish a fair value hierarchy that contains three levels for inputs used in fair value measurements. Level 1 inputs include quoted market prices for identical assets or liabilities in active markets. Level 2 inputs include quoted market prices for similar assets and liabilities in active markets or quoted market prices for identical assets and liabilities in inactive markets. Level 3 inputs are unobservable. A financial instrument’s level within the fair value hierarchy is based on the lowest level of any input that is significant to the fair value measurement. A financial instrument’s level within the fair value hierarchy is not representative of its expected performance or its overall risk profile and, therefore, Level 3 assets are not necessarily higher risk than Level 2 assets or Level 1 assets.
TDS has applied the provisions of fair value accounting for purposes of computing the fair value of financial instruments for disclosure purposes as displayed below.
| | | | Level within the Fair Value Hierarchy | | June 30, 2019 | | December 31, 2018 | Level within the Fair Value Hierarchy | | June 30, 2020 | | December 31, 2019 |
| | Book Value | | Fair Value | | Book Value | | Fair Value | Book Value | | Fair Value | | Book Value | | Fair Value |
| (Dollars in millions) | | | | | | | | | | | | | | | | | | |
| Cash and cash equivalents | 1 | | $ | 834 |
| | $ | 834 |
| | $ | 921 |
| | $ | 921 |
| 1 | | $ | 565 |
| | $ | 565 |
| | $ | 465 |
| | $ | 465 |
|
| Short-term investments | 1 | | 18 |
| | 18 |
| | 17 |
| | 17 |
| |
| Long-term debt | | | | | | | | | | | | | | | | |
| Retail | 2 | | 1,753 |
| | 1,781 |
| | 1,753 |
| | 1,596 |
| 2 | | 1,753 |
| | 1,732 |
| | 1,753 |
| | 1,796 |
|
| Institutional | 2 | | 534 |
| | 578 |
| | 534 |
| | 531 |
| 2 | | 535 |
| | 630 |
| | 534 |
| | 594 |
|
| Other | 2 | | 176 |
| | 176 |
| | 182 |
| | 182 |
| 2 | | 259 |
| | 258 |
| | 84 |
| | 84 |
|
The fair values of Cash and cash equivalents and Short-term investments approximate their book values due to the short-term nature of these financial instruments. Long-term debt excludes lease obligations, other installment arrangements, the current portion of Long-term debt and debt financing costs. The fair value of “Retail” Long-term debt was estimated using market prices for TDS’ 7.0% Senior Notes, 6.875% Senior Notes, 6.625% Senior Notes and 5.875% Senior Notes, and U.S. Cellular’s 7.25% 2063 Senior Notes, 7.25% 2064 Senior Notes and 6.95% Senior Notes. TDS’ “Institutional” debt consists of U.S. Cellular’s 6.7% Senior Notes which are traded over the counter. TDS’ “Other” debt consists of a senior term loan credit agreements, receivables securitization agreement and other borrowings with financial institutions. TDS estimated the fair value of its Institutional and Other debt through a discounted cash flow analysis using the interest rates or estimated yield to maturity for each borrowing, which ranged from 4.16%1.77% to 6.75%6.63% and 5.03%3.55% to 8.00%6.25% at June 30, 20192020 and December 31, 2018,2019, respectively.
Note 4 Equipment Installment Plans
TDSU.S. Cellular sells devices to customers under equipment installment plans over a specified time period. For certain equipment installment plans, after a specified period of time or amount of payments, the customer may have the right to upgrade to a new device and have the remaining unpaid equipment installment contract balance waived, subject to certain conditions, including trading in the original device in good working condition and signing a new equipment installment contract. TDS values this trade-in right as a guarantee liability. The guarantee liability is initially measured at fair value and is determined based on assumptions including the probability and timing of the customer upgrading to a new device and the fair value of the device being traded-in at the time of trade-in. When a customer exercises the trade-in option, both the outstanding receivable and guarantee liability balances related to the respective device are reduced to zero, and the value of the used device that is received in the transaction is recognized as inventory. If the customer does not exercise the trade-in option at the time of eligibility, TDS begins amortizing the liability and records this amortization as additional equipment revenue. As of June 30, 2019 and December 31, 2018, the guarantee liability related to these plans was $10 million and $11 million, respectively, and is reflected in Customer deposits and deferred revenues in the Consolidated Balance Sheet.
The following table summarizes equipment installment plan receivables as of June 30, 20192020 and December 31, 2018.2019.
| | | | June 30, 2019 | | December 31, 2018 | June 30, 2020 | | December 31, 2019 |
| (Dollars in millions) | | | | | | |
| Equipment installment plan receivables, gross | $ | 961 |
| | $ | 974 |
| $ | 948 |
| | $ | 1,008 |
|
| Allowance for credit losses | (80 | ) | | (77 | ) | (82 | ) | | (84 | ) |
| Equipment installment plan receivables, net | $ | 881 |
| | $ | 897 |
| $ | 866 |
| | $ | 924 |
|
| | | | | | | |
| Net balance presented in the Consolidated Balance Sheet as: | | | | | | |
| Accounts receivable — Customers and agents (Current portion) | $ | 568 |
| | $ | 560 |
| $ | 562 |
| | $ | 587 |
|
| Other assets and deferred charges (Non-current portion) | 313 |
| | 337 |
| 304 |
| | 337 |
|
| Equipment installment plan receivables, net | $ | 881 |
| | $ | 897 |
| $ | 866 |
| | $ | 924 |
|
TDSU.S. Cellular uses various inputs, including internal data, information from credit bureaus and other sources, to evaluate the credit profiles of its customers. From this evaluation, a credit class is assigned to the customer that determines the number of eligible lines, the amount of credit available, and the down payment requirement, if any. Customers assigned toThese credit classes requiring no down payment represent aare grouped into four credit categories: lowest risk, lower risk, category, whereas thoseslight risk and higher risk. A customer's assigned to credit classes requiringclass is reviewed periodically and a down payment represent a higher risk category.change is made, if appropriate. An equipment installment plan billed amount is considered past due if not paid within 30 days. The balance and aging of the equipment installment plan receivables on a gross basis by credit category were as follows:
|
| | | | | | | | | | | | | | | | | | | | | | | |
| | June 30, 2019 | | December 31, 2018 |
| | Lower Risk | | Higher Risk | | Total | | Lower Risk | | Higher Risk | | Total |
| (Dollars in millions) | | | | | | | | | | | |
| Unbilled | $ | 888 |
| | $ | 9 |
| | $ | 897 |
| | $ | 904 |
| | $ | 17 |
| | $ | 921 |
|
| Billed — current | 43 |
| | 1 |
| | 44 |
| | 35 |
| | 1 |
| | 36 |
|
| Billed — past due | 18 |
| | 2 |
| | 20 |
| | 15 |
| | 2 |
| | 17 |
|
| Equipment installment plan receivables, gross | $ | 949 |
| | $ | 12 |
| | $ | 961 |
| | $ | 954 |
| | $ | 20 |
| | $ | 974 |
|
|
| | | | | | | | | | | | | | | | | | | | | | | | | | | | | | | | | | | | | | | |
| | June 30, 2020 | | December 31, 2019 |
| | Lowest Risk | | Lower Risk | | Slight Risk | | Higher Risk | | Total | | Lowest Risk | | Lower Risk | | Slight Risk | | Higher Risk | | Total |
| (Dollars in millions) | | | | | | | | | | | | | | | | | | | |
| Unbilled | $ | 764 |
| | $ | 94 |
| | $ | 22 |
| | $ | 10 |
| | $ | 890 |
| | $ | 812 |
| | $ | 99 |
| | $ | 23 |
| | $ | 8 |
| | $ | 942 |
|
| Billed — current | 36 |
| | 4 |
| | 1 |
| | 1 |
| | 42 |
| | 37 |
| | 5 |
| | 2 |
| | 1 |
| | 45 |
|
| Billed — past due | 9 |
| | 4 |
| | 2 |
| | 1 |
| | 16 |
| | 11 |
| | 6 |
| | 3 |
| | 1 |
| | 21 |
|
| Total | $ | 809 |
| | $ | 102 |
| | $ | 25 |
| | $ | 12 |
| | $ | 948 |
| | $ | 860 |
| | $ | 110 |
| | $ | 28 |
| | $ | 10 |
| | $ | 1,008 |
|
The balance of the equipment installment plan receivables as of June 30, 2020 on a gross basis by year of origination were as follows: |
| | | | | | | | | | | | | | | | | | | |
| | 2017 | | 2018 | | 2019 | | 2020 | | Total |
| (Dollars in millions) | | | | | | | | | |
| Lowest Risk | $ | 2 |
| | $ | 139 |
| | $ | 408 |
| | $ | 260 |
| | $ | 809 |
|
| Lower Risk | — |
| | 11 |
| | 51 |
| | 40 |
| | 102 |
|
| Slight Risk | — |
| | 2 |
| | 12 |
| | 11 |
| | 25 |
|
| Higher Risk | — |
| | 1 |
| | 5 |
| | 6 |
| | 12 |
|
| Total | $ | 2 |
| | $ | 153 |
| | $ | 476 |
| | $ | 317 |
| | $ | 948 |
|
Activity for the six months ended June 30, 20192020 and 2018,2019, in the allowance for credit losses for equipment installment plan receivables was as follows:
| | | | June 30, 2019 | | June 30, 2018 | June 30, 2020 | | June 30, 2019 |
| (Dollars in millions) | | | | | | |
| Allowance for credit losses, beginning of period | $ | 77 |
| | $ | 65 |
| $ | 84 |
| | $ | 77 |
|
| Bad debts expense | 38 |
| | 30 |
| 33 |
| | 38 |
|
| Write-offs, net of recoveries | (35 | ) | | (26 | ) | (35 | ) | | (35 | ) |
| Allowance for credit losses, end of period | $ | 80 |
| | $ | 69 |
| $ | 82 |
| | $ | 80 |
|
Note 5 Income Taxes
The effective tax rate on Income before income taxes was 9.6% and 6.9% for the three and six months ended June 30, 2020, respectively, and 28.8% and 31.3%, for the three and six months ended June 30, 2019, respectively. The lower effective tax rate in 2020 as compared to 2019 is due primarily to the income tax benefits of the CARES Act enacted on March 27, 2020.
The CARES Act provides retroactive eligibility of bonus depreciation on qualified improvement property put into service after December 31, 2017 and a 5-year carryback of net operating losses generated in years 2018-2020. As the statutory federal tax rate applicable to certain years within the carryback period is 35%, carryback to those years provides a tax benefit in excess of the current federal statutory rate of 21%, resulting in a reduction of income tax expense.
Note 56 Earnings Per Share
Basic earnings per share attributable to TDS shareholders is computed by dividing Net income attributable to TDS shareholders by the weighted average number of Common Shares outstanding during the period. Diluted earnings per share attributable to TDS shareholders is computed by dividing Net income attributable to TDS shareholders by the weighted average number of Common Shares outstanding during the period adjusted to include the effects of potentially dilutive securities. Potentially dilutive securities primarily include incremental shares issuable upon the exercise of outstanding stock options and the vesting of performance and restricted stock units.
The amounts used in computing basic and diluted earnings per common share and the effects of potentially dilutive securities on the weighted average number of Common Sharesattributable to TDS shareholders were as follows:
| | | | Three Months Ended
June 30, | | Six Months Ended
June 30, | Three Months Ended
June 30, | | Six Months Ended
June 30, |
| | 2019 | | 2018 | | 2019 | | 2018 | 2020 | | 2019 | | 2020 | | 2019 |
| (Dollars and shares in millions, except per share amounts) | |
| | |
| | |
| | | |
| | |
| | |
| | |
| Basic earnings per share attributable to TDS shareholders: | |
| | |
| | |
| | | |
| Net income attributable to TDS shareholders used in basic earnings per share | $ | 33 |
| | $ | 33 |
| | $ | 92 |
| | $ | 72 |
| $ | 65 |
| | $ | 33 |
| | $ | 135 |
| | $ | 92 |
|
| Adjustments to compute diluted earnings: | | | | | | | | | | | | | | |
| Noncontrolling interest adjustment | (1 | ) | | (1 | ) | | (1 | ) | | (1 | ) | — |
| | (1 | ) | | (2 | ) | | (1 | ) |
| Net income attributable to TDS shareholders used in diluted earnings per share | $ | 32 |
| | $ | 32 |
| | $ | 91 |
| | $ | 71 |
| $ | 65 |
| | $ | 32 |
| | $ | 133 |
| | $ | 91 |
|
| | | | | | | | | | | | | | | |
| Weighted average number of shares used in basic earnings per share: | | | | | | | | | | | | | | |
| Common Shares | 107 |
| | 105 |
| | 107 |
| | 105 |
| 107 |
| | 107 |
| | 108 |
| | 107 |
|
| Series A Common Shares | 7 |
| | 7 |
| | 7 |
| | 7 |
| 7 |
| | 7 |
| | 7 |
| | 7 |
|
| Total | 114 |
| | 112 |
| | 114 |
| | 112 |
| 114 |
| | 114 |
| | 115 |
| | 114 |
|
| | | | | | | | | | | �� | | | | |
| Effects of dilutive securities | 2 |
| | 1 |
| | 2 |
| | 1 |
| 1 |
| | 2 |
| | — |
| | 2 |
|
| Weighted average number of shares used in diluted earnings per share | 116 |
| | 113 |
| | 116 |
| | 113 |
| 115 |
| | 116 |
| | 115 |
| | 116 |
|
| | | | | | | | | | | | | | | |
| Basic earnings per share attributable to TDS shareholders | $ | 0.29 |
| | $ | 0.30 |
| | $ | 0.81 |
| | $ | 0.65 |
| $ | 0.57 |
| | $ | 0.29 |
| | $ | 1.18 |
| | $ | 0.81 |
|
| | | | | | | | | | | | | | | |
| Diluted earnings per share attributable to TDS shareholders | $ | 0.28 |
| | $ | 0.29 |
| | $ | 0.78 |
| | $ | 0.63 |
| $ | 0.56 |
| | $ | 0.28 |
| | $ | 1.15 |
| | $ | 0.78 |
|
Certain Common Shares issuable upon the exercise of stock options or vesting of performance and restricted stock units were not included in weighted average diluted shares outstanding for the calculation of Diluted earnings per share attributable to TDS shareholders because their effects were antidilutive. The number of such Common Shares excluded was 5 million and 4 million for the three and six months ended June 30, 2020, respectively, and less than 1 million for both the three and six months ended June 30, 2019, and 3 million and 4 million for the three and six months ended June 30, 2018, respectively.2019.
Note 67 Intangible Assets
Activity related to Licenses for the six months ended June 30, 2019,2020, is presented below:
|
| | | |
| | Licenses |
| (Dollars in millions) | |
| Balance at December 31, 2018 | $ | 2,195 |
|
| Acquisitions | 257 |
|
| Exchanges - Licenses received | 26 |
|
| Balance at June 30, 2019 | $ | 2,478 |
|
|
| | | |
| | Licenses |
| (Dollars in millions) | |
| Balance at December 31, 2019 | $ | 2,480 |
|
| Acquisitions | 147 |
|
| Capitalized interest | 3 |
|
| Balance at June 30, 2020 | $ | 2,630 |
|
In June 2019,March 2020, the FCC announced by way of public notice that U.S. Cellular was the provisional winning bidder for 408237 wireless spectrum licenses in its 28the 37, 39 and 47 GHz auctionbands (Auction 101) and 282 wireless spectrum licenses in its 24 GHz auction (Auction 102)103) for an aggregate purchase price of $256$146 million. U.S. Cellular paid $24 million of this amount in the three months ended March 31, 2020 and substantially all of the $256 millionremainder in April 2020. In June 2020, the first half of 2019. The wireless spectrum licenses are expected to befrom Auction 103 were granted by the FCC during 2019.FCC.
Note 78 Investments in Unconsolidated Entities
Investments in unconsolidated entities consist of amounts invested in entities in which TDS holds a noncontrolling interest.
TDS’ Investments in unconsolidated entities are accounted for using either the equity method or measurement alternative method as shown in the table below. The measurement alternative method was elected for investments without readily determinable fair values formerly accounted for under the cost method. The carrying value of measurement alternative method investments represents cost minus any impairments plus or minus any observable price changes.
| | | | June 30, 2019 | | December 31, 2018 | June 30, 2020 | | December 31, 2019 |
| (Dollars in millions) | |
| | |
| |
| | |
|
| Equity method investments | $ | 469 |
| | $ | 459 |
| $ | 464 |
| | $ | 467 |
|
| Measurement alternative method investments | 21 |
| | 21 |
| 22 |
| | 21 |
|
| Total investments in unconsolidated entities | $ | 490 |
| | $ | 480 |
| $ | 486 |
| | $ | 488 |
|
The following table, which is based in part on information provided in part by third parties, summarizes the combined results of operations of TDS’ equity method investments.
| | | | Three Months Ended
June 30, | | Six Months Ended
June 30, | Three Months Ended
June 30, | | Six Months Ended
June 30, |
| | 2019 | | 2018 | | 2019 | | 2018 | 2020 | | 2019 | | 2020 | | 2019 |
| (Dollars in millions) | |
| | |
| | | | | |
| | |
| | | | |
| Revenues | $ | 1,660 |
| | $ | 1,661 |
| | $ | 3,356 |
| | $ | 3,324 |
| $ | 1,586 |
| | $ | 1,660 |
| | $ | 3,249 |
| | $ | 3,356 |
|
| Operating expenses | 1,192 |
| | 1,204 |
| | 2,413 |
| | 2,417 |
| 1,098 |
| | 1,192 |
| | 2,265 |
| | 2,413 |
|
| Operating income | 468 |
| | 457 |
| | 943 |
| | 907 |
| 488 |
| | 468 |
| | 984 |
| | 943 |
|
| Other income (expense), net | 3 |
| | 1 |
| | (3 | ) | | (1 | ) | (2 | ) | | 3 |
| | 1 |
| | (3 | ) |
| Net income | $ | 471 |
| | $ | 458 |
| | $ | 940 |
| | $ | 906 |
| $ | 486 |
| | $ | 471 |
| | $ | 985 |
| | $ | 940 |
|
Note 8 Leases9 Debt
ChangeTerm Loan
In March 2020, TDS borrowed $50 million on its senior term loan credit agreement. This agreement was entered into in Accounting PolicyJanuary 2020 and amended in March 2020. The interest rate on outstanding borrowings is at a rate of LIBOR plus 200 basis points. Principal reductions are due and payable in quarterly installments of $0.5 million beginning in June 2021. The remaining unpaid balance will be due and payable in January 2027. TDS believes that it was in compliance with all of the financial covenants and other requirements set forth in its senior term loan credit agreement as of June 30, 2020.
Receivables Securitization Agreement
In February 2016,April 2020, U.S. Cellular borrowed $125 million under its receivables securitization agreement, which permits securitized borrowings using its equipment installment plan receivables. The interest rate on outstanding borrowings is at a rate of either LIBOR or applicable cost of funds plus 95 basis points. Absent an extension of the FASB issued Accounting Standards Update 2016-02, Leases receivables securitization agreement, it will terminate in December 2021, at which time any outstanding borrowings will be repaid over a time period based on the collection of equipment installment plan receivables. U.S. Cellular believes that it was in compliance with all of the financial covenants and has since amendedother requirements set forth in its receivables securitization agreement as of June 30, 2020. As of June 30, 2020, the standard with Accounting Standards Update 2018-01, Leases: Land Easement Practical Expedient for TransitionUSCC Master Note Trust held $239 million of assets available to Topic 842, Accounting Standards Update 2018-10, Codification Improvements to Topic 842, Leases, Accounting Standards Update 2018-11, Leases: Targeted Improvements, and Accounting Standards Update 2018-20, Leases: Narrow-Scope Improvements for Lessors, collectively referred tobe pledged as ASC 842. This standard replaces the previous lease accounting standard under ASC 840 - Leases and requires lessees to record a right-of-use (ROU) asset and lease liabilitycollateral for the majority of leases. TDS adopted the provisions of ASC 842 on January 1, 2019, using a modified retrospective method. Under this method, TDS elected to apply the new accounting standard only to the most recent period presented, recognizing the cumulative effect of the accounting change, if any, as an adjustment to the beginning balance of retained earnings. Accordingly, prior periods have not been recast to reflect the new accounting standard. The cumulative effect of applying the provisions of ASC 842 had no material impact on retained earnings.
TDS elected transitional practical expedients for existing leases which eliminated the requirements to reassess existing lease classification, initial direct costs, and whether contracts contain leases. TDS also elected the practical expedient related to land easements that allows it to carry forward the accounting treatment for pre-existing land easement agreements.
The cumulative effect of the adoption of ASC 842 on TDS’ Consolidated Balance Sheet as of January 1, 2019 is presented below.
|
| | | | | | | | | |
| | December 31, 2018 | ASC 842 Adjustment | January 1, 2019 |
| (Dollars in millions) | | | |
| Prepaid expenses | $ | 103 |
| $ | (13 | ) | $ | 90 |
|
| Operating lease right-of-use assets | — |
| 975 |
| 975 |
|
| Other assets and deferred charges | 616 |
| (12 | ) | 604 |
|
| Short-term operating lease liabilities | — |
| 112 |
| 112 |
|
| Other current liabilities | 114 |
| (8 | ) | 106 |
|
| Long-term operating lease liabilities | — |
| 949 |
| 949 |
|
| Other deferred liabilities and credits | 541 |
| (103 | ) | 438 |
|
In connection with the adoption of ASC 842, TDS recorded ROU assets and lease liabilities for its operating leases in its Consolidated Balance Sheet as of January 1, 2019. The amounts for ROU assets and lease liabilities initially were calculated as the discounted value of future lease payments. The difference between the ROU assets and the corresponding lease liabilities at January 1, 2019 as shown in the table above resulted from adjustments to ROU assets to account for various lease prepayments and straight-line expense recognition deferral balances which existed as of December 31, 2018. Finance leases are included in Property, plant and equipment and Long-term debt, net consistent with the presentation under prior accounting standards.
Lessee Agreements
A lease is generally present in a contract if the lessee controls the use of identified property, plant or equipment for a period of time in exchange for consideration. Nearly all of TDS’ leases are classified as operating leases, although it does have a small number of finance leases. TDS’ most significant leases are for land and tower spaces, network facilities, retail spaces, and offices.
TDS has agreements with both lease and nonlease components, which are accounted for separately. As part of the present value calculation for the lease liabilities, TDS uses an incremental borrowing rate as the rates implicit in the leases are not readily determinable. The incremental borrowing rates used for lease accounting are based on TDS' unsecured rates, adjusted to approximate the rates at which TDS would be required to borrow on a collateralized basis over a term similar to the recognized lease term. TDS applies the incremental borrowing rates to lease components using a portfolio approach based upon the length of the lease term and the reporting entity in which the lease resides. The cost of nonlease components in TDS’ lease portfolio (e.g., utilities and common area maintenance) are not typically predetermined at lease commencement and are expensed as incurred at their relative standalone price.
Variable lease expense occurs when, subsequent to the lease commencement, lease payments are made that were not originally included in the lease liability calculation. TDS’ variable lease payments are primarily a result of leases with escalations that are tied to an index. The incremental changes due to the index changes are recorded as variable lease expense and are not included in the ROU assets or lease liabilities.
Lease term recognition determines the periods to which expense is allocated and also has a significant impact on the ROU asset and lease liability calculations. Many of TDS’ leases include renewal and early termination options. At lease commencement, the lease terms include options to extend the lease when TDS is reasonably certain that it will exercise the options. The lease terms do not include early termination options unless TDS is reasonably certain to exercise the options. Certain asset classes have similar lease characteristics; therefore, TDS has applied the portfolio approach for lease term recognition for its tower space, retail, and certain ground lease asset classes.
The following table shows the components of lease cost included in the Consolidated Statement of Operations: |
| | | | | | | |
| | Three Months Ended
June 30, 2019 | | Six Months Ended
June 30, 2019 |
| (Dollars in millions) | | | |
| Operating lease cost | $ | 44 |
| | $ | 87 |
|
| Financing lease cost: | | | |
| Amortization of ROU assets | 1 |
| | 1 |
|
| Variable lease cost | 2 |
| | 4 |
|
| Total lease cost | $ | 47 |
| | $ | 92 |
|
The following table shows supplemental cash flow information related to lease activities: |
| | | |
| | Six Months Ended
June 30, 2019 |
| (Dollars in millions) | |
| Cash paid for amounts included in the measurement of lease liabilities: | |
| Operating cash flows from operating leases | $ | 84 |
|
| ROU assets obtained in exchange for lease obligations: | |
| Operating leases | $ | 57 |
|
| Finance leases | 7 |
|
The following table shows the classification of TDS’ operating and finance leases in its Consolidated Balance Sheet: |
| | | |
| | June 30, 2019 |
| (Dollars in millions) | |
| Operating Leases | |
| Operating lease right-of-use assets | $ | 963 |
|
| | |
| Short-term operating lease liabilities | $ | 112 |
|
| Long-term operating lease liabilities | 927 |
|
| Total operating lease liabilities | $ | 1,039 |
|
| | |
| Finance Leases | |
|
| Property, plant and equipment | $ | 17 |
|
| Less: Accumulated depreciation and amortization | 4 |
|
| Property, plant and equipment, net | $ | 13 |
|
| Current portion of long-term debt | $ | 1 |
|
| Long-term debt, net | 5 |
|
| Total finance lease liabilities | $ | 6 |
|
The table below shows a weighted-average analysis for lease term and discount rate for all leases: |
| | |
| June 30, 2019 |
Weighted Average Remaining Lease Term | |
Operating leases | 12 years |
|
Finance leases | 23 years |
|
| |
Weighted Average Discount Rate | |
Operating leases | 4.5 | % |
Finance leases | 6.9 | % |
The maturities of lease liabilities are as follows: |
| | | | | | | |
| | Operating Leases | | Finance Leases |
| (Dollars in millions) | | | |
| Remainder of 2019 | $ | 73 |
| | $ | 1 |
|
| 2020 | 162 |
| | 1 |
|
| 2021 | 147 |
| | — |
|
| 2022 | 131 |
| | 1 |
|
| 2023 | 116 |
| | — |
|
| Thereafter | 791 |
| | 13 |
|
Total lease payments1 | $ | 1,420 |
| | $ | 16 |
|
| Less: Imputed interest | 381 |
| | 10 |
|
| Present value of lease liabilities | $ | 1,039 |
| | $ | 6 |
|
| |
1
| Lease payments exclude $8 million of legally binding lease payments for leases signed but not yet commenced. |
Lessor Agreements
TDS’ most significant lessor leases are for tower space and colocation space. All of TDS’ lessor leases are classified as operating leases. A lease is generally present in a contract if the lessee controls the use of identified property, plant, or equipment for a period of time in exchange for consideration. TDS’ lessor agreements with lease and nonlease components are generally accounted for separately; however, certain service agreements with insignificant lease components are accounted for as nonlease transactions.
Lease term recognition determines the periods to which revenue is allocated over the term of the lease. Many of TDS’ leases include renewal and early termination options. At lease commencement, lease terms include options to extend the lease when TDS is reasonably certain that lessees will exercise the options. Lease terms would not include periods after the date of a termination option that lessees are reasonably certain to exercise.
Variable lease income occurs when, subsequent to the lease commencement, lease payments are received that were not originally included in the lease receivable calculation. TDS’ variable lease income is primarily a result of leases with escalations that are tied to an index. The incremental increases due to the index changes are recorded as variable lease income.
The following table shows the components of lease income which are included in service revenue in the Consolidated Statement of Operations: |
| | | | | | | |
| | Three Months Ended
June 30, 2019 | | Six Months Ended
June 30, 2019 |
| (Dollars in millions) | | | |
| Operating lease income | $ | 23 |
| | $ | 45 |
|
The maturities of expected lease payments to be received are as follows: |
| | | |
| | Operating Leases |
| (Dollars in millions) | |
| Remainder of 2019 | $ | 39 |
|
| 2020 | 80 |
|
| 2021 | 45 |
|
| 2022 | 31 |
|
| 2023 | 19 |
|
| Thereafter | 14 |
|
| Total future lease maturities | $ | 228 |
|
Disclosures under ASC 840
As of December 31, 2018, future minimum rental payments required under operating leases and rental receipts expected under operating leases that have noncancellable lease terms in excess of one year were as follows: |
| | | | | | | |
| | Operating Leases Future Minimum Rental Payments | | Operating Leases Future Minimum Rental Receipts |
| (Dollars in millions) | | | |
| 2019 | $ | 170 |
| | $ | 59 |
|
| 2020 | 158 |
| | 48 |
|
| 2021 | 142 |
| | 35 |
|
| 2022 | 126 |
| | 23 |
|
| 2023 | 110 |
| | 10 |
|
| Thereafter | 784 |
| | 7 |
|
| Total | $ | 1,490 |
| | $ | 182 |
|
Note 910 Variable Interest Entities
Consolidated VIEs
TDS consolidates VIEs in which it has a controlling financial interest as defined by GAAP and is therefore deemed the primary beneficiary. ATDS reviews the criteria for a controlling financial interest will have both of the following characteristics: (a) the power to direct the VIE activities that most significantly impact economic performance; and (b) the obligation to absorb the VIE losses and the right to receive benefits that are significant to the VIE. TDS reviews these criteria initially at the time it enters into agreements and subsequently when events warranting reconsideration occur. These VIEs have risks similar to those described in the “Risk Factors” in this Form 10-Q and TDS’ Form 10-K for the year ended December 31, 2018.2019.
During 2017, U.S. Cellular formed USCC EIP LLC (Seller/Sub-Servicer), USCC Receivables Funding LLC (Transferor) and the USCC Master Note Trust (Trust), collectively the special purpose entities (SPEs), to facilitate a securitized borrowing using its equipment installment plan receivables. Under a Receivables Sale Agreement, U.S. Cellular wholly-owned, majority-owned and unconsolidated entities, collectively referred to as “affiliated entities”, transfer device equipment installment plan contracts to the Seller/Sub-Servicer. The Seller/Sub-Servicer aggregates device equipment installment plan contracts, and performs servicing, collection and all other administrative activities related to accounting for the equipment installment plan contracts. The Seller/Sub-Servicer sells the eligible equipment installment plan receivables to the Transferor, a bankruptcy remote entity, which subsequently sells the receivables to the Trust. The Trust, which is bankruptcy remote and isolated from the creditors of U.S. Cellular, will be responsible for issuing asset-backed variable funding notes (Notes), which are collateralized by the equipment installment plan receivables owned by the Trust. Given that U.S. Cellular has the power to direct the activities of these SPEs, and that these SPEs lack sufficient equity to finance their activities, U.S. Cellular is deemed to have a controlling financial interest in the SPEs and, therefore, consolidates them. All transactions with third parties (e.g., issuance of the asset-backed variable funding notes) will be accounted for as a secured borrowing due to the pledging of equipment installment plan contracts as collateral, significant continuing involvement in the transferred assets, subordinated interests of the cash flows, and continued evidence of control of the receivables.
The following VIEs were formed to participate in FCC auctions of wireless spectrum licenses and to fund, establish, and provide wireless service with respect to any FCC wireless spectrum licenses won in the auctions:
| |
| ▪ | Advantage Spectrum, L.P. (Advantage Spectrum) and Sunshine Spectrum, Inc., the general partner of Advantage Spectrum; and |
| |
| ▪ | King Street Wireless, L.P. (King Street Wireless) and King Street Wireless, Inc., the general partner of King Street Wireless. |
These particular VIEs are collectively referred to as designated entities. The power to direct the activities that most significantly impact the economic performance of these VIEs is shared. Specifically, the general partner of these VIEs has the exclusive right to manage, operate and control the limited partnerships and make all decisions to carry on the business of the partnerships. The general partner of each partnership needs the consent of the limited partner, an indirect TDS subsidiary, to sell or lease certain wireless spectrum licenses, to make certain large expenditures, admit other partners or liquidate the limited partnerships. Although the power to direct the activities of these VIEs is shared, TDS has the most significant level of exposure to the variability associated with the economic performance of the VIEs, indicating that TDS is the primary beneficiary of the VIEs. Therefore, in accordance with GAAP, these VIEs are consolidated.
TDS also consolidates other VIEs that are limited partnerships that provide wireless service. A limited partnership is a variable interest entity unless the limited partners hold substantive participating rights or kick-out rights over the general partner. For certain limited partnerships, U.S. Cellular is the general partner and manages the operations. In these partnerships, the limited partners do not have substantive kick-out or participating rights and, further, such limited partners do not have the authority to remove the general partner. Therefore, these limited partnerships also are also recognized as VIEs and are consolidated under the variable interest model.
The following table presents the classification and balances of the consolidated VIEs’ assets and liabilities in TDS’ Consolidated Balance Sheet. | | | | June 30, 2019 | | December 31, 2018 | June 30, 2020 | | December 31, 2019 |
| (Dollars in millions) | | | | | | |
| Assets | | | | | | |
| Cash and cash equivalents | $ | 8 |
| | $ | 9 |
| $ | 18 |
| | $ | 19 |
|
| Short-term investments | 18 |
| | 17 |
| |
| Accounts receivable | 616 |
| | 609 |
| 608 |
| | 637 |
|
| Inventory, net | 4 |
| | 5 |
| 3 |
| | 5 |
|
| Other current assets | 5 |
| | 5 |
| 19 |
| | 7 |
|
| Licenses | 647 |
| | 647 |
| 647 |
| | 647 |
|
| Property, plant and equipment, net | 84 |
| | 88 |
| 98 |
| | 95 |
|
| Operating lease right-of-use assets | 40 |
| | — |
| 42 |
| | 42 |
|
| Other assets and deferred charges | 322 |
| | 347 |
| 311 |
| | 347 |
|
| Total assets | $ | 1,744 |
| | $ | 1,727 |
| $ | 1,746 |
| | $ | 1,799 |
|
| | | | | | | |
| Liabilities | | | | | | |
| Current liabilities | $ | 32 |
| | $ | 31 |
| $ | 28 |
| | $ | 30 |
|
| Long-term operating lease liabilities | 37 |
| | — |
| 38 |
| | 39 |
|
| Other deferred liabilities and credits | 11 |
| | 15 |
| 13 |
| | 13 |
|
| Total liabilities | $ | 80 |
| | $ | 46 |
| $ | 79 |
| | $ | 82 |
|
Unconsolidated VIEs
TDS manages the operations of and holds a variable interest in certain other limited partnerships, but is not the primary beneficiary of these entities and, therefore, does not consolidate them under the variable interest model.
TDS’ total investment in these unconsolidated entities was $4$5 million at both June 30, 20192020 and December 31, 2018,2019, and is included in Investments in unconsolidated entities in TDS’ Consolidated Balance Sheet. The maximum exposure from unconsolidated VIEs is limited to the investment held by TDS in those entities.
Other Related Matters
TDS made contributions, loans and/or advances to its VIEs totaling $208$88 million and $51$208 million, during the six months ended June 30, 2020 and 2019, and 2018, respectively;respectively, of which $67 million in 2020 and $184 million in 2019, and $33 million in 2018, are related to USCC EIP LLC as discussed above. TDS may agree to make additional capital contributions and/or advances to these or other VIEs and/or to their general partners to provide additional funding for operations or the development of wireless spectrum licenses granted in various auctions. TDS may finance such amounts with a combination of cash on hand, borrowings under its revolving credit agreementor receivables securitization agreements and/or other long-term debt. There is no assurance that TDS will be able to obtain additional financing on commercially reasonable terms or at all to provide such financial support.
The limited partnership agreementsagreement of Advantage Spectrum and King Street Wireless also provideprovides the general partner with a put option whereby the general partner may require the limited partner, a subsidiary of U.S. Cellular, to purchase its interest in the limited partnership. The general partner’s put options related to its interests in King Street Wireless will become exercisable in the fourth quarter of 2019. The general partner’s put optionsoption related to its interest in Advantage Spectrum will becomebe exercisable in 2021, and if not exercised at that time, will be exercisable in 2022. The greater of the carrying value of the general partner's investment or the value of the put option, net of any borrowings due to TDS, is recorded as Noncontrolling interests with redemption features in TDS’ Consolidated Balance Sheet. Also in accordance with GAAP, minority share of income or changes in the redemption value of the put options,option, net of interest accrued on the loans, are recorded as a component of Net income attributable to noncontrolling interests, net of tax, in TDS’ Consolidated Statement of Operations.
During the first quarter of 2018, TDS recorded an out-of-period adjustment attributable to 2016 and 2017 due to errors in the application of accounting guidance applicable to the calculation of Noncontrolling interests with redemption features related to King Street Wireless, Inc. This out-of-period adjustment had the impact of increasing Net income attributable to noncontrolling interests, net of tax, by $6 million and decreasing Net income attributable to TDS shareholders by $6 million for the six months ended June 30, 2018. TDS determined that this adjustment was not material to any of the periods impacted.
Note 1011 Noncontrolling Interests
The following schedule discloses the effects of Net income attributable to TDS shareholders and changes in TDS’ ownership interest in U.S. Cellular on TDS’ equity:
| | | Six Months Ended June 30, | 2019 | | 2018 | 2020 | | 2019 |
| (Dollars in millions) | | | | | | |
| Net income attributable to TDS shareholders | $ | 92 |
| | $ | 72 |
| $ | 135 |
| | $ | 92 |
|
| Transfers to noncontrolling interests | | | | |
| Transfers (to) from noncontrolling interests | | | | |
| Change in TDS' Capital in excess of par value from U.S. Cellular's issuance of U.S. Cellular shares | (23 | ) | | (17 | ) | (32 | ) | | (23 | ) |
| Change in TDS' Capital in excess of par value from U.S. Cellular's repurchases of U.S. Cellular shares | — |
| | — |
| 14 |
| | — |
|
| Purchase of ownership in subsidiaries from noncontrolling interests | — |
| | — |
| |
| Net transfers to noncontrolling interests | (23 | ) | | (17 | ) | |
| Change from net income attributable to TDS and transfers to noncontrolling interests | $ | 69 |
| | $ | 55 |
| |
| Net transfers (to) from noncontrolling interests | | (18 | ) | | (23 | ) |
| Changes from net income attributable to TDS shareholders and transfers (to) from noncontrolling interests | | $ | 117 |
| | $ | 69 |
|
Note 1112 Business Segment Information
U.S. Cellular and TDS Telecom are billed for services they receive from TDS, consisting primarily of information processing, accounting and finance, and general management services. Such billings are based on expenses specifically identified to U.S. Cellular and TDS Telecom and on allocations of common expenses. Management believes the method used to allocate common expenses is reasonable and that all expenses and costs applicable to U.S. Cellular and TDS Telecom are reflected in the accompanying business segment information on a basis that is representative of what they would have been if U.S. Cellular and TDS Telecom operated on a stand-alone basis.
Financial data for TDS’ reportable segments for the three and six month periods ended, or as of June 30, 20192020 and 2018,2019, is as follows. See Note 1 — Basis of Presentation for additional information.
|
| | | | | | | | | | | | | | | | | | | | | | | |
| | | | TDS Telecom | | | | |
| Three Months Ended or as of June 30, 2019 | U.S. Cellular | | Wireline | | Cable | | TDS Telecom Total1 | | Corporate, Eliminations and Other | | Total |
| (Dollars in millions) | | | | | | | | | | | |
| Operating revenues | | | | | | | | | | | |
| Service | $ | 757 |
| | $ | 172 |
| | $ | 62 |
| | $ | 233 |
| | $ | 23 |
| | $ | 1,013 |
|
| Equipment and product sales | 216 |
| | — |
| | — |
| | — |
| | 32 |
| | 248 |
|
| Total operating revenues | 973 |
| | 172 |
| | 62 |
| | 233 |
| | 55 |
| | 1,261 |
|
| Cost of services (excluding Depreciation, amortization and accretion reported below) | 193 |
| | 64 |
| | 27 |
| | 91 |
| | 20 |
| | 304 |
|
| Cost of equipment and products | 224 |
| | — |
| | — |
| | — |
| | 25 |
| | 249 |
|
| Selling, general and administrative | 344 |
| | 49 |
| | 15 |
| | 64 |
| | 13 |
| | 421 |
|
| Depreciation, amortization and accretion | 177 |
| | 33 |
| | 17 |
| | 50 |
| | 7 |
| | 234 |
|
| (Gain) loss on asset disposals, net | 5 |
| | (1 | ) | | — |
| | (1 | ) | | 1 |
| | 5 |
|
| Operating income (loss) | 30 |
| | 27 |
| | 2 |
| | 29 |
| | (11 | ) | | 48 |
|
| Equity in earnings of unconsolidated entities | 40 |
| | — |
| | — |
| | — |
| | 1 |
| | 41 |
|
| Interest and dividend income | 5 |
| | 3 |
| | — |
| | 3 |
| | 1 |
| | 9 |
|
| Interest expense | (29 | ) | | 1 |
| | — |
| | 1 |
| | (15 | ) | | (43 | ) |
| Income (loss) before income taxes | 46 |
| | 30 |
| | 3 |
| | 33 |
| | (24 | ) | | 55 |
|
Income tax expense (benefit)2 | 14 |
| |
|
| |
|
| | 8 |
| | (6 | ) | | 16 |
|
| Net income (loss) | 32 |
| |
|
| |
|
| | 25 |
| | (18 | ) | | 39 |
|
| Add back: | | | | | | | | | | | |
| Depreciation, amortization and accretion | 177 |
| | 33 |
| | 17 |
| | 50 |
| | 7 |
| | 234 |
|
| (Gain) loss on asset disposals, net | 5 |
| | (1 | ) | | — |
| | (1 | ) | | 1 |
| | 5 |
|
| Interest expense | 29 |
| | (1 | ) | | — |
| | (1 | ) | | 15 |
| | 43 |
|
Income tax expense (benefit)2 | 14 |
| |
|
| |
|
| | 8 |
| | (6 | ) | | 16 |
|
Adjusted EBITDA3 | $ | 257 |
| | $ | 62 |
| | $ | 20 |
| | $ | 82 |
| | $ | (2 | ) | | $ | 337 |
|
| |
|
| |
|
| |
|
| |
|
| |
|
| |
|
|
| Investments in unconsolidated entities | $ | 450 |
| | $ | 4 |
| | $ | — |
| | $ | 4 |
| | $ | 36 |
| | $ | 490 |
|
| Total assets | $ | 8,223 |
| | $ | 1,377 |
| | $ | 641 |
| | $ | 2,009 |
| | $ | 563 |
| | $ | 10,795 |
|
| Capital expenditures | $ | 195 |
| | $ | 55 |
| | $ | 15 |
| | $ | 70 |
| | $ | (1 | ) | | $ | 264 |
|
|
| | | | | | | | | | | | | | | | | | | | | | | |
| | | | TDS Telecom | | | | |
| Three Months Ended or as of June 30, 2018 | U.S. Cellular | | Wireline | | Cable | | TDS Telecom Total1 | | Corporate, Eliminations and Other | | Total |
| (Dollars in millions) | | | | | | | | | | | |
| Operating revenues | | | | | | | | | | | |
| Service | $ | 741 |
| | $ | 173 |
| | $ | 57 |
| | $ | 230 |
| | $ | 22 |
| | $ | 993 |
|
| Equipment and product sales | 233 |
| | — |
| | — |
| | 1 |
| | 28 |
| | 262 |
|
| Total operating revenues | 974 |
| | 174 |
| | 57 |
| | 230 |
| | 51 |
| | 1,255 |
|
| Cost of services (excluding Depreciation, amortization and accretion reported below) | 187 |
| | 67 |
| | 27 |
| | 93 |
| | 20 |
| | 300 |
|
| Cost of equipment and products | 240 |
| | — |
| | — |
| | — |
| | 26 |
| | 266 |
|
| Selling, general and administrative | 342 |
| | 50 |
| | 15 |
| | 64 |
| | 11 |
| | 417 |
|
| Depreciation, amortization and accretion | 159 |
| | 36 |
| | 18 |
| | 53 |
| | 8 |
| | 220 |
|
| (Gain) loss on asset disposals, net | 1 |
| | 1 |
| | — |
| | 1 |
| | — |
| | 2 |
|
| (Gain) loss on license sales and exchanges, net | (11 | ) | | — |
| | — |
| | — |
| | — |
| | (11 | ) |
| Operating income (loss) | 56 |
| | 21 |
| | (3 | ) | | 18 |
| | (13 | ) | | 61 |
|
| Equity in earnings of unconsolidated entities | 40 |
| | — |
| | — |
| | — |
| | — |
| | 40 |
|
| Interest and dividend income | 3 |
| | 2 |
| | — |
| | 2 |
| | 1 |
| | 6 |
|
| Interest expense | (29 | ) | | — |
| | — |
| | — |
| | (14 | ) | | (43 | ) |
| Other, net | — |
| | 1 |
| | — |
| | 1 |
| | — |
| | 1 |
|
| Income (loss) before income taxes | 70 |
| | 24 |
| | (2 | ) | | 21 |
| | (26 | ) | | 65 |
|
Income tax expense (benefit)2 | 18 |
| |
|
| |
|
| | 5 |
| | (2 | ) | | 21 |
|
| Net income (loss) | 52 |
| |
|
| |
|
| | 16 |
| | (24 | ) | | 44 |
|
| Add back: | | | | | | | | | | | |
| Depreciation, amortization and accretion | 159 |
| | 36 |
| | 18 |
| | 53 |
| | 8 |
| | 220 |
|
| (Gain) loss on asset disposals, net | 1 |
| | 1 |
| | — |
| | 1 |
| | — |
| | 2 |
|
| (Gain) loss on license sales and exchanges, net | (11 | ) | | — |
| | — |
| | — |
| | — |
| | (11 | ) |
| Interest expense | 29 |
| | — |
| | — |
| | — |
| | 14 |
| | 43 |
|
Income tax expense (benefit)2 | 18 |
| |
|
| |
|
| | 5 |
| | (2 | ) | | 21 |
|
Adjusted EBITDA3 | $ | 248 |
| | $ | 59 |
| | $ | 16 |
| | $ | 75 |
| | $ | (4 | ) | | $ | 319 |
|
| | | | | | | | | | | | |
| Investments in unconsolidated entities | $ | 439 |
| | $ | 4 |
| | $ | — |
| | $ | 4 |
| | $ | 34 |
| | $ | 477 |
|
| Total assets | $ | 7,075 |
| | $ | 1,260 |
| | $ | 643 |
| | $ | 1,893 |
| | $ | 530 |
| | $ | 9,498 |
|
| Capital expenditures | $ | 86 |
| | $ | 33 |
| | $ | 13 |
| | $ | 46 |
| | $ | 6 |
| | $ | 138 |
|
|
| | | | | | | | | | | | | | | | | | | | | | | |
| | | | TDS Telecom | | | | |
| Three Months Ended or as of June 30, 2020 | U.S. Cellular | | Wireline | | Cable | | TDS Telecom Total1 | | Corporate, Eliminations and Other | | Total |
| (Dollars in millions) | | | | | | | | | | | |
| Operating revenues | | | | | | | | | | | |
| Service | $ | 753 |
| | $ | 169 |
| | $ | 71 |
| | $ | 240 |
| | $ | 23 |
| | $ | 1,016 |
|
| Equipment and product sales | 220 |
| | — |
| | — |
| | — |
| | 27 |
| | 247 |
|
| Total operating revenues | 973 |
| | 169 |
| | 71 |
| | 241 |
| | 49 |
| | 1,263 |
|
| Cost of services (excluding Depreciation, amortization and accretion reported below) | 197 |
| | 63 |
| | 30 |
| | 92 |
| | 17 |
| | 306 |
|
| Cost of equipment and products | 218 |
| | — |
| | — |
| | — |
| | 23 |
| | 241 |
|
| Selling, general and administrative | 323 |
| | 48 |
| | 17 |
| | 66 |
| | 9 |
| | 398 |
|
| Depreciation, amortization and accretion | 178 |
| | 32 |
| | 20 |
| | 51 |
| | 7 |
| | 236 |
|
| (Gain) loss on asset disposals, net | 4 |
| | — |
| | — |
| | — |
| | — |
| | 4 |
|
| Operating income (loss) | 53 |
| | 27 |
| | 4 |
| | 31 |
| | (6 | ) | | 78 |
|
| Equity in earnings of unconsolidated entities | 44 |
| | — |
| | — |
| | — |
| | — |
| | 44 |
|
| Interest and dividend income | 1 |
| | 1 |
| | — |
| | 1 |
| | — |
| | 2 |
|
| Interest expense | (25 | ) | | 1 |
| | — |
| | 1 |
| | (14 | ) | | (38 | ) |
| Income (loss) before income taxes | 73 |
| | 28 |
| | 4 |
| | 33 |
| | (20 | ) | | 86 |
|
Income tax expense (benefit)2 | 4 |
| |
|
| |
|
| | 5 |
| | (1 | ) | | 8 |
|
| Net income (loss) | 69 |
| |
|
| |
|
| | 28 |
| | (19 | ) | | 78 |
|
| Add back: | | | | | | | | | | | |
| Depreciation, amortization and accretion | 178 |
| | 32 |
| | 20 |
| | 51 |
| | 7 |
| | 236 |
|
| (Gain) loss on asset disposals, net | 4 |
| | — |
| | — |
| | — |
| | — |
| | 4 |
|
| Interest expense | 25 |
| | (1 | ) | | — |
| | (1 | ) | | 14 |
| | 38 |
|
Income tax expense (benefit)2 | 4 |
| |
|
| |
|
| | 5 |
| | (1 | ) | | 8 |
|
Adjusted EBITDA3 | $ | 280 |
| | $ | 59 |
| | $ | 24 |
| | $ | 83 |
| | $ | 1 |
| | $ | 364 |
|
| |
|
| |
|
| |
|
| |
|
| |
|
| |
|
|
| Investments in unconsolidated entities | $ | 445 |
| | $ | 4 |
| | $ | — |
| | $ | 4 |
| | $ | 37 |
| | $ | 486 |
|
| Total assets | $ | 8,500 |
| | $ | 1,495 |
| | $ | 725 |
| | $ | 2,210 |
| | $ | 451 |
| | $ | 11,161 |
|
| Capital expenditures | $ | 168 |
| | $ | 58 |
| | $ | 17 |
| | $ | 75 |
| | $ | 4 |
| | $ | 247 |
|
| | | | | | TDS Telecom | | | | | | | TDS Telecom | | | | |
| Six Months Ended or as of June 30, 2019 | U.S. Cellular | | Wireline | | Cable | | TDS Telecom Total1 | | Corporate, Eliminations and Other | | Total | |
| Three Months Ended or as of June 30, 2019 | | U.S. Cellular | | Wireline | | Cable | | TDS Telecom Total1 | | Corporate, Eliminations and Other | | Total |
| (Dollars in millions) | | | | | | | | | | | | | | | | | | | | | | |
| Operating revenues |
| |
| |
| |
| |
| |
| | | | | | | | | | | |
| Service | $ | 1,498 |
| | $ | 342 |
| | $ | 121 |
| | $ | 463 |
| | $ | 47 |
| | $ | 2,008 |
| $ | 757 |
| | $ | 172 |
| | $ | 62 |
| | $ | 233 |
| | $ | 23 |
| | $ | 1,013 |
|
| Equipment and product sales | 441 |
| | 1 |
| | — |
| | 1 |
| | 68 |
| | 510 |
| 216 |
| | — |
| | — |
| | — |
| | 32 |
| | 248 |
|
| Total operating revenues | 1,939 |
| | 343 |
| | 121 |
| | 464 |
| | 115 |
| | 2,518 |
| 973 |
| | 172 |
| | 62 |
| | 233 |
| | 55 |
| | 1,261 |
|
| Cost of services (excluding Depreciation, amortization and accretion reported below) | 369 |
| | 127 |
| | 52 |
| | 179 |
| | 40 |
| | 588 |
| 193 |
| | 64 |
| | 27 |
| | 91 |
| | 20 |
| | 304 |
|
| Cost of equipment and products | 458 |
| | 1 |
| | — |
| | 1 |
| | 54 |
| | 513 |
| 224 |
| | — |
| | — |
| | — |
| | 25 |
| | 249 |
|
| Selling, general and administrative | 669 |
| | 96 |
| | 30 |
| | 125 |
| | 25 |
| | 819 |
| 344 |
| | 49 |
| | 15 |
| | 64 |
| | 13 |
| | 421 |
|
| Depreciation, amortization and accretion | 345 |
| | 66 |
| | 34 |
| | 100 |
| | 15 |
| | 460 |
| 177 |
| | 33 |
| | 17 |
| | 50 |
| | 7 |
| | 234 |
|
| (Gain) loss on asset disposals, net | 7 |
| | (8 | ) | | 1 |
| | (8 | ) | | 1 |
| | — |
| 5 |
| | (1 | ) | | — |
| | (1 | ) | | 1 |
| | 5 |
|
| (Gain) loss on sale of business and other exit costs, net | (2 | ) | | — |
| | — |
| | — |
| | — |
| | (2 | ) | |
| (Gain) loss on license sales and exchanges, net | (2 | ) | | — |
| | — |
| | — |
| | — |
| | (2 | ) | |
| Operating income (loss) | 95 |
| | 61 |
| | 5 |
| | 66 |
| | (19 | ) | | 142 |
| 30 |
| | 27 |
| | 2 |
| | 29 |
| | (11 | ) | | 48 |
|
| Equity in earnings of unconsolidated entities | 84 |
| | — |
| | — |
| | — |
| | 1 |
| | 85 |
| 40 |
| | — |
| | — |
| | — |
| | 1 |
| | 41 |
|
| Interest and dividend income | 11 |
| | 5 |
| | 1 |
| | 6 |
| | — |
| | 17 |
| 5 |
| | 3 |
| | — |
| | 3 |
| | 1 |
| | 9 |
|
| Interest expense | (58 | ) | | 1 |
| | — |
| | 1 |
| | (29 | ) | | (86 | ) | (29 | ) | | 1 |
| | — |
| | 1 |
| | (15 | ) | | (43 | ) |
| Other, net | (1 | ) | | — |
| | — |
| | — |
| | 2 |
| | 1 |
| |
| Income (loss) before income taxes | 131 |
| | 68 |
| | 6 |
| | 74 |
| | (46 | ) | | 159 |
| 46 |
| | 30 |
| | 3 |
| | 33 |
| | (24 | ) | | 55 |
|
Income tax expense (benefit)2 | 41 |
| |
|
| |
|
| | 18 |
| | (9 | ) | | 50 |
| 14 |
| |
|
| |
|
| | 8 |
| | (6 | ) | | 16 |
|
| Net income (loss) | 90 |
| |
|
| |
|
| | 56 |
| | (37 | ) | | 109 |
| 32 |
| |
|
| |
|
| | 25 |
| | (18 | ) | | 39 |
|
| Add back: |
|
| |
|
| |
|
| |
|
| |
|
| |
|
| | | | | | | | | | | |
| Depreciation, amortization and accretion | 345 |
| | 66 |
| | 34 |
| | 100 |
| | 15 |
| | 460 |
| 177 |
| | 33 |
| | 17 |
| | 50 |
| | 7 |
| | 234 |
|
| (Gain) loss on asset disposals, net | 7 |
| | (8 | ) | | 1 |
| | (8 | ) | | 1 |
| | — |
| 5 |
| | (1 | ) | | — |
| | (1 | ) | | 1 |
| | 5 |
|
| (Gain) loss on sale of business and other exit costs, net | (2 | ) | | — |
| | — |
| | — |
| | — |
| | (2 | ) | |
| (Gain) loss on license sales and exchanges, net | (2 | ) | | — |
| | — |
| | — |
| | — |
| | (2 | ) | |
| Interest expense | 58 |
| | (1 | ) | | — |
| | (1 | ) | | 29 |
| | 86 |
| 29 |
| | (1 | ) | | — |
| | (1 | ) | | 15 |
| | 43 |
|
Income tax expense (benefit)2 | 41 |
| |
|
| |
|
| | 18 |
| | (9 | ) | | 50 |
| 14 |
| |
|
| |
|
| | 8 |
| | (6 | ) | | 16 |
|
Adjusted EBITDA3 | $ | 537 |
| | $ | 125 |
| | $ | 40 |
| | $ | 165 |
| | $ | (1 | ) | | $ | 701 |
| $ | 257 |
| | $ | 62 |
| | $ | 20 |
| | $ | 82 |
| | $ | (2 | ) | | $ | 337 |
|
| |
|
| |
|
| |
|
| |
|
| |
|
| |
|
| | | | | | | | | | | |
| Investments in unconsolidated entities | | $ | 450 |
| | $ | 4 |
| | $ | — |
| | $ | 4 |
| | $ | 36 |
| | $ | 490 |
|
| Total assets | | $ | 8,223 |
| | $ | 1,377 |
| | $ | 641 |
| | $ | 2,009 |
| | $ | 563 |
| | $ | 10,795 |
|
| Capital expenditures | $ | 297 |
| | $ | 84 |
| | $ | 28 |
| | $ | 112 |
| | $ | 2 |
| | $ | 411 |
| $ | 195 |
| | $ | 55 |
| | $ | 15 |
| | $ | 70 |
| | $ | (1 | ) | | $ | 264 |
|
| | | | | | TDS Telecom | | | | | | | TDS Telecom | | | | |
| Six Months Ended or as of June 30, 2018 | U.S. Cellular | | Wireline | | Cable | | TDS Telecom Total1 | | Corporate, Eliminations and Other | | Total | |
| Six Months Ended or as of June 30, 2020 | | U.S. Cellular | | Wireline | | Cable | | TDS Telecom Total1 | | Corporate, Eliminations and Other | | Total |
| (Dollars in millions) | | | | | | | | | | | | | | | | | | | | | | |
| Operating revenues | | | | | | | | | | | |
| |
| |
| |
| |
| |
|
| Service | $ | 1,465 |
| | $ | 348 |
| | $ | 112 |
| | $ | 460 |
| | $ | 45 |
| | $ | 1,970 |
| $ | 1,515 |
| | $ | 338 |
| | $ | 142 |
| | $ | 480 |
| | $ | 47 |
| | $ | 2,042 |
|
| Equipment and product sales | 450 |
| | 1 |
| | — |
| | 1 |
| | 59 |
| | 510 |
| 422 |
| | — |
| | — |
| | 1 |
| | 59 |
| | 482 |
|
| Total operating revenues | 1,915 |
| | 349 |
| | 112 |
| | 461 |
| | 104 |
| | 2,480 |
| 1,937 |
| | 339 |
| | 142 |
| | 481 |
| | 106 |
| | 2,524 |
|
| Cost of services (excluding Depreciation, amortization and accretion reported below) | 365 |
| | 131 |
| | 52 |
| | 183 |
| | 39 |
| | 587 |
| 377 |
| | 128 |
| | 60 |
| | 188 |
| | 34 |
| | 599 |
|
| Cost of equipment and products | 459 |
| | 1 |
| | — |
| | 1 |
| | 52 |
| | 512 |
| 435 |
| | — |
| | — |
| | — |
| | 52 |
| | 487 |
|
| Selling, general and administrative | 668 |
| | 97 |
| | 28 |
| | 124 |
| | 21 |
| | 813 |
| 659 |
| | 97 |
| | 34 |
| | 130 |
| | 20 |
| | 809 |
|
| Depreciation, amortization and accretion | 317 |
| | 72 |
| | 35 |
| | 107 |
| | 17 |
| | 441 |
| 354 |
| | 64 |
| | 39 |
| | 103 |
| | 13 |
| | 470 |
|
| (Gain) loss on asset disposals, net | 2 |
| | 1 |
| | 1 |
| | 1 |
| | — |
| | 3 |
| 8 |
| | — |
| | — |
| | — |
| | — |
| | 8 |
|
| (Gain) loss on license sales and exchanges, net | (17 | ) | | — |
| | — |
| | — |
| | — |
| | (17 | ) | |
| Operating income (loss) | 121 |
| | 47 |
| | (4 | ) | | 43 |
| | (23 | ) | | 141 |
| 104 |
| | 50 |
| | 9 |
| | 59 |
| | (12 | ) | | 151 |
|
| Equity in earnings of unconsolidated entities | 78 |
| | — |
| | — |
| | — |
| | — |
| | 78 |
| 89 |
| | — |
| | — |
| | — |
| | 1 |
| | 90 |
|
| Interest and dividend income | 7 |
| | 3 |
| | — |
| | 3 |
| | 1 |
| | 11 |
| 5 |
| | 3 |
| | 1 |
| | 4 |
| | (1 | ) | | 8 |
|
| Interest expense | (58 | ) | | 1 |
| | — |
| | 1 |
| | (29 | ) | | (86 | ) | (49 | ) | | 2 |
| | — |
| | 2 |
| | (28 | ) | | (75 | ) |
| Other, net | (1 | ) | | 1 |
| | — |
| | 1 |
| | 2 |
| | 2 |
| — |
| | (1 | ) | | — |
| | (1 | ) | | — |
| | (1 | ) |
| Income (loss) before income taxes | 147 |
| | 52 |
| | (4 | ) | | 48 |
| | (49 | ) | | 146 |
| 149 |
| | 55 |
| | 10 |
| | 64 |
| | (40 | ) | | 173 |
|
Income tax expense (benefit)2 | 40 |
| | | | | | 12 |
| | (7 | ) | | 45 |
| 8 |
| |
|
| |
|
| | 8 |
| | (4 | ) | | 12 |
|
| Net income (loss) | 107 |
| | | | | | 37 |
| | (43 | ) | | 101 |
| 141 |
| |
|
| |
|
| | 56 |
| | (36 | ) | | 161 |
|
| Add back: | | | | | | | | | | | |
|
| |
|
| |
|
| |
|
| |
|
| |
|
|
| Depreciation, amortization and accretion | 317 |
| | 72 |
| | 35 |
| | 107 |
| | 17 |
| | 441 |
| 354 |
| | 64 |
| | 39 |
| | 103 |
| | 13 |
| | 470 |
|
| (Gain) loss on asset disposals, net | 2 |
| | 1 |
| | 1 |
| | 1 |
| | — |
| | 3 |
| 8 |
| | — |
| | — |
| | — |
| | — |
| | 8 |
|
| (Gain) loss on license sales and exchanges, net | (17 | ) | | — |
| | — |
| | — |
| | — |
| | (17 | ) | |
| Interest expense | 58 |
| | (1 | ) | | — |
| | (1 | ) | | 29 |
| | 86 |
| 49 |
| | (2 | ) | | — |
| | (2 | ) | | 28 |
| | 75 |
|
Income tax expense (benefit)2 | 40 |
| | | | | | 12 |
| | (7 | ) | | 45 |
| 8 |
| |
|
| |
|
| | 8 |
| | (4 | ) | | 12 |
|
Adjusted EBITDA3 | $ | 507 |
| | $ | 124 |
| | $ | 32 |
| | $ | 156 |
| | $ | (4 | ) | | $ | 659 |
| $ | 560 |
| | $ | 116 |
| | $ | 49 |
| | $ | 165 |
| | $ | 1 |
| | $ | 726 |
|
| | | | | | | | | | | | |
|
| |
|
| |
|
| |
|
| |
|
| |
|
|
| Capital expenditures | $ | 155 |
| | $ | 62 |
| | $ | 24 |
| | $ | 87 |
| | $ | 11 |
| | $ | 253 |
| $ | 405 |
| | $ | 97 |
| | $ | 31 |
| | $ | 128 |
| | $ | 6 |
| | $ | 539 |
|
|
| | | | | | | | | | | | | | | | | | | | | | | |
| | | | TDS Telecom | | | | |
| Six Months Ended or as of June 30, 2019 | U.S. Cellular | | Wireline | | Cable | | TDS Telecom Total1 | | Corporate, Eliminations and Other | | Total |
| (Dollars in millions) | | | | | | | | | | | |
| Operating revenues | | | | | | | | | | | |
| Service | $ | 1,498 |
| | $ | 342 |
| | $ | 121 |
| | $ | 463 |
| | $ | 47 |
| | $ | 2,008 |
|
| Equipment and product sales | 441 |
| | 1 |
| | — |
| | 1 |
| | 68 |
| | 510 |
|
| Total operating revenues | 1,939 |
| | 343 |
| | 121 |
| | 464 |
| | 115 |
| | 2,518 |
|
| Cost of services (excluding Depreciation, amortization and accretion reported below) | 369 |
| | 127 |
| | 52 |
| | 179 |
| | 40 |
| | 588 |
|
| Cost of equipment and products | 458 |
| | 1 |
| | — |
| | 1 |
| | 54 |
| | 513 |
|
| Selling, general and administrative | 669 |
| | 96 |
| | 30 |
| | 125 |
| | 25 |
| | 819 |
|
| Depreciation, amortization and accretion | 345 |
| | 66 |
| | 34 |
| | 100 |
| | 15 |
| | 460 |
|
| (Gain) loss on asset disposals, net | 7 |
| | (8 | ) | | 1 |
| | (8 | ) | | 1 |
| | — |
|
| (Gain) loss on sale of business and other exit costs, net | (2 | ) | | — |
| | — |
| | — |
| | — |
| | (2 | ) |
| (Gain) loss on license sales and exchanges, net | (2 | ) | | — |
| | — |
| | — |
| | — |
| | (2 | ) |
| Operating income (loss) | 95 |
| | 61 |
| | 5 |
| | 66 |
| | (19 | ) | | 142 |
|
| Equity in earnings of unconsolidated entities | 84 |
| | — |
| | — |
| | — |
| | 1 |
| | 85 |
|
| Interest and dividend income | 11 |
| | 5 |
| | 1 |
| | 6 |
| | — |
| | 17 |
|
| Interest expense | (58 | ) | | 1 |
| | — |
| | 1 |
| | (29 | ) | | (86 | ) |
| Other, net | (1 | ) | | — |
| | — |
| | — |
| | 2 |
| | 1 |
|
| Income (loss) before income taxes | 131 |
| | 68 |
| | 6 |
| | 74 |
| | (46 | ) | | 159 |
|
Income tax expense (benefit)2 | 41 |
| | | | | | 18 |
| | (9 | ) | | 50 |
|
| Net income (loss) | 90 |
| | | | | | 56 |
| | (37 | ) | | 109 |
|
| Add back: | | | | | | | | | | | |
| Depreciation, amortization and accretion | 345 |
| | 66 |
| | 34 |
| | 100 |
| | 15 |
| | 460 |
|
| (Gain) loss on asset disposals, net | 7 |
| | (8 | ) | | 1 |
| | (8 | ) | | 1 |
| | — |
|
| (Gain) loss on sale of business and other exit costs, net | (2 | ) | | — |
| | — |
| | — |
| | — |
| | (2 | ) |
| (Gain) loss on license sales and exchanges, net | (2 | ) | | — |
| | — |
| | — |
| | — |
| | (2 | ) |
| Interest expense | 58 |
| | (1 | ) | | — |
| | (1 | ) | | 29 |
| | 86 |
|
Income tax expense (benefit)2 | 41 |
| | | | | | 18 |
| | (9 | ) | | 50 |
|
Adjusted EBITDA3 | $ | 537 |
| | $ | 125 |
| | $ | 40 |
| | $ | 165 |
| | $ | (1 | ) | | $ | 701 |
|
| | | | | | | | | | | | |
| Capital expenditures | $ | 297 |
| | $ | 84 |
| | $ | 28 |
| | $ | 112 |
| | $ | 2 |
| | $ | 411 |
|
Numbers may not foot due to rounding.
| |
1 | TDS Telecom Total includes eliminations between the Wireline and Cable segments. |
| |
2 | Income tax expense (benefit) is not provided at the individual segment level for Wireline and Cable. TDS calculates income tax expense for “TDS Telecom Total”Total". |
| |
3 | Adjusted earnings before interest, taxes, depreciation, amortization and accretion (Adjusted EBITDA) is a segment measure reported to the chief operating decision maker for purposes of making decisions about allocating resources to the segments and assessing their performance. Adjusted EBITDA is defined as net income, adjusted for the items set forth in the reconciliation above. TDS believes Adjusted EBITDA is a useful measure of TDS’ operating results before significant recurring non-cash charges, gains and losses, and other items as presented above as they provide additional relevant and useful information to investors and other users of TDS' financial data in evaluating the effectiveness of its operations and underlying business trends in a manner that is consistent with management's evaluation of business performance. |
Telephone and Data Systems, Inc.
Additional Required Information
Controls and Procedures
Evaluation of Disclosure Controls and Procedures
TDS maintains disclosure controls and procedures (as defined in Rules 13a-15(e) and 15d-15(e) under the Securities Exchange Act of 1934, as amended (the Exchange Act)) that are designed to ensure that information required to be disclosed in its reports filed or submitted under the Exchange Act is processed, recorded, summarized and reported within the time periods specified in the SEC’s rules and forms, and that such information is accumulated and communicated to TDS’ management, including its principal executive officer and principal financial officer, as appropriate, to allow for timely decisions regarding required disclosure. In designing and evaluating the disclosure controls and procedures, management recognizes that any controls and procedures, no matter how well designed and operated, can provide only reasonable assurance of achieving the desired control objectives.
As required by SEC Rules 13a-15(b), TDS carried out an evaluation, under the supervision and with the participation of management, including its principal executive officer and principal financial officer, of the effectiveness of the design and operation of TDS’ disclosure controls and procedures as of the end of the period covered by this Quarterly Report. Based on this evaluation, TDS’ principal executive officer and principal financial officer concluded that TDS' disclosure controls and procedures were effective as of June 30, 2019,2020, at the reasonable assurance level.
Changes in Internal Control Over Financial Reporting
There have been no changes in internal controls over financial reporting that have occurred during the six months ended June 30, 2019,2020, that have materially affected, or are reasonably likely to materially affect, TDS’ internal control over financial reporting, except as follows: TDS implemented internal controls to ensure that, upon adoption of the new lease accounting standard codified in ASC 842, effective January 1, 2019, and for all periods thereafter, the financial statements will be presented in accordance with this new accounting standard.reporting.
Legal Proceedings
TheIn April 2018, the United States Department of Justice (DOJ) has notified TDS that it iswas conducting inquiries of U.S. Cellular and TDS under the federal False Claims Act. The DOJ is investigatingAct relating to U.S. Cellular’s participation in wireless spectrum license auctions 58, 66, 73 and 97 conducted by the FCC. U.S. Cellular isis/was a limited partner in several limited partnerships which qualified for the 25% bid credit in each auction. The investigation arose from civil actions under the Federal False Claims Act brought by private parties. In November and December 2019, following the DOJ’s investigation, the DOJ informed TDS and U.S. Cellular that it would not intervene in the above-referenced actions. Subsequently, the private party plaintiffs filed amended complaints in both actions in the U.S. District Court for the Western District of Oklahoma and are cooperating withcontinuing the DOJ’s review.action on their own. In July 2020, these actions were transferred to the U.S. District Court for the District of Columbia. TDS and U.S. Cellular believe that U.S. Cellular’s arrangements with the limited partnerships and the limited partnerships’ participation in the FCC auctions complied with applicable law and FCC rules. At this time, TDS cannot predict the outcome of this review.any proceeding.
Refer to the disclosure under Legal Proceedings in TDS’ Form 10-K for the year ended December 31, 2018,2019, for additional information. There have been no material changes to such information since December 31, 2018.2019.
Unregistered Sales of Equity Securities and Use of Proceeds
On August 2, 2013, the Board of Directors of TDS authorized, and TDS announced by Form 8-K, a $250 million stock repurchase program for TDS Common Shares. Depending on market conditions, such shares may be repurchased in compliance with Rule 10b-18 of the Exchange Act, pursuant to Rule 10b5-1 under the Exchange Act, or pursuant to accelerated share repurchase arrangements, prepaid share repurchases, private transactions or as otherwise authorized. This authorization does not have an expiration date. TDS did not determine to terminate the foregoing Common Share repurchase program, or cease making further purchases thereunder, during the second quarter of 2019.2020.
The maximum dollar value of shares that may yet be purchased under this program was $199 million as of June 30, 2019. There were nofollowing table provides certain information with respect to all purchases made by or on behalf of TDS, and noany open market purchases made by any “affiliated purchaser”"affiliated purchaser" (as defined by the SEC) of TDS, of TDS Common Shares during the quarter covered by this Form 10-Q.
61 |
| | | | | | | | | | |
| Period | Total Number of Shares Purchased | Average Price Paid per Share | Total Number of Shares Purchased as Part of Publicly Announced Plans or Programs | Maximum Dollar Value of Shares that May Yet Be Purchased Under the Plans or Programs |
| April 1 - 30, 2020 | 501,212 |
| $ | 15.62 |
| 501,212 |
| $ | 185,033,191 |
|
| May 1 - 31, 2020 | — |
| $ | — |
| — |
| $ | 185,033,191 |
|
| June 1 - 30, 2020 | — |
| $ | — |
| — |
| $ | 185,033,191 |
|
| Total for or as of the end of the quarter ended June 30, 2020 | 501,212 |
| $ | 15.62 |
| 501,212 |
| $ | 185,033,191 |
|
Other Information
The following information is being provided to update prior disclosures made pursuant to the requirements of Form 8-K, Item 2.03 — Creation of a Direct Financial Obligation or an Obligation Under an Off-Balance Sheet Arrangement of a Registrant.
Neither TDS nor U.S. Cellular borrowed or repaid any cash amounts under their revolving credit agreements in the second quarter of 20192020 or through the filing date of this Form 10-Q, and had no cash borrowings outstanding under their revolving credit agreements as of June 30, 2019,2020, or as of the filing date of this Form 10-Q.
Neither TDS nor U.S. Cellular repaid any cash amounts under their senior term loan credit agreements in the second quarter of 2020 or through the filing date of this Form 10-Q.
Further, U.S. Cellular did not borrow or repay any cash amounts under its receivables securitization agreement in the second quarter of 2019 or through the filing date of this Form 10-Q, and had no cash borrowings outstanding2020. In April 2020, U.S. Cellular borrowed $125 million under its receivables securitization agreement as of June 30, 2019, or as of the filing date of this Form 10-Q.agreement.
Exhibits
|
| |
| Exhibit Number | Description of Documents |
Exhibit 3.14.1 | Restated Bylaws,Term Loan Credit Agreement, among TDS, CoBank, ACB, as amended, areadministrative agent, and the lenders thereto, dated as of January 6, 2020, is hereby incorporated by reference to Exhibit 3.14.1 to TDS' Current Report on Form 8-K dated May 23, 2019.January 6, 2020. |
| | |
Exhibit 4.14.2 | |
| |
| Exhibit 4.3 | |
| |
| Exhibit 4.4 | |
| |
| Exhibit 4.5 | Fourth Amendment to Amended and Restated Term Loan Credit Agreement, among U.S. Cellular, CoBank, ACB, as administrative agent, and the other lenders thereto, dated as of March 14, 2019,2, 2020, is hereby incorporated by reference to Exhibit 4.2 to U.S. Cellular's Current Report on Form 8-K dated March 2, 2020. |
| |
| Exhibit 4.6 | |
| |
Exhibit 4.2 | |
| | |
| Exhibit 10.1 | |
| | |
| Exhibit 10.2 | |
| | |
| Exhibit 10.3 | |
| |
| Exhibit 10.4 | |
| |
| Exhibit 10.5 | |
| |
| Exhibit 10.6 | |
| |
| Exhibit 10.7 | |
| | |
| Exhibit 31.1 | |
| | |
| Exhibit 31.2 | |
| | |
| Exhibit 32.1 | |
| | |
| Exhibit 32.2 | |
| | |
| |
| Exhibit 101.INS | XBRL Instance Document - the instance document does not appear in the Interactive Data File because its XBRL tags are embedded within the Inline XBRL document. |
| | |
| Exhibit 101.SCH | Inline XBRL Taxonomy Extension Schema Document |
| | |
| Exhibit 101.PRE | Inline XBRL Taxonomy Presentation Linkbase Document |
| | |
| Exhibit 101.CAL | Inline XBRL Taxonomy Calculation Linkbase Document |
| | |
| Exhibit 101.LAB | Inline XBRL Taxonomy Label Linkbase Document |
| | |
| Exhibit 101.DEF | Inline XBRL Taxonomy Extension Definition Linkbase Document |
| |
| Exhibit 104 | Cover Page Interactive Data File - the cover page interactive data file does not appear in the Interactive Data File because its XBRL tags are embedded within the inline document. |
The foregoing exhibits include only the exhibits that relate specifically to this Form 10-Q or that supplement the exhibits identified in TDS’ Form 10-K for the year ended December 31, 2018.2019. Reference is made to TDS’ Form 10-K for the year ended December 31, 2018,2019, for a complete list of exhibits, which are incorporated herein except to the extent supplemented or superseded above.
Form 10-Q Cross Reference Index
| | | Item Number | Item Number | Page No. | Item Number | Page No. |
| Part I. | Financial Information | | | Financial Information | | |
| | | | | | | |
| | | | | - | | | | | - | |
| | | | | - | | | | | - | |
| | | | | | | |
| | | | | - | | | | | - | |
| | | | | | | |
| | | | | | | |
| | | | | | | |
| | | | | | | |
| | | | | | | |
| Part II. | Other Information | | | Other Information | | |
| | | | | | | |
| | | | | | | |
| | | | | | | |
| | | | | | | |
| | | | | | | |
| | | | | | | |
| | | | | | | |
| | | | | | | |
| | | | | | | |
| | | | | | | |
| | | | | | | |
| | | | | | |
SIGNATURES
Pursuant to the requirements of the Securities Exchange Act of 1934, the registrant has duly caused this report to be signed on its behalf by the undersigned thereunto duly authorized.
|
| | | | | |
| | | TELEPHONE AND DATA SYSTEMS, INC. | | |
| | | (Registrant) | | |
| | | | | | |
| Date: | August 1, 20196, 2020 | | /s/ LeRoy T. Carlson, Jr. | |
| | | | LeRoy T. Carlson, Jr. President and Chief Executive Officer (principal executive officer) |
| | | | | | |
| Date: | August 1, 20196, 2020 | | /s/ Peter L. Sereda | |
| | | | Peter L. Sereda Executive Vice President and Chief Financial Officer (principal financial officer) |
| | | | | | |
| Date: | August 1, 20196, 2020 | | /s/ Anita J. Kroll | |
| | | | Anita J. Kroll Vice President - Controller and Chief Accounting Officer (principal accounting officer) |