UNITED STATES
SECURITIES AND EXCHANGE COMMISSION
Washington, D.C. 20549
FORM 10-Q
|
| | | | | | | |
| ☒ | Quarterly Report pursuant to Section 13 or 15(d) of the Securities Exchange Act of 1934 |
| For the quarterly period ended September 30, 2017 | March 31, 2021 |
| ☐ | Transition Report pursuant to Section 13 or 15(d) of the Securities Exchange Act of 1934 |
| For the transition period from to |
Commission File Number 0-24429
COGNIZANT TECHNOLOGY SOLUTIONS CORPORATION
(Exact Name of Registrant as Specified in Its Charter)
|
| | | | | | | | | | |
| Delaware | | 13-3728359 |
(State or Other Jurisdiction of Incorporation or Organization) | | (I.R.S. Employer
Identification No.)
|
| | |
Glenpointe Centre West
|
300 Frank W. Burr Blvd.
Teaneck, New Jersey 07666
500 Frank W. Burr Blvd.
Teaneck, New Jersey
| 07666 | (Address of Principal Executive Offices) | | (Address of Principal Executive Offices including Zip Code) |
Registrant’s telephone number, including area code: (201) 801-0233
N/A
(Former Name, Former Address and Former Fiscal Year,
if Changed Since Last Report)
Securities registered pursuant to Section 12(b) of the Act:
| | | | | | | | |
| Title of each class | Trading Symbol(s) | Name of each exchange on which registered |
Class A Common Stock,
$0.01 par value per share | CTSH | The Nasdaq Stock Market LLC |
Indicate by check mark whether the registrant: (1) has filed all reports required to be filed by Section 13 or 15(d) of the Securities Exchange Act of 1934 during the preceding 12 months (or for such shorter period that the registrant was required to file such reports), and (2) has been subject to such filing requirements for the past 90 days. Yes ☒ No: ☐
Indicate by check mark whether the registrant has submitted electronically and posted on its corporate Website, if any, every Interactive Data File required to be submitted and posted pursuant to Rule 405 of Regulation S-T (§232.405 of this chapter) during the preceding 12 months (or for such shorter period that the registrant was required to submit and post such files). Yes ☒ No: ☐
Indicate by check mark whether the registrant is a large accelerated filer, an accelerated filer, a non-accelerated filer, or a smaller reporting company, or an emerging growth company. See the definitions of “large accelerated filer,” “accelerated filer”,filer,” “smaller reporting company,” and "emerging“emerging growth company"company” in Rule 12b-2 of the Exchange Act. (Check one):
| | | | | | | | | | | |
| Large Accelerated Filer | ☒ | Accelerated filer | ☐ |
| | | |
Large acceleratedNon-accelerated filer | ☒☐ | Accelerated filerSmaller reporting company | ☐ |
| | | |
Non-accelerated filer | ☐ (Do not check if a smaller reporting company) | Smaller reporting company | ☐ |
| | | |
| | Emerging growth company | ☐ |
If an emerging growth company, indicate by check mark if the registrant has elected not to use the extended transition period for complying with any new or revised financial accounting standards provided pursuant to Section 13(a) of the Exchange Act. ☐
Indicate by check mark whether the registrant is a shell company (as defined in Rule 12b-2 of the Exchange Act). Yes ☐ No ☒ý
Indicate the number of shares outstanding of each of the issuer’s class of common stock, as of October 25, 2017:
|
| | | | | | | |
| Class | | Number of Shares |
Class A Common Stock, par value $.01$0.01 per share | | 589,645,636527,411,884 |
COGNIZANT TECHNOLOGY SOLUTIONS CORPORATION
TABLE OF CONTENTS
| | | | | | | | |
| | Page |
| |
| | |
| | Page |
| PART I. | | |
| | |
| Item 1. | | |
| | |
| 2020 | |
| | |
| | |
| | |
| | |
| | |
| | |
| | |
| | |
| | |
| | |
| | |
| Item 2. | | |
| | |
| Item 3. | | |
| | |
| Item 4. | | |
| | |
| PART II. | | |
| | |
| Item 1. | | |
| | |
| Item 1A. | | |
| | |
| Item 2. | | |
| | |
| Item 6. | | |
| |
| |
GLOSSARY
| | | | | |
| Defined Term | Definition |
| 10b5-1 Plan | Trading plan adopted pursuant to Rule 10b5-1 of the Exchange Act |
| Adjusted Diluted EPS | Adjusted Diluted Earnings Per Share |
| AI | Artificial Intelligence |
| ASC | Accounting Standards Codification |
| ASR | Accelerated Stock Repurchase |
| CC | Constant Currency |
| COVID-19 | The novel coronavirus disease |
| COVID-19 Charges | Costs directly related to the COVID-19 pandemic |
| Credit Agreement | Credit agreement with a commercial bank syndicate dated November 5, 2018 |
| Credit Loss Standard | ASC Topic 326: "Financial Instruments - Credit Losses" |
| CTS India | Our principal operating subsidiary in India |
| DevOps | Agile relationship between development and IT operations |
| Division Bench | Division Bench of the Madras High Court |
| DOJ | United States Department of Justice |
| DSO | Days Sales Outstanding |
| EPS | Earnings Per Share |
| ESG Mobility | ESG Mobility GmbH |
| EU | European Union |
| Exchange Act | Securities Exchange Act of 1934, as amended |
| GAAP | Generally Accepted Accounting Principles in the United States of America |
| High Court | Madras High Court |
| India Defined Contribution Obligation | Certain statutory defined contribution obligations of employees and employers in India |
| IoT | Internet of Things |
| IRS | Internal Revenue Service |
| ITD | Indian Income Tax Department |
| LIBOR | London Inter-bank Offered Rate |
| Linium | The ServiceNow business of Ness Digital Engineering |
| Magenic | Magenic Technologies, LLC |
| SCI | Supreme Court of India |
| SEC | United States Securities and Exchange Commission |
| Servian | SVN HoldCo Pty Limited |
| SG&A | Selling, general and administrative |
| SLP | Special Leave Petition |
| Syntel | Syntel Sterling Best Shores Mauritius Ltd. |
| Term Loan | Unsecured term loan |
| Third Circuit | United States Court of Appeals for the Third Circuit |
| TriZetto | The TriZetto Group, Inc., now known as Cognizant Technology Software Group, Inc. |
| USDC-NJ | United States District Court for the District of New Jersey |
| USDC-SDNY | United States District Court for the Southern District of New York |
| | | | | | | | |
| Cognizant | 1 | March 31, 2021 Form 10-Q |
PART I. FINANCIAL INFORMATION
Item 1. Condensed Consolidated Financial Statements (Unaudited).
COGNIZANT TECHNOLOGY SOLUTIONS CORPORATION
CONSOLIDATED STATEMENTS OF FINANCIAL POSITION
(Unaudited)
(in millions, except par values)
| | | | September 30,
2017 |
| December 31,
2016 | |
| (in millions, except par values) | | (in millions, except par values) | March 31, 2021 | | December 31, 2020 |
| Assets |
|
|
| Assets | |
| Current assets: |
|
|
| Current assets: | |
| Cash and cash equivalents | $ | 1,577 |
|
| $ | 2,034 |
| Cash and cash equivalents | $ | 1,973 | | | $ | 2,680 | |
| Short-term investments | 3,136 |
|
| 3,135 |
| Short-term investments | 185 | | | 44 | |
| Trade accounts receivable, net of allowances of $62 and $48, respectively | 2,889 |
|
| 2,556 |
| |
| Unbilled accounts receivable | 403 |
|
| 349 |
| |
| Trade accounts receivable, net | | Trade accounts receivable, net | 3,232 | | | 3,087 | |
| Other current assets | 552 |
|
| 526 |
| Other current assets | 1,205 | | | 1,040 | |
| Total current assets | 8,557 |
|
| 8,600 |
| Total current assets | 6,595 | | | 6,851 | |
| Property and equipment, net | 1,304 |
|
| 1,311 |
| Property and equipment, net | 1,250 | | | 1,251 | |
| Operating lease assets, net | | Operating lease assets, net | 980 | | | 1,013 | |
| Goodwill | 2,608 |
|
| 2,554 |
| Goodwill | 5,219 | | | 5,031 | |
| Intangible assets, net | 957 |
|
| 951 |
| Intangible assets, net | 1,110 | | | 1,046 | |
| Deferred income tax assets, net | 464 |
|
| 425 |
| Deferred income tax assets, net | 307 | | | 445 | |
| Long-term investments | 262 |
| | 62 |
| Long-term investments | 439 | | | 440 | |
| Other noncurrent assets | 428 |
|
| 359 |
| Other noncurrent assets | 760 | | | 846 | |
| Total assets | $ | 14,580 |
|
| $ | 14,262 |
| Total assets | $ | 16,660 | | | $ | 16,923 | |
| Liabilities and Stockholders’ Equity |
|
|
| Liabilities and Stockholders’ Equity | |
| Current liabilities: |
|
|
| Current liabilities: | |
| Accounts payable | $ | 186 |
|
| $ | 175 |
| Accounts payable | $ | 349 | | | $ | 389 | |
| Deferred revenue | 333 |
|
| 306 |
| Deferred revenue | 403 | | | 383 | |
| Short-term debt | 100 |
|
| 81 |
| Short-term debt | 38 | | | 38 | |
| Operating lease liabilities | | Operating lease liabilities | 202 | | | 211 | |
| Accrued expenses and other current liabilities | 1,981 |
|
| 1,856 |
| Accrued expenses and other current liabilities | 2,158 | | | 2,519 | |
| Total current liabilities | 2,600 |
|
| 2,418 |
| Total current liabilities | 3,150 | | | 3,540 | |
| Deferred revenue, noncurrent | 114 |
|
| 151 |
| Deferred revenue, noncurrent | 32 | | | 36 | |
| Operating lease liabilities, noncurrent | | Operating lease liabilities, noncurrent | 821 | | | 846 | |
| Deferred income tax liabilities, net | 5 |
|
| 6 |
| Deferred income tax liabilities, net | 204 | | | 206 | |
| Long-term debt | 723 |
|
| 797 |
| Long-term debt | 654 | | | 663 | |
| Long-term income taxes payable | | Long-term income taxes payable | 428 | | | 428 | |
| Other noncurrent liabilities | 159 |
|
| 162 |
| Other noncurrent liabilities | 334 | | | 368 | |
| Total liabilities | 3,601 |
|
| 3,534 |
| Total liabilities | 5,623 | | | 6,087 | |
Commitments and contingencies (See Note 12) |
| |
| Commitments and contingencies (See Note 12) | 0 | | 0 |
| Stockholders’ equity: | | | | Stockholders’ equity: | |
| Preferred stock, $0.10 par value, 15.0 shares authorized, none issued | — |
| | — |
| |
| Class A common stock, $0.01 par value, 1,000 shares authorized, 590 and 608 shares issued and outstanding at September 30, 2017 and December 31, 2016, respectively | 6 |
| | 6 |
| |
| Preferred stock, $0.10 par value, 15 shares authorized, NaN issued | | Preferred stock, $0.10 par value, 15 shares authorized, NaN issued | 0 | | | 0 | |
Class A common stock, $0.01 par value, 1,000 shares authorized, 528 and 530 shares issued and outstanding as of March 31, 2021 and December 31, 2020, respectively | | Class A common stock, $0.01 par value, 1,000 shares authorized, 528 and 530 shares issued and outstanding as of March 31, 2021 and December 31, 2020, respectively | 5 | | | 5 | |
| Additional paid-in capital | 208 |
| | 358 |
| Additional paid-in capital | 44 | | | 32 | |
| Retained earnings | 10,721 |
| | 10,478 |
| Retained earnings | 10,907 | | | 10,689 | |
| Accumulated other comprehensive income (loss) | 44 |
| | (114 | ) | Accumulated other comprehensive income (loss) | 81 | | | 110 | |
| Total stockholders’ equity | 10,979 |
|
| 10,728 |
| Total stockholders’ equity | 11,037 | | | 10,836 | |
| Total liabilities and stockholders’ equity | $ | 14,580 |
|
| $ | 14,262 |
| Total liabilities and stockholders’ equity | $ | 16,660 | | | $ | 16,923 | |
The accompanying notes are an integral part of the unaudited condensed consolidated financial statements.
| | | | | | | | |
| Cognizant | 2 | March 31, 2021 Form 10-Q |
COGNIZANT TECHNOLOGY SOLUTIONS CORPORATION
CONSOLIDATED STATEMENTS OF OPERATIONS
(Unaudited)
(in millions, except per share data)
| | | | Three Months Ended
September 30, | | Nine Months Ended
September 30, | |
(in millions, except per share data) | | (in millions, except per share data) | Three Months Ended
March 31, | |
| | 2017 | | 2016 | | 2017 | | 2016 | | 2021 | | 2020 | |
| Revenues | $ | 3,766 |
|
| $ | 3,453 |
|
| $ | 10,982 |
|
| $ | 10,025 |
| Revenues | $ | 4,401 | | | $ | 4,225 | | |
| Operating expenses: |
|
|
|
|
|
|
| Operating expenses: | | |
| Cost of revenues (exclusive of depreciation and amortization expense shown separately below) | 2,337 |
|
| 2,077 |
|
| 6,792 |
|
| 6,030 |
| Cost of revenues (exclusive of depreciation and amortization expense shown separately below) | 2,764 | | | 2,747 | | |
| Selling, general and administrative expenses | 674 |
|
| 701 |
|
| 2,069 |
|
| 2,001 |
| Selling, general and administrative expenses | 827 | | | 711 | | |
| Restructuring charges | | Restructuring charges | 0 | | | 55 | | |
| Depreciation and amortization expense | 107 |
|
| 92 |
|
| 297 |
|
| 266 |
| Depreciation and amortization expense | 141 | | | 133 | | |
| Income from operations | 648 |
|
| 583 |
|
| 1,824 |
|
| 1,728 |
| Income from operations | 669 | | | 579 | | |
| Other income (expense), net: |
|
|
|
|
|
|
| Other income (expense), net: | | |
| Interest income | 34 |
|
| 27 |
|
| 97 |
|
| 86 |
| Interest income | 9 | | | 41 | | |
| Interest expense | (6 | ) |
| (5 | ) |
| (18 | ) |
| (15 | ) | Interest expense | (2) | | | (6) | | |
| Foreign currency exchange gains (losses), net | (16 | ) |
| 7 |
|
| 41 |
|
| (4 | ) | Foreign currency exchange gains (losses), net | (9) | | | (102) | | |
| Other, net | (2 | ) |
| 1 |
|
| (2 | ) |
| 2 |
| Other, net | (2) | | | (2) | | |
| Total other income (expense), net | 10 |
|
| 30 |
|
| 118 |
|
| 69 |
| Total other income (expense), net | (4) | | | (69) | | |
| Income before provision for income taxes | 658 |
|
| 613 |
|
| 1,942 |
|
| 1,797 |
| Income before provision for income taxes | 665 | | | 510 | | |
| Provision for income taxes | (164 | ) |
| (170 | ) |
| (421 | ) |
| (661 | ) | Provision for income taxes | (160) | | | (142) | | |
| Income from equity method investment | 1 |
| | 1 |
| | 1 |
| | 1 |
| |
| Income (loss) from equity method investments | | Income (loss) from equity method investments | 0 | | | (1) | | |
| Net income | $ | 495 |
|
| $ | 444 |
|
| $ | 1,522 |
|
| $ | 1,137 |
| Net income | $ | 505 | | | $ | 367 | | |
| Basic earnings per share | $ | 0.84 |
|
| $ | 0.73 |
|
| $ | 2.56 |
|
| $ | 1.88 |
| Basic earnings per share | $ | 0.95 | | | $ | 0.67 | | |
| Diluted earnings per share | $ | 0.84 |
|
| $ | 0.73 |
|
| $ | 2.55 |
|
| $ | 1.87 |
| Diluted earnings per share | $ | 0.95 | | | $ | 0.67 | | |
| Weighted average number of common shares outstanding - Basic | 590 |
|
| 606 |
|
| 594 |
|
| 607 |
| Weighted average number of common shares outstanding - Basic | 530 | | | 546 | | |
| Dilutive effect of shares issuable under stock-based compensation plans | 2 |
| | 3 |
| | 2 |
| | 3 |
| Dilutive effect of shares issuable under stock-based compensation plans | 1 | | | 0 | | |
| Weighted average number of common shares outstanding - Diluted | 592 |
|
| 609 |
|
| 596 |
|
| 610 |
| Weighted average number of common shares outstanding - Diluted | 531 | | | 546 | | |
| Dividends declared per common share | $ | 0.15 |
| | $ | — |
| | $ | 0.30 |
| | $ | — |
| |
The accompanying notes are an integral part of the unaudited condensed consolidated financial statements.
| | | | | | | | |
| Cognizant | 3 | March 31, 2021 Form 10-Q |
COGNIZANT TECHNOLOGY SOLUTIONS CORPORATION
CONSOLIDATED STATEMENTS OF COMPREHENSIVE INCOME
(Unaudited)
(in millions)
| | | | Three Months Ended
September 30, | | Nine Months Ended
September 30, | |
(in millions) | | (in millions) | Three Months Ended
March 31, | |
| | 2017 | | 2016 | | 2017 | | 2016 | | 2021 | | 2020 | |
| Net income | $ | 495 |
| | $ | 444 |
| | $ | 1,522 |
| | $ | 1,137 |
| Net income | $ | 505 | | | $ | 367 | | |
| Other comprehensive income (loss), net of tax: | | | | | | | | Other comprehensive income (loss), net of tax: | | |
| Foreign currency translation adjustments | 33 |
| | 1 |
| | 100 |
| | (8 | ) | Foreign currency translation adjustments | (25) | | | (135) | | |
| Change in unrealized gains and losses on cash flow hedges, net of taxes | (22 | ) | | 41 |
| | 56 |
| | 53 |
| |
| Change in unrealized gains and losses on available-for-sale securities, net of taxes | — |
| | (2 | ) | | 2 |
| | 6 |
| |
| Change in unrealized gains and losses on cash flow hedges | | Change in unrealized gains and losses on cash flow hedges | (4) | | | (91) | | |
| | Other comprehensive income (loss) | 11 |
| | 40 |
| | 158 |
| | 51 |
| Other comprehensive income (loss) | (29) | | | (226) | | |
| Comprehensive income | $ | 506 |
| | $ | 484 |
| | $ | 1,680 |
| | $ | 1,188 |
| Comprehensive income | $ | 476 | | | $ | 141 | | |
The accompanying notes are an integral part of the unaudited condensed consolidated financial statements.
| | | | | | | | |
| Cognizant | 4 | March 31, 2021 Form 10-Q |
COGNIZANT TECHNOLOGY SOLUTIONS CORPORATION
CONSOLIDATED STATEMENTS OF STOCKHOLDERS’ EQUITY
(Unaudited)
| | | | | | | | | | | | | | | | | | | | | | | | | | | | | | | | | | | | | | |
(in millions) | | Class A Common Stock | | Additional
Paid-in
Capital | | Retained
Earnings | | Accumulated
Other
Comprehensive
Income (Loss) | | Total |
| Shares | | Amount | |
| Balance, December 31, 2020 | | 530 | | | $ | 5 | | | $ | 32 | | | $ | 10,689 | | | $ | 110 | | | $ | 10,836 | |
| Net income | | — | | | — | | | — | | | 505 | | | — | | | 505 | |
| Other comprehensive income (loss) | | — | | | — | | | — | | | — | | | (29) | | | (29) | |
| Common stock issued, stock-based compensation plans | | 1 | | | — | | | 43 | | | — | | | — | | | 43 | |
| Stock-based compensation expense | | — | | | — | | | 62 | | | — | | | — | | | 62 | |
| Repurchases of common stock | | (3) | | | — | | | (93) | | | (159) | | | — | | | (252) | |
| Dividends declared, $0.24 per share | | — | | | — | | | — | | | (128) | | | — | | | (128) | |
| Balance, March 31, 2021 | | 528 | | | $ | 5 | | | $ | 44 | | | $ | 10,907 | | | $ | 81 | | | $ | 11,037 | |
| | | | | | | | | | | | |
| | | | | | | | | | | | |
| | | | | | | | | | | | |
| | | | | | | | | | | | |
| | | | | | | | | | | | |
| | | | | | | | | | | | |
| | | | | | | | | | | | |
| | | | | | | | | | | | |
| | | | | | | | | | | | |
| | | | | | | | | | | | |
| | | | | | | | | | | | |
| | | | | | | | | | | | |
| | | | | | | | | | | | |
| | | | | | | | | | | | |
| | | | | | | | | | | | |
| | | | | | | | | | | | |
| | | | | | | | | | | | | | | | | | | | | | | | | | | | | | | | | | | | | | |
(in millions) | | Class A Common Stock | | Additional
Paid-in
Capital | | Retained
Earnings | | Accumulated
Other
Comprehensive
Income (Loss) | | Total |
| Shares | | Amount | |
| Balance, December 31, 2019 | | 548 | | | $ | 5 | | | $ | 33 | | | $ | 11,022 | | | $ | (38) | | | $ | 11,022 | |
Cumulative effect of changes in accounting principle(1) | | — | | | — | | | — | | | 1 | | | — | | | 1 | |
| Net income | | — | | | — | | | — | | | 367 | | | — | | | 367 | |
| Other comprehensive income (loss) | | — | | | — | | | — | | | — | | | (226) | | | (226) | |
| Common stock issued, stock-based compensation plans | | 2 | | | — | | | 40 | | | — | | | — | | | 40 | |
| Stock-based compensation expense | | — | | | — | | | 55 | | | — | | | — | | | 55 | |
| Repurchases of common stock | | (9) | | | — | | | (87) | | | (439) | | | — | | | (526) | |
| Dividends declared, $0.22 per share | | — | | | — | | | — | | | (120) | | | — | | | (120) | |
| Balance, March 31, 2020 | | 541 | | | $ | 5 | | | $ | 41 | | | $ | 10,831 | | | $ | (264) | | | $ | 10,613 | |
| | | | | | | | | | | | |
| | | | | | | | | | | | |
| | | | | | | | | | | | |
| | | | | | | | | | | | |
| | | | | | | | | | | | |
| | | | | | | | | | | | |
| | | | | | | | | | | | |
| | | | | | | | | | | | |
| | | | | | | | | | | | |
| | | | | | | | | | | | |
| | | | | | | | | | | | |
| | | | | | | | | | | | |
| | | | | | | | | | | | |
| | | | | | | | | | | | |
| | | | | | | | | | | | |
| | | | | | | | | | | | |
(1)Reflects the adoption of the Credit Loss Standard on January 1, 2020. Refer to the notes in the consolidated financial statements included in our Annual Report on Form 10-K for the year ended December 31, 2020.
The accompanying notes are an integral part of the unaudited consolidated financial statements.
| | | | | | | | |
| Cognizant | 5 | March 31, 2021 Form 10-Q |
COGNIZANT TECHNOLOGY SOLUTIONS CORPORATION
CONSOLIDATED STATEMENTS OF CASH FLOWS
(Unaudited)
(in millions)
| | | | For the Nine Months Ended
September 30, | |
(in millions) | | (in millions) | For the Three Months Ended
March 31, |
| | 2017 | | 2016 | | 2021 | | 2020 |
| Cash flows from operating activities: | | | | Cash flows from operating activities: | |
| Net income | $ | 1,522 |
| | $ | 1,137 |
| Net income | $ | 505 | | | $ | 367 | |
| Adjustments to reconcile net income to net cash provided by operating activities: | | | | Adjustments to reconcile net income to net cash provided by operating activities: | |
| Depreciation and amortization | 321 |
| | 278 |
| Depreciation and amortization | 141 | | | 136 | |
| Provision for doubtful accounts | 12 |
| | 9 |
| |
| | Deferred income taxes | (46 | ) | | (44 | ) | Deferred income taxes | 122 | | | (19) | |
| Stock-based compensation expense | 161 |
| | 165 |
| Stock-based compensation expense | 62 | | | 55 | |
| | Other | (49 | ) | | 10 |
| Other | 0 | | | 144 | |
| Changes in assets and liabilities: | | | | Changes in assets and liabilities: | |
| Trade accounts receivable | (284 | ) | | (261 | ) | Trade accounts receivable | (131) | | | 13 | |
| Other current assets | 21 |
| | (84 | ) | |
| Other noncurrent assets | (65 | ) | | (51 | ) | |
| Other current and noncurrent assets | | Other current and noncurrent assets | (36) | | | 26 | |
| Accounts payable | (5 | ) | | 12 |
| Accounts payable | 61 | | | 44 | |
| Deferred revenues, current and noncurrent | (21 | ) | | (57 | ) | Deferred revenues, current and noncurrent | 15 | | | 59 | |
| Other current and noncurrent liabilities | 4 |
| | (73 | ) | Other current and noncurrent liabilities | (558) | | | (328) | |
| Net cash provided by operating activities | 1,571 |
| | 1,041 |
| Net cash provided by operating activities | 181 | | | 497 | |
| Cash flows from investing activities: | | | | Cash flows from investing activities: | |
| Purchases of property and equipment | (204 | ) | | (213 | ) | Purchases of property and equipment | (88) | | | (112) | |
| Purchases of available-for-sale investment securities | (2,163 | ) | | (3,423 | ) | |
| Proceeds from maturity or sale of available-for-sale investment securities | 2,352 |
| | 3,052 |
| |
| | Purchases of held-to-maturity investment securities | (1,015 | ) | | (29 | ) | Purchases of held-to-maturity investment securities | (82) | | | (202) | |
| Proceeds from maturity of held-to-maturity investment securities | 208 |
| | — |
| Proceeds from maturity of held-to-maturity investment securities | 62 | | | 154 | |
| Purchases of other investments | (363 | ) | | (764 | ) | Purchases of other investments | (150) | | | (54) | |
| Proceeds from maturity or sale of other investments | 835 |
| | 689 |
| Proceeds from maturity or sale of other investments | 30 | | | 28 | |
| Payments for business combinations, net of cash acquired and equity method investment | (72 | ) | | (185 | ) | |
| Payments for business combinations, net of cash acquired | | Payments for business combinations, net of cash acquired | (310) | | | (86) | |
| Net cash (used in) investing activities | (422 | ) | | (873 | ) | Net cash (used in) investing activities | (538) | | | (272) | |
| Cash flows from financing activities: | | | | Cash flows from financing activities: | |
| Issuance of common stock under stock-based compensation plans | 146 |
| | 135 |
| Issuance of common stock under stock-based compensation plans | 43 | | | 40 | |
| | Repurchases of common stock | (1,557 | ) | | (492 | ) | Repurchases of common stock | (240) | | | (511) | |
| Repayment of term loan borrowings and capital lease obligations | (62 | ) | | (41 | ) | |
| Net change in notes outstanding under the revolving credit facility | — |
| | (350 | ) | |
| Repayment of Term Loan borrowings and finance lease and earnout obligations | | Repayment of Term Loan borrowings and finance lease and earnout obligations | (15) | | | (13) | |
| Proceeds from borrowings under the revolving credit facility | | Proceeds from borrowings under the revolving credit facility | 0 | | | 1,740 | |
| Dividends paid | (179 | ) | | — |
| Dividends paid | (128) | | | (121) | |
| Net cash (used in) financing activities | (1,652 | ) | | (748 | ) | |
| Net cash (used in) provided by financing activities | | Net cash (used in) provided by financing activities | (340) | | | 1,135 | |
| Effect of exchange rate changes on cash and cash equivalents | 46 |
| | 5 |
| Effect of exchange rate changes on cash and cash equivalents | (10) | | | (119) | |
| (Decrease) in cash and cash equivalents | (457 | ) | | (575 | ) | |
| (Decrease) increase in cash and cash equivalents | | (Decrease) increase in cash and cash equivalents | (707) | | | 1,241 | |
| Cash and cash equivalents, beginning of year | 2,034 |
| | 2,125 |
| Cash and cash equivalents, beginning of year | 2,680 | | | 2,645 | |
| Cash and cash equivalents, end of period | $ | 1,577 |
| | $ | 1,550 |
| Cash and cash equivalents, end of period | $ | 1,973 | | | $ | 3,886 | |
The accompanying notes are an integral part of the unaudited condensed consolidated financial statements.
| | | | | | | | |
| Cognizant | 6 | March 31, 2021 Form 10-Q |
COGNIZANT TECHNOLOGY SOLUTIONS CORPORATION
NOTES TO CONDENSED CONSOLIDATED FINANCIAL STATEMENTS
(Unaudited)
Note 1 — Interim Condensed Consolidated Financial Statements
| | | | | | | | | | | | | | |
| Note 1 — Interim Consolidated Financial Statements |
The terms “Cognizant,” “we,” “our,” “us” and “the Company” refer to Cognizant Technology Solutions Corporation and its subsidiaries unless the context indicates otherwise. We have prepared the accompanying unaudited condensed consolidated financial statements included herein in accordance with generally accepted accounting principles in the United States of America, or U.S. GAAP and Article 10 of Regulation S-X under the Securities Exchange Act of 1934, as amended, or the Exchange Act. The accompanying unaudited condensed consolidated financial statements should be read in conjunction withwith our audited consolidated financial statements (and notes thereto) included in our Annual Report on Form 10-K for the year ended December 31, 2016.2020. In our opinion, all adjustments considered necessary for a fair statement of the accompanying unaudited condensed consolidated financial statements have been included and all adjustments are of a normal and recurring nature. Operating results for the interim periods are not necessarily indicative of results that may be expected to occur for the entire year.
Recently Adopted Accounting Pronouncements.
| | | | | | | | | | | | | | |
| Note 2 — Revenues and Trade Accounts Receivable |
In March 2016, the Financial Accounting Standards Board, or FASB, issued an update to the standard on derivatives and hedging, which clarifies the effectDisaggregation of derivative contract novations on existing hedge accounting relationships. As it relates to derivative instruments, novation refers to replacing one of the parties to a derivative instrument with a new party, which may occur for a variety of reasons such as: financial institution mergers, intercompany transactions, an entity exiting a particular derivatives business or relationship, or because of laws or regulatory requirements. Revenues
The update clarifies that a change in the counterparty to a derivative instrument that has been designated as the hedging instrument does not, in and of itself, require dedesignation of that hedge accounting relationship provided that all other hedge accounting criteria continue to be met. The update is effective for fiscal years, and interim periods within those fiscal years, beginning on or after January 1, 2017. We adopted this update beginning January 1, 2017. The adoption of this update did not have any effect on our financial condition or results of operations.
In March 2016, the FASB issued an update to the standard on stock compensation, which simplifies several aspects of the accounting for employee share-based payment transactions including the accounting for excess tax benefits and deficiencies, forfeitures, and statutory tax withholding requirements, as well as classification in the statement of cash flows. The update is effective for fiscal years, and interim periods within those fiscal years, beginning on or after January 1, 2017. We adopted this update prospectively beginning January 1, 2017. For the three and nine months ended September 30, 2017, we recognized net excess tax benefits on stock-based compensation awards in our income tax provision in the amount of $5 million and $16 million or approximately $0.01 and $0.03 per share, respectively. Additionally, the excess tax benefits and deficiencies have been presentedin operating activities in the statement of cash flows in our consolidated financial statements and the prior period presentation has been adjusted to conform to the current period.
In January 2017, the FASB issued an update to the standard on business combinations, which clarifies the definition of a business. The update requires a business to include at least an input and a substantive process that together significantly contribute to the ability to create outputs. The update also states that the definition of a business is not met if substantially all of the fair value of the gross assets acquired is concentrated in a single identifiable asset or a group of similar identifiable assets. The update is effective for fiscal years, and interim periods within those fiscal years, beginning after January 1, 2018 with early adoption permitted. We early adopted this update prospectively beginning January 1, 2017. The adoption of this update did not have a material effect on our financial condition or results of operations.
In January 2017, the FASB issued an update to the standard on goodwill, which eliminates the need to calculate the implied fair value of goodwill when an impairment is indicated. The update states that goodwill impairment is measured as the excess of a reporting unit’s carrying value over its fair value, not to exceed the carrying amount of goodwill. The update is effective for fiscal years, and interim periods within those fiscal years, beginning after January 1, 2020 with early adoption permitted. We early adopted this update prospectively beginning January 1, 2017. The adoption of this update did not have any effect on our financial condition or results of operations.
New Accounting Pronouncements.
In May 2014, the FASB issued a standard on revenuetables below present disaggregated revenues from contracts with customers. In 2016, the FASB issued five amendments to the new standard. The new standard, as amended, sets forth a single comprehensive modelclients by client location, service line and contract type for recognizing and reporting revenues. The standard also requires additional financial statement disclosures that will enable users to understandeach of our business segments. We believe this disaggregation best depicts how the nature, amount, timing and uncertainty of our revenues and cash flows relatingare affected by industry, market and other economic factors. Revenues are attributed to customer contracts.geographic regions based upon client location. Substantially all revenues in our North America region relate to operations in the United States.
| | | | | | | | | | | | | | | | | | | | | | | | | | | | | | | | | | | | | | | | | | |
| | Three Months Ended
March 31, 2021 | | |
| | |
| (in millions) | | Financial Services | | Healthcare | | Products and Resources | | Communications, Media and Technology | | Total | | | | | | | | | | |
| | | | | | | | | | | | | | | | | | | | |
| Geography: | | | | | | | | | | | | | | | | | | | | |
| North America | | $ | 1,013 | | | $ | 1,101 | | | $ | 718 | | | $ | 451 | | | $ | 3,283 | | | | | | | | | | | |
| United Kingdom | | 125 | | | 40 | | | 106 | | | 99 | | | 370 | | | | | | | | | | | |
| Continental Europe | | 192 | | | 118 | | | 103 | | | 43 | | | 456 | | | | | | | | | | | |
| Europe - Total | | 317 | | | 158 | | | 209 | | | 142 | | | 826 | | | | | | | | | | | |
| Rest of World | | 128 | | | 29 | | | 71 | | | 64 | | | 292 | | | | | | | | | | | |
| Total | | $ | 1,458 | | | $ | 1,288 | | | $ | 998 | | | $ | 657 | | | $ | 4,401 | | | | | | | | | | | |
| | | | | | | | | | | | | | | | | | | | |
| Service line: | | | | | | | | | | | | | | | | | | | | |
| Consulting and technology services | | $ | 967 | | | $ | 745 | | | $ | 616 | | | $ | 396 | | | $ | 2,724 | | | | | | | | | | | |
| Outsourcing services | | 491 | | | 543 | | | 382 | | | 261 | | | 1,677 | | | | | | | | | | | |
| Total | | $ | 1,458 | | | $ | 1,288 | | | $ | 998 | | | $ | 657 | | | $ | 4,401 | | | | | | | | | | | |
| | | | | | | | | | | | | | | | | | | | |
| Type of contract: | | | | | | | | | | | | | | | | | | | | |
| Time and materials | | $ | 899 | | | $ | 519 | | | $ | 418 | | | $ | 397 | | | $ | 2,233 | | | | | | | | | | | |
| Fixed-price | | 471 | | | 499 | | | 481 | | | 230 | | | 1,681 | | | | | | | | | | | |
| Transaction or volume-based | | 88 | | | 270 | | | 99 | | | 30 | | | 487 | | | | | | | | | | | |
| Total | | $ | 1,458 | | | $ | 1,288 | | | $ | 998 | | | $ | 657 | | | $ | 4,401 | | | | | | | | | | | |
| | | | | | | | |
| Cognizant | 7 | March 31, 2021 Form 10-Q |
| | | | | | | | | | | | | | | | | | | | | | | | | | | | | | | | | | | | | | | | | | |
| | Three Months Ended
March 31, 2020 | | |
| | |
| (in millions) | | Financial Services | | Healthcare | | Products and Resources | | Communications, Media and Technology | | Total | | | | | | | | | | |
| | | | | | | | | | | | | | | | | | | | |
| Geography: | | | | | | | | | | | | | | | | | | | | |
| North America | | $ | 1,012 | | | $ | 1,038 | | | $ | 689 | | | $ | 451 | | | $ | 3,190 | | | | | | | | | | | |
| United Kingdom | | 120 | | | 40 | | | 93 | | | 84 | | | 337 | | | | | | | | | | | |
| Continental Europe | | 191 | | | 99 | | | 109 | | | 38 | | | 437 | | | | | | | | | | | |
| Europe - Total | | 311 | | | 139 | | | 202 | | | 122 | | | 774 | | | | | | | | | | | |
| Rest of World | | 128 | | | 17 | | | 63 | | | 53 | | | 261 | | | | | | | | | | | |
| Total | | $ | 1,451 | | | $ | 1,194 | | | $ | 954 | | | $ | 626 | | | $ | 4,225 | | | | | | | | | | | |
| | | | | | | | | | | | | | | | | | | | |
| Service line: | | | | | | | | | | | | | | | | | | | | |
| Consulting and technology services | | $ | 947 | | | $ | 662 | | | $ | 590 | | | $ | 348 | | | $ | 2,547 | | | | | | | | | | | |
| Outsourcing services | | 504 | | | 532 | | | 364 | | | 278 | | | 1,678 | | | | | | | | | | | |
| Total | | $ | 1,451 | | | $ | 1,194 | | | $ | 954 | | | $ | 626 | | | $ | 4,225 | | | | | | | | | | | |
| | | | | | | | | | | | | | | | | | | | |
| Type of contract: | | | | | | | | | | | | | | | | | | | | |
| Time and materials | | $ | 884 | | | $ | 475 | | | $ | 409 | | | $ | 383 | | | $ | 2,151 | | | | | | | | | | | |
| Fixed-price | | 483 | | | 409 | | | 443 | | | 219 | | | 1,554 | | | | | | | | | | | |
| Transaction or volume-based | | 84 | | | 310 | | | 102 | | | 24 | | | 520 | | | | | | | | | | | |
| Total | | $ | 1,451 | | | $ | 1,194 | | | $ | 954 | | | $ | 626 | | | $ | 4,225 | | | | | | | | | | | |
| | | | | | | | | | | | | | | | | | | | |
Costs to Fulfill
Costs to fulfill, such as setup or transition activities, are recorded in "Other noncurrent assets" in our unaudited consolidated statements of financial position and the amortization expense of costs to fulfill is included in "Cost of revenues" in our unaudited consolidated statements of operations. Costs to obtain contracts were immaterial for the periods disclosed. The standardfollowing table presents information related to the capitalized costs to fulfill for the three months ended March 31:
| | | | | | | | | | | | | | |
| (in millions) | | 2021 | | 2020 |
| Beginning balance | | $ | 467 | | | $ | 485 | |
| Amortization expense | | (29) | | | (22) | |
| Costs capitalized | | 14 | | | 35 | |
| Impairment | | (9) | | | 0 | |
| Ending balance | | $ | 443 | | | $ | 498 | |
Contract Balances
A contract asset is effectivea right to consideration that is conditional upon factors other than the passage of time. Contract assets are presented in "Other current assets" in our unaudited consolidated statements of financial position and primarily relate to unbilled amounts on fixed-price contracts utilizing the cost-to-cost method of revenue recognition. The table below shows significant movements in contract assets for fiscal years,the three months ended March 31:
| | | | | | | | | | | | | | |
| (in millions) | | 2021 | | 2020 |
| Beginning balance | | $ | 315 | | | $ | 334 | |
| Revenues recognized during the period but not billed | | 183 | | | 219 | |
| Amounts reclassified to trade accounts receivable | | (162) | | | (194) | |
| | | | |
| Ending balance | | $ | 336 | | | $ | 359 | |
| | | | | | | | |
| Cognizant | 8 | March 31, 2021 Form 10-Q |
Our contract liabilities, or deferred revenue, consist of advance payments and interimbillings in excess of revenues recognized. The table below shows significant movements in the deferred revenue balances (current and noncurrent) for the three months ended March 31:
| | | | | | | | | | | | | | |
| (in millions) | | 2021 | | 2020 |
| Beginning balance | | $ | 419 | | | $ | 336 | |
| Amounts billed but not recognized as revenues | | 341 | | | 257 | |
| Revenues recognized related to the opening balance of deferred revenue | | (325) | | | (197) | |
| | | | |
| Ending balance | | $ | 435 | | | $ | 396 | |
Revenues recognized during the three months ended March 31, 2021 for performance obligations satisfied or partially satisfied in previous periods within those years, beginning on or after January 1, 2018. The standard allows for two methodswere immaterial.
Remaining Performance Obligations
As of adoption:March 31, 2021, the full retrospective adoption,aggregate amount of transaction price allocated to remaining performance obligations was $1,648 million, of which requires the standard to be applied to each prior period presented, or the modified retrospective adoption, which requires the cumulative effect of adoptionapproximately 75% is expected to be recognized as an adjustmentrevenue within 2 years. Disclosure is not required for performance obligations that meet any of the following criteria:
(1)contracts with a duration of one year or less as determined under ASC Topic 606: "Revenue from Contracts with Customers",
(2)contracts for which we recognize revenues based on the right to opening retained earningsinvoice for services performed,
(3)variable consideration allocated entirely to a wholly unsatisfied performance obligation or to a wholly unsatisfied promise to transfer a distinct good or service that forms part of a single performance obligation in accordance with ASC 606-10-25-14(b), for which the criteria in ASC 606-10-32-40 have been met, or
(4)variable consideration in the periodform of adoption. We intend to adopt the standard using the modified retrospective method effective January 1, 2018. While we are currently evaluating the effect the new standard will have on our consolidated financial statements and related disclosures, we believe the most significant impacts primarily relate to changesa sales-based or usage-based royalty promised in the method used to measure progress on our application maintenance and business process services fixed-price contracts, capitalization and amortizationexchange for a license of costs to acquire and fulfill a contract, as well as the timing of revenue recognition on our software license contracts. Due to the complexity of certain of our contracts, the actual revenue recognition treatment required under the standard will be dependent on each contract's specific terms. The final impact of adoption of the new standard will be based on active contracts as of December 31, 2017. intellectual property.
Many of our contractsperformance obligations meet one or more of these exemptions and therefore are short-termnot included in naturethe remaining performance obligation amount disclosed above.
Trade Accounts Receivable and may be renewed, terminated or otherwise modified after September 30, 2017. Additionally, new contracts will be signedAllowance for Doubtful Accounts
We calculate expected credit losses for our trade accounts receivable based on historical credit loss rates for each aging category as adjusted for the current market conditions and forecasts about future economic conditions. The following table presents the activity in the allowance for trade accounts receivable for the three months ended March 31:
| | | | | | | | | | | | | | |
| (in millions) | | 2021 | | 2020 |
| Beginning balance | | $ | 57 | | | $ | 67 | |
| Impact of adoption of the Credit Loss Standard | | — | | | (1) | |
| Credit loss (reversal) expense | | (5) | | | 10 | |
| Write-offs charged against the allowance | | (6) | | | (2) | |
| | | | |
| Ending balance | | $ | 46 | | | $ | 74 | |
| | | | | | | | | | | | | | |
| Note 3 — Business Combinations |
Acquisitions completed during the fourth quarter of 2017. Thus, we are unable to provide a quantification of the impact of adoption of the new standard at this time.
In January 2016, the FASB issued an update to the standard on financial instruments. The update significantly revises an entity’s accounting related to (1) the classification and measurement of investments in equity securities and (2) the presentation of certain fair value changes for financial liabilities measured at fair value. It also amends certain disclosure requirements. The update is effective for fiscal years, and interim periods within those fiscal years, beginning onthree months ended March 31, 2021 were not individually or after January 1, 2018. Upon adoption, entities will be required to make a cumulative-effect adjustment to the statement of financial position as of the beginning of the first reporting period in which the guidance is effective. However, the specific guidance on equity securities without readily determinable fair value will apply prospectively to all equity investments that exist as of the date of adoption. We do not expect the adoption of this update to have a material effect on our financial condition or results of operations.
In February 2016, the FASB issued a standard on lease accounting. The new standard replaces the existing guidance on leases and requires the lessee to recognize a right-of-use asset and a lease liability for all leases with lease terms equal to or greater than twelve months. For finance leases, the lessee would recognize interest expense and amortization of the right-of-use asset, and for operating leases, the lessee would recognize total lease expense on a straight-line basis. This standard is effective for fiscal years, and interim periods within those fiscal years, beginning on or after January 1, 2019. Upon adoption, entities will be required to use a modified retrospective transition which provides for certain practical expedients. Entities are required to apply the new standard at the beginning of the earliest comparative period presented. Early adoption of this new standard is permitted. We expect to adopt the standard beginning January 1, 2019. We are currently evaluating the effect the new standard will have on our consolidated financial statements and related disclosures. We expect the requirement to recognize a right-of-use asset and a lease liability for operating leases to have a material impact on the presentation of our consolidated statements of financial position.
In August 2016, the FASB issued an update to the standard on the statement of cash flows, which clarifies the presentation and classification of certain cash receipts and cash payments. The update addresses specific cash flow issues, including debt prepayment or debt extinguishment costs, contingent consideration payments made after a business combination, proceeds from the settlement of insurance claims, and distributions received from equity method investees. The update is effective for fiscal years, and interim periods within those fiscal years, beginning on or after January 1, 2018. Upon adoption, entities will be required to use a retrospective transition approach. The adoption of this guidance may affect financial statement presentation but will have no effect on our financial position or results of operations.
In March 2017, the FASB issued an update to shorten the amortization period for certain callable debt securities held at a premium to the earliest call date. The amendments do not require an accounting change for securities held at a discount. The update is effective for fiscal years, and interim periods within those fiscal years, beginning on or after January 1, 2019 with early adoption permitted. Upon adoption, entities will be required to use a modified retrospective transition with the cumulative effect adjustment recognized to retained earnings as of the beginning of the period of adoption. We are currently evaluating the effect the amendments will have on our consolidated financial statements and related disclosures.
In May 2017, the FASB issued an update to amend the scope of modification accounting for share-based payment arrangements. The amendment requires that an entity will not apply modification accounting to a share-based payment award if the award’s fair value, vesting conditions and classification are the same immediately before and after the modification. The
update is effective for fiscal years, and interim periods within those fiscal years, beginning on or after January 1, 2018. Upon adoption, entities will be required to apply this guidance prospectively to an award modified on or after the adoption date. We do not expect the adoption of this update to have a material effect on our financial condition or results of operations.
In August 2017, the FASB issued an update to the standard on derivatives and hedging. The update expands and refines hedge accounting for both financial and nonfinancial hedging strategies to better align hedge accounting with companies’ risk management strategies. The update also amends the presentation and disclosure requirements and changes how companies assess effectiveness of their hedges. The update is effective for fiscal years, and interim periods within those fiscal years, beginning on or after January 1, 2019 with early adoption permitted. Adoption methods will differ by type of hedge. We are currently evaluating the effect the update will have on our consolidated financial statements and related disclosures.
Note 2 — Internal Investigation and Related Matters
We are conducting an internal investigation focused on whether certain payments relating to Company-owned facilities in India were made improperly and in possible violation of the U.S. Foreign Corrupt Practices Act, or FCPA, and other applicable laws. In September 2016, we voluntarily notified the U.S. Department of Justice, or DOJ, and Securities and Exchange Commission, or SEC, and are cooperating fully with both agencies. The investigation is being conducted under the oversight of the Audit Committee, with the assistance of outside counsel. To date, the investigation has identified a total of approximately $6 million in payments made between 2010 and 2015 that may have been improper. During the year ended December 31, 2016, we recorded out-of-period corrections related to $4 million of such payments that had been previously capitalized that should have been expensed. Of the $4 million out-of-period correction, $3 million was recorded in the third quarter of 2016 and $1 million was recorded in the fourth quarter of 2016. These out-of-period corrections and the other $2 million in potentially improper payments were not material to any previously issued financial statements. The investigation is also examining various other payments made in small amounts in India and elsewhere that may not have complied with Company policy or applicable law. There were no adjustments recorded during the nine months ended September 30, 2017.
Note 3 — Business Combinations
Business Combinations
In 2017, we completed three business combinations for total initial consideration of approximately $72 million (net of cash acquired). One of these transactions was an acquisition of an intelligent products and solutions company specializing in digital strategy, product design and engineering, the internet of things, and enterprise mobility that expands our digital transformation portfolio and capabilities. The second transaction was an acquisition of a healthcare management consulting firm that strengthens our consulting service offerings within the healthcare consulting market. The third transaction was an acquisition of a leading national provider of business process services to the government healthcare market that further strengthens our business process-as-a-service solutions for government and public health programs.
These acquisitions were included in our unaudited condensed consolidated financial statements as of the date on which the businesses were acquired and were notaggregate material to our operations, financial position or cash flows.operations. Accordingly, pro forma results have not been presented. We have preliminarily allocated the purchase price related to these transactions to tangible and intangible assets acquired and liabilities assumed, including non-deductible goodwill, based on their estimated fair values. We will finalizeGoodwill from these acquisitions is expected to benefit all of our reportable segments and has been allocated as such. The primary items that generated goodwill are the value of the acquired assembled workforces and synergies between the acquired companies and us, neither of which qualify as an identifiable intangible asset.
During the three months ended March 31, 2021, we acquired 100% ownership in each of the following:
•Linium, a cloud transformation consultancy group specializing in the ServiceNow platform and solutions for smart digital enterprise workflows, acquired to broaden our enterprise service management capabilities (acquired January 31, 2021); and
| | | | | | | | |
| Cognizant | 9 | March 31, 2021 Form 10-Q |
•Magenic, a provider of agile software and cloud development, DevOps, experience design and advisory services across a range of industries, acquired to enhance our global software engineering expertise (acquired February 1, 2021).
The allocations of preliminary purchase price allocationto the fair value of the aggregate assets acquired and liabilities assumed were as follows:
| | | | | | | | | | | | | | | | | | | | | | | |
| (in millions) | Linium | | Magenic | | Total | | Weighted Average Useful Life |
| Cash | $ | 0 | | | $ | 13 | | | $ | 13 | | | |
| Trade accounts receivable | 5 | | | 17 | | | 22 | | | |
| Property and equipment and other assets | 1 | | | 4 | | | 5 | | | |
| Operating lease assets, net | 0 | | | 8 | | | 8 | | | |
| Non-deductible goodwill | 0 | | | 34 | | | 34 | | | |
| Tax-deductible goodwill | 57 | | | 112 | | | 169 | | | |
| Customer relationship assets | 24 | | | 90 | | | 114 | | | 8.4 years |
| Other intangible assets | 0 | | | 1 | | | 1 | | | 1.0 year |
| | | | | | | |
| Current liabilities | (2) | | | (29) | | | (31) | | | |
| Noncurrent liabilities | 0 | | | (5) | | | (5) | | | |
| Purchase price, inclusive of contingent consideration | $ | 85 | | | $ | 245 | | | $ | 330 | | | |
The above allocations are preliminary and will be finalized as soon as practicable within the measurement period, but in no event later than one year following the date of acquisition. Specifically-identified intangible assets
| | | | | | | | | | | | | | |
| Note 4 — Restructuring Charges |
During 2020, we incurred costs related to both our realignment program and goodwill acquired were as follows:
|
| | | | | |
| | Fair Value | | Weighted Average Useful Life |
| | (in millions) | | |
| Non-deductible goodwill | $ | 28 |
| | |
| Customer relationship intangible assets | 91 |
| | 10.0 years |
| Other intangible assets | 2 |
| | 2.7 years |
The primary items that generatedour 2020 Fit for Growth Plan. Our realignment program, which began in 2017, improved our client focus, cost structure and the aforementioned goodwill are the value of the acquired assembled workforcesefficiency and synergies between the acquired companies and us, neither of which qualify as an amortizable intangible asset.
Supplemental Schedule of Noncash Investing Activities
In conjunction with the 2017 acquisitions, liabilities were assumed as follows:
|
| | | |
| | Nine Months Ended
September 30, |
| | (in millions) |
| Fair value of assets acquired | $ | 165 |
|
| Purchase price paid in cash (net of cash acquired) | (72 | ) |
| Liabilities assumed | $ | 93 |
|
Note 4 — Realignment Charges
In 2017, we began a realignmenteffectiveness of our businessdelivery while continuing to acceleratedrive revenue growth. Our 2020 Fit for Growth Plan, which began in the shiftfourth quarter of 2019, simplified our organizational model and optimized our cost structure in order to digitalpartially fund the investments required to execute on our strategy and advance our growth agenda and included our decision to exit certain content-related services and solutions while improving the overall efficiency ofthat were not in line with our operations. As part of this realignment,strategic vision for the threeCompany. The total costs related to our realignment program and nineour 2020 Fit for Growth Plan are reported in "Restructuring charges" in our unaudited consolidated statement of operations. During the three months ended September 30, 2017,March 31, 2020, we incurred $19certain retention costs and professional fees of $20 million and $69 million, respectively, in pre-tax realignment charges, reported in "Selling, general and administrative expenses" in our consolidated statements of operations. The realignment charges are comprised of severance costs, including those related to a voluntaryour realignment program and employee separation, program, or VSP, announced in May 2017, lease termination costsemployee retention, facility exit and advisory feesother charges of $35 million related to non-routine shareholder matters andour 2020 Fit for Growth Plan. We did not incur any costs related to the development of our realignment and return of capital programs.
Realignment charges forthese plans during the three and nine months ended September 30, 2017 were as follows:March 31, 2021.
|
| | | | | | | | |
| | | Three Months | | Nine Months |
| | | (in millions) |
| Employee separations | | $ | 14 |
| | $ | 53 |
|
| Advisory fees | | 5 |
| | 15 |
|
| Lease termination costs | | — |
| | 1 |
|
| Total realignment costs | | $ | 19 |
| | $ | 69 |
|
There were no realignment charges incurred in 2016.
Note 5 — Investments
Our investments were as follows:
| | | | | | | | | | | |
| (in millions) | March 31, 2021 | | December 31, 2020 |
| Short-term investments: | | | |
| Equity investment security | $ | 27 | | | $ | 27 | |
| Held-to-maturity investment securities | 34 | | | 14 | |
| Time deposits | 124 | | | 3 | |
| Total short-term investments | $ | 185 | | | $ | 44 | |
| | | | | | | | | | | |
| Long-term investments: | | | |
| Equity and cost method investments | $ | 35 | | | $ | 35 | |
Restricted time deposits(1) | 404 | | | 405 | |
| Total long-term investments | $ | 439 | | | $ | 440 | |
| | | | | | | | |
| Cognizant | 10 | March 31, 2021 Form 10-Q |
|
| | | | | | | |
| | September 30, 2017 | | December 31, 2016 |
| | (in millions) |
| Short-term investments: | | | |
| Trading investment securities | $ | 25 |
| | $ | 25 |
|
| Available-for-sale investment securities | 2,075 |
| | 2,264 |
|
| Held-to-maturity investment securities | 677 |
| | 40 |
|
| Time deposits | 359 |
| | 806 |
|
| Total short-term investments | $ | 3,136 |
| | $ | 3,135 |
|
|
| | | | | | | |
| Long-term investments: | | | |
| Equity and cost method investments | $ | 72 |
| | $ | 62 |
|
| Held-to-maturity investment securities | 190 |
| | — |
|
| Total long-term investments | $ | 262 |
| | $ | 62 |
|
Trading Investment Securities
Our tradingequity investment securities consist ofsecurity is a U.S. dollar denominated investment in a fixed income mutual fund. Unrealized losses for the threeRealized and nine months ended September 30, 2017 and 2016 were immaterial. There were no realized gains or losses on trading securities during the three and nine months ended September 30, 2017. The value of the fixed income mutual fund invested in fixed income securities is based on the net asset value, or NAV, of the fund, with appropriate consideration of the liquidity and any restrictions on disposition of our investment in the fund.
Available-for-Sale Investment Securities
Our available-for-sale investment securities consist of U.S. dollar denominated investments primarily in U.S. Treasury notes, U.S. government agency debt securities, municipal debt securities, non-U.S. government debt securities, U.S. and international corporate bonds, certificates of deposit, commercial paper, debt securities issued by supranational institutions, and asset-backed securities, including securities backed by auto loans, credit card receivables, and other receivables. Our investment guidelines are to purchase securities which are investment grade at the time of acquisition. We monitor the credit ratings of the securities in our portfolio on an ongoing basis.
The amortized cost, gross unrealized gains and losses and fair value of available-for-sale investment securities at September 30, 2017were as follows:
|
| | | | | | | | | | | | | | | |
| | Amortized Cost | | Unrealized Gains | | Unrealized Losses | | Fair
Value |
| | (in millions) |
| U.S. Treasury and agency debt securities | $ | 658 |
| | $ | — |
| | $ | (2 | ) | | $ | 656 |
|
| Corporate and other debt securities | 452 |
| | — |
| | (1 | ) | | 451 |
|
| Certificates of deposit and commercial paper | 546 |
| | 1 |
| | — |
| | 547 |
|
| Asset-backed securities | 289 |
| | — |
| | (1 | ) | | 288 |
|
| Municipal debt securities | 133 |
| | — |
| | — |
| | 133 |
|
| Total available-for-sale investment securities | $ | 2,078 |
| | $ | 1 |
| | $ | (4 | ) | | $ | 2,075 |
|
The amortized cost, gross unrealized gains and losses and fair value of available-for-sale investment securities at December 31, 2016 were as follows:
|
| | | | | | | | | | | | | | | |
| | Amortized Cost | | Unrealized Gains | | Unrealized Losses | | Fair Value |
| | (in millions) |
| U.S. Treasury and agency debt securities | $ | 605 |
| | $ | — |
| | $ | (3 | ) | | $ | 602 |
|
| Corporate and other debt securities | 407 |
| | — |
| | (2 | ) | | 405 |
|
| Certificates of deposit and commercial paper | 910 |
| | 1 |
| | — |
| | 911 |
|
| Asset-backed securities | 232 |
| | — |
| | (1 | ) | | 231 |
|
| Municipal debt securities | 116 |
| | — |
| | (1 | ) | | 115 |
|
| Total available-for-sale investment securities | $ | 2,270 |
| | $ | 1 |
| | $ | (7 | ) | | $ | 2,264 |
|
The fair value and related unrealized losses of available-for-sale investment securities in a continuous unrealized loss position for less than 12 months and for 12 months or longer were as follows as of September 30, 2017:
|
| | | | | | | | | | | | | | | | | | | | | | | |
| | Less than 12 Months | | 12 Months or More | | Total |
| | Fair Value | | Unrealized Losses | | Fair Value | | Unrealized Losses | | Fair Value | | Unrealized Losses |
| | (in millions) |
| U.S. Treasury and agency debt securities | $ | 546 |
| | $ | (1 | ) | | $ | 44 |
| | $ | (1 | ) | | $ | 590 |
| | $ | (2 | ) |
| Corporate and other debt securities | 253 |
| | (1 | ) | | 37 |
| | — |
| | 290 |
| | (1 | ) |
| Certificates of deposit and commercial paper | 25 |
| | — |
| | — |
| | — |
| | 25 |
| | — |
|
| Asset-backed securities | 226 |
| | (1 | ) | | 10 |
| | — |
| | 236 |
| | (1 | ) |
| Municipal debt securities | 60 |
| | — |
| | 7 |
| | — |
| | 67 |
| | — |
|
| Total | $ | 1,110 |
| | $ | (3 | ) | | $ | 98 |
| | $ | (1 | ) | | $ | 1,208 |
| | $ | (4 | ) |
The fair value and related unrealized losses of available-for-sale investment securities in a continuous unrealized loss position for less than 12 months and for 12 months or longer were as follows as of December 31, 2016:
|
| | | | | | | | | | | | | | | | | | | | | | | |
| | Less than 12 Months | | 12 Months or More | | Total |
| | Fair Value | | Unrealized Losses | | Fair Value | | Unrealized Losses | | Fair Value | | Unrealized Losses |
| | (in millions) |
| U.S. Treasury and agency debt securities | $ | 526 |
| | $ | (3 | ) | | $ | — |
| | $ | — |
| | $ | 526 |
| | $ | (3 | ) |
| Corporate and other debt securities | 342 |
| | (2 | ) | | 1 |
| | — |
| | 343 |
| | (2 | ) |
| Certificates of deposit and commercial paper | 185 |
| | — |
| | — |
| | — |
| | 185 |
| | — |
|
| Asset-backed securities | 206 |
| | (1 | ) | | 1 |
| | — |
| | 207 |
| | (1 | ) |
| Municipal debt securities | 88 |
| | (1 | ) | | 1 |
| | — |
| | 89 |
| | (1 | ) |
| Total | $ | 1,347 |
| | $ | (7 | ) | | $ | 3 |
| | $ | — |
| | $ | 1,350 |
| | $ | (7 | ) |
The unrealized lossesimmaterial for the above securities as of September 30, 2017three months ended March 31, 2021 and December 31, 2016 were primarily attributable to changes in interest rates. At each reporting date, the Company performs an evaluation of impaired available-for-sale securities to determine if the unrealized losses are other-than-temporary. We do not consider any of the investments to be other-than-temporarily impaired as of September 30, 2017. The gross unrealized gains and losses in the above tables were recorded, net of tax, in "Accumulated other comprehensive income (loss)" in our consolidated statements of financial position.2020.
The contractual maturities of our fixed income available-for-sale investment securities as of September 30, 2017 are set forth in the following table:
|
| | | | | | | |
| | Amortized Cost | | Fair Value |
| | (in millions) |
| Due within one year | $ | 692 |
| | $ | 692 |
|
| Due after one year up to two years | 539 |
| | 538 |
|
| Due after two years up to three years | 461 |
| | 460 |
|
| Due after three years | 97 |
| | 97 |
|
| Asset-backed securities | 289 |
| | 288 |
|
| Total available-for-sale investment securities | $ | 2,078 |
| | $ | 2,075 |
|
Asset-backed securities were excluded from the maturity categories because the actual maturities may differ from the contractual maturities since the underlying receivables may be prepaid without penalties. Further, actual maturities of debt securities may differ from those presented above since certain obligations provide the issuer the right to call or prepay the obligation prior to scheduled maturity without penalty.
Proceeds from sales of available-for-sale investment securities and the gross gains and losses that have been included in earnings as a result of those sales were as follows:
|
| | | | | | | | | | | | | | | |
| | Three Months Ended
September 30, | | Nine Months Ended
September 30, |
| | 2017 | | 2016 | | 2017 | | 2016 |
| | (in millions) |
| Proceeds from sales of available-for-sale investment securities | $ | 375 |
| | $ | 465 |
| | $ | 2,020 |
| | $ | 2,843 |
|
| | | | | | | | |
| Gross gains | $ | — |
| | $ | 1 |
| | $ | 1 |
| | $ | 5 |
|
| Gross losses | (1 | ) | | (4 | ) | | (2 | ) | | (4 | ) |
| Net realized (losses) gains on sales of available-for-sale investment securities | $ | (1 | ) | | $ | (3 | ) | | $ | (1 | ) | | $ | 1 |
|
Held-to-Maturity Investment Securities
Our held-to-maturity investment securities consist of Indian rupee denominated investments primarily in commercial paper and international corporate bonds and government debt securities.bonds. Our investment guidelines are to purchase securities that are investment grade at the time of acquisition. We monitorThe basis for the credit ratingsmeasurement of fair value of our held-to-maturity investments is Level 2 in the securities in our portfolio on an ongoing basis. We classify these securities with maturities beyond 90 days but less than one year at the reporting date as short-term investments and beyond one year as long-term investments.
fair value hierarchy.
The amortized cost gross unrealized gains and losses and fair value of held-to-maturity investment securities at September 30, 2017 were as follows:
| | | | | | | | | | | | | | | | | | | | | | | | | | | |
| (in millions) | March 31, 2021 | | December 31, 2020 |
| | Amortized
Cost | | | | | | Fair
Value | | Amortized
Cost | | Fair
Value |
| Short-term investments, maturing within one year: | | | | | | | | | | | |
| Corporate and other debt securities | $ | 14 | | | | | | | $ | 14 | | | $ | 14 | | | $ | 14 | |
| Commercial paper | 20 | | | | | | | 20 | | | 0 | | | 0 | |
| Total short-term held-to-maturity investments | $ | 34 | | | | | | | $ | 34 | | | $ | 14 | | | $ | 14 | |
|
| | | | | | | | | | | | | | | |
| | Amortized
Cost | | Unrealized
Gains | | Unrealized
Losses | | Fair
Value |
| | (in millions) |
| Short-term investments: | | | | | | | |
| Corporate and other debt securities | $ | 281 |
| | $ | — |
| | $ | — |
| | $ | 281 |
|
| Commercial paper | 396 |
| | — |
| | — |
| | 396 |
|
| Total short-term held-to-maturity investments | 677 |
| | — |
| | — |
| | 677 |
|
| Long-term investments: | | | | | | | |
| Corporate and other debt securities | 190 |
| | — |
| | (1 | ) | | 189 |
|
| Total held-to-maturity investment securities | $ | 867 |
| | $ | — |
| | $ | (1 | ) | | $ | 866 |
|
The amortized cost, gross unrealized gains and losses and fair valueAs of held-to-maturity investment securities at DecemberMarch 31, 2016 were as follows:
|
| | | | | | | | | | | | | | | |
| | Amortized
Cost | | Unrealized
Gains | | Unrealized
Losses | | Fair
Value |
| | (in millions) |
| Short-term investments: | | | | | | | |
| Certificates of deposit and commercial paper | $ | 40 |
| | $ | — |
| | $ | — |
| | $ | 40 |
|
There were no long-term held-to-maturity investment securities at December 31, 2016.
The fair value and related unrealized losses of held-to-maturity investment2021, commercial paper securities in a continuousthe amount of $7 million were in an unrealized loss position. The total unrealized loss was less than $1 million and NaN of the securities had been in an unrealized loss position for lesslonger than 12 months and for 12 months or longer were as follows as of September 30, 2017:
|
| | | | | | | | | | | | | | | | | | | | | | | |
| | Less than 12 Months | | 12 Months or More | | Total |
| | Fair Value | | Unrealized Losses | | Fair Value | | Unrealized Losses | | Fair Value | | Unrealized Losses |
| | (in millions) |
| Corporate and other debt securities | $ | 363 |
| | $ | (1 | ) | | $ | — |
| | $ | — |
| | $ | 363 |
| | $ | (1 | ) |
| Commercial paper | 268 |
| | — |
| | — |
| | — |
| | 268 |
| | — |
|
| Total | $ | 631 |
| | $ | (1 | ) | | $ | — |
| | $ | — |
| | $ | 631 |
| | $ | (1 | ) |
months. As of December 31, 2016,2020, there were 0 held-to-maturity investment securities in an unrealized loss positionposition.
The securities in our portfolio are highly rated and short-term in nature. As of March 31, 2021, our corporate and other debt securities were immaterial. At each reporting date, the Company performsrated AA+ or better and our commercial paper securities were rated A-1+ by CRISIL, an evaluationIndian subsidiary of held-to-maturity securities to determine if the unrealized losses are other-than-temporary. We do not consider anyS&P Global.
Equity and Cost Method Investments
As of the investments to be other-than-temporarily impaired as of September 30, 2017.
The contractual maturities of our fixed income held-to-maturity investment securities as of September 30, 2017 are set forth in the following table:
|
| | | | | | | |
| | Amortized Cost | | Fair Value |
| | (in millions) |
| Due within one year | $ | 677 |
| | $ | 677 |
|
| Due after one year up to two years | 184 |
| | 183 |
|
| Due after two years | 6 |
| | 6 |
|
| Total held-to-maturity investment securities | $ | 867 |
| | $ | 866 |
|
During the nine months ended September 30, 2017both March 31, 2021 and the year ended December 31, 2016, there were no transfers2020, we had equity method investments of $31 million and cost method investments between our trading, available-for-sale and held-to-maturity investment portfolios.of $4 million.
| | | | | | | | | | | | | | |
| Note 6 — Accrued Expenses and Other Current Liabilities |
Accrued expenses and other current liabilities were as follows:
| | | | | | | | | | | |
| (in millions) | March 31, 2021 | | December 31, 2020 |
| Compensation and benefits | $ | 1,359 | | | $ | 1,607 | |
| Customer volume and other incentives | 264 | | | 266 | |
| | | |
| Income taxes | 11 | | | 34 | |
| Professional fees | 148 | | | 143 | |
| Other | 376 | | | 469 | |
| Total accrued expenses and other current liabilities | $ | 2,158 | | | $ | 2,519 | |
|
| | | | | | | |
| | September 30, 2017 | | December 31, 2016 |
| | (in millions) |
| Compensation and benefits | $ | 1,262 |
| | $ | 1,134 |
|
| Income taxes | 23 |
| | 10 |
|
| Professional fees | 99 |
| | 99 |
|
| Travel and entertainment | 43 |
| | 36 |
|
| Customer volume and other incentives | 277 |
| | 258 |
|
| Derivative financial instruments | 2 |
| | 4 |
|
| Other | 275 |
| | 315 |
|
| Total accrued expenses and other current liabilities | $ | 1,981 |
| | $ | 1,856 |
|
Note 7 — Debt
In 2014,2018, we entered into a credit agreement with a commercial bank syndicate, or, as amended,into the Credit Agreement providing for a $1,000the $750 million unsecured term loanTerm Loan and a $750$1,750 million unsecured revolving credit facility. The term loan and the revolving credit facility both, which are due to mature in November 2019. All notes drawn2023.
The Credit Agreement requires interest to date underbe paid, at our option, at either the revolving credit facilityABR or the Eurocurrency Rate (each as defined in the Credit Agreement), plus, in each case, an Applicable Margin (as defined in the Credit Agreement). Initially, the Applicable Margin is 0.875% with respect to Eurocurrency Rate loans and 0.00% with respect to ABR loans. Subsequently, the Applicable Margin with respect to Eurocurrency Rate loans may range from 0.75% to 1.125%, depending on our public debt ratings (or, if we have been less than 90 daysnot received public debt ratings, from 0.875% to 1.125%, depending on our Leverage Ratio, which is the ratio of indebtedness for borrowed money to Consolidated EBITDA, as defined in duration. There werethe Credit Agreement). Our Credit
| | | | | | | | |
| Cognizant | 11 | March 31, 2021 Form 10-Q |
Agreement also provides a mechanism for determining an alternative rate of interest to the Eurocurrency rate after LIBOR is no notes outstanding under the revolving credit facility as of September 30, 2017 or December 31, 2016. longer available.
We are required under the Credit Agreement to make scheduled quarterly principal payments on the term loan.Term Loan. The Credit Agreement contains customary affirmative and negative covenants as well as a financial covenant. We were in compliance with all debt covenants and representations as of SeptemberMarch 31, 2021.
In February 2021, our India subsidiary renewed its 13 billion Indian rupee ($178 millionat the March 31, 2021 exchange rate) working capital facility, which requires us to repay any balances within 90 days from the date of disbursement. There is a 1.0% prepayment penalty applicable to payments made prior to 30 2017.
days after disbursement. This working capital facility contains affirmative and negative covenants and may be renewed annually in February.
Short-term Debt
The following summarizes ourAs of both March 31, 2021 and December 31, 2020, we had $38 millionof short-term debt balances as of:
|
| | | | | | | | |
| | | September 30, 2017 | | December 31, 2016 |
| | | (in millions) |
| Term loan - current maturities | | $ | 100 |
| | $ | 81 |
|
| Total short-term debt | | $ | 100 |
| | $ | 81 |
|
related to current maturities of our Term Loan.
Long-term Debt
The following summarizes our long-term debt balances as of:
| | | | | | | | | | | |
| (in millions) | March 31, 2021 | | December 31, 2020 |
| | | |
| Term Loan | $ | 694 | | | $ | 703 | |
| Less: | | | |
| Current maturities - Term Loan | (38) | | | (38) | |
| Deferred financing costs | (2) | | | (2) | |
| Long-term debt, net of current maturities | $ | 654 | | | $ | 663 | |
The carrying value of our debt approximated its fair value as of March 31, 2021 and December 31, 2020.
|
| | | | | | | | |
| | | September 30, 2017 | | December 31, 2016 |
| | | (in millions) |
| Term loan, due 2019 | | $ | 825 |
| | $ | 881 |
|
| Less: | | | | |
| Current maturities | | (100 | ) | | (81 | ) |
| Deferred financing costs | | (2 | ) | | (3 | ) |
| Long-term debt, net of current maturities | | $ | 723 |
| | $ | 797 |
|
Note 8 — Income Taxes
Our Indian subsidiaries, collectively referredIn March 2021, we reached an agreement with the IRS, which effectively settled tax years 2012 through 2016. As a result of this effective settlement, in the first quarter of 2021, we recorded a reduction of $43 million to as Cognizant India, are primarily export-orientedour uncertain tax position balance, which resulted in a $14 million discrete benefit to the provision for income taxes and are eligible for certaina $29 million adjustment to our current income tax holiday benefits grantedbalance sheet accounts. Tax years that remain subject to examination by the government of India for export activities conducted within Special Economic Zones, or SEZs, for periods of up to 15 years. Our Indian profits ineligible for SEZ benefitsIRS are subject to corporate income tax at the rate of 34.6%. In addition, all Indian profits, including those generated within SEZs, are subject to the Minimum Alternative Tax, or MAT, at the rate of 21.3%. Any MAT paid is creditable against future Indian corporate income tax, subject to limitations.
2017 onward.
Our effective income tax rates were as follows:follows for the three months ended March 31:
| | | | | | | | | | | | | | | |
| | | |
| | 2021 | | 2020 | | | | |
| Effective income tax rate | 24.1 | % | | 27.8 | % | | | | |
|
| | | | | | | | | | | |
| | Three Months Ended
September 30, | | Nine Months Ended
September 30, |
| | 2017 | | 2016 | | 2017 | | 2016 |
| Effective income tax rate | 24.9 | % | | 27.6 | % | | 21.7 | % | | 36.7 | % |
InThe effective tax rate for the first quarterthree months ended March 31, 2021 decreased primarily as a result of 2017, we recognized income tax benefits previously unrecognizedsignificantly lower non-deductible foreign currency exchange losses in our unaudited consolidated financial statements related to several uncertain tax positions totaling $72 million. The recognitionstatement of these benefitsoperations in the first quarter of 2017 was based on management’s reassessment regarding whether certain unrecognized tax benefits met2021 period and the more-likely-than-not threshold in lightdiscrete benefit of the lapseeffective settlement of the IRS examination for tax years 2012 through 2016.
We are involved in an ongoing dispute with the statute of limitations asITD in connection with a previously disclosed transaction undertaken by CTS India in 2016 to a portion of such benefits.
In May 2016, our principal operating subsidiary in India repurchasedrepurchase shares from its shareholders which are non-Indian(non-Indian Cognizant entities,entities) valued at $2.8 billion ("India Cash Remittance"). Thisbillion. As a result of that transaction, which was undertaken pursuant to a plan approved by the High Court of Madras and simplifiedin Chennai, India, we previously paid $135 million in Indian income taxes - an amount we believe includes all applicable taxes owed for this transaction under Indian law. In March 2018, we received a communication from the shareholding structureITD asserting that the ITD is owed an additional 33 billion Indian rupees ($451 million at the March 31, 2021 exchange rate) on the 2016 transaction. Immediately thereafter, the ITD placed an attachment on certain of our principal operating subsidiary in India. PursuantIndia bank accounts. In addition to the dispute on the 2016 transaction, our principal Indian operating subsidiary repurchased approximately $1.2 billion ofwe are also involved in another ongoing dispute with the total $2.8 billion ofITD relating to a 2013 transaction undertaken by CTS India to repurchase shares from its U.S. shareholders resulting invalued at $523 million (the two disputes are collectively referred to as the "ITD Dispute").
In April 2018, the High Court admitted our writ petition for a stay of the actions of the ITD and lifted the ITD’s attachment on our bank accounts. As part of the interim stay order, we deposited 5 billion Indian rupees ($68 million at the March 31, 2021 and December 31, 2020 exchange rates) representing 15% of the disputed tax expense in the United States and India, while the remaining $1.6 billion was repurchased from its shareholder outside the United States. Net of taxes, the transaction resulted in a remittance of cashamount related to the United States2016 transaction, with the ITD. In addition, the High Court placed a lien on certain time deposits of CTS India in the amount of $1.0 billion. As28 billion Indian rupees ($383 million at the March 31, 2021 exchange rate and $384 million at the December 31, 2020 exchange rate), which is the remainder of the disputed tax amount related to the 2016 transaction.
| | | | | | | | |
| Cognizant | 12 | March 31, 2021 Form 10-Q |
In June 2019, the High Court dismissed our previously admitted writ petitions on the ITD Dispute, holding that the Company must exhaust other remedies, such as pursuing the matter before other appellate bodies, for resolution of the ITD Dispute prior to intervention by the High Court. The High Court did not issue a ruling on the substantive issue of whether we owe additional tax as a result of either the 2016 or the 2013 transaction. In July 2019, we appealed the High Court’s orders before the Division Bench. In September 2019, the Division Bench partly allowed the Company’s appeal with respect to the 2016 transaction, but did not issue a ruling on the substantive issue of the tax implications of the transactions. In October 2019, we filed a SLP before the SCI with respect to the 2016 transaction. In March 2020, the SCI referred the case based on the 2016 transaction back to the ITD with directions to carry out the assessment following the due process of law. Further, until the conclusion of the assessment, the SCI maintained in place the lien on our 28 billion Indian rupees time deposit and did not order the release of the 5 billion Indian rupees deposit held by the ITD. In April 2020, we received an assessment from the ITD, which is consistent with its previous assertions regarding our 2016 transaction. In June 2020, we filed an appeal against this transaction, we incurred an incremental 2016 income tax expenseassessment.
As of $238March 31, 2021 and December 31, 2020, the balance of deposits under lien was $404 million and $405 million, respectively, presented in "Long-term investments", including a discrete item recognizedportion of the interest previously earned. As of both March 31, 2021 and December 31, 2020, the deposit with the ITD was $68 million, presented in "Other noncurrent assets".
We believe we have paid all applicable taxes owed on both the second quarter of 2016 of $143 million relating to the distribution of historic undistributed accumulated foreign earnings. Total incremental tax expense of $24 million and $214 million were recognized in the three and nine months ended September 30, 2016. This transaction is primarily responsible for the decrease in our effective income tax rate in 2017 compared to 2016.
The decrease in our effective income tax rate for the nine months ended 2017 as compared to the same period in 2016 is primarily due to the India Cash Remittance and the recognition2013 transactions. Accordingly, we have not recorded any reserves for these matters as of previously unrecognized income tax benefits, as described above. For the 2017 periods, the principal reasons for the difference between our effective income tax rates and the U.S. federal statutory rate are the effect of the Indian tax holiday, earnings taxed in countries that have lower rates than the United States, and, for the nine months ended September 30, 2017, the recognition in the first quarter of 2017 of previously unrecognized income tax benefits. For the three months ended September 30, 2016, the principal reasons for the difference between our effective income tax rates and the U.S. federal statutory rate are the effect of the Indian tax holiday and earnings taxed in countries that have lower rates than the United States, partially offset by the effect of the India Cash Remittance transaction. For the nine months ended September 30, 2016, the principal reasons for the difference between our effective income tax rates and the U.S. federal statutory rate are the effect of the India Cash Remittance transaction, partially offset by the effect of the Indian tax holiday and earnings taxed in countries that have lower rates than the United States.March 31, 2021.
| | | | | | | | | | | | | | |
| Note 9 — Derivative Financial Instruments |
In the normal course of business, we use foreign exchange forward and option contracts to manage foreign currency exchange rate risk. The estimated fair value of the foreign exchange forward contracts considers the following items: discount rate, timing and amount of cash flow and counterparty credit risk. Derivatives may give rise to credit risksrisk from the possible non-performance by counterparties. Credit risk is generally limited to the fair value of those contracts that are favorable to us. We have limited our credit risk by entering into derivative transactions only with highly-rated financial institutions, limitinglimiting the amount of credit exposure with any one financial institution and conducting an ongoing evaluation of the creditworthiness of the financial institutions with which we do business. In addition, all the assets and liabilities related to our foreign exchange forwardderivative contracts set forth in the below table are subject to master netting arrangements, such as the International Swaps and Derivatives Association or ISDA, master netting arrangements or other similar agreementsMaster Agreement, with each individual counterparty. These master netting arrangements generally provide for net settlement of all outstanding contracts with the counterparty in the case of an event of default or a termination event. We have presented all the assets and liabilities related to our foreign exchange forwardderivative contracts, as applicable, on a gross basis, with no offsets, in our accompanying unaudited consolidated statements of financial position. There is no financial collateral (including cash collateral) posted or received by us related to our foreign exchange forwardderivative contracts.
The following table provides information on the location and fair values of derivative financial instruments included in our unaudited consolidated statements of financial position as of:
| | | | | | | | | | | | | | | | | | | | | | | | | | | | | | | | |
| (in millions) | | | | March 31, 2021 | | December 31, 2020 |
| Designation of Derivatives | | Location on Statement of
Financial Position | | Assets | | Liabilities | | Assets | | Liabilities |
| Foreign exchange forward and option contracts – Designated as cash flow hedging instruments | | Other current assets | | $ | 45 | | | $ | — | | | $ | 45 | | | $ | — | |
| | Other noncurrent assets | | 18 | | | — | | | 26 | | | — | |
| | | | | | | | | | |
| | | | | | | | | | |
| | Total | | 63 | | | 0 | | | 71 | | | 0 | |
| Foreign exchange forward contracts – Not designated as hedging instruments | | Other current assets | | 2 | | | — | | | 1 | | | — | |
| | Accrued expenses and other current liabilities | | — | | | 0 | | | — | | | 1 | |
| | Total | | 2 | | | 0 | | | 1 | | | 1 | |
| Total | | | | $ | 65 | | | $ | 0 | | | $ | 72 | | | $ | 1 | |
| | | | | | | | |
| Cognizant | 13 | March 31, 2021 Form 10-Q |
|
| | | | | | | | | | | | | | | | | | |
| | | | | September 30, 2017 | | December 31, 2016 |
| Designation of Derivatives | | Location on Statement of Financial Position | | Assets | | Liabilities | | Assets | | Liabilities |
| | | | | (in millions) |
| Foreign exchange forward contracts – Designated as cash flow hedging instruments | | Other current assets | | $ | 106 |
| | $ | — |
| | $ | 34 |
| | $ | — |
|
| | | Other noncurrent assets | | 24 |
| | — |
| | 17 |
| | — |
|
| | | Accrued expenses and other current liabilities | | — |
| | 1 |
| | — |
| | — |
|
| | | Other noncurrent liabilities | | — |
| | 2 |
| | — |
| | — |
|
| | | Total | | 130 |
| | 3 |
| | 51 |
| | — |
|
| Foreign exchange forward contracts – Not designated as hedging instruments | | Other current assets | | 3 |
| | — |
| | — |
| | — |
|
| | | Accrued expenses and other current liabilities | | — |
| | 1 |
| | — |
| | 4 |
|
| | | Total | | 3 |
| | 1 |
| | — |
| | 4 |
|
| Total | | | | $ | 133 |
| | $ | 4 |
| | $ | 51 |
| | $ | 4 |
|
Cash Flow Hedges
We have entered into a series of foreign exchange forwardderivative contracts that are designated as cash flow hedges of Indian rupee denominated payments in India. These contracts are intended to partially offset the impact of movement of exchange ratesthe Indian rupee against the U.S. dollar on future operating costs and are scheduled to mature each month during 2017, 2018the remainder of 2021, 2022 and 2019. Under these contracts, we purchase Indian rupees and sell U.S. dollars.the first three months of 2023. The changes in fair value of these contracts are initially reported in the caption “Accumulated"Accumulated other comprehensive income (loss)”" in our unaudited consolidated statements of financial position and are subsequently reclassified to earnings within "Cost of revenues" and "Selling, general and administrative expenses" in our unaudited consolidated statements of operations in the same period that the forecasted Indian rupee denominated payments are recorded in earnings. As of September 30, 2017,March 31, 2021, we estimate that $78 $36 million, net of tax, of net gains relatedrelated to derivatives designated as cash flow hedges recordedreported in accumulated"Accumulated other comprehensive income (loss)" in our unaudited consolidated statements of financial position is expected to be reclassified into earnings within the next 12 months.
The notional value of our outstanding contracts by year of maturity and the net unrealized gains and losses included in accumulated"Accumulated other comprehensive income (loss)" in our unaudited consolidated statements of financial position, for such contracts, were as followsfollows:
| | | | | | | | | | | |
| (in millions) | March 31,
2021 | | December 31, 2020 |
| 2021 | $ | 1,125 | | | $ | 1,470 | |
| 2022 | 920 | | | 803 | |
| 2023 | 140 | | | 0 | |
Total notional value of contracts outstanding (1) | $ | 2,185 | | | $ | 2,273 | |
| | | |
(1)Includes $133 million notional value of option contracts as of:
|
| | | | | | | |
| | September 30, 2017 | | December 31, 2016 |
| | (in millions) |
| 2017 | $ | 360 |
| | $ | 1,320 |
|
| 2018 | 1,140 |
| | 1,020 |
|
| 2019 | 525 |
| | — |
|
| Total notional value of contracts outstanding | $ | 2,025 |
| | $ | 2,340 |
|
| Net unrealized gains included in accumulated other comprehensive income (loss), net of taxes | $ | 95 |
| | $ | 39 |
|
Upon settlement or maturity of the cash flow hedge contracts, we record the gains or losses, based on our designation at the commencement of the contract,both March 31, 2021 and December 31, 2020, with the remaining notional value related hedged Indian rupee denominated expense reported within cost of revenues and selling, general and administrative expenses. Hedge ineffectiveness was immaterial for all periods presented.
to forward contracts.
The following table provides information on the location and amounts of pre-tax gains (losses)and losses on our cash flow hedges for the three months ended September 30:March 31:
| | | | | | | | | | | | | | | | | | | | | | | | | | | | | |
| (in millions) | Change in
Derivative Gains (Losses) Recognized
in Accumulated Other
Comprehensive Income (Loss)
(effective portion) | | Location of Net Gains (Losses) Reclassified
from Accumulated Other
Comprehensive Income (Loss)
into Income
(effective portion) | | Net Gains (Losses) Reclassified
from Accumulated Other
Comprehensive Income (Loss)
into Income
(effective portion) |
| | 2021 | | 2020 | | | | 2021 | | 2020 |
| Foreign exchange forward and option contracts – Designated as cash flow hedging instruments | $ | 17 | | | $ | (113) | | | Cost of revenues | | $ | 18 | | | $ | (3) | |
| | | | | SG&A expenses | | 3 | | | 0 | |
| | | | | Total | | $ | 21 | | | $ | (3) | |
|
| | | | | | | | | | | | | | | | | |
| | Change in Derivative Gains/Losses Recognized in Accumulated Other Comprehensive Income (Loss) (effective portion) | | Location of Net Derivative Gains Reclassified from Accumulated Other Comprehensive Income (Loss) into Income (effective portion) | | Net Gains Reclassified from Accumulated Other Comprehensive Income (Loss) into Income (effective portion) |
| | 2017 | | 2016 | | | | 2017 | | 2016 |
| | (in millions) |
| Foreign exchange forward contracts – Designated as cash flow hedging instruments | $ | 6 |
| | $ | 63 |
| | Cost of revenues | | $ | 29 |
| | $ | 7 |
|
| | | | | | Selling, general and administrative expenses | | 5 |
| | 2 |
|
| | | | | | Total | | $ | 34 |
| | $ | 9 |
|
The following table provides information on the location and amounts of pre-tax gains (losses) on our cash flow hedges for the nine months ended September 30:
|
| | | | | | | | | | | | | | | | | |
| | Change in Derivative Gains/Losses Recognized in Accumulated Other Comprehensive Income (Loss) (effective portion) | | Location of Net Derivative Gains Reclassified from Accumulated Other Comprehensive Income (Loss) into Income (effective portion) | | Net Gains Reclassified from Accumulated Other Comprehensive Income (Loss) into Income (effective portion) |
| | 2017 | | 2016 | | | | 2017 | | 2016 |
| | (in millions) |
| Foreign exchange forward contracts – Designated as cash flow hedging instruments | $ | 165 |
| | $ | 78 |
| | Cost of revenues | | $ | 75 |
| | $ | 8 |
|
| | | | | | Selling, general and administrative expenses | | 14 |
| | 2 |
|
| | | | | | Total | | $ | 89 |
| | $ | 10 |
|
The activity related to the change in net unrealized gains (losses)and losses on our cash flow hedges included in accumulated"Accumulated other comprehensive income (loss)" in our unaudited consolidated statements of stockholders' equity is presentedpresented in Note 11.
Other Derivatives
We use foreign exchange forward contracts which have not been designated as hedges, to provide an economic hedge against balance sheet exposureexposures to certain monetary assets and liabilities denominated in currencies primarily the Indian rupee, other than the functional currency of our foreign subsidiaries. TheseWe entered into foreign exchange forward contracts that are scheduled to mature in 2017 and 2018.2021. Realized gains or losses and changes in the estimated fair value of these derivative financial instruments are recorded in the caption "Foreign currency exchange gains (losses), net" in our unaudited consolidated statements of operations.
Additional information related to our outstanding foreign exchange forward contracts not designated as hedging instruments iswas as follows:
| | | | | | | | | | | | | | | | | | | | | | | |
| (in millions) | March 31, 2021 | | December 31, 2020 |
| Notional | | Fair Value | | Notional | | Fair Value |
| Contracts outstanding | $ | 574 | | | $ | 2 | | | $ | 637 | | | $ | 0 | |
| | | | | | | | |
| Cognizant | 14 | March 31, 2021 Form 10-Q |
|
| | | | | | | | | | | | | | | |
| | September 30, 2017 | | December 31, 2016 |
| | Notional | | Fair Value | | Notional | | Fair Value |
| | (in millions) |
| Contracts outstanding | $ | 273 |
| | $ | 2 |
| | $ | 213 |
| | $ | (4 | ) |
The following table provides information on the location and amounts of realized and unrealized pre-tax gains and losses on our other derivative financial instruments for the three and nine months ended September 30:March 31:
|
| | | | | | | | | | | | | | | | | |
| | Location of Net (Losses) on Derivative Instruments | | Amount of Net (Losses) on Derivative Instruments |
| | | | Three Months Ended
September 30, | | Nine Months Ended
September 30, |
| | | | 2017 | | 2016 | | 2017 | | 2016 |
| | | | (in millions) |
| Foreign exchange forward contracts – Not designated as hedging instruments | Foreign currency exchange gains (losses), net | | $ | (3 | ) | | $ | (6 | ) | | $ | (16 | ) | | $ | (6 | ) |
| | | | | | | | | | | | | | | | | | | | | |
| Location of Net Gains on
Derivative Instruments | | Amount of Net Gains on Derivative Instruments | | | | |
| | | | |
| (in millions) | | 2021 | | 2020 | | | | |
| Foreign exchange forward contracts – Not designated as hedging instruments | Foreign currency exchange gains (losses), net | | $ | 3 | | | $ | 6 | | | | | |
The related cash flow impacts of all of our derivative activities are reflected as cash flows from operating activities.
| | | | | | | | | | | | | | |
| Note 10 — Fair Value Measurements |
We measure our cash equivalents, certain investments, contingent consideration liabilities and foreign exchange forward and option contracts at fair value. The authoritative guidance defines fair value as the exit price, or the amount that would be received to sell an asset or paid to transfer a liability in an orderly transaction between market participants as of the measurement date. The authoritative guidance also establishes a fair value hierarchy that is intended to increase consistency and comparability in fair value measurements and related disclosures. The fair value hierarchy is based on inputs to valuation techniques that are used to measure fair value that are either observable or unobservable. Observable inputs reflect assumptions market participants would use in pricing an asset or liability based on market data obtained from independent sources while unobservable inputs reflect a reporting entity’s pricing based upon their own market assumptions.
The fair value hierarchy consists of the following three levels:
•Level 1 – Inputs are quoted prices in active markets for identical assets or liabilities.
•Level 2 – Inputs are quoted prices for similar assets or liabilities in an active market, quoted prices for identical or similar assets or liabilities in markets that are not active, inputs other than quoted prices that are observable and market-corroborated inputs which are derived principally from or corroborated by observable market data.
•Level 3 – Inputs are derived from valuation techniques in which one or more significant inputs or value drivers are unobservable.
The following table summarizes our financial assets and (liabilities) measured at fair value on a recurring basis as of September 30, 2017:March 31, 2021:
|
| | | | | | | | | | | | | | | |
| | Level 1 | | Level 2 | | Level 3 | | Total |
| | (in millions) |
| Cash equivalents: | | | | | | | |
| Money market funds | $ | 317 |
| | $ | — |
| | $ | — |
| | $ | 317 |
|
| Bank deposits | — |
| | 80 |
| | — |
| | 80 |
|
| Commercial paper | — |
| | 10 |
| | — |
| | 10 |
|
| Total cash equivalents | 317 |
| | 90 |
| | — |
| | 407 |
|
| Short-term investments: | | | | | | | |
| Time deposits | — |
| | 359 |
| | — |
| | 359 |
|
| Available-for-sale investment securities: | | | | | | | |
| U.S. Treasury and agency debt securities | 574 |
| | 82 |
| | — |
| | 656 |
|
| Corporate and other debt securities | — |
| | 451 |
| | — |
| | 451 |
|
| Certificates of deposit and commercial paper | — |
| | 547 |
| | — |
| | 547 |
|
| Asset-backed securities | — |
| | 288 |
| | — |
| | 288 |
|
| Municipal debt securities | — |
| | 133 |
| | — |
| | 133 |
|
| Total available-for-sale investment securities | 574 |
| | 1,501 |
| | — |
| | 2,075 |
|
| Held-to-maturity investment securities: | | | | | | | |
| Commercial paper | — |
| | 396 |
| | — |
| | 396 |
|
| Corporate and other debt securities | — |
| | 281 |
| | — |
| | 281 |
|
| Total short-term held-to-maturity investment securities | — |
| | 677 |
| | — |
| | 677 |
|
Total short-term investments(1) | 574 |
| | 2,537 |
| | — |
| | 3,111 |
|
| Long-term investments: | | | | | | | |
| Held-to-maturity investment securities: | | | | | | | |
| Corporate and other debt securities | — |
| | 189 |
| | — |
| | 189 |
|
| Total long-term held-to-maturity investment securities | — |
| | 189 |
| | — |
| | 189 |
|
Total long-term investments(2) | — |
| | 189 |
| | — |
| | 189 |
|
| Derivative financial instruments - foreign exchange forward contracts: | | | | | | | |
| Other current assets | — |
| | 109 |
| | — |
| | 109 |
|
| Accrued expenses and other current liabilities | — |
| | (2 | ) | | — |
| | (2 | ) |
| Other noncurrent assets | — |
| | 24 |
| | — |
| | 24 |
|
| Other noncurrent liabilities | — |
| | (2 | ) | | — |
| | (2 | ) |
| Total | $ | 891 |
| | $ | 2,945 |
| | $ | — |
| | $ | 3,836 |
|
| | | | | | | | | | | | | | | | | | | | | | | |
| (in millions) | Level 1 | | Level 2 | | Level 3 | | Total |
| Cash equivalents: | | | | | | | |
| Money market funds | $ | 272 | | | $ | — | | | $ | — | | | $ | 272 | |
| Time deposits | — | | | 53 | | | — | | | 53 | |
| Commercial paper | — | | | 310 | | | — | | | 310 | |
| Short-term investments: | | | | | | | |
| Time deposits | 0 | | | 124 | | | 0 | | | 124 | |
| Equity investment security | 27 | | | 0 | | | 0 | | | 27 | |
| | | | | | | |
| | | | | | | |
| | | | | | | |
| | | | | | | |
| | | | | | | |
| | | | | | | |
| | | | | | | |
| Other current assets: | | | | | | | |
| Foreign exchange forward and option contracts | 0 | | | 47 | | | 0 | | | 47 | |
| Long-term investments: | | | | | | | |
Restricted time deposits(1) | — | | | 404 | | | — | | | 404 | |
| Other noncurrent assets | | | | | | | |
| Foreign exchange forward and option contracts | 0 | | | 18 | | | 0 | | | 18 | |
| | | | | | | |
| Accrued expenses and other current liabilities: | | | | | | | |
| Contingent consideration liabilities | 0 | | | 0 | | | (11) | | | (11) | |
| Other noncurrent liabilities: | | | | | | | |
| | | | | | | |
| Contingent consideration liabilities | 0 | | | 0 | | | (46) | | | (46) | |
________________
| | |
(1) | Excludes trading securities invested in a mutual fund valued at $25 million based on the NAV of the fund at September 30, 2017. |
| | | | | | | | |
(2)Cognizant | Excludes equity and cost method investments of $72 million at September 30, 2017, which are accounted for using the equity method of accounting and at cost, respectively.15 | March 31, 2021 Form 10-Q |
The following table summarizes our financial assets and (liabilities) measured at fair value on a recurring basis as of December 31, 2016:2020:
| | | | | | | | | | | | | | | | | | | | | | | |
| (in millions) | Level 1 | | Level 2 | | Level 3 | | Total |
| Cash equivalents: | | | | | | | |
| Money market funds | $ | 209 | | | $ | — | | | $ | — | | | $ | 209 | |
| Time deposits | — | | | 203 | | | — | | | 203 | |
| Commercial paper | — | | | 200 | | | — | | | 200 | |
| Short-term investments: | | | | | | | |
| Time deposits | 0 | | | 3 | | | 0 | | | 3 | |
| Equity investment security | 27 | | | 0 | | | 0 | | | 27 | |
| Other current assets: | | | | | | | |
| Foreign exchange forward and option contracts | 0 | | | 46 | | | 0 | | | 46 | |
| Long-term investments: | | | | | | | |
Restricted time deposits(1) | — | | | 405 | | | — | | | 405 | |
| Other noncurrent assets: | | | | | | | |
| Foreign exchange forward and option contracts | 0 | | | 26 | | | 0 | | | 26 | |
| Accrued expenses and other current liabilities: | | | | | | | |
| Foreign exchange forward and option contracts | 0 | | | (1) | | | 0 | | | (1) | |
| Contingent consideration liabilities | 0 | | | 0 | | | (11) | | | (11) | |
| Other noncurrent liabilities: | | | | | | | |
| | | | | | | |
| Contingent consideration liabilities | 0 | | | 0 | | | (43) | | | (43) | |
|
| | | | | | | | | | | | | | | |
| | Level 1 | | Level 2 | | Level 3 | | Total |
| | (in millions) |
| Cash equivalents: | | | | | | | |
| Money market funds | $ | 624 |
| | $ | — |
| | $ | — |
| | $ | 624 |
|
| Commercial paper | — |
| | 131 |
| | — |
| | 131 |
|
| Total cash equivalents | 624 |
| | 131 |
| | — |
| | 755 |
|
| Short-term investments: | | | | | | | |
| Time deposits | — |
| | 806 |
| | — |
| | 806 |
|
| Available-for-sale investment securities: | | | | | | | |
| U.S. Treasury and agency debt securities | 558 |
| | 44 |
| | — |
| | 602 |
|
| Corporate and other debt securities | — |
| | 405 |
| | — |
| | 405 |
|
| Certificates of deposit and commercial paper | — |
| | 911 |
| | — |
| | 911 |
|
| Asset-backed securities | — |
| | 231 |
| | — |
| | 231 |
|
| Municipal debt securities | — |
| | 115 |
| | — |
| | 115 |
|
| Total available-for-sale investment securities | 558 |
| | 1,706 |
| | — |
| | 2,264 |
|
| Held-to-maturity investment securities: | | | | | | | |
| Certificates of deposit and commercial paper | — |
| | 40 |
| | — |
| | 40 |
|
| Total held-to-maturity investment securities | — |
| | 40 |
| | — |
| | 40 |
|
Total short-term investments(1) | 558 |
| | 2,552 |
| | — |
| | 3,110 |
|
| Derivative financial instruments - foreign exchange forward contracts: | | | | | | | |
| Other current assets | — |
| | 34 |
| | — |
| | 34 |
|
| Accrued expenses and other current liabilities | — |
| | (4 | ) | | — |
| | (4 | ) |
| Other noncurrent assets | — |
| | 17 |
| | — |
| | 17 |
|
| Total | $ | 1,182 |
| | $ | 2,730 |
| | $ | — |
| | $ | 3,912 |
|
________________
| | |
(1) | Excludes trading securities invested in a mutual fund valued at $25 million based on the NAV of the fund at December 31, 2016. |
The following table summarizes the changes in Level 3 contingent consideration liabilities for the three months ended March 31:
| | | | | | | | | | | | | | |
| (in millions) | | 2021 | | 2020 |
| Beginning balance | | $ | 54 | | | $ | 38 | |
| Initial measurement recognized at acquisition | | 8 | | | 4 | |
| Change in fair value recognized in SG&A expenses | | (3) | | | (22) | |
| Payments | | (2) | | | 0 | |
| Ending balance | | $ | 57 | | | $ | 20 | |
We measure the fair value of money market funds and U.S. Treasury securities based on quoted prices in active markets for identical assets and therefore classify these assets as Level 1.measure the fair value of our equity security based on the published daily net asset value at which investors can freely subscribe to or redeem from the fund. The fair value of commercial paper certificates of deposit, U.S. government agency securities, municipal debt securities, debt securities issued by supranational institutions, U.S. and international corporate bonds and foreign government debt securities is measured based on relevant trade data, dealer quotes, or model-driven valuations using significant inputs derived from or corroborated by observable market data, such as yield curves and credit spreads. We measure the fairThe carrying value of our asset-backed securities using model-driven valuations based on significant inputs derived from or corroborated by observable market data such as dealer quotes, available trade information, spread data, current market assumptions on prepayment speeds and defaults and historical data on deal collateral performance. The carrying value oftime deposits approximated fair value as of September 30, 2017March 31, 2021 and December 31, 2016.2020.
We estimate the fair value of each foreign exchange forward contract by using a present value of expected cash flows model. This model calculates the difference between the current market forward price and the contracted forward price for each foreign exchange forward contract and applies the difference in the rates to each outstanding contract. The market forward rates include a discount and credit risk factor. The amountsWe estimate the fair value of each foreign exchange option contract by using a variant of the Black-Scholes model. This model uses present value techniques and reflects the time value and intrinsic value based on observable market rates.
We estimate the fair value of contingent consideration liabilities associated with our acquisitions using a variation of the income approach, which utilizes one or more significant inputs that are aggregated by typeunobservable. This approach calculates the fair value of contract and maturity.such liabilities based on the probability-weighted expected performance of the acquired entity against the target performance metric, discounted to present value when appropriate.
| | | | | | | | |
| Cognizant | 16 | March 31, 2021 Form 10-Q |
During the ninethree months ended September 30, 2017March 31, 2021 and the year ended December 31, 2016,2020, there were no transfers among Level 1, Level 2 or Level 3 financial assets and liabilities.
Note 11 — Stockholder's Equity | | | | | | | | | | | | | | |
| Note 11 — Accumulated Other Comprehensive Income (Loss) |
Stock Repurchase Program
Under the Board of Directors' authorized stock repurchase program, the Company is authorized to repurchase its Class A common stock through open market purchases, including under a trading plan adopted pursuant to Rule 10b5-1 of the Exchange Act, or in private transactions, in accordance with applicable federal securities laws. The timing of repurchases and the exact number of shares to be purchased are determined by the Company’s management, in its discretion, or pursuant to a Rule 10b5-1 trading plan, and will depend upon market conditions and other factors.
In March 2017, we entered into accelerated share repurchase agreements, referred to collectively as the ASR, with certain financial institutions under our stock repurchase program. Under the terms of the ASR and in exchange for up-front payments of $1,500 million, the financial institutions initially delivered 21.5 million shares. In August 2017, upon the final settlement of the ASR, we received an additional 2.2 million shares based on the final volume-weighted average price of the Company's Class A common stock during the purchase period less the negotiated discount.
Under the ASR, the shares received were constructively retired and returned to the status of authorized and unissued shares in the periods they were delivered, and the up-front payments were accounted for as a reduction to stockholders’ equity in our consolidated statement of financial position in the period the payments were made. The ASR was accounted for as a $400 million reduction in common stock and additional paid-in capital and a $1,100 million reduction in retained earnings in our consolidated statements of financial position. We reflected the ASR as a repurchase of common stock in the period shares were delivered for purposes of calculating earnings per share and as forward contracts indexed to our common stock. The forward contracts met all of the applicable criteria for equity classification, and therefore were not accounted for as derivative instruments.
As of September 30, 2017, the remaining available balance under our stock repurchase program was $2,000 million.
Stock repurchases were made in connection with our stock-based compensation plans, whereby Company shares were tendered by employees for payment of applicable statutory tax withholdings. We also repurchased a limited number of shares from employees at the repurchase date market price. Combined, for the nine months ended September 30, 2017, such repurchases totaled 0.9 million shares at an aggregate cost of $57 million.
Dividends
The Company declared and paid cash dividends per share during the periods presented as follows:
|
| | | | | | | | |
| | | Dividends per Share | | Amount Paid |
| | | | | (in millions) |
| Three months ended June 30, 2017 | | $ | 0.15 |
| | $ | 89 |
|
| Three months ended September 30, 2017 | | 0.15 |
| | 90 |
|
| Nine months ended September 30, 2017 | | | | $ | 179 |
|
On November 1, 2017, our Board of Directors approved the Company's declaration of a $0.15 per share dividend with a record date of November 20, 2017 and a payment date of November 30, 2017.
Accumulated Other Comprehensive Income (Loss)
Changes in accumulated"Accumulated other comprehensive income (loss)" by component were as follows for the three and nine months ended September 30, 2017:March 31, 2021:
| | | | | | | | | | | | | | | | | | | | | | | |
| | | |
| (in millions) | Before Tax
Amount | | Tax
Effect | | Net of Tax
Amount | | | | | | |
| Foreign currency translation adjustments: | | | | | | | | | | | |
| Beginning balance | $ | 56 | | | $ | (1) | | | $ | 55 | | | | | | | |
| Change in foreign currency translation adjustments | (27) | | | 2 | | | (25) | | | | | | | |
| Ending balance | $ | 29 | | | $ | 1 | | | $ | 30 | | | | | | | |
| Unrealized gains on cash flow hedges: | | | | | | | | | | | |
| Beginning balance | $ | 67 | | | $ | (12) | | | $ | 55 | | | | | | | |
| Unrealized gains arising during the period | 17 | | | (3) | | | 14 | | | | | | | |
| Reclassifications of net (gains) to: | | | | | | | | | | | |
| Cost of revenues | (18) | | | 3 | | | (15) | | | | | | | |
| SG&A expenses | (3) | | | 0 | | | (3) | | | | | | | |
| Net change | (4) | | | 0 | | | (4) | | | | | | | |
| Ending balance | $ | 63 | | | $ | (12) | | | $ | 51 | | | | | | | |
| Accumulated other comprehensive income (loss): | | | | | | | | | | | |
| Beginning balance | $ | 123 | | | $ | (13) | | | $ | 110 | | | | | | | |
| Other comprehensive income (loss) | (31) | | | 2 | | | (29) | | | | | | | |
| Ending balance | $ | 92 | | | $ | (11) | | | $ | 81 | | | | | | | |
|
| | | | | | | | | | | | | | | | | | | | | | | |
| | Three Months | | Nine Months |
| | Before Tax Amount | | Tax Effect | | Net of Tax Amount | | Before Tax
Amount | | Tax
Effect | | Net of Tax
Amount |
| | (in millions) |
| Foreign currency translation adjustments: | | | | | | | | | | | |
| Beginning balance | $ | (82 | ) | | $ | — |
| | $ | (82 | ) | | $ | (149 | ) | | $ | — |
| | $ | (149 | ) |
| Change in foreign currency translation adjustments | 33 |
| | — |
| | 33 |
| | 100 |
| | — |
| | 100 |
|
| Ending balance | $ | (49 | ) | | $ | — |
| | $ | (49 | ) | | $ | (49 | ) | | $ | — |
| | $ | (49 | ) |
| | | | | | | | | | | | |
| Unrealized gains (losses) on available-for-sale investment securities: | | | | | | | | | | | |
| Beginning balance | $ | (3 | ) | | $ | 1 |
| | $ | (2 | ) | | $ | (6 | ) | | $ | 2 |
| | $ | (4 | ) |
| Net unrealized (losses) gains arising during the period | (1 | ) | | — |
| | (1 | ) | | 2 |
| | (1 | ) | | 1 |
|
| Reclassification of net losses to Other, net | 1 |
| | — |
| | 1 |
| | 1 |
| | — |
| | 1 |
|
| Net change | — |
| | — |
| | — |
| | 3 |
| | (1 | ) | | 2 |
|
| Ending balance | $ | (3 | ) | | $ | 1 |
| | $ | (2 | ) | | $ | (3 | ) | | $ | 1 |
| | $ | (2 | ) |
| | | | | | | | | | | | |
| Unrealized gains on cash flow hedges: | | | | | | | | | | | |
| Beginning balance | $ | 155 |
| | $ | (38 | ) | | $ | 117 |
| | $ | 51 |
| | $ | (12 | ) | | $ | 39 |
|
| Unrealized gains arising during the period | 6 |
| | (2 | ) | | 4 |
| | 165 |
| | (41 | ) | | 124 |
|
| Reclassifications of net (gains) to: | | | | | | | | | | | |
| Cost of revenues | (29 | ) | | 7 |
| | (22 | ) | | (75 | ) | | 18 |
| | (57 | ) |
| Selling, general and administrative expenses | (5 | ) | | 1 |
| | (4 | ) | | (14 | ) | | 3 |
| | (11 | ) |
| Net change | (28 | ) | | 6 |
| | (22 | ) | | 76 |
| | (20 | ) | | 56 |
|
| Ending balance | $ | 127 |
| | $ | (32 | ) | | $ | 95 |
| | $ | 127 |
| | $ | (32 | ) | | $ | 95 |
|
| | | | | | | | | | | | |
| Accumulated other comprehensive income (loss): | | | | | | | | | | | |
| Beginning balance | $ | 70 |
| | $ | (37 | ) | | $ | 33 |
| | $ | (104 | ) | | $ | (10 | ) | | $ | (114 | ) |
| Other comprehensive income (loss) | 5 |
| | 6 |
| | 11 |
| | 179 |
| | (21 | ) | | 158 |
|
| Ending balance | $ | 75 |
| | $ | (31 | ) | | $ | 44 |
| | $ | 75 |
| | $ | (31 | ) | | $ | 44 |
|
Changes in accumulated"Accumulated other comprehensive income (loss)" by component were as follows for the three and nine months ended September 30, 2016:March 31, 2020:
| | | | | | | | | | | | | | | | | | | | | | | |
| | | |
| (in millions) | Before Tax
Amount | | Tax
Effect | | Net of Tax
Amount | | | | | | |
| Foreign currency translation adjustments: | | | | | | | | | | | |
| Beginning balance | $ | (63) | | | $ | (1) | | | $ | (64) | | | | | | | |
| Change in foreign currency translation adjustments | (139) | | | 4 | | | (135) | | | | | | | |
| Ending balance | $ | (202) | | | $ | 3 | | | $ | (199) | | | | | | | |
| Unrealized gains (losses) on cash flow hedges: | | | | | | | | | | | |
| Beginning balance | $ | 31 | | | $ | (5) | | | $ | 26 | | | | | | | |
| Unrealized (losses) arising during the period | (113) | | | 19 | | | (94) | | | | | | | |
| Reclassifications of net losses to: | | | | | | | | | | | |
| Cost of revenues | 3 | | | 0 | | | 3 | | | | | | | |
| SG&A expenses | 0 | | | 0 | | | 0 | | | | | | | |
| Net change | (110) | | | 19 | | | (91) | | | | | | | |
| Ending balance | $ | (79) | | | $ | 14 | | | $ | (65) | | | | | | | |
| Accumulated other comprehensive income (loss): | | | | | | | | | | | |
| Beginning balance | $ | (32) | | | $ | (6) | | | $ | (38) | | | | | | | |
| Other comprehensive income (loss) | (249) | | | 23 | | | (226) | | | | | | | |
| Ending balance | $ | (281) | | | $ | 17 | | | $ | (264) | | | | | | | |
| | | | | | | | |
| Cognizant | 17 | March 31, 2021 Form 10-Q |
|
| | | | | | | | | | | | | | | | | | | | | | | |
| | Three Months | | Nine Months |
| | Before Tax Amount | | Tax Effect | | Net of Tax Amount | | Before Tax
Amount | | Tax
Effect | | Net of Tax
Amount |
| | (in millions) |
| Foreign currency translation adjustments: | | | | | | | | | | | |
| Beginning balance | $ | (99 | ) | | $ | — |
| | $ | (99 | ) | | $ | (90 | ) | | $ | — |
| | $ | (90 | ) |
| Change in foreign currency translation adjustments | 1 |
| | — |
| | 1 |
| | (8 | ) | | — |
| | (8 | ) |
| Ending balance | $ | (98 | ) | | $ | — |
| | $ | (98 | ) | | $ | (98 | ) | | $ | — |
| | $ | (98 | ) |
| | | | | | | | | | | | |
| Unrealized gains (losses) on available-for-sale investment securities: | | | | | | | | | | | |
| Beginning balance | $ | 5 |
| | $ | (2 | ) | | $ | 3 |
| | $ | (7 | ) | | $ | 2 |
| | $ | (5 | ) |
| Net unrealized (losses) gains arising during the period | (3 | ) | | 1 |
| | (2 | ) | | 10 |
| | (3 | ) | | 7 |
|
| Reclassification of net (gains) to Other, net | — |
| | — |
| | — |
| | (1 | ) | | — |
| | (1 | ) |
| Net change | (3 | ) | | 1 |
| | (2 | ) | | 9 |
| | (3 | ) | | 6 |
|
| Ending balance | $ | 2 |
| | $ | (1 | ) | | $ | 1 |
| | $ | 2 |
| | $ | (1 | ) | | $ | 1 |
|
| | | | | | | | | | | | |
| Unrealized gains (losses) on cash flow hedges: | | | | | | | | | | | |
| Beginning balance | $ | — |
| | $ | — |
| | $ | — |
| | $ | (14 | ) | | $ | 2 |
| | $ | (12 | ) |
| Unrealized gains (losses) arising during the period | 63 |
| | (16 | ) | | 47 |
| | 78 |
| | (18 | ) | | 60 |
|
| Reclassifications of gains to: | | | | | | | | | | | |
| Cost of revenues | (7 | ) | | 2 |
| | (5 | ) | | (8 | ) | | 2 |
| | (6 | ) |
| Selling, general and administrative expenses | (2 | ) | | 1 |
| | (1 | ) | | (2 | ) | | 1 |
| | (1 | ) |
| Net change | 54 |
| | (13 | ) | | 41 |
| | 68 |
| | (15 | ) | | 53 |
|
| Ending balance | $ | 54 |
| | $ | (13 | ) | | $ | 41 |
| | $ | 54 |
| | $ | (13 | ) | | $ | 41 |
|
| | | | | | | | | | | | |
| Accumulated other comprehensive income (loss): | | | | | | | | | | | |
| Beginning balance | $ | (94 | ) | | $ | (2 | ) | | $ | (96 | ) | | $ | (111 | ) | | $ | 4 |
| | $ | (107 | ) |
| Other comprehensive income (loss) | 52 |
| | (12 | ) | | 40 |
| | 69 |
| | (18 | ) | | 51 |
|
| Ending balance | $ | (42 | ) | | $ | (14 | ) | | $ | (56 | ) | | $ | (42 | ) | | $ | (14 | ) | | $ | (56 | ) |
Note 12 — Commitments and Contingencies
| | | | | | | | | | | | | | |
| Note 12— Commitments and Contingencies |
We are involved in various claims and legal actionsproceedings arising in the ordinary course of business. We accrue a liability when a loss is considered probable and the amount can be reasonably estimated. When a material loss contingency is reasonably possible but not probable, we do not record a liability, but instead disclose the nature and the amount of the claim, and an estimate of the loss or range of loss, if such an estimate can be made. Legal fees are expensed as incurred. InWhile we do not expect that the opinion of management, the outcomeultimate resolution of any existing claims and legal or regulatory proceedings other(other than the specific matters described below, if decided adversely, is not expected toadversely), individually or in the aggregate, will have a material adverse effect on our business, financial condition,position, an unfavorable outcome in some or all of these proceedings could have a material adverse impact on results of operations or cash flows for a particular period. This assessment is based on our current understanding of relevant facts and cash flows.circumstances. As such, our view of these matters is subject to inherent uncertainties and may change in the future.
On January 15, 2015, Syntel sued TriZetto and Cognizant in the United States District Court for the Southern District of New York. Syntel’s complaint alleged breach of contract against TriZetto, and tortious interference and misappropriation of trade secrets against Cognizant and TriZetto, stemming from Cognizant’s hiring of certain former Syntel employees. Cognizant and TriZetto countersued on March 23, 2015, for breach of contract, misappropriation of trade secrets and tortious interference, based on Syntel’s misuse of TriZetto confidential information and abandonment of contractual obligations. Cognizant and TriZetto subsequently added federal Defend Trade Secrets Act and copyright infringement claims for Syntel’s misuse of TriZetto’s proprietary technology. The parties’ claims were narrowed by the court and the case was tried before a jury, which on October 27, 2020 returned a verdict in favor of Cognizant in the amount of $855 million, including $570 million in punitive damages. On April 20, 2021, the USDC-SDNY issued a post-trial order that, among other things, affirmed the jury’s award of $285 million in actual damages, but reduced the award of punitive damages from $570 million to $285 million, thereby reducing the overall damages award from $855 million to $570 million. We are conducting an internal investigation focused onexpect the USDC-SDNY will issue a final judgment consistent with this order in the near future, after which we expect Syntel to appeal the decision. Thus, we will not record the gain in our financial statements until it becomes realizable.
On February 28, 2019, a ruling of the SCI interpreting the India Defined Contribution Obligation altered historical understandings of the obligation, extending it to cover additional portions of the employee’s income. As a result, the ongoing contributions of our affected employees and the Company were required to be increased. In the first quarter of 2019, we accrued $117 million with respect to prior periods, assuming retroactive application of the Supreme Court’s ruling, in "Selling, general and administrative expenses" in our unaudited consolidated statement of operations. There is significant uncertainty as to how the liability should be calculated as it is impacted by multiple variables, including the period of assessment, the application with respect to certain current and former employees and whether certain payments relatinginterest and penalties may be assessed. Since the ruling, a variety of trade associations and industry groups have advocated to Company-owned facilitiesthe Indian government, highlighting the harm to the information technology sector, other industries and job growth in India were made improperly and in possible violationthat would result from a retroactive application of the FCPAruling. It is possible the Indian government will review the matter and other applicable laws. In September 2016, we voluntarily notifiedthere is a substantial question as to whether the DOJ and SEC and are cooperating fully with both agencies. The investigation is being conducted underIndian government will apply the oversightSCI’s ruling on a retroactive basis. As such, the ultimate amount of our obligation may be materially different from the Audit Committee, with the assistance of outside counsel. To date, the investigation has identified a total of approximately $6 million in payments made between 2010 and 2015 that may have been improper. During the year ended December 31, 2016, we recorded out-of-period corrections related to $4 million of such payments that were previously capitalized that should have been expensed. These out-of-period corrections and the other $2 million in potentially improper payments were not material to any previously issued financial statements. The investigation is also examining various other payments made in small amounts in India and elsewhere that may not have complied with Company policy or applicable law. There were no adjustments recorded during the nine months ended September 30, 2017.amount accrued.
On October 5, 2016, October 27, 2016 and November 18, 2016, three putative securities class action complaints were filed in the United States District Court for the District of New Jersey naming us and certain of our current and former officers as defendants. In an order dated February 3, 2017, the United States District Court for the District of New JerseyThese complaints were consolidated the three putative securities class actions into a single action and appointed lead plaintiffs and lead counsel. Onon April 7, 2017, the lead plaintiffs filed a consolidated amended complaint on behalf of a putative class of stockholderspersons and entities who purchased our common stock during the period between February 27, 2015 and September 29, 2016, naming us and certain of our current and former officers as defendants and alleging violations of the Exchange Act, based on allegedly false or misleading statements related to potential violations of the FCPA,Foreign Corrupt Practices Act, our business, prospects and operations, and the effectiveness of our internal controls over financial reporting and our disclosure controls and procedures. The lead plaintiffs seek an award of compensatory damages, among other relief, and their reasonable costs and expenses, including attorneys’ fees. UnderDefendants filed a stipulation filed by the parties on February 23, 2017, defendants filed motionsmotion to dismiss the consolidated amended complaint on June 6, 2017,2017. On August 8, 2018, the USDC-NJ issued an order which granted the motion to dismiss in part, including dismissal of all claims against current officers of the Company, and denied them in part. On September 7, 2018, we filed a motion in the USDC-NJ to certify the August 8, 2018 order for immediate appeal to the United States Court of Appeals for the Third Circuit pursuant to 28 U.S.C. § 1292(b). On October 18, 2018, the USDC-NJ issued an order granting our motion, and staying the action pending the outcome of our appeal petition to the Third Circuit. On October 29, 2018, we filed a petition for permission to appeal with the Third Circuit. On March 6, 2019, the Third Circuit denied our petition without prejudice. In an order dated March 19, 2019, the USDC-NJ directed the lead plaintiffs to provide the defendants with a proposed amended complaint. On April 26, 2019, lead plaintiffs filed an opposition brief on July 21, 2017 responding to defendants’ motions to dismiss, and defendants filed reply briefs in further support of their motions to dismiss on September 5, 2017. On September 5, 2017, we alsosecond amended complaint. We filed a motion to strike certain allegations indismiss the consolidatedsecond amended complaint plaintiffson June 10, 2019. On June 7, 2020, the USDC-NJ issued an order denying our motion to dismiss the second amended complaint. On July 10, 2020, we filed an oppositionour answer to the second amended
| | | | | | | | |
| Cognizant | 18 | March 31, 2021 Form 10-Q |
complaint. On July 23, 2020, the DOJ filed a motion on consent for leave to strike on October 2, 2017,intervene and to stay all discovery through the conclusion of the criminal proceedings in United States v. Gordon J. Coburn and Steven Schwartz, Crim. No. 19-120 (KM), except for documents produced by us to the DOJ in connection with those criminal proceedings. On July 24, 2020, the USDC-NJ granted the DOJ’s motion; and on October 10, 2017,that same day, we filed a reply briefmotion in further support of the motionUSDC-NJ to strike.certify the June 7, 2020 order for immediate appeal to the Third Circuit pursuant to 28 U.S.C. 1292(b). On March 17, 2021, the USDC-NJ issued an order denying our motion.
On October 31, 2016, November 15, 2016 and November 18, 2016, three putative shareholder derivative complaints were filed in New Jersey Superior Court, Bergen County, naming us, all of our then current directors and certain of our current and former officers as defendants. OnThese actions were consolidated in an order dated January 24, 2017, the New Jersey Superior Court, Bergen County, consolidated the three putative shareholder derivative actions filed in that court into a single action and appointed lead plaintiff and lead counsel.2017. The complaints assert claims for breach of fiduciary duty, corporate waste, unjust enrichment, abuse of control, mismanagement, and/or insider selling by defendants. On March 16, 2017, the parties filed a stipulation deferring all further proceedings pending a final, non-appealable ruling on the then anticipated motion to dismiss the consolidated putative securities class action. On April 26, 2017, in lieu of ordering the stipulation filed by the parties, the New Jersey Superior Court deferred further proceedings by dismissing the consolidated putative shareholder derivative litigation without prejudice but permitting the parties to file a motion to vacate the dismissal in the future.
On February 22, 2017, a fourthApril 7, 2017 and May 10, 2017, three additional putative shareholder derivative complaint assertingcomplaints alleging similar claims waswere filed in the United States District Court for the District of New Jersey,USDC-NJ, naming us and certain of our current and former directors and officers as defendants. On April 5,These complaints asserted claims similar to those in the previously-filed putative shareholder derivative actions. In an order dated June 20, 2017, the United States District Court for the District of New Jersey entered an order stayingUSDC-NJ consolidated these actions into a single action, appointed lead plaintiff and lead counsel, and stayed all further proceedings pending a final, non-appealable ruling on the then anticipated motionmotions to dismiss the consolidated putative securities class action. On April 7, 2017,October 30, 2018, lead plaintiff filed a fifthconsolidated verified derivative complaint.
On March 11, 2019, a seventh putative shareholder derivative complaint was filed in the United States District Court for the District of New Jersey,USDC-NJ, naming us, certain of our current and former directors, and certain of our current and former officers as defendants. The complaint in that action asserts claims similar to those in the previously-filed putative shareholder derivative actions, but also adds a claim for violations of Section 10(b) of the Exchange Act against the individual defendants.actions. On May 10, 2017,14, 2019, the USDC-NJ approved a sixthstipulation that (i) consolidated this action with the putative shareholder derivative complaint wassuits that were previously filed in the United States District Court for the District of New Jersey, naming us, certain of our directors,USDC-NJ; and certain of our current and former officers as defendants. The complaint in that action asserts claims similar to those in the previously-filed putative shareholder derivative actions, but also adds a claim for violations of Section 14(a) of the Exchange Act against the individual defendants. In an order dated June 20, 2017, the United States District Court for the District of New Jersey consolidated the three putative shareholder derivative actions filed in that court into a single action, appointed lead plaintiff and lead counsel, and(ii) stayed all further proceedingsof these suits pending a final, non-appealable rulingan order on the motion to dismiss the consolidated putativesecond amended complaint in the securities class action. AllOn August 3, 2020, lead plaintiffs filed an amended complaint. On October 19, 2020, the USDC-NJ approved a stipulation that stayed all of these suits through the earlier of the putative shareholder derivative complaints allege among other things that certain of our public disclosures were false and misleading by failing to disclose that payments allegedly in violationconclusion of the FCPA had been madecriminal proceedings in United States v. Gordon J. Coburn and by asserting that management had determined that our internal controls were effective. The plaintiffs seek awards of compensatory damages and restitution to us as a result of the alleged violations and their costs and attorneys’ fees, experts’ fees, and other litigation expenses, among other relief.Steven Schwartz, Crim. No. 19-120 (KM), or November 1, 2021.
We are presently unable to predict the duration, scope or result of the internal investigation, the related consolidated putative securities class action, the putative shareholder derivative actions or any other related lawsuit, and any investigations by the DOJ or the SEC, including whether either agency will commence any legal action.lawsuits. As such, we are presently unable to develop a reasonable estimate of a possible loss or range of losses, if any, and thus have not recorded an accrualany accruals related to these matters. The DOJ and the SEC have a broad range of civil and criminal sanctions under the FCPA and other laws and regulations including injunctive relief, disgorgement, fines, penalties, modifications to business practices including the termination or modification of existing business relationships and the imposition of compliance programs and the retention of a monitor to oversee compliance with the FCPA. In addition, the DOJ and the SEC could bring enforcement actions against the Company or individuals, including former members of senior management. Such actions, if brought, could result in dispositions, judgments, settlements, fines, injunctions, cease and desist orders, debarment or other civil or criminal penalties against the Company or such individuals.
We expect to incur additional expenses related to remedial measures, and may incur additional expenses related to fines. The imposition of any sanctions or the implementation of remedial measures could have a material adverse effect on our business, annual and interim results of operations, cash flows and financial condition. Furthermore, whileWhile the Company intends to defend the lawsuits vigorously, these lawsuits and any other related lawsuits are subject to inherent uncertainties, the actual cost of such litigation will depend upon many unknown factors and the outcome of the litigation is necessarily uncertain.
We have indemnification and expense advancement obligations pursuant to our bylaws and indemnification agreements with respect to certain current and former members of senior management and the Company’s directors. In connection with the matters that were the subject of our previously disclosed internal investigation, the DOJ and SEC investigations and the related litigation, we have received and expect to continue to receive requests under such indemnification agreements and our bylaws to provide funds for legal fees and other expenses. We have expensed such costs incurred through March 31, 2021.
We have maintained directors and officers insurance and have recorded an insurance receivable of $3 million and $7 million as of March 31, 2021 and December 31, 2020, respectively, in "Other current assets," on our unaudited consolidated statement of financial position related to the recovery of a portion of the indemnification expenses and costs related to the putative securities class action complaints. We are unable to make a reliable estimate of the eventual cash flows by period related to the indemnification and expense advancement obligations described here.
See Note 8 for information relating to the ITD Dispute. Many of our engagements involve projects that are critical to the operations of our customers’clients’ business and provide benefits that are difficult to quantify. Any failure in a customer’sclient’s systems or our failure to meet our contractual obligations to our customers,clients, including any breach involving a customer’sclient’s confidential information or sensitive data, or our obligations under applicable laws or regulations could result in a claim for substantial damages against us, regardless of our responsibility for such failure. Although we attempt to contractually limit our liability for damages arising from negligent acts, errors, mistakes, or omissions in
| | | | | | | | |
| Cognizant | 19 | March 31, 2021 Form 10-Q |
rendering our services, there can be no assurance that the limitations of liability set forth in our contracts will be enforceable in all instances or will otherwise protect us from liability for damages. Although we have general liability insurance coverage, including coverage for errors or omissions, there can be no assurance that such coverage will cover all types of claims, continue to be available on reasonable terms or will be available in sufficient amounts to cover one or more large claims, or that the insurer will not disclaim coverage as to any future claim. The successful assertion of one or more large claims against us that exceed or are not covered by our insurance coverage or changes in our insurance policies, including premium increases or the imposition of large deductible or co-insurance requirements, could have a material adverse effect on our business, results of operations, financial conditionposition and cash flows.flows for a particular period.
In the normal course of business and in conjunction with certain customerclient engagements, we have entered into contractual arrangements through which we may be obligated to indemnify customersclients or other parties with whom we conduct business with respect to certain matters. These arrangements can include provisions whereby we agree to hold the indemnified party and certain of their affiliated entities harmless with respect to third-party claims related to such matters as our breach of certain representations or covenants, our intellectual property infringement, our gross negligence or willful misconduct or certain other claims made against certain parties. Payments by us under any of these arrangements are generally conditioned on the customerclient making a claim and providing us with full control over the defense and settlement of such claim. It is not possible to determine the maximum potential liability under these indemnification agreements due to the unique facts and circumstances involved in each particular agreement. Historically, we have not made material payments under these indemnification agreements and therefore they have not had anya material impact on our operating results, financial position, or cash flows. However, if events arise requiring us to make payment for indemnification claims under our indemnification obligations in contracts we have entered, such payments could have a material impactadverse effect on our business, results of operations, financial conditionposition and cash flows.flows for a particular period.
The Company has indemnification and expense advancement obligations pursuant to its Bylaws and indemnification agreements with respect to certain current and former members of senior management and the Company’s directors. In connection with the ongoing internal investigation, the Company has received requests under such indemnification agreements and its Bylaws to provide advances of funds for legal fees and other expenses, and expects additional requests in connection with the investigation and related litigation. The Company has not recorded any liability for these matters as of September 30, 2017 as it cannot estimate the ultimate outcome at this time but has expensed advances made through September 30, 2017. The Company has maintained directors and officers insurance, from which a portion of these expenses may be recoverable, though we have not recorded an insurance receivable as of September 30, 2017.
Note 13— Related Party Transactions
Brackett B. Denniston, III, was Interim General Counsel and an executive officer of the Company from December 2016 until May 15, 2017. Mr. Denniston is, and was during such period, also a Senior Counsel at the law firm of Goodwin Procter LLP, or Goodwin. During the three and nine months ended September 30, 2017, Goodwin performed legal services for the Company for which it earned approximately $1 million and $4 million, respectively. Goodwin has continued to perform such legal services since September 30, 2017 through the date of this filing. Goodwin did not perform any services for the Company during the three and nine months ended September 30, 2016. The provision of legal services by Goodwin was reviewed and approved by our Audit Committee.
Note 14 | | | | | | | | | | | | | | |
| Note 13 — Segment Information |
Our reportable segments are:
•Financial Services, which consists of our banking and insurance operating segments;
•Healthcare, which consists of our healthcare and life sciences operating segments;
•Products and Resources, (previously referred to as Manufacturing/Retail/Logistics), which consists of our retail and consumer goods,goods; manufacturing, logistics, energy, and logistics,utilities; and travel and hospitality and energy and utilities operating segments; and
•Communications, Media and Technology, (previously referred to as Other), which includes our communications and media operating segment and our technology operating segment.
Our sales managers,client partners, account executives accountand client relationship managers and project teams are aligned in accordance with the specific industries they serve. Our chief operating decision maker evaluates the Company’sCompany's performance and allocates resources based on segment revenues and operating profit. Segment operating profit is defined as income from operations before unallocated costs. Generally, operating expenses for each operating segment have similar characteristics and are subject to the same factors, pressures and challenges. However, the economic environment and its effects on industries served by our operating groupssegments may affect revenues and operating expenses to differing degrees.
Expenses included in segment operating profit consist principally of direct selling and delivery costs (including stock-based compensation expense) as well as a per seatemployee charge for use of theour global delivery centers.centers and infrastructure. Certain selling, general and administrativeSG&A expenses, the excess or shortfall of incentiveincentive-based compensation for commercial and delivery personnel as compared to target, stock-based compensation expense,restructuring and COVID-19 Charges, a portion of depreciation and amortization costs related to our realignment program and the impact of the settlements of our cash flow hedges are not allocated to individual segments in internal management reports used by the chief operating decision maker. Accordingly, such expenses are excluded from segment operating profit and are separately disclosedincluded below as “unallocated costs” and adjusted only against our total income from operations. Additionally, management has determined that it is not practical to allocate identifiable assets by segment, since such assets are used interchangeably among the segments.
Revenues from external customers
| | | | | | | | |
| Cognizant | 20 | March 31, 2021 Form 10-Q |
For revenues by reportable segment and segmentgeographic area, see Note 2. Segment operating
profit, before unallocated expenses,profits by reportable segment were as
follows:follows for the three months ended March 31: |
| | | | | | | | | | | | | | | |
| | Three Months Ended
September 30, | | Nine Months Ended
September 30, |
| | 2017 | | 2016 | | 2017 | | 2016 |
| | (in millions) |
| Revenues: | | | | | | | |
| Financial Services | $ | 1,427 |
| | $ | 1,375 |
| | $ | 4,209 |
| | $ | 4,012 |
|
| Healthcare | 1,085 |
| | 993 |
| | 3,138 |
| | 2,866 |
|
| Products and Resources | 774 |
| | 679 |
| | 2,258 |
| | 1,972 |
|
| Communications, Media and Technology | 480 |
| | 406 |
| | 1,377 |
| | 1,175 |
|
| Total revenues | $ | 3,766 |
| | $ | 3,453 |
| | $ | 10,982 |
| | $ | 10,025 |
|
| | | | | | | | |
| Segment Operating Profit: | | | | | | | |
| Financial Services | $ | 444 |
| | $ | 433 |
| | $ | 1,246 |
| | $ | 1,315 |
|
| Healthcare | 347 |
| | 314 |
| | 963 |
| | 879 |
|
| Products and Resources | 232 |
| | 214 |
| | 649 |
| | 659 |
|
| Communications, Media and Technology | 147 |
| | 118 |
| | 414 |
| | 374 |
|
| Total segment operating profit | 1,170 |
| | 1,079 |
| | 3,272 |
| | 3,227 |
|
| Less: unallocated costs | 522 |
| | 496 |
| | 1,448 |
| | 1,499 |
|
| Income from operations | $ | 648 |
| | $ | 583 |
| | $ | 1,824 |
| | $ | 1,728 |
|
| | | | | | | | | | | | | | | |
| | | |
| (in millions) | 2021 | | 2020 | | | | |
| Financial Services | $ | 406 | | | 381 | | | | | |
| Healthcare | 411 | | | 321 | | | | | |
| Products and Resources | 308 | | | 261 | | | | | |
| Communications, Media and Technology | 215 | | | 190 | | | | | |
| Total segment operating profit | 1,340 | | | 1,153 | | | | | |
| Less: unallocated costs | 671 | | | 574 | | | | | |
| Income from operations | $ | 669 | | | $ | 579 | | | | | |
Geographic Area Information
Revenue and long-livedLong-lived assets by geographic area are as follows:
| | | | | | | | | | | |
| As of |
| (in millions) | March 31, 2021 | | December 31, 2020 |
Long-lived Assets: (1) | | | |
North America(2) | $ | 407 | | | $ | 399 | |
| Europe | 80 | | | 88 | |
Rest of World (3) | 763 | | | 764 | |
| Total | $ | 1,250 | | | $ | 1,251 | |
|
| | | | | | | | | | | | | | | |
| | Three Months Ended
September 30, | | Nine Months Ended
September 30, |
| | 2017 | | 2016 | | 2017 | | 2016 |
| | (in millions) |
Revenues: (1) | | | | | | | |
North America(2) | $ | 2,891 |
| | $ | 2,710 |
| | $ | 8,503 |
| | $ | 7,831 |
|
| United Kingdom | 301 |
| | 293 |
| | 863 |
| | 903 |
|
| Rest of Europe | 327 |
| | 244 |
| | 903 |
| | 707 |
|
| Europe - Total | 628 |
| | 537 |
| | 1,766 |
| | 1,610 |
|
Rest of World (3) | 247 |
| | 206 |
| | 713 |
| | 584 |
|
| Total | $ | 3,766 |
| | $ | 3,453 |
| | $ | 10,982 |
| | $ | 10,025 |
|
|
| | | | | | | |
| | As of |
| | September 30, 2017 | | December 31, 2016 |
| | (in millions) |
Long-lived Assets: (4) | | | |
North America(2) | $ | 328 |
| | $ | 279 |
|
| Europe | 56 |
| | 52 |
|
Rest of World (3)(5) | 920 |
| | 980 |
|
| Total | $ | 1,304 |
| | $ | 1,311 |
|
________________
| | |
(1) | Revenues are attributed to regions based upon customer location. |
(1)Long-lived assets include property and equipment, net of accumulated depreciation and amortization.
(2)Substantially all relates to the United States.
(3)Substantially all relates to India.
| | | | | | | | | | | | | | |
(2) | Substantially all relates to operations in the United States.Note 14 — Subsequent Events |
Dividend
On May 5, 2021, our Board of Directors approved the Company's declaration of a $0.24 per share dividend with a record date of May 20, 2021 and a payment date of May 28, 2021.
Acquisitions
In March 2021, we entered into an agreement to acquire ESG Mobility, a digital automotive engineering research and development provider for connected, autonomous and electric vehicles for a preliminary purchase price of approximately $117 million. This acquisition is expected to expand our automotive engineering expertise, particularly in connected vehicles. The transaction is expected to close during the second quarter of 2021.
In April 2021, we completed the acquisition of Servian for a preliminary purchase price of $248 million. Servian is an Australia-based enterprise transformation consultancy specializing in data analytics, AI, digital services, experience design and cloud, which was acquired to enhance our digital portfolio and market presence in Australia and New Zealand.
| | | | | | | | |
(3)Cognizant | Includes our operations in Asia Pacific, the Middle East and Latin America.21 | March 31, 2021 Form 10-Q |
| |
(4) | Long-lived assets include property and equipment, net of accumulated depreciation and amortization. |
| |
(5) | Substantially all of these long-lived assets relate to our operations in India. |
| | | | | | | | | | | |
| Item 2. Management’s Discussion and Analysis of Financial Condition and Results of Operations. |
Executive Summary
Cognizant is one of the world’s leading professional services companies, transforming customers’engineering modern business operating and technology models for the digital era. Our unique industry-based, consultative approach helps customers envision, build and run more innovative and efficient businesses. Our core competencies include: business, process, operations and technology consulting, application development and systems integration, enterprise information management, application testing, application maintenance, information technology, or IT, infrastructure services and business process services. We tailor our services to specific industries and utilize an integrated global delivery model with customer service teams typically based on-site at customer locations and delivery teams located at dedicated global delivery centers.
Our objective is to create value for both our customers and stockholders by enhancing our position as a leading professional services company in the digital era. Digital services is work we do to help our customers win in the digital economy by applying technology and analytics to change consumer experiences to drive sustainable growth, deploying systems of intelligence to automate and improve core business processes, and improving technology systems by deploying cloud and cyber security solutions and as-a-service models to make them simpler, more modern and secure. To accelerate our shift toinclude digital services and solutions, we are deploying the following strategies:
Aligning our digital services into three digital practice areas - Digital Business, Digital Operations, and Digital Systems and Technology - to address the needs of our customers as they transform their business and technology models.
Investing to scale these digital practice areas across our business segments and geographies, including through extensive training and re-skilling of our existing technical teams and expansion of our local workforces in the United States and other local markets around the world where we operate and pursuing select strategic acquisitions, joint ventures, investments and alliances that can expand our intellectual property, industry expertise, geographic reach, and platform and technology capabilities.
Continuingconsulting, application development, of our core business, which includessystems integration, application services, IT infrastructure and business process services. Our customers often look for efficiencies in the running of their core operations to help them fund investments in new digital capabilities. We work with them to analyze and identify opportunities for advanced automation and delivery efficiencies. Additionally, we seek to expand the geographic reach of our core portfolio of services.
Selectively targeting higher margin work within our core business and unifying our delivery capabilities to allow for more cost-conscious delivery, leveraging automation and scale, improving our utilization and optimizing our pyramid.
In 2017, we began a realignment of our business by executing on the above strategies and improving the overall efficiency of our operations, with the goal of achieving 22% non-GAAP operating margin1 in 2019 while continuing to drive revenue growth. As part of this realignment, for the three and nine months ended September 30, 2017, we incurred $19 million and $69 million, respectively, in pre-tax realignment charges, which are reported in "Selling, general and administrative expenses" in our consolidated statements of operations, and are comprised of severance costs, including costs related to a voluntary separation program, or VSP, announced in May 2017, lease termination costs and advisory fees related to non-routine shareholder matters and to the development of our realignment and return of capital programs. We expect the decrease in our workforce resulting from the VSP to reduce our compensation expense, including incentive-based compensation, by approximately $60 million on an annualized basis.
The costs related to the realignment are excluded from non-GAAP operating margin1 and non-GAAP diluted earnings per share1. The total costs related to the realignment, which will consist primarily of severance costs, advisory fees and lease termination costs, are expected to be incurred primarily in 2017 and will continue to be excluded from non-GAAP operating margin1 and non-GAAP diluted earnings per share1.
_______________
| |
1 | Non-GAAP income from operations, non-GAAP operating margin and non-GAAP diluted earnings per share are not measurements of financial performance prepared in accordance with GAAP. See “Non-GAAP Financial Measures” for more information and a reconciliation to the most directly comparable GAAP financial measure. |
We have a capital return plan that includes a combination of stock repurchases and cash dividends. As part of this plan, in 2017, we entered into and completed accelerated stock repurchase agreements, referred to collectively as the ASR, of $1.5 billion. Additionally, in May 2017, we commenced a quarterly cash dividend of $0.15 per share and made dividend payments aggregating to $179 million during the second and third quarter of 2017.
There can be no assurances that we will be successful in achieving the objectives of these plans or that other factors beyond our control, including the various risks set forth in "Part I, Item 1A. Risk Factors” in our Annual Report on Form 10-K for the year ended December 31, 2016, will not cause us to fail to achieve the targeted improvements.
The following table sets forth summarized operating results for the three months ended September 30, 2017 and 2016:
|
| | | | | | | | | | | | | | | | | | |
| | | | | | | | | Increase |
| | | 2017 | | 2016 | | $ | | % |
| | | (Dollars in millions, except per share data) |
| Revenues | | $ | 3,766 |
| | | $ | 3,453 |
| | | $ | 313 |
| | 9.1 |
| Income from operations and operating margin | | 648 |
| 17.2 | % | | 583 |
| 16.9 | % | | 65 |
| | 11.1 |
| Net income | | 495 |
| | | 444 |
| | | 51 |
| | 11.5 |
| Diluted earnings per share | | 0.84 |
| | | 0.73 |
| | | 0.11 |
| |
|
Other Financial Information2 | | | | | | | |
|
| |
|
| Non-GAAP income from operations and Non-GAAP operating margin | | 754 |
| 20.0 | % | | 667 |
| 19.3 | % | | 87 |
| | 13.0 |
| Non-GAAP diluted earnings per share | | 0.98 |
| | | 0.86 |
| | | 0.12 |
| |
|
The key drivers of our revenue growth during the three months ended September 30, 2017 as compared to September 30, 2016 were as follows:
Solid performance in our Communications, Media and Technology (previously referred to as Other), Products and Resources (previously referred to as Manufacturing/Retail/Logistics) and Healthcare business segments with revenue growth of 18.2%, 14.0% and 9.3%, respectively;
Revenues in our Financial Services business segment grew 3.8% as our banking customers continue to focus on optimizing their cost structure and managing their discretionary spending;
Sustained strength in the North American market where revenues grew 6.7%;
Continued penetration of the European and Rest of World (primarily Asia Pacific) markets:
| |
◦ | In Europe, we experienced revenue growth of 16.9%. Specifically, revenues from our Rest of Europe customers, including revenues from new strategic customers acquired in the fourth quarter of 2016, increased 34.0%, while within the United Kingdom we experienced an increase in revenues of 2.7%. Revenue growth in the United Kingdom was negatively affected by weakness in the banking sector in that region; |
| |
◦ | Revenues from our Rest of World customers increased 19.9%; |
Increased customer spending on discretionary projects;
Expansion of our service offerings, including consulting and digital services, next-generation IT solutions and platform-based solutions;
Continued expansion of the market for global delivery of technology and business process services; and
Increased penetration at existing customers, including strategic customers.
_______________
| |
2 | Non-GAAP income from operations, non-GAAP operating margin and non-GAAP diluted earnings per share are not measurements of financial performance prepared in accordance with GAAP. See “Non-GAAP Financial Measures” for more information and a reconciliation to the most directly comparable GAAP financial measure. |
Our customers seek to meet a dual mandate of achieving more efficient and effective operations, while investing in digital technologies that are reshaping their business models. Increasingly, the relative emphasis among our customers is shifting towards investment and innovation, as reflected in accelerated demand for our digital services. We continue to see demand for larger, more complex projects that are transformational for our customers, including managed services contracts. Such contracts may have longer sales cycles and ramp-up periods and could lead to greater period-to-period variability in our operating results. We increased the number of strategic customers by 7 during the quarter, bringing the total number of our strategic customers to 350. We define a strategic customer as one offering the potential to generate at least $5 million to $50 million or more in annual revenues at maturity.
Our operating margin increased to 17.2% for the quarter ended September 30, 2017 from 16.9% for the quarter ended September 30, 2016, while our non-GAAP operating margin for the same period increased to 20.0%3 from 19.3%3. The increases in both our GAAP and non-GAAP operating margins were due to a decrease in subcontractor and other operating costs, partially offset by an increase in compensation and benefits costs (primarily due to an increase in incentive-based compensation accrual rates). Our 2017 GAAP operating margin was also negatively affected by the realignment charges incurred in 2017.
As previously disclosed, the Company is conducting an internal investigation focused on whether certain payments relating to Company-owned facilities in India were made improperly and in possible violation of the U.S. Foreign Corrupt Practices Act, or FCPA, and other applicable laws. In September 2016, we voluntarily notified the Department of Justice, or DOJ, and the Securities and Exchange Commission, or SEC, and are cooperating fully with both agencies. The investigation is being conducted under the oversight of the Audit Committee, with the assistance of outside counsel. To date, the investigation has identified a total of approximately $6 million in payments made between 2010 and 2015 that may have been improper. In the second half of 2016, we recorded an out-of-period correction related to $4 million of such payments that had been previously capitalized that should have been expensed. The investigation is also examining various other payments made in small amounts in India and elsewhere that may not have complied with Company policy or applicable law. There were no adjustments recorded during the nine months ended September 30, 2017 related to the amounts under investigation.
In 2016, there were putative securities class action complaints filed, naming us and certain of our current and former officers as defendants and alleging violations of the Securities Exchange Act of 1934, as amended, or the Exchange Act, based on allegedly false or misleading statements related to potential violations of the FCPA, our business, prospects and operations, and the effectiveness of our internal control over financial reporting and our disclosure controls and procedures. Additionally, in 2016 and 2017, putative shareholder derivative complaints were filed, naming us, certain of our directors and certain of our current and former officers as defendants. See the section titled "Part II, Item 1. Legal Proceedings."During the quarter ended September 30, 2017, we incurred $9 million in costs related to the FCPA investigation and related lawsuits. We expect to continue to incur expenses related to these matters for the remainder of 2017 and future periods.
We finished the third quarter of 2017 with approximately 256,100 employees, which is an increase of approximately 300 as compared to September 30, 2016. The increase in the number of our service delivery staff and the related infrastructure costs to meet the demand for our services are the primary drivers of the increase in our operating expenses in 2017. Annualized turnover, including both voluntary and involuntary, was approximately 22.5% for the three months ended September 30, 2017. The annualized turnover rate reflects higher than usual voluntary attrition related to aspects of our realignment program. The majority of our turnover occurs in India. As a result, annualized attrition rates on-site at customers are below our global attrition rate. In addition, attrition is weighted towards the more junior members of our staff.
During the remainder of 2017, barring any unforeseen events, we expect the following factors to affect our business and our operating results:
Demand from our customers for digital services;
Our customers' dual mandate of simultaneously achieving cost savings while investing in transformation and innovation;
Continued focus by customers on directing technology spending towards cost containment projects, such astesting, application maintenance, infrastructure services and business process services;services. Digital services have become an increasingly important part of our portfolio, aligning with our clients' focus on becoming data-enabled, customer-centric and differentiated businesses. We are focused on continued investment in four key areas of digital: IoT, AI, experience-driven software engineering and cloud. We tailor our services and solutions to specific industries with an integrated global delivery model that employs client service and delivery teams based at client locations and dedicated global and regional delivery centers.
SecularQ1 2021 Financial Results
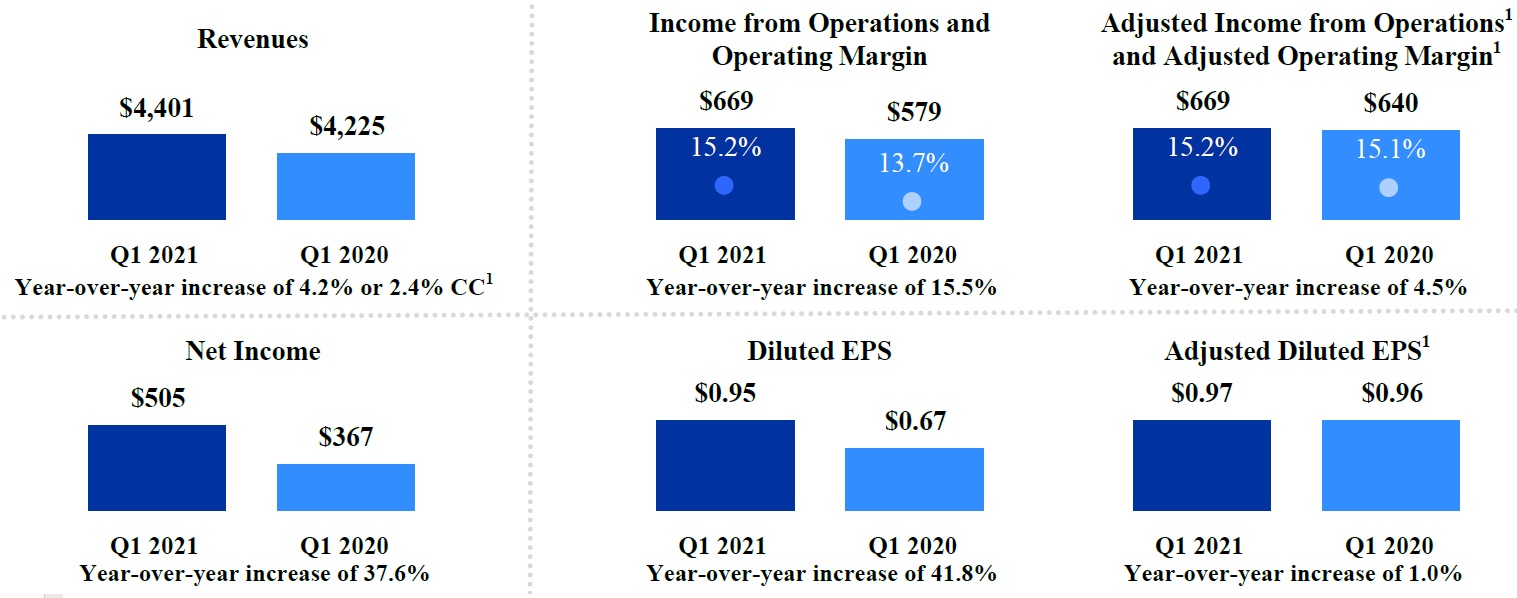
During the quarter ended March 31, 2021, revenues increased by $176 million as compared to the quarter ended March 31, 2020, representing growth of 4.2%, or 2.4% on a constant currency basis1. Our recently completed acquisitions contributed 310 basis points to our revenue growth. Our revenues reflected our clients' continued adoption and integration of digital technologies and the acceleration in the demand for cloud, mobile workplace solutions, e-commerce, automation and AI as a result of the COVID-19 pandemic. We continue to experience pricing pressure on our non-digital services as our clients, particularly those in our Financial Services segment, optimize the cost of supporting their legacy systems and operations. Revenue growth in our Healthcare segment was strong, driven by increased demand for our services from our pharmaceutical and health insurance clients. Revenue growth was also strong among our manufacturing, logistics, energy and utilities clients in our Products and Resources segment due to their continued adoption and integration of digital technologies, while the pandemic continued to negatively affect some of our retail, consumer goods, travel and hospitality clients in the same segment. Overall revenue growth was negatively impacted by 90 basis points by our exit from certain content-related services in our Communications, Media and Technology segment.
Our operating margin and Adjusted Operating Margin1 were both 15.2% for the quarter ended March 31, 2021, as there were no adjustments for unusual items to report in our calculation of Adjusted Operating Margin for that period. Our margin and Adjusted Operating Margin1 were 13.7% and 15.1%, respectively, for the quarter ended March 31, 2020. Our 2021 operating marginbenefited from a significant decrease in travel and entertainment expenses due to the COVID-19 pandemic, savings resulting from the implementation of the delivery cost optimization initiatives of our 2020 Fit for Growth Plan and lower immigration costs. These benefits were partially offset by investments intended to drive organic revenue growth, including additions to our sales organization and initiatives to reposition our brand, as well as the negative impact on margin of our recently completed acquisitions and costs related to continued enhancements to our cyber security environment. Our 2020 GAAP operating margin was negatively impacted by costs related to our restructuring program that concluded at the end of 2020.
1 Adjusted Income from Operations, Adjusted Operating Margin, Adjusted Diluted EPS and constant currency revenue growth are not measures of financial performance prepared in accordance with GAAP. See “Non-GAAP Financial Measures” for more information and reconciliations to the most directly comparable GAAP financial measures, as applicable.
| | | | | | | | |
| Cognizant | 22 | March 31, 2021 Form 10-Q |
Business Outlook
As we seek to increase our commercial momentum and accelerate growth, our four strategic priorities are:
•Repositioning our brand - improving our global brand recognition and becoming better known as a global digital partner to the entire C-suite;
•Accelerating digital - growing our digital business organically and inorganically;
•Globalizing Cognizant - growing our business in key international markets and diversifying leadership, capabilities and delivery footprint; and
•Increasing our relevance to our clients - leading with thought leadership and capabilities to address clients' business needs.
During the first quarter of 2021, we acquired Linium and Magenic to strengthen our digital capabilities. We intend to continue to pursue strategic acquisitions, investments and alliances to expand our talent, experience and capabilities in key digital areas or in particular geographies or industries.
We continue to expect the long-term focus of our clients to be on their digital transformation into software-driven, data-enabled, customer-centric and differentiated businesses. Clients continue to adopt and integrate digital technologies. Demand for our digital operations services and solutions has increased since the beginning of the COVID-19 pandemic. At the same time, as our clients seek to optimize the cost of supporting their legacy systems and operations, our non-digital services has been and may continue to be subject to pricing pressure.
Our clients will likely continue to contend with industry-specific changes driven by evolving digital technologies, and regulatory changes, including potential regulatory changes with respect to immigration and taxes;
________________
| |
3 | Non-GAAP operating margin is not a measurement of financial performance prepared in accordance with GAAP. See “Non-GAAP Financial Measures” for more information and a reconciliation to the most directly comparable GAAP financial measure. |
Demand from our healthcare customers could be affected by uncertainty in the regulatory environment;
Demand fromenvironment, industry consolidation and convergence as well as international trade policies and other macroeconomic factors, which could affect their demand for our banking customersservices. The COVID-19 pandemic may continue to negatively impact demand, particularly among our retail, consumer goods, travel and hospitality clients within our Products and Resources segment as well as communications and media clients in our Communications, Media and Technology segment. The evolving nature of the COVID-19 pandemic makes it difficult to estimate its future impact on our ongoing business, results of operations and overall financial performance. For example, India has seen a considerable and sudden increase in new COVID cases in March and April of 2021. A significant worsening of the pandemic, particularly in India, where a significant majority of our operations and technical personnel are located, could present challenges to our ability to deliver services to clients. We remain focused on protecting our employees’ health, safety and well-being.
As a global professional services company, we compete on the basis of the knowledge, experience, insights, skills and talent of our employees and the value they can provide to our clients. Our success is dependent, in large part, on our ability to keep our supply of skilled employees, in particular those with experience in key digital areas, in balance with client demand. For the three months ended March 31, 2021, our annualized attrition, including both voluntary and involuntary, was 21.0%. Competition for skilled employees in the current labor market is intense, and we have experienced significantly elevated voluntary attrition during March and April 2021. Challenges attracting and retaining highly qualified personnel have negatively impacted, and we expect will continue to impact, our ability to satisfy client demand and achieve our full revenue potential. Further, our ongoing and anticipated future efforts with respect to recruitment, talent management and employee engagement may not be negativelysuccessful and will result in increased delivery costs during the remainder of 2021.
In addition, our future results may be affected by their continued focus on optimizing their cost structure and managing their discretionary spending;
Discretionary spending byimmigration law changes that may impact our retail customers may continueability to be negatively affected by weakness in the retail sector;
Legal feesdo business or significantly increase our costs of doing business, potential tax law changes and other expenses related to the internal investigationpotential regulatory changes, including potentially increased costs for employment and related matters as described above;
Volatilitypost-employment benefits in foreign currency rates; and
Continued uncertainty in the U.S. and world economies, includingIndia as a result of recent changes in the government administrations in the United States and elsewhere.
In response to this environment, we plan to:
Continue to invest in our digital practice areas of focus across industries and geographies;
Continue to invest in our talent base, including through local hiring and re-skilling, and new service offerings, including digital technologies and new delivery models;
Partner with our existing customers to garner an increased portion of our customers’ overall technology spend by providing innovative solutions;
FocusCode on growing our business in Europe, the Middle East, Asia Pacific and Latin America, where we believe there are opportunities to gain market share;
Increase our strategic customer base across all of our business segments;
Pursue strategic acquisition opportunities that we believe add new technologies, including digital technologies, or platforms that complement our existing services, improve our overall service delivery capabilities, and/or expand our geographic presence;
Focus on operating discipline in order to appropriately manage our cost structure; and
Locate most of our new development center facilities in tax incentivized areas.
Business Segments
Our reportable segments are:
Financial Services,Social Security, 2020 following its effective date, which consists of our banking and insurance operating segments;
Healthcare, which consists of our healthcare and life sciences operating segments;
Products and Resources (previously referred to as Manufacturing/Retail/Logistics), which consists of our retail and consumer goods, manufacturing and logistics, travel and hospitality, and energy and utilities operating segments; and
Communications, Media and Technology (previously referred to as Other), which includes our communications and media operating segment and our technology operating segment.
Our chief operating decision maker evaluates Cognizant’s performance and allocates resources based on segment revenues and operating profit. Segment operating profit is defined as income from operations before unallocated costs. Generally, operating expenses for each business segment have similar characteristics and are subject to the same factors, pressures and challenges. However, the economic environment and its effects on industries served by our operating groups may affect revenues and operating expenses to differing degrees. Expenses included in segment operating profit consist principally of direct selling and delivery costsnot yet determined, as well as a per seat charge for use of the global delivery centers. Certain selling, general and administrative expenses, excess or shortfall of incentive compensation for delivery personnel as compared to target, stock-based compensation expense, costs related to our realignment program, a portionthe potential resolution of depreciationlegal and amortization and the impact of the settlements of our cash flow hedges are not allocated to individual segmentsregulatory matters discussed in internal management reports used by the chief operating decision maker. Accordingly, such expenses are excluded from segment operating profit.
We provide a significant volume of services to many customers in each of our business segments. Therefore, a loss of a significant customer or a few significant customers in a particular segment could materially reduce revenues for that segment. However, no individual customer accounted for sales in excess of 10% of our consolidated revenues for the periods ended September 30, 2017 and 2016. In addition, the services we provideNote 12 to our larger customers are often critical to the operationsunaudited consolidated financial statements.
| | | | | | | | |
| Cognizant | 23 | March 31, 2021 Form 10-Q |
Results of Operations
Three Months Ended September 30, 2017March 31, 2021 Compared to Three Months Ended September 30, 2016March 31, 2020
The following table sets forth, for the periods indicated, certain financial data for the three months ended September 30:March 31:
| | | | | | | | | | | | | | | | | | | | | | | | | | | | | | | | | | | | | | | |
| | | | % of | | | | | % of | | | | | Increase / Decrease |
| (Dollars in millions, except per share data) | 2021 | | Revenues | | | 2020 | | Revenues | | | | | $ | | % |
| Revenues | $ | 4,401 | | | 100.0 | | | | $ | 4,225 | | | 100.0 | | | | | | $ | 176 | | | 4.2 | |
Cost of revenues(1) | 2,764 | | | 62.8 | | | | 2,747 | | | 65.0 | | | | | | 17 | | | 0.6 | |
Selling, general and administrative expenses(1) | 827 | | | 18.8 | | | | 711 | | | 16.8 | | | | | | 116 | | | 16.3 | |
| Restructuring charges | — | | | — | | | | 55 | | | 1.3 | | | | | | (55) | | | (100.0) | |
| Depreciation and amortization expense | 141 | | | 3.2 | | | | 133 | | | 3.1 | | | | | | 8 | | | 6.0 | |
| Income from operations | 669 | | | 15.2 | | | | 579 | | | 13.7 | | | | | | 90 | | | 15.5 | |
| Other income (expense), net | (4) | | | | | | (69) | | | | | | | | 65 | | | (94.2) | |
| Income before provision for income taxes | 665 | | | 15.1 | | | | 510 | | | 12.1 | | | | | | 155 | | | 30.4 | |
| Provision for income taxes | (160) | | | | | | (142) | | | | | | | | (18) | | | 12.7 | |
| Income (loss) from equity method investments | — | | | | | | (1) | | | | | | | | 1 | | | (100.0) | |
| Net income | $ | 505 | | | 11.5 | | | | $ | 367 | | | 8.7 | | | | | | $ | 138 | | | 37.6 | |
| Diluted earnings per share | $ | 0.95 | | | | | | $ | 0.67 | | | | | | | | $ | 0.28 | | | 41.8 | |
| | | | | | | | | | | | | | | |
Other Financial Information2 | | | | | | | | | | | | | | | |
| Adjusted Income from Operations and Adjusted Operating Margin | $ | 669 | | | 15.2 | | | | $ | 640 | | | 15.1 | | | | | | $ | 29 | | | 4.5 | |
| Adjusted Diluted EPS | $ | 0.97 | | | | | | $ | 0.96 | | | | | | | | $ | 0.01 | | | 1.0 | |
|
| | | | | | | | | | | | | | | | | | |
| | | | % of | | | | % of | | Increase / Decrease |
| | 2017 | | Revenues | | 2016 | | Revenues | | $ | | % |
| | (Dollars in millions, except per share data) |
| Revenues | $ | 3,766 |
| | 100.0 | | $ | 3,453 |
| | 100.0 | | $ | 313 |
| | 9.1 |
|
Cost of revenues(1) | 2,337 |
| | 62.1 | | 2,077 |
| | 60.2 | | 260 |
| | 12.5 |
|
Selling, general and administrative expenses(1) | 674 |
| | 17.9 | | 701 |
| | 20.3 | | (27 | ) | | (3.9 | ) |
| Depreciation and amortization expense | 107 |
| | 2.8 | | 92 |
| | 2.7 | | 15 |
| | 16.3 |
|
| Income from operations | 648 |
| | 17.2 | | 583 |
| | 16.9 | | 65 |
| | 11.1 |
|
| Other income (expense), net | 10 |
| | | | 30 |
| | | | (20 | ) | | (66.7 | ) |
| Income before provision for income taxes | 658 |
| | 17.5 | | 613 |
| | 17.7 | | 45 |
| | 7.3 |
|
| Provision for income taxes | (164 | ) | | | | (170 | ) | | | | 6 |
| | (3.5 | ) |
| Income from equity method investment | 1 |
| | | | 1 |
| | | | — |
| | |
| Net income | $ | 495 |
| | 13.1 | | $ | 444 |
| | 12.9 | | $ | 51 |
| | 11.5 |
|
| Diluted earnings per share | $ | 0.84 |
| | | | $ | 0.73 |
| | | | $ | 0.11 |
| |
|
| | | | | | | | | | | | |
Other Financial Information (2) | | | | | | | | | | | |
| Non-GAAP income from operations and non-GAAP operating margin | $ | 754 |
| | 20.0 | | $ | 667 |
| | 19.3 | | $ | 87 |
| | 13.0 |
|
| Non-GAAP diluted earnings per share | $ | 0.98 |
| | | | $ | 0.86 |
| | | | $ | 0.12 |
| | |
_____________________
| | |
(1) | Exclusive of depreciation and amortization expense. |
| |
(2) | Non-GAAP income from operations, non-GAAP operating margin and non-GAAP diluted earnings per share are not measurements of financial performance prepared in accordance with GAAP. See “Non-GAAP Financial Measures” for more information and a reconciliation to the most directly comparable GAAP financial measure. |
(1)Exclusive of depreciation and amortization expense.
Revenues - Overall2
During the quarter ended March 31, 2021, revenues increased by $176 million as compared to the quarter ended March 31, 2020, representing growth of 4.2%, or 2.4% on a constant currency basis2. The increase inOur recently completed acquisitions contributed 310 basis points to our revenue growth. Our revenues was primarily attributed to services related toreflected our clients' continued adoption and integration of digital technologies that are reshaping our customers' business, operating and technology models, increased customer spending on discretionary projects, continued interestthe acceleration in using our global delivery modelthe demand for cloud, mobile workplace solutions, e-commerce, automation and AI as a meansresult of the COVID-19 pandemic. At the same time, the pandemic continued to reduce overall technologynegatively affect some of our clients, including retail, consumer goods, travel and operations costshospitality clients. We continue to experience pricing pressure on our non-digital services as our clients optimize the cost of supporting their legacy systems and continued penetration in alloperations. Overall revenue growth was negatively impacted by 90 basis points by our geographic markets.exit from certain content-related services. Revenues from customersclients added since September 30, 2016,March 31, 2020, including new strategic customers acquiredthose related to acquisitions, were $182 million.
2 Adjusted Income from Operations, Adjusted Operating Margin, Adjusted Diluted EPS and constant currency revenue growth are not measures of financial performance prepared in accordance with GAAP. See “Non-GAAP Financial Measures” for more information and reconciliations to the fourth quartermost directly comparable GAAP financial measures, as applicable.
| | | | | | | | |
| Cognizant | 24 | March 31, 2021 Form 10-Q |
Revenues - Reportable Business Segments
The following charts set forth revenues and the third quarter of 2017, were $131 millionchange in revenues by business segment and represented 41.9% of the period-over-period revenue increase.
Our consulting and technology services revenuesgeography for the three months ended September 30, 2017 increased by 11.3% compared to the three months ended September 30, 2016 and represented 58.6% of total revenues for the three months ended September 30, 2017. Our outsourcing services revenues for the three months ended September 30, 2017 increased by 6.1% and constituted 41.4% of total revenues for the three months ended September 30, 2017.
Revenues from our top customers were as follows:
|
| | | | | | |
| | | Three Months Ended September 30, |
| | | 2017 | | 2016 |
| Revenues from top five customers as a percentage of total revenues | | 8.9 | % | | 10.1 | % |
| Revenues from top ten customers as a percentage of total revenues | | 14.9 | % | | 16.6 | % |
As we continue to add new customers and increase our penetration at existing customers, we expect the percentage of revenues from our top five and top ten customers to continue to decline over time.
Revenues - Reportable Segments. Revenues by reportable business segment were as follows for the three months ended September 30:
|
| | | | | | | | | | | | | | |
| | | 2017 | | 2016 | | Increase |
| $ | | % |
| | | (Dollars in millions) |
| Financial Services | | $ | 1,427 |
| | $ | 1,375 |
| | $ | 52 |
| | 3.8 |
| Healthcare | | 1,085 |
| | 993 |
| | 92 |
| | 9.3 |
| Products and Resources | | 774 |
| | 679 |
| | 95 |
| | 14.0 |
| Communications, Media and Technology | | 480 |
| | 406 |
| | 74 |
| | 18.2 |
| Total revenues | | $ | 3,766 |
| | $ | 3,453 |
| | $ | 313 |
| | 9.1 |
Revenues from our Financial Services segment grew 3.8% for the three months ended September 30, 2017,March 31, 2021 as compared to the three months ended September 30, 2016. Growth was stronger among our insurance customers where revenues increased by $44 million as compared to an increase of $8 million for our banking customers. In this segment, revenuesMarch 31, 2020:
| | | | | | | | | | | | | | | | | | | | | | | | | | | | | | | | | | | | | | | | | | | | | | | | | | | | | | | | | | |
| | |
| | |
| | Financial Services | | Healthcare | | | | |
| | | | Increase / (Decrease) | | | | Increase / (Decrease) | | | | | | | | |
| Dollars in millions | | Revenues | | $ | | % | | CC %3 | | Revenues | | $ | | % | | CC %3 | | | | | | | | |
| North America | | $ | 1,013 | | | 1 | | | 0.1 | | | (0.3) | | | $ | 1,101 | | | 63 | | | 6.1 | | | 6.0 | | | | | | | | | |
| United Kingdom | | 125 | | | 5 | | | 4.2 | | | (1.7) | | | 40 | | | — | | | — | | | (5.9) | | | | | | | | | |
| Continental Europe | | 192 | | | 1 | | | 0.5 | | | (7.2) | | | 118 | | | 19 | | | 19.2 | | | 11.4 | | | | | | | | | |
| Europe - Total | | 317 | | | 6 | | | 1.9 | | | (5.1) | | | 158 | | | 19 | | | 13.7 | | | 6.4 | | | | | | | | | |
| Rest of World | | 128 | | | — | | | — | | | (3.8) | | | 29 | | | 12 | | | 70.6 | | | 68.1 | | | | | | | | | |
| Total | | $ | 1,458 | | | 7 | | | 0.5 | | | (1.7) | | | $ | 1,288 | | | 94 | | | 7.9 | | | 7.0 | | | | | | | | | |
| | | | | | | | | | | | | | | | | | | | | | | | |
| | Products and Resources | | Communications, Media and Technology | | | | |
| | | | Increase / (Decrease) | | | | Increase / (Decrease) | | | | | | | | |
| Dollars in millions | | Revenues | | $ | | % | | CC %3 | | Revenues | | $ | | % | | CC %3 | | | | | | | | |
| North America | | $ | 718 | | | 29 | | | 4.2 | | | 3.8 | | | $ | 451 | | | — | | | — | | | — | | | | | | | | | |
| United Kingdom | | 106 | | | 13 | | | 14.0 | | | 6.0 | | | 99 | | | 15 | | | 17.9 | | | 9.4 | | | | | | | | | |
| Continental Europe | | 103 | | | (6) | | | (5.5) | | | (13.8) | | | 43 | | | 5 | | | 13.2 | | | 3.5 | | | | | | | | | |
| Europe - Total | | 209 | | | 7 | | | 3.5 | | | (4.7) | | | 142 | | | 20 | | | 16.4 | | | 7.6 | | | | | | | | | |
| Rest of World | | 71 | | | 8 | | | 12.7 | | | 9.8 | | | 64 | | | 11 | | | 20.8 | | | 19.3 | | | | | | | | | |
| Total | | $ | 998 | | | 44 | | | 4.6 | | | 2.4 | | | $ | 657 | | | 31 | | | 5.0 | | | 3.1 | | | | | | | | | |
Financial Services
Revenues from customers added since September 30, 2016 were $22 million and represented 42.3% of the period-over-period revenue increase in this segment. Key areas of focus for our Financial Services customers included the adoptionsegment increased 0.5%, and integration of digital technologies that are reshaping our customers' business and operating models, cost optimization, robotic process automation, cyber security and vendor consolidation. Demand from our banking customers may continue to be negatively affected by their continued focusdecreased 1.7% on optimizing their cost structure and managing their discretionary spending.
Revenues from our Healthcare segment grew 9.3%a constant currency basis3, for the three months ended September 30, 2017,March 31, 2021, as compared to the three months ended September 30, 2016. March 31, 2020. Revenues in this segment increased by $14 million from our banking clients and decreased $7 million from our insurance clients. Revenues from clients added, including those related to acquisitions, since March 31, 2020 were $34 million. Moderate revenue growth generated by our digital services did not fully offset revenue declines related to our non-digital services as our clients optimize the cost of supporting their legacy systems and operations.
Healthcare
Revenues from our Healthcare segment increased 7.9%, or 7.0% on a constant currency basis3, for the three months ended March 31, 2021, as compared to the three months ended March 31, 2020. Revenues in this segment increased by $49 million from our healthcare clients and $45 million from our life sciences clients. Revenue growth among our healthcare customers benefited from increased demand by $72 million, including revenues from a new strategic customer acquired in the third quarter of 2017,health insurance customers for our integrated payer software solutions while revenue growth among our life sciences customers was $20 million. Revenues from customers added since September 30, 2016 were $21 million and represented 22.8% of the period-over-period revenue increase in this segment. The increase in revenues from our life sciences customersclients was driven by a growing demand for a broader range of services, including business process services, advanced data analytics and solutions that span multiple service lines while leveraging cloud technologies and platforms. Theincreased demand for our services among pharmaceutical companies. Revenues from clients added, including those related to acquisitions, since March 31, 2020 were $30 million. Demand from our healthcare customers couldclients may continue to be affected by uncertainty in the regulatory environment. We believe that in the long term the healthcareand political environment while demand from our life sciences clients may be affected by industry continues to present a significant growth opportunity due to factors that are transforming the industry, including the changing regulatory environment, increasing focus on medical costs,consolidation.
Products and the consumerization of healthcare.Resources
Revenues from our Products and Resources segment (previously referred to as Manufacturing/Retail/Logistics) grew 14.0%increased 4.6%, or 2.4% on a constant currency basis3, for the three months ended September 30, 2017,March 31, 2021, as compared to the three months ended September 30, 2016. Revenue growth in this segment was strongest amongMarch 31, 2020. Revenues from our manufacturing, logistics, energy and utilities customersclients increased $82 million primarily due to our clients' adoption and manufacturingintegration of digital technologies. Retail, consumer goods, travel and logistics customers, where revenues increasedhospitality clients continued to be adversely affected by a combined $85the COVID-19 pandemic. Thus, revenue decreased by $16 million including revenues from new strategic customers acquired in the fourth quarter of 2016. Revenues from among our retail and consumer goods customersclients and travel$22 million among our travel and hospitality customers increased by a combined $10 million.clients. Revenues from customersclients added, including those related to acquisitions, since September 30, 2016March 31, 2020 were $76 million, representing 80.0%$64 million.
3 Constant currency revenue growth is not a measure of the period-over-period revenue increasefinancial performance prepared in this segment. Demand within this segment continues to be driven by increased adoptionaccordance with GAAP. See “Non-GAAP Financial Measures” for more information.
| | | | | | | | |
| Cognizant | 25 | March 31, 2021 Form 10-Q |
Communications, Media and operating models, as well as growing demand for analytics, supply chain consulting, implementation initiatives, product transformation, internet of things and omni channel commerce implementation and integration services. Discretionary spending by our retail customers has been and may continue to be affected by weakness in the retail sector.Technology
Revenues from our Communications, Media and Technology segment (previously referred to as Other) grew 18.2%increased 5.0%, or 3.1% on a constant currency basis4, for the three months ended September 30, 2017,March 31, 2021, as compared toto the three months ended September March 31, 2020. Revenues in this segment increased by $30 2016. Revenue growth was $37 million among our technology customers and $36 million amongfrom our communications and media customers.clients and were relatively flat for our technology clients. Revenues from customers added since September 30, 2016our communications and media clients benefited significantly from recently completed acquisitions and were $12 million and represented 16.2% ofnegatively impacted by the period-over-period revenue increaseCOVID-19 pandemic. Revenues among our technology clients in this segment. Growth within this segment was drivenwere negatively impacted by the increased adoption of digital technologies,approximately $37 million due to our exit from certain content-related services, offset by growing demand from our technology clients for other more strategic digital content operationsservices and an expanded range of services, such as business process services.revenues from our acquisitions. Revenues from clients added, including those related to acquisitions, since March 31, 2020 were $54 million.
Revenues - Geographic Markets.
Revenues by geographic market were as follows for the three months ended September 30:March 31:
| | | | | | | | | | | | | | | | | | | | | | | | | | | | | | | | | |
| (Dollars in millions) | | 2021 | | 2020 | | Increase / (Decrease) |
| $ | | % | | CC %4 | |
| North America | | $ | 3,283 | | | $ | 3,190 | | | $ | 93 | | | 2.9 | | | 2.7 | | |
| United Kingdom | | 370 | | | 337 | | | 33 | | | 9.8 | | | 2.7 | | |
| Continental Europe | | 456 | | | 437 | | | 19 | | | 4.3 | | | (3.7) | | |
| Europe - Total | | 826 | | | 774 | | | 52 | | | 6.7 | | | (0.9) | | |
| Rest of World | | 292 | | | 261 | | | 31 | | | 11.9 | | | 8.9 | | |
| Total revenues | | $ | 4,401 | | | $ | 4,225 | | | $ | 176 | | | 4.2 | | | 2.4 | | |
|
| | | | | | | | | | | | | | |
| | | 2017 | | 2016 | | Increase |
| | $ | | % |
| | | (Dollars in millions) |
| North America | | $ | 2,891 |
| | $ | 2,710 |
| | $ | 181 |
| | 6.7 |
| United Kingdom | | 301 |
| | 293 |
| | 8 |
| | 2.7 |
| Rest of Europe | | 327 |
| | 244 |
| | 83 |
| | 34.0 |
| Europe - Total | | 628 |
| | 537 |
| | 91 |
| | 16.9 |
| Rest of World | | 247 |
| | 206 |
| | 41 |
| | 19.9 |
| Total revenues | | $ | 3,766 |
| | $ | 3,453 |
| | $ | 313 |
| | 9.1 |
North America continues to be our largest market, representing 76.8%74.6% of total revenues for the third quarter of 2017, and accounting for 57.8% of totalrevenues. Our North America region revenue growth benefited from the third quarter of 2016. Revenue growth inour recently completed acquisitions and was negatively impacted by our exit from certain content-related services. Our Continental Europe region benefited from favorable foreign currency exchange rates and Rest of World markets was driven by an increase inincreased demand for an expanded range ofour services such as business process services, customer adoption and integration of digital technologies that are reshaping our customers' business and operating models. Revenues from our customers in Europe grew 16.9%. Specifically, revenues from our Rest of Europe customers, including revenues from new strategic customers acquired in the fourth quarter of 2016, increased 34.0%, while within the United Kingdom we experienced an increase in revenues of 2.7%. Revenue growth in the United Kingdom was negatively affected by weakness in the banking sectoramong pharmaceutical companies in that region. Revenues fromRevenue growth in our Rest of World customers grew 19.9% in the third quarter of 2017,region was primarily driven by the Australia and India markets. We believe that Europe, the Middle East, the Asia Pacific and Latin America regions will continue to be areas of significant investment for us as we see these regions as long term growth opportunities.our clients in India.
Cost of Revenues (Exclusive of Depreciation and Amortization Expense).
Our cost of revenues consists primarily of salaries, incentive-based compensation, stock-based compensation expense, payroll taxes, employee benefits, project-related immigration and project-related travel for technical personnel, subcontracting and subcontracting expense.equipment costs relating to revenues. Our cost of revenues increased by 12.5%0.6% during the thirdfirst quarter of 20172021 as compared to the thirdfirst quarter of 2016.2020, decreasing as a percentage of revenues to 62.8% in the first quarter of 2021 compared to 65.0% in the first quarter of 2020. The increasedecrease in cost of revenues, as a percentage of revenues, was due primarily to higher compensation and benefits costs (inclusive of an increase in incentive-based compensation accrual rates) for our technical personnel, partially offset by a significant decrease in subcontractor costs. Compensationtravel and benefitsentertainment costs including incentive-based compensation, increased by $233 million when comparedas a result of a reduction in travel due to the three months ended September 30, 2016, asCOVID-19 pandemic and savings resulting from the numberimplementation of the delivery cost optimization initiatives of our technical personnel increased.2020 Fit for Growth Plan.
SG&A Expenses (Exclusive of Depreciation and Amortization Expense)
Selling, General and Administrative Expenses. Selling, general and administrativeSG&A expenses consist primarily of salaries, incentive-based compensation, stock-based compensation expense, payroll taxes, employee benefits, immigration, travel, marketing, communications, management, finance, administrative and occupancy costs. Selling, general and administrativeSG&A expenses including depreciation and amortization, decreasedincreased by 1.5%16.3% during the thirdfirst quarter of 20172021 as compared to the thirdfirst quarter of 2016, decreasing2020, increasing as a percentage of revenues to 20.7%18.8% in the third quarter of 20172021 as compared to 22.9%16.8% in the third quarter of 2016.2020. The decreaseincrease, as a percentage of revenues, was due primarily to a decrease in compensationinvestments intended to drive organic revenue growth, including additions to our sales organization and benefits costs (net of in the increase in incentive-based compensation accrual rates) and a decrease in certain operating and professional serviceinitiatives to reposition our brand, as well as increased costs as we leverageda result of our cost structure over a larger organization,recently completed acquisitions and costs related to continued enhancements to our cyber security environment, partially offset by realignment charges incurreda significant decrease in travel and entertainment costs as a result of a reduction in travel due to the thirdCOVID-19 pandemic and lower immigration costs.
Depreciation and Amortization Expense
Depreciation and amortization expense increased by 6.0% during the first quarter of 2017.
Income from Operations and Operating Margin - Overall. Income from operations increased 11.1% in the third quarter of 20172021 as compared to the thirdfirst quarter of 2016. 2020 primarily as a result of the amortization of intangible assets from recently completed acquisitions.
4 Constant currency revenue growth is not a measure of financial performance prepared in accordance with GAAP. See “Non-GAAP Financial Measures” for more information.
| | | | | | | | |
| Cognizant | 26 | March 31, 2021 Form 10-Q |
Operating Margin - Overall
Our operating margin increased to 17.2% and Adjusted Operating Margin5 were both 15.2% for the quarter ended September 30, 2017 from 16.9%March 31, 2021. Our operating margin and Adjusted Operating Margin5 were 13.7% and 15.1%, respectively, for the quarter ended September 30, 2016, primarilyMarch 31, 2020. Our 2021 marginbenefited from a significant decrease in travel and entertainment expenses due to a decrease in subcontractorthe COVID-19 pandemic, savings resulting from the implementation of the delivery cost optimization initiatives of our 2020 Fit for Growth Plan and other operating costs,lower immigration costs. These benefits were partially offset by an increase in compensationinvestments intended to drive organic revenue growth, including additions to our sales organization and benefitsinitiatives to reposition our brand, as well as the negative impact on margin of our recently completed acquisitions and costs (primarily duerelated to continued enhancements to our cyber security environment. Our 2020 GAAP operating margin was negatively impacted by costs related to our restructuring program that concluded at the end of an increase in incentive-based compensation accrual rates) and the realignment charges incurred in 2017. 2020.
Excluding the impact of applicable designated cash flow hedges, the appreciationdepreciation of the Indian rupee against the U.S. dollar negativelypositively impacted our operating margin by approximately 7611 basis points or 0.76 percentage points induring the three months ended September 30, 2017.March 31, 2021. Each additional 1.0% change in the exchange rate between the Indian rupee and the U.S. dollar will have the effect of moving our operating margin by approximately 1917 basis points or 0.19 percentage points.
We enteredenter into foreign exchange forwardderivative contracts to hedge certain Indian rupee denominated payments in India. These hedges are intended to mitigate the volatility of the changes in the exchange rate between the U.S. dollar and the Indian rupee. During the three months ended September 30, 2017,March 31, 2021, the settlement of our cash flow hedgeshedges positively impacted our operating margin by 48 basis points and negatively impacted our operating
margin by approximately 907 basis points or 0.90 percentage points as compared to a positive impact of approximately 25 basis points or 0.25 percentage points duringfor the three months ended September 30, 2016.March 31, 2020.
ForWe finished the first quarter of 2021 with approximately 296,500 employees, which is an increase of 4,800 as compared to March 31, 2020 and 7,000 as compared to December 31, 2020. Annualized attrition, including both voluntary and involuntary, was approximately 21.0% for the three months ended September 30, 2017March 31, 2021. Voluntary attrition constitutes the significant majority of our attrition. Both voluntary and 2016,involuntary attrition are weighted towards our non-GAAP operating margins were 20.0%4 and 19.3%4, respectively. As set forth in the “Non-GAAP Financial Measures” section below, our non-GAAP operating margin excludes stock based compensation expense, acquisition-related charges and, for 2017, realignment charges.more junior employees.
Segment Operating Profit. Profit
Segment operating profits wereprofit was as follows for the three months ended September 30:March 31:
| | | | | | | | | | | | | | | | | | | | | | | | | | | | | |
| (Dollars in millions) | 2021 | | Operating Margin % | | 2020 | | Operating Margin % | | Increase / (Decrease) |
| Financial Services | $ | 406 | | | 27.8 | | | $ | 381 | | | 26.3 | | | $ | 25 | |
| Healthcare | 411 | | | 31.9 | | | 321 | | | 26.9 | | | 90 | |
| Products and Resources | 308 | | | 30.9 | | | 261 | | | 27.4 | | | 47 | |
| Communications, Media and Technology | 215 | | | 32.7 | | | 190 | | | 30.4 | | | 25 | |
| Total segment operating profit | 1,340 | | | 30.4 | | | 1,153 | | | 27.3 | | | 187 | |
| Less: unallocated costs | 671 | | | | | 574 | | | | | 97 | |
| Income from operations | $ | 669 | | | 15.2 | | | $ | 579 | | | 13.7 | | | $ | 90 | |
| | | | | | | | | |
| | | | | | | | | |
| | | | | | | | | |
| | | | | | | | | |
| | | | | | | | | |
| | | | | | | | | |
|
| | | | | | | | | | | | | |
| | | | | | Increase |
| | 2017 | | 2016 | | $ | | % |
| | (Dollars in millions) |
| Financial Services | $ | 444 |
| | $ | 433 |
| | $ | 11 |
| | 2.5 |
| Healthcare | 347 |
| | 314 |
| | 33 |
| | 10.5 |
| Products and Resources | 232 |
| | 214 |
| | 18 |
| | 8.4 |
| Communications, Media and Technology | 147 |
| | 118 |
| | 29 |
| | 24.6 |
| Total segment operating profit | 1,170 |
| | 1,079 |
| | 91 |
| | 8.4 |
| Less: unallocated costs | 522 |
| | 496 |
| | 26 |
| | 5.2 |
| Income from operations | $ | 648 |
| | $ | 583 |
| | $ | 65 |
| | 11.1 |
InAcross all our Healthcare and Communications, Media and Technology business segments, operating profitsmargins benefited from a significant decrease in travel and entertainment costs due to COVID-19 related reductions in travel and savings resulting from the implementation of the delivery cost optimization initiatives of our 2020 Fit for Growth Plan. The increase in unallocated costs for the three months ended March 31, 2021 as compared to the three months ended March 31, 2020 was primarily due to increased costs as a percentageresult of revenues dueour recently completed acquisitions and continued enhancements to revenue growth outpacing headcount growth, partially offset byour cyber security environment.
5 Adjusted Operating Margin is not a measure of financial performance prepared in accordance with GAAP. See “Non-GAAP Financial Measures” for more information and a reconciliation to the negative impactmost directly comparable GAAP financial measure.
| | | | | | | | |
| Cognizant | 27 | March 31, 2021 Form 10-Q |
Other Income (Expense), Net.
Total other income (expense), net consists primarily of foreign currency exchange gains and (losses),losses, interest income and interest expense. The following table sets forth total other income (expense), net for the three months ended September 30:March 31:
| | | | | | | | | | | | | | | | | | | |
| (in millions) | 2021 | | | 2020 | | Increase/
Decrease | |
| Foreign currency exchange (losses) | $ | (12) | | | | $ | (108) | | | $ | 96 | | |
| Gains on foreign exchange forward contracts not designated as hedging instruments | 3 | | | | 6 | | | (3) | | |
| Foreign currency exchange gains (losses), net | (9) | | | | (102) | | | 93 | | |
| Interest income | 9 | | | | 41 | | | (32) | | |
| Interest expense | (2) | | | | (6) | | | 4 | | |
| Other, net | (2) | | | | (2) | | | — | | |
| Total other income (expense), net | $ | (4) | | | | $ | (69) | | | $ | 65 | | |
|
| | | | | | | | | | | |
| | 2017 | | 2016 | | Increase/ Decrease |
| | (in millions) |
| Foreign currency exchange (losses) gains | $ | (13 | ) | | $ | 12 |
| | $ | (25 | ) |
| (Losses) on foreign exchange forward contracts not designated as hedging instruments | (3 | ) | | (5 | ) | | 2 |
|
| Net foreign currency exchange (losses) gains | (16 | ) | | 7 |
| | (23 | ) |
| Interest income | 34 |
| | 27 |
| | 7 |
|
| Interest expense | (6 | ) | | (5 | ) | | (1 | ) |
| Other, net | (2 | ) | | 1 |
| | (3 | ) |
| Total other income (expense), net | $ | 10 |
| | $ | 30 |
| | $ | (20 | ) |
The foreign currency exchange gains and losses were primarily attributed to the remeasurement of the Indian rupee denominated net monetary assets in our U.S. dollar functional currency India subsidiaries as well as the remeasurement of other net monetary assetsand liabilities denominated in currencies other than the functional currencies of our subsidiaries. The gains and losses on our foreign exchange forward contracts not designated as hedging instruments relaterelated to the realized and unrealized gains and losses on foreign exchange forward contracts entered into primarily to offset foreign currency exposure to the Indian rupee and other non-U.S. dollar denominated net monetary assets and liabilities. As of September 30, 2017,March 31, 2021, the notional value of our undesignated hedges was $273$574 million. The decrease in interest income of $32 million was primarily attributable to lower invested balances in India, which generate higher yields. Our invested balances in India are lower in 2021 as a result of our $2.1 billion repatriation of cash from India in the fourth quarter of 2020.
Provision for Income Taxes.
The provision for income taxes decreasedincreased to $164$160 million during the three months ended September 30, 2017March 31, 2021 from $170$142 million duringfor the three months ended September 30, 2016.March 31, 2020. The effective income tax rate decreased to 24.9%24.1% for the three months ended September 30, 2017 from 27.6%March 31, 2021 compared to 27.8% for the three months ended September 30, 2016.
_______________
| |
4 | Non-GAAP operating margin is not a measurement of financial performance prepared in accordance with GAAP. See “Non-GAAP Financial Measures” for more information and a reconciliation to the most directly comparable GAAP financial measure. |
In May 2016, our principal operating subsidiary in India repurchased shares from its shareholders, which are non-Indian Cognizant entities, valued at $2.8 billion ("India Cash Remittance"). This transaction was undertaken pursuant to a plan approved by the High Court of Madras and simplified the shareholding structure of our principal operating subsidiary in India. Pursuant to the transaction, our principal Indian operating subsidiary repurchased approximately $1.2 billion of the total $2.8 billion of shares from its U.S. shareholders, resulting in tax expense in the United States and India, while the remaining $1.6 billion was repurchased from its shareholder outside the United States. Net of taxes, the transaction resulted in a remittance of cash to the United States in the amount of $1.0 billion. AsMarch 31, 2020, primarily as a result of
this transaction, we incurred an incremental 2016 income tax expensesignificantly lower non-deductible foreign currency exchange losses in our unaudited consolidated statement of
$238 million, including a discrete item recognizedoperations in the
second quarter2021 period, and the discrete benefit of the effective settlement of the IRS examination for tax years 2012 through 2016 of $143 million relatingas described in Note 8 to the distribution of historic undistributed accumulated foreign earnings. Total incremental tax expense of $24 million was recognized in the quarter ended September 30, 2016. This transaction is primarily responsible for the decrease in our effective income tax rate in 2017 as compared to 2016.unaudited consolidated financial statements.
Net Income.
Net income increased to $495$505 million for the three months ended September 30, 2017March 31, 2021 from $444$367 million for the three months ended September 30, 2016,March 31, 2020, representing 13.1%11.5% and 12.9%8.7% of revenues, respectively. The increase in net income was driven by higher income from operations and lower foreign currency exchange losses, partially offset by lower interest income and a higher provision for income taxes.
Non-GAAP Financial Measures
Portions of our disclosure including the following table, include non-GAAP income from operations, non-GAAP operating margin, and non-GAAP diluted earnings per share.financial measures. These non-GAAP financial measures are not based on any comprehensive set of accounting rules or principles and should not be considered a substitute for, or superior to, financial measures calculated in accordance with GAAP, and may be different from non-GAAP financial measures used by other companies. In addition, these non-GAAP financial measures should be read in conjunction with our financial statements prepared in accordance with GAAP. The reconciliations of Cognizant’sour non-GAAP financial measures to the corresponding GAAP measures, set forth below, should be carefully evaluated.
Our non-GAAP income from operationsfinancial measures, Adjusted Operating Margin, Adjusted Income From Operations and non-GAAP operating marginAdjusted Diluted EPS exclude stock-based compensation expense, acquisition-related charges and, in 2017, realignment charges. Our definition of non-GAAP diluted earnings per shareunusual items. Additionally, Adjusted Diluted EPS excludes net non-operating foreign currency exchange gains or losses the effect of recognition in the first quarter of 2017 of an income tax benefit previously unrecognized in our consolidated financial statements related to a specific uncertain tax position, and the impact of a one-time incremental income tax expense related to the India Cash Remittance in 2016, in addition to excluding stock-based compensation expense, acquisition-related charges and, in 2017, realignment charges. Our non-GAAP diluted earnings per share is additionally adjusted for the income tax impact of all the above items, as applicable.applicable adjustments. The income tax impact of each item is calculated by applying the statutory rate and local tax regulations in the jurisdiction in which the item was incurred. Constant currency revenue growth is defined as revenues for a given period restated at the comparative period’s foreign currency exchange rates measured against the comparative period's reported revenues.
We believe providing investors with an operating view consistent with how we manage the Company provides enhanced transparency into theour operating results of the Company.results. For our internal management reporting and budgeting purposes, we use various GAAP
| | | | | | | | |
| Cognizant | 28 | March 31, 2021 Form 10-Q |
and non-GAAP financial measures for financial and operational decision making,decision-making, to evaluate period-to-period comparisons, to determine portions of the compensation for our executive officers and for making comparisons of our operating results to those of our competitors. Therefore, it is our belief that the use of non-GAAP financial measures excluding thesecertain costs provides a meaningful supplemental measure for investors to evaluate our financial performance. Accordingly, weWe believe that the presentation of our non-GAAP income from operations, non-GAAP operating margin and non-GAAP diluted earnings per share, when read in conjunctionfinancial measures along with our reportedreconciliations to the most comparable GAAP results,measure, as applicable, can provide useful supplemental information to our management and investors regarding financial and business trends relating to our financial condition and results of operations.
A limitation of using non-GAAP financial measures versus financial measures calculated in accordance with GAAP is that non-GAAP financial measures do not reflect all of the amounts associated with our operating results as determined in accordance with GAAP and may exclude costs that are recurring namely stock-based compensation expense, certain acquisition-related charges, andsuch as our net non-operating foreign currency exchange gains or losses. In addition, other companies may calculate non-GAAP financial measures differently than us, thereby limiting the usefulness of these non-GAAP financial measures as a comparative tool. We compensate for these limitations by providing specific information regarding the GAAP amounts excluded from our non-GAAP income from operations, non-GAAP operating margin and non-GAAP diluted earnings per sharefinancial measures to allow investors to evaluate such non-GAAP financial measures.
The following table presents a reconciliation of each non-GAAP financial measure to the most comparable GAAP measure for the three months ended September 30:March 31:
| | | | | | | | | | | | | | | | | | | | | | | |
| (Dollars in millions, except per share amounts) | 2021 | | % of
Revenues | | 2020 | | % of
Revenues |
| GAAP income from operations and operating margin | $ | 669 | | | 15.2 | | | $ | 579 | | | 13.7 | |
Realignment charges (1) | — | | | — | | | 20 | | | 0.5 | |
2020 Fit for Growth Plan restructuring charges (2) | — | | | — | | | 35 | | | 0.8 | |
COVID-19 Charges (3) | — | | | — | | | 6 | | | 0.1 | |
| Adjusted Income from Operations and Adjusted Operating Margin | $ | 669 | | | 15.2 | | | $ | 640 | | | 15.1 | |
| | | | | | | |
| GAAP diluted EPS | $ | 0.95 | | | | | $ | 0.67 | | | |
| Effect of above adjustments, pre-tax | — | | | | | 0.11 | | | |
Non-operating foreign currency exchange (gains) losses, pre-tax (4) | 0.02 | | | | | 0.19 | | | |
Tax effect of above adjustments (5) | — | | | | | (0.01) | | | |
| | | | | | | |
| Adjusted Diluted EPS | $ | 0.97 | | | | | $ | 0.96 | | | |
| | | | | | | |
| | | | | | | |
| | | | | | | |
| | | | | | | |
|
| | | | | | | | | | | |
| | 2017 | | % of Revenues | | 2016 | | % of Revenues |
| | (Dollars in millions, except per share amounts) |
| GAAP income from operations and operating margin | $ | 648 |
| | 17.2 | | $ | 583 |
| | 16.9 |
Add: Stock-based compensation expense (1) | 52 |
| | 1.4 | | 49 |
| | 1.4 |
Add: Acquisition-related charges (2) | 35 |
| | 0.9 | | 35 |
| | 1.0 |
Add: Realignment charges (3) | 19 |
| | 0.5 | | — |
| | — |
| Non-GAAP income from operations and non-GAAP operating margin | $ | 754 |
| | 20.0 | | $ | 667 |
| | 19.3 |
| | | | | | | | |
| GAAP diluted earnings per share | $ | 0.84 |
| | | | $ | 0.73 |
| | |
| Effect of above operating adjustments, pre-tax | 0.18 |
| | | | 0.14 |
| | |
Effect of non-operating foreign currency exchange (gains) losses, pre-tax (4) | 0.02 |
| | | | (0.01 | ) | | |
Tax effect of non-GAAP adjustments to pre-tax income (5) | (0.06 | ) | | | | (0.04 | ) | | |
Effect of incremental income tax expense related to the India Cash Remittance (6) | — |
| | | | 0.04 |
| | |
| Non-GAAP diluted earnings per share | $ | 0.98 |
| | | | $ | 0.86 |
| | |
_____________________
| | |
(1) | Stock-based compensation expense reported in: |
|
| | | | | | | |
| | Three Months Ended
September 30, |
| | 2017 | | 2016 |
| Cost of revenues | $ | 13 |
| | $ | 13 |
|
| Selling, general and administrative expenses | 39 |
| | 36 |
|
| |
(2) | Acquisition-related charges include, when applicable, amortization of purchased intangible assets included in the depreciation and amortization expense line on our consolidated statements of operations, external deal costs, acquisition-related retention bonuses, integration costs, changes in the fair value of contingent consideration liabilities, charges for impairment of acquired intangible assets and other acquisition-related costs. |
| |
(3) | Realignment charges include severance costs, including costs associated with the VSP, lease termination costs, and advisory fees related to non-routine shareholder matters and to the development of our realignment and return of capital programs, as applicable. The total costs related to the realignment are reported in "Selling, general and administrative expenses" in our consolidated statements of operations and are expected to be incurred primarily in 2017. |
| |
(4) | Non-operating foreign currency exchange gains (losses)(2)As part of our 2020 Fit for Growth plan, during the three months ended March 31, 2020, we incurred certain employee separation, employee retention, facility exit costs and other charges. See Note 4 to our unaudited consolidated financial statements for additional information. (3)During the three months ended March 31, 2020, we incurred costs in response to the COVID-19 pandemic, including a one-time bonus to our employees at the designation of associate and below in both India and the Philippines, certain costs to enable our employees to work remotely and costs to provide medical staff and extra cleaning services for our facilities. Substantially all of the costs related to the pandemic are reported in "Cost of revenues" in our unaudited consolidated statement of operations. (4)Non-operating foreign currency exchange gains and losses, inclusive of gains and losses on related foreign exchange forward contracts not designated as hedging instruments for accounting purposes, reported in "Foreign currency exchange gains (losses), net" in our consolidated statements of operations. |
| |
(5) | Presented below are the tax impacts of each of our non-GAAP adjustments to pre-tax income: |
|
| | | | | | | |
| | Three Months Ended
September 30, |
| | 2017 | | 2016 |
| Non-GAAP income tax benefit (expense) related to: | | | |
| Stock-based compensation expense | $ | 19 |
| | $ | 10 |
|
| Acquisition-related charges | 11 |
| | 12 |
|
| Realignment charges | 6 |
| | — |
|
| Foreign currency exchange gains (losses) | (1 | ) | | 2 |
|
The effective tax rate related to each of our non-GAAP adjustments varies depending on the jurisdictions in which such income and expenses are generated and the statutory rates applicable in those jurisdictions.
| |
(6) | In May 2016, our principal operating subsidiary in India repurchased shares from its shareholders, which are non-Indian Cognizant entities, valued at $2.8 billion. As a result of this transaction, we incurred an incremental income tax expense of $24 million during the three months ended September 30, 2016. |
Nine Months Ended September 30, 2017 Compared to Nine Months Ended September 30, 2016
The following table sets forth, for the periods indicated, certain financial data for the nine months ended September 30:
|
| | | | | | | | | | | | | | | | | | |
| | | | % of | | | | % of | | Increase / Decrease |
| | 2017 | | Revenues | | 2016 | | Revenues | | $ | | % |
| | (Dollars in millions, except per share data) |
| Revenues | $ | 10,982 |
| | 100.0 | | $ | 10,025 |
| | 100.0 | | $ | 957 |
| | 9.5 |
|
Cost of revenues(1) | 6,792 |
| | 61.8 | | 6,030 |
| | 60.2 | | 762 |
| | 12.6 |
|
Selling, general and administrative expenses(1) | 2,069 |
| | 18.8 | | 2,001 |
| | 20.0 | | 68 |
| | 3.4 |
|
| Depreciation and amortization expense | 297 |
| | 2.7 | | 266 |
| | 2.7 | | 31 |
| | 11.7 |
|
| Income from operations | 1,824 |
| | 16.6 | | 1,728 |
| | 17.2 | | 96 |
| | 5.6 |
|
| Other income (expense), net | 118 |
| | | | 69 |
| | | | 49 |
| | 71.0 |
|
| Income before provision for income taxes | 1,942 |
| | 17.7 | | 1,797 |
| | 17.9 | | 145 |
| | 8.1 |
|
| Provision for income taxes | (421 | ) | | | | (661 | ) | | | | 240 |
| | (36.3 | ) |
| Income from equity method investment | 1 |
| | | | 1 |
| | | | — |
| | |
| Net income | $ | 1,522 |
| | 13.9 | | $ | 1,137 |
| | 11.4 | | $ | 385 |
| | 33.9 |
|
| Diluted earnings per share | $ | 2.55 |
| | | | $ | 1.87 |
| | | | $ | 0.68 |
| | |
Other Financial Information (2) | | | | | | | | | | | |
| Non-GAAP income from operations and non-GAAP operating margin | $ | 2,158 |
| | 19.7 | | $ | 1,987 |
| | 19.8 | | $ | 171 |
| | 8.6 |
|
| Non-GAAP diluted earnings per share | $ | 2.75 |
| | | | $ | 2.53 |
| | | | $ | 0.22 |
| | |
_____________________
| |
(1) | Exclusive of depreciation and amortization expense. |
| |
(2) | Non-GAAP income from operations, non-GAAP operating margin and non-GAAP diluted earnings per share are not measurements of financial performance prepared in accordance with GAAP. See “Non-GAAP Financial Measures” for more information and a reconciliation to the most directly comparable GAAP financial measure. |
Revenues - Overall. The increase in revenues was primarily attributed to services related to integration of digital technologies to align with shifts in consumer preferences, increased customer spending on discretionary projects, continued interest in using our global delivery model as a means to reduce overall IT and operations costs and continued penetration in all our geographic markets. Revenues from customers added since September 30, 2016 were $291 million and represented 30.4% of the period-over-period revenue increase. Foreign currency exchange movements negatively impacted year-over-year revenue growth by $52 million, or 0.5%, primarily due to the weakening of the British pound.
Our consulting and technology services revenues for the nine months ended September 30, 2017 increased by 11.1% compared to the nine months ended September 30, 2016 and represented 58.4% of total revenues for the nine months ended September 30, 2017. Our outsourcing services revenues for the nine months ended September 30, 2017 increased by 7.4% and constituted 41.6% of total revenues for the nine months ended September 30, 2017.
Revenues from our top customers were as follows:
|
| | | | | | |
| | | Nine Months Ended September 30, |
| | | 2017 | | 2016 |
| Revenues from top five customers as a percentage of total revenues | | 8.9 | % | | 10.3 | % |
| Revenues from top ten customers as a percentage of total revenues | | 14.9 | % | | 17.2 | % |
As we continue to add new customers and increase our penetration at existing customers, we expect the percentage of revenues from our top five and top ten customers to continue to decline over time.
Revenues - Reportable Segments. Revenues by reportable business segment were as follows for the nine months ended September 30:
|
| | | | | | | | | | | | | | |
| | | 2017 | | 2016 | | Increase |
| $ | | % |
| | | (Dollars in millions) |
| Financial Services | | $ | 4,209 |
| | $ | 4,012 |
| | $ | 197 |
| | 4.9 |
| Healthcare | | 3,138 |
| | 2,866 |
| | 272 |
| | 9.5 |
| Products and Resources | | 2,258 |
| | 1,972 |
| | 286 |
| | 14.5 |
| Communication, Media and Technology | | 1,377 |
| | 1,175 |
| | 202 |
| | 17.2 |
| Total revenues | | $ | 10,982 |
| | $ | 10,025 |
| | $ | 957 |
| | 9.5 |
Revenues from our Financial Services segment grew 4.9% for the nine months ended September 30, 2017, as compared to the nine months ended September 30, 2016. Growth was stronger among our insurance customers where revenues increased by $136 million as compared to an increase of $61 million for our banking customers. In this segment, revenues from customers added since September 30, 2016 were $47 million and represented 23.9% of the period-over-period revenue increase in this segment. Key areas of focus for our Financial Services customers included the adoption and integration of digital technologies that are reshaping our customers' business and operating models, cost optimization, robotic process automation, cyber security and vendor consolidation. Demand from our banking customers may continue to be negatively affected by their continued focus on optimizing their cost structure and managing their discretionary spending.
Revenues from our Healthcare segment grew 9.5% for the nine months ended September 30, 2017, as compared to the nine months ended September 30, 2016. Revenues from our healthcare customers increased by $178 million, including revenues from a new strategic customer acquired in the third quarter of 2017, while revenue growth among our life sciences customers was $94 million. Revenues from customers added since September 30, 2016 were $40 million and represented 14.7% of the period-over-period revenue increase in this segment. The increase in revenues from our life sciences customers was driven by a growing demand for a broader range of services, including business process services, advanced data analytics and solutions that span multiple service lines while leveraging cloud technologies and platforms. The demand for our services among healthcare customers could be affected by uncertainty in the regulatory environment. We believe that in the long term the healthcare industry continues to present a significant growth opportunity due to factors that are transforming the industry, including the changing regulatory environment, increasing focus on medical costs, and the consumerization of healthcare.
Revenues from our Products and Resources segment (previously referred to as Manufacturing/Retail/Logistics) grew 14.5% for the nine months ended September 30, 2017, as compared to the nine months ended September 30, 2016. Revenue growth in this segment was strongest among our energy and utilities customers and manufacturing and logistics customers, where revenues increased by a combined $255 million, including revenues from new strategic customers acquired in the fourth quarter of 2016. Revenues from our retail and consumer goods customers and travel and hospitality customers increased by a combined $31 million. Revenues from customers added since September 30, 2016 were $176 million, representing 61.5% of the period-over-period revenue increase in this segment. Demand within this segment continues to be driven by increased adoption of digital technologies that are reshaping our customers' business and operating models, as well as growing demand for analytics, supply chain consulting, implementation initiatives, product transformation, internet of things and omni channel commerce implementation and integration services. Discretionary spending by our retail customers has been and may continue to be affected by weakness in the retail sector.
Revenues from our Communications, Media and Technology segment (previously referred to as Other) grew 17.2% for the nine months ended September 30, 2017, as compared to the nine months ended September 30, 2016. Revenue growth was $117 million among our communications and media customers and $85 million among our technology customers. Revenues from customers added since September 30, 2016 were $28 million and represented 13.9% of the period-over-period revenue increase in this segment. Growth within this segment was driven by the increased adoption of digital technologies, digital content operations and an expanded range of services, such as business process services.
Revenues - Geographic Markets. Revenues by geographic market were as follows for the nine months ended September 30:
|
| | | | | | | | | | | | | | | |
| | | 2017 | | 2016 | | Increase (Decrease) |
| $ | | % |
| | | (Dollars in millions) |
| North America | | $ | 8,503 |
| | $ | 7,831 |
| | $ | 672 |
| | 8.6 |
|
| United Kingdom | | 863 |
| | 903 |
| | (40 | ) | | (4.4 | ) |
| Rest of Europe | | 903 |
| | 707 |
| | 196 |
| | 27.7 |
|
| Europe - Total | | 1,766 |
| | 1,610 |
| | 156 |
| | 9.7 |
|
| Rest of World | | 713 |
| | 584 |
| | 129 |
| | 22.1 |
|
| Total revenues | | $ | 10,982 |
| | $ | 10,025 |
| | $ | 957 |
| | 9.5 |
|
North America continues to be our largest market, representing 77.4% of total revenues for the nine months ended September 30, 2017 and accounting for 70.2% of total revenue growth over the nine months ended September 30, 2016. Revenue growth in Europe and Rest of World markets was driven by an increase in demand for an expanded range of services, such as business process services, customer adoption and integration of digital technologies that are reshaping our customers' business and operating models. Revenues from our customers in Europe grew 9.7%, after a negative currency impact of 3.7%. Specifically, revenues from our Rest of Europe customers, including revenues from new strategic customers acquired in the fourth quarter of 2016, increased 27.7% after an immaterial currency impact, while within the United Kingdom we experienced a decrease in revenues of 4.4%, after a negative currency impact of 6.7%. Revenue growth in the United Kingdom was negatively affected by weakness in the banking sector in that region. Revenues from our Rest of World customers grew 22.1%, primarily driven by the Australia and India markets. We believe that Europe, the Middle East, the Asia Pacific and Latin America regions will continue to be areas of significant investment for us as we see these regions as long term growth opportunities.
Cost of Revenues (Exclusive of Depreciation and Amortization Expense). Our cost of revenues consists primarily of salaries, incentive-based compensation, stock-based compensation expense, payroll taxes, employee benefits, immigration and project-related travel for technical personnel and subcontracting related to revenues. Our cost of revenues increased by 12.6% during the nine months ended September 30, 2017 as compared to the nine months ended September 30, 2016. The increase was due primarily to an increase in compensation and benefits costs (net of lower incentive-based compensation) as average technical personnel headcount increased over the prior year and the increase in certain operating and professional service costs. For the nine months ended September 30, 2017, compensation and benefits costs increased by $701 million as compared to the nine months ended September 30, 2016.
Selling, General and Administrative Expenses. Selling, general and administrative expenses consist primarily of salaries, incentive-based compensation, stock-based compensation expense, payroll taxes, employee benefits, immigration, travel, marketing, communications, management, finance, administrative and occupancy costs. Selling, general and administrative expenses, including depreciation and amortization, increased by 4.4% during the nine months ended September 30, 2017 as compared to the nine months ended September 30, 2016, decreasing as a percentage of revenues to 21.5% for the nine months ended September 30, 2017 as compared to 22.6% for the nine months ended September 30, 2016. The decrease as a percentage of revenues was due primarily to a decrease in compensation and benefits costs and a decrease in immigration expense, partially offset by realignment charges in 2017 and an increase in professional service costs, primarily related to the FCPA investigation and related lawsuits. The decrease in compensation and benefits costs as a percentage of revenues was driven by a decline in the number of support personnel as compared to September 30, 2016 and by the decrease in incentive-based compensation.
Income from Operations and Operating Margin - Overall. Income from operations increased 5.6% for the nine months ended September 30, 2017 as compared to the same period in 2016. Our operating margin decreased to 16.6% for the nine months ended September 30, 2017 from 17.2% for the nine months ended September 30, 2016, due to an increase in compensation and benefits costs (net of lower incentive-based compensation) and an increase in certain operating costs, partially offset by a decrease in immigration costs. Excluding the impact of applicable designated cash flow hedges, the appreciation of the Indian rupee against the U.S. dollar negatively impacted our operating margin by approximately 53 basis points or 0.53% percentage points during the nine months ended September 30, 2017. Each additional 1.0% change in exchange rate between the Indian rupee and the U.S. dollar will have the effect of moving our operating margin by approximately 19 basis points or 0.19 percentage points.
We entered into foreign exchange forward contracts to hedge certain Indian rupee denominated payments in India. These hedges are intended to mitigate the volatility of the changes in the exchange rate between the U.S. dollar and the Indian rupee. During the nine months ended September 30, 2017, the settlement of cash flow hedges positively impacted our operating margin by approximately 81 basis points or 0.81 percentage points, as compared to a positive impact of approximately 9 basis points or 0.09 percentage points during the nine months ended September 30, 2016.
For the nine months ended September 30, 2017 and 2016, our non-GAAP operating margins were 19.7%5 and 19.8%5, respectively. As set forth in the “Non-GAAP Financial Measures” section below, our non-GAAP operating margin excludes stock based compensation expense, acquisition-related charges and, for 2017, realignment charges.
Segment Operating Profit. Segment operating profits were as follows for the nine months ended September 30:
|
| | | | | | | | | | | | | | |
| | | | | | Increase (Decrease) |
| | 2017 | | 2016 | | $ | | % |
| | (Dollars in millions) |
| Financial Services | $ | 1,246 |
| | $ | 1,315 |
| | $ | (69 | ) | | (5.2 | ) |
| Healthcare | 963 |
| | 879 |
| | 84 |
| | 9.6 |
|
| Products and Resources | 649 |
| | 659 |
| | (10 | ) | | (1.5 | ) |
| Communications, Media and Technology | 414 |
| | 374 |
| | 40 |
| | 10.7 |
|
| Total segment operating profit | 3,272 |
| | 3,227 |
| | 45 |
| | 1.4 |
|
| Less: unallocated costs | 1,448 |
| | 1,499 |
| | (51 | ) | | (3.4 | ) |
| Income from operations | $ | 1,824 |
| | $ | 1,728 |
| | $ | 96 |
| | 5.6 |
|
In our Financial Services, Products and Resources, and Communication, Media and Technology business segments, operating profits decreased as a percentage of revenues due to increases in compensation and benefits costs, investments to accelerate our shift to digital, including re-skilling of service delivery personnel, and the negative impact of the appreciation of various currencies, including the Indian rupee, against the U.S. dollar. In our Healthcare business segment, operating profits were flat as a percentage of revenues.
Other Income (Expense), Net. Total other income (expense), net consists primarily of foreign currency exchange gains and (losses) and interest income. The following table sets forth total other income (expense), net for the nine months ended September 30:
|
| | | | | | | | | | | |
| | 2017 | | 2016 | | Increase/ Decrease |
| | (in millions) |
| Foreign currency exchange gains | $ | 57 |
| | $ | 2 |
| | $ | 55 |
|
| (Losses) on foreign exchange forward contracts not designated as hedging instruments | (16 | ) | | (6 | ) | | (10 | ) |
| Foreign currency exchange gains (losses), net | 41 |
| | (4 | ) | | 45 |
|
| Interest income | 97 |
| | 86 |
| | 11 |
|
| Interest expense | (18 | ) | | (15 | ) | | (3 | ) |
| Other, net | (2 | ) | | 2 |
| | (4 | ) |
| Total other income (expense), net | $ | 118 |
| | $ | 69 |
| | $ | 49 |
|
The foreign currency exchange gains were primarily attributed to the remeasurement of the Indian rupee denominated net monetary assets in our U.S. dollar functional currency India subsidiaries as well as the remeasurement of other net monetary assets denominated in currencies other than the functional currencies of our subsidiaries. The losses on our foreign exchange forward contracts not designated as hedging instruments relate to the realized and unrealizedfor accounting purposes, are reported in "Foreign currency exchange gains and losses on foreign exchange forward contracts entered into primarily to offset foreign currency exposure to the Indian rupee and other non-U.S. dollar denominated net monetary assets. As of September 30, 2017, the notional value of our undesignated hedges was $273 million. The increase in interest income of $11 million was primarily attributable to an increase in average invested balances in 2017.
________________
| |
5 | Non-GAAP operating margin is not a measurement of financial performance prepared in accordance with GAAP. See “Non-GAAP Financial Measures” for more information and a reconciliation to the most directly comparable GAAP financial measure. |
Provision for Income Taxes. The provision for income taxes decreased to $421 million during the nine months ended September 30, 2017 from $661 million during the nine months ended September 30, 2016. The effective income tax rate decreased to 21.7% for the nine months ended September 30, 2017 from 36.7% for the nine months ended September 30, 2016. The decrease(losses), net" in our effective income tax rate was primarily attributed to the effectunaudited consolidated statements of the incremental income tax expense of $214 million related to the India Cash Remittance in 2016 and the recognition in the first quarter of 2017 of income tax benefits previously unrecognized in our consolidated financial statements related to several uncertain tax positions totaling $72 million.operations.
Net Income. Net income increased to $1,522 million for the nine months ended September 30, 2017 from $1,137 million for the nine months ended September 30, 2016, representing 13.9% and 11.4% of revenues, respectively. The increase in net income as a percentage of revenues is primarily due to the increase in operating margin and a decrease in the provision for income taxes during the nine months ended September 30, 2017 as compared to the nine months ended September 30, 2016.
Non-GAAP Financial Measures
The following table presents a reconciliation of each non-GAAP financial measure to the most comparable GAAP measure for the nine months ended September 30:
|
| | | | | | | | | | | |
| | 2017 | | % of Revenues | | 2016 | | % of Revenues |
| | (Dollars in millions, except per share amounts) |
| GAAP income from operations and operating margin | $ | 1,824 |
| | 16.6 | | $ | 1,728 |
| | 17.2 |
Add: Stock-based compensation expense (1) | 161 |
| | 1.5 | | 165 |
| | 1.7 |
Add: Acquisition-related charges (2) | 104 |
| | 1.0 | | 94 |
| | 0.9 |
Add: Realignment charges (3) | 69 |
| | 0.6 | | — |
| | — |
| Non-GAAP income from operations and non-GAAP operating margin | $ | 2,158 |
| | 19.7 | | $ | 1,987 |
| | 19.8 |
| | | | | | | | |
| GAAP diluted earnings per share | $ | 2.55 |
| | | | $ | 1.87 |
| | |
| Effect of above operating adjustments, pre-tax | 0.56 |
| | | | 0.42 |
| | |
Effect of non-operating foreign currency exchange (gains) losses, pre-tax (4) | (0.06 | ) | | | | 0.01 |
| | |
Tax effect of non-GAAP adjustments to pre-tax income (5) | (0.21 | ) | | | | (0.12 | ) | | |
Effect of recognition of income tax benefit related to an uncertain tax position (6) | (0.09 | ) | | | | — |
| | |
Effect of incremental income tax expense related to the India Cash Remittance (7) | — |
| | | | 0.35 |
| | |
| Non-GAAP diluted earnings per share | $ | 2.75 |
| | | | $ | 2.53 |
| | |
_____________________
| |
(1) | Stock-based compensation expense reported in: |
|
| | | | | | | |
| | Nine Months Ended
September 30, |
| | 2017 | | 2016 |
| Cost of revenues | $ | 41 |
| | $ | 39 |
|
| Selling, general and administrative expenses | 120 |
| | 126 |
|
| |
(2) | Acquisition-related charges include, when applicable, amortization of purchased intangible assets included in the depreciation and amortization expense line on our consolidated statements of operations, external deal costs, acquisition-related retention bonuses, integration costs, changes in the fair value of contingent consideration liabilities, charges for impairment of acquired intangible assets and other acquisition-related costs. |
| |
(3) | Realignment charges include severance costs, including costs associated with the VSP, lease termination costs, and advisory fees related to non-routine shareholder matters and to the development of our realignment and return of capital programs, as applicable. The total costs related to the realignment are reported in "Selling, general and administrative expenses" in our consolidated statements of operations and are expected to be incurred primarily in 2017. |
| |
(4) | Non-operating foreign currency exchange gains (losses) are inclusive of gains and losses on related foreign exchange forward contracts not designated as hedging instruments for accounting purposes, reported in "Foreign currency exchange gains (losses), net" in our consolidated statements of operations. |
| |
(5) | (5)Presented below are the tax impacts of each of our non-GAAP adjustments to pre-tax income: |
|
| | | | | | | |
| | Nine Months Ended
September 30, |
| | 2017 | | 2016 |
| Non-GAAP income tax benefit (expense) related to: | | | |
| Stock-based compensation expense | $ | 60 |
| | $ | 37 |
|
| Acquisition-related charges | 35 |
| | 34 |
|
| Realignment charges | 24 |
| | — |
|
| Foreign currency exchange gains (losses) | 4 |
| | 3 |
|
The effective tax rate related to each of our non-GAAP adjustments varies depending on the jurisdictions in which such income and expenses are generated and the statutory rates applicable in those jurisdictions.to pre-tax income:
| | | | | | | | | | | |
| Three Months Ended
March 31, |
| (in millions) | 2021 | | 2020 |
| Non-GAAP income tax benefit (expense) related to: | | | |
| Realignment charges | $ | — | | | $ | 5 | |
| 2020 Fit for Growth Plan restructuring charges | — | | | 9 | |
| COVID-19 Charges | — | | | 2 | |
| Foreign currency exchange gains and losses | — | | | (10) | |
| | | | | | | | |
(6)Cognizant | During the three months ended 29 | March 31, 2017, we recognized an income tax benefit previously unrecognized in our consolidated financial statements related to a specific uncertain tax position of $55 million. The recognition of the benefit in the first quarter of 2017 was based on management’s reassessment regarding whether this unrecognized tax benefit met the more-likely-than-not threshold in light of the lapse in the statute of limitations as to a portion of such benefit.2021 Form 10-Q |
| | | | | | | | | | | | | | |
(7) | In May 2016, our principal operating subsidiary in India repurchased shares from its shareholders, which are non-Indian Cognizant entities, valued at $2.8 billion. As a result of this transaction, we incurred an incremental income tax expense of $214 million in the nine months ended September 30, 2016.Liquidity and Capital Resources |
Liquidity and Capital Resources
CashOur cash generated from operations has historically been our primary source of liquidity to fund operations and investments to grow our business. In addition, as of September 30, 2017,March 31, 2021, we had cash, cash equivalents and short-term investments of $4,713$2,158 million and additional available capacity under our revolving credit facilityfacilities of approximately $750$1,928 million.
The following table provides a summary of our cash flows for the ninethree months ended September 30:March 31:
| | | | | | | | | | | | | | | | | | | | | | |
| (in millions) | | 2021 | | 2020 | | Increase / Decrease | | |
| Net cash provided by (used in): | | | | | | | | |
| Operating activities | | $ | 181 | | | $ | 497 | | | $ | (316) | | | |
| Investing activities | | (538) | | | (272) | | | (266) | | | |
| Financing activities | | (340) | | | 1,135 | | | (1,475) | | | |
|
| | | | | | | | | | | | |
| | | 2017 | | 2016 | | Increase / Decrease |
| | | (in millions) |
| Net cash from operating activities | | $ | 1,571 |
| | $ | 1,041 |
| | $ | 530 |
|
| Net cash (used in) investing activities | | (422 | ) | | (873 | ) | | 451 |
|
| Net cash (used in) financing activities | | (1,652 | ) | | (748 | ) | | (904 | ) |
Operating activities.
The increasedecrease in cash generated fromprovided by operating activities was primarily attributable to higher net income duringfor the ninethree months ended September 30, 2017 asMarch 31, 2021 compared to the same period in 2016. Trade accounts receivable increased to $2,889 million at September 30, 2017 from $2,556 million at December 31, 2016. Unbilled accounts receivable increased to $403 million at September 30, 2017 from $349 million at December 31, 2016. The increase in trade accounts receivable and unbilled receivables as of September 30, 2017 as compared to December 31, 20162020 was primarily driven by higher incentive-based compensation payouts in 2021 and the remittance of certain tax payments in 2021, which were deferred due to increased revenues.
COVID-19 pandemic regulatory relief in 2020.
We monitor turnover, aging and the collection of accounts receivable by customer.client. Our days sales outstandingDSO calculation includes billed and unbilled accounts receivable,receivables, net of allowance for doubtful accounts, and contract assets, reduced by the uncollected portion of our deferred revenue. Our days sales outstanding as of September 30, 2017DSO was 74 days, higher as compared to 7270 days as of both March 31, 2021 and December 31, 2016,2020, and lower as compared to 75 days74 as of September 30, 2016.March 31, 2020.
Investing activities.
The decreaseincrease in net cash used in investing activities infor the 2017 period is primarily related to lower net investment purchases in the 2017 periodthree months ended March 31, 2021 as compared to the same period in 2016,three months ended March 31, 2020 was primarily driven by higher payments for acquisitions and net purchases of investments, partially offset by lower paymentsoutflows for acquisitions in the 2017 period.capital expenditures.
Financing activities.
The increase in cash used in financing activities infor the 2017 period is primarily attributable tothree months ended March 31, 2021 was driven by repurchases of common stock understock. The cash provided by financing activities for the ASR and dividend payments, partially offset by lower net repayments underthree months ended March 31, 2020 was primarily a result of our borrowing against the revolving credit facility, in 2017 as compared to the same period in 2016.partially offset by repurchases of common stock.
In 2014, we entered intoWe have a credit agreement with a commercial bank syndicate, or, as amended, the Credit Agreement providing for a $1,000$750 million Term Loan and a $1,750 million unsecured term loan and a $750 millionrevolving credit facility, which are due to mature in November 2023. We are required under the Credit Agreement to make scheduled quarterly principal payments on the Term Loan. As of March 31, 2021, we had no outstanding balance on our revolving credit facility. The term loan was usedSee Note 7 to payour unaudited consolidated financial statements.
a portion ofIn February 2021, our India subsidiary renewed its one-year 13 billion Indian rupee ($178 million at the cash consideration in connection with our acquisition of TZ US Parent, Inc., or TriZetto. The revolving creditMarch 31, 2021 exchange rate) working capital facility, is available for general corporate purposes. The term loan and the revolving credit facility both mature in November 2019. As of September 30, 2017, we had $825 million outstanding under the term loan and no outstanding notes under the revolving credit facility.
The Credit Agreement contains certain negative covenants, including limitations on liens, mergers, consolidations and acquisitions, subsidiary indebtedness and affiliate transactions, as well as certain affirmative covenants. In addition, the Credit Agreementwhich requires us to maintain a debt to total stockholders' equity ratio not in excess of 0.40 to 1.00. As of September 30, 2017, we were in compliance with our debt covenants and have provided a quarterly certification to our lenders to that effect. We believe that we currently meet all conditions set forth in the Credit Agreement to borrow thereunder, and we are not aware ofrepay any conditions that would prevent usbalances drawn down within 90 days from borrowing part or all of the remaining available capacity under the revolving credit facility as of September 30, 2017 and through the date of this filing.
We have initiateddisbursement. There is a plan1.0% prepayment penalty applicable to return $3.4 billionpayments made prior to stockholders by the end of 2018 through a combination of stock repurchases30 days after disbursement. This working capital facility contains affirmative and cash dividends. As part of this plan, in 2017, we repurchased $1.5 billion of our Class A common stock under the ASRnegative covenants and paid quarterly cash dividends totaling $179 million. The up-front payments related to the ASR were funded with cash on hand in the U.S. and borrowings under the revolving credit facility. We intend to repurchase an additional $1.2 billion of shares by the end of 2018. Stock repurchases may be made from timerenewed annually in February. As of March 31, 2021, we have not borrowed funds under this facility.
During the three months ended March 31, 2021, we returned $362 million to timeour stockholders through open-market purchases$234 million in share repurchases under our stock repurchase program and through the use of Rule 10b5-1 plans and/or by other means.
Our Board of Directors intends to continue to$128 million in dividend payments. We review theour capital return plan on an ongoing basis, considering the potential impacts of COVID-19 pandemic, our financial performance and liquidity position, investments required to execute our strategic plans and initiatives, acquisition opportunities, the economic outlook, regulatory changes and any other relevant factors. The Board of Directors’ determinations regarding share repurchases and dividends will depend on a variety of factors, including our net income, cash flow generated from operations or other sources, liquidity position and potential alternative uses of cash, such as acquisitions, as well as economic conditions and expected future financial results. As these factors may change over time, the amount ofactual amounts expended on stock repurchase activity, dividends, and actual amount of dividends declared by our Board of Directors,acquisitions, if any, during any particular period cannot be predicted and may fluctuate from time to time. There can be no guarantee that we will achieve the objective
| | | | | | | | |
| Cognizant | 30 | March 31, 2021 Form 10-Q |
Other Liquidity and Capital Resources Information
We believe the combination of our U.S. cash on hand, U.S. cash flows and ability to borrow under both existing and future debt arrangements continues to be sufficient to fund our current domestic operations and obligations, including debt service, future share repurchases and quarterly cash dividends. The amount of funds held in U.S. tax jurisdictions can fluctuate due to the timing of receipts and payments in the ordinary course of business, including debt repayments, and due to other reasons, such as acquisition-related activities. The Company’s U.S. operations historically have generated and are expected to continue to generate substantial cash flows. In circumstances where the Company has additional cash requirements in the United States, we have several additional liquidity options available to meet those requirements. These options may include borrowing additional funds, including borrowings under our committed revolving credit facility or a new syndicated lending facility should we seek one, temporarily utilizing intercompany loans with certain foreign subsidiaries on a limited basis and repatriating certain of our foreign earnings. Additionally, we believe we have access to the credit and equity markets and could borrow additional funds under acceptable terms and conditions or raise additional capital through an equity transaction.
Many of our operations are conducted outside the United States and significant portions of our cash, cash equivalents and short-term investments are held internationally. As of September 30, 2017, $4,336 million of our cash, cash equivalents and short-term investments were held outside the United States. As part of our ongoing liquidity assessments, we regularly monitor the mix of domestic and international cash flows and cash balances. We utilize certain strategies in an effort to ensure that our worldwide cash is available in the locations in which it is needed. MostAs part of our ongoing liquidity assessments, we regularly monitor the mix of our domestic and international cash flows and cash balances. We evaluate on an ongoing basis what portion of the amounts held outside of the United States could be repatriatednon-U.S. cash, cash equivalents and short-term investments is needed locally to execute our strategic plans and what amount is available for repatriation back to the United States but, under current law, would be subject to income taxes in the United States, less applicable foreign tax credits. We intend to indefinitely reinvest these funds outside the United States and our current plans do not demonstrate a need to repatriate these amounts to fund our liquidity needs in the United States. In reaching this conclusion, we considered our capital needs in the United States, the available sources of liquidity in the United States and our growth plans outside the United States. However, future events may occur, such as material changes in cash estimates, discretionary transactions, including corporate restructurings, and changes in applicable laws, which may lead us to repatriate foreign earnings. This may result in an additional provision for income taxes, which could materially affect our future effective income tax rate. Due to the various methods by which such earnings could be repatriated in the future, it is not currently practicable to determine the amount of applicable taxes that would result from such repatriation..
We expect our operating cash flow,flows, cash and short-term investment balances, andtogether with our available capacity under our revolving credit facilityfacilities, to be sufficient to meet our operating requirements including costs related to realignment,and service our debt for the next twelve months. Our ability to expand and grow our business in accordance with current plans, to make acquisitions, and form joint ventures, to meet our long termlong-term capital requirements beyond a twelve-month period and to execute our announced capital return plan beyond a twelve month period will
depend on many factors, including the rate, if any, at which our cash flow increases, our ability and willingness to accomplishpay for acquisitions and joint ventures with capital stock our continued intent not to repatriate foreign earnings, and the availability of public and private debt and equity financing. We cannot be certain that additional financing, if required, will be available on terms and conditions acceptable to us, if at all.
| | | | | | | | | | | | | | |
| Commitments and Contingencies |
We are involved in various claims and legal actions arising in the ordinary course of business. We accrue a liability when a loss is considered probable and the amount can be reasonably estimated. When a material loss contingency is reasonably possible but not probable, we do not record a liability, but instead disclose the nature and the amount of the claim, and an estimate of the loss or range of loss, if such an estimate can be made. Legal fees are expensed as incurred. In the opinion of management, the outcome of any existing claims and legal or regulatory proceedings, other than the specific matters described below, if decided adversely, is not expected to have a material adverse effect on our business, financial condition, results of operations and cash flows.
We are conducting an internal investigation focused on whether certain payments relating to Company-owned facilities in India were made improperly and in possible violation of the FCPA and other applicable laws. In September 2016, we voluntarily notified the DOJ and SEC and are cooperating fully with both agencies. The investigation is being conducted under the oversight of the Audit Committee, with the assistance of outside counsel. To date, the investigation has identified a total of approximately $6 million in payments made between 2010 and 2015 that may have been improper. The investigation is also examining various other payments made in small amounts in India and elsewhere that may not have complied with Company policy or applicable law. There were no adjustments recorded during the nine months ended September 30, 2017. See Note 12 to our unaudited condensed consolidated financial statements.
On October 5, 2016, October 27, 2016, and November 18, 2016, three putative securities class action complaints were filed in the United States District Court for the District of New Jersey, naming us and certain of our current and former officers as defendants. In an order dated February 3, 2017, the United States District Court for the District of New Jersey consolidated the three putative securities class actions into a single action and appointed lead plaintiffs and lead counsel. On April 7, 2017, the lead plaintiffs filed a consolidated amended complaint on behalf of a putative class of stockholders who purchased our common stock during the period between February 27, 2015 and September 29, 2016, naming us and certain of our current and former officers as defendants and alleging violations of the Exchange Act, based on allegedly false or misleading statements related to potential violations of the FCPA, our business, prospects and operations, and the effectiveness of our internal controls over financial reporting and our disclosure controls and procedures. The lead plaintiffs seek an award of compensatory damages, among other relief, and their reasonable costs and expenses, including attorneys’ fees. Under a stipulation filed by the parties on February 23, 2017, defendants filed motions to dismiss the consolidated amended complaint on June 6, 2017, plaintiffs filed an opposition brief on July 21, 2017 responding to defendants’ motions to dismiss, and defendants filed reply briefs in further support of their motions to dismiss on September 5, 2017. On September 5, 2017, we also filed a motion to strike certain allegations in the consolidated amended complaint, plaintiffs filed an opposition to the motion to strike on October 2, 2017, and on October 10, 2017, we filed a reply brief in further support of the motion to strike.
| | | | | | | | | | | | | | |
| Off-Balance Sheet Arrangements |
On October 31, 2016, November 15, 2016, and November 18, 2016, three putative shareholder derivative complaints were filed in New Jersey Superior Court, Bergen County, naming us, all of our then current directors and certain of our current and former officers as defendants. On January 24, 2017, the New Jersey Superior Court, Bergen County, consolidated the three putative shareholder derivative actions filed in that court into a single action and appointed lead plaintiff and lead counsel. The complaints assert claims for breach of fiduciary duty, corporate waste, unjust enrichment, abuse of control, mismanagement, and/or insider selling by defendants. On March 16, 2017, the parties filed a stipulation deferring all further proceedings pending a final, non-appealable ruling on the then anticipated motion to dismiss the consolidated putative securities class action. On April 26, 2017, in lieu of ordering the stipulation filed by the parties, the New Jersey Superior Court deferred further proceedings by dismissing the consolidated putative shareholder derivative litigation without prejudice but permitting the parties to file a motion to vacate the dismissal in the future. On February 22, 2017, a fourth putative shareholder derivative complaint asserting similar claims was filed in the United States District Court for the District of New Jersey, naming us and certain of our directors as defendants. On April 5, 2017, the United States District Court for the District of New Jersey entered an order staying all proceedings pending a final, non-appealable ruling on the then anticipated motion to dismiss the consolidated putative securities class action. On April 7, 2017, a fifth putative shareholder derivative complaint was filed in the United States District Court for the District of New Jersey, naming us, certain of our directors, and certain of our current and former officers as defendants. The complaint in that action asserts claims similar to those in the previously-filed putative shareholder derivative actions, but also adds a claim for violations of Section 10(b) of the Exchange Act against the individual defendants. On May 10, 2017, a sixth putative shareholder derivative complaint was filed in the United States District Court for the District of New Jersey, naming us, certain of our directors, and certain of our current and former officers as defendants. The
complaint in that action asserts claims similar to those in the previously-filed putative shareholder derivative actions, but also adds a claim for violations of Section 14(a) of the Exchange Act against the individual defendants. In an order dated June 20, 2017, the United States District Court for the District of New Jersey consolidated the three putative shareholder derivative actions filed in that court into a single action, appointed lead plaintiff and lead counsel, and stayed all further proceedings pending a final, non-appealable ruling on the motion to dismiss the consolidated putative securities class action. All of the putative shareholder derivative complaints allege among other things that certain of our public disclosures were false and misleading by failing to disclose that payments allegedly in violation of the FCPA had been made and by asserting that management had determined that our internal controls were effective. The plaintiffs seek awards of compensatory damages and restitution to us as a result of the alleged violations and their costs and attorneys’ fees, experts’ fees, and other litigation expenses, among other relief.
We are presently unable to predict the duration, scope or result of the internal investigation, any investigations by the DOJ or the SEC, the consolidated putative securities class action, the putative shareholder derivative actions or any other lawsuits. As such, we are presently unable to develop a reasonable estimate of a possible loss or range of losses, if any, and thus have not recorded any accruals related to these matters. The DOJ and the SEC have a broad range of civil and criminal sanctions under the FCPA and other laws and regulations including injunctive relief, disgorgement, fines, penalties, modifications to business practices, including the termination or modification of existing business relationships, the imposition of compliance programs and the retention of a monitor to oversee compliance with the FCPA. In addition, the DOJ and the SEC could bring enforcement actions against the Company or individuals, including former members of senior management. Such actions, if brought, could result in dispositions, judgments, settlements, fines, injunctions, cease and desist orders, debarment or other civil or criminal penalties against the Company or such individuals.
We expect to incur additional expenses related to remedial measures, and may incur additional expenses related to fines. The imposition of any sanctions or the implementation of remedial measures could have a material adverse effect on our business, annual and interim results of operations, cash flows and financial condition. Furthermore, while the Company intends to defend the lawsuits vigorously, these lawsuits and any other related lawsuits are subject to inherent uncertainties, the actual cost of such litigation will depend upon many unknown factors and the outcome of the litigation is necessarily uncertain.
Many of our engagements involve projects that are critical to the operations of our customers’ business and provide benefits that are difficult to quantify. Any failure in a customer’s systems or our failure to meet our contractual obligations to our customers, including any breach involving a customer’s confidential information or sensitive data, or our obligations under applicable laws or regulations could result in a claim for substantial damages against us, regardless of our responsibility for such failure. Although we attempt to contractually limit our liability for damages arising from negligent acts, errors, mistakes, or omissions in rendering our services, there can be no assurance that the limitations of liability set forth in our contracts will be enforceable in all instances or will otherwise protect us from liability for damages. Although we have general liability insurance coverage, including coverage for errors or omissions, there can be no assurance that such coverage will cover all types of claims, continue to be available on reasonable terms or will be available in sufficient amounts to cover one or more large claims, or that the insurer will not disclaim coverage as to any future claim. The successful assertion of one or more large claims against us that exceed or are not covered by our insurance coverage or changes in our insurance policies, including premium increases or the imposition of large deductible or co-insurance requirements, could have a material adverse effect on our business, results of operations, financial condition and cash flows.
In the normal course of business and in conjunction with certain customer engagements, we have entered into contractual arrangements through which we may be obligated to indemnify customers or other parties with whom we conduct business with respect to certain matters. These arrangements can include provisions whereby we agree to hold the indemnified party and certain of their affiliated entities harmless with respect to third-party claims related to such matters as our breach of certain representations or covenants, our intellectual property infringement, our gross negligence or willful misconduct or certain other claims made against certain parties. Payments by us under any of these arrangements are generally conditioned on the customer making a claim and providing us with full control over the defense and settlement of such claim. It is not possible to determine the maximum potential liability under these indemnification agreements due to the unique facts and circumstances involved in each particular agreement. Historically, we have not made payments under these indemnification agreements and therefore they have not had any impact on our operating results, financial position, or cash flows. However, if events arise requiring us to make payment for indemnification claims under our indemnification obligations in contracts we have entered, such payments could have material impact on our business, results of operations, financial condition and cash flows.
The Company has indemnification and expense advancement obligations pursuant to its Bylaws and indemnification agreements with respect to certain current and former members of senior management and the Company’s directors. In connection with the ongoing internal investigation, the Company has received requests under such indemnification agreements and its Bylaws to provide advances of funds for legal fees and other expenses, and expects additional requests in connection
with the investigation and related litigation. The Company has not recorded any liability for these matters as of September 30, 2017 as it cannot estimate the ultimate outcome at this time but has expensed advances made through September 30, 2017. The Company has maintained directors and officers insurance, from which a portion of these expenses may be recoverable, though we have not recorded an insurance receivable as of September 30, 2017. We are unable to make a reliable estimate of the eventual cash flows by period related to the indemnification agreements described here.
Foreign Currency Risk
Overall, we believe that we have limited revenue risk resulting from movement in foreign currency exchange rates as 77.4% of our revenues for the nine months ended September 30, 2017 were generated from customers located in North America. Revenues from our customers in the United Kingdom, Rest of Europe and Rest of World represented 7.9%, 8.2% and 6.5%, respectively, of our 2017 revenues. Accordingly, our operating results outside the United States may be affected by fluctuations in the exchange rates, primarily the British pound and the Euro, as compared to the U.S. dollar. In particular, the results of the Brexit Referendum and its effect on the British pound may subject us to increased volatility in foreign currency exchange rate movements.
A portion of our costs in India, representing approximately 22.7% of our global operating costs for the nine months ended September 30, 2017, are denominated in the Indian rupee and are subject to foreign exchange rate fluctuations. These foreign currency exchange rate fluctuations have an impact on our results of operations. In addition, a portion of our balance sheet is exposed to foreign currency exchange rate fluctuations, which may result in non-operating foreign currency exchange gains or losses upon remeasurement. For the nine months ended September 30, 2017, we reported foreign currency exchange gains, exclusive of hedging gains or losses, of $57 million, which were primarily attributed to the remeasurement of the Indian rupee denominated net monetary assets in our U.S. dollar functional currency India subsidiaries as well as the remeasurement of other net monetary assets denominated in currencies other than the functional currencies of our subsidiaries. On an ongoing basis, we manage a portion of this risk by limiting our net monetary asset exposure to certain currencies, primarily the Indian rupee, in our foreign subsidiaries.
We entered into a series of foreign exchange forward contracts that are designated as cash flow hedges of certain Indian rupee denominated payments in India. Our Indian subsidiaries, collectively referred to as Cognizant India, convert U.S. dollar receipts from intercompany billings to Indian rupees to fund local expenses. These foreign exchange forward contracts to buy Indian rupees and sell U.S. dollars are intended to partially offset the impact of movement of exchange rates on future operating costs. For the nine months ended September 30, 2017, we reported gains of $89 million on contracts that settled during this period. As of September 30, 2017, the notional value and weighted average contract rates of these contracts were as follows:
|
| | | | | | |
| | Notional Value (in millions) | | Weighted Average Contract Rate (Indian rupee to U.S. dollar) |
| 2017 | $ | 360 |
| | 71.5 |
|
| 2018 | 1,140 |
| | 73.0 |
|
| 2019 | 525 |
| | 69.6 |
|
| Total | $ | 2,025 |
| | 71.8 |
|
Our foreign subsidiaries are exposed to foreign currency exchange rate risk for transactions denominated in currencies other than the functional currency of the respective subsidiary. We also use foreign exchange forward contracts to hedge balance sheet exposure to certain monetary assets and liabilities denominated in currencies other than the functional currency of the subsidiary. These contracts are not designated as hedges and are intended to offset the foreign currency exchange gains or losses upon remeasurement of these net monetary assets and liabilities. We entered into a series of foreign exchange forward contracts scheduled to mature in 2017 and 2018 which are used to hedge our foreign currency denominated net monetary assets and liabilities. At September 30, 2017, the notional value of the outstanding contracts was $273 million and the related fair value was an asset of $2 million. During the nine months ended September 30, 2017, inclusive of $16 million of losses on these undesignated balance sheet hedges, we reported net foreign currency exchange gains of $41 million.
Off-Balance Sheet Arrangements
Other than our foreign exchange forward and option contracts, there were no off-balance sheet transactions, arrangements or other relationships with unconsolidated entities or other persons in the ninethree months ended September 30, 2017March 31, 2021 that have, or are reasonably likely to have, a current or future effect on our financial condition, revenues or expenses, results of operations, liquidity, capital expenditures or capital resources.
| | | | | | | | | | | | | | |
| Critical Accounting Estimates |
Management’s discussion and analysis of our financial condition and results of operations is based on our unaudited condensed consolidated financial statements that have been prepared in accordance with accounting principles generally accepted in the United States of America.GAAP. The preparation of these financial statements requires management to make estimates and assumptions that affect the amounts reported for assets and liabilities, including the recoverability of tangible and intangible assets, disclosure of contingent assets and liabilities as of the date of the financial statements, and the reported amounts of revenues and expenses during the reported period. On an on-goingongoing basis, we evaluate our estimates. The most significant estimates relate to the recognition of revenue and profits, based onincluding the percentageapplication of completionthe cost-to-cost method of accountingmeasuring progress to completion for certain fixed pricefixed-price contracts, the allowance for doubtful accounts, income taxes, business combinations, valuation of goodwill and other long-lived assets valuation of investments and derivative financial instruments, assumptions used in valuing stock-based compensation arrangements, business combinations and contingencies. We base our estimates on historical experience, current trends and on various other assumptions that are believed to be reasonable under the circumstances, the results of which form the basis for making judgments about the carrying values of assets and liabilities that are not readily apparent from other sources. The actual amounts may differ from the estimates used in the preparation of the accompanying unaudited condensed consolidated financial statements. For a discussion of our critical accounting estimates, see “Item 7. Management’s Discussion and Analysis of Financial Condition and Results of Operations” in our 2016 Annual Report on Form 10-K.10-K for the year ended December 31, 2020. Our significant accounting policies are described in Note 1 to the audited consolidated financial statements included in our 2016 Annual Report on Form 10-K. There have been no material changes to10-K for the aforementioned critical accounting estimates and policies during the quarter.year ended December 31, 2020.
| | | | | | | | | | | | | | |
| Recently Adopted and New Accounting Pronouncements |
See Note 1 to our unaudited condensed consolidated financial statements for additional information.statements.
Effects of Inflation
Our most significant costs are the salaries and related benefits for our programming staff and other professionals. In certain regions, competition for professionals with advanced technical skills necessary to perform our services has caused wages to increase at a rate greater than the general rate of inflation. As with other service providers in our industry, we must adequately anticipate wage increases, particularly on our fixed-price contracts. Historically, we have experienced increases in compensation and benefits costs in India; however, this has not had a material impact on our results of operations as we have been able to absorb such cost increases through cost management strategies such as managing discretionary costs, mix of professional staff and utilization levels and achieving other operating efficiencies. There can be no assurance that we will be able to offset such cost increases in the future.
| | | | | | | | | | | | | | |
| Forward Looking Statements |
The statements contained in this Quarterly Report on Form 10-Q that are not historical facts are forward-looking statements (within the meaning of Section 21E of the Exchange Act) that involve risks and uncertainties. Such forward-looking statements may be identified by, among other things, the use of forward-looking terminology such as “believe,” “expect,” “may,” “could,” “would,” “plan,” “intend,” “estimate,” “predict,” “potential,” “continue,” “should” or “anticipate” or the negative thereof or other variations thereon or comparable terminology, or by discussions of strategy that involve risks and uncertainties. From time to time, we or our representatives have made or may make forward-looking statements, orally or in writing.
| | | | | | | | |
| Cognizant | 31 | March 31, 2021 Form 10-Q |
Such forward-looking statements may be included in various filings made by us with the Securities and Exchange Commission, orSEC, in press releases or in oral statements made by or with the approval of one of our authorized executive officers. These forward-looking statements, such as statements regarding our anticipated future revenues or operating margins, contract percentage completions,margin, earnings, capital expenditures, impacts to our business, financial results and financial condition as a result of the COVID-19 pandemic, the competitive marketplace for talent, anticipated effective income tax rate and income tax expense, liquidity, access to capital, capital return plan, investment strategies, cost management, realignment program, 2020 Fit for Growth Plan, plans and objectives, including those related to our digital practice areas, investment in our business, and potential acquisitions, industry trends, customerclient behaviors and trends, the outcome of regulatory and litigation matters, the ongoing internal investigationincremental accrual related to the India Defined Contribution Obligation and other statements regarding matters that are not historical facts, are based on our current expectations, estimates and projections, management’s beliefs and certain assumptions made by management, many of which, by their nature, are inherently uncertain and beyond our control. Actual results, performance, achievements and outcomes could differ materially from the results expressed in, or anticipated or implied by, these forward-looking statements. There are a number of important factors that could cause our results to differ materially from those indicated by such forward-looking statements, including:
•economic and political conditions globally and in particular in the markets in which our clients and operations are concentrated;
Competition from•the continuing impact of the COVID-19 pandemic, or other service providers;future pandemics, on our business, results of operations, liquidity and financial condition;
The risk that we may not be able•our ability to attract, train and retain skilled employees, including highly skilled technical personnel to satisfy client demand and senior management to lead our business globally;
•challenges related to growing our business organically as well as inorganically through acquisitions, and our ability to achieve our targeted improvementsgrowth rates;
•our ability to achieve our profitability goals and capital return strategy;
•our ability to successfully execute on the investments outlined in our operating margin2020 Fit for Growth Plan and levelachieve the anticipated benefits from the plan;
•our ability to meet specified service levels or milestones required by certain of profitability, orour contracts;
•intense and evolving competition and significant technological advances that our operating margin and profitability may decline;
The risk of liability or damage to our reputation resulting from security breaches;
Any possible failure to comply with or adapt to changes in data protection and privacy laws;
The loss of customers, especially as a few customers account for a large portion of our revenues;
The risk that we may not be able toservice offerings must keep pace with in the rapidly evolving technological environment;changing markets we compete in;
The rate•legal, reputation and financial risks if we fail to protect client and/or our data from security breaches and/or cyber attacks;
•the effectiveness of growth in the use of technology inour risk management, business continuity and disaster recovery plans and the type and level of technology spending bypotential that our customers;global delivery capabilities could be impacted;
Mispricing of our services, especially•restrictions on our fixed-price contracts;
Risks associated with our ongoing internal investigation into possible violations of the FCPA and similar laws, including the cost of such investigation and any sanctions, fines or remedial measures that may be imposed by the DOJ or SEC, additional expenses related to remedial measures, the costs of defending and/or settling and possible judgments against us that may result from associated lawsuits against us and any possible impact on our ability to timely file the required reports with the SEC;
Risks associated with our identified material weaknessvisas, in internal control over financial reporting and any other failure to maintain effective internal controls, including any potential future findings of control deficiencies through the internal investigation, in connection with any company we acquire, or otherwise;
Our inability to successfully acquire or integrate target companies;
System failure or disruptions in our communications or information technology;
The risk that we may lose key executives and not be able to enforce non-competition agreements with them;
Competition for hiring highly-skilled technical personnel;
Possible failure to provide business solutions and deliver complex and large projects for our customers;
The risk of reputational harm to us;
Our revenues being highly dependent on customers concentrated in certain industries, including financial services and healthcare, and located primarilyparticular in the United States, United Kingdom and Europe;
The risk thatEU, or immigration more generally or increased costs of such visas or the wages we may not be ableare required to pay dividends or repurchase shares in accordance withassociates on visas, which may affect our announced capital return plan, or at all;ability to compete for and provide services to our clients;
The •risks related to anti-outsourcing legislation, if adopted, and negative perceptions associated with the incurrenceoffshore outsourcing, both of indebtedness aswhich could impair our ability to serve our clients;
•risks and costs related to complying with numerous and evolving legal and regulatory requirements to which we anticipate incurring additional indebtedness to help fund our announced capital return plan;
Risks relating to our global operations, including our operations in India;
The effects of fluctuationsare subject in the Indian rupeemany jurisdictions in which we operate;
•potential changes in tax laws, or in their interpretation or enforcement, failure by us to adapt our corporate structure and other currency exchange rates;intercompany arrangements to achieve global tax efficiencies or adverse outcomes of tax audits, investigations or proceedings;
The effect•potential exposure to litigation and legal claims in the conduct of our use of derivative instruments;business; and
The possibility that we may be required, as a result of our indebtedness, or otherwise choose to repatriate foreign earnings or that our foreign earnings or profits may become subject to U.S. taxes;
The possibility that we may lose certain tax benefits provided to companies in our industry by •the Indian government;
The risk that we may not be able to enforce or protect our intellectual property rights, or that we may infringe upon the intellectual property rights of others;
Changes in domestic and international regulations and legislation relating to immigration and anti-outsourcing;
Increased regulation of the financial services and healthcare industries, as well as other industries in which our customers operate;
The Brexit Referendum and any negative effects on global economic conditions, financial markets and our business;
The recent U.S. presidential election and related regulatory uncertainties, including in the areas of outsourcing, immigration and taxes;
The risk of war, terrorist activities, pandemics and natural disasters; and
The factors set forth in "Part I, Item 1A. Risk Factors” in our Annual Report on Form 10-K for the year ended December 31, 2016 and “Part II, Item 1.A. Risk Factors” in this Quarterly Report on Form 10-Q.
2020.
You are advised to consult any further disclosures we make on related subjects in the reports we file with the Securities and Exchange Commission,SEC, including this report in the section titled “Part I, Item 2. Management’s Discussion and Analysis of Financial Condition and Results of Operations” and “Part I, Item 1. Business” in our Annual Report on Form 10-K for the year ended December 31, 2016.2020. We undertake no obligation to update or revise any forward-looking statements, whether as a result of new information, future events or otherwise, except as may be required under applicable securities laws.
| | | | | | | | |
| Cognizant | 32 | March 31, 2021 Form 10-Q |
| | | | | | | | | | | |
| Item 3. Quantitative and Qualitative Disclosures about Market Risk. |
There have been no material changes in our quantitative and qualitative disclosures about market risk from those disclosed in Part II, Item 7A, Quantitative and Qualitative Disclosures about Market Risk.
We are exposed to foreign currency exchange rate riskRisk, in the ordinary course of doing business as we transact or hold a portion of our funds in foreign currencies, particularly the Indian rupee. Additionally, the Brexit Referendum and its effectAnnual Report on the British pound may subject us to increased volatility in foreign currency exchange rate movements. Accordingly, we periodically evaluate the need for hedging strategies, including the use of derivative financial instruments, to mitigate the effect of foreign currency exchange rate fluctuations and expect to continue to use such instruments in the future to reduce foreign currency exposure to appreciation or depreciation in the value of certain foreign currencies. All hedging transactions are authorized and executed pursuant to regularly reviewed policies and procedures.
We have entered into a series of foreign exchange forward contracts that are designated as cash flow hedges of certain Indian rupee denominated payments in India. Cognizant India converts U.S. dollar receipts from intercompany billings to Indian rupees to fund local expenses. These U.S. dollar / Indian rupee hedges are intended to partially offset the impact of movement of exchange rates on future operating costs. As of September 30, 2017, the notional value and weighted average contract rates of these contracts were as follows:
|
| | | | | | |
| | Notional Value (in millions) | | Weighted Average Contract Rate (Indian rupee to U.S. dollar) |
| 2017 | $ | 360 |
| | 71.5 |
|
| 2018 | 1,140 |
| | 73.0 |
|
| 2019 | 525 |
| | 69.6 |
|
| Total | $ | 2,025 |
| | 71.8 |
|
As of September 30, 2017, the net unrealized gain on our outstanding foreign exchange forward contracts designated as cash flow hedges was $127 million. Based upon a sensitivity analysis of our foreign exchange forward contracts at September 30, 2017, which estimates the fair value of the contracts based upon market exchange rate fluctuations, a 10.0% change in the foreign currency exchange rate against the U.S. dollar with all other variables held constant would have resulted in a change in the fair value of approximately $207 million.
Our foreign subsidiaries are exposed to foreign currency exchange rate risk for transactions denominated in currencies other than the functional currency of the respective subsidiary. We also use foreign exchange forward contracts to hedge balance sheet exposure to certain monetary assets and liabilities denominated in currencies other than the functional currency of the subsidiary. These contracts are not designated as hedges and are intended to offset the foreign currency exchange gains or losses upon remeasurement of these net monetary assets and liabilities. We entered into a series of foreign exchange forward contracts scheduled to mature in 2017 and 2018 which are used to hedge our foreign currency denominated net monetary assets and liabilities. At September 30, 2017, the notional value of the outstanding contracts was $273 million and the related fair value was an asset of $2 million. Based upon a sensitivity analysis of our foreign exchange forward contracts at September 30, 2017, which estimates the fair value of the contracts based upon market exchange rate fluctuations, a 10.0% change in the foreign currency exchange rate against the U.S. dollar with all other variables held constant would have resulted in a change in the fair value of approximately $18 million.
Our Credit Agreement provides for a $1,000 million unsecured term loan and a $750 million unsecured revolving credit facility. The term loan and the revolving credit facility both mature on November 20, 2019. As of September 30, 2017, we had $825 million outstanding under the term loan and no outstanding loans under the revolving credit facility. The Credit Agreement requires interest to be paid at either the base rate or the Eurocurrency rate, plus a margin. The margin over the base rate is 0.00%, and the margin over the Eurocurrency rate ranges from 0.75% to 1.125%, depending on our debt ratings (or, if we have not received debt ratings, from 0.875% to 1.00%, depending on our debt to total stockholders' equity ratio). Thus, our debt exposes us to market risk from changes in interest rates. We performed a sensitivity analysis to determine the effect of interest rate fluctuations on our interest expense. A 10% change in interest rates, with all other variables held constant, would have resulted in a 4.5% change to our reported interest expenseForm 10-K for the nine monthsfiscal year ended September 30, 2017.
We typically invest in highly-rated securities and our policy generally limits the amount of credit exposure to any one issuer. Our investment policy requires investments to be investment gradeDecember 31, 2020, filed with the objective of minimizing the potential risk of principal loss. We may sell our trading and available-for-sale investments prior to their stated maturities for strategic purposes, in anticipation of credit deterioration, or for duration management. As of September 30, 2017, our short-term and long-term investments were $3,136 million and $262 million, respectively. Our investment portfolio is comprised primarily of time deposits, mutual funds invested in fixed income securities, Indian rupee denominated commercial paper, Indian rupee denominated international corporate bonds and government debt securities, U.S. dollar denominated corporate bonds, municipal bonds, certificates of deposit, commercial paper, debt issuances by the U.S. government, U.S. government agencies, foreign governments and supranational entities and asset-backed securities. The asset-backed securities included securities backed by auto loans, credit card receivables, and other receivables. Our long-term investments are comprised of held-to-maturity corporate and other debt securities as well as equity and cost method investments.SEC on February 12, 2020.
In addition, our cash, cash equivalents and short-term investments are subject to market risk from changes in interest rates. As of September 30, 2017, a 10% change in interest rates, with all other variables held constant, would result in a change in the fair value of our available-for-sale investment securities of approximately $5 million.
Information provided by the sensitivity analysis does not necessarily represent the actual changes that would occur under normal market conditions.
Item 4. Controls and Procedures.
Internal Investigation
Background
As previously disclosed, the Company is conducting an internal investigation focused on whether certain payments relating to Company-owned facilities in India were made improperly and in possible violation of the FCPA and other applicable laws. The investigation is also examining various other payments made in small amounts in India and elsewhere that may not have complied with Company policy or applicable law. In 2016, through the internal investigation, we discovered that certain members of senior management may have participated in or been aware of the making of potentially improper payments and failed to take action to prevent the making of potentially improper payments by either overriding or failing to enforce the controls established by the Company relating to real estate and procurement principally in connection with permits for certain facilities in India. Such actions would be inconsistent with the standards and tone at the top to which our Board of Directors and senior management are committed and would be in violation of the Company’s written code of conduct and procedures established in part to detect and prevent improper payments.
Material Weakness
Based on the results of the internal investigation to date and remedial actions taken through September 30, 2017, we concluded a material weakness that existed at December 31, 2016 continued to exist as of September 30, 2017 as we did not maintain an effective internal control environment. A material weakness is a deficiency, or a combination of deficiencies, in internal control over financial reporting such that there is a reasonable possibility that a material misstatement of our annual or interim financial statements will not be prevented or detected on a timely basis. Specifically, we did not maintain an effective tone at the top as certain members of senior management may have participated in or failed to take action to prevent the making of potentially improper payments by either overriding or failing to enforce the controls established by the Company relating to real estate and procurement principally in connection with permits for certain facilities in India.
This control deficiency did not result in a material misstatement of our current or prior period consolidated annual or interim financial statements. However, this control deficiency could have resulted in material misstatements to the annual or interim consolidated financial statements that would not have been prevented or detected. Accordingly, management has concluded that this control deficiency constitutes a material weakness.
Remediation
We have undertaken a number of measures designed to directly address, or that may contribute to, the remediation of our material weakness or the enhancement of our internal controls over financial reporting. While the internal investigation is ongoing, based on the results of the investigation to date, the members of senior management who may have participated in or been aware of the making of the identified potentially improper payments and failed to take action to prevent the making of the identified potentially improper payments are no longer with the Company or in a senior management position. Additional personnel actions have been taken with respect to other employees and further actions may be required.
Further, among other things, we have made certain new management appointments, including a new President and a new General Counsel, added resources and personnel to our compliance function and programs, enhanced our oversight controls in the areas of procurement and accounts payable as they relate to real estate transactions in India, and enhanced our compliance program and control environment through a number of actions, including additional and improved anti-corruption and ethical conduct training programs and a distribution of a revised code of ethics to all employees.
Changes to internal controls over financial reporting need to operate for a period of time in order for management to evaluate and test whether the internal control changes are effective. We are evaluating the effectiveness of certain changes to our internal controls over financial reporting implemented to directly address the material weakness. | | | | | | | | | | | |
| Item 4. Controls and Procedures. |
Evaluation of Disclosure Controls and Procedures
Our management, under the supervision and with the participation of our chief executive officer and our chief financial officer, evaluated the design and operating effectiveness of our disclosure controls and procedures (as defined in Rules 13a-15(e) and 15d-15(e) under the Securities Exchange Act of 1934, as amended, or the Exchange Act) as of September 30, 2017.
March 31, 2021. Based on thethis evaluation, our chief executive officer and our chief financial officer concluded that, as of the design and effectiveness ofMarch 31, 2021, our disclosure controls and procedures and as a result of the material weakness described above, our chief executive officer and chief financial officer have concluded that, as of September 30, 2017, the Company’s disclosure controls and procedures were not effective.
Changes in Internal Control over Financial Reporting
Other than described in “Remediation” above, there were noNo changes in the Company’sour internal control over financial reporting that(as defined in Rules 13a-15(f) and 15d-15(f) under the Exchange Act) occurred during the thirdfiscal quarter of 2017ended March 31, 2021 that have materially affected, or are reasonably likely to materially affect, the Company’sour internal control over financial reporting.
| | | | | | | | |
| Cognizant | 33 | March 31, 2021 Form 10-Q |
PART II. OTHER INFORMATION
| | | | | | | | | | | | | | |
| Item 1. Legal Proceedings |
We are conducting an internal investigation focused on whether certain payments relating to Company-owned facilities in India were made improperly and in possible violation of the U.S. Foreign Corrupt Practices Act, or FCPA and other applicable laws. In September 2016, we voluntarily notified the U.S. Department of Justice, or DOJ, and Securities and Exchange Commission, or SEC, and are cooperating fully with both agencies. The investigation is being conducted under the oversight of the Audit Committee, with the assistance of outside counsel. To date, the investigation has identified a total of approximately $6 million in payments made between 2010 and 2015 that may have been improper. The investigation is also examining various other payments made in small amounts in India and elsewhere that may not have complied with Company policy or applicable law. Based on the results of the investigation to date, no material adjustments, restatements or other revisionsSee Note 12 to our previously issued financial statements are required.
On October 5, 2016, October 27, 2016, and November 18, 2016, three putative securities class action complaints were filed in the United States District Court for the District of New Jersey, naming us and certain of our current and former officers as defendants. In an order dated February 3, 2017, the United States District Court for the District of New Jersey consolidated the three putative securities class actions into a single action and appointed lead plaintiffs and lead counsel. On April 7, 2017, the lead plaintiffs filed a consolidated amended complaint on behalf of a putative class of stockholders who purchased our common stock during the period between February 27, 2015 and September 29, 2016, naming us and certain of our current and former officers as defendants and alleging violations of the Exchange Act, based on allegedly false or misleading statements related to potential violations of the FCPA, our business, prospects and operations, and the effectiveness of our internal controls over financial reporting and our disclosure controls and procedures. The lead plaintiffs seek an award of compensatory damages, among other relief, and their reasonable costs and expenses, including attorneys’ fees. Under a stipulation filed by the parties on February 23, 2017, defendants filed motions to dismiss the consolidated amended complaint on June 6, 2017, plaintiffs filed an opposition brief on July 21, 2017 responding to defendants’ motions to dismiss, and defendants filed reply briefs in further support of their motions to dismiss on September 5, 2017. On September 5, 2017, we also filed a motion to strike certain allegations in the consolidated amended complaint, plaintiffs filed an opposition to the motion to strike on October 2, 2017, and on October 10, 2017, we filed a reply brief in further support of the motion to strike.
On October 31, 2016, November 15, 2016, and November 18, 2016, three putative shareholder derivative complaints were filed in New Jersey Superior Court, Bergen County, naming us, all of our then current directors and certain of our current and former officers as defendants. On January 24, 2017, the New Jersey Superior Court, Bergen County, consolidated the three putative shareholder derivative actions filed in that court into a single action and appointed lead plaintiff and lead counsel. The complaints assert claims for breach of fiduciary duty, corporate waste, unjust enrichment, abuse of control, mismanagement, and/or insider selling by defendants. On March 16, 2017, the parties filed a stipulation deferring all further proceedings pending a final, non-appealable ruling on the then anticipated motion to dismiss the consolidated putative securities class action. On April 26, 2017, in lieu of ordering the stipulation filed by the parties, the New Jersey Superior Court deferred further proceedings by dismissing the consolidated putative shareholder derivative litigation without prejudice but permitting the parties to file a motion to vacate the dismissal in the future. On February 22, 2017, a fourth putative shareholder derivative complaint asserting similar claims was filed in the United States District Court for the District of New Jersey, naming us and certain of our directors as defendants. On April 5, 2017, the United States District Court for the District of New Jersey entered an order staying all proceedings pending a final, non-appealable ruling on the then anticipated motion to dismiss the consolidated putative securities class action. On April 7, 2017, a fifth putative shareholder derivative complaint was filed in the United States District Court for the District of New Jersey, naming us, certain of our directors, and certain of our current and former officers as defendants. The complaint in that action asserts claims similar to those in the previously-filed putative shareholder derivative actions, but also adds a claim for violations of Section 10(b) of the Exchange Act against the individual defendants. On May 10, 2017, a sixth putative shareholder derivative complaint was filed in the United States District Court for the District of New Jersey, naming us, certain of our directors, and certain of our current and former officers as defendants. The complaint in that action asserts claims similar to those in the previously-filed putative shareholder derivative actions, but also adds a claim for violations of Section 14(a) of the Exchange Act against the individual defendants. In an order dated June 20, 2017, the United States District Court for the District of New Jersey consolidated the three putative shareholder derivative actions filed in that court into a single action, appointed lead plaintiff and lead counsel, and stayed all further proceedings pending a final, non-appealable ruling on the motion to dismiss the consolidated putative securities class action. All of the putative shareholder derivative complaints allege among other things that certain of our public disclosures were false and misleading by failing to disclose that payments allegedly in violation of the FCPA had been made and by asserting that management had determined that our internal controls were effective. The plaintiffs seek awards of compensatory damages and restitution to us as a result of the alleged violations and their costs and attorneys’ fees, experts’ fees, and other litigation expenses, among other relief.
We are presently unable to predict the duration, scope or result of the Audit Committee’s investigation, any investigations by the DOJ or the SEC, the consolidated putative securities class action, the putative shareholder derivative actions or any other lawsuits. As such, we are presently unable to develop a reasonable estimate of a possible loss or range of losses, if any, and thus have not recorded any accruals related to these matters. The DOJ and the SEC have a broad range of civil and criminal sanctions under the FCPA and other laws and regulations including injunctive relief, disgorgement, fines, penalties, modifications to business practices, including the termination or modification of existing business relationships, the imposition of compliance programs and the retention of a monitor to oversee compliance with the FCPA. In addition, the DOJ and the SEC could bring enforcement actions against the Company or individuals, including former members of senior management. Such actions, if brought, could result in dispositions, judgments, settlements, fines, injunctions, cease and desist orders, debarment or other civil or criminal penalties against the Company or such individuals.
We expect to incur additional expenses related to remedial measures, and may incur additional expenses related to fines. The imposition of any sanctions or the implementation of remedial measures could have a material adverse effect on our business, annual and interim results of operations, cash flows and financial condition. Furthermore, while the Company intends to defend the lawsuits vigorously, these lawsuits and any other related lawsuits are subject to inherent uncertainties, the actual cost of such litigation will depend upon many unknown factors and the outcome of the litigation is necessarily uncertain.
We are also involved in various claims and legal actions arising in the ordinary course of business. In the opinion of our management, the outcome of such claims and legal actions, if decided adversely, is not expected to have a material adverse effect on our quarterly or annual operating results, cash flows orunaudited consolidated financial position.statements.
TheThere have been no material changes in our risk factors from those disclosed in Part I, Item 1A, Risk Factors, in our Annual Report on Form 10-K for the fiscal year ended December 31, 20162020 filed with the SEC on March 1, 2017 continue to apply to our business.February 12, 2021.
The information presented below amends the risk factor of the same heading in our Annual Report on Form 10-K for the fiscal year ended December 31, 2016 and should be read in conjunction with the other risk factors disclosed in our Annual Report on Form 10-K for the fiscal year ended December 31, 2016.
The outcome of the internal investigation being conducted under the oversight of our Audit Committee of possible violations of the Foreign Corrupt Practices Act, or FCPA, and similar laws and related litigation could have a material adverse effect on our business, annual and interim results of operations, cash flows and financial condition.
We are conducting an internal investigation focused on whether certain payments relating to Company-owned facilities in India were made improperly and in possible violation of the FCPA and other applicable laws. In September 2016, we voluntarily notified the DOJ and the SEC, and are cooperating fully with both agencies. The investigation is being conducted under the oversight of the Audit Committee, with the assistance of outside counsel. The investigation is also examining various other payments made in small amounts in India and elsewhere that may not have complied with Company policy or applicable law. We expect to incur additional expenses in connection with conducting the internal investigation.
On October 5, 2016, October 27, 2016, and November 18, 2016, three putative securities class action complaints were filed in the United States District Court for the District of New Jersey, naming us and certain of our current and former officers as defendants. In an order dated February 3, 2017, the United States District Court for the District of New Jersey consolidated the three putative securities class actions into a single action and appointed lead plaintiffs and lead counsel. On April 7, 2017, the lead plaintiffs filed a consolidated amended complaint on behalf of a putative class of stockholders who purchased our common stock during the period between February 27, 2015 and September 29, 2016, naming us and certain of our current and former officers as defendants and alleging violations of the Exchange Act, based on allegedly false or misleading statements related to potential violations of the FCPA, our business, prospects and operations, and the effectiveness of our internal controls over financial reporting and our disclosure controls and procedures. The lead plaintiffs seek an award of compensatory damages, among other relief, and their reasonable costs and expenses, including attorneys’ fees. Under a stipulation filed by the parties on February 23, 2017, defendants filed motions to dismiss the consolidated amended complaint on June 6, 2017, plaintiffs filed an opposition brief on July 21, 2017 responding to defendants’ motions to dismiss, and defendants filed reply briefs in further support of their motions to dismiss on September 5, 2017. On September 5, 2017, we also filed a motion to strike certain allegations in the consolidated amended complaint, plaintiffs filed an opposition to the motion to strike on October 2, 2017, and on October 10, 2017, we filed a reply brief in further support of the motion to strike.
On October 31, 2016, November 15, 2016, and November 18, 2016, three putative shareholder derivative complaints were filed in New Jersey Superior Court, Bergen County, naming us, all of our then current directors and certain of our current
and former officers as defendants. On January 24, 2017, the New Jersey Superior Court, Bergen County, consolidated the three putative shareholder derivative actions filed in that court into a single action and appointed lead plaintiff and lead counsel. The complaints assert claims for breach of fiduciary duty, corporate waste, unjust enrichment, abuse of control, mismanagement, and/or insider selling by defendants. On March 16, 2017, the parties filed a stipulation deferring all further proceedings pending a final, non-appealable ruling on the then anticipated motion to dismiss the consolidated putative securities class action. On April 26, 2017, in lieu of ordering the stipulation filed by the parties, the New Jersey Superior Court deferred further proceedings by dismissing the consolidated putative shareholder derivative litigation without prejudice but permitting the parties to file a motion to vacate the dismissal in the future. On February 22, 2017, a fourth putative shareholder derivative complaint asserting similar claims was filed in the United States District Court for the District of New Jersey, naming us and certain of our directors as defendants. On April 5, 2017, the United States District Court for the District of New Jersey entered an order staying all proceedings pending a final, non-appealable ruling on the then anticipated motion to dismiss the consolidated putative securities class action. On April 7, 2017, a fifth putative shareholder derivative complaint was filed in the United States District Court for the District of New Jersey, naming us, certain of our directors, and certain of our current and former officers as defendants. The complaint in that action asserts claims similar to those in the previously-filed putative shareholder derivative actions, but also adds a claim for violations of Section 10(b) of the Exchange Act against the individual defendants. On May 10, 2017, a sixth putative shareholder derivative complaint was filed in the United States District Court for the District of New Jersey, naming us, certain of our directors, and certain of our current and former officers as defendants. The complaint in that action asserts claims similar to those in the previously-filed putative shareholder derivative actions, but also adds a claim for violations of Section 14(a) of the Exchange Act against the individual defendants. In an order dated June 20, 2017, the United States District Court for the District of New Jersey consolidated the three putative shareholder derivative actions filed in that court into a single action, appointed lead plaintiff and lead counsel, and stayed all further proceedings pending a final, non-appealable ruling on the motion to dismiss the consolidated putative securities class action. All of the putative shareholder derivative complaints allege among other things that certain of our public disclosures were false and misleading by failing to disclose that payments allegedly in violation of the FCPA had been made and by asserting that management had determined that our internal controls were effective. The plaintiffs seek awards of compensatory damages and restitution to us as a result of the alleged violations and their costs and attorneys’ fees, experts’ fees, and other litigation expenses, among other relief.
We are presently unable to predict the duration, scope or result of the internal investigation, the related consolidated putative securities class action, the consolidated putative shareholder derivative action or any other related lawsuit, and any investigations by the DOJ or the SEC, including whether either agency will commence any legal action.
The DOJ and the SEC have a broad range of civil and criminal sanctions under the FCPA and other laws and regulations including injunctive relief, disgorgement, fines, penalties, the imposition of revised compliance programs and the retention of a monitor to oversee compliance with the FCPA. In addition, the DOJ and the SEC could bring enforcement actions against the Company or individuals, including former members of senior management. Such actions, if brought, could result in dispositions, judgments, settlements, fines, injunctions, cease and desist orders, debarment or other civil or criminal penalties against the Company or such individuals. The imposition of any sanctions, fines or the implementation of remedial measures could have a material adverse effect on our business, annual and interim results of operations, cash flows and financial condition. We could also incur additional expenses related to remedial measures, including those that we are implementing in response to our conclusion that our internal control over financial reporting and our disclosure controls and procedures are not effective.
The outcome of the putative class action litigation, derivative lawsuit, or any other litigation is necessarily uncertain. We could be forced to expend significant resources in the defense of these lawsuits or future ones, and we may not prevail. The imposition of any sanctions, remedial measures or judgments against us could have a material adverse effect on our business, results of operations and financial condition.
| | | | | | | | | | | | | | |
| Item 2. Unregistered Sales of Equity Securities and Use of Proceeds |
Issuer RepurchasesPurchases of Equity Securities
Effective March 1, 2017, the Board of Directors approved the termination of the stock repurchase program then in effect and approved a new stock repurchase program. TheOur stock repurchase program allows for the repurchase of $3.5up to $9.5 billion, of our outstanding shares of Class A common stock, excludingexcluding fees and expenses, through December 31, 2019.
Under the stock repurchase program, the Company is authorized to repurchase itsof our Class A common stock through open market purchases, including under a trading plan adopted pursuant to Rule 10b5-1 of the Exchange Act,Plan or in private transactions, including through ASR agreements entered into with financial institutions, in accordance with applicable federal securities laws. The repurchase program does not have an expiration date. The timing of repurchases and the exact number of shares to
be purchased are determined by the Company’s management, in its discretion, or pursuant to a Rule 10b5-1 trading plan,Plan, and will depend upon market conditions and other factors.
In March 2017, we entered into accelerated share repurchase agreements, referred to collectively as the ASR, with certain financial institutions under our stock repurchase program. Under the terms of the ASR and in exchange for up-front payments of $1.5 billion, the financial institutions initially delivered 21.5 million shares. In August 2017, upon the final settlement of the ASR, we received an additional 2.2 million shares based on the final volume-weighted average price of the Company's Class A common stock during the purchase period less the negotiated discount.
As of September 30, 2017, the remaining available balance under the Board of Directors' authorized stock repurchase program was $2.0 billion.
|
| | | | | | | | | | | | | | |
| Month | | Total Number
of Shares
Purchased | | Average
Price Paid
per Share | | Total Number of
Shares Purchased
as Part of Publicly
Announced
Plans or
Programs | | Approximate
Dollar Value of Shares
that May Yet Be
Purchased under the
Plans or Programs
(in millions) |
| July 1, 2017 - July 31, 2017 | | | | | | | | |
| Open market and privately negotiated purchases | | — |
| | $ | — |
| | — |
| | $ | 2,000 |
|
| August 1, 2017 - August 31, 2017 | | | | | | | | |
| Open market and privately negotiated purchases | | — |
| | — |
| | — |
| | |
| March 2017 ASR | | 2,219,349 |
| | (a) | | 2,219,349 |
| | 2,000 |
|
| September 1, 2017 - September 30, 2017 | | | | | | | | |
| Open market and privately negotiated purchases | | — |
| | — |
| | — |
| | 2,000 |
|
| Total | | 2,219,349 |
| | $ | — |
| | 2,219,349 |
| | |
______________
| |
(a) | In March 2017, the Company entered into an ASR to purchase up to $1.5 billion of the Company's Class A common stock. In August 2017, the purchase period for the ASR ended and an additional 2.2 million shares were delivered. In total, 23.7 million shares were delivered under the ASR at an average repurchase price of $63.19. |
During the three months ended September 30, 2017,March 31, 2021, we repurchased $234 million of our Class A common stock. The stock repurchase activity under our stock repurchase program during the three months ended March 31, 2021 was as follows:
| | | | | | | | | | | | | | | | | | | | | | | | | | |
| Month | | Total Number
of Shares
Purchased | | Average
Price Paid
per Share | | Total Number of
Shares Purchased
as Part of Publicly
Announced
Plans or
Programs | | Approximate
Dollar Value of Shares
that May Yet Be
Purchased under the
Plans or Programs
(in millions) |
| January 1, 2021 - January 31, 2021 | | — | | | $ | — | | | — | | | $ | 2,815 | |
| February 1, 2021 - February 28, 2021 | | 1,190,000 | | | 74.94 | | | 1,190,000 | | | 2,726 | |
| March 1, 2021 - March 31, 2021 | | 1,900,000 | | | 76.34 | | | 1,900,000 | | | 2,581 | |
| Total | | 3,090,000 | | | $ | 75.80 | | | 3,090,000 | | | |
During the three months ended March 31, 2021, we also purchased shares in connection with our stock-based compensation plans, whereby shares of our common stock were tendered by employees for payment of applicable statutory tax withholdings. We also repurchased a limited number of shares from employees at the repurchase date market price. Combined, forwithholdings. For the three months ended September 30, 2017,March 31, 2021, such repurchases totaled 204,4320.2 million shares at an aggregate cost of $13$18 million.
Item 6. Exhibits.
| | | | | | | | |
| Cognizant | 34 | March 31, 2021 Form 10-Q |
EXHIBIT INDEX
| | | | | | | | | | | | | | | | | | | | | | | | | | | | | | | | | | | | | | |
| | | | | Incorporated by Reference | | |
| Number | | Exhibit Description | | Form | | File No. | | Exhibit | | Date | | Filed or Furnished Herewith |
| 3.1 | | | | 8-K | | 000-24429 | | 3.1 | | | 6/7/2018 | | |
| 3.2 | | | | 8-K | | 000-24429 | | 3.1 | | | 9/20/2018 | | |
| 31.1 | | | | | | | | | | | | Filed |
| 31.2 | | | | | | | | | | | | Filed |
| 32.1 | | | | | | | | | | | | Furnished |
| 32.2 | | | | | | | | | | | | Furnished |
| 101.INS | | Inline XBRL Instance Document - the instance document does not appear in the Interactive Data File because its XBRL tags are embedded within the Inline XBRL document. | | | | | | | | | | Filed |
| 101.SCH | | Inline XBRL Taxonomy Extension Schema Document | | | | | | | | | | Filed |
| 101.CAL | | Inline XBRL Taxonomy Extension Calculation Linkbase Document | | | | | | | | | | Filed |
| 101.DEF | | Inline XBRL Taxonomy Extension Definition Linkbase Document | | | | | | | | | | Filed |
| 101.LAB | | Inline XBRL Taxonomy Extension Label Linkbase Document | | | | | | | | | | Filed |
| 101.PRE | | Inline XBRL Taxonomy Extension Presentation Linkbase Document | | | | | | | | | | Filed |
| 104 | | Cover Page Interactive Data File (formatted as Inline XBRL and contained in Exhibit 101) | | | | | | | | | | Filed |
| | | | | | | | |
| Cognizant | 35 | March 31, 2021 Form 10-Q |
|
| | | | | | | | | | | | | |
| | | | | Incorporated by Reference | | |
| Number | | Exhibit Description | | Form | | File No. | | Exhibit | | Date | | Filed or Furnished Herewith |
| 3.1 | | | | 8-K | | 000-24429 | | 3.2 |
| | 9/17/2013 | | |
| 3.2 | | | | 8-K | | 000-24429 | | 3.1 |
| | 3/31/2017 | | |
| 31.1 | | | | | | | | | | | | Filed |
| 31.2 | | | | | | | | | | | | Filed |
| 32.1 | | | | | | | | | | | | Furnished |
| 32.2 | | | | | | | | | | | | Furnished |
| 101.INS | | XBRL Instance Document | | | | | | | | | | Filed |
| 101.SCH | | XBRL Taxonomy Extension Schema Document | | | | | | | | | | Filed |
| 101.CAL | | XBRL Taxonomy Extension Calculation Linkbase Document | | | | | | | | | | Filed |
| 101.DEF | | XBRL Taxonomy Extension Definition Linkbase Document | | | | | | | | | | Filed |
| 101.LAB | | XBRL Taxonomy Extension Label Linkbase Document | | | | | | | | | | Filed |
| 101.PRE | | XBRL Taxonomy Extension Presentation Linkbase Document | | | | | | | | | | Filed |
SIGNATURES
Pursuant to the requirements of the Securities Exchange Act of 1934, the Registrant has duly caused this report to be signed on its behalf by the undersigned thereunto duly authorized.
| | | | | | | | | | | | | | | | | | | | |
| | | Cognizant Technology Solutions Corporation |
| | | | |
| Date: | May 5, 2021 | | | By: | | /s/ BRIAN HUMPHRIES |
| | | | | | Brian Humphries, |
| | | | | | Chief Executive Officer |
| | | | | | (Principal Executive Officer) |
| | | | | | | | | | | | | | | | | | | | |
| | | | | | |
| Date: | May 5, 2021 | | Cognizant Technology Solutions Corporation | By: | | /s/ JAN SIEGMUND |
| | | | | | Jan Siegmund, |
Date: | November 1, 2017 | | | By: | | /s/ Francisco D’SouzaChief Financial Officer |
| | | | | | Francisco D’Souza, |
| | | | | | Chief Executive Officer |
| | | | | | (Principal ExecutiveFinancial Officer) |
|
| | | | | | | |
| Cognizant | 36 | | | | | |
Date: | November 1, 2017 | | | By: | | /s/ Karen McLoughlin |
| | | | | | Karen McLoughlin, |
| | | | | | Chief Financial Officer |
| | | | | | (Principal Financial Officer)March 31, 2021 Form 10-Q |