UNITED STATES
SECURITIES AND EXCHANGE COMMISSION
Washington, D.C. 20549
FORM 10-Q
|
| | | |
☒ý | Quarterly Report pursuant to Section 13 or 15(d) of the Securities Exchange Act of 1934 |
| | For the quarterly period ended March 31,June 30, 2018 |
☐¨ | Transition Report pursuant to Section 13 or 15(d) of the Securities Exchange Act of 1934 |
| | For the transition period from to |
Commission File Number 0-24429
COGNIZANT TECHNOLOGY SOLUTIONS CORPORATION
(Exact Name of Registrant as Specified in Its Charter)
|
| | |
| Delaware | | 13-3728359 |
(State or Other Jurisdiction of Incorporation or Organization) | | (I.R.S. Employer Identification No.) |
| | |
Glenpointe Centre West 500 Frank W. Burr Blvd. Teaneck, New Jersey | | 07666 |
| (Address of Principal Executive Offices) | | (Zip Code) |
Registrant’s telephone number, including area code: (201) 801-0233
Indicate by check mark whether the registrant: (1) has filed all reports required to be filed by Section 13 or 15(d) of the Securities Exchange Act of 1934 during the preceding 12 months (or for such shorter period that the registrant was required to file such reports), and (2) has been subject to such filing requirements for the past 90 days. Yes ☒ý No: ☐¨
Indicate by check mark whether the registrant has submitted electronically and posted on its corporate Website, if any, every Interactive Data File required to be submitted and posted pursuant to Rule 405 of Regulation S-T (§232.405 of this chapter) during the preceding 12 months (or for such shorter period that the registrant was required to submit and post such files). Yes ☒ý No: ☐¨
Indicate by check mark whether the registrant is a large accelerated filer, an accelerated filer, a non-accelerated filer or a smaller reporting company, or an emerging growth company. See the definitions of “large accelerated filer,” “accelerated filer”, “smaller reporting company,” and "emerging growth company" in Rule 12b-2 of the Exchange Act. (Check one):
|
| | | |
| Large accelerated filer | ☒ý | Accelerated filer | ☐¨ |
| | | | |
| Non-accelerated filer | ☐¨ (Do not check if a smaller reporting company) | Smaller reporting company | ☐¨ |
| | | | |
| | | Emerging growth company | ☐¨ |
If an emerging growth company, indicate by check mark if the registrant has elected not to use the extended transition period for complying with any new or revised financial accounting standards provided pursuant to Section 13(a) of the Exchange Act. ☐¨
Indicate by check mark whether the registrant is a shell company (as defined in Rule 12b-2 of the Exchange Act). Yes ☐¨ No ☒ý
Indicate the number of shares outstanding of each of the issuer’s class of common stock, as of April 30,July 27, 2018:
|
| | |
| Class | | Number of Shares |
| Class A Common Stock, par value $.01 per share | | 585,898,903580,233,834 |
COGNIZANT TECHNOLOGY SOLUTIONS CORPORATION
TABLE OF CONTENTS
|
| | |
| | | Page |
| PART I. | | |
| | | |
| Item 1. | | |
| | | |
| | | |
| | | |
| | | |
| | | |
| | | |
| | | |
| | | |
| | | |
| | | |
| | | |
| | | |
| | | |
| Item 2. | | |
| | | |
| Item 3. | | |
| | | |
| Item 4. | | |
| | | |
| PART II. | | |
| | | |
| Item 1. | | |
| | | |
| Item 1A. | | |
| | | |
| Item 2. | | |
| | | |
| Item 6. | | |
| | |
| |
PART I. FINANCIAL INFORMATION
Item 1. Consolidated Financial Statements (Unaudited).
COGNIZANT TECHNOLOGY SOLUTIONS CORPORATION
CONSOLIDATED STATEMENTS OF FINANCIAL POSITION
(Unaudited)
(in millions, except par values)
| | | | March 31,
2018 |
| December 31,
2017 | June 30,
2018 |
| December 31,
2017 |
| Assets |
|
|
|
|
|
|
| Current assets: |
|
|
|
|
|
|
| Cash and cash equivalents | $ | 1,440 |
|
| $ | 1,925 |
| $ | 901 |
|
| $ | 1,925 |
|
| Short-term investments | 3,390 |
|
| 3,131 |
| 3,346 |
|
| 3,131 |
|
| Trade accounts receivable, net of allowances of $66 and $65, respectively | 3,145 |
|
| 2,865 |
| |
| Trade accounts receivable, net of allowances of $68 and $65, respectively | | 3,204 |
|
| 2,865 |
|
| Unbilled accounts receivable | — |
|
| 357 |
| — |
|
| 357 |
|
| Restricted cash | 159 |
| | — |
| |
| Other current assets | 856 |
|
| 833 |
| 852 |
|
| 833 |
|
| Total current assets | 8,990 |
|
| 9,111 |
| 8,303 |
|
| 9,111 |
|
| Property and equipment, net | 1,333 |
|
| 1,324 |
| 1,345 |
|
| 1,324 |
|
| Goodwill | 2,713 |
|
| 2,704 |
| 3,036 |
|
| 2,704 |
|
| Intangible assets, net | 955 |
|
| 981 |
| 1,060 |
|
| 981 |
|
| Deferred income tax assets, net | 394 |
|
| 418 |
| 367 |
|
| 418 |
|
| Long-term investments | 83 |
| | 235 |
| 80 |
| | 235 |
|
| Other noncurrent assets | 577 |
|
| 448 |
| 615 |
|
| 448 |
|
| Total assets | $ | 15,045 |
|
| $ | 15,221 |
| $ | 14,806 |
|
| $ | 15,221 |
|
| Liabilities and Stockholders’ Equity |
|
|
|
|
|
|
| Current liabilities: |
|
|
|
|
|
|
| Accounts payable | $ | 293 |
|
| $ | 210 |
| $ | 217 |
|
| $ | 210 |
|
| Deferred revenue | 360 |
|
| 383 |
| 308 |
|
| 383 |
|
| Short-term debt | 100 |
|
| 175 |
| 100 |
|
| 175 |
|
| Accrued expenses and other current liabilities | 1,716 |
|
| 2,071 |
| 1,912 |
|
| 2,071 |
|
| Total current liabilities | 2,469 |
|
| 2,839 |
| 2,537 |
|
| 2,839 |
|
| Deferred revenue, noncurrent | 70 |
|
| 104 |
| 77 |
|
| 104 |
|
| Deferred income tax liabilities, net | 113 |
|
| 146 |
| 145 |
|
| 146 |
|
| Long-term debt | 673 |
|
| 698 |
| 649 |
|
| 698 |
|
| Long-term income taxes payable | 533 |
| | 584 |
| 508 |
| | 584 |
|
| Other noncurrent liabilities | 199 |
|
| 181 |
| 242 |
|
| 181 |
|
| Total liabilities | 4,057 |
|
| 4,552 |
| 4,158 |
|
| 4,552 |
|
Commitments and contingencies (See Note 11) |
| |
| |
Commitments and contingencies (See Note 13) | |
| |
|
| Stockholders’ equity: | | | | | | |
| Preferred stock, $0.10 par value, 15.0 shares authorized, none issued | — |
| | — |
| — |
| | — |
|
| Class A common stock, $0.01 par value, 1,000 shares authorized, 586 and 588 shares issued and outstanding at March 31, 2018 and December 31, 2017, respectively | 6 |
| | 6 |
| |
| Class A common stock, $0.01 par value, 1,000 shares authorized, 580 and 588 shares issued and outstanding at June 30, 2018 and December 31, 2017, respectively | | 6 |
| | 6 |
|
| Additional paid-in capital | 63 |
| | 49 |
| 55 |
| | 49 |
|
| Retained earnings | 10,856 |
| | 10,544 |
| 10,681 |
| | 10,544 |
|
| Accumulated other comprehensive income (loss) | 63 |
| | 70 |
| (94 | ) | | 70 |
|
| Total stockholders’ equity | 10,988 |
|
| 10,669 |
| 10,648 |
|
| 10,669 |
|
| Total liabilities and stockholders’ equity | $ | 15,045 |
|
| $ | 15,221 |
| $ | 14,806 |
|
| $ | 15,221 |
|
The accompanying notes are an integral part of the unaudited consolidated financial statements.
COGNIZANT TECHNOLOGY SOLUTIONS CORPORATION
CONSOLIDATED STATEMENTS OF OPERATIONS
(Unaudited)
(in millions, except per share data)
| | | | Three Months Ended
March 31, | Three Months Ended
June 30, | | Six Months Ended
June 30, |
| | 2018 | | 2017 | 2018 | | 2017 | | 2018 | | 2017 |
| Revenues | $ | 3,912 |
|
| $ | 3,546 |
| $ | 4,006 |
|
| $ | 3,670 |
|
| $ | 7,918 |
|
| $ | 7,216 |
|
| Operating expenses: |
|
|
|
|
|
|
|
|
|
|
| Cost of revenues (exclusive of depreciation and amortization expense shown separately below) | 2,401 |
|
| 2,194 |
| 2,417 |
|
| 2,261 |
|
| 4,818 |
|
| 4,455 |
|
| Selling, general and administrative expenses | 711 |
|
| 686 |
| 805 |
|
| 709 |
|
| 1,516 |
|
| 1,395 |
|
| Depreciation and amortization expense | 107 |
|
| 96 |
| 114 |
|
| 94 |
|
| 221 |
|
| 190 |
|
| Income from operations | 693 |
|
| 570 |
| 670 |
|
| 606 |
|
| 1,363 |
|
| 1,176 |
|
| Other income (expense), net: |
|
|
|
|
|
|
|
|
|
|
| Interest income | 41 |
|
| 32 |
| 40 |
|
| 31 |
|
| 81 |
|
| 63 |
|
| Interest expense | (6 | ) |
| (6 | ) | (7 | ) |
| (6 | ) |
| (13 | ) |
| (12 | ) |
| Foreign currency exchange gains (losses), net | (31 | ) |
| 52 |
| (80 | ) |
| 5 |
|
| (111 | ) |
| 57 |
|
| Other, net | — |
|
| 1 |
| — |
|
| (1 | ) |
| — |
|
| — |
|
| Total other income (expense), net | 4 |
|
| 79 |
| (47 | ) |
| 29 |
|
| (43 | ) |
| 108 |
|
| Income before provision for income taxes | 697 |
|
| 649 |
| 623 |
|
| 635 |
|
| 1,320 |
|
| 1,284 |
|
| Provision for income taxes | (177 | ) |
| (92 | ) | (168 | ) |
| (165 | ) |
| (345 | ) |
| (257 | ) |
| Income from equity method investments | — |
| | — |
| 1 |
| | — |
| | 1 |
| | — |
|
| Net income | $ | 520 |
|
| $ | 557 |
| $ | 456 |
|
| $ | 470 |
|
| $ | 976 |
|
| $ | 1,027 |
|
| Basic earnings per share | $ | 0.89 |
|
| $ | 0.92 |
| $ | 0.78 |
|
| $ | 0.80 |
|
| $ | 1.67 |
|
| $ | 1.72 |
|
| Diluted earnings per share | $ | 0.88 |
|
| $ | 0.92 |
| $ | 0.78 |
|
| $ | 0.80 |
|
| $ | 1.66 |
|
| $ | 1.71 |
|
| Weighted average number of common shares outstanding - Basic | 587 |
|
| 605 |
| 585 |
|
| 589 |
|
| 586 |
|
| 597 |
|
| Dilutive effect of shares issuable under stock-based compensation plans | 2 |
| | 2 |
| 1 |
| | 2 |
| | 1 |
| | 2 |
|
| Weighted average number of common shares outstanding - Diluted | 589 |
|
| 607 |
| 586 |
|
| 591 |
|
| 587 |
|
| 599 |
|
| Dividends declared per common share | $ | 0.20 |
| | $ | — |
| $ | 0.20 |
| | $ | 0.15 |
| | $ | 0.40 |
| | $ | 0.15 |
|
The accompanying notes are an integral part of the unaudited consolidated financial statements.
COGNIZANT TECHNOLOGY SOLUTIONS CORPORATION
CONSOLIDATED STATEMENTS OF COMPREHENSIVE INCOME
(Unaudited)
(in millions)
| | | | Three Months Ended
March 31, | Three Months Ended
June 30, | | Six Months Ended
June 30, |
| | 2018 | | 2017 | 2018 | | 2017 | | 2018 | | 2017 |
| Net income | $ | 520 |
| | $ | 557 |
| $ | 456 |
| | $ | 470 |
| | $ | 976 |
| | $ | 1,027 |
|
| Other comprehensive income (loss), net of tax: | | | | | | | | | | |
| Foreign currency translation adjustments | 37 |
| | 17 |
| (71 | ) | | 50 |
| | (34 | ) | | 67 |
|
| Change in unrealized gains and losses on cash flow hedges, net of taxes | (36 | ) | | 79 |
| (87 | ) | | (1 | ) | | (123 | ) | | 78 |
|
| Change in unrealized gains and losses on available-for-sale securities, net of taxes | (7 | ) | | 1 |
| 1 |
| | 1 |
| | (6 | ) | | 2 |
|
| Other comprehensive income (loss) | (6 | ) | | 97 |
| (157 | ) | | 50 |
| | (163 | ) | | 147 |
|
| Comprehensive income | $ | 514 |
| | $ | 654 |
| $ | 299 |
| | $ | 520 |
| | $ | 813 |
| | $ | 1,174 |
|
The accompanying notes are an integral part of the unaudited consolidated financial statements.
COGNIZANT TECHNOLOGY SOLUTIONS CORPORATION
CONSOLIDATED STATEMENTS OF STOCKHOLDERS’ EQUITY
(Unaudited)
(in millions)
| | | | | Class A Common Stock | | Additional Paid-in Capital | | Retained Earnings | | Accumulated Other Comprehensive Income (Loss) | | Total | | Class A Common Stock | | Additional Paid-in Capital | | Retained Earnings | | Accumulated Other Comprehensive Income (Loss) | | Total |
| | Shares | | Amount | | | Shares | | Amount | |
| Balance, December 31, 2017 | | 588 |
| | $ | 6 |
| | $ | 49 |
| | $ | 10,544 |
| | $ | 70 |
| | $ | 10,669 |
| | 588 |
| | $ | 6 |
| | $ | 49 |
| | $ | 10,544 |
| | $ | 70 |
| | $ | 10,669 |
|
Cumulative effect of changes in accounting principle(1) | | — |
| | — |
| | — |
| | 122 |
| | (1 | ) | | 121 |
| | — |
| | — |
| | — |
| | 122 |
| | (1 | ) | | 121 |
|
| Net income | | — |
| | — |
| | — |
| | 520 |
| | — |
| | 520 |
| | — |
| | — |
| | — |
| | 976 |
| | — |
| | 976 |
|
| Other comprehensive income (loss) | | — |
| | — |
| | — |
| | — |
| | (6 | ) | | (6 | ) | | — |
| | — |
| | — |
| | — |
| | (163 | ) | | (163 | ) |
| Common stock issued, stock-based compensation plans | | 2 |
| | — |
| | 60 |
| | — |
| | — |
| | 60 |
| | 4 |
| | — |
| | 102 |
| | — |
| | — |
| | 102 |
|
| Stock-based compensation expense | | — |
| | — |
| | 59 |
| | — |
| | — |
| | 59 |
| | — |
| | — |
| | 130 |
| | — |
| | — |
| | 130 |
|
| Repurchases of common stock | | (4 | ) | | — |
| | (105 | ) | | (211 | ) | | — |
| | (316 | ) | | (12 | ) | | — |
| | (226 | ) | | (723 | ) | | — |
| | (949 | ) |
| Dividends | | — |
| | — |
| | — |
| | (119 | ) | | — |
| | (119 | ) | | — |
| | — |
| | — |
| | (238 | ) | | — |
| | (238 | ) |
| Balance, March 31, 2018 | | 586 |
| | $ | 6 |
| | $ | 63 |
| | $ | 10,856 |
| | $ | 63 |
| | $ | 10,988 |
| |
| Balance, June 30, 2018 | | | 580 |
| | $ | 6 |
| | $ | 55 |
| | $ | 10,681 |
| | $ | (94 | ) | | $ | 10,648 |
|
| | | | | | | | | | | | | | | | | | | | | | | | | |
| | | Class A Common Stock | | Additional Paid-in Capital | | Retained Earnings | | Accumulated Other Comprehensive Income (Loss) | | Total | | Class A Common Stock | | Additional Paid-in Capital | | Retained Earnings | | Accumulated Other Comprehensive Income (Loss) | | Total |
| | Shares | | Amount | | | Shares | | Amount | |
| Balance, December 31, 2016 | | 608 |
| | $ | 6 |
| | $ | 358 |
| | $ | 10,478 |
| | $ | (114 | ) | | $ | 10,728 |
| | 608 |
| | $ | 6 |
| | $ | 358 |
| | $ | 10,478 |
| | $ | (114 | ) | | $ | 10,728 |
|
| Net income | | — |
| | — |
| | — |
| | 557 |
| | — |
| | 557 |
| | — |
| | — |
| | — |
| | 1,027 |
| | — |
| | 1,027 |
|
| Other comprehensive income (loss) | | — |
| | — |
| | — |
| | — |
| | 97 |
| | 97 |
| | — |
| | — |
| | — |
| | — |
| | 147 |
| | 147 |
|
| Common stock issued, stock-based compensation plans | | 3 |
| | — |
| | 61 |
| | — |
| | — |
| | 61 |
| | 4 |
| | — |
| | 105 |
| | — |
| | — |
| | 105 |
|
| Stock-based compensation expense | | — |
| | — |
| | 54 |
| | — |
| | — |
| | 54 |
| | — |
| | — |
| | 109 |
| | — |
| | — |
| | 109 |
|
| Repurchases of common stock | | (22 | ) | | — |
| | (414 | ) | | (1,100 | ) | | — |
| | (1,514 | ) | | (22 | ) | | — |
| | (444 | ) | | (1,100 | ) | | — |
| | (1,544 | ) |
| Balance, March 31, 2017 | | 589 |
| | $ | 6 |
| | $ | 59 |
| | $ | 9,935 |
| | $ | (17 | ) | | $ | 9,983 |
| |
| Dividends | | | — |
| | — |
| | — |
| | (89 | ) | | — |
| | (89 | ) |
| Balance, June 30, 2017 | | | 590 |
| | $ | 6 |
| | $ | 128 |
| | $ | 10,316 |
| | $ | 33 |
| | $ | 10,483 |
|
| |
| (1) | Reflects the adoption of accounting standards as described in Note 1. |
The accompanying notes are an integral part of the unaudited consolidated financial statements.
COGNIZANT TECHNOLOGY SOLUTIONS CORPORATION
CONSOLIDATED STATEMENTS OF CASH FLOWS
(Unaudited)
(in millions)
| | | | For the Three Months Ended
March 31, | For the Six Months Ended
June 30, |
| | 2018 | | 2017 | 2018 | | 2017 |
| Cash flows from operating activities: | | | | | | |
| Net income | $ | 520 |
| | $ | 557 |
| $ | 976 |
| | $ | 1,027 |
|
| Adjustments to reconcile net income to net cash provided by operating activities: | | | | | | |
| Depreciation and amortization | 117 |
| | 104 |
| 240 |
| | 207 |
|
| Provision for doubtful accounts | 2 |
| | 9 |
| 4 |
| | 17 |
|
| Deferred income taxes | 2 |
| | 9 |
| 51 |
| | 8 |
|
| Stock-based compensation expense | 59 |
| | 54 |
| 130 |
| | 109 |
|
| Other | 23 |
| | (55 | ) | 100 |
| | (63 | ) |
| Changes in assets and liabilities: | | | | | | |
| Trade accounts receivable | (273 | ) | | (86 | ) | (330 | ) | | (103 | ) |
| Other current assets | 352 |
| | 20 |
| 296 |
| | (81 | ) |
| Other noncurrent assets | (105 | ) | | (31 | ) | (159 | ) | | (46 | ) |
| Accounts payable | 86 |
| | 13 |
| (3 | ) | | 2 |
|
| Deferred revenues, current and noncurrent | (2 | ) | | 67 |
| (47 | ) | | 10 |
|
| Other current and noncurrent liabilities | (393 | ) | | (384 | ) | (230 | ) | | (289 | ) |
| Net cash provided by operating activities | 388 |
| | 277 |
| 1,028 |
| | 798 |
|
| Cash flows from investing activities: | | | | | | |
| Purchases of property and equipment | (96 | ) | | (66 | ) | (187 | ) | | (126 | ) |
| Purchases of available-for-sale investment securities | (300 | ) | | (1,176 | ) | (806 | ) | | (1,622 | ) |
| Proceeds from maturity or sale of available-for-sale investment securities | 193 |
| | 1,488 |
| 906 |
| | 1,936 |
|
| Purchases of held-to-maturity investment securities | (222 | ) | | (349 | ) | (519 | ) | | (662 | ) |
| Proceeds from maturity of held-to-maturity investment securities | 171 |
| | 15 |
| 386 |
| | 50 |
|
| Purchases of other investments | (31 | ) | | (59 | ) | (318 | ) | | (213 | ) |
| Proceeds from maturity or sale of other investments | 59 |
| | 244 |
| 205 |
| | 345 |
|
| Payments for business combinations, net of cash acquired | (1 | ) | | (6 | ) | (478 | ) | | (6 | ) |
| Net cash (used in) provided by investing activities | (227 | ) | | 91 |
| |
| Net cash (used in) investing activities | | (811 | ) | | (298 | ) |
| Cash flows from financing activities: | | | | | | |
| Issuance of common stock under stock-based compensation plans | 60 |
| | 61 |
| 102 |
| | 104 |
|
| Repurchases of common stock | (316 | ) | | (1,514 | ) | (949 | ) | | (1,544 | ) |
| Repayment of term loan borrowings and capital lease obligations | (39 | ) | | (21 | ) | (64 | ) | | (42 | ) |
| Net change in notes outstanding under the revolving credit facility | (75 | ) | | 350 |
| (75 | ) | | 150 |
|
| Dividends paid | (118 | ) | | — |
| (236 | ) | | (89 | ) |
| Net cash (used in) financing activities | (488 | ) | | (1,124 | ) | (1,222 | ) | | (1,421 | ) |
| Effect of exchange rate changes on cash, cash equivalents and restricted cash | 1 |
| | 30 |
| |
| (Decrease) in cash, cash equivalents and restricted cash | (326 | ) | | (726 | ) | |
| Effect of exchange rate changes on cash and cash equivalents | | (19 | ) | | 44 |
|
| (Decrease) in cash and cash equivalents | | (1,024 | ) | | (877 | ) |
| Cash and cash equivalents, beginning of year | 1,925 |
| | 2,034 |
| 1,925 |
| | 2,034 |
|
| Cash, cash equivalents and restricted cash, end of period | $ | 1,599 |
| | $ | 1,308 |
| |
| Cash and cash equivalents, end of period | | $ | 901 |
| | $ | 1,157 |
|
The accompanying notes are an integral part of the unaudited consolidated financial statements.
COGNIZANT TECHNOLOGY SOLUTIONS CORPORATION
NOTES TO CONSOLIDATED FINANCIAL STATEMENTS
(Unaudited)
|
| | | | |
| Note 1 — Interim Consolidated Financial Statements |
The terms “Cognizant,” “we,” “our,” “us” and “the Company” refer to Cognizant Technology Solutions Corporation and its subsidiaries unless the context indicates otherwise. We have prepared the accompanying unaudited consolidated financial statements included herein in accordance with generally accepted accounting principles in the United States of America, or U.S. GAAP, and Regulation S-X under the Securities Exchange Act of 1934, as amended, or the Exchange Act. The accompanying unaudited consolidated financial statements should be read in conjunction with our audited consolidated financial statements (and notes thereto) included in our Annual Report on Form 10-K for the year ended December 31, 2017. In our opinion, all adjustments considered necessary for a fair statement of the accompanying unaudited consolidated financial statements have been included and all adjustments are of a normal and recurring nature. Operating results for the interim periods are not necessarily indicative of results that may be expected to occur for the entire year.
Recently Adopted Accounting Pronouncements
|
| | | |
| Date Issued and Topic | Date Adopted and Method | Description | Impact |
May 2014
Revenue | January 1, 2018
Modified Retrospective | The new standard, as amended, sets forth a single comprehensive model for recognizing and reporting revenues. The standard also requires additional financial statement disclosures that enable users to understand the nature, amount, timing and uncertainty of revenues and cash flows relating to customer contracts. The standard allows for two methods of adoption: the full retrospective adoption, which requires the standard to be applied to each prior period presented, or the modified retrospective adoption, which requires the cumulative effect of adoption to be recognized as an adjustment to opening retained earnings in the period of adoption. | See Note 3 for the impact of adoption of this standard. |
November 2016
Statement of Cash Flows | January 1, 2018
Retrospective
| This update requires restricted cash to be included with cash and cash equivalents when reconciling the beginning and ending amounts on the statement of cash flows. It also requires a reconciliation of such totals to the amounts on the statement of financial position and disclosure as to the nature of the restrictions.
| As of March 31, 2018, we had a restricted cash balance of $159 million. There were no restricted cash balances in prior periods. Accordingly, theas of June 30, 2018. The adoption of this update resulted in an increase to the ending cash, cash equivalents and restricted cash balance presentedhad no impact on our unaudited consolidated statement of cash flowsfinancial statements for the three and six months ended March 31,June 30, 2018. |
February 2018
Income Statement - Reporting Comprehensive Income | January 1, 2018
In the period of adoption | This update provides an option for entities to reclassify stranded tax effects caused by the newly-enacted Tax Cuts and Jobs Act, or Tax Reform Act, from accumulated other comprehensive income to retained earnings. | We have early adopted this update as of January 1, 2018. The adoption resulted in a decrease of $1 million in accumulated other comprehensive income and a corresponding increase of $1 million to opening retained earnings. |
New Accounting Pronouncements
|
| | | |
| Date Issued and Topic | Effective Date | Description | Impact |
February 2016
Leases
| January 1, 2019 | The new standard replaces the existing guidance on leases and requires the lessee to recognize a right-of-use asset and a lease liability for all leases with lease terms equal to or greater than twelve months. For finance leases, the lessee would recognize interest expense and amortization of the right-of-use asset, and for operating leases, the lessee would recognize total lease expense on a straight-line basis. The standard offers several practical expedients for transition and certain expedients specific to lessees or lessors. The standard allows for two methods of adoption: retrospective to each prior reporting period presented with the cumulative effect of adoption recognized at the beginning of the earliest period presented or retrospective to the beginning of the period of adoption through a cumulative-effect adjustment. | While we are incontinuing to evaluate the processprovisions of being finalized bythis standard, the Financial Accounting Standards Board. | primary effect will be to require recording of right-of-use assets and corresponding lease obligations for current operating leases. We expect the requirement to recognize a right-of-use asset and a lease liability for operating leasesadoption of this standard to have a material impact on the presentationour consolidated statement of ourfinancial position, but not on the consolidated statements of financial position.operations or cash flows. As of December 31, 2017, our undiscounted operating lease commitments were $943 million.We are currently planning to elect the package of practical expedients which permits us to not reassess prior conclusions related to contracts containing leases, lease classification and initial direct costs. We are also evaluating other available practical expedients. We intend to adopt the standard retrospectively to the beginning of the period of adoption through a cumulative-effect adjustment. |
March 2017
Nonrefundable Fees and Other Costs | January 1, 2019 | This update shortens the amortization period for certain callable debt securities held at a premium to the earliest call date. The amendments do not require an accounting change for securities held at a discount. Upon adoption, entities will be required to use a modified retrospective transition with the cumulative effect adjustment recognized to retained earnings as of the beginning of the period of adoption. | We are currently evaluating the effect the amendments will have on our consolidated financial statements and related disclosures. |
|
| | | | |
| Note 2 — Internal Investigation and Related Matters |
We are conducting an internal investigation focused on whether certain payments relating to Company-owned facilities in India were made improperly and in possible violation of the U.S. Foreign Corrupt Practices Act, or FCPA, and other applicable laws. The investigation is also examining various other payments made in small amounts in India that may not have complied with Company policy or applicable law. In September 2016, we voluntarily notified the U.S. Department of Justice, or DOJ, and Securities and Exchange Commission, or SEC, and are cooperating fully with both agencies. The investigation is being conducted under the oversight of the Audit Committee, with the assistance of outside counsel. To date, the investigation has identified a total of approximately $6 million in payments made between 2009 and 2016 that may have been improper. During the year ended December 31, 2016, we recorded out-of-period corrections related to $4 million of such payments that had been previously capitalized that should have been expensed. These out-of-period corrections and the other $2 million in potentially improper payments were not material to any previously issued financial statements. There were no adjustments recorded during 2018 and 2017 related to the amounts under investigation.
Adoption of ASC Topic 606, “Revenue from Contracts with Customers”
On January 1, 2018, we adopted ASC Topic 606, “Revenue from Contracts with Customers,” or the New Revenue Standard, using the modified retrospective method applied to contracts that were not completed as of January 1, 2018. Results for reporting periods beginning after January 1, 2018 are presented under the New Revenue Standard, while prior period amounts are not adjusted and continue to be reported in accordance with our historic accounting policies. For contracts that were modified before the effective date, the Company aggregated the effect of all contract modifications prior to identifying performance obligations and allocating transaction price in accordance with the practical expedient ASC 606-10-65-1-(f)-4. Upon adoption of the New Revenue Standard on January 1, 2018, we recorded a net increase to opening retained earnings of approximately $121 million, after a tax impact of $37 million. The impact of adoption primarily relates to (1) changes in the method used to measure progress on our fixed-price application maintenance, consulting and business process services contracts, (2) the longer period of amortization for costs to fulfill a contract, (3) the timing of revenue recognition and allocation of purchase price on our software license contracts, (4) the reclassification of balances representing receivables, as defined by the New Revenue Standard, from Unbilled accounts receivable to Trade accounts receivable, net, (5) the reclassification of balances representing contract assets, as defined by the New Revenue Standard, from Unbilled accounts receivable to Other current assets, as well as (6) the income tax impact of the above items, as applicable.
The following tables compare the financial statement line items materially affected by the adoption of the New Revenue Standard as of and for the three and six months ended March 31,June 30, 2018 to the pro-forma amounts had the previous guidance been in effect, or Pro-forma Amounts:
| | | | | March 31, 2018 | | June 30, 2018 |
| | | As Reported | | Pro-forma Amounts | | Impacts of the New Revenue Standard | | As Reported | | Pro-forma Amounts | | Impacts of the New Revenue Standard |
| | | (in millions) | | (in millions) |
| Assets: | | | | | | | | | | | | |
Trade accounts receivable, net(1), (2) | | $ | 3,145 |
| | $ | 3,015 |
| | $ | 130 |
| | $ | 3,204 |
| | $ | 3,082 |
| | $ | 122 |
|
Unbilled accounts receivable(1), (3) | | — |
| | 412 |
| | (412 | ) | | — |
| | 416 |
| | (416 | ) |
Other current assets(2), (3) | | 856 |
| | 549 |
| | 307 |
| | 852 |
| | 534 |
| | 318 |
|
| Total current assets | | | | | | 25 |
| | | | | | 24 |
|
Other noncurrent assets(4) | | 577 |
| | 533 |
| | 44 |
| | 615 |
| | 565 |
| | 50 |
|
| Total assets | | | | | | $ | 69 |
| | | | | | $ | 74 |
|
| Liabilities: | | | | | | | | | | | | |
Deferred revenue(2) | | $ | 360 |
| | $ | 471 |
| | $ | (111 | ) | | $ | 308 |
| | $ | 451 |
| | $ | (143 | ) |
| Total current liabilities | | | | | | (111 | ) | | | | | | (143 | ) |
Deferred revenue, noncurrent(2) | | 70 |
| | 79 |
| | (9 | ) | | 77 |
| | 86 |
| | (9 | ) |
Deferred income tax liabilities, net(5) | | 113 |
| | 70 |
| | 43 |
| | 145 |
| | 95 |
| | 50 |
|
| Total liabilities | | | | | | (77 | ) | | | | | | (102 | ) |
| Stockholders’ equity: | | | | | | | | | | | | |
| Retained earnings | | 10,856 |
| | 10,712 |
| | 144 |
| | 10,681 |
| | 10,505 |
| | 176 |
|
Accumulated other comprehensive income (loss)(6) | | 63 |
| | 61 |
| | 2 |
| |
| Total stockholders’ equity | | | | | | 146 |
| | | | | | 176 |
|
| Total liabilities and stockholders’ equity | | | | | | $ | 69 |
| | | | | | $ | 74 |
|
| | | | | Three Months Ended March 31, 2018 | | Three Months Ended June 30, 2018 | | Six Months Ended June 30, 2018 |
| | | As Reported | | Pro-forma Amounts | | Impacts of the New Revenue Standard | | As Reported | | Pro-forma Amounts | | Impacts of the New Revenue Standard | | As Reported | | Pro-forma Amounts | | Impacts of the New Revenue Standard |
| | | (in millions) | | (in millions) | | (in millions) |
Revenues(2) | | $ | 3,912 |
| | $ | 3,891 |
| | $ | 21 |
| | $ | 4,006 |
| | $ | 3,975 |
| | $ | 31 |
| | $ | 7,918 |
| | $ | 7,866 |
| | $ | 52 |
|
Cost of revenues (4) | | 2,401 |
| | 2,409 |
| | (8 | ) | | 2,417 |
| | 2,424 |
| | (7 | ) | | 4,818 |
| | 4,833 |
| | (15 | ) |
| Selling, general and administrative expenses | | 711 |
| | 711 |
| | — |
| | 805 |
| | 805 |
| | — |
| | 1,516 |
| | 1,516 |
| | — |
|
| Depreciation and amortization expense | | 107 |
| | 107 |
| | — |
| | 114 |
| | 114 |
| | — |
| | 221 |
| | 221 |
| | — |
|
| Income from operations | | 693 |
| | 664 |
| | 29 |
| | 670 |
| | 632 |
| | 38 |
| | 1,363 |
| | 1,296 |
| | 67 |
|
| Other income (expense), net | | 4 |
| | 4 |
| | — |
| | (47 | ) | | (47 | ) | | — |
| | (43 | ) | | (43 | ) | | — |
|
Income before provision for income taxes(5) | | 697 |
| | 668 |
| | 29 |
| | 623 |
| | 585 |
| | 38 |
| | 1,320 |
| | 1,253 |
| | 67 |
|
| Provision for income taxes | | (177 | ) | | (171 | ) | | (6 | ) | | (168 | ) | | (161 | ) | | (7 | ) | | (345 | ) | | (332 | ) | | (13 | ) |
| Income (loss) from equity method investment | | | 1 |
| | 1 |
| | — |
| | 1 |
| | 1 |
| | — |
|
| Net income | | $ | 520 |
| | $ | 497 |
| | $ | 23 |
| | $ | 456 |
| | $ | 425 |
| | $ | 31 |
| | $ | 976 |
| | $ | 922 |
| | $ | 54 |
|
| Basic earnings per share | | $ | 0.89 |
| | $ | 0.85 |
| | $ | 0.04 |
| | $ | 0.78 |
| | $ | 0.73 |
| | $ | 0.05 |
| | $ | 1.67 |
| | $ | 1.57 |
| | $ | 0.10 |
|
| Diluted earnings per share | | $ | 0.88 |
| | $ | 0.84 |
| | $ | 0.04 |
| | $ | 0.78 |
| | $ | 0.73 |
| | $ | 0.05 |
| | $ | 1.66 |
| | $ | 1.57 |
| | $ | 0.09 |
|
| |
| (1) | Reflects the reclassification of balances representing receivables, as defined by the New Revenue Standard, from Unbilled accounts receivable to Trade accounts receivable, net. |
| |
| (2) | Reflects the impact of changes in the method used to measure progress on our fixed-price application maintenance, consulting and business process services contracts and the timing of revenue recognition and allocation of purchase price on our software license contracts. |
| |
| (3) | Reflects the reclassification of balances representing contract assets, as defined by the New Revenue Standard, from Unbilled accounts receivable to Other current assets. |
| |
| (4) | Reflects the impact of a longer period of amortization for costs to fulfill a contract. |
| |
| (5) | Reflects the income tax impact of the above items. |
| |
(6) | Reflects the impact of foreign currency translation related to the above impacts. |
Revenue Recognition
We recognize revenues as we transfer control of deliverables (products, solutions and services) to our customers in an amount reflecting the consideration to which we expect to be entitled. To recognize revenues, we apply the following five step approach: (1) identify the contract with a customer, (2) identify the performance obligations in the contract, (3) determine the transaction price, (4) allocate the transaction price to the performance obligations in the contract, and (5) recognize revenues when a performance obligation is satisfied. We account for a contract when it has approval and commitment from all parties, the rights of the parties are identified, payment terms are identified, the contract has commercial substance and collectability of consideration is probable. The Company applies judgment in determining the customer’s ability and intention to pay, which is based on a variety of factors including the customer’s historical payment experience.
We may enter into arrangements that consist of multiple performance obligations. Such arrangements may include any combination of our deliverables. To the extent a contract includes multiple promised deliverables, we apply judgment to determine whether promised deliverables are capable of being distinct and are distinct in the context of the contract. If these criteria are not met, the promised deliverables are accounted for as a combined performance obligation. For arrangements with multiple distinct performance obligations, we allocate consideration among the performance obligations based on their relative standalone selling price. Standalone selling price is the price at which we would sell a promised good or service separately to the customer. When not directly observable, we typically estimate standalone selling price by using the expected cost plus a margin approach. We typically establish a standalone selling price range for our deliverables, which is reassessed on a periodic basis or when facts and circumstances change.
For performance obligations where control is transferred over time, revenues are recognized based on the extent of progress towards completion of the performance obligation. The selection of the method to measure progress towards completion requires judgment and is based on the nature of the deliverables to be provided. Revenues related to fixed-price contracts for application development and systems integration services, consulting or other technology services are recognized as the service is performed using the cost to cost method, under which the total value of revenues is recognized on the basis of the percentage that each contract’s total labor cost to date bears to the total expected labor costs. Revenues related to fixed-price application maintenance, testing and business process services are recognized based on our right to invoice for services performed for contracts in which the invoicing is representative of the value being delivered, in accordance with the practical expedient in ASC 606-10-55-18. If our invoicing is not consistent with value delivered, revenues are recognized as the service is performed based on the cost to cost method described above. The cost to cost method requires estimation of future costs, which is updated as the project progresses to reflect the latest available information; such estimates and changes in estimates involve the use of judgment. The cumulative impact of any revision in estimates is reflected in the financial reporting period in which the change in estimate becomes known and any anticipated losses on contracts are recognized immediately. Revenues related to fixed-price hosting and infrastructure services are recognized based on our right to invoice for services performed for contracts in which the invoicing is representative of the value being delivered, in accordance with the practical expedient in ASC 606-10-55-18. If our invoicing is not consistent with value delivered, revenues are recognized on a straight-line basis unless revenues are earned and obligations are fulfilled in a different pattern. The revenue recognition method applied to the types of contracts described above provides the most faithful depiction of performance towards satisfaction of our performance obligations; for example, the cost to cost method is used when the value of services provided to the customer is best represented by the costs expended to deliver those services.
Revenues related to our non-hosted software license arrangements that do not require significant modification or customization of the underlying software are recognized when the software is delivered as control is transferred at a point in time. For software license arrangements that require significant functionality enhancements or modification of the software, revenues for the software license and related services are recognized as the services are performed in accordance with the methods described above. In software hosting arrangements, the rights provided to the customer, such as ownership of a license, contract termination provisions and the feasibility of the client to operate the software, are considered in determining whether the arrangement includes a license or a service. Sales and usage-based fees promised in exchange for licenses of intellectual property are not recognized as revenue until the uncertainty related to the variable amounts is resolved. Revenues related to software maintenance and support are generally recognized on a straight-line basis over the contract period.
Revenues related to our time-and-materials, transaction-based or volume-based contracts are recognized over the period the services are provided in a manner that corresponds with the value transferred to the customer to-date relative to the remaining services to be provided.
Revenues also include the reimbursement of out-of-pocket expenses. Our warranties generally provide a customer with assurance that the related deliverable will function as the parties intended because it complies with agreed-upon specifications and is therefore not considered an additional performance obligation in the contract.
From time to time, we may enter into arrangements with third party suppliers to resell products or services. In such cases, we evaluate whether we are the principal (i.e. report revenues on a gross basis) or agent (i.e. report revenues on a net basis). In doing so, we first evaluate whether we control the good or service before it is transferred to the customer. If we control the good or service before it is transferred to the customer, we are the principal; if not, we are the agent. Determining whether we control the good or service before it is transferred to the customer may require judgment.
Our contracts may be modified to add, remove or change existing performance obligations. The accounting for modifications to our contracts involves assessing whether the services added to an existing contract are distinct and whether the pricing is at the standalone selling price. Services added that are not distinct are accounted for on a cumulative catch up basis, while those that are distinct are accounted for prospectively, either as a separate contract if the additional services are priced at the standalone selling price, or as a termination of the existing contract and creation of a new contract if not priced at the standalone selling price. Services added to our application development and systems integration service contracts are typically not distinct, while services added to our other contracts, including application maintenance, testing and business process services contracts, are typically distinct.
Incentive revenues, volume discounts, or any other form of variable consideration is estimated using either the sum of probability weighted amounts in a range of possible consideration amounts (expected value), or the single most likely amount in a range of possible consideration amounts (most likely amount), depending on which method better predicts the amount of consideration to which we may be entitled. We include in the transaction price variable consideration only to the extent it is probable that a significant reversal of revenues recognized will not occur when the uncertainty associated with the variable consideration is resolved. Our estimates of variable consideration and determination of whether to include estimated amounts in the transaction price may involve judgment and are based largely on an assessment of our anticipated performance and all information that is reasonably available to us.
We assess the timing of the transfer of goods or services to the customer as compared to the timing of payments to determine whether a significant financing component exists. As a practical expedient, we do not assess the existence of a significant financing component when the difference between payment and transfer of deliverables is a year or less. If the difference in timing arises for reasons other than the provision of finance to either the customer or us, no financing component is deemed to exist. The primary purpose of our invoicing terms is to provide customers with simplified and predictable ways of purchasing our services, not to receive or provide financing from or to customers. We do not consider set up or transition fees paid upfront by our customers to represent a financing component, as such fees are required to encourage customer commitment to the project and protect us from early termination of the contract.
Costs to Fulfill
Recurring operating costs for contracts with customers are recognized as incurred. Certain eligible, nonrecurring costs incurred in the initial phases of our application maintenance, business process outsourcing and infrastructure services contracts (i.e. set-up or transition costs) are capitalized when such costs (1) relate directly to the contract, (2) generate or enhance resources of the Company that will be used in satisfying the performance obligation in the future, and (3) are expected to be recovered. These costs are expensed ratably over the estimated life of the customer relationship, including expected renewals. In determining the estimated life of the customer relationship, we evaluate the average contract term, on a portfolio basis by nature of the services to be provided, as well asand apply judgment to evaluate the rate of technological and industry change. Capitalized amounts are monitored regularly for impairment. Impairment losses are recorded when projected remaining undiscounted operating cash flows are not sufficient to recover the carrying amount of the capitalized costs to fulfill.
The following table presents information related to the capitalized costs to fulfill, such as set-up or transition activities, for the threesix months ended March 31,June 30, 2018. Costs to obtain contracts arewere immaterial for the periods disclosed and were expensed as incurred.disclosed.
| | | | | Costs to Fulfill | | Costs to Fulfill |
| | | (in millions) | | (in millions) |
| Balance - January 1, 2018 | | $ | 303 |
| | $ | 303 |
|
| Amortization expense | | (14 | ) | | (32 | ) |
| Costs capitalized | | 39 |
| | 85 |
|
| Other | | 2 |
| | (3 | ) |
| Balance - March 31, 2018 | | $ | 330 |
| |
| Balance - June 30, 2018 | | | $ | 353 |
|
Costs to fulfill are recorded in "Other noncurrent assets" in our consolidated statements of financial position.
Trade Accounts Receivable and Contract Balances
We classify our right to consideration in exchange for deliverables as either a receivable or a contract asset. A receivable is a right to consideration that is unconditional (i.e. only the passage of time is required before payment is due). For example, we recognize a receivable for revenues related to our time and materials and transaction or volume-based contracts.contracts when earned regardless of whether amounts have been billed. We present such receivables in Trade accounts receivable, net in our consolidated statements of financial position at their net estimated realizable value. We maintain an allowance for doubtful accounts to provide for the estimated amount of receivables that may not be collected. The allowance is based upon an assessment of customer creditworthiness, historical payment experience, the age of outstanding receivables and other applicable factors.
A contract asset is a right to consideration that is conditional upon factors other than the passage of time. Contract assets are presented in Other current assets in our consolidated statements of financial position and primarily relate to unbilled amounts on fixed-price contracts utilizing the cost to cost method of revenue recognition. The table below shows significant movements in contract assets:
| | | | | Contract Assets | | Contract Assets |
| | | (in millions) | | (in millions) |
| Balance - January 1, 2018 | | $ | 306 |
| | $ | 306 |
|
| Revenues recognized during the period but not billed | | 225 |
| | 259 |
|
| Amounts reclassified to accounts receivable | | (225 | ) | | (247 | ) |
| Other | | 1 |
| |
| Balance - March 31, 2018 | | $ | 307 |
| |
| Balance - June 30, 2018 | | | $ | 318 |
|
Our contract liabilities, or deferred revenue, consist of advance payments and billings in excess of revenues recognized. We classify deferred revenue as current or noncurrent based on the timing of when we expect to recognize the revenues. The noncurrent portion of deferred revenue is included in other noncurrent liabilities in our consolidated statements of financial position.
The table below shows significant movements in the deferred revenue balances (current and noncurrent) for the period disclosed:
| | | | | Deferred Revenue | | Deferred Revenue |
| | | (in millions) | | (in millions) |
| Balance - January 1, 2018 | | $ | 431 |
| | $ | 431 |
|
| Amounts billed but not recognized as revenues | | 99 |
| | 119 |
|
| Revenues recognized related to the opening balance of deferred revenue | | (100 | ) | | (163 | ) |
| Balance - March 31, 2018 | | $ | 430 |
| |
| Other | | | (2 | ) |
| Balance - June 30, 2018 | | | $ | 385 |
|
Our contract assets and liabilities are reported in a net position on a contract by contract basis at the end of each reporting period. The difference between the opening and closing balances of our contract assets and deferred revenues primarily results from the timing difference between our performance obligations and the customer’s payment. We receive payments from customers based on the terms established in our contracts, which vary by contract type.
Revenues recognized during the threesix months ended March 31,June 30, 2018 for performance obligations satisfied or partially satisfied in previous periods were immaterial.
Remaining Performance Obligations
ASC 606 requires that we disclose the aggregate amount of transaction price that is allocated to performance obligations that have not yet been satisfied as of March 31,June 30, 2018. This disclosure is not required for:
| |
| (1) | contracts with an original duration of one year or less, including contracts that can be terminated for convenience without a substantive penalty, |
| |
| (2) | contracts for which we recognize revenues based on the right to invoice for services performed, |
| |
| (3) | variable consideration allocated entirely to a wholly unsatisfied performance obligation or to a wholly unsatisfied promise to transfer a distinct good or service that forms part of a single performance obligation in accordance with ASC 606-10-25-14(b), for which the criteria in ASC 606-10-32-40 have been met, or |
| |
| (4) | variable consideration in the form of a sales-based or usage based royalty promised in exchange for a license of intellectual property. |
Many of our performance obligations meet one or more of these exemptions. As of March 31,June 30, 2018, the aggregate amount of transaction price allocated to remaining performance obligations, other than those meeting the exclusion criteria above, was $1,752$1,595 million, of which approximately 70%64% is expected to be recognized as revenues within 2 years, and the remainder thereafter.years.
Disaggregation of Revenues
The table below presents disaggregated revenues from contracts with customers by customer location, service line and contract-type for each of our business segments. We believe this disaggregation best depicts how the nature, amount, timing and uncertainty of our revenues and cash flows are affected by industry, market and other economic factors.
|
| | | | | | | | | | | | | | | | | | | | |
| | | Three Months Ended |
| | | June 30, 2018 |
| | | Financial Services | | Healthcare | | Products and Resources | | Communications, Media and Technology | | Total |
| | | (in millions) |
| Revenues | | | | | | | | | | |
| Geography: | | | | | | | | | | |
| North America | | $ | 1,056 |
| | $ | 1,060 |
| | $ | 585 |
| | $ | 366 |
| | $ | 3,067 |
|
| United Kingdom | | 114 |
| | 22 |
| | 89 |
| | 84 |
| | 309 |
|
| Rest of Europe | | 165 |
| | 61 |
| | 109 |
| | 46 |
| | 381 |
|
| Europe - Total | | 279 |
| | 83 |
| | 198 |
| | 130 |
| | 690 |
|
| Rest of World | | 134 |
| | 13 |
| | 57 |
| | 45 |
| | 249 |
|
| Total | | $ | 1,469 |
| | $ | 1,156 |
| | $ | 840 |
| | $ | 541 |
| | $ | 4,006 |
|
| | | | | | | | | | | |
| Service line: | | | | | | | | | | |
| Consulting and technology services | | $ | 885 |
| | $ | 613 |
| | $ | 499 |
| | $ | 289 |
| | $ | 2,286 |
|
| Outsourcing services | | 584 |
| | 543 |
| | 341 |
| | 252 |
| | 1,720 |
|
| Total | | $ | 1,469 |
| | $ | 1,156 |
| | $ | 840 |
| | $ | 541 |
| | $ | 4,006 |
|
| | | | | | | | | | | |
| Type of contract: | | | | | | | | | | |
| Time and materials | | $ | 953 |
| | $ | 452 |
| | $ | 379 |
| | $ | 335 |
| | $ | 2,119 |
|
| Fixed-price | | 460 |
| | 443 |
| | 367 |
| | 179 |
| | 1,449 |
|
| Transaction or volume-based | | 56 |
| | 261 |
| | 94 |
| | 27 |
| | 438 |
|
| Total | | $ | 1,469 |
| | $ | 1,156 |
| | $ | 840 |
| | $ | 541 |
| | $ | 4,006 |
|
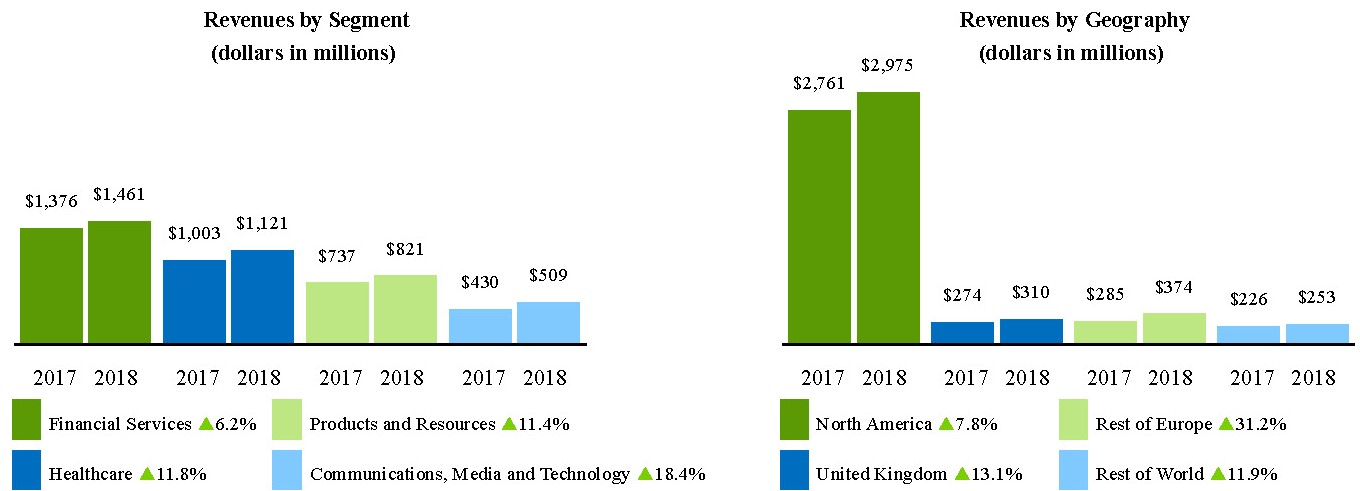
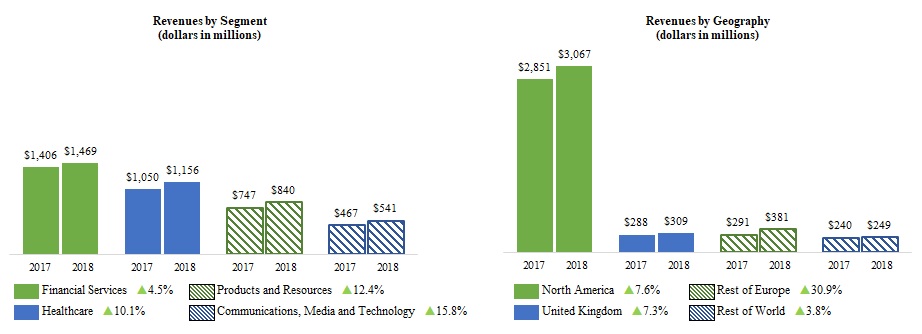
| | | | | Three Months Ended | | Six Months Ended |
| | | March 31, 2018 | | June 30, 2018 |
| | | Financial Services | | Healthcare | | Products and Resources | | Communications, Media and Technology | | Total | | Financial Services | | Healthcare | | Products and Resources | | Communications, Media and Technology | | Total |
| | | (in millions) | | (in millions) |
| Revenues | | | | | | | | | | | | | | | | | | | | |
| Geography: | | | | | | | | | | | | | | | | | | | | |
| North America | | $ | 1,044 |
| | $ | 1,023 |
| | $ | 572 |
| | $ | 336 |
| | $ | 2,975 |
| | $ | 2,100 |
| | $ | 2,083 |
| | $ | 1,157 |
| | $ | 702 |
| | $ | 6,042 |
|
| United Kingdom | | 116 |
| | 23 |
| | 87 |
| | 84 |
| | 310 |
| | 230 |
| | 45 |
| | 176 |
| | 168 |
| | 619 |
|
| Rest of Europe | | 162 |
| | 61 |
| | 109 |
| | 42 |
| | 374 |
| | 327 |
| | 122 |
| | 218 |
| | 88 |
| | 755 |
|
| Europe - Total | | 278 |
| | 84 |
| | 196 |
| | 126 |
| | 684 |
| | 557 |
| | 167 |
| | 394 |
| | 256 |
| | 1,374 |
|
| Rest of World | | 139 |
| | 14 |
| | 53 |
| | 47 |
| | 253 |
| | 273 |
| | 27 |
| | 110 |
| | 92 |
| | 502 |
|
| Total | | $ | 1,461 |
| | $ | 1,121 |
| | $ | 821 |
| | $ | 509 |
| | $ | 3,912 |
| | $ | 2,930 |
| | $ | 2,277 |
| | $ | 1,661 |
| | $ | 1,050 |
| | $ | 7,918 |
|
| | | | | | | | | | |
| | | | | | | | | |
|
| Service line: | | | | | | | | | |
| | | | | | | | | |
|
| Consulting and technology services | | $ | 871 |
| | $ | 638 |
| | $ | 481 |
| | $ | 278 |
| | $ | 2,268 |
| | $ | 1,756 |
| | $ | 1,251 |
| | $ | 980 |
| | $ | 567 |
| | $ | 4,554 |
|
| Outsourcing services | | 590 |
| | 483 |
| | 340 |
| | 231 |
| | 1,644 |
| | 1,174 |
| | 1,026 |
| | 681 |
| | 483 |
| | 3,364 |
|
| Total | | $ | 1,461 |
| | $ | 1,121 |
| | $ | 821 |
| | $ | 509 |
| | $ | 3,912 |
| | $ | 2,930 |
| | $ | 2,277 |
| | $ | 1,661 |
| | $ | 1,050 |
| | $ | 7,918 |
|
| | | | | | | | | | |
| | | | | | | | | |
|
| Type of contract: | | | | | | | | | |
| | | | | | | | | |
|
| Time and materials | | $ | 935 |
| | $ | 448 |
| | $ | 369 |
| | $ | 306 |
| | $ | 2,058 |
| | $ | 1,888 |
| | $ | 900 |
| | $ | 748 |
| | $ | 641 |
| | $ | 4,177 |
|
| Fixed-price | | 471 |
| | 511 |
| | 361 |
| | 179 |
| | 1,522 |
| | 931 |
| | 954 |
| | 728 |
| | 358 |
| | 2,971 |
|
| Transaction or volume-based | | 55 |
|
| 162 |
| | 91 |
| | 24 |
| | 332 |
| | 111 |
|
| 423 |
| | 185 |
| | 51 |
| | 770 |
|
| Total | | $ | 1,461 |
| | $ | 1,121 |
| | $ | 821 |
| | $ | 509 |
| | $ | 3,912 |
| | $ | 2,930 |
| | $ | 2,277 |
| | $ | 1,661 |
| | $ | 1,050 |
| | $ | 7,918 |
|
|
| | | | |
| Note 4 — Business Combinations |
In 2018, we completed two business combinations for total consideration of approximately $492 million, inclusive of contingent consideration. The acquisition of Bolder Healthcare Solutions, a privately-held U.S. provider of revenue cycle management solutions to the healthcare industry expands our healthcare consulting, technology and business process services portfolio and strengthens our position in digital healthcare technology and operations. The acquisition of Hedera Consulting, a privately-held company specializing in business advisory and data analytics services across a number of industries expands our consulting, business insight and digital transformation capabilities in Belgium and the Netherlands.
These acquisitions were not material, either individually or in the aggregate, to our operations, financial position or cash flow. Accordingly, pro forma results have not been presented. These acquisitions were included in our unaudited consolidated financial statements as of the date on which the businesses were acquired. We have allocated the purchase price related to these transactions to tangible and intangible assets and liabilities, including non-deductible goodwill, based on their estimated fair values. We will finalize the purchase price allocation as soon as practicable within the measurement period, but in no event later than one year following the date of acquisition. The allocations of purchase price to the fair value of the aggregate assets acquired and liabilities assumed were as follows:
|
| | | | | |
| | Six Months Ended
June 30, 2018 |
| | Fair Value | | Weighted Average Useful Life |
| | (in millions) | | |
| Cash | $ | 10 |
| | |
| Current assets | 37 |
| | |
| Property, plant and equipment and other noncurrent assets | 10 |
| | |
Non-deductible goodwill (1) | 340 |
| | |
| Customer relationship intangible assets | 123 |
| | 9.7 years |
| Other intangible assets | 26 |
| | 2.4 years |
| Current liabilities | (15 | ) | | |
| Noncurrent liabilities | (39 | ) | | |
| Purchase price | $ | 492 |
| | |
(1) The primary items that generated goodwill are the value of the acquired assembled workforces and synergies between the acquired companies and us, neither of which qualify as an amortizable intangible asset.
|
| | | | |
| Note 5 — Realignment Charges |
In 2017, we began a realignment of our business to accelerate the shift to digital services and solutions while improving the overall efficiency of our operations. Charges we incurred as part of this realignment were reported in "Selling, general and administrative expenses" in our consolidated statements of operations. The realignment charges are comprised of severance costs, including those related to a voluntary separation program announced in May 2017, lease termination costs and advisory fees related to non-routine shareholder matters and to the development of our realignment and return of capital programs.
Realignment charges were as follows:
|
| | | | | | | | | | | | | | | |
| | Three Months Ended
June 30, | | Six Months Ended
June 30, |
| | 2018 | | 2017 | | 2018 | | 2017 |
| | (in millions) |
| Employee separations | $ | — |
| | $ | 37 |
| | $ | — |
| | $ | 39 |
|
| Advisory fees | — |
| | 1 |
| | — |
| | 10 |
|
| Lease termination costs | — |
| | 1 |
| | 1 |
| | 1 |
|
| Total realignment costs | $ | — |
| | $ | 39 |
| | $ | 1 |
| | $ | 50 |
|
Our investments were as follows:
| | | | March 31, 2018 | | December 31, 2017 | June 30, 2018 | | December 31, 2017 |
| | (in millions) | (in millions) |
| Short-term investments: | | | | | | |
| Equity investment securities | $ | 25 |
| | $ | 25 |
| $ | 25 |
| | $ | 25 |
|
| Available-for-sale investment securities | 2,069 |
| | 1,972 |
| 1,862 |
| | 1,972 |
|
| Held-to-maturity investment securities | 943 |
| | 745 |
| 987 |
| | 745 |
|
Time deposits(1) | 353 |
| | 389 |
| 472 |
| (1) | 389 |
|
| Total short-term investments | $ | 3,390 |
| | $ | 3,131 |
| $ | 3,346 |
| | $ | 3,131 |
|
|
| | | | | | | |
| Long-term investments: | | | |
| Equity and cost method investments | $ | 74 |
| | $ | 74 |
|
| Held-to-maturity investment securities | 6 |
| | 161 |
|
| Total long-term investments | $ | 80 |
| | $ | 235 |
|
|
| | | | | | | |
| Long-term investments: | | | |
| Equity and cost method investments | $ | 77 |
| | $ | 74 |
|
| Held-to-maturity investment securities | 6 |
| | 161 |
|
| Total long-term investments | $ | 83 |
| | $ | 235 |
|
| |
| (1) | Includes $348$419 million in restricted time deposits as of March 31,June 30, 2018. See Note 149. |
Equity Investment Securities
Our equity investment securities consist of a U.S. dollar denominated investment in a fixed income mutual fund. Unrealized losses for the three and six months ended March 31,June 30, 2018 and 2017 were immaterial. The value of the fixed income mutual fund invested in fixed income securities is based on the net asset value, or NAV, of the fund, with appropriate consideration of the liquidity and any restrictions on disposition of our investment in the fund. There were no realized gains or losses on equity securities during the three and six months ended March 31,June 30, 2018 and 2017.
Available-for-Sale Investment Securities
Our available-for-sale investment securities consist of U.S. dollar denominated investments primarily in U.S. Treasury notes, U.S. government agency debt securities, municipal debt securities, non-U.S. government debt securities, U.S. and international corporate bonds, certificates of deposit, commercial paper, debt securities issued by supranational institutions, and asset-backed securities, including securities backed by auto loans, credit card receivables, and other receivables. Our investment guidelines are to purchase securities which are investment grade at the time of acquisition. We monitor the credit ratings of the securities in our portfolio on an ongoing basis.
The amortized cost, gross unrealized gains and losses and fair value of available-for-sale investment securities at March 31,June 30, 2018 were as follows:
| | | | Amortized Cost | | Unrealized Gains | | Unrealized Losses | | Fair
Value | Amortized Cost | | Unrealized Gains | | Unrealized Losses | | Fair
Value |
| | (in millions) | (in millions) |
| U.S. Treasury and agency debt securities | $ | 643 |
| | $ | — |
| | $ | (9 | ) | | $ | 634 |
| $ | 647 |
| | $ | — |
| | $ | (10 | ) | | $ | 637 |
|
| Corporate and other debt securities | 448 |
| | — |
| | (6 | ) | | 442 |
| 440 |
| | — |
| | (5 | ) | | 435 |
|
| Certificates of deposit and commercial paper | 563 |
| | — |
| | — |
| | 563 |
| 377 |
| | — |
| | — |
| | 377 |
|
| Asset-backed securities | 305 |
| | — |
| | (3 | ) | | 302 |
| 306 |
| | — |
| | (3 | ) | | 303 |
|
| Municipal debt securities | 129 |
| | — |
| | (1 | ) | | 128 |
| 111 |
| | — |
| | (1 | ) | | 110 |
|
| Total available-for-sale investment securities | $ | 2,088 |
| | $ | — |
| | $ | (19 | ) | | $ | 2,069 |
| $ | 1,881 |
| | $ | — |
| | $ | (19 | ) | | $ | 1,862 |
|
The amortized cost, gross unrealized gains and losses and fair value of available-for-sale investment securities at December 31, 2017 were as follows:
|
| | | | | | | | | | | | | | | |
| | Amortized Cost | | Unrealized Gains | | Unrealized Losses | | Fair Value |
| | (in millions) |
| U.S. Treasury and agency debt securities | $ | 667 |
| | $ | — |
| | $ | (6 | ) | | $ | 661 |
|
| Corporate and other debt securities | 439 |
| | — |
| | (2 | ) | | 437 |
|
| Certificates of deposit and commercial paper | 450 |
| | — |
| | — |
| | 450 |
|
| Asset-backed securities | 297 |
| | — |
| | (2 | ) | | 295 |
|
| Municipal debt securities | 130 |
| | — |
| | (1 | ) | | 129 |
|
| Total available-for-sale investment securities | $ | 1,983 |
| | $ | — |
| | $ | (11 | ) | | $ | 1,972 |
|
The fair value and related unrealized losses of available-for-sale investment securities in a continuous unrealized loss position for less than 12 months and for 12 months or longer were as follows as of March 31,June 30, 2018:
| | | | Less than 12 Months | | 12 Months or More | | Total | Less than 12 Months | | 12 Months or More | | Total |
| | Fair Value | | Unrealized Losses | | Fair Value | | Unrealized Losses | | Fair Value | | Unrealized Losses | Fair Value | | Unrealized Losses | | Fair Value | | Unrealized Losses | | Fair Value | | Unrealized Losses |
| | (in millions) | (in millions) |
| U.S. Treasury and agency debt securities | $ | 517 |
| | $ | (7 | ) | | $ | 94 |
| | $ | (2 | ) | | $ | 611 |
| | $ | (9 | ) | $ | 517 |
| | $ | (8 | ) | | $ | 86 |
| | $ | (2 | ) | | $ | 603 |
| | $ | (10 | ) |
| Corporate and other debt securities | 331 |
| | (5 | ) | | 111 |
| | (1 | ) | | 442 |
| | (6 | ) | 321 |
| | (4 | ) | | 97 |
| | (1 | ) | | 418 |
| | (5 | ) |
| Certificates of deposit and commercial paper | 399 |
| | — |
| | — |
| | — |
| | 399 |
| | — |
| 99 |
| | — |
| | — |
| | — |
| | 99 |
| | — |
|
| Asset-backed securities | 214 |
| | (2 | ) | | 85 |
| | (1 | ) | | 299 |
| | (3 | ) | 212 |
| | (2 | ) | | 78 |
| | (1 | ) | | 290 |
| | (3 | ) |
| Municipal debt securities | 107 |
| | (1 | ) | | 16 |
| | — |
| | 123 |
| | (1 | ) | 86 |
| | (1 | ) | | 16 |
| | — |
| | 102 |
| | (1 | ) |
| Total | $ | 1,568 |
| | $ | (15 | ) | | $ | 306 |
| | $ | (4 | ) | | $ | 1,874 |
| | $ | (19 | ) | $ | 1,235 |
| | $ | (15 | ) | | $ | 277 |
| | $ | (4 | ) | | $ | 1,512 |
| | $ | (19 | ) |
The fair value and related unrealized losses of available-for-sale investment securities in a continuous unrealized loss position for less than 12 months and for 12 months or longer were as follows as of December 31, 2017:
|
| | | | | | | | | | | | | | | | | | | | | | | |
| | Less than 12 Months | | 12 Months or More | | Total |
| | Fair Value | | Unrealized Losses | | Fair Value | | Unrealized Losses | | Fair Value | | Unrealized Losses |
| | (in millions) |
| U.S. Treasury and agency debt securities | $ | 519 |
| | $ | (4 | ) | | $ | 124 |
| | $ | (2 | ) | | $ | 643 |
| | $ | (6 | ) |
| Corporate and other debt securities | 297 |
| | (1 | ) | | 126 |
| | (1 | ) | | 423 |
| | (2 | ) |
| Certificates of deposit and commercial paper | 49 |
| | — |
| | — |
| | — |
| | 49 |
| | — |
|
| Asset-backed securities | 193 |
| | (1 | ) | | 94 |
| | (1 | ) | | 287 |
| | (2 | ) |
| Municipal debt securities | 107 |
| | (1 | ) | | 18 |
| | — |
| | 125 |
| | (1 | ) |
| Total | $ | 1,165 |
| | $ | (7 | ) | | $ | 362 |
| | $ | (4 | ) | | $ | 1,527 |
| | $ | (11 | ) |
The unrealized losses for the above securities as of March 31,June 30, 2018 and December 31, 2017 were primarily attributable to changes in interest rates. At each reporting date, we perform an evaluation of impaired available-for-sale securities to determine if the unrealized losses are other-than-temporary. We do not consider any of the investments to be other-than-temporarily impaired as of March 31,June 30, 2018. The gross unrealized gains and losses in the above tables were recorded, net of tax, in "Accumulated other comprehensive income (loss)" in our consolidated statements of financial position.
The contractual maturities of our fixed income available-for-sale investment securities as of March 31,June 30, 2018 are set forth in the following table:
| | | | Amortized Cost | | Fair Value | Amortized Cost | | Fair Value |
| | (in millions) | (in millions) |
| Due within one year | $ | 729 |
| | $ | 728 |
| $ | 536 |
| | $ | 535 |
|
| Due after one year up to two years | 500 |
| | 494 |
| 526 |
| | 518 |
|
| Due after two years up to three years | 495 |
| | 487 |
| 468 |
| | 461 |
|
| Due after three years | 59 |
| | 58 |
| 45 |
| | 45 |
|
| Asset-backed securities | 305 |
| | 302 |
| 306 |
| | 303 |
|
| Total available-for-sale investment securities | $ | 2,088 |
| | $ | 2,069 |
| $ | 1,881 |
| | $ | 1,862 |
|
Asset-backed securities were excluded from the maturity categories because the actual maturities may differ from the contractual maturities since the underlying receivables may be prepaid without penalties. Further, actual maturities of debt securities may differ from those presented above since certain obligations provide the issuer the right to call or prepay the obligation prior to scheduled maturity without penalty.
Proceeds from sales of available-for-sale investment securities and the gross gains and losses that have been included in earnings as a result of those sales were as follows:
| | | | Three Months Ended
March 31, | Three Months Ended
June 30, | | Six Months Ended
June 30, |
| | 2018 | | 2017 | 2018 | | 2017 | | 2018 | | 2017 |
| | (in millions) | (in millions) |
| Proceeds from sales of available-for-sale investment securities | $ | 125 |
| | $ | 1,248 |
| $ | 434 |
| | $ | 397 |
| | $ | 559 |
| | $ | 1,645 |
|
| | | | | | | | | | | |
| Gross gains | $ | — |
| | $ | 1 |
| $ | — |
| | $ | — |
| | $ | — |
| | $ | 1 |
|
| Gross losses | (1 | ) | | (1 | ) | (1 | ) | | — |
| | (2 | ) | | (1 | ) |
| Net realized (losses) on sales of available-for-sale investment securities | $ | (1 | ) | | $ | — |
| $ | (1 | ) | | $ | — |
| | $ | (2 | ) | | $ | — |
|
Held-to-Maturity Investment Securities
Our held-to-maturity investment securities consist of Indian rupee denominated investments primarily in commercial paper, corporate bonds and government debt securities. Our investment guidelines are to purchase securities that are investment grade at the time of acquisition. We monitor the credit ratings of the securities in our portfolio on an ongoing basis.
The amortized cost, gross unrealized gains and losses and fair value of held-to-maturity investment securities at March 31,June 30, 2018 were as follows:
| | | | Amortized
Cost | | Unrealized
Gains | | Unrealized
Losses | | Fair
Value | Amortized
Cost | | Unrealized
Gains | | Unrealized
Losses | | Fair
Value |
| | (in millions) | (in millions) |
| Short-term investments: | | | | | | | | | | | | | | |
| Corporate and other debt securities | $ | 481 |
| | $ | — |
| | $ | (1 | ) | | $ | 480 |
| $ | 599 |
| | $ | — |
| | $ | (2 | ) | | $ | 597 |
|
| Commercial paper | 462 |
| | — |
| | (1 | ) | | 461 |
| 388 |
| | — |
| | (1 | ) | | 387 |
|
| Total short-term held-to-maturity investments | 943 |
| | — |
| | (2 | ) | | 941 |
| 987 |
| | — |
| | (3 | ) | | 984 |
|
| Long-term investments: | | | | | | | | | | | | | | |
| Corporate and other debt securities | 6 |
| | — |
| | — |
| | 6 |
| 6 |
| | — |
| | — |
| | 6 |
|
| Total held-to-maturity investment securities | $ | 949 |
| | $ | — |
| | $ | (2 | ) | | $ | 947 |
| $ | 993 |
| | $ | — |
| | $ | (3 | ) | | $ | 990 |
|
The amortized cost, gross unrealized gains and losses and fair value of held-to-maturity investment securities at December 31, 2017 were as follows:
|
| | | | | | | | | | | | | | | |
| | Amortized
Cost | | Unrealized
Gains | | Unrealized
Losses | | Fair
Value |
| | (in millions) |
| Short-term investments: | | | | | | | |
| Corporate and other debt securities | $ | 346 |
| | $ | — |
| | $ | (1 | ) | | $ | 345 |
|
| Commercial paper | 399 |
| | — |
| | (2 | ) | | 397 |
|
| Total short-term held-to-maturity investments | 745 |
| | — |
| | (3 | ) | | 742 |
|
| Long-term investments: | | | | | | | |
| Corporate and other debt securities | 161 |
| | — |
| | (1 | ) | | 160 |
|
| Total held-to-maturity investment securities | $ | 906 |
| | $ | — |
| | $ | (4 | ) | | $ | 902 |
|
The fair value and related unrealized losses of held-to-maturity investment securities in a continuous unrealized loss position for less than 12 months and for 12 months or longer were as follows as of March 31,June 30, 2018:
| | | | Less than 12 Months | | 12 Months or More | | Total | Less than 12 Months | | 12 Months or More | | Total |
| | Fair Value | | Unrealized Losses | | Fair Value | | Unrealized Losses | | Fair Value | | Unrealized Losses | Fair Value | | Unrealized Losses | | Fair Value | | Unrealized Losses | | Fair Value | | Unrealized Losses |
| | (in millions) | (in millions) |
| Corporate and other debt securities | $ | 327 |
| | $ | (1 | ) | | $ | 32 |
| | $ | — |
| | $ | 359 |
| | $ | (1 | ) | $ | 485 |
| | $ | (2 | ) | | $ | 31 |
| | $ | — |
| | $ | 516 |
| | $ | (2 | ) |
| Commercial paper | 322 |
| | (1 | ) | | — |
| | — |
| | 322 |
| | (1 | ) | 387 |
| | (1 | ) | | — |
| | — |
| | 387 |
| | (1 | ) |
| Total | $ | 649 |
| | $ | (2 | ) | | $ | 32 |
| | $ | — |
| | $ | 681 |
| | $ | (2 | ) | $ | 872 |
| | $ | (3 | ) | | $ | 31 |
| | $ | — |
| | $ | 903 |
| | $ | (3 | ) |
The fair value and related unrealized losses of held-to-maturity investment securities in a continuous unrealized loss position for less than 12 months and for 12 months or longer were as follows as of December 31, 2017:
|
| | | | | | | | | | | | | | | | | | | | | | | |
| | Less than 12 Months | | 12 Months or More | | Total |
| | Fair Value | | Unrealized Losses | | Fair Value | | Unrealized Losses | | Fair Value | | Unrealized Losses |
| | (in millions) |
| Corporate and other debt securities | $ | 473 |
| | $ | (2 | ) | | $ | — |
| | $ | — |
| | $ | 473 |
| | $ | (2 | ) |
| Commercial paper | 394 |
| | (2 | ) | | — |
| | — |
| | 394 |
| | (2 | ) |
| Total | $ | 867 |
| | $ | (4 | ) | | $ | — |
| | $ | — |
| | $ | 867 |
| | $ | (4 | ) |
At each reporting date, the Company performs an evaluation of held-to-maturity securities to determine if the unrealized losses are other-than-temporary. We do not consider any of the investments to be other-than-temporarily impaired as of March 31,June 30, 2018.
The contractual maturities of our fixed income held-to-maturity investment securities as of March 31,June 30, 2018 are set forth in the following table:
| | | | Amortized Cost | | Fair Value | Amortized Cost | | Fair Value |
| | (in millions) | (in millions) |
| Due within one year | $ | 943 |
| | $ | 941 |
| $ | 987 |
| | $ | 984 |
|
| Due after two years | 6 |
| | 6 |
| 6 |
| | 6 |
|
| Total held-to-maturity investment securities | $ | 949 |
| | $ | 947 |
| $ | 993 |
| | $ | 990 |
|
During the threesix months ended March 31,June 30, 2018 and the year ended December 31, 2017, there were no transfers of investments between our available-for-sale and held-to-maturity investment portfolios.
|
| | | | |
Note 57 — Accrued Expenses and Other Current Liabilities |
Accrued expenses and other current liabilities were as follows:
| | | | March 31, 2018 | | December 31, 2017 | June 30, 2018 | | December 31, 2017 |
| | (in millions) | (in millions) |
| Compensation and benefits | $ | 848 |
| | $ | 1,272 |
| $ | 928 |
| | $ | 1,272 |
|
| Income taxes | 74 |
| | 48 |
| 174 |
| | 48 |
|
| Professional fees | 103 |
| | 100 |
| 113 |
| | 100 |
|
| Travel and entertainment | 38 |
| | 32 |
| 45 |
| | 32 |
|
| Customer volume and other incentives | 318 |
| | 289 |
| 312 |
| | 289 |
|
| Derivative financial instruments | 2 |
| | 5 |
| 18 |
| | 5 |
|
| Other | 333 |
| | 325 |
| 322 |
| | 325 |
|
| Total accrued expenses and other current liabilities | $ | 1,716 |
| | $ | 2,071 |
| $ | 1,912 |
| | $ | 2,071 |
|
In 2014, we entered into a credit agreement with a commercial bank syndicate, or, as amended, the Credit Agreement, providing for a $1,000 million unsecured term loan and a $750 million unsecured revolving credit facility. The term loan and the revolving credit facility both mature in November 2019. All notes drawn to date under the revolving credit facility have been less than 90 days in duration. We are required under the Credit Agreement to make scheduled quarterly principal payments on the term loan. We were in compliance with all debt covenants and representations as of March 31,June 30, 2018.
Short-term Debt
The following summarizes our short-term debt balances as of:
| | | | | March 31, 2018 | | December 31, 2017 | | June 30, 2018 | | December 31, 2017 |
| | | (in millions) | | (in millions) |
| Notes outstanding under revolving credit facility | | $ | — |
| | $ | 75 |
| | $ | — |
| | $ | 75 |
|
| Term loan - current maturities | | 100 |
| | 100 |
| | 100 |
| | 100 |
|
| Total short-term debt | | $ | 100 |
| | $ | 175 |
| | $ | 100 |
| | $ | 175 |
|
Long-term Debt
The following summarizes our long-term debt balances as of:
| | | | | March 31, 2018 | | December 31, 2017 | | June 30, 2018 | | December 31, 2017 |
| | | (in millions) | | (in millions) |
| Term loan, due November 2019 | | $ | 775 |
| | $ | 800 |
| | $ | 750 |
| | $ | 800 |
|
| Less: | | | | | | | | |
| Current maturities | | (100 | ) | | (100 | ) | | (100 | ) | | (100 | ) |
| Deferred financing costs | | (2 | ) | | (2 | ) | | (1 | ) | | (2 | ) |
| Long-term debt, net of current maturities | | $ | 673 |
| | $ | 698 |
| | $ | 649 |
| | $ | 698 |
|
On December 22, 2017, the United States enacted the Tax Reform Act, which significantly revised the U.S. corporate income tax law for tax years beginning after December 31, 2017 by (among other provisions):
reducing the U.S. federal statutory corporate income tax rate from 35% to 21% for tax years beginning after December 31, 2017;
implementing a modified territorial tax system that includes a one-time transition tax on all accumulated undistributed earnings of foreign subsidiaries;
providing for a full deduction on future dividends received from foreign affiliates; and
imposing a U.S. income tax on global intangible low-taxed income, or GILTI.
During the fourth quarter of 2017, in accordance with the SEC Staff Accounting Bulletin ("SAB") No. 118 - Income Tax Accounting Implications of the Tax Cuts and Jobs Act, we recorded a one-time provisional net income tax expense of $617 million, which was comprised of: (i) the one-time transition tax expense on accumulated undistributed earnings of foreign subsidiaries of $635 million, (ii) foreign and U.S. state income tax expense that will be applicable upon repatriation of the accumulated undistributed earnings of our foreign subsidiaries, other than our Indian subsidiaries, of $53 million, partially offset by (iii) an income tax benefit of $71 million resulting from the revaluation of U.S. net deferred income tax liabilities to the new lower U.S. income tax rate. The Company has elected to pay the transition tax on undistributed earnings is payable over eight years. The one-time incremental income tax expense is provisional as it reflects certain assumptions based upon our interpretation of the Tax Reform Act and may change, possibly materially, as we receive additional clarification and guidance and as the interpretation of the Tax Reform Act evolves over time. During the first quarter ofsix months ended June 30, 2018, we have not recorded any adjustments to the one-time provisional net income tax expense. We anticipate completingwill complete the accounting for the Tax Reform Act within the one year measurement period.
Our Indian subsidiaries, collectively referred toperiod as Cognizant India, are primarily export-oriented and are eligible for certain income tax holiday benefits granted by the government of India for export activities conducted within Special Economic Zones, or SEZs, for periods of up to 15 years. Our Indian profits ineligible for SEZ benefits are subject to corporate income tax at the rate of 34.9%. In addition, all Indian profits, including those generated within SEZs, are subject to the Minimum Alternative Tax, or MAT, at the rate of 21.5%. Any MAT paid is creditable against future Indian corporate income tax, subject to limitations.provided in SAB 118.
Our effective income tax rates were as follows:
|
| | | | | |
| | Three Months Ended
March 31, |
| | 2018 | | 2017 |
| Effective income tax rate | 25.4 | % | | 14.2 | % |
|
| | | | | | | | | | | |
| | Three Months Ended
June 30, | | Six Months Ended
June 30, |
| | 2018 | | 2017 | | 2018 | | 2017 |
| Effective income tax rate | 27.0 | % | | 26.0 | % | | 26.1 | % | | 20.0 | % |
The effective tax rate for the threesix months ended March 31,June 30, 2017 was affected by the recognition of income tax benefits previously unrecognized in our consolidated financial statements related to several uncertain tax positions totaling $72 million. The recognition of these benefits in the first quarter of 2017 was based on management’s reassessment regarding whether certain unrecognized tax benefits met the more-likely-than-not threshold in light of the lapse in the statute of limitations as to a portion of such benefits. Our March 31, 2018 effective tax rate benefitted from the new lower U.S. federal statutory corporate income tax rate, partially offset by the estimated incremental income tax expense related to the current interpretation of the GILTI provision of the Tax Reform Act. The estimate of our 2018 annual effective income tax rate reflects the current interpretation of the Tax Reform Act, including the GILTI provision and may change as we receive additional clarification and guidance and as the interpretation of the Tax Reform Act evolves over time.
We are involved in an ongoing dispute with the Indian Income Tax Department, or ITD, in connection with which we received a notice in March 2018 asserting that the ITD is owed additional taxes on our previously disclosed 2016 India Cash Remittance, the transaction undertaken by our principal operating subsidiary in India, or CTS India, to repurchase shares from its shareholders, which are non-Indian Cognizant entities, valued at $2.8 billion. As a result of that transaction, undertaken pursuant to a plan approved by the Madras High Court in Chennai, India, we previously paid $135 million in Indian income taxes, which we believe are all the applicable taxes owed for this transaction under Indian law. The ITD is asserting that we owe an additional $50733 billion Indian rupees ($482 million at the June 30, 2018 exchange rate) related to the 2016 India Cash Remittance. In addition to the dispute on the 2016 India Cash Remittance, we are involved in another ongoing dispute with the ITD relating to a 2013 transaction undertaken by CTS India to repurchase shares from its shareholders valued at $523 million (the two disputes collectively referred to as the ITD Dispute), for which we also believe we have paid all the applicable taxes owed. Accordingly, we have not recorded any reserves for these matters as of March 31,June 30, 2018. The ITD Dispute is ongoing, and no final decision has been reached.
In March 2018, the ITD placed an attachment on certain of our India bank accounts, relating to the 2016 India Cash Remittance. In April 2018, the Madras High Court granted our application for a stay of the actions of the ITD and lifted the ITD’s attachment of our bank accounts. As part of the interim stay order, we have deposited $765 billion Indian rupees ($72 million at the June 30, 2018 exchange rate) representing 15% of the disputed tax amount related to the 2016 India Cash Remittance, to be kept in a segregated account by the ITD. This amount is presented in "Other current assets" on our consolidated statement of financial position. In addition, in April 2018 the court has placed a lien on certain time deposits of CTS India in the amount of $43128 billion Indian rupees ($410 million at the June 30, 2018 exchange rate), which is the remainder of the disputed tax amount related to the 2016 India Cash Remittance. See Note 14 for a description of ourWe have classified affected time deposits as restricted assets and reported them in “Short-term investments” on
our consolidated statement of financial position. As of June 30, 2018, the restricted time deposits balance was $419 million, including accumulated interest. There were no restricted time deposits as of MarchDecember 31, 2018 relating to this matter.2017.
|
| | | | |
Note 810 — Derivative Financial Instruments |
In the normal course of business, we use foreign exchange forward contracts to manage foreign currency exchange rate risk. The estimated fair value of the foreign exchange forward contracts considers the following items: discount rate, timing and amount of cash flow and counterparty credit risk. Derivatives may give rise to credit risks from the possible non-performance by counterparties. Credit risk is generally limited to the fair value of those contracts that are favorable to us. We have limited our credit risk by entering into derivative transactions only with highly-rated financial institutions, limiting the amount of credit exposure with any one financial institution and conducting an ongoing evaluation of the creditworthiness of the financial institutions with which we do business. In addition, all the assets and liabilities related to our foreign exchange forward contracts set forth in the below table are subject to International Swaps and Derivatives Association, or ISDA, master netting arrangements or other similar agreements with each individual counterparty. These master netting arrangements generally provide for net settlement of all outstanding contracts with the counterparty in the case of an event of default or a termination event. We have presented all the assets and liabilities related to our foreign exchange forward contracts on a gross basis, with no offsets, in our accompanying unaudited consolidated statements of financial position. There is no financial collateral (including cash collateral) posted or received by us related to our foreign exchange forward contracts.
The following table provides information on the location and fair values of derivative financial instruments included in our unaudited consolidated statements of financial position as of:
| | | | | | | March 31, 2018 | | December 31, 2017 | | | | June 30, 2018 | | December 31, 2017 |
| Designation of Derivatives | | Location on Statements of Financial Position | | Assets | | Liabilities | | Assets | | Liabilities | | Location on Statements of Financial Position | | Assets | | Liabilities | | Assets | | Liabilities |
| | | (in millions) | | (in millions) |
| Foreign exchange forward contracts – Designated as cash flow hedging instruments | | Other current assets | | $ | 97 |
| | $ | — |
| | $ | 134 |
| | $ | — |
| | Other current assets | | $ | 36 |
| | $ | — |
| | $ | 134 |
| | $ | — |
|
| | | Other noncurrent assets | | 9 |
| | — |
| | 20 |
| | — |
| | Other noncurrent assets | | — |
| | — |
| | 20 |
| | — |
|
| | | Other noncurrent liabilities | | — |
| | 1 |
| | — |
| | — |
| | Accrued expenses and other current liabilities | | — |
| | 18 |
| | — |
| | — |
|
| | | Total | | 106 |
| | 1 |
| | 154 |
| | — |
| | Other noncurrent liabilities | | — |
| | 25 |
| | — |
| | — |
|
| | | | Total | | 36 |
| | 43 |
| | 154 |
| | — |
|
| Foreign exchange forward contracts – Not designated as hedging instruments | | Other current assets | | 1 |
| | — |
| | — |
| | — |
| | Other current assets | | 4 |
| | — |
| | — |
| | — |
|
| | | Accrued expenses and other current liabilities | | — |
| | 2 |
| | — |
| | 5 |
| | Accrued expenses and other current liabilities | | — |
| | — |
| | — |
| | 5 |
|
| | | Total | | 1 |
| | 2 |
| | — |
| | 5 |
| | Total | | 4 |
| | — |
| | — |
| | 5 |
|
| Total | | $ | 107 |
| | $ | 3 |
| | $ | 154 |
| | $ | 5 |
| | $ | 40 |
| | $ | 43 |
| | $ | 154 |
| | $ | 5 |
|
Cash Flow Hedges
We have entered into a series of foreign exchange forward contracts that are designated as cash flow hedges of Indian rupee denominated payments in India. These contracts are intended to partially offset the impact of movement of exchange rates on future operating costs and are scheduled to mature each month during 2018, 2019 and the first quarterhalf of 2020. Under these contracts, we purchase Indian rupees and sell U.S. dollars. The changes in fair value of these contracts are initially reported in the caption “Accumulated other comprehensive income (loss)” in our consolidated statements of financial position and are subsequently reclassified to earnings in the same period the forecasted Indian rupee denominated payments are recorded in earnings. As of March 31,June 30, 2018, we estimate that $72$13 million, net of tax, of net gains related to derivatives designated as cash flow hedges recorded in accumulated other comprehensive income (loss) is expected to be reclassified into earnings within the next 12 months.
The notional value of our outstanding contracts by year of maturity and the net unrealized gains included in accumulated other comprehensive income (loss) for such contracts were as follows as of:
| | | | March 31, 2018 | | December 31, 2017 | June 30, 2018 | | December 31, 2017 |
| | (in millions) | (in millions) |
| 2018 | $ | 983 |
| | $ | 1,185 |
| $ | 690 |
| | $ | 1,185 |
|
| 2019 | 885 |
| | 720 |
| 1,050 |
| | 720 |
|
| 2020 | 135 |
| | — |
| 315 |
| | — |
|
| Total notional value of contracts outstanding | $ | 2,003 |
| | $ | 1,905 |
| $ | 2,055 |
| | $ | 1,905 |
|
| Net unrealized gains included in accumulated other comprehensive income (loss), net of taxes | $ | 79 |
| | $ | 115 |
| |
| Net unrealized (losses) gains included in accumulated other comprehensive income (loss), net of taxes | | $ | (8 | ) | | $ | 115 |
|
Upon settlement or maturity of the cash flow hedge contracts, we record the gains or losses, based on our designation at the commencement of the contract, with the related hedged Indian rupee denominated expense reported within cost of revenues and selling, general and administrative expenses. Hedge ineffectiveness was immaterial for all periods presented.
The following table provides information on the location and amounts of pre-tax gains on our cash flow hedges for the three months ended March 31:June 30:
|
| | | | | | | | | | | | | | | | | |
| | Change in Derivative Gains/Losses Recognized in Accumulated Other Comprehensive Income (Loss) (effective portion) | | Location of Net Derivative Gains Reclassified from Accumulated Other Comprehensive Income (Loss) into Income (effective portion) | | Net Gains Reclassified from Accumulated Other Comprehensive Income (Loss) into Income (effective portion) |
| | 2018 | | 2017 | | | | 2018 | | 2017 |
| | (in millions) |
| Foreign exchange forward contracts – Designated as cash flow hedging instruments | $ | (14 | ) | | $ | 124 |
| | Cost of revenues | | $ | 30 |
| | $ | 17 |
|
| | | | | | Selling, general and administrative expenses | | 5 |
| | 3 |
|
| | | | | | Total | | $ | 35 |
| | $ | 20 |
|
|
| | | | | | | | | | | | | | | | | |
| | Change in Derivative Gains/Losses Recognized in Accumulated Other Comprehensive Income (Loss) (effective portion) | | Location of Net Derivative Gains Reclassified from Accumulated Other Comprehensive Income (Loss) into Income (effective portion) | | Net Gains Reclassified from Accumulated Other Comprehensive Income (Loss) into Income (effective portion) |
| | 2018 | | 2017 | | | | 2018 | | 2017 |
| | (in millions) |
| Foreign exchange forward contracts – Designated as cash flow hedging instruments | $ | (91 | ) | | $ | 35 |
| | Cost of revenues | | $ | 18 |
| | $ | 29 |
|
| | | | | | Selling, general and administrative expenses | | 3 |
| | 6 |
|
| | | | | | Total | | $ | 21 |
| | $ | 35 |
|
The following table provides information on the location and amounts of pre-tax gains on our cash flow hedges for the six months ended June 30:
|
| | | | | | | | | | | | | | | | | |
| | Change in Derivative Gains/Losses Recognized in Accumulated Other Comprehensive Income (Loss) (effective portion) | | Location of Net Derivative Gains Reclassified from Accumulated Other Comprehensive Income (Loss) into Income (effective portion) | | Net Gains Reclassified from Accumulated Other Comprehensive Income (Loss) into Income (effective portion) |
| | 2018 | | 2017 | | | | 2018 | | 2017 |
| | (in millions) |
| Foreign exchange forward contracts – Designated as cash flow hedging instruments | $ | (105 | ) | | $ | 159 |
| | Cost of revenues | | $ | 48 |
| | $ | 46 |
|
| | | | | | Selling, general and administrative expenses | | 8 |
| | 9 |
|
| | | | | | Total | | $ | 56 |
| | $ | 55 |
|
The activity related to the change in net unrealized gains on our cash flow hedges included in accumulated other comprehensive income (loss) is presented in Note 1012.
Other Derivatives
We use foreign exchange forward contracts, which have not been designated as hedges, to hedge balance sheet exposure to certain monetary assets and liabilities denominated in currencies, primarily the Indian rupee, and British pound and Euro, other than the functional currency of our foreign subsidiaries. We entered into a series of foreign exchange forward contracts that are scheduled to mature in 2018. Realized gains or losses and changes in the estimated fair value of these derivative financial instruments are recorded in the caption "Foreign currency exchange gains (losses), net" in our consolidated statements of operations.
Additional information related to our outstanding foreign exchange forward contracts not designated as hedging instruments is as follows:
|
| | | | | | | | | | | | | | | |
| | March 31, 2018 | | December 31, 2017 |
| | Notional | | Fair Value | | Notional | | Fair Value |
| | (in millions) |
| Contracts outstanding | $ | 301 |
| | $ | (1 | ) | | $ | 255 |
| | $ | (5 | ) |
|
| | | | | | | | | | | | | | | |
| | June 30, 2018 | | December 31, 2017 |
| | Notional | | Fair Value | | Notional | | Fair Value |
| | (in millions) |
| Contracts outstanding | $ | 432 |
| | $ | 4 |
| | $ | 255 |
| | $ | (5 | ) |
The following table provides information on the location and amounts of realized and unrealized pre-tax gains and losses on our other derivative financial instruments for the three and six months ended March 31:June 30:
|
| | | | | | | | | |
| | Location of Net Gains (Losses) on Derivative Instruments | | Amount of Net Gains (Losses) on Derivative Instruments |
| | | | 2018 | | 2017 |
| | | | (in millions) |
| Foreign exchange forward contracts – Not designated as hedging instruments | Foreign currency exchange gains (losses), net | | $ | 2 |
| | $ | (10 | ) |
|
| | | | | | | | | | | | | | | | | |
| | Location of Net Gains (Losses) on Derivative Instruments | | Amount of Net Gains (Losses) on Derivative Instruments |
| | | | Three Months Ended
June 30, | | Six Months Ended
June 30, |
| | | | 2018 | | 2017 | | 2018 | | 2017 |
| | | | (in millions) |
| Foreign exchange forward contracts – Not designated as hedging instruments | Foreign currency exchange gains (losses), net | | $ | 18 |
| | $ | (3 | ) | | $ | 20 |
| | $ | (13 | ) |
The related cash flow impacts of all of our derivative activities are reflected as cash flows from operating activities.
|
| | | | |
Note 911 — Fair Value Measurements |
We measure our cash equivalents, investments and foreign exchange forward contracts at fair value. The authoritative guidance defines fair value as the exit price, or the amount that would be received to sell an asset or paid to transfer a liability in an orderly transaction between market participants as of the measurement date. The authoritative guidance also establishes a fair value hierarchy that is intended to increase consistency and comparability in fair value measurements and related disclosures. The fair value hierarchy is based on inputs to valuation techniques that are used to measure fair value that are either observable or unobservable. Observable inputs reflect assumptions market participants would use in pricing an asset or liability based on market data obtained from independent sources while unobservable inputs reflect a reporting entity’s pricing based upon their own market assumptions.
The fair value hierarchy consists of the following three levels:
Level 1 – Inputs are quoted prices in active markets for identical assets or liabilities.
Level 2 – Inputs are quoted prices for similar assets or liabilities in an active market, quoted prices for identical or similar assets or liabilities in markets that are not active, inputs other than quoted prices that are observable and market-corroborated inputs which are derived principally from or corroborated by observable market data.
Level 3 – Inputs are derived from valuation techniques in which one or more significant inputs or value drivers are unobservable.
The following table summarizes our financial assets and (liabilities) measured at fair value on a recurring basis as of March 31,June 30, 2018:
| | | | Level 1 | | Level 2 | | Level 3 | | Total | Level 1 | | Level 2 | | Level 3 | | Total |
| | (in millions) | (in millions) |
| Cash equivalents: | | | | | | | | | | | | | | |
| Money market funds | $ | 335 |
| | $ | — |
| | $ | — |
| | $ | 335 |
| $ | 300 |
| | $ | — |
| | $ | — |
| | $ | 300 |
|
| Commercial paper | — |
| | 248 |
| | — |
| | 248 |
| |
| Certificates of deposit and commercial paper | | — |
| | 81 |
| | — |
| | 81 |
|
| Total cash equivalents | 335 |
| | 248 |
| | — |
| | 583 |
| 300 |
| | 81 |
| | — |
| | 381 |
|
| Short-term investments: | | | | | | | | | | | | | | |
Time deposits(1) | — |
| | 353 |
| | — |
| | 353 |
| — |
| | 472 |
| | — |
| | 472 |
|
| Available-for-sale investment securities: | | | | | | | | | | | | | | |
| U.S. Treasury and agency debt securities | 566 |
| | 68 |
| | — |
| | 634 |
| 572 |
| | 65 |
| | — |
| | 637 |
|
| Corporate and other debt securities | — |
| | 442 |
| | — |
| | 442 |
| — |
| | 435 |
| | — |
| | 435 |
|
| Certificates of deposit and commercial paper | — |
| | 563 |
| | — |
| | 563 |
| — |
| | 377 |
| | — |
| | 377 |
|
| Asset-backed securities | — |
| | 302 |
| | — |
| | 302 |
| — |
| | 303 |
| | — |
| | 303 |
|
| Municipal debt securities | — |
| | 128 |
| | — |
| | 128 |
| — |
| | 110 |
| | — |
| | 110 |
|
| Total available-for-sale investment securities | 566 |
| | 1,503 |
| | — |
| | 2,069 |
| 572 |
| | 1,290 |
| | — |
| | 1,862 |
|
| Held-to-maturity investment securities: | | | | | | | | | | | | | | |
| Commercial paper | — |
| | 461 |
| | — |
| | 461 |
| — |
| | 387 |
| | — |
| | 387 |
|
| Corporate and other debt securities | — |
| | 480 |
| | — |
| | 480 |
| — |
| | 597 |
| | — |
| | 597 |
|
| Total short-term held-to-maturity investment securities | — |
| | 941 |
| | — |
| | 941 |
| — |
| | 984 |
| | — |
| | 984 |
|
Total short-term investments(2) | 566 |
| | 2,797 |
| | — |
| | 3,363 |
| 572 |
| | 2,746 |
| | — |
| | 3,318 |
|
| Long-term investments: | | | | | | | | | | | | | | |
| Held-to-maturity investment securities: | | | | | | | | | | | | | | |
| Corporate and other debt securities | — |
| | 6 |
| | — |
| | 6 |
| — |
| | 6 |
| | — |
| | 6 |
|
| Total long-term held-to-maturity investment securities | — |
| | 6 |
| | — |
| | 6 |
| — |
| | 6 |
| | — |
| | 6 |
|
Total long-term investments(3) | — |
| | 6 |
| | — |
| | 6 |
| — |
| | 6 |
| | — |
| | 6 |
|
| Derivative financial instruments - foreign exchange forward contracts: | | | | | | | | | | | | | | |
| Other current assets | — |
| | 98 |
| | — |
| | 98 |
| — |
| | 40 |
| | — |
| | 40 |
|
| Accrued expenses and other current liabilities | — |
| | (2 | ) | | — |
| | (2 | ) | — |
| | (18 | ) | | — |
| | (18 | ) |
| Other noncurrent assets | — |
| | 9 |
| | — |
| | 9 |
| |
| Other noncurrent liabilities | — |
| | (1 | ) | | — |
| | (1 | ) | — |
| | (25 | ) | | — |
| | (25 | ) |
| Total | $ | 901 |
| | $ | 3,155 |
| | $ | — |
| | $ | 4,056 |
| $ | 872 |
| | $ | 2,830 |
| | $ | — |
| | $ | 3,702 |
|
| |
| (1) | Includes $348$419 million in restricted time deposits. See Note 149. |
| |
| (2) | Excludes an equity security invested in a mutual fund valued at $25 million based on the NAV of the fund. |
| |
| (3) | Excludes equity and cost method investments of $77$74 million, which are accounted for using the equity method of accounting and at cost, respectively. |
The following table summarizes our financial assets and (liabilities) measured at fair value on a recurring basis as of December 31, 2017:
|
| | | | | | | | | | | | | | | |
| | Level 1 | | Level 2 | | Level 3 | | Total |
| | (in millions) |
| Cash equivalents: | | | | | | | |
| Money market funds | $ | 334 |
| | $ | — |
| | $ | — |
| | $ | 334 |
|
| Bank deposits | — |
| | 80 |
| | — |
| | 80 |
|
| Commercial paper | — |
| | 386 |
| | — |
| | 386 |
|
| Total cash equivalents | 334 |
| | 466 |
| | — |
| | 800 |
|
| Short-term investments: | | | | | | | |
| Time deposits | — |
| | 389 |
| | — |
| | 389 |
|
| Available-for-sale investment securities: | | | | | | | |
| U.S. Treasury and agency debt securities | 585 |
| | 76 |
| | — |
| | 661 |
|
| Corporate and other debt securities | — |
| | 437 |
| | — |
| | 437 |
|
| Certificates of deposit and commercial paper | — |
| | 450 |
| | — |
| | 450 |
|
| Asset-backed securities | — |
| | 295 |
| | — |
| | 295 |
|
| Municipal debt securities | — |
| | 129 |
| | — |
| | 129 |
|
| Total available-for-sale investment securities | 585 |
| | 1,387 |
| | — |
| | 1,972 |
|
| Held-to-maturity investment securities: | | | | | | | |
| Commercial paper | — |
| | 397 |
| | — |
| | 397 |
|
| Corporate and other debt securities | — |
| | 345 |
| | — |
| | 345 |
|
| Total held-to-maturity investment securities | — |
|
| 742 |
|
| — |
|
| 742 |
|
Total short-term investments(1) | 585 |
| | 2,518 |
| | — |
| | 3,103 |
|
| Long-term investments: | | | | | | | |
| Held-to-maturity investment securities: | | | | | | | |
| Corporate and other debt securities | — |
| | 160 |
| | — |
| | 160 |
|
| Total held-to-maturity investment securities | — |
| | 160 |
| | — |
| | 160 |
|
Total long-term investments(2) | — |
| | 160 |
| | — |
| | 160 |
|
| Derivative financial instruments - foreign exchange forward contracts: | | | | | | | |
| Other current assets | — |
| | 134 |
| | — |
| | 134 |
|
| Accrued expenses and other current liabilities | — |
| | (5 | ) | | — |
| | (5 | ) |
| Other noncurrent assets | — |
| | 20 |
| | — |
| | 20 |
|
| Total | $ | 919 |
| | $ | 3,293 |
| | $ | — |
| | $ | 4,212 |
|
| |
| (1) | Excludes an equity security invested in a mutual fund valued at $25 million based on the NAV of the fund. |
| |
| (2) | Excludes equity and cost method investments of $74 million, which are accounted for using the equity method of accounting and at cost, respectively. |
We measure the fair value of money market funds and U.S. Treasury securities based on quoted prices in active markets for identical assets and therefore classify these assets as Level 1. The fair value of commercial paper, certificates of deposit, U.S. government agency securities, municipal debt securities, debt securities issued by supranational institutions, U.S. and international corporate bonds and foreign government debt securities is measured based on relevant trade data, dealer quotes, or model-driven valuations using significant inputs derived from or corroborated by observable market data, such as yield curves and credit spreads. We measure the fair value of our asset-backed securities using model-driven valuations based on significant inputs derived from or corroborated by observable market data such as dealer quotes, available trade information, spread data, current market assumptions on prepayment speeds and defaults and historical data on deal collateral performance. The carrying value of deposits approximated fair value as of March 31,June 30, 2018 and December 31, 2017.
We estimate the fair value of each foreign exchange forward contract by using a present value of expected cash flows model. This model calculates the difference between the current market forward price and the contracted forward price for each foreign
exchange contract and applies the difference in the rates to each outstanding contract. The market forward rates include a discount and credit risk factor. The amounts are aggregated by type of contract and maturity.
During the threesix months ended March 31,June 30, 2018 and the year ended December 31, 2017, there were no transfers among Level 1, Level 2, or Level 3 financial assets and liabilities.
|
| | | | |
Note 1012 — Stockholders' Equity |
Stock Repurchase Program
We have entered into multiple accelerated stock repurchase agreements, or ASRs, under our stock repurchase program authorized by our Board of Directors. The ASR activity and related information during the threesix months ended March 31,June 30, 2018 and the year ended December 31, 2017 were as follows:
|
| | | | | | | | | | | | | |
| | | Purchase Period End Date | | Number of Shares | | Average Repurchase Price per Share | | ASR Amount |
| | | | | (in millions) | | | | (in millions) |
| June 2018 ASR | | (1) | | 6.5 |
| (1) | (1) | | $ | 600 |
|
| March 2018 ASR | | May 2018 | | 3.7 |
| (2) | $ | 79.95 |
| | $ | 300 |
|
| December 2017 ASR | | March 2018 | | 4.0 |
| (3) | $ | 75.75 |
| | $ | 300 |
|
| March 2017 ASR | | August 2017 | | 23.7 |
| | $ | 63.19 |
| | $ | 1,500 |
|
|
| | | | | | | | | | | | | |
| | | Purchase Period End Date | | Number of Shares | | Average Repurchase Price per Share | | ASR Amount |
| | | | | (in millions) | | | | (in millions) |
| March 2018 ASR | | (1) | | 3.0 |
| (1) | (1) | | $ | 300 |
|
| December 2017 ASR | | March 2018 | | 4.0 |
| (2) | $ | 75.75 |
| | $ | 300 |
|
| March 2017 ASR | | August 2017 | | 23.7 |
| | $ | 63.19 |
| | $ | 1,500 |
|
___________________
| |
| (1) | Under the terms of the MarchJune 2018 ASR and in exchange for up-front payments of $300$600 million, the financial institution initially delivered 3.06.5 million shares, a portion of the Company's total expected shares to be repurchased under the MarchJune 2018 ASR. The total number of shares ultimately delivered, and therefore the average price paid per share, will be determined at the end of the purchase period, which is scheduled to end during the secondthird quarter of 2018, based on the volume-weighted average price of the Company's common stock during that period. |
| |
| (2) | Includes 3.0 million shares initially delivered in March 2018 and 0.7 million shares delivered in May 2018 upon the final settlement of the ASR. |
| |
| (3) | Includes 3.6 million shares initially delivered in December 2017 and 0.4 million shares delivered in March 2018 upon the final settlement of the ASR. |
Our stock repurchase program allows for the repurchase of $3,500 million of our outstanding shares of Class A common stock, excluding fees and expenses, through December 31, 2019. As of March 31,June 30, 2018, the remaining available balance under our stock repurchase program was $1,400$800 million.
Stock repurchases were made in connection with our stock-based compensation plans, whereby Company shares were tendered by employees for payment of applicable statutory tax withholdings. In 2017, we also repurchased a limited number of shares from employees at the repurchase date market price. For the threesix months ended March 31,June 30, 2018 and 2017, such repurchases totaled 0.20.6 million shares at an aggregate cost of $16$49 million, and 0.20.7 million shares at an aggregate cost of $14$44 million, respectively.
Dividends
Dividends on our Class A common stock, including dividend equivalents, during the periods presented were as follows:
| | | | | Dividends per Share | | Amount | | Dividends per Share | | Amount |
| | | | | (in millions) | | | | (in millions) |
| 2018: | | | | | | | | |
| Three months ended March 31, 2018 | | $ | 0.20 |
| | $ | 119 |
| | $ | 0.20 |
| | $ | 119 |
|
| Three months ended June 30, 2018 | | | 0.20 |
| | 119 |
|
| Six months ended June 30, 2018 | | | | | $ | 238 |
|
| 2017: | | | | | | | | |
| Three months ended June 30, 2017 | | $ | 0.15 |
| | $ | 89 |
| | $ | 0.15 |
| | $ | 89 |
|
| Three months ended September 30, 2017 | | 0.15 |
| | 90 |
| | 0.15 |
| | 90 |
|
| Three months ended December 31, 2017 | | 0.15 |
| | 89 |
| | 0.15 |
| | 89 |
|
| Year ended December 31, 2017 | | | | $ | 268 |
| | | | $ | 268 |
|
On August 2, 2018, our Board of Directors approved the Company's declaration of a $0.20 per share dividend with a record date of August 22, 2018 and a payment date of August 31, 2018.
Accumulated Other Comprehensive Income (Loss)
Changes in accumulated other comprehensive income (loss) by component were as follows for the three and six months ended March 31,June 30, 2018:
| | | | Three Months | Three Months | | Six Months |
| | Before Tax Amount | | Tax Effect | | Net of Tax Amount | Before Tax Amount | | Tax Effect | | Net of Tax Amount | | Before Tax
Amount | | Tax
Effect | | Net of Tax
Amount |
| | (in millions) | (in millions) |
| Foreign currency translation adjustments: | | | | | | | | | | | | | | | | |
| Beginning balance | $ | (38 | ) | | $ | — |
| | $ | (38 | ) | $ | 3 |
| | $ | (4 | ) | | $ | (1 | ) | | $ | (38 | ) | | $ | — |
| | $ | (38 | ) |
| Change in foreign currency translation adjustments | 41 |
| | (4 | ) | | 37 |
| (82 | ) | | 11 |
| | (71 | ) | | (41 | ) | | 7 |
| | (34 | ) |
| Ending balance | $ | 3 |
| | $ | (4 | ) | | $ | (1 | ) | $ | (79 | ) | | $ | 7 |
| | $ | (72 | ) | | $ | (79 | ) | | $ | 7 |
| | $ | (72 | ) |
| | | | | | | | | | | | | | | | | |
| Unrealized (losses) on available-for-sale investment securities: | | | | | | | | | | | | | | | | |
| Beginning balance | $ | (11 | ) | | $ | 4 |
| | $ | (7 | ) | $ | (19 | ) | | $ | 4 |
| | $ | (15 | ) | | $ | (11 | ) | | $ | 4 |
| | $ | (7 | ) |
Cumulative effect of change in accounting principle(1) | — |
| | (1 | ) | | (1 | ) | — |
| | — |
| | — |
| | — |
| | (1 | ) | | (1 | ) |
| Net unrealized (losses) arising during the period | (9 | ) | | 1 |
| | (8 | ) | (1 | ) | | 1 |
| | — |
| | (10 | ) | | 2 |
| | (8 | ) |
| Reclassification of net losses to Other, net | 1 |
| | — |
| | 1 |
| 1 |
| | — |
| | 1 |
| | 2 |
| | — |
| | 2 |
|
| Net change | (8 | ) | | — |
| | (8 | ) | — |
| | 1 |
| | 1 |
| | (8 | ) | | 1 |
| | (7 | ) |
| Ending balance | $ | (19 | ) | | $ | 4 |
| | $ | (15 | ) | $ | (19 | ) | | $ | 5 |
| | $ | (14 | ) | | $ | (19 | ) | | $ | 5 |
| | $ | (14 | ) |
| | | | | | | | | | | | | | | | | |
| Unrealized gains on cash flow hedges: | | | | | | | | | | | | | | | | |
| Beginning balance | $ | 154 |
| | $ | (39 | ) | | $ | 115 |
| $ | 105 |
| | $ | (26 | ) | | $ | 79 |
| | $ | 154 |
| | $ | (39 | ) | | $ | 115 |
|
| Unrealized (losses) arising during the period | (14 | ) | | 5 |
| | (9 | ) | (91 | ) | | 19 |
| | (72 | ) | | (105 | ) | | 24 |
| | (81 | ) |
| Reclassifications of net (gains) to: | | | | | | | | | | | | | | | | |
| Cost of revenues | (30 | ) | | 7 |
| | (23 | ) | (18 | ) | | 5 |
| | (13 | ) | | (48 | ) | | 12 |
| | (36 | ) |
| Selling, general and administrative expenses | (5 | ) | | 1 |
| | (4 | ) | (3 | ) | | 1 |
| | (2 | ) | | (8 | ) | | 2 |
| | (6 | ) |
| Net change | (49 | ) | | 13 |
| | (36 | ) | (112 | ) | | 25 |
| | (87 | ) | | (161 | ) | | 38 |
| | (123 | ) |
| Ending balance | $ | 105 |
| | $ | (26 | ) | | $ | 79 |
| $ | (7 | ) | | $ | (1 | ) | | $ | (8 | ) | | $ | (7 | ) | | $ | (1 | ) | | $ | (8 | ) |
| | | | | | | | | | | | | | | | | |
| Accumulated other comprehensive income (loss): | | | | | | | | | | | | | | | | |
| Beginning balance | $ | 105 |
| | $ | (35 | ) | | $ | 70 |
| $ | 89 |
| | $ | (26 | ) | | $ | 63 |
| | $ | 105 |
| | $ | (35 | ) | | $ | 70 |
|
| Other comprehensive income (loss) | (16 | ) | | 9 |
| | (7 | ) | (194 | ) | | 37 |
| | (157 | ) | | (210 | ) | | 46 |
| | (164 | ) |
| Ending balance | $ | 89 |
| | $ | (26 | ) | | $ | 63 |
| $ | (105 | ) | | $ | 11 |
| | $ | (94 | ) | | $ | (105 | ) | | $ | 11 |
| | $ | (94 | ) |
| |
| (1) | Reflects the adoption of accounting standards as described in Note 1. |
Changes in accumulated other comprehensive income (loss) by component were as follows for the three and six months ended March 31,June 30, 2017:
| | | | Three Months | Three Months | | Six Months |
| | Before Tax Amount | | Tax Effect | | Net of Tax Amount | Before Tax Amount | | Tax Effect | | Net of Tax Amount | | Before Tax
Amount | | Tax
Effect | | Net of Tax
Amount |
| | (in millions) | (in millions) |
| Foreign currency translation adjustments: | | | | | | | | | | | | | | | | |
| Beginning balance | $ | (149 | ) | | $ | — |
| | $ | (149 | ) | $ | (132 | ) | | $ | — |
| | $ | (132 | ) | | $ | (149 | ) | | $ | — |
| | $ | (149 | ) |
| Change in foreign currency translation adjustments | 17 |
| | — |
| | 17 |
| 50 |
| | — |
| | 50 |
| | 67 |
| | — |
| | 67 |
|
| Ending balance | $ | (132 | ) | | $ | — |
| | $ | (132 | ) | $ | (82 | ) | | $ | — |
| | $ | (82 | ) | | $ | (82 | ) | | $ | — |
| | $ | (82 | ) |
| | | | | | | | | | | | | | | | | |
| Unrealized gains on available-for-sale investment securities: | | | | | | |
| Unrealized gains (losses) on available-for-sale investment securities: | | | | | | | | | | | | |
| Beginning balance | $ | (6 | ) | | $ | 2 |
| | $ | (4 | ) | $ | (4 | ) | | $ | 1 |
| | $ | (3 | ) | | $ | (6 | ) | | $ | 2 |
| | $ | (4 | ) |
| Net unrealized gains arising during the period | 2 |
| | (1 | ) | | 1 |
| 1 |
| | — |
| | 1 |
| | 3 |
| | (1 | ) | | 2 |
|
| Reclassification of net (gains) to Other, net | — |
| | — |
| | — |
| — |
| | — |
| | — |
| | — |
| | — |
| | — |
|
| Net change | 2 |
| | (1 | ) | | 1 |
| 1 |
| | — |
| | 1 |
| | 3 |
| | (1 | ) | | 2 |
|
| Ending balance | $ | (4 | ) | | $ | 1 |
| | $ | (3 | ) | $ | (3 | ) | | $ | 1 |
| | $ | (2 | ) | | $ | (3 | ) | | $ | 1 |
| | $ | (2 | ) |
| | | | | | | | | | | | | | | | | |
| Unrealized gains (losses) on cash flow hedges: | | | | | | |
| Unrealized gains on cash flow hedges: | | | | | | | | | | | | |
| Beginning balance | $ | 51 |
| | $ | (12 | ) | | $ | 39 |
| $ | 155 |
| | $ | (37 | ) | | $ | 118 |
| | $ | 51 |
| | $ | (12 | ) | | $ | 39 |
|
| Unrealized gains arising during the period | 124 |
| | (30 | ) | | 94 |
| 35 |
| | (9 | ) | | 26 |
| | 159 |
| | (39 | ) | | 120 |
|
| Reclassifications of net (gains) to: | | | | | | | | | | | | | | | | |
| Cost of revenues | (17 | ) | | 4 |
| | (13 | ) | (29 | ) | | 7 |
| | (22 | ) | | (46 | ) | | 11 |
| | (35 | ) |
| Selling, general and administrative expenses | (3 | ) | | 1 |
| | (2 | ) | (6 | ) | | 1 |
| | (5 | ) | | (9 | ) | | 2 |
| | (7 | ) |
| Net change | 104 |
| | (25 | ) | | 79 |
| — |
| | (1 | ) | | (1 | ) | | 104 |
| | (26 | ) | | 78 |
|
| Ending balance | $ | 155 |
| | $ | (37 | ) | | $ | 118 |
| $ | 155 |
| | $ | (38 | ) | | $ | 117 |
| | $ | 155 |
| | $ | (38 | ) | | $ | 117 |
|
| | | | | | | | | | | | | | | | | |
| Accumulated other comprehensive income (loss): | | | | | | | | | | | | | | | | |
| Beginning balance | $ | (104 | ) | | $ | (10 | ) | | $ | (114 | ) | $ | 19 |
| | $ | (36 | ) | | $ | (17 | ) | | $ | (104 | ) | | $ | (10 | ) | | $ | (114 | ) |
| Other comprehensive income (loss) | 123 |
| | (26 | ) | | 97 |
| 51 |
| | (1 | ) | | 50 |
| | 174 |
| | (27 | ) | | 147 |
|
| Ending balance | $ | 19 |
| | $ | (36 | ) | | $ | (17 | ) | $ | 70 |
| | $ | (37 | ) | | $ | 33 |
| | $ | 70 |
| | $ | (37 | ) | | $ | 33 |
|
|
| | | | |
Note 1113 — Commitments and Contingencies |
We are involved in various claims and legal actions arising in the ordinary course of business. We accrue a liability when a loss is considered probable and the amount can be reasonably estimated. When a material loss contingency is reasonably possible but not probable, we do not record a liability, but instead disclose the nature and the amount of the claim, and an estimate of the loss or range of loss, if such an estimate can be made. Legal fees are expensed as incurred. In the opinion of management, the outcome of any existing claims and legal or regulatory proceedings, other than the specific matters described below, if decided adversely, is not expected to have a material adverse effect on our business, financial condition, results of operations and cash flows.
We are conducting an internal investigation focused on whether certain payments relating to Company-owned facilities in India were made improperly and in possible violation of the FCPA and other applicable laws. The investigation is also examining various other payments made in small amounts in India that may not have complied with Company policy or applicable law. In September 2016, we voluntarily notified the DOJ and SEC and are cooperating fully with both agencies. The investigation is being conducted under the oversight of the Audit Committee, with the assistance of outside counsel. To date, the investigation has identified a total of approximately $6 million in payments made between 2009 and 2016 that may have been improper. During the year ended December 31, 2016, we recorded out-of-period corrections related to $4 million of such payments that were previously capitalized that should have been expensed. These out-of-period corrections and the other $2 million in potentially improper payments were not material to any previously issued financial statements. There were no adjustments recorded during 2018 and 2017 related to the amounts under investigation.
On October 5, 2016, October 27, 2016, and November 18, 2016, three putative securities class action complaints were filed in the United States District Court for the District of New Jersey, naming us and certain of our current and former officers as
defendants. In an order dated February 3, 2017, the United States District Court for the District of New Jersey consolidated the three putative securities class actions into a single action and appointed lead plaintiffs and lead counsel. On April 7, 2017, the lead plaintiffs filed a consolidated amended complaint on behalf of a putative class of stockholders who purchased our common stock during the period between February 27, 2015 and September 29, 2016, naming us and certain of our current and former officers as defendants and alleging violations of the Exchange Act, based on allegedly false or misleading statements related to potential violations of the FCPA, our business, prospects and operations, and the effectiveness of our internal controls over financial reporting and our disclosure controls and procedures. The lead plaintiffs seek an award of compensatory damages, among other relief, and their reasonable costs and expenses, including attorneys’ fees. Under a stipulation filed by the parties on February 23, 2017, defendants filed motions to dismiss the consolidated amended complaint on June 6, 2017, plaintiffs filed an opposition brief on July 21, 2017 responding to defendants’ motions to dismiss, and defendants filed reply briefs in further support of their motions to dismiss on September 5, 2017. On September 5, 2017, defendants also filed a motion to strike certain allegations in the consolidated amended complaint, plaintiffs filed an opposition to the motion to strike on October 2, 2017, and, on October 10, 2017, we filed a reply brief in further support of the motion to strike.
On October 31, 2016, November 15, 2016, and November 18, 2016, three putative shareholder derivative complaints were filed in New Jersey Superior Court, Bergen County, naming us, all of our then current directors and certain of our current and former officers as defendants. On January 24, 2017, the New Jersey Superior Court, Bergen County, consolidated the three putative shareholder derivative actions filed in that court into a single action and appointed lead plaintiff and lead counsel. The complaints assert claims for breach of fiduciary duty, corporate waste, unjust enrichment, abuse of control, mismanagement, and/or insider selling by defendants. On March 16, 2017, the parties filed a stipulation deferring all further proceedings pending a final, non-appealable ruling on the then anticipated motion to dismiss the consolidated putative securities class action. On April 26, 2017, in lieu of ordering the stipulation filed by the parties, the New Jersey Superior Court deferred further proceedings by dismissing the consolidated putative shareholder derivative litigation without prejudice but permitting the parties to file a motion to vacate the dismissal in the future. On February 22, 2017, a fourth putative shareholder derivative complaint asserting similar claims was filed in the United States District Court for the District of New Jersey, naming us and certain of our then current directors as defendants. On April 5, 2017, the United States District Court for the District of New Jersey entered an order staying all proceedings pending a final, non-appealable ruling on the then anticipated motion to dismiss the consolidated putative securities class action. On April 7, 2017, a fifth putative shareholder derivative complaint was filed in the United States District Court for the District of New Jersey, naming us, certain of our then current directors, and certain of our current and former officers as defendants. The complaint in that action asserts claims similar to those in the previously-filed putative shareholder derivative actions, but also adds a claim for violations of Section 10(b) of the Exchange Act against the individual defendants. On May 10, 2017, a sixth putative shareholder derivative complaint was filed in the United States District Court for the District of New Jersey, naming us, certain of our then current directors, and certain of our current and former officers as defendants. The complaint in that action asserts claims similar to those in the previously-filed putative shareholder derivative actions, but also adds a claim for violations of Section 14(a) of the Exchange Act against the individual defendants. In an order dated June 20, 2017, the United States District Court for the District of New Jersey consolidated the three putative shareholder derivative actions filed in that court into a single action, appointed lead plaintiff and lead counsel, and stayed all further proceedings pending a final, non-appealable ruling on the motions to dismiss the consolidated putative securities class action. All of the putative shareholder derivative complaints allege among other things that certain of our public disclosures were false and misleading by failing to disclose that payments allegedly in violation of the FCPA had been made and by asserting that management had determined that our internal controls were effective. The plaintiffs seek awards of compensatory damages and restitution to the Company as a result of the alleged violations and their costs and attorneys’ fees, experts’ fees, and other litigation expenses, among other relief.
We are presently unable to predict the duration, scope or result of the internal investigation, any investigations by the DOJ or the SEC, the consolidated putative securities class action, the putative shareholder derivative actions or any other lawsuits. As such, we are presently unable to develop a reasonable estimate of a possible loss or range of losses, if any, and thus have not recorded any accruals related to these matters. The DOJ and the SEC have a broad range of civil and criminal sanctions under the FCPA and other laws and regulations including injunctive relief, disgorgement, fines, penalties, modifications to business practices, including the termination or modification of existing business relationships, the imposition of compliance programs and the retention of a monitor to oversee compliance with the FCPA. In addition, the DOJ and the SEC could bring enforcement actions against the Company or individuals, including former members of senior management. Such actions, if brought, could result in dispositions, judgments, settlements, fines, injunctions, cease and desist orders, debarment or other civil or criminal penalties against the Company or such individuals.
We expect to incur additional expenses related to remedial measures, and may incur additional expenses related to fines. The imposition of any sanctions or the implementation of remedial measures could have a material adverse effect on our business, annual and interim results of operations, cash flows and financial condition. Furthermore, while the Company intends to defend
the lawsuits vigorously, these lawsuits and any other related lawsuits are subject to inherent uncertainties, the actual cost of such litigation will depend upon many unknown factors and the outcome of the litigation is necessarily uncertain.
We have indemnification and expense advancement obligations pursuant to our Bylaws and indemnification agreements with respect to certain current and former members of senior management and the Company’s directors. In connection with the ongoing internal investigation, we have received requests under such indemnification agreements and our Bylaws to provide funds for legal fees and other expenses, and expect additional requests in connection with the investigation and related litigation. We have not recorded any liability for these matters as of March 31,June 30, 2018 as we cannot estimate the ultimate outcome at this time but have expensed payments made through March 31,June 30, 2018.
We have maintained directors and officers insurance, from which a portion of the indemnification expenses and costs related to the putative securities class action complaints may be recoverable, and have recorded an insurance receivable of less than $1 million as of March 31,June 30, 2018.
See Note 79 for information relating to the ITD Dispute. Many of our engagements involve projects that are critical to the operations of our customers’ business and provide benefits that are difficult to quantify. Any failure in a customer’s systems or our failure to meet our contractual obligations to our customers, including any breach involving a customer’s confidential information or sensitive data, or our obligations under applicable laws or regulations could result in a claim for substantial damages against us, regardless of our responsibility for such failure. Although we attempt to contractually limit our liability for damages arising from negligent acts, errors, mistakes, or omissions in rendering our services, there can be no assurance that the limitations of liability set forth in our contracts will be enforceable in all instances or will otherwise protect us from liability for damages. Although we have general liability insurance coverage, including coverage for errors or omissions, there can be no assurance that such coverage will cover all types of claims, continue to be available on reasonable terms or will be available in sufficient amounts to cover one or more large claims, or that the insurer will not disclaim coverage as to any future claim. The successful assertion of one or more large claims against us that exceed or are not covered by our insurance coverage or changes in our insurance policies, including premium increases or the imposition of large deductible or co-insurance requirements, could have a material adverse effect on our business, results of operations, financial condition and cash flows.
In the normal course of business and in conjunction with certain customer engagements, we have entered into contractual arrangements through which we may be obligated to indemnify customers or other parties with whom we conduct business with respect to certain matters. These arrangements can include provisions whereby we agree to hold the indemnified party and certain of their affiliated entities harmless with respect to third-party claims related to such matters as our breach of certain representations or covenants, our intellectual property infringement, our gross negligence or willful misconduct or certain other claims made against certain parties. Payments by us under any of these arrangements are generally conditioned on the customer making a claim and providing us with full control over the defense and settlement of such claim. It is not possible to determine the maximum potential liability under these indemnification agreements due to the unique facts and circumstances involved in each particular agreement. Historically, we have not made payments under these indemnification agreements and therefore they have not had any impact on our operating results, financial position, or cash flows. However, if events arise requiring us to make payment for indemnification claims under our indemnification obligations in contracts we have entered, such payments could have material impact on our business, results of operations, financial condition and cash flows.
|
| | | | |
Note 1214 — Related Party Transactions |
Brackett B. Denniston, III was the Interim General Counsel and an executive officer of the Company from December 2016 until May 15, 2017, during which period Mr. Denniston was also a Senior Counsel at the law firm of Goodwin Procter LLP, or Goodwin. During the three and six months ended March 31,June 30, 2017, Goodwin performed legal services for the Company for which it earned approximately $2 million.$1 million and $3 million, respectively. For such period and other periods when Goodwin was a related party of the Company, the provision of legal services from Goodwin was reviewed and approved by our Audit Committee. During the threesix months ended March 31,June 30, 2018, Goodwin was not a related party of the Company.
|
| | | | |
Note 1315 — Segment Information |
Our reportable segments are:
Financial Services, which consists of our banking and insurance operating segments;
Healthcare, which consists of our healthcare and life sciences operating segments;
Products and Resources, which consists of our retail and consumer goods, manufacturing and logistics, travel and hospitality, and energy and utilities operating segments; and
Communications, Media and Technology, which includes our communications and media operating segment and our technology operating segment.
Our sales managers, account executives, account managers and project teams are aligned in accordance with the specific industries they serve. Our chief operating decision maker evaluates the Company’s performance and allocates resources based on segment revenues and operating profit. Segment operating profit is defined as income from operations before unallocated costs. Generally, operating expenses for each operating segment have similar characteristics and are subject to the same factors, pressures and challenges. However, the economic environment and its effects on industries served by our operating segments may affect revenues and operating expenses to differing degrees.
In 2018, we made changes to the internal measurement of segment operating profits for the purpose of evaluating segment performance and resource allocation. The primary reason for the changes is to charge to our business segments costs that are directly managed and controlled by them. Specifically, segment operating profit now includes the stock-based compensation expense of sales managers, account executives, account managers and project teams, which was previously included in "unallocated costs." In addition, we have changed the methodology of charging our business segments for the use of our global delivery centers and infrastructure from a fixed per employee charge to a variable per employee charge.charge that differs depending on location and assets deployed. We have reported our segment operating profits using the new measurement methodology and have restated the prior period results to conform to the new methodology.
Expenses included in segment operating profit consist principally of direct selling and delivery costs (including stock-based compensation expense) as well as a per employee charge for use of our global delivery centers and infrastructure. Certain selling, general and administrative expenses, excess or shortfall of incentive compensation for delivery personnel as compared to target, costs related to our realignment program, a portion of depreciation and amortization and the impact of the settlements of our cash flow hedges are not allocated to individual segments in internal management reports used by the chief operating decision maker. Accordingly, such expenses are excluded from segment operating profit and are separately disclosed as “unallocated costs” and adjusted against our total income from operations. Additionally, management has determined that it is not practical to allocate identifiable assets by segment, since such assets are used interchangeably among the segments.
As described in Note 3 to our unaudited consolidated financial statements, on January 1, 2018, we adopted the New Revenue Standard, using the modified retrospective method. Results for reporting periods beginning after January 1, 2018 are presented under the New Revenue Standard, while prior period amounts are not adjusted and continue to be reported in accordance with our historic accounting policies.
Revenues from external customers and segment operating profit,profits, before unallocated expenses, by reportable segment were as follows:
|
| | | | | | | | | | | | | | | |
| | Three Months Ended
June 30, | | Six Months Ended
June 30, |
| | 2018 | | 2017 | | 2018 | | 2017 |
| | (in millions) |
| Revenues: | | | | | | | |
| Financial Services | $ | 1,469 |
| | $ | 1,406 |
| | $ | 2,930 |
| | $ | 2,782 |
|
| Healthcare | 1,156 |
| | 1,050 |
| | 2,277 |
| | 2,053 |
|
| Products and Resources | 840 |
| | 747 |
| | 1,661 |
| | 1,484 |
|
| Communications, Media and Technology | 541 |
| | 467 |
| | 1,050 |
| | 897 |
|
| Total revenues | $ | 4,006 |
| | $ | 3,670 |
| | $ | 7,918 |
| | $ | 7,216 |
|
| | | | | | | | |
| Segment Operating Profit: | | | | | | | |
| Financial Services | $ | 462 |
| | $ | 445 |
| | $ | 909 |
| | $ | 872 |
|
| Healthcare | 357 |
| | 345 |
| | 695 |
| | 619 |
|
| Products and Resources | 258 |
| | 230 |
| | 514 |
| | 447 |
|
| Communications, Media and Technology | 179 |
| | 156 |
| | 338 |
| | 291 |
|
| Total segment operating profit | 1,256 |
| | 1,176 |
| | 2,456 |
| | 2,229 |
|
Less: unallocated costs(1) | 586 |
| | 570 |
| | 1,093 |
| | 1,053 |
|
| Income from operations | $ | 670 |
| | $ | 606 |
| | $ | 1,363 |
| | $ | 1,176 |
|
|
| | | | | | | |
| | Three Months Ended
March 31, |
| | 2018 | | 2017 |
| | (in millions) |
| Revenues: | | | |
| Financial Services | $ | 1,461 |
| | $ | 1,376 |
|
| Healthcare | 1,121 |
| | 1,003 |
|
| Products and Resources | 821 |
| | 737 |
|
| Communications, Media and Technology | 509 |
| | 430 |
|
| Total revenues | $ | 3,912 |
| | $ | 3,546 |
|
| | | | |
| Segment Operating Profit: | | | |
| Financial Services | $ | 447 |
| | $ | 427 |
|
| Healthcare | 338 |
| | 274 |
|
| Products and Resources | 256 |
| | 217 |
|
| Communications, Media and Technology | 159 |
| | 135 |
|
| Total segment operating profit | 1,200 |
| | 1,053 |
|
| Less: unallocated costs | 507 |
| | 483 |
|
| Income from operations | $ | 693 |
| | $ | 570 |
|
| |
| (1) | In the second quarter of 2018, we provided $100 million of initial funding to Cognizant U.S. Foundation, which is focused on science, technology, engineering and math (or collectively, STEM) education in the United States. This charge was recorded in unallocated costs for the three and six months ended June 30, 2018. |
Geographic Area Information
Revenue and long-lived assets, by geographic area, are as follows:
| | | | Three Months Ended
March 31, | Three Months Ended
June 30, | | Six Months Ended
June 30, |
| | 2018 | | 2017 | 2018 | | 2017 | | 2018 | | 2017 |
| | (in millions) | (in millions) |
Revenues: (1) | | | | | | | | | | |
North America(2) | $ | 2,975 |
| | $ | 2,761 |
| $ | 3,067 |
| | $ | 2,851 |
| | $ | 6,042 |
| | $ | 5,612 |
|
| United Kingdom | 310 |
| | 274 |
| 309 |
| | 288 |
| | 619 |
| | 562 |
|
| Rest of Europe | 374 |
| | 285 |
| 381 |
| | 291 |
| | 755 |
| | 576 |
|
| Europe - Total | 684 |
| | 559 |
| 690 |
| | 579 |
| | 1,374 |
| | 1,138 |
|
Rest of World (3) | 253 |
| | 226 |
| 249 |
| | 240 |
| | 502 |
| | 466 |
|
| Total | $ | 3,912 |
| | $ | 3,546 |
| |
| Total revenues | | $ | 4,006 |
| | $ | 3,670 |
| | $ | 7,918 |
| | $ | 7,216 |
|
| | | | As of | As of |
| | March 31, 2018 | | December 31, 2017 | June 30, 2018 | | December 31, 2017 |
| | (in millions) | (in millions) |
Long-lived Assets: (4) | | | | | | |
North America(2) | $ | 387 |
| | $ | 360 |
| $ | 403 |
| | $ | 360 |
|
| Europe | 66 |
| | 63 |
| 82 |
| | 63 |
|
Rest of World (3)(5) | 880 |
| | 901 |
| 860 |
| | 901 |
|
| Total | $ | 1,333 |
| | $ | 1,324 |
| $ | 1,345 |
| | $ | 1,324 |
|
________________
| |
| (1) | Revenues are attributed to regions based upon customer location. |
| |
| (2) | Substantially all relates to operations in the United States. |
| |
| (3) | Includes our operations in Asia Pacific, the Middle East and Latin America. |
| |
| (4) | Long-lived assets include property and equipment, net of accumulated depreciation and amortization. |
| |
| (5) | Substantially all of these long-lived assets relate to our operations in India. |
|
| | | | |
Note 14 — Subsequent Events |
Business Combination
In April 2018, we completed the previously announced acquisition of Bolder Healthcare Solutions, a privately-held U.S. provider of revenue cycle management solutions to the healthcare industry for initial consideration of approximately $477 million. This acquisition expands our healthcare consulting, technology, and business process services portfolio and strengthens our position in digital healthcare technology and operations.
Restricted Cash and Time Deposits
Based on the April 2018 events related to the dispute with the ITD with respect to the 2016 India Cash Remittance described in Note 7, we have classified the March 31, 2018 cash and time deposits affected by the dispute with the ITD as restricted assets. The following table summarizes total restricted assets that are included in our consolidated statements of financial position as of March 31, 2018: |
| | | |
| | Restricted Assets |
| | (in millions) |
Restricted cash (1) | $ | 159 |
|
Short-term investments (2) | 348 |
|
| Total restricted assets at March 31, 2018 | $ | 507 |
|
| |
(1) | The restricted cash balance at March 31, 2018 is composed of $76 million of cash that in April 2018 was placed in a segregated account with the ITD and $83 million of cash that, in April 2018, was invested into a time deposit and placed under lien by court order. |
| |
(2) | The restricted short-term investments balance consists of time deposits in India as of March 31, 2018 that were subsequently restricted by court order in April 2018. This balance of $348 million, together with the additional deposit of $83 million described in note (1), comprise the $431 million of deposits currently subject to lien.
|
There were no restricted cash and deposits as of December 31, 2017.
The following table provides a reconciliation of cash, cash equivalents and restricted cash reported within the consolidated statements of financial position to the amounts shown in the consolidated statements of cash flows:
|
| | | | | | | |
| | March 31 |
| | 2018 | | 2017 |
| | (in millions) |
| Cash and cash equivalents | $ | 1,440 |
| | $ | 1,308 |
|
| Restricted cash | 159 |
| | — |
|
| Total cash, cash equivalents and restricted cash | $ | 1,599 |
| | $ | 1,308 |
|
See Note 7 for additional information on the ITD Dispute.
Dividend
On May 4, 2018, our Board of Directors approved the Company's declaration of a $0.20 per share dividend with a record date of May 22, 2018 and a payment date of May 31, 2018.
|
| | | |
| Item 2. Management’s Discussion and Analysis of Financial Condition and Results of Operations. |
We are one of the world’s leading professional services companies. We are in business to help our customers adapt, compete and grow in the face of continual shifts and disruptions within their markets. We do so by partnering with them to apply technology to transform their business, operating, and technology models, allowing them to achieve the full value of digitizing their entire enterprises. We call this being “digital at scale.” When implemented, it enables customers to achieve more efficient and effective operations while reshaping their business models for innovation and growth. Our industry-based, consultative approach helps customers envision, build and run more innovative and efficient businesses. Our core competencies include: business, process, operations and technology consulting, application development and systems integration, enterprise information management, application testing, application maintenance, information technology, or IT, infrastructure services, and business process services. We tailor our services and solutions to specific industries and use an integrated global delivery model that employs customer service teams based at customer locations and delivery teams located at dedicated global and regional delivery centers.
In 2017, we began a realignment of our business to improve the overall efficiency of our operations while continuing to drive revenue growth. As a continuation of this realignment program, we intend to take additional actions during the remainder of 2018 to further improve our cost structure primarily by optimizing our resource pyramid. As a result of these actions, we expect to incur $25 million to $35 million in severance costs during the remainder of 2018. The final amount and timing of these charges is uncertain and may change as the severance program continues to develop. In addition, to accelerate our shift to digital services and solutions, we are deployingcontinuing to deploy the following strategies: aligning our digital services and solutions along three practice areas, investing to scale these digital practice areas across our business segments and geographies, continuing to develop our core business and selectively targeting higher margin work within our core business. We believe thesethe above actions and strategies will enable us to gradually expand our non-GAAP operating margins1 with the goal of achieving 22% non-GAAP operating margin1 in 2019. There can be no assurances that we will be successful in achieving the objectives of these plans or that other factors beyond our control, including the various risks set forth in "Part I, Item 1A. Risk Factors” in our Annual Report on Form 10-K for the year ended December 31, 2017, will not cause us to fail to achieve the targeted improvements.
In February 2017, we announced a plan to return $3.4 billion to our stockholders over a two-year period. To date, as part of this plan, we have repurchased $2.1$2.7 billion of stock through accelerated stock repurchase agreements, or ASRs, and paid dividends of $383$501 million. In May 2017, we initiated a quarterly cash dividend and, in February 2018, we increased our quarterly dividend to $0.20 per share from $0.15 per share. In the first quarter of 2018, we paid dividends totaling $118 million. On an ongoing basis, we review our capital return plan, considering our financial performance and liquidity position, investments required to execute our strategic initiatives, the economic outlook, regulatory changes and other relevant factors. We are currently evaluating the impact of the Tax Cuts and Jobs Act, or Tax Reform Act, on our capital return plan.
On January 1, 2018, we adopted ASC Topic 606, “Revenue from Contracts with Customers,” or New Revenue Standard, using the modified retrospective method. Results for reporting periods beginning after January 1, 2018 are presented under the New Revenue Standard, while prior period amounts are not adjusted and continue to be reported in accordance with our historic accounting policies. For the three months ended March 31,June 30, 2018, adoption of the New Revenue Standard had a positive impact on revenue of $21$31 million, income from operations of $29$38 million and diluted earnings per share of $0.04$0.05 per share. See Note 3 to our unaudited consolidated financial statements for additional information. The following table sets forth summarized operating results for the three months ended March 31, 2018 and 2017:
|
| | | | | | | | | | | | | | | | | | | |
| | | | | | | | | Increase / Decrease |
| | | 2018 | | 2017 | | $ | | % |
| | | (Dollars in millions, except per share data) |
| Revenues | | $ | 3,912 |
| | | $ | 3,546 |
| | | $ | 366 |
| | 10.3 |
|
| Income from operations and operating margin | | 693 |
| 17.7 | % | | 570 |
| 16.1 | % | | 123 |
| | 21.6 |
|
| Net income | | 520 |
| | | 557 |
| | | (37 | ) | | (6.6 | ) |
| Diluted earnings per share | | 0.88 |
| | | 0.92 |
| | | (0.04 | ) | |
|
|
Other Financial Information1 | | | | | | | |
|
| |
|
|
| Non-GAAP income from operations and Non-GAAP operating margin | | 794 |
| 20.3 | % | | 669 |
| 18.9 | % | | 125 |
| | 18.7 |
|
| Non-GAAP diluted earnings per share | | 1.06 |
| | | 0.84 |
| | | 0.22 |
| |
|
|
| |
| 1 | Non-GAAP operating margin and non-GAAP earnings per share areis not measurementsa measurement of financial performance prepared in accordance with GAAP. See “Non-GAAP Financial Measures” for more information and a reconciliation to the most directly comparable GAAP financial measures.measure. |
The following table sets forth summarized operating results for the three months ended June 30, 2018 and 2017:
|
| | | | | | | | | | | | | | | | | | | |
| | | | | | | | | Increase / Decrease |
| | | 2018 | | 2017 | | $ | | % |
| | | (Dollars in millions, except per share data) |
| Revenues | | $ | 4,006 |
| | | $ | 3,670 |
| | | $ | 336 |
| | 9.2 |
|
| Income from operations and operating margin | | 670 |
| 16.7 | % | | 606 |
| 16.5 | % | | 64 |
| | 10.6 |
|
| Net income | | 456 |
| | | 470 |
| | | (14 | ) | | (3.0 | ) |
| Diluted earnings per share | | 0.78 |
| | | 0.80 |
| | | (0.02 | ) | |
|
|
Other Financial Information2 | | | | | | | |
|
| |
|
|
| Non-GAAP income from operations and Non-GAAP operating margin | | 882 |
| 22.0 | % | | 735 |
| 20.0 | % | | 147 |
| | 20.0 |
|
| Non-GAAP diluted earnings per share | | 1.19 |
| | | 0.93 |
| | | 0.26 |
| |
|
|
The following charts set forth revenues and revenue growth by business segment and geography for the three months ended March 31, 2018June 30, 2017 and 2017:2018:
The following factors impacted our revenue growth during the three months ended March 31,June 30, 2018 as compared to March 31,June 30, 2017:
Solid performance in our Communications, Media and Technology, Products and Resources and Healthcare segments;
Revenues in our Financial Services business segment grew below Company average as certain banking customers continue to optimize the cost of supporting their systems and operations as they shift their spend to transformation and digital services;
Sustained strength in the North American market;
Continued penetration of the European and Rest of World (primarily Asia Pacific) markets.markets;
Revenues from our customers in Europe grew 19.2% inclusive of a positive currency impact of 6.4%.
| |
| ◦ | Revenues from our Rest of Europe customers in Europe grew 22.4%increased 30.9% inclusive of a positive currency impact of 11.7%. Specifically,7.1% and revenues from a new strategic customer acquired in the third quarter of 2017. |
| |
| ◦ | Revenues from our Rest of EuropeUnited Kingdom customers increased 31.2%7.3% inclusive of a positive currency impact of 12.7%, while within the United Kingdom we experienced an increase in revenues of 13.1% inclusive of a positive currency impact of 10.7%5.8%. Revenue growth in the United Kingdom wascontinues to be negatively affected by weakness in the banking sector in that region; |
Increased customer spending on discretionary projects;
Expansion of our service offerings, including consulting and digital services, next-generation IT solutions and platform-based solutions;
| |
| 2 | Non-GAAP income from operations, Non-GAAP operating margin and non-GAAP earnings per share are not measurements of financial performance prepared in accordance with GAAP. See “Non-GAAP Financial Measures” for more information and a reconciliation to the most directly comparable GAAP financial measures. |
Continued expansion of the market for global delivery of technology and business process services; and
Increased penetration at existing customers, including strategic customers.
Our customers seek to meet a dual mandate of achieving more efficient and effective operations, while investing in digital technologies that are reshaping their business models. Increasingly, the relative emphasis among our customers is shifting towards investment and innovation, as reflected in accelerated demand for our digital services. We continue to see demand for larger, more complex projects that are transformational for our customers, including managed services contracts. Such contracts may have longer sales cycles and ramp-up periods and could lead to greater period-to-period variability in our operating results. We increased the number of strategic customers by 7 during the quarter, bringing the total number of our strategic customers to 364.371. We define a strategic customer as one offering the potential to generate at least $5 million to $50 million or more in annual revenues at maturity.
In the second quarter of 2018, we provided $100 million of initial funding to Cognizant U.S. Foundation, which is focused on science, technology, engineering and math (or collectively, STEM) education in the United States. This funding was reported in "Selling, general and administrative expenses" in our consolidated statements of operations and was excluded from our non-GAAP income from operations3, non-GAAP operating margin3 and non-GAAP diluted earnings per share3 as it is not expected to recur at this magnitude in the foreseeable future.
Our operating margin increased to 17.7%16.7% for the quarter ended March 31,June 30, 2018 from 16.1%16.5% for the quarter ended March 31,June 30, 2017, while our non-GAAP operating margin for the same period increased to 20.3%22.0%23 from 18.9%20.0%23. The increases in both our GAAP and non-GAAP operating margins were due to a decrease, as a percentage of revenues, in compensation and benefit costs immigration costs and subcontractor and other operating costs, partially offset by an increase in depreciation due to recent acquisitionsas revenue growth outpaced headcount growth and the appreciationdepreciation of the Indian rupee against the U.S. dollar.dollar, partially offset by an increase in fees paid to strategic partners and other vendors related to our managed services and digital products and lower gains on settlement of our cash flow hedges in 2018 compared to 2017. Our GAAP operating margin was further negatively impacted by the initial funding of the Cognizant U.S. Foundation and the increase in amortization expense due to recent acquisitions. For the remainder of 2018, we expect our GAAP and non-GAAP operating margins to trend lower than the second quarter of 2018 as we absorb increased costs related to our annual salary revision and promotion cycles and other planned investments.
| |
2 | Non-GAAP operating margin is not a measurement of financial performance prepared in accordance with GAAP. See “Non-GAAP Financial Measures” for more information and a reconciliation to the most directly comparable GAAP financial measure. |
On December 22, 2017, the United States enacted the Tax Reform Act, which significantly revised the U.S. corporate income tax law for tax years beginning after December 31, 2017. During the fourth quarter of 2017, we recorded a one-time provisional net income tax expense of $617 million, which reflects certain assumptions based upon our interpretation of the Tax Reform Act and may change, possibly materially, as we receive additional clarification and guidance and as the interpretation of the Tax Reform Act evolves over time. During the first quarter of 2018, we have not recorded any adjustments to the one-time provisional net income tax expense. We anticipate completing the accounting for the Tax Reform Act within the measurement period. See Note 79 to our unaudited consolidated financial statements for additional information. Our effective income tax rate for the first quarter of 2018 was 25.4% as compared to 14.2% in the same period of 2017. For the three months ended March 31, 2018, our effective tax rate increased primarily due to the recognition in the first quarter of 2017 of income tax benefits previously unrecognized in our consolidated financial statements related to several uncertain tax positions totaling $72 million and the 2018 estimated incremental income tax expense related to the current interpretation of the global intangible low-taxed income, or GILTI, provision of the Tax Reform Act, partially offset by the new lower U.S. income tax rate in 2018.
As previously disclosed, the Company is conducting an internal investigation focused on whether certain payments relating to Company-owned facilities in India were made improperly and in possible violation of the U.S. Foreign Corrupt Practices Act, or FCPA, and other applicable laws. The investigation is also examining various other payments made in small amounts in India that may not have complied with Company policy or applicable law. In September 2016, we voluntarily notified the Department of Justice, or DOJ, and the Securities and Exchange Commission, or SEC, and are cooperating fully with both agencies. The investigation is being conducted under the oversight of the Audit Committee, with the assistance of outside counsel. To date, the investigation has identified a total of approximately $6 million in payments made between 2009 and 2016 that may have been improper. In 2016, we recorded an out-of-period correction related to $4 million of such payments that had been previously capitalized that should have been expensed. There were no adjustments recorded during 2018 or 2017 related to the amounts under investigation.
In 2016, there were putative securities class action complaints filed, naming us and certain of our current and former officers as defendants and alleging violations of the Securities Exchange Act of 1934, as amended, or the Exchange Act, based on allegedly false or misleading statements related to potential violations of the FCPA, our business, prospects and operations, and the effectiveness of our internal control over financial reporting and our disclosure controls and procedures. Additionally, in 2017 and 2016, putative shareholder derivative complaints were filed, naming us, certain of our current and former directors and certain of our current and former officers as defendants. See the section titled "Part II, Item 1. Legal Proceedings." During the quarters ended March 31,June 30, 2018 and 2017, we incurred $3 million and $14$8 million, respectively, in costs related to the FCPA investigation and related lawsuits. We expect to continue to incur expenses related to these matters.
| |
| 3 | Non-GAAP income from operations, non-GAAP operating margin and non-GAAP earnings per share are not measurements of financial performance prepared in accordance with GAAP. See “Non-GAAP Financial Measures” for more information and a reconciliation to the most directly comparable GAAP financial measures. |
We are involved in an ongoing dispute with the Indian Income Tax Department, or ITD, in connection with which we received a notice in March 2018 asserting that the ITD is owed additional taxes on our previously disclosed 2016 India Cash Remittance, the transaction undertaken by our principal operating subsidiary in India, or CTS India, to repurchase shares from its shareholders, which are non-Indian Cognizant entities, valued at $2.8 billion. As a result of that transaction, undertaken pursuant to a plan approved by the Madras High Court in Chennai, India, we previously paid $135 million in Indian income taxes, which we believe are all the applicable taxes owed for this transaction under Indian law. The ITD is asserting that we owe an additional $50733 billion Indian rupees ($482 million at the June 30, 2018 exchange rate) related to the 2016 India Cash Remittance. In addition to the dispute on the 2016 India Cash Remittance, we are involved in another ongoing dispute with the ITD relating to a 2013 transaction undertaken by CTS India to repurchase shares from its shareholders valued at $523 million (the two disputes collectively referred to as the ITD Dispute), for which we also believe we have paid all applicable taxes owed. Accordingly, we have not recorded any reserves for these matters as of March 31,June 30, 2018. The ITD Dispute is ongoing, and no final decision has been reached. While we believe that we have paid all applicable taxes related to the transactions underlying the ITD Dispute, if it is ultimately determined that we are liable for the full amount of additional taxes the ITD alleges we owe, there could be a material adverse effect on our results of operations, cash flows and financial condition.
In March 2018, the ITD placed an attachment on certain of our India bank accounts, relating to the 2016 India Cash Remittance. In April 2018, the Madras High Court granted our application for a stay of the actions of the ITD and lifted the ITD’s attachment of our bank accounts. As part of the interim stay order, we have deposited $765 billion Indian rupees ($72 million at the June 30, 2018 exchange rate) representing 15% of the disputed tax amount related to the 2016 India Cash Remittance, to be kept in a segregated account by the ITD. This amount is presented in "Other current assets" on our consolidated statement of financial position. In addition, the court has placed a lien on certain time deposits of CTS India in the amount of $43128 billion Indian rupees ($410 million at the June 30, 2018 exchange rate), which is the remainder of the disputed tax amount related to the 2016 India Cash Remittance. We have classified affected time deposits as restricted assets and reported them in “Short-term investments” on our consolidated statement of financial position. As of June 30, 2018, the restricted time deposits balance was $419 million, including accumulated interest. See Note 7 and Note 149 to our unaudited consolidated financial statements for additional information and impact on our financial statements.information. We finished the firstsecond quarter of 2018 with approximately 261,400268,900 employees, which is an increase of approximately 20012,100 as compared to March 31,June 30, 2017. Annualized turnover, including both voluntary and involuntary, was approximately 20.3%22.6% for the
three months ended March 31,June 30, 2018. The majority of our turnover occurs in India. The higher than usual annualized turnover rate reflects the highly competitive labor market in our industry in the geographies in which we compete for talent, including India. Annualized attrition rates on-site at customers are below our global attrition rate. In addition, attrition is weighted towards the more junior members of our staff.
During the remainder of 2018, barring any unforeseen events, we expect the following factors to affect our business and our operating results:
Demand from our customers for digital services;
Our customers' dual mandate of simultaneously achieving cost savings while investing in transformation and innovation;
Continued focus by customers on directing technology spending towards cost containment projects;
Secular changes driven by evolving digital technologies and regulatory changes, including potential regulatory changes with respect to immigration and taxes;
Demand from our healthcare customers may continue to be affected by the uncertainty in the regulatory and secular environments;
Demand from certain banking customers may continue to be negatively affected by their ongoing efforts to optimize the cost of supporting their systems and operations as they shift their spend to transformation and digital services;
Discretionary spending by our retail customers may continue to be affected by weakness in the retail sector;
Legal fees and other expenses related to the internal investigation and related matters as described above; and
Volatility in foreign currency rates.
In response to this environment, we plan to:
Continue to invest in our digital practice areas of focus across industries and geographies;
Continue to invest in our talent base, including through local hiring and re-skilling, and new service offerings, including digital technologies and new delivery models;
Partner with our existing customers to garner an increased portion of our customers’ overall spend by providing innovative solutions;
Focus on growing our business in Europe, the Middle East, Asia Pacific and Latin America, where we believe there are opportunities to gain market share;
Increase our strategic customer base across all of our business segments;
Pursue strategic acquisition opportunities that we believe add new technologies, including digital technologies, or platforms that complement our existing services, improve our overall service delivery capabilities, and/or expand our geographic presence; and
Focus on operating discipline in order to appropriately manage our cost structure.
Our reportable segments are:
Financial Services, which consists of our banking and insurance operating segments;
Healthcare, which consists of our healthcare and life sciences operating segments;
Products and Resources, which consists of our retail and consumer goods, manufacturing and logistics, travel and hospitality, and energy and utilities operating segments; and
Communications, Media and Technology, which includes our communications and media operating segment and our technology operating segment.
Our sales managers, account executives, account managers and project teams are aligned in accordance with the specific industries they serve. Our chief operating decision maker evaluates the Company’s performance and allocates resources based on segment revenues and operating profit. Segment operating profit is defined as income from operations before unallocated costs. Generally, operating expenses for each operating segment have similar characteristics and are subject to the same factors, pressures and challenges. However, the economic environment and its effects on industries served by our operating segments may affect revenues and operating expenses to differing degrees.
In 2018, we made changes to the internal measurement of segment operating profits for the purpose of evaluating segment performance and resource allocation. The primary reason for the changes is to charge to our business segments costs that are directly managed and controlled by them. Specifically, segment operating profit now includes the stock-based compensation expense of sales managers, account executives, account managers and project teams, which was previously included in "unallocated costs." In addition, we have changed the methodology of charging our business segments for the use of our global delivery centers and infrastructure from a fixed per employee charge to a variable per employee charge.charge that differs depending on location and assets deployed. We have reported our segment operating profits using the new measurement methodology and have restated the prior period results to conform to the new methodology.
Expenses included in segment operating profit consist principally of direct selling and delivery costs (including stock-based compensation expense) as well as a per employee charge for use of our global delivery centers and infrastructure. Certain selling, general and administrative expenses, excess or shortfall of incentive compensation for delivery personnel as compared to target, costs related to our realignment program, a portion of depreciation and amortization and the impact of the settlements of our cash flow hedges are not allocated to individual segments in internal management reports used by the chief operating decision maker. Accordingly, such expenses are excluded from segment operating profit and are separately disclosed as “unallocated costs” and adjusted against our total income from operations.
We provide a significant volume of services to many customers in each of our business segments. Therefore, a loss of a significant customer or a few significant customers in a particular segment could materially reduce revenues for that segment. However, no individual customer accounted for sales in excess of 10% of our consolidated revenues for the periods ended March 31,June 30, 2018 and 2017. In addition, the services we provide to our larger customers are often critical to the operations of such customers. As such, we believe that a termination of our services would in many instances require an extended transition period with gradually declining revenues.
Three Months Ended March 31,June 30, 2018 Compared to Three Months Ended March 31,June 30, 2017
The following table sets forth, for the periods indicated, certain financial data for the three months ended March 31:June 30:
| | | | | | % of | | | | % of | | Increase / Decrease(1) | | | % of | | | | % of | | Increase / Decrease(1) |
| | 2018(1) | | Revenues | | 2017(1) | | Revenues | | $ | | % | 2018(1) | | Revenues | | 2017(1) | | Revenues | | $ | | % |
| | (Dollars in millions, except per share data) | (Dollars in millions, except per share data) |
| Revenues | $ | 3,912 |
| | 100.0 | | $ | 3,546 |
| | 100.0 | | $ | 366 |
| | 10.3 |
| $ | 4,006 |
| | 100.0 | | $ | 3,670 |
| | 100.0 | | $ | 336 |
| | 9.2 |
|
Cost of revenues(2) | 2,401 |
| | 61.4 | | 2,194 |
| | 61.9 | | 207 |
| | 9.4 |
| 2,417 |
| | 60.3 | | 2,261 |
| | 61.6 | | 156 |
| | 6.9 |
|
Selling, general and administrative expenses(2) | 711 |
| | 18.2 | | 686 |
| | 19.3 | | 25 |
| | 3.6 |
| 805 |
| | 20.1 | | 709 |
| | 19.3 | | 96 |
| | 13.5 |
|
| Depreciation and amortization expense | 107 |
| | 2.7 | | 96 |
| | 2.7 | | 11 |
| | 11.5 |
| 114 |
| | 2.8 | | 94 |
| | 2.6 | | 20 |
| | 21.3 |
|
| Income from operations | 693 |
| | 17.7 | | 570 |
| | 16.1 | | 123 |
| | 21.6 |
| 670 |
| | 16.7 | | 606 |
| | 16.5 | | 64 |
| | 10.6 |
|
| Other income (expense), net | 4 |
| | 79 |
| | (75 | ) | | (94.9 | ) | (47 | ) | | 29 |
| | (76 | ) | | (262.1 | ) |
| Income before provision for income taxes | 697 |
| | 17.8 | | 649 |
| | 18.3 | | 48 |
| | 7.4 |
| 623 |
| | 15.6 | | 635 |
| | 17.3 | | (12 | ) | | (1.9 | ) |
| Provision for income taxes | (177 | ) | | (92 | ) | | (85 | ) | | 92.4 |
| (168 | ) | | (165 | ) | | (3 | ) | | 1.8 |
|
| Income from equity method investments | | 1 |
| | — |
| | 1 |
| |
|
|
| Net income | $ | 520 |
| | 13.3 | | $ | 557 |
| | 15.7 | | $ | (37 | ) | | (6.6 | ) | $ | 456 |
| | 11.4 | | $ | 470 |
| | 12.8 | | $ | (14 | ) | | (3.0 | ) |
| Diluted earnings per share | $ | 0.88 |
| | $ | 0.92 |
| | $ | (0.04 | ) | |
| $ | 0.78 |
| | $ | 0.80 |
| | $ | (0.02 | ) | |
|
| | | | | | | | | | | | | | | |
Other Financial Information(3) | | | | | | | | | | | | | | |
| Non-GAAP income from operations and non-GAAP operating margin | $ | 794 |
| | 20.3 | | $ | 669 |
| | 18.9 | | $ | 125 |
| | 18.7 |
| $ | 882 |
| | 22.0 | | $ | 735 |
| | 20.0 | | $ | 147 |
| | 20.0 |
|
| Non-GAAP diluted earnings per share | $ | 1.06 |
| | $ | 0.84 |
| | $ | 0.22 |
| | | $ | 1.19 |
| | $ | 0.93 |
| | $ | 0.26 |
| | |
_____________________
| |
| (1) | On January 1, 2018, we adopted the New Revenue Standard using the modified retrospective method. Results for reporting periods beginning after January 1, 2018 are presented under the New Revenue Standard, while prior period amounts are not adjusted and continue to be reported in accordance with our historic accounting policies. For the three months ended March 31,June 30, 2018, adoption of the New Revenue Standard had a positive impact on revenue of $21$31 million, income from operations of $29$38 million and diluted earnings per share of $0.04$0.05 per share. See Note 3 to our unaudited consolidated financial statements for additional information. |
| |
| (2) | Exclusive of depreciation and amortization expense. |
| |
| (3) | Non-GAAP income from operations, non-GAAP operating margin and non-GAAP diluted earnings per share are not measurements of financial performance prepared in accordance with GAAP. See “Non-GAAP Financial Measures” for more information and a reconciliation to the most directly comparable GAAP financial measure. |
Revenues - Overall
Our revenue growth was primarily attributed to services related to integration of digital technologies that are reshaping our customers' business, operating and technology models to align with shifts in consumer preferences, increased customer spending on discretionary projects, continued interest in using our global delivery model as a means to reduce overall technology and operations costs and continued penetration in all our geographic markets. Revenues from customers added since March 31,June 30, 2017 were $96$126 million and represented 26.2%37.5% of the period-over-period revenue increase.
Our consulting and technology services revenues for the three months ended March 31,June 30, 2018 increased by 10.7%6.0% compared to the three months ended March 31,June 30, 2017 and represented 58.0%57.1% of total revenues for the three months ended March 31,June 30, 2018. Our outsourcing services revenues for the three months ended March 31,June 30, 2018 increased by 9.7%13.6% and constituted 42.0%42.9% of total revenues for the three months ended March 31,June 30, 2018.
On January 1, 2018, we adopted the New Revenue Standard using the modified retrospective method. For the three months ended March 31,June 30, 2018, adoption of the New Revenue Standard had a positive impact on revenue of $21$31 million. See Note 3 to our unaudited consolidated financial statements for additional information.
Revenues from our top customers as a percentage of total revenues were as follows:
|
| | | | | | |
| | | Three Months Ended March 31, |
| | | 2018 | | 2017 |
| Top five customers | | 9.0 | % | | 9.0 | % |
| Top ten customers | | 15.9 | % | | 15.1 | % |
As we continue to add new customers and increase our penetration at existing customers, we expect the percentage of revenues from our top five and top ten customers to decline over time. |
| | | | | | |
| | | Three Months Ended June 30, |
| | | 2018 | | 2017 |
| Top five customers | | 8.6 | % | | 9.0 | % |
| Top ten customers | | 15.4 | % | | 15.1 | % |
Revenues - Reportable Business Segments
Revenues by reportable business segment were as follows for the three months ended March 31:June 30:
| | | | | 2018 | | 2017 | | Increase | | 2018 | | 2017 | | Increase |
| $ | | % | $ | | % |
| | | (Dollars in millions) | | (Dollars in millions) |
| Financial Services | | $ | 1,461 |
| | $ | 1,376 |
| | $ | 85 |
| | 6.2 | | $ | 1,469 |
| | $ | 1,406 |
| | $ | 63 |
| | 4.5 |
| Healthcare | | 1,121 |
| | 1,003 |
| | 118 |
| | 11.8 | | 1,156 |
| | 1,050 |
| | 106 |
| | 10.1 |
| Products and Resources | | 821 |
| | 737 |
| | 84 |
| | 11.4 | | 840 |
| | 747 |
| | 93 |
| | 12.4 |
| Communications, Media and Technology | | 509 |
| | 430 |
| | 79 |
| | 18.4 | | 541 |
| | 467 |
| | 74 |
| | 15.8 |
Total revenues(1) | | $ | 3,912 |
| | $ | 3,546 |
| | $ | 366 |
| | 10.3 | | $ | 4,006 |
| | $ | 3,670 |
| | $ | 336 |
| | 9.2 |
_____________________
| |
| (1) | Results for 2018 are presented under the New Revenue Standard, while prior period amounts are not adjusted and continue to be reported in accordance with our historic accounting policies. See Note 3 to our unaudited consolidated financial statements for additional information. |
Financial Services
Revenues from our Financial Services segment grew 6.2%4.5%, inclusive of a positive currency impact of 1.0%, for the three months ended March 31,June 30, 2018, as compared to the three months ended March 31,June 30, 2017. Growth was stronger among our insurance customers where revenues increased by $55$54 million as compared to an increase of $30$9 million for our banking customers. In this segment, revenues from customers added since March 31,June 30, 2017 were $28$36 million and represented 32.9%57.1% of the period-over-period revenues increase in this segment. Key areas of focus for our Financial Services customers included the adoption and integration of digital technologies that are reshaping our customers' business and operating models, cost optimization, robotic process automation, cyber security and vendor consolidation. Demand from certain banking customers may continue to be negatively affected by their ongoing efforts to optimize the cost of supporting their systems and operations as they shift their spend to transformation and digital services.
Healthcare
Revenues from our Healthcare segment grew 11.8%10.1% for the three months ended March 31,June 30, 2018, as compared to the three months ended March 31,June 30, 2017. Growth was stronger among our healthcare customers where revenues increased by $111$100 million, including revenues from Bolder Healthcare Solutions acquired in the second quarter of 2018 and a new strategic customer acquired in the third quarter of 2017, as compared to an increase of $7$6 million for our life sciences customers. Revenues from customers added since March 31,June 30, 2017 were $20$52 million and represented 16.9%49.1% of the period-over-period revenues increase in this segment. The demand for our services among life science customers has been affected by reduced discretionary spending. The demand for our services among healthcare customers may continue to be affected by uncertainty in the regulatory environment. We believe that in the long term the healthcare industry continues to present a significant growth opportunity due to factors that are transforming the industry, including the changing regulatory environment, increasing focus on medical costs, and the consumerization of healthcare.
Products and Resources
Revenues from our Products and Resources segment grew 11.4%12.4%, inclusive of a positive currency impact of 1.7%, for the three months ended March 31,June 30, 2018, as compared to the three months ended March 31,June 30, 2017. Revenue growth in this segment was strongest among our manufacturing and logistics customers and energy and utilities customers where revenues increased by a combined $64$66 million. Revenues from our retail and consumer goods customers and travel and hospitality customers increased by a combined $20$27 million. Revenues from customers added since March 31,June 30, 2017 were $39$31 million, representing 46.4%33.3% of the period-over-period revenue increase in this segment. Demand within this segment continues to be driven by increased adoption
of digital technologies that are reshaping our customers' business and operating models, as well as growing demand for analytics, supply chain consulting, implementation initiatives, smart products, transformation of business models, internet of things and omni channel commerce implementation and integration services. Discretionary spending by our retail customers has been and may continue to be affected by weakness in the retail sector.
Communications, Media and Technology
Revenues from our Communications, Media and Technology segment grew 18.4%15.8%, inclusive of a positive currency impact of 1.5%, for the three months ended March 31,June 30, 2018, as compared to the three months ended March 31,June 30, 2017. Revenue growth was $53$59 million among our technology customers and $26$15 million among our communications and media customers. Revenues from customers added since March 31,June 30, 2017 were $9$7 million and represented 11.4%9.5% of the period-over-period revenue increase in this segment. Growth within this segment was driven by the increased adoption of digital technologies, digital content operations, services to help our customers balance rationalizing costs while creating a differentiated user experience and an expanded range of services, such asincluding business process services. Revenue growth among our communications customers has been and may continue to be negatively affected by uncertainty due to significant merger and acquisition activity in their industry.
Revenues - Geographic Markets
Revenues by geographic market were as follows for the three months ended March 31:June 30:
| | | | | 2018 | | 2017 | | Increase | | 2018 | | 2017 | | Increase |
| | $ | | % | | $ | | % |
| | | (Dollars in millions) | | (Dollars in millions) |
| North America | | $ | 2,975 |
| | $ | 2,761 |
| | $ | 214 |
| | 7.8 | | $ | 3,067 |
| | $ | 2,851 |
| | $ | 216 |
| | 7.6 |
| United Kingdom | | 310 |
| | 274 |
| | 36 |
| | 13.1 | | 309 |
| | 288 |
| | 21 |
| | 7.3 |
| Rest of Europe | | 374 |
| | 285 |
| | 89 |
| | 31.2 | | 381 |
| | 291 |
| | 90 |
| | 30.9 |
| Europe - Total | | 684 |
| | 559 |
| | 125 |
| | 22.4 | | 690 |
| | 579 |
| | 111 |
| | 19.2 |
| Rest of World | | 253 |
| | 226 |
| | 27 |
| | 11.9 | | 249 |
| | 240 |
| | 9 |
| | 3.8 |
Total revenues(1) | | $ | 3,912 |
| | $ | 3,546 |
| | $ | 366 |
| | 10.3 | | $ | 4,006 |
| | $ | 3,670 |
| | $ | 336 |
| | 9.2 |
_____________________
| |
| (1) | Results for 2018 are presented under the New Revenue Standard, while prior period amounts are not adjusted and continue to be reported in accordance with our historic accounting policies. See Note 3 to our unaudited consolidated financial statements for additional information. |
North America continues to be our largest market, representing 76.0%76.6% of total revenues for the firstsecond quarter of 2018, and 58.5%64.3% of total revenue growth from the firstsecond quarter of 2017. The increase in revenues in this region was primarily attributed to services related to the integration of digital technologies that are reshaping our customers' business and operating models to align with shifts in consumer preferences, increased customer spending on discretionary projects and continued interest in using our global delivery model as a means to reduce overall technology and operations costs. In the first quarter of 2018, revenue growth in Europe and Rest of World markets was driven by an increase in demand for an expanded range of services, such as business process services and customer adoption and integration of digital technologies that are reshaping our customers' business and operating models. Revenues from our customers in Europe grew 22.4%19.2% inclusive of a positive currency impact of 11.7%6.4%. Specifically, revenues from our Rest of Europe customers, increased 31.2%30.9% inclusive of a positive currency impact of 12.7%7.1%, while within the United Kingdom we experienced an increase in revenues of 13.1%7.3% inclusive of a positive currency impact of 10.7%5.8%. Revenues from our Rest of World customers grew 3.8% in the second quarter of 2018. Revenue growth in the United Kingdom and Rest of World was negatively affected by weakness in the banking sector in that region. Revenues from our Rest of World customers grew 11.9% in the first quarter of 2018, primarily driven by the Australia and Middle East markets.those regions. We believe that Europe, India, Middle East, Asia Pacific and Latin America will continue to be areas of significant investment for us as we see these regions as long term growth opportunities.
Cost of Revenues (Exclusive of Depreciation and Amortization Expense)
Our cost of revenues consists primarily of salaries, incentive-based compensation, stock-based compensation expense, employee benefits, immigration and project-related immigration and travel for technical personnel and subcontracting costs relating to revenues. Our cost of revenues increased by 9.4%6.9% during the firstsecond quarter of 2018 as compared to the firstsecond quarter of 2017, decreasing as a percentage of revenues to 61.4%60.3% in the firstsecond quarter of 2018 compared to 61.9%61.6% in the firstsecond quarter of 2017. The decrease as a percentage of revenues was due primarily to a decrease in subcontractor costs,compensation and benefits as revenue growth outpaced headcount growth and the depreciation of the Indian rupee against the U.S. dollar, partially offset by an increase in compensation and benefits costs for our technical personnel, an increase in fees paid to strategic partners and other vendors related to our managed services and digital products and the appreciation of the India rupee against the U.S. dollar.lower realized gains on our cash flow hedges in 2018 compared to 2017. Compensation and benefits costs including incentive-based compensation, increased by $179$66 million when compared to the three months ended March 31,June 30, 2017, as the number of our technical personnel increased.
Selling, General and Administrative Expenses
Selling, general and administrative expenses consist primarily of salaries, incentive-based compensation, stock-based compensation expense, employee benefits, immigration, travel, marketing, communications, management, finance, administrative and occupancy costs. Selling, general and administrative expenses, including depreciation and amortization, increased by 4.6%14.4% during the firstsecond quarter of 2018 as compared to the firstsecond quarter of 2017, decreasingincreasing as a percentage of revenues to 20.9%22.9% in the firstsecond quarter of 2018 as compared to 22.1%21.9% in the firstsecond quarter of 2017. The decreaseincrease as a percentage of revenues was due primarily to efficienciesthe initial funding of leveraging our cost structure overthe Cognizant U.S. Foundation and increases in amortization expense due to recent acquisitions, partially offset by a larger organizationdecrease in compensation and a reduction in immigrationbenefit costs.
Income from Operations and Operating Margin - Overall
Income from operations increased 21.6%10.6% in the firstsecond quarter of 2018 as compared to the firstsecond quarter of 2017. Our operating margin increased to 17.7%16.7% for the quarter ended March 31,June 30, 2018 from 16.1%16.5% for the quarter ended March 31,June 30, 2017, primarily due to a decrease, as a percentage of revenues, in compensation and benefit costs immigration costs, subcontractor and other operating costs and greater realized gains on settlement of cash flow hedges, partially offset by an increase in depreciation expense due to recent acquisitionsas revenue growth outpaced headcount growth and the appreciationdepreciation of the Indian rupee against the U.S. dollar.dollar, partially offset by the initial funding of the Cognizant U.S. Foundation, an increase in fees paid to strategic partners and other vendors related to our managed services and digital products, an increase in amortization expense due to the recent acquisitions and lower gains on settlement of our cash flow hedges in 2018 compared to 2017. Excluding the impact of applicable designated cash flow hedges, the appreciationdepreciation of the Indian rupee against the U.S. dollar negativelypositively impacted our operating margin by approximately 7266 basis points or 0.720.66 percentage points in the three months ended March 31,June 30, 2018. Each additional 1.0% change in the exchange rate between the Indian rupee and the U.S. dollar will have the effect of moving our operating margin by approximately 1817 basis points or 0.180.17 percentage points.
We entered into foreign exchange forward contracts to hedge certain Indian rupee denominated payments in India. These hedges are intended to mitigate the volatility of the changes in the exchange rate between the U.S. dollar and the Indian rupee. During the three months ended March 31,June 30, 2018, the settlement of our cash flow hedges positively impacted our operating margin by approximately 8952 basis points or 0.890.52 percentage points as compared to a positive impact of approximately 5695 basis points or 0.560.95 percentage points during the three months ended March 31,June 30, 2017.
For the three months ended March 31,June 30, 2018 and 2017, our non-GAAP operating margins were 20.3%22.0%34 and 18.9%20.0%34, respectively. As set forth in the “Non-GAAP Financial Measures” section below, our non-GAAP operating margin excludes stock based compensation expense, acquisition-related charges, realignment charges and realignment charges.in the second quarter of 2018, the initial funding of the Cognizant U.S. Foundation.
Our most significantFor the remainder of 2018, we expect our GAAP and non-GAAP operating margins to trend lower than the second quarter of 2018 as we absorb increased costs are the salariesrelated to our annual salary revision and related benefits for our technical staffpromotion cycles and other professionals. In certain regions, competition for professionals with advanced technical skills necessary to perform our services has caused wages to increase at a rate greater than the general rate of inflation. As with other service providers in our industry, we must adequately anticipate wage increases, particularly on our fixed-price and transaction- or volume-based priced contracts. Historically, we have experienced increases in compensation and benefit costs in India; however, this has not had a material impact on our results of operations as we have been able to absorb such cost increases through cost management strategies, such as managing discretionary costs, the mix of professional staff and utilization levels, and achieving other operating efficiencies. There can be no assurance that we will be able to offset such cost increases in the future.
_______________
| |
3 | Non-GAAP operating margin is not a measurement of financial performance prepared in accordance with GAAP. See “Non-GAAP Financial Measures” for more information and a reconciliation to the most directly comparable GAAP financial measure. |
planned investments.
Segment Operating Profit
In 2018, we made changes to the internal measurement of segment operating profits for the purpose of evaluating segment performance and resource allocation. The primary reason for the changes is to charge to our business segments costs that are directly managed and controlled by them. Specifically, segment operating profit now includes the stock-based compensation expense of sales managers, account executives, account managers and project teams, which was previously included in "unallocated costs." In addition, we have changed the methodology of charging our business segments for the use of our global delivery centers and infrastructure from a fixed per employee charge to a variable per employee charge.charge that differs depending on location and assets deployed. We have reported our segment operating profits using the new measurement methodology and have restated the prior period results to conform to the new methodology.
_______________
| |
| 4 | Non-GAAP operating margin is not a measurement of financial performance prepared in accordance with GAAP. See “Non-GAAP Financial Measures” for more information and a reconciliation to the most directly comparable GAAP financial measure. |
Segment operating profits were as follows for the three months ended March 31:June 30:
| | | | | | | | Increase | | | | | Increase |
| | 2018 | | 2017 | | $ | | % | 2018 | | 2017 | | $ | | % |
| | (Dollars in millions) | (Dollars in millions) |
| Financial Services | $ | 447 |
| | $ | 427 |
| | $ | 20 |
| | 4.7 | $ | 462 |
| | $ | 445 |
| | $ | 17 |
| | 3.8 |
| Healthcare | 338 |
| | 274 |
| | 64 |
| | 23.4 | 357 |
| | 345 |
| | 12 |
| | 3.5 |
| Products and Resources | 256 |
| | 217 |
| | 39 |
| | 18.0 | 258 |
| | 230 |
| | 28 |
| | 12.2 |
| Communications, Media and Technology | 159 |
| | 135 |
| | 24 |
| | 17.8 | 179 |
| | 156 |
| | 23 |
| | 14.7 |
| Total segment operating profit | 1,200 |
| | 1,053 |
| | 147 |
| | 14.0 | 1,256 |
| | 1,176 |
| | 80 |
| | 6.8 |
| Less: unallocated costs | 507 |
| | 483 |
| | 24 |
| | 5.0 | 586 |
| | 570 |
| | 16 |
| | 2.8 |
| Income from operations | $ | 693 |
| | $ | 570 |
| | $ | 123 |
| | 21.6 | $ | 670 |
| | $ | 606 |
| | $ | 64 |
| | 10.6 |
In our Financial Services, Healthcare business segment and our Communications, Media and Technology business segment, operating profits increased as a percentage of revenues due to revenue growth outpacing headcount growth, partially offset by the negative impact of the appreciation of the Indian rupee against the U.S. dollar and investments to accelerate our shift to digital. In our Financial Services business segment,segments, operating profits decreased as a percentage of revenues due to investments to accelerate our shift to digital, including re-skilling of service delivery personnel, an increase in subcontractor costs and an increase in fees paid to the strategic partners and other vendors related to our managed services and digital products, partially offset by the positive impact of revenue growth outpacing headcount growth and the negative impact of the appreciationdepreciation of the Indian rupee against the U.S. dollar. In our Products and Resources business segment, operating profits remained flat as a percentage of revenues.
Other Income (Expense), Net
Total other income (expense), net consists primarily of foreign currency exchange gains and (losses), interest income and interest expense. The following table sets forth total other income (expense), net for the three months ended March 31:June 30:
| | | | 2018 | | 2017 | | Increase/ Decrease | 2018 | | 2017 | | Increase/ Decrease |
| | (in millions) | (in millions) |
| Foreign currency exchange (losses) gains | $ | (33 | ) | | $ | 62 |
| | $ | (95 | ) | $ | (98 | ) | | $ | 8 |
| | $ | (106 | ) |
| Gains (losses) on foreign exchange forward contracts not designated as hedging instruments | 2 |
| | (10 | ) | | 12 |
| 18 |
| | (3 | ) | | 21 |
|
| Net foreign currency exchange (losses) gains | (31 | ) | | 52 |
| | (83 | ) | (80 | ) | | 5 |
| | (85 | ) |
| Interest income | 41 |
| | 32 |
| | 9 |
| 40 |
| | 31 |
| | 9 |
|
| Interest expense | (6 | ) | | (6 | ) | | — |
| (7 | ) | | (6 | ) | | (1 | ) |
| Other, net | — |
| | 1 |
| | (1 | ) | — |
| | (1 | ) | | 1 |
|
| Total other income (expense), net | $ | 4 |
| | $ | 79 |
| | $ | (75 | ) | |
| Total other (expense) income, net | | $ | (47 | ) | | $ | 29 |
| | $ | (76 | ) |
The foreign currency exchange gains and losses were primarily attributed to the remeasurement of the Indian rupee denominated net monetary assets in our U.S. dollar functional currency India subsidiaries as well as the remeasurement of other net monetary assets and liabilities denominated in currencies other than the functional currencies of our subsidiaries. The gains and losses on our foreign exchange forward contracts not designated as hedging instruments relate to the realized and unrealized gains and losses on foreign exchange forward contracts entered into primarily to offset foreign currency exposure to the Indian rupee and other non-U.S. dollar denominated net monetary assets and liabilities. As of March 31,June 30, 2018, the notional value of our undesignated hedges was $301$432 million. The increase in interest income of $9$9 million was primarily attributable to an increase in average invested balances and higher yields in 2018.
Provision for Income Taxes
The provision for income taxes increased to $177$168 million during the three months ended March 31,June 30, 2018 from $92$165 million during the three months ended March 31,June 30, 2017. The effective income tax rate increased to 25.4%27.0% for the three months ended March 31,June 30, 2018 from 14.2%26.0% for the three months ended March 31,June 30, 2017 primarily due to the recognition in the first quarter of 2017 ofa higher effective income tax benefits previously unrecognized inrate for our consolidated financial statements related to several uncertain tax positions totaling $72 million andIndia subsidiaries resulting from the foreign currency exchange gains on their statutory books as the Indian rupee depreciated against the U.S. dollar. The estimate of our 2018 estimated incrementalannual effective income tax expense related torate reflects the current interpretation of the Tax Reform Act, including the GILTI provision and may change as we receive additional clarification and guidance and as the interpretation of the Tax Reform Act partially offset by the new lower U.S. income tax rate in 2018. The recognition of these benefits in the first quarter of 2017 was based on management’s reassessment regarding whether certain unrecognized tax benefits met the more-likely-than-not threshold in light of the lapse in the statute of limitations as to a portion of such benefits.evolves over time.
Net Income
Net income decreased to $520$456 million for the three months ended March 31,June 30, 2018 from $557$470 million for the three months ended March 31,June 30, 2017, representing 13.3%11.4% and 15.7%12.8% of revenues, respectively. The decrease in net income is primarily due to foreign currency exchange losses in 2018 compared to gains in 2017, and an increase in the provision for income taxes, partially offset by an increase in income from operations.
Non-GAAP Financial Measures
Portions of our disclosure, including the following table, include non-GAAP income from operations, non-GAAP operating margin, and non-GAAP diluted earnings per share. These non-GAAP financial measures are not based on any comprehensive set of accounting rules or principles and should not be considered a substitute for, or superior to, financial measures calculated in accordance with GAAP, and may be different from non-GAAP measures used by other companies. In addition, these non-GAAP measures should be read in conjunction with our financial statements prepared in accordance with GAAP. The reconciliations of Cognizant’s non-GAAP financial measures to the corresponding GAAP measures should be carefully evaluated.
Our non-GAAP income from operations and non-GAAP operating margin exclude stock-based compensation expense, acquisition-related charges, realignment charges and, realignment charges.in the second quarter of 2018, the initial funding of the Cognizant U.S. Foundation. Our definition of non-GAAP diluted earnings per share excludes net non-operating foreign currency exchange gains or losses and the effect of recognition in the first quarter of 2017 of an income tax benefit previously unrecognized in our consolidated financial statements related to a specific uncertain tax position, in addition to excluding stock-based compensation expense, acquisition-related charges, realignment charges and, realignment charges.in the second quarter of 2018, the initial funding of the Cognizant U.S. Foundation. Our non-GAAP diluted earnings per share is additionally adjusted for the income tax impact of the above items, as applicable. The income tax impact of each item is calculated by applying the statutory rate and local tax regulations in the jurisdiction in which the item was incurred.
We believe providing investors with an operating view consistent with how we manage the Company provides enhanced transparency into the operating results of the Company. For our internal management reporting and budgeting purposes, we use various GAAP and non-GAAP financial measures for financial and operational decision making, to evaluate period-to-period comparisons, to determine portions of the compensation for our executive officers and for making comparisons of our operating results to those of our competitors. In addition, due to a variety of award types, valuation methodologies and subjective assumptions that affect the calculations of stock-based compensation expense, we believe that the exclusion of stock-based compensation expense allows for more accurate comparisons of our operating results to those of our competitors. Therefore, it is our belief that the use of non-GAAP financial measures excluding these costs provides a meaningful supplemental measure for investors to evaluate our financial performance. Accordingly, we believe that the presentation of non-GAAP income from operations, non-GAAP operating margin and non-GAAP diluted earnings per share, when read in conjunction with our reported GAAP results, can provide useful supplemental information to our management and investors regarding financial and business trends relating to our financial condition and results of operations.
A limitation of using non-GAAP financial measures versus financial measures calculated in accordance with GAAP is that non-GAAP measures do not reflect all of the amounts associated with our operating results as determined in accordance with GAAP and exclude costs that are recurring, namely stock-based compensation expense, certain acquisition-related charges, and net non-operating foreign currency exchange gains or losses. In addition, other companies may calculate non-GAAP financial measures differently than us, thereby limiting the usefulness of these non-GAAP financial measures as a comparative tool. We compensate for these limitations by providing specific information regarding the GAAP amounts excluded from non-GAAP income from operations, non-GAAP operating margin and non-GAAP diluted earnings per share to allow investors to evaluate such non-GAAP financial measures.
The following table presents a reconciliation of each non-GAAP financial measure to the most comparable GAAP measure for the three months ended March 31:June 30:
| | | | 2018 | | % of Revenues | | 2017 | | % of Revenues | 2018 | | % of Revenues | | 2017 | | % of Revenues |
| | (Dollars in millions, except per share amounts) | (Dollars in millions, except per share amounts) |
| GAAP income from operations and operating margin | $ | 693 |
| | 17.7 | | $ | 570 |
| | 16.1 | $ | 670 |
| | 16.7 | | $ | 606 |
| | 16.5 |
Add: Stock-based compensation expense (1) | 59 |
| | 1.5 | | 54 |
| | 1.5 | 71 |
| | 1.8 | | 55 |
| | 1.5 |
Add: Acquisition-related charges (2) | 41 |
| | 1.1 | | 34 |
| | 1.0 | 41 |
| | 1.0 | | 35 |
| | 1.0 |
Add: Realignment charges (3) | 1 |
| | — | | 11 |
| | 0.3 | — |
| | — | | 39 |
| | 1.0 |
Add: Initial funding of Cognizant U.S. Foundation (4) | | 100 |
| | 2.5 | | — |
| | — |
| Non-GAAP income from operations and non-GAAP operating margin | $ | 794 |
| | 20.3 | | $ | 669 |
| | 18.9 | $ | 882 |
| | 22.0 | | $ | 735 |
| | 20.0 |
| | | | | | | | | |
| GAAP diluted earnings per share | $ | 0.88 |
| | $ | 0.92 |
| | $ | 0.78 |
| | $ | 0.80 |
| |
| Effect of above operating adjustments, pre-tax | 0.17 |
| | 0.16 |
| | 0.36 |
| | 0.22 |
| |
Effect of non-operating foreign currency exchange (gains) losses, pre-tax (4) | 0.06 |
| | (0.08 | ) | | |
Tax effect of non-GAAP adjustments to pre-tax income (5) | (0.05 | ) | | (0.07 | ) | | |
Effect of recognition of income tax benefit related to an uncertain tax position (6) | — |
| | (0.09 | ) | | |
Effect of non-operating foreign currency exchange (gains) losses, pre-tax (5) | | 0.14 |
| | (0.01 | ) | |
Tax effect of non-GAAP adjustments to pre-tax income (6) | | (0.09 | ) | | (0.08 | ) | |
| Non-GAAP diluted earnings per share | $ | 1.06 |
| | $ | 0.84 |
| | $ | 1.19 |
| | $ | 0.93 |
| |
_____________________
| |
| (1) | Stock-based compensation expense reported in: |
| | | | | | | Three Months Ended
June 30, |
| | Three Months Ended
March 31, | 2018 | | 2017 |
| | 2018 | | 2017 | (in millions) |
| Cost of revenues | $ | 15 |
| | $ | 15 |
| $ | 16 |
| | $ | 13 |
|
| Selling, general and administrative expenses | 44 |
| | 39 |
| 55 |
| | 42 |
|
| |
| (2) | Acquisition-related charges include, when applicable, amortization of purchased intangible assets included in the depreciation and amortization expense line on our consolidated statements of operations, external deal costs, acquisition-related retention bonuses, integration costs, changes in the fair value of contingent consideration liabilities, charges for impairment of acquired intangible assets and other acquisition-related costs. |
| |
| (3) | Realignment charges include severance costs, lease termination costs, and advisory fees related to non-routine shareholder matters and to the development of our realignment and return of capital programs, as applicable. The total costs related to the realignment are reported in "Selling, general and administrative expenses" in our consolidated statements of operations. |
| |
| (4) | In the second quarter of 2018, we provided $100 million of initial funding to Cognizant U.S. Foundation, which is focused on STEM education in the United States. |
| |
| (5) | Non-operating foreign currency exchange gains (losses) are, inclusive of gains and losses on related foreign exchange forward contracts not designated as hedging instruments for accounting purposes, are reported in "Foreign currency exchange gains (losses), net" in our consolidated statements of operations. |
| |
(5)(6) | Presented below are the tax impacts of each of our non-GAAP adjustments to pre-tax income: |
| | | | | | | Three Months Ended
June 30, |
| | Three Months Ended
March 31, | 2018 | | 2017 |
| | 2018 | | 2017 | (in millions) |
| Non-GAAP income tax benefit (expense) related to: | | | | | | |
| Stock-based compensation expense | $ | 19 |
| | $ | 21 |
| $ | 19 |
| | $ | 20 |
|
| Acquisition-related charges | 9 |
| | 12 |
| 11 |
| | 12 |
|
| Realignment charges | — |
| | 4 |
| — |
| | 14 |
|
| Foreign currency exchange gains (losses) | (1 | ) | | 5 |
| (8 | ) | | — |
|
| Initial funding of Cognizant U.S. Foundation | | 28 |
| | — |
|
The effective income tax rate related to each of our non-GAAP adjustments varies depending on the jurisdictions in which such income and expenses are generated and the statutory rates applicable in those jurisdictions.
Six Months Ended June 30, 2018 Compared to Six Months Ended June 30, 2017
The following table sets forth, for the periods indicated, certain financial data for the six months ended June 30:
|
| | | | | | | | | | | | | | | | | | |
| | | | % of | | | | % of | | Increase / Decrease |
| | 2018(1) | | Revenues | | 2017(1) | | Revenues | | $ | | % |
| | (Dollars in millions, except per share data) |
| Revenues | $ | 7,918 |
| | 100.0 | | $ | 7,216 |
| | 100.0 | | $ | 702 |
| | 9.7 |
|
Cost of revenues(2) | 4,818 |
| | 60.8 | | 4,455 |
| | 61.7 | | 363 |
| | 8.1 |
|
Selling, general and administrative expenses(2) | 1,516 |
| | 19.1 | | 1,395 |
| | 19.3 | | 121 |
| | 8.7 |
|
| Depreciation and amortization expense | 221 |
| | 2.8 | | 190 |
| | 2.6 | | 31 |
| | 16.3 |
|
| Income from operations | 1,363 |
| | 17.2 | | 1,176 |
| | 16.3 | | 187 |
| | 15.9 |
|
| Other income (expense), net | (43 | ) | | | | 108 |
| | | | (151 | ) | | (139.8 | ) |
| Income before provision for income taxes | 1,320 |
| | 16.7 | | 1,284 |
| | 17.8 | | 36 |
| | 2.8 |
|
| Provision for income taxes | (345 | ) | | | | (257 | ) | | | | (88 | ) | | 34.2 |
|
| Income from equity method investments | 1 |
| | | | — |
| | | | 1 |
| | |
| Net income | $ | 976 |
| | 12.3 | | $ | 1,027 |
| | 14.2 | | $ | (51 | ) | | (5.0 | ) |
| Diluted earnings per share | $ | 1.66 |
| | | | $ | 1.71 |
| | | | $ | (0.05 | ) | | |
Other Financial Information (3) | | | | | | | | | | | |
| Non-GAAP income from operations and non-GAAP operating margin | $ | 1,676 |
| | 21.2 | | $ | 1,404 |
| | 19.5 | | $ | 272 |
| | 19.4 |
|
| Non-GAAP diluted earnings per share | $ | 2.25 |
| | | | $ | 1.76 |
| | | | $ | 0.49 |
| | |
| |
| (1) | On January 1, 2018, we adopted the New Revenue Standard using the modified retrospective method. Results for reporting periods beginning after January 1, 2018 are presented under the New Revenue Standard, while prior period amounts are not adjusted and continue to be reported in accordance with our historic accounting policies. For the six months ended June 30, 2018, adoption of the New Revenue Standard had a positive impact on revenue of $52 million, income from operations of $67 million and diluted earnings per share of $0.09 per share. See Note 3 to our unaudited consolidated financial statements for additional information. |
| |
| (2) | Exclusive of depreciation and amortization expense. |
| |
| (3) | Non-GAAP income from operations, non-GAAP operating margin and non-GAAP diluted earnings per share are not measurements of financial performance prepared in accordance with GAAP. See “Non-GAAP Financial Measures” for more information and a reconciliation to the most directly comparable GAAP financial measure. |
Revenues - Overall
Our revenue growth was primarily attributed to services related to integration of digital technologies that are reshaping our customers' business, operating and technology models to align with shifts in consumer preferences, increased customer spending on discretionary projects, continued interest in using our global delivery model as a means to reduce overall technology and operations costs and continued penetration in all our geographic markets. Revenues from customers added since June 30, 2017 were $183 million and represented 26.1% of the period-over-period revenue increase.
Our consulting and technology services revenues for the six months ended June 30, 2018 increased by 8.3% compared to the six months ended June 30, 2017 and represented 57.5% of total revenues for the six months ended June 30, 2018. Our outsourcing services revenues for the six months ended June 30, 2018 increased by 11.7% and constituted 42.5% of total revenues for the six months ended June 30, 2018.
On January 1, 2018, we adopted the New Revenue Standard using the modified retrospective method. For the six months ended June 30, 2018, adoption of the New Revenue Standard had a positive impact on revenue of $52 million. See Note 3 to our unaudited consolidated financial statements for additional information.
Revenues from our top customers were as follows:
|
| | | | | | |
| | | Six Months Ended June 30, |
| | | 2018 | | 2017 |
| Revenues from top five customers as a percentage of total revenues | | 8.6 | % | | 8.9 | % |
| Revenues from top ten customers as a percentage of total revenues | | 15.6 | % | | 15.0 | % |
Revenues - Reportable Business Segments
Revenues by reportable business segment were as follows for the six months ended June 30:
|
| | | | | | | | | | | | | | |
| | | 2018 | | 2017 | | Increase |
| $ | | % |
| | | (Dollars in millions) |
| Financial Services | | $ | 2,930 |
| | $ | 2,782 |
| | $ | 148 |
| | 5.3 |
| Healthcare | | 2,277 |
| | 2,053 |
| | 224 |
| | 10.9 |
| Products and Resources | | 1,661 |
| | 1,484 |
| | 177 |
| | 11.9 |
| Communications, Media and Technology | | 1,050 |
| | 897 |
| | 153 |
| | 17.1 |
Total revenues(1) | | $ | 7,918 |
| | $ | 7,216 |
| | $ | 702 |
| | 9.7 |
_____________________
| |
| (1) | Results for 2018 are presented under the New Revenue Standard, while prior period amounts are not adjusted and continue to be reported in accordance with our historic accounting policies. See Note 3 to our unaudited consolidated financial statements for additional information. |
Financial Services
Revenues from our Financial Services segment grew 5.3%, inclusive of a positive currency impact of 1.6%, for the six months ended June 30, 2018, as compared to the six months ended June 30, 2017. Growth was stronger among our insurance customers where revenues increased by $109 million as compared to an increase of $39 million for our banking customers. In this segment, revenues from customers added since June 30, 2017 were $56 million and represented 37.8% of the period-over-period revenue increase in this segment. Key areas of focus for our Financial Services customers included the adoption and integration of digital technologies that are reshaping our customers' business and operating models, cost optimization, robotic process automation, cyber security and vendor consolidation. Demand from certain banking customers may continue to be negatively affected by their ongoing efforts to optimize the cost of supporting their systems and operations as they shift their spend to transformation and digital services.
Healthcare
Revenues from our Healthcare segment grew 10.9% for the six months ended June 30, 2018, as compared to the six months ended June 30, 2017. Revenues from our healthcare customers increased by $211 million, including revenues from Bolder Healthcare Solutions acquired in the second quarter of 2018 and a new strategic customer acquired in the third quarter of 2017, while revenue growth among our life sciences customers was $13 million. Revenues from customers added since June 30, 2017 were $66 million and represented 29.5% of the period-over-period revenue increase in this segment. The increase in revenues from our life sciences customers was driven by a growing demand for a broader range of services, including business process services, advanced data analytics and solutions that span multiple service lines while leveraging cloud technologies and platforms. The demand for our services among healthcare customers could be affected by uncertainty in the regulatory environment. We believe that in the long term the healthcare industry continues to present a significant growth opportunity due to factors that are transforming the industry, including the changing regulatory environment, increasing focus on medical costs, and the consumerization of healthcare.
Products and Resources
Revenues from our Products and Resources segment grew 11.9%, inclusive of a positive currency impact of 2.4%, for the six months ended June 30, 2018, as compared to the six months ended June 30, 2017. Revenue growth in this segment was strongest among our energy and utilities customers and manufacturing and logistics customers, where revenues increased by a combined $130 million. Revenues from our retail and consumer goods customers and travel and hospitality customers increased by a combined $47 million. Revenues from customers added since June 30, 2017 were $50 million, representing 28.2% of the period-over-period revenue increase in this segment. Demand within this segment continues to be driven by increased adoption of digital technologies that are reshaping our customers' business and operating models, as well as growing demand for analytics, supply chain consulting, implementation initiatives, smart products, transformation of business models, internet of things and omni channel commerce
implementation and integration services. Discretionary spending by our retail customers has been and may continue to be affected by weakness in the retail sector.
Communications, Media and Technology
Revenues from our Communications, Media and Technology segment grew 17.1%, inclusive of a positive currency impact of 2.4%, for the six months ended June 30, 2018, as compared to the six months ended June 30, 2017. Revenue growth was $112 million among our technology customers and $41 million among our communications and media customers. Revenues from customers added since June 30, 2017 were $11 million and represented 7.2% of the period-over-period revenue increase in this segment. Growth within this segment was driven by the increased adoption of digital technologies, digital content operations, services to help our customers balance rationalizing costs while creating a differentiated user experience and an expanded range of services, including business process services. Revenue growth among our communications customers has been and may continue to be negatively affected by uncertainty due to significant merger and acquisition activity in their industry.
Revenues - Geographic Markets
Revenues by geographic market were as follows for the six months ended June 30:
|
| | | | | | | | | | | | | | |
| | | 2018 | | 2017 | | Increase (Decrease) |
| $ | | % |
| | | (Dollars in millions) |
| North America | | $ | 6,042 |
| | $ | 5,612 |
| | $ | 430 |
| | 7.7 |
| United Kingdom | | 619 |
| | 562 |
| | 57 |
| | 10.1 |
| Rest of Europe | | 755 |
| | 576 |
| | 179 |
| | 31.1 |
| Europe - Total | | 1,374 |
| | 1,138 |
| | 236 |
| | 20.7 |
| Rest of World | | 502 |
| | 466 |
| | 36 |
| | 7.7 |
Total revenues(1) | | $ | 7,918 |
| | $ | 7,216 |
| | $ | 702 |
| | 9.7 |
_____________________
| |
| (1) | Results for 2018 are presented under the New Revenue Standard, while prior period amounts are not adjusted and continue to be reported in accordance with our historic accounting policies. See Note 3 to our unaudited consolidated financial statements for additional information. |
North America continues to be our largest market, representing 76.3% of total revenues for the six months ended June 30, 2018 and accounting for 61.3% of total revenue growth over the six months ended June 30, 2017. Revenues from our customers in Europe grew 20.7%, after a positive currency impact of 9.0%. Specifically, revenues from our Rest of Europe customers grew 31.1% after an positive currency impact of 9.9%, while within the United Kingdom we experienced an increase in revenues of 10.1%, after a positive currency impact of 8.2%. Revenue growth in the United Kingdom was negatively affected by weakness in the banking sector in that region. Revenues from our Rest of World customers grew 7.7%. We believe that Europe, India, Middle East, Asia Pacific and Latin America regions will continue to be areas of significant investment for us as we see these regions as long term growth opportunities.
Cost of Revenues (Exclusive of Depreciation and Amortization Expense)
Our cost of revenues consists primarily of salaries, incentive-based compensation, stock-based compensation expense, employee benefits, project-related immigration and travel for technical personnel and subcontracting costs relating to revenues. Our cost of revenues increased by 8.1% during the six months ended June 30, 2018 as compared to the six months ended June 30, 2017, decreasing as a percentage of revenues to 60.8% in the first half of 2018 compared to 61.7% in the first half of 2017. The decrease as a percentage of revenues was due primarily to a decrease in compensation and benefits costs as revenue growth outpaced headcount growth, partially offset by an increase in fees paid to strategic partners and other vendors related to our managed services and digital products. For the six months ended June 30, 2018, compensation and benefits costs increased by $245 million as compared to the six months ended June 30, 2017.
Selling, General and Administrative Expenses
Selling, general and administrative expenses consist primarily of salaries, incentive-based compensation, stock-based compensation expense, employee benefits, immigration, travel, marketing, communications, management, finance, administrative and occupancy costs. Selling, general and administrative expenses, including depreciation and amortization, increased by 9.6% during the six months ended June 30, 2018 as compared to the six months ended June 30, 2017, decreasing as a percentage of revenues to 21.9% for the six months ended June 30, 2018 as compared to 22.0% for the six months ended June 30, 2017. The
decrease as a percentage of revenues was due primarily to efficiencies of leveraging our cost structure over a larger organization, partially offset by the initial funding of the Cognizant U.S. Foundation in the second quarter of 2018.
Income from Operations and Operating Margin - Overall
Income from operations increased 15.9% for the six months ended June 30, 2018 as compared to the same period in 2017. Our operating margin increased to 17.2% for the six months ended June 30, 2018 from 16.3% for the six months ended June 30, 2017, due to a decrease, as a percentage of revenues, in compensation and benefits costs as revenue growth outpaced headcount growth, partially offset by the initial funding of the Cognizant U.S. Foundation in the second quarter of 2018 and an increase in fees paid to strategic partners and other vendors related to our managed service and digital products. Excluding the impact of applicable designated cash flow hedges, the appreciation of the Indian rupee against the U.S. dollar positively impacted our operating margin by approximately 2 basis points or 0.02% percentage points during the six months ended June 30, 2018. Each additional 1.0% change in exchange rate between the Indian rupee and the U.S. dollar will have the effect of moving our operating margin by approximately 18 basis points or 0.18 percentage points.
We entered into foreign exchange forward contracts to hedge certain Indian rupee denominated payments in India. These hedges are intended to mitigate the volatility of the changes in the exchange rate between the U.S. dollar and the Indian rupee. During the six months ended June 30, 2018, the settlement of cash flow hedges positively impacted our operating margin by approximately 71 basis points or 0.71 percentage points, as compared to a positive impact of approximately 76 basis points or 0.76 percentage points during the six months ended June 30, 2017.
For the six months ended June 30, 2018 and 2017, our non-GAAP operating margins were 21.2%5 and 19.5%5, respectively. As set forth in the “Non-GAAP Financial Measures” section below, our non-GAAP operating margin excludes stock based compensation expense, acquisition-related charges, realignment charges and in the second quarter of 2018, the initial funding of the Cognizant U.S. Foundation.
Segment Operating Profit
Segment operating profits were as follows for the six months ended June 30:
|
| | | | | | | | | | | | | |
| | | | | | Increase (Decrease) |
| | 2018 | | 2017 | | $ | | % |
| | (Dollars in millions) |
| Financial Services | $ | 909 |
| | $ | 872 |
| | $ | 37 |
| | 4.2 |
| Healthcare | 695 |
| | 619 |
| | 76 |
| | 12.3 |
| Products and Resources | 514 |
| | 447 |
| | 67 |
| | 15.0 |
| Communications, Media and Technology | 338 |
| | 291 |
| | 47 |
| | 16.2 |
| Total segment operating profit | 2,456 |
| | 2,229 |
| | 227 |
| | 10.2 |
| Less: unallocated costs | 1,093 |
| | 1,053 |
| | 40 |
| | 3.8 |
| Income from operations | $ | 1,363 |
| | $ | 1,176 |
| | $ | 187 |
| | 15.9 |
In our Healthcare and Products and Resources business segments, operating profits increased as a percentage of revenues as revenue growth outpaced headcount growth, partially offset by investments to accelerate our shift to digital. In our Financial Services and Communication, Media and Technology business segments, operating profits decreased as a percentage of revenues due to investments to accelerate our shift to digital.
________________
| |
| 5 | Non-GAAP operating margin is not a measurement of financial performance prepared in accordance with GAAP. See “Non-GAAP Financial Measures” for more information and a reconciliation to the most directly comparable GAAP financial measure. |
Other Income (Expense), Net
Total other income (expense), net consists primarily of foreign currency exchange gains and (losses) and interest income. The following table sets forth total other income (expense), net for the six months ended June 30:
|
| | | | | | | | | | | |
| | 2018 | | 2017 | | Increase/ Decrease |
| | (in millions) |
| Foreign currency exchange (losses) gains | $ | (131 | ) | | $ | 70 |
| | $ | (201 | ) |
| Gains (losses) on foreign exchange forward contracts not designated as hedging instruments | 20 |
| | (13 | ) | | 33 |
|
| Foreign currency exchange (losses) gains, net | (111 | ) | | 57 |
| | (168 | ) |
| Interest income | 81 |
| | 63 |
| | 18 |
|
| Interest expense | (13 | ) | | (12 | ) | | (1 | ) |
| Total other (expense) income, net | $ | (43 | ) | | $ | 108 |
| | $ | (151 | ) |
The foreign currency exchange gains and losses were primarily attributed to the remeasurement of the Indian rupee denominated net monetary assets in our U.S. dollar functional currency India subsidiaries as well as the remeasurement of other net monetary assets and liabilities denominated in currencies other than the functional currencies of our subsidiaries. The gains and losses on our foreign exchange forward contracts not designated as hedging instruments relate to the realized and unrealized gains and losses on foreign exchange forward contracts entered into primarily to offset foreign currency exposure to the Indian rupee and other non-U.S. dollar denominated net monetary assets and liabilities. As of June 30, 2018, the notional value of our undesignated hedges was $432 million. The increase in interest income of $18 million was primarily attributable to an increase in average invested balances in 2018.
Provision for Income Taxes
The provision for income taxes increased to $345 million during the six months ended June 30, 2018 from $257 million during the six months ended June 30, 2017. The effective income tax rate increased to 26.1% for the six months ended June 30, 2018 from 20.0% for the six months ended June 30, 2017. The increase in our effective income tax rate was primarily due to the recognition in the first quarter of 2017 of income tax benefits previously unrecognized in our consolidated financial statements related to several uncertain tax positions totaling $72 million and a higher effective income tax rate for our India subsidiaries resulting from the foreign currency exchange gains on their statutory books as the Indian rupee depreciated against the U.S. dollar. The estimate of our 2018 annual effective income tax rate reflects the current interpretation of the Tax Reform Act, including the GILTI provision and may change as we receive additional clarification and guidance and as the interpretation of the Tax Reform Act evolves over time.
Net Income
Net income decreased to $976 million for the six months ended June 30, 2018 from $1,027 million for the six months ended June 30, 2017, representing 12.3% and 14.2% of revenues, respectively. The decrease in net income as a percentage of revenues is primarily due to foreign exchange losses in 2018 compared to gains in 2017.
Non-GAAP Financial Measures
The following table presents a reconciliation of each non-GAAP financial measure to the most comparable GAAP measure for the six months ended June 30:
|
| | | | | | | | | | | |
| | 2018 | | % of Revenues | | 2017 | | % of Revenues |
| | (Dollars in millions, except per share amounts) |
| GAAP income from operations and operating margin | $ | 1,363 |
| | 17.2 | | $ | 1,176 |
| | 16.3 |
Add: Stock-based compensation expense (1) | 130 |
| | 1.6 | | 109 |
| | 1.5 |
Add: Acquisition-related charges (2) | 82 |
| | 1.1 | | 69 |
| | 1.0 |
Add: Realignment charges (3) | 1 |
| | — | | 50 |
| | 0.7 |
Add: Initial funding of Cognizant U.S. Foundation (4) | 100 |
| | 1.3 | | — |
| | — |
| Non-GAAP income from operations and non-GAAP operating margin | $ | 1,676 |
| | 21.2 | | $ | 1,404 |
| | 19.5 |
| | | | | | | | |
| GAAP diluted earnings per share | $ | 1.66 |
| | | | $ | 1.71 |
| | |
| Effect of above operating adjustments, pre-tax | 0.53 |
| | | | 0.38 |
| | |
Effect of non-operating foreign currency exchange losses (gains), pre-tax (5) | 0.19 |
| | | | (0.10 | ) | | |
Tax effect of non-GAAP adjustments to pre-tax income (6) | (0.13 | ) | | | | (0.14 | ) | | |
Effect of recognition of income tax benefit related to an uncertain tax position (7) | — |
| | | | (0.09 | ) | | |
| Non-GAAP diluted earnings per share | $ | 2.25 |
| | | | $ | 1.76 |
| | |
_____________________
| |
| (1) | Stock-based compensation expense reported in: |
|
| | | | | | | |
| | Six Months Ended
June 30, |
| | 2018 | | 2017 |
| | (in millions) |
| Cost of revenues | $ | 31 |
| | $ | 28 |
|
| Selling, general and administrative expenses | 99 |
| | 81 |
|
| |
| (2) | Acquisition-related charges include, when applicable, amortization of purchased intangible assets included in the depreciation and amortization expense line on our consolidated statements of operations, external deal costs, acquisition-related retention bonuses, integration costs, changes in the fair value of contingent consideration liabilities, charges for impairment of acquired intangible assets and other acquisition-related costs. |
| |
| (3) | Realignment charges include severance costs, lease termination costs, and advisory fees related to non-routine shareholder matters and to the development of our realignment and return of capital programs, as applicable. The total costs related to the realignment are reported in "Selling, general and administrative expenses" in our consolidated statements of operations. |
| |
| (4) | In the second quarter of 2018, we provided $100 million of initial funding to Cognizant U.S. Foundation, which is focused on STEM education in the United States. |
| |
| (5) | Non-operating foreign currency exchange gains (losses), inclusive of gains and losses on related foreign exchange forward contracts not designated as hedging instruments for accounting purposes, are reported in "Foreign currency exchange gains (losses), net" in our consolidated statements of operations. |
| |
| (6) | Presented below are the tax impacts of each of our non-GAAP adjustments to pre-tax income: |
|
| | | | | | | |
| | Six Months Ended
June 30, |
| | 2018 | | 2017 |
| | (in millions) |
| Non-GAAP income tax benefit (expense) related to: | | | |
| Stock-based compensation expense | $ | 38 |
|
| $ | 41 |
|
| Acquisition-related charges | 20 |
|
| 24 |
|
| Realignment charges | — |
|
| 18 |
|
| Foreign currency exchange gains (losses) | (9 | ) |
| 5 |
|
| Initial funding of Cognizant U.S. Foundation | 28 |
| | — |
|
The effective tax rate related to each of our non-GAAP adjustments varies depending on the jurisdictions in which such income and expenses are generated and the statutory rates applicable in those jurisdictions.
| |
(6)(7) | During the three months ended March 31, 2017, we recognized an income tax benefit previously unrecognized in our consolidated financial statements related to a specific uncertain tax position of $55 million. The recognition of the benefit in the first quarter of 2017 was based on management’s reassessment regarding whether this unrecognized tax benefit met the more-likely-than-not threshold in light of the lapse in the statute of limitations as to a portion of such benefit. |
|
| | | | |
| Liquidity and Capital Resources |
Cash generated from operations has historically been our primary source of liquidity to fund operations and investments to grow our business. In addition, as of March 31,June 30, 2018, we had cash, cash equivalents and short-term investments of $4,989$4,247 million, of which $507$419 million was restricted and not available for use as a result of our dispute with the ITD with respect to our 2016 India Cash Remittance. See Note 7 and Note 149 of our unaudited consolidated financial statements for more information. In addition,As of June 30, 2018, we had available capacity under our revolving credit facility of approximately $750 million. The following table provides a summary of our cash flows for the threesix months ended March 31:June 30: | | | | | 2018 | | 2017 | | Increase / Decrease | | 2018 | | 2017 | | Increase / Decrease |
| | | (in millions) | | (in millions) |
| Net cash provided by operating activities | | $ | 388 |
| | $ | 277 |
| | $ | 111 |
| | $ | 1,028 |
| | $ | 798 |
| | $ | 230 |
|
| Net cash (used in) provided by investing activities | | (227 | ) | | 91 |
| | (318 | ) | |
| Net cash (used in) investing activities | | | (811 | ) | | (298 | ) | | (513 | ) |
| Net cash (used in) financing activities | | (488 | ) | | (1,124 | ) | | 636 |
| | (1,222 | ) | | (1,421 | ) | | 199 |
|
Operating activities
The increase in cash generated from operating activities was primarily attributable to anthe increase in income from operations forand the threeincrease in non-cash expenses in the six months ended March 31,June 30, 2018 as compared to the same period in 2017, partially offset by higher incentive-based compensation payments during the three months ended March 31, 2018 as compared to 2017.initial funding of the Cognizant U.S. Foundation in the second quarter of 2018.
On January 1, 2018, we adopted the New Revenue Standard using the modified retrospective method. As a result of adoption, we classify our right to consideration in exchange for deliverables as either a receivable or a contract asset. A receivable is a right to consideration that is unconditional (i.e. only the passage of time is required before payment is due). By contrast, a contract asset is a right to consideration that is conditional upon factors other than the passage of time. Upon adoption, we reclassified (i) balances representing receivables, as defined by the New Revenue Standard, from Unbilled accounts receivable to Trade accounts receivable, net and (ii) balances representing contract assets, as defined by the New Revenue Standard, from Unbilled accounts receivable to Other current assets. Balances as of March 31,June 30, 2018 are presented under the New Revenue Standard, while prior period balances are not adjusted and continue to be reported in accordance with our historic accounting policies.
Historically, our days sales outstanding calculation included billed and unbilled accounts receivable, net of allowance for doubtful accounts, reduced by the uncollected portion of our deferred revenue. To reflect the adoption of the New Revenue Standard and maintain the comparability of the calculation, in 2018 we adjusted the definition to include receivables, as defined by the New Revenue Standard, net of allowance for doubtful accounts, and contract assets, reduced by the uncollected portion of our deferred revenue. Our days sales outstanding as of March 31,June 30, 2018 was 7576 days, higher as compared to 71 days as of December 31, 2017 and 7273 days as of March 31,June 30, 2017. The adoption of the New Revenue Standard increased our days sales outstanding as of March 31,June 30, 2018 by 2 days. We monitor turnover, aging and the collection of accounts receivable by customer.
Investing activities
The increase in cash used in investing activities in the 2018 period compared to cash generated from investing activities in the same period of 2017 is primarily related to net investment purchaseshigher payments for acquisitions and outflows for capital expenditures in the 2018 period as compared to net investment sales or maturities in the same period in 2017.
Financing activities
The decrease in cash used in financing activities in the 2018 period is primarily attributable to lower repurchases of common stock in 2018 compared to the same period in 2017, partially offset by higher dividends paid in 2018 and net repayments under the revolving credit facility in 2018 as compared to net borrowings under the credit facility in the same period in 2017.
In 2014, we entered into a credit agreement with a commercial bank syndicate, or the Credit Agreement, providing for a $1,000 million unsecured term loan and a $750 million revolving credit facility. The term loan was used to pay a portion of the cash consideration in connection with our acquisition of TZ US Parent, Inc., or TriZetto. The revolving credit facility is available for general corporate purposes. The term loan and the revolving credit facility both mature in November 2019. As of March 31,June 30, 2018, we had $775$750 million outstanding under the term loan and no outstanding notes under the revolving credit facility.
The term loan and the revolving credit facility both mature in November 2019 with a final payment of $625 million due on the term loan. While we believe we will have sufficient liquidity to fund the final payment if necessary, we plan to evaluate alternative financing arrangements prior to maturity.
The Credit Agreement contains certain negative covenants, including limitations on liens, mergers, consolidations and acquisitions, subsidiary indebtedness and affiliate transactions, as well as certain affirmative covenants. In addition, the Credit Agreement requires us to maintain a debt to total stockholders' equity ratio not in excess of 0.40 to 1.00. As of March 31,June 30, 2018, we were in compliance with our debt covenants and have provided a quarterly certification to our lenders to that effect. We believe that we currently meet all conditions set forth in the Credit Agreement to borrow thereunder, and we are not aware of any conditions that would prevent us from borrowing part or all of the remaining available capacity under the revolving credit facility as of March 31,June 30, 2018 and through the date of this filing.
In February 2017, we announced a plan to return $3.4 billion to stockholders by the end of 2018 through a combination of stock repurchases and cash dividends. As part of this plan, to date we expended $2.1$2.7 billion to repurchase our Class A common stock under ASRs and paid cash dividends totaling $383$501 million. The payments related to the ASRs were funded with cash on hand in the U.S. and borrowings under the revolving credit facility. We expect to fund the remaining portion of the capital return plan from cash from operations and from available capacity under our revolving credit facility. Stock repurchases may be made from time to time through open-market purchases, through the use of Rule 10b5-1 plans and/or by other means. We are currently evaluating the longer term impact the Tax Reform Act may have on our overall capital return program. As a first step, in February 2018 our Board of Directors approved an increase to our quarterly dividend to $0.20 per share.
Our Board of Directors reviews our capital return plan on an ongoing basis with consideration given to our financial performance, economic outlook, regulatory changes and any other relevant factors. The Board of Directors’ determinations regarding future share repurchases and dividends will include evaluating the longer term impact of the Tax Reform Act, as well as a variety of other factors, including our net income, cash flow generated from operations or other sources, liquidity position and potential alternative uses of cash, such as acquisitions, as well as economic conditions and expected future financial results. As these factors may change over time, the amount of stock repurchase activity and actual amount of dividends declared, if any, during any particular period cannot be predicted and may fluctuate from time to time. There can be no guarantee that we will achieve the objective of our announced capital return plan in the amounts or within the expected time frame that we have indicated, or at all.
Other Liquidity and Capital Resources Information
We seek to ensure that our worldwide cash is available in the locations in which it is needed. As part of our ongoing liquidity assessments, we regularly monitor the mix of our domestic and international cash flows and cash balances. As a result of the enactment of the Tax Reform Act, our historical and future foreign earnings are no longer subject to U.S. federal income tax upon repatriation beyond the one-time transition tax accrued in the fourth quarter of 2017. During the first quarterhalf of 2018, we repatriated $2,010$2,108 million from our foreign subsidiaries. As of March 31,June 30, 2018, $2,983$2,570 million of our cash, cash equivalents and short-term investments were held outside the United States, of which $1,565$1,723 million was held in India. As further described in Note 149 of our unaudited consolidated financial statements, $507$419 million of these assetsour short-term investment balances held in India were classified as restricted as of March 31,June 30, 2018. We are continuing to evaluate what portion of the non-U.S. cash, cash equivalents and short-term investments held outside India is needed locally to execute our strategic plans and what amount is available for repatriation back to the United States.
Our Indian earnings are indefinitely reinvested and our current plans do not demonstrate the need to repatriate our historical undistributed earnings of our India subsidiaries to fund our liquidity needs outside of India. In reaching this conclusion, we considered our global capital needs, the available sources of liquidity globally and our growth plans in India. However, future events may occur, such as material changes in cash estimates, discretionary transactions, including corporate restructurings, and changes in applicable laws, that may lead us to repatriate Indian earnings. If we were to change our assertion that our accumulated undistributed Indian earnings are indefinitely reinvested, we would expect, based on our current interpretation of Indian tax law, to accrue additional tax expense at a rate of approximately 21% of cash available for distribution, which could have a material adverse effect on our future effective income tax rate. This estimate is subject to change based on tax legislative developments in India and other jurisdictions as well as judicial and interpretive developments of applicable tax laws.
We expect our operating cash flow, cash and investment balances (excluding the $507$419 million of India restricted assets), and available capacity under our revolving credit facility to be sufficient to meet our operating requirements, in India and globally, for
the next twelve months. We expect to fund the remaining balance of the one-time transition tax related to the Tax Reform Act, of $635 million, which is payable over eight years,in installments through the year 2024, from a combination of cash generated from operations, borrowings and the repatriation of a portion of our historical non-U.S. earnings that are available for distribution to the United States. Our ability to expand and grow our business in accordance with current plans, to make acquisitions and form joint ventures, to meet our long-term capital requirements beyond a twelve month period and our ability to execute the remainder of our capital return plan will depend on many factors, including the rate, if any, at which our cash flow increases, our ability and willingness to accomplish acquisitions and joint ventures with capital stock and the availability of public and private debt and equity financing. We cannot be certain that additional financing, if required, will be available on terms and conditions acceptable to us, if at all.
As further described in Note 7 and Note 149 of our unaudited consolidated financial statements, certain cash, cash equivalents and short-term investment balances in India totaling $507$419 million were restricted in connection with our dispute with the ITD with respect to our 2016 India Cash Remittance. The dispute with the ITD is ongoing, and no final decision has been reached. The affected balances may continue to remain restricted and unavailable for our use while the dispute is ongoing. Additionally, while we believe that we have paid all applicable taxes related to the transactions underlying the ITD Dispute, if it is ultimately determined that we are liable for the full amount of additional taxes the ITD claims we owe, our liquidity could be materially adversely affected. |
| | | | |
| Commitments and Contingencies |
See Note 1113 to our unaudited consolidated financial statements. |
| | | | |
| Off-Balance Sheet Arrangements |
Other than our foreign exchange forward contracts, there were no off-balance sheet transactions, arrangements or other relationships with unconsolidated entities or other persons in the threesix months ended March 31,June 30, 2018 that have, or are reasonably likely to have, a current or future effect on our financial condition, revenues or expenses, results of operations, liquidity, capital expenditures or capital resources.
|
| | | | |
| Critical Accounting Estimates |
Management’s discussion and analysis of our financial condition and results of operations is based on our unaudited consolidated financial statements that have been prepared in accordance with accounting principles generally accepted in the United States of America. The preparation of these financial statements requires management to make estimates and assumptions that affect the amounts reported for assets and liabilities, including the recoverability of tangible and intangible assets, disclosure of contingent assets and liabilities as of the date of the financial statements, and the reported amounts of revenues and expenses during the reported period. On an on-going basis, we evaluate our estimates. The most significant estimates relate to the recognition of revenue and profits, including the application of the cost to cost method of measuring progress to completion for certain fixed-price contracts, income taxes, assumptions used in valuing stock-based compensation arrangements, valuation of investments and derivative financial instruments, business combinations, valuation of goodwill and other long-lived assets and contingencies. We base our estimates on historical experience, current trends and on various other assumptions that are believed to be reasonable under the circumstances, the results of which form the basis for making judgments about the carrying values of assets and liabilities that are not readily apparent from other sources. The actual amounts may differ from the estimates used in the preparation of the accompanying unaudited consolidated financial statements. For a discussion of our critical accounting estimates, see “Item 7. Management’s Discussion and Analysis of Financial Condition and Results of Operations” in our 2017 Annual Report on Form 10-K. Our significant accounting policies are described in Note 1 to the audited consolidated financial statements included in our 2017 Annual Report on Form 10-K. There have been no material changes to the aforementioned critical accounting estimates and policies during the quarter.
|
| | | | |
| Recently Adopted and New Accounting Pronouncements |
See Note 1 to our unaudited consolidated financial statements. |
| | | | |
| Forward Looking Statements |
The statements contained in this Quarterly Report on Form 10-Q that are not historical facts are forward-looking statements (within the meaning of Section 21E of the Exchange Act) that involve risks and uncertainties. Such forward-looking statements may be identified by, among other things, the use of forward-looking terminology such as “believe,” “expect,” “may,” “could,” “would,” “plan,” “intend,” “estimate,” “predict,” “potential,” “continue,” “should” or “anticipate” or the negative thereof or other variations thereon or comparable terminology, or by discussions of strategy that involve risks and uncertainties. From time to time, we or our representatives have made or may make forward-looking statements, orally or in writing.
Such forward-looking statements may be included in various filings made by us with the SEC, or press releases or oral statements made by or with the approval of one of our authorized executive officers. These forward-looking statements, such as statements regarding anticipated future revenues or operating margins, contract percentage completions, earnings, capital expenditures, anticipated effective tax rates, liquidity, access to capital, capital return plan, investment strategies, cost management, realignment program, plans and objectives, including those related to our digital practice areas, investment in our business and potential acquisitions, industry trends, customer behaviors and trends, and the ongoing internal investigation and other statements regarding matters that are not historical facts, are based on our current expectations, estimates and projections, management’s beliefs and certain assumptions made by management, many of which, by their nature, are inherently uncertain and beyond our control. Actual results, performance, achievements and outcomes could differ materially from the results expressed in, or implied by, these forward-looking statements. There are a number of important factors that could cause our results to differ materially from those indicated by such forward-looking statements, including:
competition from other service providers;
the risk that we may not be able to achieve targeted improvements in our operating margin and level of profitability, or that our operating margin and profitability may decline;
the risk of liability or damage to our reputation resulting from security breaches or disclosure of sensitive data or failure to comply with data protection laws and regulations;
the risk that we may not be able to keep pace with the rapidly evolving technological environment;
the rate of growth in the use of technology in business and the type and level of technology spending by our customers;
mispricing of our services, especially on our fixed-price and transaction- or volume-based priced contracts;
risks associated with our ongoing internal investigation into possible violations of the FCPA and similar laws, including the cost of such investigation and any sanctions, fines or remedial measures that may be imposed by the DOJ or SEC, additional expenses related to remedial measures, the costs of defending and/or settling possible judgments against us that may result from associated lawsuits against us and any possible impact on our ability to timely file the required reports with the SEC;
our inability to successfully acquire or integrate target companies;
system failure or disruptions in our communications or information technology;
the risk that we may lose key executives and not be able to enforce non-competition agreements with them;
competition for hiring highly-skilled technical personnel;
possible failure to provide business solutions and deliver complex and large projects for our customers;
the risk of reputational harm to us;
the effect of our use of derivative instruments;
our revenues being highly dependent on customers concentrated in certain industries, including financial services and healthcare, and located primarily in the United States and Europe;
the risk that we may not be able to pay dividends or repurchase shares in accordance with our capital return plan, or at all;
risks relating to our global operations, including our operations in India;
the effects of fluctuations in the Indian rupee and other currency exchange rates;
the risk of war, terrorist activities, pandemics and natural disasters;
the Brexit Referendum and any negative effects on global economic conditions, financial markets and our business;
the risk that we may not be able to enforce or protect our intellectual property rights, or that we may infringe upon the intellectual property rights of others;
regulatory uncertainties, including in the areas of outsourcing, immigration and taxes;
increased regulation of the financial services and healthcare industries, as well as other industries in which our customers operate;
the possibility that we may be required to or choose to repatriate Indian earnings;
the possibility that we may lose certain tax benefits provided to companies in our industry by the Indian government, and any adverse outcome of our dispute with the ITD; and
The factors set forth in "Part I, Item 1A. Risk Factors” in our Annual Report on Form 10-K for the year ended December 31, 2017.
You are advised to consult any further disclosures we make on related subjects in the reports we file with the SEC, including this report in the section titled “Part I, Item 2. Management’s Discussion and Analysis of Financial Condition and Results of Operations” and “Part I, Item 1. Business” in our Annual Report on Form 10-K for the year ended December 31, 2017. We undertake no obligation to update or revise any forward-looking statements, whether as a result of new information, future events or otherwise, except as may be required under applicable securities laws.
|
| | | |
| Item 3. Quantitative and Qualitative Disclosures about Market Risk. |
There have been no material changes in our quantitative and qualitative disclosures about market risk from those disclosed in Part II, Item 7A, Quantitative and Qualitative Disclosures about Market Risk, in our Annual Report on Form 10-K for the fiscal year ended December 31, 2017, filed with the SEC on February 27, 2018.
|
| | | |
| Item 4. Controls and Procedures. |
Evaluation of Disclosure Controls and Procedures
Our management, under the supervision and with the participation of our chief executive officer and our chief financial officer, evaluated the design and operating effectiveness of our disclosure controls and procedures (as defined in Rules 13a-15(e) and 15d-15(e) under the Securities Exchange Act of 1934, as amended, or the Exchange Act) as of March 31,June 30, 2018. Based on this evaluation, our chief executive officer and our chief financial officer concluded that, as of March 31,June 30, 2018, our disclosure controls and procedures were effective.
Changes in Internal Control over Financial Reporting
No changes in our internal control over financial reporting (as defined in Rules 13a-15(f) and 15d-15(f) under the Exchange Act) occurred during the fiscal quarter ended March 31,June 30, 2018 that have materially affected, or are reasonably likely to materially affect, our internal control over financial reporting.
PART II. OTHER INFORMATION
|
| | | | |
| Item 1. Legal Proceedings |
See Note 1113 to our unaudited consolidated financial statements.
There have been no material changes in our risk factors from those disclosed in Part I, Item 1A, Risk Factors, in our Annual Report on Form 10-K for the fiscal year ended December 31, 2017 filed with the SEC on February 27, 2018.
|
| | | | |
| Item 2. Unregistered Sales of Equity Securities and Use of Proceeds |
Issuer Repurchases of Equity Securities
Our existing stock repurchase program, as approved by our Board of Directors, allows for the repurchase of $3.5 billion of our outstanding shares of Class A common stock, excluding fees and expenses, through December 31, 2019. Under the stock repurchase program, the Company is authorized to repurchase its Class A common stock through open market purchases, including under a trading plan adopted pursuant to Rule 10b5-1 of the Exchange Act, or in private transactions, in accordance with applicable federal securities laws. The timing of repurchases and the exact number of shares to be purchased are determined by the Company’s management, in its discretion, or pursuant to a Rule 10b5-1 trading plan, and will depend upon market conditions and other factors.
As of March 31,June 30, 2018, the remaining available balance under our stock repurchase program authorized by the Board of Directors was $1.4$0.8 billion.
| | | Month | | Total Number
of Shares
Purchased | | Average
Price Paid
per Share | | Total Number of
Shares Purchased
as Part of Publicly
Announced
Plans or
Programs | | Approximate
Dollar Value of Shares
that May Yet Be
Purchased under the
Plans or Programs
(in millions) | | Total Number
of Shares
Purchased | | Average
Price Paid
per Share | | Total Number of
Shares Purchased
as Part of Publicly
Announced
Plans or
Programs | | Approximate
Dollar Value of Shares
that May Yet Be
Purchased under the
Plans or Programs
(in millions) |
| January 1, 2018 - January 31, 2018 | | | | | | | | | |
| April 1, 2018 - April 30, 2018 | | | | | | | | | |
| Open market and privately negotiated purchases | | — |
| | $ | — |
| | — |
| | $ | 1,700 |
| | — |
| | $ | — |
| | — |
| | $ | 1,400 |
|
| February 1, 2018 - February 28, 2018 | | | | | | | | | |
| May 1, 2018 - May 31, 2018 | | | | | | | | | |
| Open market and privately negotiated purchases | | — |
| | — |
| | — |
| | 1,700 |
| | — |
| | — |
| | — |
| | |
| March 1, 2018 - March 31, 2018 | | | | | | | | | |
| March 2018 ASR | | | 708,984 |
| | (a) |
| | 708,984 |
| | 1,400 |
|
| June 1, 2018 - June 30, 2018 | | | | | | | | | |
| Open market and privately negotiated purchases | | — |
| | — |
| | — |
| | | | — |
| | — |
| | — |
| | |
| December 2017 ASR | | 378,598 |
| | (a) |
| | 378,598 |
| | | |
| March 2018 ASR | | 3,043,323 |
| | (b) |
| | 3,043,323 |
| | 1,400 |
| |
| June 2018 ASR | | | 6,492,680 |
| | (b) |
| | 6,492,680 |
| | 800 |
|
| Total | | 3,421,921 |
| | $ | — |
| | 3,421,921 |
| | | | 7,201,664 |
| | $ | — |
| | 7,201,664 |
| | |
| |
| (a) | In December 2017,March 2018, the Company entered into an ASR to purchase up to $300 million of the Company's Class A common stock. In MarchMay 2018, the purchase period for the ASR ended and an additional 0.40.7 million shares were delivered. In total, 4.03.7 million shares were delivered under the ASR at an average repurchase price of $75.75.$79.95. |
| |
| (b) | Under the terms of the MarchJune 2018 ASR and in exchange for up-front payments of $300$600 million, the financial institution initially delivered 3.06.5 million shares, a portion of the Company's total expected shares to be repurchased under the MarchJune 2018 ASR. The total number of shares ultimately delivered and therefore the average price paid per share, will be determined at the end of the purchase period, which is scheduled to end during the secondthird quarter of 2018, based on the volume-weighted average price of the Company's common stock during that period. |
During the three months ended March 31,June 30, 2018, we purchased shares in connection with our stock-based compensation plans, whereby shares of our common stock were tendered by employees for payment of applicable statutory tax withholdings. For the three months ended March 31,June 30, 2018, such repurchases totaled 201,888433,947 shares at an aggregate cost of $16$33 million.
EXHIBIT INDEX
|
| | | | | | | | | | | | | |
| | | | | Incorporated by Reference | | |
| Number | | Exhibit Description | | Form | | File No. | | Exhibit | | Date | | Filed or Furnished Herewith |
| 3.1 | | | | 8-K | | 000-24429 | | 3.2 |
| | 9/17/2013 | | |
| 3.2 | | | | 8-K | | 000-24429 | | 3.1 |
| | 3/31/2017 | | |
| 31.1 | | | | | | | | | | | | Filed |
| 31.2 | | | | | | | | | | | | Filed |
| 32.1 | | | | | | | | | | | | Furnished |
| 32.2 | | | | | | | | | | | | Furnished |
| 101.INS | | XBRL Instance Document | | | | | | | | | | Filed |
| 101.SCH | | XBRL Taxonomy Extension Schema Document | | | | | | | | | | Filed |
| 101.CAL | | XBRL Taxonomy Extension Calculation Linkbase Document | | | | | | | | | | Filed |
| 101.DEF | | XBRL Taxonomy Extension Definition Linkbase Document | | | | | | | | | | Filed |
| 101.LAB | | XBRL Taxonomy Extension Label Linkbase Document | | | | | | | | | | Filed |
| 101.PRE | | XBRL Taxonomy Extension Presentation Linkbase Document | | | | | | | | | | Filed |
|
| | | | | | | | | | | | | |
| | | | | Incorporated by Reference | | |
| Number | | Exhibit Description | | Form | | File No. | | Exhibit | | Date | | Filed or Furnished Herewith |
| 3.1 | | | | 8-K | | 000-24429 | | 3.1 |
| | 6/7/2018 | | |
| 3.2 | | | | 8-K | | 000-24429 | | 3.3 |
| | 6/7/2018 | | |
| 10.1 | | | | | | | | | | | | Filed |
| 31.1 | | | | | | | | | | | | Filed |
| 31.2 | | | | | | | | | | | | Filed |
| 32.1 | | | | | | | | | | | | Furnished |
| 32.2 | | | | | | | | | | | | Furnished |
| 101.INS | | XBRL Instance Document | | | | | | | | | | Filed |
| 101.SCH | | XBRL Taxonomy Extension Schema Document | | | | | | | | | | Filed |
| 101.CAL | | XBRL Taxonomy Extension Calculation Linkbase Document | | | | | | | | | | Filed |
| 101.DEF | | XBRL Taxonomy Extension Definition Linkbase Document | | | | | | | | | | Filed |
| 101.LAB | | XBRL Taxonomy Extension Label Linkbase Document | | | | | | | | | | Filed |
| 101.PRE | | XBRL Taxonomy Extension Presentation Linkbase Document | | | | | | | | | | Filed |
SIGNATURES
Pursuant to the requirements of the Securities Exchange Act of 1934, the Registrant has duly caused this report to be signed on its behalf by the undersigned thereunto duly authorized.
|
| | | | | | |
| | | | Cognizant Technology Solutions Corporation |
| | | | | |
| Date: | May 7,August 2, 2018 | | | By: | | /s/ FRANCISCO D’SOUZA |
| | | | | | | Francisco D’Souza, |
| | | | | | | Chief Executive Officer |
| | | | | | | (Principal Executive Officer) |
|
| | | | | | |
| | | | | | | |
| Date: | May 7,August 2, 2018 | | | By: | | /s/ KAREN MCLOUGHLIN |
| | | | | | | Karen McLoughlin, |
| | | | | | | Chief Financial Officer |
| | | | | | | (Principal Financial Officer) |