UNITED STATES
SECURITIES AND EXCHANGE COMMISSION
Washington, D.C. 20549
(Mark one)
| | | | | |
| ☑ | QUARTERLY REPORT PURSUANT TO SECTION 13 OR 15(d) OF THE SECURITIES EXCHANGE ACT OF 1934 |
For the quarterly period ended SeptemberJune 30, 20202021
Or
| | | | | |
| ☐ | TRANSITION REPORT PURSUANT TO SECTION 13 OR 15(d) OF THE SECURITIES EXCHANGE ACT OF 1934 |
For the transition period from to
Commission file number 1-14037
____________________
Moody’s Corporation
(Exact name of registrant as specified in its charter)
| | | | | | | | | | | |
| Delaware | | 13-3998945 |
| (State of Incorporation) | | (I.R.S. Employer Identification No.) |
7 World Trade Center at 250 Greenwich Street, New York, New York 10007
(Address of Principal Executive Offices)
(Zip Code)
Registrant’s telephone number, including area code:
(212) 553-0300
Securities registered pursuant to Section 12(b) of the Act:
| | | | | | | | | | | | | | |
| Title of each class | | Trading Symbol(s) | | Name of each exchange on which registered |
| Common Stock, par value $0.01 per share | | MCO | | New York Stock Exchange |
| 1.75% Senior Notes Due 2027 | | MCO 27 | | New York Stock Exchange |
| 0.950% Senior Notes Due 2030 | | MCO 30 | | New York Stock Exchange |
Indicate by check mark whether the registrant (1) has filed all reports required to be filed by Sections 13 or 15(d) of the Securities Exchange Act of 1934 during the preceding 12 months (or for such shorter period that the registrant was required to file such reports), and (2) has been subject to such filing requirements for the past 90 days. Yes ☑ No ☐
Indicate by check mark whether the registrant has submitted electronically, every Interactive Data File required to be submitted pursuant to Rule 405 of Regulation S-T during the preceding 12 months, or for such shorter period that the registrant was required to submit such files. Yes ☑ No ☐
Indicate by check mark whether the registrant is a large accelerated filer, an accelerated filer, a non-accelerated filer, smaller reporting company, or an emerging growth company. See the definitions of “large accelerated filer,” “accelerated filer,” “smaller reporting company,” and “emerging growth company” in Rule 12b-2 of the Exchange Act. (Check one):
| | | | | | | | | | | | | | |
| Large Accelerated Filer | ☑ | | Accelerated filer | ☐ |
| Non-accelerated filer | ☐ | | Smaller reporting company | ☐ |
| Emerging growth company | ☐ | | | |
If an emerging growth company, indicate by check mark if the registrant has elected not to use the extended transition period for complying with any new or revised financial accounting standards provided pursuant to Section 13(a) of the Exchange Act. ☐
Indicate by check mark whether the registrant is a shell company (as defined in Rule 12b-2 of the Exchange Act). Yes ☐ No ☑
Indicate the number of shares outstanding of each of the issuer’s classes of common stock, as of the latest practicable date:
| | |
Shares Outstanding at SeptemberJune 30, 20202021 |
187.8186.2 million |
| | | | | | | | |
| MOODY’S CORPORATION
INDEX TO FORM 10-Q
| |
| Page(s) |
| |
| | |
| | |
| | |
| | |
| | |
| | |
| | |
| | |
| | |
| | |
| | |
| | |
| | |
| | |
| | |
| | |
| | |
| | |
| | |
| | |
| | |
| | |
| |
|
| | |
| | |
| | |
| | |
| | |
| | |
| |
| Exhibits Filed Herewith | |
| | |
31.1 | Chief Executive Officer Certification Pursuant to Section 302 of the Sarbanes-Oxley Act of 2002 | |
31.2 | Chief Financial Officer Certification Pursuant to Section 302 of the Sarbanes-Oxley Act of 2002 | |
32.1 | Chief Executive Officer Certification Pursuant to Section 906 of the Sarbanes-Oxley Act of 2002 | |
32.2 | Chief Financial Officer Certification Pursuant to Section 906 of the Sarbanes-Oxley Act of 2002 | |
101.INS | Inline XBRL Instance Document (the instance document does not appear in the Interactive Data File because its XBRL tags are embedded within the Inline XBRL document) | |
101.SCH | Inline XBRL Taxonomy Extension Schema Document | |
101.CAL | Inline XBRL Taxonomy Extension Calculation Linkbase Document | |
101.DEF | Inline XBRL Definitions Linkbase Document | |
101.LAB | Inline XBRL Taxonomy Extension Labels Linkbase Document | |
101.PRE | Inline XBRL Taxonomy Extension Presentation Linkbase Document | |
104 | Cover Page Interactive Data File (formatted as inline XBRL and contained in Exhibit 101) | |
GLOSSARY OF TERMS AND ABBREVIATIONS
The following terms, abbreviations and acronyms are used to identify frequently used terms in this report:
| | | | | |
| TERM | DEFINITION |
ABS Suite | Business acquired by the Company in October 2019 which includes a software platform used by issuers and trustees for administration of asset-backed and mortgage-backed securities programs |
Acquisition-Related Amortization | Amortization of definite-lived intangible assets acquired by the Company from all business combination transactions |
| Acquire Media (AM) | Business acquired by the Company in October 2020; an aggregator and distributor of curated adverse real-time news, multimedia, data, and alerts.alerts |
Acquisition-Related ExpensesIntangible Amortization Expense | ConsistsAmortization of expenses incurred to complete and integratedefinite-lived intangible assets acquired by the acquisition of Bureau van Dijk for which the integration will be a multi-year effortCompany from all business combination transactions |
| |
| Adjusted Diluted EPS | Diluted EPS excluding the impact of certain items as detailed in the section entitled “Non-GAAP Financial Measures” |
| Adjusted Net Income | Net Income excluding the impact of certain items as detailed in the section entitled “Non-GAAP Financial Measures” |
| Adjusted Operating Income | Operating income excluding the impact of certain items as detailed in the section entitled “Non-GAAP Financial Measures” |
| Adjusted Operating Margin | Adjusted Operating Income divided by revenue |
| Americas | Represents countries within North and South America, excluding the U.S. |
AOCLAOCI(L) | Accumulated other comprehensive income/loss; a separate component of shareholders’ equity |
| ASC | The FASB Accounting Standards Codification; the sole source of authoritative GAAP as of July 1, 2009 except for rules and interpretive releases of the SEC, which are also sources of authoritative GAAP for SEC registrants |
| Asia-Pacific | Represents Australia and countries in Asia including but not limited to: China, India, Indonesia, Japan, Korea, Malaysia, Singapore, Sri Lanka and Thailand |
ASR | Accelerated Share Repurchase |
| ASU | The FASB Accounting Standards Update to the ASC. It also provides background information for accounting guidance and the bases for conclusions on the changes in the ASC. ASUs are not considered authoritative until codified into the ASC |
| Board | The board of directors of the Company |
| BPS | Basis points |
| Bureau van Dijk | Bureau van Dijk Electronic Publishing, B.V., a global provider of business intelligence and company information; acquired by the Company on August 10, 2017 via the acquisition of Yellow Maple I B.V., an indirect parent of Bureau van Dijk |
| Catylist | A provider of commercial real estate (CRE) solutions for brokers; acquired by the Company on December 30, 2020 |
| CFG | Corporate finance group; an LOB of MIS |
| CLO | Collateralized loan obligation |
| CMBS | Commercial mortgage-backed securities; an asset class within SFG |
| COLI | Corporate-Owned Life Insurance |
| Common Stock | The Company’s common stock |
| Company | Moody’s Corporation and its subsidiaries; MCO; Moody’s |
Content | |
| Cortera | A reporting unit within the MA segment that offers subscription-based research,provider of North American credit data and analytical products, including credit ratings produced by MIS, credit research, quantitative credit scores and other analytical tools, economic research and forecasts, business intelligence and company information products, and commercial real estate data and analytical toolsworkflow solutions; the Company acquired Cortera in March 2021 |
| COVID-19 | An outbreak of a novel strain of coronavirus resulting in an international public health crisis and a global pandemic |
| CP | Commercial Paper |
| | | | | |
TERM | DEFINITION |
| CP Program | A program entered into on August 3, 2016 allowing the Company to privately place CP up to a maximum of $1 billion for which the maturity may not exceed 397 days from the date of issue and which is backstopped by the 2018 Facility |
| CRAs | Credit rating agencies |
DBPPDBPPs | Defined benefit pension plans |
| Dodd-Frank Act | Dodd-Frank Wall Street Reform and Consumer Protection Act |
| EMEA | Represents countries within Europe, the Middle East and Africa |
| EPS | Earnings per share |
| | | | | |
| TERM | DEFINITION |
| ERS | The Enterprise Risk Solutions LOB within MA, which offers risk management software solutions as well as related risk management advisory engagements services |
| ESG | Environmental, Social, and Governance |
| ESMA | European Securities and Markets Authority |
| ETR | Effective tax rate |
| EU | European Union |
| EUR | Euros |
| EURIBOR | The Euro Interbank Offered Rate |
| Excess Tax Benefits | The difference between the tax benefit realized at exercise of an option or delivery of a restricted share and the tax benefit recorded at the time the option or restricted share is expensed under GAAP |
| Exchange Act | The Securities Exchange Act of 1934, as amended |
| External Revenue | Revenue excluding any intersegment amounts |
| FASB | Financial Accounting Standards Board |
| FIG | Financial institutions group; an LOB of MIS |
Four Twenty Seven | A provider of data, intelligence, and analysis related to physical climate risks; acquired by the Company in July 2019 |
| Free Cash Flow | Net cash provided by operating activities less cash paid for capital additions |
| |
| FX | Foreign exchange |
| GAAP | U.S. Generally Accepted Accounting Principles |
| GBP | British pounds |
| ICRA | ICRA Limited; a provider of credit ratings and research in India. ICRA is a public company with its shares listed on the Bombay Stock Exchange and the National Stock Exchange of India. The Company previously held 28.5% equity ownership and in June 2014, increased that ownership stake to over 50% through the acquisition of additional shares |
IRS | Internal Revenue Service |
IT | Information technology |
| |
| |
| KIS Pricing | Korea Investors Service Pricing, Inc; a Korean provider of fixed income securities pricing and consolidated subsidiary of the Company |
| KIS Research | Korea Investors Service Research; a Korean provider of financial research and consolidated subsidiary of the Company |
| Korea | Republic of South Korea |
| LIBOR | London Interbank Offered Rate |
| LOB | Line of business |
| MA | Moody’s Analytics - a reportable segment of MCO which provides a wide range of products and services that support financial analysis and risk management activities of institutional participants in global financial markets; consists of two LOBs - RD&A and ERS |
Make Whole Amount | The prepayment penalty amount relating to the 2017 Senior Notes due 2021 and 2018 Senior Notes due 2021 which is a premium based on the excess, if any, of the discounted value of the remaining scheduled payments over the prepaid principal |
| | | | | |
TERM | DEFINITION |
| MAKS | Moody’s Analytics Knowledge Services; formerly known as Copal Amba; provided offshore research and analytic services to the global financial and corporate sectors; business was divested in the fourth quarter of 2019 and was formerly part of the PS LOB and a reporting unit within the MA reportable segment |
MALS | Moody’s Analytics Learning Solutions; a reporting unit within the MA segment that includes on-line and classroom-based training services as well as credentialing and certification services |
| MCO | Moody’s Corporation and its subsidiaries; the Company; Moody’s |
| MD&A | Management’s Discussion and Analysis of Financial Condition and Results of Operations |
| MIS | Moody’s Investors Service - a reportable segment of MCO; consists of five LOBs - SFG, CFG, FIG, PPIF and MIS Other |
| MIS Other | Consists of non-ratings revenue from ICRA, KIS Pricing, KIS Research and revenue from providing ESG research, data and assessments. These businesses are components of MIS; MIS Other is an LOB of MIS |
| Moody’s | Moody’s Corporation and its subsidiaries; MCO; the Company |
| MSS | Moody's Shared Services; primarily consists of information technology and support staff such as finance, human resources and legal that support both MIS and MA. |
| |
| |
| Net Income | Net income attributable to Moody’s Corporation, which excludes net income from consolidated noncontrolling interests belonging to the minority interest holder |
| | | | | |
| TERM | DEFINITION |
| New Credit Losses Accounting Standard | Updates to the ASC pursuant to ASU No. 2016-13, “Financial Instruments—Credit Losses (Topic 326): Measurement of Credit Losses on Financial Instruments”. This new accounting guidance requires the use of an “expected credit loss” impairment model for most financial assets reported at amortized cost, which will require entities to estimate expected credit losses over the lifetime of the instrument. |
New Internal Use Software Accounting Standard | Updates to the ASC pursuant to ASU No. 2018-15, “Intangibles—Goodwill and Other—Internal-Use Software (Subtopic 350-40): Customer’s Accounting for Implementation Costs Incurred in a Cloud Computing Arrangement that is a Service Contract”. This new accounting guidance requires implementation costs incurred by customers in cloud computing arrangements (i.e., hosting arrangements) to be capitalized under the same premises of authoritative guidance for internal-use software. |
| |
| NM | Percentage change is not meaningful |
| Non-GAAP | A financial measure not in accordance with GAAP; these measures, when read in conjunction with the Company’s reported results, can provide useful supplemental information for investors analyzing period-to-period comparisons of the Company’s performance, facilitate comparisons to competitors’ operating results and to provide greater transparency to investors of supplemental information used by management in its financial and operational decision making |
| NRSRO | Nationally Recognized Statistical Rating Organization, which is a credit rating agency registered with the SEC. |
| OCI | Other comprehensive income (loss); includes gains and losses on cash flow and net investment hedges, unrealized gains and losses on available for sale securities (in periods prior to January 1, 2018), certain gains and losses relating to pension and other retirement benefit obligations and foreign currency translation adjustments |
| |
| Operating segment | Term defined in the ASC relating to segment reporting; the ASC defines an operating segment as a component of a business entity that has each of the three following characteristics: i) the component engages in business activities from which it may recognize revenue and incur expenses; ii) the operating results of the component are regularly reviewed by the entity’s chief operating decision maker; and iii) discrete financial information about the component is available |
| Other Retirement Plan | The U.S. retirement healthcare and U.S. retirement life insurance plans |
| |
| PPIF | Public, project and infrastructure finance; an LOB of MIS |
| Profit Participation Plan | Defined contribution profit participation plan that covers substantially all U.S. employees of the Company |
| | | | | |
TERM | DEFINITION |
PS | Professional Services, a former LOB within MA which consisted of MAKS and MALS that provided offshore analytical and research services as well as learning solutions and certification programs. Subsequent to the divestiture of MAKS in 2019, revenue from the MALS reporting unit, which previous to 2020 was reported in the PS LOB, is now reported as part of the RD&A LOB. Prior periods have not been reclassified as the amounts were not material. |
RBA International (RBA) | A provider of online retail bank training and certifications; the Company acquired RBA in March 2020 |
| RD&A | An LOB within MA that offers subscription-based research, data and analytical products, includingincluding: credit ratings produced by MIS,MIS; credit research,research; quantitative credit scores and other analytical tools,tools; economic research and forecasts,forecasts; business intelligence and company information products, andproducts; commercial real estate data and analytical toolstools; learning solutions |
Redeemable Noncontrolling Interest | Represents minority shareholders' interest in entities which are controlled but not wholly-owned by Moody's and for which Moody's obligation to redeem the minority shareholders' interest is represented by a put/call relationship |
Reform Act | Credit Rating Agency Reform Act of 2006 |
Regulatory DataCorp Inc. (RDC) | A global leader in risk and compliance intelligence; the Company acquired RDC in February 2020 |
Reis, Inc. (Reis) | A provider of U.S. commercial real estate data; acquired by the Company in October 2018 |
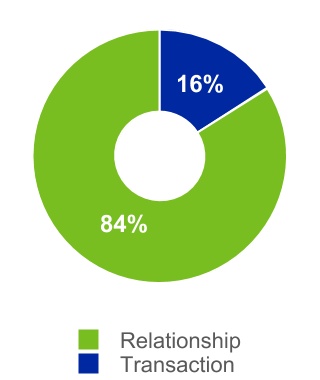
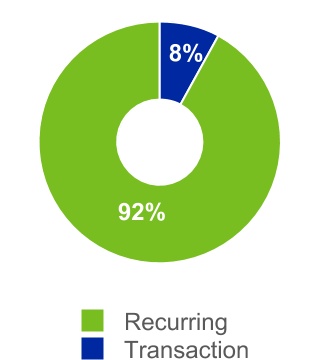
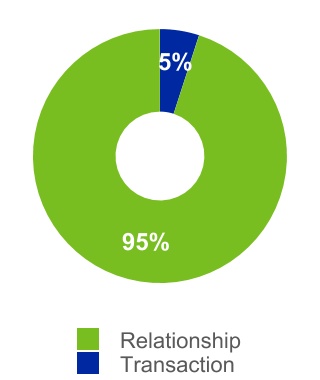
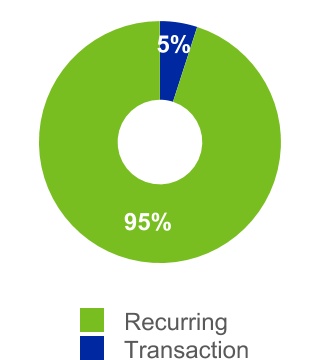
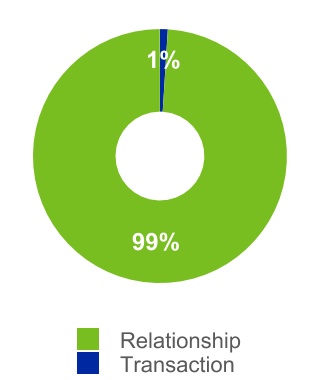
RelationshipRecurring Revenue | For MIS, represents recurring monitoring fees of a rated debt obligation and/or entities that issue such obligations, as well as revenue from programs such as commercial paper, medium-term notes and shelf registrations. For MIS Other, represents subscription-based revenue. For MA, represents subscription-based revenue and software maintenance revenue |
| Reform Act | Credit Rating Agency Reform Act of 2006 |
| Regulatory DataCorp Inc. (RDC) | A global leader in risk and compliance intelligence; the Company acquired RDC in February 2020 |
| |
| |
| Reporting unit | The level at which Moody’s evaluates its goodwill for impairment under U.S. GAAP; defined as an operating segment or one level below an operating segment |
| Retirement Plans | Moody’s funded and unfunded pension plans, the healthcare plans and life insurance plans |
| Revenue Accounting Standard | Updates to the ASC pursuant to ASU No. 2014-09, “Revenue from Contracts with Customers (ASC Topic 606)”. This new accounting guidance significantly changes the accounting framework under U.S. GAAP relating to revenue recognition and to the accounting for the deferral of incremental costs of obtaining or fulfilling a contract with a customer |
RiskFirst | A company providing risk analytic solutions for the asset management and pension fund communities; acquired by the Company in July 2019 |
| RMBS | Residential mortgage-backed securities; an asset class within SFG |
ROU Asset | Assets recorded pursuant to the New Lease Accounting Standard which represent the Company’s right to use an underlying asset for the term of a lease |
| SEC | U.S. Securities and Exchange Commission |
| Securities Act | Securities Act of 1933, as amended |
| SFG | Structured finance group; an LOB of MIS |
| SG&A | Selling, general and administrative expenses |
| Tax Act | The “Tax Cuts and Jobs Act” enacted into U.S. law on December 22, 2017 which significantly amends the tax code in the U.S. |
| |
| | | | | |
| TERM | DEFINITION |
| Transaction Revenue | For MIS, represents the initial rating of a new debt issuance as well as other one-time fees. For MIS Other, represents revenue from professional services as well as data services, research and analytical engagements. For MA, represents perpetual software license fees and revenue from software implementation services, risk management advisory projects, training and certification services, and research and analytical engagements |
| U.K. | United Kingdom |
| U.S. | United States |
| USD | U.S. dollar |
| UTPs | Uncertain tax positions |
| | | | | |
TERMYTD | DEFINITIONYear-To-Date |
Vigeo EirisZM Financial Systems (ZMFS) | A provider of in ESG research, datarisk and assessments;financial management software for the U.S. banking sector; acquired by the Company on April 12, 2019in December 2020 |
2018 | |
| 2020 MA Strategic Reorganization Restructuring Program | Restructuring program approved by the chief executive officer of Moody’s on October 26, 2018. This program included relocation of certain functions from high-cost to lower-cost jurisdictions, a reduction of staff, including from acquisitions and pursuant to a review of the business criticality of certain positions, and the rationalization and exit of certain real estate leases due to consolidation of various business activities. |
2020 Restructuring Program | Restructuring program approved by the chief executive officer of Moody’s on July 29,December 22, 2020, primarilyrelating to a strategic reorganization in response to the COVID-19 pandemic which revolves around the rationalization and exit of certain real estate leases.MA reportable segment |
| |
| 2012 Senior Notes due 2022 | Principal amount of $500 million, 4.50% senior unsecured notes due in September 2022 |
| 2013 Senior Notes due 2024 | Principal amount of the $500 million, 4.875% senior unsecured notes due in February 2024 |
2014 Senior Notes (30-Year)due 2044 | Principal amount of $600 million, 5.25% senior unsecured notes due in July 2044 |
| 2015 Senior Notes due 2027 | Principal amount of €500 million, 1.75% senior unsecured notes due in March 2027 |
2017 Senior Notes Duedue 2023 | Principal amount of $500 million, 2.625% senior unsecured notes due January 15, 2023 |
2017 Senior Notes Duedue 2028 | Principal amount of $500 million, 3.250% senior unsecured notes due January 15, 2028 |
2017 Senior Notes Due 2021 | Principal amount of $500 million, 2.75% senior unsecured notes originally due in December 2021, but early repaid by the Company in 2020. |
| 2018 Facility | Five-year unsecured revolving credit facility, with capacity to borrow up to $1 billion; backstops CP issued under the CP Program |
2018 Senior Notes | Principal amount of $300 million, 3.25% senior unsecured notes originally due in June 2021, but early repaid by the Company in 2020. |
2018 Senior Notes (10-year)due 2029 | Principal amount of $400 million, 4.25% senior unsecured notes due February 1, 2029 |
2018 Senior Notes (30-year)due 2048 | Principal amount of $400 million, 4.875% senior unsecured notes due December 17, 2048 |
| 2019 Senior Notes due 2030 | Principal amount of €750 million, 0.950% senior unsecured notes due February 25, 2030 |
2020 Senior Notes Duedue 2025 | Principal amount of $700 million, 3.75% senior unsecured notes due March 24, 2025 |
2020 Senior Notes Duedue 2050 | Principal amount of $300 million, 3.25% senior unsecured notes due May 20, 2050 |
2020 Senior Notes Duedue 2060 | Principal amount of $500 million, 2.55% senior unsecured notes due August 18, 2060 |
PART I. FINANCIAL INFORMATION
Item 1. Financial Statements
MOODY’S CORPORATION
CONSOLIDATED STATEMENTS OF OPERATIONS (UNAUDITED)
(Amounts in millions, except per share data)
| | | Three Months Ended
September 30, | | Nine Months Ended
September 30, | | Three Months Ended
June 30, | | Six Months Ended
June 30, |
| | 2020 | | 2019 | | 2020 | | 2019 | | 2021 | | 2020 | | 2021 | | 2020 |
| Revenue | Revenue | $ | 1,356 | | | $ | 1,240 | | | $ | 4,081 | | | $ | 3,596 | | Revenue | $ | 1,553 | | | $ | 1,435 | | | $ | 3,153 | | | $ | 2,725 | |
| Expenses | Expenses | | | | | | | | Expenses | | | | | | | |
| Operating | Operating | 364 | | | 350 | | | 1,066 | | | 1,032 | | Operating | 365 | | | 362 | | | 758 | | | 702 | |
| Selling, general and administrative | Selling, general and administrative | 271 | | | 292 | | | 879 | | | 848 | | Selling, general and administrative | 327 | | | 307 | | | 620 | | | 608 | |
| Depreciation and amortization | | Depreciation and amortization | 60 | | | 58 | | | 119 | | | 107 | |
| Restructuring | Restructuring | 23 | | | (1) | | | 20 | | | 58 | | Restructuring | 0 | | | (2) | | | 2 | | | (3) | |
| Depreciation and amortization | 56 | | | 48 | | | 163 | | | 150 | | |
| Acquisition-Related Expenses | 0 | | | 0 | | | 0 | | | 3 | | |
| | Loss pursuant to the divestiture of MAKS | Loss pursuant to the divestiture of MAKS | 0 | | | 2 | | | 9 | | | 11 | | Loss pursuant to the divestiture of MAKS | 0 | | | 0 | | | 0 | | | 9 | |
| Total expenses | Total expenses | 714 | | | 691 | | | 2,137 | | | 2,102 | | Total expenses | 752 | | | 725 | | | 1,499 | | | 1,423 | |
| Operating income | Operating income | 642 | | | 549 | | | 1,944 | | | 1,494 | | Operating income | 801 | | | 710 | | | 1,654 | | | 1,302 | |
| Non-operating (expense) income, net | Non-operating (expense) income, net | | | | | | | | Non-operating (expense) income, net | | | | | | | |
| Interest expense, net | Interest expense, net | (53) | |
| (46) | |
| (153) | |
| (149) | | Interest expense, net | (49) | | | (60) | | | (56) | | | (100) | |
| Other non-operating income, net | Other non-operating income, net | 10 | |
| 10 | |
| 38 | |
| 12 | | Other non-operating income, net | 6 | | | 16 | | | 22 | | | 28 | |
| Total non-operating expense, net | (43) | | | (36) | | | (115) | | | (137) | | |
| Income before provisions for income taxes | 599 | | | 513 | | | 1,829 | | | 1,357 | | |
| Total non-operating (expense) income, net | | Total non-operating (expense) income, net | (43) | | | (44) | | | (34) | | | (72) | |
| Income before provision for income taxes | | Income before provision for income taxes | 758 | | | 666 | | | 1,620 | | | 1,230 | |
| Provision for income taxes | Provision for income taxes | 132 | | | 130 | | | 366 | | | 290 | | Provision for income taxes | 181 | | | 157 | | | 307 | | | 234 | |
| Net income | Net income | 467 | | | 383 | | | 1,463 | | | 1,067 | | Net income | 577 | | | 509 | | | 1,313 | | | 996 | |
| Less: Net (loss) income attributable to noncontrolling interests | 0 | | | 3 | | | (1) | | | 5 | | |
| Less: Net income (loss) attributable to noncontrolling interests | | Less: Net income (loss) attributable to noncontrolling interests | 0 | | | 0 | | | 0 | | | (1) | |
| Net income attributable to Moody's | Net income attributable to Moody's | $ | 467 | | | $ | 380 | | | $ | 1,464 | | | $ | 1,062 | | Net income attributable to Moody's | $ | 577 | | | $ | 509 | | | $ | 1,313 | | | $ | 997 | |
| Earnings per share attributable to Moody's common shareholders | Earnings per share attributable to Moody's common shareholders | | | | | | | | Earnings per share attributable to Moody's common shareholders | | | | | | | |
| Basic | Basic | $ | 2.49 | |
| $ | 2.01 | |
| $ | 7.80 | |
| $ | 5.60 | | Basic | $ | 3.09 | | | $ | 2.71 | | | $ | 7.02 | | | $ | 5.31 | |
| Diluted | Diluted | $ | 2.47 | |
| $ | 1.99 | |
| $ | 7.73 | |
| $ | 5.54 | | Diluted | $ | 3.07 | | | $ | 2.69 | | | $ | 6.98 | | | $ | 5.27 | |
| Weighted average number of shares outstanding | Weighted average number of shares outstanding | | | | | | | | Weighted average number of shares outstanding | | | | | | | |
| Basic | Basic | 187.8 | |
| 189.0 | |
| 187.6 | |
| 189.6 | | Basic | 186.7 | | | 187.7 | |
| 187.0 | | | 187.6 | |
| Diluted | Diluted | 189.3 | |
| 191.1 | |
| 189.3 | |
| 191.8 | | Diluted | 187.9 | | | 189.0 | |
| 188.2 | | | 189.3 | |
The accompanying notes are an integral part of the condensed consolidated financial statements.
MOODY’S CORPORATION
CONSOLIDATED STATEMENTS OF COMPREHENSIVE INCOME (UNAUDITED)
(Amounts in millions)
| | | | | | | | | | | | | | | | | | | | | | | | | | | | | | | | | | | |
| Three Months Ended
June 30, 2021 | | Three Months Ended
June 30, 2020 |
| |
| Pre-tax
amounts | | Tax
amounts | | After-tax
amounts | | Pre-tax
amounts | | Tax
amounts | | After-tax
amounts |
| Net Income | | | | | $ | 577 | | | | | | | $ | 509 | |
| Other Comprehensive Income (Loss): | | | | | | | | | | | |
| Foreign Currency Adjustments: | | | | | | | | | | | |
| Foreign currency translation adjustments, net | $ | 37 | | | $ | (2) | | | 35 | | | $ | 78 | | | $ | 1 | | | 79 | |
| Net losses on net investment hedges | (41) | | | 12 | | | (29) | | | (97) | | | 24 | | | (73) | |
| Net investment hedges - reclassification of gains included in net income | (1) | | | 1 | | | 0 | | | 0 | | | 0 | | | 0 | |
| | | | | | | | | | | |
| Cash Flow Hedges: | | | | | | | | | | | |
| Net losses on cash flow hedges | 0 | | | 0 | | | 0 | | | (20) | | | 6 | | | (14) | |
| | | | | | | | | | | |
| Pension and Other Retirement Benefits: | | | | | | | | | | | |
| Amortization of actuarial losses/prior service costs and settlement charge included in net income | 10 | | | (2) | | | 8 | | | 1 | | | 0 | | | 1 | |
| Net actuarial gains (losses) and prior service costs | 0 | | | 0 | | | 0 | | | 9 | | | (2) | | | 7 | |
| Total other comprehensive income (loss) | $ | 5 | | | $ | 9 | | | 14 | | | $ | (29) | | | $ | 29 | | | 0 | |
| Comprehensive income | | | | | 591 | | | | | | | 509 | |
| Less: comprehensive (loss) income attributable to noncontrolling interests | | | | | (1) | | | | | | | (11) | |
| Comprehensive Income Attributable to Moody's | | | | | $ | 592 | | | | | | | $ | 520 | |
| | | | | | | | | | | | | | | | | | | | | | | | | | | | | | | | | | | |
| Three Months Ended
September 30, 2020 | | Three Months Ended
September 30, 2019 |
| Pre-tax amounts | | Tax amounts | | After-tax amounts | | Pre-tax amounts | | Tax amounts | | After-tax amounts |
| Net Income | | | | | $ | 467 | | | | | | | $ | 383 | |
| Other Comprehensive Income (loss): | | | | | | | | | | | |
| Foreign Currency Adjustments: | | | | | | | | | | | |
| Foreign currency translation adjustments, net | $ | 204 | | | $ | (17) | | | 187 | | | $ | (194) | | | $ | 0 | | | (194) | |
| Net (losses) gains on net investment hedges | (191) | | | 48 | | | (143) | | | 136 | | | (34) | | | 102 | |
| Net investment hedges - reclassification of gains included in net income | 0 | | | 0 | | | 0 | | | (1) | | | 0 | | | (1) | |
| | | | | | | | | | | |
| | | | | | | | | | | |
| | | | | | | | | | | |
| Pension and Other Retirement Benefits: | | | | | | | | | | | |
| Amortization of actuarial losses and prior service costs included in net income | 2 | | | 0 | | | 2 | | | 1 | | | 0 | | | 1 | |
| Net actuarial (losses) gains and prior service costs | (9) | | | 2 | | | (7) | | | 0 | | | 0 | | | 0 | |
| Total other comprehensive income (loss) | $ | 6 | | | $ | 33 | | | $ | 39 | | | $ | (58) | | | $ | (34) | | | $ | (92) | |
| Comprehensive income | | | | | 506 | | | | | | | 291 | |
| Less: comprehensive income attributable to noncontrolling interests | | | | | 1 | | | | | | | 3 | |
| Comprehensive Income Attributable to Moody's | | | | | $ | 505 | | | | | | | $ | 288 | |
| | | | | | | | | | | |
| | | Nine Months Ended
September 30, 2020 | | Nine Months Ended
September 30, 2019 | | Six Months Ended
June 30, 2021 | | Six Months Ended
June 30, 2020 |
| | | Pre-tax amounts | | Tax amounts | | After-tax amounts | | Pre-tax amounts | | Tax amounts | | After-tax amounts | | Pre-tax
amounts | | Tax
amounts | | After-tax
amounts | | Pre-tax
amounts | | Tax
amounts | | After-tax
amounts |
| Net Income | Net Income | | | | | $ | 1,463 | | | | | | | $ | 1,067 | | Net Income | | | | | $ | 1,313 | | | | | | | $ | 996 | |
| Other Comprehensive Income (loss): | | | | | |
| Other Comprehensive Income (Loss): | | Other Comprehensive Income (Loss): | | | | |
| Foreign Currency Adjustments: | Foreign Currency Adjustments: | | | Foreign Currency Adjustments: | | |
| Foreign currency translation adjustments, net | Foreign currency translation adjustments, net | $ | 107 | | | $ | (11) | | | 96 | | | $ | (179) | | | $ | 0 | | | (179) | | Foreign currency translation adjustments, net | $ | (110) | | | $ | 4 | | | (106) | | | $ | (97) | | | $ | 6 | | | (91) | |
| Net (losses) gains on net investment hedges | (169) | | | 42 | | | (127) | | | 130 | | | (33) | | | 97 | | |
| Net gains on net investment hedges | | Net gains on net investment hedges | 134 | | | (30) | | | 104 | | | 22 | | | (6) | | | 16 | |
| Net investment hedges - reclassification of gains included in net income | | Net investment hedges - reclassification of gains included in net income | (2) | | | 1 | | | (1) | | | 0 | | | 0 | | | 0 | |
| | Net investment hedges - reclassification of gains included in net income | 0 | | | 0 | | | 0 | | | (1) | | | 0 | | | (1) | | |
| Cash Flow Hedges: | Cash Flow Hedges: | | Cash Flow Hedges: | |
| Net losses on cash flow hedges | Net losses on cash flow hedges | (68) | | | 18 | | | (50) | | | 0 | | | 0 | | | 0 | | Net losses on cash flow hedges | 0 | | | 0 | | | 0 | | | (68) | | | 18 | | | (50) | |
| Reclassification of losses included in net income | Reclassification of losses included in net income | 1 | | | 0 | | | 1 | | | 0 | | | 0 | | | 0 | | Reclassification of losses included in net income | 1 | | | 0 | | | 1 | | | 1 | | | 0 | | | 1 | |
| Pension and Other Retirement Benefits: | Pension and Other Retirement Benefits: | | Pension and Other Retirement Benefits: | |
| Amortization of actuarial losses and prior service costs included in net income | 5 | | | (1) | | | 4 | | | 3 | | | (1) | | | 2 | | |
| Amortization of actuarial losses/prior service costs and settlement charge included in net income | | Amortization of actuarial losses/prior service costs and settlement charge included in net income | 13 | | | (3) | | | 10 | | | 3 | | | (1) | | | 2 | |
| Net actuarial gains (losses) and prior service costs | Net actuarial gains (losses) and prior service costs | (1) | | | 0 | | | (1) | | | (2) | | | 1 | | | (1) | | Net actuarial gains (losses) and prior service costs | 0 | | | 0 | | | 0 | | | 8 | | | (2) | | | 6 | |
| Total other comprehensive (loss) income | $ | (125) | | | $ | 48 | | | (77) | | | $ | (49) | | | $ | (33) | | | (82) | | |
| Total other comprehensive income (loss) | | Total other comprehensive income (loss) | $ | 36 | | | $ | (28) | | | 8 | | | $ | (131) | | | $ | 15 | | | (116) | |
| Comprehensive income | Comprehensive income | | | | | 1,386 | | | | | | | 985 | | Comprehensive income | | | | | 1,321 | | | | | | | 880 | |
| Less: comprehensive (loss) income attributable to noncontrolling interests | | (12) | | | 15 | | |
| Less: comprehensive income (loss) attributable to noncontrolling interests | | Less: comprehensive income (loss) attributable to noncontrolling interests | | 1 | | | (13) | |
| Comprehensive Income Attributable to Moody's | Comprehensive Income Attributable to Moody's | | $ | 1,398 | | | $ | 970 | | Comprehensive Income Attributable to Moody's | | $ | 1,320 | | | $ | 893 | |
The accompanying notes are an integral part of the condensed consolidated financial statements.
MOODY’S CORPORATION
CONSOLIDATED BALANCE SHEETS (UNAUDITED)
(Amounts in millions, except per share data)
| | | | | | | | | | | |
| September 30, 2020 | | December 31, 2019 |
| ASSETS | | | |
| Current assets: | | | |
| Cash and cash equivalents | $ | 2,492 | | | $ | 1,832 | |
| Short-term investments | 96 | | | 98 | |
| Accounts receivable, net of allowance for credit losses of $41 in 2020 and $20 in 2019 | 1,360 | | | 1,419 | |
| Other current assets | 333 | | | 330 | |
| | | |
| Total current assets | 4,281 | | | 3,679 | |
| Property and equipment, net of accumulated depreciation of $907 in 2020 and $839 in 2019 | 282 | | | 292 | |
| Operating lease right-of-use assets | 410 | | | 456 | |
| Goodwill | 4,282 | | | 3,722 | |
| Intangible assets, net | 1,717 | | | 1,498 | |
| Deferred tax assets, net | 232 | | | 229 | |
| Other assets | 468 | | | 389 | |
| Total assets | $ | 11,672 | | | $ | 10,265 | |
| LIABILITIES, REDEEMABLE NONCONTROLLING INTERESTS AND SHAREHOLDERS' EQUITY |
| Current liabilities: | | | |
| Accounts payable and accrued liabilities | $ | 712 | | | $ | 773 | |
| Current portion of operating lease liabilities | 91 | | | 89 | |
| | | |
| | | |
| Deferred revenue | 918 | | | 1,050 | |
| | | |
| Total current liabilities | 1,721 | | | 1,912 | |
| Non-current portion of deferred revenue | 102 | | | 112 | |
| Long-term debt | 6,363 | | | 5,581 | |
| Deferred tax liabilities, net | 385 | | | 357 | |
| Uncertain tax positions | 471 | | | 477 | |
| Operating lease liabilities | 439 | | | 485 | |
| Other liabilities | 498 | | | 504 | |
| Total liabilities | 9,979 | | | 9,428 | |
| Contingencies (Note 19) | | | |
| Redeemable noncontrolling interest | 5 | | | 6 | |
| Shareholders' equity: |
| Preferred stock, par value $0.01 per share; 10,000,000 shares authorized; 0 shares issued and outstanding | 0 | | | 0 | |
| Series Common Stock, par value $0.01 per share; 10,000,000 shares authorized; 0 shares issued and outstanding | 0 | | | 0 | |
| Common stock, par value $0.01 per share; 1,000,000,000 shares authorized; 342,902,272 shares issued at September 30, 2020 and December 31, 2019, respectively. | 3 | | | 3 | |
| Capital surplus | 699 | | | 642 | |
| Retained earnings | 10,804 | | | 9,656 | |
| Treasury stock, at cost; 155,064,080 and 155,215,143 shares of common stock at September 30, 2020 and December 31, 2019 | (9,505) | | | (9,250) | |
| Accumulated other comprehensive loss | (504) | | | (439) | |
| Total Moody's shareholders' equity | 1,497 | | | 612 | |
| Noncontrolling interests | 191 | | | 219 | |
| Total shareholders' equity | 1,688 | | | 831 | |
| Total liabilities, noncontrolling interests and shareholders' equity | $ | 11,672 | | | $ | 10,265 | |
| | | | | | | | | | | |
| June 30, 2021 | | December 31, 2020 |
| ASSETS | | | |
| Current assets: | | | |
| Cash and cash equivalents | $ | 2,809 | | | $ | 2,597 | |
| Short-term investments | 88 | | | 99 | |
| Accounts receivable, net of allowance for credit losses of $32 in 2021 and $34 in 2020 | 1,458 | | | 1,430 | |
| Other current assets | 379 | | | 383 | |
| | | |
| Total current assets | 4,734 | | | 4,509 | |
| Property and equipment, net of accumulated depreciation of $969 in 2021 and $928 in 2020 | 282 | | | 278 | |
| Operating lease right-of-use assets | 357 | | | 393 | |
| Goodwill | 4,590 | | | 4,556 | |
| Intangible assets, net | 1,784 | | | 1,824 | |
| Deferred tax assets, net | 249 | | | 334 | |
| Other assets | 556 | | | 515 | |
| Total assets | $ | 12,552 | | | $ | 12,409 | |
| LIABILITIES AND SHAREHOLDERS' EQUITY |
| Current liabilities: | | | |
| Accounts payable and accrued liabilities | $ | 816 | | | $ | 1,039 | |
| Current portion of operating lease liabilities | 92 | | | 94 | |
| | | |
| | | |
| Deferred revenue | 1,142 | | | 1,089 | |
| | | |
| Total current liabilities | 2,050 | | | 2,222 | |
| Non-current portion of deferred revenue | 93 | | | 98 | |
| Long-term debt | 6,355 | | | 6,422 | |
| Deferred tax liabilities, net | 422 | | | 404 | |
| Uncertain tax positions | 406 | | | 483 | |
| Operating lease liabilities | 386 | | | 427 | |
| Other liabilities | 460 | | | 590 | |
| Total liabilities | 10,172 | | | 10,646 | |
| Contingencies (Note 18) | 0 | | 0 |
| Shareholders' equity: |
| Preferred stock, par value $0.01 per share; 10,000,000 shares authorized; 0 shares issued and outstanding | 0 | | | 0 | |
| Series common stock, par value $0.01 per share; 10,000,000 shares authorized; 0 shares issued and outstanding | 0 | | | 0 | |
| Common stock, par value $0.01 per share; 1,000,000,000 shares authorized; 342,902,272 shares issued at June 30, 2021 and December 31, 2020, respectively. | 3 | | | 3 | |
| Capital surplus | 784 | | | 735 | |
| Retained earnings | 12,094 | | | 11,011 | |
| Treasury stock, at cost; 156,723,618 and 155,808,563 shares of common stock at June 30, 2021 and December 31, 2020 | (10,270) | | | (9,748) | |
| Accumulated other comprehensive loss | (425) | | | (432) | |
| Total Moody's shareholders' equity | 2,186 | | | 1,569 | |
| Noncontrolling interests | 194 | | | 194 | |
| Total shareholders' equity | 2,380 | | | 1,763 | |
| Total liabilities, noncontrolling interests and shareholders' equity | $ | 12,552 | | | $ | 12,409 | |
The accompanying notes are an integral part of the condensed consolidated financial statements.
MOODY’S CORPORATION
CONSOLIDATED STATEMENTS OF CASH FLOWS (UNAUDITED)
(Amounts in millions)
| | | | | | | | | | | |
| Nine Months Ended September 30, |
| 2020 | | 2019 |
| Cash flows from operating activities | |
| Net income | $ | 1,463 | | | $ | 1,067 | |
| Reconciliation of net income to net cash provided by operating activities: | | | |
| Depreciation and amortization | 163 | | | 150 | |
| Stock-based compensation | 110 | | | 103 | |
| Deferred income taxes | (1) | | | (22) | |
| ROU Asset impairment & other non-cash restructuring/impairment charges | 23 | | | 38 | |
| Loss pursuant to the divestiture of MAKS | 9 | | | 11 | |
| Settlement of treasury rate lock | (68) | | | 0 | |
| Prepayment penalty relating to early redemption of debt | 24 | | | 0 | |
| Changes in assets and liabilities: | | | |
| Accounts receivable | 73 | | | 36 | |
| Other current assets | (8) | | | (8) | |
| | | |
| Other assets | (89) | | | (32) | |
| | | |
| | | |
| Accounts payable and accrued liabilities | (28) | | | (100) | |
| Deferred revenue | (171) | | | (96) | |
| Unrecognized tax benefits and other non-current tax liabilities | (9) | | | (17) | |
| Other liabilities | (3) | | | 66 | |
| Net cash provided by operating activities | 1,488 | | | 1,196 | |
| Cash flows from investing activities |
| Capital additions | (83) | | | (61) | |
| Purchases of investments | (130) | | | (111) | |
| Sales and maturities of investments | 57 | | | 139 | |
| | | |
| Cash paid for acquisitions, net of cash acquired | (699) | | | (121) | |
| Receipts from settlements of net investment hedges | 2 | | | 4 | |
| Net cash used in investing activities | (853) | | | (150) | |
| Cash flows from financing activities | | | |
| Issuance of notes | 1,491 | | | 0 | |
| Repayment of notes | (800) | | | (450) | |
| Issuance of commercial paper | 789 | | | 1,307 | |
| Repayment of commercial paper | (792) | | | (1,310) | |
| Proceeds from stock-based compensation plans | 41 | | | 37 | |
| Repurchase of shares related to stock-based compensation | (101) | | | (76) | |
| Treasury shares | (253) | | | (728) | |
| Dividends | (315) | | | (284) | |
| Debt issuance costs, extinguishment costs and related fees | (39) | | | 0 | |
| Dividends to noncontrolling interest | (1) | | | (1) | |
| Payment to acquire noncontrolling interests | (17) | | | (12) | |
| | | |
| Net cash provided by (used in) financing activities | 3 | | | (1,517) | |
| Reclassification of cash to assets held for sale | 0 | | | (11) | |
| Effect of exchange rate changes on cash and cash equivalents | 22 | | | (25) | |
| Increase (decrease) in cash and cash equivalents | 660 | | | (507) | |
| Cash and cash equivalents, beginning of period | 1,832 | | | 1,685 | |
| Cash and cash equivalents, end of period | $ | 2,492 | | | $ | 1,178 | |
| | | | | | | | | | | |
| Six Months Ended June 30, |
| 2021 | | 2020 |
| Cash flows from operating activities | |
| Net income | $ | 1,313 | | | $ | 996 | |
| Reconciliation of net income to net cash provided by operating activities: | | | |
| Depreciation and amortization | 119 | | | 107 | |
| Stock-based compensation | 86 | | | 72 | |
| Deferred income taxes | 59 | | | 46 | |
| | | |
| Loss pursuant to the divestiture of MAKS | 0 | | | 9 | |
| | | |
| | | |
| Settlement of treasury rate lock | 0 | | | (68) | |
| Changes in assets and liabilities: | | | |
| Accounts receivable | (29) | | | 11 | |
| Other current assets | 17 | | | (45) | |
| | | |
| Other assets | (23) | | | (39) | |
| | | |
| | | |
| Accounts payable and accrued liabilities | (182) | | | 31 | |
| Deferred revenue | 49 | | | (60) | |
| Unrecognized tax benefits and other non-current tax liabilities | (75) | | | (13) | |
| Other liabilities | (64) | | | (70) | |
| Net cash provided by operating activities | 1,270 | | | 977 | |
| Cash flows from investing activities |
| Capital additions | (44) | | | (62) | |
| Purchases of investments | (109) | | | (108) | |
| Sales and maturities of investments | 85 | | | 45 | |
| | | |
| Cash paid for acquisitions, net of cash acquired | (138) | | | (698) | |
| Receipts from settlements of net investment hedges | 2 | | | 0 | |
| Payments for settlements of net investment hedges | (47) | | | 0 | |
| Net cash used in investing activities | (251) | | | (823) | |
| Cash flows from financing activities | | | |
| Issuance of notes | 0 | | | 995 | |
| Repayment of notes | 0 | | | (300) | |
| Issuance of commercial paper | 0 | | | 789 | |
| Repayment of commercial paper | 0 | | | (792) | |
| Proceeds from stock-based compensation plans | 23 | | | 29 | |
| Repurchase of shares related to stock-based compensation | (79) | | | (100) | |
| Treasury shares | (503) | | | (253) | |
| Dividends | (232) | | | (210) | |
| Debt issuance costs, extinguishment costs and related fees | 0 | | | (17) | |
| Dividends to noncontrolling interest | (1) | | | (1) | |
| Payment to acquire noncontrolling interests | 0 | | | (17) | |
| | | |
| Net cash (used in) provided by financing activities | (792) | | | 123 | |
| | | |
| Effect of exchange rate changes on cash and cash equivalents | (15) | | | (10) | |
| Increase in cash and cash equivalents | 212 | | | 267 | |
| Cash and cash equivalents, beginning of period | 2,597 | | | 1,832 | |
| Cash and cash equivalents, end of period | $ | 2,809 | | | $ | 2,099 | |
The accompanying notes are an integral part of the condensed consolidated financial statements.
MOODY’S CORPORATION
CONSOLIDATED STATEMENTS OF SHAREHOLDERS’ EQUITY (UNAUDITED)
(Amounts in millions, except per share data)
| | | | | | | | | | | | | | | | | | | | | | | | | | | | | | | | | | | | | | | | | | | | | | | | | | | | | | | | | | | |
| Shareholders of Moody's Corporation | | | |
| Common Stock | | Capital Surplus | | Retained Earnings | | Treasury Stock | | Accumulated Other Comprehensive Loss | | Total Moody's Shareholders' Equity | | Non- Controlling Interests | | Total Shareholders' Equity |
| Shares | | Amount | | | Shares | | Amount | |
| Balance at June 30, 2019 | 342.9 | | | $ | 3 | | | $ | 575 | | | $ | 9,108 | | | (153.7) | | | $ | (8,887) | | | $ | (446) | | | $ | 353 | | | $ | 222 | | | $ | 575 | |
| Net income | | | | | | | 380 | | | | | | | | | 380 | | | 3 | | | 383 | |
| Dividends ($0.50 per share) | | | | | | | (97) | | | | | | | | | (97) | | | 0 | | | (97) | |
| Stock-based compensation | | | | | 33 | | | | | | | | | | | 33 | | | | | 33 | |
| Shares issued for stock-based compensation plans at average cost, net | | | | | 0 | | | | | 0.2 | | | 7 | | | | | 7 | | | | | 7 | |
| | | | | | | | | | | | | | | | | | | |
| Treasury shares repurchased | | | | | 0 | | | | | (0.7) | | | (113) | | | | | (113) | | | | | (113) | |
Currency translation adjustment, net of net investment hedge activity (net of tax of $34 million) | | | | | | | | | | | | | (92) | | | (92) | | | 0 | | | (92) | |
| | | | | | | | | | | | | | | | | | | |
| Amortization of prior service costs and actuarial losses | | | | | | | | | | | | | 1 | | | 1 | | | | | 1 | |
| Balance at September 30, 2019 | 342.9 | | | $ | 3 | | | $ | 608 | | | $ | 9,391 | | | (154.2) | | | $ | (8,993) | | | $ | (537) | | | $ | 472 | | | $ | 225 | | | $ | 697 | |
| | | | | | | | | | | | | | | | | | | |
| | | | | | | | | | | | | | | | | | | | | | | | | | | | | | | | | | | | | | | | | | | | | | | | | | | | | | | | | | | |
| Shareholders of Moody's Corporation | | | |
| Common Stock | | Capital Surplus | | Retained Earnings | | Treasury Stock | | Accumulated
Other
Comprehensive
Loss | | Total Moody's
Shareholders'
Equity | | Non- Controlling
Interests | | Total
Shareholders'
Equity |
| Shares | | Amount | | | Shares | | Amount | |
| Balance at March 31, 2020 | 342.9 | | | $ | 3 | | | $ | 616 | | | $ | 10,041 | | | (155.4) | | | $ | (9,524) | | | $ | (554) | | | $ | 582 | | | $ | 217 | | | $ | 799 | |
| Net income | | | | | | | 509 | | | | | | | | | 509 | | | 1 | | | 510 | |
| Dividends ($0.56 per share) | | | | | | | (108) | | | | | | | | | (108) | | | 0 | | | (108) | |
| | | | | | | | | | | | | | | | | | | |
| Stock-based compensation | | | | | 35 | | | | | | | | | | | 35 | | | | | 35 | |
| Shares issued for stock-based compensation plans at average cost, net | | | | | 2 | | | | | 0.2 | | | 11 | | | | | 13 | | | | | 13 | |
| Purchase of noncontrolling interest | | | | | (2) | | | | | | | | | | | (2) | | | (15) | | | (17) | |
| | | | | | | | | | | | | | | | | | | |
| Currency translation adjustment, net of net investment hedge activity (net of tax of $25 million) | | | | | | | | | | | | | 18 | | | 18 | | | (12) | | | 6 | |
| Net actuarial gains and prior service cost (net of tax of $2 million) | | | | | | | | | | | | | 7 | | | 7 | | | | | 7 | |
| Amortization of prior service costs and actuarial losses | | | | | | | | | | | | | 1 | | | 1 | | | | | 1 | |
| Net realized and unrealized loss on cash flow hedges (net of tax of $6 million) | | | | | | | | | | | | | (14) | | | (14) | | | | | (14) | |
| Balance at June 30, 2020 | 342.9 | | | $ | 3 | | | $ | 651 | | | $ | 10,442 | | | (155.2) | | | $ | (9,513) | | | $ | (542) | | | $ | 1,041 | | | $ | 191 | | | $ | 1,232 | |
The accompanying notes are an integral part of the condensed consolidated financial statements.
MOODY'S CORPORATION
CONSOLIDATED STATEMENTS OF SHAREHOLDERS' EQUITY (UNAUDITED)
(Amounts in millions, except per share data)
| | | | | | | | | | | | | | | | | | | | | | | | | | | | | | | | | | | | | | | | | | | | | | | | | | | | | | | | | | | | | | |
| Shareholders of Moody's Corporation | | | | | | |
| Common Stock | | Capital
Surplus | | Retained
Earnings | | Treasury Stock | | Accumulated
Other
Comprehensive
Loss | | Total Moody's
Shareholders'
Equity | | Non- Controlling
Interests | | Total
Shareholders'
Equity | | | |
| Shares | | Amount | | | Shares | | Amount | | | | |
| Balance at December 31, 2019 | 342.9 | | | $ | 3 | | | $ | 642 | | | $ | 9,656 | | | (155.2) | | | $ | (9,250) | | | $ | (439) | | | $ | 612 | | | $ | 219 | | | $ | 831 | | | | |
| Net income | | | | | | | 997 | | | | | | | | | 997 | | | — | | | 997 | | | | |
| Dividends ($1.12 per share) | | | | | | | (209) | | | | | | | | | (209) | | | — | | | (209) | | | | |
| Adoption of New Credit Losses Accounting Standard | | | | | | | (2) | | | | | | | 0 | | (2) | | | | | (2) | | | | |
| Stock-based compensation | | | | | 72 | | | | | | | | | | | 72 | | | | | 72 | | | | |
| Shares issued for stock-based compensation plans at average cost, net | | | | | (61) | | | | | 1.1 | | | (10) | | | | | (71) | | | | | (71) | | | | |
| Purchase of noncontrolling interest | | | | | (2) | | | | | | | | | | | (2) | | | (15) | | | (17) | | | | |
| | | | | | | | | | | | | | | | | | | | | | |
| Treasury shares repurchased | | | | | 0 | | | | | (1.1) | | | (253) | | | | | (253) | | | | | (253) | | | | |
| | | | | | | | | | | | | | | | | | | | | | |
| Currency translation adjustment, net of net investment hedge activity | | | | | | | | | | | | | (62) | | | (62) | | | (13) | | | (75) | | | | |
| Net actuarial gains and prior service costs (net of tax of $2 million) | | | | | | | | | | | | | 6 | | | 6 | | | | | 6 | | | | |
| Amortization of prior service costs and actuarial losses (net of tax of $1 million) | | | | | | | | | | | | | 2 | | | 2 | | | | | 2 | | | | |
| Net realized and unrealized loss on cash flow hedges (net of tax of $18 million) | | | | | | | | | | | | | (49) | | | (49) | | | | | (49) | | | | |
| Balance at June 30, 2020 | 342.9 | | | $ | 3 | | | $ | 651 | | | $ | 10,442 | | | (155.2) | | | $ | (9,513) | | | $ | (542) | | | $ | 1,041 | | | $ | 191 | | | $ | 1,232 | | | | |
The accompanying notes are an integral part of the condensed consolidated financial statements.
MOODY'S CORPORATION
CONSOLIDATED STATEMENTS OF SHAREHOLDERS' EQUITY (UNAUDITED)
(Amounts in millions, except per share data)
| | | | | | | | | | | | | | | | | | | | | | | | | | | | | | | | | | | | | | | | | | | | | | | | | | | | | | | | | | | | | | |
| Shareholders of Moody's Corporation | | | | | | |
| Common Stock | | Capital Surplus | | Retained Earnings | | Treasury Stock | | Accumulated Other Comprehensive Loss | | Total Moody's
Shareholders'
Equity | | Non- Controlling Interests | | Total
Shareholders'
Equity | | | |
| Shares | | Amount | | | Shares | | Amount | | | | |
| Balance at December 31, 2018 | 342.9 | | | $ | 3 | | | $ | 601 | | | $ | 8,594 | | | (151.6) | | | $ | (8,313) | | | $ | (426) | | | $ | 459 | | | $ | 197 | | | $ | 656 | | | | |
| Net income | | | | | | | 1,062 | | | | | | | | | 1,062 | | | 5 | | | 1,067 | | | | |
| Dividends ($1.50 per share) | | | | | | | (285) | | | | | | | | | (285) | | | (1) | | | (286) | | | | |
| Adoption of ASU 2018-02, relating to the Tax Act | | | | | | | 20 | | | | | | | (20) | | | 0 | | | | | 0 | | | | |
| Stock-based compensation | | | | | 103 | | | | | | | | | | | 103 | | | | | 103 | | | | |
| Shares issued for stock-based compensation plans at average cost, net | | | | | (71) | | | | | 1.5 | | | 32 | | | | | (39) | | | | | (39) | | | | |
| Purchase of noncontrolling interest | | | | | (9) | | | | | | | | | | | (9) | | | (3) | | | (12) | | | | |
| Non-controlling interest resulting from majority acquisition of Vigeo Eiris | | | | | | | | | | | | | | | 0 | | | 17 | | | 17 | | | | |
| Treasury shares repurchased | | | | | (16) | | | | | (4.1) | | | (712) | | | | | (728) | | | | | (728) | | | | |
| | | | | | | | | | | | | | | | | | | | | | |
Currency translation adjustment, net of net investment hedge activity (net of tax of $33 million) | | | | | | | | | | | | | (92) | | | (92) | | | 10 | | | (82) | | | | |
| Net actuarial gains and prior service cost | | | | | | | | | | | | | (1) | | | (1) | | | | | (1) | | | | |
| Amortization of prior service costs and actuarial losses (net of tax of $1 million) | | | | | | | | | | | | | 2 | | | 2 | | | | | 2 | | | | |
| Balance at September 30, 2019 | 342.9 | | | $ | 3 | | | $ | 608 | | | $ | 9,391 | | | (154.2) | | | $ | (8,993) | | | $ | (537) | | | $ | 472 | | | $ | 225 | | | $ | 697 | | | | |
The accompanying notes are an integral part of the condensed consolidated financial statements.
MOODY'S CORPORATION
CONSOLIDATED STATEMENTS OF SHAREHOLDERS' EQUITY (UNAUDITED)
(Amounts in millions, except per share data)
| | | | | | | | | | | | | | | | | | | | | | | | | | | | | | | | | | | | | | | | | | | | | | | | | | | | | | | | | | | |
| Shareholders of Moody's Corporation | | | |
| Common Stock | | Capital Surplus | | Retained Earnings | | Treasury Stock | | Accumulated Other Comprehensive Loss | | Total Moody's
Shareholders'
Equity | | Non- Controlling
Interests | | Total
Shareholders'
Equity |
| Shares | | Amount | | | Shares | | Amount | |
| Balance at June 30, 2020 | 342.9 | | | $ | 3 | | | $ | 651 | | | $ | 10,442 | | | (155.2) | | | $ | (9,513) | | | $ | (542) | | | $ | 1,041 | | | $ | 191 | | | $ | 1,232 | |
| Net income | | | | | | | 467 | | | | | | | | | 467 | | | 0 | | | 467 | |
| Dividends ($0.56 per share) | | | | | | | (105) | | | | | | | | | (105) | | | (1) | | | (106) | |
| Stock-based compensation | | | | | 38 | | | | | | | | | | | 38 | | | | | 38 | |
| Shares issued for stock-based compensation plans at average cost, net | | | | | 10 | | | | | 0.1 | | | 8 | | | | | 18 | | | | | 18 | |
| | | | | | | | | | | | | | | | | | | |
| | | | | | | | | | | | | | | | | | | |
| | | | | | | | | | | | | | | | | | | |
| Currency translation adjustment, net of net investment hedge activity (net of tax of $31 million) | | | | | | | | | | | | | 43 | | | 43 | | | 1 | | | 44 | |
| Net actuarial gains and prior service cost (net of tax of $2 million) | | | | | | | | | | | | | (7) | | | (7) | | | | | (7) | |
| Amortization of prior service costs and actuarial losses | | | | | | | | | | | | | 2 | | | 2 | | | | | 2 | |
| | | | | | | | | | | | | | | | | | | |
| Balance at September 30, 2020 | 342.9 | | | $ | 3 | | | $ | 699 | | | $ | 10,804 | | | (155.1) | | | $ | (9,505) | | | $ | (504) | | | $ | 1,497 | | | $ | 191 | | | $ | 1,688 | |
| | | | | | | | | | | | | | | | | | | | | | | | | | | | | | | | | | | | | | | | | | | | | | | | | | | | | | | | | | | |
| Shareholders of Moody's Corporation | | | |
| Common Stock | | Capital
Surplus | | Retained
Earnings | | Treasury Stock | | Accumulated
Other
Comprehensive
Loss | | Total Moody's
Shareholders'
Equity | | Non- Controlling
Interests | | Total
Shareholders'
Equity |
| Shares | | Amount | | | Shares | | Amount | |
| Balance at March 31, 2021 | 342.9 | | | $ | 3 | | | $ | 739 | | | $ | 11,632 | | | (155.7) | | | $ | (9,904) | | | $ | (440) | | | $ | 2,030 | | | $ | 195 | | | $ | 2,225 | |
| Net income | | | | | | | 577 | | | | | | | | | 577 | | | — | | | 577 | |
| Dividends ($0.62 per share) | | | | | | | (115) | | | | | | | | | (115) | | | — | | | (115) | |
| Stock-based compensation | | | | | 41 | | | | | | | | | | | 41 | | | | | 41 | |
| Shares issued for stock-based compensation plans at average cost, net | | | | | 4 | | | | | 0.1 | | | 5 | | | | | 9 | | | | | 9 | |
| | | | | | | | | | | | | | | | | | | |
| | | | | | | | | | | | | | | | | | | |
| Treasury shares repurchased | | | | | | | | | (1.1) | | | (371) | | | | | (371) | | | | | (371) | |
| Currency translation adjustment, net of net investment hedge activity (net of tax of $11 million) | | | | | | | | | | | | | 7 | | | 7 | | | (1) | | | 6 | |
| | | | | | | | | | | | | | | | | | | |
| Amortization of prior service costs/actuarial losses and settlement charge (net of tax of $2 million) | | | | | | | | | | | | | 8 | | | 8 | | | | | 8 | |
| | | | | | | | | | | | | | | | | | | |
| Balance at June 30, 2021 | 342.9 | | | $ | 3 | | | $ | 784 | | | $ | 12,094 | | | (156.7) | | | $ | (10,270) | | | $ | (425) | | | $ | 2,186 | | | $ | 194 | | | $ | 2,380 | |
The accompanying notes are an integral part of the condensed consolidated financial statements.
MOODY'S CORPORATION
CONSOLIDATED STATEMENTS OF SHAREHOLDERS' EQUITY UNAUDITED)
(Amounts in millions, except per share data)
| | | | | | | | | | | | | | | | | | | | | | | | | | | | | | | | | | | | | | | | | | | | | | | | | | | | | | | | | | | |
| Shareholders of Moody's Corporation | | | |
| Common Stock | | Capital Surplus | | Retained Earnings | | Treasury Stock | | Accumulated Other Comprehensive Loss | | Total Moody's
Shareholders'
Equity | | Non- Controlling
Interests | | Total
Shareholders'
Equity |
| Shares | | Amount | | | Shares | | Amount | |
| Balance at December 31, 2019 | 342.9 | | | $ | 3 | | | $ | 642 | | | $ | 9,656 | | | (155.2) | | | $ | (9,250) | | | $ | (439) | | | $ | 612 | | | $ | 219 | | | $ | 831 | |
| Net income | | | | | | | 1,464 | | | | | | | | | 1,464 | | | 0 | | | 1,464 | |
| Dividends ($1.68 per share) | | | | | | | (314) | | | | | | | | | (314) | | | (1) | | | (315) | |
| Adoption of New Credit Losses Accounting Standard | | | | | | | (2) | | | | | | | | | (2) | | | | | (2) | |
| | | | | | | | | | | | | | | | | | | |
| Stock-based compensation | | | | | 110 | | | | | | | | | | | 110 | | | | | 110 | |
| Shares issued for stock-based compensation plans at average cost, net | | | | | (51) | | | | | 1.2 | | | (2) | | | | | (53) | | | | | (53) | |
| Purchase of noncontrolling interest | | | | | (2) | | | | | | | | | | | (2) | | | (15) | | | (17) | |
| | | | | | | | | | | | | | | | | | | |
| Treasury shares repurchased | | | | | | | | | (1.1) | | | (253) | | | | | (253) | | | | | (253) | |
| Currency translation adjustment, net of net investment hedge activity (net of tax of $31 million) | | | | | | | | | | | | | (19) | | | (19) | | | (12) | | | (31) | |
| Net actuarial losses and prior service cost | | | | | | | | | | | | | (1) | | | (1) | | | | | (1) | |
| Amortization of prior service costs and actuarial losses (net of tax of $1 million) | | | | | | | | | | | | | 4 | | | 4 | | | | | 4 | |
| Net realized and unrealized gain on cash flow hedges (net of tax of $18 million) | | | | | | | | | | | | | (49) | | | (49) | | | | | (49) | |
| Balance at September 30, 2020 | 342.9 | | | $ | 3 | | | $ | 699 | | | $ | 10,804 | | | (155.1) | | | $ | (9,505) | | | $ | (504) | | | $ | 1,497 | | | $ | 191 | | | $ | 1,688 | |
| | | | | | | | | | | | | | | | | | | | | | | | | | | | | | | | | | | | | | | | | | | | | | | | | | | | | | | | | | | |
| Shareholders of Moody's Corporation | | | |
| Common Stock | | Capital
Surplus | | Retained
Earnings | | Treasury Stock | | Accumulated
Other
Comprehensive
Loss | | Total Moody's
Shareholders'
Equity | | Non- Controlling
Interests | | Total
Shareholders'
Equity |
| Shares | | Amount | | | Shares | | Amount | |
| Balance at December 31, 2020 | 342.9 | | | $ | 3 | | | $ | 735 | | | $ | 11,011 | | | (155.8) | | | $ | (9,748) | | | $ | (432) | | | $ | 1,569 | | | $ | 194 | | | $ | 1,763 | |
| Net income | | | | | | | 1,313 | | | | | | | | | 1,313 | | | — | | | 1,313 | |
| Dividends ($1.24 per share) | | | | | | | (230) | | | | | | | | | (230) | | | (1) | | | (231) | |
| | | | | | | | | | | | | | | | | | | |
| | | | | | | | | | | | | | | | | | | |
| Stock-based compensation | | | | | 86 | | | | | | | | | | | 86 | | | | | 86 | |
| Shares issued for stock-based compensation plans at average cost, net | | | | | (37) | | | | | 0.7 | | | (19) | | | | | (56) | | | | | (56) | |
| | | | | | | | | | | | | | | | | | | |
| | | | | | | | | | | | | | | | | | | |
| Treasury shares repurchased | | | | | | | | | (1.6) | | | (503) | | | | | (503) | | | | | (503) | |
| Currency translation adjustment, net of net investment hedge activity (net of tax of $25 million) | | | | | | | | | | | | | (4) | | | (4) | | | 1 | | | (3) | |
| | | | | | | | | | | | | | | | | | | |
| Amortization of prior service costs/actuarial losses and settlement charge (net of tax of $3 million) | | | | | | | | | | | | | 10 | | | 10 | | | | | 10 | |
| Net realized and unrealized gain on cash flow hedges | | | | | | | | | | | | | 1 | | | 1 | | | | | 1 | |
| Balance at June 30, 2021 | 342.9 | | | $ | 3 | | | $ | 784 | | | $ | 12,094 | | | (156.7) | | | $ | (10,270) | | | $ | (425) | | | $ | 2,186 | | | $ | 194 | | | $ | 2,380 | |
The accompanying notes are an integral part of the condensed consolidated financial statements.
MOODY’S CORPORATION
NOTES TO CONDENSED CONSOLIDATED FINANCIAL STATEMENTS (UNAUDITED)
(tabular dollar and share amounts in millions, except per share data)
NOTE 1. DESCRIPTION OF BUSINESS AND BASIS OF PRESENTATION
Moody’s is a provider of (i) credit ratingsglobal integrated risk assessment firm that empowers organizations and assessment services; (ii) credit, capital markets and economic research, data and analytical tools; (iii) software solutions that support financial risk management activities; (iv) quantitatively derived credit scores; (v) learning solutions and certification services; and (vi) company information and business intelligence products.investors to make better decisions. Moody’s reports in 2 reportable segments: MIS and MA.
MIS the credit rating agency, publishes credit ratings and provides assessment services on a wide range of debt obligations and the entities that issue such obligations in markets worldwide. Revenue is primarily derived from the originators and issuers of such transactions who use MIS ratings in the distribution of their debt issues to investors. Additionally, MIS earns revenue from certain non-ratings-related operations which consist primarily of financial instrument pricing services in the Asia-Pacific region, revenue from ICRA’s non-ratings operations and revenue from providing ESG research, data and assessments.assessments and revenue from ICRA’s non-ratings operations. The revenue from these operations is included in the MIS Other LOB and is not material to the results of the MIS segment.
MA provides financial intelligenceis a global provider of data and analytical tools to assist businesses in makinganalytic solutions which help companies make better and faster decisions. MA’s portfolio ofanalytic models, industry insights, software tools and proprietary data assets allow companies to inform and perform many critical business activities with trust and confidence. MA’s approach to aggregating, broadening and deepening available data, research, analytic tools and software solutions consists of specialized research, data, software,fosters a more integrated and professional services, which are assembledefficient delivery to support the financial analysisMA's customers resulting in better decisions around risks and risk management activities of institutional customers worldwide.opportunities.
These interim financial statements have been prepared in accordance with the instructions to Form 10-Q and should be read in conjunction with the Company’s consolidated financial statements and related notes in the Company’s 20192020 annual report on Form 10-K filed with the SEC on February 24, 2020.22, 2021. The results of interim periods are not necessarily indicative of results for the full year or any subsequent period. In the opinion of management, all adjustments (including normal recurring accruals) considered necessary for a fair presentation of financial position, results of operations and cash flows at the dates and for the periods presented have been included. The year-end consolidated balance sheet data was derived from audited financial statements, but does not include all disclosures required by accounting principles generally accepted in the United States of America.
Certain reclassifications have been made to prior period amounts to conform to the current presentation.
Adoption of New Accounting Standards
On January 1, 2020,2021, the Company adopted ASU No. 2016-13, “Financial2019-04, “Codification Improvements to Topic 326, Financial Instruments—Credit Losses, (Topic 326): Measurement of Credit Losses onTopic 815, Derivatives and Hedging, and Topic 825 Financial Instruments.” The Company has implemented policiesThis ASU clarifies and procedures in compliance with the “expected credit loss” impairment model, which included (1) refinement of the grouping of receivables with similar risk characteristics; and (2) processes to identify information that can be used to develop reasonable and supportable forecasts of factors that could affect the collectability of the reported amount of the receivable. As the Company's accounts receivable are short-term in nature, the adoption of this ASU did not have a material impactimproves guidance related to the Company's allowance for bad debts or its policies and procedures for determining the allowance. Refer to Note 2 for further informationrecently issued standards updates on how the Company determines its reserves for expected credit losses. The Company recorded a $2 million cumulative-effect adjustment to retained earnings to increase its allowance for credit losses, upon adoption.
On January 1, 2020, the Company adopted ASU No. 2018-15, “Intangibles—Goodwillhedging, and Other—Internal-Use Software (Subtopic 350-40): Customer’s Accounting for Implementation Costs Incurred in a Cloud Computing Arrangement that is a Service Contract.” This ASU requires implementation costs incurred by customers in cloud computing arrangements (i.e., hosting arrangements) to be capitalized under the same provisionsrecognition and measurement of authoritative guidance for internal-use software, and amortized over the non-cancellable term of the cloud computing arrangements plus any option renewal periods that are reasonably certain to be exercised by the customer or for which the exercise is controlled by the service provider. The Company will be required to present the amortization of capitalized implementation costs in the same line item in the statement of operations as the fees associated with the hosting service (i.e. operating and SG&A expense) and classify the related payments in the statement of cash flows in the same manner as payments made for fees associated with the hosting service (i.e. cash flows from operating activities). This ASU also requires capitalization of implementation costs in the balance sheet to be consistent with the location of prepayment of fees for the hosting element (i.e. within other current assets or other assets).financial instruments. The Company adopted this ASU prospectively to all implementation costs incurred after the date of adoption and it did not have a material impact on the Company's current financial statements. The future impact
On January 1, 2021, the Company adopted ASU No. 2019-12, "Income Taxes (Topic 740): Simplifying the Accounting for Income Taxes." This ASU simplifies the accounting for income taxes by eliminating certain exceptions to the general principles in Topic 740, Income Taxes, and clarifies certain aspects of the existing guidance to promote consistency among reporting entities. Most amendments within this ASU are required to be applied on a prospective basis, while certain amendments must be applied on a retrospective or modified retrospective basis. The Company adopted this ASU prospectively and it did not have a material impact on the Company's current financial statements will relate to the aforementioned classification of these capitalized costs and related amortization.statements.
Recently Issued Accounting Standards In March 2020,January 2021, the FASB issued ASU 2021-01, “Reference Rate Reform - Scope,” which clarified the scope and application of the original guidance, ASU No. 2020-04, "Facilitation of the Effects of Reference Rate Reform on Financial Reporting". The ("ASU No. 2020-04"), issued in March 2020. ASU No. 2020-04 provides temporary optional expedients and exceptions to the U.S. GAAP guidance on contract modifications and hedge accounting to ease the financial reporting burdens related to the expected market transition from the London Interbank Offered Rate (LIBOR) and other interbank offered rates to alternative reference rates. This guidance wasBoth ASU's were effective beginning on March 12, 2020,upon issuance, and the Company may elect to apply the amendments prospectively through December 31, 2022 as the transition from LIBOR is completed.
COVID-19
The Company is closely monitoring the impact of the COVID-19 pandemic has not had a material adverse impact on all aspects ofthe Company's reported results to date and is currently not expected to have a material adverse impact on its business. While the Company has selectively reopened certain of its offices, Moody’s continues to require remote work for most employees globally. The Company continues to monitor regional developments relating to the COVID-19 pandemic to inform decisions on office re-openings.
The Company experienced disruption in certain sectors of its business beginning late in the first quarter of 2020 resulting from market volatility associated with the COVID-19 crisis.near-term outlook. However, at the date of the filing of this quarterly report on Form 10-Q, the CompanyMoody's is unable to predict either the potential near-term or longer-term impact that the COVID-19 crisispandemic may have on its business, future results of operations, financial position and operating resultsor cash flows due to numerous uncertainties regarding the duration and severityuncertainties.
In the nine months ended September 30, 2020, in order to maximize liquidity and to increase available cash on hand through this period of uncertainty, the Company increased its long-term borrowings by $700 million and began borrowing under its CP Program as more fully discussed in Note 17. At September 30, 2020, the Company had repaid all CP outstanding. In addition, the Company reduced discretionary spending, including temporarily suspending its share repurchase program beginning late in the first quarter of 2020 and spanning through the third quarter. The Company anticipates resuming its share repurchase program in the fourth quarter of 2020.
The Coronavirus Aid, Relief, and Economic Security Act (“CARES Act”) was enacted on March 27, 2020 in the United States. The Company is utilizing certain provisions in the CARES Act and other IRS guidance which permit the deferral of certain income and payroll tax remittances.
NOTE 2. SUMMARY OF SIGNIFICANT ACCOUNTING POLICIES
On January 1, 2020,Pursuant to a strategic reorganization in the MA operating segment which was completed in the second quarter of 2021, the Company adopted the New Credit Losses Accounting Standardrealigned its MA reporting units used in assessing goodwill for impairment as more fully discussed in Note 1.of June 30, 2021. Accordingly, the Company revised its accounts receivable allowances accounting policy for goodwill to reflect the provisions of the new standard,change in MA's reporting units, which is discussed below along with the capitalized software accounting policy, which was also updated to reflect the New Internal Use Software Accounting Standard.below. All other significant accounting policies described in the Form 10-K for the year ended December 31, 20192020 remain unchanged.
Accounts Receivable Allowances
On January 1, 2020, the Company adopted ASU No. 2016-13, “Financial Instruments—Credit Losses (Topic 326): Measurement of Credit Losses on Financial Instruments” as more fully described in Note 1. As the Company's accounts receivable are short-term in nature, the adoption of this ASU This reorganization did not haveresult in a material impactchange to the Company's allowancereportable segments.
Goodwill
Moody’s evaluates its goodwill for bad debtsimpairment at the reporting unit level, defined as an operating segment (i.e., MIS and MA), or its policies and procedures for determining the allowance.
In order to determineone level below an estimateoperating segment (i.e., a component of expected credit losses, receivables are segmented based on similar risk characteristics including historical credit loss patterns and industryan operating segment), annually as of July 31 or class of customers to calculate reserve rates. The Company uses an aging method for developing its allowance for credit losses by which receivable balances are stratified based on aging category. A reserve rate is calculated for each aging category which is generally based on historical information. The reserve rate is adjusted, when necessary, for current conditions (e.g., macroeconomic or industry related) and reasonable and supportable forecasts about the future. The Company also considers customer specific information (e.g., bankruptcy or financial difficulty) when estimating its expected credit losses, as well as the economic environment of the customers, both from an industry and geographic perspective,more frequently if impairment indicators arise in evaluating the need for allowances. Expected credit losses are reflected as additions to the accounts receivable allowance. Actual uncollectible account write-offs are recorded against the allowance.
As of September 30, 2020, Moody's assessment included consideration of the current COVID-19 pandemic and its estimated impact on the Company's accounts receivable allowances. This assessment involved the utilization of significant judgment regarding the expected severity and duration of the market disruption caused by the COVID-19 pandemic, as well as judgment regarding which industries, classes of customers and geographies would be most significantly impacted.
During the nine months ended September 30, 2020, the Company recorded a net provision for expected credit losses of $31 million. The increase in the provision for expected credit losses for the current period was primarily attributable to the aforementioned estimated effects of COVID-19.
Computer Software Developed or Obtained for Internal Useaccordance with ASC Topic 350.
The Company capitalizes costs relatedevaluates the recoverability of goodwill using a two-step impairment test approach at the reporting unit level. In the first step, the Company assesses various qualitative factors to software developed or obtained for internal use. These assets, included in property and equipmentdetermine whether the fair value of a reporting unit may be less than its carrying amount. If a determination is made based on the qualitative factors that an impairment does not exist, the Company is not required to perform further testing. If the aforementioned qualitative assessment results in the consolidated balance sheets, relateCompany concluding that it is more likely than not that the fair value of a reporting unit may be less than its carrying amount, the fair value of the reporting unit will be quantitatively determined and compared to its carrying value including goodwill. If the Company’s financial systems, websitefair value of the reporting unit exceeds the carrying value of the net assets assigned to that unit, goodwill is not impaired and other systems. Such costs generally consistthe Company is not required to perform further testing. If the fair value of direct coststhe reporting unit is less than the carrying value, the Company will record a goodwill impairment charge for third-party perpetual license fees, professional services providedthe amount by third parties and employee compensation, in each case incurred either duringwhich the application development stage or in connection with upgrades and enhancements that increase functionality. Such costs are depreciated over their estimated useful lives on a straight-line basis. Costs incurred duringcarrying value exceeds the preliminary project stage of development as well as maintenance costs are expensed as incurred.reporting unit’s fair value.
The Company also capitalizes implementation costs incurredevaluates its reporting units on an annual basis, or more frequently if there are changes in cloud computing arrangements (i.e., hosting arrangements) and depreciates the costs over the non-cancellable termreporting structure of the cloud computing arrangements plus any option renewal periodsCompany due to acquisitions, reporting unit realignments or if there are indicators of potential impairment. For the reporting units where the Company is consistently able to conclude that are reasonably certainno impairment exists using only a qualitative approach, the Company’s accounting policy is to be exercised or forperform the second step of the aforementioned goodwill impairment assessment at least once every three years. Goodwill is assigned to a reporting unit at the date when an acquisition is integrated into one of the established reporting units, and is based on which reporting unit is expected to benefit from the exercise is controlledsynergies of the acquisition.
Prior to the second quarter of 2021, MA's reporting unit structure consisted of 5 reporting units (Content, ERS, MALS, Bureau van Dijk and Reis). Pursuant to a strategic reorganization in the MA segment which was completed in the second quarter of 2021, MA's reporting unit structure has been reorganized into 2 reporting units. MA’s 2 new reporting units generally consist of: i) businesses offering data and data-driven analytical solutions; and ii) risk-management software, workflow and CRE solutions.
The Company performed qualitative assessments of the reporting units impacted by the service provider. Followingreorganization immediately before and after the January 1, 2020 adoption of ASU No. 2018-15, “Intangibles—Goodwill and Other—Internal-Use Software (Subtopic 350-40): Customer’s Accounting for Implementation Costs Incurredreorganization became effective. These qualitative assessments resulted in a Cloud Computing Arrangement that is a Service Contract" (as further discussed in Note 1), the Company classifiesdetermining that it was not more likely than not that the amortizationfair value of capitalized implementation costs in the same line item in the statement of operations as the fees associated with the hosting service (i.e., operating and SG&A expense) and classifies the related payments in the statement of cash flows in the same manner as payments made for fees associated with the hosting service (i.e. cash flows from operating activities). In addition, the capitalization of implementation costs is reflected in the balance sheet consistent with the location of prepayment of fees for the hosting element (i.e., within other current assets or other assets). The implementation costs incurred prior to adoption of this ASU have been included within property and equipment, net in the balance sheet with the amortization of such balance included within depreciation and amortization in the statement of operations.
Use of Estimatesany reporting unit was less than its carrying amount.
The preparationCompany will perform a quantitative assessment on the new reporting units as of financial statements in conformity with GAAP requires management to make estimates and assumptions that affect the reported amounts of assets and liabilities, the disclosure of contingent assets and liabilities atJuly 31, 2021, the date of the financial statements, andCompany’s annual goodwill impairment assessment, which will provide new baseline valuations under the reported amounts of revenue and expenses during the period. Actual results could differ from those estimates.new reporting unit structure.
NOTE 3. REVENUES
Revenue by Category
The following table presents the Company’s revenues disaggregated by LOB:
| | | | | | | | | | | | | | | | | | | | | | | |
| Three Months Ended
September 30, | | Nine Months Ended
September 30, |
| 2020 | | 2019 | | 2020 | | 2019 |
| MIS: | | | | | | | |
| Corporate finance (CFG) | | | | | | | |
| Investment-grade | $ | 141 | | | $ | 106 | | | $ | 576 | | | $ | 299 | |
| High-yield | 101 | | | 56 | | | 275 | | | 182 | |
| Bank loans | 73 | | | 90 | | | 205 | | | 246 | |
Other accounts (1) | 146 | | | 140 | | | 430 | | | 408 | |
| Total CFG | 461 | | | 392 | | | 1,486 | | | 1,135 | |
| Structured finance (SFG) | | | | | | | |
| Asset-backed securities | 25 | | | 25 | | | 70 | | | 74 | |
| RMBS | 24 | | | 21 | | | 74 | | | 69 | |
| CMBS | 15 | | | 18 | | | 45 | | | 56 | |
| Structured credit | 24 | | | 40 | | | 74 | | | 116 | |
| Other accounts | 0 | | | 1 | | | 2 | | | 3 | |
| Total SFG | 88 | | | 105 | | | 265 | | | 318 | |
| Financial institutions (FIG) |
| Banking | 95 | | | 80 | | | 269 | | | 244 | |
| Insurance | 31 | | | 31 | | | 105 | | | 88 | |
| Managed investments | 6 | | | 6 | | | 20 | | | 20 | |
| Other accounts | 2 | | | 3 | | | 7 | | | 9 | |
| Total FIG | 134 | | | 120 | | | 401 | | | 361 | |
| Public, project and infrastructure finance (PPIF) |
| Public finance / sovereign | 71 | | | 58 | | | 192 | | | 157 | |
| Project and infrastructure | 62 | | | 62 | | | 183 | | | 164 | |
| Total PPIF | 133 | | | 120 | | | 375 | | | 321 | |
| Total ratings revenue | 816 | | | 737 | | | 2,527 | | | 2,135 | |
| MIS Other | 9 | | | 9 | | | 30 | | | 20 | |
| Total external revenue | 825 | | | 746 | | | 2,557 | | | 2,155 | |
| Intersegment royalty | 38 | | | 35 | | | 110 | | | 100 | |
| Total MIS | 863 | | | 781 | | | 2,667 | | | 2,255 | |
| MA: | | | | | | | |
| Research, data and analytics (RD&A) | 386 | | | 317 | | | 1,110 | | | 940 | |
Enterprise risk solutions (ERS) | 145 | | | 134 | | | 414 | | | 373 | |
Professional services (PS) (2) | 0 | | | 43 | | | 0 | | | 128 | |
| Total external revenue | 531 | | | 494 | | | 1,524 | | | 1,441 | |
| Intersegment revenue | 1 | | | 2 | | | 5 | | | 7 | |
| Total MA | 532 | | | 496 | | | 1,529 | | | 1,448 | |
| Eliminations | (39) | | | (37) | | | (115) | | | (107) | |
| Total MCO | $ | 1,356 | | | $ | 1,240 | | | $ | 4,081 | | | $ | 3,596 | |
| | | | | | | | | | | | | | | | | | | | | | | |
| Three Months Ended
June 30, | | Six Months Ended
June 30, |
| 2021 | | 2020 | | 2021 | | 2020 |
| MIS: | | | | | | | |
| Corporate finance (CFG) | | | | | | | |
| Investment-grade | $ | 102 | | | $ | 291 | | | $ | 236 | | | $ | 435 | |
| High-yield | 124 | | | 99 | | | 265 | | | 174 | |
| Bank loans | 157 | | | 43 | | | 337 | | | 132 | |
Other accounts (1) | 167 | | | 139 | | | 317 | | | 284 | |
| Total CFG | 550 | | | 572 | | | 1,155 | | | 1,025 | |
| Financial institutions (FIG) |
| Banking | 101 | | | 88 | | | 210 | | | 174 | |
| Insurance | 33 | | | 44 | | | 76 | | | 74 | |
| Managed investments | 13 | | | 8 | | | 21 | | | 14 | |
| Other accounts | 3 | | | 2 | | | 5 | | | 5 | |
| Total FIG | 150 | | | 142 | | | 312 | | | 267 | |
| Public, project and infrastructure finance (PPIF) |
| Public finance / sovereign | 63 | | | 64 | | | 130 | | | 121 | |
| Project and infrastructure | 67 | | | 69 | | | 143 | | | 121 | |
| Total PPIF | 130 | | | 133 | | | 273 | | | 242 | |
| Structured finance (SFG) | | | | | | | |
| Asset-backed securities | 33 | | | 23 | | | 59 | | | 45 | |
| RMBS | 31 | | | 23 | | | 58 | | | 50 | |
| CMBS | 23 | | | 13 | | | 47 | | | 30 | |
| Structured credit | 53 | | | 21 | | | 91 | | | 50 | |
| Other accounts | 0 | | | 1 | | | 1 | | | 2 | |
| Total SFG | 140 | | | 81 | | | 256 | | | 177 | |
| Total ratings revenue | 970 | | | 928 | | | 1,996 | | | 1,711 | |
| MIS Other | 10 | | | 10 | | | 20 | | | 21 | |
| Total external revenue | 980 | | | 938 | | | 2,016 | | | 1,732 | |
| Intersegment revenue | 42 | | | 35 | | | 82 | | | 72 | |
| Total MIS | 1,022 | | | 973 | | | 2,098 | | | 1,804 | |
| MA: | | | | | | | |
| Research, data and analytics (RD&A) | 435 | | | 366 | | | 854 | | | 724 | |
Enterprise risk solutions (ERS) | 138 | | | 131 | | | 283 | | | 269 | |
| Total external revenue | 573 | | | 497 | | | 1,137 | | | 993 | |
| Intersegment revenue | 2 | | | 2 | | | 4 | | | 4 | |
| Total MA | 575 | | | 499 | | | 1,141 | | | 997 | |
| Eliminations | (44) | | | (37) | | | (86) | | | (76) | |
| Total MCO | $ | 1,553 | | | $ | 1,435 | | | $ | 3,153 | | | $ | 2,725 | |
(1) Other includes: recurring monitoring fees of a rated debt obligation and/or entities that issue such obligations as well as fees from programs such as commercial paper, medium term notes, and ICRA corporate finance revenue.
(2)Subsequent to the divestiture of MAKS in 2019, revenue from the MALS reporting unit, which previous to 2020 was reported in the PS LOB, is now reported as part of the RD&A LOB. Prior periods have not been reclassified as the amounts were not material.
The following table presents the Company’s revenues disaggregated by LOB and geographic area:
| | | Three Months Ended September 30, 2020 | | Three Months Ended September 30, 2019 | | Three Months Ended June 30, 2021 | | Three Months Ended June 30, 2020 |
| | U.S. | | Non-U.S | | Total | | U.S. | | Non-U.S | | Total | | U.S. | | Non-U.S | | Total | | U.S. | | Non-U.S | | Total |
| MIS: | MIS: | MIS: |
Corporate finance (CFG) | $ | 311 | | | $ | 150 | | | $ | 461 | | | $ | 259 | | | $ | 133 | | | $ | 392 | | |
| Structured finance (SFG) | 54 | | | 34 | | | 88 | | | 68 | | | 37 | | | 105 | | |
| Financial institutions (FIG) | 59 | | | 75 | | | 134 | | | 54 | | | 66 | | | 120 | | |
| Public, project and infrastructure finance (PPIF) | 82 | | | 51 | | | 133 | | | 73 | | | 47 | | | 120 | | |
| Corporate finance | | Corporate finance | $ | 345 | | | $ | 205 | | | $ | 550 | | | $ | 413 | | | $ | 159 | | | $ | 572 | |
| Financial institutions | | Financial institutions | 69 | | | 81 | | | 150 | | | 70 | | | 72 | | | 142 | |
| Public, project and infrastructure finance | | Public, project and infrastructure finance | 79 | | | 51 | | | 130 | | | 87 | | | 46 | | | 133 | |
| Structured finance | | Structured finance | 88 | | | 52 | | | 140 | | | 45 | | | 36 | | | 81 | |
| Total ratings revenue | Total ratings revenue | 506 | | | 310 | | | 816 | | | 454 | | | 283 | | | 737 | | Total ratings revenue | 581 | | | 389 | | | 970 | | | 615 | | | 313 | | | 928 | |
| MIS Other | MIS Other | 0 | | | 9 | | | 9 | | | 0 | | | 9 | | | 9 | | MIS Other | 1 | | | 9 | | | 10 | | | 1 | | | 9 | | | 10 | |
| Total MIS | Total MIS | 506 | | | 319 | | | 825 | | | 454 | | | 292 | | | 746 | | Total MIS | 582 | | | 398 | | | 980 | | | 616 | | | 322 | | | 938 | |
| MA: | MA: | MA: |
| Research, data and analytics (RD&A) | 167 | | | 219 | | | 386 | | | 139 | | | 178 | | | 317 | | |
Enterprise risk solutions (ERS) | 56 | | | 89 | | | 145 | | | 49 | | | 85 | | | 134 | | |
Professional services (PS) (1) | 0 | | | 0 | | | 0 | | | 18 | | | 25 | | | 43 | | |
| Research, data and analytics | | Research, data and analytics | 190 | | | 245 | | | 435 | | | 167 | | | 199 | | | 366 | |
Enterprise risk solutions | | Enterprise risk solutions | 59 | | | 79 | | | 138 | | | 54 | | | 77 | | | 131 | |
| | Total MA | Total MA | 223 | | | 308 | | | 531 | | | 206 | | | 288 | | | 494 | | Total MA | 249 | | | 324 | | | 573 | | | 221 | | | 276 | | | 497 | |
| Total MCO | Total MCO | $ | 729 | | | $ | 627 | | | $ | 1,356 | | | $ | 660 | | | $ | 580 | | | $ | 1,240 | | Total MCO | $ | 831 | | | $ | 722 | | | $ | 1,553 | | | $ | 837 | | | $ | 598 | | | $ | 1,435 | |
| |
| | | | | | | | | | | | | | | | | | | | | | | | | | | | | | | | | | | |
| Six Months Ended June 30, 2021 | | Six Months Ended June 30, 2020 |
| U.S. | | Non-U.S | | Total | | U.S. | | Non-U.S | | Total |
| MIS: |
| Corporate finance | $ | 759 | | | $ | 396 | | | $ | 1,155 | | | $ | 727 | | | $ | 298 | | | $ | 1,025 | |
| Financial institutions | 155 | | | 157 | | | 312 | | | 130 | | | 137 | | | 267 | |
| Public, project and infrastructure finance | 157 | | | 116 | | | 273 | | | 155 | | | 87 | | | 242 | |
| Structured finance | 156 | | | 100 | | | 256 | | | 106 | | | 71 | | | 177 | |
| Total ratings revenue | 1,227 | | | 769 | | | 1,996 | | | 1,118 | | | 593 | | | 1,711 | |
| MIS Other | 2 | | | 18 | | | 20 | | | 1 | | | 20 | | | 21 | |
| Total MIS | 1,229 | | | 787 | | | 2,016 | | | 1,119 | | | 613 | | | 1,732 | |
| MA: |
| Research, data and analytics | 373 | | | 481 | | | 854 | | | 325 | | | 399 | | | 724 | |
Enterprise risk solutions | 114 | | | 169 | | | 283 | | | 107 | | | 162 | | | 269 | |
| Total MA | 487 | | | 650 | | | 1,137 | | | 432 | | | 561 | | | 993 | |
| Total MCO | $ | 1,716 | | | $ | 1,437 | | | $ | 3,153 | | | $ | 1,551 | | | $ | 1,174 | | | $ | 2,725 | |
| | | | | | | | | | | | | | | | | | | | | | | | | | | | | | | | | | | |
| Nine Months Ended September 30, 2020 | | Nine Months Ended September 30, 2019 |
| U.S. | | Non-U.S | | Total | | U.S. | | Non-U.S | | Total |
| MIS: |
Corporate finance (CFG) | $ | 1,038 | | | $ | 448 | | | $ | 1,486 | | | $ | 744 | | | $ | 391 | | | $ | 1,135 | |
| Structured finance (SFG) | 160 | | | 105 | | | 265 | | | 202 | | | 116 | | | 318 | |
| Financial institutions (FIG) | 189 | | | 212 | | | 401 | | | 152 | | | 209 | | | 361 | |
| Public, project and infrastructure finance (PPIF) | 237 | | | 138 | | | 375 | | | 202 | | | 119 | | | 321 | |
| Total ratings revenue | 1,624 | | | 903 | | | 2,527 | | | 1,300 | | | 835 | | | 2,135 | |
| MIS Other | 1 | | | 29 | | | 30 | | | 1 | | | 19 | | | 20 | |
| Total MIS | 1,625 | | | 932 | | | 2,557 | | | 1,301 | | | 854 | | | 2,155 | |
| MA: |
| Research, data and analytics (RD&A) | 492 | | | 618 | | | 1,110 | | | 412 | | | 528 | | | 940 | |
Enterprise risk solutions (ERS) | 163 | | | 251 | | | 414 | | | 143 | | | 230 | | | 373 | |
Professional services (PS) (1) | 0 | | | 0 | | | 0 | | | 54 | | | 74 | | | 128 | |
| Total MA | 655 | | | 869 | | | 1,524 | | | 609 | | | 832 | | | 1,441 | |
| Total MCO | $ | 2,280 | | | $ | 1,801 | | | $ | 4,081 | | | $ | 1,910 | | | $ | 1,686 | | | $ | 3,596 | |
(1) Subsequent to the divestiture of MAKS in 2019, the RD&A LOB now includes revenue from MALS beginning in the first quarter of 2020. MALS revenue was previously reported as part of the PS LOB and prior year revenue by LOB has not been reclassified as the amounts were not material.
The following table presents the Company’s reportable segment revenues disaggregated by segment and geographic region:
| | | | | | | | | | | | | | | | | | | | | | | |
| Three Months Ended
September 30, | | Nine Months Ended
September 30, |
| 2020 | | 2019 | | 2020 | | 2019 |
| MIS: | |
| U.S. | $ | 506 | | | $ | 454 | | | $ | 1,625 | | | $ | 1,301 | |
| Non-U.S.: | | | | | | | |
| EMEA | 188 | | | 175 | | | 542 | | | 502 | |
| Asia-Pacific | 99 | | | 78 | | | 270 | | | 241 | |
| Americas | 32 | | | 39 | | | 120 | | | 111 | |
| Total Non-U.S. | 319 | | | 292 | | | 932 | | | 854 | |
| Total MIS | 825 | | | 746 | | | 2,557 | | | 2,155 | |
| MA: | | | | | | | |
| U.S. | 223 | | | 206 | | | 655 | | | 609 | |
| Non-U.S.: | | | | | | | |
| EMEA | 213 | | | 187 | | | 595 | | | 555 | |
| Asia-Pacific | 57 | | | 64 | | | 166 | | | 174 | |
| Americas | 38 | | | 37 | | | 108 | | | 103 | |
| Total Non-U.S. | 308 | | | 288 | | | 869 | | | 832 | |
| Total MA | 531 | | | 494 | | | 1,524 | | | 1,441 | |
| Total MCO | $ | 1,356 | | | $ | 1,240 | | | $ | 4,081 | | | $ | 3,596 | |
| | | | | | | | | | | | | | | | | | | | | | | |
| Three Months Ended
June 30, | | Six Months Ended
June 30, |
| 2021 | | 2020 | | 2021 | | 2020 |
| MIS: | |
| U.S. | $ | 582 | | | $ | 616 | | | $ | 1,229 | | | $ | 1,119 | |
| Non-U.S.: | | | | | | | |
| EMEA | 248 | | | 183 | | | 496 | | | 354 | |
| Asia-Pacific | 100 | | | 90 | | | 197 | | | 171 | |
| Americas | 50 | | | 49 | | | 94 | | | 88 | |
| Total Non-U.S. | 398 | | | 322 | | | 787 | | | 613 | |
| Total MIS | 980 | | | 938 | | | 2,016 | | | 1,732 | |
| MA: | | | | | | | |
| U.S. | 249 | | | 221 | | | 487 | | | 432 | |
| Non-U.S.: | | | | | | | |
| EMEA | 233 | | | 190 | | | 463 | | | 382 | |
| Asia-Pacific | 55 | | | 54 | | | 114 | | | 109 | |
| Americas | 36 | | | 32 | | | 73 | | | 70 | |
| Total Non-U.S. | 324 | | | 276 | | | 650 | | | 561 | |
| Total MA | 573 | | | 497 | | | 1,137 | | | 993 | |
| Total MCO | $ | 1,553 | | | $ | 1,435 | | | $ | 3,153 | | | $ | 2,725 | |
The following tables summarize the split between transaction and relationshiprecurring revenue. In the MIS segment, excluding MIS Other, transaction revenue represents the initial rating of a new debt issuance as well as other one-time fees while relationshiprecurring revenue represents the recurring monitoring fees of a rated debt obligation and/or entities that issue such obligations, as well as revenue from programs such as commercial paper, medium-term notes and shelf registrations. In MIS Other, transaction revenue represents revenue from professional services and outsourcing engagements and relationshiprecurring revenue represents subscription-based revenues. In the MA segment, relationshiprecurring revenue represents subscription-based revenues and software maintenance revenue. Transaction revenue in MA represents perpetual software license fees and revenue from software implementation services, risk management advisory projects, and training and certification services, and outsourced research and analytical engagements.services. | | | | | | | | | | | | | | | | | | | | | | | | | | | | | | | | | | | |
| Three Months Ended June 30, |
| 2021 | | 2020 |
| Transaction | | Recurring | | Total | | Transaction | | Recurring | | Total |
| Corporate Finance | $ | 427 | | | $ | 123 | | | $ | 550 | | | $ | 457 | | | $ | 115 | | | $ | 572 | |
| 78 | % | | 22 | % | | 100 | % | | 80 | % | | 20 | % | | 100 | % |
| Financial Institutions | $ | 79 | | | $ | 71 | | | $ | 150 | | | $ | 76 | | | $ | 66 | | | $ | 142 | |
| 53 | % | | 47 | % | | 100 | % | | 54 | % | | 46 | % | | 100 | % |
| Public, Project and Infrastructure Finance | $ | 88 | | | $ | 42 | | | $ | 130 | | | $ | 96 | | | $ | 37 | | | $ | 133 | |
| 68 | % | | 32 | % | | 100 | % | | 72 | % | | 28 | % | | 100 | % |
| Structured Finance | $ | 92 | | | $ | 48 | | | $ | 140 | | | $ | 35 | | | $ | 46 | | | $ | 81 | |
| 66 | % | | 34 | % | | 100 | % | | 43 | % | | 57 | % | | 100 | % |
| MIS Other | $ | 0 | | | $ | 10 | | | $ | 10 | | | $ | 0 | | | $ | 10 | | | $ | 10 | |
| 0 | % | | 100 | % | | 100 | % | | 0 | % | | 100 | % | | 100 | % |
| Total MIS | $ | 686 | | | $ | 294 | | | $ | 980 | | | $ | 664 | | | $ | 274 | | | $ | 938 | |
| 70 | % | | 30 | % | | 100 | % | | 71 | % | | 29 | % | | 100 | % |
| Research, data and analytics | $ | 22 | | | $ | 413 | | | $ | 435 | | | $ | 16 | | | $ | 350 | | | $ | 366 | |
| 5 | % | | 95 | % | | 100 | % | | 4 | % | | 96 | % | | 100 | % |
| Enterprise risk solutions | $ | 16 | | | $ | 122 | | | $ | 138 | | | $ | 26 | | | $ | 105 | | | $ | 131 | |
| 12 | % | | 88 | % | | 100 | % | | 20 | % | | 80 | % | | 100 | % |
| Total MA | $ | 38 | | (1) | $ | 535 | | | $ | 573 | | | $ | 42 | | | $ | 455 | | | $ | 497 | |
| 7 | % | | 93 | % | | 100 | % | | 8 | % | | 92 | % | | 100 | % |
| Total Moody's Corporation | $ | 724 | | | $ | 829 | | | $ | 1,553 | | | $ | 706 | | | $ | 729 | | | $ | 1,435 | |
| 47 | % | | 53 | % | | 100 | % | | 49 | % | | 51 | % | | 100 | % |
| | | | | | | | | | | |
| | | Three Months Ended September 30, | | Six Months Ended June 30, |
| | 2020 | | 2019 | | 2021 | | 2020 |
| | Transaction | | Relationship | | Total | | Transaction | | Relationship | | Total | | Transaction | | Recurring | | Total | | Transaction | | Recurring | | Total |
| Corporate Finance | Corporate Finance | $ | 347 | | | $ | 114 | | | $ | 461 | | | $ | 282 | | | $ | 110 | | | $ | 392 | | Corporate Finance | $ | 914 | | | $ | 241 | | | $ | 1,155 | | | $ | 795 | | | $ | 230 | | | $ | 1,025 | |
| | 75 | % | | 25 | % | | 100 | % | | 72 | % | | 28 | % | | 100 | % | | 79 | % | | 21 | % | | 100 | % | | 78 | % | | 22 | % | | 100 | % |
| Structured Finance | $ | 41 | | | $ | 47 | | | $ | 88 | | | $ | 58 | | | $ | 47 | | | $ | 105 | | |
| 47 | % | | 53 | % | | 100 | % | | 55 | % | | 45 | % | | 100 | % | |
| Financial Institutions | Financial Institutions | $ | 67 | | | $ | 67 | | | $ | 134 | | | $ | 56 | | | $ | 64 | | | $ | 120 | | Financial Institutions | $ | 169 | | | $ | 143 | | | $ | 312 | | | $ | 136 | | | $ | 131 | | | $ | 267 | |
| | 50 | % | | 50 | % | | 100 | % | | 47 | % | | 53 | % | | 100 | % | | 54 | % | | 46 | % | | 100 | % | | 51 | % | | 49 | % | | 100 | % |
| Public, Project and Infrastructure Finance | Public, Project and Infrastructure Finance | $ | 92 | | | $ | 41 | | | $ | 133 | | | $ | 82 | | | $ | 38 | | | $ | 120 | | Public, Project and Infrastructure Finance | $ | 188 | | | $ | 85 | | | $ | 273 | | | $ | 165 | | | $ | 77 | | | $ | 242 | |
| | | 69 | % | | 31 | % | | 100 | % | | 68 | % | | 32 | % | | 100 | % |
| Structured Finance | | Structured Finance | $ | 158 | | | $ | 98 | | | $ | 256 | | | $ | 85 | | | $ | 92 | | | $ | 177 | |
| | 69 | % | | 31 | % | | 100 | % | | 68 | % | | 32 | % | | 100 | % | | 62 | % | | 38 | % | | 100 | % | | 48 | % | | 52 | % | | 100 | % |
| MIS Other | MIS Other | $ | 1 | | | $ | 8 | | | $ | 9 | | | $ | 0 | | | $ | 9 | | | $ | 9 | | MIS Other | $ | 2 | | | $ | 18 | | | $ | 20 | | | $ | 2 | | | $ | 19 | | | $ | 21 | |
| | 11 | % | | 89 | % | | 100 | % | | 0 | % | | 100 | % | | 100 | % | | 10 | % | | 90 | % | | 100 | % | | 10 | % | | 90 | % | | 100 | % |
| Total MIS | Total MIS | $ | 548 | | | $ | 277 | | | $ | 825 | | | $ | 478 | | | $ | 268 | | | $ | 746 | | Total MIS | $ | 1,431 | | | $ | 585 | | | $ | 2,016 | | | $ | 1,183 | | | $ | 549 | | | $ | 1,732 | |
| | 66 | % | | 34 | % | | 100 | % | | 64 | % | | 36 | % | | 100 | % | | 71 | % | | 29 | % | | 100 | % | | 68 | % | | 32 | % | | 100 | % |
| Research, data and analytics | Research, data and analytics | $ | 19 | | | $ | 367 | | | $ | 386 | | | $ | 3 | | | $ | 314 | | | $ | 317 | | Research, data and analytics | $ | 42 | | | $ | 812 | | | $ | 854 | | | $ | 34 | | | $ | 690 | | | $ | 724 | |
| | 5 | % | | 95 | % | | 100 | % | | 1 | % | | 99 | % | | 100 | % | | 5 | % | | 95 | % | | 100 | % | | 5 | % | | 95 | % | | 100 | % |
| Enterprise risk solutions | Enterprise risk solutions | $ | 32 | | | $ | 113 | | | $ | 145 | | | $ | 32 | | | $ | 102 | | | $ | 134 | | Enterprise risk solutions | $ | 39 | | | $ | 244 | | | $ | 283 | | | $ | 58 | | | $ | 211 | | | $ | 269 | |
| | 22 | % | | 78 | % | | 100 | % | | 24 | % | | 76 | % | | 100 | % | | 14 | % | | 86 | % | | 100 | % | | 22 | % | | 78 | % | | 100 | % |
Professional services(2) | $ | 0 | | | $ | 0 | | | $ | 0 | | | $ | 43 | | | $ | 0 | | | $ | 43 | | |
| 0 | % | | 0 | % | | 0 | % | | 100 | % | | 0 | % | | 100 | % | |
| Total MA | Total MA | $ | 51 | | | $ | 480 | | | $ | 531 | | | $ | 78 | | | $ | 416 | | | $ | 494 | | Total MA | $ | 81 | | (1) | $ | 1,056 | | | $ | 1,137 | | | $ | 92 | | | $ | 901 | | | $ | 993 | |
| | 10 | % | | 90 | % | | 100 | % | | 16 | % | | 84 | % | | 100 | % | | 7 | % | | 93 | % | | 100 | % | | 9 | % | | 91 | % | | 100 | % |
| Total Moody's Corporation | Total Moody's Corporation | $ | 599 | | | $ | 757 | | | $ | 1,356 | | | $ | 556 | | | $ | 684 | | | $ | 1,240 | | Total Moody's Corporation | $ | 1,512 | | | $ | 1,641 | | | $ | 3,153 | | | $ | 1,275 | | | $ | 1,450 | | | $ | 2,725 | |
| | 44 | % | | 56 | % | | 100 | % | | 45 | % | | 55 | % | | 100 | % | | 48 | % | | 52 | % | | 100 | % | | 47 | % | | 53 | % | | 100 | % |
|
| | | | | | | | | | | | | | | | | | | | | | | | | | | | | | | | | | | |
| Nine Months Ended September 30, |
| 2020 | | 2019 |
| Transaction | | Relationship | | Total | | Transaction | | Relationship | | Total |
| Corporate Finance | $ | 1,142 | | | $ | 344 | | | $ | 1,486 | | | $ | 808 | | | $ | 327 | | | $ | 1,135 | |
| 77 | % | | 23 | % | | 100 | % | | 71 | % | | 29 | % | | 100 | % |
| Structured Finance | $ | 126 | | | $ | 139 | | | $ | 265 | | | $ | 184 | | | $ | 134 | | | $ | 318 | |
| 48 | % | | 52 | % | | 100 | % | | 58 | % | | 42 | % | | 100 | % |
| Financial Institutions | $ | 203 | | | $ | 198 | | | $ | 401 | | | $ | 165 | | | $ | 196 | | | $ | 361 | |
| 51 | % | | 49 | % | | 100 | % | | 46 | % | | 54 | % | | 100 | % |
| Public, Project and Infrastructure Finance | $ | 257 | | | $ | 118 | | | $ | 375 | | | $ | 208 | | | $ | 113 | | | $ | 321 | |
| 69 | % | | 31 | % | | 100 | % | | 65 | % | | 35 | % | | 100 | % |
| MIS Other | $ | 3 | | | $ | 27 | | | $ | 30 | | | $ | 1 | | | $ | 19 | | | $ | 20 | |
| 10 | % | | 90 | % | | 100 | % | | 5 | % | | 95 | % | | 100 | % |
| Total MIS | $ | 1,731 | | | $ | 826 | | | $ | 2,557 | | | $ | 1,366 | | | $ | 789 | | | $ | 2,155 | |
| 68 | % | | 32 | % | | 100 | % | | 63 | % | | 37 | % | | 100 | % |
| Research, data and analytics | $ | 53 | | | $ | 1,057 | | | $ | 1,110 | | | $ | 12 | | | $ | 928 | | | $ | 940 | |
| 5 | % | | 95 | % | | 100 | % | | 1 | % | | 99 | % | | 100 | % |
| Enterprise risk solutions | $ | 90 | | | $ | 324 | | | $ | 414 | | | $ | 79 | | | $ | 294 | | | $ | 373 | |
| 22 | % | | 78 | % | | 100 | % | | 21 | % | | 79 | % | | 100 | % |
Professional services(2) | $ | 0 | | | $ | 0 | | | $ | 0 | | | $ | 128 | | | $ | 0 | | | $ | 128 | |
| 0 | % | | 0 | % | | 0 | % | | 100 | % | | 0 | % | | 100 | % |
| Total MA | $ | 143 | | (1) | $ | 1,381 | | | $ | 1,524 | | | $ | 219 | | (1) | $ | 1,222 | | | $ | 1,441 | |
| 9 | % | | 91 | % | | 100 | % | | 15 | % | | 85 | % | | 100 | % |
| Total Moody's Corporation | $ | 1,874 | | | $ | 2,207 | | | $ | 4,081 | | | $ | 1,585 | | | $ | 2,011 | | | $ | 3,596 | |
| 46 | % | | 54 | % | | 100 | % | | 44 | % | | 56 | % | | 100 | % |
(1) Revenue from software implementation services and risk management advisory projects, while classified by management as transactional revenue, is recognized over time under the Revenue Accounting Standard (please also refer to the following table).
The following table presents the timing of revenue recognition:
| | | Three Months Ended September 30, 2020 | | Nine Months Ended September 30, 2020 | | Three Months Ended June 30, 2021 | | Six Months Ended June 30, 2021 | |
| | MIS | | MA | | Total | | MIS | | MA | | Total | | MIS | | MA | | Total | | MIS | | MA | | Total | |
| Revenue recognized at a point in time | Revenue recognized at a point in time | $ | 548 | | | $ | 30 | | | $ | 578 | | | $ | 1,731 | | | $ | 89 | | | $ | 1,820 | | Revenue recognized at a point in time | $ | 686 | | | $ | 20 | | | $ | 706 | | | $ | 1,431 | | | $ | 49 | | | $ | 1,480 | | |
| Revenue recognized over time | Revenue recognized over time | 277 | | | 501 | | | 778 | | | 826 | | | 1,435 | | | 2,261 | | Revenue recognized over time | 294 | | | 553 | | | 847 | | | 585 | | | 1,088 | | | 1,673 | | |
| Total | Total | $ | 825 | | | $ | 531 | | | $ | 1,356 | | | $ | 2,557 | | | $ | 1,524 | | | $ | 4,081 | | Total | $ | 980 | | | $ | 573 | | | $ | 1,553 | | | $ | 2,016 | | | $ | 1,137 | | | $ | 3,153 | | |
| | | | | | | | | | | | | | | | | | | | | | | | | | | | | | | | | | | |
| Three Months Ended September 30, 2019 | | Nine Months Ended September 30, 2019 |
| MIS | | MA | | Total | | MIS | | MA | | Total |
| Revenue recognized at a point in time | $ | 478 | | | $ | 31 | | | $ | 509 | | | $ | 1,366 | | | $ | 83 | | | $ | 1,449 | |
| Revenue recognized over time | 268 | | | 463 | | | 731 | | | 789 | | | 1,358 | | | 2,147 | |
| Total | $ | 746 | | | $ | 494 | | | $ | 1,240 | | | $ | 2,155 | | | $ | 1,441 | | | $ | 3,596 | |
| | | | | | | | | | | | | | | | | | | | | | | | | | | | | | | | | | | |
| | | | | | | | | | | |
| Three Months Ended June 30, 2020 | | Six Months Ended June 30, 2020 |
| MIS | | MA | | Total | | MIS | | MA | | Total |
| Revenue recognized at a point in time | $ | 664 | | | $ | 20 | | | $ | 684 | | | $ | 1,183 | | | $ | 59 | | | $ | 1,242 | |
| Revenue recognized over time | 274 | | | 477 | | | 751 | | | 549 | | | 934 | | | 1,483 | |
| Total | $ | 938 | | | $ | 497 | | | $ | 1,435 | | | $ | 1,732 | | | $ | 993 | | | $ | 2,725 | |
Unbilled receivables, deferred revenue and remaining performance obligations
Unbilled receivables
At SeptemberJune 30, 20202021 and December 31, 2019,2020, accounts receivable, net included $404$429 million and $346$361 million, respectively, of unbilled receivables, net related to the MIS segment. Certain MIS arrangements contain contractual terms whereby the customers are billed in arrears for annual monitoring services, requiring revenue to be accrued as an unbilled receivable as such services are provided.
In addition, for certain MA arrangements, the timing of when the Company has the unconditional right to consideration and recognizes revenue occurs prior to invoicing the customer. Consequently, at SeptemberJune 30, 20202021 and December 31, 2019,2020, accounts receivable, net included $89$95 million and $53$98 million, respectively, of unbilled receivables, net related to the MA segment.
Deferred revenue
The Company recognizes deferred revenue when a contract requires a customer to pay consideration to the Company in advance of when revenue related to that contract is recognized. This deferred revenue is relieved when the Company satisfies the related performance obligation and revenue is recognized.
Significant changes in the deferred revenue balances during the three and ninesix months ended SeptemberJune 30, 2021 and 2020 are as follows:
| | | | | | | | | | | | | | | | | |
| Three Months Ended September 30, 2020 |
| MIS | | MA | | Total |
| Balance at June 30, 2020 | $ | 365 | | | $ | 740 | | | $ | 1,105 | |
| Changes in deferred revenue | | | | | |
| Revenue recognized that was included in the deferred revenue balance at the beginning of the period | (118) | | | (347) | | | (465) | |
| Increases due to amounts billable excluding amounts recognized as revenue during the period | 83 | | | 273 | | | 356 | |
| Effect of exchange rate changes | 5 | | | 19 | | | 24 | |
| Total changes in deferred revenue | (30) | | | (55) | | | (85) | |
| Balance at September 30, 2020 | $ | 335 | | | $ | 685 | | | $ | 1,020 | |
| | | | | |
| | | | | |
| | | | | | | | | | | | | | | | | |
| Nine Months Ended September 30, 2020 |
| MIS | | MA | | Total |
| Balance at January 1, 2020 | $ | 322 | | | $ | 840 | | | $ | 1,162 | |
| Changes in deferred revenue | | | | | |
| Revenue recognized that was included in the deferred revenue balance at the beginning of the period | (207) | | | (781) | | | (988) | |
| Increases due to amounts billable excluding amounts recognized as revenue during the period | 219 | | | 607 | | | 826 | |
| Increases due to RDC acquisition during the period | 0 | | | 20 | | | 20 | |
| Effect of exchange rate changes | 1 | | | (1) | | | 0 | |
| Total changes in deferred revenue | 13 | | | (155) | | | (142) | |
| Balance at September 30, 2020 | $ | 335 | | | $ | 685 | | | $ | 1,020 | |
| Deferred revenue - current | $ | 237 | | | $ | 681 | | | $ | 918 | |
| Deferred revenue - noncurrent | $ | 98 | | | $ | 4 | | | $ | 102 | |
| | | | | | | | | | | | | | | | | | | | | | | | | | | | | | | | | | | |
| Three Months Ended June 30, 2021 | | Three Months Ended June 30, 2020 |
| MIS | | MA | | Total | | MIS | | MA | | Total |
| Balance at March 31, | $ | 388 | | | $ | 940 | | | $ | 1,328 | | | $ | 379 | | | $ | 843 | | | $ | 1,222 | |
| Changes in deferred revenue | | | | | | | | | | | |
| Revenue recognized that was included in the deferred revenue balance at the beginning of the period | (119) | | | (338) | | | (457) | | | (115) | | | (341) | | | (456) | |
| Increases due to amounts billable excluding amounts recognized as revenue during the period | 98 | | | 262 | | | 360 | | | 100 | | | 234 | | | 334 | |
| | | | | | | | | | | |
| Effect of exchange rate changes | 1 | | | 3 | | | 4 | | | 1 | | | 4 | | | 5 | |
| Total changes in deferred revenue | (20) | | | (73) | | | (93) | | | (14) | | | (103) | | | (117) | |
| Balance at June 30, | $ | 368 | | | $ | 867 | | | $ | 1,235 | | | $ | 365 | | | $ | 740 | | | $ | 1,105 | |
| | | | | | | | | | | |
| | | Three Months Ended September 30, 2019 | | Six Months Ended June 30, 2021 | | Six Months Ended June 30, 2020 |
| | MIS | | MA | | Total | | MIS | | MA | | Total | | MIS | | MA | | Total |
| Balance at June 30, 2019 | $ | 376 | | | $ | 695 | | | $ | 1,071 | | |
| Balance at December 31, | | Balance at December 31, | $ | 313 | | | $ | 874 | | | $ | 1,187 | | | $ | 322 | | | $ | 840 | | | $ | 1,162 | |
| Changes in deferred revenue | Changes in deferred revenue | | | | |
| Changes in deferred revenue | | | | | | | | | | | |
| Revenue recognized that was included in the deferred revenue balance at the beginning of the period | Revenue recognized that was included in the deferred revenue balance at the beginning of the period | (111) | | | (344) | | | (455) | | Revenue recognized that was included in the deferred revenue balance at the beginning of the period | (162) | | | (565) | | | (727) | | | (167) | | | (578) | | (1) | (745) | |
| Increases due to amounts billable excluding amounts recognized as revenue during the period | Increases due to amounts billable excluding amounts recognized as revenue during the period | 82 | | | 290 | | | 372 | | Increases due to amounts billable excluding amounts recognized as revenue during the period | 219 | | | 555 | | | 774 | | | 213 | | | 478 | | (1) | 691 | |
| | Increases due to acquisitions during the period | | Increases due to acquisitions during the period | 0 | | | 4 | | | 4 | | | 0 | | | 20 | | | 20 | |
| Effect of exchange rate changes | Effect of exchange rate changes | (3) | | | (14) | | | (17) | | Effect of exchange rate changes | (2) | | | (1) | | | (3) | | | (3) | | | (20) | | | (23) | |
| Total changes in deferred revenue | Total changes in deferred revenue | (32) | | | (68) | | | (100) | | Total changes in deferred revenue | 55 | | | (7) | | | 48 | | | 43 | | | (100) | | | (57) | |
| Balance at September 30, 2019 | $ | 344 | | | $ | 627 | | | $ | 971 | | |
| | Balance at June 30, | | Balance at June 30, | $ | 368 | | | $ | 867 | | | $ | 1,235 | | | $ | 365 | | | $ | 740 | | | $ | 1,105 | |
| Deferred revenue - current | | Deferred revenue - current | $ | 279 | | | $ | 863 | | | $ | 1,142 | | | $ | 265 | | | $ | 736 | | | 1,001 | |
| Deferred revenue - noncurrent | | Deferred revenue - noncurrent | $ | 89 | | | $ | 4 | | | $ | 93 | | | $ | 100 | | | $ | 4 | | | 104 | |
| | | | | | | | | | | | | | | | | |
| Nine Months Ended September 30, 2019 |
| MIS | | MA | | Total |
| Balance at January 1, 2019 | $ | 326 | | | $ | 750 | | | $ | 1,076 | |
| Changes in deferred revenue | | | | |
|
| Revenue recognized that was included in the deferred revenue balance at the beginning of the period | (191) | | | (687) | | | (878) | |
| Increases due to amounts billable excluding amounts recognized as revenue during the period | 212 | | | 576 | | | 788 | |
| Amount included in liabilities reclassified as held for sale | 0 | | | (3) | | | (3) | |
| Effect of exchange rate changes | (3) | | | (9) | | | (12) | |
| Total changes in deferred revenue | 18 | | | (123) | | | (105) | |
| Balance at September 30, 2019 | $ | 344 | | | $ | 627 | | | $ | 971 | |
| Deferred revenue - current | $ | 234 | | | $ | 622 | | | 856 | |
| Deferred revenue - noncurrent | $ | 110 | | | $ | 5 | | | 115 | |
For the MIS segment, the changes in the deferred revenue balance during the three and ninesix months ended SeptemberJune 30, 2020 and 20192021 were primarily related to the significant portion of contract renewals that occuroccurred during the first quarter of each year2021 and are generally recognized over a one-yearone year period.
For the MA segment, the decrease in deferred revenue for the three months ended SeptemberJune 30, 2020 and 20192021 was primarily due to the recognition of annual subscription and maintenance billings from December 2020 and January of each year.2021. For the ninesix months ended SeptemberJune 30, 2020 and 2019,2021, the decrease in the deferred revenue balance is attributable to recognition of revenues related to the aforementioned December 2020 billings being partially offset by the impact of the high concentration of January 2021 billings.
Remaining performance obligations
Remaining performance obligations in the MIS segment largely reflect deferred revenue related to monitoring fees for certain structured finance products, primarily CMBS, where the issuers can elect to pay the monitoring fees for the life of the security in advance. As of SeptemberJune 30, 2020,2021, the aggregate amount of the transaction price allocated to remaining performance obligations was approximately $136$118 million. The Company expects to recognize into revenue approximately 20% of this balance within one year, approximately 50% of this balance between one to five years and the remaining amount thereafter. With respect to the remaining performance obligations for the MIS segment, the Company has applied a practical expedient set forth in ASC Topic 606 permitting the omission from the amounts stated above relating to unsatisfied performance obligations for contracts with an original expected length of one year or less.
Remaining performance obligations in the MA segment include both amounts recorded as deferred revenue on the balance sheet as of SeptemberJune 30, 20202021 as well as amounts not yet invoiced to customers as of SeptemberJune 30, 2020,2021, largely reflecting future revenue related to signed multi-year arrangements for hosted and installed subscription-based products. As of SeptemberJune 30, 2020,2021, the aggregate amount of the transaction price allocated to remaining performance obligations was approximately $1.8$2.2 billion. The Company expects to recognize into revenue approximately 60%65% of this balance within one year, approximately 25%20% of this balance between one to two years and the remaining amount thereafter.
NOTE 4. STOCK-BASED COMPENSATION
Presented below is a summary of the stock-based compensation cost and associated tax benefit included in the accompanying consolidated statements of operations:
| | | | | | | | | | | | | | | | | | | | | | | |
| Three Months Ended
September 30, | | Nine Months Ended
September 30, |
| 2020 | | 2019 | | 2020 | | 2019 |
| Stock-based compensation cost | $ | 38 | | | $ | 33 | | | $ | 110 | | | $ | 103 | |
| Tax benefit | $ | 8 | | | $ | 7 | | | $ | 22 | | | $ | 22 | |
| | | | | | | | | | | | | | | | | | | | | | | |
| Three Months Ended
June 30, | | Six Months Ended
June 30, |
| 2021 | | 2020 | | 2021 | | 2020 |
| Stock-based compensation cost | $ | 41 | | | $ | 35 | | | $ | 86 | | | $ | 72 | |
| Tax benefit | $ | 10 | | | $ | 7 | | | $ | 21 | | | $ | 14 | |
During the first ninesix months of 2020,2021, the Company granted 0.1 million employee stock options, which had a weighted average grant date fair value of $60.66$67.41 per share based on the Black-Scholes option-pricing model. The Company also granted 0.5 million shares of restricted stock in the first ninesix months of 2020,2021, which had a weighted average grant date fair value of $278.92$277.22 per share. Both the employee stock options and restricted stock generally vest ratably over four years. Additionally, the Company granted 0.1 million shares of performance-based awards whereby the number of shares that ultimately vest are based on the achievement of certain non-market-based performance metrics of the Company over three years. The weighted average grant date fair value of these awards was $273.81$268.85 per share.
The following weighted average assumptions were used in determining the fair value for options granted in 2020:
2021: | | | | | |
| Expected dividend yield | 0.80 0.89 | % |
| Expected stock volatility | 22.52 28 | % |
| Risk-free interest rate | 1.430.81 % |
| Expected holding period | 5.75.6 years |
Unrecognized stock-based compensation expense at SeptemberJune 30, 20202021 was $8$11 million and $192$230 million for stock options and unvested restricted stock, respectively, which is expected to be recognized over a weighted average period of 2.42.5 years and 2.52.6 years, respectively. Additionally, there was $34$39 million of unrecognized stock-based compensation expense relating to the aforementioned non-market-based performance-based awards, which is expected to be recognized over a weighted average period of 2.02.1 years.
The following tables summarize information relating to stock option exercises and restricted stock vesting:
| | | | | | | | | | | |
| Nine Months Ended
September 30, |
| 2020 | | 2019 |
| Exercise of stock options: | | | |
| Proceeds from stock option exercises | $ | 32 | | | $ | 29 | |
| Aggregate intrinsic value | $ | 102 | | | $ | 99 | |
| Tax benefit realized upon exercise | $ | 24 | | | $ | 24 | |
| Number of shares exercised | 0.5 | | | 0.7 | |
| Vesting of restricted stock: | | | |
| Fair value of shares vested | $ | 195 | | | $ | 153 | |
| Tax benefit realized upon vesting | $ | 45 | | | $ | 36 | |
| Number of shares vested | 0.8 | | | 0.8 | |
| Vesting of performance-based restricted stock: | | | |
| Fair value of shares vested | $ | 70 | | | $ | 48 | |
| Tax benefit realized upon vesting | $ | 17 | | | $ | 12 | |
| Number of shares vested | 0.3 | | | 0.3 | |
| | | | | | | | | | | |
| Six Months Ended
June 30, |
| 2021 | | 2020 |
| Exercise of stock options: | | | |
| Proceeds from stock option exercises | $ | 16 | | | $ | 23 | |
| Aggregate intrinsic value | $ | 35 | | | $ | 74 | |
| Tax benefit realized upon exercise | $ | 8 | | | $ | 18 | |
| Number of shares exercised | 0.2 | | | 0.4 | |
| Vesting of restricted stock: | | | |
| Fair value of shares vested | $ | 187 | | | $ | 193 | |
| Tax benefit realized upon vesting | $ | 43 | | | $ | 45 | |
| Number of shares vested | 0.7 | | | 0.8 | |
| Vesting of performance-based restricted stock: | | | |
| Fair value of shares vested | $ | 28 | | | $ | 70 | |
| Tax benefit realized upon vesting | $ | 7 | | | $ | 17 | |
| Number of shares vested | 0.1 | | | 0.3 | |
NOTE 5. INCOME TAXES
Moody’s ETReffective tax rate was 22.0%23.9% and 25.3%23.6% for the three months ended SeptemberJune 30, 20202021 and 2019,2020, respectively and 20.0% and 21.4%19.0% for the nineboth six months ended SeptemberJune 30, 2021 and 2020 and 2019, respectively. The decrease in the ETR for the three month period ended September 30, 2020 was primarily due to a tax benefit recognized from a corporate reorganization outside of the U.S. in the third quarter of 2020 and a detriment from a non-U.S. tax rate change in the third quarter of 2019 which did not recur to the same extent in 2020.periods. The Company’s year to date tax expense differs from the tax computed by applying its estimated annual effective tax rate to the year to dateyear-to-date pre-tax earnings primarily due to Excess Tax Benefits from stock compensation of $52$26 million and net reductions in UTPs of $61 million related to tax positionsa settlement and a lapse of $43 million.a statute of limitations.
The Company classifies interest related to UTPs in interest expense, net in its consolidated statements of operations. Penalties, if incurred, would be recognized in other non-operating (expense) income, net. The Company had an increase in its UTPs of $17$4 million ($164 million net of federal tax) during the thirdsecond quarter of 20202021 and a net decrease in its UTPs during the first nine months of 2020 of $6$76 million ($767 million, net of federal tax). during the first six months of 2021, which primarily related to the aforementioned resolution of uncertain tax positions. The Company also reversed $40 million in accrued interest in connection with these matters in the first quarter of 2021.
Moody’s Corporation and subsidiaries are subject to U.S. federal income tax as well as income tax in various state, local and foreign jurisdictions. The Company’s U.S. federal income tax return for 2019 remains open to examination and 2017 and 2018 are currently under examination. The Company’s New York State tax returns for 2011 through 2016 are currently under examination and the Company’s New York City tax return for 2014 through 2017 are currently under examination. The Company’s U.K. tax return for 2012 is currently under examination and its returns for 2013 through 20182019 remain open to examination.
For ongoing audits, it is possible the balance of UTPs could decrease in the next twelve months as a result of the settlement of these audits, which might involve the payment of additional taxes, the adjustment of certain deferred taxes and/or the recognition of tax benefits. It is also possible that new issues might be raised by tax authorities which could necessitate increases to the balance of UTPs. As the Company is unable to predict the timing or outcome of these audits, it is therefore unable to estimate the amount of changes to the balance of UTPs at this time. However, the Company believes that it has adequately provided for its financial exposure relating to all open tax years by tax jurisdiction in accordance with the applicable provisions of Topic 740 of the ASC regarding UTPs.
The following table shows the amount the Company paid for income taxes:
| | | | | | | | | | | |
| Nine Months Ended September 30, |
| 2020 | | 2019 |
| Income taxes paid | $ | 374 | | | $ | 303 | |
| | | | | | | | | | | |
| Six Months Ended June 30, |
| 2021 | | 2020 |
| Income taxes paid | $ | 327 | | | $ | 111 | |
NOTE 6. WEIGHTED AVERAGE SHARES OUTSTANDING
Below is a reconciliation of basic to diluted shares outstanding:
| | | | | | | | | | | | | | | | | | | | | | | |
| Three Months Ended
September 30, | | Nine Months Ended September 30, |
| |
| 2020 | | 2019 | | 2020 | | 2019 |
| Basic | 187.8 | | | 189.0 | | | 187.6 | | | 189.6 | |
| Dilutive effect of shares issuable under stock-based compensation plans | 1.5 | | | 2.1 | | | 1.7 | | | 2.2 | |
| Diluted | 189.3 | | | 191.1 | | | 189.3 | | | 191.8 | |
| Anti-dilutive options to purchase common shares and restricted stock as well as contingently issuable restricted stock which are excluded from the table above | 0.3 | | | 0.2 | | | 0.3 | | | 0.3 | |
| | | | | | | | | | | | | | | | | | | | | | | |
| Three Months Ended June 30, | | Six Months Ended June 30, |
| |
| 2021 | | 2020 | | 2021 | | 2020 |
| Basic | 186.7 | | | 187.7 | | | 187.0 | | | 187.6 | |
| Dilutive effect of shares issuable under stock-based compensation plans | 1.2 | | | 1.3 | | | 1.2 | | | 1.7 | |
| Diluted | 187.9 | | | 189.0 | | | 188.2 | | | 189.3 | |
| Anti-dilutive options to purchase common shares and restricted stock as well as contingently issuable restricted stock which are excluded from the table above | 0.2 | | | 0.3 | | | 0.3 | | | 0.3 | |
The calculation of diluted EPS requires certain assumptions regarding the use of both cash proceeds and assumed proceeds that would be received upon the exercise of stock options and vesting of restricted stock outstanding as of SeptemberJune 30, 20202021 and 2019.2020.
NOTE 7. ACCELERATED SHARE REPURCHASE PROGRAM
On February 20, 2019, the Company entered into an ASR agreement with a financial institution counterparty to repurchase $500 million of its outstanding common stock. The Company paid $500 million to the counterparty and received an initial delivery of 2.2 million shares of its common stock. Final settlement of the ASR agreement was completed on April 26, 2019 and the Company received delivery of an additional 0.6 million shares of the Company’s common stock.
In total, the Company repurchased 2.8 million shares of the Company’s common stock during the term of the ASR Agreement, based on the volume-weighted average price (net of discount) of $180.33 per share over the duration of the program. The initial share repurchase and final share settlement were recorded as a reduction to shareholders’ equity.
NOTE 8.7. CASH EQUIVALENTS AND INVESTMENTS
The table below provides additional information on the Company’s cash equivalents and investments: | | | | | | | | | | | | | | | | | | | | | | | | | | | | | | | | | | | |
| As of June 30, 2021 |
| | | | | | | Balance sheet location |
| Cost | | Gains/(Losses) | | Fair Value | | Cash and cash equivalents | | Short-term
investments | | Other
assets |
Certificates of deposit and money market deposit accounts (1) | $ | 1,481 | | | $ | 0 | | | $ | 1,481 | | | $ | 1,370 | | | $ | 88 | | | $ | 23 | |
| Mutual funds | $ | 53 | | | $ | 7 | | | $ | 60 | | | $ | 0 | | | $ | 0 | | | $ | 60 | |
| | | | | | | | | | | |
| | | | | | | | | | | | | | | | | | | | | | | | | | | | | | | | | | | |
| As of September 30, 2020 |
| | | | | | | Balance sheet location |
| Cost | | Gains/(Losses) | | Fair Value | | Cash and cash equivalents | | Short-term investments | | Other assets |
Certificates of deposit and money market deposit accounts (1) | $ | 1,387 | | | $ | 0 | | | $ | 1,387 | | | $ | 1,284 | | | $ | 96 | | | $ | 7 | |
| Mutual funds | $ | 47 | | | $ | 3 | | | $ | 50 | | | $ | 0 | | | $ | 0 | | | $ | 50 | |
| | | | | | | | | | | |
| | | As of December 31, 2019 | | As of December 31, 2020 |
| | | Balance sheet location | | | Balance sheet location |
| |
Cost | | Gains/(Losses) | |
Fair Value | | Cash and cash equivalents | | Short-term investments | | Other assets | |
Cost | | Gains/(Losses) | |
Fair Value | | Cash and cash
equivalents | | Short-term
investments | | Other
assets |
| Certificates of deposit and money market deposit accounts (1) | Certificates of deposit and money market deposit accounts (1) | $ | 971 | | | $ | 0 | | | $ | 971 | | | $ | 866 | | | $ | 95 | | | $ | 10 | | Certificates of deposit and money market deposit accounts (1) | $ | 1,430 | | | $ | 0 | | | $ | 1,430 | | | $ | 1,325 | | | $ | 99 | | | $ | 6 | |
| Mutual funds | Mutual funds | $ | 3 | | | $ | 0 | | | $ | 3 | | | $ | 0 | | | $ | 3 | | | $ | 0 | | Mutual funds | $ | 54 | | | $ | 6 | | | $ | 60 | | | $ | 0 | | | $ | 0 | | | $ | 60 | |
(1) Consists of time deposits and money market deposit accounts. The remaining contractual maturities for the certificates of deposits classified as short-term investments were one month to 12 months at both SeptemberJune 30, 20202021 and December 31, 2019.2020. The remaining contractual maturities for the certificates of deposits classified in other assets are 13 months to 2223 months at Septemberboth June 30, 20202021 and 13 months to 18 months at December 31, 2019.2020. Time deposits with a maturity of less than 90 days at time of purchase are classified as cash and cash equivalents.
In addition, the Company invested in Corporate-Owned Life Insurance (COLI) in the first quarter of 2020. As of SeptemberJune 30, 2021 and December 31, 2020, the contract value of the COLI was $14 million.$36 million and $17 million, respectively.
NOTE 9.8. ACQUISITIONS AND OTHER STRATEGIC INITIATIVES
The business combinations described below are accounted for using the acquisition method of accounting whereby assets acquired and liabilities assumed were recognized at fair value on the date of the transaction. Any excess of the purchase price over the fair value of the assets acquired and liabilities assumed was recorded to goodwill. Goodwill typically results through expected synergies from combining operations of an acquiree and an acquirer, anticipated new customer acquisition and products, as well as from intangible assets that do not qualify for separate recognition.
Cortera
On March 19, 2021, the Company acquired 100% of Cortera, a provider of North American credit data and workflow solutions.
The table below details the total consideration relating to the acquisition: | | | | | | | | |
| Cash paid at closing | | $ | 138 | |
Additional consideration paid to sellers in 2021 (1) | | 1 | |
| Total consideration | | $ | 139 | |
(1) Represents additional consideration paid to the sellers following finalization of customary post-closing completion adjustments.
Shown below is the preliminary purchase price allocation, which summarizes the fair value of the assets and liabilities assumed, at the date of acquisition: | | | | | | | | | | | |
| Current assets | | | $ | 7 | |
| Intangible assets: | | | |
| Database (10 year useful life) | $ | 38 | | | |
| Customer relationships (18 year useful life) | 9 | | | |
| Product technology (8 year useful life) | 9 | | | |
| Trade name (5 year useful life) | 1 | | | |
| Total intangible assets (11 year weighted average useful life) | | | 57 | |
| Goodwill | | | 95 | |
| Other assets | | | 2 | |
| Liabilities: | | | |
| Accounts payable and accrued liabilities | $ | (1) | | | |
| Deferred revenue | (4) | | | |
| Deferred tax liabilities | (15) | | | |
| Other liabilities | (2) | | | |
| Total liabilities | | | (22) | |
| Net assets acquired | | | $ | 139 | |
The Company has performed a preliminary valuation analysis of the fair market value of assets and liabilities of the Cortera business. The final purchase price allocation will be determined when the Company has completed and fully reviewed the detailed valuations. The final allocation could differ materially from the preliminary allocation. The final allocation may include changes in allocations to acquired intangible assets as well as goodwill and other changes to assets and liabilities including reserves for UTPs and deferred tax liabilities. The estimated useful lives of acquired intangibles assets are also preliminary.
Current assets in the table above include acquired cash of $4 million and accounts receivable of approximately $2 million.
Goodwill
The goodwill recognized as a result of this acquisition includes, among other things, the value of combining the complementary risk assessment products of the Company and Cortera, which is expected to extend the Company’s reach to new and evolving market segments as well as cost savings synergies, expected new customer acquisitions and products.
Goodwill, which has been assigned to the MA segment, is not deductible for tax purposes.
Transaction costs
Transaction costs directly related to the Cortera acquisition were not material.
RDC
On February 13, 2020, the Company acquired 100% of RDC, a provider of anti-money laundering and know-your-customer data and due diligence services.
The table below details the total consideration relating to the acquisition:
| | | | | | | | |
| Cash paid at closing | | $ | 700 | |
Additional consideration paid to sellers in 2020 (1) | | 2 | |
| Total consideration | | $ | 702 | |
(1) Represents additional consideration paid to the sellers following finalization of customary post-closing completion adjustments.
Shown below is the preliminary purchase price allocation, which summarizes the fair value of the assets and liabilities assumed, at the date of acquisition:
| | | | | | | | | | | |
(Amounts in millions) | | | |
| Current assets | | | $ | 24 | |
| Intangible assets: | | | |
Customer relationships (25 year weighted averageuseful life) | $ | 174 | | | |
Database (10 year weighted averageuseful life) | 86 | | | |
Product technology (4 year weighted averageuseful life) | 17 | | | |
Trade name (3 year weighted averageuseful life) | 3 | | | |
| Total intangible assets (19 year weighted average life) | | | 280 | |
| Goodwill | | | 494 | |
| Other assets | | | 2 | |
| Liabilities: | | | |
| Accounts payable and accrued liabilities | $ | (5) | | | |
| Deferred revenue | (20) | | | |
| Deferred tax liabilities | (71) | | | |
| Other liabilities | (2) | | | |
| Total liabilities | | | (98) | |
| Net assets acquired | | | $ | 702 | |
The Company has performed a preliminary valuation analysis of the fair market value of assets and liabilities of the RDC business. The final purchase price allocation will be determined when the Company has completed and fully reviewed the detailed valuations. The final allocation could differ materially from the preliminary allocation. The final allocation may include changes in allocations to acquired intangible assets as well as goodwill and other changes to assets and liabilities including reserves for UTPs and deferred tax liabilities. The estimated useful lives of acquired intangibles assets are also preliminary.
Current assets in the table above include acquired cash of $6 million. Additionally, current assets includemillion and accounts receivable of approximately $14 million.
Goodwill
The goodwill recognized as a result of this acquisition includes, among other things, the value of combining the complementary product portfolios of the Company and RDC, which is expected to extend the Company’s reach to new and evolving market segments as well as cost savings synergies, expected new customer acquisitions and products.
Goodwill, which has been assigned to the MA segment, is not deductible for tax purposes.
RDC is a component of the Bureau van Dijk reporting unit for purposes of the Company’s annual goodwill impairment assessment.
Transaction costs
Transaction costs directly related to the RDC acquisition were not material.
Other Acquisitions and Strategic Initiatives
During the second quarter of 2020, the Company increased its stake in Vigeo Eiris, a provider of ESG research, data and assessments, from 69.2% to 99.8%. The purchase price for the additional stake was not material. Vigeo Eiris revenue is reported in the MIS Other LOB.
NOTE 10.9. DERIVATIVE INSTRUMENTS AND HEDGING ACTIVITIES
The Company is exposed to global market risks, including risks from changes in FX rates and changes in interest rates. Accordingly, the Company uses derivatives in certain instances to manage the aforementioned financial exposures that occur in the normal course of business. The Company does not hold or issue derivatives for speculative purposes.
Derivatives and non-derivative instruments designated as accounting hedges:
Fair Value Hedges
Interest Rate Swaps
The Company has entered into interest rate swaps to convert the fixed interest rate on certain of its long-term debt to a floating interest rate based on the 3-month LIBOR and 6-month LIBOR. The purpose of these hedges is to mitigate the risk associated with changes in the fair value of the long-term debt, thus the Company has designated these swaps as fair value hedges. The fair value of the swaps is adjusted quarterly with a corresponding adjustment to the carrying value of the debt. The changes in the fair value of the swaps and the underlying hedged item generally offset and the net cash settlements on the swaps are recorded each period within interest expense, net in the Company’s consolidated statementstatements of operations.
The following table summarizes the Company’s interest rate swaps designated as fair value hedges: | | | | | | | | | | | | | | | | | | | | | | | | | | |
| | | | Notional Amount | | |
| Hedged Item | | Nature of Swap | | As of June 30,
2021 | | As of December 31,
2020 | | Floating Interest Rate |
| 2012 Senior Notes due 2022 | | Pay Floating/Receive Fixed | | $ | 330 | | | $ | 330 | | | 3-month USD LIBOR |
| 2017 Senior Notes due 2023 | | Pay Floating/Receive Fixed | | $ | 250 | | | $ | 250 | | | 3-month USD LIBOR |
| 2017 Senior Notes due 2028 | | Pay Floating/Receive Fixed | | $ | 500 | | | $ | 500 | | | 3-month USD LIBOR |
| 2020 Senior Notes due 2025 | | Pay Floating/Receive Fixed | | $ | 300 | | | $ | 300 | | | 6-month USD LIBOR |
| Total | | | | $ | 1,380 | | | $ | 1,380 | | | |
| | | | | | | | | | | | | | | | | | | | | | | | | | |
| | | | Notional Amount | | |
| Hedged Item | | Nature of Swap | | As of September 30,
2020 | | As of December 31,
2019 | | Floating Interest Rate |
| 2012 Senior Notes due 2022 | | Pay Floating/Receive Fixed | | $ | 330 | | | $ | 330 | | | 3-month USD LIBOR |
2017 Senior Notes due 2021(1) | | Pay Floating/Receive Fixed | | $ | 0 | | | $ | 500 | | | 3-month USD LIBOR |
| 2017 Senior Notes due 2023 | | Pay Floating/Receive Fixed | | $ | 250 | | | $ | 250 | | | 3-month USD LIBOR |
| 2017 Senior Notes due 2028 | | Pay Floating/Receive Fixed | | $ | 500 | | | $ | 0 | | | 3-month USD LIBOR |
2020 Senior Notes due 2025 (2) | | Pay Floating/Receive Fixed | | $ | 300 | | | $ | 0 | | | 6-month USD LIBOR |
| Total | | | | $ | 1,380 | | | $ | 1,080 | | | |
(2) These interest rate swaps were executed in the third quarter of 2020.
Refer to Note 1716 for information on the cumulative amount of fair value hedging adjustments included in the carrying amount of the above hedged items.
The following table summarizes the impact to the statementstatements of operations of the Company’s interest rate swaps designated as fair value hedges:
| | | | | | | | | | | | | | | | | | | | | | | | | | | | | | | | |
| Total amounts of financial statement line item presented in the statements of operations in which the effects of fair value hedges are recorded | | Amount of income/(loss) recognized in the consolidated statements of operations |
| Three Months Ended September 30, | | Nine Months Ended
September 30, |
| 2020 | | 2019 | | 2020 | | 2019 |
| Interest expense, net | | $ | (53) | | | $ | (46) | | | $ | (153) | | | $ | (149) | |
| | | | | | | | | | |
Descriptions | | Location on Consolidated Statements of Operations | | | | | | | | |
| Net interest settlements and accruals on interest rate swaps | |
Interest expense, net | | $ | 6 | | | $ | 1 | | | $ | 14 | | | $ | 1 | |
| Fair value changes on interest rate swaps | | Interest expense, net | | $ | (7) | | | $ | 2 | | | $ | 53 | | | $ | 33 | |
| Fair value changes on hedged debt | | Interest expense, net | | $ | 7 | | | $ | (2) | | | $ | (53) | | | $ | (33) | |
| | | | | | | | | | | | | | | | | | | | | | | | | | | | | | | | |
| Total amounts of financial statement line item presented in the statements of operations in which the effects of fair value hedges are recorded | | Amount of income/(loss) recognized in the consolidated statements of operations |
| Three Months Ended June 30, | | Six Months Ended June 30, |
| 2021 | | 2020 | | 2021 | | 2020 |
| Interest expense, net | | $ | (49) | | | $ | (60) | | | $ | (56) | | | $ | (100) | |
| | | | | | | | | | |
Descriptions | | Location on Consolidated Statements of Operations | | | | | | | | |
| Net interest settlements and accruals on interest rate swaps | | Interest expense, net | | $ | 6 | | | $ | 5 | | | $ | 11 | | | $ | 8 | |
| Fair value changes on interest rate swaps | | Interest expense, net | | $ | 0 | | | $ | 2 | | | $ | (24) | | | $ | 60 | |
| Fair value changes on hedged debt | | Interest expense, net | | $ | 0 | | | $ | (2) | | | $ | 24 | | | $ | (60) | |
NetDebt designated as net investment hedges
The Company has designated €500 million of the 2015 Senior Notes Due 2027 and €750 million of the 2019 Senior Notes due 2030 as net investment hedges to mitigate FX exposure related to a portion of the Company’s euro net investment in certain foreign subsidiaries against changes in euro/USD exchange rates. These hedges are designated as accounting hedges under the applicable sections of ASC Topic 815 and will end upon the repayment of the notes in 2027 and 2030, respectively, unless terminated early at the discretion of the Company.
Cross currency swaps designated as net investment hedges
The Company enters into cross-currency swaps to mitigate FX exposure related to a portion of the Company’s euro net investment in certain foreign subsidiaries against changes in euro/USD exchange rates. The following table provides information on the cross-currency swaps designated as net investment hedges under ASC Topic 815: | | | | | | | | | | | | | | | | | | | | | | | | | | |
| June 30, 2021 |
| | Pay | | Receive |
| Nature of Swap | | Notional Amount | | Weighted Average Interest Rate | | Notional Amount | | Weighted Average Interest Rate |
| Pay Fixed/Receive Fixed | | € | 1,060 | | | 2.15% | | $ | 1,220 | | | 4.45% |
| Pay Floating/Receive Floating | | 959 | | | Based on 3-month EURIBOR | | 1,080 | | | Based on 3-month USD LIBOR |
| Total | | € | 2,019 | | | | | $ | 2,300 | | | |
| | September 30, 2020 | |
| December 31, 2020 | | December 31, 2020 |
| | Pay | | Receive | | Pay | | Receive |
| Nature of Swap | Nature of Swap | | Notional Amount | | Weighted Average Interest Rate | | Notional Amount | | Weighted Average Interest Rate | Nature of Swap | | Notional Amount | | Weighted Average Interest Rate | | Notional Amount | | Weighted Average Interest Rate |
| Pay Fixed/Receive Fixed | Pay Fixed/Receive Fixed | | € | 1,079 | | | 1.43% | | $ | 1,220 | | | 3.96% | Pay Fixed/Receive Fixed | | € | 1,079 | | | 1.43% | | $ | 1,220 | | | 3.96% |
| Pay Floating/Receive Floating | Pay Floating/Receive Floating | | 959 | | | Based on 3-month EURIBOR | | 1,080 | | | Based on 3-month USD LIBOR | Pay Floating/Receive Floating | | 959 | | | Based on 3-month EURIBOR | | 1,080 | | | Based on 3-month USD LIBOR |
| Total | Total | | € | 2,038 | | | $ | 2,300 | | | Total | | € | 2,038 | | | $ | 2,300 | | |
| | | | | | | | | | | | | | | | | | | | | | | | | | |
| December 31, 2019 |
| | Pay | | Receive |
| Nature of Swap | | Notional Amount | | Weighted Average Interest Rate | | Notional Amount | | Weighted Average Interest Rate |
| Pay Fixed/Receive Fixed | | € | 1,079 | | | 1.43% | | $ | 1,220 | | | 3.96% |
| Pay Floating/Receive Floating | | 931 | | | Based on 3-month EURIBOR | | 1,080 | | | Based on 3-month USD LIBOR |
| Total | | € | 2,010 | | | | | $ | 2,300 | | | |
As of
SeptemberJune 30,
2020,2021 these hedges will expire and
the notional amounts will be settled
in 2021, 2022, 2023, 2024, and 2026 for €265 million, €438 million, €442 million, €443 million, and €450 million of the total notional amount, respectively,as follows unless terminated early at the discretion of the
Company.Company: | | | | | | | | |
| Years Ending December 31, | | |
| 2021 (After June 30,) | | € | 0 | |
| 2022 | | € | 438 | |
| 2023 | | € | 442 | |
| 2024 | | € | 443 | |
| 2026 | | € | 450 | |
| 2027 | | € | 246 | |
| Total | | € | 2,019 | |
During the third quarter of 2020, the Company early-terminated €422.5 million notional value of cross-currency swaps (set to expire in 2021), resulting in immaterial cash proceeds.
Forward contracts designated as net investment hedges
The Company also enters into forward contracts to mitigate FX exposure related to a portion of the Company’s euro net investment in certain foreign subsidiaries against changes in euro/USD and GBP/euro exchange rates. The following table summarizes the notional amounts of the Company's outstanding forward contractcontracts that waswere designated as a net investment hedge:hedges: | | | | | | | | | | | | | | | | | | | | | | | | | | | | | | | | |
| Notional amount of net investment hedges | | June 30, 2021 | | December 31, 2020 | | | | | | |
| Sell | | Buy | | Sell | | Buy | | | | | | |
| Contract to sell EUR for USD | | € | 597 | | | $ | 728 | | | € | 524 | | | $ | 627 | | | | | | | |
| Contract to sell GBP for EUR | | £ | 134 | | | € | 155 | | | £ | 134 | | | € | 148 | | | | | | | |
| | | | | | | | | | | | | | | | | | | | | | | | | | | | |
| | September 30, 2020 | | December 31, 2019 | | |
| Notional amount of net investment hedges | | Sell | | Buy | | Sell | | Buy | | |
| Contract to sell EUR for USD | | € | 247 | | | $ | 292 | | | — | | | — | | | |
ThisThese forward contractcontracts will expire in November 2020.August 2021.
Cash Flow HedgeHedges
Interest Rate Forward Contracts
In January 2020, the Company entered into $300 million notional amount treasury rate locks with an average locked-in U.S. 30-year Treasury rate of 2.0103%, which were designated as cash flow hedges and used to manage the Company’s interest rate risk during the period prior to an anticipated issuance of 30-year debt. The treasury lock interest rate forward contracts matured on April 30, 2020, resulting in a cumulative loss of $68 million, which was recognized in AOCL. The loss on the Treasury rate lock will be reclassified from AOCL to earnings in the same period that the hedged transaction (i.e. interest payments on the 3.25% 2020 Senior Notes, due 2050) impacts earnings.
The following tablestable provide information on the gains/(losses) on the Company’s net investment and cash flow hedges:
| | | | | | | | | | | | | | | | | | | | | | | | | | | | | | | | | | | | | | |
| Derivative and Non-Derivative Instruments in Net Investment Hedging Relationships | | Amount of Gain/(Loss) Recognized in AOCL on Derivative, net of Tax | | Amount of Gain/(Loss) Reclassified from AOCL into Income, net of Tax | | Gain/(Loss) Recognized in Income on Derivative (Amount Excluded from Effectiveness Testing) |
| Three Months Ended
September 30, | | Three Months Ended
September 30, | | Three Months Ended
September 30, |
| | 2020 | | 2019 | | 2020 | | 2019 | | 2020 | | 2019 |
| FX forward contracts | | $ | 1 | | | $ | 5 | | | $ | 0 | | | $ | 1 | | | $ | 0 | | | $ | 0 | |
| Cross currency swaps | | (98) | | | 79 | | | 0 | | | 0 | | | 10 | | | 15 | |
| Long-term debt | | (46) | | | 18 | | | 0 | | | 0 | | | 0 | | | 0 | |
| Total net investment hedges | | $ | (143) | | | $ | 102 | | | $ | 0 | | | $ | 1 | | | $ | 10 | | | $ | 15 | |
| Derivatives in Cash Flow Hedging Relationships | | | | | | | | | | | | |
| | | | | | | | | | | | |
| Interest rate contracts | | (1) | | | 0 | | | (1) | | | 0 | | | 0 | | | 0 | |
| Total cash flow hedges | | $ | (1) | | | $ | 0 | | | $ | (1) | | | $ | 0 | | | $ | 0 | | | $ | 0 | |
| Total | | $ | (144) | | | $ | 102 | | | $ | (1) | | | $ | 1 | | | $ | 10 | | | $ | 15 | |
| | | | | | | | | | | | |
| | | | | | | | | | | | |
| | | | | | | | | | | | | | | | | | | | | | | | | | | | | | | | | | | | | | |
| Derivative and Non-Derivative Instruments in Net Investment Hedging Relationships | | Amount of Gain/(Loss) Recognized in AOCL on Derivative, net of Tax | | Amount of Gain/(Loss) Reclassified from AOCL into Income, net of Tax | | Gain/(Loss) Recognized in Income on Derivative (Amount Excluded from Effectiveness Testing) |
| Three Months Ended
June 30, | | Three Months Ended
June 30, | | Three Months Ended
June 30, |
| | 2021 | | 2020 | | 2021 | | 2020 | | 2021 | | 2020 |
| FX forward contracts | | $ | 0 | | | $ | 0 | | | $ | 0 | | | $ | 0 | | | $ | 0 | | | $ | 0 | |
| Cross currency swaps | | (18) | | | (49) | | | 0 | | | 0 | | | 9 | | | 14 | |
| Long-term debt | | (10) | | | (24) | | | 0 | | | 0 | | | 0 | | | 0 | |
| Total net investment hedges | | $ | (28) | | | $ | (73) | | | $ | 0 | | | $ | 0 | | | $ | 9 | | | $ | 14 | |
| Derivatives in Cash Flow Hedging Relationships | | | | | | | | | | | | |
| | | | | | | | | | | | |
| Interest rate contracts | | 0 | | | (14) | | | 0 | | | 0 | | | 0 | | | 0 | |
| | | | | | | | | | | | |
| Total cash flow hedges | | 0 | | | (14) | | | 0 | | | 0 | | | 0 | | | 0 | |
| Total | | $ | (28) | | | $ | (87) | | | $ | 0 | | | $ | 0 | | | $ | 9 | | | $ | 14 | |
| | | | | | | | | | | | | | | | | | | | | | | | | | | | | | | | | | | | | | |
| Derivative and Non-Derivative Instruments in Net Investment Hedging Relationships | | Amount of Gain/(Loss) Recognized in AOCL on Derivative, net of Tax | | Amount of Gain/(Loss) Reclassified from AOCL into Income, net of Tax | | Gain/(Loss) Recognized in Income on Derivative (Amount Excluded from Effectiveness Testing) |
| Nine Months Ended
September 30, | | Nine Months Ended
September 30, | | Nine Months Ended
September 30, |
| | 2020 | | 2019 | | 2020 | | 2019 | | 2020 | | 2019 |
| FX forward contracts | | $ | 1 | | | $ | 5 | | | $ | 0 | | | $ | 1 | | | $ | 0 | | | $ | 0 | |
| Cross currency swaps | | (81) | | | 75 | | | 0 | | | 0 | | | 40 | | | 37 | |
| Long-term debt | | (47) | |
| 17 | | | 0 | | | 0 | | | 0 | | | 0 | |
| Total net investment hedges | | $ | (127) | | | $ | 97 | | | $ | 0 | | | $ | 1 | | | $ | 40 | | | $ | 37 | |
| Derivatives in Cash Flow Hedging Relationships | | | | | | | | | | | | |
| | | | | | | | | | | | |
| Interest rate contracts | | (51) | | | 0 | | | (2) | | | 0 | | | 0 | | | 0 | |
| Total cash flow hedges | | $ | (51) | | | $ | 0 | | | $ | (2) | | | $ | 0 | | | $ | 0 | | | $ | 0 | |
| Total | | $ | (178) | | | $ | 97 | | | $ | (2) | | | $ | 1 | | | $ | 40 | | | $ | 37 | |
| | | | | | | | | | | | | | | | | | | | | | | | | | | | | | | | | | | | | | |
| Derivative and Non-Derivative Instruments in Net Investment Hedging Relationships | | Amount of Gain/(Loss) Recognized in AOCL on Derivative, net of Tax | | Amount of Gain/(Loss) Reclassified from AOCL into Income, net of Tax | | Gain/(Loss) Recognized in Income on Derivative (Amount Excluded from Effectiveness Testing) |
| Six Months Ended June 30, | | Six Months Ended June 30, | | Six Months Ended June 30, |
| | 2021 | | 2020 | | 2021 | | 2020 | | 2021 | | 2020 |
| FX forward contracts | | $ | 16 | | | $ | 0 | | | $ | 1 | | | $ | 0 | | | $ | 0 | | | $ | 0 | |
| Cross currency swaps | | 54 | | | 17 | | | 0 | | | 0 | | | 19 | | | 30 | |
| Long-term debt | | 35 | | | (1) | | | 0 | | | 0 | | | 0 | | | 0 | |
| Total net investment hedges | | $ | 105 | | | $ | 16 | | | $ | 1 | | | $ | 0 | | | $ | 19 | | | $ | 30 | |
| Derivatives in Cash Flow Hedging Relationships | | | | | | | | | | | | |
| | | | | | | | | | | | |
| Interest rate contracts | | 0 | | | (50) | | | (1) | | | (1) | | | 0 | | | 0 | |
| | | | | | | | | | | | |
| Total cash flow hedges | | 0 | | | (50) | | | (1) | | | (1) | | | 0 | | | 0 | |
| Total | | $ | 105 | | | $ | (34) | | | $ | 0 | | | $ | (1) | | | $ | 19 | | | $ | 30 | |
The cumulative amount of net investment hedge and cash flow hedge gains (losses) remaining in AOCL is as follows:
| | | | | | | | | | | |
| Cumulative Gains/(Losses), net of tax |
| June 30, 2021 | | December 31, 2020 |
| Net investment hedges | | | |
| Cross currency swaps | $ | (70) | | | $ | (124) | |
| FX forwards | 27 | | | 12 | |
| Long-term debt | (73) | | | (108) | |
| Total net investment hedges | $ | (116) | | | $ | (220) | |
| Cash flow hedges | | | |
| Interest rate contracts | $ | (50) | | | $ | (51) | |
| Cross currency swaps | 2 | | | 2 | |
| Total cash flow hedges | (48) | | | (49) | |
| Total net loss in AOCL | $ | (164) | | | $ | (269) | |
| | | | | | | | | | | |
| Cumulative Gains/(Losses), net of tax |
| September 30, 2020 | | December 31, 2019 |
| Net investment hedges | | | |
| Cross currency swaps | $ | (40) | | | $ | 41 | |
| FX forwards | 27 | | | 26 | |
| Long-term debt | (60) | | | (13) | |
| Total net investment hedges | $ | (73) | | | $ | 54 | |
| Cash flow hedges | | | |
| Interest rate contracts | $ | (51) | | | $ | (2) | |
| Cross currency swaps | 2 | | | 2 | |
| Total cash flow hedges | (49) | | | 0 | |
| Total net (loss) gain in AOCL | $ | (122) | | | $ | 54 | |
Derivatives not designated as accounting hedges:
Foreign exchange forwards
The Company also enters into foreign exchange forward contracts to mitigate the change in fair value on certain assets and liabilities denominated in currencies other than a subsidiary’s functional currency. These forward contracts are not designated as accounting hedges under the applicable sections of Topic 815 of the ASC. Accordingly, changes in the fair value of these contracts are recognized immediately in other non-operating income, net in the Company’s consolidated statements of operations along with the FX gain or loss recognized on the assets and liabilities denominated in a currency other than the subsidiary’s functional currency. These contracts have expiration dates at various times through November 2020.August 2021.
The following table summarizes the notional amounts of the Company’s outstanding foreign exchange forwards:
| | | | | | | | | | | | | | | | | | | | | | | |
| September 30, 2020 | | December 31, 2019 |
| Notional amount of currency pair: | Sell | | Buy | | Sell | | Buy |
| Contracts to sell USD for GBP | $ | 320 | | | £ | 254 | | | $ | 235 | | | £ | 178 | |
| Contracts to sell USD for Japanese Yen | $ | 10 | | | ¥ | 1,000 | | | $ | 29 | | | ¥ | 3,200 | |
| Contracts to sell USD for Canadian dollars | $ | 105 | | | C$ | 140 | | | $ | 83 | | | C$ | 110 | |
| Contracts to sell USD for Singapore dollars | $ | 58 | | | S$ | 79 | | | $ | 41 | | | S$ | 56 | |
| Contracts to sell USD for Euros | $ | 530 | | | € | 452 | | | $ | 421 | | | € | 378 | |
| Contracts to sell Euros for GBP | € | 53 | | | £ | 48 | | | € | 25 | | | £ | 21 | |
| Contracts to sell USD for Russian Ruble | $ | 9 | | | ₽ | 670 | | | $ | 0 | | | ₽ | 0 | |
| Contracts to sell USD for Indian Rupee | $ | 18 | | | ₹ | 1,350 | | | $ | 0 | | | ₹ | 0 | |
| | | | | | | | | | | | | | | | | | | | | | | | | | | | | |
| June 30, 2021 | | December 31, 2020 |
| Notional amount of currency pair: | Sell | | Buy | | Sell | | Buy |
| Contracts to sell USD for GBP | $ | 424 | | | £ | 301 | | | $ | 295 | | | £ | 222 | |
| Contracts to sell USD for Japanese yen | $ | 15 | | | ¥ | 1,600 | | | $ | 15 | | | ¥ | 1,600 | |
| Contracts to sell USD for Canadian dollars | $ | 105 | | | C$ | 129 | | | $ | 107 | | | C$ | 140 | |
| Contracts to sell USD for Singapore dollars | $ | 59 | | | S$ | 79 | | | $ | 59 | | | S$ | 79 | |
| Contracts to sell USD for euros | $ | 549 | | | € | 450 | | | $ | 447 | | | € | 376 | |
| Contracts to sell Euros for GBP | € | 135 | | | £ | 116 | | | € | 135 | | | £ | 121 | |
| Contracts to sell USD for Russian ruble | $ | 13 | | | ₽ | 1,000 | | | $ | 13 | | | ₽ | 1,000 | |
| Contracts to sell USD for Indian rupee | $ | 18 | | | ₹ | 1,350 | | | $ | 18 | | | ₹ | 1,350 | |
NOTE: € = Euro,euro, £ = British pound, $ = U.S. dollar, ¥ = Japanese Yen,yen, C$ = Canadian dollar, S$= Singapore dollars, ₽= Russian Ruble,ruble, ₹= Indian Rupeerupee
The following table summarizes the impact to the consolidated statements of operations relating to the net losses on the Company’s derivatives which are not designated as hedging instruments:
| | | | | | | | | | | | | | | | | | | | | | | | | | | | | | | | |
| Derivatives not designated as accounting hedges | | Location on Statement of Operations | | Three Months Ended
September 30, | | Nine Months Ended
September 30, |
| | 2020 | | 2019 | | 2020 | | 2019 |
| Foreign exchange forwards | | Other non-operating income, net | | $ | 36 | | | $ | (26) | | | $ | 1 | | | $ | (35) | |
| | | | | | | | | | | | | | | | | | | | | | | | | | | | | | | | |
| Derivatives not designated as accounting hedges | | Location on Consolidated Statements of Operations | | Three Months Ended
June 30, | | Six Months Ended
June 30, |
| | 2021 | | 2020 | | 2021 | | 2020 |
| Foreign exchange forwards | | Other non-operating income, net | | $ | (1) | | | $ | 5 | | | $ | (7) | | | $ | (35) | |
The table below shows the classification between assets and liabilities on the Company’s consolidated balance sheets for the fair value of the derivative instrument as well as the carrying value of its non-derivative debt instruments designated and qualifying as net investment hedges:
| | | | | | | | | | | | | | | | | | | | |
| | Derivative and Non-Derivative Instruments |
| | Balance Sheet Location | | September 30, 2020 | | December 31, 2019 |
| Assets: | | | | | | |
| Derivatives designated as accounting hedges: | | | | | | |
| Cross-currency swaps designated as net investment hedges | | Other assets | | $ | 9 | | | $ | 56 | |
| Interest rate swaps designated as fair value hedges | | Other assets | | 63 | | | 27 | |
| FX forwards designated as net investment hedges | | Other current assets | | 2 | | | 0 | |
| Total derivatives designated as accounting hedges | | | | 74 | | | 83 | |
| | | | | | |
| Derivatives not designated as accounting hedges: | | | | | | |
| FX forwards on certain assets and liabilities | | Other current assets | | 5 | | | 9 | |
| Total assets | | | | $ | 79 | | | $ | 92 | |
| Liabilities: | | | | | | |
| Derivatives designated as accounting hedges: | | | | | | |
| Cross-currency swaps designated as net investment hedges | | Other liabilities | | $ | 63 | | | $ | 0 | |
| Interest rate swaps designated as fair value hedges | | Other liabilities | | 1 | | | 0 | |
| Total derivatives designated as accounting hedges | | | | 64 | | | 0 | |
| Non-derivatives designated as accounting hedges: | | | | | | |
| Long-term debt designated as net investment hedge | | Long-term debt | | 1,465 | | | 1,403 | |
| Derivatives not designated as accounting hedges: | | | | | | |
| FX forwards on certain assets and liabilities | | Accounts payable and accrued liabilities | | 5 | | | 0 | |
| Total liabilities | | | | $ | 1,534 | | | $ | 1,403 | |
| | | | | | | | | | | | | | | | | | | | |
| | Derivative and Non-Derivative Instruments |
| | Balance Sheet Location | | June 30, 2021 | | December 31, 2020 |
| Assets: | | | | | | |
| Derivatives designated as accounting hedges: | | | | | | |
| Cross-currency swaps designated as net investment hedges | | Other assets | | $ | 7 | | | $ | 0 | |
| Interest rate swaps designated as fair value hedges | | Other assets | | 37 | | | 57 | |
| FX forwards designated as net investment hedges | | Other current assets | | 19 | | | 0 | |
| Total derivatives designated as accounting hedges | | | | 63 | | | 57 | |
| | | | | | |
| Derivatives not designated as accounting hedges: | | | | | | |
| FX forwards on certain assets and liabilities | | Other current assets | | 3 | | | 31 | |
| Total assets | | | | $ | 66 | | | $ | 88 | |
| Liabilities: | | | | | | |
| Derivatives designated as accounting hedges: | | | | | | |
| FX forwards designated as net investment hedges | | Accounts payable and accrued liabilities | | $ | 1 | | | $ | 16 | |
| Cross-currency swaps designated as net investment hedges | | Accounts payable and accrued liabilities | | 0 | | | 23 | |
| Cross-currency swaps designated as net investment hedges | | Other liabilities | | 80 | | | 144 | |
| Interest rate swaps designated as fair value hedges | | Other liabilities | | 5 | | | 1 | |
| Total derivatives designated as accounting hedges | | | | 86 | | | 184 | |
| Non-derivatives designated as accounting hedges: | | | | | | |
| Long-term debt designated as net investment hedge | | Long-term debt | | 1,482 | | | 1,530 | |
| Derivatives not designated as accounting hedges: | | | | | | |
| FX forwards on certain assets and liabilities | | Accounts payable and accrued liabilities | | 26 | | | 2 | |
| Total liabilities | | | | $ | 1,594 | | | $ | 1,716 | |
NOTE 11.10. GOODWILL AND OTHER ACQUIRED INTANGIBLE ASSETS
The following table summarizes the activity in goodwill for the periods indicated: | | | | | | | | | | | | | | | | | | | | | | | | | | | | | | | | | | | | | | | | | | | | | | | | | | | | | |
| Six Months Ended June 30, 2021 |
| MIS | | MA | | Consolidated |
| Gross goodwill | | Accumulated impairment
charge | | Net
goodwill | | Gross goodwill | | Accumulated
impairment
charge | | Net
goodwill | | Gross goodwill | | Accumulated
impairment
charge | | Net
goodwill |
Balance at beginning
of year | $ | 311 | | | $ | 0 | | | $ | 311 | | | $ | 4,257 | | | $ | (12) | | | $ | 4,245 | | | $ | 4,568 | | | $ | (12) | | | $ | 4,556 | |
Additions/ adjustments (1) | 0 | | | — | | | 0 | | | 95 | | | — | | | 95 | | | 95 | | | — | | | 95 | |
| Foreign currency translation adjustments | 1 | | | — | | | 1 | | | (62) | | | — | | | (62) | | | (61) | | | — | | | (61) | |
| | | | | | | | | | | | | | | | | |
| Ending balance | $ | 312 | | | $ | 0 | | | $ | 312 | | | $ | 4,290 | | | $ | (12) | | | $ | 4,278 | | | $ | 4,602 | | | $ | (12) | | | $ | 4,590 | |
| | | | | | | | | | | | | | | | | | | | | | | | | | | | | | | | | | | | | | | | | | | | | | | | | | | | | |
| Nine Months Ended September 30, 2020 |
| MIS | | MA | | Consolidated |
| Gross goodwill | | Accumulated impairment charge | | Net goodwill | | Gross goodwill | | Accumulated impairment charge | | Net goodwill | | Gross goodwill | | Accumulated impairment charge | | Net goodwill |
Balance at beginning of year | $ | 315 | | | $ | 0 | | | $ | 315 | | | $ | 3,419 | | | $ | (12) | | | $ | 3,407 | | | $ | 3,734 | | | $ | (12) | | | $ | 3,722 | |
Additions/ adjustments (1) | (2) | | | — | | | (2) | | | 497 | | | — | | | 497 | | | 495 | | | — | | | 495 | |
| Foreign currency translation adjustments | (11) | | | — | | | (11) | | | 76 | | | — | | | 76 | | | 65 | | | — | | | 65 | |
| | | | | | | | | | | | | | | | | |
| Ending balance | $ | 302 | | | $ | 0 | | | $ | 302 | | | $ | 3,992 | | | $ | (12) | | | $ | 3,980 | | | $ | 4,294 | | | $ | (12) | | | $ | 4,282 | |
| | | Year Ended December 31, 2019 | | Year Ended December 31, 2020 |
| | MIS | | MA | | Consolidated | | MIS | | MA | | Consolidated |
| | Gross goodwill | | Accumulated impairment charge | | Net goodwill | | Gross goodwill | | Accumulated impairment charge | | Net goodwill | | Gross goodwill | | Accumulated impairment charge | | Net goodwill | | Gross goodwill | | Accumulated impairment charge | | Net goodwill | | Gross goodwill | | Accumulated impairment charge | | Net goodwill | | Gross goodwill | | Accumulated impairment charge | | Net goodwill |
Balance at beginning of year | Balance at beginning of year | $ | 258 | | | $ | 0 | | | $ | 258 | | | $ | 3,535 | | | $ | (12) | | | $ | 3,523 | | | $ | 3,793 | | | $ | (12) | | | $ | 3,781 | | Balance at beginning
of year | $ | 315 | | | $ | 0 | | | $ | 315 | | | $ | 3,419 | | | $ | (12) | | | $ | 3,407 | | | $ | 3,734 | | | $ | (12) | | | $ | 3,722 | |
Additions/ adjustments (2) | Additions/ adjustments (2) | 53 | | | — | | | 53 | | | 61 | | | — | | | 61 | | | 114 | | | — | | | 114 | | Additions/ adjustments (2) | (2) | | | — | | | (2) | | | 628 | | | — | | | 628 | | | 626 | | | — | | | 626 | |
Foreign currency translation adjustments | Foreign currency translation adjustments | 4 | | | — | | | 4 | | | (14) | | | — | | | (14) | | | (10) | | | — | | | (10) | | Foreign currency translation
adjustments | (2) | | | — | | | (2) | | | 210 | | | — | | | 210 | | | 208 | | | — | | | 208 | |
| Divestiture of MAKS | 0 | | | — | | | 0 | | | (163) | | | — | | | (163) | | | (163) | | | — | | | (163) | | |
| | Ending balance | Ending balance | $ | 315 | | | $ | 0 | | | $ | 315 | | | $ | 3,419 | | | $ | (12) | | | $ | 3,407 | | | $ | 3,734 | | | $ | (12) | | | $ | 3,722 | | Ending balance | $ | 311 | | | $ | 0 | | | $ | 311 | | | $ | 4,257 | | | $ | (12) | | | $ | 4,245 | | | $ | 4,568 | | | $ | (12) | | | $ | 4,556 | |
(1) The 2020 additions/adjustments for the MA segment in the table above primarily relate to the acquisitions of RDC and RBA.
(2) The 2019 additions/adjustments for the MIS segment in the table above relate to the acquisitions of Vigeo Eiris and Four Twenty Seven. The 20192021 additions/adjustments for the MA segment in the table above relate to the acquisition of RiskFirstCortera.
(2) The 2020 additions/adjustments for the MA segment in the table above relate to the acquisitions of RDC, AM, ZMFS, and ABS Suite.Catylist.
Acquired intangible assets and related amortization consisted of:
| | | | | | | | | | | |
| September 30,
2020 | | December 31,
2019 |
| Customer relationships | $ | 1,524 | | | $ | 1,325 | |
| Accumulated amortization | (287) | | | (235) | |
| Net customer relationships | 1,237 | | | 1,090 | |
| Trade secrets | 30 | | | 30 | |
| Accumulated amortization | (29) | | | (29) | |
| Net trade secrets | 1 | | | 1 | |
| Software/product technology | 378 | | | 372 | |
| Accumulated amortization | (152) | | | (131) | |
| Net software/product technology | 226 | | | 241 | |
| Trade names | 152 | | | 150 | |
| Accumulated amortization | (35) | | | (30) | |
| Net trade names | 117 | | | 120 | |
Other (1) | 182 | | | 80 | |
| Accumulated amortization | (46) | | | (34) | |
| Net other | 136 | | | 46 | |
| Total acquired intangible assets, net | $ | 1,717 | | | $ | 1,498 | |
| | | | | | | | | | | |
| June 30,
2021 | | December 31,
2020 |
| Customer relationships | $ | 1,611 | | | $ | 1,623 | |
| Accumulated amortization | (347) | | | (313) | |
| Net customer relationships | 1,264 | | | 1,310 | |
| Software/product technology | 442 | | | 441 | |
| Accumulated amortization | (195) | | | (177) | |
| Net software/product technology | 247 | | | 264 | |
| Database | 181 | | | 144 | |
| Accumulated amortization | (37) | | | (29) | |
| Net database | 144 | | | 115 | |
| Trade names | 160 | | | 161 | |
| Accumulated amortization | (42) | | | (38) | |
| Net trade names | 118 | | | 123 | |
Other (1) | 54 | | | 55 | |
| Accumulated amortization | (43) | | | (43) | |
| Net other | 11 | | | 12 | |
| Total acquired intangible assets, net | $ | 1,784 | | | $ | 1,824 | |
(1) Other intangible assets primarily consist of databases,trade secrets, covenants not to compete, and acquired ratings methodologies and models.
Amortization expense relating to acquired intangible assets is as follows: | | | | | | | | | | | | | | | | | | | | | | | |
| Three Months Ended
June 30, | | Six Months Ended
June 30, |
| 2021 | | 2020 | | 2021 | | 2020 |
| Amortization expense | $ | 36 | | | $ | 31 | | | $ | 71 | | | $ | 59 | |
| | | | | | | | | | | | | | | | | | | | | | | |
| Three Months Ended
September 30, | | Nine Months Ended
September 30, |
| 2020 | | 2019 | | 2020 | | 2019 |
| Amortization expense | $ | 31 | | | $ | 24 | | | $ | 90 | | | $ | 77 | |
Estimated future amortization expense for acquired intangible assets subject to amortization is as follows:
| | | | | | | | |
| Year Ending December 31, | | |
| 2020 (After September 30,) | | $ | 31 | |
| 2021 | | 121 | |
| 2022 | | 120 | |
| 2023 | | 116 | |
| 2024 | | 108 | |
| Thereafter | | 1,221 | |
| Total estimated future amortization | | $ | 1,717 | |
| | | | | | | | |
| Year Ending December 31, | | |
| 2021 (After June 30,) | | $ | 63 | |
| 2022 | | 133 | |
| 2023 | | 129 | |
| 2024 | | 125 | |
| 2025 | | 121 | |
| Thereafter | | 1,213 | |
| Total estimated future amortization | | $ | 1,784 | |
Matters concerning the ICRA reporting unit
On August 29, 2019, the board of directors of ICRA terminated the employment of ICRA's CEO and on September 28, 2019, the shareholders of ICRA voted to remove the former CEO from his position on ICRA's board of directors. ICRA appointed a new Managing Director & Group CEO effective August 10, 2020. ICRA has reported thatvarious matters relating to: (i) an adjudication order and fine imposed by the Securities and Exchange Board of India (SEBI) issued an adjudication order dated December 26, 2019 imposing a penalty of INR 25 lakh (approximately $35,000) on ICRA in connection with credit ratings assigned to one of ICRA’s customers and the customer’s subsidiaries. ICRA has further reported that: (i) itsubsidiaries, which are being appealed by ICRA; (ii) an increase in the original fine, which also is appealing that order; and (ii) it had received a related "show cause" notice from SEBI asking ICRA to demonstrate whybeing appealed by ICRA; (iii) the penalty imposed should not be increased. In an order dated September 22, 2020, SEBI increased the penalty imposed on ICRA from INR 25 lakh to INR 1 crore (approximately $140,000).In addition, ICRA has disclosed that it has completed itscompletion of internal examinations intoregarding various anonymous allegations that were forwarded to ICRAcomplaints; and (iv) actions taken by SEBI and certain additional allegations made during the course of that examination while an examination into a separate anonymous complaint is ongoing. ICRA reported that its Board of Directors is in the process of taking appropriate actionsICRA’s board based on the findings of the completed examinations.examinations’ findings. As of the date of this quarterly report on Form 10-Q, the Company is unable to estimate the financial impact, if any, that may result from a potential unfavorable conclusion of these matters or any other ICRA inquiry. An unfavorable resolution of such matters may negatively impact ICRA’s future operating results, which could result in an impairment of goodwill and amortizable intangible assets in future quarters.
NOTE 12.11. RESTRUCTURING
On July 29,December 22, 2020, the chief executive officer of Moody’s approved a restructuring program (the “2020 Restructuring Program”) primarily in response to the COVID-19 pandemic which revolves around the rationalization and exit of certain real estate leases. The exit from certain leased office space began in the third quarter of 2020 and is anticipated to be substantially completed during the first half of 2021. The 2020 Restructuring Program is estimated to result in total pre-tax charges of $25 to $35 million, which primarily reflect non-cash charges related to the impairment of operating lease right-of-use assets and leasehold improvements. Approximately $25 to $30 million of this amount is expected to be recorded in the second half of 2020. The 2020 Restructuring Program is expected to result in an estimated annualized savings of approximately $5 to $6 million a year.
On October 26, 2018, the chief executive officer of Moody’s approved a restructuring program (the “2018MA Strategic Reorganization Restructuring Program”) that the Company estimates will result in annualized savings of approximately $60$20 million per year. The 2018 Restructuring Program, the scope of which was expandedThis program relates to a strategic reorganization in the second quarterMA reportable segment consisting of 2019, is estimated to result in total pre-tax charges of $105 to $110 million. The 2018 Restructuring Program included relocation of certain functions from high-cost to lower-cost jurisdictions, a reduction of staff, including from acquisitions and pursuant to a review of the business criticality of certain positions, and the rationalization and exit of certain real estate leases due to consolidation of various business activities. The exit from certain leased office space began in the fourth quarter of 2018 and resulted in approximately $50 million of the charges to either terminate or sublease the affected real estate leases. The 2018 Restructuring Program also included approximately $60 million of personnel-related restructuring charges, an amount that includes severance and related costs primarily determined under the Company’s existing severance plans. The 2020 MA Strategic Reorganization Restructuring Program resulted in a total of $20 million in pre-tax charges and is substantially complete at June 30, 2021. Cash outlays associated with the employee termination cost component of the 2018 Restructuring Programthis program are anticipatedexpected to be approximately $60$20 million, which will be paid through 2021. The remaining restructuring liability relating to the 2018 Restructuring Program was not material as of September 30, 2020.2022.
Total expensesexpense included in the accompanying consolidated statements of operations relating to the 2018aforementioned restructuring program is below: | | | | | | | | | | | | | | | | | | | | | | | |
| Three Months Ended
June 30, | | Six Months Ended
June 30, |
| 2021 | | 2020 | | 2021 | | 2020 |
| | | | | | | |
| 2020 MA Strategic Reorganization Restructuring Program | $ | 0 | | | $ | 0 | | | $ | 2 | | | $ | 0 | |
| | | | | | | |
Changes to the restructuring liability for the aforementioned restructuring program during the first six months of 2021 were as follows: | | | | | | | | | |
| Employee Termination Costs | | | | |
| Balance as of December 31, 2020 | $ | 18 | | | | | |
| | | | | |
| | | | | |
| | | | | |
| | | | | |
| | | | | |
| | | | | |
| 2020 MA Strategic Reorganization Restructuring Program: | | | | | |
| Cost incurred and adjustments | 2 | | | | | |
| Cash payments and adjustments | (8) | | | | | |
| Balance as of June 30, 2021 | $ | 12 | | | | | |
| | | | | |
| Cumulative expense incurred to date | | | | | |
| | | | | |
| | | | | |
| 2020 MA Strategic Reorganization Restructuring Program: | $ | 20 | | | | | |
As of June 30, 2021, the remaining $12 million restructuring liability related to the 2020 MA Strategic Reorganization Restructuring Program and 2020 Restructuring Program are as follows:
| | | | | | | | | | | | | | | | | | | | | | | |
| Three Months Ended
September 30, | | Nine Months Ended
September 30, |
| 2020 | | 2019 | | 2020 | | 2019 |
| 2018 Restructuring Program | $ | 0 | | | $ | (1) | | | $ | (3) | | | $ | 58 | |
2020 Restructuring Program (1) | 23 | | | 0 | | | 23 | | | 0 | |
| Total Restructuring | $ | 23 | | | $ | (1) | | | $ | 20 | | | $ | 58 | |
(1) Consists of a non-cash charge relatingis expected to the impairment of leasehold improvements and ROU Assets. The fair value of the impaired ROU Assets was determined by utilizing the present value of the estimated future cash flows attributable to the assets. The fair value of these ROU assets immediately subsequent to the impairment was $10 million, and is categorized as Level 3 within the ASC Topic 820 fair value hierarchy.be paid out through 2022.
NOTE 13.12. FAIR VALUE
The table below presents information about items that are carried at fair value at SeptemberJune 30, 20202021 and December 31, 2019:2020: | | | | | | | | | | | | | | | | | |
| Fair value Measurement as of June 30, 2021 |
| Description | Balance | | Level 1 | | Level 2 |
| Assets: | | | | | |
Derivatives (1) | $ | 66 | | | $ | 0 | | | $ | 66 | |
| Mutual funds | 60 | | | 60 | | | 0 | |
| Total | $ | 126 | | | $ | 60 | | | $ | 66 | |
| Liabilities: | | | | | |
Derivatives (1) | $ | 112 | | | $ | 0 | | | $ | 112 | |
| Total | $ | 112 | | | $ | 0 | | | $ | 112 | |
| | | | | | | | | | | | | | | | | |
| Fair value Measurement as of September 30, 2020 |
| Description | Balance | | Level 1 | | Level 2 |
| Assets: | | | | | |
Derivatives (1) | $ | 79 | | | $ | 0 | | | $ | 79 | |
| Mutual funds | 50 | | | 50 | | | 0 | |
| Total | $ | 129 | | | $ | 50 | | | $ | 79 | |
| Liabilities: | | | | | |
Derivatives (1) | $ | 69 | | | $ | 0 | | | $ | 69 | |
| Total | $ | 69 | | | $ | 0 | | | $ | 69 | |
| | | Fair value Measurement as of December 31, 2019 | | Fair value Measurement as of December 31, 2020 |
| Description | Description | Balance | | Level 1 | | Level 2 | Description | Balance | | Level 1 | | Level 2 |
| Assets: | Assets: | | | | | | Assets: | | | | | |
Derivatives (1) | Derivatives (1) | $ | 92 | | | $ | 0 | | | $ | 92 | | Derivatives (1) | $ | 88 | | | $ | 0 | | | $ | 88 | |
| | Mutual funds | Mutual funds | 3 | | | 3 | | | 0 | | Mutual funds | 60 | | | 60 | | | 0 | |
| Total | Total | $ | 95 | | | $ | 3 | | | $ | 92 | | Total | $ | 148 | | | $ | 60 | | | $ | 88 | |
| | Liabilities: | | Liabilities: | | | | | |
Derivatives (1) | | Derivatives (1) | $ | 186 | | | $ | 0 | | | $ | 186 | |
| Total | | Total | $ | 186 | | | $ | 0 | | | $ | 186 | |
(1)Represents FX forwards on certain assets and liabilities as well asforward contracts, interest rate swaps and cross-currency swaps and forward contracts as more fully described in Note 109 to the condensed consolidated financial statements.
The following are descriptions of the methodologies utilized by the Company to estimate the fair value of its derivative contracts, mutual funds and money market mutual funds:
Derivatives:
In determining the fair value of the derivative contracts in the table above, the Company utilizes industry standard valuation models. Where applicable, these models project future cash flows and discount the future amounts to a present value using spot rates, forward points, currency volatilities, interest rates as well as the risk of non-performance of the Company and the counterparties with whom it has derivative contracts. The Company established strict counterparty credit guidelines and only enters into transactions with financial institutions that adhere to these guidelines. Accordingly, the risk of counterparty default is deemed to be minimal.
Mutual funds and money market mutual funds:
The mutual funds in the table above are deemed to be equity securities with readily determinable fair values with changes in the fair value recognized through net income under ASC Topic 321. The fair value of these instruments is determined using Level 1 inputs as defined in the ASC Topic 820.
NOTE 14.13. OTHER BALANCE SHEET AND STATEMENTSTATEMENTS OF OPERATIONS INFORMATION
The following tables contain additional detail related to certain balance sheet captions:
| | | | | | | | | | | |
| September 30, 2020 | | December 31, 2019 |
| Other current assets: | | | |
| Prepaid taxes | $ | 121 | | | $ | 79 | |
| Prepaid expenses | 77 | | | 71 | |
| Capitalized costs to obtain and fulfill sales contracts | 80 | | | 91 | |
| Other | 55 | | | 89 | |
| Total other current assets | $ | 333 | | | $ | 330 | |
| Other assets: | | | |
| Investments in non-consolidated affiliates | $ | 123 | | | $ | 117 | |
| Deposits for real-estate leases | 16 | | | 13 | |
| Indemnification assets related to acquisitions | 16 | | | 16 | |
| Mutual funds and fixed deposits | 54 | | | 10 | |
| Company owned life insurance (at contract value) | 14 | | | 0 | |
| Costs to obtain sales contracts | 118 | | | 119 | |
| Cross currency and interest rate swaps | 72 | | | 83 | |
| Other | 55 | | | 31 | |
| Total other assets | $ | 468 | | | $ | 389 | |
| Accounts payable and accrued liabilities: | | | |
| Salaries and benefits | $ | 131 | | | $ | 152 | |
| Incentive compensation | 160 | | | 208 | |
| Customer credits, advanced payments and advanced billings | 44 | | | 28 | |
| | | |
| Dividends | 7 | | | 7 | |
| Professional service fees | 51 | | | 43 | |
| Interest accrued on debt | 43 | | | 63 | |
| Accounts payable | 26 | | | 38 | |
| Income taxes | 97 | | | 73 | |
| Pension and other retirement employee benefits | 7 | | | 7 | |
| Accrued royalties | 13 | | | 25 | |
| Foreign exchange forwards on certain assets and liabilities | 5 | | | 0 | |
| Restructuring liability | 4 | | | 21 | |
| | | |
| Other | 124 | | | 108 | |
| Total accounts payable and accrued liabilities | $ | 712 | | | $ | 773 | |
| | | |
| | | |
| | | |
| | | |
| | | |
| | | |
| | | |
| | | |
| | | |
| | | |
| | | | | | | | | | | |
| June 30, 2021 | | December 31, 2020 |
| Other current assets: | | | |
| Prepaid taxes | $ | 125 | | | $ | 94 | |
| Prepaid expenses | 78 | | | 91 | |
| Capitalized costs to obtain and fulfill sales contracts | 92 | | | 93 | |
| Foreign exchange forwards on certain assets and liabilities | 3 | | | 31 | |
| Derivative instruments designated as accounting hedges | 19 | | | 0 | |
| Other | 62 | | | 74 | |
| Total other current assets | $ | 379 | | | $ | 383 | |
| Other assets: | | | |
| Investments in non-consolidated affiliates | $ | 151 | | | $ | 135 | |
| Deposits for real-estate leases | 14 | | | 19 | |
| Indemnification assets related to acquisitions | 15 | | | 15 | |
| Mutual funds and fixed deposits | 83 | | | 66 | |
| Company owned life insurance (at contract value) | 36 | | | 17 | |
| Costs to obtain sales contracts | 142 | | | 134 | |
| Derivative instruments designated as accounting hedges | 44 | | | 57 | |
| Pension and other retirement employee benefits | 19 | | | 21 | |
| Other | 52 | | | 51 | |
| Total other assets | $ | 556 | | | $ | 515 | |
| Accounts payable and accrued liabilities: | | | |
| Salaries and benefits | $ | 149 | | | $ | 197 | |
| Incentive compensation | 134 | | | 226 | |
| Customer credits, advanced payments and advanced billings | 60 | | | 42�� | |
| | | |
| Dividends | 5 | | | 11 | |
| Professional service fees | 60 | | | 53 | |
| Interest accrued on debt | 72 | | | 82 | |
| Accounts payable | 18 | | | 39 | |
| Income taxes | 108 | | | 128 | |
| Pension and other retirement employee benefits | 46 | | | 45 | |
| Accrued royalties | 23 | | | 19 | |
| Foreign exchange forwards on certain assets and liabilities | 26 | | | 2 | |
| Restructuring liability | 12 | | | 18 | |
| | | |
| Derivative instruments designated as accounting hedges | 1 | | | 39 | |
| Other | 102 | | | 138 | |
| Total accounts payable and accrued liabilities | $ | 816 | | | $ | 1,039 | |
| | | |
| | | |
| | | |
| | | |
| | | |
| | | |
| | | |
| | | |
| | | |
| | | |
| | | | | | | | | | | |
| September 30, 2020 | | December 31, 2019 |
| | | |
| | | |
| | | |
| | | |
| | | |
| | | |
| | | |
| | | |
| | | |
| | | |
| | | |
| | | |
| | | |
| | | |
| | | |
| | | |
| | | |
| | | |
| | | |
| | | |
| | | |
| | | |
| | | |
| | | |
| | | |
| | | |
| | | |
| | | |
| | | |
| | | |
| | | |
| | | |
| | | |
| | | |
| | | |
| Other liabilities: | | | |
| Pension and other retirement employee benefits | $ | 214 | | | $ | 299 | |
| | | |
| Interest accrued on UTPs | 107 | | | 82 | |
| MAKS indemnification provisions | 33 | | | 43 | |
| Income tax liability - non-current portion | 51 | | | 51 | |
| Cross currency and interest rate swaps | 64 | | | 0 | |
| Restructuring liability | 2 | | | 3 | |
| Other | 27 | | | 26 | |
| Total other liabilities | $ | 498 | | | $ | 504 | |
| | | | | | | | | | | |
| June 30, 2021 | | December 31, 2020 |
| | | |
| | | |
| | | |
| | | |
| | | |
| | | |
| | | |
| | | |
| | | |
| | | |
| | | |
| | | |
| | | |
| | | |
| | | |
| | | |
| | | |
| | | |
| | | |
| | | |
| | | |
| | | |
| | | |
| | | |
| | | |
| | | |
| | | |
| | | |
| | | |
| | | |
| | | |
| | | |
| | | |
| | | |
| | | |
| Other liabilities: | | | |
| Pension and other retirement employee benefits | $ | 211 | | | $ | 244 | |
| | | |
| Interest accrued on UTPs | 75 | | | 113 | |
| MAKS indemnification provisions | 33 | | | 33 | |
| Income tax liability - non-current portion | 18 | | | 18 | |
| Derivative instruments designated as accounting hedges | 85 | | | 145 | |
| | | |
| Other | 38 | | | 37 | |
| Total other liabilities | $ | 460 | | | $ | 590 | |
Loss pursuant to the Divestiture of MAKS:
The $2 million and $11 million loss during the three and nine months ended September 30, 2019 and $9 million loss during the ninesix months ended SeptemberJune 30, 2020 relates to customary post-closing completion adjustments pursuant to the strategicfourth quarter 2019 divestiture of MAKS.
Other Non-Operating Income (Expense):
The following table summarizes the components of other non-operating income (expense):
| | | Three Months Ended September 30, | | Nine Months Ended September 30, | | Three Months Ended June 30, | | Six Months Ended June 30, |
| | 2020 | | 2019 | | 2020 | | 2019 | | 2021 | | 2020 | | 2021 | | 2020 |
| FX gain (loss) | FX gain (loss) | $ | 2 | | | $ | 1 | | | $ | 7 | | | $ | (15) | | FX gain (loss) | $ | 2 | | | $ | (8) | | | $ | 0 | | | $ | 5 | |
Net periodic pension costs - other components | Net periodic pension costs - other components | 3 | | | 4 | | | 10 | | | 13 | | Net periodic pension costs - other components | (3) | | | 4 | | | 1 | | | 7 | |
| Income from investments in non-consolidated affiliates | 4 | | | 4 | | | 4 | | | 11 | | |
| Income/(loss) from investments in non-consolidated affiliates | | Income/(loss) from investments in non-consolidated affiliates | 1 | | | 3 | | | 9 | | | 0 | |
| Other | Other | 1 | | | 1 | | | 17 | | | 3 | | Other | 6 | | | 17 | | | 12 | | | 16 | |
| Total | Total | $ | 10 | | | $ | 10 | | | $ | 38 | | | $ | 12 | | Total | $ | 6 | | | $ | 16 | | | $ | 22 | | | $ | 28 | |
(1) The amounts for the three and six months ended June 30, 2021 include a $7 million loss related to a settlement of pension obligations | | (1) The amounts for the three and six months ended June 30, 2021 include a $7 million loss related to a settlement of pension obligations |
NOTE 15.14. COMPREHENSIVE INCOME AND ACCUMULATED OTHER COMPREHENSIVE LOSS
The following table provides details about the reclassifications out of AOCL:
| | | Losses on cash flow hedges | Three Months Ended
September 30, 2020 | | Nine Months Ended
September 30, 2020 | | Location in the consolidated statement of operations | |
| | Interest rate contract | $ | 0 | | | $ | (1) | | | Other non-operating expense, net | |
| | Income tax effect of items above | 0 | | | 0 | | | Provision for income taxes | |
| Total net losses on cash flow hedges | 0 | | | (1) | | | |
| | | | Three Months Ended June 30, | | Location in the consolidated statements of operations |
| | | 2021 | | 2020 | |
| | | Gains on net investment hedges | | Gains on net investment hedges | | | | | |
| FX forwards | | FX forwards | $ | 1 | | | $ | 0 | | | Other non-operating income, net |
| Income tax effect of item above | | Income tax effect of item above | (1) | | | 0 | | | Provision for income taxes |
| Total net gains on net investment hedges | | Total net gains on net investment hedges | 0 | | | 0 | | |
| Pension and other retirement benefits | Pension and other retirement benefits | | | | | Pension and other retirement benefits | | | | |
| Amortization of actuarial losses and prior service costs included in net income | Amortization of actuarial losses and prior service costs included in net income | (1) | | | (3) | | | Operating expense | Amortization of actuarial losses and prior service costs included in net income | (3) | | | (1) | | | Other non-operating income, net |
| Amortization of actuarial losses and prior service costs included in net income | (1) | | | (2) | | | SG&A expense | |
| Settlement charge | | Settlement charge | (7) | | | 0 | | | Other non-operating income, net |
| Total before income taxes | Total before income taxes | (2) | | | (5) | | | Total before income taxes | (10) | | | (1) | | |
| Income tax effect of item above | 0 | | | 1 | | | Provision for income taxes | |
| Income tax effect of items above | | Income tax effect of items above | 2 | | | 0 | | | Provision for income taxes |
| Total pension and other retirement benefits | Total pension and other retirement benefits | (2) | | | (4) | | | Total pension and other retirement benefits | (8) | | | (1) | | |
| Total net losses included in Net Income attributable to reclassifications out of AOCL | Total net losses included in Net Income attributable to reclassifications out of AOCL | $ | (2) | | | $ | (5) | | | Total net losses included in Net Income attributable to reclassifications out of AOCL | $ | (8) | | | $ | (1) | | |
| | | Location in the consolidated statement of operations | | Six Months Ended June 30, | | Location in the consolidated statements of operations |
| Gains (losses) on cash flow hedges | Three Months Ended
September 30, 2019 | | Nine Months Ended
September 30, 2019 | | |
| Cross-currency swap | $ | 0 | | | $ | 0 | | | Other non-operating income, net | |
| Losses on cash flow hedges | | Losses on cash flow hedges | 2021 | | 2020 | | Location in the consolidated statements of operations |
| | Interest rate contract | Interest rate contract | 0 | | | 0 | | | Interest expense, net | Interest rate contract | $ | (1) | | | $ | (1) | | | Other non-operating income, net |
| Total before income taxes | 0 | | | 0 | | | |
| Income tax effect of items above | 0 | | | 0 | | | Provision for income taxes | |
| Total net gains (losses) on cash flow hedges | 0 | | | 0 | | | |
| Income tax effect of item above | | Income tax effect of item above | 0 | | | 0 | | | Provision for income taxes |
| Total net losses on cash flow hedges | | Total net losses on cash flow hedges | (1) | | | (1) | | |
| Gains on net investment hedges | Gains on net investment hedges | | | | | Gains on net investment hedges | | | | |
| FX forwards | FX forwards | 1 | | | 1 | | | Other non-operating income, net | FX forwards | 2 | | | 0 | | | Other non-operating income, net |
| Income tax effect of item above | Income tax effect of item above | 0 | | | 0 | | | Provision for income taxes | Income tax effect of item above | (1) | | | 0 | | | Provision for income taxes |
| Total net gains on net investment hedges | Total net gains on net investment hedges | 1 | | 1 | | Total net gains on net investment hedges | 1 | | 0 | | |
| Pension and other retirement benefits | Pension and other retirement benefits | | | | | Pension and other retirement benefits | | | | |
| Amortization of actuarial losses and prior service costs included in net income | Amortization of actuarial losses and prior service costs included in net income | (1) | | | (2) | | | Operating expense | Amortization of actuarial losses and prior service costs included in net income | (6) | | | (3) | | | Other non-operating income, net |
| Amortization of actuarial losses and prior service costs included in net income | 0 | | | (1) | | | SG&A expense | |
| Settlement charge | | Settlement charge | (7) | | | 0 | | | Other non-operating income, net |
| Total before income taxes | Total before income taxes | (1) | | | (3) | | | Total before income taxes | (13) | | | (3) | | |
| Income tax effect of item above | 0 | | | 1 | | | Provision for income taxes | |
| Income tax effect of items above | | Income tax effect of items above | 3 | | | 1 | | | Provision for income taxes |
| Total pension and other retirement benefits | Total pension and other retirement benefits | (1) | | | (2) | | | Total pension and other retirement benefits | (10) | | | (2) | | |
| Total net losses included in Net Income attributable to reclassifications out of AOCL | Total net losses included in Net Income attributable to reclassifications out of AOCL | $ | 0 | | | $ | (1) | | | Total net losses included in Net Income attributable to reclassifications out of AOCL | $ | (10) | | | $ | (3) | | |
The following tables show changes in AOCL by component (net of tax):
| | | | Three Months Ended | | Three Months Ended June 30, |
| | September 30, 2020 | | September 30, 2019 | | 2021 | | 2020 |
| Gains/(Losses) | Gains/(Losses) | Pension and Other Retirement Benefits | Cash Flow Hedges | Foreign Currency Translation Adjustments | Net Investment Hedges | Total | | Pension and Other Retirement Benefits | Cash Flow Hedges | Foreign Currency Translation Adjustments | Net Investment Hedges | | Total | Gains/(Losses) | Pension and Other Retirement Benefits | Cash Flow Hedges | Foreign Currency Translation Adjustments | Net Investment Hedges | Total | | Pension and Other Retirement Benefits | Cash Flow Hedges | Foreign Currency Translation Adjustments | Net Investment Hedges | Total |
| Balance June 30, | $ | (84) | | $ | (49) | | $ | (479) | | $ | 70 | | $ | (542) | | | $ | (70) | | $ | 0 | | $ | (401) | | $ | 25 | | | $ | (446) | | |
| Balance March 31, | | Balance March 31, | $ | (116) | | $ | (48) | | $ | (188) | | $ | (88) | | $ | (440) | | | $ | (92) | | $ | (35) | | $ | (570) | | $ | 143 | | $ | (554) | |
| Other comprehensive income/(loss) before reclassifications | Other comprehensive income/(loss) before reclassifications | (7) | | 0 | | 186 | | (143) | | 36 | | | 0 | | 0 | | (193) | | 102 | | | (91) | | Other comprehensive income/(loss) before reclassifications | 0 | | 0 | | 36 | | (29) | | 7 | | | 7 | | (14) | | 91 | | (73) | | 11 | |
| Amounts reclassified from AOCL | Amounts reclassified from AOCL | 2 | | 0 | | 0 | | 0 | | 2 | | | 1 | | 0 | | 0 | | (1) | | | 0 | | Amounts reclassified from AOCL | 8 | | 0 | | 0 | | 0 | | 8 | | | 1 | | 0 | | 0 | | 0 | | 1 | |
| Other comprehensive income/(loss) | Other comprehensive income/(loss) | (5) | | 0 | | 186 | | (143) | | 38 | | | 1 | | 0 | | (193) | | 101 | | | (91) | | Other comprehensive income/(loss) | 8 | | 0 | | 36 | | (29) | | 15 | | | 8 | | (14) | | 91 | | (73) | | 12 | |
| Balance September 30, | $ | (89) | | $ | (49) | | $ | (293) | | $ | (73) | | $ | (504) | | | $ | (69) | | $ | 0 | | $ | (594) | | $ | 126 | | | $ | (537) | | |
| Balance June 30, | | Balance June 30, | $ | (108) | | $ | (48) | | $ | (152) | | $ | (117) | | $ | (425) | | | $ | (84) | | $ | (49) | | $ | (479) | | $ | 70 | | $ | (542) | |
| | | Nine Months Ended | | Six Months Ended June 30, |
| | September 30, 2020 | September 30, 2019 | | 2021 | | 2020 |
| Gains/(Losses) | Gains/(Losses) | Pension and Other Retirement Benefits | Cash Flow Hedges | Foreign Currency Translation Adjustments | Net Investment Hedges | Total | | Pension and Other Retirement Benefits | Cash Flow Hedges | Foreign Currency Translation Adjustments | Net Investment Hedges | Total | Gains/(Losses) | Pension and Other Retirement Benefits | Cash Flow Hedges | Foreign Currency Translation Adjustments | Net Investment Hedges | Total | | Pension and Other Retirement Benefits | Cash Flow Hedges | Foreign Currency Translation Adjustments | Net Investment Hedges | Total |
| Balance December 31, | Balance December 31, | $ | (92) | | $ | 0 | | $ | (401) | | $ | 54 | | $ | (439) | | | $ | (53) | | $ | 0 | | $ | (406) | | $ | 33 | | $ | (426) | | Balance December 31, | $ | (118) | | $ | (49) | | $ | (45) | | $ | (220) | | $ | (432) | | | $ | (92) | | $ | 0 | | $ | (401) | | $ | 54 | | $ | (439) | |
| Other comprehensive income/(loss) before reclassifications | Other comprehensive income/(loss) before reclassifications | (1) | | (50) | | 108 | | (127) | | (70) | | | (1) | | 0 | | (188) | | 97 | | (92) | | Other comprehensive income/(loss) before reclassifications | 0 | | 0 | | (107) | | 104 | | (3) | | | 6 | | (50) | | (78) | | 16 | | (106) | |
| Amounts reclassified from AOCL | Amounts reclassified from AOCL | 4 | | 1 | | 0 | | 0 | | 5 | | | 2 | | 0 | | 0 | | (1) | | 1 | | Amounts reclassified from AOCL | 10 | | 1 | | 0 | | (1) | | 10 | | | 2 | | 1 | | 0 | | 0 | | 3 | |
| Adoption of ASU 2018-02 | — | | — | | — | | — | | — | | | (17) | | — | | — | | (3) | | (20) | | |
| | Other comprehensive income/(loss) | Other comprehensive income/(loss) | 3 | | (49) | | 108 | | (127) | | (65) | | | (16) | | 0 | | (188) | | 93 | | (111) | | Other comprehensive income/(loss) | 10 | | 1 | | (107) | | 103 | | 7 | | | 8 | | (49) | | (78) | | 16 | | (103) | |
| Balance September 30, | $ | (89) | | $ | (49) | | $ | (293) | | $ | (73) | | $ | (504) | | | $ | (69) | | $ | 0 | | $ | (594) | | $ | 126 | | $ | (537) | | |
| Balance June 30, | | Balance June 30, | $ | (108) | | $ | (48) | | $ | (152) | | $ | (117) | | $ | (425) | | | $ | (84) | | $ | (49) | | $ | (479) | | $ | 70 | | $ | (542) | |
NOTE 16.15. PENSION AND OTHER RETIREMENT BENEFITS
Moody’s maintains funded and unfunded noncontributory DBPPs. The U.S. plansDBPPs provide defined benefits using a cash balance formula based on years of service and career average salary for its employees or final average pay for selected executives. The Company also provides certain healthcare and life insurance benefits for retired U.S. employees. The retirement healthcare plans are contributory; the life insurance plans are noncontributory. Moody’s funded and unfunded U.S. pension plans, the U.S. retirement healthcare plans and the U.S. retirement life insurance plans are collectively referred to herein as the “Retirement Plans”. The U.S. retirement healthcare plans and the U.S. retirement life insurance plans are collectively referred to herein as the “Other Retirement Plans”.Plans.” The non-U.S. defined benefit pension plans are immaterial.
Through 2007, substantially all U.S. employees were eligible to participate in the Company’s DBPPs. Effective January 1, 2008, the Company no longer offers DBPPs to U.S. employees hired or rehired on or after January 1, 2008. New2008 and new hires in the U.S. employeesinstead will instead receive a retirement contribution ofin similar benefit value under the Company’s Profit Participation Plan. Current participants of the Company’s DBPPsRetirement Plans and Other Retirement Plans continue to accrue benefits based on existing plan formulas.
The components of net periodic benefit expense related to the Retirement Plans and Other Retirement Plans are as follows:
| | | | Three Months Ended September 30, | | Three Months Ended June 30, |
| | Pension Plans | | Other Retirement Plans | | Pension Plans | | Other Retirement Plans |
| | 2020 | | 2019 | | 2020 | | 2019 | | 2021 | | 2020 | | 2021 | | 2020 |
| Components of net periodic expense | Components of net periodic expense | | | | | | | | Components of net periodic expense | | | | | | | |
| Service cost | Service cost | $ | 5 | | | $ | 4 | | | $ | 0 | | | $ | 1 | | Service cost | $ | 5 | | | $ | 3 | | | $ | 1 | | | $ | 1 | |
| Interest cost | Interest cost | 4 | | | 5 | | | 1 | | | 0 | | Interest cost | 3 | | | 5 | | | 1 | | | 0 | |
| Expected return on plan assets | Expected return on plan assets | (5) | | | (5) | | | 0 | | | 0 | | Expected return on plan assets | (6) | | | (5) | | | 0 | | | 0 | |
| Amortization of net actuarial loss from earlier periods | Amortization of net actuarial loss from earlier periods | 2 | | | 1 | | | 0 | | | 0 | | Amortization of net actuarial loss from earlier periods | 3 | | | 1 | | | 0 | | | 0 | |
| Loss on settlement of pension obligation | | Loss on settlement of pension obligation | 7 | | | 0 | | | 0 | | | 0 | |
| | Net periodic expense | Net periodic expense | $ | 6 | | | $ | 5 | | | $ | 1 | | | $ | 1 | | Net periodic expense | $ | 12 | | | $ | 4 | | | $ | 2 | | | $ | 1 | |
| | | | Nine Months Ended September 30, | | Six Months Ended June 30, |
| | Pension Plans | | Other Retirement Plans | | Pension Plans | | Other Retirement Plans |
| | 2020 | | 2019 | | 2020 | | 2019 | | 2021 | | 2020 | | 2021 | | 2020 |
| Components of net periodic expense | Components of net periodic expense | | | | | | | | Components of net periodic expense | | | | | | | |
| Service cost | Service cost | $ | 13 | | | $ | 12 | | | $ | 2 | | | $ | 2 | | Service cost | $ | 10 | | | $ | 8 | | | $ | 2 | | | $ | 2 | |
| Interest cost | Interest cost | 13 | | | 15 | | | 1 | | | 1 | | Interest cost | 7 | | | 9 | | | 1 | | | 0 | |
| Expected return on plan assets | Expected return on plan assets | (15) | | | (15) | | | 0 | | | 0 | | Expected return on plan assets | (13) | | | (10) | | | 0 | | | 0 | |
| Amortization of net actuarial loss from earlier periods | Amortization of net actuarial loss from earlier periods | 5 | | | 3 | | | 0 | | | 0 | | Amortization of net actuarial loss from earlier periods | 5 | | | 3 | | | 0 | | | 0 | |
| Loss on settlement of pension obligation | | Loss on settlement of pension obligation | 7 | | | 0 | | | 0 | | | 0 | |
| | Net periodic expense | Net periodic expense | $ | 16 | | | $ | 15 | | | $ | 3 | | | $ | 3 | | Net periodic expense | $ | 16 | | | $ | 10 | | | $ | 3 | | | $ | 2 | |
The Company contributed $99 million to its funded pension plan, $8made contributions of $41 million related to its unfunded U.S. DBPPs and $1 million to its U.S. other retirement plans during the ninesix months ended SeptemberJune 30, 2020. Additionally,2021. Actual and anticipated contributions in 2021 for the Company anticipates making payments of $1 millionremaining plans are not expected to its unfunded U.S. DBPPs, during the remainder of 2020.be material.
NOTE 17.16. INDEBTEDNESS
The Company’s debt is recorded at its carrying amount, which represents the issuance amount plus or minus any issuance premium or discount, except for the 2012 Senior Notes due 2022, the 2017 Senior Notes due 2023, the 2017 Senior Notes due 2028 and the 2020 Senior Notes due 2025, which are recorded at the carrying amount adjusted for the fair value of an interest rate swap used to hedge the fair value of the note.
The following table summarizes total indebtedness:
| | September 30, 2020 | |
| June 30, 2021 | | June 30, 2021 |
| Notes Payable: | Notes Payable: | Principal Amount | | Fair Value of Interest Rate Swaps (1) | | Unamortized (Discount) Premium | | Unamortized Debt Issuance Costs | | Carrying Value | Notes Payable: | Principal Amount | | Fair Value of Interest Rate Swaps (1) | | Unamortized (Discount) Premium | | Unamortized Debt Issuance Costs | | Carrying Value |
| 4.50% 2012 Senior Notes, due 2022 | 4.50% 2012 Senior Notes, due 2022 | $ | 500 | | | $ | 16 | | | $ | (1) | | | $ | (1) | | | $ | 514 | | 4.50% 2012 Senior Notes, due 2022 | $ | 500 | | | $ | 10 | | | $ | 0 | | | $ | 0 | | | $ | 510 | |
| 4.875% 2013 Senior Notes, due 2024 | 4.875% 2013 Senior Notes, due 2024 | 500 | | | — | | | (1) | | | (1) | | | 498 | | 4.875% 2013 Senior Notes, due 2024 | 500 | | | 0 | | | (1) | | | (1) | | | 498 | |
| 5.25% 2014 Senior Notes (30-Year), due 2044 | 600 | | | — | | | 4 | | | (5) | | | 599 | | |
| 5.25% 2014 Senior Notes, due 2044 | | 5.25% 2014 Senior Notes, due 2044 | 600 | | | 0 | | | 3 | | | (5) | | | 598 | |
| 1.75% 2015 Senior Notes, due 2027 | 1.75% 2015 Senior Notes, due 2027 | 586 | | | — | | | 0 | | | (2) | | | 584 | | 1.75% 2015 Senior Notes, due 2027 | 593 | | | 0 | | | 0 | | | (2) | | | 591 | |
| 2.625% 2017 Senior Notes, due 2023 | 2.625% 2017 Senior Notes, due 2023 | 500 | | | 13 | | | (1) | | | (2) | | | 510 | | 2.625% 2017 Senior Notes, due 2023 | 500 | | | 9 | | | 0 | | | (1) | | | 508 | |
| 3.25% 2017 Senior Notes, due 2028 | 3.25% 2017 Senior Notes, due 2028 | 500 | | | 34 | | | (4) | | | (3) | | | 527 | | 3.25% 2017 Senior Notes, due 2028 | 500 | | | 18 | | | (4) | | | (3) | | | 511 | |
| 4.25% 2018 Senior Notes, due 2029 | 4.25% 2018 Senior Notes, due 2029 | 400 | | | — | | | (2) | | | (3) | | | 395 | | 4.25% 2018 Senior Notes, due 2029 | 400 | | | 0 | | | (2) | | | (3) | | | 395 | |
| 4.875% 2018 Senior Notes, due 2048 | 4.875% 2018 Senior Notes, due 2048 | 400 | | | — | | | (7) | | | (4) | | | 389 | | 4.875% 2018 Senior Notes, due 2048 | 400 | | | 0 | | | (6) | | | (4) | | | 390 | |
| 0.950% 2019 Senior Notes, due 2030 | 0.950% 2019 Senior Notes, due 2030 | 879 | | | — | | | (3) | | | (6) | | | 870 | | 0.950% 2019 Senior Notes, due 2030 | 889 | | | 0 | | | (3) | | | (6) | | | 880 | |
| 3.75% 2020 Senior Notes, due 2025 | 3.75% 2020 Senior Notes, due 2025 | 700 | | | (1) | | | (1) | | | (5) | | | 693 | | 3.75% 2020 Senior Notes, due 2025 | 700 | | | (5) | | | (1) | | | (4) | | | 690 | |
| 3.25% 2020 Senior Notes, due 2050 | 3.25% 2020 Senior Notes, due 2050 | 300 | | | — | | | (4) | | | (3) | | | 293 | | 3.25% 2020 Senior Notes, due 2050 | 300 | | | 0 | | | (4) | | | (3) | | | 293 | |
| 2.55% 2020 Senior Notes, due 2060 | 2.55% 2020 Senior Notes, due 2060 | 500 | | | — | | | (4) | | | (5) | | | 491 | | 2.55% 2020 Senior Notes, due 2060 | 500 | | | 0 | | | (4) | | | (5) | | | 491 | |
| | Total long-term debt | Total long-term debt | $ | 6,365 | | | $ | 62 | | | $ | (24) | | | $ | (40) | | | $ | 6,363 | | Total long-term debt | $ | 6,382 | | | $ | 32 | | | $ | (22) | | | $ | (37) | | | $ | 6,355 | |
|
| | December 31, 2019 | |
| December 31, 2020 | | December 31, 2020 |
| Notes Payable: | Notes Payable: | Principal Amount | | Fair Value of Interest Rate Swaps (1) | | Unamortized (Discount) Premium | | Unamortized Debt Issuance Costs | | Carrying Value | Notes Payable: | Principal Amount | | Fair Value of Interest Rate Swaps (1) | | Unamortized (Discount) Premium | | Unamortized Debt Issuance Costs | | Carrying Value |
| | 4.50% 2012 Senior Notes, due 2022 | 4.50% 2012 Senior Notes, due 2022 | $ | 500 | | | $ | 9 | | | $ | (1) | | | $ | (1) | | | $ | 507 | | 4.50% 2012 Senior Notes, due 2022 | $ | 500 | | | $ | 14 | | | $ | (1) | | | $ | (1) | | | $ | 512 | |
| 4.875% 2013 Senior Notes, due 2024 | 4.875% 2013 Senior Notes, due 2024 | 500 | | | — | | | (1) | | | (2) | | | 497 | | 4.875% 2013 Senior Notes, due 2024 | 500 | | | 0 | | | (1) | | | (1) | | | 498 | |
| 5.25% 2014 Senior Notes (30-Year), due 2044 | 600 | | | — | | | 4 | | | (5) | | | 599 | | |
| 5.25% 2014 Senior Notes, due 2044 | | 5.25% 2014 Senior Notes, due 2044 | 600 | | | 0 | | | 3 | | | (5) | | | 598 | |
| 1.75% 2015 Senior Notes, due 2027 | 1.75% 2015 Senior Notes, due 2027 | 561 | | | — | | | 0 | | | (3) | | | 558 | | 1.75% 2015 Senior Notes, due 2027 | 612 | | | 0 | | | 0 | | | (2) | | | 610 | |
| 2.75% 2017 Senior Notes, due 2021 | 500 | | | 11 | | | (1) | | | (2) | | | 508 | | |
| 2.625% 2017 Senior Notes, due 2023 | 2.625% 2017 Senior Notes, due 2023 | 500 | | | 7 | | | (1) | | | (2) | | | 504 | | 2.625% 2017 Senior Notes, due 2023 | 500 | | | 12 | | | 0 | | | (2) | | | 510 | |
| 3.25% 2017 Senior Notes, due 2028 | 3.25% 2017 Senior Notes, due 2028 | 500 | | | — | | | (4) | | | (3) | | | 493 | | 3.25% 2017 Senior Notes, due 2028 | 500 | | | 31 | | | (4) | | | (3) | | | 524 | |
| 3.25% 2018 Senior Notes, due 2021 | 300 | | | — | | | 0 | | | (1) | | | 299 | | |
| 4.25% 2018 Senior Notes, due 2029 | 4.25% 2018 Senior Notes, due 2029 | 400 | | | — | | | (3) | | | (3) | | | 394 | | 4.25% 2018 Senior Notes, due 2029 | 400 | | | 0 | | | (3) | | | (3) | | | 394 | |
| 4.875% 2018 Senior Notes, due 2048 | 4.875% 2018 Senior Notes, due 2048 | 400 | | | — | | | (7) | | | (4) | | | 389 | | 4.875% 2018 Senior Notes, due 2048 | 400 | | | 0 | | | (6) | | | (4) | | | 390 | |
| 0.950% 2019 Senior Notes, due 2030 | 0.950% 2019 Senior Notes, due 2030 | 842 | | | — | | | (3) | | | (6) | | | 833 | | 0.950% 2019 Senior Notes, due 2030 | 918 | | | 0 | | | (3) | | | (6) | | | 909 | |
| 3.75% 2020 Senior Notes, due 2025 | | 3.75% 2020 Senior Notes, due 2025 | 700 | | | (1) | | | (1) | | | (5) | | | 693 | |
| 3.25% 2020 Senior Notes, due 2050 | | 3.25% 2020 Senior Notes, due 2050 | 300 | | | 0 | | | (4) | | | (3) | | | 293 | |
| 2.55% 2020 Senior Notes, due 2060 | | 2.55% 2020 Senior Notes, due 2060 | 500 | | | 0 | | | (4) | | | (5) | | | 491 | |
| Total long-term debt | Total long-term debt | $ | 5,603 | | | $ | 27 | | | $ | (17) | | | $ | (32) | | | $ | 5,581 | | Total long-term debt | $ | 6,430 | | | $ | 56 | | | $ | (24) | | | $ | (40) | | | $ | 6,422 | |
|
(1) The fair value of interest rate swaps in the table above represents the cumulative amount of fair value hedging adjustments included in the carrying amount of the hedged debt.
Notes Payable
In the first nine months of 2020, the Company issued the 2020 Senior Notes (5-year), the 2020 Senior Notes (30-year) and the 2020 Senior Notes (40-year). The key terms of these debt issuances are set forth in the table above.
The Company may prepay certain amounts of its senior notes, in whole or in part, but may incur a Make-Whole Amount penalty.
In the second quarter of 2020, the Company fully repaid $300 million of the 2018 Senior Notes dueAt June 30, 2021, along with a Make-Whole Amount of approximately $8 million. In the third quarter of 2020, the Company fully repaid $500 million of the 2017 Senior Notes due 2021 along with a Make-Whole Amount of approximately $16 million. Additionally, in the third quarter of 2020, the Company recognized into interest expense, net, $17 million of carrying value adjustments relating to the early termination of interest rate swaps designated as fair value hedges that were associated with the 2017 Senior Notes due 2021.
At September 30, 2020, the Company was in compliance with all covenants contained within all of the debt agreements. All the debt agreements contain cross default provisions which state that default under one of the aforementioned debt instruments could in turn permit lenders under other debt instruments to declare borrowings outstanding under those instruments to be immediately due and payable. As of SeptemberJune 30, 2020,2021, there were no such cross defaults.
The repayment schedule for the Company’s borrowings is as follows:
| | Year Ending December 31, | Year Ending December 31, | 2012 Senior Notes due 2022 | | 2013 Senior Notes due 2024 | | 2014 Senior Notes (30-Year) due 2044 | | 2015 Senior Notes due 2027 | | 2017 Senior Notes due 2023 | | 2017 Senior Notes due 2028 | | 2018 Senior Notes due 2029 | | 2018 Senior Notes due 2048 | | 2019 Senior Notes due 2030 | | 2020 Senior Notes due 2025 | | 2020 Senior Notes due 2050 | | 2020 Senior Notes due 2060 | | | Total | Year Ending December 31, | 2012 Senior Notes due 2022 | | 2013 Senior Notes due 2024 | | 2014 Senior Notes due 2044 | | 2015 Senior Notes due 2027 | | 2017 Senior Notes due 2023 | | 2017 Senior Notes due 2028 | | 2018 Senior Notes due 2029 | | 2018 Senior Notes due 2048 | | 2019 Senior Notes due 2030 | | 2020 Senior Notes due 2025 | | 2020 Senior Notes due 2050 | | 2020 Senior Notes due 2060 | | | Total |
| 2020 (After September 30,) | $ | — | | | $ | — | | | $ | — | | | $ | — | | | $ | — | | | $ | — | | | $ | — | | | $ | — | | | $ | — | | | $ | — | | | $ | — | | | $ | — | | | | $ | 0 | | |
| 2021 | — | | | — | | | — | | | — | | | — | | | — | | | — | | | — | | | — | | | — | | | — | | | — | | | | 0 | | |
| 2021 (After June 30,) | | 2021 (After June 30,) | $ | — | | | $ | — | | | $ | — | | | $ | — | | | $ | — | | | $ | — | | | $ | — | | | $ | — | | | $ | — | | | $ | — | | | $ | — | | | $ | — | | | | $ | 0 | |
| 2022 | 2022 | 500 | | | — | | | — | | | — | | | — | | | — | | | — | | | — | | | — | | | — | | | — | | | — | | | | 500 | | 2022 | 500 | | | — | | | — | | | — | | | — | | | — | | | — | | | — | | | — | | | — | | | — | | | — | | | | 500 | |
| 2023 | 2023 | — | | | — | | | — | | | — | | | 500 | | | — | | | — | | | — | | | — | | | — | | | — | | | — | | | | 500 | | 2023 | — | | | — | | | — | | | — | | | 500 | | | — | | | — | | | — | | | — | | | — | | | — | | | — | | | | 500 | |
| 2024 | 2024 | — | | | 500 | | | — | | | — | | | — | | | — | | | — | | | — | | | — | | | — | | | — | | | — | | | | 500 | | 2024 | — | | | 500 | | | — | | | — | | | — | | | — | | | — | | | — | | | — | | | — | | | — | | | — | | | | 500 | |
| 2025 | | 2025 | — | | | — | | | — | | | — | | | — | | | — | | | — | | | — | | | — | | | 700 | | | — | | | — | | | | 700 | |
| Thereafter | Thereafter | — | | | — | | | 600 | | | 586 | | | — | | | 500 | | | 400 | | | 400 | | | 879 | | | 700 | | | 300 | | | 500 | | | | 4,865 | | Thereafter | — | | | — | | | 600 | | | 593 | | | — | | | 500 | | | 400 | | | 400 | | | 889 | | | — | | | 300 | | | 500 | | | | 4,182 | |
| Total | Total | $ | 500 | | | $ | 500 | | | $ | 600 | | | $ | 586 | | | $ | 500 | | | $ | 500 | | | $ | 400 | | | $ | 400 | | | $ | 879 | | | $ | 700 | | | $ | 300 | | | $ | 500 | | | | $ | 6,365 | | Total | $ | 500 | | | $ | 500 | | | $ | 600 | | | $ | 593 | | | $ | 500 | | | $ | 500 | | | $ | 400 | | | $ | 400 | | | $ | 889 | | | $ | 700 | | | $ | 300 | | | $ | 500 | | | | $ | 6,382 | |
Interest expense, net
The following table summarizes the components of interest as presented in the consolidated statements of operations:
| | | | | | | | | | | | | | | | | | | | | | | |
| Three Months Ended
September 30, | | Nine Months Ended
September 30, |
| 2020 | | 2019 | | 2020 | | 2019 |
| Income | $ | 2 | | | $ | 3 | | | $ | 9 | | | $ | 12 | |
| Expense on borrowings | (42) | | | (37) | | | (121) | | | (125) | |
| UTPs and other tax related liabilities | (9) | | | (7) | | | (27) | | | (20) | |
| Net periodic pension costs - interest component | (4) | | | (6) | | | (14) | | | (17) | |
| Capitalized | 0 | | | 1 | | | 0 | | | 1 | |
| Total | $ | (53) | | | $ | (46) | | | $ | (153) | | | $ | (149) | |
The following table showsoperations and the cash paid for interest:
| | | | | | | | | | | |
| Nine Months Ended
September 30, |
| 2020 | | 2019 |
| Interest paid | $ | 119 | | | $ | 149 | |
| | | | | | | | | | | | | | | | | | | | | | | |
| Three Months Ended
June 30, | | Six Months Ended
June 30, |
| 2021 | | 2020 | | 2021 | | 2020 |
| Income | $ | 1 | | | $ | 3 | | | $ | 4 | | | $ | 7 | |
| Expense on borrowings | (41) | | | (48) | | | (82) | | | (79) | |
Income (expense) on UTPs and other tax related liabilities(2) | (5) | | | (10) | | | 30 | | | (18) | |
| Net periodic pension costs - interest component | (4) | | | (5) | | | (8) | | | (10) | |
| Interest expense, net | $ | (49) | | | $ | (60) | | | $ | (56) | | | $ | (100) | |
Interest paid(1) | $ | 13 | | | $ | 23 | | | $ | 86 | | | $ | 72 | |
44(1) Interest paid includes net settlements on interest rate swaps more fully discussed in Note 9.
Table(2) Income (expense) on UTPs and other tax related liabilities for the six months ended June 30, 2021 includes a $40 million benefit relating to the reversal of Contentstax-related interest accruals pursuant to the resolution of tax matters.The fair value and carrying value of the Company’s debt as of SeptemberJune 30, 20202021 and December 31, 20192020 are as follows:
| | | September 30, 2020 | | December 31, 2019 | | June 30, 2021 | | December 31, 2020 |
| | Carrying Amount | | Estimated Fair Value | | Carrying Amount | | Estimated Fair Value | | Carrying Amount | | Estimated Fair Value | | Carrying Amount | | Estimated Fair Value |
| 4.50% 2012 Senior Notes, due 2022 | 4.50% 2012 Senior Notes, due 2022 | $ | 514 | | | $ | 535 | | | $ | 507 | | | $ | 531 | | 4.50% 2012 Senior Notes, due 2022 | $ | 510 | | | $ | 522 | | | $ | 512 | | | $ | 530 | |
| 4.875% 2013 Senior Notes, due 2024 | 4.875% 2013 Senior Notes, due 2024 | 498 | | | 565 | | | 497 | | | 551 | | 4.875% 2013 Senior Notes, due 2024 | 498 | | | 551 | | | 498 | | | 562 | |
| 5.25% 2014 Senior Notes (30-Year), due 2044 | 599 | | | 822 | | | 599 | | | 757 | | |
| 5.25% 2014 Senior Notes, due 2044 | | 5.25% 2014 Senior Notes, due 2044 | 598 | | | 808 | | | 598 | | | 828 | |
| 1.75% 2015 Senior Notes, due 2027 | 1.75% 2015 Senior Notes, due 2027 | 584 | | | 643 | | | 558 | | | 604 | | 1.75% 2015 Senior Notes, due 2027 | 591 | | | 643 | | | 610 | | | 674 | |
| 2.75% 2017 Senior Notes, due 2021 | — | | | — | | | 508 | | | 507 | | |
| 2.625% 2017 Senior Notes, due 2023 | 2.625% 2017 Senior Notes, due 2023 | 510 | | | 523 | | | 504 | | | 507 | | 2.625% 2017 Senior Notes, due 2023 | 508 | | | 516 | | | 510 | | | 522 | |
| 3.25% 2017 Senior Notes, due 2028 | 3.25% 2017 Senior Notes, due 2028 | 527 | | | 566 | | | 493 | | | 523 | | 3.25% 2017 Senior Notes, due 2028 | 511 | | | 550 | | | 524 | | | 561 | |
| 3.25% 2018 Senior Notes, due 2021 | — | | | — | | | 299 | | | 306 | | |
| 4.25% 2018 Senior Notes, due 2029 | 4.25% 2018 Senior Notes, due 2029 | 395 | | | 479 | | | 394 | | | 453 | | 4.25% 2018 Senior Notes, due 2029 | 395 | | | 465 | | | 394 | | | 480 | |
| 4.875% 2018 Senior Notes, due 2048 | 4.875% 2018 Senior Notes, due 2048 | 389 | | | 540 | | | 389 | | | 492 | | 4.875% 2018 Senior Notes, due 2048 | 390 | | | 527 | | | 390 | | | 544 | |
| 0.950% 2019 Senior Notes, due 2030 | 0.950% 2019 Senior Notes, due 2030 | 870 | | | 923 | | | 833 | | | 847 | | 0.950% 2019 Senior Notes, due 2030 | 880 | | | 919 | | | 909 | | | 974 | |
| 3.75% 2020 Senior Notes, due 2025 | 3.75% 2020 Senior Notes, due 2025 | 693 | | | 789 | | | — | | | — | | 3.75% 2020 Senior Notes, due 2025 | 690 | | | 768 | | | 693 | | | 785 | |
| 3.25% 2020 Senior Notes, due 2050 | 3.25% 2020 Senior Notes, due 2050 | 293 | | | 320 | | | — | | | — | | 3.25% 2020 Senior Notes, due 2050 | 293 | | | 313 | | | 293 | | | 329 | |
| 2.55% 2020 Senior Notes, due 2060 | 2.55% 2020 Senior Notes, due 2060 | 491 | | | 458 | | | — | | | — | | 2.55% 2020 Senior Notes, due 2060 | 491 | | | 442 | | | 491 | | | 467 | |
| Total | Total | $ | 6,363 | | | $ | 7,163 | | | $ | 5,581 | | | $ | 6,078 | | Total | $ | 6,355 | | | $ | 7,024 | | | $ | 6,422 | | | $ | 7,256 | |
The fair value of the Company’s long-term debt is estimated based on quoted market prices for similar instruments. Accordingly, the inputs used to estimate the fair value of the Company’s long-term debt are classified as Level 2 inputs within the fair value hierarchy.
NOTE 18.17. LEASES
The Company has operating leases, substantially all of which relate to the lease of office space. The Company’s leases which are classified as finance leases are not material to the consolidated financial statements. Certain of the Company’s leases include options to renew, with renewal terms that can extend the lease term from one year to 20 years at the Company’s discretion.
The following table presents the components of the Company’s lease cost:
| | | | | | | | | | | | | | | | | | | | | | | |
| Three Months Ended September 30, | | Nine Months Ended September 30, |
| 2020 | | 2019 | | 2020 | | 2019 |
| | | | | | | |
| Operating lease cost | $ | 24 | | | $ | 24 | | | $ | 72 | | | $ | 73 | |
| Sublease income | (1) | | | 0 | | | (3) | | | 0 | |
| Variable lease cost | 4 | | | 5 | | | 14 | | | 13 | |
| Total lease cost | $ | 27 | | | $ | 29 | | | $ | 83 | | | $ | 86 | |
| | | | | | | |
During the third quarter of 2020, the Company recorded $11 million of ROU Asset impairment charges related to the rationalization and exit of certain real estate leases pursuant to the 2020 Restructuring Program. The impairment charges were recorded within the Restructuring caption on the consolidated statement of operations. Refer to Note 12 for further details on the Company's 2020 Restructuring Program. | | | | | | | | | | | | | | | | | | | | | | | |
| Three Months Ended
June 30, | | Six Months Ended
June 30, |
| 2021 | | 2020 | | 2021 | | 2020 |
| | | | | | | |
| Operating lease cost | $ | 23 | | | $ | 24 | | | $ | 47 | | | $ | 48 | |
| Sublease income | (1) | | | (1) | | | (2) | | | (2) | |
| Variable lease cost | 5 | | | 5 | | | 10 | | | 10 | |
| Total lease cost | $ | 27 | | | $ | 28 | | | $ | 55 | | | $ | 56 | |
The following tables present other information related to the Company’s operating leases:
| | | Three Months Ended September 30, | | Nine Months Ended September 30, | | Three Months Ended June 30, | | Six Months Ended June 30, |
| | 2020 | | 2019 | | 2020 | | 2019 | | 2021 | | 2020 | | 2021 | | 2020 |
| Cash paid for amounts included in the measurement of operating lease liabilities | Cash paid for amounts included in the measurement of operating lease liabilities | $ | 27 | | | $ | 27 | | | $ | 80 | | | $ | 80 | | Cash paid for amounts included in the measurement of operating lease liabilities | $ | 28 | | | $ | 27 | | | $ | 56 | | | $ | 53 | |
| Right-of-use assets obtained in exchange for new operating lease liabilities | Right-of-use assets obtained in exchange for new operating lease liabilities | $ | 7 | | | $ | 12 | | | $ | 26 | | | $ | 28 | | Right-of-use assets obtained in exchange for new operating lease liabilities | $ | 2 | | | $ | 11 | | | $ | 6 | | | $ | 20 | |
| | | September 30, 2020 | | September 30, 2019 | | | June 30, 2021 | | June 30, 2020 | |
| Weighted-average remaining lease term | Weighted-average remaining lease term | 6.3 years | | 6.9 years | | Weighted-average remaining lease term | 5.6 years | | 6.5 years | |
| Weighted-average discount rate applied to operating leases | Weighted-average discount rate applied to operating leases | 3.6 | % | | 3.6 | % | | Weighted-average discount rate applied to operating leases | 3.6 | % | | 3.6 | % | |
The following table presents a maturity analysis of the future minimum lease payments included within the Company’s operating lease liabilities at SeptemberJune 30, 2020:2021:
| | Year Ending December 31, | Year Ending December 31, | | Operating Leases | Year Ending December 31, | | Operating Leases |
| 2020 (After September 30) | | $ | 27 | | |
| 2021 | | 107 | | |
| 2021 (After June 30) | | 2021 (After June 30) | | $ | 55 | |
| 2022 | 2022 | | 96 | | 2022 | | 100 | |
| 2023 | 2023 | | 90 | | 2023 | | 94 | |
| 2024 | 2024 | | 81 | | 2024 | | 85 | |
| After 2024 | | 191 | | |
| 2025 | | 2025 | | 77 | |
| After 2025 | | After 2025 | | 117 | |
| Total lease payments (undiscounted) | Total lease payments (undiscounted) | | 592 | | Total lease payments (undiscounted) | | 528 | |
| Less: Interest | Less: Interest | | 62 | | Less: Interest | | 50 | |
| Present value of lease liabilities: | Present value of lease liabilities: | | $ | 530 | | Present value of lease liabilities: | | $ | 478 | |
| Lease liabilities - current | Lease liabilities - current | | $ | 91 | | Lease liabilities - current | | $ | 92 | |
| Lease liabilities - noncurrent | Lease liabilities - noncurrent | | $ | 439 | | Lease liabilities - noncurrent | | $ | 386 | |
NOTE 19.18. CONTINGENCIES
Given the nature of the Company's activities, Moody’s and its subsidiaries are subject to legal and tax proceedings, governmental, regulatory and legislative investigations, subpoenas and other inquiries, and claims and litigation by governmental and private parties that are based on ratings assigned by MIS or that are otherwise incidental to the Company’s business. Moody’s and MIS also are subject to periodic reviews, inspections, examinations and investigations by regulators in the U.S. and other jurisdictions, any of which may result in claims, legal proceedings, assessments, fines, penalties or restrictions on business activities. Moody’s also is subject to ongoing tax audits as addressed in Note 5 to the consolidated financial statements.
Management periodically assesses the Company’s liabilities and contingencies in connection with these matters based upon the latest information available. For claims, litigation and proceedings and governmental investigations and inquiries not related to income taxes, the Company records liabilities in the consolidated financial statements when it is both probable that a liability has been incurred and the amount of loss can be reasonably estimated and periodically adjusts these as appropriate. When the reasonable estimate of the loss is within a range of amounts, the minimum amount of the range is accrued unless some higher amount within the range is a better estimate than another amount within the range. In instances when a loss is reasonably possible but uncertainties exist related to the probable outcome and/or the amount or range of loss, management does not record a liability but discloses the contingency if material. As additional information becomes available, the Company adjusts its assessments and estimates of such matters accordingly. Moody’s also discloses material pending legal proceedings pursuant to SEC rules and other pending matters as it may determine to be appropriate.
In view of the inherent difficulty of assessing the potential outcome of legal proceedings, governmental, regulatory and legislative investigations and inquiries, claims and litigation and similar matters and contingencies, particularly when the claimants seek large or indeterminate damages or assert novel legal theories or the matters involve a large number of parties, the
Company often cannot predict what the eventual outcome of the pending matters will be or the timing of any resolution of such matters. The Company also may be unable to predict the impact (if any) that any such matters may have on how its business is conducted, on its competitive position or on its financial position, results of operations or cash flows. As the process to resolve any pending matters progresses, management will continue to review the latest information available and assess its ability to predict the outcome of such matters and the effects, if any, on its operations and financial condition and to accrue for and disclose such matters as and when required. However, because such matters are inherently unpredictable and unfavorable developments or resolutions can occur, the ultimate outcome of such matters, including the amount of any loss, may differ from those estimates.
NOTE 20.19. SEGMENT INFORMATION
The Company is organized into 2 operating segments: MIS and MA and accordingly, the Company reports in 2 reportable segments: MIS and MA.
The MIS segment consists of 5 LOBs. The CFG, SFG, FIG, PPIF and PPIFSFG LOBs generate revenue principally from fees for the assignment and ongoing monitoring of credit ratings on debt obligations and the entities that issue such obligations in markets worldwide. The MIS Other LOB primarily consists of financial instruments pricing services in the Asia-Pacific region, ICRA non-ratings revenue and revenue from providing ESG research, data and assessments.
The MA segment develops a wide range of products and services that support the risk management activities of institutional participants in global financial markets. Beginning in the first quarter of 2020, theThe MA segment now consists of 2 LOBs - RD&A and ERS. Subsequent to the divestiture of MAKS in the fourth quarter of 2019, the MALS business, which was historically part of the PS LOB through December 31, 2019, was reclassified to the RD&A LOB. Prior year revenue by LOB has not been reclassified as the amounts relating to the MALS business were not material.
Revenue for MIS and expenses for MA include an intersegment royaltyfees charged to MA for the rights to use and distribute content, data and products developed by MIS. The royalty rate charged by MIS approximates the fair value of the aforementioned content, data and products and is generally based on comparable market transactions. Also,Additionally, revenue for MA and expenses for MIS include an intersegment fee charged to MIS from MA for certain MA products and services utilized in MIS’s ratings process. These intersegment fees charged by MA are generally equal tobased on the costs incurred by MA to produce thesemarket value of the products and services.services being transferred between the segments.
Overhead expenses include costs such as rent and occupancy, information technology and support staff such as finance, human resources and legal. Such costs and corporate expenses that exclusively benefit one segment are fully charged to that segment.
For overhead costs and corporate expenses that benefit both segments, costs are allocated to each segment based on the segment’s share of full-year 20182019 actual revenue which comprises a “Baseline Pool” that will remain fixed over time. In subsequent periods, incremental overhead costs (or reductions thereof) will be allocated to each segment based on the prevailing shares of total revenue represented by each segment.
“Eliminations” in the following table represent intersegment revenue/expense. Moody’s does not report the Company’s assets by reportable segment, as this metric is not used by the chief operating decision maker to allocate resources to the segments. Consequently, it is not practical to show assets by reportable segment.
Financial Information by Segment
The table below shows revenue, operating income and Adjusted Operating Income by reportable segment. Adjusted Operating Income is a financial metric utilized by the Company’s chief operating decision maker to assess the profitability of each reportable segment. Refer to Note 3 for further details on the components of the Company’s revenue. | | | | | | | | | | | | | | | | | | | | | | | | | | | | | | | | | | | | | | | | | | | | | | | |
| Three Months Ended June 30, |
| 2021 | | 2020 |
| MIS | | MA | | Eliminations | | Consolidated | | MIS | | MA | | Eliminations | | Consolidated |
| Revenue | $ | 1,022 | | | $ | 575 | | | $ | (44) | | | $ | 1,553 | | | $ | 973 | | | $ | 499 | | | $ | (37) | | | $ | 1,435 | |
| Total Expenses | 362 | | | 434 | | | (44) | | | 752 | | | 369 | | | 393 | | | (37) | | | 725 | |
| Operating income | 660 | | | 141 | | | 0 | | | 801 | | | 604 | | | 106 | | | 0 | | | 710 | |
| Add: | | | | | | |
| | | | | | | | |
Depreciation and
amortization | 18 | | | 42 | | | 0 | | | 60 | | | 19 | | | 39 | | | 0 | | | 58 | |
| | | | | | | | | | | | | | | |
| Restructuring | 0 | | | 0 | | | 0 | | | 0 | | | 0 | | | (2) | | | 0 | | | (2) | |
| | | | | | | | | | | | | | | |
| | | | | | | | | | | | | | | |
| Adjusted Operating Income | $ | 678 | | | $ | 183 | | | $ | 0 | | | $ | 861 | | | $ | 623 | | | $ | 143 | | | $ | 0 | | | $ | 766 | |
| | | | | | | | | | | | | | | | | | | | | | | | | | | | | | | | | | | | | | | | | | | | | | | |
| | | | | | | | | | | | | | | |
| Three Months Ended September 30, |
| 2020 | | 2019 |
| MIS | | MA | | Eliminations | | Consolidated | | MIS | | MA | | Eliminations | | Consolidated |
| Revenue | $ | 863 | | | $ | 532 | | | $ | (39) | | | $ | 1,356 | | | $ | 781 | | | $ | 496 | | | $ | (37) | | | $ | 1,240 | |
| Total Expense | 339 | | | 414 | | | (39) | | | 714 | | | 340 | | | 388 | | | (37) | | | 691 | |
| Operating income | 524 | | | 118 | | | 0 | | | 642 | | | 441 | | | 108 | | | 0 | | | 549 | |
| Add: | | | | | | | | | | | | | | | |
| Restructuring | 13 | | | 10 | | | 0 | | | 23 | | | 0 | | | (1) | | | 0 | | | (1) | |
Depreciation and amortization | 17 | | | 39 | | | 0 | | | 56 | | | 18 | | | 30 | | | 0 | | | 48 | |
| | | | | | | | | | | | | | | |
| Loss pursuant to the divestiture of MAKS | 0 | | | 0 | | | 0 | | | 0 | | | 0 | | | 2 | | | 0 | | | 2 | |
| Captive insurance company settlement | 0 | | | 0 | | | 0 | | | 0 | | | 10 | | | 6 | | | 0 | | | 16 | |
| Adjusted Operating Income | $ | 554 | | | $ | 167 | | | $ | 0 | | | $ | 721 | | | $ | 469 | | | $ | 145 | | | $ | 0 | | | $ | 614 | |
| | | | | | | | | | | | | | | | | | | | | | | | | | | | | | | | | | | | | | | | | | | | | | | |
| Nine Months Ended September 30, |
| 2020 | | 2019 |
| MIS | | MA | | Eliminations | | Consolidated | | MIS | | MA | | Eliminations | | Consolidated |
| Revenue | $ | 2,667 | | | $ | 1,529 | | | $ | (115) | | | $ | 4,081 | | | $ | 2,255 | | | $ | 1,448 | | | $ | (107) | | | $ | 3,596 | |
| Total Expenses | 1,051 | | | 1,201 | | | (115) | | | 2,137 | | | 1,028 | | | 1,181 | | | (107) | | | 2,102 | |
| Operating income | 1,616 | | | 328 | | | 0 | | | 1,944 | | | 1,227 | | | 267 | | | 0 | | | 1,494 | |
| Add: | | | | | | |
| | | | | | | | |
| Restructuring | 12 | | | 8 | | | 0 | | | 20 | | | 29 | | | 29 | | | 0 | | | 58 | |
Depreciation and amortization | 52 | | | 111 | | | 0 | | | 163 | | | 53 | | | 97 | | | 0 | | | 150 | |
Acquisition-Related Expenses | 0 | | | 0 | | | 0 | | | 0 | | | 0 | | | 3 | | | 0 | | | 3 | |
| Loss pursuant to the divestiture of MAKS | 0 | | | 9 | | | 0 | | | 9 | | | 0 | | | 11 | | | 0 | | | 11 | |
| Captive insurance company settlement | 0 | | | 0 | | | 0 | | | 0 | | | 10 | | | 6 | | | 0 | | | 16 | |
| Adjusted Operating Income | $ | 1,680 | | | $ | 456 | | | $ | 0 | | | $ | 2,136 | | | $ | 1,319 | | | $ | 413 | | | $ | 0 | | | $ | 1,732 | |
The cumulative restructuring charges related to the 2018 Restructuring Program, as more fully discussed in Note 12, for the MIS and MA reportable segments are $62 million and $44 million, respectively.
The cumulative restructuring charges related to the 2020 Restructuring Program, as more fully discussed in Note 12, for the MIS and MA reportable segments are $13 million and $10 million, respectively.
| | | | | | | | | | | | | | | | | | | | | | | | | | | | | | | | | | | | | | | | | | | | | | | |
| Six Months Ended June 30, |
| 2021 | | 2020 |
| MIS | | MA | | Eliminations | | Consolidated | | MIS | | MA | | Eliminations | | Consolidated |
| Revenue | $ | 2,098 | | | $ | 1,141 | | | $ | (86) | | | $ | 3,153 | | | $ | 1,804 | | | $ | 997 | | | $ | (76) | | | $ | 2,725 | |
| Total Expenses | 728 | | | 857 | | | (86) | | | 1,499 | | | 712 | | | 787 | | | (76) | | | 1,423 | |
| Operating income | 1,370 | | | 284 | | | 0 | | | 1,654 | | | 1,092 | | | 210 | | | 0 | | | 1,302 | |
| Add: | | | | | | |
| | | | | | | | |
Depreciation and
amortization | 36 | | | 83 | | | 0 | | | 119 | | | 35 | | | 72 | | | 0 | | | 107 | |
| | | | | | | | | | | | | | | |
| Restructuring | 0 | | | 2 | | | 0 | | | 2 | | | (1) | | | (2) | | | 0 | | | (3) | |
| Loss pursuant to the divestiture of MAKS | 0 | | | 0 | | | 0 | | | 0 | | | 0 | | | 9 | | | 0 | | | 9 | |
| | | | | | | | | | | | | | | |
| Adjusted Operating Income | $ | 1,406 | | | $ | 369 | | | $ | 0 | | | $ | 1,775 | | | $ | 1,126 | | | $ | 289 | | | $ | 0 | | | $ | 1,415 | |
Consolidated Revenue Information by Geographic Area
| | | Three Months Ended September 30, | | Nine Months Ended September 30, | | Three Months Ended June 30, | | Six Months Ended June 30, |
| | 2020 | | 2019 | | 2020 | | 2019 | | 2021 | | 2020 | | 2021 | | 2020 |
| United States | United States | $ | 729 | | | $ | 660 | | | $ | 2,280 | | | $ | 1,910 | | United States | $ | 831 | | | $ | 837 | | | $ | 1,716 | | | $ | 1,551 | |
| Non-U.S.: | Non-U.S.: | | Non-U.S.: | |
| EMEA | EMEA | 401 | | | 362 | | | 1,137 | | | 1,057 | | EMEA | 481 | | | 373 | | | 959 | | | 736 | |
| Asia-Pacific | Asia-Pacific | 156 | | | 142 | | | 436 | | | 415 | | Asia-Pacific | 155 | | | 144 | | | 311 | | | 280 | |
| Americas | Americas | 70 | | | 76 | | | 228 | | | 214 | | Americas | 86 | | | 81 | | | 167 | | | 158 | |
| Total Non-U.S. | Total Non-U.S. | 627 | | | 580 | | | 1,801 | | | 1,686 | | Total Non-U.S. | 722 | | | 598 | | | 1,437 | | | 1,174 | |
| Total | Total | $ | 1,356 | | | $ | 1,240 | | | $ | 4,081 | | | $ | 3,596 | | Total | $ | 1,553 | | | $ | 1,435 | | | $ | 3,153 | | | $ | 2,725 | |
NOTE 21. RECENTLY ISSUED ACCOUNTING STANDARDS
In August 2018, the FASB issued ASU No. 2018-14, “Compensation—Retirement Benefits—Defined Benefit Plans—General (Subtopic 715- 20): Disclosure Framework—Changes to the Disclosure Requirements for Defined Benefit Plans”. This ASU eliminates requirements for certain disclosures and requires additional disclosures under defined benefit pension plans and other postretirement plans. The ASU is effective for all entities for fiscal years beginning after December 15, 2020 on a retrospective basis to all periods presented, with early adoption permitted. The Company will comply with the new disclosure requirements set forth in this ASU upon adoption.
In April 2019, the FASB issued ASU No. 2019-04, “Codification Improvements to Topic 326, Financial Instruments—Credit Losses, Topic 815, Derivatives and Hedging, and Topic 825 Financial Instruments”. This ASU clarifies and improves guidance related to the recently issued standards updates on credit losses, hedging, and recognition and measurement of financial instruments. This ASU is effective for fiscal years beginning after December 15, 2020, with early adoption permitted. The Company does not anticipate that the adoption of this ASU will have a significant impact on its consolidated financial statements.
In December 2019, the FASB issued ASU No. 2019-12, "Income Taxes (Topic 740): Simplifying the Accounting for Income Taxes". This ASU simplifies the accounting for income taxes by eliminating certain exceptions to the general principles in Topic 740, Income Taxes, and clarifies certain aspects of the existing guidance to promote consistency among reporting entities. Most amendments within this ASU are required to be applied on a prospective basis, while certain amendments must be applied on a retrospective or modified retrospective basis. This ASU is effective for fiscal years beginning after December 15, 2020, with early adoption permitted. The Company does not anticipate that the adoption of this ASU will have a significant impact on its consolidated financial statements.
NOTE 22.20. SUBSEQUENT EVENTSEVENT
On October 21, 2020, the Company completed the acquisition of Acquire Media (AM), an aggregator and distributor of curated real-time news, multimedia, data, and alerts. The purchase price for this acquisition was not material and the near-term impact to the Company's financial statements is not expected to be material.
On OctoberJuly 27, 2020,2021, the Board approved the declaration of a quarterly dividend of $0.56$0.62 per share of Moody’s common stock, payable on December 14, 2020September 10, 2021 to shareholders of record at the close of business on November 23, 2020.
Item 2. MANAGEMENT’S DISCUSSION AND ANALYSIS OF FINANCIAL CONDITION AND RESULTS OF OPERATIONS
This discussion and analysis of financial condition and results of operations should be read in conjunction with the Moody’s Corporation condensed consolidated financial statements and notes thereto included elsewhere in this quarterly report on Form 10-Q.
This Management’s Discussion and Analysis of Financial Condition and Results of Operations contains Forward-Looking Statements. See “Forward-Looking Statements” commencing on page 9181 for a discussion of uncertainties, risks and other factors associated with these statements.
THE COMPANY
Moody’s is a provider of (i) credit ratingsglobal integrated risk assessment firm that empowers organizations and assessment services; (ii) credit, capital markets and economic research, data and analytical tools; (iii) software solutions that support financial risk management activities; (iv) quantitatively derived credit scores; (v) learning solutions and certification services; and (vi) company information and business intelligence products.investors to make better decisions. Moody’s reports in two reportable segments: MIS and MA.
MIS the credit rating agency, publishes credit ratings and provides assessment services on a wide range of debt obligations, programs and facilities, and the entities that issue such obligations in markets worldwide.worldwide, including various corporate, financial institution and governmental obligations, and structured finance securities. Revenue is primarily derived from the originators and issuers of such transactions who use MIS ratings in the distribution of their debt issues to investors. Additionally, MIS earns revenue from certain non-ratings-related operations, which consist primarily of financial instrument pricing services in the Asia-Pacific region, revenue from ICRA’s non-ratings operations and revenue from providing ESG research, data and assessments.assessments and revenue from ICRA’s non-ratings operations. The revenue from these operations is included in the MIS Other LOB and is not material to the results of the MIS segment.
MA provides financial intelligenceis a global provider of data and analytical tools to assist businesses in makinganalytic solutions which help companies make better and faster decisions. MA’s portfolio of solutions consists of specialized research, data,analytic models, industry insights, software and professional services, which are assembled to support the financial analysis and risk management activities of institutional customers worldwide.
Corporate Social Responsibility
Moody’s believes that knowledge fuels opportunity. The core of Moody’s business is to provide credit ratings, research, tools and analysis that helpproprietary data assets allow companies to equip participantsinform and perform many critical business activities with trust and confidence. MA’s approach to aggregating, broadening and deepening available data, research, analytic tools and software solutions fosters a more integrated and efficient delivery to MA's customers resulting in the global financial markets to understandbetter decisions around risks and make important investment decisions with critical insight. Moody’s global corporate social responsibility (CSR) efforts are rooted in that same approach. Moody’s is committed to working to empower people with the knowledge, resources and confidence they need to create a better future – for themselves, their communities and the environment.opportunities.
The CSR Council, chaired by President and CEO Raymond W. McDaniel, Jr. and comprised of members of the management team, evaluates the Company’s CSR progress and generates recommendations on its CSR strategy. The CSR Working Group, comprised of senior executives, is then charged with implementing the Company’s CSR strategy. In addition, the Company’s Board of Directors oversees sustainability matters, with assistance from the Governance & Nominating Committee, as part of its oversight of management and the Company’s overall strategy. For more information on Moody’s approach to CSR, see moodys.com/csr. The content of this website is not incorporated by reference herein.
Sustainability
Moody’s manages its business with the goal of delivering value to all of its stakeholders, including its customers, employees, business partners, local communities and stockholders. As part of this effort, Moody’s advances sustainability by considering Environmental, Social,environmental, social, and Governance (ESG)governance (“ESG”) factors throughout its operations and two business segments.products and services. It uses its expertise and assets to make a positive difference through technology tools, research and analytical services that help other organizations and the investor community better understand the links between sustainability considerations and the global markets. Moody’s efforts to promote sustainability-related thought leadership, assessments and data to market participants include following the policies of recognized sustainability and corporate social responsibility partiesorganizations that develop standards or frameworks and/or evaluate and assess performance, including the Global Reporting Initiative (GRI) and, Sustainability Accounting Standards Board (SASB), and most recently World Economic Forum (WEF). Moody’s sustainability-related achievements have included the following: (i) reporting using recommendations from SASB; (ii) becoming a signatory to the Principles for Responsible Investment; (iii) joining the United Nations Global Compact; and (iv) issuingMoody's also issues an annual reportsreport on how the Company has implemented the recommendations of the Task Force on Climate-related Financial Disclosures (TCFD).(“TCFD”) recommendations. In the second quarter of 2021, Moody's published its progress through Moody's 2020 Stakeholder Sustainability Report, 2020 TCFD Report, 2020 GRI Report, 2020 SASB Report and 2020 WEF Report.
its oversight of management and the Company’s overall strategy. COVID-19
The Company iscontinues to closely monitoringmonitor the impact of the COVID-19 pandemic on all aspects of its business. While the Company has selectively reopened certain of its offices, Moody’s continues to require remote work for most employees globally and has operated effectively to date. The Company continues to monitor regional developments relating to the COVID-19 pandemic to inform decisions on the reopening of its offices.offices and its business travel policies. The Company has selectively reopened certain of its offices, most on a limited capacity basis.
The Company experienced disruption in certain sectors ofCOVID-19 pandemic has not had a material adverse impact on the Company's reported results to date and is currently not expected to have a material adverse impact on its business beginning late in the first quarter of 2020 resulting from market volatility associated with the COVID-19 crisis.near-term outlook. However, at the date of the filing of this quarterly report on Form 10-Q, the CompanyMoody's is unable to predict either the potential near-term or longer-term impact that the COVID-19 crisispandemic may have on its business, future results of operations, financial position and operating resultsor cash flows due to numerous uncertainties regardinguncertainties. Refer to Item 1A. “Risk Factors”, contained in the duration and severityCompany’s annual report on Form 10-K for the year ended December 31, 2020 for further disclosure relating to the risks of the crisis. As a result, it is reasonably possible that the Company could experience material impacts including, but not limited to: reductions in revenue and cash flows; additional credit losses related to accounts receivables; asset impairment charges; and changes in the funded status of defined benefit pension plans. While it is reasonably possible that the COVID-19 crisis will have a material impactpandemic on the resultsCompany's business.
In the first nine months of 2020, in order to maximize liquidity and to increase available cash on hand through this period of uncertainty, the Company added $700 million in additional long-term borrowings as more fully discussed in the section entitled "Liquidity and Capital Resources" below and in Note 17 to the condensed consolidated financial statements. In addition, the Company has reduced discretionary spending, including temporarily suspending its share repurchase program beginning late in the first quarter of 2020 and spanning through the third quarter. The Company anticipates resuming its share repurchase program in the fourth quarter of 2020.
The Coronavirus Aid, Relief, and Economic Security Act (“CARES Act”) was enacted on March 27, 2020 in the United States. The Company is utilizing certain provisions in the CARES Act and other IRS guidance which permit the deferral of certain income and payroll tax remittances.
Critical Accounting Estimates
Moody’s discussion and analysis of its financial condition and results of operations are based on the Company’s consolidated financial statements, which have been prepared in accordance with accounting principles generally accepted in the United States. The preparation of these financial statements requires Moody’s to make estimates and judgments that affect reported amounts of assets and liabilities and related disclosures of contingent assets and liabilities at the dates of the financial statements and revenue and expenses during the reporting periods. These estimates are based on historical experience and on other assumptions that are believed to be reasonable under the circumstances. On an ongoing basis, Moody’s evaluates its estimates, including those related to revenue recognition, accounts receivable allowances, contingencies, restructuring, goodwill and acquired intangible assets, pension and other retirement benefits, stock-based compensation, and income taxes. Actual results may differ from these estimates under different assumptions or conditions. Item 7, MD&A, in the Company’s annual report on Form 10-K for the year ended December 31, 2019,2020, includes descriptions of some of the judgments that Moody’s makes in applying its accounting estimates in these areas. Since the date of the annual report on Form 10-K, there have been no material changes to the Company’s critical accounting estimates other than certain updates below relating to i)goodwill resulting from a reorganization of reporting units in the MA segment.
Goodwill
This update should be read in conjunction with the critical accounting estimate disclosures relating to goodwill to update the Company's goodwill impairment assessments in 2020 and ii) to update the critical accounting estimate disclosures for the Company's accounts receivable allowances to align with the adoption of ASU 2016-13, "Financial Instruments - Credit Losses (Topic 326): Measurement of Credit Losses on Financial Instruments".
Goodwill
As of July 31st of each year, Moody’s evaluates its goodwill for impairment at the reporting unit level, defined as an operating segment (i.e., MIS and MA), or one level below an operating segment (i.e., a component of an operating segment).
The Company has seven primary reporting units: two within the Company’s ratings business (one for the ICRA business and one that encompasses all of Moody’s other ratings operations) and five reporting units within MA: Content, ERS, MALS, Bureau van Dijk and Reis. The Content reporting unit offers subscription-based research, data and analytical products, including credit ratings produced by MIS, credit research, quantitative credit scores and other analytical tools, economic research and forecasts, business intelligence and company information products. The ERS reporting unit provides products and services that support the credit risk management and regulatory compliance activities of financial institutions and also provides advanced actuarial software for the life insurance industry. These products and services are primarily sold on a subscription basis or delivered via software that is licensed on a perpetual basis. The MALS reporting unit consists of the portion of the MA business that offers both credit training as well as other professional development training. The Bureau van Dijk reporting unit primarily
consists of the Bureau van Dijk business and the newly acquired RDC business, and provides business intelligence, company information products and risk and compliance intelligence. The Reis reporting unit, which consists of the Reis business, provides commercial real estate market information and analytical tools.
The Company evaluates the recoverability of goodwill using a two-step impairment test approach at the reporting unit level. In the first step, the Company assesses various qualitative factors to determine whether the fair value of a reporting unit may be less than its carrying amount. If a determination is made based on the qualitative factors that an impairment does not exist, the Company is not required to perform further testing. If the aforementioned qualitative assessment results in the Company concluding that it is more likely than not that the fair value of a reporting unit may be less than its carrying amount, the fair value of the reporting unit will be quantitatively determined and compared to its carrying value including goodwill. If the fair value of the reporting unit exceeds the carrying value of the net assets assigned to that unit, goodwill is not impaired. If the fair value of the reporting unit is less than the carrying value, the Company will record a goodwill impairment charge for the amount by which the carrying value exceeds the reporting unit’s fair value. The Company evaluates its reporting units on an annual basis, or more frequently if there are changes in the reporting structure of the Company due to acquisitions, realignments or if there are indicators of potential impairment. For the reporting units where the Company is consistently able to conclude that no impairment exists using only a qualitative approach, the Company’s accounting policy is to perform the second step of the aforementioned goodwill impairment assessment at least once every three years.
Interim goodwill impairment assessments performed in advance of the Company's annual assessment
During the first half of 2020, the observable market capitalization of ICRA declined to a level that resulted in a significant decline in headroom (the amount by which the fair value of a reporting unit exceeds its carrying value) from amounts reported in the Company's Form 10-K for the year ended December 31, 2019. ICRA is a publicly traded company in India, and accordingly2020.
Prior to the Company is able to derive its fair value based on its observable average market capitalization (plus a control premium) over a relatively short durationsecond quarter of time. While the estimate of the fair value of the ICRA2021, MA's reporting unit resulted in no impairmentstructure consisted of goodwill5 reporting units (Content, ERS, MALS, Bureau van Dijk and Reis). Pursuant to a strategic reorganization in the first halfMA segment which was completed in the second quarter of 2020, further declines in ICRA's average market capitalization could2021, MA's reporting unit structure has been reorganized into 2 reporting units. MA’s 2 new reporting units generally consist of: i) businesses offering data and data-driven analytical solutions; and ii) risk-management software, workflow and CRE solutions. This reorganization did not result in impairment in future quarters.
As discussed in further detail in Note 11a change to the Company's condensed consolidated financial statements, ICRA has reported that it has completed its internal examinations into anonymous allegations that were forwarded to ICRA by SEBI and certain additional allegations made during the course of that examination while an examination into a separate anonymous complaint is ongoing. ICRA reported that its Board of Directors is in the process of taking appropriate actions based on the findings of the completed examinations. As of the date of this quarterly report on Form 10-Q, the Company is unable to estimatereportable segments.
the financial impact, if any, that may result from a potential unfavorable conclusion of these matters or any other ICRA inquiry. An unfavorable resolution of such matters may negatively impact ICRA’s future operating results, which could result in an impairment of goodwill and amortizable intangible assets in future.
At June 30, 2020, the Company performed an interim quantitative goodwill impairment assessment on the Reis reporting unit (acquired in October 2018), which resulted in no impairment of goodwill. The Company performed this quantitative assessment in response to a decline in projected cash flows relative to Reis' acquisition case projections and included the estimated impact of the COVID-19 crisis on the business. While the fair value at June 30, 2020 of the Reis reporting unit exceeded its carrying value, further declines in its financial projections could result in impairment in future quarters.
Annual goodwill impairment assessment performed at July 31, 2020
At July 31, 2020, the Company performed a qualitative assessment for eachassessments of the reporting units. Theunits impacted by the reorganization immediately before and after the reorganization became effective. These qualitative analysesassessments resulted in the Company determining that it was not more likely than not that the fair value of any reporting unit was less than its carrying amount.
DeterminingThe Company will perform a quantitative assessment on the fair value of anew reporting unit or an indefinite-lived acquired intangible asset involves the use of significant estimates and assumptions, which are more fully described below. In addition, the Company also makes certain judgments and assumptions in allocating shared assets and liabilities to determine the carrying values for each of its reporting units.
Other assets and liabilities, including applicable corporate assets, are allocated to the extent they are related to the operation of respective reporting units.
Sensitivity Analysis and Key Assumptions for Deriving the Fair Value of a Reporting Unit
The following table identifies the amount of goodwill allocated to each reporting unitunits as of September 30, 2020 and the amount by which the net assets of each reporting unit would exceed the fair value under Step 2 of the goodwill impairment test as prescribed in ASC Topic 350, assuming hypothetical reductions in their fair values as ofJuly 31, 2021, the date of the last quantitativeCompany’s annual goodwill impairment assessment, for eachwhich will provide new baseline valuations under the new reporting unit (June 30, 2020 for ICRA and Reis; July 31, 2019 for all remaining reporting units).
| | | | | | | | | | | | | | | | | | | | | | | | | | | | | |
| | | Sensitivity Analysis |
| | | Deficit Caused by a Hypothetical Reduction to Fair Value |
| Goodwill | | 10% | | 20% | | 30% | | 40% |
| MIS | $ | 95 | | | $ | — | | | $ | — | | | $ | — | | | $ | — | |
| Content | 371 | | | — | | | — | | | — | | | — | |
| ERS | 745 | | | — | | | — | | | — | | | — | |
| MALS | 123 | | | — | | | — | | | (12) | | | (37) | |
| ICRA | 207 | | | — | | | (2) | | | (44) | | | (85) | |
| Bureau van Dijk | 2,594 | | | — | | | — | | | — | | | (266) | |
| Reis | 147 | | | — | | | (22) | | | (48) | | | (74) | |
| Totals | $ | 4,282 | | | $ | — | | | $ | (24) | | | $ | (104) | | | $ | (462) | |
Methodologies and significant estimates utilized in determining the fair value of reporting units:
The following is a discussion regarding the Company’s methodology for determining the fair value of its reporting units as of the date of each reporting unit’s last quantitative assessment (June 30, 2020 for Reis and ICRA; and July 31, 2019 for the remaining reporting units). As ICRA is a publicly traded company in India, the Company estimates its fair value using its observable market capitalization.
The fair value of each reporting unit, excluding ICRA, was estimated using a discounted cash flow methodology and comparable public company and precedent transaction multiples. The discounted cash flow analysis requires significant estimates, including projections of future operating results and cash flows of each reporting unit that are based on internal budgets and strategic plans, expected long-term growth rates, terminal values, weighted average cost of capital and the effects of external factors and market conditions. Changes in these estimates and assumptions could materially affect the estimated fair value of each reporting unit that could result in an impairment charge to reduce the carrying value of goodwill, which could be material to the Company’s financial position and results of operations. Moody’s allocates newly acquired goodwill to reporting units based on the reporting unit expected to benefit from the acquisition.
The sensitivity analysis on the future cash flows and WACC assumptions described below are as of each reporting unit’s last quantitative goodwill impairment assessment. The following discusses the key assumptions utilized in the discounted cash flow valuation methodology that require significant management judgment:
–Future cash flow assumptions - The projections for future cash flows utilized in the models are derived from historical experience and assumptions regarding future growth and profitability of each reporting unit. These projections are consistent with the Company’s operating budget and strategic plan. Beyond the forecasted period, a terminal value was determined using a perpetuity growth rate based on inflation and real GDP growth rates. A sensitivity analysis of the revenue growth rates was performed on all reporting units. For each reporting unit analyzed, a 10% reduction in the revenue growth rates used would not have resulted in its carrying value exceeding its estimated fair value.
–WACC - The WACC is the rate used to discount each reporting unit’s estimated future cash flows. The WACC is calculated based on the proportionate weighting of the cost of debt and equity. The cost of equity is based on a risk-free interest rate and an equity risk factor, which is derived from public companies similar to the reporting unit and which captures the perceived risks and uncertainties associated with the reporting unit’s cash flows. The cost of debt component is calculated as the weighted average cost associated with all of the Company’s outstanding borrowings as of the date of the impairment test and was immaterial to the computation of the WACC. The cost of debt and equity is weighted based on the debt to market capitalization ratio of publicly traded companies with similarities to the reporting unit being tested. The WACC applied in each reporting unit's last quantitative test ranged from 8.5% to 9.0%. Differences in the WACC used between reporting units is primarily due to distinct risks and uncertainties regarding the cash flows of the different reporting units. A sensitivity analysis of the WACC was performed on all reporting units. For each reporting unit
analyzed, an increase in the WACC of one percentage point would not result in the carrying value of the reporting unit exceeding its fair value.
Accounts Receivable Allowances
On January 1, 2020, the Company adopted ASU No. 2016-13, “Financial Instruments—Credit Losses (Topic 326): Measurement of Credit Losses on Financial Instruments” as more fully described in Note 1 to the condensed consolidated financial statements. As the Company's accounts receivable are short-term in nature, the adoption of this ASU did not have a material impact to the Company's allowance for bad debts or its policies and procedures for determining the allowance.
In order to determine an estimate of expected credit losses, receivables are segmented based on similar risk characteristics including historical credit loss patterns and industry or class of customers to calculate reserve rates. The Company uses an aging method for developing its allowance for credit losses by which receivable balances are grouped based on aging category. A reserve rate is calculated for each aging category which is generally based on historical information. The reserve rate is adjusted, when necessary, for current conditions (e.g., macroeconomic or industry related) and reasonable and supportable forecasts about the future. The Company also considers customer specific information (e.g., bankruptcy or financial difficulty) when estimating its expected credit losses, as well as the economic environment of the customers, both from an industry and geographic perspective, in evaluating the need for allowances. Expected credit losses are reflected as additions to the accounts receivable allowance. Actual uncollectible account write-offs are recorded against the allowance.
In 2020, Moody's assessment included consideration of the current COVID-19 pandemic and its estimated impact on the Company's accounts receivable allowances. This assessment involved the utilization of significant judgment regarding the severity and duration of the market disruption caused by the pandemic, as well as judgment regarding which industries, classes of customers and geographies would be most significantly impacted.structure.
Reportable Segments
The Company is organized into two reportable segments at SeptemberJune 30, 2020:2021: MIS and MA, which are more fully described in the section entitled “The Company” above and in Note 2019 to the condensed consolidated financial statements.
RESULTS OF OPERATIONS
Potential Impact of COVID-19 on the Company's future operating results
–The Company is closely monitoring the impact of COVID-19 on all aspects of its business (refer to the section above entitled "COVID-19" for further detail). The operating results discussed below may not be indicative of future quarterly results of the Company due to uncertainties relating to the duration and severity of the pandemic and its potential impact on Moody's. The Company remains committed to disciplined cost management through this period of uncertainty.
–As of the date of the filing of this quarterly report on Form 10-Q, the Company believes the most significant near-term impacts to Moody's business may be:
–MIS: within the MIS segment, the most notable near-term impacts are likely to be:
–the potential for continued volatility in issuance. The Company observed significant market disruption and a widening of credit spreads late in the first quarter of 2020, followed by strong corporate bond issuance activity in the second and third quarters of 2020. Future market volatility and widening of credit spreads could have a material impact on MIS's near-term operating results;
–corporate debt issuance (both investment-grade and speculative-grade) may moderate compared to issuance levels observed in the first nine months of 2020. While issuance has been strong in the first nine months of 2020, a portion of this activity has resulted from corporate issuers bolstering their balance sheets in light of uncertainties regarding the COVID-19 pandemic;
–potential full-year 2020 declines in leveraged loan issuance could result in a decrease in availability of collateral for securitization activity, which could then result in further declines in CLO activity.
–MA: within the MA segment, the most notable near-term impacts are likely to be:
–reductions in discretionary spending by MA’s customer base and social distancing measures could result in fewer new sales opportunities being identified and an extension of sales cycles on existing opportunities, particularly related to software sales;
–postponement of certain compliance deadlines (e.g., CECL for financial institutions and IFRS 17 for insurers) may delay sales for MA solutions that address these requirements;
–higher attrition rates and/or lower yields on renewable contracts.
Impact of acquisitions/divestitures on comparative results
–Moody’s completed the following acquisitions, which impact the Company's year-over-year comparative results:
–Vigeo Eiris on April 12, 2019;
–Four Twenty Seven on July 22, 2019;
–RiskFirst on July 25, 2019;
–ABS Suite on October 1, 2019;
–Regulatory DataCorp on February 13, 2020.2020;
–On November 8, 2019, the Company sold its MAKS business to Equistone Partners Europe Limited, a European private equity firm. The operating results of MAKS are reported within the MA segment (and PS LOB) through the November 8, 2019 closing of the transaction. Beginning in 2020, revenue from the Moody's Analytics Learning Solutions ("MALS") unit, which previous to 2020 was reported in the PS LOB, is now reported as part of the RD&A LOB. Prior periods have not been reclassified as the amounts were not material.Acquire Media on October 21, 2020;
–ZM Financial Systems on December 7, 2020;
–Catylist on December 30, 2020; and
–Cortera on March 19, 2021.
Refer to the section entitled "Non-GAAP Financial Measures" of this MD&A for the definitions of how the Company determines certain organic growth measures used in this MD&A that exclude the impact of acquisition/divestiture activity.
Three months ended SeptemberJune 30, 20202021 compared with three months ended SeptemberJune 30, 20192020
Executive Summary
–The following table provides an executive summary of key operating results for the quarter ended SeptemberJune 30, 2020.2021. Following this executive summary is a more detailed discussion of the Company’s operating results as well as a discussion of the operating results of the Company’s reportable segments.
| | | Three Months Ended September 30, | | | Three Months Ended June 30, | |
| Financial measure: | Financial measure: | 2020 | 2019 | % Change | Insight and Key Drivers of Change Compared to Prior Year | Financial measure: | 2021 | 2020 | % Change Favorable
(Unfavorable) | Insight and Key Drivers of Change Compared to Prior Year |
| Moody's total revenue | Moody's total revenue | $ | 1,356 | | $ | 1,240 | | 9 | % | — reflects strong growth in both segments | Moody's total revenue | $ | 1,553 | | $ | 1,435 | | 8 | % | — reflects strong growth in both segments. |
| MIS External Revenue | MIS External Revenue | $ | 825 | | $ | 746 | | 11 | % | — growth driven by higher corporate debt issuance (both investment-grade and speculative-grade) as issuers took advantage of low borrowing costs for refinancing purposes and M&A activity | MIS External Revenue | $ | 980 | | $ | 938 | | 4 | % | — strong growth in leveraged finance issuance as issuers continued to take advantage of favorable market conditions to refinance existing debt and fund M&A activity; and — favorable changes in FX translation rates; partially offset by: — declines in investment-grade rated issuance volumes compared to a strong prior year period |
| MA External Revenue | MA External Revenue | $ | 531 | | $ | 494 | | 7 | % | — growth in know-your-customer (KYC) and compliance solutions, as well as research and data feeds; — demand for insurance compliance products along with credit assessment and loan origination solutions in ERS; and — inorganic growth from acquisitions. | MA External Revenue | $ | 573 | | $ | 497 | | 15 | % | — strong growth in KYC and compliance solutions, as well as research and data feeds; — ongoing recurring revenue growth in ERS from subscription-based sales to banking, insurance and asset management customers; — favorable changes in FX translation rates; and — inorganic growth from acquisitions. |
Total operating and SG&A expenses | Total operating and SG&A expenses | $ | 635 | | $ | 642 | | (1) | % | In line with prior year with key offsetting drivers being: — additional compensation expense resulting from hiring activity and merit increases coupled with higher incentive compensation aligned with financial and operating performance; — higher costs to support the Company’s initiative to enhance technology infrastructure to enable automation, innovation and efficiency as well as to support business growth; offset by — lower travel costs and disciplined cost management in light of the COVID-19 crisis; — lower legal accruals | Total operating and SG&A
expenses | $ | 692 | | $ | 669 | | (3 | %) | — growth in compensation costs mainly reflecting higher incentive and stock-based compensation accruals aligned with operating performance; — unfavorable changes in FX translation rates; and — inorganic expense growth from acquisitions; partially offset by: — lower legal accruals. |
| Restructuring | $ | 23 | | $ | (1) | | NM | — charge in 2020 is pursuant to the Company's restructuring program revolving around the rationalization and exit of certain real estate leases in response to the COVID-19 pandemic | |
| | Total non-operating (expense) income, net | | Total non-operating (expense) income, net | $ | (43) | | $ | (44) | | 2 | % | — generally in line with prior year |
| Operating Margin | Operating Margin | 47.3 | % | 44.3 | % | 300BPS | — margin expansion reflects strong revenue growth coupled with operating expenses in line with prior year | Operating Margin | 51.6 | % | 49.5 | % | 210BPS | — margin expansion reflects strong revenue growth outpacing operating expense growth |
| Adjusted Operating Margin | Adjusted Operating Margin | 53.2 | % | 49.5 | % | 370BPS | Adjusted Operating Margin | 55.4 | % | 53.4 | % | 200BPS |
| ETR | ETR | 22.0 | % | 25.3 | % | (330BPS) | — decrease primarily due to a deferred tax benefit in 2020 resulting from a non-U.S. corporate reorganization | ETR | 23.9 | % | 23.6 | % | (30BPS) | — generally in line with prior year |
| Diluted EPS | Diluted EPS | $ | 2.47 | | $ | 1.99 | | 24 | % | — increase reflects strong operating income/Adjusted Operating Income growth as described above | Diluted EPS | $ | 3.07 | | $ | 2.69 | | 14 | % | — increase reflects aforementioned strong operating income/Adjusted Operating Income growth |
| Adjusted Diluted EPS | Adjusted Diluted EPS | $ | 2.69 | | $ | 2.15 | | 25 | % | Adjusted Diluted EPS | $ | 3.22 | | $ | 2.81 | | 15 | % |
Moody's Corporation
| | | | | | | | | | | | | | | | | |
| Three Months Ended September 30, | | % Change Favorable (Unfavorable) |
| 2020 | | 2019 | |
| Revenue: | | | | | |
| United States | $ | 729 | | | $ | 660 | | | 10 | % |
| Non-U.S.: | | | | | |
| EMEA | 401 | | | 362 | | | 11 | % |
| Asia-Pacific | 156 | | | 142 | | | 10 | % |
| Americas | 70 | | | 76 | | | (8 | %) |
| Total Non-U.S. | 627 | | | 580 | | | 8 | % |
| Total | 1,356 | | | 1,240 | | | 9 | % |
| Expenses: | | | | | |
| Operating | 364 | | | 350 | | | (4 | %) |
| SG&A | 271 | | | 292 | | | 7 | % |
| Restructuring | 23 | | | (1) | | | NM |
| Depreciation and amortization | 56 | | | 48 | | | (17 | %) |
| | | | | |
| Loss pursuant to the divestiture of MAKS | — | | | 2 | | | 100 | % |
| | | | | |
| Total | 714 | | | 691 | | | (3 | %) |
| Operating income | $ | 642 | | | $ | 549 | | | 17 | % |
Adjusted Operating Income (1) | $ | 721 | | | $ | 614 | | | 17 | % |
| Interest expense, net | $ | (53) | | | $ | (46) | | | (15 | %) |
| Other non-operating income, net | 10 | | | 10 | | | — | % |
| Non-operating (expense) income, net | $ | (43) | | | $ | (36) | | | (19 | %) |
| | | | | |
| Net income attributable to Moody's | $ | 467 | | | $ | 380 | | | 23 | % |
| Diluted weighted average shares outstanding | 189.3 | | | 191.1 | | | 1 | % |
| Diluted EPS attributable to Moody's common shareholders | $ | 2.47 | | | $ | 1.99 | | | 24 | % |
Adjusted Diluted EPS (1) | $ | 2.69 | | | $ | 2.15 | | | 25 | % |
| Operating margin | 47.3 | % | | 44.3 | % | | |
Adjusted Operating Margin(1) | 53.2 | % | | 49.5 | % | | |
| Effective tax rate | 22.0 | % | | 25.3 | % | | |
| | | | | | | | | | | | | | | | | |
| Three Months Ended June 30, | | % Change Favorable (Unfavorable) |
| 2021 | | 2020 | |
| Revenue: | | | | | |
| United States | $ | 831 | | | $ | 837 | | | (1 | %) |
| Non-U.S.: | | | | | |
| EMEA | 481 | | | 373 | | | 29 | % |
| Asia-Pacific | 155 | | | 144 | | | 8 | % |
| Americas | 86 | | | 81 | | | 6 | % |
| Total Non-U.S. | 722 | | | 598 | | | 21 | % |
| Total | 1,553 | | | 1,435 | | | 8 | % |
| Expenses: | | | | | |
| Operating | 365 | | | 362 | | | (1 | %) |
| SG&A | 327 | | | 307 | | | (7 | %) |
| Depreciation and amortization | 60 | | | 58 | | | (3 | %) |
| Restructuring | — | | | (2) | | | NM |
| | | | | |
| | | | | |
| | | | | |
| Total | 752 | | | 725 | | | (4 | %) |
| Operating income | $ | 801 | | | $ | 710 | | | 13 | % |
Adjusted Operating Income (1) | $ | 861 | | | $ | 766 | | | 12 | % |
| Interest expense, net | $ | (49) | | | $ | (60) | | | 18 | % |
| Other non-operating income, net | 6 | | | 16 | | | (63 | %) |
| Non-operating (expense) income, net | $ | (43) | | | $ | (44) | | | 2 | % |
| | | | | |
| Net income attributable to Moody's | $ | 577 | | | $ | 509 | | | 13 | % |
| Diluted weighted average shares outstanding | 187.9 | | | 189.0 | | | 1 | % |
| Diluted EPS attributable to Moody's common shareholders | $ | 3.07 | | | $ | 2.69 | | | 14 | % |
Adjusted Diluted EPS (1) | $ | 3.22 | | | $ | 2.81 | | | 15 | % |
| Operating margin | 51.6 | % | | 49.5 | % | | |
Adjusted Operating Margin(1) | 55.4 | % | | 53.4 | % | | |
| Effective tax rate | 23.9 | % | | 23.6 | % | | |
(1) Adjusted Operating Income, Adjusted Operating Margin and Adjusted Diluted EPS are non-GAAP financial measures. Refer to the section entitled "Non-GAAP Financial Measures" of this Management Discussion and Analysis for further information regarding these measures.
The table below shows Moody’s global staffing by geographic area:
| | | | | | | | | | | | | | | | | |
| September 30, | | % Change |
| 2020 | | 2019 | |
| United States | 4,087 | | | 3,875 | | | 5 | % |
| Non-U.S. | 7,310 | | | 9,850 | | | (26 | %) |
| Total | 11,397 | | (1) | 13,725 | | | (17 | %) |
| | | | | | | | | | | | | | | | | | | | | | | | | |
|
| | | June 30, | | | | Change |
| | | 2021 | | 2020 | | | | % |
| MIS | | | | | | | | |
| U.S. | | 1,441 | | | 1,518 | | | | | (5 | %) |
| Non-U.S. | | 3,586 | | | 3,467 | | | | | 3 | % |
| Total | | 5,027 | | | 4,985 | | | | | 1 | % |
| | | | | | | | | |
| MA | | | | | | | | |
| U.S. | | 2,039 | | | 1,831 | | | | | 11 | % |
| Non-U.S. | | 2,921 | | | 3,036 | | | | | (4 | %) |
| Total | | 4,960 | | | 4,867 | | | | | 2 | % |
| MSS |
| U.S. | | 679 | | | 703 | | | | | (3 | %) |
| Non-U.S. | | 876 | | | 724 | | | | | 21 | % |
| Total | | 1,555 | | | 1,427 | | | | | 9 | % |
| Total MCO | | | | | | | | |
| U.S. | | 4,159 | | | 4,052 | | | | | 3 | % |
| Non-U.S. | | 7,383 | | | 7,227 | | | | | 2 | % |
| Total | | 11,542 | | | 11,279 | | | | | 2 | % |
(1)The divestiture of the MAKS business resulted in a reduction of approximately 2,700 employees, most of which were in low-cost jurisdictions. Additionally, Moody’s global staffing increased by approximately 150240 employees relating to acquisitions completed subsequent to SeptemberJune 30, 2019.2020.
GLOBAL REVENUE
20202021---------------------------------------------------------------------------------------------------------------------------------------------------------------------------------------------------------20192020
________________________________________________________________________________________________________________________________________________________________________________________________________________________________________________________
| | | | | | | | | | | | | | | | | |
Global revenue ⇑ $116$118 million | U.S. Revenue ⇑ $69⇓ $6 million | Non-U.S. Revenue ⇑ $47 $124 million |
The increase in global revenue reflected growth across all regions for MA and growth internationally in both reportable segments.MIS. This growth was partially offset by declines in U.S. MIS revenue compared to a strong prior year. Refer to the section entitled “Segment Results” of this MD&A for a more fulsome discussion of the Company’s segment revenue.
–The increase in both U.S. and non-U.S. revenue reflects strong growth in both reportable segments
–Foreign currency translation favorably impacted non-U.S.global revenue by twothree percent.
| | | | | | | | | |
| | Operating Expense ⇑ $14 million
| | | SG&A Expense ⇓ $21 million
|
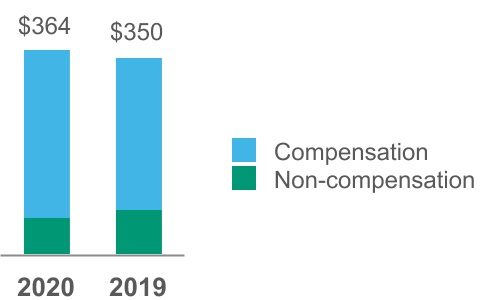
-------------------------------------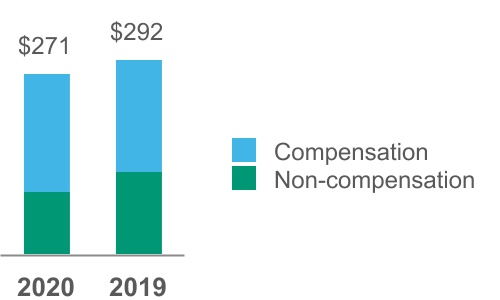
| | | | | | | | | | | | | | | | | | | | | |
| | Compensation expenses increased $29Operating Expense ⇑ $3 million reflecting: | | | | Compensation expenses increased $10SG&A Expense ⇑ $20 million reflecting: | |
| | — hiring activity and salary increases coupled with net inorganic growth from acquisitions/divestiture activity; and | | | | — hiring activity and salary increases coupled with net inorganic growth from acquisitions/divestiture activity; and | |
| | — higher incentive compensation accruals | | | | — higher incentive compensation accruals. | |
| | | | | | | | | |
| | Non-compensation expenses decreased $15 million reflecting: | | | | Non-compensation expenses decreased $31 million reflecting: | |
| | — lower travel costs and disciplined cost management in light of the COVID-19 crisis. | | | | — lower legal accruals, which includes a $16 million captive insurance company settlement in 2019; and | |
| | | | | | | — lower travel costs and disciplined cost management in light of the COVID-19 crisis; partially offset by: | |
| | | | | | — higher costs to support the Company’s initiative to enhance technology infrastructure to enable automation, innovation and efficiency as well as to support business growth. | |
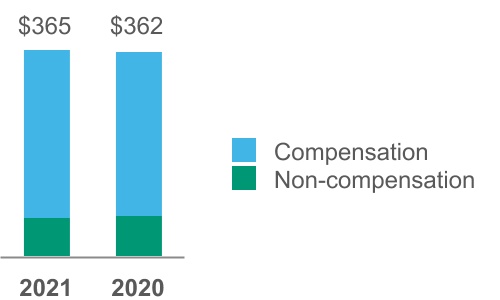
The restructuring charge of $23 million primarily relates to the non-cash impairment of certain leased real estate assets (ROU Assets and leasehold improvements) pursuant to the rationalization and exit of certain real estate leases in response to the COVID-19 pandemic. This restructuring program is more fully discussed in Note 12 to the condensed consolidated financial statements.
| | | | | | | | | |
| | Operating margin 47.3%, up 300 BPS | | | Adjusted Operating Margin 53.2%, up 370 BPS |
| | | | | | | | | | | | | | |
| Compensation expenses increased $7 million reflecting: | | | | Compensation expenses increased $30 million reflecting: | |
| — higher incentive and stock-based compensation accruals aligned with actual/projected financial and operating performance. Incentive compensation accruals in 2020 were lower reflecting uncertainties at the time relating to the COVID-19 pandemic; | | | | — higher incentive and stock-based compensation accruals aligned with actual/projected financial and operating performance. Incentive compensation accruals in 2020 were lower reflecting uncertainties at the time relating to the COVID-19 pandemic; | |
— Operating marginhiring and Adjusted Operating Margin expansion reflects strong revenuesalary increases, including inorganic growth of acquisitions; and | | | | — hiring and salary increases, including inorganic growth of acquisitions; and | |
| | | | | |
| — unfavorable changes in FX translation rates | | | | — unfavorable changes in FX translation rates | |
| | | | | |
| Non-compensation expenses decreased $4 million reflecting: | | | | Non-compensation expenses decreased $10 million reflecting: | |
— ongoing disciplined cost management; mostly offset by: — higher costs relating to strategic initiatives to support business growth coupled with operating expenses generally in lineenhancements to technology infrastructure to enable automation, innovation and efficiency; and —inorganic growth from acquisitions | | | | — lower legal accruals; | |
| | | — ongoing disciplined cost management; partially offset by: | |
| | | — higher costs relating to strategic initiatives to support business growth coupled with the prior yearenhancements to technology infrastructure to enable automation, innovation and efficiency; and — inorganic growth from acquisitions | |
| | | | | | |
| | | | | | | | | |
| | Operating margin 51.6%, up 210 BPS | | | Adjusted Operating Margin 55.4%, up 200 BPS |
Operating margin and Adjusted Operating Margin expansion reflects revenue growth outpacing growth in total operating expenses.
| | | | | | | | | |
| | Interest Expense, net ⇑ $7⇓ $11 million | | | Other non-operating income was in line with prior year⇓ $10 million |
| | | | | | | | | | | | | | |
IncreaseDecrease in expense is primarily due to: | | Overall,Decrease in line with the prior yearincome is primarily due to: |
— a $16an $8 million prepayment penalty onin the second quarter of 2020 related to the early redemption of the 20172018 Senior Notes due 2021Notes. | | — a $9 million benefit in 2020 relating to statute of limitations lapses on certain indemnification obligations relating to the MAKS divestiture; and |
| | |
— higher interest expense reflecting an additional $700a $7 million loss on the settlement of long-term borrowingspension obligations in 2020 (further discussion in "Liquidity and Capital Resources" below);2021 resulting from lump sum distributions from the Company's defined benefit pension plans; partially offset by: |
| | | — $2 million in FX gains in 2021 compared to $8 million in FX losses in the prior year. |
| | | |
— a $17 million benefit from a fair value hedge settled in connection with the early redemption of the 2017 Senior Notes | | |
| | | |
| | |
| | | |
The decrease2021 ETR was generally in the ETR is primarily due to a deferred tax benefit resulting from a non-U.S. corporate reorganization.line with prior year.
| | | | | | | | | |
| | Diluted EPS ⇑ $0.48 $0.38 | | | Adjusted Diluted EPS ⇑ $0.54 $0.41 |
| | | | | | | | |
Diluted EPS in the thirdsecond quarter of 20202021 of $2.47$3.07 increased $0.48$0.38 compared to the same period in 20192020 mainly due to higher operating income. | | Adjusted Diluted EPS of $2.69$3.22 in the thirdsecond quarter of 20202021 increased $0.54$0.41 compared to the same period in 2019,2020, mainly due to higher Adjusted Operating Income (referIncome. Refer to the section entitled “Non-GAAP Financial Measures” of this MD&A for items excluded in the derivation of Adjusted Diluted EPS).EPS. |
Segment Results
Moody’s Investors Service
The table below provides a summary of revenue and operating results, followed by further insight and commentary:
| | | | | | | | | | | | | | | | | |
| Three Months Ended September 30, | | % Change Favorable (Unfavorable) |
| 2020 | | 2019 | |
| Revenue: | | | | | |
| Corporate finance (CFG) | $ | 461 | | | $ | 392 | | | 18 | % |
| Structured finance (SFG) | 88 | | | 105 | | | (16 | %) |
| Financial institutions (FIG) | 134 | | | 120 | | | 12 | % |
| Public, project and infrastructure finance (PPIF) | 133 | | | 120 | | | 11 | % |
| Total ratings revenue | 816 | | | 737 | | | 11 | % |
| MIS Other | 9 | | | 9 | | | — | % |
| Total external revenue | 825 | | | 746 | | | 11 | % |
| Intersegment royalty | 38 | | | 35 | | | 9 | % |
| Total MIS revenue | 863 | | | 781 | | | 10 | % |
| Expenses: | |
| Operating and SG&A (external) | 308 | | | 320 | | | 4 | % |
| Operating and SG&A (intersegment) | 1 | | | 2 | | | 50 | % |
| Restructuring | 13 | | | — | | | NM |
| Depreciation and amortization | 17 | | | 18 | | | 6 | % |
| Total expense | 339 | | | 340 | | | — | % |
| Operating Income | $ | 524 | | | $ | 441 | | | 19 | % |
| Restructuring | 13 | | | — | | | NM |
| Depreciation and amortization | 17 | | | 18 | | | 6 | % |
| Captive insurance company settlement | — | | | 10 | | | 100 | % |
| Adjusted Operating Income | $ | 554 | | | $ | 469 | | | 18 | % |
| | | | | |
| Operating margin | 60.7 | % | | 56.5 | % | | |
| Adjusted Operating Margin | 64.2 | % | | 60.1 | % | | |
| | | | | | | | | | | | | | | | | |
| Three Months Ended June 30, | | % Change Favorable (Unfavorable) |
| 2021 | | 2020 | |
| Revenue: | | | | | |
| Corporate finance (CFG) | $ | 550 | | | $ | 572 | | | (4 | %) |
| Financial institutions (FIG) | 150 | | | 142 | | | 6 | % |
| Public, project and infrastructure finance (PPIF) | 130 | | | 133 | | | (2 | %) |
| Structured finance (SFG) | 140 | | | 81 | | | 73 | % |
| Total ratings revenue | 970 | | | 928 | | | 5 | % |
| MIS Other | 10 | | | 10 | | | — | % |
| Total external revenue | 980 | | | 938 | | | 4 | % |
| Intersegment revenue | 42 | | | 35 | | | 20 | % |
| Total MIS revenue | 1,022 | | | 973 | | | 5 | % |
| Expenses: | |
| Operating and SG&A (external) | 342 | | | 348 | | | 2 | % |
| Operating and SG&A (intersegment) | 2 | | | 2 | | | — | % |
| Depreciation and amortization | 18 | | | 19 | | | 5 | % |
| | | | | |
| Total expense | 362 | | | 369 | | | 2 | % |
| Operating Income | $ | 660 | | | $ | 604 | | | 9 | % |
| Depreciation and amortization | 18 | | | 19 | | | 5 | % |
| | | | | |
| | | | | |
| Adjusted Operating Income | $ | 678 | | | $ | 623 | | | 9 | % |
| | | | | |
| Operating margin | 64.6 | % | | 62.1 | % | | |
| Adjusted Operating Margin | 66.3 | % | | 64.0 | % | | |
MOODY'S INVESTORS SERVICE REVENUE
20202021---------------------------------------------------------------------------------------------------------------------------------------------------------------------------------------------------------20192020
________________________________________________________________________________________________________________________________________________________________________________________________________________________________________________________
| | | | | | | | |
MIS: Global revenue ⇑ $79$42 million | U.S. Revenue ⇑ $52⇓ $34 million | Non-U.S. Revenue ⇑ $27 $76 million |
–The increase in global MIS revenue reflected growth across all ratings LOBs excluding SFG.
–The growth in U.S. revenue mainly reflected higher CFG revenue beinginternationally partially offset by declines in SFG.
–The increase in non-U.S. revenue primarily reflected growth in CFG and FIG.the U.S. compared to a strong comparative prior year.
–Foreign currency translation favorably impacted non-U.S. MIS revenue by two percentage points.
–Transaction revenue grew $70$22 million compared to the same period in the prior year.
CFG REVENUE
20202021---------------------------------------------------------------------------------------------------------------------------------------------------------------------------------------------------------20192020
________________________________________________________________________________________________________________________________________________________________________________________________________________________________________________________
| | | | | | | | |
CFG: Global revenue ⇑ $69⇓ $22 million | U.S. Revenue ⇑ $52⇓ $68 million | Non-U.S. Revenue ⇑ $17$46 million |
Global CFG revenue for the three months ended SeptemberJune 30, 20202021 and 20192020 was comprised as follows:follows:
(1) Other includes: recurring monitoring fees of a rated debt obligation and/or entities that issue such obligations as well as fees from programs such as commercial paper, medium term notes, and ICRA corporate finance revenue.
The increasedecrease in CFG revenue of 18%4% reflected growth bothdeclines in the U.S. (20%(16%) andpartially offset by growth internationally (13%(29%). The most notable drivers of the change compared to 2020 were:
–declines in investment-grade rated issuance volumes in all regions, most notably in the U.S., compared to very strong issuance in the prior year period when large corporate issuers opportunistically bolstered their liquidity positions in light of uncertainties surrounding the COVID-19 crisis;
partially offset by:
–strong growth in leveraged loan and speculative-grade bond activity in the U.S. and EMEA as issuers refinanced existing debt in light of favorable market conditions and funded M&A activity.
Transaction revenue grew $65declined $30 million compared to the same period in the prior year. The most notable drivers of theForeign currency translation favorably impacted CFG growth consisted of:revenue by two percentage points.
FIG REVENUE
–2021growth in both high-yield and investment-grade bond issuance as credit spreads declined for much of the third quarter of -----------------------------------------------------------------------------------2020 which resulted in:
–opportunistic refinancing in advance of potential volatility in the fourth quarter surrounding the U.S. presidential election;
–issuance to support M&A activity.
–benefits from favorable changes in product mix and pricing increases;
partially offset by:
–a decline in rated issuance volumes in U.S. bank loans reflecting issuer and investor preference for corporate bonds, which provided more favorable borrowing rates.
SFG REVENUE
2020----------------------------------------------------------------------------------------------------------------------2019
________________________________________________________________________________________________________________________________________________________________________________________________________________________________________________________
| | | | | | | | |
SFG:FIG: Global revenue ⇓ $17⇑ $8 million
| U.S. Revenue ⇓ $14$1 million | Non-U.S. Revenue ⇓ $3⇑ $9 million |
Global SFGFIG revenue for the three months ended SeptemberJune 30, 20202021 and 20192020 was comprised as follows:
62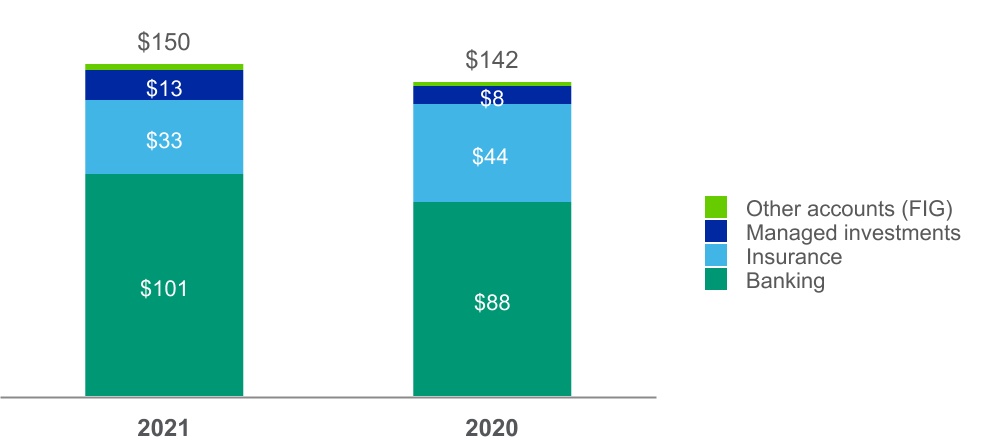
The decrease in SFG revenue of 16% primarily reflected declines in the U.S. (21%). Transaction revenue declined $17increased $3 million compared to the thirdsecond quarter of 2019. 2020.
The most notable drivers of the decline6% increase in SFGFIG revenue were:
–a reduction in CLO securitization activity (both new formation and refinancing activity)higher banking revenue in the U.S. reflecting:and EMEA mainly reflecting a favorable change in product mix and pricing increases;
partially offset by
–elevated credit spreads and macroeconomiclower U.S. insurance revenue as insurers had fortified their balance sheets in the prior year in response to uncertainties relatingrelated to the COVID-19 pandemic;crisis.
–a decline in available collateral (see discussion on bank loan issuance in CFG section above);
–an increasingly competitive landscape in this asset class.Foreign currency translation favorably impacted FIG revenue by three percentage points.
PPIF REVENUE
20202021---------------------------------------------------------------------------------------------------------------------------------------------------------------------------------------------------------20192020
________________________________________________________________________________________________________________________________________________________________________________________________________________________________________________________
| | | | | | | | |
FIG:PPIF: Global revenue ⇑ $14⇓ $3 million
| U.S. Revenue ⇑ $5⇓ $8 million | Non-U.S. Revenue ⇑ $9$5 million |
Global FIGPPIF revenue for the three months ended SeptemberJune 30, 20202021 and 20192020 was comprised as follows:
Transaction revenue increased $11decreased $8 million compared to the thirdsecond quarter of 2019.2020.
The 12% increasemodest decline in FIGPPIF revenue of 2% reflected a decrease in the U.S. (9%) partially offset by growth internationally (11%).
The decrease in revenue was mainly duea result of a strong prior year comparative period in infrastructure finance where issuers were bolstering their balance sheets in response to higher bankinguncertainties relating to the COVID-19 crisis.
Foreign currency translation favorably impacted PPIF revenue both in the U.S. and internationally reflecting a favorable issuance mix.by two percentage points.
SFG REVENUE
PPIF REVENUE
2020----------------------------------------------------------------------------------------------------------------------2019
__________________________________________________________________________________________________________________________________________________________
| | | | | | | | |
PPIF:SFG: Global revenue ⇑ $13$59 million
| U.S. Revenue ⇑ $9$43 million | Non-U.S. Revenue ⇑ $4$16 million |
Global PPIFSFG revenue for the three months ended SeptemberJune 30, 20202021 and 20192020 was comprised as follows:
The 73% increase in SFG revenue reflected growth both in the U.S. (96%) and internationally (44%). Transaction revenue increased $10$57 million compared to the thirdsecond quarter of 2020.
The 11%most notable drivers of the growth in SFG revenue were:
–higher CLO refinancing and securitization activity in the U.S. and EMEA as market conditions remain favorable for this asset class; and
–an increase in PPIFU.S. CMBS activity reflecting a narrowing of credit spreads for this asset class compared to a challenging prior year period when securitization activity for retail and hotel properties was adversely impacted by the COVID-19 crisis.
Foreign currency translation favorably impacted SFG revenue primarily consisted of growth in U.S. public finance issuance volumes reflecting favorable market conditions, including refinancing by way of taxable transactions.
| | | | |
| | MIS: Operating and SG&A Expense ⇓ $12$6 million |
The modest decline is primarily due to lower non-compensation costs of $37$22 million partially offset by growth inhigher compensation costs of $25$16 million with the most notable drivers reflecting:
| | | | | | | | |
Non-compensationCompensation costs | | CompensationNon-compensation costs |
| The increase is primarily due to: | | The decrease is primarily due to: |
— lower legalhigher incentive and stock-based compensation accruals aligned with actual/projected financial and operating performance. Incentive compensation accruals in 2020 which includes a $10 million captive insurance company settlementwere lower reflecting uncertainties at the time relating to the COVID-19 pandemic; and
— unfavorable changes in 2019FX translation rates | | — higher costs reflecting hiring activity and salary increases coupled with higher incentive compensationlower legal accruals; partially offset by: |
— lower travel costs and disciplined expense managementunfavorable changes in light of the COVID-19 crisis; partially offset byFX translation rates | | — benefits from the 2018 Restructuring Program. |
|
— higher costs to support the Company’s initiative to enhance technology infrastructure to enable automation, innovation and efficiency as well as to support business growth. | | |
| |
The restructuring charge of $13 million in the third quarter of 2020 primarily relates to the non-cash impairment of certain leased real estate assets (ROU Assets and leasehold improvements) pursuant to the rationalization and exit of certain real estate leases in response to the COVID-19 pandemic. This restructuring program is more fully discussed in Note 12 to the condensed consolidated financial statements.
| | | | | | | | | |
| | MIS: Operating Margin 60.7% 64.6% ⇑ 420250 BPS | | | Adjusted Operating Margin 64.2% 66.3% ⇑ 410230 BPS |
MIS operating margin and Adjusted Operating Margin both increased reflecting strong revenue growth coupled with declinesa decline in operating and SG&A expenses.
Moody’s Analytics
The table below provides a summary of revenue and operating results, followed by further insight and commentary:
| | | | | | | | | | | | | | | | | |
| Three Months Ended September 30, | | % Change Favorable (Unfavorable) |
| 2020 | | 2019 | |
| Revenue: | | | | | |
| Research, data and analytics (RD&A) | $ | 386 | | | $ | 317 | | | 22 | % |
| Enterprise risk solutions (ERS) | 145 | | | 134 | | | 8 | % |
| Professional services (PS) | — | | | 43 | | | (100 | %) |
| Total external revenue | 531 | | | 494 | | | 7 | % |
| Intersegment revenue | 1 | | | 2 | | | (50 | %) |
| Total MA revenue | 532 | | | 496 | | | 7 | % |
| Expenses: | | | | | |
| Operating and SG&A (external) | 327 | | | 322 | | | (2 | %) |
| Operating and SG&A (intersegment) | 38 | | | 35 | | | (9 | %) |
| Restructuring | 10 | | | (1) | | | NM |
| Depreciation and amortization | 39 | | | 30 | | | (30 | %) |
| | | | | |
| Loss pursuant to the divestiture of MAKS | — | | | 2 | | | 100 | % |
| Total expense | 414 | | | 388 | | | (7 | %) |
| Operating income | $ | 118 | | | $ | 108 | | | 9 | % |
| Restructuring | 10 | | | (1) | | | NM |
| Depreciation and amortization | 39 | | | 30 | | | (30 | %) |
| | | | | |
| Loss pursuant to the divestiture of MAKS | — | | | 2 | | | 100 | % |
| Captive insurance company settlement | — | | | 6 | | | 100 | % |
| Adjusted Operating Income | $ | 167 | | | $ | 145 | | | 15 | % |
| | | | | |
| Operating margin | 22.2 | % | | 21.8 | % | | |
| Adjusted Operating Margin | 31.4 | % | | 29.2 | % | | |
| | | | | | | | | | | | | | | | | |
| Three Months Ended June 30, | | % Change Favorable (Unfavorable) |
| 2021 | | 2020 | |
| Revenue: | | | | | |
| Research, data and analytics (RD&A) | $ | 435 | | | $ | 366 | | | 19 | % |
| Enterprise risk solutions (ERS) | 138 | | | 131 | | | 5 | % |
| | | | | |
| Total external revenue | 573 | | | 497 | | | 15 | % |
| Intersegment revenue | 2 | | | 2 | | | — | % |
| Total MA revenue | 575 | | | 499 | | | 15 | % |
| Expenses: | | | | | |
| Operating and SG&A (external) | 350 | | | 321 | | | (9 | %) |
| Operating and SG&A (intersegment) | 42 | | | 35 | | | (20 | %) |
| Depreciation and amortization | 42 | | | 39 | | | (8 | %) |
| Restructuring | — | | | (2) | | | NM |
| | | | | |
| | | | | |
| Total expense | 434 | | | 393 | | | (10 | %) |
| Operating income | $ | 141 | | | $ | 106 | | | 33 | % |
| Depreciation and amortization | 42 | | | 39 | | | (8 | %) |
| Restructuring | — | | | (2) | | | NM |
| | | | | |
| | | | | |
| | | | | |
| Adjusted Operating Income | $ | 183 | | | $ | 143 | | | 28 | % |
| | | | | |
| Operating margin | 24.5 | % | | 21.2 | % | | |
| Adjusted Operating Margin | 31.8 | % | | 28.7 | % | | |
MOODY'S ANALYTICS REVENUE
20202021---------------------------------------------------------------------------------------------------------------------------------------------------------------------------------------------------------20192020
________________________________________________________________________________________________________________________________________________________________________________________________________________________________________________________
| | | | | | | | |
MA: Global revenue ⇑ $37 $76 million | U.S. Revenue ⇑ $17 $28 million | Non-U.S. Revenue ⇑ $20 $48 million |
The 7%15% increase in global MA revenue reflects strong growth both in RD&Athe U.S. and ERS, whichinternationally in both LOBs and includes revenue from the acquisitions of RDC, RiskFirstAM, ZMFS, Catylist and ABS Suite. These increases were partially offset by a decline in revenue resulting from the divestiture of the MAKS business in the fourth quarter of 2019.Cortera.
–Organic revenue growth (1) was 9%13%.
–Foreign currency translation favorably impacted MA revenue by twofive percent.
–The increase in U.S. and non U.S. revenue reflected growth in both RD&A and ERS.
–The growth in non-U.S. revenue was partially offset by the negative impact of the divestiture of the MAKS business in the fourth quarter of 2019.
–Foreign currency translation favorably impacted non-U.S. MA revenue by three percent.
–The increase in relationship revenue as a percentage of total revenue from 84% in the third quarter of 2019 to 90% in the same period of 2020 reflects the divestiture of the transaction revenue-based MAKS business in 2019.
(1) Refer to the section entitled "Non-GAAP Financial Measures" of this MD&A for the definition and methodology that the Company utilizes to calculate this metric.
RD&A REVENUE
20202021---------------------------------------------------------------------------------------------------------------------------------------------------------------------------------------------------------20192020
_________________________________________________________________________________________________________________________________________________________________________________________________________
| | | | | | | | |
RD&A: Global revenue ⇑ $69 million | U.S. Revenue ⇑ $28 $23 million | Non-U.S. Revenue ⇑ $41 $46 million |
Global RD&A revenue grew 22%19% compared to the thirdsecond quarter of 20192020 with the most notable drivers of the change reflecting:
–inorganic revenue growth from the acquisitions of RDCcontinued demand for KYC and ABS Suite;compliance solutions reflecting increased customer and supplier risk data usage;
–strong renewals and new sales ofrelated to credit research and data feeds in the trailing twelve month period;feeds; and
–strong demand for solutions that address customer identity requirements, such as know-your-customer, anti-money laundering, anti-briberyinorganic revenue growth from the acquisitions of AM, Catylist, and sanctions compliance over the trailing twelve month period.Cortera.
Foreign currency translation favorably impacted RD&A revenue by twofive percent.
Organic revenue growth for RD&A was 12%16%.
ERS REVENUE
20202021---------------------------------------------------------------------------------------------------------------------------------------------------------------------------------------------------------20192020
______________________________________________________________________________________________________________________________________________________________________________________________________________________________________________________________________
| | | | | | | | |
ERS: Global revenue ⇑ $11$7 million | U.S. Revenue ⇑ $7$5 million | Non-U.S. Revenue ⇑ $4$2 million |
Global ERS revenue increased 8%5% compared to the thirdsecond quarter of 2019 with the most notable drivers of the growth reflecting:2020 mainly driven by:
–continued strong demand for credit assessment and loan origination solutions;
–increased demandgrowth in subscription-based revenue, most notably for actuarial modeling tools in support of certain international accounting standards relating to insurance contracts;contracts and demand from asset managers for risk management solutions;
–Favorable foreign currency translation which impacted revenue by four percent; and
–inorganic revenue growth from the acquisition of RiskFirst.ZMFS;
partially offset by:
–lower non-recurring software revenue and services due to a de-emphasizing of these lower margin offerings.
Organic revenue growth for ERS was 7%3%.
| | | | |
| | MA: Operating and SG&A Expense ⇑ $5$29 million |
The increase in operating and SG&A expenses compared to the thirdsecond quarter of 20192020 reflected growth in compensation costs of $15$21 million partially offset by a decreaseand in non-compensation costs of $10$8 million. The most notable drivers of these changesincreases were:
| | | | | | | | |
| Compensation costs | | Non-compensation costs |
— higher costs reflecting hiring activity, salary increases and inorganic expense growth from acquisitions; | | — lower travel costsinorganic expense growth from acquisitions; and disciplined expense management
— unfavorable changes in light of the COVID-19 crisis;FX translation rates |
— higher incentive compensation accruals aligned with business performance;actual/projected financial and operating performance. Incentive compensation accruals in 2020 were lower reflecting uncertainties at the time relating to the COVID-19 pandemic; and
partially offset by,
—unfavorable changes in FX translation rates | | — a $6 million captive insurance company settlement in the prior year; partially offset by,
|
— lower expenses resulting from the divestiture of MAKS in the fourth quarter of 2019 and benefits from the 2018 Restructuring Program | | — higher costs to support the Company’s initiative to enhance technology infrastructure to enable automation, innovation and efficiency as well as to support business growth |
The restructuring charge of $10 million in the third quarter of 2020 primarily relates to the non-cash impairment of certain leased real estate assets (ROU Assets and leasehold improvements) pursuant to the rationalization and exit of certain real estate leases in response to the COVID-19 pandemic. This restructuring program is more fully discussed in Note 12 to the condensed consolidated financial statements.
| | | | | | | | | |
| | MA: Operating Margin 22.2% 24.5% ⇑ 40330 BPS | | | Adjusted Operating Margin 31.4% 31.8% ⇑ 220310 BPS |
MA operating margin expansion was suppressed by the aforementioned restructuring charge in the third quarter of 2020. The operating margin and Adjusted Operating Margin expansion for MA both reflect revenue growth outpacing expense growth.
NineSix months ended SeptemberJune 30, 20202021 compared with ninesix months ended SeptemberJune 30, 20192020
Executive Summary
–The following table provides an executive summary of key operating results for the ninesix months ended SeptemberJune 30, 2020.2021. Following this executive summary is a more detailed discussion of the Company’s operating results as well as a discussion of the operating results of the Company’s reportable segments.
| | | Nine Months Ended September 30, | | | Six Months Ended June 30, | |
| Financial measure: | Financial measure: | 2020 | 2019 | % Change | Insight and Key Drivers of Change Compared to Prior Year | Financial measure: | 2021 | 2020 | % Change | Insight and Key Drivers of Change Compared to Prior Year |
| Moody's total revenue | Moody's total revenue | $ | 4,081 | | $ | 3,596 | | 13 | % | — reflects strong growth in both segments | Moody's total revenue | $ | 3,153 | | $ | 2,725 | | 16 | % | — reflects strong growth in both segments |
| MIS External Revenue | MIS External Revenue | $ | 2,557 | | $ | 2,155 | | 19 | % | — higher corporate debt rated issuance volumes (both investment-grade and speculative-grade) as corporate issuers bolstered liquidity positions in response to COVID-19 uncertainties and issued opportunistically for refinancing and M&A needs; partially offset by — declines in U.S. bank loan revenue and declines across key asset classes in SFG | MIS External Revenue | $ | 2,016 | | $ | 1,732 | | 16 | % | — strong growth mainly driven by leveraged finance issuance as issuers refinanced existing debt and funded M&A activity; — increased CLO and CMBS activity amid favorable market conditions; and — favorable changes in FX translation rates |
| MA External Revenue | MA External Revenue | $ | 1,524 | | $ | 1,441 | | 6 | % | — strong renewals and new sales of credit research and data feeds, as well as demand for know-your-customer (KYC) and compliance solutions; and | MA External Revenue | $ | 1,137 | | $ | 993 | | 15 | % | — strong growth in KYC and compliance solutions, as well as research and data feeds; — ongoing recurring revenue growth in ERS from subscription-based sales to banking, insurance and asset management customers; — favorable changes in FX translation rates; and — inorganic growth from acquisitions. |
| — strong demand for credit assessment and loan origination solutions along with insurance compliance products in ERS; | |
| — inorganic growth from acquisitions | |
| Total operating and SG&A expenses | Total operating and SG&A expenses | $ | 1,945 | | $ | 1,880 | | (3 | %) | — higher costs to enhance technology infrastructure to enable automation, innovation and efficiency as well as to support business growth; | Total operating and SG&A expenses | $ | 1,378 | | $ | 1,310 | | (5 | %) | — higher incentive and stock-based compensation aligned with operating performance; and — unfavorable changes in FX translation rates; partially offset by — lower legal accruals; and — cost savings resulting from the COVID-19 crisis and disciplined expense management |
| — additional compensation expense resulting from hiring activity and merit increases; | |
— higher estimates for bad debt reserves resulting from the COVID-19 crisis; partially offset by | |
| — lower travel costs and disciplined expense management in light of the COVID-19 crisis coupled with benefits from the 2018 Restructuring Program | |
| Restructuring | $ | 20 | | $ | 58 | | 66 | % | — charges pursuant to the Company's 2020 Restructuring Program and 2018 Restructuring Program, more fully discussed in Note 12 to the condensed consolidated financial statements | |
| Total non-operating (expense) income, net | | Total non-operating (expense) income, net | $ | (34) | | $ | (72) | | 53 | % | — primarily reflects a $40 million benefit related to the reversal of tax-related interest accruals pursuant to the resolution of uncertain tax positions |
| Operating Margin | Operating Margin | 47.6 | % | 41.5 | % | 610 BPS | — margin expansion reflects strong revenue growth partially offset by modest increases in operating expenses | Operating Margin | 52.5 | % | 47.8 | % | 470 BPS | — margin expansion reflects strong revenue growth outpacing operating expense growth |
| Adjusted Operating Margin | Adjusted Operating Margin | 52.3 | % | 48.2 | % | 410 BPS | Adjusted Operating Margin | 56.3 | % | 51.9 | % | 440 BPS |
| ETR | ETR | 20.0 | % | 21.4 | % | (140BPS) | — decrease primarily due to a deferred tax benefit in 2020 resulting from a non-U.S. corporate reorganization | ETR | 19.0 | % | 19.0 | % | —BPS | — higher benefits of approximately $40 million from the resolution of UTPs in 2021; offset by — lower Excess Tax Benefits in 2021 |
| Diluted EPS | Diluted EPS | $ | 7.73 | | $ | 5.54 | | 40 | % | — growth reflects higher operating income/Adjusted Operating Income | Diluted EPS | $ | 6.98 | | $ | 5.27 | | 32 | % | — increase reflects strong operating income/Adjusted Operating Income growth as described above and includes $0.47/share and $0.11/share in benefits related to the resolution of uncertain tax positions in 2021 and 2020, respectively. |
| Adjusted Diluted EPS | Adjusted Diluted EPS | $ | 8.24 | | $ | 6.29 | | 31 | % | Adjusted Diluted EPS | $ | 7.28 | | $ | 5.55 | | 31 | % |
Moody’s Corporation
| | | | | | | | | | | | | | | | | |
| Nine Months Ended September 30, | | % Change Favorable
(Unfavorable) |
| 2020 | | 2019 | |
| Revenue: | | | | | |
| United States | $ | 2,280 | | | $ | 1,910 | | | 19 | % |
| Non-U.S.: | | | | | |
| EMEA | 1,137 | | | 1,057 | | | 8 | % |
| Asia-Pacific | 436 | | | 415 | | | 5 | % |
| Americas | 228 | | | 214 | | | 7 | % |
| Total Non-U.S. | 1,801 | | | 1,686 | | | 7 | % |
| Total | 4,081 | | | 3,596 | | | 13 | % |
| Expenses: | | | | | |
| Operating | 1,066 | | | 1,032 | | | (3 | %) |
| SG&A | 879 | | | 848 | | | (4 | %) |
| Restructuring | 20 | | | 58 | | | 66 | % |
| Depreciation and amortization | 163 | | | 150 | | | (9 | %) |
| Acquisition-Related Expenses | — | | | 3 | | | 100 | % |
| Loss pursuant to the divestiture of MAKS | 9 | | | 11 | | | 18 | % |
| Total | 2,137 | | | 2,102 | | | (2 | %) |
| Operating income | 1,944 | | | 1,494 | | | 30 | % |
Adjusted Operating Income (1) | 2,136 | | | 1,732 | | | 23 | % |
| Interest expense, net | (153) | | | (149) | | | (3 | %) |
| Other non-operating income, net | 38 | | | 12 | | | 217 | % |
| Non-operating (expense) income, net | (115) | | | (137) | | | 16 | % |
| | | | | |
| Net income attributable to Moody’s | $ | 1,464 | | | $ | 1,062 | | | 38 | % |
| Diluted weighted average shares outstanding | 189.3 | | | 191.8 | | | 1 | % |
| Diluted EPS attributable to Moody’s common shareholders | $ | 7.73 | | | $ | 5.54 | | | 40 | % |
Adjusted Diluted EPS (1) | $ | 8.24 | | | $ | 6.29 | | | 31 | % |
| Operating margin | 47.6 | % | | 41.5 | % | | |
Adjusted Operating Margin (1) | 52.3 | % | | 48.2 | % | | |
| Effective tax rate | 20.0 | % | | 21.4 | % | | |
| | | | | | | | | | | | | | | | | |
| Six Months Ended June 30, | | % Change Favorable
(Unfavorable) |
| 2021 | | 2020 | |
| Revenue: | | | | | |
| United States | $ | 1,716 | | | $ | 1,551 | | | 11 | % |
| Non-U.S.: | | | | | |
| EMEA | 959 | | | 736 | | | 30 | % |
| Asia-Pacific | 311 | | | 280 | | | 11 | % |
| Americas | 167 | | | 158 | | | 6 | % |
| Total Non-U.S. | 1,437 | | | 1,174 | | | 22 | % |
| Total | 3,153 | | | 2,725 | | | 16 | % |
| Expenses: | | | | | |
| Operating | 758 | | | 702 | | | (8 | %) |
| SG&A | 620 | | | 608 | | | (2 | %) |
| Depreciation and amortization | 119 | | | 107 | | | (11 | %) |
| Restructuring | 2 | | | (3) | | | (167 | %) |
| | | | | |
| Loss pursuant to the divestiture of MAKS | — | | | 9 | | | 100 | % |
| Total | 1,499 | | | 1,423 | | | (5 | %) |
| Operating income | 1,654 | | | 1,302 | | | 27 | % |
Adjusted Operating Income (1) | 1,775 | | | 1,415 | | | 25 | % |
| Interest expense, net | (56) | | | (100) | | | 44 | % |
| Other non-operating income, net | 22 | | | 28 | | | (21 | %) |
| Non-operating (expense) income, net | (34) | | | (72) | | | 53 | % |
| | | | | |
| Net income attributable to Moody’s | $ | 1,313 | | | $ | 997 | | | 32 | % |
| Diluted weighted average shares outstanding | 188.2 | | | 189.3 | | | 1 | % |
| Diluted EPS attributable to Moody’s common shareholders | $ | 6.98 | | | $ | 5.27 | | | 32 | % |
Adjusted Diluted EPS (1) | $ | 7.28 | | | $ | 5.55 | | | 31 | % |
| Operating margin | 52.5 | % | | 47.8 | % | | |
Adjusted Operating Margin (1) | 56.3 | % | | 51.9 | % | | |
| Effective tax rate | 19.0 | % | | 19.0 | % | | |
(1)Adjusted Operating Income, Adjusted Operating Margin and Adjusted Diluted EPS attributable to Moody’s common shareholders are non-GAAP financial measures. Refer to the section entitled “Non-GAAP Financial Measures” of this Management Discussion and Analysis for further information regarding these measures.
GLOBAL REVENUE
20202021---------------------------------------------------------------------------------------------------------------------------------------------------------------------------------------------------------20192020
________________________________________________________________________________________________________________________________________________________________________________________________________________________________________________________
| | | | | | | | | | | | | | | | | |
Global revenue ⇑ $485$428 million | U.S. Revenue ⇑ $370 $165 million | Non-U.S. Revenue ⇑ $115 $263 million |
The increase in global revenue reflected growth in both reportable segments both in both the U.S. and internationally. Refer to the section entitled “Segment Results” of this MD&A for a more fulsome discussion of the Company’s segment revenue.
–Foreign currency translation favorably impacted global revenue by three percent.
| | | | | | | | | |
| | Operating Expense ⇑ $34$56 million | | | SG&A Expense ⇑ $31$12 million |
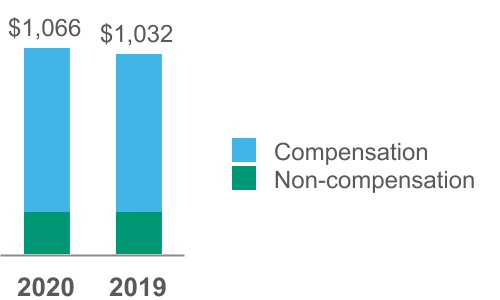
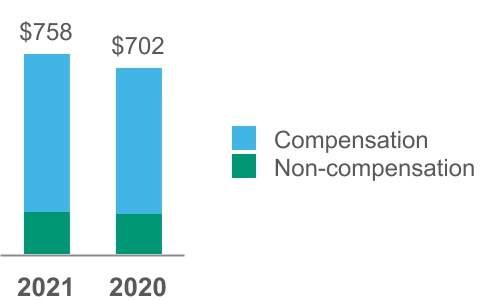 -------------------------------------
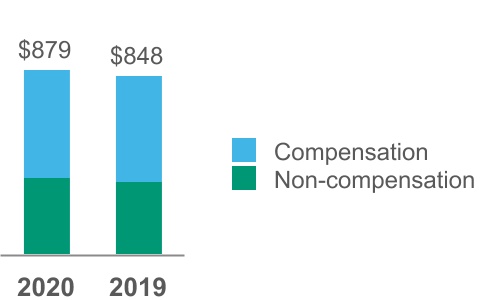
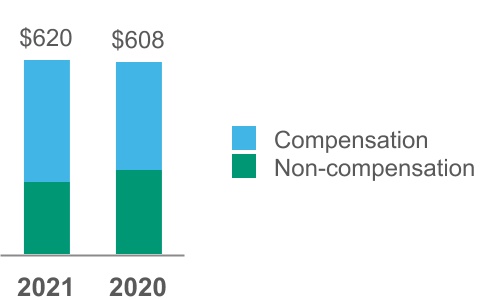
| | | | | | | | | | | | | | | |
| | Compensation expenses increased $31$49 million and reflected: | | | Compensation expenses increased $17$49 million reflecting: |
| | — hiring activity and salary increases coupled with higher incentive and stock-based compensation accruals partially offset by benefits fromaligned with actual/projected financial and operating performance. Incentive compensation accruals in 2020 were lower reflecting uncertainties at the 2018 Restructuring Program.time relating to the COVID-19 pandemic; | | | — higher incentive and stock-based compensation accruals aligned with actual/projected financial and operating performance. Incentive compensation accruals in 2020 were lower reflecting uncertainties at the time relating to the COVID-19 pandemic; |
| | — hiring activity and salary increases partially offset by benefits from the 2018 Restructuring Program.increases; | | | — hiring and salary increases; |
| | — inorganic growth from acquisitions; and | | | —inorganic growth from acquisitions; and |
| | — unfavorable changes in FX translation rates | | | — unfavorable changes in FX translation rates |
| | | | | | |
| | Non-compensation expenses increased $3$7 million reflecting: | | | Non-compensation expenses increased $14decreased $37 million reflecting: |
| | — higher costs relating to strategic initiatives to support the Company’s initiativebusiness growth coupled with enhancements to enhance technology infrastructure to enable automation, innovation and efficiency as well as to support business growth;efficiency; partially offset by: — lower travel costs and disciplined expense management in light of the COVID-19 crisis.
| | | — higherlower estimates for bad debtcredit losses primarily reflecting an increase in reserves of approximately $20 million primarilyin 2020 resulting from the anticipated impact of the COVID-19 crisis on the Company's customers; andcrisis; |
| | | | — lower legal accruals; |
| | — lower travel costs in light of the COVID-19 crisis and continued disciplined cost management. | | — higherlower travel costs to supportin light of the Company’s initiative to enhance technology infrastructure to enable automation, innovationCOVID-19 crisis and efficiency as well as to support business growth;continued disciplined cost management; partially offset by: |
| | | | | — lower travelhigher costs relating to strategic initiatives to support business growth coupled with enhancements to technology infrastructure to enable automation, innovation and disciplined expense management in light of the COVID-19 crisis; |
| | | | | — a $16 million captive insurance company settlement in 2019.efficiency |
| | | | | | |
| | | | | | |
The restructuring charge of $202020 amount includes a $9 million in 2020 primarily relates to the non-cash impairment of certain leased real estate assets (ROU Assets and leasehold improvements) pursuant to the rationalization and exit of certain real estate leases in response to the COVID-19 pandemic. The $58 million restructuring charge in 2019 relates to actions pursuant to the Company’s 2018 Restructuring Program. Both of these programs are more fully discussed in Note 12 to the condensed consolidated financial statements.
The loss pursuant to the divestiture of MAKS in both years relatesrelating to customary post-closing completion adjustments pursuant to the Company's strategic divestituresale of this business.the business in the fourth quarter of 2019.
| | | | | | | | | |
| | | | | |
| | Operating margin 47.6%52.5%, up 610470 BPS | | | Adjusted Operating Margin 52.3%56.3%, up 410440 BPS |
Operating margin and Adjusted Operating Margin expansion reflects strong revenue growth partially offset by modestoutpacing growth in total operating expenses.
| | | | | | | | | |
| | Interest Expense, net⇑ $4 ⇓ $44 million | | | Other non-operating income ⇑ $26⇓ $6 million |
| | | | | | | | | | | | | | |
Primarily reflects:Decrease in expense is primarily due to: | | The increaseDecrease in income is primarily due to: |
| — a $40 million benefit in 2021 related to the reversal of tax-related interest accruals pursuant to the resolution of uncertain tax positions | | — a combined $24$13 million prepayment penaltybenefit in 2020 relating to statute of limitations lapses on certain indemnification obligations relating to the first nine months of 2020 on the early redemption of the 2018 Senior Notes and 2017 Senior Notes;MAKS divestiture; partially offset by |
| | — immaterial FX gains of $7 millionlosses in the first nine months of 20202021 compared to $15$5 million in FX lossesgains in the same period of the prior year.2020; |
— a $17 million benefit from a fair value hedge settled in connection with the early redemption of the 2017 Senior Notes | | | — a $7 million loss on the settlement of pension obligations in 2021 resulting from lump sum distributions from the Company's defined benefit pension plans; partially offset by: |
| | | — higher gains in 2021 on certain of the Company's investments in equity securities/investments. |
| | | | | |
| | ETR in line with prior year⇓ 140 BPS | |
The 2021 and 2020 ETR include $61 million and $20 million, respectively, in tax benefits relating to the resolution of uncertain tax positions. The aforementioned benefit to the 2021 ETR was diluted by higher income before provision for income taxes compared to the prior year. Additionally, there was an approximate $20 million decrease in Excess Tax Benefits in the ETR is primarily duefirst half of 2021 compared to a deferred tax benefit resulting from a non-U.S. corporate reorganization.the prior year.
| | | | | | | | | |
| | Diluted EPS ⇑ $2.19 $1.71 | | | Adjusted Diluted EPS ⇑ $1.95 $1.73 |
| | | | | | | | |
Diluted EPS in the first nine monthshalf of 20202021 of $7.73$6.98 increased $2.19$1.71 compared to the same period in 2019, with both periods including the aforementioned restructuring charges. The growth in EPS is2020 mainly due to higher operating income. Diluted EPS in 2021 and 2020 include $0.47/share and $0.11/share, respectively, in benefits related to the aforementioned growth in operating income.resolution of uncertain tax positions. | | Adjusted Diluted EPS of $8.24$7.28 in 2020the first half of 2021 increased $1.95$1.73 compared to the first nine monthshalf of 2019 (refer2020 mainly due to higher Adjusted Operating Income. Adjusted Diluted EPS in 2021 and 2020 include $0.47/share and $0.11/share, respectively, in benefits related to the aforementioned resolution of uncertain tax positions. Refer to the section entitled “Non-GAAP Financial Measures” of this MD&A for items excluded in the derivation of Adjusted Diluted EPS). The growth in Adjusted Diluted EPS is primarily due to the aforementioned growth in Adjusted Operating Income.EPS. |
Segment Results
Moody’s Investors Service
The table below provides a summary of revenue and operating results, followed by further insight and commentary:
| | | | | | | | | | | | | | | | | |
| Nine Months Ended September 30, | | % Change Favorable
(Unfavorable) |
| 2020 | | 2019 | |
| Revenue: | | | | | |
| Corporate finance (CFG) | $ | 1,486 | | | $ | 1,135 | | | 31 | % |
| Structured finance (SFG) | 265 | | | 318 | | | (17 | %) |
| Financial institutions (FIG) | 401 | | | 361 | | | 11 | % |
| Public, project and infrastructure finance (PPIF) | 375 | | | 321 | | | 17 | % |
| Total ratings revenue | 2,527 | | | 2,135 | | | 18 | % |
| MIS Other | 30 | | | 20 | | | 50 | % |
| Total external revenue | 2,557 | | | 2,155 | | | 19 | % |
| Intersegment royalty | 110 | | | 100 | | | 10 | % |
| Total | 2,667 | | | 2,255 | | | 18 | % |
| Expenses: | | | | | |
| Operating and SG&A (external) | 982 | | | 939 | | | (5 | %) |
| Operating and SG&A (intersegment) | 5 | | | 7 | | | 29 | % |
| Restructuring | 12 | | | 29 | | | 59 | % |
| Depreciation and amortization | 52 | | | 53 | | | 2 | % |
| Total expense | 1,051 | | | 1,028 | | | (2 | %) |
| Operating income | $ | 1,616 | | | $ | 1,227 | | | 32 | % |
| Restructuring | 12 | | | 29 | | | 59 | % |
| Depreciation and amortization | 52 | | | 53 | | | 2 | % |
| Captive insurance company settlement | — | | | 10 | | | 100 | % |
| Adjusted Operating Income | $ | 1,680 | | | $ | 1,319 | | | 27 | % |
| Operating margin | 60.6 | % | | 54.4 | % | | |
| Adjusted Operating Margin | 63.0 | % | | 58.5 | % | | |
| | | | | | | | | | | | | | | | | |
| Six Months Ended June 30, | | % Change Favorable
(Unfavorable) |
| 2021 | | 2020 | |
| Revenue: | | | | | |
| Corporate finance (CFG) | $ | 1,155 | | | $ | 1,025 | | | 13 | % |
| Financial institutions (FIG) | 312 | | | 267 | | | 17 | % |
| Public, project and infrastructure finance (PPIF) | 273 | | | 242 | | | 13 | % |
| Structured finance (SFG) | 256 | | | 177 | | | 45 | % |
| Total ratings revenue | 1,996 | | | 1,711 | | | 17 | % |
| MIS Other | 20 | | | 21 | | | (5 | %) |
| Total external revenue | 2,016 | | | 1,732 | | | 16 | % |
| Intersegment royalty | 82 | | | 72 | | | 14 | % |
| Total | 2,098 | | | 1,804 | | | 16 | % |
| Expenses: | | | | | |
| Operating and SG&A (external) | 688 | | | 674 | | | (2 | %) |
| Operating and SG&A (intersegment) | 4 | | | 4 | | | — | % |
| Depreciation and amortization | 36 | | | 35 | | | (3 | %) |
| Restructuring | — | | | (1) | | | (100 | %) |
| Total expense | 728 | | | 712 | | | (2 | %) |
| Operating income | $ | 1,370 | | | $ | 1,092 | | | 25 | % |
| Depreciation and amortization | 36 | | | 35 | | | (3 | %) |
| Restructuring | — | | | (1) | | | (100 | %) |
| | | | | |
| Adjusted Operating Income | $ | 1,406 | | | $ | 1,126 | | | 25 | % |
| Operating margin | 65.3 | % | | 60.5 | % | | |
| Adjusted Operating Margin | 67.0 | % | | 62.4 | % | | |
MOODY'S INVESTORS SERVICE REVENUE
20202021---------------------------------------------------------------------------------------------------------------------------------------------------------------------------------------------------------20192020
________________________________________________________________________________________________________________________________________________________________________________________________________________________________________________________
| | | | | | | | |
MIS: Global revenue ⇑ $402$284 million | U.S. Revenue ⇑ $324$110 million | Non-U.S. Revenue ⇑ $78$174 million |
–The increase in global MIS revenue (and in both U.S. and non-U.S. revenue) reflected strong growth across all ratings LOBs excluding SFG.both in the U.S. and internationally.
–Foreign currency translation favorably impacted MIS revenue by three percentage points.
–Transaction revenue grew $248 million compared to the same period in the prior year.
CFG REVENUE
20202021---------------------------------------------------------------------------------------------------------------------------------------------------------------------------------------------------------20192020
________________________________________________________________________________________________________________________________________________________________________________________________________________________________________________________
| | | | | | | | |
CFG: Global revenue ⇑ $351$130 million | U.S. Revenue ⇑ $294$32 million | Non-U.S. Revenue ⇑ $57$98 million |
Global CFG revenue for the ninesix months ended SeptemberJune 30, 20202021 and 20192020 was comprised as follows:
(1) Other includes: recurring monitoring fees of a rated debt obligation and/or entities that issue such obligations as well as fees from programs such as commercial paper, medium term notes, and ICRA corporate finance revenue.
The increase in CFG revenue of 31%13% reflected growth both in the U.S. (40%(4%) and internationally (15%(33%) which resulted in a $334$119 million increase in transaction revenue.
The most notable drivers of the CFG revenue growththis increase were:
–strong growth in investment-gradeleveraged loan and speculative-grade bond activity in the U.S. and EMEA as issuers refinanced existing debt in light of favorable market conditions and funded M&A activity;
partially offset by:
–lower investment grade rated issuance volumes reflecting:
–corporatefollowing very strong issuance volumes in the prior year when issuers were bolstering their liquidity positionsbalance sheets in light of uncertainties regarding the duration and severity of the COVID-19 crisis;
–opportunistic issuance for both refinancing and M&A activity in light of current favorable market conditions.
–strong growth in speculative-grade rated issuance volumes despite severe market disruption in this sector in March relating to the COVID-19 crisis. In the second and third quarters of
Foreign currency translation favorably impacted CFG revenue by two percentage points.
FIG REVENUE
2021-----------------------------------------------------------------------------------2020 high-yield market sentiment improved and credit spreads tightened resulting in strong growth in rated issuance volumes; and
–_______________________________________________benefits from________________________________________________________
| | | | | | | | |
| FIG: Global revenue ⇑ $45 million | U.S. Revenue ⇑ $25 million | Non-U.S. Revenue ⇑ $20 million |
Global FIG revenue for the six months ended June 30, 2021 and 2020 was comprised as follows:
Transaction revenue grew by $33 million compared to the same period in the prior year.
The 17% increase in FIG revenue is mainly due to higher banking revenue in the U.S. and EMEA reflecting both the benefit of favorable changes in product mix and pricing increases;increases coupled with opportunistic issuer activity in light of favorable market conditions.
partially offset by:Foreign currency translation favorably impacted FIG revenue by three percentage points.
–a decline in U.S. bank loan revenue primarily reflecting rising defaults on leveraged loans and issuer/investor preference for fixed-rate bonds.
SFG
PPIF REVENUE
20202021---------------------------------------------------------------------------------------------------------------------------------------------------------------------------------------------------------20192020
________________________________________________________________________________________________________________________________________________________________________________________________________________________________________________________
| | | | | | | | |
SFG:PPIF: Global revenue ⇓ $53⇑ $31 million
| U.S. Revenue ⇓ $42⇑ $2 million | Non-U.S. Revenue ⇓ $11⇑ $29 million |
Global SFGPPIF revenue for the ninesix months ended SeptemberJune 30, 20202021 and 20192020 was comprised as follows:
Transaction revenue increased $23 million compared to the same period in the prior year.
The decrease13% increase in SFGPPIF revenue of 17% reflected declinesgrowth both in the U.S. (21%(1%) and internationally (10%(33%). Transaction revenue declined $58 million. The most notable factors contributing to the decline in SFG revenue were: and was driven by:
–reduced activitygrowth in the CLO asset class resulting from:
–challengesproject and infrastructure finance revenue in the leveraged loan market (refer to CFG discussion above);
–widening credit spreadsEMEA mainly reflecting favorable changes in response to uncertainties relating to the COVID-19 crisis;product mix and pricing increases; and
–an increasingly competitive landscape. growth in sovereign issuance reflecting funding to support economic recovery.
Foreign currency translation favorably impacted PPIF revenue by three percentage points.
SFG REVENUE
2021-----------------------------------------------------------------------------------2020
_______________________________________________________________________________________________________
–declines in U.S. CMBS securitization activity as retail and hotel properties have been significantly impacted by the COVID-19 crisis.
FIG REVENUE
2020----------------------------------------------------------------------------------------------------------------------2019
__________________________________________________________________________________________________________________________________________________________
| | | | | | | | |
FIG:SFG: Global revenue ⇑ $40$79 million
| U.S. Revenue ⇑ $37$50 million | Non-U.S. Revenue ⇑ $3$29 million |
Global FIGSFG revenue for the ninesix months ended SeptemberJune 30, 20202021 and 20192020 was comprised as follows:
The increase in SFG revenue of 45% reflected growth both in the U.S. (47%) and internationally (41%). Transaction revenue grew by $38increased $73 million compared to the same period in the prior year.
The 11% increasemost notable drivers of the growth in FIGSFG revenue was mainly due to:were:
–growthhigher CLO refinancing and securitization activity in U.S. banking and insurance rated issuance volumes as large financial institutions and insurers fortified their balance sheets in light of uncertainties relating to the COVID-19 crisis and favorable market conditions;
–issuance in advance of anticipated volatility around the U.S. presidential election in the fourth quarter of 2020;and EMEA, as market conditions remain favorable for this asset class; and
–benefits from favorable changesan increase in product mix and pricing increases.
PPIF REVENUE
2020----------------------------------------------------------------------------------------------------------------------2019
__________________________________________________________________________________________________________________________________________________________
| | | | | | | | |
PPIF: Global revenue ⇑ $54 million
| U.S. Revenue ⇑ $35 million
| Non-U.S. Revenue ⇑ $19 million
|
Global PPIF revenuecredit spreads for the nine months ended September 30, 2020 and 2019 was comprised as follows:
Transaction revenue increased $49 millionthis asset class compared to the samea challenging prior year period in the prior year.
The 17% increase in PPIF revenue resulted primarily from:
–higher U.S. public finance refunding volumes resulting from continued low benchmark interest rates, including refinancingwhen securitization activity for retail and hotel properties was adversely impacted by way of taxable transactions;
–higher infrastructure finance revenue resulting from investment-grade issuers bolstering their balance sheets in light of uncertainties regarding the duration and severity of the COVID-19 crisis; andcrisis.
–benefits from favorable changes in product mix and pricing increases.Foreign currency translation favorably impacted SFG revenue by four percentage points.
| | | | |
| | MIS: Operating and SG&A Expense ⇑ $43$14 million |
The growth reflects a $36 million and $7$55 million increase in compensation andpartially offset by a $41 million decline in non-compensation expenses, respectively. The most notable drivers of these increaseschanges are as follows:
| | | | | | | | |
| Compensation costs | | Non-compensation costs |
| The increase is primarily due to: | | The increasedecrease is primarily due to: |
— annual salary increaseshigher incentive and hiring; partially offset by: stock-based compensation accruals aligned with actual/projected financial and operating performance. Incentive compensation accruals in 2020 were lowered reflecting uncertainties at the time relating to the COVID-19 pandemic; and | | — approximately $15 million in higher costs to support the Company’s initiative to enhance technology infrastructure to enable automation, innovation and efficiency as well as to support business growth;lower legal accruals; |
| — benefits from the 2018 Restructuring Program | | — higherlower estimates for bad debtcredit losses primarily reflecting an increase in reserves of $12 million primarilyin 2020 resulting from the anticipated impact of the COVID-19 crisis on the Company's customers; crisis; andpartially offset by:
|
| — unfavorable changes in FX translation rates | | —lower travel costs of $11 million and disciplined expense management in light of the COVID-19 crisis; andpandemic |
| | — a $10 million charge in the prior year for a captive insurance company settlement |
| | |
Other Expenses |
The restructuring charges in both years relate to the Company's 2020 Restructuring Program and 2018 Restructuring Program as more fully discussed in Note 12 to the condensed consolidated financial statements. |
| | | | | | | | | |
| | MIS: Operating Margin of 60.6% 65.3% ⇑ 620480 BPS | | | Adjusted Operating Margin of 63.0% 67.0% ⇑ 450 460 BPS |
MIS operating margin and Adjusted Operating Margin both increased reflecting strong revenue growth outpacing expense growth.
Moody’s Analytics
The table below provides a summary of revenue and operating results, followed by further insight and commentary:
| | | | | | | | | | | | | | | | | |
| Nine Months Ended September 30, | | % Change Favorable
(Unfavorable) |
| 2020 | | 2019 | |
| Revenue: | | | | | |
Research, data and analytics (RD&A) (1) | $ | 1,110 | | | $ | 940 | | | 18 | % |
| Enterprise risk solutions (ERS) | 414 | | | 373 | | | 11 | % |
Professional services (PS) (1) | — | | | 128 | | | (100 | %) |
| Total external revenue | 1,524 | | | 1,441 | | | 6 | % |
| Intersegment revenue | 5 | | | 7 | | | (29 | %) |
| Total MA Revenue | 1,529 | | | 1,448 | | | 6 | % |
| Expenses: | | | | | |
| Operating and SG&A (external) | 963 | | | 941 | | | (2 | %) |
| Operating and SG&A (intersegment) | 110 | | | 100 | | | (10 | %) |
| Restructuring | 8 | | | 29 | | | 72 | % |
| Depreciation and amortization | 111 | | | 97 | | | (14 | %) |
| Acquisition-Related Expenses | — | | | 3 | | | 100 | % |
| Loss pursuant to the divestiture of MAKS | 9 | | | 11 | | | 18 | % |
| Total expense | 1,201 | | | 1,181 | | | (2 | %) |
| Operating income | $ | 328 | | | $ | 267 | | | 23 | % |
| Restructuring | 8 | | | 29 | | | 72 | % |
| Depreciation and amortization | 111 | | | 97 | | | (14 | %) |
| Acquisition-Related Expenses | — | | | 3 | | | 100 | % |
| Loss pursuant to the divestiture of MAKS | 9 | | | 11 | | | 18 | |
| Captive insurance company settlement | — | | | 6 | | | 100 | |
| Adjusted Operating Income | $ | 456 | | | $ | 413 | | | 10 | % |
| Operating margin | 21.5 | % | | 18.4 | % | | |
| Adjusted Operating Margin | 29.8 | % | | 28.5 | % | | |
| | | | | | | | | | | | | | | | | |
| Six Months Ended June 30, | | % Change Favorable
(Unfavorable) |
| 2021 | | 2020 | |
| Revenue: | | | | | |
| Research, data and analytics (RD&A) | $ | 854 | | | $ | 724 | | | 18 | % |
| Enterprise risk solutions (ERS) | 283 | | | 269 | | | 5 | % |
| | | | | |
| Total external revenue | 1,137 | | | 993 | | | 15 | % |
| Intersegment revenue | 4 | | | 4 | | | — | % |
| Total MA Revenue | 1,141 | | | 997 | | | 14 | % |
| Expenses: | | | | | |
| Operating and SG&A (external) | 690 | | | 636 | | | (8 | %) |
| Operating and SG&A (intersegment) | 82 | | | 72 | | | (14 | %) |
| Depreciation and amortization | 83 | | | 72 | | | (15 | %) |
| Restructuring | 2 | | | (2) | | | (200 | %) |
| | | | | |
| Loss pursuant to the divestiture of MAKS | — | | | 9 | | | 100 | % |
| Total expense | 857 | | | 787 | | | (9 | %) |
| Operating income | $ | 284 | | | $ | 210 | | | 35 | % |
| Depreciation and amortization | 83 | | | 72 | | | (15 | %) |
| Restructuring | 2 | | | (2) | | | (200 | %) |
| | | | | |
| Loss pursuant to the divestiture of MAKS | — | | | 9 | | | 100 | |
| | | | | |
| Adjusted Operating Income | $ | 369 | | | $ | 289 | | | 28 | % |
| Operating margin | 24.9 | % | | 21.1 | % | | |
| Adjusted Operating Margin | 32.3 | % | | 29.0 | % | | |
(1) Subsequent to the divestiture of MAKS in 2019, revenue from the Moody's Analytics Learning Solutions ("MALS") unit, which previous to 2020 was reported in the Professional Services line of business ("LOB"), is now reported as part of the RD&A LOB. Prior periods have not been reclassified as the amounts were not material.
MOODY'S ANALYTICS REVENUE
20202021---------------------------------------------------------------------------------------------------------------------------------------------------------------------------------------------------------20192020
________________________________________________________________________________________________________________________________________________________________________________________________________________________________________________________
| | | | | | | | |
MA: Global revenue ⇑ $83$144 million | U.S. Revenue ⇑ $46$55 million | Non-U.S. Revenue ⇑ $37$89 million |
The 6%15% increase in global MA revenue reflects strong growth both in the U.S. and internationally mainly within the RD&A LOB and ERS partially offset by a decline inincludes revenue resulting from the divestitureacquisitions of the MAKS business in the fourth quarter of 2019.RDC, AM, ZMFS, Catylist and Cortera.
–Organic revenue growth was 8%11%.
–The increase in U.S.Foreign currency translation favorably impacted MA revenue reflected growth in both RD&A and ERS.by five percentage points.
–The increase in non-U.S. revenue reflected growth in RD&A and ERS, partially offset by a decline in revenue resulting from the divestiture of MAKS in the fourth quarter of 2019.
–The increase in relationship revenue as a percentage of total revenue from 85% in the first nine months of 2019 to 91% in the same period of 2020 reflects the divestiture of the transaction revenue-based MAKS business in 2019.
RD&A REVENUE
20202021---------------------------------------------------------------------------------------------------------------------------------------------------------------------------------------------------------20192020
________________________________________________________________________________________________________________________________________________________________________________________________________________________________________________________
| | | | | | | | |
RD&A: Global revenue ⇑ $170$130 million | U.S. Revenue ⇑ $80$48 million | Non-U.S. Revenue ⇑ $90$82 million |
Global RD&A revenue grew 18% compared to the first nine monthshalf of 20192020 with the most notable drivers of the increase reflecting:
–strong demand for KYC and compliance solutions reflecting increased customer and supplier risk data usage;
–strong renewals and new sales ofrelated to credit research and data feeds; and
–inorganic revenue growth from the acquisitions of RDC, AM, Catylist and ABS Suite; andCortera.
–strong demand for solutions that address customer identity requirements, such as know-your-customer, anti-money laundering, anti-bribery and sanctions compliance.Foreign currency translation favorably impacted RD&A revenue by five percentage points.
Organic revenue growth for RD&A was 9%14%.
ERS REVENUE
20202021---------------------------------------------------------------------------------------------------------------------------------------------------------------------------------------------------------20192020
________________________________________________________________________________________________________________________________________________________________________________________________________________________________________________________
| | | | | | | | |
ERS: Global revenue ⇑ $41$14 million | U.S. Revenue ⇑ $20$7 million | Non-U.S. Revenue ⇑ $21$7 million |
Global ERS revenue increased 11%5% compared to the first nine monthshalf of 20192020 with the most notable drivers of the growth reflecting:
–continued strong demand for credit assessment and loan origination solutions;
–increased demandgrowth in subscription-based revenue, most notably for actuarial modeling tools in support of certain international accounting standards relating to insurance contracts;contracts and demand from asset managers for risk management solutions;
–favorable foreign currency translation which impacted revenue by four percentage points; and
–inorganic revenue growth from the acquisition of RiskFirst.ZMFS;
partially offset by:
–lower non-recurring software revenue and services due to a de-emphasizing of these lower margin offerings.
Organic revenue growth for ERS was 8%3%.
| | | | |
| | MA: Operating and SG&A Expense ⇑ $22$54 million |
The increase in operating and SG&A expenses compared to the first ninesix months of 20192020 is primarily due to growth in both compensation non-compensation costs of $13$42 million and $9$12 million, respectively, reflecting:
| | | | | | | | |
| Compensation costs | | Non-compensation costs |
The increase is primarily due to: | | The increase is primarily due to: |
— annualhigher costs reflecting salary increases and hiring;inorganic expense growth from acquisitions; | | — approximately $44 million in higher costs relating to strategic initiatives to support the Company’s initiativebusiness growth coupled with enhancements to enhance technology infrastructure to enable automation, innovation and efficiency as well as to support business growth;efficiency; partially offset by: |
— higher incentive compensation accruals aligned with performance; partially offset by: actual/projected financial and operating performance. Incentive compensation accruals in 2020 were lowered reflecting uncertainties at the time relating to the COVID-19 pandemic; and | |
| — higherlower estimates for bad debtcredit losses primarily reflecting an increase in reserves of $8 million primarilyin 2020 resulting from the anticipated impact of the COVID-19 crisis on the Company's customers; crisis; andpartially offset by: |
— benefits from the 2018 Restructuring Programunfavorable changes in FX translation rates | | — lower travel costs of $26 million coupled with disciplined expense management across other expense categories in light of the COVID-19 crisis;crisis and |
| | — a $6 million charge in the prior year for a captive insurance company settlement continued disciplined expense management |
The restructuring charges in both years relate to the Company'sfirst half of 2020 Restructuring Program and 2018 Restructuring Program as more fully discussed in Note 12 to the condensed consolidated financial statements.
Theincludes a $9 million and $11 million lossesloss pursuant to the divestiture of MAKS in both 2020 and 2019 relaterelated to a customary post-closing completion adjustment pursuant to the Company's strategic divestituresale of this business.the business in the fourth quarter of 2019.
| | | | | | | | | |
| | MA: Operating Margin 21.5% 24.9% ⇑ 310BPS 380BPS | | | Adjusted Operating Margin 29.8% 32.3% ⇑ 130BPS 330BPS |
The operating margin and Adjusted Operating Margin expansion for MA both reflect RD&A and ERS revenue growth partially offset by modestoutpacing expense growth. Operating margin expansion also benefitted from a lower restructuring charge in the first nine months of 2020 compared to the same period in the prior year. Both the operating margin and Adjusted Operating Margin were suppressed by higher bad debt reserves in the first nine months of 2020.
Liquidity and Capital Resources
Cash Flow
The Company is currently financing its operations, capital expenditures, acquisitions and share repurchases from operating and financing cash flows.
The following is a summary of the changes in the Company’s cash flows followed by a brief discussion of these changes:
| | | | | | | | | | | | | | | | | |
| Nine Months Ended September 30, | | $ Change Favorable (Unfavorable) |
| 2020 | | 2019 | |
| Net cash provided by operating activities | $ | 1,488 | | | $ | 1,196 | | | $ | 292 | |
| Net cash used in investing activities | $ | (853) | | | $ | (150) | | | $ | (703) | |
| Net cash provided by (used in) financing activities | $ | 3 | | | $ | (1,517) | | | $ | 1,520 | |
Free Cash Flow (1) | $ | 1,405 | | | $ | 1,135 | | | $ | 270 | |
| | | | | | | | | | | | | | | | | |
| Six Months Ended June 30, | | $ Change
Favorable (Unfavorable) |
| 2021 | | 2020 | |
| Net cash provided by operating activities | $ | 1,270 | | | $ | 977 | | | $ | 293 | |
| Net cash used in investing activities | $ | (251) | | | $ | (823) | | | $ | 572 | |
| Net cash (used in) provided by financing activities | $ | (792) | | | $ | 123 | | | $ | (915) | |
Free Cash Flow (1) | $ | 1,226 | | | $ | 915 | | | $ | 311 | |
(1) Free Cash Flow is a non-GAAP measure and is defined by the Company as net cash provided by operating activities minus cash paid for capital expenditures. Refer to “Non-GAAP Financial Measures” of this MD&A for further information on this financial measure.
Net cash provided by operating activities
Net cash flows from operating activities in the ninesix months ended SeptemberJune 30, 20202021 increased $292$293 million compared to same period in 20192020 with the most significant drivers reflecting:
–an increase in net income compared to the same period in the prior year (see section entitled “Results of Operations” for further discussion);
partially offset by:
–a $99 million contribution to the Company's funded pension plan in the first quarter of 2020;2020 that did not recur in 2021; and
–a $68 million payment made in 2020 in conjunction with the settlement of treasury lock interest rate forward contracts as more fully described
partially offset by:
–higher cash paid for income taxes of approximately $215 million resulting from both the Company's strong earnings growth in Note 102021 and from the extension of payment terms to the condensed consolidated financial statements.third quarter of 2020 for approximately $115 million in estimated federal tax payments as a result of relief provided by the IRS in response to the COVID-19 crisis.
Net cash used in investing activities
The $703$572 million increasedecrease in cash used in investing activities in the ninesix months ended SeptemberJune 30, 20202021 compared to the same period in 20192020 primarily reflects:
–an increase inreflects lower cash paid for acquisitions of $578$560 million (refer to Note 98 to the condensed consolidated financial statements for further discussion on the Company's M&A activity);
– $101 million in higher net purchases of investments in the first nine months of 2020 compared to the same period in the prior year..
Net cash (used in) provided by (used in) financing activities
The $1,520$915 million increase in cash flows provided byused in financing activities in the ninesix months ended SeptemberJune 30, 20202021 compared to the same period in the prior year was primarily attributed to:
–the net issuance of $691approximately $700 million in long-term debt during the first nine months of 2020 compared to repayment of long-term debt of $450 million in the same period of the prior year;2020; and
–lowerhigher cash paid for treasury share repurchases of $475$250 million compared to the first nine monthshalf of 2019.2020.
Cash and short-term investments held in non-U.S. jurisdictions
The Company’s aggregate cash and cash equivalents and short-term investments of $2.6$2.9 billion at SeptemberJune 30, 20202021 consisted of approximately $1.5$1.9 billion located outside of the U.S. Approximately 10%17% of the Company’s aggregate cash and cash equivalents and short-term investments is denominated in euros and British pounds. The Company manages both its U.S. and non-U.S cash flow to maintain sufficient liquidity in all regions to effectively meet its operating needs.
As a result of the Tax Act, all previously net undistributed foreign earnings have now been subject to U.S. tax. The Company continues to evaluate which entities it will indefinitely reinvest earnings outside the U.S. The Company has provided deferred taxes for those entities whose earnings are not considered indefinitely reinvested. Accordingly, the Company has commenced repatriating a portion of its non-U.S. cash in these subsidiaries and will continue to repatriate certain of its offshore cash in a manner that addresses compliance with local statutory requirements, sufficient offshore working capital and any other factors that may be relevant in certain jurisdictions. Notwithstanding the Tax Act, which generally eliminated federal income tax on future cash repatriation to the U.S., cash repatriation may be subject to state and local taxes or withholding or similar taxes.
Other Material Future Cash Requirements
The Company believes that it has the financial resources needed to meet its cash requirements and expects to have positive operating cash flow for the next twelve months. Cash requirements for periods beyond the next twelve months will depend, among other things, on the Company’s profitability and its ability to manage working capital requirements. The Company may also borrow from various sources.
The CompanyMoody's remains committed to using its strong cash flow to create value for shareholders by both investing in the Company's employees and growing areas of the business reinvesting in ratings qualitythrough targeted organic initiatives making selectiveand inorganic acquisitions repurchasing stockaligned with strategic priorities. Additional excess capital is returned to the Company’s shareholders via a combination of dividends and paying
dividends, all in a manner consistent with maintaining sufficient liquidity after giving effect to any additional indebtedness that may be incurred.share repurchases.
Dividends and share repurchases
On OctoberJuly 27, 2020,2021, the Board of Directors of the Company declared a quarterly dividend of $0.56$0.62 per share of Moody’s common stock, payable December 14, 2020September 10, 2021 to shareholders of record at the close of business on November 23, 2020. August 20, 2021. The continued payment of dividends at this rate, or at all, is subject to the discretion of the Board.
In October 2018,On December 16, 2019, the Board authorized a $1.0approved $1 billion share repurchase program, which at Septemberauthority and on February 9, 2021, the Board approved an additional $1 billion in share repurchase authority. At June 30, 2020 had2021, there was a total remaining authority of approximately $81 million. Additionally, in December 2019, the Board authorized an additional $1.0$1.3 billion share repurchase program, which may commence following the completion of the existing program.
Beginning late in the first quarter of 2020 and through the third quarter of 2020, the Company suspended itsunder these authorizations. Future share repurchase activity is subject to preserve liquidity in light of uncertainties regarding the severityavailable cash, market conditions and duration of the COVID-19 crisis. The Company anticipates resuming its share repurchase program in the fourth quarter of 2020.other ongoing capital allocation decisions.
Other cash requirements
The Company has future cash requirements, including operating leases and debt service and payments as noted in the tables that follow as well as future payments related to the transition tax under the Tax Act.
Indebtedness
During the first nine months of 2020, in response to uncertainties relating to the severity and duration of the COVID-19 crisis, the Company increased its long-term debt position by $700 million via public offerings to bolster liquidity. The key terms of these transactions are presented in Note 17 to the condensed consolidated financial statements.
At SeptemberJune 30, 2020,2021, Moody’s had $6.4 billion of outstanding debt and approximately $1 billion of additional capacity available under the Company’s CP program, which is backstopped by the 2018 Facility. At SeptemberJune 30, 2020,2021, the Company was in compliance with all covenants contained within all of the debt agreements. All of the Company’s long-term debt agreements contain cross default provisions which state that default under one of the aforementioned debt instruments could in turn permit lenders under other debt instruments to declare borrowings outstanding under those instruments to be immediately due and payable. At SeptemberJune 30, 2020,2021, there were no such cross defaults.
The repayment schedule for the Company’s borrowings outstanding at SeptemberJune 30, 20202021 is as follows:
For additional information on the Company's outstanding debt, refer to Note 1716 to the condensed consolidated financial statements.
Management may consider pursuing additional long-term financing when it is appropriate in light of cash requirements for operations, share repurchases and other strategic opportunities, which would result in higher financing costs.
Off-Balance Sheet Arrangements
At SeptemberJune 30, 2020,2021, Moody’s did not have any relationships with unconsolidated entities or financial partnerships, such as entities often referred to as special purpose or variable interest entities where Moody’s is the primary beneficiary, which would have been established for the purpose of facilitating off-balance sheet arrangements or other contractually narrow or limited purposes. As such, Moody’s is not exposed to any financing, liquidity market or credit risk that could arise if it had engaged in such relationships.
Contractual Obligations
The following table presents payments due under the Company’s contractual obligations as of SeptemberJune 30, 2020:2021:
Payments Due by Period
| | | | | | | | | | | | | | | | | | | | | | | | | | | | | |
| Payments Due by Period |
| (in millions) | Total | | Less Than 1 Year | | 1 - 3 Years | | 3 - 5 Years | | Over 5 Years |
Indebtedness (1) | $ | 9,127 | | | $ | 197 | | | $ | 1,382 | | | $ | 1,497 | | | $ | 6,051 | |
| Operating lease obligations | 592 | | | 27 | | | 203 | | | 171 | | | 191 | |
| Purchase obligations | 208 | | | 91 | | | 106 | | | 11 | | | — | |
Pension obligations (2) | 151 | | | 2 | | | 45 | | | 28 | | | 76 | |
Total (3) | $ | 10,078 | | | $ | 317 | | | $ | 1,736 | | | $ | 1,707 | | | $ | 6,318 | |
| | | | | | | | | | | | | | | | | | | | | | | | | | | | | |
| Payments Due by Period |
| (in millions) | Total | | Less Than 1 Year | | 1 - 3 Years | | 3 - 5 Years | | Over 5 Years |
Indebtedness (1) | $ | 9,002 | | | $ | 194 | | | $ | 1,860 | | | $ | 962 | | | $ | 5,986 | |
| Operating lease obligations | 528 | | | 107 | | | 186 | | | 152 | | | 83 | |
| Purchase obligations | 238 | | | 121 | | | 110 | | | 7 | | | — | |
Pension obligations (2) | 107 | | | 4 | | | 22 | | | 21 | | | 60 | |
Total (3) | $ | 9,875 | | | $ | 426 | | | $ | 2,178 | | | $ | 1,142 | | | $ | 6,129 | |
(1)Reflects principal payments, related interest and applicable fees due on all indebtedness outstanding as described in Note 1716 to the condensed consolidated financial statements.
(2)Reflects projected benefit payments relating to the Company’s U.S. unfunded DBPPs and Retirement and Other Plans described in Note 1615 to the condensed consolidated financial statements.
(3)The table above does not include the Company's long-term tax liabilities of $471$406 million relating to UTPs, since the expected cash outflow of such amounts by period cannot be reasonably estimated. Additionally, the table above does not include approximately $33 million relating to indemnification liability resulting from the divestiture of MAKS and approximately $51$18 million relating to the remaining unpaid deemed repatriation liability resulting from the Tax Act enacted into law in the U.S. in December 2017.
Non-GAAP Financial Measures:
In addition to its reported results, Moody’s has included in this MD&A certain adjusted results that the SEC defines as “non-GAAP financial measures.” Management believes that such adjusted financial measures, when read in conjunction with the Company’s reported results, can provide useful supplemental information for investors analyzing period-to-period comparisons of the Company’s performance, facilitate comparisons to competitors’ operating results and can provide greater transparency to investors of supplemental information used by management in its financial and operational decision-making. These adjusted measures, as defined by the Company, are not necessarily comparable to similarly defined measures of other companies. Furthermore, these adjusted measures should not be viewed in isolation or used as a substitute for other GAAP measures in assessing the operating performance or cash flows of the Company. Below are brief descriptions of the Company’s adjusted financial measures accompanied by a reconciliation of the adjusted measure to its most directly comparable GAAP measure:
Adjusted Operating Income and Adjusted Operating Margin:
The Company presents Adjusted Operating Income and Adjusted Operating Margin because management deems these metrics to be useful measures to provide additional perspective on the operating performance of Moody’s. Adjusted Operating Income excludes the impact of: i) restructuring; ii) depreciation and amortization; ii) restructuring charges/adjustments; and iii) Acquisition-Related Expenses; iv)a loss pursuant to the divestiture of MAKS; and v) a captive insurance company settlement. Restructuring charges are excluded as the frequency and magnitude of these charges may vary widely across periods and companies.MAKS. Depreciation and amortization are excluded because companies utilize productive assets of different ages and use different methods of acquiring and depreciating productive assets. Acquisition-Related Expenses consistRestructuring charges are excluded as the frequency and magnitude of expenses incurred to completethese charges may vary widely across periods and integrate the acquisition of Bureau van Dijk. These expenses were excluded in the prior years due to the material nature of the cumulative costs incurred over the multi-year integration effort. Acquisition-related expenses from other acquisitions were not material.companies. The loss pursuant to the divestiture of MAKS is excluded as the frequency and magnitude of divestiture activity may vary widely from period to period and across companies. The captive insurance company settlement relates to the resolution of a matter that is not expected to recur in the future at this magnitude.
Management believes that the exclusion of the aforementioned items, as detailed in the reconciliation below, allows for an additional perspective on the Company’s operating results from period to period and across companies. The Company defines Adjusted Operating Margin as Adjusted Operating Income divided by revenue.
| | | | | | | | | | | | | | | | | | | | | | | |
| Three Months Ended September 30, | | Nine Months Ended September 30, |
| 2020 | | 2019 | | 2020 | | 2019 |
| Operating income | $ | 642 | | | $ | 549 | | | $ | 1,944 | | | $ | 1,494 | |
| Adjustments: | | | | | | | |
| Restructuring | 23 | | | (1) | | | 20 | | | 58 | |
| Depreciation and amortization | 56 | | | 48 | | | 163 | | | 150 | |
| Acquisition-Related Expenses | — | | | — | | | — | | | 3 | |
| Loss pursuant to the divestiture of MAKS | — | | | 2 | | | 9 | | | 11 | |
| Captive insurance company settlement | — | | | 16 | | | — | | | 16 | |
| Adjusted Operating Income | $ | 721 | | | $ | 614 | | | $ | 2,136 | | | $ | 1,732 | |
| Operating margin | 47.3 | % | | 44.3 | % | | 47.6 | % | | 41.5 | % |
| Adjusted Operating Margin | 53.2 | % | | 49.5 | % | | 52.3 | % | | 48.2 | % |
| | | | | | | | | | | | | | | | | | | | | | | |
| Three Months Ended June 30, | | Six Months Ended June 30, |
| 2021 | | 2020 | | 2021 | | 2020 |
| Operating income | $ | 801 | | | $ | 710 | | | $ | 1,654 | | | $ | 1,302 | |
| Adjustments: | | | | | | | |
| Depreciation and amortization | 60 | | | 58 | | | 119 | | | 107 | |
| Restructuring | — | | | (2) | | | 2 | | | (3) | |
| | | | | | | |
| Loss pursuant to the divestiture of MAKS | — | | | — | | | — | | | 9 | |
| | | | | | | |
| Adjusted Operating Income | $ | 861 | | | $ | 766 | | | $ | 1,775 | | | $ | 1,415 | |
| Operating margin | 51.6 | % | | 49.5 | % | | 52.5 | % | | 47.8 | % |
| Adjusted Operating Margin | 55.4 | % | | 53.4 | % | | 56.3 | % | | 51.9 | % |
Adjusted Net Income and Adjusted Diluted EPS attributable to Moody's common shareholders:
The Company presents Adjusted Net Income and Adjusted Diluted EPS because management deems these metrics to be useful measures to provide additional perspective on the operating performance of Moody’s. Adjusted Net Income and Adjusted Diluted EPS exclude the impact of: i) Acquisition-Related Expenses; ii) amortization of acquired intangible assets; iii)ii) restructuring charges/adjustments; iv)and iii) loss and a tax charge pursuant to the divestiture of MAKS; and v) a captive insurance company settlement.MAKS.
Acquisition-Related Expenses consist of expenses incurred to complete and integrate the acquisition of Bureau van Dijk. These expenses were excluded in prior years due to the material nature of the cumulative costs incurred over the multi-year integration effort. Acquisition-related expenses from other acquisitions were not material. The Company excludes the impact of amortization of acquired intangible assets as companies utilize intangible assets with different ages and have different methods of acquiring and amortizing intangible assets. These intangible assets were recorded as part of acquisition accounting and contribute to revenue generation. The amortization of intangible assets related to acquisitions will recur in future periods until such intangible assets have been fully amortized. Furthermore, the timing and magnitude of business combination transactions are not predictable and the purchase price allocated to amortizable intangible assets and the related amortization period are unique to each acquisition and can vary significantly from period to period and across companies. Restructuring charges are excluded as the frequency and magnitude of these charges may vary widely across periods and companies. The loss and tax charge pursuant to the divestiture of MAKS areis excluded as the frequency and magnitude of divestiture activity may vary widely from period to period and across companies. The captive insurance company settlement relates to the resolution of a matter that is not expected to recur in the future at this magnitude.
The Company excludes the aforementioned items to provide additional perspective when comparing net income and diluted EPS from period to period and across companies as the frequency and magnitude of similar transactions may vary widely across periods.
Below is a reconciliation of this measure to its most directly comparable U.S. GAAP amount: | | | | | | | | | | | | | | | | | | | | | | | | | | | | | | | | | | | |
| Three Months Ended June 30, | | Six Months Ended June 30, |
| Amounts in millions | 2021 | | 2020 | | 2021 | | 2020 |
| Net income attributable to Moody's common shareholders | | $ | 577 | | | | $ | 509 | | | | $ | 1,313 | | | | $ | 997 | |
| | | | | | | | | | | |
| | | | | | | | | | | |
| | | | | | | | | | | |
| Pre-Tax Acquisition-Related Intangible Amortization Expenses | $ | 36 | | | | $ | 31 | | | | $ | 71 | | | | $ | 59 | | |
| Tax on Acquisition-Related Intangible Amortization Expenses | (8) | | | | (7) | | | | (16) | | | | (13) | | |
| Net Acquisition-Related Intangible Amortization Expenses |
| 28 | | |
| 24 | | |
| 55 | | |
| 46 | |
| | | | | | | | | | | |
| Pre-Tax Restructuring | $ | — | | | | $ | (2) | | | | $ | 2 | | | | $ | (3) | | |
| Tax on Restructuring | — | | | | 1 | | | | — | | | | 1 | | |
| Net Restructuring | | — | | | | (1) | | | | 2 | | | | (2) | |
| | | | | | | | | | | |
| | | | | | | | | | | |
| | | | | | | | | | | |
| | | | | | | | | | | |
| | | | | | | | | | | |
| Loss pursuant to the divestiture of MAKS | | — | | | | — | | | | — | | | | 9 | |
| Adjusted Net Income |
| $ | 605 | | |
| $ | 532 | | |
| $ | 1,370 | | |
| $ | 1,050 | |
| | | | | | | | | | | | | | | | | | | | | | | | | | | | | | | | | | | |
| Three Months Ended September 30, | | Nine Months Ended September 30, |
| Amounts in millions | 2020 | | 2019 | | 2020 | | 2019 |
| Net income attributable to Moody's common shareholders | | $ | 467 | | | | $ | 380 | | | | $ | 1,464 | | | | $ | 1,062 | |
| Pre-Tax Acquisition-Related Expenses | $ | — | | | | $ | — | | | | $ | — | | | | $ | 3 | | |
| Tax on Acquisition-Related Expenses | — | | | | — | | | | — | | | | — | | |
| Net Acquisition-Related Expenses |
| — | | |
| — | | |
| — | | |
| 3 | |
| Pre-Tax Acquisition-Related Intangible Amortization Expenses | $ | 31 | | | | $ | 24 | | | | $ | 90 | | | | $ | 77 | | |
| Tax on Acquisition-Related Intangible Amortization Expenses | (7) | | | | (6) | | | | (20) | | | | (18) | | |
| Net Acquisition-Related Intangible Amortization Expenses |
| 24 | | |
| 18 | | |
| 70 | | |
| 59 | |
| | | | | | | | | | | |
| Pre-Tax Restructuring | $ | 23 | | | | $ | (1) | | | | $ | 20 | | | | $ | 58 | | |
| Tax on Restructuring | (5) | | | | — | | | | (4) | | | | (14) | | |
| Net Restructuring | | 18 | | | | (1) | | | | 16 | | | | 44 | |
| Pre-Tax captive insurance company settlement | $ | — | | | | $ | 16 | | | | $ | — | | | | $ | 16 | | |
| Tax on captive insurance company settlement | — | | | | (4) | | | | — | | | | (4) | | |
| Net captive insurance company settlement | | — | | | | 12 | | | | — | | | | 12 | |
| Tax charge pursuant to the divestiture of MAKS | | — | | | | — | | | | — | | | | 15 | |
| | | | | | | | | | | |
| Loss pursuant to the divestiture of MAKS | | — | | | | 2 | | | | 9 | | | | 11 | |
| Adjusted Net Income |
| $ | 509 | | |
| $ | 411 | | |
| $ | 1,559 | | |
| $ | 1,206 | |
| | | Three Months Ended September 30, | | Nine Months Ended September 30, | | Three Months Ended June 30, | | Six Months Ended June 30, |
| | 2020 | | 2019 | | 2020 | | 2019 | | 2021 | | 2020 | | 2021 | | 2020 |
| Diluted earnings per share attributable to Moody's common shareholders | Diluted earnings per share attributable to Moody's common shareholders | | $ | 2.47 | | | | $ | 1.99 | | | | $ | 7.73 | | | | $ | 5.54 | | Diluted earnings per share attributable to Moody's common shareholders | | $ | 3.07 | | | | $ | 2.69 | | | | $ | 6.98 | | | | $ | 5.27 | |
| Pre-Tax Acquisition-Related Expenses | $ | — | | | $ | — | | | | $ | — | | | $ | 0.02 | | | |
| Tax on Acquisition-Related Expenses | — | | | — | | | | — | | | (0.01) | | | |
| Net Acquisition-Related Expenses | | — | | | | — | | | | — | | | | 0.01 | | |
| | Pre-Tax Acquisition-Related Intangible Amortization Expenses | Pre-Tax Acquisition-Related Intangible Amortization Expenses | $ | 0.16 | | | $ | 0.13 | | | | $ | 0.47 | | | $ | 0.40 | | | Pre-Tax Acquisition-Related Intangible Amortization Expenses | $ | 0.19 | | | $ | 0.16 | | | | $ | 0.38 | | | $ | 0.31 | | |
| Tax on Acquisition-Related Intangible Amortization Expenses | Tax on Acquisition-Related Intangible Amortization Expenses | (0.04) | | | (0.04) | | | | (0.09) | | | (0.09) | | | Tax on Acquisition-Related Intangible Amortization Expenses | (0.04) | | | (0.03) | | | | (0.09) | | | (0.07) | | |
| Net Acquisition-Related Intangible Amortization Expenses | Net Acquisition-Related Intangible Amortization Expenses | | 0.12 | | | | 0.09 | | | | 0.38 | | | | 0.31 | | Net Acquisition-Related Intangible Amortization Expenses | | 0.15 | | | | 0.13 | | | | 0.29 | | | | 0.24 | |
| | Pre-Tax Restructuring | Pre-Tax Restructuring | $ | 0.12 | | | $ | (0.01) | | | | $ | 0.10 | | | $ | 0.30 | | | Pre-Tax Restructuring | $ | — | | | $ | (0.01) | | | | $ | 0.01 | | | $ | (0.02) | | |
| Tax on Restructuring | Tax on Restructuring | (0.02) | | | 0.01 | | | | (0.02) | | | (0.07) | | | Tax on Restructuring | — | | | — | | | | — | | | 0.01 | | |
| Net Restructuring | Net Restructuring | | 0.10 | | | | — | | | | 0.08 | | | | 0.23 | | Net Restructuring | | — | | | | (0.01) | | | | 0.01 | | | | (0.01) | |
| Pre-Tax captive insurance company settlement | $ | — | | | $ | 0.08 | | | | $ | — | | | $ | 0.08 | | | |
| Tax on captive insurance company settlement | — | | | (0.02) | | | | — | | | (0.02) | | | |
| Net captive insurance company settlement | | — | | | | 0.06 | | | | — | | | | 0.06 | | |
| Tax charge pursuant to the divestiture of MAKS | | — | | | — | | | | — | | | 0.08 | | |
| | | Loss pursuant to the divestiture of MAKS | Loss pursuant to the divestiture of MAKS | | — | | | 0.01 | | | | 0.05 | | | 0.06 | | Loss pursuant to the divestiture of MAKS | | — | | | — | | | | — | | | 0.05 | |
| Adjusted Diluted EPS | Adjusted Diluted EPS | | $ | 2.69 | | | $ | 2.15 | | | | $ | 8.24 | | | $ | 6.29 | | Adjusted Diluted EPS | | $ | 3.22 | | | $ | 2.81 | | | | $ | 7.28 | | | $ | 5.55 | |
Note: the tax impacts in the table above were calculated using tax rates in effect in the jurisdiction for which the item relates.
Free Cash Flow:
The Company defines Free Cash Flow as net cash provided by operating activities minus payments for capital additions. Management believes that Free Cash Flow is a useful metric in assessing the Company’s cash flows to service debt, pay dividends and to fund acquisitions and share repurchases. Management deems capital expenditures essential to the Company’s product and service innovations and maintenance of Moody’s operational capabilities. Accordingly, capital expenditures are deemed to be a recurring use of Moody’s cash flow. Below is a reconciliation of the Company’s net cash flows from operating activities to Free Cash Flow:
| | | | | | | | | | | |
| Nine Months Ended September 30, |
| 2020 | | 2019 |
| Net cash flows provided by operating activities | $ | 1,488 | | | $ | 1,196 | |
| Capital additions | (83) | | | (61) | |
| Free Cash Flow | $ | 1,405 | | | $ | 1,135 | |
| Net cash flows used in investing activities | $ | (853) | | | $ | (150) | |
| Net cash flows provided by (used in) financing activities | $ | 3 | | | $ | (1,517) | |
| | | | | | | | | | | |
| Six Months Ended June 30, |
| 2021 | | 2020 |
| Net cash flows provided by operating activities | $ | 1,270 | | | $ | 977 | |
| Capital additions | (44) | | | (62) | |
| Free Cash Flow | $ | 1,226 | | | $ | 915 | |
| Net cash flows used in investing activities | $ | (251) | | | $ | (823) | |
| Net cash flows (used in) provided by financing activities | $ | (792) | | | $ | 123 | |
Organic Revenue:
The Company presents the organic revenue and growth because management deems this metric to be a useful measure which provides additional perspective in assessing the revenue growth excluding the inorganic revenue impacts from certain acquisitions and divestitureacquisition activity. The following table details the periods excluded from each acquisition/divestitureacquisition to determine organic revenue.
| | | | | | | | | | | | | | | | | | | | | | | | | | | | | | | | |
| | | | Period excluded to determine organic revenue growth |
| Acquisition | | Acquisition Date | | Q2 | | YTD |
| Regulatory DataCorp | | February 13, 2020 | | - | | January 1, 2021 - February 12, 2021 |
| Acquire Media | | October 21, 2020 | | April 1, 2021 - June 30, 2021 | | January 1, 2021 - June 30, 2021 |
| ZM Financial Systems | | December 7, 2020 | | April 1, 2021 - June 30, 2021 | | January 1, 2021 - June 30, 2021 |
| Catylist | | December 30, 2020 | | April 1, 2021 - June 30, 2021 | | January 1, 2021 - June 30, 2021 |
| Cortera | | March 19, 2021 | | April 1, 2021 - June 30, 2021 | | March 19, 2021 - June 30, 2021 |
| | | | | | |
| | | | | | | | |
Acquisition | | Acquisition Date | | Three Months Ended September 30 | | Nine Months Ended September 30 |
RiskFirst | | July 25, 2019 | | July 1, 2020 - July 24, 2020 | | January 1, 2020 - July 24, 2020 |
ABS Suite | | October 1, 2019 | | July 1, 2020 - September 30, 2020 | | January 1, 2020 - September 30, 2020 |
Regulatory DataCorp | | February 13, 2020 | | July 1, 2020 - September 30, 2020 | | February 13, 2020 - September 30, 2020 |
| | | | | | | | | | |
Divestiture | | Divestiture Date | | | | | | | | |
MAKS | | November 7, 2019 | | July 1, 2019 - September 30, 2019 | | January 1, 2019 - September 30, 2019 |
| | | | | | | | | | |
Additionally, subsequent to the divestiture of MAKS in 2019, revenue from the Moody's Analytics Learning Solutions ("MALS") unit, which previous to 2020 was reported in the Professional Services LOB, is now reported as part of the RD&A LOB. Prior periods have not been reclassified as the amounts were not material. For purposes of determining organic RD&A revenue growth, MALS revenue has been excluded from 2020 RD&A revenue. Below is a reconciliation of MA's reported revenue and growth rates to its organic revenue and organic growth rates:
| | | | | | | | | | | | | | | | | | | | | | | | | | | | | | | | | | | | | | | | | | | | | | | |
| Three Months Ended September 30, | | Nine Months Ended September 30, |
| Amounts in millions | 2020 | | 2019 | | Change | | Growth | | 2020 | | 2019 | | Change | | Growth |
| MA revenue | $ | 531 | | | $ | 494 | | | $ | 37 | | | 7% | | $ | 1,524 | | | $ | 1,441 | | | $ | 83 | | | 6% |
| RiskFirst | (2) | | | — | | | (2) | | | | | (12) | | | — | | | (12) | | | |
| ABS Suite | (3) | | | — | | | (3) | | | | | (6) | | | — | | | (6) | | | |
| Regulatory DataCorp | (16) | | | — | | | (16) | | | | | (37) | | | — | | | (37) | | | |
| MAKS | — | | | (28) | | | 28 | | | | | — | | | (83) | | | 83 | | | |
| Organic MA revenue | $ | 510 | | | $ | 466 | | | $ | 44 | | | 9% | | $ | 1,469 | | | $ | 1,358 | | | $ | 111 | | | 8% |
| | | | | | | | | | | | | | | |
| Three Months Ended September 30, | | Nine Months Ended September 30, |
| Amounts in millions | 2020 | | 2019 | | Change | | Growth | | 2020 | | 2019 | | Change | | Growth |
| RD&A revenue | $ | 386 | | | $ | 317 | | | $ | 69 | | | 22% | | $ | 1,110 | | | $ | 940 | | | $ | 170 | | | 18% |
| ABS Suite | (3) | | | — | | | (3) | | | | | (6) | | | — | | | (6) | | | |
| Regulatory DataCorp | (16) | | | — | | | (16) | | | | | (37) | | | — | | | (37) | | | |
| MALS | (13) | | | — | | | (13) | | | | | (40) | | | — | | | (40) | | | |
| Organic RD&A revenue | $ | 354 | | | $ | 317 | | | $ | 37 | | | 12% | | $ | 1,027 | | | $ | 940 | | | $ | 87 | | | 9% |
| | | | | | | | | | | | | | | |
| Three Months Ended September 30, | | Nine Months Ended September 30, |
| Amounts in millions | 2020 | | 2019 | | Change | | Growth | | 2020 | | 2019 | | Change | | Growth |
| ERS revenue | $ | 145 | | | $ | 134 | | | $ | 11 | | | 8% | | $ | 414 | | | $ | 373 | | | $ | 41 | | | 11% |
| RiskFirst | (2) | | | — | | | (2) | | | | | (12) | | | — | | | (12) | | | |
| Organic ERS revenue | $ | 143 | | | $ | 134 | | | $ | 9 | | | 7% | | $ | 402 | | | $ | 373 | | | $ | 29 | | | 8% |
| | | | | | | | | | | | | | | |
| | | | | | | | | | | | | | | | | | | | | | | | | | | | | | | | | | | | | | | | | | | | | | | |
| Three Months Ended June 30, | | Six Months Ended June 30, |
| Amounts in millions | 2021 | | 2020 | | Change | | Growth | | 2021 | | 2020 | | Change | | Growth |
| MA revenue | $ | 573 | | | $ | 497 | | | $ | 76 | | | 15% | | $ | 1,137 | | | $ | 993 | | | $ | 144 | | | 15% |
| Regulatory DataCorp | — | | | — | | | — | | | | | (8) | | | — | | | (8) | | | |
| Acquire Media | (5) | | | — | | | (5) | | | | | (12) | | | — | | | (12) | | | |
| ZM Financial Systems | (3) | | | — | | | (3) | | | | | (5) | | | — | | | (5) | | | |
| Catylist | (2) | | | — | | | (2) | | | | | (4) | | | — | | | (4) | | | |
| Cortera | (3) | | | — | | | (3) | | | | | (3) | | | — | | | (3) | | | |
| Organic MA revenue | $ | 560 | | | $ | 497 | | | $ | 63 | | | 13% | | $ | 1,105 | | | $ | 993 | | | $ | 112 | | | 11% |
| | | | | | | | | | | | | | | |
| Three Months Ended June 30, | | Six Months Ended June 30, |
| Amounts in millions | 2021 | | 2020 | | Change | | Growth | | 2021 | | 2020 | | Change | | Growth |
| RD&A revenue | $ | 435 | | | $ | 366 | | | $ | 69 | | | 19% | | $ | 854 | | | $ | 724 | | | $ | 130 | | | 18% |
| Regulatory DataCorp | — | | | — | | | — | | | | | (8) | | | — | | | (8) | | | |
| Acquire Media | (5) | | | — | | | (5) | | | | | (12) | | | — | | | (12) | | | |
| Catylist | (2) | | | — | | | (2) | | | | | (4) | | | — | | | (4) | | | |
| Cortera | (3) | | | — | | | (3) | | | | | (3) | | | — | | | (3) | | | |
| Organic RD&A revenue | $ | 425 | | | $ | 366 | | | $ | 59 | | | 16% | | $ | 827 | | | $ | 724 | | | $ | 103 | | | 14% |
| | | | | | | | | | | | | | | |
| Three Months Ended June 30, | | Six Months Ended June 30, |
| Amounts in millions | 2021 | | 2020 | | Change | | Growth | | 2021 | | 2020 | | Change | | Growth |
| ERS revenue | $ | 138 | | | $ | 131 | | | $ | 7 | | | 5% | | $ | 283 | | | $ | 269 | | | $ | 14 | | | 5% |
| ZM Financial Systems | (3) | | | — | | | (3) | | | | | (5) | | | — | | | (5) | | | |
| Organic ERS revenue | $ | 135 | | | $ | 131 | | | $ | 4 | | | 3% | | $ | 278 | | | $ | 269 | | | $ | 9 | | | 3% |
| | | | | | | | | | | | | | | |
Recently Issued Accounting Standards
Refer to Note 211 to the condensed consolidated financial statements located in Part I onof this Form 10-Q for a discussion on the impact to the Company relating to recently issued accounting pronouncements.
Contingencies
Legal proceedings in which the Company is involved also may impact Moody’s liquidity or operating results. No assurance can be provided as to the outcome of such proceedings. In addition, litigation inherently involves significant costs. For information regarding legal proceedings, see Item 1 - "Financial Statements", Note 1918 "Contingencies” in this Form 10-Q.
Regulation
MIS, certain of the Company's credit rating affiliates and many of the issuers and/or securities that it ratesMIS and the affiliates rate, are subject to extensive regulation in both the U.S., EU and in other countries (including by state and local authorities). In addition, some of the services offered by MA and its affiliates are subject to regulation in a number of countries. MA also derives a significant amount of its sales from banks and other financial services providers who are subject to regulatory oversight and who are required to pass through certain regulatory requirements to key suppliers such as MA. Existing and proposed laws and regulations can impact the Company’s operations, products and the markets for securities that it rates.in which the Company operates. Additional laws and regulations have been proposed or are being considered. Each of the existing, adopted, proposed and potential laws and regulations can increase the costs and legal risk associated with the Company’s operations, including the issuance of credit ratings, and may negatively impact the Company’s profitability and ability to compete, or result in changes in the demand for credit ratings,the Company’s products and services, in the manner in which credit ratingsthe Company’s products and services are utilized and in the manner in which the Company operates.
The regulatory landscape continues to evolve. In the U.S., CRAs are subject to extensive regulation primarily pursuant to the Reform Act and the Dodd-Frank Act. The Reform Act added Section 15E to the Exchange Act and provided the SEC with the authority to establish a registration and oversight program for credit rating agenciesCRAs registered as NRSROs. Among other things, the Reform Act requires the SEC to submit an annual report to Congress providing an overview of SEC activities with respect to NRSROs, and detailing the SEC’s views on the state of competition, transparency and conflicts of interests among NRSROs. The Dodd-Frank Act enhanced the SEC’s oversightadded additional provisions to Section 15E. The transitions of the Presidential administration, Congress and SEC, in the U.S., as with any such government transition, could bring potential changes in the laws affecting CRAs and/or the enforcement of any new or existing legislation, regulation of NRSROs, and includes a requirement that the SEC publish an annual report summarizing the results of its annual examinations of NRSROs. To date, through a series of rulemakings, the SEC has implemented several Exchange Act provisions related to NRSROs. These include, for example, provisions addressing disclosure of data and assumptions underlying credit ratings, conflicts of interest with respect to sales and marketing practices, disclosure of performance statistics, application and disclosure of credit rating methodologies, analyst training and testing and consistent application of rating symbols and definitions. The Company has made and continues to make substantial IT and other investments, and has implemented the relevant compliance obligations.or directives by government authorities.
In the EU, the CRA industry is registered and supervised through a pan-EU regulatory framework. The European Securities and Markets Authority (ESMA)ESMA has direct supervisory responsibility for the registered CRA industryCRAs throughout the EU. MIS’ EU CRA subsidiaries are registered and are subject to formal regulation and periodic inspection. Applicable rules include procedural requirements with respect to use of credit ratings, independence and avoidance of conflicts of interest, conflicts of interest concerning investments in CRAs, methodologies, models and key rating assumptions, CRA rotation and use of multiple CRAs, outsourcing, disclosures, credit ratings of sovereign issuers, liability for intentional or grossly negligent failure to abide by applicable regulations, reporting requirements to ESMA regarding fees, and additional procedural and substantive requirements on the pricing of services. From time to time, ESMA publishes interpretive guidance, or thematic reports regarding various aspects of the CRA regulation and, annually, sets out its work program for the forthcoming year. ESMA’sIn July 2021, work program includes, amongst others, monitoring, identifying and assessing new risks such as those emanating from COVID-19 and Environmental, Social and Governance (ESG) products, assessing the drivers behind changes to credit rating methodologies, engaging with CRAs on IT and information security controls and ensuring that credit ratings are accessible and usable by investors.
In 2016, the European Commission published a report concluding that no new EU legislation was necessary at that time, but that it would continue to monitor the credit rating industry and analyze approaches that may strengthen existing regulation. In April 2020, the Commission published a consultation on a Sustainable Finance strategy for the EU. The new strategy is expected to be publishedannounced further measures in the first quarterrespect of 2021 and couldits sustainable finance strategy. These include proposals on the integrationfurther assessments in respect of Environmental, Social, and Governance criteria in the credit rating process. The Commission is also expected to publish a report in 2021 onboth CRAs and the integration of sustainability factors into their credit ratings and on Sustainability Research and Ratings.research, which might lead to legislative action.
Separately, on June 23, 2016, the U.K. voted to exit the E.U. and on January 31, 2020 formally left the E.U. There is now a transition period of 11 months untilOn December 31, 2020, when most EU law will remain applicable in the U.K.. The longer-term impact of the decisionMIS U.K. registered CRA ceased to leave the E.U. on the overall regulatory framework forbe registered with and regulated by ESMA and became subject to regulation by the U.K. will depend,Financial Conduct Authority. Regulatory arrangements also came into effect in part, on the relationship that the U.K. negotiates with the E.U. During the transition period, the E.U. CRA regulatory framework will remain in place inboth the U.K. and firms must continuethe EU to abide by their existing obligations with ESMA asallow credit ratings to be available for regulatory use in both the regulator of EU-registered CRAs. It is
expected that fromEU and the start of 2021, relevant legislation for CRAs underU.K. MIS has put arrangements in place to endorse its U.K. credit ratings into the supervision of the Financial Conduct Authority will comeEU and its EU credit ratings into force in the U.K.
In light of the regulations that have gone into effect in both the E.U.EU and the U.S. (as well as many other countries), periodically and as a matter of course pursuant to their enabling legislation, regulatory authorities have, and will continue to, publish reports that describe their oversight activities over the industry.activities. In addition, other legislation, regulation and/or interpretation of existing regulation relating to the Company’s operations, including credit rating, ancillary and research services has been or is being considered by local, national and multinational bodies and this type of activity is likely to continue in the future. Finally, in certain countries, governments may provide financial or other support to locally-based CRAs. For example, governments may from time to time establish official CRAs or credit ratings criteria or procedures for evaluating local issuers. If enacted, any such legislation and regulation could change the competitive landscape in which MISthe Company operates. The legal status of CRAs has been addressed by courts in various decisions and is likely to be considered and addressed in legal proceedings from time to time in the future. Management of the Company cannot predict whether these or any other proposals will be enacted, the outcome of any pending or possible future legal proceedings, or regulatory or legislative actions, or the ultimate impact of any such matters on the competitive position, financial position or results of operations of the Company.
Forward-Looking Statements
Certain statements contained in this quarterly report on Form 10-Q are forward-looking statements and are based on future expectations, plans and prospects for the business and operations of the Company that involve a number of risks and uncertainties. Such statements involve estimates, projections, goals, forecasts, assumptions and uncertainties that could cause actual results or outcomes to differ materially from those contemplated, expressed, projected, anticipated or implied in the forward-looking statements. Those statements appear at various places throughout this quarterly report on Form 10-Q, including in the sections entitled “Contingencies” under Item 2, “MD&A”, commencing on page 5047 of this quarterly report on Form 10-Q, under “Legal Proceedings” in Part II, Item 1, of this Form 10-Q, and elsewhere in the context of statements containing the words “believe”, “expect”, “anticipate”, “intend”, “plan”, “will”, “predict”, “potential”, “continue”, “strategy”, “aspire”, “target”, “forecast”, “project”, “estimate”, “should”, “could”, “may” and similar expressions or words and variations thereof relating to the Company’s views on future events, trends and contingencies or otherwise convey the prospective nature of events or outcomes generally indicative of forward-looking statements. Stockholders and investors are cautioned not to place undue reliance on these forward-looking statements. The forward-looking statements and other information are made as of the date of this quarterly report on Form 10-Q, and the Company undertakes no obligation (nor does it intend) to publicly supplement, update or revise such statements on a going-forward basis, whether as a result of subsequent developments, changed expectations or otherwise, except as required by applicable law or regulation. In connection with the “safe harbor” provisions of the Private Securities Litigation Reform Act of 1995, the Company is identifying examples of factors, risks and uncertainties that could cause actual results to differ, perhaps materially, from those indicated by these forward-looking statements.
Those factors, risks and uncertainties include, but are not limited to the impact of COVID-19 on volatility in the U.S. and world financial markets, on general economic conditions and GDP growth in the U.S. and worldwide, and on the Company’s own operations and personnel. Many other factors could cause actual results to differ from Moody’s outlook, including including:
•credit market disruptions or economic slowdowns, which could affect the volume of debt and other securities issued in domestic and/or global capital markets;
•other matters that could affect the volume of debt and other securities issued in domestic and/or global capital markets, including regulation, credit quality concerns, changes in interest rates and other volatility in the financial markets such as that due to Brexit and uncertainty as companies transition away from LIBOR;
•the level of merger and acquisition activity in the U.S. and abroad;
•the uncertain effectiveness and possible collateral consequences of U.S. and foreign government actions affecting credit markets, international trade and economic policy, including those related to tariffs, tax agreements and trade barriers;
•concerns in the marketplace affecting our credibility or otherwise affecting market perceptions of the integrity or utility of independent credit agency ratings;
•the introduction of competing products or technologies by other companies;
•pricing pressure from competitors and/or customers;
•the level of success of new product development and global expansion;
•the impact of regulation as an NRSRO, the potential for new U.S., state and local legislation and regulations, including provisions in the Dodd-Frank Act and regulations resulting from that Act; regulations;
•the potential for increased competition and regulation in the EU and other foreign jurisdictions;
•exposure to litigation related to Moody's Investors Service's rating opinions, as well as any other litigation, government and regulatory proceedings, investigations and inquiries to which the Company may be subject from time to time; provisions in the Dodd-Frank Act
•U.S. legislation modifying the pleading standards and EU regulations modifying the liability standards applicable to credit rating agencies in a manner adverse to credit rating agencies;
•provisions of EU regulations imposing additional procedural and substantive requirements on the pricing of services and the expansion of supervisory remit to include non-EU ratings used for regulatory purposes;
•the possible loss of key employees; failures or malfunctions of our operations and infrastructure;
•any vulnerabilities to cyber threats or other cybersecurity concerns;
•the outcome of any review by controlling tax authorities of the Company’s global tax planning initiatives;
•exposure to potential criminal sanctions or civil remedies if the Company fails to comply with foreign and U.S. laws and regulations that are applicable in the jurisdictions in which the Company operates, including data protection and privacy laws, sanctions laws, anti-corruption laws, and local laws prohibiting corrupt payments to government officials;
•the impact of mergers, acquisitions or other business combinations and the ability of the Company to successfully integrate such acquired businesses;
•currency and foreign exchange volatility;
•the level of future cash flows;
•the levels of capital investments; and
•a decline in the demand for credit risk management tools by financial institutions.
These factors, risks and uncertainties as well as other risks and uncertainties that could cause Moody’s actual results to differ materially from those contemplated, expressed, projected, anticipated or implied in the forward-looking statements are currently, or in the future could be, amplified by the COVID-19 outbreak, and are described in greater detail under “Risk Factors” in Part I, Item 1A of the Company’s annual report on Form 10-K for the year ended December 31, 2019, its quarterly report on Form 10-Q for the quarter ended March 31, 2020 and in other filings made by the Company from time to time with the SEC or in materials incorporated herein or therein. Stockholders and investors are cautioned that the occurrence of any of these factors, risks and uncertainties may cause the Company’s actual results to differ materially from those contemplated, expressed, projected, anticipated or implied in the forward-looking statements, which could have a material and adverse effect on the Company’s business, results of operations and financial condition. New factors may emerge from time to time, and it is not possible for the Company to predict new factors, nor can the Company assess the potential effect of any new factors on it.
Item 3. Quantitative and Qualitative Disclosures about Market Risk
The following discussion outlinesThere have been no material changes in Moody’s derivative instrument portfolio subsequent to the filingCompany's market risk during the six months ended June 30, 2021. For a discussion of the Company’s Form 10-K for the year ended December 31, 2019:
Interest rate swaps designated as fair value hedges:
In the first quarter of 2020, the Company entered into interest rate swaps with a notional amount of $500 millionexposure to convert the fixed rate of interest on the 3.25% 2017 Senior Notes due 2028 to a floating interest rate based on the 3-month USD LIBOR. The hedges will be settled in 2026. A hypothetical change of 100 BPS in the USD LIBOR-based swap rate would result in an approximate $28 million changemarket risk, refer to the fair value of the swap, which would be offset by the changeCompany’s market risk disclosures set forth in fair value of the hedged item.
In the third quarter of 2020, the Company entered into interest rate swaps with a notional amount of $300 million to convert the fixed rate of interest on the 3.75% 2020 Senior Notes due 2025 to a floating interest rate based on the 6-month USD LIBOR. The hedges will mature in 2025. A hypothetical change of 100 BPS in the USD LIBOR-based swap rate would result in an approximate $13 million change to the fair value of the swap, which would be offset by the change in fair value of the hedged item.
Cross-currency swaps designated as net investment hedges:
In the first quarter of 2020, the Company entered into cross-currency swaps to exchange an aggregate amount of €450 million with corresponding interest based on the floating 3-month EURIBOR for an aggregate amount of $500 million with corresponding interest based on the floating 3-month USD LIBOR. These swaps were designated as net investment hedges under ASC Topic 815. The purpose of these cross-currency swaps is to mitigate FX exposure related to a portion of the Company’s euro net investments in certain foreign subsidiaries against changes in euro/USD exchange rates. If the euro were to strengthen 10% relative to the U.S. dollar, there would be an approximate $53 million unfavorable impact to the fair value of the cross-currency swaps recognized in OCI, which would be offset by favorable currency translation gains on the Company’s euro net investment in foreign subsidiaries.
Foreign exchange forwards designated as net investment hedges:
In the third quarter of 2020, the Company entered into a foreign exchange forward contract to exchange €247 million for $292 million. The purpose of this foreign exchange forward is to mitigate FX exposure related to a portion of the Company's euro net investment in certain foreign subsidiaries against changes in euro/USD exchange rates. If the euro were to strengthen 10% relative to the U.S. dollar, there would be an approximate $29 million unfavorable impact to the fair value of the forward contract recognized in OCI, which would be offset by favorable currency translation gains on the Company's euro net investment in foreign subsidiaries.
Refer to Note 10 to the condensed consolidated financial statements in this Form 10-Q andPart II, Item 7A.7A, “Quantitative and Qualitative Disclosures aboutAbout Market Risk”, contained in of the Company’s annual report on2020 Form 10-K for the year ended December 31, 2019 for further discussion on the Company’s derivative financial instruments.10-K.
Item 4. Controls and Procedures
Evaluation of Disclosure Controls and Procedures: The Company carried out an evaluation, as required by Rule 13a-15(b) under the Exchange Act, under the supervision and with the participation of the Company’s management, including the Company’s Chief Executive Officer and Chief Financial Officer, of the effectiveness of the design and operation of the Company’s disclosure controls and procedures, as defined in Rule 13a-15(e) of the Exchange Act, as of the end of the period covered by this report (the “Evaluation Date”). Based on such evaluation, such officers have concluded that, as of the Evaluation Date, the Company’s disclosure controls and procedures were effective to provide reasonable assurance that information required to be disclosed by the Company in reports that it files or submits under the Exchange Act is recorded, processed, summarized and reported within the time periods specified in the communication to the Company’s management, including the Company’s Chief Executive Officer and Chief Financial Officer, as appropriate to allow timely decisions regarding required disclosure.
The Company’s management, including the Company’s Chief Executive Officer and Chief Financial Officer, has determined that there were no changes in the Company’s internal control over financial reporting that have materially affected, or are reasonably likely to materially affect, these internal controls over financial reporting during the three-month period ended SeptemberJune 30, 2020.2021. Although a significant portion of the Company’s workforce beganhas been working remotely in mid-March 2020 due to the COVID-19 pandemic, Moody’s has not experienced any material impact to its internal controls over financial reporting.
PART II. OTHER INFORMATION
Item 1. Legal Proceedings
For information regarding legal proceedings, see Item 1 – “Financial Statements – Notes to Condensed Consolidated Financial Statements (Unaudited),” Note 1918 “Contingencies” in this Form 10-Q.
Item 1A. Risk Factors
There have been no material changes from the significant risk factors and uncertainties previously disclosed under the heading "Risk Factors" in the Company's annual report on Form 10-K for the year ended December 31, 2019, as updated in the Company's quarterly report on Form 10-Q for the quarter ended March 31, 2020, that if they were to occur, could materially adversely affect the Company’s business, financial condition, operating results and/or cash flow. For a discussion of the Company’s risk factors, refer to Item 1A. “Risk Factors”, contained in the Company’s annual report on Form 10-K for the year ended December 31, 2019 and its quarterly report on Form 10-Q for the quarter ended March 31, 2020.
Item 2. Unregistered Sales of Equity Securities and Use of Proceeds
MOODY'S PURCHASES OF EQUITY SECURITIES
For the three months ended SeptemberJune 30, 2020
| | | | | | | | | | | | | | | | | | | | | | | | | | |
| Period | | Total Number of Shares Purchased (1) | |
Average Price Paid per Share | | Total Number of Shares Purchased as Part of Publicly Announced Program | | Approximate Dollar Value of Shares That May Yet be Purchased Under the Program(2) |
| July 1- 31 | | 789 | | | $ | — | | | $ | — | | | $ | 1,081 | million |
| August 1- 31 | | 493 | | | $ | — | | | $ | — | | | $ | 1,081 | million |
| September 1- 30 | | 174 | | | $ | — | | | $ | — | | | $ | 1,081 | million |
| Total | | 1,456 | | | $ | — | | | $ | — | | | |
| | | | | | | | | | | | | | | | | | | | | | | | | | |
| Period | | Total Number of Shares Purchased (1) | |
Average Price Paid per Share | | Total Number of Shares Purchased as Part of Publicly Announced Program | | Approximate Dollar Value of Shares That May Yet be Purchased Under the Program(2) |
| April 1- 30 | | 402,163 | | | $ | 315.99 | | | $ | 399,925 | | | $ | 1,572 | million |
| May 1- 31 | | 372,995 | | | $ | 329.18 | | | $ | 372,329 | | | $ | 1,449 | million |
| June 1- 30 | | 364,564 | | | $ | 344.93 | | | $ | 353,244 | | | $ | 1,327 | million |
| Total | | 1,139,722 | | | $ | 329.44 | | | $ | 1,125,498 | | | |
(1)Includes surrender to the Company of 789, 4932,238, 666 and 17411,320 shares of common stock in July, AugustApril, May and September,June, respectively, to satisfy tax withholding obligations in connection with the vesting of restricted stock issued to employees.
(2)As of the last day of each of the months. On October 22, 2018,December 16, 2019, the Board authorized a $1 billion in share repurchase program, which at September 30, 2020 had approximately $81 million of remaining authority. On December 16, 2019,authority and on February 9, 2021, the Board approved an additional $1 billion for thein share repurchase program, which may commence following the completionauthority. At June 30, 2021 there was approximately $1,327 million of the existing program.combined share repurchase authority remaining. There is no established expiration date for the remaining authorization.
During the thirdsecond quarter of 2020,2021, Moody’s issued a net 0.10.2 million shares under employee stock-based compensation plans.
Item 5. Other Information
Not applicableapplicable.
Item 6. Exhibits
| | | | | | | | |
| Exhibit No | | Description |
| 3 | | ARTICLES OF INCORPORATION AND BY-LAWS |
| | |
| .1 | | |
| | |
| .2 | | |
| | |
| | |
| | |
| | |
| | |
| | |
| | |
| | |
| 31 | | CERTIFICATIONS PURSUANT TO SECTION 302 OF THE SARBANES-OXLEY ACT OF 2002 |
| | |
| .1* | | |
| | |
| .2* | | |
| | |
| 32 | | CERTIFICATIONS PURSUANT TO SECTION 906 OF THE SARBANES-OXLEY ACT OF 2002 |
| | |
| .1* | | |
| | |
| .2* | | |
| | |
| 101.INS* | | Inline XBRL Instance Document (the instance document does not appear in the Interactive Data File because its XBRL tags are embedded within the Inline XBRL document) |
| 101.SCH* | | Inline XBRL Taxonomy Extension Schema Document |
| 101.CAL* | | Inline XBRL Taxonomy Extension Calculation Linkbase Document |
| 101.DEF* | | Inline XBRL Definitions Linkbase Document |
| 101.LAB* | | Inline XBRL Taxonomy Extension Labels Linkbase Document |
| 101.PRE* | | Inline XBRL Taxonomy Extension Presentation Linkbase Document |
| 104* | | Cover Page Interactive Data File (formatted as inline XBRL and contained in Exhibit 101) |
| | |
| * Filed herewith |
SIGNATURES
Pursuant to the requirements of the Securities Exchange Act of 1934, the registrant has duly caused this report to be signed on its behalf by the undersigned, thereunto duly authorized.
| | | | | | | | |
| | MOODY’S CORPORATION |
| | |
| | |
| By: | / S / MARK KAYE |
| | Mark Kaye |
| | SeniorExecutive Vice President and Chief Financial Officer |
| | (principal financial officer) |
| | |
| By: | / S / CAROLINE SULLIVAN |
| | Caroline Sullivan |
| | Senior Vice President and Corporate Controller |
| | (principal accounting officer) |
| | |
Date: October 30, 2020July 29, 2021 | | |