UNITED STATES
SECURITIES AND EXCHANGE COMMISSION
Washington, D.C. 20549
FORM 10-Q
(Mark One)
[X] QUARTERLY REPORT PURSUANT TO SECTION 13 OR 15(d) OF THE SECURITIES EXCHANGE ACT OF 1934
For the quarterly period endedSeptember 30, 20132014
OR
[ ] TRANSITION REPORT PURSUANT TO SECTION 13 OR 15(d) OF THE SECURITIES AND EXCHANGE ACT OF 1934
For the transition period from ___________________________________ To _____________________________________
Commission file number:000-31203
NET 1 UEPS TECHNOLOGIES, INC.
(Exact name of registrant as specified in its charter)
| Florida | 98-0171860 |
| (State or other jurisdiction | (IRS Employer |
| of incorporation or organization) | Identification No.) |
President Place, 4th Floor, Cnr. Jan Smuts Avenue and Bolton Road
Rosebank, Johannesburg 2196, South Africa
(Address of principal executive offices, including zip code)
Registrant’s telephone number, including area code:27-11-343-2000
Not Applicable
(Former Name, Former Address and Former Fiscal Year, if Changed Since Last Report)
Indicate by check mark whether the registrant (1) has filed all reports required to be filed by Section 13 or 15(d) of the Securities Exchange Act of 1934 during the preceding 12 months (or for such shorter period that the registrant was required to file such reports), and (2) has been subject to such filing requirements for the past 90 days.
YES [X] NO [ ]
Indicate by check mark whether the registrant has submitted electronically and posted on its corporate Web site, if any, every Interactive Data File required to be submitted and posted pursuant to Rule 405 of Regulation S-T (§232.405 of this chapter) during the preceding 12 months (or for such shorter period that the registrant was required to submit and post such files).
YES [X] NO [ ]
Indicate by check mark whether the registrant is a large accelerated filer, an accelerated filer, a non-accelerated filer or a smaller reporting company. See the definitions of “large accelerated filer”, “accelerated filer” and “smaller reporting company” in Rule 12b-2 of the Exchange Act (check one):
| [ ] | Large accelerated filer | [X] | Accelerated filer |
| [ ] | Non-accelerated filer | [ ] | Smaller reporting company |
| (do not check if a smaller reporting company) |
Indicate by check mark whether the registrant is a shell company (as defined in Rule 12b-2 of the Exchange Act).
YES [ ] NO [X ]
As of November 7, 20134, 2014 (the latest practicable date), 45,735,23646,475,623 shares of the registrant’s common stock, par value $0.001 per share, net of treasury shares, were outstanding.
Form 10-Q
NET 1 UEPS TECHNOLOGIES, INC.
Table of Contents
1
Part I. Financial Information
Item 1. Financial Statements
NET 1 UEPS TECHNOLOGIES, INC.
Unaudited Condensed Consolidated Balance Sheets
| Unaudited | (A) | Unaudited | (A) | |||||||||
| September 30, | June 30, | September 30, | June 30, | |||||||||
| 2013 | 2013 | 2014 | 2014 | |||||||||
| (In thousands, except share data) | (In thousands, except share data) | |||||||||||
| ASSETS | ASSETS | ASSETS | ||||||||||
| CURRENT ASSETS | ||||||||||||
| Cash and cash equivalents | $ | 47,670 | $ | 53,665 | $ | 81,185 | $ | 58,672 | ||||
| Pre-funded social welfare grants receivable (Note 2) | 4,263 | 2,934 | 4,863 | 4,809 | ||||||||
| Accounts receivable, net of allowances of – September: $935; June: $4,701 | 118,025 | 102,614 | ||||||||||
| Finance loans receivable, net of allowances of – September: $701; June: $- | 17,338 | 8,350 | ||||||||||
| Accounts receivable, net of allowances of – September: $2,075; June: $1,313 | 136,701 | 148,067 | ||||||||||
| Finance loans receivable, net of allowances of – September: $3,136; June: $3,083 | 53,884 | 53,124 | ||||||||||
| Inventory (Note 3) | 11,063 | 12,222 | 12,200 | 10,785 | ||||||||
| Deferred income taxes | 5,125 | 4,938 | 7,045 | 7,451 | ||||||||
| Total current assets before settlement assets | 203,484 | 184,723 | 295,878 | 282,908 | ||||||||
| Settlement assets (Note 4) | 685,305 | 752,476 | 724,279 | 725,987 | ||||||||
| Total current assets | 888,789 | 937,199 | 1,020,157 | 1,008,895 | ||||||||
| PROPERTY, PLANT AND EQUIPMENT, NET OF ACCUMULATED | ||||||||||||
| DEPRECIATION OF – September: $92,099; June: $84,808 | 48,716 | 48,301 | ||||||||||
| PROPERTY, PLANT AND EQUIPMENT, net of accumulated depreciation of – September: $92,753; June: $91,422 | 48,739 | 47,797 | ||||||||||
| EQUITY-ACCOUNTED INVESTMENTS | 1,270 | 1,183 | 934 | 878 | ||||||||
| GOODWILL (Note 6) | 180,950 | 175,806 | 179,003 | 186,576 | ||||||||
| INTANGIBLE ASSETS, net (Note 6) | 76,915 | 77,257 | 62,148 | 68,514 | ||||||||
| OTHER LONG-TERM ASSETS, including reinsurance assets (Note 7) | 36,150 | 36,576 | ||||||||||
| OTHER LONG-TERM ASSETS, including reinsurance assets (Note 5 and Note 7) | 36,533 | 38,285 | ||||||||||
| TOTAL ASSETS | 1,232,790 | 1,276,322 | 1,347,514 | 1,350,945 | ||||||||
| LIABILITIES | LIABILITIES | LIABILITIES | ||||||||||
| CURRENT LIABILITIES | ||||||||||||
| Accounts payable | 14,036 | 26,567 | 14,941 | 17,101 | ||||||||
| Other payables | 38,802 | 33,808 | 43,346 | 42,257 | ||||||||
| Current portion of long-term borrowings (Note 9) | 15,007 | 14,209 | 14,276 | 14,789 | ||||||||
| Income taxes payable | 9,261 | 2,275 | 13,581 | 7,676 | ||||||||
| Total current liabilities before settlement obligations | 77,106 | 76,859 | 86,144 | 81,823 | ||||||||
| Settlement obligations (Note 4) | 685,305 | 752,476 | 724,279 | 725,987 | ||||||||
| Total current liabilities | 762,411 | 829,335 | 810,423 | 807,810 | ||||||||
| DEFERRED INCOME TAXES | 18,703 | 18,727 | 14,078 | 15,522 | ||||||||
| LONG-TERM BORROWINGS (Note 9) | 70,374 | 66,632 | 61,288 | 62,388 | ||||||||
| OTHER LONG-TERM LIABILITIES, including insurance policy liabilities (Note 7) | 21,499 | 21,659 | 22,396 | 23,477 | ||||||||
| TOTAL LIABILITIES | 872,987 | 936,353 | 908,185 | 909,197 | ||||||||
| COMMITMENTS AND CONTINGENCIES (Note 16) | ||||||||||||
| COMMITMENTS AND CONTINGENCIES (Note 17) | ||||||||||||
| EQUITY | EQUITY | EQUITY | ||||||||||
| COMMON STOCK (Note 10) | ||||||||||||
| Authorized: 200,000,000 with $0.001 par value; Issued and outstanding shares, net of treasury - September: 45,780,513; June: 45,592,550 | 59 | 59 | ||||||||||
| Authorized: 200,000,000 with $0.001 par value; Issued and outstanding shares, net of treasury - September: 46,475,623; June: 47,819,299 | 64 | 63 | ||||||||||
| PREFERRED STOCK | ||||||||||||
| Authorized shares: 50,000,000 with $0.001 par value; Issued and outstanding shares, net of treasury: September: -; June: - | - | - | - | - | ||||||||
| ADDITIONAL PAID-IN-CAPITAL | 161,605 | 160,670 | 210,708 | 202,401 | ||||||||
| TREASURY SHARES, AT COST: September: 13,455,090; June: 13,455,090 | (175,823 | ) | (175,823 | ) | ||||||||
| TREASURY SHARES, AT COST: September: 18,057,228; June: 15,883,212 | (214,520 | ) | (200,681 | ) | ||||||||
| ACCUMULATED OTHER COMPREHENSIVE LOSS | (93,544 | ) | (100,858 | ) | (104,126 | ) | (82,741 | ) | ||||
| RETAINED EARNINGS | 464,214 | 452,618 | 547,222 | 522,729 | ||||||||
| TOTAL NET1 EQUITY | 356,511 | 336,666 | 439,348 | 441,771 | ||||||||
| NON-CONTROLLING INTEREST | 3,292 | 3,303 | (19 | ) | (23 | ) | ||||||
| TOTAL EQUITY | 359,803 | 339,969 | 439,329 | 441,748 | ||||||||
| TOTAL LIABILITIES AND SHAREHOLDERS’ EQUITY | $ | 1,232,790 | $ | 1,276,322 | $ | 1,347,514 | $ | 1,350,945 | ||||
(A) – Derived from audited financial statements
See Notes to Unaudited Condensed Consolidated Financial Statements
2
NET 1 UEPS TECHNOLOGIES, INC.
Unaudited Condensed Consolidated Statements of Operations
| Three months ended | Three months ended | |||||||||||
| September 30, | September 30, | |||||||||||
| 2013 | 2012 | 2014 | 2013 | |||||||||
| (In thousands, except per share data) | (In thousands, except per share data) | |||||||||||
| REVENUE | $ | 123,494 | $ | 111,682 | $ | 156,441 | $ | 123,494 | ||||
| EXPENSE | ||||||||||||
| Cost of goods sold, IT processing, servicing and support | 56,559 | 45,101 | 74,406 | 56,559 | ||||||||
| Selling, general and administration | 40,506 | 47,252 | 38,736 | 40,506 | ||||||||
| Depreciation and amortization | 10,029 | 10,004 | 10,174 | 10,029 | ||||||||
| OPERATING INCOME | 16,400 | 9,325 | 33,125 | 16,400 | ||||||||
| INTEREST INCOME | 3,319 | 3,091 | 4,090 | 3,319 | ||||||||
| INTEREST EXPENSE | 1,752 | 2,071 | 1,312 | 1,752 | ||||||||
| INCOME BEFORE INCOME TAX EXPENSE | 17,967 | 10,345 | 35,903 | 17,967 | ||||||||
| INCOME TAX EXPENSE (note 15) | 6,485 | 3,729 | ||||||||||
| INCOME TAX EXPENSE (Note 16) | 11,648 | 6,485 | ||||||||||
| NET INCOME BEFORE EARNINGS FROM EQUITY-ACCOUNTED INVESTMENTS | 11,482 | 6,616 | 24,255 | 11,482 | ||||||||
| EARNINGS FROM EQUITY-ACCOUNTED INVESTMENTS | 103 | 128 | 92 | 103 | ||||||||
| NET INCOME | 11,585 | 6,744 | 24,347 | 11,585 | ||||||||
| (ADD) NET (LOSS) ATTRIBUTABLE TO NON-CONTROLLING INTEREST | (11 | ) | - | |||||||||
| LESS (ADD) NET (INCOME) LOSS ATTRIBUTABLE TO NON-CONTROLLING INTEREST | 258 | (11 | ) | |||||||||
| NET INCOME ATTRIBUTABLE TO NET1 | $ | 11,596 | $ | 6,744 | $ | 24,089 | $ | 11,596 | ||||
| Net income per share, in United States dollars(note 12) | ||||||||||||
| Net income per share, in United States dollars(Note 13) | ||||||||||||
| Basic earnings attributable to Net1 shareholders | $ | 0.25 | $ | 0.15 | $ | 0.51 | $ | 0.25 | ||||
| Diluted earnings attributable to Net1 shareholders | $ | 0.25 | $ | 0.15 | $ | 0.51 | $ | 0.25 | ||||
See Notes to Unaudited Condensed Consolidated Financial Statements
3
NET 1 UEPS TECHNOLOGIES, INC.
Unaudited Condensed Consolidated Statements of Comprehensive Income
| Three months ended | Three months ended | |||||||||||
| September 30, | September 30, | |||||||||||
| 2013 | 2012 | 2014 | 2013 | |||||||||
| (In thousands) | (In thousands) | |||||||||||
| Net income | $ | 11,585 | $ | 6,744 | $ | 24,347 | $ | 11,585 | ||||
| Other comprehensive (loss) income | ||||||||||||
| Net unrealized loss on asset available for sale, net of tax | (255 | ) | - | (226 | ) | (255 | ) | |||||
| Movement in foreign currency translation reserve | 7,569 | 4,255 | (21,185 | ) | 7,569 | |||||||
| Total other comprehensive income, net of taxes | 7,314 | 4,255 | ||||||||||
| Total other comprehensive (loss) income, net of taxes | (21,411 | ) | 7,314 | |||||||||
| Comprehensive income | 18,899 | 10,999 | 2,936 | 18,899 | ||||||||
| Add comprehensive loss attributable to non-controlling interest | 11 | - | ||||||||||
| (Less) Add comprehensive (income) loss attributable to non-controlling interest | (232 | ) | 11 | |||||||||
| Comprehensive income attributable to Net1 | $ | 18,910 | $ | 10,999 | $ | 2,704 | $ | 18,910 | ||||
See Notes to Unaudited Condensed Consolidated Financial Statements
4
NET 1 UEPSTECHNOLOGIES, INC.
UnauditedCondensedConsolidatedStatement ofChanges in Equity for the threemonths endedSeptember 30, 2014 (dollaramounts inthousands)
| Net 1 UEPS Technologies, Inc. Shareholder | |||||||||||||||||||||||||||||||||
| Accumulated | |||||||||||||||||||||||||||||||||
| Number of | Number of | Additional | other | Non- | |||||||||||||||||||||||||||||
| Number of | Treasury | Treasury | shares, net of | Paid-In | Retained | comprehensive | Total Net1 | controlling | |||||||||||||||||||||||||
| Shares | Amount | Shares | Shares | treasury | Capital | Earnings | (loss) income | Equity | Interest | Total | |||||||||||||||||||||||
| Balance – July 1, 2013 | 59,047,640 | $ | 59 | (13,455,090 | ) | $ | (175,823 | ) | 45,592,550 | $ | 160,670 | $ | 452,618 | $ | (100,858 | ) | $ | 336,666 | $ | 3,303 | $ | 339,969 | |||||||||||
| Restricted stock granted | 187,963 | 187,963 | - | - | |||||||||||||||||||||||||||||
| Stock-based compensation charge | 930 | 930 | 930 | ||||||||||||||||||||||||||||||
| Income tax benefit from vested stock awards | 5 | 5 | 5 | ||||||||||||||||||||||||||||||
| Net income | 11,596 | 11,596 | (11 | ) | 11,585 | ||||||||||||||||||||||||||||
| Other comprehensive income | 7,314 | 7,314 | 7,314 | ||||||||||||||||||||||||||||||
| Balance – September 30, 2013 | 59,235,603 | $ | 59 | (13,455,090 | ) | $ | (175,823 | ) | 45,780,513 | $ | 161,605 | $ | 464,214 | $ | (93,544 | ) | $ | 356,511 | $ | 3,292 | $ | 359,803 | |||||||||||
| Net 1 UEPS Technologies, Inc. Shareholders | |||||||||||||||||||||||||||||||||
| Accumulated | |||||||||||||||||||||||||||||||||
| Number of | Number of | Additional | other | Non- | |||||||||||||||||||||||||||||
| Number of | Treasury | Treasury | shares, net of | Paid-In | Retained | comprehensive | Total Net1 | controlling | |||||||||||||||||||||||||
| Shares | Amount | Shares | Shares | treasury | Capital | Earnings | loss | Equity | Interest | Total | |||||||||||||||||||||||
| Balance – July 1, 2014 | 63,702,511 | $ | 63 | (15,883,212 | ) | $ | (200,681 | ) | 47,819,299 | $ | 202,401 | $ | 522,729 | $ | (82,741 | ) | $ | 441,771 | $ | (23 | ) | $ | 441,748 | ||||||||||
| Repurchase of common stock (Note 10) | (1,837,432 | ) | (9,151 | ) | (1,837,432 | ) | (9,151 | ) | (9,151 | ) | |||||||||||||||||||||||
| Restricted stock granted (Note 12) | 141,707 | 141,707 | - | - | |||||||||||||||||||||||||||||
| Exercise of stock option (Note 12) | 688,633 | 1 | (336,584 | ) | (4,688 | ) | 352,049 | 5,677 | 990 | 990 | |||||||||||||||||||||||
| Stock-based compensation charge (Note 12) | 916 | 916 | 916 | ||||||||||||||||||||||||||||||
| Income tax benefit from vested stock awards | 483 | 483 | 483 | ||||||||||||||||||||||||||||||
| Transactions with non-controlling interests (Note 10) | 1,231 | 404 | 1,635 | (228 | ) | 1,407 | |||||||||||||||||||||||||||
| Net income | 24,089 | 24,089 | 258 | 24,347 | |||||||||||||||||||||||||||||
| Other comprehensive loss (Note 11) | (21,385 | ) | (21,385 | ) | (26 | ) | (21,411 | ) | |||||||||||||||||||||||||
| Balance – September 30, 2014 | 64,532,851 | $ | 64 | (18,057,228 | ) | $ | (214,520 | ) | 46,475,623 | $ | 210,708 | $ | 547,222 | $ | (104,126 | ) | $ | 439,348 | $ | (19 | ) | $ | 439,329 | ||||||||||
See Notes to Unaudited Condensed Consolidated Financial Statements
5
NET 1 UEPS TECHNOLOGIES, INC.
Unaudited Condensed Consolidated Statements of Cash Flows
| Three months ended | Three months ended | |||||||||||
| September 30, | September 30, | |||||||||||
| 2013 | 2012 | 2014 | 2013 | |||||||||
| (In thousands) | (In thousands) | |||||||||||
| Cash flows from operating activities | ||||||||||||
| Net income | $ | 11,585 | $ | 6,744 | $ | 24,347 | $ | 11,585 | ||||
| Depreciation and amortization | 10,029 | 10,004 | 10,174 | 10,029 | ||||||||
| Earnings from equity-accounted investments | (103 | ) | (128 | ) | (92 | ) | (103 | ) | ||||
| Fair value adjustments | (133 | ) | (293 | ) | 413 | (133 | ) | |||||
| Interest payable | 972 | 1,192 | 1,159 | 972 | ||||||||
| Profit on disposal of plant and equipment | (1 | ) | - | (122 | ) | (1 | ) | |||||
| Stock-based compensation charge | 930 | 1,116 | 916 | 930 | ||||||||
| Facility fee amortized | 69 | 88 | 82 | 69 | ||||||||
| (Increase) Decrease in accounts receivable, pre-funded social welfare grants receivable | ||||||||||||
| and finance loans receivable | (23,101 | ) | 5,892 | |||||||||
| Decrease (Increase) in inventory | 1,011 | (959 | ) | |||||||||
| Decrease (Increase) in accounts receivable, pre-funded social welfare grants receivable and finance loans receivable | 9,470 | (23,101 | ) | |||||||||
| (Increase) Decrease in inventory | (2,123 | ) | 1,011 | |||||||||
| Decrease in accounts payable and other payables | (8,668 | ) | (1,349 | ) | (10,933 | ) | (8,668 | ) | ||||
| Increase in taxes payable | 6,921 | 5,438 | 6,611 | 6,921 | ||||||||
| Decrease in deferred taxes | (1,187 | ) | (2,016 | ) | (390 | ) | (1,187 | ) | ||||
| Net cash (used in) provided by operating activities | (1,676 | ) | 25,729 | |||||||||
| Net cash provided by (used in) operating activities | 39,512 | (1,676 | ) | |||||||||
| Cash flows from investing activities | ||||||||||||
| Capital expenditures | (5,616 | ) | (6,453 | ) | (9,378 | ) | (5,616 | ) | ||||
| Proceeds from disposal of property, plant and equipment | 48 | 105 | 241 | 48 | ||||||||
| Acquisitions, net of cash acquired | - | (1,913 | ) | |||||||||
| Repayment of loan by equity-accounted investment | - | 3 | ||||||||||
| Proceeds from sale of business (Note 14) | 1,895 | - | ||||||||||
| Other investing activities, net | (1 | ) | - | - | (1 | ) | ||||||
| Proceeds from maturity of investments related to insurance business | - | 545 | ||||||||||
| Net change in settlement assets | 51,773 | 60,779 | (43,054 | ) | 51,773 | |||||||
| Net cash provided by investing activities | 46,204 | 53,066 | ||||||||||
| Net cash (used in) provided by investing activities | (50,296 | ) | 46,204 | |||||||||
| Cash flows from financing activities | ||||||||||||
| Acquisition of treasury stock (Note 10) | (9,151 | ) | - | |||||||||
| Sale of equity to non-controlling interest (Note 10) | 1,407 | - | ||||||||||
| Long-term borrowings utilized | 1,097 | - | ||||||||||
| Proceeds from issue of common stock | - | 240 | 989 | - | ||||||||
| Net change in settlement obligations | (51,773 | ) | (60,779 | ) | 43,054 | (51,773 | ) | |||||
| Net cash used in financing activities | (51,773 | ) | (60,539 | ) | ||||||||
| Net cash provided by (used in) financing activities | 37,396 | (51,773 | ) | |||||||||
| Effect of exchange rate changes on cash | 1,250 | 165 | (4,099 | ) | 1,250 | |||||||
| Net (decrease) increase in cash and cash equivalents | (5,995 | ) | 18,421 | |||||||||
| Net increase (decrease) in cash and cash equivalents | 22,513 | (5,995 | ) | |||||||||
| Cash and cash equivalents – beginning of period | 53,665 | 39,123 | 58,672 | 53,665 | ||||||||
| Cash and cash equivalents – end of period | $ | 47,670 | $ | 57,544 | $ | 81,185 | $ | 47,670 | ||||
See Notes to Unaudited Condensed Consolidated Financial Statements
6
NET 1 UEPS TECHNOLOGIES, INC.
Notes to the Unaudited Condensed Consolidated Financial Statements
for the three months ended September 30, 20132014 and 20122013
(All amounts in tables stated in thousands or thousands of United States Dollars, unless otherwise stated)
1. Basis of Presentation and Summary of Significant Accounting Policies
Unaudited Interim Financial Information
The accompanying unaudited condensed consolidated financial statements include all majority-owned subsidiaries over which the Company exercises control and have been prepared in accordance with US generally accepted accounting principles (“GAAP”) and the rules and regulations of the Securities and Exchange Commission for quarterly reports on Form 10-Q and include all of the information and disclosures required for interim financial reporting. The results of operations for the three months ended September 30, 20132014 and 2012,2013, are not necessarily indicative of the results for the full year. The Company believes that the disclosures are adequate to make the information presented not misleading.
These financial statements should be read in conjunction with the financial statements, accounting policies and financial notes thereto included in the Company’s Annual Report on Form 10-K for the fiscal year ended June 30, 2013.2014. In the opinion of management, the accompanying unaudited condensed consolidated financial statements reflect all adjustments (consisting only of normal recurring adjustments), which are necessary for a fair representation of financial results for the interim periods presented.
References to the “Company” refer to Net1 and its consolidated subsidiaries, unless the context otherwise requires. References to Net1 are references solely to Net 1 UEPS Technologies, Inc.
Recent accounting pronouncements adopted
In February 2013, the FASB issued guidance regardingReporting of Amounts Reclassified Out of Accumulated Other Comprehensive Income. This guidance requires entities to present (either on the face of the statement of operations or in the notes) the effects on the line items of the statement of operations for amounts reclassified out of accumulated other comprehensive income. The guidance is effective for the Company beginning July 1, 2013 and is applied prospectively. The adoption of this guidance did not have a material impact on the Company’s financial statements.
Recent accounting pronouncements not yet adopted as of September 30, 2013
In March 2013, the FASB issued guidance regardingParent’s Accounting for the Cumulative Translation Adjustment Upon Derecognition of Certain Subsidiaries or Groups of Assets Within a Foreign Entity or of an Investment in a Foreign Entity. This guidance requires that the parent release any related cumulative translation adjustment into net income only if the sale or transfer results in the complete or substantially complete liquidation of the foreign entity in which the subsidiary or group of assets had resided. The guidance is effective for the Company beginning July 1, 2014.2014, and is applied prospectively. The adoption of this guidance did not have a material impact on the Company’s financial statements.
Recent accounting pronouncements not yet adopted as of September 30, 2014
In May 2014, the FASB issued guidance regardingRevenue from Contracts with Customers. This guidance requires an entity to recognize revenue when a customer obtains control of promised goods or services in an amount that reflects the consideration to which the entity expects to receive in exchange for those goods or services. In addition, the standard requires disclosure of the nature, amount, timing, and uncertainty of revenue and cash flows arising from contracts with customers. The guidance is effective for the Company beginning July 1, 2017. Early adoption is not permitted. The Company expects that this guidance will have a material impact on its financial statements and is currently evaluating the impact of this guidance on its financial statements on adoption.
In August 2014, the FASB issued guidance regardingDisclosure of Uncertainties About an Entity’s Ability to Continue as a Going Concern. This guidance requires an entity to perform interim and annual assessments of its ability to continue as a going concern within one year of the date that its financial statements are issued. An entity must provide certain disclosures if conditions or events raise substantial doubt about the entity’s ability to continue as a going concern. The guidance is effective for the Company for beginning July 1, 2017. Early adoption is permitted. The Company is currently assessing the impact of this guidance on its financial statements disclosure.
2. Pre-funded social welfare grants receivable
Pre-funded social welfare grants receivable represents amounts pre-funded by the Company to certain merchants participating in the merchant acquiring system. The October 20132014 payment service commenced on October 1, 2013,2014, but the Company pre-funded certain merchants participating in the merchant acquiring system duringon the last threetwo days of September 2013.2014.
7
3. Inventory
The Company’s inventory comprised the following categories as of September 30, 20132014 and June 30, 2013.2014.
| September 30, | June 30, | ||||||
| 2013 | 2013 | ||||||
| Finished goods | $ | 11,063 | $ | 12,222 | |||
| $ | 11,063 | $ | 12,222 |
| September 30, | June 30, | |||||
| 2014 | 2014 | |||||
| Finished goods | $ | 12,200 | $ | 10,785 | ||
| $ | 12,200 | $ | 10,785 |
7
4. Settlement assets and settlement obligations
Settlement assets comprise (1) cash received from the South African government that the Company holds pending disbursement to beneficiariesrecipient cardholders of social welfare grants (2) cash received from health care plans which the Company disburses to health care service providers once it adjudicates claims and (3)(2) cash received from customers on whose behalf the Company processes payroll payments that the Company will disburse to customer employees, payroll-related payees and other payees designated by the customer.
Settlement obligations comprise (1) amounts that the Company is obligated to disburse to beneficiariesrecipient cardholders of social welfare grants, (2) amounts which are due to health care service providers after claims have been adjudicated and reconciled, provided that the Company shall have previously received such funds from health care plan customers and (3) amounts that the Company is obligated to pay to customer employees, payroll-related payees and other payees designated by the customer.
The balances at each reporting date may vary widely depending on the timing of the receipts and payments of these assets and obligationsobligations.
5. Fair value of financial instruments and equity-accounted investments
Fair value of financial instruments
Initial recognition and measurement
Financial instruments are recognized when the Company becomes a party to the transaction. Initial measurements are at cost, which includes transaction costs.
Risk managementmanagement
The Company seeks to reduce its exposure to currencies other than the South African randRand (“ZAR”) through a policy of matching, to the extent possible, assets and liabilities denominated in those currencies. In addition, the Company uses financial instruments in order to economically hedge its exposure to exchange rate and interest rate fluctuations arising from its operations. The Company is also exposed to equity price and liquidity risks as well as credit risks.
Currency exchange risk
The Company is subject to currency exchange risk because it purchases inventories that it is required to settle in other currencies, primarily the euro and US dollar. The Company has used forward contracts in order to limit its exposure in these transactions to fluctuations in exchange rates between the South African rand,ZAR, on the one hand, and the US dollar and the euro, on the other hand.
The Company’s outstanding foreign exchange contracts are as follows: As of September 30, 2013 None.
As of June 30, 2013
| Fair market | ||||||
| Notional amount | Strike price | value price | Maturity | |||
| USD | 4,000,000 | ZAR | 9.06 | ZAR | 10.1397 | September 30, 2013 |
Translation risk
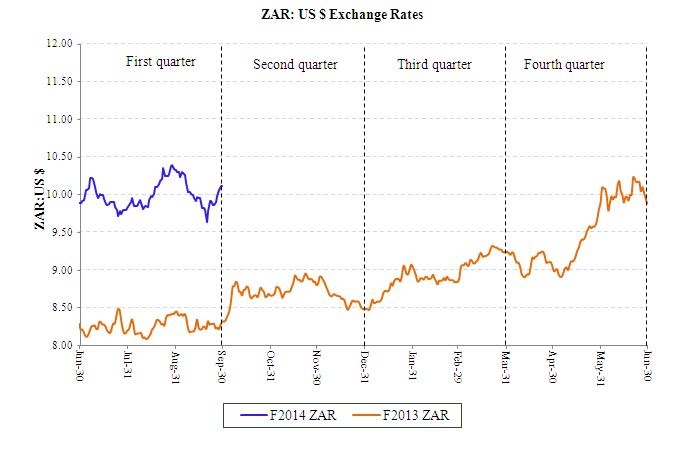
Translation risk relates to the risk that the Company’s results of operations will vary significantly as the US dollar is its reporting currency, but it earns most of its revenues and incurs most of its expenses in ZAR. The US dollar to ZAR exchange rate has fluctuated significantly over the past twothree years. As exchange rates are outside the Company’s control, there can be no assurance that future fluctuations will not adversely affect the Company’s results of operations and financial condition.
Interest rate risk
As a result of its normal borrowing and leasing activities, the Company’s operating results are exposed to fluctuations in interest rates, which it manages primarily through regular financing activities. The Company generally maintains limited investment in cash equivalents and has occasionally invested in marketable securities.
8
5. Fair value of financial instruments and equity-accounted investments (continued)
Fair value of financial instruments (continued)
Risk management (continued)
Credit risk
Credit risk relates to the risk of loss that the Company would incur as a result of non-performance by counterparties. The Company maintains credit risk policies with regard to its counterparties to minimize overall credit risk. These policies include an evaluation of a potential counterparty’s financial condition, credit rating, and other credit criteria and risk mitigation tools as the Company’s management deems appropriate.
With respect to credit risk on financial instruments, the Company maintains a policy of entering into such transactions only with South African and European financial institutions that have a credit rating of BBB or better, as determined by credit rating agencies such as Standard & Poor’s, Moody’s and Fitch Ratings.
UEPS-based microlending credit risk
The Company is exposed to credit risk in its UEPS-based microlending activities, which provides unsecured short-term loans to qualifying customers, primarily its social grant recipient cardholder base.customers. The Company manages this risk by performing an affordability test for each prospective customer and assigns a “creditworthiness score”, which takes into account a variety of factors such as other debts and total expenditures on normal household and lifestyle expenses.
Equity price and liquidity risk
Equity price risk relates to the risk of loss that the Company would incur as a result of the volatility in the exchange-traded price of equity securities that it holds and the risk that it may not be able to liquidate these securities. The market price of these securities may fluctuate for a variety of reasons, consequently, the amount the Company may obtain in a subsequent sale of these securities may significantly differ from the reported market value.
Liquidity risk relates to the risk of loss that the Company would incur as a result of the lack of liquidity on the exchange on which these securities are listed. The Company may not be able to sell some or all of these securities at one time, or over an extended period of time without influencing the exchange traded price, or at all.
Financial instruments
The following section describes the valuation methodologies the Company uses to measure its significant financial assets and liabilities at fair value.
In general, and where applicable, the Company uses quoted prices in active markets for identical assets or liabilities to determine fair value. This pricing methodology applies to Level 1 investments. If quoted prices in active markets for identical assets or liabilities are not available to determine fair value, then the Company uses quoted prices for similar assets and liabilities or inputs other than the quoted prices that are observable either directly or indirectly. These investments are included in Level 2 investments. In circumstances in which inputs are generally unobservable, values typically reflect management’s estimates of assumptions that market participants would use in pricing the asset or liability. The fair values are therefore determined using model-based techniques that include option pricing models, discounted cash flow models, and similar techniques. Investments valued using such techniques are included in Level 3 investments.
Asset measured at fair value using significant unobservable inputs – investment in Finbond Group Limited (“Finbond”)
The Company's Level 3 asset represents an investment of 156,788,712 shares of common stock of Finbond, which are exchange-traded equity securities. Finbond’s shares are traded on the JSE LimitedJohannesburg Stock Exchange (“JSE”) and the Company has designated such shares as available for sale investments. The Company has concluded that the market for Finbond shares is not active and consequently has employed alternative valuation techniques in order to determine the fair value of such stock. Currently, the operations of Finbond relate primarily to the provision of microlending products. Finbond was recently issuedissues financial products and services under a mutual banking licence and intends to offer financial products under this licence.also has a microlending offering. In determining the fair value of Finbond, the Company has considered amongst other things Finbond’s historical financial information (including its most recent public accounts), press releases issued by Finbond and its published net asset value. The Company believes that the best indicator of fair value of Finbond is its published net asset value and has used this value to determine the fair value.
9
5. Fair value of financial instruments (continued)
Financial instruments (continued)
Asset measured at fair value using significant unobservable inputs – investment in Finbond Group Limited (“Finbond”) (continued)
The fair value of these securities as of September 30, 2013,2014, represented approximately 1% of the Company’s total assets, including these securities. The Company expects to hold these securities for an extended period of time and it is not concerned with short-term equity price volatility with respect to these securities provided that the underlying business, economic and management characteristics of the company remain sound.
9Derivative transactions - Foreign exchange contracts
As part of the Company’s risk management strategy, the Company enters into derivative transactions to mitigate exposures to foreign currencies using foreign exchange contracts. These foreign exchange contracts are over-the-counter derivative transactions. Substantially all of the Company’s derivative exposures are with counterparties that have long-term credit ratings of BBB or better. The Company uses quoted prices in active markets for similar assets and liabilities to determine fair value (level 2). The Company has no derivatives that require fair value measurement under level 1 or 3 of the fair value hierarchy.
The Company’s outstanding foreign exchange contracts are as follows:
As of September 30, 2014
| Fair market | |||
| Notional amount | Strike price | value price | Maturity |
| EUR 181,570.50 | ZAR 15.5739 | ZAR 14.3053 | October 20, 2014 |
| EUR 181,570.50 | ZAR 15.4316 | ZAR 14.3053 | October 20, 2014 |
| EUR 180,022.50 | ZAR 15.6552 | ZAR 14.3818 | November 20, 2014 |
| EUR 180,022.50 | ZAR 15.5136 | ZAR 14.3818 | November 20, 2014 |
| EUR 180,022.50 | ZAR 15.5970 | ZAR 14.4701 | December 22, 2014 |
| EUR 180,022.50 | ZAR 15.7391 | ZAR 14.4701 | December 22, 2014 |
| EUR 174,424.50 | ZAR 15.8119 | ZAR 14.5511 | January 20, 2015 |
| EUR 174,424.50 | ZAR 15.6729 | ZAR 14.5511 | January 20, 2015 |
As of June 30, 2014
| Fair market | |||
| Notional amount | Strike price | value price | Maturity |
| EUR 182,272.50 | ZAR 15.2077 | ZAR 14.5803 | July 21, 2014 |
| EUR 182,272.50 | ZAR 15.3488 | ZAR 14.5803 | July 21, 2014 |
| EUR 180,022.50 | ZAR 15.4228 | ZAR 14.6542 | August 20, 2014 |
| EUR 180,022.50 | ZAR 15.2819 | ZAR 14.6542 | August 20, 2014 |
| EUR 180,022.50 | ZAR 15.3623 | ZAR 14.7367 | September 22, 2014 |
| EUR 180,022.50 | ZAR 15.5041 | ZAR 14.7367 | September 22, 2014 |
| EUR 181,570.50 | ZAR 15.5739 | ZAR 14.8119 | October 20, 2014 |
| EUR 181,570.50 | ZAR 15.4316 | ZAR 14.8119 | October 20, 2014 |
| EUR 180,022.50 | ZAR 15.6552 | ZAR 14.8982 | November 20, 2014 |
| EUR 180,022.50 | ZAR 15.5136 | ZAR 14.8982 | November 20, 2014 |
| EUR 180,022.50 | ZAR 15.5970 | ZAR 14.9874 | December 22, 2014 |
| EUR 180,022.50 | ZAR 15.7391 | ZAR 14.9874 | December 22, 2014 |
| EUR 174,424.50 | ZAR 15.8119 | ZAR 15.0671 | January 20, 2015 |
| EUR 174,424.50 | ZAR 15.6729 | ZAR 15.0671 | January 20, 2015 |
10
5. Fair value of financial instruments and equity-accounted investments (continued)
The following table presents the Company’s assets and liabilities measured at fair value on a recurring basis as of September 30, 2013,2014, according to the fair value hierarchy:
| Quoted | |||||||||||||
| Price in | |||||||||||||
| Active | Significant | ||||||||||||
| Markets for | Other | Significant | |||||||||||
| Identical | Observable | Unobservable | |||||||||||
| Assets | Inputs | Inputs | |||||||||||
| (Level 1) | (Level 2) | (Level 3) | Total | ||||||||||
| Assets | |||||||||||||
| Related to insurance business (included in other long-term assets): | |||||||||||||
| Cash and cash equivalents | $ | 1,816 | $ | - | $ | - | $ | 1,816 | |||||
| Investment in Finbond (available for sale assets included in other long-term assets) | - | - | 8,019 | 8,019 | |||||||||
| Other | - | 155 | - | 155 | |||||||||
| Total assets at fair value | $ | 1,816 | $ | 155 | $ | 8,019 | $ | 9,990 |
| Quoted | ||||||||||||
| Price in | ||||||||||||
| Active | Significant | |||||||||||
| Markets for | Other | Significant | ||||||||||
| Identical | Observable | Unobservable | ||||||||||
| Assets | Inputs | Inputs | ||||||||||
| (Level 1) | (Level 2) | (Level 3) | Total | |||||||||
| Assets | ||||||||||||
| Related to insurance business (included in other long-term assets): | ||||||||||||
| Cash and cash equivalents | $ | 1,716 | $ | - | $ | - | $ | 1,716 | ||||
| Investment in Finbond (available for sale assets included in other long-term assets) | - | - | 7,584 | 7,584 | ||||||||
| Other | - | 45 | - | 45 | ||||||||
| Total assets at fair value | $ | 1,716 | $ | 45 | $ | 7,584 | $ | 9,345 | ||||
| Liabilities | ||||||||||||
| Foreign exchange contracts | $ | - | $ | 152 | $ | - | $ | 152 | ||||
| Total liabilities at fair value | $ | - | $ | 152 | $ | - | $ | 152 |
The following table presents the Company’s assets and liabilities measured at fair value on a recurring basis as of June 30, 2013,2014, according to the fair value hierarchy:
| Quoted | |||||||||||||
| Price in | |||||||||||||
| Active | Significant | ||||||||||||
| Markets for | Other | Significant | |||||||||||
| Identical | Observable | Unobservable | |||||||||||
| Assets | Inputs | Inputs | |||||||||||
| (Level 1) | (Level 2) | (Level 3) | Total | ||||||||||
| Assets | |||||||||||||
| Related to insurance business (included in other long-term assets): | |||||||||||||
| Cash and cash equivalents | $ | 1,833 | $ | - | $ | - | $ | 1,833 | |||||
| Investment in Finbond (available for sale assets included in other long-term assets) | - | - | 8,303 | 8,303 | |||||||||
| Other | - | 147 | - | 147 | |||||||||
| Total assets at fair value | $ | 1,833 | $ | 147 | $ | 8,303 | $ | 10,283 | |||||
| Liabilities | |||||||||||||
| Foreign exchange contracts | $ | - | $ | 436 | $ | - | $ | 436 | |||||
| Total liabilities at fair value | $ | - | $ | 436 | $ | - | $ | 436 |
| Quoted | ||||||||||||
| Price in | ||||||||||||
| Active | Significant | |||||||||||
| Markets for | Other | Significant | ||||||||||
| Identical | Observable | Unobservable | ||||||||||
| Assets | Inputs | Inputs | ||||||||||
| (Level 1) | (Level 2) | (Level 3) | Total | |||||||||
| Assets | ||||||||||||
| Related to insurance business (included in other long-term assets): | ||||||||||||
| Cash and cash equivalents | $ | 1,800 | $ | - | $ | - | $ | 1,800 | ||||
| Investment in Finbond (available for sale assets included in other long-term assets) | - | - | 8,068 | 8,068 | ||||||||
| Other | - | 47 | - | 47 | ||||||||
| Total assets at fair value | $ | 1,800 | $ | 47 | $ | 8,068 | $ | 9,915 | ||||
| Liabilities | ||||||||||||
| Foreign exchange contracts | $ | - | $ | 164 | $ | - | $ | 164 | ||||
| Total liabilities at fair value | $ | - | $ | 164 | $ | - | $ | 164 |
Changes in the Company’s investment in Finbond (Level 3 that are measured at fair value on a recurring basis) were insignificant during the three months ended September 30, 20132014 and 2012,2013, respectively. There have been no transfers in or out of Level 3 during the three months ended September 30, 20132014 and 2012,2013, respectively.
Assets and liabilities measured at fair value on a nonrecurring basis
The Company measures its assets at fair value on a nonrecurring basis when they are deemed to be other-than-temporarily impaired. The Company has no liabilities that are measured at fair value on a nonrecurring basis. The Company reviews the carrying values of its assets when events and circumstances warrant and considers all available evidence in evaluating when declines in fair value are other-than-temporary. The fair values of the Company’s assets are determined using the best information available, and may include quoted market prices, market comparables, and discounted cash flow projections. An impairment charge is recorded when the cost of the assets exceeds its fair value and the excess is determined to be other-than-temporary. The Company has not recorded any impairment charges during the reporting periods presented herein.
1011
6.Goodwill and intangible assets, net
Goodwill
Summarized below is the movement in the carrying value of goodwill for the three months ended September 30, 2013:2014:
| Accumulated | Carrying | ||||||||
| Gross value | impairment | value | |||||||
| Balance as of June 30, 2013 | $ | 218,558 | $ | (42,752) | $ | 175,806 | |||
| Foreign currency adjustment (1) | 5,067 | 77 | 5,144 | ||||||
| Balance as of September 30, 2013 | $ | 223,625 | $ | (42,675) | $ | 180,950 |
| Accumulated | Carrying | |||||||||
| Gross value | impairment | value | ||||||||
| Balance as of June 30, 2014 | $ | 186,576 | $ | - | $ | 186,576 | ||||
| Foreign currency adjustment(1) | (7,573 | ) | - | (7,573 | ) | |||||
| Balance as of September 30, 2014 | $ | 179,003 | $ | 0 | $ | 179,003 |
(1) – the foreign currency adjustment represents the effects of the fluctuations between the South African rand and the Korean won, and the US dollar on the carrying value.
Goodwill has been allocated to the Company’s reportable segments as follows:
| As of | As of | |||||
| September 30, | June 30, | |||||
| 2013 | 2013 | |||||
| SA transaction-based activities | $ | 29,861 | $ | 30,525 | ||
| International transaction-based activities | 120,334 | 113,972 | ||||
| Smart card accounts | - | - | ||||
| Financial services | - | - | ||||
| Hardware, software and related technology sales | 30,755 | 31,309 | ||||
| Total | $ | 180,950 | $ | 175,806 |
| As of | As of | |||||||||
| September 30, | June 30, | |||||||||
| 2014 | 2014 | |||||||||
| South African transaction processing | $ | 26,808 | $ | 28,517 | ||||||
| International transaction processing | 123,993 | 128,427 | ||||||||
| Financial inclusion and applied technologies | 28,202 | 29,632 | ||||||||
| Total | $ | 179,003 | $ | 186,576 |
Intangible assets, net
Carrying value and amortization of intangible assets
�� Summarized below is the carrying value and accumulated amortization of the intangible assets as of September 30, 20132014 and June 30, 2013:2014:
| As of September 30, 2013 | As of June 30, 2013 | ||||||||||||||||||
| Gross | Net | Gross | Net | ||||||||||||||||
| carrying | Accumulated | carrying | carrying | Accumulated | carrying | ||||||||||||||
| value | amortization | value | value | amortization | value | ||||||||||||||
| Finite-lived intangible assets: | |||||||||||||||||||
| Customer relationships | $ | 94,206 | ($32,986 | ) | $ | 61,220 | $ | 90,469 | $ | (29,818 | ) | $ | 60,651 | ||||||
| Software and unpatented | |||||||||||||||||||
| technology | 36,052 | (24,129 | ) | 11,923 | 34,951 | (22,151 | ) | 12,800 | |||||||||||
| FTS patent | 3,789 | (3,789 | ) | - | 3,873 | (3,873 | ) | - | |||||||||||
| Exclusive licenses | 4,506 | (4,506 | ) | - | 4,506 | (4,506 | ) | - | |||||||||||
| Trademarks | 6,755 | (2,983 | ) | 3,772 | 6,611 | (2,805 | ) | 3,806 | |||||||||||
| Customer database | 601 | (601 | ) | - | 614 | (614 | ) | - | |||||||||||
| Total finite-lived intangible assets | $ | 145,909 | ($68,994 | ) | $ | 76,915 | $ | 141,024 | $ | (63,767 | ) | $ | 77,257 | ||||||
| As of September 30, 2014 | As of June 30, 2014 | ||||||||||||||||||
| Gross | Net | Gross | Net | ||||||||||||||||
| carrying | Accumulated | carrying | carrying | Accumulated | carrying | ||||||||||||||
| value | amortization | value | value | amortization | value | ||||||||||||||
| Finite-lived intangible assets: | |||||||||||||||||||
| Customer relationships | $ | 94,844 | $ | (41,881 | ) | $ | 52,963 | $ | 98,676 | $ | (41,273 | ) | $ | 57,403 | |||||
| Software and unpatented | |||||||||||||||||||
| technology | 32,271 | (26,478 | ) | 5,793 | 33,604 | (26,207 | ) | 7,397 | |||||||||||
| FTS patent | 3,402 | (3,402 | ) | - | 3,619 | (3,619 | ) | - | |||||||||||
| Exclusive licenses | 4,506 | (4,506 | ) | - | 4,506 | (4,506 | ) | - | |||||||||||
| Trademarks | 6,583 | (3,191 | ) | 3,392 | 6,890 | (3,176 | ) | 3,714 | |||||||||||
| Total finite-lived intangible assets | $ | 141,606 | $ | (79,458 | ) | $ | 62,148 | $ | 147,295 | $ | (78,781 | ) | $ | 68,514 | |||||
Aggregate amortization expense on the finite-lived intangible assets for the three months ended September 30, 2014 and 2013, was approximately $3.9 million and $3.7 million, (three months ended September 30, 2012, was approximately $4.7 million).respectively.
Future estimated annual amortization expense for the next five fiscal years and thereafter, assuming exchange rates prevailing on September 30, 2013,2014, is presented in the table below. Actual amortization expense in future periods could differ from this estimate as a result of acquisitions, changes in useful lives, exchange rate fluctuations and other relevant factors.
| 2014 | $ | 15,637 | ||||
| 2015 | 15,583 | $ | 15,239 | |||
| 2016 | 11,228 | 11,394 | ||||
| 2017 | 8,896 | 9,080 | ||||
| 2018 | 8,896 | 9,080 | ||||
| 2019 | 8,745 | |||||
| Thereafter | $ | 20,575 | $ | 12,146 | ||
1112
7. Reinsurance assets and policy holder liabilities under insurance and investment contracts
Reinsurance assets and policy holder liabilities under insurance contracts
Summarized below is the movement in reinsurance assets and policy holder liabilities under insurance contracts during the three monthmonths ended September 30, 2013:2014:
| Reinsurance | Insurance | |||||
| assets (1) | contracts (2) | |||||
| Balance as of June 30, 2013 | $ | 19,557 | $ | (19,711 | ) | |
| Foreign currency adjustment(3) | (425 | ) | 428 | |||
| Balance as of September 30, 2013 | $ | 19,132 | $ | (19,283 | ) |
| Reinsurance | Insurance | |||||
| assets (1) | contracts (2) | |||||
| Balance as of June 30, 2014 | $ | 21,062 | $ | (21,478 | ) | |
| Foreign currency adjustment(3) | (1,263 | ) | 1,288 | |||
| Balance as of September 30, 2014 | $ | 19,799 | $ | (20,190 | ) |
(1) Included in other long-term assets.
| ||
| ||
|
The Company has agreements with reinsurance companies in order to limit its losses from large insurance contracts, however, if the reinsurer is unable to meet its obligations, the Company retains the liability.
The value of insurance contract liabilities is based on best estimates assumptions of future experience plus prescribed margins, as required in the markets in which these products are offered, namely South Africa. The process of deriving the best estimates assumptions plus prescribed margins includes assumptions related to future mortality and morbidity (an appropriate base table of standard mortality is chosen depending on the type of contract and class of business), withdrawals (based on recent withdrawal investigations and expected future trends), investment returns (based on government treasury rates adjusted by an applicable margin), expense inflation (based on a 10 year10-year real return on CPI-linked government bonds from the risk-free rate and adding an allowance for salary inflation and book shrinkage of 1% per annum) and claim reporting delays (based on average industry experience).
Assets and policy holder liabilities under investment contracts
Summarized below is the movement in assets and policy holder liabilities under investment contracts during the three months ended September 30, 2013:2014:
| Investment | ||||||
| Assets (1) | contracts (2) | |||||
| Balance as of June 30, 2013 | $ | 953 | $ | (953 | ) | |
| Foreign currency adjustment(3) | (21 | ) | 21 | |||
| Balance as of September 30, 2013 | $ | 932 | $ | (932 | ) |
| Investment | ||||||
| Assets (1) | contracts (2) | |||||
| Balance as of June 30, 2014 | $ | 688 | $ | (688 | ) | |
| Foreign currency adjustment(3) | (41 | ) | 41 | |||
| Balance as of September 30, 2014 | $ | 647 | $ | (647 | ) |
| ||
| ||
|
(1) Included in other long-term assets.
(2) Included in other long-term liabilities.
(3) The foreign currency adjustment represents the effects of the fluctuations between the ZAR against the US dollar.
The Company does not offer any investment products with guarantees related to capital or returns.
8. Short-term credit facility
The Company’s short-term credit facilities are described in Note 12 to the Company’s audited consolidated financial statements included in its Annual Report on Form 10-K for the year ended June 30, 2014.
South Africa
As of September 30, 2014, and June 30, 2014, the Company has ahad not utilized any of its ZAR 250250.0 million ($24.722.2 million, translated at exchange rates applicable as of September 30, 2013) short-term South African credit facility from Nedbank Limited (“Nedbank”). As of September 30, 2013, the2014) overdraft rate on this facility was 7.35% . The Company has ceded its investment in Cash Paymaster Services (Proprietary) Limited, a wholly owned South African subsidiary, as security for the facility. As of September 30, 2013,2014, the interest rate on the overdraft facility was 8.10% . At September 30, 2014, the Company had utilized approximately ZAR 130137.2 million ($12.2 million, translated at exchange rates applicable as of this facilitySeptember 30, 2014) of its indirect and derivative facilities to obtain foreign exchange contracts from the bank and to enable the bank providing the short-term credit facility to issue guarantees, including stand-by letters of credit, in order for the Company to honor its obligations to third parties requiring such guarantees (Refer(refer to Note 16)17). As of June 30, 2013,2014, the Company had utilized noneapproximately ZAR 139.0 million ($13.1 million, translated at exchange rates applicable as of this facility.June 30, 2014) of its indirect and derivative facilities.
13
8. Short-term credit facility (continued)
Korea
The Company believes that this facility is sufficient in order to meethad not utilized any of its future obligations as they arise.
12
9.Long-term borrowings
2010 Senior Facilities Agreement
The Company’s KRW 92.410 billion ($85.49.5 million, translated at exchange rates applicable as of September 30, 2013)2014) overdraft facility as of September 30, 2014 and June 30, 2014. As of September 30, 2014, the interest rate on the overdraft facility was 4.71% . The facility expires in January 2015.
9. Long-term borrowings
The Company’s Korean senior secured loan facility is described in Note 13 to the Company’s audited consolidated financial statements included in its Annual Report on Form 10-K for the year ended June 30, 2013.2014. The current carrying value as of September 30, 2013,2014, is $85.4$75.6 million. As of September 30, 2013,2014, the carrying amount of the long-term borrowings approximated fair value. The interest rate in effect on September 30, 2013,2014, was 6.76%5.75% .
Interest expense incurred during the three months ended September 30, 2014 and 2013, was $1.1 million and 2012, was $1.4 million, respectively. During each of the three months ended September 30, 2014 and $1.9 million, respectively.2013, respectively, the Company amortized prepaid facility fees of approximately $0.1 million.
The fifth and sixthfirst scheduled principal repayments are $7.5repayment of $14.3 million, each, translated at exchange rates applicable as of September 30, 2013,2014, was paid on October 29, 2014, and havehas been classified as current in the Company’s unaudited condensed consolidated balance sheet. The Company repaid the full amount outstanding of KRW 92.4 billion on October 29, 2013, using a combination of cash on hand and loan proceeds from the new facility described below. The Company has expensed the remaining prepaid facility fees of approximately $0.4 million during the three months ended December 31, 2013. The third scheduled repayment of $7.3 million was paid on October 29, 2012.
2013 Senior Facilities Agreement
On October 28, 2013, the Company signed a new five-year senior secured facilities agreement (the “New Facilities Agreement”) provided by a consortium of Korean banks. The New Facilities Agreement provides for three separate facilities to the Company’s wholly owned subsidiary, Net1 Applied Technologies Korea (“Net1 Korea”): a Facility A loan of up to KRW 60.0 billion ($55.5 million), a Facility B loan of up to KRW 15 billion ($13.9 million) and a Facility C revolving credit facility of up to KRW 10.0 billion ($9.2 million) (all facilities denominated in KRW and translated at exchange rates applicable as of September 30, 2013).
The Facility A and B loans were fully drawn on October 29, 2013, and used to repay KRW 75.0 billion of the KRW 92.4 billion loan outstanding under the 2010 senior facilities agreement. The remaining outstanding balance under the 2010 facility of KRW 17.4 billion was paid from cash on hand on October 29, 2013. In addition, the Company drew KRW 1.1 billion of the revolving credit facility on October 29, 2013, to pay fees and expenses related to the New Facilities Agreement.
Interest on the loans and revolving credit facility is payable quarterly and is based on the Korean CD rate in effect from time to time plus a margin of 3.10% for the Facility A loan and Facility C revolving credit facility; and a margin of 2.90% for the Facility B loan. The CD rate was 2.66% on September 30, 2013. The Company paid facilities fees of approximately KRW 0.9 billion. A commitment fee of 0.3% is payable on any un-drawn and un-cancelled amount of the revolving credit facility.
The Facility A loan is repayable in three scheduled annual installments of KRW 10 billion each beginning 30 months after initial drawdown and one final installment of KRW 30 billion on the maturity date, namely October 29, 2018. The Facility B loan is repayable in full on October 29, 2014. The Facility C revolving credit facility is repayable in full on the maturity date. Prepayment of the revolving credit facility may be withdrawn at any time up to three months before the maturity date.
The loans under the New Facilities Agreement are secured by a pledge by Net1 Korea of its entire equity interest in KSNET and a pledge by the immediate parent of Net1 Korea (also one of the Company’s subsidiaries) of its entire equity interest in Net1 Korea. The Facilities Agreement contains customary covenants that require Net1 Korea to maintain agreed leverage and debt service coverage ratios and restricts Net1 Korea’s ability to make certain distributions with respect to its capital stock, prepay other debt, encumber its assets, incur additional indebtedness, or engage in certain business combinations. The loans under the Facilities Agreement are without recourse to, and the covenants and other agreements contained therein do not apply to, the Company or any of the Company’s subsidiaries (other than Net1 Korea).
10. Capital structure
Common stock repurchases
The Company did not repurchase any of its shares during the three months ended September 30, 2013 and 2012, respectively.
13
10. Capital structure (continued)
The following table presents reconciliation between the number of shares, net of treasury, presented in the unaudited condensed consolidated statement of changes in equity during the three months ended September 30, 20132014 and 2012,2013, respectively, and the number of shares, net of treasury, excluding non-vested equity shares that have not vested during the three months ended September 30, 20132014 and 2012,2013, respectively:
| 2013 | 2012 | 2014 | 2013 | |||||||||
| Number of shares, net of treasury: | ||||||||||||
| Statement of changes in equity | 45,780,513 | 45,600,471 | 46,475,623 | 45,780,513 | ||||||||
| Less: Non-vested equity shares that have not vested | (576,282 | ) | (644,750 | ) | ||||||||
| Less: Non-vested equity shares that have not vested (Note 12) | (453,333 | ) | (576,282 | ) | ||||||||
| Number of shares, net of treasury excluding non-vested equity shares that have not vested | 45,204,231 | 44,955,721 | 46,022,290 | 45,204,231 | ||||||||
Common stock repurchases and transaction with noncontrolling interests
The Company did not repurchase any of its shares during the three months ended September 30, 2014 and 2013, under its share repurchase authorization. However, on August 27, 2014, the Company entered into a Subscription and Sale of Shares Agreement with Business Venture Investments No 1567 Proprietary Limited (RF) (“BVI”), one of the Company’s BEE partners, in preparation for any new potential SASSA tender. Pursuant to the agreement: (i) the Company repurchased BVI’s remaining 1,837,432 shares of the Company’s common stock for approximately ZAR 97.4 million in cash ($9.2 million translated at exchange rates prevailing as of August 27, 2014) and (ii) BVI has subscribed for new ordinary shares of Cash Paymaster Services (Pty) Ltd (“CPS”) representing approximately 12.5% of CPS’ ordinary shares outstanding after the subscription for ZAR 15.0 million in cash (approximately $1.4 million translated at exchange rates prevailing as of August 27, 2014). In connection with transactions described above, the CPS shareholder agreement that was negotiated as part of the original December 2013 Relationship Agreement became effective.
14
11. Accumulated other comprehensive loss
The table below presents the change in accumulated other comprehensive (loss) income per component during the three months ended September 30, 2014:
| Three months ended | ||||||||||
| September 30, 2014 | ||||||||||
| Accumulated | ||||||||||
| Net | ||||||||||
| unrealized | ||||||||||
| Accumulated | income (loss) | |||||||||
| Foreign | on asset | |||||||||
| currency | available for | |||||||||
| translation | sale, net of | |||||||||
| reserve | tax | Total | ||||||||
| ‘000 | ‘000 | ‘000 | ||||||||
| Balance as of June 30, 2014 | $ | (83,359 | ) | $ | $618 | $ | (82,741 | ) | ||
| Movement in foreign currency translation reserve | (21,159 | ) | - | (21,159 | ) | |||||
| Unrealized loss on asset available for sale, net of tax of $88 | - | (226 | ) | (226 | ) | |||||
| Balance as of September 30, 2014 | $ | (104,518 | ) | $ | 392 | $ | (104,126 | ) | ||
There were no reclassifications from accumulated other comprehensive loss to comprehensive (loss) income during the three months ended September 30, 2014 or 2013, respectively.
12. Stock-based compensation
Stock option and restricted stock activity
Options
The following table summarizes stock option activity for the three months ended September 30, 20132014 and 2012:2013:
| Weighted | Weighted | ||||||||||||||
| Weighted | Average | Average | |||||||||||||
| average | Remaining | Aggregate | Grant | ||||||||||||
| exercise | Contractual | Intrinsic | Date Fair | ||||||||||||
| Number of | price | Term | Value | Value | |||||||||||
| shares | ($) | (in years) | ($’000) | ($) | |||||||||||
| Outstanding – June 30, 2013 | 2,648,583 | 15.15 | 5.98 | 313 | |||||||||||
| Granted under Plan: August 2013 | 224,896 | 7.35 | 10.00 | 568 | 2.53 | ||||||||||
| Outstanding – September 30, 2013 | 2,873,479 | 14.54 | 6.06 | 4,841 | |||||||||||
| Outstanding – June 30, 2012 | 2,247,583 | 16.28 | 6.43 | 602 | |||||||||||
| Granted under Plan: August 2012 | 431,000 | 8.75 | 10.00 | 1,249 | 2.90 | ||||||||||
| Exercised | (30,000 | ) | 7.98 | 24 | |||||||||||
| Outstanding – September 30, 2012 | 2,648,583 | 15.15 | 6.74 | 978 |
| Weighted | Weighted | |||||||||||||||
| Weighted | Average | Average | ||||||||||||||
| average | Remaining | Aggregate | Grant | |||||||||||||
| exercise | Contractual | Intrinsic | Date Fair | |||||||||||||
| Number of | price | Term | Value | Value | ||||||||||||
| shares | ($) | (in years) | ($’000) | ($) | ||||||||||||
| Outstanding – June 30, 2014 | 2,710,392 | 14.16 | 5.38 | 3,909 | ||||||||||||
| Granted under Plan: August 2014 | 464,410 | 11.23 | 10.00 | 2,113 | 4.55 | |||||||||||
| Exercised | (688,633 | ) | 8.24 | 3,697 | ||||||||||||
| Outstanding – September 30, 2014 | 2,486,169 | 15.24 | 5.45 | 1,820 | ||||||||||||
| Outstanding – June 30, 2013 | 2,648,583 | 15.15 | 5.98 | 313 | ||||||||||||
| Granted under Plan: August 2013 | 224,896 | 7.35 | 10.00 | 568 | 2.53 | |||||||||||
| Outstanding – September 30, 2013 | 2,873,479 | 14.54 | 6.06 | 4,841 |
The fair value of each option is estimated on the date of grant using the Cox Ross Rubinstein binomial model that uses the assumptions noted in the following table. The estimated expected volatility is calculated based on the Company’s 250 day volatility. The estimated expected life of the option was determined based on historical behavior of employees who were granted options with similar terms. The Company has estimated no forfeitures for options awarded in August 2013 and 2012,2014, respectively.
15
12. Stock-based compensation (continued)
Stock option and restricted stock activity (continued)
Options (continued)
The table below presents the range of assumptions used to value options granted during the three months ended September 30, 20132014 and 2012:2013:
| Three months ended | |||||||||
| September 30, | |||||||||
| 2013 | 2012 | 2014 | 2013 | ||||||
| Expected volatility | 50% | 49% | 60% | 50% | |||||
| Expected dividends | 0% | 0% | 0% | 0% | |||||
| Expected life (in years) | 3 | 3 | 3 | 3 | |||||
| Risk-free rate | 0.9% | 0.3% | 1.0% | 0.9% | |||||
14
11. Stock-based compensation (continued)
Stock option There were no forfeitures during the three months ended September 30, 2014 and restricted stock activity (continued)
Options (continued)2013.
The following table presents stock options vestingvested and expecting to vest as of September 30, 2013:2014:
| Weighted | ||||||||||||
| Weighted | Average | |||||||||||
| average | Remaining | Aggregate | ||||||||||
| exercise | Contractual | Intrinsic | ||||||||||
| Number of | price | Term | Value | |||||||||
| shares | ($) | (in years) | ($’000) | |||||||||
| Vested and expecting to vest – September 30, 2013 | 2,873,479 | 14.54 | 6.06 | 4,841 |
| Weighted | ||||||||||||
| Weighted | Average | |||||||||||
| average | Remaining | Aggregate | ||||||||||
| exercise | Contractual | Intrinsic | ||||||||||
| Number of | price | Term | Value | |||||||||
| shares | ($) | (in years) | ($’000) | |||||||||
| Vested and expecting to vest – September 30, 2014 | 2,486,169 | 15.24 | 5.45 | 1,820 |
These options have an exercise price range of $6.59$7.35 to $24.46.
| Weighted | ||||||||||||
| Average | ||||||||||||
| Weighted | Remaining | Aggregate | ||||||||||
| average | Contractual | Intrinsic | ||||||||||
| Number of | exercise | Term | Value | |||||||||
| shares | price ($) | (in years) | (’000) | |||||||||
| Exercisable | 1,985,250 | $ | 17.07 | 5.05 | $ | 1,963 |
The following table presents stock options that are exercisable as of September 30, 2014:
| Weighted | ||||||||||||
| Average | ||||||||||||
| Weighted | Remaining | Aggregate | ||||||||||
| average | Contractual | Intrinsic | ||||||||||
| Number of | exercise | Term | Value | |||||||||
| shares | price ($) | (in years) | ($’000) | |||||||||
| Exercisable – September 30, 2014 | 1,670,829 | 17.88 | 3.64 | 573 |
During the three months ended September 30, 2014 and 2013, respectively, 273,633 and 2012, respectively, 198,667 and 85,000 stock options became exercisable. Included in the 85,000 stock options are 30,000 stock options with respect to which the Remuneration Committee of the Board agreed to accelerate vesting, in August 2012, prior to the resignation of a non-employee director. During the three months ended September 30, 2012,2014, the Company received approximately $0.2$1.0 million from the 30,000116,395 stock options exercised. The remaining 572,238 stock options were exercised bythrough recipients delivering 336,584 shares of the non-employee director that resigned.Company’s common stock to the Company on September 9, 2014, to settle the exercise price due. No stock options were exercised during the three months ended September 30, 2013. The Company issues new shares to satisfy stock option exercises.
16
12. Stock-based compensation (continued)
Stock option and restricted stock activity (continued)
Restricted stock
The following table summarizes restricted stock activity for the three months ended September 30, 20132014 and 2012:2013:
| Weighted | Weighted | |||||||||||
| Number of | Average | Number of | Average | |||||||||
| Shares of | Grant Date | Shares of | Grant Date | |||||||||
| Restricted | Fair Value | Restricted | Fair Value | |||||||||
| Stock | ($’000) | Stock | ($’000) | |||||||||
| Non-vested – June 30, 2014 | 385,778 | 3,534 | ||||||||||
| Granted – August 2014 | 141,707 | 581 | ||||||||||
| Vested – August 2014 | (74,152 | ) | 828 | |||||||||
| Non-vested – September 30, 2014 | 453,333 | 3,568 | ||||||||||
| Non-vested – June 30, 2013 | 405,226 | $ | 4,393 | 405,226 | 4,393 | |||||||
| Granted – August 2013 | 187,963 | 1,382 | 187,963 | 1,382 | ||||||||
| Vested – August 2013 | (16,907 | ) | 161 | (16,907 | ) | 161 | ||||||
| Non-vested – September 30, 2013 | 576,282 | 5,630 | 576,282 | 5,630 | ||||||||
| Non-vested – June 30, 2012 | 646,617 | 7,061 | ||||||||||
| Granted – August 2012 | 21,569 | 189 | ||||||||||
| Vested – August 2012 | (23,436 | ) | 216 | |||||||||
| Non-vested – September 30, 2012 | 644,750 | $ | 7,021 | |||||||||
Included in the 141,707 shares of restricted stock granted are 127,626 shares of restricted stock granted to employees on August 27, 2014, that will vest in full only on the date, if any, the following conditions are satisfied: (1) the closing price of the Company’s common stock equals or exceeds $19.41 (subject to appropriate adjustment for any stock split or stock dividend) for a period of 30 consecutive trading days during a measurement period commencing on the date that the Company files its Annual Report on Form 10-K for the fiscal year ended 2017 and ending on December 31, 2017 and (2) the recipient is employed by the Company on a full-time basis when the condition in (1) is met. If either of these conditions is not satisfied, then none of the shares of restricted stock will vest and they will be forfeited. The $19.41 price target represents a 20% increase, compounded annually, in the price of the Company’s common stock on Nasdaq over the $11.23 closing price on August 27, 2014.
These 127,626 shares of restricted stock are effectively forward starting knock-in barrier options with a strike price of zero. The fair value of these shares of restricted stock was calculated utilizing an adjusted Monte Carlo simulation discounted cash flow model which was developed for the purpose of the valuation of these shares. For each simulated share price path, the market share price condition was evaluated to determine whether or not the shares would vest under that simulation. The “adjustment” to the Monte Carlo simulation model incorporates a “jump diffusion” process to the standard Geometric Brownian Motion simulation, in order to capture the discontinuous share price jumps observed in the Company’s share price movements on stock exchanges on which it is listed. Therefore, the simulated share price paths capture the idiosyncrasies of the observed Company share price movements.
In scenarios where the shares do not vest, the final vested value at maturity is zero. In scenarios where vesting occurs, the final vested value on maturity is the share price on vesting date. The value of the grant is the average of the discounted vested values. The Company used an expected volatility of 76.01%, an expected life of approximately three years, a risk-free rate of 1.27% and no future dividends in its calculation of the fair value of the restricted stock. The estimated expected volatility was calculated based on the Company’s 30 day VWAP share price using the exponentially weighted moving average of returns.
The fair value of restricted stock vesting during the three months ended September 30, 20132014 and 2012,2013, respectively, was $0.2$0.8 million and $0.2 million. Included in the 23,436 shares of restricted stock that vested in August 2012 are 8,547 shares with respect to which the Remuneration Committee of the Board agreed to accelerate vesting prior to the resignation of a non-employee director.
The fair value of restricted stock is based on the closing price of the Company’s stock quoted on The Nasdaq Global Select Market on the date of grant.
1517
11.12. Stock-based compensation (continued)
Stock-based compensation charge and unrecognized compensation cost
The Company has recorded a stockstock-based compensation charge of $0.9 million and $1.1 million forduring each of the three months ended September 30, 20132014 and 2012,2013, respectively, which comprised:
| Allocated to cost | ||||||||||
| of goods sold, IT | Allocated to | |||||||||
| processing, | selling, general | |||||||||
| Total | servicing and | and | ||||||||
| charge | support | administration | ||||||||
| Three months ended September 30, 2013 | ||||||||||
| Stock-based compensation charge | $ | 930 | $ | - | $ | 930 | ||||
| Total – three months ended September 30, 2013 . | $ | 930 | $ | - | $ | 930 | ||||
| Three months ended September 30, 2012 | ||||||||||
| Stock-based compensation charge | $ | 1,116 | $ | - | $ | 1,116 | ||||
| Total – three months ended September 30, 2012 . | $ | 1,116 | $ | - | $ | 1,116 |
| Allocated to cost | ||||||||||
| of goods sold, IT | Allocated to | |||||||||
| processing, | selling, general | |||||||||
| Total | servicing and | and | ||||||||
| charge | support | administration | ||||||||
| Three months ended September 30, 2014 | ||||||||||
| Stock-based compensation charge | $ | 916 | $ | - | $ | 916 | ||||
| Total – three months ended September 30, 2014 | $ | 916 | $ | - | $ | 916 | ||||
| Three months ended September 30, 2013 | ||||||||||
| Stock-based compensation charge | $ | 930 | $ | - | $ | 930 | ||||
| Total – three months ended September 30, 2013 | $ | 930 | $ | - | $ | 930 |
The stock-based compensation charges have been allocated to selling, general and administration based on the allocation of the cash compensation paid to the employees.
As of September 30, 2013,2014, the total unrecognized compensation cost related to stock options was approximately $1.6$2.8 million, which the Company expects to recognize over approximately three years. As of September 30, 2013,2014, the total unrecognized compensation cost related to restricted stock awards was approximately $4.3$2.2 million, which the Company expects to recognize over approximately threetwo years.
As of each of September 30, 20132014 and June 30, 2013,2014, respectively, the Company has recorded a deferred tax asset of approximately $1.4$1.2 million related to the stock-based compensation charge recognized related to employees and directors of Net1 as it is able to deduct the grant date fair value for taxation purposes in the United States.
12.13. Earnings per share
Basic earnings per share include shares of restricted stock that meet the definition of a participating security because these shares are eligible to receive non-forfeitable dividend equivalents at the same rate as common stock. Basic earnings per share have been calculated using the two-class method and basic earnings per share for the three months ended September 30, 20132014 and 2012,2013, reflects only undistributed earnings. The computation below of basic earnings per share excludes the net income attributable to shares of unvested restricted stock (participating non-vested restricted stock) from the numerator and excludes the dilutive impact of these unvested shares of restricted stock from the denominator.
Diluted earnings per share has been calculated to give effect to the number of shares of additional common stock that would have been outstanding if the potential dilutive instruments had been issued in each period. Stock options are included in the calculation of diluted earnings per share utilizing the treasury stock method and are not considered to be participating securities as the stock options do not contain non-forfeitable dividend rights. The calculation of diluted earnings per share includes the dilutive effect of a portion of the restricted stock granted to employees in February 2012, August 2013 and August 20132014 as these shares of restricted stock are considered contingently returnable shares for the purposes of the diluted earnings per share calculation and the vesting conditions in respect of a portion of the restricted stock had been satisfied. The vesting conditions are discussed in Note 1718 to the Company’s audited consolidated financial statements included in its Annual Report on Form 10-K for the year ended June 30, 2013.2014.
1618
12.13. Earnings per share (continued)
The following table presents net income attributable to Net1 (income from continuing operations) and the share data used in the basic and diluted earnings per share computations using the two-class method:
| Three months ended | |||||||
| September 30, | |||||||
| 2013 | 2012 | ||||||
| (in thousands except percent | |||||||
| and | |||||||
| per share data) | |||||||
| Numerator: | |||||||
| Net income attributable to Net1 | $ | 11,596 | $ | 6,744 | |||
| Undistributed earnings | 11,596 | 6,744 | |||||
| Percent allocated to common shareholders (Calculation 1) | 99% | 99% | |||||
| Numerator for earnings per share: basic and diluted | $ | 11,495 | $ | 6,659 | |||
| Denominator: | |||||||
| Denominator for basic earnings per share: weighted-average common | |||||||
| shares outstanding | 45,216 | 44,968 | |||||
| Effect of dilutive securities: | |||||||
| Performance shares related to acquisition | - | - | |||||
| Stock options | 71 | 48 | |||||
| Denominator for diluted earnings per share: adjusted weighted average common shares outstanding and assumed conversion | 45,287 | 45,016 | |||||
| Earnings per share: | |||||||
| Basic | $ | 0.25 | $ | 0.15 | |||
| Diluted | $ | 0.25 | $ | 0.15 | |||
| (Calculation 1) | |||||||
| Basic weighted-average common shares outstanding (A) | 45,216 | 44,968 | |||||
| Basic weighted-average common shares outstanding and unvested | |||||||
| restricted shares expected to vest (B) | 45,613 | 45,544 | |||||
| Percent allocated to common shareholders (A) / (B) | 99% | 99% | |||||
| Three months ended | ||||||
| September 30, | ||||||
| 2014 | 2013 | |||||
| (in thousands except percent | ||||||
| and | ||||||
| per share data) | ||||||
| Numerator: | ||||||
| Net income attributable to Net1 | $ | 24,089 | $ | 11,596 | ||
| Undistributed earnings | 24,089 | 11,596 | ||||
| Percent allocated to common shareholders (Calculation 1) | 99% | 99% | ||||
| Numerator for earnings per share: basic and diluted | $ | 23,847 | $ | 11,495 | ||
| Denominator: | ||||||
| Denominator for basic earnings per share: weighted-average common shares outstanding | 46,751 | 45,216 | ||||
| Effect of dilutive securities: | ||||||
| Stock options | 109 | 71 | ||||
| Denominator for diluted earnings per share: adjusted weighted average common shares outstanding and assumed conversion | 46,860 | 45,287 | ||||
| Earnings per share: | ||||||
| Basic | $ | 0.51 | $ | 0.25 | ||
| Diluted | $ | 0.51 | $ | 0.25 | ||
| (Calculation 1) | ||||||
| Basic weighted-average common shares outstanding (A) | 46,751 | 45,216 | ||||
| Basic weighted-average common shares outstanding and unvested restricted shares expected to vest (B) | 47,226 | 45,613 | ||||
| Percent allocated to common shareholders (A) / (B) | 99% | 99% | ||||
Options to purchase 2,493,7591,858,853 shares of the Company’s common stock at prices ranging from $7.35$11.23 to $24.46 per share were outstanding during the three months ended September 30, 2013,2014, but were not included in the computation of diluted earnings per share because the options’ exercise price were greater than the average market price of the Company’s common shares.stock. The options, which expire at various dates through August 21, 2023,27, 2024, were still outstanding as of September 30, 2013.2014.
13.14. Supplemental cash flow information
The following table presents the supplemental cash flow disclosures for the three months ended September 30, 20132014 and 2012:2013:
| Three months ended | Three months ended | |||||||||||
| September 30, | September 30, | |||||||||||
| 2013 | 2012 | 2014 | 2013 | |||||||||
| Cash received from interest | $ | 3,241 | $ | 3,125 | $ | 4,163 | $ | 3,241 | ||||
| Cash paid for interest | $ | 1,639 | $ | 2,000 | $ | 1,218 | $ | 1,639 | ||||
| Cash paid for income taxes | $ | 498 | $ | 342 | $ | 5,160 | $ | 498 | ||||
14. The sale of the Company’s NUETS business is described in Note 19 to its audited consolidated financial statements included in its Annual Report on Form 10-K for the year ended June 30, 2014. The Company received cash sale proceeds of $1.9 million related to this transaction in July 2014.
As discussed in Note 12, during the three months ended September 30, 2014, employees exercised stock options through the delivery 336,584 shares of the Company’s common stock at the closing price on September 9, 2014 or $13.93 under the terms of their option agreements. These shares are included in the Company’s total share count and amount reflected as treasury shares on the unaudited condensed consolidated balance sheet as of September 30, 2014 and unaudited condensed consolidated statement of changes in equity for the three months ended September 30, 2014.
19
15. Operating segments
The Company discloses segment information as reflected in the management information systems reports that its chief operating decision maker uses in making decisions and to report certain entity-wide disclosures about products and services, major customers, and the countries in which the entity holds material assets or reports material revenues. A description of the Company’s operating segments is contained in Note 2223 to the Company’s audited consolidated financial statements included in its Annual Report on Form 10-K for the year ended June 30, 2013.2014.
17
14. Operating The reconciliation of the reportable segments (continued)revenue to revenue from external customers for the three months ended September 30, 2014 and 2013, respectively, is as follows:
| Revenue | |||||||||
| From | |||||||||
| Reportable | Inter- | external | |||||||
| Segment | segment | customers | |||||||
| South African transaction processing | $ | 60,252 | $ | 5,121 | $ | 55,131 | |||
| International transaction processing | 43,204 | - | 43,204 | ||||||
| Financial inclusion and applied technologies | 65,197 | 7,091 | 58,106 | ||||||
| Total for the three months ended September 30, 2014 | 168,653 | 12,212 | 156,441 | ||||||
| South African transaction processing | 57,161 | 700 | 56,461 | ||||||
| International transaction processing | 37,541 | - | 37,541 | ||||||
| Financial inclusion and applied technologies | 36,796 | 7,304 | 29,492 | ||||||
| Total for the three months ended September 30, 2013 | $ | 131,498 | $ | 8,004 | $ | 123,494 |
The Company does not allocate interest income, interest expense or income tax expense to its reportable segments. The Company evaluates segment performance based on segment operating income before acquisition-related intangible asset amortization which represents operating income before acquisition-related intangible asset amortization and allocation of expenses allocated to Corporate/Eliminations, all under GAAP. The reconciliation of the reportable segments measure of profit or loss to income before income taxes for the three months ended September 30, 2014 and 2013, respectively, is as follows:
| For the three months | ||||||
| ended September 30, | ||||||
| 2014 | 2013 | |||||
| Reportable segments measure of profit or loss | $ | 38,595 | $ | 24,820 | ||
| Operating income: Corporate/Eliminations | (5,470 | ) | (8,420 | ) | ||
| Interest income | 4,090 | 3,319 | ||||
| Interest expense | (1,312 | ) | (1,752 | ) | ||
| Income before income taxes | $ | 35,903 | $ | 17,967 | ||
The following tables summarize segment information which is prepared in accordance with GAAP:GAAP for the three months ended September 30, 2014 and 2013:
| Three months ended | ||||||
| September 30, | ||||||
| 2013 | 2012 | |||||
| Revenues from external customers | ||||||
| SA transaction-based activities | $ | 63,032 | $ | 61,364 | ||
| International transaction-based activities | 36,817 | 31,649 | ||||
| Smart card accounts | 11,329 | 8,364 | ||||
| Financial services | 2,427 | 1,384 | ||||
| Hardware, software and related technology sales | 9,889 | 8,921 | ||||
| Total | 123,494 | 111,682 | ||||
| Inter-company revenues | ||||||
| SA transaction-based activities | 2,275 | 3,983 | ||||
| International transaction-based activities | - | - | ||||
| Smart card accounts | - | 386 | ||||
| Financial services | 252 | - | ||||
| Hardware, software and related technology sales | 170 | 208 | ||||
| Total | 2,697 | 4,577 | ||||
| Operating (loss) income | ||||||
| SA transaction-based activities | 13,282 | 6,400 | ||||
| International transaction-based activities | 2,051 | (171 | ) | |||
| Smart card accounts | 3,228 | 2,385 | ||||
| Financial services | 56 | 1,097 | ||||
| Hardware, software and related technology sales | 2,948 | 1,984 | ||||
| Corporate/Eliminations | (5,165 | ) | (2,370 | ) | ||
| Total | 16,400 | 9,325 | ||||
| Interest income | ||||||
| SA transaction-based activities | - | - | ||||
| International transaction-based activities | - | - | ||||
| Smart card accounts | - | - | ||||
| Financial services | - | - | ||||
| Hardware, software and related technology sales | - | - | ||||
| Corporate/Eliminations | 3,319 | 3,091 | ||||
| Total | 3,319 | 3,091 | ||||
| Interest expense | ||||||
| SA transaction-based activities | 23 | 143 | ||||
| International transaction-based activities | 44 | - | ||||
| Smart card accounts | - | - | ||||
| Financial services | 51 | - | ||||
| Hardware, software and related technology sales | 161 | 70 | ||||
| Corporate/Eliminations | 1,473 | 1,858 | ||||
| Total | 1,752 | 2,071 | ||||
| Depreciation and amortization | ||||||
| SA transaction-based activities | 2,447 | 3,141 | ||||
| International transaction-based activities | 7,406 | 6,679 | ||||
| Smart card accounts | - | - | ||||
| Financial services | 117 | 87 | ||||
| Hardware, software and related technology sales | 59 | 97 | ||||
| Corporate/Eliminations | - | - | ||||
| Total | 10,029 | 10,004 | ||||
| Income taxation (benefit) expense | ||||||
| SA transaction-based activities | 3,712 | 1,753 | ||||
| International transaction-based activities | 157 | (433 | ) | |||
| Smart card accounts | 903 | 668 | ||||
| Financial services | 10 | 312 | ||||
| Hardware, software and related technology sales | 693 | 438 | ||||
| Corporate/Eliminations | 1,010 | 991 | ||||
| Total | $ | 6,485 | $ | 3,729 | ||
| For the three months | ||||||
| ended September 30, | ||||||
| 2014 | 2013 | |||||
| Revenues | ||||||
| South African transaction processing | $ | 60,252 | $ | 57,161 | ||
| International transaction processing | 43,204 | 37,541 | ||||
| Financial inclusion and applied technologies | 65,197 | 36,796 | ||||
| Total | 168,653 | 131,498 | ||||
| Operating income (loss) | ||||||
| South African transaction processing | 13,639 | 6,461 | ||||
| International transaction processing | 7,349 | 5,524 | ||||
| Financial inclusion and applied technologies | 17,607 | 12,835 | ||||
| Subtotal: Operating segments | 38,595 | 24,820 | ||||
| Corporate/Eliminations | (5,470 | ) | (8,420 | ) | ||
| Total | $ | 33,125 | $ | 16,400 | ||
1820
14.15. Operating segments (continued)
| Three months ended | ||||||
| September 30, | ||||||
| 2013 | 2012 | |||||
| Net (loss) income | ||||||
| SA transaction-based activities | $ | 9,547 | $ | 4,504 | ||
| International transaction-based activities | 1,937 | 343 | ||||
| Smart card accounts | 2,324 | 1,716 | ||||
| Financial services | 27 | 801 | ||||
| Hardware, software and related technology sales | 2,095 | 1,477 | ||||
| Corporate/Eliminations | (4,334 | ) | (2,097 | ) | ||
| Total | 11,596 | 6,744 | ||||
| Expenditures for long-lived assets | ||||||
| SA transaction-based activities | 556 | 3,594 | ||||
| International transaction-based activities | 4,831 | 2,703 | ||||
| Smart card accounts | - | - | ||||
| Financial services | 200 | 145 | ||||
| Hardware, software and related technology sales | 29 | 11 | ||||
| Corporate/Eliminations | - | - | ||||
| Total | $ | 5,616 | $ | 6,453 | ||
| For the three months | ||||||
| ended September 30, | ||||||
| 2014 | 2013 | |||||
| Depreciation and amortization | ||||||
| South African transaction processing | $ | 1,722 | $ | 1,873 | ||
| International transaction processing | 4,372 | 4,259 | ||||
| Financial inclusion and applied technologies | 179 | 149 | ||||
| Subtotal: Operating segments | 6,273 | 6,281 | ||||
| Corporate/Eliminations | 3,901 | 3,748 | ||||
| Total | 10,174 | 10,029 | ||||
| Expenditures for long-lived assets | ||||||
| South African transaction processing | 682 | 556 | ||||
| International transaction processing | 8,327 | 4,831 | ||||
| Financial inclusion and applied technologies | 369 | 229 | ||||
| Subtotal: Operating segments | 9,378 | 5,616 | ||||
| Corporate/Eliminations | - | - | ||||
| Total | $ | 9,378 | $ | 5,616 | ||
The segment information as reviewed by the chief operating decision maker does not include a measure of segment assets per segment as all of the significant assets are used in the operations of all, rather than any one, of the segments. The Company does not have dedicated assets assigned to a particular operating segment. Accordingly, it is not meaningful to attempt an arbitrary allocation and segment asset allocation is therefore not presented.
It is impractical to disclose revenues from external customers for each product and service or each group of similar products and services.
15.16. Income tax
Income tax in interim periods
For the purposes of interim financial reporting, the Company determines the appropriate income tax provision by first applying the effective tax rate expected to be applicable for the full fiscal year to ordinary income. This amount is then adjusted for the tax effect of significant unusual or extraordinary items, for instance, changes in tax law, valuation allowances and non-deductible transaction-related expenses that are reported separately, and have an impact on the tax charge. The cumulative effect of any change in the enacted tax rate, if and when applicable, on the opening balance of deferred tax assets and liabilities is also included in the tax charge as a discrete event in the interim period in which the enactment date occurs.
For the three months ended September 30, 2013,2014, the tax charge was calculated using the expected effective tax rate for the year. The Company’s effective tax rate for eachthe three months ended September 30, 2014, was 32.4% and was higher than the South African statutory rate primarily as a result of non-deductible expenses (including consulting and legal fees, interest expense related to the Company’s long-term Korean borrowings and stock-based compensation charges).
The Company’s effective tax rate for the three months ended September 30, 2013, and 2012, respectively, was 36%36.1% and was higher than the South African statutory rate as a result of non-deductible expenses (including interest expense related to the Company’s long-term Korean borrowings and stock-based compensation charges).
Uncertain tax positions
There were no changes during the three months ended September 30, 2013.2014. As of September 30, 2013,2014, the Company had accrued interest related to uncertain tax positions of approximately $0.2 million on its balance sheet.
The Company does not expect changes related to its unrecognized tax benefits will have a significant impact on its results of operations or financial position in the next 12 months.
As of September 30, 2014 and June 30, 2014, respectively the Company has unrecognized tax benefits of $1.1 million and $1.2 million, all of which would impact the Company’s effective tax rate. The Company files income tax returns mainly in South Africa, South Korea, Austria, Botswana the Russian Federation and in the US federal jurisdiction. As of September 30, 2013,2014, the Company isCompany’s South African subsidiaries are no longer subject to any new income tax examination by the South African Revenue Service for yearsperiods before June 30, 2009. In 2011, the Korea National Tax Service had completed the examination of the Company’s returns in Korea related to years 2006 through 2010. The Company is subject to income tax in other jurisdictions outside South Africa, and Korea, none of which are individually material to its financial position, statement of cash flows, or results of operations.
1921
16.17. Commitments and contingencies
Guarantees
The South African Revenue Service and certain of the Company’s customers, suppliers and other business partners have asked the Company to provide them with guarantees, including standby letters of credit, issued by a South African bank. The Company is required to procure these guarantees for these third parties to operate its business.
Nedbank has issued guarantees to these third parties amounting to ZAR 131.2135.0 million ($13.012.0 million, translated at exchange rates applicable as of September 30, 2013)2014) and thereby utilizing part of the Company’s short-term facility. The Company in turn has provided nonrecourse, unsecured counter-guarantees to Nedbank for the same amount.ZAR 125.0 million ($11.1 million, translated at exchange rates applicable as of September 30, 2014). The Company pays commission of between 0.2% per annum to 2.0% per annum of the face value of these guarantees and does not recover any of the commission from third parties.
The Company has not recognized any obligation related to these counter-guarantees in its unaudited condensed consolidated balance sheet as of September 30, 2013.2014 and June 30, 2014. The maximum potential amount that the Company could pay under these guarantees is ZAR 131.2135.0 million ($13.012.0 million, translated at exchange rates applicable as of September 30, 2013)2014). The guarantees have reduced the amount available for borrowings under the Company’s short-term credit facility described in noteNote 8.
Contingencies
Securities Litigation
On December 24, 2013, Net1, its chief executive officer and its chief financial officer were named as defendants in a purported class action lawsuit filed in the United States District Court for the Southern District of New York alleging violations of the federal securities laws. The lawsuit was brought on behalf of a purported shareholder of Net1 and all other similarly situated shareholders who purchased Net1’s securities between August 27, 2009 and November 27, 2013. On July 23, 2014, the Court appointed a lead plaintiff and lead counsel. On September 22, 2014, the lead plaintiff filed an amended complaint alleging that Net1 made materially false and misleading statements in that it failed to disclose material adverse information and misrepresented the truth about the Company’s finances and business prospects. The amended complaint seeks unspecified damages on behalf of the lead plaintiff and all other similarly situated shareholders who purchased Net1’s securities between January 18, 2012 and December 4, 2012, which is a shorter class period than proposed in the original complaint. No motion for class certification has been filed. The Company believes this lawsuit has no merit and intends to defend it vigorously.
The Company is subject to a variety of insignificant claims and suits that arise from time to time in the ordinary course of business.
Management currently believes that the resolution of these matters, individually or in the aggregate, will not have a material adverse impact on the Company’s financial position, results of operations and cash flows.
17.18. Subsequent events
2013 Senior Facilities Agreement
As describedordered by the South African Constitutional Court in Note 9, the Company signedits April 2014 ruling, SASSA has initiated a new tender process for a five-year senior secured facilities agreement provided bycontract relating to the payment of social grants. SASSA issued a consortium of banksrequest for proposals on October 28, 2013.
November 2013 Broad Based Black Economic Empowerment deal
On November 6, 2013,22, 2014. Bidders are required to submit proposals by December 12, 2014. The Company cannot predict with certainty what the Company signed a letter of intent to issue 4,400,000 shares of its common stock at a price of ZAR 88.50 per share (calculated as 75%timing or ultimate outcome of the closing price of the Company’s common stock on the JSE Limited on November 5, 2013) to Business Venture Investments 1567 (Proprietary) Limited (RF), a special purpose entity, pursuant totender process will be, or if a new Broad Based Black Economic Empowerment transaction. Issue oftender award will be made at all after the sharesprocess is subject to the conclusion of an agreement which will include certain conditions, including obtaining the relevant regulatory approvals.complete.
2022
Item 2. Management’s Discussion and Analysis of Financial Condition and Results of Operations
The following discussion should be read in conjunction with our Annual Report on Form 10-K for the year ended June 30, 2013,2014, and the unaudited condensed consolidated financial statements and the accompanying notes included in this Form 10-Q.
Forward-looking statements
Some of the statements in this Form 10-Q constitute forward-looking statements. These statements relate to future events or our future financial performance and involve known and unknown risks, uncertainties and other factors that may cause our or our industry’s actual results, levels of activity, performance or achievements to be materially different from any future results, levels of activity, performance or achievements expressed, implied or inferred by these forward-looking statements. Such factors include, among other things, those listed under Item 1A.—“Risk Factors” and elsewhere in our Annual Report on Form 10-K for the year ended June 30, 20132014, and Item 1A—“Risk Factors” and elsewhere in this Form 10-Q. In some cases, you can identify forward-looking statements by terminology such as “may,” “will,” “should,” “could,” “would,” “expects,” “plans,” “intends,” “anticipates,” “believes,” “estimates,” “predicts,” “potential” or “continue” or the negative of such terms and other comparable terminology.
Although we believe that the expectations reflected in the forward-looking statements are reasonable, we do not know whether we can achieve positive future results, levels of activity, performance, or goals. Actual events or results may differ materially. We undertake no obligation to update any of the forward-looking statements after the date of this Form 10-Q to conform those statements to reflect the occurrence of unanticipated events, except as required by applicable law.
You should read this Form 10-Q and the documents that we reference herein and the documents we have filed as exhibits hereto and which we have filed with the Securities and Exchange Commission completely and with the understanding that our actual future results, levels of activity, performance and achievements may be materially different from what we expect. We qualify all of our forward-looking statements by these cautionary statements.
Recent Developments
Letter of IntentTransactions in preparation for New Broad-Based Black Economic Empowerment, or BEE, Transactionnew SASSA tender
On November 6, 2013,August 27, 2014, we signedentered into a letterSubscription and Sale of intent to issue 4,400,000 shares, or BVI Shares which will be contractually restricted as to resale as described below, of our common stock at a price of ZAR 88.50 per share (calculated as 75% of the closing price of our common stock on the JSE Limited on November 5, 2013) toAgreement with Business Venture Investments No 1567 (Proprietary)Proprietary Limited (RF), or BVI, a special purpose entity owned by aone of our BEE consortium, pursuantpartners, in preparation for any new potential SASSA tender. Pursuant to athe agreement: (i) we repurchased BVI’s remaining 1,837,432 shares of Net1 common stock for approximately ZAR 97.4 million in cash ($9.2 million translated at exchange rates prevailing as of August 27, 2014) and (ii) BVI has subscribed for new BEE transaction. Issuanceordinary shares of Cash Paymaster Services (Pty) Ltd, or CPS, representing approximately 12.5% of CPS’ ordinary shares outstanding after the subscription for ZAR 15.0 million in cash (approximately $1.4 million translated at exchange rates prevailing as of August 27, 2014). In connection with transactions described above, the CPS shareholder agreement that was negotiated as part of the BVI Shares is subject to the conclusion of aoriginal December 2013 Relationship Agreement before December 1, 2013, which will include certain conditions, including obtaining the relevant regulatory approvals. Under certain circumstances we may call the BVI Shares then owned, in exchange for a minority interest in our wholly-owned subsidiary Cash Paymaster Service Proprietary Limited.became effective.
Similar to our January 2012 proposed BEE transaction, the lead partner in the BEE consortium is Mosomo Investment Holdings (Pty) Ltd, a well-known black empowerment investment company headed by former Net1 non-executive director Brian Mosehla, with a proven track record in transformation, and with experience in mining, financial services and mass banking concepts. Other partners in the BEE consortium will include community-focused organizations led by black women and community development enterprises.
This BEE transaction is part of our efforts to strengthen the development of our business plan, and is in compliance with South African regulation and business practice. Our actions in support of achieving a stronger BEE standing build on our prior efforts, and the proposed structure is similar to transactions pursued by other leading South African companies across multiple industries.
The letter of intent provides that BVI will pay the purchase price of ZAR 88.50 per share in ZAR. The BVI Shares will be locked-up for a period of five years from date of issue, with the exception of periodic sales in order to fund the repayment of the loan and related interest as described below.
Our wholly owned subsidiary, Net1 Applied Technologies South Africa Proprietary Limited, will lend BVI the funds to effect the purchase of the BVI Shares and these shares will act as the collateral on the loan. The key terms of the loan are:
The loan will bear interest at rate equal to Johannesburg Interbank rate, or JIBAR (currently 550 basis points) plus 300 basis points;
The loan principal is to be repaid as follows, 10% each after the first and second years, 15% each after the third and fourth years, and 50% after the fifth year. Interest payments on the loan are due semi-annually;
After five years, Net1 will have the right, but not the obligation, to repurchase all or any portion of any remaining shares; and
The loan will be repaid in full using the proceeds from the sale of a sufficient amount of BVI Shares if our share price is or exceeds ZAR 177.00 per share (200% of ZAR 88.50 per share) on the JSE at any time during term of the loan. As of November 5, 2013, our closing price on the JSE was ZAR 118.00 per share.
South African Constitutional CourtCommencement of new SASSA tender process
On SeptemberOctober 10, 2013,2014, SASSA announced the commencement of a new tender process in the South African Constitutional Court heard oral argumentsGovernment Gazette by inviting proposals for the provision of payment services for social assistance benefits, or RFP. According to information provided on the appeal by AllPay Consolidated Investment Holdings (Pty) Ltd,website www.sa-tenders.co.za, the following is applicable to this process:
Bids will be evaluated on functionality as stipulated in the Terms of References and only service providers who score a minimum of 70 percent on functionality will proceed to be evaluated further on price and B-BBEE level of contribution.
Bids will be evaluated in accordance with the 90/10 preference point system, where a weighting of 90 is allocated to price and a weighting of 10 is awarded to bidders in accordance with their B-BBEE contributor status level.
As reported on SASSA's website, the submission date was initially November 21, 2014. However, as per notices on the SASSA website, the bid submission date has been extended a number of times and currently the submission date is December 12, 2014. The bid instructions state that neither bidders nor their agents are allowed to circulate any news or AllPay, againstpress releases concerning the ruling byRFP, or the South African Supreme Court of Appeal upholding the awardawarding of the SASSA tender to us. The Constitutional Court has reserved judgment.RFP or any resulting agreements without the written consent of, or in consultation with SASSA. We cannot predict whenthe timing of the tender process or how itwhat the outcome will rule on the matter. be.
See Part II, Item 1—1A.—“Legal Proceedings”Risk Factors,” for an update on legal proceedings associated with our SASSA contract.additional details.
South Africa
SASSA
We completed bulk enrollment during fiscal 2013, in accordance with the implementation plan agreed with SASSA. During the first quarter of fiscal 2014, we continued to enroll eligible and new grant recipient cardholders and grant beneficiaries.
During March 2013, the Minister of Social Development and SASSA announced that the deadline for the enrollment of grant recipient cardholders would be extended to April 30, 2013. SASSA sent termination notices to all grant recipient cardholders and grant beneficiaries who had not presented themselves for enrollment during May, June and July 2013 in terms of the Promotion of Administrative Justice Act. As of September 30, 2013, there were an estimated 292,000 former grant recipient cardholders who had not presented themselves for enrollment and whose grants had therefore been suspended by SASSA in September 2013. These grant recipient cardholders would have to apply for restoration of their grant and present themselves for enrollment should they wish to have their grants reinstated.
Due to the suspension of these grants and therefore lower volumes, we experienced a modest negative impact on our results of operations during the first quarter of fiscal 2014. We expect a similar adverse impact on our volumes and revenue for the remainder of fiscal 2014, but we expect this decrease in volume and revenue to be partially offset by new grant recipient cardholders approved by SASSA during the year.
New prepaid airtime product (“Umoya Manje”)
During the first quarter of fiscal 2014, our Net1 Mobile Solutions business unit introduced our new prepaid airtime product called Umoya Manje. This product allows our customers in South Africa to electronically purchase prepaid airtime without having to visit a physical prepaid airtime vendor.
2123
Traditional prepaid airtime procurement is usually time consuming for the customer and results in them having to pay additional costs. Our product allows our customers, many of whom do not have their own means of transport or ready access to transport, to purchase prepaid airtime without having to travel. We also believe that our product is substantially cheaper than traditional prepaid airtime channels, which often require customers to pay a substantial premium to obtain airtime. We exceeded one million registered users during our second month of operation, effecting more than 250,000 transactions per day during peak periods.
Rollout of financial service offering
During the first quarter of fiscal 2014, our Financial Services business unit commenced the national roll out of our financial services offering and began introducing UEPS-based loans in the six provinces in which we did not offer our product during fiscal 2013. The rollout has required us to employ and train additional staff and incur set up costs, and rent additional premises in order to establish a physical presence in these six provinces.
Critical Accounting Policies
Our unaudited condensed consolidated financial statements have been prepared in accordance with US GAAP, which requires management to make estimates and assumptions about future events that affect the reported amount of assets and liabilities and disclosure of contingent assets and liabilities. As future events and their effects cannot be determined with absolute certainty, the determination of estimates requires management’s judgment based on a variety of assumptions and other determinants such as historical experience, current and expected market conditions and certain scientific evaluation techniques.
Critical accounting policies are those that reflect significant judgments or uncertainties, and potentially may result in materially different results under different assumptions and conditions. Management has identified the following critical accounting policies that are described in more detail in our Annual Report on Form 10-K for the year ended June 30, 2013:2014:
Recent accounting pronouncements adopted
Refer to Note 1 to our unaudited condensed consolidated financial statements for a full description of recent accounting pronouncements adopted, including the dates of adoption and the effects on our condensed consolidated financial statements.
Recent accounting pronouncements not yet adopted as of September 30, 20132014
Refer to noteNote 1 to our unaudited condensed consolidated financial statements for a full description of recent accounting pronouncements not yet adopted as of September 30, 2013,2014, including the expected dates of adoption and effects on our financial condition, results of operations and cash flows.
Currency Exchange Rate Information
Actual exchange rates
The actual exchange rates for and at the end of the periods presented were as follows:
| Table 1 | Three months ended | Year | Three months ended | Year ended | ||||||||||||||
| September 30, | ended | |||||||||||||||||
| June 30, | September 30, | June 30, | ||||||||||||||||
| 2013 | 2012 | 2013 | 2014 | 2013 | 2014 | |||||||||||||
| ZAR : $ average exchange rate | 10.0015 | 8.2644 | 8.8462 | 10.7581 | 10.0015 | 10.3798 | ||||||||||||
| Highest ZAR : $ rate during period | 10.4936 | 8.5470 | 10.3587 | 11.2641 | 10.4936 | 11.2579 | ||||||||||||
| Lowest ZAR : $ rate during period | 9.5436 | 8.0444 | 8.0444 | 10.5128 | 9.5436 | 9.6259 | ||||||||||||
| Rate at end of period | 10.1123 | 8.3172 | 9.8925 | 11.2641 | 10.1123 | 10.5887 | ||||||||||||
| KRW : $ average exchange rate | 1,113 | 1,137 | 1,112 | 1,027 | 1,113 | 1,068 | ||||||||||||
| Highest KRW : $ rate during period | 1,152 | 1,156 | 1,162 | 1,051 | 1,152 | 1,147 | ||||||||||||
| Lowest KRW : $ rate during period | 1,045 | 1,080 | 1,019 | 1,009 | 1,045 | 1,014 | ||||||||||||
| Rate at end of period | 1,083 | 1,125 | 1,144 | 1,051 | 1,083 | 1,014 | ||||||||||||
2224
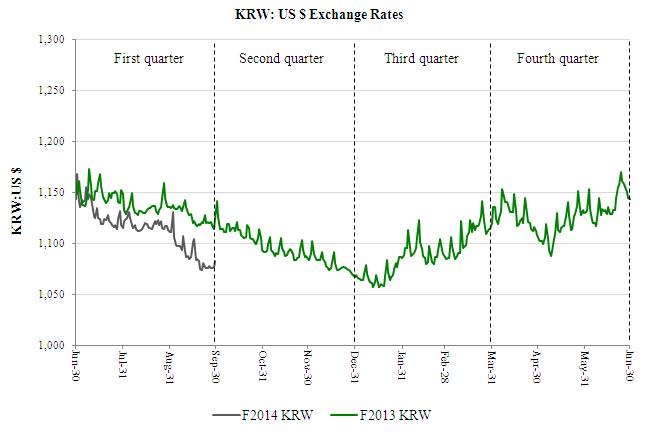
23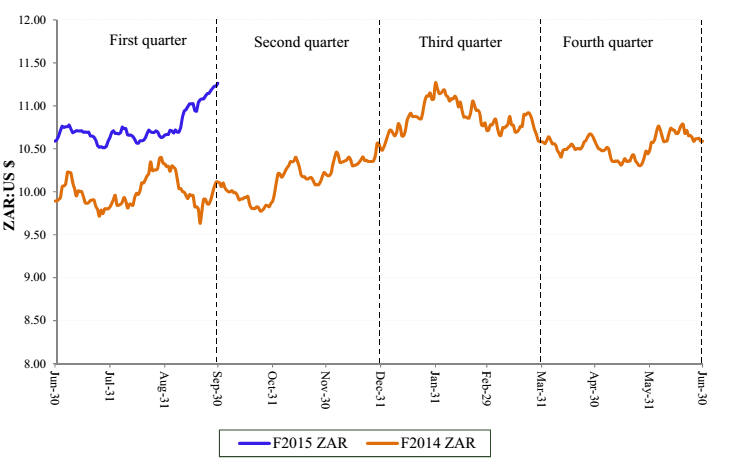
KRW: US $ Exchange Rates
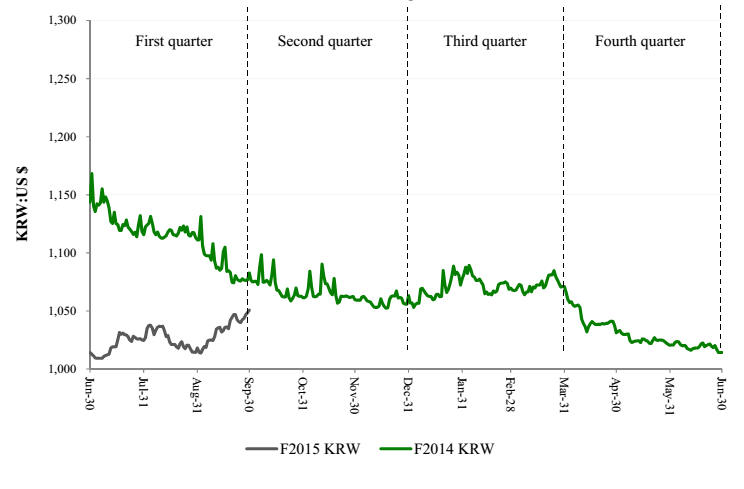
25
Translation exchange rates for financial reporting purposes
For financial reporting purposes weWe are required to translate our results of operations from ZAR and KRW to US dollars on a monthly basis. Thus, the average rates used to translate this data for the three months ended September 30, 2014 and 2013, and 2012, vary slightly from the averages shown in the table above. The translation rates we use in presenting our results of operations are the rates shown in the following table:
| Table 2 | Three months ended | Year ended | Three months ended | Year ended | ||||||||||||||
| September 30, | June 30, | September 30, | June 30, | |||||||||||||||
| 2013 | 2012 | 2013 | 2014 | 2013 | 2014 | |||||||||||||
| Income and expense items: $1 = ZAR . | 10.0001 | 8.2606 | 8.7105 | 10.7431 | 10.0001 | 10.3966 | ||||||||||||
| Income and expense items: $1 = KRW | 1,141 | 1,140 | 1,072 | 1,029 | 1,141 | 1,049 | ||||||||||||
| Balance sheet items: $1 = ZAR | 10.1123 | 8.3172 | 9.8925 | 11.2641 | 10.1123 | 10.5887 | ||||||||||||
| Balance sheet items: $1 = KRW | 1,083 | 1,125 | 1,144 | 1,051 | 1,083 | 1,014 | ||||||||||||
Results of operations
The discussion of our consolidated overall results of operations is based on amounts as reflected in our unaudited condensed consolidated financial statements which are prepared in accordance with US GAAP. We analyze our results of operations both in US dollars, as presented in the consolidated financial statements, and supplementally in ZAR, because ZAR is the functional currency of the entities which contribute the majority of our profits and is the currency in which the majority of our transactions are initially incurred and measured. Due to the significant impact of currency fluctuations between the US dollar and ZAR on our reported results and because we use the US dollar as our reporting currency, we believe that the supplemental presentation of our results of operations in ZAR is useful to investors to understand the changes in the underlying trends of our business.
Three months ended September 30, 2013,Fiscal 2015 does not include MediKredit and the NUETS business and fiscal 2014 includes SmartSwitch BotswanaMediKredit and Pbelthe NUETS business for the entire period. Three months ended September 30, 2012, does not include SmartSwitch Botswana,
Our operating segment revenue presented in “—Results of operations by operating segment” represents total revenue per operating segment before inter-segment eliminations. A reconciliation between total operating segment revenue and includes Pbel from September 1, 2012.revenue presented in our consolidated financial statements is included in Note 15 to those statements.
We analyze our business and operations in terms of fivethree inter-related but independent operating segments: (1) South African transaction-based activities,transaction processing, (2) international transaction-based activities,International transaction processing and (3) smart card accounts, (4) financial services,Financial inclusion and (5) hardware, software and related technology sales.applied technologies. In addition, corporate and corporate office activities that are impracticable to ascribe directly to any of the other operating segments, as well as any inter-segment eliminations, are included in corporate/eliminations.
First quarter of fiscal 20142015 compared to first quarter of fiscal 20132014
The following factors had ana significant influence on our results of operations during the first quarter of fiscal 20142015 as compared with the same period in the prior year:
| ||
| ||
| ||
| ||
| ||
|
26
Consolidated overall results of operations
This discussion is based on the amounts which were prepared in accordance with US GAAP.
24
The following tables show the changes in the items comprising our statements of operations, both in US dollars and in ZAR:
| In United States Dollars | In United States Dollars | |||||||||||||||||
| Table 3 | (US GAAP) | (US GAAP) | ||||||||||||||||
| Three months ended September 30, | Three months ended September 30, | |||||||||||||||||
| 2013 | 2012 | $ % | 2014 | 2013 | $% | |||||||||||||
| $’000 | $’000 | change | $’000 | $’000 | change | |||||||||||||
| Revenue | 123,494 | 111,682 | 11% | 156,441 | 123,494 | 27% | ||||||||||||
| Cost of goods sold, IT processing, servicing and support | 56,559 | 45,101 | 25% | 74,406 | 56,559 | 32% | ||||||||||||
| Selling, general and administration | 40,506 | 47,252 | (14% | ) | 38,736 | 40,506 | (4% | ) | ||||||||||
| Depreciation and amortization | 10,029 | 10,004 | 0% | 10,174 | 10,029 | 1% | ||||||||||||
| Operating income | 16,400 | 9,325 | 76% | 33,125 | 16,400 | 102% | ||||||||||||
| Interest income | 3,319 | 3,091 | 7% | 4,090 | 3,319 | 23% | ||||||||||||
| Interest expense | 1,752 | 2,071 | (15% | ) | 1,312 | 1,752 | (25% | ) | ||||||||||
| Income before income tax expense | 17,967 | 10,345 | 74% | 35,903 | 17,967 | 100% | ||||||||||||
| Income tax expense | 6,485 | 3,729 | 74% | 11,648 | 6,485 | 80% | ||||||||||||
| Net income before earnings from equity-accounted investments | 11,482 | 6,616 | 74% | 24,255 | 11,482 | 111% | ||||||||||||
| Earnings from equity-accounted investments | 103 | 128 | (20% | ) | 92 | 103 | (11% | ) | ||||||||||
| Net income | 11,585 | 6,744 | 72% | 24,347 | 11,585 | 110% | ||||||||||||
| Add net loss attributable to non-controlling interest | (11 | ) | - | nm | ||||||||||||||
| Less (Add) net income (loss) attributable to non-controlling interest | 258 | (11 | ) | nm | ||||||||||||||
| Net income attributable to us | 11,596 | 6,744 | 72% | 24,089 | 11,596 | 108% | ||||||||||||
| In South African Rand | In South African Rand | |||||||||||||||||
| Table 4 | (US GAAP) | (US GAAP) | ||||||||||||||||
| Three months ended September 30, | Three months ended September 30, | |||||||||||||||||
| 2013 | 2012 | 2014 | 2013 | |||||||||||||||
| ZAR | ZAR | ZAR % | ZAR | ZAR | ZAR % | |||||||||||||
| ’000 | ’000 | change | ’000 | ’000 | change | |||||||||||||
| Revenue | 1,234,965 | 922,561 | 34% | |||||||||||||||
| 1,680,661 | 1,234,965 | 36% | ||||||||||||||||
| Cost of goods sold, IT processing, servicing and support | 565,601 | 372,561 | 52% | 799,351 | 565,601 | 41% | ||||||||||||
| Selling, general and administration | 405,069 | 390,330 | 4% | 416,145 | 405,069 | 3% | ||||||||||||
| Depreciation and amortization | 100,292 | 82,640 | 21% | 109,300 | 100,292 | 9% | ||||||||||||
| Operating income | 164,003 | 77,030 | 113% | 355,865 | 164,003 | 117% | ||||||||||||
| Interest income | 33,191 | 25,534 | 30% | 43,939 | 33,191 | 32% | ||||||||||||
| Interest expense | 17,520 | 17,108 | 2% | 14,095 | 17,520 | (20% | ) | |||||||||||
| Income before income tax expense | 179,674 | 85,456 | 110% | 385,709 | 179,674 | 115% | ||||||||||||
| Income tax expense | 64,851 | 30,804 | 111% | 125,136 | 64,851 | 93% | ||||||||||||
| Net income before earnings from equity-accounted investments | 114,823 | 54,652 | 110% | 260,573 | 114,823 | 127% | ||||||||||||
| Earnings from equity-accounted investments | 1,030 | 1,057 | (3% | ) | 988 | 1,030 | (4% | ) | ||||||||||
| Net income | 115,853 | 55,709 | 108% | 261,561 | 115,853 | 126% | ||||||||||||
| Add net loss attributable to non-controlling interest | (110 | ) | - | nm | ||||||||||||||
| Less (Add) net income (loss) attributable to non-controlling interest | 2,772 | (110 | ) | nm | ||||||||||||||
| Net income attributable to us | 115,963 | 55,709 | 108% | 258,789 | 115,963 | 123% | ||||||||||||
The increase in revenue was primarily due to higher prepaid airtime sales, more low-margin transaction fees generated from beneficiaries using the South African National Payment System, higher prepaid airtime sales driven byan increase in the rolloutnumber of our Umoya Manje product, more ad hoc terminal and card salesUEPS-based loans, an increase in the number of SASSA UEPS/ EMV cardholders paid and a higher contribution from KSNET.
The increase in cost of goods sold, IT processing, servicing and support was primarily due to higher expenses incurred from increased usage of the South African National Payment System by beneficiaries and higher prepaid airtime, terminal and card sales. These increases were offset by the substantial elimination of expenses related to our SASSA contract implementation, which we completed in the fourth quarter of fiscal 2013.airtime.
In ZAR, our selling, general and administration expense increased due to increases in goods and services purchased from third parties and legal fees of approximately $2.1 million (ZAR 21.4 million) in connection with the government investigations, which were offset by the substantial elimination of SASSA contract implementation costs.parties.
Our operating income margin for the first quarter of fiscal 2015 and 2014 was 21% and 2013, was 13% and 8%, respectively. We discuss the components of operating income margin under “—Results of operations by operating segment.” The increase is primarily attributable to the eliminationhigher volumes of implementation coststransaction in fiscal 2014.South Africa, including prepaid airtime sales, lending and SASSA grants paid.
2527
In ZAR, depreciation and amortization were higher primarily as a result of an increase in depreciation related to assetsmore terminals used to service our obligations under our SASSA contract,provide transaction processing in Korea, which was partially offset by no MediKredit and FIHRSTEason intangible asset amortization as the these intangible assets were fully amortized at the end of June 2013. The tables below present the acquisition-related intangible asset amortization that has been allocated to our operating segments:2014.
| Table 5 | Three months ended September 30, | ||||||
| 2013 | 2012 | ||||||
| $’000 | $ ’000 | ||||||
Amortization included in depreciation and amortization expense: | 3,748 | 4,689 | |||||
South African transaction-based activities | 526 | 1,449 | |||||
International transaction-based activities | 3,149 | 3,152 | |||||
Hardware, software and related technology sales | 73 | 88 | |||||
| Table 6 | Three months ended September 30, | ||||||
| 2013 | 2012 | ||||||
| ZAR ’000 | ZAR ’000 | ||||||
Amortization included in depreciation and amortization expense: | 37,474 | 38,732 | |||||
South African transaction-based activities | 5,267 | 11,978 | |||||
International transaction-based activities | 31,490 | 26,037 | |||||
Hardware, software and related technology sales | 717 | 717 | |||||
Interest on surplus cash increased to $4.1 million (ZAR 43.9 million) from $3.3 million (ZAR 33.2 million) from $3.1 million (ZAR 25.5 million), due primarily to higher average daily ZAR cash balances.
In US dollars, interestInterest expense decreased to $1.3 million (ZAR 14.1 million) from $1.8 million (ZAR 17.5 million) from $2.1 million (ZAR 17.1 million), due to a lower average long-term debt balance.balance on our South Korean debt and a lower interest rate.
First quarter fiscal 2014Fiscal 2015 tax expense was $11.6 million (ZAR 125.1 million) compared to $6.5 million (ZAR 64.9 million) compared to $3.7 million (ZAR 30.8 million) in fiscal 2013.2014. Our effective tax rate for eachfiscal 2015, was 32.4% and was higher than the South African statutory rate as a result of non-deductible expenses (including consulting and legal fees, the interest expense related to our long-term South Korean borrowings and stock-based compensation charges). Our effective tax rate for fiscal 2014, and 2013, was 36%36.1% and was higher than the South African statutory rate as a result of non-deductible expenses (including interest expense related to our long-term Korean borrowings and stock-based compensation charges).
Results of operations by operating segment
The composition of revenue and the contributions of our business activities to operating income are illustrated below.below
| Table 7 | In United States Dollars (US GAAP) | ||||||||||||||||||
| Three months ended September 30, | |||||||||||||||||||
| 2013 | % of | 2012 | % of | % | |||||||||||||||
| Operating Segment | $’000 | total | $ ’000 | total | change | ||||||||||||||
| Consolidated revenue: | |||||||||||||||||||
| SA transaction-based activities | 63,032 | 51% | 61,364 | 55% | 3% | ||||||||||||||
| International transaction-based activities | 36,817 | 30% | 31,649 | 28% | 16% | ||||||||||||||
| Smart card accounts | 11,329 | 9% | 8,364 | 7% | 35% | ||||||||||||||
| Financial services | 2,427 | 2% | 1,384 | 1% | 75% | ||||||||||||||
| Hardware, software and related technology sales | 9,889 | 8% | 8,921 | 9% | 11% | ||||||||||||||
| Total consolidated revenue | 123,494 | 100% | 111,682 | 100% | 11% | ||||||||||||||
| Consolidated operating (loss) income: | |||||||||||||||||||
| SA transaction-based activities | 13,282 | 81% | 6,400 | 69% | 108% | ||||||||||||||
| Operating income before amortization | 13,808 | 7,850 | |||||||||||||||||
| Amortization of intangible assets | (526 | ) | (1,450 | ) | |||||||||||||||
| International transaction-based activities | 2,051 | 13% | (171 | ) | (2% | ) | nm | ||||||||||||
| Operating income before amortization | 5,200 | 2,981 | |||||||||||||||||
| Amortization of intangible assets | (3,149 | ) | (3,152 | ) | |||||||||||||||
| Smart card accounts | 3,228 | 20% | 2,385 | 26% | 35% | ||||||||||||||
| Financial services | 56 | - | 1,097 | 12% | (95% | ) | |||||||||||||
| Hardware, software and related technology sales | 2,948 | 18% | 1,984 | 21% | 49% | ||||||||||||||
| Operating income before amortization | 3,021 | 2,071 | |||||||||||||||||
| Amortization of intangible assets | (73 | ) | (87 | ) | |||||||||||||||
| Corporate/eliminations | (5,165 | ) | (32% | ) | (2,370 | ) | (26% | ) | 118% | ||||||||||
| Total consolidated operating income | 16,400 | 100% | 9,325 | 100% | 76% | ||||||||||||||
| Table 5 | In United States Dollars (US GAAP) | ||||||||||||||
| Three months ended September 30, | |||||||||||||||
| 2014 | % of | 2013 | % of | % | |||||||||||
| Operating Segment | $’000 | total | $’000 | total | change | ||||||||||
| Revenue: | |||||||||||||||
| South African transaction processing | 60,252 | 39% | 57,161 | 46% | 5% | ||||||||||
| International transaction processing | 43,204 | 28% | 37,541 | 30% | 15% | ||||||||||
| Financial inclusion and applied technologies | 65,197 | 42% | 36,796 | 30% | 77% | ||||||||||
| Subtotal: Operating segments | 168,653 | 109% | 131,498 | 106% | 28% | ||||||||||
| Intersegment eliminations | (12,212 | ) | (9% | ) | (8,004 | ) | (6% | ) | 53% | ||||||
| Consolidated revenue | 156,441 | 100% | 123,494 | 100% | 27% | ||||||||||
| Operating income (loss): | |||||||||||||||
| South African transaction processing | 13,639 | 41% | 6,461 | 39% | 111% | ||||||||||
| International transaction processing | 7,349 | 22% | 5,524 | 34% | 33% | ||||||||||
| Financial inclusion and applied technologies | 17,607 | 53% | 12,835 | 78% | 37% | ||||||||||
| Subtotal: Operating segments | 38,595 | 116% | 24,820 | 151% | 55% | ||||||||||
| Corporate/Eliminations | (5,470 | ) | (16% | ) | (8,420 | ) | (51% | ) | (35% | ) | |||||
| Consolidated operating income | 33,125 | 100% | 16,400 | 100% | 102% | ||||||||||
| Table 6 | In South African Rand (US GAAP) | ||||||||||||||
| Three months ended September 30, | |||||||||||||||
| 2014 | 2013 | ||||||||||||||
| ZAR | % of | ZAR | % of | % | |||||||||||
| Operating Segment | ’000 | total | ’000 | total | change | ||||||||||
| Revenue: | |||||||||||||||
| South African transaction processing | 647,293 | 39% | 571,622 | 46% | 13% | ||||||||||
| International transaction processing | 464,145 | 28% | 375,418 | 30% | 24% | ||||||||||
| Financial inclusion and applied technologies | 700,418 | 42% | 367,967 | 30% | 90% | ||||||||||
| Subtotal: Operating segments | 1,811,856 | 109% | 1,315,007 | 106% | 38% | ||||||||||
| Intersegment eliminations | (131,195 | ) | (9% | ) | (80,042 | ) | (6% | ) | 64% | ||||||
| Consolidated revenue | 1,680,661 | 100% | 1,234,965 | 100% | 36% | ||||||||||
| Operating income (loss): | |||||||||||||||
| South African transaction processing | 146,525 | 41% | 64,611 | 39% | 127% | ||||||||||
| International transaction processing | 78,951 | 22% | 55,241 | 34% | 43% | ||||||||||
| Financial inclusion and applied technologies | 189,154 | 53% | 128,353 | 78% | 47% | ||||||||||
| Subtotal: Operating segments | 414,630 | 116% | 248,205 | 151% | 67% | ||||||||||
| Corporate/Eliminations | (58,765 | ) | (16% | ) | (84,202 | ) | (51% | ) | (30% | ) | |||||
| Consolidated operating income | 355,865 | 100% | 164,003 | 100% | 117% | ||||||||||
2628
| Table 8 | In South African Rand (US GAAP) | ||||||||||||||||||
| Three months ended September 30, | |||||||||||||||||||
| 2013 | 2012 | ||||||||||||||||||
| ZAR | % of | ZAR | % of | % | |||||||||||||||
| Operating Segment | ’000 | total | ’000 | total | change | ||||||||||||||
| Consolidated revenue: | |||||||||||||||||||
| SA transaction-based activities | 630,326 | 51% | 506,903 | 55% | 24% | ||||||||||||||
| International transaction-based activities | 368,174 | 30% | 261,440 | 28% | 41% | ||||||||||||||
| Smart card accounts | 113,291 | 9% | 69,092 | 7% | 64% | ||||||||||||||
| Financial services | 24,270 | 2% | 11,433 | 1% | 112% | ||||||||||||||
| Hardware, software and related technology sales | 98,891 | 8% | 73,692 | 9% | 34% | ||||||||||||||
| Total consolidated revenue | 1,234,952 | 100% | 922,560 | 100% | 34% | ||||||||||||||
| Consolidated operating (loss) income: | |||||||||||||||||||
| SA transaction-based activities | 132,821 | 81% | 52,868 | 69% | 151% | ||||||||||||||
| Operating income before amortization | 138,088 | 64,846 | |||||||||||||||||
| Amortization of intangible assets | (5,267 | ) | (11,978 | ) | |||||||||||||||
| International transaction-based activities | 20,510 | 13% | (1,413 | ) | (2% | ) | nm | ||||||||||||
| Operating income before amortization | 52,000 | 24,624 | |||||||||||||||||
| Amortization of intangible assets | (31,490 | ) | (26,037 | ) | |||||||||||||||
| Smart card accounts | 32,280 | 20% | 19,702 | 26% | 64% | ||||||||||||||
| Financial services | 560 | - | 9,062 | 12% | (94% | ) | |||||||||||||
| Hardware, software and related technology sales | 29,480 | 18% | 16,389 | 21% | 80% | ||||||||||||||
| Operating income before amortization | 30,197 | 17,106 | |||||||||||||||||
| Amortization of intangible assets | (717 | ) | (717 | ) | |||||||||||||||
| Corporate/eliminations | (51,651 | ) | (32% | ) | (19,578 | ) | (26% | ) | 164% | ||||||||||
| Total consolidated operating income | 164,000 | 100% | 77,030 | 100% | 113% | ||||||||||||||
South African transaction-based activitiestransaction processing
In ZAR, the increasesincrease in segment revenue wererevenues was primarily due to more low-margin transaction fees generated from beneficiaries using the South African National Payment System incremental prepaid airtime sales drivenand more inter-segment transaction processing activities. In addition, revenue from the distribution of social welfare grants grew modestly during the year and was in-line with the increase in unique welfare cardholder recipients, net of removal of invalid and fraudulent beneficiaries, partially offset by the rolloutloss of our Umoya Manje product, and reflectMediKredit revenue as a result of the eliminationsale of inter-company transactions.that business.
Our operating income margin for the first quarter of fiscal 2015 and 2014 was 23% and 2013 was 21% and 10%11%, respectively, and has increased primarily due to more higher-margin inter-segment transaction processing activities, the elimination of SASSA implementation costsMediKredit losses and an increase in the number of beneficiaries paid in fiscal 2014.2015.
South African transaction processors:International transaction-based activities
The table below presents the totalRevenue and operating income increased primarily due to higher transaction volume and value processedat KSNET during the first quarter of fiscal 2014 and 2013:
| Table 9 | ||||||||||||||||||
| Transaction | Total volume (‘000s) | Total value $ (‘000) | Total value ZAR (‘000) | |||||||||||||||
| processor | 2014 | 2013 | 2014 | 2013 | 2014 | 2013 | ||||||||||||
| CPS | 28,325 | 28,373 | 2,698,278 | 3,143,773 | 26,983,054 | 25,969,448 | ||||||||||||
| EasyPay | 99,145 | 102,420 | 2,657,667 | 2,710,615 | 26,576,938 | 22,391,310 | ||||||||||||
| MediKredit | 2,593 | 2,624 | 201,595 | 171,478 | 2,015,966 | 1,416,508 | ||||||||||||
| FIHRST | 5,628 | 5,987 | 2,058,717 | 2,373,540 | 20,587,371 | 19,606,861 | ||||||||||||
CPS volumes were flat year over year due to SASSA’s suspension of former grant recipient cardholders who had not presented themselves for enrollment during the first quarter of fiscal 2014. These grant recipient cardholders will have to apply for restoration of their grant and present themselves for enrollment should they want to reinstate their grants. Our pension and welfare operations continue to generate the majority of our revenues and operating income, before implementation costs, in this operating segment and overall.
International transaction-based activities
KSNET continues to contribute the majority of our revenues and operating income in this operating segment. Revenue increased primarily due to KSNET’s revenue growth during the first quarter of fiscal 2014 and was partially offset by the expiration and non-renewal of NUETS’ contract with its Iraqi customer in the third quarter of fiscal 2013.2015. Operating income during the first quarter of fiscal 2014 was negatively impacted by the loss of this contract as well as ongoing losses related to our XeoHealth launch in the United States and at Net1 Virtual Card, as well as ongoing competition in the Korean marketplace, but was partially offset by increased revenue contributions from KSNET.
27
Operating margin for the segment is lower than for most of our South African transaction-basedtransaction processing businesses. Operating income margin for the first quarter of fiscal 2015 and 2014, was 17% and 2013 was 6% and (1%), respectively. Excluding amortization of intangibles, our operating margin for the first quarter of fiscal 2014 and 2013 was 14% and 9%, respectively.
Smart card accounts
In ZAR, our revenue from this operating segment was higher because the number of smart card-based accounts has increased as a result of the new SASSA contract. Operating income margin from providing smart card accounts for the first quarter of fiscal 2014 and 2013 was 28% and 29%15%, respectively.
In ZAR, revenue from the provision of smart card-based accounts increased in proportion to the increased number of recipients serviced through our SASSA contract. Approximately 9.4 million smart card-based accounts were active at September 30, 2013 compared to approximately 5.8 million active accounts as at September 30, 2012.
Financial servicesinclusion and applied technologies
UEPS-based lending contributes the majority of theFinancial inclusion and applied technologies revenue and operating income in this operating segment. Our current UEPS-based lending portfolio comprises loans made to qualifying old age grant recipients in all of the provinces where we distribute social welfare grants. Revenue increased primarily due to higher prepaid airtime sales driven by the substantialrollout of our prepaid airtime product, an increase in the number of UEPS-based loans granted as we rolled out our product nationally. Operatingnationally and an increase in intersegment revenues, offset by lower ad hoc terminal and smart card sales. Fiscal 2014 operating income decreased primarily as a resultincludes expenses related to the national roll-out of related start-up expensesour UEPS-based lending offering and the re-allocationestablishment of UEPS-based lending corporate and administration overhead expenses.the allowance for doubtful finance loans in fiscal 2014. Smart Life did not contribute to operating income in fiscal 2015 and 2014 due to the first quarter of fiscal 2014 as it is currently unable to issue new insurance policies as a result of theFSB suspension of its license bylicense.
Notwithstanding the Financial Services Boardnational roll-out expenses incurred in fiscal 2013.
First quarter of fiscal 2014, includes the re-allocation of UEPS-based lending corporate administration and overhead expenses to this segment from the South African transaction-based activities segment. We were not able to accurately quantify these expenses for last year and therefore did not allocate such costs to this segment during the first quarter of fiscal 2013.
Operatingoperating income margin for the financial servicesFinancial inclusion and applied technologies segment decreased to 2%27% from 79%35%, primarily as a result of more low-margin prepaid airtime and the roll-out expenditures and corporate overhead expense re-allocation described above.sale of competitively-priced financial inclusion products to address the needs of the broader market.
Hardware, software and related technology salesCorporate/ Eliminations
In ZAR, the increase in revenue and operating income resulted from more ad hoc terminal and smart card sales. We continue to expect significant quarter over quarter fluctuations in revenue, operating income and operating margin due to the ad hoc nature of orders in this operating segment.
Corporate/eliminations
The increase in our corporate expenses resulted primarily from legal fees we incurred in connection with the DOJ and SEC investigations and other corporate head office-related expenses.
Our corporate expenses alsogenerally include acquisition-related intangible asset amortization; expenditure related to compliance with Sarbanes; non-executivethe Sarbanes-Oxley Act of 2002; non-employee directors’ fees; employee and executive salaries and bonuses; stock-based compensation; legal andfees; audit fees; directors and officers insurance premiums; telecommunications expenses; property-related expenditures including utilities, rental, security and maintenance; and elimination entries.
The decrease in our corporate expenses was primarily due to lower US government investigations-related and US lawsuit expenses, audit fees and other corporate head office-related expenses, which was partially offset by increases in acquisition-related intangible asset amortization.
Liquidity and Capital Resources
At September 30, 2013,2014, our cash balances were $47.7$81.2 million, which comprised mainly ZAR-denominated balances of ZAR 75.6612.0 million ($7.554.3 million), KRW-denominated balances of KRW 33.520.6 billion ($30.919.6 million) and US dollar-denominated balances of $6.8$5.1 million and other currency deposits, primarily euro,Botswana Pula, of $2.5$2.2 million. The decreaseincrease in our cash balances from June 30, 2013,2014, was primarily due to the expansion of our UEPS-based lending business, offset byall of our core businesses during the quarter, and to a lesser extent due to the cash generatedconservation resulting from operations.the sale of loss-incurring businesses.
We currently believe that our cash and credit facilities are sufficient to fund our future operations for at least the next four quarters.
We generally invest the surplus cash held by our South African operations in overnight call accounts that we maintain at South African banking institutions, and surplus cash held by our non-South African companies in the US and European money markets. We have invested surplus cash in Korea in short-term investment accounts at Korean banking institutions.
28
Historically, we have financed most of our operations, research and development, working capital, capital expenditures and acquisitions through our internally generated cash. When considering whether to borrow under our financing facilities, we consider the cost of capital, cost of financing, opportunity cost of utilizing surplus cash and availability of tax efficient structures to moderate financing costs.
29
We have a short-term South African credit facility with Nedbank Limited of ZAR 400 million ($35.5 million). The short-term facility comprises an overdraft facility of up to ZAR 250 million and indirect and derivative facilities of up to ZAR 150 million, which includes letters of guarantee, letters of credit and forward exchange contracts. As of September 30, 2013,2014, we have a South African short-term credit facilityused none of approximatelythe overdraft and ZAR 250135.0 million ($24.712.0 million) of which approximately ZAR 130 million ($ 13.0 million) has been utilizedthe indirect and derivative facilities to support cross-guarantees issuedobtain foreign exchange contracts and to Nedbank Limited forsupport guarantees issued by Nedbank to various third parties on our behalf. Refer to Note 12 to our audited consolidated financial statements included in our Annual Report on Form 10-K for the year ended June 30, 2014, for additional information related to our short-term facilities.
As of September 30, 2013,2014, we had outstanding long-term debt of KRW 92.479.4 billion (approximately $85.4$75.6 million translated at exchange rates applicable as of September 30, 2013)2014) under credit facilities with a group of South Korean banks. We refinanced this debt on October 28, 2013 with a new KRW 85.0 billion five-year senior secured term loan and revolving credit facility. The loans bear interest at the South Korean CD rate in effect from time to time (2.66%(2.65% as of September 30, 2013)2014) plus a margin of 3.10% for one of the term loan facilities and the revolver and a margin of 2.90% for the other term loan facility. Scheduled repayments of the term loans and loan under the revolving credit facility are as follows: October 2014 (KRW 15 billion), April 2016, 2017 and 2018 (KRW 10 billion each) and October 2018 (KRW 30 billion plus all outstanding loans under our revolving credit facility). Refer to noteNote 9 to theour unaudited condensed consolidated financial statements for morethe three months ended September 30, 2014, for additional information about the terms ofrelated to our new facility.long-term borrowings.
Cash flows from operating activities
First quarter of fiscal 2015
Net cash utilized inprovided by operating activities for the first quarter of fiscal 20142015 was $39.5 million (ZAR 424.6 million) compared to cash utilized in operating activities of $1.7 million (ZAR 16.8 million) compared to cash generated from operating activities of $25.7 million (ZAR 212.5 million) for the first quarter of fiscal 2013.2014. Excluding the impact of interest received, interest paid under our Korean debt and taxes presented in the table below, the decreaseincrease in cash from operating activities resulted from improved trading activity during fiscal 2015.
During the expansionfirst quarter of our UEPS-based lending book and the timingfiscal 2015, we made additional tax payment of prefunding related to the October 2013 payment cycle, offset by improved cash generated from operating activities and the elimination of implementation costs$2.4 million (ZAR 26.4 million) related to our SASSA contract2014 tax year in fiscal 2014.
South Africa. We also paid taxes totaling $1.6 million in other tax jurisdictions, primarily South Korea. There were no significant tax payments during the first quarter of fiscal 2014 and 2013, respectively.2014.
Taxes paid during the first quarter of fiscal 20142015 and 20132014 were as follows:
| Table 10 | Three months ended September 30, | |||||||||||||||||||||||
| Table 7 | Three months ended September 30, | |||||||||||||||||||||||
| 2013 | 2012 | 2013 | 2012 | 2014 | 2013 | 2014 | 2013 | |||||||||||||||||
| $ | $ | ZAR | ZAR | $ | $ | ZAR | ZAR | |||||||||||||||||
| ‘000 | ‘000 | ‘000 | ‘000 | ‘000 | ‘000 | ‘000 | ‘000 | |||||||||||||||||
| Taxation paid related to prior years | 2,408 | - | 26,392 | - | ||||||||||||||||||||
| Taxation refunds received | - | (55 | ) | - | (464 | ) | (35 | ) | - | (365 | ) | - | ||||||||||||
| Total South African taxes refunded | - | (55 | ) | - | (464 | ) | ||||||||||||||||||
| Total South African taxes paid | 2,374 | - | 26,027 | - | ||||||||||||||||||||
| Foreign taxes paid: primarily Korea | 498 | 397 | 4,984 | 3,279 | 2,786 | 498 | 30,170 | 4,984 | ||||||||||||||||
| Total tax paid | 498 | 342 | 4,984 | 2,815 | 5,160 | 498 | 56,197 | 4,984 | ||||||||||||||||
We expect to pay our secondfirst provisional payments in South Africa related to our 20142015 tax year in the second quarter of fiscal 2014.2015.
Cash flows from investing activities
First quarter of fiscal 2015
Cash used in investing activities for the first quarter of fiscal 2015 includes capital expenditure of $9.4 million (ZAR 100.9 million), primarily for the acquisition of payment processing terminals in Korea. We also received approximately $1.9 million resulting from the sale of NUETS business.
Cash used in investing activities for the first quarter of fiscal 2014 includes capital expenditure of $5.6 million (ZAR 56.2 million), primarily for the acquisition of payment processing terminals in Korea.
Cash used in investing activities for the first quarter of fiscal 2013 includes capital expenditure of $6.5 million (ZAR 53.7 million), primarily for payment vehicles and related equipment for our new SASSA contract and acquisition of payment processing terminals in Korea. During that quarter, we also paid $1.9 million (ZAR 16.2 million) for Pbel.30
Cash flows from financing activities
First quarter of fiscal 2015
During the first quarter of fiscal 2015, we repurchased BVI’s remaining 1,837,432 shares of Net1 common stock for approximately $9.2 million and BVI paid $1.4 million for 12.5% of CPS’ issued and outstanding ordinary shares. We also utilized approximately $1.1 million of our Korean borrowings to pay quarterly interest due and received approximately $1.0 million from the exercise of stock options during the first quarter of fiscal 2015.
There were no cash flows from financing activities during the first quarter of fiscal 2014. During the first quarter of fiscal 2013, we received $0.2 million from the exercise of stock options.
Off-Balance Sheet Arrangements
We have no off-balance sheet arrangements.
29
Capital Expenditures
We expect capital spending for the second quarter of fiscal 20142015 to primarily include the acquisition of payment terminals for the expansion of our operations in Korea.
Our historical capital expenditures for the first quarter of fiscal 20142015 and 20132014 are discussed under “—Liquidity and Capital Resources—Cash flows from investing activities.” All of our capital expenditures for the past three fiscal years were funded through internally-generated funds. We had outstanding capital commitments as of September 30, 2013,2014, of $0.4$0.3 million related mainly to computer equipment. We expect to fund these expenditures through internally-generated funds.
Contingent Liabilities, Commitments and Contractual Obligations
The following table sets forth our contractual obligations as of September 30, 2013:2014:
| Table 11 | Payments due by Period, as of September 30, 2013(in $ ’000s) | |||||||||||||||||||||||||||||
| Table 8 | Payments due by Period, as of September 30, 2014(in $ ’000s) | |||||||||||||||||||||||||||||
| Less | More | Less | More | |||||||||||||||||||||||||||
| than 1 | 1-3 | 3-5 | than 5 | than 1 | 1-3 | 3-5 | than 5 | |||||||||||||||||||||||
| Total | year | years | years | years | Total | year | years | years | years | |||||||||||||||||||||
| Long-term debt obligations (A) | 92,997 | 20,102 | 72,895 | - | - | 83,935 | 17,753 | 24,847 | 41,335 | - | ||||||||||||||||||||
| Operating lease obligations | 8,932 | 3,854 | 4,216 | 862 | - | 6,913 | 3,330 | 3,426 | 157 | - | ||||||||||||||||||||
| Purchase obligations | 2,869 | 2,869 | - | - | - | 9,090 | 9,090 | - | - | - | ||||||||||||||||||||
| Capital commitments | 398 | 398 | - | - | - | 304 | 304 | - | - | - | ||||||||||||||||||||
| Other long-term obligations (B)(C) | 21,499 | - | - | - | 21,499 | 22,396 | - | - | - | 22,396 | ||||||||||||||||||||
| Total | 126,695 | 27,223 | 77,111 | 862 | 21,499 | 122,638 | 30,477 | 28,273 | 41,492 | 22,396 | ||||||||||||||||||||
| (A) | – Includes | |
| (B) | – Includes policy holder liabilities of | |
| (C) | – We have excluded cross-guarantees in the aggregate amount of |
3031
Item 3. Quantitative and Qualitative Disclosures About Market Risk
In addition to the tables below, see noteNote 5 to the unaudited condensed consolidated financial statements for a discussion of market risk.
The following table illustrates the effect on our annual expected interest charge, translated at exchange rates applicable as of September 30, 2013,2014, as a result of a changechanges in the Korean CD rate.CD. The effectseffect of a hypothetical 1% increase and a 1% decrease in each of the Korean CD rate as of September 30, 2013, is2014, are shown. The selected 1% hypothetical change does not reflect what could be considered the best or worst case scenarios.
| As of September 30, 2013 | As of September 30, 2014 | ||||||||||||||||||||
| Table 12 | Estimated | ||||||||||||||||||||
| annual | |||||||||||||||||||||
| Table 9 | Hypothetical | Estimated annual | |||||||||||||||||||
| expected | change in | expected interest | |||||||||||||||||||
| interest charge | Korean CD | charge after | |||||||||||||||||||
| after | rate or South | hypothetical change in | |||||||||||||||||||
| Annual | hypothetical | Annual | Africa | Korean CD rate or | |||||||||||||||||
| expected | Hypothetical | change in | expected | overdraft | South African | ||||||||||||||||
| interest | change in | Korean CD | interest | facility rate, | overdraft facility rate, | ||||||||||||||||
| charge | Korean CD | rate | charge | as | as appropriate | ||||||||||||||||
| ($ ’000) | rate | ($ ’000) | ($ ’000) | appropriate | ($ ’000) | ||||||||||||||||
| Interest on Korean long-term debt | 5,772 | 1% | 6,626 | 4,316 | 1% | 5,080 | |||||||||||||||
| (1% | ) | 4,918 | (1% | ) | 3,569 | ||||||||||||||||
The following table summarizes our exchange-traded equity securities with equity price risk as of September 30, 2013.2014. The effects of a hypothetical 10% increase and a 10% decrease in market prices as of September 30, 2013,2014, is also shown. The selected 10% hypothetical change does not reflect what could be considered the best or worst case scenarios. Indeed, results could be far worse due both to the nature of equity markets and the aforementioned liquidity risk.
| As of September 30, 2013 | As of September 30, 2014 | |||||||||||||||||||||||
| Table 13 | ||||||||||||||||||||||||
| Table 10 | ||||||||||||||||||||||||
| Hypothetical | Hypothetical | |||||||||||||||||||||||
| Estimated fair | Percentage | Estimated fair | Percentage | |||||||||||||||||||||
| value after | Increase | value after | Increase | |||||||||||||||||||||
| Fair | hypothetical | (Decrease) in | Fair | hypothetical | (Decrease) in | |||||||||||||||||||
| value | Hypothetical | change in price | Shareholders’ | value | Hypothetical | change in price | Shareholders’ | |||||||||||||||||
| ($ ’000) | price change | ($ ’000) | Equity | ($ ’000) | price change | ($ ’000) | Equity | |||||||||||||||||
| Exchange-traded equity securities | 8,019 | 10% | 8,821 | 0.22% | 7,584 | 10% | 8,342 | 0.17% | ||||||||||||||||
| (10% | ) | 7,217 | (0.22% | ) | 7,584 | (10% | ) | 6,826 | (0.17% | ) | ||||||||||||||
Item 4. Controls and Procedures
Evaluation of disclosure controls and procedures
Under the supervision and with the participation of our management, including our chief executive officer and our chief financial officer, we conducted an evaluation of our disclosure controls and procedures, as such term is defined under Rule 13a-15(e) promulgated under the Securities Exchange Act of 1934, as amended, as of September 30, 2013.2014. Management recognizes that any controls and procedures, no matter how well designed and operated, can provide only reasonable assurance of achieving their objectives and management necessarily applies its judgment in evaluating the cost-benefit relationship of possible controls and procedures. Based on this evaluation, the chief executive officer and the chief financial officer concluded that our disclosure controls and procedures were effective as of September 30, 2013.2014.
Changes in Internal Control over Financial Reporting
There have not been any changes in our internal control over financial reporting during the fiscal quarter ended September 30, 2013,2014, that have materially affected, or are reasonably likely to materially affect, our internal control over financial reporting.
3132
Part II. Other Information
Item 1. Legal Proceedings
AllPay Challenge to Tender AwardUnited States securities litigation
On September 10,December 24, 2013, Net1, our chief executive officer and our chief financial officer were named as defendants in a purported class action lawsuit filed in the South African ConstitutionalUnited States District Court heard oral arguments onfor the appeal by AllPay against the ruling by the South African Supreme CourtSouthern District of Appeal upholding the awardNew York alleging violations of the SASSA tenderfederal securities laws. The lawsuit was brought on behalf of a purported shareholder of Net1 and all other similarly situated shareholders who purchased our securities between August 27, 2009 and November 27, 2013. On July 23, 2014, the Court appointed a lead plaintiff and lead counsel. On September 22, 2014, the lead plaintiff filed an amended complaint alleging that we made materially false and misleading statements in that we failed to us.disclose material adverse information and misrepresented the truth about our finances and business prospects. The Constitutional Courtamended complaint seeks unspecified damages on behalf of the lead plaintiff and all other similarly situated shareholders who purchased our securities between January 18, 2012 and December 4, 2012, which is a shorter class period than proposed in the original complaint. No motion for class certification has reserved judgment.been filed. We cannot predict when or howbelieve this lawsuit has no merit and intend to defend it will rule on the matter.vigorously.
Item 1A. Risk Factors
See “Item 1A RISK FACTORS” in Part I of our Annual Report on Form 10-K for the fiscal year ended June 30, 2013,2014, for a discussion of risk factors relating to (i) our business, (ii) operating in South Africa and other foreign markets, (iii) government regulation, and (iv) our common stock. Except as set forth below, there have been no material changes from the risk factors previously disclosed in our Annual Report on Form 10-K for the fiscal year ended June 30, 2013.2014.
SASSA has initiated a new tender process for the payment of social grants. As a result, we cannot predict whether our current SASSA contract will remain in effect for the remainder of its five-year term. We derive a substantial portion of our revenues from this contract and from the provision of financial and other services to our cardholder base. If we were to lose our SASSA contract or we were to obtain a new contract on terms that are substantially inferior to our current contract, our business would suffer significantly.
As ordered by the South African Constitutional Court in its April 2014 ruling, SASSA has initiated a new tender process for a five-year contract relating to the payment of social grants. SASSA issued a request for proposals on October 22, 2014. Bidders are required to submit proposals by December 12, 2014.
We cannot predict with certainty what the timing or ultimate outcome of the tender process will be, or if a new tender award will be made at all after the process is complete. We intend to participate in the new tender, which, as with prior SASSA tenders, will consume a substantial amount of our management’s time and attention and will impact their ability to focus on other matters, including other South African and international business development activities. We cannot assure you that the current tender process will result in our receiving a contract to continue to distribute social welfare grants nationally. If a new contract is awarded and we are not the winning bidder, we would lose the benefit of the remaining portion of our current contract. Even if we win the tender and do receive a new contract, we cannot predict the terms that such contract will contain. Any new contract we receive may contain pricing or other terms that would be less favorable to us than the terms of our current contract.
In addition, our SASSA contract has enabled us to offer a variety of innovative financial and other services, such as UEPS-based loans and procurement of prepaid airtime, to our social welfare recipient cardholders. Although we believe that our offerings frequently represent the lowest-cost alternative for our customers for these types of services, if we were to lose our SASSA contract or if our SASSA contract were to limit the provision of these services, it might be less convenient for our cardholder customers to purchase these services from us and thus, we may have difficulty growing or even maintaining this aspect of our South African business, which would negatively affect our future operating performance.
Further, in connection with the litigation challenging the award of the previous SASSA tender to us, we included our entire 2011 SASSA tender submission in the court record, which court record is in the public domain. Our previous tender submission contained competitively sensitive business information. As a result of this disclosure, our existing and future competitors have access to this information which could adversely affect our competitive position in the current tender process to the extent that such information continues to remain competitively sensitive.
Finally, if we were to be awarded one or more contracts by SASSA, an unsuccessful tenderor could seek to challenge the award, which could result in the contract being set aside or could require us to expend time and resources in an attempt to defeat any such challenge.
33
The South African National Credit Regulator has applied to cancel the registration of our subsidiary, Moneyline Financial Services (Pty) Ltd, as a credit provider. If the registration is cancelled, we will not be able to provide UEPS-based loans to our customers, which would harm our business.
Moneyline provides microloans to our UEPS/EMV cardholders. Moneyline is a registered credit provider under the South African National Credit Act, or NCA, and is required to comply with the NCA in the operation of its lending business. On September 22, 2014, the South African National Credit Regulator, or NCR, issued a press release stating that it has applied to the National Consumer Tribunal to cancel Moneyline’s registration, based on an investigation concluded by the NCR. The NCR's press release alleges, among other things, that Moneyline contravened the NCA by including child support grants and foster child grants in the affordability assessments performed by Moneyline prior to granting credit to these borrowers, and that the procedures followed and documentation maintained by Moneyline are not in accordance with the NCA. We have signedreviewed NCR’s application and believe that it contains numerous factual inaccuracies. We believe that Moneyline has conducted its business in compliance with NCA. However, if the NCR’s application is successful, Moneyline would be prohibited from operating its microlending business, which could have a non-binding lettermaterial adverse effect on our results of intentoperations and cash flows.
Item 2. Unregistered Sales of Equity Securities and Use of Proceeds
As described in further detail under “Management’s Discussion and Analysis of Financial Condition and Results of Operations—Recent Developments—Transactions in Preparation for a proposed BEE Transaction. IfNew SASSA Tender,” on August 27, 2014, we do not complete the transaction, our business and stock price may suffer.
On November 6, 2013, we signed a non-binding letter of intent to issue 4,400,000repurchased 1,837,432 shares of our common stock from one of our BEE partners at a price of ZAR 88.5052.99 per share to a consortium of investors pursuant to a new BEE transaction. The letter of intent provides, among other things, that one of our South African subsidiaries would extend a five-year loan to the BEE consortium to provide it with the funds to pay the purchase price of the shares, with the shares serving as collateral security for repayment of the loan. Completion of the transaction, is subject to the conclusion of definitive agreements which will include certain conditions to the issuance of the shares, including obtaining the relevant regulatory approvals. We cannot assure you that we will be able to complete the proposed transaction on the proposed terms, if at all.share.
The proposed BEE transaction is part of our ongoing efforts to strengthen the development of our business plan, and is in compliance with South African regulation and business practice. We expect that completion of the proposed transaction will help us achieve applicable BEE objectives. However, if we are unable to complete the transaction as proposed, we would not achieve these expected benefits and our business could be adversely impacted. In addition, we are lending the BEE consortium the purchase price for the shares and are relying in part on the future appreciation of our stock price to enable the BEE consortium to repay the loan. We also cannot predict how the announcement of the letter of intent, or the completion or non-completion of the transaction on the contemplated terms, will affect the trading price of our common stock.
Item 6. Exhibits
The following exhibits are filed as part of this Form 10-Q:
| Incorporated by Reference Herein | ||||||||||
| Exhibit | Included | |||||||||
| No. | Description of Exhibit | Herewith | Form | Exhibit | Filing Date | |||||
| 10.24 | KRW 85,000,000,000 Senior Facilities Agreement dated October 28, 2013, between Net 1 Applied Technologies Korea, as borrower, Hana Bank, as agent and security agent, financial institutions listed therein as original lenders and Hana Daetoo Securities Co., Ltd., as mandated lead arranger. | 8-K | 10.24 | October 31, 2013 | ||||||
| 31.1 | Certification of Principal Executive Officer pursuant to Rule 13a-14(a) under the Exchange Act | X | ||||||||
| 31.2 | Certification of Principal Financial Officer pursuant to Rule 13a-14(a) under the Exchange Act | X | ||||||||
| 32 | Certification pursuant to 18 USC Section 1350 | X | ||||||||
| 101.INS | XBRL Instance Document | X | ||||||||
| 101.SCH | XBRL Taxonomy Extension Schema | X | ||||||||
| 101.CAL | XBRL Taxonomy Extension Calculation Linkbase | X | ||||||||
| 101.DEF | XBRL Taxonomy Extension Definition Linkbase | X | ||||||||
| 101.LAB | XBRL Taxonomy Extension Label Linkbase | X | ||||||||
| 101.PRE | XBRL Taxonomy Extension Presentation Linkbase | X | ||||||||
34
SIGNATURES
Pursuant to the requirements of the Securities Exchange Act of 1934, the registrant has caused this report to be signed on its behalf by the undersigned, thereunto duly authorized, on November 7, 2013.6, 2014.
NET 1 UEPS TECHNOLOGIES, INC.
By: /s/ Dr. Serge C.P. Belamant
Dr. Serge C.P. Belamant
Chief Executive Officer, Chairman of the Board and Director
By: /s/ Herman Gideon Kotzé
Herman Gideon Kotzé
Chief Financial Officer, Treasurer and Secretary, Director
3235