UNITED STATES
SECURITIES AND EXCHANGE COMMISSION
Washington, D.C. 20549
FORM 10-Q
[X] QUARTERLY REPORT UNDER SECTION 13 OR 15(D) OF THE SECURITIES EXCHANGE ACT OF 1934
For the quarterly period ended February 28,August 31, 2015
[ ] TRANSITION REPORT UNDER SECTION 13 OR 15(D) OF THE SECURITIES EXCHANGE ACT OF 1931934
For the transition period from _____ to _____
Commission File Number:000-50907
HANDENI GOLD INC.
(Exact name of registrant as specified in its charter)
| Nevada | 98-0430222 |
| (State or other jurisdiction of incorporation or organization) | (I.R.S. Employer Identification No.) |
| P.O. Box 33507, | |
| Plot 82A, ITV Road, Mikocheni Light Industrial Area, | N/A |
| Dar es Salaam, the United Republic of Tanzania | |
| (Address of principal executive offices) | (Zip Code) |
+255 222 700 08470 00 84
(Registrant’s telephone number, including area code)
Indicate by check mark whether the registrant (1) has filed all reports required to be filed by Section 13 or 15(d) of the Exchange Act during the past 12 months (or for such shorter period that the registrant was required to file such reports), and (2) has been subject to such filing requirements for the past 90 days.
Yes [X] No [ ]
Indicate by check mark whether the registrant has submitted electronically and posted on its corporate Web site, if any, every Interactive Data File required to be submitted and posted pursuant to Rule 405 of Regulation S-T (§232.405 of this chapter) during the preceding 12 months (or for such shorter period that the registrant was required to submit and post such files).
Yes [X] No [ ]
Indicate by check mark whether the registrant is a large accelerated filer, an accelerated filer, a non-accelerated filer, or a smaller reporting company. See the definitions of “large accelerated filer,” “accelerated filer,” “non-accelerated filer,” and “smaller reporting company” in Rule 12b-2 of the Exchange Act.
| Large accelerated filer [ ] | Accelerated filer [ ] |
| Non-accelerated filer [ ] | Smaller reporting company [X] |
| (Do not check if a smaller reporting company) |
Indicate by check mark whether the registrant is a shell company (as defined in Rule 12b-2 of the Exchange Act).
Yes [ ] No [X]
State the number of shares outstanding of each of the issuer’s classes of common equity, as of the latest practicable date,
321,416,654 shares of common stock as of March 31,October 5, 2015.
HANDENI GOLD INC. (FORMERLY DOUGLAS LAKE MINERALS INC.)
Quarterly Report On Form 10-QFor The Quarterly Period Ended
| HANDENI GOLD INC. (FORMERLY DOUGLAS LAKE MINERALS INC.) |
| Quarterly Report On Form 10-Q |
| For The Quarterly Period Ended |
| August 31, 2015 |
| INDEX |
INDEX
FORWARD-LOOKING STATEMENTS
This quarterly report on Form 10-Q contains forward-looking statements that involve risks and uncertainties. Forward-looking statements in this quarterly report include, among others, statements regarding our capital needs, business plans and expectations. Such forward-looking statements involve risks and uncertainties regarding the market price of gold, availability of funds, government regulations, permitting, common share prices, operating costs, capital costs, outcomes of ore reserve development, recoveries and other factors. Forward-looking statements are made, without limitation, in relation to operating plans, property exploration and development, availability of funds, environmental reclamation, operating costs and permit acquisition. Any statements contained herein that are not statements of historical facts may be deemed to be forward-looking statements. In some cases, you can identify forward-looking statements by terminology such as “may”, “will”, “should”, “expect”, “plan”, “intend”, “anticipate”, “believe”, “estimate”, “predict”, “potential” or “continue”, the negative of such terms or other comparable terminology. Actual events or results may differ materially. In evaluating these statements, you should consider various factors, including the risks outlined in our annual report on Form 10-K for the year ended May 31, 2014,2015, and, from time to time, in other reports that we file with the Securities and Exchange Commission (the “SEC”). These factors may cause our actual results to differ materially from any forward-looking statement. Given these uncertainties, readers are cautioned not to place undue reliance on such forward-looking statements.
1
PART I – FINANCIAL INFORMATION
Item 1. Financial Statements
| Item 1. | Financial Statements |
The following unaudited interim consolidated financial statements of Handeni Gold Inc. (sometimes referred to as “we”, “us” or “our Company”) are included in this quarterly report on Form 10-Q:
2
Handeni Gold Inc.
| Handeni Gold Inc. |
| Consolidated Balance Sheets |
| (Expressed in U.S. dollars) |
| February 28, 2015 | May 31, 2014 | |||||
| (Unaudited) | (Audited) | |||||
| ASSETS | ||||||
| Current Assets | ||||||
| �� Cash | $ | 82,801 | $ | 532,694 | ||
| Amounts receivable (Note 3) | 36,341 | 34,326 | ||||
| Prepaid expenses and deposits (Note 4) | 4,637 | 15,076 | ||||
| Total Current Assets | 123,779 | 582,096 | ||||
| Restricted cash equivalent (Note 5) | 13,806 | 26,522 | ||||
| Restricted marketable securities (Note 6) | - | 73,600 | ||||
| Mineral licenses (Note 7) | 1,650,000 | 1,650,000 | ||||
| Property and equipment, net (Note 8) | 2,576 | 55,446 | ||||
| TOTAL ASSETS | $ | 1,790,161 | $ | 2,387,664 | ||
| LIABILITIES AND STOCKHOLDERS' EQUITY | ||||||
| Current Liabilities | ||||||
| Accounts payable and accrued liabilities | $ | 66,105 | $ | 109,432 | ||
| Accounts payable and accrued liabilities - related parties (Note 9) | 422,500 | 277,500 | ||||
| Current portion of loans from related parties (Note 9 (a)) | 1,125,000 | 1,070,683 | ||||
| Total Current Liabilities | 1,613,605 | 1,457,615 | ||||
| Loans from related parties (Note 9 (a)) | 80,000 | - | ||||
| Total Liabilities | 1,693,605 | 1,457,615 | ||||
| Commitments and Contingencies (Notes 1, 7 and 13) | ||||||
| Stockholders' Equity | ||||||
| Common stock (Note 10) | ||||||
| Authorized: 500,000,000 shares, $0.001 par value Issued and outstanding: 321,416,654 shares (May 31, 2014 – 321,416,654 shares) | 321,417 | 321,417 | ||||
| Additional paid-in capital (Note 10) | 116,414,824 | 116,414,824 | ||||
| Donated capital | 305,290 | 222,495 | ||||
| Accumulated other comprehensive loss | - | (86,400 | ) | |||
| Accumulated deficit | (116,944,975 | ) | (115,942,287 | ) | ||
| Total Stockholders' Equity | 96,556 | 930,049 | ||||
| TOTAL LIABILITIES AND STOCKHOLDERS' EQUITY | $ | 1,790,161 | $ | 2,387,664 |
| August 31, 2015 | May 31, 2015 | |||||
| (Unaudited) | (Audited) | |||||
| ASSETS | ||||||
| Current Assets | ||||||
| Cash | $ | 107,171 | $ | 85,985 | ||
| Amounts receivable (Note 3) | 40,323 | 38,751 | ||||
| Prepaid expenses and deposits (Note 4) | 10,487 | 306 | ||||
| Total Current Assets | 157,981 | 125,042 | ||||
| Restricted cash equivalent (Note 5) | 13,045 | 13,858 | ||||
| Mineral licenses (Note 6) | 1,650,000 | 1,650,000 | ||||
| Property and equipment, net (Note 7) | 679 | 1,474 | ||||
| TOTAL ASSETS | $ | 1,821,705 | $ | 1,790,374 | ||
| LIABILITIES AND STOCKHOLDERS' DEFICIENCY | ||||||
| Current Liabilities | ||||||
| Accounts payable and accrued liabilities | $ | 52,958 | $ | 52,785 | ||
| Accounts payable and accrued liabilities - related parties (Note 8) | - | 454,615 | ||||
| Total Current Liabilities | 52,958 | 507,400 | ||||
| Loans from related parties (Note 8 (a)) | 1,475,000 | 1,340,000 | ||||
| Payables due to related parties (Note 8) | 451,000 | - | ||||
| Total Liabilities | 1,978,958 | 1,847,400 | ||||
| Nature of Operations and Going Concern (Note 1) | ||||||
| Commitments and Contingencies (Notes 6 and 12) | ||||||
| Stockholders' Equity (Deficiency) | ||||||
| Common stock (Note 9) Authorized: 500,000,000 shares, $0.001 par value Issued and outstanding: 321,416,654 shares (May 31, 2015 – 321,416,654 shares) | 321,417 | 321,417 | ||||
| Additional paid-in capital (Note 9) | 116,414,824 | 116,414,824 | ||||
| Donated capital (Note 8 (a)) | 350,989 | 314,982 | ||||
| Deficit accumulated during the exploration stage | (117,244,483 | ) | (117,108,249 | ) | ||
| Total Stockholders' Deficiency | (157,253 | ) | (57,026 | ) | ||
| TOTAL LIABILITIES AND STOCKHOLDERS' DEFICIENCY | $ | 1,821,705 | $ | 1,790,374 |
(The accompanying notes are an integral part of these consolidated financial statements)
3
Handeni Gold Inc.
| Handeni Gold Inc. |
| Interim Consolidated Statements of Operations and Comprehensive Loss |
| (Expressed in U.S. dollars) |
| (Unaudited) |
| For the Three Months Ended, | For the Nine Months Ended, | For the Three Months Ended, | ||||||||||||||||
| February 28, 2015 | February 28, 2014 | February 28, 2015 | February 28, 2014 | August 31, 2015 | August 31, 2014 | |||||||||||||
| Revenue | $ | - | $ | - | $ | - | $ | - | $ | - | $ | - | ||||||
| Expenses | ||||||||||||||||||
| Consulting fees | 3,610 | - | 14,530 | 22,500 | 1,350 | 5,850 | ||||||||||||
| Depreciation | 14,557 | 46,320 | 52,719 | 143,971 | 795 | 22,206 | ||||||||||||
| Exploration expenses | 35,925 | 70,678 | 174,245 | 180,885 | 20,303 | 45,577 | ||||||||||||
| Gain on disposal or write-down of equipment | - | - | (20,058 | ) | (2,820 | ) | ||||||||||||
| General and administrative | 110,450 | 138,281 | 340,655 | 382,309 | 47,868 | 125,760 | ||||||||||||
| Interest expense | 28,638 | 23,469 | 82,795 | 58,595 | 36,007 | 26,987 | ||||||||||||
| Professional | 57,198 | 16,008 | 107,013 | 52,290 | 3,347 | 32,503 | ||||||||||||
| Rent | 332 | 17,871 | 58,875 | 70,216 | 36,411 | 48,215 | ||||||||||||
| Travel and investor relations | 4,871 | 9,508 | 32,037 | 14,695 | 165 | 1,134 | ||||||||||||
| Total Expenses | 255,581 | 322,135 | 842,811 | 922,641 | 146,246 | 308,232 | ||||||||||||
| Loss From Operations | (255,581 | ) | (322,135 | ) | (842,811 | ) | (922,641 | ) | (146,246 | ) | (308,232 | ) | ||||||
| Other Income (Expenses) | ||||||||||||||||||
| Impairment of marketable securities (Note 6) | (53,600 | ) | - | (140,000 | ) | (1,000,000 | ) | |||||||||||
| Loss on marketable securities (Note 6) | (20,000 | ) | - | (20,000 | ) | - | ||||||||||||
| Gain on disposal of equipment | 10,000 | 20,209 | ||||||||||||||||
| Interest income | 28 | 61 | 123 | 216 | 12 | 64 | ||||||||||||
| Total other (Expenses) / Income | (73,572 | ) | 61 | (159,877 | ) | (999,784 | ) | |||||||||||
| Total other Income | 10,012 | 20,273 | ||||||||||||||||
| Net Loss | (329,153 | ) | (322,074 | ) | (1,002,688 | ) | (1,922,425 | ) | (136,234 | ) | (287,959 | ) | ||||||
| Other Comprehensive Loss | ||||||||||||||||||
| Unrealized gain (loss) on marketable securities | - | 15,600 | - | (74,400 | ) | |||||||||||||
| Unrealized loss on marketable securities | - | (13,600 | ) | |||||||||||||||
| Comprehensive Loss | $ | (329,153 | ) | $ | (306,474 | ) | $ | (1,002,688 | ) | $ | (1,996,825 | ) | $ | (136,234 | ) | $ | (301,559 | ) |
| Net Loss per Share - Basic and Diluted | $ | (0.00 | ) | $ | (0.00 | ) | $ | (0.00 | ) | $ | (0.01 | ) | $ | (0.00 | ) | $ | (0.00 | ) |
| Basic and Diluted Weighted Average Number of Common Shares Outstanding | 321,416,654 | 321,416,654 | 321,416,654 | 321,416,654 | 321,416,654 | 321,416,654 | ||||||||||||
(The accompanying notes are an integral part of these consolidated financial statements)
4
Handeni Gold Inc.
| Handeni Gold Inc. |
| Interim Consolidated Statements of Cash Flows |
| (Expressed in U.S. dollars) |
| (Unaudited) |
| For the Nine Months Ended, | For the Three Months Ended, | |||||||||||
| February 28, 2015 | February 28, 2014 | August 31, 2015 | August 31, 2014 | |||||||||
| CASH PROVIDED BY (USED IN): | ||||||||||||
| CASH AND CASH EQUIVALENTS PROVIDED BY (USED IN): | ||||||||||||
| Operating Activities: | ||||||||||||
| Net loss | $ | (1,002,688 | ) | $ | (1,922,425 | ) | $ | (136,234 | ) | $ | (287,959 | ) |
| Adjustments for non-cash items in net loss: | ||||||||||||
| Depreciation | 52,719 | 143,971 | 795 | 22,206 | ||||||||
| Donated capital, services, interest and rent | 82,795 | 58,595 | 36,007 | 26,987 | ||||||||
| Impairment of marketable securities | 140,000 | 1,000,000 | ||||||||||
| Loss on marketable securities | 20,000 | - | ||||||||||
| Loss on unrealized foreign exchange | 2,332 | 1,983 | 813 | 95 | ||||||||
| Gain on disposal or write-down of equipment | (20,058 | ) | (2,820 | ) | ||||||||
| Gain on disposal of equipment | (10,000 | ) | (20,209 | ) | ||||||||
| Changes in non-cash operating working capital: | ||||||||||||
| Amounts receivable | (2,015 | ) | 46,257 | (1,572 | ) | (2,104 | ) | |||||
| Prepaid expenses and deposits | 10,439 | 55,336 | (10,181 | ) | (5,077 | ) | ||||||
| Accounts payable and accrued liabilities | (43,327 | ) | (50,131 | ) | 173 | (22,669 | ) | |||||
| Due to related parties | 145,000 | 124,319 | (3,615 | ) | 43,656 | |||||||
| Cash Used in Operating Activities | (614,803 | ) | (544,915 | ) | (123,814 | ) | (245,074 | ) | ||||
| Investing Activities: | ||||||||||||
| Proceeds from disposal of equipment | 20,209 | 6,623 | 10,000 | 20,209 | ||||||||
| Redemption of restricted cash equivalent | 10,384 | - | ||||||||||
| Purchase of property and equipment | - | (1,690 | ) | |||||||||
| Cash Provided by Investing Activities | 30,593 | 4,933 | 10,000 | 20,209 | ||||||||
| Financing Activities: | ||||||||||||
| Loan from a related party | 134,317 | 475,000 | 135,000 | - | ||||||||
| Cash Provided by Financing Activities | 134,317 | 475,000 | 135,000 | - | ||||||||
| Decrease in cash | (449,893 | ) | (64,982 | ) | ||||||||
| Increase (Decrease) in cash | 21,186 | (224,865 | ) | |||||||||
| Cash, at beginning of the period | 532,694 | 206,402 | 85,985 | 532,694 | ||||||||
| Cash, at end of the period | $ | 82,801 | $ | 141,420 | $ | 107,171 | $ | 307,829 | ||||
(The accompanying notes are an integral part of these consolidated financial statements)
5
Handeni Gold Inc.Notes to the Interim Consolidated Financial Statements as of February 28,
| Handeni Gold Inc. |
| Notes to the Interim Consolidated Financial Statements as of August 31, 2015 |
| (Expressed in U.S. dollars) |
| (Unaudited) |
| 1. | Nature of Operations and | |
| ||
| ||
The Company was incorporated in the State of Nevada on January 5, 2004. On February 14, 2012, the Company changed its name from Douglas Lake Minerals Inc. to Handeni Gold Inc. (the “Company”). The Company’s principal business is the acquisition and exploration of mineral resources located in Tanzania, Africa. The Company has not presently determined whether its properties contain mineral reserves that are economically recoverable.
These consolidated financial statements have been prepared on a going concern basis, which implies the Company will continue to realize its assets and discharge its liabilities in the normal course of business. The Company has never generated revenues since inception and has never paid any dividends and is unlikely to pay dividends or generate earnings in the immediate or foreseeable future. The continuation of the Company as a going concern is dependent upon the continued financial support from its stockholders, the ability of the Company to obtain necessary equity financing to continue operations and to determine the existence, discovery and successful exploitation of economically recoverable reserves in its resource properties, confirmation of the Company’s interests in the underlying properties, and the attainment of profitable operations.
As at August 31, 2015, the Company has not generated any revenues and has accumulated losses of $117,244,483 since inception. These factors raise substantial doubt regarding the Company’s ability to continue as a going concern. The Company plans to raise equity and/or debt financing to fund its operations which may result in substantial dilution to the Company’s stockholders or may not be available, if at all, in amounts or on terms acceptable to the Company. If additional capital is not obtained, the Company may be forced to cease operations. These consolidated financial statements do not include any adjustments to the recoverability and classification of recorded asset amounts and classification of liabilities that might be necessary should the Company be unable to continue as a going concern.
| 2. | Summary of Significant Accounting Policies |
| a) | Basis of Presentation | |
These consolidated financial statements and related notes are presented in accordance with accounting principles generally accepted in the United States, and are expressed in U.S. dollars. These consolidated financial statements include the accounts of the Company and its subsidiaries described as follows. In June 2011, the Company incorporated in Tanzania a wholly-owned subsidiary, HG Limited (formerly DLM Tanzania Limited), which undertakes mineral property exploration activities in Tanzania. The Company also has a wholly-owned non-operating Tanzanian subsidiary (Douglas Lake Tanzania Limited). | ||
All significant intercompany transactions and balances have been eliminated. The Company’s fiscal year-end is May 31. | ||
| b) | Interim Consolidated Financial Statements | |
The interim unaudited consolidated financial statements have been prepared in accordance with accounting principles generally accepted in the United States for interim financial information and with the instructions to Securities and Exchange Commission (“SEC”) Form 10-Q. They do not include all of the information and footnotes required by generally accepted accounting principles for complete financial statements. Therefore, these financial statements should be read in conjunction with the Company’s audited consolidated financial statements and notes thereto for the year ended May 31, | ||
The interim financial statements included herein are unaudited; however, they contain all normal recurring accruals and adjustments that, in the opinion of management, are necessary to present fairly the Company’s financial position at | ||
| c) | Use of Estimates | |
The preparation of consolidated financial statements in accordance with United States generally accepted accounting principles requires management to make estimates and assumptions that affect the reported amounts of assets and liabilities at the date of the consolidated financial statements and the reported amounts of revenue and expenses in the reporting period. The Company regularly evaluates estimates and assumptions related to the recoverability and useful life of long-lived assets, mineral prospecting licenses, stock-based compensation, deferred income tax asset valuation allowances and contingent liabilities. The Company bases its estimates and assumptions on current facts, historical experience and various other factors that it believes to be reasonable under the circumstances, the results of which form the basis for making judgments about the carrying values of assets and liabilities and the accrual of costs and expenses that are not readily apparent from other sources. The actual results experienced by the Company may differ materially and adversely from the Company’s estimates. To the extent there are material differences between the estimates and the actual results, future results of operations will be affected. | ||
| d) | Basic and Diluted Net Income (Loss) Per Share | |
The Company computes net income (loss) per share in accordance with ASC 260,Earnings per Sharewhich requires presentation of both basic and diluted earnings per share (EPS) on the face of the income statement. Basic EPS is computed by dividing net income (loss) available to common shareholders (numerator) by the weighted average number of shares outstanding (denominator) during the period. Diluted EPS gives effect to all dilutive potential common shares outstanding during the period using the treasury stock method and convertible preferred stock using the if-converted method. In computing diluted EPS, the average stock price for the period is used in determining the number of shares assumed to be purchased from the exercise of stock options or warrants. Diluted EPS excludes all dilutive potential shares if their effect is anti-dilutive. |
6
Handeni Gold Inc.Notes to the Interim Consolidated Financial Statements as of February 28,
| Handeni Gold Inc. |
| Notes to the Interim Consolidated Financial Statements as of August 31, 2015 |
| (Expressed in U.S. dollars) |
| (Unaudited) |
| 2. | Summary of Significant Accounting Policies (continued) |
| e) | Comprehensive Income (Loss) | |
ASC 220,Comprehensive Incomeestablishes standards for the reporting and display of comprehensive income (loss) and its components in the consolidated financial statements. As at | ||
| f) | Cash and Cash Equivalents | |
Cash and cash equivalents are carried at fair value and they comprise cash on hand, deposits held with banks and other highly liquid investments. Highly liquid investments are readily convertible to cash and generally have maturities of three months or less from the time acquired. The Company places its cash and cash equivalents with high quality financial institutions which the Company believes limits credit risk. | ||
| g) | Marketable Securities | |
The Company reports investments in marketable equity securities at fair value based on quoted market prices. All investment securities are designated as available for sale with unrealized gains and losses included in stockholders’ equity. Realized gains and losses are accounted for based on the specific identification method. | ||
The Company periodically reviews these investments for other-than-temporary declines in fair value based on the specific identification method. When an other-than-temporary decline has occurred, unrealized losses that are other than temporary are recognized in earnings. When determining whether a decline is other-than-temporary, the Company examines (i) the length of time and the extent to which the fair value of an investment has been lower than its carrying value; (ii) the financial condition and | ||
| h) | Property and Equipment | |
Property and equipment consists of office equipment, automobiles and computer software recorded at cost and depreciated on a |
| Automobiles | 3 years |
| Camp and equipment | 3 years |
| Office furniture and equipment | 3 years |
| Software | 1 year |
| i) | Mineral Property Costs | |
The Company has been in the exploration stage since its inception on January 5, 2004 and has not yet realized any revenues from its planned operations. It is primarily engaged in the acquisition and exploration of mining properties. Mineral property exploration costs are expensed as incurred. Mineral prospecting licenses and mineral property acquisition costs are initially capitalized. The Company assesses the carrying costs for impairment under ASC 360,Property, Plant, and Equipment | ||
When it has been determined that a mineral property can be economically developed as a result of establishing proven and probable reserves, the costs then incurred to develop such property, are capitalized. Such costs will be amortized using the | ||
| j) | Long-Lived Assets | |
In accordance with ASC 360, |
7
Handeni Gold Inc.Notes to the Interim Consolidated Financial Statements as of February 28,
| Handeni Gold Inc. |
| Notes to the Interim Consolidated Financial Statements as of August 31, 2015 |
| (Expressed in U.S. dollars) |
| (Unaudited) |
| 2. | Summary of Significant Accounting Policies (continued) |
| k) | Asset Retirement Obligations | |
The Company accounts for asset retirement obligations in accordance with the provisions of ASC 440,Asset Retirement and Environmental Obligations,which requires the Company to record the fair value of an asset retirement obligation as a liability in the period in which it incurs a legal obligation associated with the retirement of tangible long-lived assets that result from the acquisition, construction, development and/or normal use of the assets. The Company did not have any asset retirement obligations as of | ||
| l) | Financial Instruments | |
ASC 825,Financial Instruments,requires an entity to maximize the use of observable inputs, and the fair value of financial instruments, which include cash, restricted cash equivalent, restricted marketable securities, and accounts payable were estimated to approximate their carrying values due to the immediate or short-term maturities of these financial instruments. | ||
The Company’s operations are in Canada and Africa, which results in exposure to market risks from changes in foreign currency rates. The financial risk is the risk to the Company’s operations that arise from fluctuations in foreign exchange rates and the degree of volatility of these rates. Currently, the Company does not use derivative instruments to reduce its exposure to foreign currency risk. | ||
| m) | Income Taxes | |
The Company accounts for income taxes using the asset and liability method in accordance with ASC 740,Income Taxes.The asset and liability method provides that deferred tax assets and liabilities are recognized for the expected future tax consequences of temporary differences between the financial reporting and tax bases of assets and liabilities, and for operating loss and tax credit carry-forwards. Deferred tax assets and liabilities are measured using the currently enacted tax rates and laws that will be in effect when the differences are expected to reverse. The Company records a valuation allowance to reduce deferred tax assets to the amount that is believed more likely than not to be realized. | ||
| n) | Foreign Currency Translation | |
The functional and reporting currency of the Company is the United States dollar. Monetary assets and liabilities denominated in foreign currencies are translated to United States dollars in accordance with ASC 830,Foreign Currency Translation Matters, using the exchange rate prevailing at the consolidated balance sheet date. Non-monetary assets and liabilities denominated in foreign currencies are translated at rates of exchange in effect at the date of the transaction. Average rates are used to translate revenues and expenses. | ||
Gains and losses arising on translation or settlement of foreign currency denominated transactions or balances are included in the determination of income. The Company has not, to the date of these consolidated financial statements, entered into derivative instruments to offset the impact of foreign currency fluctuations. | ||
To the extent that the Company incurs transactions that are not denominated in its functional currency, they are undertaken in Canadian dollars (“Cdn$”) and Tanzanian shillings. The Company has not, to the date of these consolidated financial statements, entered into derivative instruments to offset the impact of foreign currency fluctuations. | ||
| o) | Stock-based Compensation | |
The Company records stock-based compensation in accordance with ASC 718,Compensation – Stock Based Compensation,and ASC 505,Equity Based Payments to Non-Employees, which requires the measurement and recognition of compensation expense based on estimated fair values for all share-based awards made to employees and directors, including stock options. | ||
ASC 718 requires companies to estimate the fair value of share-based awards on the date of grant using an option-pricing model. The Company uses the Black-Scholes option-pricing model as its method of determining fair value. This model is affected by the Company’s stock price as well as assumptions regarding a number of subjective variables. These subjective variables include, but are not limited to the Company’s expected stock price volatility over the term of the awards, and actual and projected employee stock option exercise behaviours. The value of the portion of the award that is ultimately expected to vest is recognized as an expense in the consolidated statement of operations and comprehensive loss over the requisite service period. | ||
All transactions in which goods or services are the consideration received for the issuance of equity instruments are accounted for based on the fair value of the consideration received or the fair value of the equity instrument issued, whichever is more reliably measurable. | ||
| p) | Reclassification | |
Certain reclassifications have been made to the prior periods’ consolidated financial statements to conform to the current period’s presentation. |
8
Handeni Gold Inc.Notes to the Interim Consolidated Financial Statements as of February 28,
| Handeni Gold Inc. |
| Notes to the Interim Consolidated Financial Statements as of August 31, 2015 |
| (Expressed in U.S. dollars) |
| (Unaudited) |
| 2. | Summary of Significant Accounting Policies (continued) |
| q) | Recently Issued Accounting Pronouncements | |
The Company has adopted all new accounting pronouncements that are mandatorily effective and none have a material impact on its consolidated financial statements. | ||
New accounting pronouncements effective June 1, 2015 | ||
During the | ||
The Company does not believe that there are any other new accounting pronouncements that have been issued that are expected to have a material impact on its financial position or results of operations. | ||
| 3. | Amounts Receivable | |
| ||
| February 28, | May 31, | |||||
| 2015 | 2014 | |||||
| $ | $ | |||||
| Recoverable value added tax | 29,718 | 23,202 | ||||
| Recoverable harmonized sales tax | 6,565 | 9,765 | ||||
| Other receivable | 58 | 1,359 | ||||
| 36,341 | 34,326 |
The components of amounts receivable are as follows:
| August 31, | May 31, | ||||||
| 2015 | 2015 | ||||||
| $ | $ | ||||||
| Recoverable value added tax | 27,187 | 28,797 | |||||
| Recoverable goods and services / harmonized sales tax | 13,136 | 9,830 | |||||
| Other receivable | - | 124 | |||||
| 40,323 | 38,751 |
| 4. | Prepaid Expenses and Deposits |
|
| February 28, | May 31, | |||||
| 2015 | 2014 | |||||
| $ | $ | |||||
| General and administrative | 3,601 | 2,343 | ||||
| Rent | 1,036 | 12,733 | ||||
| 4,637 | 15,076 |
The components of prepaid expenses and deposits are as follows:
| August 31, | May 31, | ||||||
| 2015 | 2015 | ||||||
| $ | $ | ||||||
| General and administrative | 10,337 | - | |||||
| Rent | 150 | 306 | |||||
| 10,487 | 306 |
| 5. | Restricted Cash Equivalent |
As of | |
|
| February 28, 2015 | May 31, 2014 | |||||||||||||||||||||
| Fair Value | Other-than- | Fair Value | Other-than- | |||||||||||||||||||
| Based On | temporary | Loss on | Based On | temporary | Accumulated | |||||||||||||||||
| Quoted | Impairment | Marketable | Quoted | Impairment | Unrealized | |||||||||||||||||
| Cost | Market Price | Loss | Securities | Market Price | Loss | Loss | ||||||||||||||||
| $ | $ | $ | $ | $ | $ | $ | ||||||||||||||||
| Ruby Creek Resources Inc., 4,000,000 shares | 2,760,000 | - | (2,740,000 | ) | (20,000 | ) | 73,600 | (2,600,000 | ) | (86,400 | ) | |||||||||||
The four million restricted shares of common stock of Ruby Creek Resources Inc. (“RCR”) were issued to the Company on December 16, 2010 as partial consideration to purchase the mineral property interests under the agreements between RCR and the Company. The initial fair market value of these shares was $2,760,000 based on RCR’s quoted stock price on the issuance date.
On January 13, 2015, the Company reached a binding settlement to its litigation with RCR. Under the terms of the settlement, the Company will return the 4,000,000 shares of restricted RCR common stock to RCR (see Note 13, below). As a result, the Company has recorded a loss on marketable securities of $20,000 related to the pending return of these shares. As of February 28, 2015, the Company has recognized a total of $2,740,000 (May 31, 2014: $2,600,000) in other than temporary impairment on these RCR restricted shares.
9
Handeni Gold Inc.Notes to the Interim Consolidated Financial Statements as of February 28, 2015(Expressed in U.S. dollars)(Unaudited)
Mineral Properties and Licenses |
| a) | Handeni Properties, Tanzania, Africa | |
Prospecting Licenses (“PLs”) | ||
On September 21, 2010, the Company completed a Mineral Property Acquisition Agreement with IPP Gold Limited (“IPP Gold”), and the Company acquired four PLs totaling approximately 800 square kilometers, located in the Handeni District of Tanzania (the “Handeni Properties”). IPP Gold retained a 2.5% net smelter royalty (“NSR”) on the Handeni Properties and the Company has the option to reduce the NSR to 1.25% by paying $5,000,000. If the NSR is reduced to 1.25% the maximum NSR for any year is capped at $1,000,000. In any year the NSR payment is less than $1,000,000 the difference between the actual NSR payment and $1,000,000 will be carried forward to subsequent years. In addition if the London spot price for gold is equal to or greater than $1,500 then the NSR will increase from 2.5% to 3%. The Company issued 133,333,333 restricted shares of common stock to IPP Gold to acquire the Handeni Properties and no further payments to IPP Gold in shares or cash are required. | ||
On September 1, 2010, the Company entered into a Transaction Fee Agreement with a consultant for services related to soliciting offers from and in assisting in the negotiation with potential Company financiers, purchasers, acquisition targets and/or joint venture development partners (each such party being a “Potential Investor”). The initial term of the agreement was a period of 60 days and automatically renews monthly unless otherwise specifically renewed in writing by each party or terminated by the Company. Pursuant to the agreement, the Company agreed to pay the consultant a transaction fee for each completed property acquisition transaction in Tanzania (a “Completed Transaction”). The transaction fee is 12.5% of the shares issuable under each Completed Transaction, payable in restricted common shares at the lowest priced security issuable under each Completed Transaction. On September 30, 2010, the Company issued 16,666,667 restricted shares of common stock pursuant to the Transaction Fee Agreement in relation to the acquisition of the Handeni Properties. |
9
| Handeni Gold Inc. |
| Notes to the Interim Consolidated Financial Statements as of August 31, 2015 |
| (Expressed in U.S. dollars) |
| (Unaudited) |
| 6. | Mineral Properties and Licenses (continued) |
| a) | Handeni Properties, Tanzania, Africa (continued) | |
Prospecting Licenses (“PLs”) (continued) | ||
The fair value of the 133,333,333 shares of the Company’s common stock issued to IPP Gold pursuant to the Acquisition Agreement and the 16,666,667 shares of the Company’s common stock issued pursuant to the Transaction Fee Agreement totaled $60,000,000. | ||
On November 30, 2010, the capitalized acquisition costs of the Handeni Properties were tested for impairment by the Company’s management as required by ASC 360. Management determined that no positive cash flows from the Handeni Properties could be identified or supported and a full impairment loss was recognized in expenses for the $60,000,000 acquisition cost. | ||
| ||
In addition to the renewal areas, the Company had also applied for the remainder of the license areas and has received four additional PLs. The Company now holds a total license area of approximately 423.03 km2(53% of its original 800 km2license area). | ||
During the | ||
Primary Mining Licenses (“PMLs”), | ||
On August 5, 2011, the Company entered a Mineral Property Acquisition Agreement (the “2011 Acquisition Agreement”) with Handeni Resources Limited (“Handeni Resources”), a limited liability company registered under the laws of Tanzania. The Chairman of the Board of Directors of the Company has an existing ownership and/or beneficial interest(s) in Handeni Resources. Pursuant to the 2011 Acquisition Agreement, the Company had an exclusive option to acquire from Handeni Resources a 100% interest in mineral licenses covering an area of approximately 2.67 square kilometers to the east of Magambazi Hill, which is adjacent to the area covered by the Company’s four existing PLs in the Handeni District. | ||
On November 30, 2011, the Company completed the 2011 Acquisition Agreement and issued 15,000,000 restricted common shares to Handeni Resources as payment. As at November 30, 2011, the fair market price of the Company’s common stock was $0.11 per share; accordingly, the Company recorded a total fair market value of $1,650,000 as the mineral licenses acquisition cost. | ||
To comply with the laws and regulations of the Republic of Tanzania whereby foreign companies may not own PMLs, on July 19, 2012, the Company entered into an Addendum agreement to the 2011 Acquisition Agreement whereby Handeni Resources, on behalf of the Company, administers the 32 PMLs until such time as a mining license on the 32 PMLs (2.67 km2) have been allocated. During this period Handeni Resources is conducting exploration and mining activities on the PMLs as directed by the Company. | ||
| b) | Mkuvia Alluvial Gold Project, Tanzania, Africa | |
The Mkuvia Alluvial Gold Project was comprised of four PLs covering a total area of 380 square kilometers located in the Nachingwea District, Lindi Region of the Republic of Tanzania. The Company is aware that the four PLs expired during May and June of 2012. As at | ||
On January 13, 2015, the Company reached a binding settlement agreement with regards to its litigation with RCR (see Note |
10
Handeni Gold Inc.Notes to the Interim Consolidated Financial Statements as of February 28, 2015(Expressed in U.S. dollars)(Unaudited)
Property and Equipment |
| February 28, 2015 | May 31, 2014 | ||||||||||||
| Accumulated | Net Book | Net Book | |||||||||||
| Cost | Depreciation | Value | Value | ||||||||||
| $ | $ | $ | $ | ||||||||||
| Automobiles | 290,014 | 290,014 | - | 4,583 | |||||||||
| Camp and equipment | 197,011 | 196,934 | 77 | 42,242 | |||||||||
| Office furniture and equipment | 100,222 | 98,166 | 2,056 | 6,635 | |||||||||
| Software | 7,930 | 7,487 | 443 | 1,986 | |||||||||
| 595,177 | 592,601 | 2,576 | 55,446 | ||||||||||
| August 31, 2015 | May 31, 2015 | ||||||||||||
| Accumulated | Net Book | Net Book | |||||||||||
| Cost | Depreciation | Value | Value | ||||||||||
| $ | $ | $ | $ | ||||||||||
| Automobile vehicles | 230,879 | 230,879 | - | - | |||||||||
| Camp and equipment | 197,011 | 197,011 | - | - | |||||||||
| Office furniture and equipment | 100,222 | 99,543 | 679 | 1,252 | |||||||||
| Software | 7,930 | 7,930 | - | 222 | |||||||||
| 536,042 | 535,363 | 679 | 1,474 | ||||||||||
10
| Notes to the Interim Consolidated Financial Statements as of August 31, 2015 |
| (Expressed in U.S. dollars) |
| (Unaudited) |
| 8. | Related Party Transactions |
| a) | The Company has entered into the following facility agreements with related parties: |
| i) | On December 7, 2012, and as amended on September 4, 2013, | |
| ii) | On October 9, 2013, and as amended on June 18, 2014 and March 20, 2015, the Company entered into a facility agreement with Consultancy & Finance Company Associates Ltd. (“C&F”), a private company controlled by the Chairman of the Company. The funding is in the form of an interest free unsecured loan to the Company of up to $405,000 due | |
| iii) | On November 20, 2014, the Company entered into a facility agreement with C&F. The funding is in the form of an interest-free unsecured loan to the Company of up to $500,000 due May 31, 2017. As of |
Level 1 applies to assets or liabilities for which there are quoted prices in active markets for identical assets or liabilities.
Level 2 applies to assets or liabilities for which there are inputs other than quoted prices that are observable for the asset or liability such as quoted prices for similar assets or liabilities in active markets; quoted prices for identical assets or liabilities in markets with insufficient volume or infrequent transactions (less active markets); or model-derived valuations in which significant inputs are observable or can be derived principally from, or corroborated by, observable market data.
Level 3 applies to assets or liabilities for which there are unobservable inputs to the valuation methodology that are significant to the measurement of the fair value of the assets or liabilities.
Pursuant to ASC 820, the fair value of cash, restricted cash equivalent and restricted marketable securities are determined based on Level 1 inputs, which consist of quoted prices in active markets for identical assets. Management believes that the recorded values of all of the Company’s other financial instruments approximate their current fair values because of their nature and respective maturity dates or durations.
As at August 31, 2015, there were no liabilities measured at fair value on a recurring basis presented on the Company’s consolidated balance sheet. Assets measured at fair value on a recurring basis were presented on the Company’s consolidated balance sheet as of August 31, 2015, as follows:
| Fair Value Measurements Using | |||||||||||||
| Quoted Prices in | Significant | ||||||||||||
| Active Markets | Other | Significant | |||||||||||
| For Identical | Observable | Unobservable | Balance as of | ||||||||||
| Instruments | Inputs | Inputs | August 31, | ||||||||||
| (Level 1 | ) | (Level 2 | ) | (Level 3 | ) | 2015 | |||||||
| Assets: | |||||||||||||
| Cash | $ | 107,171 | $ | – | $ | – | $ | 107,171 | |||||
| Restricted cash equivalent | 13,045 | – | – | 13,045 | |||||||||
| Total assets measured at fair value | $ | 120,216 | $ | – | $ | – | $ | 120,216 | |||||
12
Handeni Gold Inc.Notes to the Interim Consolidated Financial Statements as of February 28, 2015(Expressed in U.S. dollars)(Unaudited)
| Notes to the Interim Consolidated Financial Statements as of August 31, 2015 |
| (Expressed in U.S. dollars) |
| (Unaudited) |
| 13. | Fair Value Measurements (continued) |
| |
|
| Fair Value Measurements Using | |||||||||||||
| Quoted Prices in | Significant | ||||||||||||
| Active Markets | Other | Significant | |||||||||||
| For Identical | Observable | Unobservable | Balance as of | ||||||||||
| Instruments | Inputs | Inputs | February 28, | ||||||||||
| (Level 1 | ) | (Level 2 | ) | (Level 3 | ) | 2015 | |||||||
| Assets: | |||||||||||||
| Cash | $ | 82,801 | $ | – | $ | – | $ | 82,801 | |||||
| Restricted cash equivalent | 13,806 | – | – | 13,806 | |||||||||
| Total assets measured at fair value | $ | 96,607 | $ | – | $ | – | $ | 96,607 | |||||
As at May 31, 2014,2015, there were no liabilities measured at fair value on a recurring basis presented on the Company’s consolidated balance sheet. Assets measured at fair value on a recurring basis were presented on the Company’s consolidated balance sheet as of May 31, 2014,2015, as follows:
| Fair Value Measurements Using | |||||||||||||
| Quoted Prices in | Significant | ||||||||||||
| Active Markets | Other | Significant | |||||||||||
| For Identical | Observable | Unobservable | Balance as of | ||||||||||
| Instruments | Inputs | Inputs | May 31, | ||||||||||
| (Level 1 | ) | (Level 2 | ) | (Level 3 | ) | 2014 | |||||||
| Assets: | |||||||||||||
| Cash | $ | 532,694 | $ | – | $ | – | $ | 532,694 | |||||
| Restricted cash equivalent | 26,522 | – | – | 26,522 | |||||||||
| Restricted marketable securities | 73,600 | – | – | 73,600 | |||||||||
| Total assets measured at fair value | $ | 632,816 | $ | – | $ | – | $ | 632,816 | |||||
| Fair Value Measurements Using | |||||||||||||
| Quoted Prices in | Significant | ||||||||||||
| Active Markets | Other | Significant | |||||||||||
| For Identical | Observable | Unobservable | Balance as of | ||||||||||
| Instruments | Inputs | Inputs | May 31, | ||||||||||
| (Level 1 | ) | (Level 2 | ) | (Level 3 | ) | 2015 | |||||||
| Assets: | |||||||||||||
| Cash | $ | 85,985 | $ | – | $ | – | $ | 85,985 | |||||
| Restricted cash equivalent | 13,858 | – | – | 13,858 | |||||||||
| Total assets measured at fair value | $ | 99,843 | $ | – | $ | – | $ | 99,843 | |||||
Segment Disclosures | |
|
The Company operates in one reportable segment, being the acquisition and exploration of mineral properties. Segmented information has been compiled based on the geographic regions that the Company and its subsidiary registered and performed exploration and administration activities. Assets by geographical segment are as follows:
| Canada | Tanzania, Africa | Total | ||||||||
| Current assets | $ | 98,930 | $ | 59,051 | $ | 157,981 | ||||
| Restricted cash equivalent | 13,045 | - | 13,045 | |||||||
| Mineral licenses | - | 1,650,000 | 1,650,000 | |||||||
| Equipment, net | - | 679 | 679 | |||||||
| Total assets, at August 31, 2015 | $ | 111,975 | $ | 1,709,730 | $ | 1,821,705 |
| Canada | Tanzania, Africa | Total | ||||||||
| Current assets | $ | 50,169 | $ | 73,610 | $ | 123,779 | ||||
| Restricted cash equivalent | 13,806 | - | 13,806 | |||||||
| Mineral licenses | - | 1,650,000 | 1,650,000 | |||||||
| Equipment, net | 895 | 1,681 | 2,576 | |||||||
| Total assets, at February 28, 2015 | $ | 64,870 | $ | 1,725,291 | $ | 1,790,161 | ||||
| Canada | Tanzania, Africa | Total | ||||||||
| Current assets | $ | 147,957 | $ | 434,139 | $ | 582,096 | ||||
| Restricted cash equivalent | 26,522 | - | 26,522 | |||||||
| Restricted marketable securities | 73,600 | - | 73,600 | |||||||
| Mineral licenses | - | 1,650,000 | 1,650,000 | |||||||
| Property and equipment, net | 4,061 | 51,385 | 55,446 | |||||||
| Total assets, at May 31, 2014 | $ | 252,140 | $ | 2,135,524 | $ | 2,387,664 |
| Canada | Tanzania, Africa | Total | ||||||||
| Current assets | $ | 61,447 | $ | 63,595 | $ | 125,042 | ||||
| Restricted cash equivalent | 13,858 | - | 13,858 | |||||||
| Mineral licenses | - | 1,650,000 | 1,650,000 | |||||||
| Equipment, net | 332 | 1,142 | 1,474 | |||||||
| Total assets, at May 31, 2015 | $ | 75,637 | $ | 1,714,737 | $ | 1,790,374 |
13
Item 2. Management’s Discussion and Analysis of Financial Condition and Results of Operations
| Item 2. | Management’s Discussion and Analysis of Financial Condition and Results of Operations |
The following discussion of our financial condition, changes in financial condition and results of operations for the three months and nine months ended February 28,August 31, 2015 and 2014 should be read in conjunction with our unaudited interim financial statements and related notes for the three months and nine months ended February 28,August 31, 2015 and 2014 included herewith and our audited consolidated financial statements as at May 31, 2014, May 31, 20132015 and for the period from inception (January 5, 2004) to May 31, 2014 included in our Annual Report on Form 10-K for our fiscal year ended May 31, 20142015 as filed with the SEC. All financial information in this Management’s Discussion and Analysis (“MD&A” or the “discussion”) is expressed and prepared in conformity with U.S. generally accepted accounting principles. All dollar references are to the U.S. dollar, the Company’s reporting currency, unless otherwise noted. Some numbers in this MD&A have been rounded to the nearest thousand for discussion purposes.
FORWARD-LOOKING STATEMENTS
This MD&A contains forward-looking statements that involve risks, uncertainties and assumptions with respect to the Company’s activities and future financial results, which are made based upon management’s current expectations and beliefs. These forward-looking statements involve risks and uncertainties, including statements regarding the Company’s capital needs, business plans and expectations. Our actual results may differ materially from those anticipated in these forward-looking statements as a result of many factors, including, but not limited to, those set forth under “Risk Factors” and elsewhere in this annual report. Any statements contained herein that are not statements of historical facts may be deemed to be forward-looking statements. Management disclaims any obligation to publicly update these statements, or disclose any difference between its actual results and those reflected in these statements. Given these uncertainties, readers are cautioned not to place undue reliance on such forward-looking statements.
Overview
We are engaged in the acquisition and exploration of mineral properties. Our principal area of focus is the Handeni Gold Project located in the Handeni district, within the Tanga region of the Republic of Tanzania in East Africa, in which we have interests in mineral claims through prospecting licenses (“PLs”) and/or primary mining licenses (“PMLs”) issued by the government of the Republic of Tanzania. None of our mineral claims contain any substantiated mineral deposits, resources or reserves of minerals to date. Exploration has been carried out on these claims, in particular the eight PLs in the Handeni District. Accordingly, additional exploration of these mineral claims is required before any conclusion can be drawn as to whether any commercially viable mineral deposit may exist on any of our mineral claims. Our plan of operations is to continue exploration and drilling work when funds are available in order to ascertain whether our mineral claims warrant further advanced exploration to determine whether they possess commercially exploitable deposits of minerals. We will not be able to determine whether or not any of our mineral claims contain a commercially exploitable mineral deposit, resource or reserve, until appropriate exploratory work has been completed and an economic evaluation based on that work concludes economic viability.
We are considered an exploration or exploratory stage company, because we are involved in the examination and investigation of land that we believe may contain valuable minerals, for the purpose of discovering the presence of ore, if any, and its extent. There is no assurance that a commercially viable mineral deposit exists on the properties underlying our mineral claim interests, and considerable further exploration will be required before a final evaluation as to the economic and legal feasibility for our future exploration is determined.
Our Mineral Claims
Handeni District Gold Project
Location and Access
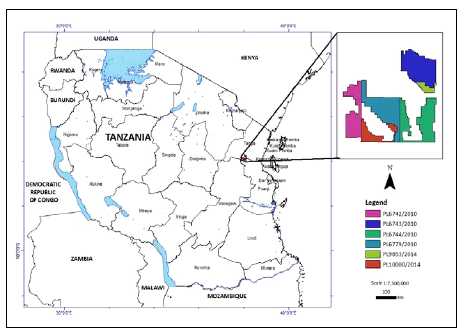
The Handeni Gold properties lie within the historic Handeni artisanal gold mining district, located in Tanga Province, roughly 175 km northwest of Tanzania’s largest city, Dar Es Salaam, and 100 km southwest of the more northerly coastal city of Tanga (Fig. 1). The road from Dar Es Salaam to Tanga is paved; the secondary road that heads northwest from this road to the town of Handeni, a distance of 65 km, has recently been paved. The Handeni property is located roughly 35 km south of the town of Handeni along a secondary gravel road. From this point, a number of dirt roads head south across various portions of the Handeni property and beyond. Driving time from Dar Es Salaam to the Handeni Gold properties is approximately five hours, depending on traffic and the weather.
20
Fig. 1: Location Map: Handeni Property in Tanzania.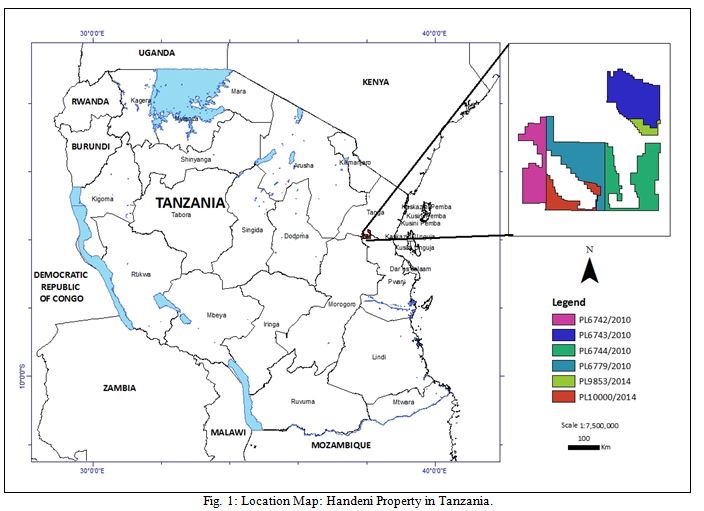
Prospecting Licenses (PLs)
Currently, our primary focus is on the undivided 100% legal, beneficial and registerable interest in and to eight PLs, located in the Handeni District of Tanzania. The total area held by the Company in the Handeni district is now 423.03 km2 (Fig. 2) (Table 1).
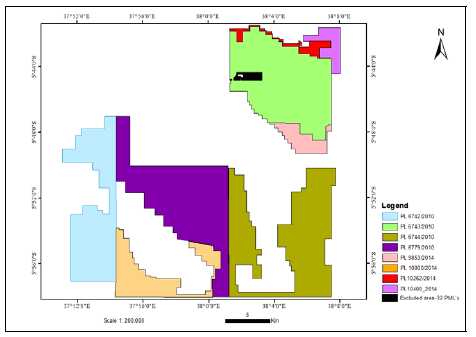
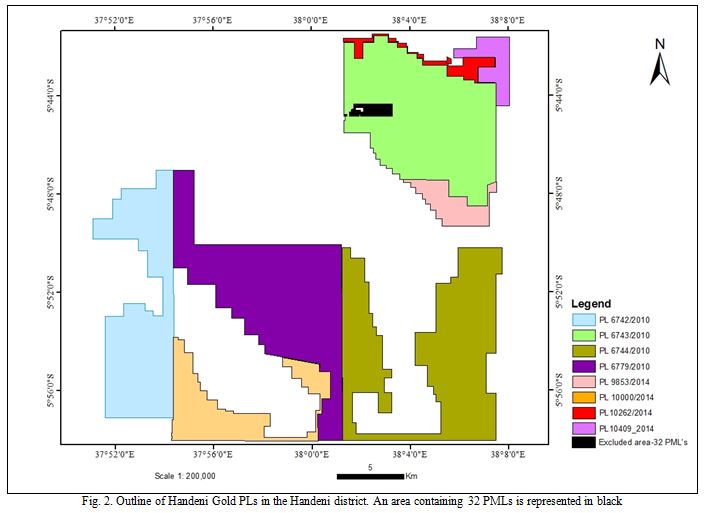
Fig. 2. Outline of Handeni Gold PLs in the Handeni district.
21
Table 1: List of Prospecting Licenses, Handeni Property (prior to the 2013 renewal of the licenses)
| PL No. | Area (Sq Km) | Issue Date | Original Recipient | Transfer Date (To IPP Gold) | Transfer Date (To Gold) | Expiry Date | Renewal Date |
| 6742/2010 | 197.98 | 05/10/10 | Diamonds Africa Ltd. | 18/11/10 | 12/12/10 | 04/10/13 | 05/10/13 |
| 6743/2010 | 195.48 | 13/10/10 | Gold Africa Ltd. | 18/11/10 | 12/12/10 | 12/10/13 | 13/10/13 |
| 6744/2010 | 198.70 | 13/09/10 | M-Mining Ltd. | 18/11/10 | 12/12/10 | 12/09/13 | 13/09/13 |
| 6779/2010 | 197.74 | 13/09/10 | Tanzania Gem Center Ltd. | 18/11/10 | 12/12/10 | 12/09/13 | 13/09/13 |
21
Following the 2013 renewal of the properties and acquisition of PLs in the current period, the Company now holds interests in PLs with details as described in Table 2.2, below.
Table 2: Handeni Gold Prospecting Licenses December 2, 2014
| PL Number | Granted Date | Expiry Date | Area Size (km2) |
| 6742/2010 6743/2010 6744/2010 6779/2010 9853/2014 10000/2014 10262/2014 10409/2014 | 5/10/2013 13/10/2013 13/9/2013 13/9/2013 2/7/2014 22/7/2014 25/9/2014 02/12/2014 | 4/10/2016 | |
12/10/2016 | |||
12/9/2016 | |||
12/9/2016 | |||
1/7/2018 | |||
21/7/2018 | |||
24/9/2018 | |||
01/12/2018 | 70.32 95.08 97.56 96.84 12.32 33.62 6.97 10.32 | ||
Primary Mining Licenses (PMLs)
On November 30, 2011, the Company acquired from Handeni Resources a 100% interest in primary mining licenses covering an area of approximately 2.67 square kilometers to the east of Magambazi Hill (Figs. 2 and 3). To comply with the laws and regulations of the Republic of Tanzania whereby foreign companies may not own PMLs, on July 19, 2012, the Company:
| (1) | entered into an Addendum agreement to the 2011 Acquisition Agreement whereby Handeni Resources will administer the 32 PMLs until such time as a mining license (“ML”) on the 32 PMLs (2.67 km2) have been allocated; and | |
| (2) | during this period Handeni Resources will be conducting exploration and mining activities on the PMLs as directed by the Company. |
An enlargement of the “excluded area” as delineated on Fig. 12 is presented below (Fig. 3). Ownership of a single, isolated claim block, depicted in fuchsia, remains uncertain; and which is something that IPP Gold andAn area within the Company are attempting to ascertain. Ownershipoutline of the smaller, rectangular block that overlies the CRI-Company boundary also remains unknown; and which again is another matter that IPP Gold and the Company are currently pursuing.32 PML’s without a PML number (Fig. 3) has now been confirmed to be part of PL6743/2010. The remaining block of 32 PMLs, shown as a grid of blue linesin grey below, belongs to the Company as described above.above and are being explored
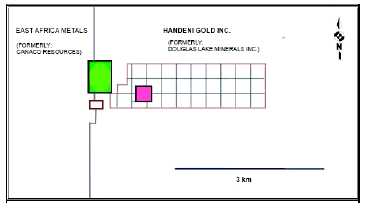
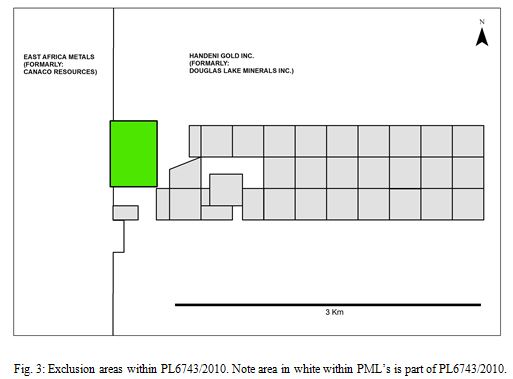
Fig. 3: Exclusion areas within PL6743/2010.
22
West of the western border of PL 6743/2010 are several more PMLs that do not belong to the Company. The area colored in green (Fig. 3) is a unitized block of four PMLs that were apparently acquired by Canaco Resources Inc. (“CRI”) (now East Africa Metals Inc.) from their owners.
Handeni District Project
We obtained a Technical Report on the Handeni Property (the “Handeni Report”), dated April 25, 2011, as prepared at our request by Avrom E. Howard, MSc, FGA, PGeol (Ontario), Principal Consultant at Nebu Consulting LLC. Mr. Howard is a Qualified Person in accordance with Canadian National Instrument 43-101 “Standards for Disclosure of Mineral Projects” and its Companion Policy (collectively, “NI 43-101”) and is a Practicing Professional Geologist registered with the Association of Professional Geoscientists of Ontario (registration number 0380).
22
Subsequent to the publishing of the April 25, 2011 NI 43-101 report by Mr. Howard, the Company produced numerous in-house technical reports and is in the process of compiling an updated NI 43-101 report that will include the updated model for mineralization on our Handeni property. The drilling conducted by the Company was done implementing and following Quality Control and Quality Assessment procedures recommended by SRK (Stephen, RoberstsonRobertson and Kirsten).
Property Description
General
Mining in Tanzania in the modern era dates back over one hundred years, first under German colonial rule and then under British control under whose authorityExploration, mining and otherrelated activities continuedis regulated and expanded. Beginning in the 1990s, in line with many other developing countries around the world, the Tanzanian government instituted several reforms to move towards a free market economy, privatize the mining industry and encourage both domestic and foreign investment in all economic sectors. In the case of the mining industry, this was supplemented, in 1998, through the passage of a new, more industry-friendly mining code. This code has been streamlinedcontrolled under the Mining Act of 1998 (revised in 2010) (the “Mining Act”) currently controlling exploration, mining and related activities in the country.
. Tanzania is Africa’s fourth leading gold producer, with several major companies producing and exploring for gold, mostly in northwestern Tanzania, south of Lake Victoria, in an area informally known as the Lake Victoria gold belt.
The Handeni Property
Gold has been known in the Handeni area for many years with some attributing its discovery to the Germans prior to World War One; however, it was theThe increase in gold prices at the turn of the century and consequent increase in artisanal gold mining activity in the Handeni area that led to the discovery of larger deposits of placer gold, in turn leading in 2003 to a classic gold rush. The discovery and mining of lode deposits followed, soon after, along with the growth of a shanty mining town at the northern base of Magambazi Hill.
Between 2005 and 2010, IPP Gold carried out exploration over its PLR leading to the upgrading of its holdings from one PLR to four PLsPL’s of 800 km2, in August 2010. Exploration work included airborne magnetic and radiometric surveys, ground magnetic surveys, reconnaissance geological mapping, soil sampling, pitting and trenching. It is these four PLs that were acquired by the Company from IPP Gold.Gold under a September 2010 agreement.
Geological Setting
Regional Geology
Regional geological mapping programs led to the recognition of several major litho-structural provinces from Archean to recent age in Tanzania. The Archean craton covers most of the western two thirds of the country, roughly bounded to the east by the East African Rift. Archean rocks host all of the country’s kimberlite pipes and contained lode diamond deposits, and most of its lode gold deposits. The Archean basement terrain is bounded to the east and west by a series of Proterozoic mobile belts; this area, particularly that to the east, hosts most of the country’s wide variety of colored gemstone deposits. Some recent research suggests that portions of this assumed Proterozoic terrane may actually consist of Archean crust that has undergone a later phase of higher grade metamorphism.
The Handeni district forms part of the Tanzanian Mozambique belt. The belt was subjected to four tectonothermal events at 830-800Ma, ~760Ma, 630-580Ma and 560-520Ma. All except the last attained upper amphibolites / granulite grade.
Property Geology
The Handeni area is situated in the Palaeoproterozoic, Usugaran/Ubendian Metamorphic Terrane of Tanzania, along the northern extension of the north-trending Proterozoic Mozambique Mobile Belt.
The geology of the Handeni area comprises amphibolite to granulite facies metamorphic rocks interpreted to originally have formed a sequence of ultramafic to felsic volcanic flows, black shales and quartz-bearing sedimentary rocks. It is furthermore interpreted to comprise a metamorphosed/overprinted eastern extension/remnant of the Lake Victoria cratonic greenstone belt. High grade metamorphism has converted these original lithologies to a variety of metamorphic equivalents, including biotite-hornblende-garnet-pyroxene gneiss, migmatitic augen garnet- hornblende-pyroxene gneiss, quartzo-feldspathic hornblende-biotite-pyroxene gneiss, pyroxene-hornblende-biotite-garnet granulite and others.
23
Recent research by geologists from the University of Western Australia suggests that much of what has previously been considered to be of Proterozic age (Usagaran System) may in fact be overprinted Archean crust. This hypothesis has been invoked to help interpret the geology within which gold in this area is found and as the basis for an analogy between this gold mineralization and that found in less metamorphosed, bona fide Archean rocks in the Lake Victoria gold district, a few hundred km to the northwest. However, this is a hypothesis, only, one that may be used for exploration modeling purposes but one that still requires more work.
Mineralization
The Handeni property is at an early stage of exploration. There are no known mineral resources or reserves on the Handeni property, nor are there any known economically mineable deposits on the property. Gold is found within garnet-amphibolite zones within biotite-feldspar gneiss at three k n o w n locations in the Company’s property, locations where historical lode gold occurrences have been documented. Gold occurs in quartz veins as well as within the garnet amphibolites adjacent to the quartz veins. Proof of this association is informally corroborated by the testimony of local, illegal artisanal miners, who apparently recover gold both from quartz veins and gold-bearing gneiss that is not quartz vein bearing. Gold in the Company’s property has also been documented in soils and placers, at a variety of locations, as well. Recent exploration increased
Our geophysical and structural geological interpretation on which the Company’s number of targets with known gold occurrences to six. Our drilling program conducted in 2012 was based, supported the mineralization model.model described above in broad terms.
23
Whereas gold was known in the Handeni area prior to the arrival in 2005 of the Company’s predecessor, IPP Gold, there is no history of any formal exploration in the area aside from limited work at Magambazi Hill itself.
The foundation for modern exploration activities onitself and the Company’s properties were laid by the exploration work conducted in recent years by IPP. Their initial work consisted of soil sampling and a ground magnetic survey over an area of 200 square kilometers coveringCanaco (East African Metals) in the area now located within PL6743/2010 immediately east of Magambazi Hill. Over the five years that ensued, this was followed by a series of exploration campaigns involving a variety of exploration methods, in turn followed by interpretation and further work in an iterative fashion. Notable programs during this period included an airborne Magnetic and Radiometric Survey, a ground magnetic survey, geological mapping and structural interpretation as well as several large soil sampling and geochemical surveys.region
Handeni Gold’s intensive early exploration program following the Company’s September 2010 agreement with IPP achieved the following:following in terms of mineralization on the properties:
| • | It outlined a number of locations where intensive placer and illegal artisanal gold mining took place within the Handeni property, notably the Kwandege, Magambazi and Mjembe areas. |
| |
| |
| |
|
The 2011 – 2012 exploration period used the foregoing as a basis and the following was conducted:
| • | A helicopter based TEM electromagnetic and radiometric aerial survey program |
| |
| |
| |
| |
| • | Twenty-eight (28) diamond core holes (5,347 meters) were drilled on the Magambazi East and related targets and delineated a gold enriched mineralization zone extending for a distance of approximately 500 meters to the south east of the Magambazi Hill mineralization as defined by CRI. |
24
| |
| • |
|
| |
|
| ||
| ||
| ||
| ||
| ||
|
An important feature of the Kwandege target is the fact that low level gold values (0.5 g/t to 1 g/t) were encountered in numerous intersections in the drill holes and also confirmed by the latest assay results. Anomalous gold with some potentially economic intersections have been encountered in an E - W (strike) direction of 1,501 meters (based on the results of the completed phase 1 drilling program). The open ended nature of the mineralization in an E-W direction was confirmed.
Exploration Activities.
The company’s exploration activities are mainly focused on delineating a hard-rock based economic deposit, but it also includes efforts to outline an economically viable alluvial (in broad terms) gold deposit/s.
| |
| • | The results of the soil sampling program on Target 5 |
During the 2013 – 2014 periods up to date we achieved the following:
| |
| • |
|
|
25
The following conclusions were drawn from the alluvial program:
| a) | The fluvial environment has the largest potential for the extraction of coarse grained | |
| b) | A large proportion of gold is contained as fine grained gold. This conclusion | |
| c) | Some specific horizons in the fluvial horizon yield higher values than others. | |
| d) | Allowing for a mere 50% efficiency of the applied processes, the overburden, the grade as well as consistency of gold on |
The exploration results on our Mjembe target defined a significant potential gold mineralization zone with a high correlation between geochemical, structural and geophysical data. Mjembe will be the Company’s primary target during the 2015/2016 field season. The potential of this area has been exploited by illegal artisanal miners.
Exploration conducted during the fiscal year 2015:
| • |
|
| • |
|
| |
| • |
|
| |
| |
| • |
|
| ||
|
| |
| • |
|
| |
| |
| |
| |
| |
|
2624
• |
|
• | Target 10 has been mapped in detail and 674 soil samples taken of which 149 were selected based on our XRF screening technique. Although some elevated gold values were obtained the Company will follow this area up utilizing a newly developed assay technique developed and successfully applied to target |
• | Mapping and |
• |
|
• | Detail geological mapping |
• | Further detailed mapping was conducted on Target 16. This was followed by gold assays using specialized geochemical techniques to test the potential of increasing the effectivity of the Company’s soil sampling program. The results were highly successful and the Company will implement this technique on Target 10 |
• | Exploration conducted during the first quarter of fiscal year 2016. |
• | A limited grab sampling program was conducted on illegal artisanal sites within the Mjembe target. The results of this |
• |
|
• | Mapping of the Gole structure is continuing as announced. |
• | XRF analyses and evaluation of drill core on |
• | An updated NI-43_101 is being compiled. |
Compliance with Government Regulation
We are subject to local laws and regulation governing the exploration, development, mining, production, importing and exporting of minerals; taxes; labor standards; occupational health; waste disposal; protection of the environment; mine safety; toxic substances; and other matters. We require licenses and permits to conduct exploration and mining operations. Amendments to current laws and regulations governing operations and activities of mining companies or more stringent implementation thereof could have a material adverse impact on our Company. Applicable laws and regulations will require us to make certain capital and operating expenditures to initiate new operations. Under certain circumstances, we may be required to close an operation once it is started until a particular problem is remedied or to undertake other remedial actions. This would have a material adverse effect on our results and financial condition.
Four of our mineral interests in Tanzania are currently held under PLs granted pursuant to the Mining Act for an initial period of three years and are renewable in two successive periods of two years only. The remaining four PL’s are being held under the 2010 Mining Act and are valid for an initial period of 4 years (the initial period expiring in 2018 (Table 2)). Following this the first renewal is for 3 years and the second renewal for 2 years, each renewal accompanied by a mandatory relinquishment of at least 50% of the license area. The application fees are $300 on initial application and $300 for each renewal. There is a preparation fee of $500 applicable on each license. The annual rent for the licenses are $100/km2 (initial period), $150/km2 (1st renewal) and $200/km2 (2nd renewal).
All PLs in Tanzania require the holder to employ and train local residents, typically amounting to $5,000 per year, and make exploration expenditures, as set out in the Mining Act. At each renewal, at least 50% of our licensed area must be relinquished. If we wish to keep the relinquished one-half portion, we must file a new application for the relinquished portion.
The geographical area covered by a PL may contain one or more previously granted PML’s. A PML is a mining license granted only to a Tanzanian citizen consisting of an area of not to exceed 10 hectares. Once a PL is granted, no additional PMLs can be granted within the geographical area covered by the PL. The PL is subject to the rights of previously granted and existing PMLs. The holder of a PL will have to work around the geographical area of the PML unless the PL holder acquires the PML and any rights to the land covered by the PML.
We must hold a mining license to carry out mining activities, which are granted only to the holder of a PL covering a particular area. A mining license is granted for a period of 25 years or the life of the mine. It is renewable after 10 years for a period not exceeding 15 years. Other than the PMLs being held under Handeni Resources, we do not hold any mining licenses, only PL’s. An application for the 32 PMLs being held under agreement by Handeni Resources to be changed into a mining license (ML) is underway. Prospecting and mining license holders must submit regular reports in accordance with mining regulations. Upon commercial production, the government of Tanzania imposes a royalty on the gross value of all production at the rate of 3% of all gold produced. The applicable regulatory body in Tanzania is the Ministry of Energy and Minerals.
25
In July 1999, environmental management and protection regulations under the Mining Act came into force. An environmental impact statement and an environmental management plan must accompany special mining license, mining license and gemstone mining license applications for mineral rights. In addition to the establishment of environmental regulations, the Tanzanian government has improved management procedures for effective monitoring and enforcement of these regulations by strengthening the institutional capacity, especially in the field offices. The government has provided rules for the creation of reclamation funds to reinstate land to alternative uses after mining and it has developed guidelines for mining in restricted areas, such as forest reserves, national parks, near sources of water and other designated areas. These regulations have not had any material effect on our operations to date.
Competition
We operate in a highly competitive industry, competing with other mining and exploration companies, and institutional and individual investors, which are actively seeking minerals exploration properties throughout the world together with the equipment, labour and materials required to exploit such properties. Many of our competitors have financial resources, staff and facilities substantially greater than ours. The principal area of competition is encountered in the financial ability to cost effectively acquire prime minerals exploration prospects and then exploit such prospects. Competition for the acquisition of minerals exploration properties is intense, with many properties available in a competitive bidding process in which we may lack technological information or expertise available to other bidders. Therefore, we may not be successful in acquiring, exploring and developing profitable properties in the face of this competition. No assurance can be given that a sufficient number of suitable minerals exploration properties will be available for acquisition, exploration and development.
27
Employees
Other than our directors and executive officers, we had approximately fiveapproximate four full-time equivalent employees and consultants as of February 28,August 31, 2015 all located in Tanzania. We also retainutilize independent geologists and consultants on a contract basis to conduct the work programs on our mineral properties in order to carry out our plan of operations.
Research and Development Expenditures
We have not incurred any research or development expenditures since our incorporation.
Subsidiaries
The Company has two subsidiaries, both of which are Tanzanian companies: (i) HG Limited (formerly DLM Tanzania Limited); and (ii) Douglas Lake Tanzania Limited, which is inactive.
Plan of Operations
Our plan of operations through our fiscal year ending May 31, 20152016 is to continue to focus on the exploration of our Handeni mineral property in Tanzania, and the budget for this plan requires approximately $0.8$0.6 million for our plan of the exploration work, $100,000 for mineral licenses fees and $0.9a minimum of $0.6 million for our general and administration expenses, professional and consulting fees and other operating expenses.
Handeni Gold Inc. has clearly identifiable goals for its exploration program in Tanzania:
a) | As previously reported the Company will focus on its regional target identification for the remainder of the fiscal year 2016 on the Gole 11 km by 4.5 km sheath fold, a feature with a combination of geological elements rendering it having high potential for gold mineralization based on experience in the district. This will conclude the Company’s regional target identification program in the Handeni area. |
b) | Continue exploration on drill targets simultaneously with the completing of the regional program. |
c) | Reduce the Company’s license holding in the Handeni district significantly by the end of the fiscal year 2016 to include only identified drill targets. |
d) | Continue efforts to secure funding for drilling on drill targets. |
Illegal artisanal activity on the Company’s license areas is increasing. The Company is addressing this issue with responsible local and central government authorities. The Company will follow all available legal structures to protect its interests.
Other low cost exploration activities being conducted on a continuous basis on the Company’s Handeni licenses include:
a) | Identification of potential alluvial mining areas other than those currently known and being evaluated by utilizing remote sensing activities. |
b) | A detailed interpretation of already collected geophysical data, specifically aimed at Target 8 and the Mjembe target. |
26
c) | A petrological, geochemical and mineralogical investigation of the Kwandege drill core to understand the style of gold mineralization at this locality. |
d) | The planning and siting of drill holes as a follow up Reverse Circulation program to evaluate the near – surface potential of the Kwandege target. |
The estimated budget for the completion of these exploration programs is provided below:
| EXPLORATION WORK | BUDGET (US$) | ||
| Ground Geophysics | 10,000 | ||
| Mapping, trenching, sampling, etc. | 20,000 | ||
| Drilling | 350,000 | ||
| Geologists, field personnel and general exploration | 150,000 | ||
| Sundry & contingencies | 50,000 | ||
| TOTAL | $ | 580,000 |
At August 31, 2015, we had cash of $107,000 and a working capital of $105,000. In addition, we have a total of $150,000 funds available to be withdrawn pursuant to a facility agreement with a related party. As such, we estimated that we will still need a minimum of $900,000 additional funds in order to cover our planned operations over the fiscal year ending May 31, 2016. Our actual expenditures may exceed our estimations.
We anticipate that we will not generate any revenues for so long as we are an exploration stage company. Accordingly, we will be required to obtain additional financing in order to pursue our plan of operations.
Exploration related activities currently under way on the Company’s Handeni licenses include:
| ||
| ||
| ||
| ||
| ||
| ||
| ||
| ||
|
The estimated budget for the completion of these exploration programs is provided below:
At February 28, 2015, we had cash of $83,000 but a working capital deficit of $1,490,000. On November 20, 2014, the Company entered into a facility agreement with a related party. The funding is in the form of an interest free unsecured loan to the Company of up to $500,000 due May 31, 2017. As of the date of this report, the Company has received $125,000 pursuant to this facility agreement. In addition, the Company has $1.125 million in loans from related parties due June 30, 2015.
We assume such related parties’ loans to the Company from the Company’s major shareholder will not be demanded for repayment at the due date. As such, we estimate that we will still need a minimum of $1.1 million additional funds in order to cover our planned operations over the fiscal year ending May 31, 2015. Our actual expenditures may exceed our estimations.
28
We believe that external debt financing will not be an alternative for funding our next fiscal year exploration, as we do not have significant tangible assets to secure any debt financing. Therefore, we anticipate that additional funding will be in the form of equity financing from the sale of our common stock and/or related parties debt financing. We cannot provide investors with any assurance that we will be able to obtain sufficient financing to fund our acquisition and exploration program going forward. In the absence of sufficient funding, we will not be able to continue acquisition and exploration of mineral claims and we will be forced to abandon our mineral claims and our plan of operations. Even if we are successful in obtaining financing to fund our acquisition and exploration program, there is no assurance that we will obtain the funding necessary to pursue any advanced exploration of any mineral claims.
Results of Operations
We have had no operating revenues and accumulated net loss of $117 million since our inception (January 5, 2004) to February 28,August 31, 2015. The following table sets out our losses from operations for the periods indicated:
| For the Three Months Ended, | For the Nine Months Ended, | |||||||||||||||||
| February 28, 2015 | February 28, 2014 | February 28, 2015 | February 28, 2014 | For the Three Months Ended, | ||||||||||||||
| August 31, 2015 | August 31, 2014 | |||||||||||||||||
| Revenue | $ | - | $ | - | $ | - | $ | - | $ | - | $ | - | ||||||
| Expenses | ||||||||||||||||||
| Consulting fees | 3,610 | - | 14,530 | 22,500 | 1,350 | 5,850 | ||||||||||||
| Depreciation | 14,557 | 46,320 | 52,719 | 143,971 | 795 | 22,206 | ||||||||||||
| Exploration expenses | 35,925 | 70,678 | 174,245 | 180,885 | 20,303 | 45,577 | ||||||||||||
| Gain on disposal or write-down of equipment | - | - | (20,058 | ) | (2,820 | ) | ||||||||||||
| General and administrative | 110,450 | 138,281 | 340,655 | 382,309 | 47,868 | 125,760 | ||||||||||||
| Interest expense | 28,638 | 23,469 | 82,795 | 58,595 | 36,007 | 26,987 | ||||||||||||
| Professional | 57,198 | 16,008 | 107,013 | 52,290 | 3,347 | 32,503 | ||||||||||||
| Rent | 332 | 17,871 | 58,875 | 70,216 | 36,411 | 48,215 | ||||||||||||
| Travel and investor relations | 4,871 | 9,508 | 32,037 | 14,695 | 165 | 1,134 | ||||||||||||
| Total Expenses | 255,581 | 322,135 | 842,811 | 922,641 | 146,246 | 308,232 | ||||||||||||
| Loss From Operations | (255,581 | ) | (322,135 | ) | (842,811 | ) | (922,641 | ) | (146,246 | ) | (308,232 | ) | ||||||
| Other Income (Expenses) | ||||||||||||||||||
| Impairment of marketable securities | (53,600 | ) | - | (140,000 | ) | (1,000,000 | ) | |||||||||||
| Loss on marketable securities | (20,000 | ) | - | (20,000 | ) | - | ||||||||||||
| Gain on disposal of equipment | 10,000 | 20,209 | ||||||||||||||||
| Interest income | 28 | 61 | 123 | 216 | 12 | 64 | ||||||||||||
| Total other (Expenses) / Income | (73,572 | ) | 61 | (159,877 | ) | (999,784 | ) | |||||||||||
| Total other Income | 10,012 | 20,273 | ||||||||||||||||
| Net Loss | (329,153 | ) | (322,074 | ) | (1,002,688 | ) | (1,922,425 | ) | $ | (136,234 | ) | $ | (287,959 | ) | ||||
27
Three Months Ended February 28,August 31, 2015 Compared to Three Months Ended February 28,August 31, 2014
Our net loss for the three months ended February 28,August 31, 2015 was $329,000,$136,000, compared to $322,000$288,000 for the same period ended February 28,August 31, 2014, the difference is mainly due to $53,600 permanent impairment of marketable securities and loss on marketable securities of $20,000 recorded during the three months ended February 28, 2015 and the following operation expenses changes.
Our operating expenses for the three months ended February 28,August 31, 2015 decreased by $67,000$162,000 to $255,000$146,000 from $322,000$308,000 for the same period ended February 28,August 31, 2014, and the main changes are as follows:
our general and administrative fees decreased by $28,000 to $110,000 during the period ended February 28, 2015 (2014 - $138,000), primarily due to continuing cost management; At February 28, 2015, approximately $423,000 (May 31, 2014 - $278,000) of general and administrative fees remained as payables due to related parties;
our exploration expenses decreased by $35,000 to $36,000 during the three months ended February 28, 2015 (2014 - $71,000) mainly due to our reduced exploration and drilling activities caused by our funding limitations;
depreciation fees decreased by $32,000 to $14,000 during the three months ended February 28, 2015 (2014 - $46,000) mainly because the majority of our equipment was fully depreciated;
29
interest expenses increased by $5,000 to $28,000 during the three months ended February 28, 2015 (2014 - $23,000), which represented deemed interest on an interest free unsecured loan from a related party. Such deemed interest was recorded as donated capital;
our professional fees increased by $41,000 to $57,000 during the three months ended February 28, 2015 (2014 - $16,000) primarily due to increased legal fees on the RC litigation;
our rent expenses decreased by $18,000 during the three months ended February 28, 2015 compared to the same period ended February 28, 2014 mainly because our Vancouver office lease expired and our Tanzania office has been moved to a smaller space; and
our travel and investor relations expenses decreased by $5,000 to $5,000 during the three months ended February 28, 2015 (2014 - $10,000) primarily due to less travel expenses incurred for investors relations.
Nine Months Ended February 28, 2015 Compared to Nine Months Ended February 28, 2014
Our net loss for the nine months ended February 28, 2015 was $1,003,000, compared to $1,922,000 for the same period ended February 28, 2014, the difference mainly due to $860,000 additional permanent impairment of marketable securities recorded during the nine months ended February 28, 2014.
Our operating expenses for the nine months ended February 28, 2015 decreased by $80,000 to $843,000 from $923,000 for the same period ended February 28, 2014, and the main changes are as follows:
our consulting, general and administrative fees decreased by $50,000 to $355,000 during the nine months ended February 28, 2015 (2014 - $405,000), primarily due to continuing cost management; At February 28, 2015, approximately $423,000 (May 31, 2014 - $278,000) of general and administrative fees remained as payables due to related parties;
our exploration expenses decreased slightly by $7,000 to $174,000 during the nine months ended February 28, 2015 (2014 - $181,000) mainly due to decreased exploration activities caused by our funding limitations;
depreciation fees decreased by $91,000 to $53,000 during the nine months ended February 28, 2015 (2014 - $144,000) mainly because the majority of our equipment was fully depreciated;
gain on disposal of equipment increased by $17,000 to $20,000 during the nine months ended February 28, 2015 (2014 - $3,000) mainly due to vehicle and office furniture disposal in our subsidiary in Tanzania.
interest expenses increased by $24,000 to $83,000 during the nine months ended February 28, 2015 (2014 - $59,000), which represented deemed interest on an interest free unsecured loan from a related party. Such deemed interest was recorded as donated capital;
our professional fees increased by $55,000 to $107,000 during the nine months ended February 28, 2015 (2014 - $52,000) primarily due to increased legal fees on the RC litigation and additional audit fees in Tanzania related to our subsidiary’s value added tax recovery;
our rent decreased by $11,000 to $59,000 during the nine months ended February 28, 2015 (2014: $70,000) representing 60% of rental expense associated with renting our Chief Executive Officer’s family house in Tanzania pursuant to the Executive Services Agreement, offset by a significant decrease on the rent on our Tanzania office as a result of moving to a small office and Vancouver office lease expiry; and
our travel and investor relations expenses increased by $17,000 to $32,000 during the nine months ended February 28, 2015 (2014 - $15,000) primarily due to travel expenses incurred for an in-person Board of Directors meeting held in Dar er Salaam, Tanzania.
• | our consulting, general and administrative fees decreased by $82,000 to $49,000 during the period ended August 31, 2015 (2014 - $132,000), primarily due to fund limitation and continuing cost management; effective June 1, 2015, the Company has stopped incurring directors’ fees and the CEO service fees; At August 31, 2015, $451,000 (May 31, 2015 - $455,000) of general and administrative fees remained as long term liabilities due to related parties; | |
• | our exploration expenses decreased by $25,000 to $20,000 during the three months ended August 31, 2015 (2014 - $45,000) mainly due to our further reduced exploration and drilling activities caused by our funding limitations; | |
• | depreciation fees decreased by $21,000 to $1,000 during the three months ended August 31, 2015 (2014 - $22,000) mainly because the majority of our equipment was fully depreciated; | |
• | interest expenses increased by $9,000 to $36,000 during the three months ended August 31, 2015 (2014 - $27,000), which represented deemed interest on increased interest free unsecured loans from related parties. Such deemed interest was recorded as donated capital; | |
• | our professional fees decreased by $29,000 to $3,000 during the three months ended August 31, 2015 (2014 - $32,000) primarily due to decreased legal fees on the RC litigation; | |
• | our rent expenses decreased by $12,000 to $36,411 during the three months ended August 31, 2015 (2014 - $48,215) mainly because our Vancouver office lease expired in September 2014 and our Tanzania office has been moved to a small office space; Included in the rent, there was $36,000 representing 60% of the rental expense associated with renting our CEO’s family house in Tanzania; | |
• | our travel and investor relations expenses decreased to almost none primarily due to our funding limitations. |
Liquidity and Capital Resources
The Company has been reviewing its budgets for its current business needs and its further exploration. We estimate that our total expenditures for our fiscal year ending May 31, 20152016 will be approximately $1.7$1.3 million, as outlined above under the heading “Plan of Operations”. At February 28,August 31, 2015, we had cash of $83,000 but$107,000 and a working capital deficit of $1,490,000.
$105,000. We entered into facility agreements with private companies controlled bybelieve that we have insufficient capital to fund our Chairmanplan of operations and we estimate we will be required to obtain a minimum of $900,000 additional funds in order to pursue our planned operations over the Board of Directors in December 2012 and October 2013. The funding is in the form of interest free unsecured loans to the Company of up to $1,125,000 due June 30, 2015. As of the date of this report, we received a total of $1,125,000 pursuant to these facility agreements.fiscal year ending May 31, 2016.
On November 20, 2014, the Company entered into an additionala credit facility agreement with a private company controlled by our Chairman of the Board of Directors. The funding is also in the form of an interest freeinterest-free unsecured loan to the Company of up to $500,000 due May 31, 2017. As of the date of this report, we received a total of $170,000$350,000, with $330,000 funds$150,000 available to be withdrawn pursuant to this facility agreement.
AsWe expected to receive approximately $10,000 of February 28, 2015, there was $30,000recoverable goods and services tax/harmonized sales tax from Canada Revenue Agency in the next quarter. Based on requirements of the Tanzania Revenue Authority (“TRA”), we had submitted recoverable value added tax (“VAT”) refund certificates in January 2015 with TRA to request a VAT refund of $23,000 (TZS 49,061,634). However, as of the date of this report, we have not received the claimed refund yet.
As at August, 2015, there was $27,000 of recoverable VAT paid in Tanzania and $7,000$13,000 of recoverable goods and services tax paid in Canada. Such recoverable amounts were included in our working capital and expected to be refunded during the fiscal year 2016.
30
We believe that we have insufficient capital to fund our plan of operations through the fiscal year ending May 31, 2015. If we exclude $1.125 million of the related parties’ loans from the current liabilities, we still have a working capital deficit of $365,000. During the nine months ended February 28, 2015, our cash used in operating activities was $615,000. As such, we estimate we will be required to obtain a minimum of $1.1 million additional funds in order to pursue our planned operations over the fiscal year ending May 31, 2015.
We have not generated revenues since the date of inception on January 5, 2004, and our cash has been generated primarily from the sale of our securities. We anticipate that we will not generate any revenue in near future. We anticipate that additional funding will be in the form of equity financing from the sale of our common stock, debt financing, joint ventures or some combination of these or other means. We believe that external debt financing will not be an alternative at this stage for funding additional phases of our exploration as we do not have significant tangible assets to secure any debt financing.
We cannot provide investors with any assurance that we will be able to raise sufficient funding to continue our acquisition and exploration program going forward. If we are not able to obtain financing in the amounts required or on terms that are acceptable to us, we may be forced to scale back, or abandon, our plan of operations. Even if we are successful in obtaining equity and/or debt financing to fund our acquisition and exploration program, there is no assurance that we will obtain the funding necessary to pursue any advanced exploration of any mineral claims. If we do not continue to obtain additional funding, we will be forced to abandon our mineral claims and our plan of operations.
28
Net Cash Used in Operating Activities
Net cash used in operating activities was $615,000$124,000 during the ninethree months ended February 28,August 31, 2015, as compared to $545,000$245,000 during the same period in 2014.
Net Cash Used in Investing Activities
Net cash provided in investing activities was $31,000$10,000 during the ninethree months ended February 28,August 31, 2015 (2014: 20,000) due to proceeds from disposal of an automobile vehicle and redemption of the restricted cash. During the same period in 2014, net cash from investing activities was $5,000 mainly due to proceeds from disposal of an automobile vehicle.vehicles.
Net Cash from Financing Activities
During the ninethree months ended February 28,August 31, 2015, we received $134,000$135,000 (2014: $475,000)$Nil) in loans pursuant to facility agreements. We have funded our business to date primarily from sales of our common stock.stock and loans from related parties.
There are no assurances that we will be able to achieve further sales of our common stock or any other form of additional financing. If we are unable to achieve the financing necessary to continue our plan of operations, then we will not be able to continue our exploration of the property underlying our mineral claim interest and our venture will fail.
Going Concern
We have not attained profitable operations and are dependent upon obtaining financing to pursue any extensive exploration activities. In addition, we had a $1.5The Company has not generated any revenues and has accumulated losses of $117 million working capital deficit as of February 28,since inception to August 31, 2015. For these reasons our auditors stated in their report on our audited consolidated financial statements for the year ended May 31, 20142015 that they have substantial doubt we will be able to continue as a going concern.
Future Financings
We anticipate continuing to rely on equity sales of our common shares, debt financing from our related parties, and/or other financing in order to continue to fund our business operations through our next fiscal year ending May 31, 2016. Issuances of additional shares will result in dilution to our existing shareholders. There is no assurance that we will achieve any additional sales of our equity securities or arrange for debt or other financing to fund our planned exploration activities.
Off-Balance Sheet Arrangements
We have no significant off-balance sheet arrangements that have or are reasonably likely to have a current or future effect on our financial condition, changes in financial condition, revenues or expenses, results of operations, liquidity, capital expenditures or capital resources that is material to stockholders.
Related Party Transactions
The details of related party transactions are disclosed in footnote 98 of our Company’s interim unaudited consolidated financial statements for the fiscal quarter ended February 28,August 31, 2015 (Item 1, above).
Segment Disclosures
The Company operates in one reportable segment, located in Tanzania Africa, being the acquisition and exploration of mineral properties. The details of segment disclosures are disclosed in footnote 1514 of our Company’s interim unaudited consolidated financial statements for the fiscal quarter ended February 28,August 31, 2015 (Item 1, above).
Inflation
31
We do not believe that inflation has had a significant impact on our consolidated results of operations or financial condition.
Contractual Obligations
a) | On |
b) | On October 9, 2013, and as amended on June 18, 2014 and March 20, 2015, the Company entered into a facility agreement with Consultancy & Finance Company Associates Ltd. (“C&F”), a private company controlled by the |
| |
| |
c) | On November 20, 2014, the Company entered into a facility agreement with C&F. The funding is in the form of an interest-free unsecured loan to the Company of up to $500,000 due May 31, 2017. As of the date of this report, C&F has advanced $350,000 to the Company pursuant to this facility agreement. |
d) | On June 23, 2014, the Company’s Tanzania subsidiary, HG Limited, entered into a lease agreement associated with renting our Chief Executive Officer’s (the “CEO”) family house in Tanzania. The lease is for a period of 24 months commencing on August 1,2014 and expiring July 31, 2016 extendable for one year till July 31, 2017 by mutual agreement. The annual rent is $60,000, of which 40% ($24,000) should be reimbursed by another Company which is related to the Chairman of the Company and the CEO has been also working for. As of the three months ended August 31, 2015, the Company paid $60,000 rent and received $24,000 reimbursement for the second year of lease period, pursuant to this lease agreement. The lease agreement may be terminated by first giving notice not less than three months. |
29
Critical Accounting Policies
Our consolidated financial statements and accompanying notes have been prepared in accordance with United States generally accepted accounting principles applied on a consistent basis. The preparation of consolidated financial statements in conformity with U.S. generally accepted accounting principles requires management to make estimates and assumptions that affect the reported amounts of assets and liabilities, the disclosure of contingent assets and liabilities at the date of the consolidated financial statements and the reported amounts of revenues and expenses during the reporting periods.
We regularly evaluate the accounting policies and estimates that we use to prepare our consolidated financial statements. In general, management’s estimates are based on historical experience, on information from third party professionals, and on various other assumptions that are believed to be reasonable under the facts and circumstances. Actual results could differ from those estimates made by management.
The critical accounting policies are disclosed in footnote 2 of our Company’s interim unaudited consolidated financial statements for the fiscal quarter ended February 28,August 31, 2015 (Item 1, above).
We believe the critical accounting policies require us to make significant judgments and estimates in the preparation of our consolidated financial statements.
Item 3. Quantitative and Qualitative Disclosures About Market Risk
| Item 3. | Quantitative and Qualitative Disclosures About Market Risk |
Not required because we are a smaller reporting company.
Item 4. Controls and Procedures
| Item 4. | Controls and Procedures |
Disclosure Controls and Procedures
An evaluation was performed under the supervision and with the participation of the Company’s management, including the Company’s Chief Executive Officer (“CEO”), Reyno Scheepers, and the Company’s Chief Financial Officer (“CFO”), Melinda Hsu, of the effectiveness of the design and operation of the Company’s disclosure controls and procedures pursuant to Rules 13a-15(b) and 15d-15(b) under the Exchange Act as of the end of the period covered by this report. Based upon the evaluation, the Company’s CEO and CFO have concluded that our disclosure controls and procedures (as defined in Rules 13a-15(e) and 15d-15(e) under the Exchange Act) were not effective as of the end of the period covered by this report (that is, as of February 28, 2015), due to the material weaknesses in our internal control over financial reporting as disclosed in the Company’s annual report for our fiscal year ended May 31, 2014,2015, which have not been completely resolved as of February 28,August 31, 2015.
Management believes that the material weaknesses did not have a material impact on the Company’s financial results and information required to be disclosed by the Company in its reports. However, management believes that these material weaknesses resulting in ineffective oversight in the establishment and monitoring of required internal control over financial reporting can impact the Company’s consolidated financial statements for future years. As a result material errors could occur.
Changes in Internal Control Over Financial Reporting
There were no changes to our internal control over financial reporting that occurred during our fiscal quarter ended February 28,August 31, 2015 that have materially affected, or are reasonably likely to materially affect, our internal control over financial reporting.
32
PART II – OTHER INFORMATION
Item 1. Legal Proceedings
| Item 1. | Legal Proceedings |
Except as disclosed below, management is not aware of any legal proceedings contemplated by any governmental authority or any other party involving us or our properties. As of the date of this quarterly report, no director, officer or affiliate is (i) a party adverse to us in any legal proceeding, or (ii) has an adverse interest to us in any legal proceedings. Management is not aware of any other legal proceedings pending or that have been threatened against us or our properties.
a) | On February 8, 2012, Ruby Creek Resources Inc. (“RCR”) filed a lawsuit against the Company in the Supreme Court, State of New York, in which RCR |
30
On February 23, 2012, the Company filed a lawsuit against RCR in the Supreme Court of British Columbia (the “British Columbia Action”), seeking relief for RCR’s breach of its payment obligations under the above-referenced agreements and seeking an order that RCR remove the U.S. restrictive legend from 4,000,000 RCR shares issued to the Company under the agreements. | |
In addition to the British Columbia Action, on May 21, 2012 in answering RCR’s claim in New York, the Company | |
On January 13, 2015, the Company and RCR reached a binding settlement | |
b) | On October 25, 2012, Craig Alford filed a lawsuit against the Company in the Supreme Court of British Columbia for breach of an alleged employment agreement. Mr. Alford claims the agreement was for a term of three years, commencing on March 1, 2011, with a monthly salary of $12,500. Mr. Alford claims that the Company wrongfully terminated the agreement in October 2011 and is seeking judgment in the amount of $362,500. The Company is of the view that the allegation is without merit and intends to vigorously contest the action. On February 4, 2013 the Company filed its response to Mr. Alford’s claim with the Supreme Court of British Columbia. |
Item 1A. Risk Factors
| Item 1A. | Risk Factors |
Not required because we are a smaller reporting company.
Item 2. Unregistered Sales of Equity Securities and Use of Proceeds
| Item 2. | Unregistered Sales of Equity Securities and Use of Proceeds |
None.
Item 3. Defaults Upon Senior Securities
| Item 3. | Defaults Upon Senior Securities |
None.
Item 4. Mine Safety Disclosures
| Item 4. | Mine Safety Disclosures |
Not applicable.
Item 5 .. Other Information
| Item 5. | Other Information |
None.
3331
Item 6. Exhibits
| Item 6. | Exhibits |
The following exhibits are filed with this Quarterly Report on Form 10-Q:
| Exhibit | Description of Exhibit |
| Number | |
| 3.1(1) | Articles of Incorporation. |
| 3.2(12) | Certificate of Amendment to Articles of Incorporation. |
| 3.3(21) | Articles of Merger as filed with the Nevada Secretary of State. |
| 3.3(3) | Amended Bylaws, as amended on September 5, 2006. |
| 10.1(4) | Asset Purchase Agreement with KBT Discovery Group Tanzania Ltd. |
| 10.2(4) | Asset Purchase Agreement with Hydro-Geos Consulting Group Tanzania Ltd. |
| 10.3(4) | Asset Purchase Agreement with Megadeposit Explorers Ltd. |
| 10.4(5) | Amendment No. 1 to Asset Purchase Agreement with KBT Discovery Group Tanzania Ltd. |
| 10.5(5) | Amendment No. 1 to Asset Purchase Agreement with Hydro-Geos Consulting Group Tanzania Ltd. |
| 10.6(5) | Amendment No. 1 to Asset Purchase Agreement with Megadeposit Explorers Ltd. |
| 10.7(6) | Amendment No. 2 to Asset Purchase Agreement with KBT Discovery Group Tanzania Ltd. |
| 10.8(6) | Amendment No. 2 to Asset Purchase Agreement with Hydro-Geos Consulting Group Tanzania Ltd. |
| 10.9(6) | Amendment No. 2 to Asset Purchase Agreement with Megadeposit Explorers Ltd. |
| 10.10(7) | Strategic Alliance Agreement between the Company and Canaco Resources Inc. |
| 10.11(8) | Option Agreement between the Company and Canaco Resources Inc. |
| 10.12(9) | Amendment No. 1 to Strategic Alliance Agreement between the Company and Canaco Resources Inc. |
| 10.13(9) | Kwadijava Option Agreement. |
| 10.14(9) | Negero Option Agreement. |
| 10.15(10) | Joint Venture Agreement with Mkuvia Maita. |
| 10.16(11) | 2007 Stock Incentive Plan. |
| 10.17(14) | 2008 Stock Incentive Plan. |
| 10.18(11) | Consulting Agreement with Harpreet Sangha. |
| 10.19(11) | Consulting Agreement with Rovingi. |
| 10.20(13) | Joint Venture Agreement with Mkuvia Maita dated June 5, 2009. |
| 10.21(15) | Agreement with Ruby Creek Resources, Inc. dated November 7, 2009. |
| 10.22(16) | Purchase Agreement with Ruby Creek Resources, Inc., dated for reference May 19, 2010. |
| 10.23(17) | August 2010 Stock Incentive Plan. |
10.24(18) | Mineral Property Acquisition Agreement between the Company and IPP Gold Limited, dated September 15, 2010, ratified by the Company’s Board of Directors on September 21, 2010. |
| 10.26(19) | November 2010 Stock Incentive Plan. |
| 10.27(20) | Mineral Property Acquisition Agreement between the Company and Handeni Resources Limited, dated August 5, 2011. |
| 10.28(22) | Executive Consulting Services Agreement between the Company and Amica Resource Inc., dated February 28, 2012. |
34
10.29(23) | Unsecured Term Loan Facility Agreement between the Company and IPP Ltd. dated December 7, 2012 |
10.30(24) | Unsecured Term Loan Facility Agreement between the Company and Consultancy & Finance Company Associates Ltd. dated October 9, 2013 |
10.31(25) | Unsecured Term Loan Facility Agreement between the Company and Consultancy & Finance Company Associates Ltd. dated November 20, 2014 |
14.1(2) | Code of Ethics. |
21.1 | Subsidiaries of the Registrant: |
a. Douglas Lake Tanzania Limited (Tanzania); and | |
b. HG Limited (Tanzania) (formerly: DLM Tanzania Limited (Tanzania)). | |
Certifications of Chief Executive Officer Pursuant to Section 302 of the Sarbanes-Oxley Act of 2002. | |
Certifications of Chief Financial Officer Pursuant to Section 302 of the Sarbanes-Oxley Act of 2002. | |
Certifications of Chief Executive Officer Pursuant to Section 906 of the Sarbanes-Oxley Act of 2002. | |
Certifications of Chief Financial Officer Pursuant to Section 906 of the Sarbanes-Oxley Act of 2002. |
32
* Filed herewith.
(1) | Incorporated by reference to Form SB-2 Registration Statement filed on July 22, 2004. |
(2) | Incorporated by reference to Annual Report on Form 10-KSB for year ended May 31, 2005. |
(3) | Incorporated by reference to Annual Report on Form 10-KSB for year ended May 31, 2006. |
(4) | Incorporated by reference to Current Report on Form 8-K filed on August 4, 2005. |
(5) | Incorporated by reference to Current Report on Form 8-K filed on November 21, 2005. |
(6) | Incorporated by reference to Quarterly Report on Form 10-SB for quarterly period ended November 30, 2005. |
(7) | Incorporated by reference to Current Report on Form 8-K filed on May 4, 2006. |
(8) | Incorporated by reference to Quarterly Report on Form 10-SB for quarterly period ended August 31, 2006. |
(9) | Incorporated by reference to Quarterly Report on Form 10-SB for quarterly period ended August 31, 2007. |
(10) | Incorporated by reference to Current Report on Form 8-K filed on August 6, 2008. |
(11) | Incorporated by reference to Annual Report on Form 10-KSB for year ended May 31, 2007. |
(12) | Incorporated by reference to Current Report on Form 8-K filed on January 27, 2009 |
(13) | Incorporated by reference to Current Report on Form 8-K filed on July 16, 2009 |
(14) | Incorporated by reference to Registration Statement Form S-8 filed on December 30, 2008. |
(15) | Incorporated by reference to Current Report on Form 8-K filed on November 13, 2009. |
(16) | Incorporated by reference to Current Report on Form 8-K filed on June 21, 2010. |
(17) | Incorporated by reference to Annual Report on Form 10-K for the year ended May 31, 2010. |
(18) | Incorporated by reference to Current Report on Form 8-K filed on September 27, 2010. |
(19) | Incorporated by reference to Annual Report on Form 10-K for the year ended May 31, 2011. |
(20) | Incorporated by reference to Current Report on Form 8-K filed on August 10, 2011. |
(21) | Incorporated by reference to Current Report on Form 8-K filed on February 15, 2012. |
(22) | Incorporated by reference to Current Report on Form 8-K filed on March 2, 2012. |
(23) | Incorporated by reference to Quarterly Report on Form 10-Q for the quarterly period ended November 30, 2012. |
(24) | Incorporated by reference to Quarterly Report on Form 10-Q for the quarterly period ended August 31, 2013. |
(25) | Incorporated by reference to Quarterly Report on Form 10-Q for the quarterly period ended November 30, 2014. |
3533
SIGNATURES
Pursuant to the requirements of the Securities Exchange Act of 1934, the registrant has duly caused this report to be signed on its behalf by the undersigned thereunto duly authorized.
HANDENI GOLD INC.
| HANDENI GOLD INC. | ||
| By: | “Reyno Scheepers” | |
| Reyno Scheepers | ||
| President, Chief Executive Officer (Principal Executive Officer) and a | ||
| director | ||
| By: | “Melinda Hsu” | |
| Melinda Hsu | ||
| Chief Financial Officer (Principal Financial Officer and Principal Accounting | ||
| Officer), Secretary and Treasurer | ||
| Date: | ||
3634