UNITED STATES
SECURITIES AND EXCHANGE COMMISSION
Washington, D.C. 20549
FORM 10-Q
(Mark One)
[X]☒ QUARTERLY REPORT PURSUANT TO SECTION 13 OR 15(d) OF THE SECURITIES EXCHANGE ACT OF 1934
For the quarterly period ended DecemberMarch 31, 20172022
OR
[ ]OR
☐ TRANSITION REPORT PURSUANT TO SECTION 13 OR 15(d) OF THE SECURITIES AND EXCHANGE ACT OF 1934
For the transition period from | To |
For the transition period from ______________ to ______________
Commission file number:000-31203
NET 1 UEPS TECHNOLOGIES, INC.
(Exact name of registrant as specified in its charter)
Florida | 98-0171860 | |||
(State or other jurisdiction | (IRS Employer | |||
of incorporation or organization) | Identification No.) | |||
President Place, 4th Floor, Cnr. Jan Smuts Avenue and Bolton RoadRosebank, Johannesburg 2196, South Africa(Address of principal executive offices, including zip code)
President Place, 4 Floor, Cnr. Jan Smuts Avenue and Bolton Road, |
Rosebank, Johannesburg, 2196, South Africa |
(Address of principal executive offices, including zip code) |
Registrant’s telephone number, including area code:27-11-343-2000
Not Applicable
Not Applicable |
(Former Name, Former Address and Former Fiscal Year, if Changed Since Last Report) |
Title of each class | Trading Symbol(s) | Name of each exchange on which registered |
Common stock, par value $0.001 per share | UEPS | NASDAQ Global Select Market |
Indicate by check mark whether the registrant (1) has filed all reports required to be filed by Section 13 or 15(d) of the Securities Exchange Act of 1934 during the preceding 12 months (or for such shorter period that the registrant was required to file such reports), and (2) has been subject to such filing requirements for the past 90 days.
YES [X] ☒ NO [ ]☐
Indicate by check mark whether the registrant has submitted electronically and posted on its corporate Web site, if any, every Interactive Data File required to be submitted and posted pursuant to Rule 405 of Regulation S-T (§232.405 of this chapter) during the preceding 12 months (or for such shorter period that the registrant was required to submit and post such files).
YES [X] ☒ NO [ ]☐
Indicate by check mark whether the registrant is a large accelerated filer, an accelerated filer, a non-accelerated filer, or a smaller reporting company or an emerging growth company. See the definitions of “large accelerated filer”,filer,” “accelerated filer”,filer,” “smaller reporting company”,company,” and “emerging growth company” in Rule 12b-2 of the Exchange Act (check one):
☐ | Large accelerated filer | ☒ | Accelerated filer |
☐ | Non-accelerated filer | ☒ | Smaller reporting company |
☐ | Emerging growth company | ||
If an emerging growth company, indicate by check mark if the registrant has elected not to use the extended transition period for complying with any new or revised financial accounting standards provided pursuant to Section 13(a) of the Exchange Act. [ ]☐
Indicate by check mark whether the registrant is a shell company (as defined in Rule 12b-2 of the Exchange Act).
YES [ ]☐ NO [X ]☒
As of February 6, 2018May 4, 2022 (the latest practicable date), 56,832,37059,178,548 shares of the registrant’s common stock, par value $0.001 per share, net of treasury shares, were outstanding.
Form 10-Q
NET 1 UEPS TECHNOLOGIES, INC.
Table of Contents
Form 10-Q NET 1 UEPS TECHNOLOGIES, INC. Table of Contents | ||
Page No. | ||
PART I. FINANCIAL INFORMATION | ||
Notes to Unaudited Condensed Consolidated Financial Statements | ||
Management’s Discussion and Analysis of Financial Condition and Results of Operations | ||
1
Part I. Financial Informationinformation
Item 1. Financial Statements
| Unaudited | (A) | |||||
| December 31, | June 30, | |||||
| 2017 | 2017 | |||||
| (In thousands, except share data) | ||||||
| ASSETS | ||||||
| CURRENT ASSETS | ||||||
| Cash and cash equivalents | $ | 64,896 | $ | 258,457 | ||
| Pre-funded social welfare grants receivable (Note 2) | 3,300 | 2,322 | ||||
| Accounts receivable, net of allowances of – December: $1,251; June: $1,255 | 128,543 | 111,429 | ||||
| Finance loans receivable, net of allowances of – December: $17,213; June: $7,469 | 105,697 | 80,177 | ||||
| Inventory (Note 3) | 12,482 | 8,020 | ||||
| Deferred income taxes (Note 1) | - | 5,330 | ||||
| Total current assets before settlement assets | 314,918 | 465,735 | ||||
| Settlement assets (Note 4) | 412,177 | 640,455 | ||||
| Total current assets | 727,095 | 1,106,190 | ||||
| PROPERTY, PLANT AND EQUIPMENT, net of accumulated depreciation of – December: $136,996; June: $120,212 | 32,852 | 39,411 | ||||
| EQUITY-ACCOUNTED INVESTMENTS (Note 6) | 147,392 | 27,862 | ||||
| GOODWILL (Note 7) | 199,495 | 188,833 | ||||
| INTANGIBLE ASSETS, net (Note 7) | 34,604 | 38,764 | ||||
| DEFERRED INCOME TAXES (Note 1) | 3,342 | - | ||||
| OTHER LONG-TERM ASSETS, including reinsurance assets (Note 6 and Note 8) | 225,463 | 49,696 | ||||
| TOTAL ASSETS | 1,370,243 | 1,450,756 | ||||
| LIABILITIES | ||||||
| CURRENT LIABILITIES | ||||||
| Short-term credit facilities (Note 9) | 35,553 | 16,579 | ||||
| Accounts payable | 16,971 | 15,136 | ||||
| Other payables | 39,168 | 34,799 | ||||
| Current portion of long-term borrowings (Note 10) | 50,530 | 8,738 | ||||
| Income taxes payable | 5,311 | 5,607 | ||||
| Total current liabilities before settlement obligations | 147,533 | 80,859 | ||||
| Settlement obligations (Note 4) | 412,177 | 640,455 | ||||
| Total current liabilities | 559,710 | 721,314 | ||||
| DEFERRED INCOME TAXES (Note 1) | 9,866 | 11,139 | ||||
| LONG-TERM BORROWINGS (Note 10) | 19,867 | 7,501 | ||||
| OTHER LONG-TERM LIABILITIES, including insurance policy liabilities (Note 8) | 2,449 | 2,795 | ||||
| TOTAL LIABILITIES | 591,892 | 742,749 | ||||
| COMMITMENTS AND CONTINGENCIES (Note 18) | ||||||
| REDEEMABLE COMMON STOCK (Note 1) | 107,672 | 107,672 | ||||
| EQUITY | ||||||
| COMMON STOCK (Note 11) | ||||||
| Authorized: 200,000,000 with $0.001 par value; | ||||||
| Issued and outstanding shares, net of treasury - December: 56,832,370; June: 56,369,737 | 80 | 80 | ||||
| PREFERRED STOCK | ||||||
| Authorized shares: 50,000,000 with $0.001 par value; | ||||||
| Issued and outstanding shares, net of treasury: December: -; June: - | - | - | ||||
| ADDITIONAL PAID-IN-CAPITAL | 274,961 | 273,733 | ||||
| TREASURY SHARES, AT COST: December: 24,891,292; June: 24,891,292 | (286,951 | ) | (286,951 | ) | ||
| ACCUMULATED OTHER COMPREHENSIVE LOSS (Note 12) | (123,359 | ) | (162,569 | ) | ||
| RETAINED EARNINGS | 802,381 | 773,276 | ||||
| TOTAL NET1 EQUITY | 667,112 | 597,569 | ||||
| NON-CONTROLLING INTEREST | 3,567 | 2,766 | ||||
| TOTAL EQUITY (Note 1) | 670,679 | 600,335 | ||||
| TOTAL LIABILITIES, REDEEMABLE COMMON STOCK ANDSHAREHOLDERS’ EQUITY | $ | 1,370,243 | $ | 1,450,756 | ||
(A) – Derived from audited financial statementsNET 1 UEPS TECHNOLOGIES, INC.
See Unaudited Condensed Consolidated Balance Sheets
|
|
|
|
| March 31, |
| June 30, | |||
|
|
|
|
|
| 2022 |
| 2021(A) | ||
|
|
|
|
|
| (In thousands, except share data) | ||||
|
|
|
|
| ASSETS |
|
|
|
|
|
CURRENT ASSETS |
|
|
|
|
| |||||
| Cash and cash equivalents | $ | 183,712 |
| $ | 198,572 | ||||
| Restricted cash related to ATM funding and credit facilities (Note 8) |
| 56,336 |
|
| 25,193 | ||||
| Accounts receivable, net and other receivables (Note 2) |
| 24,435 |
|
| 26,583 | ||||
| Finance loans receivable, net (Note 2) |
| 22,196 |
|
| 21,142 | ||||
| Inventory (Note 3) |
| 22,104 |
|
| 22,361 | ||||
|
| Total current assets before settlement assets |
| 308,783 |
|
| 293,851 | |||
|
|
| Settlement assets |
| 364 |
|
| 466 | ||
|
|
|
| Total current assets |
| 309,147 |
|
| 294,317 | |
PROPERTY, PLANT AND EQUIPMENT, net of accumulated depreciation of - March: $37,708 June: $38,535 |
| 5,851 |
|
| 7,492 | |||||
OPERATING LEASE RIGHT-OF-USE (Note 16) |
| 3,375 |
|
| 4,519 | |||||
EQUITY-ACCOUNTED INVESTMENTS (Note 5) |
| 7,275 |
|
| 10,004 | |||||
GOODWILL (Note 6) |
| 28,661 |
|
| 29,153 | |||||
INTANGIBLE ASSETS, NET (Note 6) |
| 298 |
|
| 357 | |||||
DEFERRED INCOME TAXES |
| 1,066 |
|
| 622 | |||||
OTHER LONG-TERM ASSETS, including reinsurance assets (Note 5 and 7) |
| 77,992 |
|
| 81,866 | |||||
TOTAL ASSETS |
| 433,665 |
|
| 428,330 | |||||
|
|
|
|
|
|
|
|
|
|
|
|
|
|
|
| LIABILITIES |
|
|
|
|
|
CURRENT LIABILITIES |
|
|
|
|
| |||||
| Short-term credit facilities for ATM funding (Note 8) |
| 45,678 |
|
| 14,245 | ||||
| Accounts payable |
| 5,102 |
|
| 7,113 | ||||
| Other payables (Note 9) |
| 27,187 |
|
| 27,588 | ||||
| Operating lease liability - current (Note 16) |
| 2,232 |
|
| 2,822 | ||||
| Income taxes payable |
| 695 |
|
| 256 | ||||
|
| Total current liabilities before settlement obligations |
| 80,894 |
|
| 52,024 | |||
|
|
| Settlement obligations |
| 364 |
|
| 466 | ||
|
|
|
| Total current liabilities |
| 81,258 |
|
| 52,490 | |
DEFERRED INCOME TAXES |
| 10,408 |
|
| 10,415 | |||||
OPERATING LEASE LIABILITY - LONG TERM (Note 16) |
| 1,345 |
|
| 1,890 | |||||
OTHER LONG-TERM LIABILITIES, including insurance policy liabilities (Note 7) |
| 2,695 |
|
| 2,576 | |||||
TOTAL LIABILITIES |
| 95,706 |
|
| 67,371 | |||||
REDEEMABLE COMMON STOCK |
| 84,979 |
|
| 84,979 | |||||
|
|
|
|
|
|
|
|
|
|
|
|
|
|
|
| EQUITY |
|
|
|
|
|
COMMON STOCK (Note 10) |
|
|
|
|
| |||||
| Authorized: 200,000,000 with $0.001 par value; |
|
|
|
|
| ||||
| Issued and outstanding shares, net of treasury - March: 57,921,062 June: 56,716,620 |
| 80 |
|
| 80 | ||||
PREFERRED STOCK |
|
|
|
|
| |||||
| Authorized shares: 50,000,000 with $0.001 par value; |
|
|
|
|
| ||||
| Issued and outstanding shares, net of treasury: March: 0 June: 0 |
| - |
|
| - | ||||
ADDITIONAL PAID-IN-CAPITAL |
| 304,430 |
|
| 301,959 | |||||
TREASURY SHARES, AT COST: March: 24,891,292 June: 24,891,292 |
| (286,951) |
|
| (286,951) | |||||
ACCUMULATED OTHER COMPREHENSIVE LOSS (Note 11) |
| (142,465) |
|
| (145,721) | |||||
RETAINED EARNINGS |
| 377,886 |
|
| 406,613 | |||||
TOTAL NET1 EQUITY |
| 252,980 |
|
| 275,980 | |||||
NON-CONTROLLING INTEREST |
| 0 |
|
| 0 | |||||
TOTAL EQUITY |
| 252,980 |
|
| 275,980 | |||||
|
|
|
|
|
|
|
|
|
|
|
TOTAL LIABILITIES, REDEEMABLE COMMON STOCK AND SHAREHOLDERS’ EQUITY | $ | 433,665 |
| $ | 428,330 | |||||
|
|
|
|
|
|
|
|
|
|
|
| (A) – Derived from audited financial statements | |||||||||
| See Notes to Unaudited Condensed Consolidated Financial Statements | |||||||||
2
NET 1 UEPS TECHNOLOGIES, INC.
Unaudited Condensed Consolidated Statements of Operations
|
|
|
|
|
|
| Three months ended |
|
| Nine months ended | ||||||||
|
|
|
|
|
|
|
|
| March 31, |
|
| March 31, | ||||||
|
|
|
|
|
|
|
| 2022 |
| 2021 |
| 2022 |
| 2021 | ||||
|
|
|
|
|
|
|
| (In thousands, except per share data) |
| (In thousands, except per share data) | ||||||||
|
|
|
|
|
|
|
|
|
|
|
|
|
|
|
|
|
|
|
REVENUE (Note 15) |
| $ | 35,202 |
| $ | 28,828 |
| $ | 100,820 |
| $ | 96,269 | ||||||
|
|
|
|
|
|
|
|
|
|
|
|
|
|
|
|
|
|
|
EXPENSE |
|
|
|
|
|
|
|
|
|
|
|
| ||||||
|
|
|
|
|
|
|
|
|
|
|
|
|
|
|
|
|
|
|
| Cost of goods sold, IT processing, servicing and support |
|
| 23,008 |
|
| 23,096 |
|
| 67,795 |
|
| 73,895 | |||||
| Selling, general and administration |
|
| 15,184 |
|
| 18,892 |
|
| 53,372 |
|
| 59,517 | |||||
| Depreciation and amortization |
|
| 463 |
|
| 1,132 |
|
| 2,084 |
|
| 3,129 | |||||
| Reorganization costs (Note 1) |
|
| 5,852 |
|
| 0 |
|
| 5,852 |
|
| 0 | |||||
| Transaction costs related to Connect Group acquisition |
|
| 116 |
|
| 0 |
|
| 1,790 |
|
| 0 | |||||
|
|
|
|
|
|
|
|
|
|
|
|
|
|
|
|
|
|
|
OPERATING LOSS |
|
| (9,421) |
|
| (14,292) |
|
| (30,073) |
|
| (40,272) | ||||||
|
|
|
|
|
|
|
|
|
|
|
|
|
|
|
|
|
|
|
CHANGE IN FAIR VALUE OF EQUITY SECURITIES (Note 4 and 5) |
|
| 0 |
|
| 10,814 |
|
| 0 |
|
| 25,942 | ||||||
|
|
|
|
|
|
|
|
|
|
|
|
|
|
|
|
|
|
|
GAIN RELATED TO FAIR VALUE ADJUSTMENT TO CURRENCY OPTIONS (Note 4) |
|
| 6,120 |
|
| 0 |
|
| 3,691 |
|
| 0 | ||||||
|
|
|
|
|
|
|
|
|
|
|
|
|
|
|
|
|
|
|
LOSS ON DISPOSAL OF EQUITY-ACCOUNTED INVESTMENT (Note 5) |
|
| 346 |
|
| 0 |
|
| 346 |
|
| 13 | ||||||
|
|
|
|
|
|
|
|
|
|
|
|
|
|
|
|
|
|
|
GAIN ON DISPOSAL OF EQUITY SECURITIES (Note 5) |
|
| 720 |
|
| 0 |
|
| 720 |
|
| 0 | ||||||
|
|
|
|
|
|
|
|
|
|
|
|
|
|
|
|
|
|
|
LOSS ON DISPOSAL OF EQUITY-ACCOUNTED INVESTMENT - BANK FRICK (Note 5) |
|
| 0 |
|
| 472 |
|
| 0 |
|
| 472 | ||||||
|
|
|
|
|
|
|
|
|
|
|
|
|
|
|
|
|
|
|
INTEREST INCOME |
|
| 761 |
|
| 606 |
|
| 1,463 |
|
| 1,934 | ||||||
|
|
|
|
|
|
|
|
|
|
|
|
|
|
|
|
|
|
|
INTEREST EXPENSE |
|
| 691 |
|
| 744 |
|
| 2,272 |
|
| 2,168 | ||||||
|
|
|
|
|
|
|
|
|
|
|
|
|
|
|
|
|
|
|
LOSS BEFORE INCOME TAX EXPENSE |
|
| (2,857) |
|
| (4,088) |
|
| (26,817) |
|
| (15,049) | ||||||
|
|
|
|
|
|
|
|
|
|
|
|
|
|
|
|
|
|
|
INCOME TAX EXPENSE (Note 18) |
|
| 470 |
|
| 2,171 |
|
| 754 |
|
| 4,549 | ||||||
|
|
|
|
|
|
|
|
|
|
|
|
|
|
|
|
|
|
|
NET LOSS BEFORE EARNINGS (LOSS) FROM EQUITY-ACCOUNTED INVESTMENTS |
|
| (3,327) |
|
| (6,259) |
|
| (27,571) |
|
| (19,598) | ||||||
|
|
|
|
|
|
|
|
|
|
|
|
|
|
|
|
|
|
|
EARNINGS (LOSS) FROM EQUITY-ACCOUNTED INVESTMENTS (Note 5) |
|
| 0 |
|
| 55 |
|
| (1,156) |
|
| (20,098) | ||||||
|
|
|
|
|
|
|
|
|
|
|
|
|
|
|
|
|
|
|
NET LOSS ATTRIBUTABLE TO NET1 |
| $ | (3,327) |
| $ | (6,204) |
| $ | (28,727) |
| $ | (39,696) | ||||||
|
|
|
|
|
|
|
|
|
|
|
|
|
|
|
|
|
|
|
Net loss per share, in United States dollars (Note 13): |
|
|
|
|
|
|
|
|
|
|
|
| ||||||
Basic loss attributable to Net1 shareholders |
| $ | (0.06) |
| $ | (0.11) |
| $ | (0.50) |
| $ | (0.70) | ||||||
Diluted loss attributable to Net1 shareholders |
| $ | (0.06) |
| $ | (0.11) |
| $ | (0.50) |
| $ | (0.70) | ||||||
|
|
|
|
|
|
|
|
|
|
|
|
|
|
|
|
|
|
|
See Notes to Unaudited Condensed Consolidated Financial Statements | ||||||||||||||||||
3
NET 1 UEPS TECHNOLOGIES, INC.
Unaudited Condensed Consolidated Statements of Comprehensive (Loss) Income
|
|
|
|
|
|
| Three months ended |
|
| Nine months ended | |||||||
|
|
|
|
|
|
|
| March 31, |
|
| March 31, | ||||||
|
|
|
|
|
|
| 2022 |
| 2021 |
| 2022 |
| 2021 | ||||
|
|
|
|
|
|
|
| (In thousands) |
|
| (In thousands) | ||||||
|
|
|
|
|
|
|
|
|
|
|
|
|
|
|
|
|
|
Net loss | $ | (3,327) |
| $ | (6,204) |
| $ | (28,727) |
| $ | (39,696) | ||||||
|
|
|
|
|
|
|
|
|
|
|
|
|
|
|
|
|
|
Other comprehensive income (loss), net of taxes |
|
|
|
|
|
|
|
|
|
|
| ||||||
| Movement in foreign currency translation reserve |
| 14,831 |
|
| (2,470) |
|
| 3,317 |
|
| 23,675 | |||||
| Release of foreign currency translation reserve related to disposal of Finbond equity securities (Note 11) |
| 583 |
|
| 0 |
|
| 583 |
|
| 0 | |||||
| Movement in foreign currency translation reserve related to equity-accounted investments |
| 0 |
|
| 0 |
|
| (644) |
|
| 1,688 | |||||
| Release of foreign currency translation reserve related to disposal of Bank Frick (Note 11) |
| 0 |
|
| (2,462) |
|
| 0 |
|
| (2,462) | |||||
|
|
| Total other comprehensive (loss) income, net of taxes |
| 15,414 |
|
| (4,932) |
|
| 3,256 |
|
| 22,901 | |||
|
|
|
|
|
|
|
|
|
|
|
|
|
|
|
|
|
|
|
| Comprehensive income (loss) |
| 12,087 |
|
| (11,136) |
|
| (25,471) |
|
| (16,795) | ||||
|
|
|
|
|
|
|
|
|
|
|
|
|
|
|
|
|
|
|
|
|
|
| Comprehensive income (loss) attributable to Net1 | $ | 12,087 |
| $ | (11,136) |
| $ | (25,471) |
| $ | (16,795) | |
|
|
|
|
|
|
|
|
|
|
|
|
|
|
|
|
|
|
See Notes to Unaudited Condensed Consolidated Financial Statements |
|
|
|
|
|
|
| ||||||||||
|
|
|
|
|
|
|
|
|
|
|
|
|
|
|
|
| |
4
NET 1 UEPS TECHNOLOGIES, INC.
Unaudited Condensed Consolidated Statements of Changes in Equity
| Net 1 UEPS Technologies, Inc. Shareholders |
|
|
|
|
|
| |||||||||||||||||
|
| Number of Shares |
| Amount |
| Number of Treasury Shares |
| Treasury Shares |
| Number of shares, net of treasury |
| Additional Paid-In Capital |
| Retained Earnings |
| Accumulated other comprehensive loss |
| Total Net1 Equity |
| Non-controlling Interest |
| Total |
| Redeemable common stock |
|
| For the three months ended March 31, 2021 (dollar amounts in thousands) | ||||||||||||||||||||||
| Balance – January 1, 2021 | 81,505,851 | $ | 80 |
| (24,891,292) | $ | (286,951) |
| 56,614,559 | $ | 302,196 | $ | 411,178 | $ | (141,242) | $ | 285,261 | $ | 0 | $ | 285,261 | $ | 84,979 |
|
|
|
|
|
|
|
|
|
|
|
|
|
|
|
|
|
|
|
|
|
|
|
|
|
| Exercise of stock options | 11,501 |
| 0 |
|
|
|
|
| 11,501 |
| 35 |
|
|
|
|
| 35 |
|
|
| 35 |
|
|
|
|
|
|
|
|
|
|
|
|
|
|
|
|
|
|
|
|
|
|
|
|
|
|
|
| Stock-based compensation charge (Note 12) |
|
|
|
|
|
|
|
| - |
| 245 |
|
|
|
|
| 245 |
|
|
| 245 |
|
|
|
|
|
|
|
|
|
|
|
|
|
|
|
|
|
|
|
|
|
|
|
|
|
|
|
| Reversal of stock-based compensation charge (Note 12) | 0 |
|
|
|
|
|
|
| 0 |
| 0 |
|
|
|
|
| 0 |
|
|
| 0 |
|
|
|
|
|
|
|
|
|
|
|
|
|
|
|
|
|
|
|
|
|
|
|
|
|
|
|
| Net loss |
|
|
|
|
|
|
|
| - |
|
|
| (6,204) |
|
|
| (6,204) |
| 0 |
| (6,204) |
|
|
|
|
|
|
|
|
|
|
|
|
|
|
|
|
|
|
|
|
|
|
|
|
|
|
|
| Other comprehensive loss (Note 11) |
|
|
|
|
|
|
|
|
|
|
|
|
|
| (4,932) |
| (4,932) |
| 0 |
| (4,932) |
|
|
|
|
|
|
|
|
|
|
|
|
|
|
|
|
|
|
|
|
|
|
|
|
|
|
|
| Balance – March 31, 2021 | 81,517,352 | $ | 80 |
| (24,891,292) | $ | (286,951) |
| 56,626,060 | $ | 302,476 | $ | 404,974 | $ | (146,174) | $ | 274,405 | $ | 0 | $ | 274,405 | $ | 84,979 |
|
|
|
|
|
|
|
|
|
|
|
|
|
|
|
|
|
|
|
|
|
|
|
| |
|
| For the nine months ended March 31, 2021 (dollar amounts in thousands) | ||||||||||||||||||||||
|
|
|
|
|
|
|
|
|
|
|
|
|
|
|
|
|
|
|
|
|
|
|
|
|
| Balance – July 1, 2020 | 82,010,217 | $ | 80 |
| (24,891,292) | $ | (286,951) |
| 57,118,925 | $ | 301,489 | $ | 444,670 | $ | (169,075) | $ | 290,213 | $ | 0 | $ | 290,213 | $ | 84,979 |
|
|
|
|
|
|
|
|
|
|
|
|
|
|
|
|
|
|
|
|
|
|
|
|
|
| Exercise of stock options | 17,335 |
| 0 |
|
|
|
|
| 17,335 |
| 53 |
|
|
|
|
| 53 |
|
|
| 53 |
|
|
|
|
|
|
|
|
|
|
|
|
|
|
|
|
|
|
|
|
|
|
|
|
|
|
|
| Stock-based compensation charge (Note 12) |
|
|
|
|
|
|
|
|
|
| 1,173 |
|
|
|
|
| 1,173 |
|
|
| 1,173 |
|
|
|
|
|
|
|
|
|
|
|
|
|
|
|
|
|
|
|
|
|
|
|
|
|
|
|
| Reversal of stock-based compensation charge (Note 12) | (510,200) |
|
|
|
|
|
|
| (510,200) |
| (297) |
|
|
|
|
| (297) |
|
|
| (297) |
|
|
|
|
|
|
|
|
|
|
|
|
|
|
|
|
|
|
|
|
|
|
|
|
|
|
|
| Stock-based compensation charge related to equity-accounted investment |
|
|
|
|
|
|
|
|
|
| (40) |
|
|
|
|
| (40) |
|
|
| (40) |
|
|
|
|
|
|
|
|
|
|
|
|
|
|
|
|
|
|
|
|
|
|
|
|
|
|
|
| Proceeds from disgorgement of shareholders' short-swing profits |
|
|
|
|
|
|
|
|
|
| 98 |
|
|
|
|
| 98 |
|
|
| 98 |
|
|
|
|
|
|
|
|
|
|
|
|
|
|
|
|
|
|
|
|
|
|
|
|
|
|
|
| Net loss |
|
|
|
|
|
|
|
|
|
|
|
| (39,696) |
|
|
| (39,696) |
| 0 |
| (39,696) |
|
|
|
|
|
|
|
|
|
|
|
|
|
|
|
|
|
|
|
|
|
|
|
|
|
|
|
| Other comprehensive income (Note 11) |
|
|
|
|
|
|
|
|
|
|
|
|
|
| 22,901 |
| 22,901 |
| 0 |
| 22,901 |
|
|
|
|
|
|
|
|
|
|
|
|
|
|
|
|
|
|
|
|
|
|
|
|
|
|
|
| Balance – March 31, 2021 | 81,517,352 | $ | 80 |
| (24,891,292) | $ | (286,951) |
| 56,626,060 | $ | 302,476 | $ | 404,974 | $ | (146,174) | $ | 274,405 | $ | 0 | $ | 274,405 | $ | 84,979 |
|
|
|
|
|
|
|
|
|
|
|
|
|
|
|
|
|
|
|
|
|
|
|
|
|
| See Notes to Unaudited Condensed Consolidated Financial Statements | |||||||||||||||||||||||
5
NET 1 UEPS TECHNOLOGIES, INC.
Unaudited Condensed Consolidated Statements of Changes in Equity
|
| Net 1 UEPS Technologies, Inc. Shareholders |
|
|
|
|
|
| ||||||||||||||||
|
| Number of Shares |
| Amount |
| Number of Treasury Shares |
| Treasury Shares |
| Number of shares, net of treasury |
| Additional Paid-In Capital |
| Retained Earnings |
| Accumulated other comprehensive loss |
| Total Net1 Equity |
| Non-controlling Interest |
| Total |
| Redeemable common stock |
|
|
|
|
|
|
|
|
|
|
|
|
|
|
|
|
|
|
|
|
|
|
|
|
|
|
| For the three months ended March 31, 2022 (dollar amounts in thousands) | ||||||||||||||||||||||
|
|
|
|
|
|
|
|
|
|
|
|
|
|
|
|
|
|
|
|
|
|
|
|
|
| Balance – January 1, 2022 | 82,548,464 | $ | 80 |
| (24,891,292) | $ | (286,951) |
| 57,657,172 | $ | 303,804 | $ | 381,213 | $ | (157,879) | $ | 240,267 | $ | 0 | $ | 240,267 | $ | 84,979 |
|
|
|
|
|
|
|
|
|
|
|
|
|
|
|
|
|
|
|
|
|
|
|
|
|
| Restricted stock granted (Note 12) | 257,222 |
|
|
|
|
|
|
| 257,222 |
|
|
|
|
|
|
| - |
|
|
| - |
|
|
|
|
|
|
|
|
|
|
|
|
|
|
|
|
|
|
|
|
|
|
|
|
|
|
|
| Exercise of stock option (Note 12) | 6,668 |
| - |
|
|
|
|
| 6,668 |
| 21 |
|
|
|
|
| 21 |
|
|
| 21 |
|
|
|
|
|
|
|
|
|
|
|
|
|
|
|
|
|
|
|
|
|
|
|
|
|
|
|
| Stock-based compensation charge (Note 12) |
|
|
|
|
|
|
|
|
|
| 619 |
|
|
|
|
| 619 |
|
|
| 619 |
|
|
|
|
|
|
|
|
|
|
|
|
|
|
|
|
|
|
|
|
|
|
|
|
|
|
|
| Reversal of stock-based compensation charge (Note 12) | 0 |
|
|
|
|
|
|
| 0 |
| (5) |
|
|
|
|
| (5) |
|
|
| (5) |
|
|
|
|
|
|
|
|
|
|
|
|
|
|
|
|
|
|
|
|
|
|
|
|
|
|
|
| Stock-based compensation charge related to equity-accounted investment (Note 5) |
|
|
|
|
|
|
|
|
|
| (9) |
|
|
|
|
| (9) |
|
|
| (9) |
|
|
|
|
|
|
|
|
|
|
|
|
|
|
|
|
|
|
|
|
|
|
|
|
|
|
|
| Net loss |
|
|
|
|
|
|
|
|
|
|
|
| (3,327) |
|
|
| (3,327) |
| 0 |
| (3,327) |
|
|
|
|
|
|
|
|
|
|
|
|
|
|
|
|
|
|
|
|
|
|
|
|
|
|
|
| Other comprehensive income (Note 11) |
|
|
|
|
|
|
|
|
|
|
|
|
|
| 15,414 |
| 15,414 |
| 0 |
| 15,414 |
|
|
|
|
|
|
|
|
|
|
|
|
|
|
|
|
|
|
|
|
|
|
|
|
|
|
|
| Balance – March 31, 2022 | 82,812,354 | $ | 80 |
| (24,891,292) | $ | (286,951) |
| 57,921,062 | $ | 304,430 | $ | 377,886 | $ | (142,465) | $ | 252,980 | $ | 0 | $ | 252,980 | $ | 84,979 |
|
| For the nine months ended March 31, 2022 (dollar amounts in thousands) | ||||||||||||||||||||||
|
|
|
|
|
|
|
|
|
|
|
|
|
|
|
|
|
|
|
|
|
|
|
|
|
| Balance – July 1, 2022 | 81,607,912 | $ | 80 |
| (24,891,292) | $ | (286,951) |
| 56,716,620 | $ | 301,959 | $ | 406,613 | $ | (145,721) | $ | 275,980 | $ | 0 | $ | 275,980 | $ | 84,979 |
|
|
|
|
|
|
|
|
|
|
|
|
|
|
|
|
|
|
|
|
|
|
|
|
|
| Restricted stock granted | 984,921 |
|
|
|
|
|
|
| 984,921 |
| - |
|
|
|
|
| - |
|
|
| - |
|
|
|
|
|
|
|
|
|
|
|
|
|
|
|
|
|
|
|
|
|
|
|
|
|
|
|
| Exercise of stock option (Note 12) | 249,521 |
| 0 |
|
|
|
|
| 249,521 |
| 760 |
|
|
|
|
| 760 |
|
|
| 760 |
|
|
|
|
|
|
|
|
|
|
|
|
|
|
|
|
|
|
|
|
|
|
|
|
|
|
|
| Stock-based compensation charge (Note 12) |
|
|
|
|
|
|
|
|
|
| 1,751 |
|
|
|
|
| 1,751 |
|
|
| 1,751 |
|
|
|
|
|
|
|
|
|
|
|
|
|
|
|
|
|
|
|
|
|
|
|
|
|
|
|
| Reversal of stock-based compensation charge (Note 12) | (30,000) |
|
|
|
|
|
|
| (30,000) |
| (40) |
|
|
|
|
| (40) |
|
|
| (40) |
|
|
|
|
|
|
|
|
|
|
|
|
|
|
|
|
|
|
|
|
|
|
|
|
|
|
|
| Stock-based compensation charge related to equity accounted investment (Note 5) |
|
|
|
|
|
|
|
|
|
| 0 |
|
|
|
|
| 0 |
|
|
| 0 |
|
|
|
|
|
|
|
|
|
|
|
|
|
|
|
|
|
|
|
|
|
|
|
|
|
|
|
| Net loss |
|
|
|
|
|
|
|
|
|
|
|
| (28,727) |
|
|
| (28,727) |
| 0 |
| (28,727) |
|
|
|
|
|
|
|
|
|
|
|
|
|
|
|
|
|
|
|
|
|
|
|
|
|
|
|
| Other comprehensive income (Note 11) |
|
|
|
|
|
|
|
|
|
|
|
|
|
| 3,256 |
| 3,256 |
| 0 |
| 3,256 |
|
|
|
|
|
|
|
|
|
|
|
|
|
|
|
|
|
|
|
|
|
|
|
|
|
|
|
| Balance – March 31, 2022 | 82,812,354 | $ | 80 |
| (24,891,292) | $ | (286,951) |
| 57,921,062 | $ | 304,430 | $ | 377,886 | $ | (142,465) | $ | 252,980 | $ | 0 | $ | 252,980 | $ | 84,979 |
|
|
|
|
|
|
|
|
|
|
|
|
|
|
|
|
|
|
|
|
|
|
|
|
|
| See Notes to Unaudited Condensed Consolidated Financial Statements | |||||||||||||||||||||||
6
NET 1 UEPS TECHNOLOGIES, INC.
Unaudited Condensed Consolidated Statements of Cash Flows
|
|
| Three months ended |
|
| Nine months ended | |||||||
|
|
|
| March 31, |
|
| March 31, | ||||||
|
|
| 2022 |
| 2021 |
| 2022 |
| 2021 | ||||
|
|
|
| (In thousands) |
|
| (In thousands) | ||||||
|
|
|
|
|
|
|
|
|
|
|
|
|
|
Cash flows from operating activities |
|
|
|
|
|
|
|
|
|
|
| ||
| Net loss | $ | (3,327) |
| $ | (6,204) |
| $ | (28,727) |
| $ | (39,696) | |
| Depreciation and amortization |
| 463 |
|
| 1,132 |
|
| 2,084 |
|
| 3,129 | |
| Impairment loss |
| (27) |
|
| 0 |
|
| 198 |
|
| 0 | |
| Movement in allowance for doubtful accounts receivable |
| 91 |
|
| 299 |
|
| 1,217 |
|
| 913 | |
| Interest payable |
| (97) |
|
| (25) |
|
| (199) |
|
| (46) | |
| (Gain) Loss related to fair value adjustment to currency options (Note 4) |
| (2,391) |
|
|
|
|
| 38 |
|
|
| |
| Fair value adjustment related to financial liabilities |
| (152) |
|
| (475) |
|
| (476) |
|
| 1,201 | |
| Gain on disposal of equity securities (Note 5) |
| (720) |
|
|
|
|
| (720) |
|
|
| |
| Loss on disposal of equity-accounted investments (Note 5) |
| 346 |
|
| 0 |
|
| 346 |
|
| 13 | |
| Loss on disposal of equity-accounted investment - Bank Frick |
| 0 |
|
| 472 |
|
| 0 |
|
| 472 | |
| (Earnings) Loss from equity-accounted investments |
| 0 |
|
| (55) |
|
| 1,156 |
|
| 20,098 | |
| Movement in allowance for doubtful loans to equity-accounted investments |
| 0 |
| �� | 0 |
|
| 0 |
|
| 739 | |
| Change in fair value of equity securities (Note 4 and 5) |
| 0 |
|
| (10,814) |
|
| 0 |
|
| (25,942) | |
| (Profit) Loss on disposal of property, plant and equipment |
| (1,077) |
|
| (142) |
|
| (2,598) |
|
| 600 | |
| Stock-based compensation charge (Note 12) |
| 614 |
|
| 245 |
|
| 1,711 |
|
| 876 | |
| Dividends received from equity accounted investments |
| 0 |
|
| 0 |
|
| 137 |
|
| 125 | |
| (Increase) Decrease in accounts receivable and finance loans receivable |
| (687) |
|
| 5,786 |
|
| (2,966) |
|
| 4,230 | |
| (Increase) Decrease in inventory |
| (181) |
|
| 428 |
|
| (27) |
|
| 2,642 | |
| (Decrease) Increase in accounts payable and other payables |
| (1,913) |
|
| (894) |
|
| (1,668) |
|
| (4,393) | |
| Increase (Decrease) in taxes payable |
| 395 |
|
| (160) |
|
| 444 |
|
| (15,498) | |
| (Decrease) Increase in deferred taxes |
| (112) |
|
| 2,153 |
|
| (458) |
|
| 424 | |
|
| Net cash used in operating activities |
| (8,775) |
|
| (8,254) |
|
| (30,508) |
|
| (50,113) |
|
|
|
|
|
|
|
|
|
|
|
|
|
|
Cash flows from investing activities |
|
|
|
|
|
|
|
|
|
|
| ||
Capital expenditures |
| (834) |
|
| (649) |
|
| (1,721) |
|
| (3,947) | ||
Proceeds from disposal of property, plant and equipment |
| 1,538 |
|
| 254 |
|
| 3,529 |
|
| 345 | ||
Proceeds from disposal of equity securities (Note 5) |
| 720 |
|
| 0 |
|
| 720 |
|
| 0 | ||
Proceeds from disposal of equity-accounted investment (Note 5) |
| 819 |
|
| 0 |
|
| 819 |
|
| 0 | ||
Proceeds from disposal of equity-accounted investment - Bank Frick, net of expenses |
| 0 |
|
| 18,568 |
|
| 7,500 |
|
| 18,568 | ||
Proceeds from disposal of Net1 Korea, net of cash disposed |
| 0 |
|
| 0 |
|
| 0 |
|
| 20,114 | ||
Proceeds from disposal of DNI as equity-accounted investment |
| 0 |
|
| 0 |
|
| 0 |
|
| 6,010 | ||
Loan to equity-accounted investment (Note 5) |
| 0 |
|
| 0 |
|
| 0 |
|
| (1,238) | ||
Repayment of loans by equity-accounted investments |
| 0 |
|
| 0 |
|
| 0 |
|
| 134 | ||
Net change in settlement assets |
| 5 |
|
| 745 |
|
| 102 |
|
| 6,190 | ||
| Net cash provided by investing activities |
| 2,248 |
|
| 18,918 |
|
| 10,949 |
|
| 46,176 | |
|
|
|
|
|
|
|
|
|
|
|
|
|
|
Cash flows from financing activities |
|
|
|
|
|
|
|
|
|
|
| ||
Proceeds from exercise of stock options |
| 20 |
|
| 35 |
|
| 759 |
|
| 53 | ||
Proceeds from bank overdraft (Note 8) |
| 95,048 |
|
| 55,280 |
|
| 406,398 |
|
| 261,759 | ||
Repayment of bank overdraft (Note 8) |
| (100,832) |
|
| (103,195) |
|
| (372,508) |
|
| (268,303) | ||
Proceeds from disgorgement of shareholders' short-swing profits |
| 0 |
|
| 0 |
|
| 0 |
|
| 124 | ||
Net change in settlement obligations |
| (5) |
|
| (745) |
|
| (102) |
|
| (6,190) | ||
| Net cash (used in) provided by financing activities |
| (5,769) |
|
| (48,625) |
|
| 34,547 |
|
| (12,557) | |
|
|
|
|
|
|
|
|
|
|
|
|
|
|
Effect of exchange rate changes on cash and cash equivalents |
| 12,200 |
|
| (2,263) |
|
| 1,295 |
|
| 10,839 | ||
Net (decrease) increase in cash, cash equivalents and restricted cash |
| (96) |
|
| (40,224) |
|
| 16,283 |
|
| (5,655) | ||
Cash, cash equivalents and restricted cash – beginning of period |
| 240,144 |
|
| 267,054 |
|
| 223,765 |
|
| 232,485 | ||
Cash, cash equivalents and restricted cash – end of period (Note 14) | $ | 240,048 |
| $ | 226,830 |
| $ | 240,048 |
| $ | 226,830 | ||
|
|
|
|
|
|
|
|
|
|
|
|
|
|
See Notes to Unaudited Condensed Consolidated Financial Statements | |||||||||||||
7
NET 1 UEPS TECHNOLOGIES, INC.
Notes to the Unaudited Condensed Consolidated Financial Statements
2
| Three months ended | Six months ended | |||||||||||
| December 31, | December 31, | |||||||||||
| 2017 | 2016 | 2017 | 2016 | |||||||||
| (In thousands, except per share data) | (In thousands, except per share data) | |||||||||||
| REVENUE | $ | 148,416 | $ | 151,433 | $ | 300,974 | $ | 307,066 | ||||
| EXPENSE | ||||||||||||
| Cost of goods sold, IT processing, servicing and support | 73,994 | 73,518 | 148,646 | 148,298 | ||||||||
| Selling, general and administration | 49,392 | 41,703 | 93,326 | 80,171 | ||||||||
| Depreciation and amortization | 8,723 | 10,623 | 17,689 | 20,827 | ||||||||
| OPERATING INCOME | 16,307 | 25,589 | 41,313 | 57,770 | ||||||||
| INTEREST INCOME | 4,705 | 5,061 | 9,749 | 9,365 | ||||||||
| INTEREST EXPENSE | 2,325 | 510 | 4,446 | 1,306 | ||||||||
| INCOME BEFORE INCOME TAX EXPENSE | 18,687 | 30,140 | 46,616 | 65,829 | ||||||||
| INCOME TAX EXPENSE (Note 17) | 10,062 | 10,984 | 20,339 | 22,087 | ||||||||
| NET INCOME BEFORE EARNINGS FROM EQUITY- ACCOUNTED INVESTMENTS | 8,625 | 19,156 | 26,277 | 43,742 | ||||||||
| EARNINGS FROM EQUITY-ACCOUNTED INVESTMENTS | 1,354 | 74 | 3,429 | 733 | ||||||||
| NET INCOME | 9,979 | 19,230 | 29,706 | 44,475 | ||||||||
| LESS NET INCOME ATTRIBUTABLE TO NON- | ||||||||||||
| CONTROLLING INTEREST | 357 | 589 | 601 | 1,202 | ||||||||
| NET INCOME ATTRIBUTABLE TO NET1 | $ | 9,622 | $ | 18,641 | $ | 29,105 | $ | 43,273 | ||||
| Net income per share, in U.S. dollars(Note 14) | ||||||||||||
| Basic earnings attributable to Net1 shareholders | $ | 0.17 | $ | 0.35 | $ | 0.51 | $ | 0.81 | ||||
| Diluted earnings attributable to Net1 shareholders | $ | 0.17 | $ | 0.35 | $ | 0.51 | $ | 0.81 | ||||
See Notes to Unaudited Condensed Consolidated Financial Statementsfor the three and nine months ended March 31, 2022 and 2021
3
| Three months ended | Six months ended | |||||||||||
| December 31, | December 31, | |||||||||||
| 2017 | 2016 | 2017 | 2016 | |||||||||
| (In thousands) | (In thousands) | |||||||||||
| Net income | $ | 9,979 | $ | 19,230 | $ | 29,706 | $ | 44,475 | ||||
| Other comprehensive income (loss) | ||||||||||||
| Movement in foreign currency translation reserve | 53,517 | (20,766 | ) | 39,637 | 1,536 | |||||||
| Movement in foreign currency translation reserve related to equity-accounted investments | - | - | (227 | ) | - | |||||||
| Total other comprehensive income (loss), net of taxes | 53,517 | (20,766 | ) | 39,410 | 1,536 | |||||||
| Comprehensive income (loss) | 63,496 | (1,536 | ) | 69,116 | 46,011 | |||||||
| Less comprehensive income attributable to non- controlling interest | (668 | ) | (624 | ) | (801 | ) | (1,681 | ) | ||||
| Comprehensive income (loss) attributable to Net1 | $ | 62,828 | $ | (2,160 | ) | $ | 68,315 | $ | 44,330 | |||
See Notes to Unaudited Condensed Consolidated Financial Statements(All amounts in tables stated in thousands or thousands of U.S. dollars, unless otherwise stated)
4
| Net 1 UEPS Technologies, Inc. Shareholders | ||||||||||||||||||||||||||||||||||||
| Number | Accumulated | Redeemable | ||||||||||||||||||||||||||||||||||
| Number | of | Number of | Additional | Other | Total | Non- | Common | |||||||||||||||||||||||||||||
| of | Treasury | Treasury | Shares, Net | Paid-In | Retained | Comprehensive | Net1 | Controlling | Stock | |||||||||||||||||||||||||||
| Shares | Amount | Shares | Shares | of Treasury | Capital | Earnings | (Loss) Income | Equity | Interest | Total | (Note 1) | |||||||||||||||||||||||||
| Balance – July 1, 2017 | 81,261,029 | $ | 80 | (24,891,292 | ) | $ | (286,951 | ) | 56,369,737 | $ | 273,733 | $ | 773,276 | $ | (162,569 | ) | $ | 597,569 | $ | 2,766 | $ | 600,335 | $ | 107,672 | ||||||||||||
| Restricted stock granted (Note 13) | 588,594 | 588,594 | - | - | ||||||||||||||||||||||||||||||||
| Stock-based compensation charge (Note 13) | 1,477 | 1,477 | 1,477 | |||||||||||||||||||||||||||||||||
| Reversal of stock compensation charge (Note 13) | (125,961 | ) | (125,961 | ) | (42 | ) | (42 | ) | (42 | ) | ||||||||||||||||||||||||||
| Reversal of stock based- compensation charge related to equity-accounted investment | (207 | ) | (207 | ) | (207 | ) | ||||||||||||||||||||||||||||||
| Net income | 29,105 | 29,105 | 601 | 29,706 | ||||||||||||||||||||||||||||||||
| Other comprehensive income (Note 12) | 39,210 | 39,210 | 200 | 39,410 | ||||||||||||||||||||||||||||||||
| Balance – December 31, 2017 | 81,723,662 | $ | 80 | (24,891,292 | ) | $ | (286,951 | ) | 56,832,370 | $ | 274,961 | $ | 802,381 | $ | (123,359 | ) | $ | 667,112 | $ | 3,567 | $ | 670,679 | $ | 107,672 | ||||||||||||
See Notes to Unaudited Condensed Consolidated Financial Statements
5
| Three months ended | Six months ended | |||||||||||
| December 31, | December 31, | |||||||||||
| 2017 | 2016 | 2017 | 2016 | |||||||||
| (In thousands) | (In thousands) | |||||||||||
| Cash flows from operating activities | ||||||||||||
| Net income | $ | 9,979 | $ | 19,230 | $ | 29,706 | $ | 44,475 | ||||
| Depreciation and amortization | 8,723 | 10,623 | 17,689 | 20,827 | ||||||||
| Earnings from equity-accounted investments | (1,354 | ) | (74 | ) | (3,429 | ) | (733 | ) | ||||
| Fair value adjustments | (372 | ) | 72 | (281 | ) | (11 | ) | |||||
| Interest payable | (159 | ) | (23 | ) | (247 | ) | 9 | |||||
| Facility fee amortized | 214 | 31 | 347 | 67 | ||||||||
| Loss (Profit) on disposal of property, plant and equipment | 16 | (539 | ) | 121 | (473 | ) | ||||||
| Profit on disposal of business | (463 | ) | - | (463 | ) | - | ||||||
| Stock-based compensation charge (reversal), net (Note 13) | 608 | 635 | 1,435 | (689 | ) | |||||||
| Dividends received from equity accounted investments | 1,253 | - | 2,165 | 370 | ||||||||
| (Increase) Decrease in accounts receivable, pre-funded social | ||||||||||||
| welfare grants receivable and finance loans receivable | 6,005 | 6,585 | (33,136 | ) | 14,351 | |||||||
| Increase in inventory | (2,322 | ) | (3,481 | ) | (3,848 | ) | (3,585 | ) | ||||
| (Decrease) Increase in accounts payable and other payables | (481 | ) | (5,940 | ) | 2,948 | (2,900 | ) | |||||
| Decrease in taxes payable | (9,754 | ) | (11,815 | ) | (916 | ) | (859 | ) | ||||
| Increase (Decrease) in deferred taxes | 1,419 | 386 | 428 | (1,246 | ) | |||||||
| Net cash provided by operating activities | 13,312 | 15,690 | 12,519 | 69,603 | ||||||||
| Cash flows from investing activities | ||||||||||||
| Capital expenditures | (2,103 | ) | (3,126 | ) | (3,576 | ) | (6,549 | ) | ||||
| Proceeds from disposal of property, plant and equipment | 99 | 945 | 415 | 1,014 | ||||||||
| Investment in Cell C (Note 6) | - | - | (151,003 | ) | - | |||||||
| Investment in equity of equity-accounted investments (Note 6) | (40,892 | ) | - | (113,738 | ) | - | ||||||
| Acquisition of held to maturity investment (Note 6) | (9,000 | ) | - | (9,000 | ) | - | ||||||
| Investment in MobiKwik | - | - | - | (15,347 | ) | |||||||
| Loans to equity accounted investments (Note 6) | (10,044 | ) | (10,044 | ) | ||||||||
| Acquisitions, net of cash acquired | - | (4,651 | ) | - | (4,651 | ) | ||||||
| Other investing activities | (154 | ) | - | (154 | ) | - | ||||||
| Net change in settlement assets (Note 4) | 24,519 | 258,166 | 237,168 | 220,772 | ||||||||
| Net cash (used in) provided by investing activities | (27,531 | ) | 241,290 | (39,888 | ) | 185,195 | ||||||
| Cash flows from financing activities | ||||||||||||
| Long-term borrowings utilized (Note 10) | - | - | 95,431 | 247 | ||||||||
| Repayment of long-term borrowings (Note 10) | (30,881 | ) | (1,824 | ) | (45,141 | ) | (28,493 | ) | ||||
| Proceeds from bank overdraft (Note 9) | 690 | - | 32,570 | - | ||||||||
| Repayment of bank overdraft (Note 9) | (11,391 | ) | - | (14,343 | ) | - | ||||||
| Guarantee fee paid (Note 10) | - | (1,145 | ) | (552 | ) | (1,145 | ) | |||||
| Acquisition of treasury stock (Note 11) | - | - | - | (32,081 | ) | |||||||
| Dividends paid to non-controlling interest | - | (58 | ) | - | (613 | ) | ||||||
| Net change in settlement obligations (Note 4) | (24,519 | ) | (258,166 | ) | (237,168 | ) | (220,772 | ) | ||||
| Net cash used in financing activities | (66,101 | ) | (261,193 | ) | (169,203 | ) | (282,857 | ) | ||||
| Effect of exchange rate changes on cash | 6,857 | (2,225 | ) | 3,011 | 3,306 | |||||||
| Net decrease in cash, cash equivalents and restricted cash | (73,463 | ) | (6,438 | ) | (193,561 | ) | (24,753 | ) | ||||
| Cash, cash equivalents and restricted cash – beginning ofperiod | 138,359 | 205,329 | 258,457 | 223,644 | ||||||||
| Cash, cash equivalents and restricted cash – end of period (1) | $ | 64,896 | $ | 198,891 | $ | 64,896 | $ | 198,891 | ||||
See Notes to Unaudited Condensed Consolidated Financial Statements
(1) Cash, cash equivalents and restricted cash as of December 31, 2016, includes restricted cash of approximately $43.7 million related to the guarantee issued by FirstRand Bank Limited (acting through its Rand Merchant Bank division). This cash was placed into an escrow account and was considered restricted as to use and therefore was classified as restricted cash. The restriction lapsed upon expiry of the guarantee.
6
1. Basis of Presentation and Summary of Significant Accounting Policies
Unaudited Interim Financial Information
The accompanying unaudited condensed consolidated financial statements include all majority-owned subsidiaries over which the Company exercises control and have been prepared in accordance with U.S. generally accepted accounting principles (“GAAP”) and the rules and regulations of the United States Securities and Exchange Commission for Quarterly Reports on Form 10-Q and include all of the information and disclosures required for interim financial reporting. The results of operations for the three and sixnine months ended DecemberMarch 31, 20172022 and 2016,2021, are not necessarily indicative of the results for the full year. The Company believes that the disclosures are adequate to make the information presented not misleading.
These unaudited condensed consolidated financial statements should be read in conjunction with the financial statements, accounting policies and financial notes thereto included in the Company’s Annual Report on Form 10-K for the fiscal year ended June 30, 2017.2021. In the opinion of management, the accompanying unaudited condensed consolidated financial statements reflect all adjustments (consisting only of normal recurring adjustments), which are necessary for a fair representation of financial results for the interim periods presented. During the three months ended December 31, 2017, the Company reclassified redeemable common stock out of total equity because redeemable common stock is required
References to be presented outside of permanent equity. The Company has restated these amounts in its unaudited condensed consolidated balance sheet as at June 30, 2017 and unaudited condensed consolidated statement of changes in equity for the six months ended December 31, 2017. The reclassification resulted in a decrease in total equity by approximately $107.7 million and an increase in redeemable common stock, presented outside of permanent equity, of approximately $107.7 million. This reclassification had no impact on the Company’s previously reported consolidated income, comprehensive income or cash flows.
“Net1” are references solely to Net 1 UEPS Technologies, Inc. References to the “Company” refer to Net1 and its consolidated subsidiaries, collectively, unless the context otherwise requires. References
Impact of COVID-19 on the Company’s business
The Company’s business has been, and continues to “Net1”be, impacted by government restrictions and quarantines related to COVID-19. South Africa operates with a five-level COVID-19 alert system, with Level 1 being the least restrictive and Level 5 being the most restrictive. South Africa operated at adjusted Level 1 during its most recent fiscal quarter, which had a limited impact on the Company’s businesses, and which ceased to be in operation on April 4, 2022. South Africa is subject to limited COVID-19 restrictions following the lifting of the National State of Disaster in South Africa on April 5, 2022. These restrictions are references solelyexpected to Net 1 UEPS Technologies, Inc.have a limited impact on the Company’s business.
The broader implications of COVID-19 on the Company’s results of operations and overall financial performance continue to remain uncertain. While the Company has not incurred significant disruptions thus far from the COVID-19 outbreak, apart from the two months in April and May 2020 when loan origination was curtailed, the Company is unable to accurately predict the impact that COVID-19 will have due to numerous uncertainties, including the severity and duration of the outbreak, actions that may be taken by governmental authorities, the impact on the Company’s customers and other factors. The Company will continue to evaluate the nature and extent of the impact on its business, consolidated results of operations, and financial condition.
July 2021 civil unrest in South Africa
Two of South Africa’s nine provinces experienced significant civil unrest in July 2021 resulting in mass looting, loss of life, disruption of transport and supply routes, and widespread destruction of property. In total 337 South Africans lost their lives in the unrest - fortunately none of the Company’s employees were injured or harmed. There was widespread damage to bank and ATM infrastructure in the affected provinces. In total approximately 1,800 ATMs and 300 branches were damaged, and the Banking Association of South Africa (“BASA”), estimates that total damage to banking infrastructure amounted to ZAR 1.6 billion. The South African Special Risks Insurance Association (“SASRIA”), a public enterprise and a non-life insurance company that provides coverage for damage caused by special risks such as politically motivated malicious acts, riots, strikes, terrorism and public disorders, estimates that the total damage to property across South Africa will be in the order of between ZAR 19.0 billion and ZAR 20.0 billion.
The Company suffered damage at 19 of its branches and to 173 ATMs. The disruption and related closure of branches also impacted the Company’s efforts to grow EPE customer numbers. The Company also saw an impact on transaction volumes through its ATMs with July 2021 volumes 13% lower than June 2021, and August 2021 3% lower than July 2021.
The Company’s insurance claims to recover the cost of approximately ZAR 40.0 million to repair and replace its branches and ATMs have been met in full. The Company received ZAR 12.6 million and ZAR 38.6 million from SASRIA during the three and nine months ended March 31, 2022, respectively.
As a result of the disruption to ATM coverage and availability, BASA and South Africa’s banks agreed that the fee which customers pay to utilize other banks’ ATMs would be waived for August and September 2021. The Company lost transaction fee revenue of approximately ZAR 6.0 million ($0.4 million) during the nine months ended March 31, 2022, as a result of this decision.
8
1. Basis of Presentation and Summary of Significant Accounting Policies (continued)
Reorganization charge - financial services restructuring
The Company has incurred significant losses since its contract to distribute social grants expired in September 2018. A strategic imperative for the Company is to return its South African financial services business to a breakeven position and then profitability as soon as possible. As part of a cost optimization process completed in late calendar 2021, the Company performed a review of its labor structure and determined that a number of its defined employee roles would need to be terminated due to redundancy. The Company embarked on a retrenchment process pursuant to Section 189A of the South African Labour Relations Act (“Labour Act”) on January 10, 2022. The Company incurred cash costs of approximately $6.7 million (ZAR 103.4 million) during the three and nine months ended March 31, 2022, principally consisting of severance and related payments and the payment of unutilized leave days. The Company has recorded an expense of $5.9 million in the caption reorganization costs in the Company’s unaudited condensed consolidated statements of operations for the three and nine months ended March 31, 2022. The primary difference between the reorganization charge amount and the total cash paid relates to leave pay which was accrued in prior periods.
Impact of events in Russia and Ukraine
The Company does not expect its operations to be significantly impacted by events unfolding in Russia and Ukraine. The Company believes that these events may adversely impact South African gross domestic product and rates of inflation as a result of the recent increases in crude oil prices, which is likely to impact economic activity in South Africa and therefore indirectly affect the Company. It may also lead to higher input prices for certain of the goods and services the Company procures.
Recent accounting pronouncements adopted
In August 2014,2018, the FASBFinancial Accounting Standards Board (“FASB”) issued guidance regardingDisclosure of Uncertainties about an Entity’s AbilityFramework: Changes to Continue as a Going Concern. This guidance requires an entity to perform interim and annual assessments of its ability to continue as a going concern within one year of the date that its financial statements are issued. An entity must provide certain disclosures if conditions or events raise substantial doubt about the entity’s ability to continue as a going concern.Disclosure Requirements for Fair Value Measurement. The guidance ismodifies the disclosure requirements related to fair value measurement. The guidance became effective for the Company beginning July 1, 2017.2021. The adoption of this guidance did not have a material impact on the Company’s financial statements or its footnote disclosures.
In July 2015,January 2020, the FASB issued guidance regardingSimplifying Clarifying the Measurement of Inventory. ThisInteractions Between Topic 321, Topic 323, and Topic 815. The guidance requires entities to measure most inventory “at the lower of cost and net realizable value,” thereby simplifying the current guidance under whichclarifies that an entity must measure inventory atshould consider observable transactions that require an entity to either apply or discontinue the lowerequity method of costaccounting for the purposes of applying the measurement alternative in accordance with U.S GAAP guidance immediately before applying or market (market in this context is defined as one of three different measures).upon discontinuing the equity method. The guidance willalso clarifies that, when determining the accounting for certain forward contracts and purchased options an entity should not apply to inventories that are measured by using eitherconsider, whether upon settlement or exercise, if the last-in, first-out (“LIFO”)underlying securities would be accounted for under the equity method or the retail inventory method (“RIM”).fair value option. The guidance isbecame effective for the Company beginning July 1, 2017.2021. The adoption of this guidance did not have a material impact on the Company’s financial statements.statements or its footnote disclosures.
In November 2015, the FASB issued guidance regardingBalance Sheet Classification of Deferred Taxes. This guidance requires that deferred tax liabilities and assets are to be classified as non-current in a classified statement of financial position. The current requirement that deferred tax liabilities and assets of a tax-paying component of an entity be offset and presented as a single amount is not affected by the amendments in this update. This guidance is effective for the Company beginning July 1, 2017, and has been applied on a prospective basis. The adoption of this guidance has resulted in the reclassification of current deferred tax assets and liabilities as non-current deferred tax assets and liabilities in the unaudited condensed consolidated balance sheet as of December 31, 2017. Prior period current deferred tax assets have not been reclassified as non-current in the unaudited condensed consolidated balance sheet as of June 30, 2017.
In March 2016, the FASB issued guidance regardingImprovements to Employee Share-Based Payment Accounting. The guidance simplifies several aspects of the accounting for employee share-based payment transactions for both public and nonpublic entities, including the accounting for income taxes, forfeitures, and statutory tax withholding requirements, as well as classification in the statement of cash flows. This guidance is effective for the Company beginning July 1, 2017. The adoption of this guidance did not have a material impact on the Company’s financial statements. The Company has elected to continue to estimate the number of forfeitures when an award is made.
7
1. Basis of Presentation and Summary of Significant Accounting Policies (continued)
Recent accounting pronouncements not yet adopted as of DecemberMarch 31, 20172022
In May 2014, the FASB issued guidance regardingRevenue from Contracts with Customers. This guidance requires an entity to recognize revenue when a customer obtains control of promised goods or services in an amount that reflects the consideration to which the entity expects to receive in exchange for those goods or services. In addition, the standard requires disclosure of the nature, amount, timing, and uncertainty of revenue and cash flows arising from contracts with customers. The guidance was originally set to be effective for the Company beginning July 1, 2017, however in August 2015, the FASB issued guidance regardingRevenue from Contracts with Customers, Deferral of the Effective Date. This guidance defers the required implementation date specified inRevenue from Contracts with Customers to December 2017. Public companies may elect to adopt the standard along the original timeline.
The guidance is effective for the Company beginning July 1, 2018. The Company expects that this guidance may have a material impact on its financial statements and is currently evaluating the impact of this guidance on its financial statements on adoption.
In January 2016, the FASB issued guidance regardingRecognition and Measurement of Financial Assets and Financial Liabilities. The guidance primarily affects the accounting for equity investments, financial liabilities under the fair value option and the presentation and disclosure requirements for financial instruments. The guidance requires changes in the fair value of the Company’s equity investments, with certain exceptions, to be recognized through net income rather than other comprehensive income. In addition, the guidance clarifies the valuation allowance assessment when recognizing deferred tax assets resulting from unrealized losses on available-for-sale debt securities. This guidance is effective for the Company beginning July 1, 2018, and early adoption is not permitted, with certain exceptions. The amendments are required to be applied by means of a cumulative-effect adjustment on the balance sheet as of the beginning of the fiscal year of adoption. The Company is currently assessing the impact of this guidance on its financial statements disclosure.
In February 2016, the FASB issued guidance regardingLeases. The guidance increases transparency and comparability among organizations by requiring the recognition of lease assets and lease liabilities on the balance sheet. The amendments to current lease guidance include the recognition of assets and liabilities by lessees for those leases currently classified as operating leases. The guidance also requires disclosures to meet the objective of enabling users of financial statements to assess the amount, timing, and uncertainty of cash flows arising from leases. This guidance is effective for the Company beginning July 1, 2019. Early adoption is permitted. The Company expects that this guidance may have a material impact on its financial statements and is currently evaluating the impact of this guidance on its financial statements on adoption.
In June 2016, the FASB issued guidance regardingMeasurement of Credit Losses on Financial Instruments. The guidance replaces the incurred loss impairment methodology in current GAAP with a methodology that reflects expected credit losses and requires consideration of a broader range of reasonable and supportable information to inform credit loss estimates. For trade and other receivables, loans, and other financial instruments, an entity is required to use a forward-looking expected loss model rather than the incurred loss model for recognizing credit losses, which reflects losses that are probable. Credit losses relating to available-for-sale debt securities will also be recorded through an allowance for credit losses rather than as a reduction in the amortized cost basis of the securities. This guidance is effective for the Company beginning July 1, 2020. Early adoption is permitted beginning July 1, 2019.2023. The Company is currently assessing the impact of this guidance on its financial statements disclosure.and related disclosures, but does not expect the impact on its financial results to be material.
In June 2016,November 2019, the FASB issued guidance regardingClassification Financial Instruments—Credit Losses (Topic 326), Derivatives and Hedging(Topic 815), and Leases (Topic 842). The guidance provides a framework to stagger effective dates for future major accounting standards and amends the effective dates for certain major new accounting standards to give implementation relief to certain types of Certain Cash Receiptsentities, including Smaller Reporting Companies. The Company is a Smaller Reporting Company. Specifically, the guidance changes some effective dates for certain new standards on the following topics in the FASB Codification, namely Derivatives and Cash PaymentsHedging (ASC 815); Leases (ASC 842); Financial Instruments — Credit Losses (ASC 326); and Intangibles — Goodwill and Other (ASC 350). The guidance is intended to reduce diversity in practice and explains how certain cash receipts and payments are presented and classified indefers the statementadoption date of cash flows, including beneficial interests in securitization, which would impact the presentationguidance regarding Measurement of the deferred purchase price from sales of receivables. This guidance is effective forCredit Losses on Financial Instruments by the Company beginningfrom July 1, 2018, and must be applied retrospectively. Early adoption is permitted.2020 to July 1, 2023. The Company is currently assessing the impact of this guidance on its financial statements disclosure.and related disclosures, but does not expect the impact on its financial results to be material.
In January 2017,October 2021, the FASB issued guidance which amends guidance in Business Combinations (Topic 805)regardingClarifying the Definitionrecognition and measurement of a Business.This guidance provides a more robust framework to use in determining when a set ofcontract assets and activities is a business. Because the current definition ofliabilities in a business is interpreted broadly and can be difficultcombination. These items are recognized at fair value on acquisition under current guidance. The new guidance requires an acquiring entity to apply stakeholders indicated that analyzing transactions is inefficientguidance in Revenue Recognition (Topic 606) to recognize and costlymeasure contract assets and that the definition does not permit the use of reasonable judgment. The amendments provide more consistencycontract liabilities in applying the guidance, reduce the costs of application, and make the definition of a business more operable. Thecombination. This guidance is effective for the Company beginning July 1, 2018. Early adoption is permitted.2022. The Company is currently assessing the impact of this guidance on its financial statements disclosure.and related disclosures, but does not expect the impact on its financial results to be material.
9
2.Accounts receivable, net and other receivables and finance loans receivable, net
In January 2017,
Accounts receivable, net and other receivables
The Company’s accounts receivable, net, and other receivables as of March 31, 2022, and June 30, 2021, are presented in the FASB issued guidance regardingSimplifyingtable below:
|
|
|
|
| March 31, |
| June 30, |
| |||||
|
|
|
|
| 2022 |
|
| 2021 |
| ||||
|
|
|
|
|
|
|
|
|
|
|
|
|
|
| Accounts receivable, trade, net | $ |
| 10,025 |
|
| $ |
| 10,493 |
| |||
| Accounts receivable, trade, gross |
|
| 10,479 |
|
|
|
| 10,760 |
| |||
| Allowance for doubtful accounts receivable, end of period |
|
| 454 |
|
|
|
| 267 |
| |||
|
| Beginning of period |
|
| 267 |
|
|
|
| 253 |
| ||
|
| Reversed to statement of operations |
|
| (60) |
|
|
|
| (182) |
| ||
|
| Charged to statement of operations |
|
| 251 |
|
|
|
| 232 |
| ||
|
| Utilized |
|
| (3) |
|
|
|
| (59) |
| ||
|
| Foreign currency adjustment |
|
| (1) |
|
|
|
| 23 |
| ||
|
|
|
|
|
|
|
|
|
|
|
|
|
|
| Current portion of amount outstanding related to sale of interest in Bank Frick |
|
| 3,890 |
|
|
|
| 7,500 |
| |||
| Loans provided to Carbon |
|
| 0 |
|
|
|
| 0 |
| |||
| Current portion of total held to maturity investments |
|
| 0 |
|
|
|
| 0 |
| |||
|
| Investment in 7.625% of Cedar Cellular Investment 1 (RF) (Pty) Ltd 8.625% notes |
|
| 0 |
|
|
|
| 0 |
| ||
| Other receivables |
|
| 10,520 |
|
|
|
| 8,590 |
| |||
|
| Total accounts receivable, net and other receivables | $ |
| 24,435 |
|
| $ |
| 26,583 |
| ||
|
|
|
|
|
|
|
|
|
|
|
|
|
|
Current portion of amount outstanding related to sale of interest in Bank Frick represents the Testamount due from the purchaser related to the sale of Bank Frick. The Company received the first scheduled repayment of $7.5 million in October 2021 and the remaining amount of $3.9 million is due in July 2022.
The loan of $3.0 million provided to Carbon was scheduled to be repaid before June 30, 2020, however, Carbon requested a payment holiday as a result of the impact of the COVID-19 pandemic on its business. The parties had not agreed to new repayment terms as of March 31, 2022. However, the Company acknowledges the unexpected and ongoing challenges facing Carbon and determined in June 2021 to create an allowance for Goodwill Impairment.This guidance removesdoubtful loans receivable of $3.0 million due to these circumstances and ongoing operating losses incurred by Carbon.
Investment in 7.625% of Cedar Cellular Investment 1 (RF) (Pty) Ltd 8.625% notes represents the requirement for an entityinvestment in a note which matures in August 2022. The carrying value as of each of March 31, 2022 and June 30, 2021, respectively was $0 (nil). The note is included in other long-term assets as of June 30, 2021 (refer to calculateNote 5).
Other receivables include prepayments, deposits and other receivables.
Contractual maturities of held to maturity investments
Summarized below is the impliedcontractual maturity of the Company’s held to maturity investment as of March 31, 2022:
|
|
|
|
|
|
|
|
| Cost basis |
|
| Estimated fair value(1) |
|
| Due in one year or less | $ | 0 |
| $ | 0 |
| ||||||
| Due in one year through five years(2) |
| 0 |
|
| 0 |
| ||||||
| Due in five years through ten years |
| 0 |
|
| 0 |
| ||||||
| Due after ten years |
| 0 |
|
| 0 |
| ||||||
|
|
| Total | $ | 0 |
| $ | 0 |
| ||||
(1) The estimated fair value of goodwill (as part of step 2the Cedar Cellular note has been calculated utilizing the Company’s portion of the current goodwill impairment test) in measuring a goodwill impairment loss. The guidance is effective forsecurity provided to the Company beginning July 1, 2020. Early adoptionby Cedar Cellular, namely, Cedar Cellular’s investment in Cell C.
(2) The cost basis is permitted for interim or annual goodwill impairment tests performed on testing dates after January 1, 2017. zero ($0.0 million).
10
2.Accounts receivable, net and other receivables and finance loans receivable, net (continued)
Finance loans receivable, net
The Company is currently assessing the impact of this guidance.
8
1. Basis of Presentation and Summary of Significant Accounting Policies (continued)
Recent accounting pronouncements not yet adoptedCompany’s finance loans receivable, net, as of DecemberMarch 31, 2017 (continued)
In May 2017, the FASB issued guidance regardingCompensation—Stock Compensation (Topic 718): Scope of Modification Accounting.The guidance amends the scope of modification accounting for share-based payment arrangements2022, and provides guidance on the types of changes to the terms or conditions of share-based payment awards to which an entity would be required to apply modification accounting under Accounting Standards Codification 718. Specifically, an entity would not apply modification accounting if the fair value, vesting conditions, and classification of the awardsJune 30, 2021, are the same immediately before and after the modification. The guidance is effective for the Company beginning July 1, 2018. Early adoption is permitted. The Company is currently assessing the impact of this guidance on its financial statements disclosure.
2. Pre-funded social welfare grants receivable
Pre-funded social welfare grants receivable represents primarily amounts pre-funded by the Company to certain merchants participatingpresented in the merchant acquiring system. The January 2018 payment service commenced on January 2, 2018, but the Company pre-funded certain merchants participating in the merchant acquiring systems on December 30, 2017. The July 2017 payment service commenced on July 1, 2017, but the Company pre-funded certain merchants participating in the merchant acquiring systems on the last day of June 2017.table below:
|
|
|
|
| March 31, |
| June 30, |
| |||||
|
|
|
|
| 2022 |
| 2021 | ||||||
|
|
|
|
|
|
|
|
|
|
|
|
|
|
| Microlending finance loans receivable, net | $ |
| 22,196 |
|
| $ |
| 21,142 |
| |||
| Microlending finance loans receivable, gross |
|
| 24,662 |
|
|
|
| 23,491 |
| |||
| Allowance for doubtful finance loans receivable, end of period |
|
| 2,466 |
|
|
|
| 2,349 |
| |||
|
| Beginning of period |
|
| 2,349 |
|
|
|
| 1,858 |
| ||
|
| Reversed to statement of operations |
|
| 0 |
|
|
|
| (1,004) |
| ||
|
| Charged to statement of operations |
|
| 1,026 |
|
|
|
| 2,060 |
| ||
|
| Utilized |
|
| (873) |
|
|
|
| (967) |
| ||
|
| Foreign currency adjustment |
|
| (36) |
|
|
|
| 402 |
| ||
|
|
|
|
|
|
|
|
|
|
|
|
|
|
|
|
|
|
|
|
|
|
|
|
|
|
|
|
|
| Total finance loans receivable, net | $ |
| 22,196 |
|
| $ |
| 21,142 |
| ||
|
|
|
|
|
|
|
|
|
|
|
|
|
|
3. Inventory
The Company’s inventory comprised the following categorycategories as of DecemberMarch 31, 20172022, and June 30, 2017.2021:
|
| March 31, |
|
| June 30, |
| |
|
|
| 2022 |
|
| 2021 |
|
|
|
|
|
|
|
|
|
| Finished goods | $ | 22,104 |
| $ | 22,361 |
|
|
| $ | 22,104 |
| $ | 22,361 |
|
| December 31, | June 30, | |||||
| 2017 | 2017 | |||||
| Finished goods | $ | 12,482 | $ | 8,020 | ||
| $ | 12,482 | $ | 8,020 |
4. Settlement assets
As of March 31, 2022, and settlement obligationsJune 30, 2021, finished goods includes $15.7 million and $16.5 million, respectively, of Cell C airtime inventory that was previously classified as finished goods subject to sale restrictions.
Settlement assets comprise (1) cash received from the South African government that
In support of Cell C’s liquidity position, the Company holds pending disbursementhas limited the resale of this airtime to recipient cardholders of social welfare grants and (2) cash received from customers on whose behalf the Company processes payroll payments that the Company will disburse to customer employees, payroll-related payees and other payees designated by the customer.its own distribution channels until such time as Cell C’s recapitalisation process is concluded.
Settlement obligations comprise (1) amounts that the Company is obligated to disburse to recipient cardholders of social welfare grants, and (2) amounts that the Company is obligated to pay to customer employees, payroll-related payees and other payees designated by the customer.
The balances at each reporting date may vary widely depending on the timing of the receipts and payments of these assets and obligations.
5. 4. Fair value of financial instruments
Fair value of financial instruments
Initial recognition and measurement
Financial instruments are recognized when the Company becomes a party to the transaction. Initial measurements are at cost, which includes transaction costs.
Risk management
The Company seeks to reducemanages its exposure to currencies other than the South African rand through a policy of matching, to the extent possible, assets and liabilities denominated in those currencies. In addition, the Company utilized financial instruments in order to economically hedge its exposure tocurrency exchange, rate and interest rate fluctuations arising from its operations. The Company is also exposed to translation, interest rate, customer concentration, credit, and equity price and liquidity risks.risks as discussed below.
Currency exchange risk
The Company is subject to currency exchange risk because it purchases inventories that it is required to settle in other currencies, primarily the euro and U.S. dollar. The Company has used forward contracts in order to limit its exposure in these transactions to fluctuations in exchange rates between the South African rand (“ZAR”), on the one hand, and the U.S. dollar and the euro, on the other hand.
9
5. Fair value of financial instruments (continued)
Fair value of financial instruments (continued)
Risk management (continued)
Translation risk
Translation risk relates to the risk that the Company’s results of operations will vary significantly as the U.S. dollar is its reporting currency, but it earns most of its revenues and incurs mosta significant amount of its expenses in ZAR. The U.S. dollar to ZAR exchange rate has fluctuated significantly against the ZAR over the past three years. As exchange rates are outside the Company’s control, there can be no assurance that future fluctuations will not adversely affect the Company’s results of operations and financial condition.
11
4. Fair value of financial instruments (continued)
Risk management (continued)
Interest rate risk
As a result of its normal borrowing and lending activities, the Company’s operating results are exposed to fluctuations in interest rates, which it manages primarily through regular financing activities. Interest rates in South Africa are trending upwards and the Company expects higher interest rates in the foreseeable future which will increase its cost of borrowing. The Company periodically evaluates the cost and effectiveness of interest rate hedging strategies to manage this risk. The Company generally maintains limited investments in cash equivalents and held to maturity investments and has occasionally invested in marketable securities.
Working capital finance customer concentration
Microlending credit risk
Working capital finance customer concentration risk relates to the risk of loss that the Company would incur as a result of its concentration of working capital financing receivables. During the year ended June 30, 2017, the Company commenced marketing activities to develop and expand its working capital financing receivables base.
The Company manages theis exposed to credit risk through on-going marketing effortsin its microlending activities, which provides unsecured short-term loans to further expand its customer basequalifying customers. Credit bureau checks as well as through regular contactan affordability test are conducted as part of the risk management process, both of which being in line with its customer to assess their need for the Company’s product.local regulations. The affordability test takes into account a variety of factors such as other debts and total expenditures on normal household and lifestyle expenses.
Credit risk
Credit risk relates to the risk of loss that the Company would incur as a result of non-performance by counterparties. The Company maintains credit risk policies with regard toin respect of its counterparties to minimize overall credit risk. These policies include an evaluation of a potential counterparty’s financial condition, credit rating, and other credit criteria and risk mitigation tools as the Company’s management deems appropriate.
With respect to credit risk on financial instruments, the Company maintains a policy of entering into such transactions only with South African and European financial institutions that have a credit rating of “BB+”“B” (or its equivalent) or better, as determined by credit rating agencies such as Standard & Poor’s, Moody’s and Fitch Ratings.
Microlending credit risk
The Company is exposed to credit risk in its microlending activities, which provides unsecured short-term loans to qualifying customers. The Company manages this risk by performing an affordability test for each prospective customer and assigns a “creditworthiness score”, which takes into account a variety of factors such as other debts and total expenditures on normal household and lifestyle expenses.
Equity price and liquidity risk
Equity price risk relates to the risk of loss that the Company would incur as a result of the volatility in the exchange-traded price of equity securities that it holds and the risk that it may not be able to liquidate these securities.holds. The market price of these securities may fluctuate for a variety of reasons and, consequently, the amount that the Company may obtain in a subsequent sale of these securities may significantly differ from the reported market value.
Liquidity
Equity liquidity risk relates to the risk of loss that the Company would incur as a result of the lack of liquidity on the exchange on which thesethose securities are listed. The Company may not be able to sell some or all of these securities at one time, or over an extended period of time without influencing the exchange tradedexchange-traded price, or at all.
Financial instruments
The following section describes the valuation methodologies the Company uses to measure its significant financial assets and liabilities at fair value.
10
5. Fair value of financial instruments (continued)
Financial instruments (continued)
In general, and where applicable, the Company uses quoted prices in active markets for identical assets or liabilities to determine fair value. This pricing methodology would apply to Level 1 investments. If quoted prices in active markets for identical assets or liabilities are not available to determine fair value, then the Company uses quoted prices for similar assets and liabilities or inputs other than the quoted prices that are observable either directly or indirectly. These investments would be included in Level 2 investments. In circumstances in which inputs are generally unobservable, values typically reflect management’s estimates of assumptions that market participants would use in pricing the asset or liability. The fair values are therefore determined using model-based techniques that include option pricing models, discounted cash flow models, and similar techniques. Investments valued using such techniques are included in Level 3 investments.
Asset measured at fair value using significant unobservable inputs – investment in Cell C
The Company'sCompany’s Level 3 asset represents an investment of 75,000,000 class “A” shares in Cell C, (Pty) Limited (“Cell C”), a leadingsignificant mobile telecoms provider in South Africa (refer to Note 6). Africa. The Company has designated such shares as available for sale investments. Cell C shares are not listed and there is no readily determinable market value forused a discounted cash flow model developed by the shares. The Company has developed an adjusted EBITDA multiple valuation model in order to determine the fair value of its investment in Cell C as of March 31, 2022, and June 30, 2021, and valued Cell C at $0.0 (zero) at March 31, 2022, and June 30, 2021. The Company believes the Cell C shares. The primary inputs tobusiness plan utilized in the Company’s valuation model areis reasonable based on the current performance and the expected changes in Cell C’s adjusted EBITDA, an EBITDA multiple andbusiness model. The Company incorporates the payments under Cell C’s external debt. The EBITDA multiple was determined based on an analysis oflease liabilities into the cash flow forecasts and assumes that Cell C’s peer group, which comprisesdeferred tax assets would be utilized over the primary mobile operators (Vodacom, MTNforecast period. The Company utilized the latest revised business plan provided by Cell C management for the period ended December 31, 2025, for the March 31, 2022 valuation, and Telkom)an earlier version of the business plan for the period ended December 31, 2025 for the June 30, 2021 valuation.
12
4. Fair value of financial instruments (continued)
Financial instruments (continued)
Asset measured at fair value using significant unobservable inputs – investment in Cell C (continued)
The following key valuation inputs were used as of March 31, 2022 and June 30, 2021:
Weighted Average Cost of Capital ("WACC"): | Between 18% and 24% over the period of the forecast | ||
Long term growth rate: | 3% (3% as of June 30, 2021) | ||
Marketability discount: | 10% | ||
Minority discount: | 15% | ||
Net adjusted external debt - March 31, 2022:(1) | ZAR 11.7 billion ($0.8 billion), no lease liabilities included | ||
Net adjusted external debt - June 30, 2021:(2) | ZAR 11.2 billion ($0.8 billion), no lease liabilities included |
(1) translated from ZAR to U.S. dollars at exchange rates applicable as of March 31, 2022.
(2) translated from ZAR to U.S. dollars at exchange rates applicable as of June 30, 2021.
The following table presents the impact on the carrying value of the Company’s Cell C investment of a 3.3% increase and 2.5% decrease in the South African marketplace.WACC rate and the EBITDA margins respectively used in the Cell C valuation on March 31, 2022, all amounts translated at exchange rates applicable as of March 31, 2022:
| Sensitivity for fair value of Cell C investment |
| 3.3% increase |
| 2.5% decrease |
|
| WACC rate | $ | 0 | $ | 432 |
|
| EBITDA margin | $ | 548 | $ | 0 |
|
The fair value of the Cell C shares as of DecemberMarch 31, 2017,2022, represented approximately 12%0% of the Company’s total assets, including these shares. The Company expects to hold these shares for an extended period of time and it is not concerned withthat there will be short-term equity price volatility with respect to these shares provided thatparticularly given the underlying business, economic and management characteristicscurrent situation of the company remain sound.Cell C’s business.
Derivative transactions - Foreign exchange contracts
As part of the Company’s risk management strategy, the Company enters into derivative transactions to mitigate exposures to foreign currencies in respect of operational costs using foreign exchange contracts. These foreign exchange contracts are over-the-counter derivative transactions. Substantially all of the Company’s derivative exposures are with counterparties that have long-term credit ratings of “BB+““B” (or equivalent) or better. The Company uses quoted prices in active markets for similar assets and liabilities to determine fair value (Level 2). The Company has no derivatives that require fair value measurement under Level 1 or 3 of the fair value hierarchy.
The Company had no0 outstanding foreign exchange contracts as of March 31, 2022.
The Company’s outstanding foreign exchange contracts as of June 30, 2021, were as follows:
Notional amount ('000) | Strike price | Fair market | Maturity | |||
EUR | 5.7 | USD | 1.1911 | USD | 1.1859 | July 02, 2021 |
Derivative transactions - Foreign exchange option contracts
The Company held a significant amount of U.S. dollars and intended to use a portion of these funds to settle part of the purchase consideration related to the Connect Group acquisition. The purchase consideration was expected to be settled in ZAR. Accordingly, the Company entered into foreign exchange option contracts with FirstRand Bank Limited acting through its Rand Merchant Bank division (“RMB”) in November 2021 in order to manage the risk of currency volatility and to fix the ZAR amount to be utilized for part of the purchase consideration settlement. These foreign exchange option contracts, also known as synthetic forwards, are over-the-counter derivative transactions (Level 2). RMB’s long-term credit rating is “BB”. The Company uses quoted prices in active markets for similar assets and liabilities to determine fair value of the foreign exchange option contracts (Level 2).
The Company marked-to-market the synthetic forwards as of December 31, 20172021, using a Black-Scholes option pricing model which determined the respective fair value of the options utilizing current market parameters, and June 30, 2017,recorded an unrealized loss of $2.4 million during the three months ended December 31, 2021. These currency options matured on February 24, 2022. The Company generated a realized gain of $3.7 million upon maturity. During the three and nine months ended March 31, 2022, the Company recorded a net gain of $6.1 million (which includes the reversal of the $2.4. million unrealized loss which was previously recorded) and $3.7 million, respectively. The net gain is included in the caption gain related to fair value adjustment to currency options in the Company’s unaudited condensed consolidated statements of operations for the three and nine months ended March 31, 2022.
13
4. Fair value of financial instruments (continued)
The following table presents the Company’s assets measured at fair value on a recurring basis as of DecemberMarch 31, 2017,2022, according to the fair value hierarchy:
|
|
|
|
|
| Quoted Price in Active Markets for Identical Assets (Level 1) |
|
| Significant Other Observable Inputs (Level 2) |
|
| Significant Unobservable Inputs (Level 3) |
|
| Total |
|
|
|
|
|
|
|
|
|
|
| |||||||
| Assets |
|
|
|
|
|
|
|
|
|
|
|
| |||
| Investment in Cell C | $ | 0 |
| $ | 0 |
| $ | 0 |
| $ | 0 |
| |||
| Related to insurance business: |
|
|
|
|
|
|
|
|
|
|
|
| |||
|
| Cash, cash equivalents and restricted cash (included in other long-term assets) |
| 411 |
|
| 0 |
|
| 0 |
|
| 411 |
| ||
|
| Fixed maturity investments (included in cash and cash equivalents) |
| 3,090 |
|
| 0 |
|
| 0 |
|
| 3,090 |
| ||
|
| Total assets at fair value | $ | 3,501 |
| $ | 0 |
| $ | 0 |
| $ | 3,501 |
| ||
|
|
|
|
|
|
|
|
|
|
|
|
|
|
|
|
|
| Quoted | ||||||||||||
| price in | ||||||||||||
| active | Significant | |||||||||||
| markets for | other | Significant | ||||||||||
| identical | observable | unobservable | ||||||||||
| assets | inputs | inputs | ||||||||||
| (Level 1) | (Level 2) | (Level 3) | Total | |||||||||
| Assets | ||||||||||||
| Investment in Cell C | $ | - | $ | - | $ | 161,695 | $ | 161,695 | ||||
| Related to insurance business: | ||||||||||||
| Cash and cash equivalents (included in other long-term assets) | 664 | - | - | $ | 664 | |||||||
| Fixed maturity investments (included in cash and cash equivalents) | 7,458 | - | - | 7,458 | ||||||||
| Other | - | 40 | - | 40 | ||||||||
| Total assets at fair value | $ | 8,122 | $ | 40 | $ | 161,695 | $ | 169,857 |
11
5. 4. Fair value of financial instruments (continued)
Financial instruments (continued)
The following table presents the Company’s assets measured at fair value on a recurring basis as of June 30, 2017,2021, according to the fair value hierarchy:
|
|
|
|
|
| Quoted Price in Active Markets for Identical Assets (Level 1) |
|
| Significant Other Observable Inputs (Level 2) |
|
| Significant Unobservable Inputs (Level 3) |
|
| Total |
|
|
|
|
|
|
|
|
|
|
| |||||||
| Assets |
|
|
|
|
|
|
|
|
|
|
|
| |||
| Investment in Cell C | $ | 0 |
| $ | 0 |
| $ | 0 |
| $ | 0 |
| |||
| Related to insurance business |
|
|
|
|
|
|
|
|
|
|
|
| |||
|
| Cash and cash equivalents (included in other long-term assets) |
| 381 |
|
| 0 |
|
| 0 |
|
| 381 |
| ||
|
| Fixed maturity investments (included in cash and cash equivalents) |
| 3,158 |
|
| 0 |
|
| 0 |
|
| 3,158 |
| ||
|
|
| Total assets at fair value | $ | 3,539 |
| $ | 0 |
| $ | 0 |
| $ | 3,539 |
| |
| Quoted | ||||||||||||
| Price in | ||||||||||||
| Active | Significant | |||||||||||
| Markets for | Other | Significant | ||||||||||
| Identical | Observable | Unobservable | ||||||||||
| Assets | Inputs | Inputs | ||||||||||
| (Level 1) | (Level 2) | (Level 3) | Total | |||||||||
| Assets | ||||||||||||
| Related to insurance business: | ||||||||||||
| Cash and cash equivalents (included in other long-term assets) | $ | 627 | $ | - | $ | - | $ | 627 | ||||
| Fixed maturity investments (included in cash and cash equivalents) | 5,160 | - | - | 5,160 | ||||||||
| Other | - | 37 | - | 37 | ||||||||
| Total assets at fair value | $ | 5,787 | $ | 37 | $ | - | $ | 5,824 |
There have been no0 transfers in or out of Level 3 during the three and sixnine months ended DecemberMarch 31, 20172022 and 2016,2021, respectively.
Assets
There was 0 movement in the carrying value of assets measured at fair value on a recurring basis, and categorized within Level 3, during the three and nine months ended March 31, 2022 and 2021.
Summarized below is the movement in the carrying value of assets and liabilities measured at fair value on a nonrecurringrecurring basis, and categorized within Level 3, during the nine months ended March 31, 2022:
|
|
|
|
|
| Carrying value |
| |
| Assets |
|
|
| ||||
| Balance as of June 30, 2021 | $ | 0 |
| ||||
|
| Foreign currency adjustment(1) |
| 0 |
| |||
|
|
| Balance as of March 31, 2022 | $ | 0 |
| ||
(1) The Company measures itsforeign currency adjustment represents the effects of the fluctuations between the ZAR and the U.S. dollar on the carrying value.
14
4. Fair value of financial instruments (continued)
Summarized below is the movement in the carrying value of assets and liabilities measured at fair value on a recurring basis, and categorized within Level 3, during the nine months ended March 31, 2021:
|
|
|
|
|
| Carrying value |
| |
| Assets |
|
|
| ||||
| Balance as of June 30, 2020 | $ | 0 |
| ||||
|
| Foreign currency adjustment(1) |
| 0 |
| |||
|
|
| Balance as of March 31, 2021 | $ | 0 |
| ||
(1) The foreign currency adjustment represents the effects of the fluctuations between the ZAR and the U.S. dollar on the carrying value.
Assets measured at fair value on a nonrecurring basis when they are deemed to be other-than-temporarily impaired.
The Company has no liabilities that are measuredmeasures equity investments without readily determinable fair values at fair value on a nonrecurring basis. The Company reviews the carrying values of its assets when events and circumstances warrant and considers all available evidence in evaluating when declines in fair value are other-than-temporary. The fair values of the Company’s assetsthese investments are determined based on valuation techniques using the best information available, and may include quoted market prices, market comparables, and discounted cash flow projections. An impairment charge is recorded when the cost of the assetsasset exceeds its fair value and the excess is determined to be other-than-temporary. The Company has not recordedRefer to Note 5 for any impairment charges recorded during the reporting periods presented herein. The Company has no liabilities that are measured at fair value on a nonrecurring basis.
6.
5.Equity-accounted investments and other long-term assets
Equity-accounted investments
The Company’s ownership percentage in its equity-accounted investments as of December 31, 2017 and June 30, 2017, was as follows:
| December 31, | June 30, | |||||
| 2017 | 2017 | |||||
| DNI-4PL (Pty) Ltd (“DNI”) | 45% | - | ||||
| Bank Frick & Co AG (“Bank Frick”) | 30% | - | ||||
| Finbond Group Limited (“Finbond”) | 27% | 26% | ||||
| KZ One Limited (formerly One Credit Limited) (“KZ One”) | 25% | 25% | ||||
| SmartSwitch Namibia (Pty) Ltd (“SmartSwitch Namibia”) | 50% | 50% | ||||
| Walletdoc Proprietary Limited (“Walletdoc”) | 20% | 20% |
On July 27, 2017, the Company subscribed for 44,999,999 ordinary A shares in DNI, representing a 45% voting and economic interest in DNI, for a subscription price of ZAR 945.0 million ($72.0 million) in cash. Under the terms of the Company’s agreements with DNI, the Company is requiredRefer to pay to DNI an additional amount of up to ZAR 360 million ($29.1 million, translated at the foreign exchange rates applicable as of December 31, 2017), in cash, subject to the achievement of certain performance targets by DNI. The Company has not accrued for this contingent consideration as of December 31, 2017. Net1 SA has pledged, among other things, its entire equity interest in DNI as security for the South African facilities described in Note 10 used to partially fund the acquisition of Cell C.
12
6. Equity-accounted investments and other long-term assets (continued)
Equity-accounted investments (continued)
On October 2, 2017, the Company acquired a 30% interest in Bank Frick, a fully licensed bank based in Balzers, Liechtenstein, from the Kuno Frick Family Foundation (“Frick Foundation”) for approximately CHF 39.8 million ($40.9 million) in cash. On January 26, 2018, the parties entered into an addendum to the Bank Frick shareholders agreement pursuant to which the Company agreed to purchase an additional 5% in Bank Frick from the Frick Foundation for CHF 10.4 million ($10.7 million) and the Frick Foundation agreed to contribute approximately CHF 3.8 million ($3.9 million) to Bank Frick to facilitate the development of Bank Frick’s Fintech and blockchain businesses. The Company has an option, exercisable until October 2, 2019, to acquire an additional 35% interest in Bank Frick.
Bank Frick provides a complete suite of banking services, with one of its key strategic pillars being the provision of payment services and funding of financial technology opportunities. Bank Frick holds acquiring licenses from both Visa and MasterCard and operates a branch in London. The Company and Bank Frick have jointly identified several funding opportunities, including for the Company’s card issuing and acquiring and transaction processing activities as well new opportunities in cryptocurrency and blockchain. The investment in Bank Frick has the potential to provide the Company with a stable, long-term and strategic relationship with a fully-licensed bank.
As of December 31, 2017, the Company owned 205,483,967 shares in Finbond. Finbond is listed on the Johannesburg Stock Exchange and its closing price on December 29, 2017, the last trading day of the quarter, was R3.39 per share. The aggregate value of the Company’s holding in Finbond on December 31, 2017 was R696.6 million ($56.3 million translated at exchange rates applicable as of December 31, 2017). On July 13, 2017, the Company acquired an additional 3.6 million shares in Finbond for approximately ZAR 11.2 million ($0.8 million). On July 17, 2017, the Company, pursuant to its election, received an additional 4,361,532 shares in Finbond as a capitalization share issue in lieu of a dividend.
On October 7, 2016, the Company provided a loan of ZAR 139.2 million ($10.0 million, translated at the foreign exchange rates applicable on the date of the loan) to Finbond in order to partially finance Finbond’s expansion strategy in the United States. The loan is included in accounts receivable, net, on the Company’s unaudited condensed consolidated balance sheet as of December 31, 2017 and June 30, 2017. Interest on the loan is payable quarterly in arrears and is based on the London Interbank Offered Rate (“LIBOR”) in effect from time to time plus a margin of 12.00%. The LIBOR rate was 1.4874% on December 31, 2017. The loan was initially set to mature at the earlier of Finbond concluding a rights offer or February 28, 2017, but the agreement was subsequently amended to extend the repayment date to on or before February 28, 2018, or such later date as may be mutually agreed by the parties in writing. The Company has the right to elect for the loan to be repaid in either Finbond ordinary shares, including through a rights offering, (in accordance with an agreed mechanism) or in cash. The Company must make a repayment election within 180 days after the repayment date otherwise the repayment election will automatically default to repayment in ordinary shares. Finbond has undertaken to perform all necessary steps reasonably required to effect the issuance of shares to settle the repayment of the loan if that option is elected by the Company.
The Company has provided a credit facility of up to $10 million in the form of convertible debt to KZ One, of which $2 million had been drawn as of December 31, 2017 and June 30, 2017.
Summarized below is the movement in equity-accounted investments during the six months ended December 31, 2017:
| DNI | Bank Frick | Finbond | Other(1) | Total | |||||||||||
| Investment in equity: | |||||||||||||||
| Balance as of June 30, 2017 | $ | - | $ | - | $ | 18,961 | $ | 6,742 | $ | 25,703 | |||||
| Acquisition of shares | 72,001 | 40,892 | 1,941 | - | 114,834 | ||||||||||
| Stock-based compensation | - | - | (207 | ) | - | (207 | ) | ||||||||
| Comprehensive income (loss): | 1,911 | 322 | 874 | 95 | 3,202 | ||||||||||
| Other comprehensive loss | - | - | (227 | ) | - | (227 | ) | ||||||||
| Equity accounted earnings (loss) | 1,911 | 322 | 1,101 | 95 | 3,429 | ||||||||||
| Share of net income (loss) | 3,240 | 487 | 1,931 | 95 | 5,753 | ||||||||||
| Amortization of acquired intangible assets | (1,845 | ) | (219 | ) | - | - | (2,064 | ) | |||||||
| Deferred taxes on acquired intangible assets | 516 | 54 | - | - | 570 | ||||||||||
| Dilution resulting from corporate transactions | - | - | (830 | ) | - | (830 | ) | ||||||||
| Dividends received | (1,765 | ) | - | (1,096 | ) | (400 | ) | (3,261 | ) | ||||||
| Foreign currency adjustment(2) | 4,369 | (169 | ) | 1,134 | (381 | ) | 4,953 | ||||||||
| Balance as of December 31, 2017 | $ | 76,516 | $ | 41,045 | $ | 21,607 | $ | 6,056 | $ | 145,224 |
13
6. Equity-accounted investments and other long-term assets (continued)
Equity-accounted investments (continued)
| DNI | Bank Frick | Finbond | Other(1) | Total | |||||||||||
| Investment in loans: | |||||||||||||||
| Balance as of June 30, 2017 | $ | - | $ | - | $ | - | $ | 2,159 | $ | 2,159 | |||||
| Foreign currency adjustment(2) | - | - | - | 9 | 9 | ||||||||||
| Balance as of December 31, 2017 | $ | - | $ | - | $ | - | $ | 2,168 | $ | 2,168 | |||||
| Equity | Loans | Total | |||||||||||||
| Carrying amount as of: | |||||||||||||||
| June 30, 2017 | $ | 25,703 | $ | 2,159 | $ | 27,862 | |||||||||
| December 31, 2017 | $ | 145,224 | $ | 2,168 | $ | 147,392 |
(1) Includes KZ One, SmartSwitch Namibia and Walletdoc;(2) The foreign currency adjustment represents the effects of the fluctuations South African rand, Nigerian naira and the Namibian dollar, and the U.S. dollar on the carrying value.
Other long-term assets
Summarized below is the breakdown of other long-term assets as of December 31, 2017, and June 30, 2017:
| December 31, | June 30, | |||||
| 2017 | 2017 | |||||
| Investment in 15% of Cell C (Pty) Limited (“Cell C”), at fair value(1) | $ | 161,695 | $ | - | ||
| Investment in 12% of One MobiKwik Systems Private Limited (“MobiKwik”), at cost | 27,598 | 26,317 | ||||
| Total equity investments | 189,293 | 26,317 | ||||
| Investment in 7.625% of Cedar Cellular Investment 1 (RF) (Pty) Ltd 8.625% notes due in 2022 | 9,182 | - | ||||
| Total held to maturity investments | 9,182 | - | ||||
| Long-term portion of payments to agents in South Korea amortized over the contract period | 20,512 | 17,290 | ||||
| Policy holder assets under investment contracts (Note 8) | 664 | 627 | ||||
| Reinsurance assets under insurance contracts Note 8) | 212 | 191 | ||||
| Other long-term assets | 5,600 | 5,271 | ||||
| Total other long-term assets | $ | 225,463 | $ | 49,696 |
(1) The notes to the unaudited condensed consolidated financial statements included in the Company’s Form 10-Q for the three months ended September 30, 2017, stated that the Cell C investment was carried at cost rather than at fair value. As of September 30, 2017, the fair value of the investment in Cell C approximated its cost.
On August 2, 2017, the Company, through its subsidiary, Net1 Applied Technologies South Africa Proprietary Limited (“Net1 SA”), purchased 75,000,000 class “A” shares of Cell C for an aggregate purchase price of ZAR 2.0 billion ($151.0 million) in cash. The Company funded the transaction through a combination of cash and the facilities described in Note 148 to the Company’s audited consolidated financial statements included in its Annual Report on Form 10-K for the year ended June 30, 2017. Net1 SA has pledged, among2021, for additional information regarding its equity-accounted investments and other things,long-term assets.
Equity-accounted investments
The Company’s ownership percentage in its entire equityequity-accounted investments as of March 31, 2022, and June 30, 2021, was as follows:
|
|
|
|
|
|
|
|
|
|
|
|
|
| March 31, |
| June 30, |
| |||
|
|
|
|
|
|
|
|
|
|
|
|
|
| 2022 |
| 2021 |
| |||
| Finbond Group Limited (“Finbond”) |
| 29.0 | % |
| 31.5 | % |
| ||||||||||||
| Carbon Tech Limited (“Carbon”) |
| 25.0 | % |
| 25.0 | % |
| ||||||||||||
| SmartSwitch Namibia (Pty) Ltd (“SmartSwitch Namibia”) |
| 50.0 | % |
| 50.0 | % |
| ||||||||||||
15
5.Equity-accounted investments and other long-term assets (continued)
Equity-accounted investments (continued)
Finbond
As of March 31, 2022, the Company owned 247,438,164 shares in Finbond representing approximately 29.0% of its issued and outstanding ordinary shares. Finbond is listed on the Johannesburg Stock Exchange (“JSE”) and its closing price on March 31, 2022, the last trading day of the month, was ZAR 0.50 per share. The market value, using the March 31, 2022, closing price, of the Company’s holding in Finbond on March 31, 2022, was ZAR 123.7 million ($8.5 million translated at exchange rates applicable as of March 31, 2022).
The Company sold 21,382,769 shares in Finbond for cash during the three and nine months ended March 31, 2022, and recorded a loss of $0.3 million in the caption loss on equity-accounted investment in the Company’s unaudited condensed consolidated statements of operations. The following table presents the calculation of the loss on disposal of Finbond shares during the three and nine months ended March 31, 2022:
|
|
|
|
|
| Three and nine months ended March 31, |
| |
|
| 2022 |
| |||||
| Loss on disposal of Finbond shares: |
|
|
| ||||
| Consideration received in cash | $ | 819 |
| ||||
| Less: carrying value of Finbond shares sold |
| (591) |
| ||||
| Less: release of foreign currency translation reserve from accumulated other comprehensive loss |
| (583) |
| ||||
| Add: release of stock-based compensation charge related to equity-accounted investment |
| 9 |
| ||||
|
| Loss on sale of Finbond shares | $ | (346) |
| |||
Summarized below is the movement in equity-accounted investments and loans provided to equity-accounted investments during the nine months ended March 31, 2022:
|
|
|
|
|
|
|
| Finbond |
| Other(1) |
| Total |
| |||
| Investment in equity |
|
|
|
|
|
|
|
|
| ||||||
|
| Balance as of June 30, 2021 | $ | 9,822 |
| $ | 182 |
| $ | 10,004 |
| |||||
|
|
| Stock-based compensation |
| 9 |
|
| 0 |
|
| 9 |
| ||||
|
|
| Comprehensive loss: |
| (1,800) |
|
| 0 |
|
| (1,800) |
| ||||
|
|
|
| Other comprehensive loss |
| (644) |
|
| 0 |
|
| (644) |
| |||
|
|
|
| Equity accounted loss |
| (1,156) |
|
| 0 |
|
| (1,156) |
| |||
|
|
|
|
| Share of net loss |
| (1,156) |
|
| 0 |
|
| (1,156) |
| ||
|
|
| Dividends received |
| 0 |
|
| (137) |
|
| (137) |
| ||||
|
|
| Disposal of Finbond shares |
| (591) |
|
| 0 |
|
| (591) |
| ||||
|
|
| Foreign currency adjustment(2) |
| (206) |
|
| (4) |
|
| (210) |
| ||||
|
| Balance as of March 31, 2022 | $ | 7,234 |
| $ | 41 |
| $ | 7,275 |
| |||||
|
|
|
|
|
|
|
|
|
|
|
|
|
|
|
|
|
|
|
|
|
|
|
|
| Equity |
| Loans |
| Total |
| |||
| Carrying amount as of : |
|
|
|
|
|
|
|
|
| ||||||
|
|
| June 30, 2021 | $ | 10,004 |
| $ | 0 |
| $ | 10,004 |
| ||||
|
|
| March 31, 2022 | $ | 7,275 |
| $ | 0 |
| $ | 7,275 |
| ||||
|
|
|
|
|
|
|
|
|
|
|
|
|
|
|
|
|
(1) Includes Carbon and SmartSwitch Namibia.
(2) The foreign currency adjustment represents the effects of the fluctuations of the ZAR, Nigerian naira and Namibian dollar against the U.S. dollar on the carrying value.
16
5.Equity-accounted investments and other long-term assets (continued)
Other long-term assets
Summarized below is the breakdown of other long-term assets as of March 31, 2022, and June 30, 2021:
|
|
|
|
|
|
|
|
|
|
|
|
| March 31, |
|
| June 30, | |
|
|
|
|
|
|
|
|
|
|
|
|
|
| 2022 |
|
| 2021 |
|
|
|
|
|
|
|
|
|
|
|
|
|
|
|
|
|
|
| Total equity investments | $ | 76,297 |
| $ | 76,297 | |||||||||||
|
|
| Investment in 15% of Cell C, at fair value (Note 4) |
| 0 |
|
| 0 | |||||||||
|
|
| Investment in 10% of MobiKwik (June 30, 2021: 12%) |
| 76,297 |
|
| 76,297 | |||||||||
|
|
| Investment in 87.5% of CPS(1) |
| 0 |
|
| 0 | |||||||||
| Total held to maturity investments |
| 0 |
|
| 0 | |||||||||||
|
|
| Investment in 7.625% of Cedar Cellular Investment 1 (RF) (Pty) Ltd 8.625% notes(2) |
| 0 |
|
| 0 | |||||||||
| Long-term portion of amount due related to sale of interest in Bank Frick(3) |
| 0 |
|
| 3,890 | |||||||||||
| Policy holder assets under investment contracts (Note 7) |
| 411 |
|
| 381 | |||||||||||
| Reinsurance assets under insurance contracts (Note 7) |
| 1,284 |
|
| 1,298 | |||||||||||
|
|
| Total other long-term assets | $ | 77,992 |
| $ | 81,866 | |||||||||
|
|
|
|
|
|
|
|
|
|
|
|
|
|
|
|
|
|
(1) On October 16, 2020, the High Court of South Africa, Gauteng Division, Pretoria ordered that CPS be placed into liquidation.
(2) The note is included in accounts receivable, net and other receivables as of March 31, 2022 (refer to Note 2).
(3) Long-term portion of amount due related to sale of interest in Cell CBank Frick as security for the South African facilities described in Note 10 used to partially fund the acquisition of Cell C.
The Company has signed a subscription agreement with MobiKwik, which is India’s largest independent mobile payments network, with over 65 million users and 2.0 million merchants. Pursuant to the subscription agreement, the Company agreed to make an equity investment of up to $40.0 million in MobiKwik over a 24 month period. The Company made an initial $15.0 million investment in August 2016 and a further $10.6 million investment in June 2017, under this subscription agreement. As of June 30, 2017,2021, represents the amount due from the purchaser in July 2022 and is included in accounts receivable, net, and other receivables as of March 31, 2022 (refer to Note 2).
MobiKwik
In October 2021, the Company owned approximately 13.5%converted its 310,781 shares of MobiKwik. compulsorily convertible cumulative preferences shares to 6,215,620 equity shares in anticipation of MobiKwik’s initial public offering. The Company’s investment percentage remained unchanged following the conversion. The Company’s investment percentage as of March 31, 2022, was 10.2%. The Company did not identify any observable transactions during the three and nine months ended March 31, 2022, and therefore there was no change in the fair value of MobiKwik during these periods. The Company used a transaction, at a price of $245.50 per share in June 2021, as the basis for a fair value adjustment to its investment in MobiKwik during the fourth quarter of fiscal 2021. This fair value adjustment increased the carrying value of its investment in MobiKwik by $23.4 million from $52.9 million to $76.3 million as of June 30, 2021.
In August 2017,early November 2020, MobiKwik raisedentered into an agreement to raise additional fundingcapital through the issuance of additional shares to a new shareholder at a 90% premiumvaluation of $135.54 per share. In mid-March 2021, MobiKwik raised additional capital through the issuance of shares to the Company’s investments and the Company’s percentage ownership was diluted to 12.0%. In addition, throughnew shareholders at a technology agreement, the Company’s Virtual Card technology will be integrated across all MobiKwik wallets in order to provide ubiquity across all merchants in India, and as partvaluation of the Company’s continued strategic relationship, a number$170.33 per share. The Company considered each of our other products including our digital banking platform, are expectedthese transactions to be deployed by MobiKwik over the next year.
In December 2017, the Company purchased,an observable price change in an orderly transaction for cash, $9.0 million of notes, with a face value of $20.5 million,similar or identical equity securities issued by Cedar Cellular Investment 1 (RF) (Pty) Ltd (“Cedar Cellular”), a Cell C shareholder, representing 7.625% ofMobiKwik. The Company used the issuance. TheNovember 2020 valuation as the basis for its adjustment to increase the carrying value in its investment in MobiKwik by $15.1 million from $27.0 million to $42.1 million as of December 31, 2020. The Company used the notes was madeMarch 2021 valuation as the basis for its adjustment to increase the carrying value in connection with the Cell C investment discussed above. The notes bear interest semi-annually at 8.625% per annum on the face value and interest is payable in cash or deferred, at Cedar Cellular’s election, for payment on the maturity date. The notes mature on August 2, 2022. The notes are secured by all of Cedar Cellular’sits investment in Cell C (59,000,000 class “A” shares) andMobiKwik by $10.8 million from $42.1 million to $52.9 million as of March 31, 2021. The change in the fair value of MobiKwik for the Cell C shares pledged exceedsthree and nine months ended March 31, 2021, of $10.8 million and $25.9 million, respectively, is included in the carryingcaption “Change in fair value of the notes as of December 31, 2017. The notes are listed on The International Stock Exchange. The Company has elected to treat the investmentequity securities” in the notes as held to maturity securities.unaudited condensed consolidated statement of operations for the three and nine months ended March 31, 2021.
14
17
6.
5.Equity-accounted investments and other long-term assets (continued)
Available for sale and held to maturity investments (continued)
Other long-term assets (continued)
Revix
In February 2022, the Company sold its entire interest in Revix UK Limited for cash of $0.7 million because the Company did not consider the investment core to its strategy to operate primarily in Southern Africa. The Company had previously written this investment to $0 (nil) and recognized a gain on disposal of $0.7 million, which is included in the caption gain on disposal of equity securities in the Company’s unaudited condensed consolidated statements of operations for the three and nine months ended March 31, 2022.
Summarized below are the components of the Company’s available for saleequity securities without readily determinable fair value and held to maturity investments as of DecemberMarch 31, 2017:2022:
|
|
|
|
|
|
|
|
|
|
| Cost basis |
|
| Unrealized holding |
|
| Unrealized holding |
|
| Carrying |
|
|
|
|
|
|
|
|
|
|
|
|
|
| gains |
|
| losses |
|
| value |
| |
| Equity securities: |
|
|
|
|
|
|
|
|
|
|
|
| ||||||||
|
| Investment in MobiKwik | $ | 26,993 |
| $ | 49,304 |
| $ | 0 |
| $ | 76,297 |
| |||||||
|
| Investment in CPS |
| 0 |
|
| 0 |
|
| 0 |
|
| 0 |
| |||||||
| Held to maturity: |
|
|
|
|
|
|
|
|
|
|
|
| ||||||||
|
| Investment in Cedar Cellular notes (Note 2) |
| 0 |
|
| 0 |
|
| 0 |
|
| 0 |
| |||||||
|
|
|
| Total | $ | 26,993 |
| $ | 49,304 |
| $ | 0 |
| $ | 76,297 |
| |||||
|
|
|
|
|
|
|
|
|
|
|
|
|
|
|
|
|
|
|
|
|
|
| Unrealized | Unrealized | |||||||||||
| holding | holding | Carrying | ||||||||||
| Cost basis | gains | losses | value | |||||||||
| Available for sale: | ||||||||||||
| Investment in Cell C | $ | 161,695 | $ | - | $ | - | $ | 161,695 | ||||
| Held to maturity: | ||||||||||||
| Investment in Cedar Cellular notes | 9,000 | 182 | - | 9,182 | ||||||||
| Total | 170,695 | $ | - | $ | - | $ | 170,695 |
The Company had no available for sale orSummarized below are the components of the Company’s equity securities without readily determinable fair value and held to maturity investments as of June 30, 2017.2021:
Contractual maturities of held to maturity investments
|
|
|
|
|
|
|
|
|
|
| Cost basis |
|
| Unrealized holding |
|
| Unrealized holding |
|
| Carrying |
|
|
|
|
|
|
|
|
|
|
|
|
|
| gains |
|
| losses |
|
| value |
| |
| Equity securities: |
|
|
|
|
|
|
|
|
|
|
|
| ||||||||
|
| Investment in MobiKwik | $ | 26,993 |
| $ | 49,304 |
| $ | 0 |
| $ | 76,297 |
| |||||||
|
| Investment in CPS |
| 0 |
|
| 0 |
|
| 0 |
|
| 0 |
| |||||||
| Held to maturity: |
|
|
|
|
|
|
|
|
|
|
|
| ||||||||
|
| Investment in Cedar Cellular notes |
| 0 |
|
| 0 |
|
| 0 |
|
| 0 |
| |||||||
|
|
|
| Total | $ | 26,993 |
| $ | 49,304 |
| $ | 0 |
| $ | 76,297 |
| |||||
|
|
|
|
|
|
|
|
|
|
|
|
|
|
|
|
|
|
|
|
|
|
Summarized below are the contractual maturities of the Company’s held to maturity investment as of December 31, 2017:
| Cost | Estimated | |||||
| basis | fair value | |||||
| Due in one year or less | $ | - | $ | - | ||
| Due in one year through five years | 9,000 | 9,182 | ||||
| Due in five years through ten years | - | - | ||||
| Due after ten years | - | - | ||||
| Total | $ | 9,000 | $ | 9,182 |
7. 6.Goodwill and intangible assets, net
Goodwill
Goodwill
Summarized below is the movement in the carrying value of goodwill for the sixnine months ended DecemberMarch 31, 2017:2022:
|
|
|
|
|
|
|
|
|
|
|
|
|
|
| Gross value |
|
| Accumulated impairment |
|
| Carrying value |
|
|
| Balance as of June 30, 2021 |
| $ | 42,949 |
| $ | (13,796) |
| $ | 29,153 |
| ||||||||||
|
|
| Foreign currency adjustment (1) |
|
| (630) |
|
| 138 |
|
| (492) |
| |||||||||
|
|
|
| Balance as of March 31, 2022 |
| $ | 42,319 |
| $ | (13,658) |
| $ | 28,661 |
| ||||||||
| Accumulated | Carrying | ||||||||
| Gross value | impairment | value | |||||||
| Balance as of June 30, 2017 | $ | 188,833 | $ | - | $ | 188,833 | |||
| Foreign currency adjustment(1) | 10,662 | - | 10,662 | ||||||
| Balance as of December 31, 2017 | $ | 199,495 | $ | - | $ | 199,495 |
(1) – RepresentsThe foreign currency adjustment represents the effects of the fluctuations between the South African rand, euro and the Korean won,ZAR and the U.S. dollar on the carrying value.
Refer to Note 17 for additional information regarding changes to the Company’s reportable segments during the three months ended December 31, 2021. Goodwill has been allocated to the Company’s reportable segments as follows:
|
|
|
|
|
|
|
|
|
|
|
|
|
|
|
|
|
|
|
|
|
|
| Consumer |
| Merchant |
| Other |
| Carrying value | ||||
|
| Balance as of June 30, 2021 |
| $ | 0 |
| $ | 28,496 |
| $ | 657 |
| $ | 29,153 | ||
|
|
| Foreign currency adjustment (1) |
|
| 0 |
|
| (492) |
|
| 0 |
|
| (492) | |
|
|
|
| Balance as of March 31, 2022 |
| $ | 0 |
| $ | 28,004 |
| $ | 657 |
| $ | 28,661 |
| South | Financial | |||||||||||
| African | International | inclusion and | ||||||||||
| transaction | transaction | applied | Carrying | |||||||||
| processing | processing | technologies | value | |||||||||
| Balance as of June 30, 2017 | $ | 23,131 | $ | 140,570 | $ | 25,132 | $ | 188,833 | ||||
| Foreign currency adjustment(1) | 1,282 | 8,310 | 1,070 | 10,662 | ||||||||
| Balance as of December 31, 2017 | $ | 24,413 | $ | 148,880 | $ | 26,202 | $ | 199,495 |
(1) – RepresentsThe foreign currency adjustment represents the effects of the fluctuations between the South African rand, euro and the Korean won,ZAR and the U.S. dollar on the carrying value.
1518
7.
6.Goodwill and intangible assets, net (continued)
Intangible assets, net
Carrying value and amortization of intangible assets
Summarized below is the carrying value and accumulated amortization of the intangible assets as of DecemberMarch 31, 20172022, and June 30, 2017:2021:
|
|
|
|
| As of March 31, 2022 |
| As of June 30, 2021 |
| ||||||||||||||
|
|
|
|
|
| Gross carrying value |
|
| Accumulated amortization |
|
| Net carrying value |
|
| Gross carrying value |
|
| Accumulated amortization |
|
| Net carrying value |
|
| Finite-lived intangible assets: |
|
|
|
|
|
|
|
|
|
|
|
|
|
|
|
|
|
| |||
|
| Customer relationships | $ | 9,683 |
| $ | (9,683) |
| $ | 0 |
| $ | 10,340 |
| $ | (10,340) |
| $ | 0 |
| ||
|
| Software and unpatented technology |
| 390 |
|
| (390) |
|
| 0 |
|
| 1,726 |
|
| (1,726) |
|
| 0 |
| ||
|
| FTS patent |
| 2,633 |
|
| (2,633) |
|
| 0 |
|
| 2,679 |
|
| (2,679) |
|
| 0 |
| ||
|
| Trademarks |
| 1,980 |
|
| (1,682) |
|
| 298 |
|
| 2,015 |
|
| (1,658) |
|
| 357 |
| ||
|
| Total finite-lived intangible assets | $ | 14,686 |
| $ | (14,388) |
| $ | 298 |
| $ | 16,760 |
| $ | (16,403) |
| $ | 357 |
| ||
| As of December 31, 2017 | As of June 30, 2017 | |||||||||||||||||
| Gross | Net | Gross | Net | |||||||||||||||
| carrying | Accumulated | carrying | carrying | Accumulated | carrying | |||||||||||||
| value | amortization | value | value | amortization | value | |||||||||||||
| Finite-lived intangible assets: | ||||||||||||||||||
| Customer relationships | $ | 105,365 | $ | (75,089 | ) | $ | 30,276 | $ | 99,209 | $ | (65,595 | ) | $ | 33,614 | ||||
| Software and unpatented technology | 35,227 | (33,587 | ) | 1,640 | 33,273 | (31,112 | ) | 2,161 | ||||||||||
| FTS patent | 3,098 | (3,098 | ) | - | 2,935 | (2,935 | ) | - | ||||||||||
| Exclusive licenses | 4,506 | (4,506 | ) | - | 4,506 | (4,506 | ) | - | ||||||||||
| Trademarks | 7,361 | (5,486 | ) | 1,875 | 6,972 | (4,759 | ) | 2,213 | ||||||||||
| Total finite-lived intangible assets | 155,557 | (121,766 | ) | 33,791 | 146,895 | (108,907 | ) | 37,988 | ||||||||||
| Indefinite-lived intangible assets: | ||||||||||||||||||
| Financial institution license | 813 | - | 813 | 776 | - | 776 | ||||||||||||
| Total indefinite-lived intangible assets | 813 | - | 813 | 776 | - | 776 | ||||||||||||
| Total intangible assets | $ | 156,370 | $ | (121,766 | ) | $ | 34,604 | $ | 147,671 | $ | (108,907 | ) | $ | 38,764 | ||||
Aggregate amortization expense on the finite-lived intangible assets for each of the three months ended March 31, 2022 and 2021, was approximately $0.1 million. Aggregate amortization expense on the finite-lived intangible assets for the threenine months ended DecemberMarch 31, 20172022 and 2016,2021, was approximately $2.9$0.1 million and $3.6$0.3 million, respectively. Aggregate amortization expense on the finite-lived intangible assets for the six months ended December 31, 2017 and 2016, was approximately $5.8 million and $6.5 million, respectively.
Future estimated annual amortization expense for the next five fiscal years and thereafter, assuming exchange rates that prevailed on DecemberMarch 31, 2017,2022, is presented in the table below. Actual amortization expense in future periods could differ from this estimate as a result of acquisitions, changes in useful lives, exchange rate fluctuations and other relevant factors.
| Fiscal 2022 |
| $ | 71 |
| ||||||||
| Fiscal 2023 |
|
| 71 |
| ||||||||
| Fiscal 2024 |
|
| 70 |
| ||||||||
| Fiscal 2025 |
|
| 70 |
| ||||||||
| Fiscal 2026 |
|
| 70 |
| ||||||||
|
| Total future estimated annual amortization expense |
|
|
|
|
|
|
|
| $ | 352 |
|
| Fiscal 2018 | $ | 12,838 | |
| Fiscal 2019 | 11,369 | ||
| Fiscal 2020 | 10,653 | ||
| Fiscal 2021 | 4,582 | ||
| Fiscal 2022 | 81 | ||
| Thereafter | 330 | ||
| Total future estimated annual amortization expense | $ | 39,853 |
19
8. Reinsurance assets7.Assets and policyholder liabilities under insurance and investment contracts
Reinsurance assets and policyholder liabilities under insurance contracts
Summarized below is the movement in reinsurance assets and policyholder liabilities under insurance contracts during the sixnine months ended DecemberMarch 31, 2017:2022:
|
|
|
|
|
| Reinsurance Assets(1) |
|
| Insurance contracts(2) |
|
| Balance as of June 30, 2021 | $ | 1,298 |
| $ | (2,011) |
| |||
|
| Increase in policy holder benefits under insurance contracts |
| 1,612 |
|
| 8,158 |
| ||
|
| Claims and decrease in policyholders’ benefits under insurance contracts |
| (1,603) |
|
| (8,304) |
| ||
|
| Foreign currency adjustment(3) |
| (23) |
|
| 30 |
| ||
|
|
| Balance as of March 31, 2022 | $ | 1,284 |
| $ | (2,127) |
| |
| Reinsurance | Insurance | |||||
| assets(1) | contracts(2) | |||||
| Balance as of June 30, 2017 | $ | 191 | $ | (1,611 | ) | |
| Increase in policyholder benefits under insurance contracts | (355 | ) | (4,932 | ) | ||
| Claims and policyholders’ benefits under insurance contracts | 366 | 4,884 | ||||
| Foreign currency adjustment(3) | 10 | (89 | ) | |||
| Balance as of December 31, 2017 | $ | 212 | $ | (1,748 | ) |
(1) Included in other long-term | ||
| ||
|
16
8. Reinsurance assets and policyholder liabilities under insurance and investment contracts (continued)(refer to Note 5);
Reinsurance assets and policyholder liabilities under insurance contracts (continued)(2) Included in other long-term liabilities;
(3) Represents the effects of the fluctuations of the ZAR against the U.S. dollar.
The Company has agreements with reinsurance companies in order to limit its losses from largevarious insurance contracts, however, if the reinsurer is unable to meet its obligations, the Company retains the liability.
The Company determines its reserves for policy benefits under its lifevalue of insurance products using a model which estimates claims incurred that have not been reported atcontract liabilities is based on the balance sheet date. This model includes best estimate assumptions of future experience plus prescribed margins, as required in the markets in which these products are offered, namely South Africa. The process of deriving the best estimate assumptions include thoseplus prescribed margins includes assumptions related to mortality, morbidity and claim reporting delays and the main assumptions used to calculate the reserve for policy benefits include (i) mortality and morbidity assumptions reflecting the company’s most recent experience and (ii) claim reporting delays reflecting Company specific and(based on average industry experience. The values of matured guaranteed endowments were increased by late payment interest (net of the asset management fee and allowance for tax on investment income)experience).
Assets and policyholder liabilities under investment contracts
Summarized below is the movement in assets and policyholder liabilities under investment contracts during the sixnine months ended DecemberMarch 31, 2017:2022:
|
|
|
|
| Assets(1) |
| Investment contracts(2) |
| ||
| Balance as of June 30, 2021 | $ | 381 |
| $ | (381) |
| |||
|
| Increase in policy holder benefits under investment contracts |
| 11 |
|
| (11) |
| ||
|
| Foreign currency adjustment (3) |
| 19 |
|
| 6 |
| ||
|
|
| Balance as of March 31, 2022 | $ | 411 |
| $ | (386) |
| |
| Investment | ||||||
| Assets(1) | contracts(2) | |||||
| Balance as of June 30, 2017 | $ | 627 | $ | (627 | ) | |
| Increase in policyholder benefits under investment contracts | 2 | (2 | ) | |||
| Foreign currency adjustment(3) | 35 | (35 | ) | |||
| Balance as of December 31, 2017 | $ | 664 | $ | (664 | ) |
| ||
| ||
|
(1) Included in other long-term assets (refer to Note 5);
(2) Included in other long-term liabilities;
(3) Represents the effects of the fluctuations of the ZAR against the U.S. dollar.
The Company does not offer any investment products with guarantees related to capital or returns.
20
8.Borrowings
9. Short-term credit facilities
Summarized below are the Company’s available short-term facilities and the amounts utilized as of December 31, 2017 and June 30, 2017, all amounts below were translated at the exchange rates applicable as of the date presented:
| December 31, 2017 | June 30, 2017 | |||||||||||
| Available | Utilized | Available | Utilized | |||||||||
| Europe: | ||||||||||||
| Bank Frick(1) | $ | 68,405 | $ | 35,553 | $ | 66,579 | $ | 16,579 | ||||
| South Africa: | ||||||||||||
| Nedbank Limited | 32,400 | 10,190 | 30,600 | 10,000 | ||||||||
| Overdraft facility(1) | 20,200 | - | 19,109 | - | ||||||||
| Indirect and derivative facilities (Note 18) | $ | 12,200 | $ | 10,190 | $ | 11,491 | $ | 10,000 | ||||
(1) Utilized amount included in short-term facilities on the unaudited condensed consolidated balance sheets.
Europe
The Company has obtained EUR 40.0 million ($47.9 million) and CHF 20 million ($20.5 million) revolving overdraft facilities from Bank Frick. As of December 31, 2017, the Company had utilized approximately CHF 4.7 million ($4.8 million) of the CHF 20 million facility and approximately EUR 25.7 million ($30.7 million) of the EUR 40 million facility. All amounts have been translated at exchange rates applicable as of December 31, 2017. As of June 30, 2017, the Company had utilized approximately CHF 15.9 million ($16.6 million) of the CHF 20 million facility and had not utilized any of the EUR 40 million facility. All amounts have been translated at exchange rates applicable as of June 30, 2017.
As of December 31, 2017, the interest rate on these facilities was 5.00%. The Company assigned all claims against amounts due from Masterpayment customers, which have been financed from the CHF 20 million facility, plus all secondary rights and preferential rights as collateral for this facility to Bank Frick. Masterpayment was required to open a primary business account with Bank Frick and this account has been pledged to Bank Frick as collateral for the EUR 40 million facility. Net1 also stands as guarantor for both of these facilities.
17
9. Short-term credit facilities (continued)
Europe (continued)
The initial term of the EUR 40 million facility ends on December 31, 2019 and will automatically be extended for one additional year if not terminated with 12 months written notice. The CHF 20 million facility does not have a fixed term; however, it may be terminated by either party at the end of a calendar month with six months written notice. In January 2018, the Company settled the EUR 40 million and CHF 20 million revolving overdraft facilities in full and these facilities will be cancelled and Net1 will be released from the guarantees.
United States
On January 29, 2018, the Company obtained a $10 million overdraft facility from Bank Frick. The interest rate on the facilities is 4.50% plus 3 month US Dollar LIBOR and interest is payable quarterly commencing on March 31, 2018. The facility has no fixed term, however, it may be terminated by either party with six weeks written notice. The facility is secured by a pledge of the Company’s investment in Bank Frick.
South Africa
The aggregate amount of the Company’s short-term South African credit facility with Nedbank Limited was ZAR 400 million ($32.4 million) and consists of (i) a primary amount of up to ZAR 200 million ($16.2 million, and (ii) a secondary amount of up to ZAR 200 million ($16.2 million) (all amounts denominated in ZAR and translated at exchange rates applicable as of December 31, 2017). The primary amount comprises an overdraft facility of up to ZAR 50 million ($4.0 million) and indirect and derivative facilities of up to ZAR 150 million ($12.2 million), which include letters of guarantee, letters of credit and forward exchange contracts (all amounts denominated in ZAR and translated at exchange rates applicable as of December 31, 2017).
As of December 31, 2017, the interest rate on the overdraft facility was 9.10%. The Company has ceded its investment in Cash Paymaster Services Proprietary Limited (“CPS”), a South African subsidiary, as security for its repayment obligations under the facility. A commitment fee of 0.35% per annum is payable on the monthly unutilized amount of the overdraft portion of the short-term facility. The Company is required to comply with customary non-financial covenants, including, without limitation, covenants that restrict its ability to dispose of or encumber its assets, incur additional indebtedness or engage in certain business combinations.
As of each of December 31, 2017 and June 30, 2017, respectively, the Company had not utilized any of its overdraft facility. As of December 31, 2017, the Company had utilized approximately ZAR 126.0 million ($10.2 million, translated at exchange rates applicable as of December 31, 2017) of its ZAR 150 million indirect and derivative facilities to obtain foreign exchange contracts from the bank and to enable the bank to issue guarantees, including stand-by letters of credit, in order for the Company to honor its obligations to third parties requiring such guarantees (referRefer to Note 18). As of June 30, 2017, the Company had utilized approximately ZAR 130.5 million ($10.0 million, translated at exchange rates applicable as of June 30, 2017) of its ZAR 150 million indirect and derivative facilities.
10. Long-term borrowings
South Africa
The Company’s South African long-term facility agreement is described in Note 1411 to the Company’s audited consolidated financial statements included in its Annual Report on Form 10-K for the year ended June 30, 2017. 2021, for additional information regarding its borrowings.
South Africa
July 2017 Facilities, as amended, comprising long-term borrowings (all repaid) and a short-term facility (Facility E)
Available short-term facility - Facility E
As of DecemberMarch 31, 2017, $70.4 million was outstanding under2022, the Company’s South African long-term facility agreement, and the carryingaggregate amount of the long-term borrowings approximated fair value. The Johannesburg Interbank Agreed Rate (“JIBAR”) has been set at 7.158% for the period to March 29, 2018.
On July 26, 2017, the Company utilized ZAR 1.25 billion (approximately $92.2 million) of itsCompany’s short-term South African long-termoverdraft facility to partially fund the acquisition of 15% of Cell C. Principal repayments on the facilities are due in eight quarterly installments commencing on September 29, 2017 and the Company has made scheduled repayments ofwith RMB was ZAR 375.0 million1.4 billion ($28.5 million) during the six months ended December 31, 2017. The next scheduled principal payment of ZAR 187.5 million ($15.296.2 million, translated at exchange rates applicable as of DecemberMarch 31, 2017) will2022). As of March 31, 2022, the Company had utilized approximately ZAR 0.7 billion ($45.7 million) of this overdraft facility. This overdraft facility may only be madeused to fund ATMs and therefore the overdraft utilized and converted to cash to fund the Company’s ATMs is considered restricted cash. The interest rate on this facility is equal to the prime rate. The prime rate on March 31, 2018.2022, was 7.75%.
Nedbank facility, comprising short-term facilities
As of March 31, 2022, the aggregate amount of the Company’s short-term South African credit facility with Nedbank Limited was ZAR 406.6 million ($27.9 million). The credit facility comprises an overdraft facility of up to ZAR 250.0 million ($17.2 million), which may only be used to fund mobile ATMs and indirect and derivative facilities of up to ZAR 156.6 million ($10.8 million), which include guarantees, letters of credit and forward exchange contracts. The Company paid a non-refundable deal origination feehas entered into cession and pledge agreements with Nedbank related to certain of approximatelyits Nedbank credit facilities (the indirect and derivative facility) and the Company has ceded and pledged certain bank accounts to Nedbank. The funds included in these bank accounts are restricted as they may not be withdrawn without the express permission of Nedbank. These funds, of ZAR 6.3155.1 million ($0.6 million) in August 2017. Interest expense incurred during the three and six months ended December 31, 2017, was $1.910.7 million and $3.6 million, respectively. During the three and six months ended December 31, 2017, $0.1 million and $0.2 million, respectively, of prepaid facility fees were amortized. All amounts are translated at exchange rates applicable as of DecemberMarch 31, 2017.
18
10. Long-term borrowings (continued)
South Korea
The South Korean senior secured loan facility is described in Note 142022), are included within the caption restricted cash related to ATM funding and credit facilities to the Company’s auditedunaudited condensed consolidated financial statements includedbalance sheet as of March 31, 2022. As of March 31, 2022, the interest rate on the overdraft facility was 6.60%.
As of March 31, 2022 and June 30, 2021, the Company had utilized approximately ZAR 155.1 million ($10.7 million) and ZAR 156.6 million ($10.9 million), respectively, of its indirect and derivative facilities of ZAR 156.6 million (June 30, 2021: ZAR 156.6 million) to enable the bank to issue guarantees, letters of credit and forward exchange contracts, in its Annual Report on Form 10-Korder for the year endedCompany to honor its obligations to third parties requiring such guarantees (refer to Note 19).
Movement in short-term credit facilities
Summarized below are the Company’s short-term facilities as of March 31, 2022, and the movement in the Company’s short-term facilities from as of June 30, 2017. On October 20, 2017,2022 to as of March 31, 2021, as well as the Company made an unscheduled repaymentrespective interest rates applied to the borrowings as of $16.6 millionMarch 31, 2022:
|
|
|
|
|
|
| South Africa |
|
| Total |
| |||
|
|
|
|
|
| RMB |
| Nedbank |
|
|
|
| ||
| Short-term facilities available as of March 31, 2022 | $ | 96,203 |
| $ | 27,937 |
| $ | 124,140 |
| ||||
|
| Overdraft restricted as to use for ATM funding only |
| 96,203 |
|
| 17,179 |
|
| 113,382 |
| |||
|
| Indirect and derivative facilities |
| 0 |
|
| 10,758 |
|
| 10,758 |
| |||
|
|
|
|
|
|
|
|
|
|
|
|
|
|
|
| Interest rate (%), based on South African prime rate |
| 7.75 |
|
|
|
|
|
|
| ||||
| Interest rate (%), based on South African prime rate less 1.15% |
|
|
|
| 6.60 |
|
|
|
| ||||
|
|
|
|
|
|
|
|
|
|
|
|
|
|
|
| Movement in utilized overdraft facilities: |
|
|
|
|
|
|
|
|
| ||||
|
| Balance as of June 30, 2021 |
| 14,245 |
|
| 0 |
|
| 14,245 |
| |||
|
|
| Utilized |
| 405,048 |
|
| 1,350 |
|
| 406,398 |
| ||
|
|
| Repaid |
| (371,185) |
|
| (1,323) |
|
| (372,508) |
| ||
|
|
| Foreign currency adjustment(1) |
| (2,430) |
|
| (27) |
|
| (2,457) |
| ||
|
|
|
| Balance as of March 31, 2022 |
| 45,678 |
|
| 0 |
|
| 45,678 |
| |
|
|
|
|
| Restricted as to use for ATM funding only |
| 45,678 |
|
| 0 |
|
| 45,678 |
|
|
|
|
|
|
|
|
|
|
|
|
|
|
|
|
| Movement in utilized indirect and derivative facilities: |
|
|
|
|
|
|
|
|
| ||||
|
| Balance as of June 30, 2021 |
| 0 |
|
| 10,947 |
|
| 10,947 |
| |||
|
|
| Guarantees cancelled |
| 0 |
|
| (99) |
|
| (99) |
| ||
|
|
| Foreign currency adjustment(1) |
| 0 |
|
| (189) |
|
| (189) |
| ||
|
|
|
| Balance as of March 31, 2022(2) | $ | 0 |
| $ | 10,659 |
| $ | 10,659 |
| |
|
|
|
|
|
|
|
|
|
|
|
|
|
|
|
(1) Represents the effects of the fluctuations between the ZAR and settled the full outstanding balance, including interest, related to these borrowings.U.S. dollar.
21
9.Other payables
On July 29, 2017,
Summarized below is the Company utilized approximately KRW 0.3 billion ($0.3 million)breakdown of its Facility C revolving credit facility under the Company’s South Korean long-term facility agreement to pay interest due on the Company’s South Korean senior secured loan facility.other payables as of March 31, 2022, and June 30, 2021:
Interest expense incurred during the three months ended December 31, 2017
|
|
|
| March 31, |
| June 30, |
| ||
|
|
|
|
| 2022 |
|
| 2021 |
|
| Accruals |
| $ | 7,915 |
| $ | 7,501 |
| |
| Provisions |
|
| 5,291 |
|
| 5,343 |
| |
| Other |
|
| 11,950 |
|
| 13,288 |
| |
| Value-added tax payable |
|
| 541 |
|
| 435 |
| |
| Payroll-related payables |
|
| 1,362 |
|
| 884 |
| |
| Participating merchants' settlement obligation |
|
| 128 |
|
| 137 |
| |
|
|
| $ | 27,187 |
| $ | 27,588 |
| |
Other includes transactions-switching funds payable, deferred income, client deposits and 2016, was $0.1 million and $0.2 million, respectively. Interest expense incurred during the six months ended December 31, 2017 and 2016, was $0.4 million and $0.7 million, respectively. Prepaid facility fees amortized during the three months ended December 31, 2017 and 2016, was $0.1 million and $0.03 million respectively. Prepaid facility fees amortized during the six months ended December 31, 2017 and 2016, was $0.1 million and $0.07 million, respectively.other payables.
11.
10.Capital structure
The following table presents a reconciliation between the number of shares, net of treasury, presented in the unaudited condensed consolidated statement of changes in equity during the sixnine months ended DecemberMarch 31, 20172022 and 2016,2021, respectively, and the number of shares, net of treasury, excluding non-vested equity shares that have not vested during the sixnine months ended DecemberMarch 31, 20172022 and 2016,2021, respectively:
|
|
| March 31, |
| March 31, |
|
|
|
| 2022 |
| 2021 |
|
|
|
|
|
|
|
|
| Number of shares, net of treasury: |
|
|
|
| |
|
| Statement of changes in equity | 57,921,062 |
| 56,626,060 |
|
|
| Non-vested equity shares that have not vested as of end of period | 1,248,391 |
| 294,000 |
|
| Number of shares, net of treasury, excluding non-vested equity shares that have not vested | 56,672,671 |
| 56,332,060 |
| |
| December 31, | December 31, | |||||
| 2017 | 2016 | |||||
| Number of shares, net of treasury: | ||||||
| Statement of changes in equity | 56,832,370 | 52,521,345 | ||||
| Less: Non-vested equity shares that have not vested (Note 13) | (911,856 | ) | (904,356 | ) | ||
| Number of shares, net of treasury excluding non-vested equity shares that have not vested | 55,920,514 | 51,616,989 |
Common stock repurchases
Executed under share repurchase authorizations
The Company did not repurchase any of its shares during the three and six months ended December 31, 2017, or during the three months ended December 31, 2016.
In February 2016, the Company’s board of directors approved the replenishment of its share repurchase authorization to repurchase up to an aggregate of $100 million of common stock. The authorization has no expiration date. On June 29, 2016, the Company adopted a Rule 10b5-1 trading plan for the purpose of repurchasing approximately $50 million of its common stock, which was included within the original share repurchase authorization. During the six months ended December 31, 2016, the Company repurchased 1,328,699 shares for approximately $12.7 million under its share repurchase authorization.
19
12. 11.Accumulated other comprehensive loss
The table below presents the change in accumulated other comprehensive (loss) income per component during the sixthree months ended DecemberMarch 31, 2017:2022:
|
|
|
|
|
|
|
| Three months ended |
| ||||
|
|
|
|
|
|
|
| March 31, 2022 |
| ||||
|
|
|
|
|
|
|
|
| Accumulated foreign currency translation reserve |
|
| Total |
|
| Balance as of January 1, 2022 |
|
|
|
| $ | (157,879) |
| $ | (157,879) |
| ||
|
| Release of foreign currency translation reserve related to the disposal of Finbond equity securities (Note 5) |
|
| 583 |
|
| 583 |
| ||||
|
| Movement in foreign currency translation reserve |
|
| 14,831 |
|
| 14,831 |
| ||||
|
|
| Balance as of March 31, 2022 |
|
|
|
| $ | (142,465) |
| $ | (142,465) |
|
22
11.Accumulated other comprehensive loss (continued)
The table below presents the change in accumulated other comprehensive (loss) income per component during the three months ended March 31, 2021:
|
|
|
|
| Three months ended |
| ||||
|
|
|
|
| March 31, 2021 |
| ||||
|
|
|
|
|
| Accumulated foreign currency translation reserve |
|
| Total |
|
| Balance as of January 1, 2021 |
| $ | (141,242) |
| $ | (141,242) |
| ||
|
| Release of foreign currency translation reserve related to disposal of Bank Frick |
|
| (2,462) |
|
| (2,462) |
| |
|
| Movement in foreign currency translation reserve |
|
| (2,470) |
|
| (2,470) |
| |
|
|
| Balance as of March 31, 2021 |
| $ | (146,174) |
| $ | (146,174) |
|
| Six months ended | |||||||||
| December 31, 2017 | |||||||||
| Accumulated | |||||||||
| net | |||||||||
| unrealized | |||||||||
| Accumulated | income on | ||||||||
| foreign | asset | ||||||||
| currency | available for | ||||||||
| translation | sale, net of | ||||||||
| reserve | tax | Total | |||||||
| Balance as of June 30, 2017 | $ | (162,569 | ) | $ | - | $ | (162,569 | ) | |
| Movement in foreign currency translation reserve related to equity accounted investment | (227 | ) | - | (227 | ) | ||||
| Movement in foreign currency translation reserve | 39,437 | - | 39,437 | ||||||
| Balance as of December 31, 2017 | $ | (123,359 | ) | $ | - | $ | (123,359 | ) | |
There were no reclassificationsThe table below presents the change in accumulated other comprehensive (loss) income per component during the nine months ended March 31, 2022:
|
|
|
|
|
|
|
| Nine months ended |
| ||||
|
|
|
|
|
|
|
| March 31, 2022 |
| ||||
|
|
|
|
|
|
|
|
| Accumulated foreign currency translation reserve |
|
| Total |
|
| Balance as of July 1, 2021 |
|
|
|
| $ | (145,721) |
| $ | (145,721) |
| ||
|
| Release of foreign currency translation reserve related to disposal of Finbond equity securities (Note 5) |
|
| 583 |
|
| 583 |
| ||||
|
| Movement in foreign currency translation reserve related to equity-accounted investment |
|
| (644) |
|
| (644) |
| ||||
|
| Movement in foreign currency translation reserve |
|
| 3,317 |
|
| 3,317 |
| ||||
|
|
| Balance as of March 31, 2022 |
|
|
|
| $ | (142,465) |
| $ | (142,465) |
|
The table below presents the change in accumulated other comprehensive (loss) income per component during the nine months ended March 31, 2021:
a |
|
|
|
| Nine months ended | ||||
|
|
|
|
| March 31, 2021 | ||||
|
|
|
|
|
| Accumulated foreign currency translation reserve |
|
| Total |
| Balance as of July 1, 2020 |
| $ | (169,075) |
| $ | (169,075) | ||
|
| Release of foreign currency translation reserve related to disposal of Bank Frick |
|
| (2,462) |
|
| (2,462) | |
|
| Movement in foreign currency translation reserve related to equity-accounted investment |
|
| 1,688 |
|
| 1,688 | |
|
| Movement in foreign currency translation reserve |
|
| 23,675 |
|
| 23,675 | |
|
|
| Balance as of March 31, 2021 |
| $ | (146,174) |
| $ | (146,174) |
During the three and nine months ended March 31, 2022, the Company reclassified $0.6 million from accumulated other comprehensive loss (accumulated foreign currency translation reserve) to comprehensive (loss) income duringnet loss related to the disposal of shares in Finbond. During the three and sixnine months ended DecemberMarch 31, 2017 or 2016.2021, the Company reclassified $2.5 million from accumulated other comprehensive loss (accumulated foreign currency translation reserve) to net loss related to the disposal of Bank Frick.
13. 23
12.Stock-based compensation
The Company’s Amended and Restated 2015 Stock Incentive Plan and the vesting terms of certain stock-based awards granted are described in Note 16 to the Company’s audited consolidated financial statements included in its Annual Report on Form 10-K for the year ended June 30, 2021.
Stock option and restricted stock activity
Options
Options
The following table summarizes stock option activity for the sixnine months ended DecemberMarch 31, 20172022 and 2016:2021:
|
|
|
|
|
|
|
|
|
|
|
|
|
|
|
|
|
|
|
|
|
|
|
|
|
| Number of shares |
|
| Weighted average exercise price ($) |
|
| Weighted average remaining contractual term (in years) |
|
| Aggregate intrinsic value ($'000) |
| Weighted average grant date fair value ($) |
|
|
|
|
|
|
|
|
|
|
|
|
|
|
|
|
|
|
|
| Outstanding - June 30, 2021 |
| 1,294,832 |
|
| 3.93 |
|
| 7.68 |
|
| 1,624 |
| 1.45 | ||||
|
| Granted - February 2022 |
| 137,620 |
|
| 4.87 |
|
| 10.00 |
|
| 235 |
| 1.71 | |||
|
| Exercised |
| (249,521) |
|
| 3.05 |
|
| - |
|
| 470 |
| - | |||
|
| Forfeited |
| (188,332) |
|
| 4.14 |
|
|
|
|
|
|
| 1.50 | |||
|
|
| Outstanding - March 31, 2022 |
| 994,599 |
|
| 4.25 |
|
| 6.86 |
|
| 1,884 |
| 1.64 | ||
|
|
|
|
|
|
|
|
|
|
|
|
|
|
|
|
|
|
|
| Outstanding - June 30, 2020 |
| 1,331,651 |
|
| 5.83 |
|
| 7.56 |
|
| 0 |
| 2.01 | ||||
|
| Granted – August 2020 |
| 150,000 |
|
| 3.50 |
|
| 3.00 |
|
| 166 |
| 1.11 | |||
|
| Granted – November 2020 |
| 560,000 |
|
| 3.01 |
|
| 10.00 |
|
| 691 |
| 1.23 | |||
|
| Exercised |
| (17,335) |
|
| 3.07 |
|
| - |
|
| 35 |
| - | |||
|
| Forfeited |
| (466,033) |
|
| 7.12 |
|
|
|
|
|
|
| 2.26 | |||
|
|
| Outstanding - March 31, 2021 |
| 1,558,283 |
|
| 4.24 |
|
| 7.80 |
|
| 2,860 |
| 1.59 | ||
| Weighted | |||||||||||||||
| Weighted | average | Weighted | |||||||||||||
| average | remaining | Aggregate | average | ||||||||||||
| exercise | contractual | intrinsic | grant date | ||||||||||||
| Number of | price | term | value | fair value | |||||||||||
| shares | ($) | (in years) | ($’000) | ($) | |||||||||||
| Outstanding – June 30, 2017 | 846,607 | 13.87 | 3.80 | 486 | |||||||||||
| Forfeitures | (37,333 | ) | 11.23 | ||||||||||||
| Outstanding – December 31, 2017 | 809,274 | 13.99 | 3.15 | 1,022 | |||||||||||
| Outstanding – June 30, 2016 | 2,077,524 | 15.92 | 3.65 | 926 | |||||||||||
| Expired unexercised | (474,443 | ) | 22.51 | ||||||||||||
| Outstanding – December 31, 2016 | 1,603,081 | 13.98 | 4.25 | 1,685 |
NoThe Company awarded 137,620 stock options to employees during the three and nine months ended March 31, 2022.NaN stock options were awarded during the three and six months ended DecemberMarch 31, 2017 or 2016. There were no forfeitures2021. The Company awarded 560,000 stock options to employees during the nine months ended March 31, 2021. On August 5, 2020, the Company granted one of its non-employee directors, Mr. Ali Mazanderani, in his capacity as a consultant to the Company, 150,000 stock options with an exercise price of $3.50. These stock options are subject to the non-employee director’s continuous service through the applicable vesting date, and half of the options vest on each of the first and second anniversaries of the grant date.
Employees forfeited 94,404 and 10,000 stock options during the three months ended DecemberMarch 31, 2017.2022 and 2021, respectively. Employees forfeited 188,332 and 205,999 stock options during the nine months ended March 31, 2022 and 2021, respectively. During the sixnine months ended DecemberMarch 31, 2017,2021, the Company’s former chief executive officer forfeited 250,034 stock options with strike prices ranging from $6.20 to $11.23 per share following his separation from the Company.
The fair value of each option is estimated on the date of grant using the Cox Ross Rubinstein binomial model that uses the assumptions noted in the following table. The estimated expected volatility is calculated based on the Company’s 750-day volatility. The estimated expected life of the option was determined based on the historical behavior of employees forfeited 37,333who were granted options with similar terms.
The table below presents the range of assumptions used to value stock options. There were no forfeituresoptions granted during the three and sixnine months ended DecemberMarch 31, 2016; however, during the three2022 and six months ended December 31, 2016, 474,4432021:
|
|
|
|
| Nine months ended | ||||
|
|
|
|
| March 31, | ||||
|
|
|
|
| 2022 |
| 2021 | ||
| Expected volatility | 50 | % |
| 62 | % | |||
| Expected dividends | 0 | % |
| 0 | % | |||
| Expected life (in years) | 3 |
|
| 3 |
| |||
| Risk-free rate | 1.61 | % |
| 0.19 | % | |||
24
12.Stock-based compensation (continued)
Stock option and restricted stock options awarded in August 2006, expired unexercised.activity (continued)
Options (continued)
The following table presents stock options vested and expectingexpected to vest as of DecemberMarch 31, 2017:2022:
|
|
|
|
|
|
| Number of shares |
|
| Weighted average exercise price ($) |
|
| Weighted average remaining contractual term (in years) |
|
| Aggregate intrinsic value ($’000) |
|
|
|
|
|
|
|
|
|
|
|
|
|
|
|
|
|
|
|
| Vested and expecting to vest - March 31, 2022 |
|
| 994,599 |
|
| 4.25 |
|
| 6.86 |
|
| 1,884 |
| |||
| Weighted | ||||||||||||
| Weighted | average | |||||||||||
| average | remaining | Aggregate | ||||||||||
| exercise | contractual | intrinsic | ||||||||||
| Number of | price | term | value | |||||||||
| shares | ($) | (in years) | ($’000) | |||||||||
| Vested and expecting to vest – December 31, 2017 | 809,274 | 13.99 | 3.15 | 1,022 |
20
13. Stock-based compensation
Stock option and restricted stock activity (continued)
Options (continued)
These options have an exercise price range of $7.35$3.01 to $24.46.$11.23.
The following table presents stock options that are exercisable as of DecemberMarch 31, 2017:2022:
|
|
|
|
|
|
| Number of shares |
|
| Weighted average exercise price ($) |
|
| Weighted average remaining contractual term (in years) |
|
| Aggregate intrinsic value ($’000) |
|
|
|
|
|
|
|
|
|
|
|
|
|
|
|
|
|
|
|
| Exercisable - March 31, 2022 |
|
| 464,506 |
|
| 5.37 |
|
| 5.73 |
|
| 220 |
| |||
| Weighted | ||||||||||||
| Weighted | average | |||||||||||
| average | remaining | Aggregate | ||||||||||
| exercise | contractual | intrinsic | ||||||||||
| Number of | price | term | value | |||||||||
| shares | ($) | (in years) | ($’000) | |||||||||
| Exercisable – December 31, 2017 | 809,274 | 13.99 | 3.15 | 1,022 |
NoNaN stock options became exercisable during the three months ended DecemberMarch 31, 20172022 and 2016, respectively.2021. During the sixnine months ended DecemberMarch 31, 20172022 and 2016,2021, respectively, 105,982376,348 and 154,803337,666 stock options became exercisable. The Company issues new shares to satisfy stock option exercises.
Restricted stock
The following table summarizes restricted stock activity for the sixnine months ended DecemberMarch 31, 20172022 and 2016:2021:
|
|
|
|
|
|
| Number of shares of restricted stock |
|
|
| Weighted average grant date fair value ($’000) |
|
|
|
|
|
|
|
|
|
|
|
|
|
| ||
|
|
|
|
|
|
|
|
|
|
|
| ||
|
|
|
|
|
|
|
|
|
|
|
| ||
|
|
|
|
|
|
|
|
|
|
|
| ||
| Non-vested – June 30, 2021 |
|
| 384,560 |
|
|
| 1,123 |
|
| |||
|
| Total granted |
|
| 893,831 |
|
|
| 4,433 |
|
| ||
|
|
| Granted – July 2021 |
|
| 234,608 |
|
|
| 963 |
|
| |
|
|
| Granted – August 2021 |
|
| 44,986 |
|
|
| 192 |
|
| |
|
|
| Granted – November and December 2021 |
|
| 326,158 |
|
|
| 1,766 |
|
| |
|
|
| Granted – December 2021 |
|
| 50,300 |
|
|
| 269 |
|
| |
|
|
| Granted – February 2022 |
|
| 29,920 |
|
|
| 146 |
|
| |
|
|
| Granted – March 2022 |
|
| 207,859 |
|
|
| 1,097 |
|
| |
|
| Total granted and vested - November and December 2021 |
|
| - |
|
|
| - |
|
| ||
|
|
| Granted - November and December 2021 |
|
| 71,647 |
|
|
| 393 |
|
| |
|
|
| Vested - November and December 2021 |
|
| (71,647) |
|
|
| 393 |
|
| |
| Forfeitures |
|
| (30,000) |
|
|
| (160) |
|
| |||
|
|
| Non-vested – March 31, 2022 |
|
| 1,248,391 |
|
|
| 5,867 |
|
| |
|
|
|
|
|
|
|
|
|
|
|
|
|
|
| Non-vested – June 30, 2020 |
|
| 1,115,500 |
|
|
| 5,354 |
|
| |||
| Total vested |
|
| (311,300) |
|
|
| (1,037) |
|
| |||
|
|
| Vested – August 2020 |
|
| (244,500) |
|
|
| (812) |
|
| |
|
|
| Vested – September 2020 - accelerated vesting |
|
| (66,800) |
|
|
| (225) |
|
| |
|
| Forfeitures |
|
| (510,200) |
|
|
| (1,766) |
|
| ||
|
|
|
| Non-vested – March 31, 2021 |
|
| 294,000 |
|
|
| 994 |
|
|
| Number of | Weighted | |||||
| shares of | average grant | |||||
| restricted | date fair value | |||||
| stock | ($’000) | |||||
| Non-vested – June 30, 2017 | 505,473 | 11,173 | ||||
| Granted – August 2017 | 588,594 | 4,288 | ||||
| Vested – August 2017 | (56,250 | ) | 527 | |||
| Forfeitures | (30,635 | ) | 358 | |||
| Forfeitures – August and November 2014 awards with market conditions | (95,326 | ) | 1,133 | |||
| Non-vested – December 31, 2017 | 911,856 | 9,365 | ||||
| Non-vested – June 30, 2016 | 589,447 | 7,622 | ||||
| Granted – August 2016 | 387,000 | 4,145 | ||||
| Vested – August 2016 | (72,091 | ) | 735 | |||
| Non-vested – December 31, 2016 | 904,356 | 11,142 |
25
The August 2017 grants comprises (i) 326,000 shares of restricted stock awarded to executive officers and employees that are subject to time-based vesting, (ii) 210,000 shares of restricted stock awarded to executive officers that are subject to market and time-based vesting, and (iii) 52,594 shares of restricted stock awarded to non-employee directors. The August 2016 grants comprise 350,000 and 37,000 shares of restricted stock awarded to executive officers and non-employee directors, respectively.
The 326,000 shares of restricted stock will only vest if the recipient is employed by the Company on a full-time basis on August 23, 2020. The 52,594 shares of restricted stock awarded to non-employee directors will only vest if the recipient is a director on August 23, 2018.
Market Conditions - Restricted Stock Granted in August 2017
The 210,000 shares of restricted stock awarded to executive officers in August 2017 are subject to time-based and performance-based (a market condition) vesting conditions and vest in full only on the date, if any, the following conditions are satisfied: (1 the price of the Company’s common stock must equal or exceed certain agreed VWAP levels (as described below) during a measurement period commencing on the date that it files its Annual Report on Form 10-K for the fiscal year ended 2020 and ending on December 31, 2020 and (2) the recipient is employed by the Company on a full-time basis when the condition in (1) is met. If either of these conditions is not satisfied, then none of the shares of restricted stock will vest and they will be forfeited. The $23.00 price target represents an approximate 35% increase, compounded annually, in the price of the Company’s common stock on Nasdaq over the $9.38 closing price on August 23, 2017.
21
13. 12.Stock-based compensation (continued)
Stock option and restricted stock activity (continued)
Restricted stock (continued)
Performance Conditions - Market Conditions - Restricted Stock Granted in August 2017(continued)
The VWAP levels and vesting percentages related to such levels are as follows:
Below $15.00 (threshold)—0%At or above $15.00 and below $19.00—33%At or above $19.00 and below $23.00—66%At or above $23.00—100%
These 210,000On June 30, 2021, the Company entered into employment agreements with Mr. Chris G.B. Meyer, under which Mr. Meyer was appointed Group Chief Executive Officer of the Company effective July 1, 2021. Mr. Meyer was awarded 117,304 shares of restricted stock are effectively forward starting knock-in barrier options with multi-strike priceson July 1, 2021, which were subject to time-based vesting and vest in full on June 30, 2024, subject to Mr. Meyer’s continued service to the Company through June 30, 2024. In addition, under the terms of zero. The fair value of theseMr. Meyer’s engagement, the Company’s Remuneration Committee also awarded Mr. Meyer 117,304 shares of restricted stock was calculated utilizing a Monte Carlo simulation model which was developed forinclude performance conditions and which only vest on June 30, 2024 if the purposeperformance conditions are met and Mr. Meyer remains employed with the Company through June 30, 2024. Vesting of the valuationhalf of these shares. For each simulatedawards, or 58,652 shares of restricted stock, is subject to the Company achieving its three-year financial services plan during the specific measurement period from June 30, 2021, to June 30, 2024, and the other half is subject to share price path,growth targets, and only vest if the marketCompany’s share price condition was evaluated to determine whetheris $8.14 or not the shares would vest under that simulation. A standard Geometric Brownian motion process was used in the forecasting of the share price instead of a “jump diffusion” model, as the share price volatility was more stable compared to the highly volatile regime of previous years. Therefore, the simulated share price paths capture the idiosyncrasies of the observed Company share price movements.
In scenarios where the shares do not vest, the final vested value at maturity is zero. In scenarios where vesting occurs, the final vested valuehigher on maturity is the share price on vesting date. The value of the grant is the average of the discounted vested values. The Company used an expected volatility of 44.0%, an expected life of approximately three years, a risk-free rate ranging between 1.275% to 1.657% and no future dividends in its calculation of the fair value of the restricted stock. The estimated expected volatility was calculated based on the Company’sJune 30, day VWAP share price using the exponentially weighted moving average of returns.
Performance Conditions - Restricted Stock Granted in August 2016
In August 20162024. On March 1, 2022, the Company awarded 350,000207,859 shares of restricted stock to executive officers.officers and vesting of these awards is subject to the executive’s continuous service through the applicable vesting date, one third of which vests on each of the first, second and third anniversaries of the grant date. In May 2017,August 2021, December 2021 and February 2022, the Company awarded 44,986, 50,300 and 29,920 shares of restricted stock, respectively, to employees which have time and performance-based (market conditions related to share price performance) vesting conditions.
Upon joining the Company, each of Messrs. Meyer and Lincoln C. Mali, were entitled to receive an award of shares of restricted stock which were subject to them purchasing an agreed value of shares (“matching awards”) in the market during a prescribed period of time. However, these executives were unable to purchase shares in the market during that period due to a Company-imposed insider-trading restriction placed on them. On November 15, 2021, the Company amended the terms of these awards in order to put the executives into an economically equivalent position, as follows:
(i) assume that the executives would have purchased their agreed allocation within their first 30 days post commencement of employment had they not been embargoed;
(ii) require the executives to fulfill their agreed allocations within a short period following release of the Company’s Quarterly Report on Form 10-Q for the three months ended September 30, 2021;
(iii) to the extent that the price per share actually paid is greater than the 30-day volume-weighted average price (“VWAP”) in their respective first months of employment, award the executives a top-up (“top up awards”) which amounts to the after-tax difference between (a) number of shares purchased at the 30-day VWAP in their respective first months of employment and (b) number of shares purchased at the actual share price paid. The top-up will be settled as follows: (a) 55% in shares of the Company’s common stock and (b) 45%, at the election of the executive, as either shares of the Company’s common stock or cash. The top up awards were not subject to any vesting conditions and vested immediately; and
(iv) adjust the initial matching awards to the aggregate number of shares acquired in terms of (ii) and (iii). The matching awards vest ratably over a period of three years commencing on the first anniversary of the grant of the matching awards.
The executives acquired shares during November and December 2021, and the Company granted the executives 326,158 matching awards and 71,647 top up awards.
Except as discussed above, 0 shares of restricted stock vested during the three and nine months ended March 31, 2022.
During the nine months ended March 31, 2021, 244,500 shares of restricted stock with time-based vesting conditions vested. In connection with the Company’s former chief executive officer’s separation, the Company agreed to accelerate the vesting of 200,000 of these66,800 shares of restricted stock which were granted to the Company’s former Chief Executive Officer. These remaining 150,000 shares continue to bein February 2020, and which were subject to time-based and performance-based vesting conditions. In order for any of the shares to vest, the recipient must remain employed by the Company on a full-time basis on the date that it files its Annual Report on Form 10-K for the fiscal year ended June 30, 2019. If that condition is satisfied, then the shares will vest based on the level of Fundamental EPS the Company achieves for the fiscal year ended June 30, 2019 (“2019 Fundamental EPS”), as follows:
One-third of the shares will vest if the Company achieves 2019 Fundamental EPS of $2.60;Two-thirds of the shares will vest if the Company achieves 2019 Fundamental EPS of $2.80; andAll of the shares will vest if the Company achieves 2019 Fundamental EPS of $3.00.
At levels of 2019 Fundamental EPS greater than $2.60 and less than $3.00, the number of shares that will vest will be determined by linear interpolation relative to 2019 Fundamental EPS of $2.80. Any shares that do not vest in accordance with the above-described conditions will be forfeited. Allvesting. These shares of restricted stock have been valued utilizingvested on September 30, 2020.
During the closingnine months ended March 31, 2022, 30,000 shares of restricted stock were forfeited by an executive officer as the market condition (related to share price performance) was not achieved.
The 510,200 shares of restricted stock that were forfeited during the nine months ended March 31, 2021, includes 375,200 shares of restricted stock forfeited by the Company’s former chief executive officer upon his separation from the Company and 30,000 shares of restricted stock forfeited by an executive officer as the market condition (related to share price performance) was not achieved. The March 31, 2021, non-vested shares of restricted stock presented in the table above includes 164,000 shares of restricted stock forfeited by an executive officer following his resignation from the Company on April 30, 2021. The amount of 164,000 shares of restricted stock comprised 107,200 shares of restricted stock with performance (related to agreed return on net asset value) and time-based vesting conditions, 30,000 shares of restricted stock with a market condition (related to share price performance) and time-based vesting conditions, and 26,800 shares of restricted stock with time-based vesting conditions.
26
12.Stock-based compensation (continued)
Stock option and restricted stock activity (continued)
Restricted stock (continued)
Effective January 1, 2022, the Company agreed to grant an advisor shares in lieu of cash for services provided to the Company during a contract term that will expire on December 31, 2022. The contract may be terminated early if certain agreed events occur. The advisor has agreed to receive 6,481 shares of the Company’s common stock quotedper month as payment for services rendered and is not entitled to receive additional shares if the contract is terminated early due to the occurrence of the agreed events. The 6,481 shares granted per month was calculated using an agreed monthly fee of $35,000 divided by the Company’s closing market price on TheJanuary 3, 2022, on the Nasdaq Global Select Market onMarket. The Company and the date of grant.
Performance Conditions - Restricted Stock Granted in August 2015
In August 2015advisor have agreed that the Company awarded 301,537 shares of restricted stock to executive officers and employees. These shares of restricted stock are subject to time-based and performance-based vesting conditions. In order for any ofwill issue the shares to vest, the recipient must remain employed by the Companyadvisor, in arrears, on a full-timequarterly basis on the dateand that it files its Annual Report on Form 10-K for the fiscal year ended June 30, 2018. If that condition is satisfied, then the shares will vest based onmay not be transferred until the levelearlier of Fundamental EPSDecember 31, 2022, or the Company achieves for the fiscal year ended June 30, 2018 (“2018 Fundamental EPS”), as follows:
One-thirdoccurrence of theshares will vest if the Company achieves 2018 Fundamental EPS of $2.88;Two-thirds of the shares will vest if the Company achieves 2018 Fundamental EPS of $3.30; andAll of the shares will vest if the Company achieves 2018 Fundamental EPS of $3.76.
At levels of 2018 Fundamental EPS greater than $2.88 and less than $3.76, the number of shares that will vest will be determined by linear interpolation relative to 2018 Fundamental EPS of $3.30. Any shares that do not vest in accordance with the above-described conditions will be forfeited. All shares of restricted stock have been valued utilizing the closing price of shares of the Company’s common stock quoted on The Nasdaq Global Select Market on the date of grant.
22
13. Stock-based compensation (continued)
Stock option and restricted stock activity (continued)
Restricted stock (continued)
Performance Conditions - Restricted Stock Granted in August 2015 (continued)
agreed event. During the three and six months ended DecemberMarch 31, 2016,2022, the Company reversed therecorded a stock-based compensation charge recognized to date related toof $0.1 million and included the 301,537issuance of 19,443 shares of restrictedcommon stock because it believed that it was unlikely that the 2018 Fundamental EPS target would be achieved due to the dilutive impact on the fundamental EPS calculation as a result of issuance of the approximate 10 million shares to the IFC in May 2016.its issued and outstanding share count.
Vesting of all non-employee director shares issued prior to June 30, 2017
Grants of restricted stock to non-employee directors made during fiscal 2017, as well as those grants made in prior years, originally vested over a three-year period. After the end of fiscal 2017, the Company’s board consulted with Pay Governance, an independent compensation consultant, and determined that one-year vesting of restricted stock grants is a more common compensation practice for independent directors and therefore, amended the terms of outstanding awards to vest one-year after grant. As a result of this amendment, 61,995 shares of restricted stock held by the non-employee directors as of June 30, 2017, were fully-vested.
Forfeiture of restricted stock awarded in August and November 2014 that did not achieve targeted market conditions
During the three and six months ended December 31, 2017, restricted stock with market conditions awarded in August and November 2014, were forfeited, because the target market conditions were not achieved. The stock-based compensation charge related to these awards was not reversed upon forfeiture because these awards contained market conditions.
The fair value of restricted stock vesting during the six months ended December 31, 2017 and 2016, respectively, was $0.5 million and $0.7 million.
Stock-based compensation charge and unrecognized compensation cost
The Company recorded a stock-based compensation charge, net during each of the three months ended DecemberMarch 31, 20172022 and 20162021, of $0.6 million and $0.2 million, respectively, which comprised:
|
|
|
|
|
| Total charge |
| Allocated to cost of goods sold, IT processing, servicing and support |
| Allocated to selling, general and administration |
| |||
| Three months ended March 31, 2022 |
|
|
|
|
|
|
|
|
|
| |||
|
|
| Stock-based compensation charge |
| $ | 619 |
| $ | 0 |
| $ | 619 |
| |
|
|
| Reversal of stock compensation charge related to stock options and restricted stock forfeited |
|
| (5) |
|
| - |
|
| (5) |
| |
|
|
|
| Total - three months ended March 31, 2022 |
| $ | 614 |
| $ | 0 |
| $ | 614 |
|
|
|
|
|
|
|
|
|
|
|
|
|
|
|
|
| Three months ended March 31, 2021 |
|
|
|
|
|
|
|
|
|
| |||
|
|
| Stock-based compensation charge |
| $ | 245 |
| $ | 0 |
| $ | 245 |
| |
|
|
|
| Total - three months ended March 31, 2021 |
| $ | 245 |
| $ | 0 |
| $ | 245 |
|
| Allocated to cost | |||||||||
| of goods sold, IT | Allocated to | ||||||||
| processing, | selling, general | ||||||||
| Total | servicing and | and | |||||||
| charge | support | administration | |||||||
| Three months ended December 31, 2017 | |||||||||
| Stock-based compensation charge | $ | 608 | $ | - | $ | 608 | |||
| Total – three months ended December 31, 2017 | $ | 608 | $ | - | $ | 608 | |||
| Three months ended December 31, 2016 | |||||||||
| Stock-based compensation charge | $ | 635 | $ | - | $ | 635 | |||
| Total – three months ended December 31, 2016 | $ | 635 | $ | - | $ | 635 |
23
13. Stock-based compensation (continued)
Stock-based compensation charge and unrecognized compensation cost (continued)
The Company recorded a stock-based compensation charge, (reversal)net during the sixnine months ended DecemberMarch 31, 20172022 and 20162021, of $1.4$1.7 million and ($0.7 million),$0.9 million respectively, which comprised:
a |
|
|
|
|
| Total charge |
| Allocated to cost of goods sold, IT processing, servicing and support |
| Allocated to selling, general and administration |
| |||
| Nine months ended March 31, 2022 |
|
|
|
|
|
|
|
|
|
| |||
|
|
| Stock-based compensation charge |
| $ | 1,751 |
| $ | 0 |
| $ | 1,751 |
| |
|
|
| Reversal of stock compensation charge related to stock options forfeited |
|
| (40) |
|
| 0 |
|
| (40) |
| |
|
|
|
| Total - nine months ended March 31, 2022 |
| $ | 1,711 |
| $ | 0 |
| $ | 1,711 |
|
|
|
|
|
|
|
|
|
|
|
|
|
|
|
|
| Nine months ended March 31, 2021 |
|
|
|
|
|
|
|
|
|
| |||
|
|
| Stock-based compensation charge |
| $ | 1,173 |
| $ | 0 |
| $ | 1,173 |
| |
|
|
| Reversal of stock compensation charge related to stock options and restricted stock forfeited |
|
| (297) |
|
| 0 |
|
| (297) |
| |
|
|
|
| Total - nine months ended March 31, 2021 |
| $ | 876 |
| $ | 0 |
| $ | 876 |
|
| Allocated to cost | |||||||||
| of goods sold, IT | Allocated to | ||||||||
| processing, | selling, general | ||||||||
| Total | servicing and | and | |||||||
| charge | support | administration | |||||||
| Six months ended December 31, 2017 | |||||||||
| Stock-based compensation charge | $ | 1,477 | $ | - | $ | 1,477 | |||
| Reversal of stock compensation charge related to stock options forfeited | (42 | ) | - | (42 | ) | ||||
| Total – six months ended December 31, 2017 | $ | 1,435 | $ | - | $ | 1,435 | |||
| Six months ended December 31, 2016 | |||||||||
| Stock-based compensation charge | $ | 1,138 | $ | - | $ | 1,138 | |||
| Reversal of stock compensation charge related to restricted stock | (1,827 | ) | - | (1,827 | ) | ||||
| Total – six months ended December 31, 2016 | $ | (689 | ) | $ | - | $ | (689 | ) |
The stock-based compensation charges have been allocated to selling, general and administration based on the allocation of the cash compensation paid to the relevant employees.
27
12.Stock-based compensation (continued)
As of DecemberMarch 31, 2017, there was no2022, the total unrecognized compensation cost related to stock options because all stock options granted have vested.was approximately $0.5 million, which the Company expects to recognize over approximately two years. As of DecemberMarch 31, 2017,2022, the total unrecognized compensation cost related to restricted stock awards was approximately $4.5$4.8 million, which the Company expects to recognize over approximately twothree years. This amount excludes the total unrecognized compensation cost as of December 31, 2017, of approximately $3.9 million, related to restricted stock awards that the Company expects will not vest due to it not achieving the 2018 Fundamental EPS.
As of DecemberMarch 31, 2017, the cumulative unrecorded stock-based compensation charge related to these awards of restricted stock that the Company has determined are expected not to vest and has not expensed in its consolidated statement of operations is approximately $3.2 million (which amount includes the $1.8 million reversed during the six months ended December 31, 2016).
As of December 31, 20172022, and June 30, 2017,2021, respectively, the Company recorded a deferred tax asset of approximately $0.7$0.3 million and $0.9$0.1 million, respectively, related to the stock-based compensation charge recognized related to employees of Net1. As of March 31, 2022, and June 30, 2021, respectively, the Company recorded a valuation allowance of approximately $0.3 million and $0.1 million, related to the deferred tax asset because it does not believe that the stock-based compensation deduction would be utilized as it does not anticipate generating sufficient taxable income in the United States. The Company deducts the difference between the market value on the date of exercise by the option recipient and the exercise price from income subject to taxation in the United States.
14.
13.(Loss) Earnings per share
The Company has issued redeemable common stock which is redeemable at an amount other than fair value. Redemption of a class of common stock at other than fair value increases or decreases the carrying amount of the redeemable common stock and is reflected in basic earnings per share using the two-class method. There were no redemptions of common stock, or adjustments to the carrying value of the redeemable common stock during the three and six months ended DecemberMarch 31, 2017 or 2016.2022 and 2021. Accordingly, the two-class method presented below does not include the impact of any redemption. The Company’s redeemable common stock is described in Note 1513 to the Company’s audited consolidated financial statements included in its Annual Report on Form 10-K for the year ended June 30, 2017.2021.
Basic (loss) earnings per share includeincludes shares of restricted stock that meet the definition of a participating security because these shares are eligible to receive non-forfeitable dividend equivalents at the same rate as common stock. Basic (loss) earnings per share havehas been calculated using the two-class method and basic (loss) earnings per share for the three and six months ended DecemberMarch 31, 20172022 and 2016,2021, reflects only undistributed earnings. The computation below of basic (loss) earnings per share excludes the net incomeloss attributable to shares of unvested restricted stock (participating non-vested restricted stock) from the numerator and excludes the dilutive impact of these unvested shares of restricted stock from the denominator.
Diluted (loss) earnings per share havehas been calculated to give effect to the number of shares of additional common stock that would have been outstanding if the potential dilutive instruments had been issued in each period. Stock options are included in the calculation of diluted (loss) earnings per share utilizing the treasury stock method and are not considered to be participating securities, as the stock options do not contain non-forfeitable dividend rights.
24
14. Earnings The Company has excluded employee stock options to purchase 185,902 and 172,113 shares of common stock from the calculation of diluted loss per share (continued)during the three and nine months ended March 31, 2022, because the effect would be antidilutive.
The calculation of diluted (loss) earnings per share includes the dilutive effect of a portion of the restricted stock granted to employees in May 2018, September 2018, February 2020, May 2021, July 2021, August 2014,2021, November 2014, August 2015, August 20162021, December 2021, February 2022 and August 2017,March 2022, as these shares of restricted stock are considered contingently returnable shares for the purposes of the diluted (loss) earnings per share calculation and the vesting conditions in respect of a portion of the restricted stock had been satisfied. The vesting conditions for all awards made in August 2017, August 2016 and August 2015 are discussed in Note 13 and the vesting conditions for all other awards are discussed in Note 1816 to the Company’s audited consolidated financial statements included in its Annual Report on Form 10-K for the year ended June 30, 2017.2021.
28
13.(Loss) Earnings per share (continued)
The following table presents net incomeloss attributable to Net1 (income from continuing operations) and the share data used in the basic and diluted (loss) earnings per share computations using the two-class method:
| Three months ended | Six months ended | |||||||||||
| December 31, | December 31, | |||||||||||
| 2017 | 2016 | 2017 | 2016 | |||||||||
| (in thousands except | (in thousands except | |||||||||||
| percent and | percent and | |||||||||||
| per share data) | per share data) | |||||||||||
| Numerator: | ||||||||||||
| Net income attributable to Net1 | $ | 9,622 | $ | 18,641 | $ | 29,105 | $ | 43,273 | ||||
| Undistributed earnings | 9,622 | 18,641 | 29,105 | 43,273 | ||||||||
| Percent allocated to common shareholders (Calculation 1) | 99% | 98% | 98% | 98% | ||||||||
| Numerator for earnings per share: basic and diluted | $ | 9,481 | $ | 18,296 | $ | 28,664 | $ | 42,561 | ||||
| Denominator: | ||||||||||||
| Denominator for basic earnings per share: weighted-average common shares outstanding | 55,923 | 51,549 | 55,902 | 52,301 | ||||||||
| Effect of dilutive securities: | ||||||||||||
| Stock options | 52 | 122 | 50 | 106 | ||||||||
| Denominator for diluted earnings per share: adjusted weighted average common shares outstanding and assumed conversion | 55,975 | 51,671 | 55,952 | 52,407 | ||||||||
| Earnings per share: | ||||||||||||
| Basic | $ | 0.17 | $ | 0.35 | $ | 0.51 | $ | 0.81 | ||||
| Diluted | $ | 0.17 | $ | 0.35 | $ | 0.51 | $ | 0.81 | ||||
| (Calculation 1) | ||||||||||||
| Basic weighted-average common shares outstanding (A) | 55,923 | 51,549 | 55,902 | 52,301 | ||||||||
| Basic weighted-average common shares outstanding and unvested restricted shares expected to vest (B) | 56,755 | 52,521 | 56,762 | 53,176 | ||||||||
| Percent allocated to common shareholders (A) / (B) | 99% | 98% | 98% | 98% | ||||||||
|
|
|
|
|
|
| Three months ended |
| Nine months ended |
| ||||||||||||
|
|
|
|
|
|
| March 31, |
| March 31, |
| ||||||||||||
|
|
|
|
|
|
| 2022 |
|
| 2021 |
|
| 2022 |
|
| 2021 |
|
| ||||
|
|
|
|
|
|
|
| (in thousands except |
|
|
| (in thousands except |
|
| ||||||||
|
|
|
|
|
|
|
| percent and |
|
|
| percent and |
|
| ||||||||
|
|
|
|
|
|
|
| per share data) |
|
|
| per share data) |
|
| ||||||||
| Numerator: |
|
|
|
|
|
|
|
|
|
|
|
|
|
|
|
|
| ||||
|
| Net loss attributable to Net1 |
| $ | (3,327) |
|
| $ | (6,204) |
|
| $ | (28,727) |
|
| $ | (39,696) |
|
| |||
|
| Undistributed loss |
|
| (3,327) |
|
|
| (6,204) |
|
|
| (28,727) |
|
|
| (39,696) |
|
| |||
|
| Percent allocated to common shareholders |
|
|
|
|
|
|
|
|
|
|
|
|
|
|
|
|
| |||
|
| (Calculation 1) |
|
| 98% |
|
|
| 99% |
|
|
| 99% |
|
|
| 99% |
|
| |||
|
| Numerator for loss per share: basic and diluted |
| $ | (3,262) |
| $ |
| (6,172) |
|
| $ | (28,299) |
|
| $ | (39,300) |
|
| |||
|
|
|
|
|
|
|
|
|
|
|
|
|
|
|
|
|
|
|
|
|
|
|
| Denominator |
|
|
|
|
|
|
|
|
|
|
|
|
|
|
|
|
| ||||
|
| Denominator for basic (loss) earnings per share: |
|
|
|
|
|
|
|
|
|
|
|
|
|
|
|
|
| |||
|
| weighted-average common shares outstanding |
|
| 56,660 |
|
|
| 56,352 |
|
|
| 56,467 |
|
|
| 56,236 |
|
| |||
|
| Effect of dilutive securities: |
|
|
|
|
|
|
|
|
|
|
|
|
|
|
|
|
| |||
|
|
|
| Stock options |
|
| 0 |
|
|
| 275 |
|
|
| 0 |
|
|
| 92 |
|
| |
|
|
|
| Denominator for diluted (loss) earnings per share: adjusted weighted average common shares outstanding and assuming conversion |
|
| 56,660 |
|
|
| 56,627 |
|
|
| 56,467 |
|
|
| 56,328 |
|
| |
|
|
|
|
|
|
|
|
|
|
|
|
|
|
|
|
|
|
|
|
|
|
|
| Loss per share: |
|
|
|
|
|
|
|
|
|
|
|
|
|
|
|
|
| ||||
|
| Basic |
| $ | (0.06) |
|
| $ | (0.11) |
|
| $ | (0.50) |
|
| $ | (0.70) |
|
| |||
|
| Diluted |
| $ | (0.06) |
|
| $ | (0.11) |
|
| $ | (0.50) |
|
| $ | (0.70) |
|
| |||
|
|
|
|
|
|
|
|
|
|
|
|
|
|
|
|
|
|
|
|
|
|
|
| (Calculation 1) |
|
|
|
|
|
|
|
|
|
|
|
|
|
|
|
|
| ||||
|
| Basic weighted-average common shares outstanding (A) |
|
| 56,660 |
|
|
| 56,352 |
|
|
| 56,467 |
|
|
| 56,236 |
|
| |||
|
| Basic weighted-average common shares outstanding and unvested restricted shares expected to vest (B) |
|
| 57,791 |
|
|
| 56,646 |
|
|
| 57,322 |
|
|
| 56,803 |
|
| |||
|
| Percent allocated to common shareholders |
|
|
|
|
|
|
|
|
|
|
|
|
|
|
|
|
| |||
|
| (A) / (B) |
|
| 98% |
|
|
| 99% |
|
|
| 99% |
|
|
| 99% |
|
| |||
Options to purchase 357,643408,252 shares of the Company’s common stock at prices ranging from $10.59$4.87 to $24.46$11.23 per share were outstanding during the three and sixnine months ended DecemberMarch 31, 2017,2022, respectively, but were not included in the computation of diluted (loss) earnings per share because the options’ exercise price was greater than the average market price of the Company’s common stock. Options to purchase 425,784 shares of the Company’s common stock at prices ranging from $6.20 to $11.23 per share were outstanding during the three and nine months ended March 31, 2021, respectively, but were not included in the computation of diluted (loss) earnings per share because the options’ exercise price was greater than the average market price of the Company’s common stock. The options, which expire at various dates through August 27, 2024,February 3, 2032, were still outstanding as of DecemberMarch 31, 2017.2022.
15.
14.Supplemental cash flow information
The following table presents supplemental cash flow disclosures for the three and sixnine months ended DecemberMarch 31, 20172022 and 2016:2021:
|
|
|
|
| Three months ended |
| Nine months ended |
| |||||||
|
|
|
|
| March 31, |
|
| March 31, |
| ||||||
|
|
|
|
| 2022 |
|
| 2021 |
|
| 2022 |
|
| 2021 |
|
|
|
|
|
|
|
|
|
|
|
|
|
|
|
|
|
|
| Cash received from interest |
| $ | 756 |
| $ | 537 |
| $ | 1,444 |
| $ | 1,746 |
|
|
| Cash paid for interest |
| $ | 788 |
| $ | 707 |
| $ | 2,468 |
| $ | 2,251 |
|
|
| Cash paid for income taxes |
| $ | 181 |
| $ | 211 |
| $ | 471 |
| $ | 16,382 |
|
| Three months ended | Six months ended | |||||||||||
| December 31, | December 31, | |||||||||||
| 2017 | 2016 | 2017 | 2016 | |||||||||
| Cash received from interest | $ | 4,562 | $ | 5,050 | $ | 9,848 | $ | 9,335 | ||||
| Cash paid for interest | $ | 2,330 | $ | 496 | $ | 4,418 | $ | 1,572 | ||||
| Cash paid for income taxes | $ | 18,613 | $ | 22,564 | $ | 20,649 | $ | 24,067 | ||||
29
25
15. 14.Supplemental cash flow information (continued)
Treasury shares, at cost
Disaggregation of cash, cash equivalents and restricted cash
Cash, cash equivalents and restricted cash included in the Company’s condensed consolidated balance sheet as of June 30, 2016, includes 47,056 shares of the Company’s common stock acquired for approximately $0.5 million which were paid for on July 1, 2016. The liability for this payment was included in accounts payable on the Company’s condensed consolidated balance sheet as of June 30, 2016. The payment of approximately $0.5 million is included in acquisition of treasury stock in the Company’sunaudited condensed consolidated statement of cash flows includes restricted cash related to cash withdrawn from the Company’s debt facilities to fund ATMs. This cash may only be used to fund ATMs and is considered restricted as to use and therefore is classified as restricted cash. Cash, cash equivalents and restricted cash also includes cash in certain bank accounts that have been ceded to Nedbank. As this cash has been pledged and ceded it may not be drawn and is considered restricted as to use and therefore is classified as restricted cash as well. Refer to Note 8 for additional information regarding the Company’s facilities. The following table presents the disaggregation of cash, cash equivalents and restricted cash as of March 31, 2022 and 2021, and June 30, 2021:
|
|
|
|
|
|
|
|
|
| March 31, 2022 |
|
| March 31, 2021 |
|
| June 30, 2021 |
|
|
| Cash and cash equivalents |
| $ | 183,712 |
| $ | 207,814 |
| $ | 198,572 |
| |||||
|
| Restricted cash |
|
| 56,336 |
|
| 19,016 |
|
| 25,193 |
| |||||
|
|
| Cash, cash equivalents and restricted cash |
| $ | 240,048 |
| $ | 226,830 |
| $ | 223,765 |
| ||||
Leases
The following table presents supplemental cash flow disclosure related to leases for the sixthree and nine months ended DecemberMarch 31, 2016.2022 and 2021:
|
|
|
|
| Three months ended March 31, |
|
| Nine months ended March 31, |
| ||||||
|
|
|
|
| 2022 |
|
| 2021 |
|
| 2022 |
|
| 2021 |
|
|
| Cash paid for amounts included in the measurement of lease liabilities |
|
|
|
|
|
|
|
|
|
|
|
|
|
|
| Operating cash flows from operating leases |
| $ | 902 |
| $ | 1,061 |
| $ | 2,665 |
| $ | 2,940 |
|
|
|
|
|
|
|
|
|
|
|
|
|
|
|
|
|
|
| Right-of-use assets obtained in exchange for lease obligations |
|
|
|
|
|
|
|
|
|
|
|
|
|
|
| Operating leases |
| $ | 290 |
| $ | 796 |
| $ | 1,308 |
| $ | 2,497 |
|
15.Revenue recognition
Disaggregation of revenue
The following table presents the Company’s revenue disaggregated by major revenue streams, including a reconciliation to operating segments for the three months ended March 31, 2022:
|
|
|
| Consumer |
| Merchant |
| Other |
| Total | ||||
| Processing fees | $ | 7,075 |
| $ | 8,136 |
| $ | 397 |
| $ | 15,608 | ||
|
| South Africa |
| 7,075 |
|
| 8,136 |
|
| 0 |
|
| 15,211 | |
|
| Rest of world |
| 0 |
|
| 0 |
|
| 397 |
|
| 397 | |
| Technology products |
| 40 |
|
| 7,877 |
|
| 0 |
|
| 7,917 | ||
| Telecom products and services |
| 0 |
|
| 1,862 |
|
| 0 |
|
| 1,862 | ||
| Lending revenue |
| 5,614 |
|
| 0 |
|
| 0 |
|
| 5,614 | ||
| Insurance revenue |
| 2,169 |
|
| 0 |
|
| 0 |
|
| 2,169 | ||
| Account holder fees |
| 1,434 |
|
| 0 |
|
| 0 |
|
| 1,434 | ||
| Other |
| 97 |
|
| 501 |
|
| 0 |
|
| 598 | ||
|
| Total revenue, derived from the following geographic locations |
| 16,429 |
|
| 18,376 |
|
| 397 |
|
| 35,202 | |
|
|
| South Africa |
| 16,429 |
|
| 18,376 |
|
| 0 |
|
| 34,805 |
|
|
| Rest of world | $ | 0 |
| $ | 0 |
| $ | 397 |
| $ | 397 |
30
15.Revenue recognition (continued)
Disaggregation of revenue (continued)
The following table presents the Company’s revenue disaggregated by major revenue streams, including a reconciliation to operating segments for the three months ended March 31, 2021:
|
|
|
| Consumer |
| Merchant |
| Other |
| Total | ||||
| Processing fees | $ | 7,179 |
| $ | 6,810 |
| $ | 421 |
| $ | 14,410 | ||
|
| South Africa(1) |
| 7,179 |
|
| 6,810 |
|
| 0 |
|
| 13,989 | |
|
| Rest of world |
| 0 |
|
| 0 |
|
| 421 |
|
| 421 | |
| Technology products |
| 87 |
|
| 2,179 |
|
| 0 |
|
| 2,266 | ||
| Telecom products and services |
| 0 |
|
| 2,945 |
|
| 0 |
|
| 2,945 | ||
| Lending revenue |
| 5,474 |
|
| 0 |
|
| 0 |
|
| 5,474 | ||
| Insurance revenue |
| 1,709 |
|
| 0 |
|
| 0 |
|
| 1,709 | ||
| Account holder fees |
| 1,414 |
|
| 0 |
|
| 0 |
|
| 1,414 | ||
| Other |
| 373 |
|
| 237 |
|
| 0 |
|
| 610 | ||
|
| Total revenue, derived from the following geographic locations |
| 16,236 |
|
| 12,171 |
|
| 421 |
|
| 28,828 | |
|
|
| South Africa |
| 16,236 |
|
| 12,171 |
|
| 0 |
|
| 28,407 |
|
|
| Rest of world | $ | 0 |
| $ | 0 |
| $ | 421 |
| $ | 421 |
The following table presents the Company’s revenue disaggregated by major revenue streams, including a reconciliation to operating segments for the nine months ended March 31, 2022:
|
|
|
| Consumer |
| Merchant |
| Other |
| Total | ||||
| Processing fees | $ | 22,535 |
| $ | 24,633 |
| $ | 1,220 |
| $ | 48,388 | ||
|
| South Africa |
| 22,535 |
|
| 24,633 |
|
| 0 |
|
| 47,168 | |
|
| Rest of world |
| 0 |
|
| 0 |
|
| 1,220 |
|
| 1,220 | |
| Technology products |
| 252 |
|
| 15,851 |
|
| 0 |
|
| 16,103 | ||
| Telecom products and services |
| 0 |
|
| 6,169 |
|
| 0 |
|
| 6,169 | ||
| Lending revenue |
| 16,171 |
|
| 0 |
|
| 0 |
|
| 16,171 | ||
| Insurance revenue |
| 6,396 |
|
| 0 |
|
| 0 |
|
| 6,396 | ||
| Account holder fees |
| 4,255 |
|
| 0 |
|
| 0 |
|
| 4,255 | ||
| Other |
| 623 |
|
| 2,715 |
|
| 0 |
|
| 3,338 | ||
|
| Total revenue, derived from the following geographic locations |
| 50,232 |
|
| 49,368 |
|
| 1,220 |
|
| 100,820 | |
|
|
| South Africa |
| 50,232 |
|
| 49,368 |
|
| 0 |
|
| 99,600 |
|
|
| Rest of world | $ | 0 |
| $ | 0 |
| $ | 1,220 |
| $ | 1,220 |
The following table presents the Company’s revenue disaggregated by major revenue streams, including a reconciliation to operating segments for the nine months ended March 31, 2021:
|
|
|
| Consumer |
| Merchant |
| Other |
| Total | ||||
| Processing fees | $ | 23,318 |
| $ | 20,496 |
| $ | 2,855 |
| $ | 46,669 | ||
|
| South Africa(1) |
| 23,318 |
|
| 20,496 |
|
| 0 |
|
| 43,814 | |
|
| Rest of world |
| 0 |
|
| 0 |
|
| 2,855 |
|
| 2,855 | |
| Technology products |
| 158 |
|
| 13,723 |
|
| 0 |
|
| 13,881 | ||
| Telecom products and services |
| 0 |
|
| 10,515 |
|
| 0 |
|
| 10,515 | ||
| Lending revenue |
| 14,962 |
|
| 0 |
|
| 0 |
|
| 14,962 | ||
| Insurance revenue |
| 4,779 |
|
| 0 |
|
| 0 |
|
| 4,779 | ||
| Account holder fees |
| 3,870 |
|
| 0 |
|
| 0 |
|
| 3,870 | ||
| Other |
| 780 |
|
| 813 |
|
| 0 |
|
| 1,593 | ||
|
| Total revenue, derived from the following geographic locations |
| 47,867 |
|
| 45,547 |
|
| 2,855 |
|
| 96,269 | |
|
|
| South Africa |
| 47,867 |
|
| 45,547 |
|
| 0 |
|
| 93,414 |
|
|
| Rest of world | $ | 0 |
| $ | 0 |
| $ | 2,855 |
| $ | 2,855 |
31
16.Leases
The Company has entered into leasing arrangements classified as operating leases under accounting guidance. These leasing arrangements relate primarily to the lease of its corporate head office, administration offices and branch locations through which the Company operates its financial services business in South Africa. The Company’s operating leases have remaining lease terms of between one and five years. The Company also operates parts of its financial services business from locations which it leases for a period of less than one year. The Company’s operating lease expense during the three months ended March 31, 2022 and 2021 was $0.9 million and $1.1 million, respectively. The Company’s operating lease expense during the nine months ended March 31, 2022 and 2021 was $2.7 million and $2.9 million, respectively. The Company does not have any significant leases that have not commenced as of March 31, 2022.
The Company has also entered into short-term leasing arrangements, primarily for the lease of branch locations and other locations, to operate its financial services business in South Africa. The Company’s short-term lease expense during the three months ended March 31, 2022 and 2021, was $ 1.3 million and $ 1.0 million, respectively. The Company’s short-term lease expense during the nine months ended March 31, 2022 and 2021, was $ 3.9 million and $ 3.1 million, respectively.
The following table presents supplemental balance sheet disclosure related to the Company’s right-of-use assets and its operating lease liabilities as of March 31, 2022 and June 30, 2021:
|
|
|
| March 31, |
| June 30, |
| ||
|
|
|
| 2022 |
| 2021 |
| ||
|
| Right of use assets obtained in exchange for lease obligations: |
|
|
|
|
|
|
|
|
| Weighted average remaining lease term (years) |
|
| 3.00 |
|
| 3.94 |
|
|
| Weighted average discount rate (percent) |
|
| 9.3 |
|
| 9.3 |
|
The maturities of the Company’s operating lease liabilities as of March 31, 2022, are presented below:
|
| Maturities of operating lease liabilities |
|
|
|
|
| Year ended June 30, |
|
|
|
|
| 2022 (excluding nine months to March 31, 2022) |
| $ | 917 |
|
| 2023 |
|
| 1,832 |
|
| 2024 |
|
| 861 |
|
| 2025 |
|
| 260 |
|
| 2026 |
|
| 0 |
|
| Thereafter |
|
| 0 |
|
| Total undiscounted operating lease liabilities |
|
| 3,870 |
|
| Less imputed interest |
|
| 293 |
|
| Total operating lease liabilities, included in |
|
| 3,577 |
|
| Operating lease liability - current |
|
| 2,232 |
|
| Operating lease liability - long-term |
| $ | 1,345 |
17.Operating segments
Change to internal reporting structure and restatement of previously reported information
During November 2021, the Company’s chief operating decision maker changed the Company’s operating and internal reporting structures following the establishment of a new management team and the Company’s decision to focus primarily on the South African market. The chief operating decision maker has decided to analyze the Company’s operating performance primarily based on operational lines which group financial services provided to customers (consumers) into the Consumer operating segment and goods and services provided to corporate and other juristic entities into the Merchant operating segment.
Reallocation of certain activities among operating segments
During the second quarter of fiscal 2022, the Company reorganized its operating segments by combining financial services provided to consumers (primarily individuals) from the Financial services operating segment with processing activities provided for customers within the Consumer operating segment, and by allocating processing activities performed for merchants (primarily corporate and juristic customers) from the Processing operating segment to the Merchant operating segment. Sales of hardware and licenses to customers (primarily corporate entities) included in the Technology operating segment have been allocated to the Merchant operating segment. Lastly, processing activities performed outside of South Africa have been allocated from the Processing operating segment to the Other operating segment. Segment results for the three and nine months ended March 31, 2022, reflect these changes to the operating segments. Previously reported information has been restated.
32
17.Operating segments (continued)
Operating segments
The Company discloses segment information as reflected in the management information systems reports that its chief operating decision maker uses in making decisions and to report certain entity-wide disclosures about products and services, major customers, and the countries in which the entity holds material assets or reports material revenues. A description
The Company currently has three reportable segments: Consumer, Merchant and Other. Consumer and Merchant operate mainly within South Africa and certain of the Company’s current and legacy activities outside of South Africa have been allocated to our Other operating segment. The Company’s reportable segments is contained in Note 23offer different products and services and require different resources and marketing strategies but share the Company’s assets.
The Consumer segment includes activities related to the Company’s audited consolidatedprovision of financial statements includedservices to customers, including a bank account, loans and insurance products. The Company charges monthly administration fees for all bank accounts. Customers that have a bank account managed by the Company are issued cards that can be utilized to withdraw funds at an ATM or to transact at a merchant point of sale device (“POS”). The Company earns processing fees from transactions processed for these customers. The Company also earns fees on transactions performed by other banks’ customers utilizing its ATM or POS. The Company provides short-term loans to customers in South Africa for which it earns initiation and monthly service fees. The Company writes life insurance contracts, primarily funeral-benefit policies, and policy holders pay the Company a monthly insurance premium.
The Merchant segment includes activities related to the provision of goods and services provided to corporate and other juristic entities. The Company earns fees from processing activities performed for its Annual Reportcustomers and revenue generated from the distribution of prepaid airtime. The Company provides its customers with transaction processing services that involve the collection, transmittal and retrieval of all transaction data. This segment also includes sales of hardware and licenses to customers. Hardware includes the sale of POS devices, SIM cards and other consumables which can occur on Form 10-Kan ad hoc basis. Licenses include the right to use certain technology developed by the Company.
The Other segment includes our operations outside South Africa and IPG’s processing activities for the applicable period through to the year ended June 30, 2017.2021.
Corporate/Eliminations includes the Company’s head office cost center and the amortization of acquisition-related intangible assets.
33
17.Operating segments (continued)
Operating segments (continued)
The reconciliation of the reportable segmentssegment’s revenue to revenue from external customers for the three months ended DecemberMarch 31, 20172022 and 2016,2021, is as follows:
|
|
|
|
|
| Revenue | |||||||
|
|
|
|
|
| Reportable Segment |
|
| Inter-segment |
|
| From external customers | |
|
|
|
|
|
|
|
|
|
|
|
|
|
|
| Consumer | $ | 16,429 |
| $ | 0 |
| $ | 16,429 | ||||
| Merchant |
| 18,478 |
|
| 102 |
|
| 18,376 | ||||
| Other |
| 397 |
|
| 0 |
|
| 397 | ||||
|
| Total for the three months ended March 31, 2022 | $ | 35,304 |
| $ | 102 |
| $ | 35,202 | |||
|
|
|
|
|
|
|
|
|
|
|
|
|
|
| Consumer | $ | 16,236 |
| $ | 0 |
| $ | 16,236 | ||||
| Merchant |
| 12,171 |
|
| 0 |
|
| 12,171 | ||||
| Other |
| 421 |
|
| 0 |
|
| 421 | ||||
|
|
| Total for the three months ended March 31, 2021 | $ | 28,828 |
| $ | 0 |
| $ | 28,828 | ||
| Revenue | |||||||||
| From | |||||||||
| Reportable | Inter- | external | |||||||
| Segment | segment | customers | |||||||
| South African transaction processing | $ | 64,148 | $ | 6,181 | $ | 57,967 | |||
| International transaction processing | 44,185 | - | 44,185 | ||||||
| Financial inclusion and applied technologies | 54,131 | 7,867 | 46,264 | ||||||
| Total for the three months ended December 31, 2017 | $ | 162,464 | $ | 14,048 | $ | 148,416 | |||
| South African transaction processing | $ | 59,862 | $ | 5,395 | $ | 54,467 | |||
| International transaction processing | 44,000 | - | 44,000 | ||||||
| Financial inclusion and applied technologies | 59,258 | 6,292 | 52,966 | ||||||
| Total for the three months ended December 31, 2016 | $ | 163,120 | $ | 11,687 | $ | 151,433 | |||
The reconciliation of the reportable segmentssegment’s revenue to revenue from external customers for the sixnine months ended DecemberMarch 31, 20172022 and 2016,2021, is as follows:
|
|
|
|
|
| Revenue | |||||||
|
|
|
|
|
| Reportable Segment |
|
| Inter-segment |
|
| From external customers | |
|
|
|
|
|
|
|
|
|
|
|
|
|
|
| Consumer | $ | 50,232 |
| $ | 0 |
| $ | 50,232 | ||||
| Merchant |
| 49,652 |
|
| 284 |
|
| 49,368 | ||||
| Other |
| 1,220 |
|
| 0 |
|
| 1,220 | ||||
|
| Total for the nine months ended March 31, 2022 | $ | 101,104 |
| $ | 284 |
| $ | 100,820 | |||
|
|
|
|
|
|
|
|
|
|
|
|
|
|
| Consumer | $ | 47,867 |
| $ | 0 |
| $ | 47,867 | ||||
| Merchant |
| 45,623 |
|
| 76 |
|
| 45,547 | ||||
| Other |
| 2,855 |
|
| 0 |
|
| 2,855 | ||||
|
|
| Total for the nine months ended March 31, 2021 | $ | 96,345 |
| $ | 76 |
| $ | 96,269 | ||
| Revenue | |||||||||
| From | |||||||||
| Reportable | Inter- | external | |||||||
| Segment | segment | customers | |||||||
| South African transaction processing | $ | 130,585 | $ | 12,326 | $ | 118,259 | |||
| International transaction processing | 90,207 | - | 90,207 | ||||||
| Financial inclusion and applied technologies | 108,444 | 15,936 | 92,508 | ||||||
| Total for the six months ended December 31, 2017 | $ | 329,236 | $ | 28,262 | $ | 300,974 | |||
| South African transaction processing | $ | 117,430 | $ | 10,796 | $ | 106,634 | |||
| International transaction processing | 90,190 | - | 90,190 | ||||||
| Financial inclusion and applied technologies | 122,800 | 12,558 | 110,242 | ||||||
| Total for the six months ended December 31, 2016 | $ | 330,420 | $ | 23,354 | $ | 307,066 | |||
26
The Company does not allocate interest income, interest expense or income tax expense to its reportable segments.
The Company evaluates segment performance based on segment operatingearnings before interest, tax, depreciation and amortization (“EBITDA”), adjusted for items mentioned in the next sentence (“Segment Adjusted EBITDA”). The Company does not allocate depreciation and amortization, impairment of goodwill or other intangible assets, certain lease charges (“Lease adjustments”), non-recurring items (including gains or losses on disposal of investments, fair value adjustments to equity securities, fair value adjustments to currency options), interest income, interest expense, income tax expense or loss from equity-accounted investments to its reportable segments. The Lease adjustments reflects lease charge excluded from the calculation of Segment Adjusted EBITDA and are therefore reported as a reconciling item to reconcile the reportable segments Segment Adjusted EBITDA to the Company’s loss before acquisition-related intangible asset amortization which represents operating income before acquisition-related intangible asset amortization and allocation of expenses allocated to Corporate/Eliminations, all under GAAP. tax expense.
34
17.Operating segments (continued)
Operating segments (continued)
The reconciliation of the reportable segments measuremeasures of profit or loss to income before income taxes for the three and sixnine months ended DecemberMarch 31, 20172022 and 2016,2021, is as follows:
|
|
|
|
| Three months ended |
|
| Nine months ended | ||||||
|
|
|
|
| March 31, |
|
| March 31, | ||||||
|
|
|
| 2022 |
| 2021 |
| 2022 |
| 2021 | ||||
| Reportable segments measure of profit or loss | $ | (5,508) |
| $ | (10,652) |
| $ | (16,567) |
| $ | (25,209) | ||
|
| Operating loss: Corporate/Eliminations |
| (2,560) |
|
| (1,404) |
|
| (8,775) |
|
| (8,943) | |
|
| Lease adjustments |
| (890) |
|
| (1,104) |
|
| (2,647) |
|
| (2,991) | |
|
| Depreciation and amortization |
| (463) |
|
| (1,132) |
|
| (2,084) |
|
| (3,129) | |
|
| Change in fair value of equity securities |
| 0 |
|
| 10,814 |
|
| 0 |
|
| 25,942 | |
|
| Gain related to fair value adjustment to currency options |
| 6,120 |
|
| 0 |
|
| 3,691 |
|
| 0 | |
|
| Gain on disposal of equity securities |
| 720 |
|
| 0 |
|
| 720 |
|
| 0 | |
|
| Loss on disposal of equity-accounted investment - Bank Frick |
| 0 |
|
| (472) |
|
| 0 |
|
| (472) | |
|
| Loss on disposal of equity-accounted investment |
| (346) |
|
| 0 |
|
| (346) |
|
| (13) | |
|
| Interest income |
| 761 |
|
| 606 |
|
| 1,463 |
|
| 1,934 | |
|
| Interest expense |
| (691) |
|
| (744) |
|
| (2,272) |
|
| (2,168) | |
|
|
| Loss before income taxes | $ | (2,857) |
| $ | (4,088) |
| $ | (26,817) |
| $ | (15,049) |
| Three months ended | Six months ended | |||||||||||
| December 31, | December 31, | |||||||||||
| 2017 | 2016 | 2017 | 2016 | |||||||||
| Reportable segments measure of profit or loss | $ | 21,216 | $ | 33,383 | $ | 52,784 | $ | 67,931 | ||||
| Operating income: Corporate/Eliminations | (4,909 | ) | (7,794 | ) | (11,471 | ) | (10,161 | ) | ||||
| Interest income | 4,705 | 5,061 | 9,749 | 9,365 | ||||||||
| Interest expense | (2,325 | ) | (510 | ) | (4,446 | ) | (1,306 | ) | ||||
| Income before income taxes | $ | 18,687 | $ | 30,140 | $ | 46,616 | $ | 65,829 | ||||
35
17.Operating segments (continued)
Operating segments (continued)
The following tables summarize supplemental segment information that is prepared in accordance with GAAP for the three and sixnine months ended DecemberMarch 31, 20172022 and 2016:2021:
|
|
|
|
|
|
|
|
| Three months ended |
| Nine months ended | ||||||||
|
|
|
|
|
|
|
|
| March 31, |
| March 31, | ||||||||
|
|
|
|
|
|
|
|
| 2022 |
| 2021 |
| 2022 |
| 2021 | ||||
| Revenues |
|
|
|
|
|
|
|
|
|
|
| |||||||
|
| Consumer | $ | 16,429 |
| $ | 16,236 |
| $ | 50,232 |
| $ | 47,867 | ||||||
|
| Merchant |
| 18,478 |
|
| 12,171 |
|
| 49,652 |
|
| 45,623 | ||||||
|
| Other |
| 397 |
|
| 421 |
|
| 1,220 |
|
| 2,855 | ||||||
|
|
| Total |
| 35,304 |
|
| 28,828 |
|
| 101,104 |
|
| 96,345 | |||||
|
|
|
|
|
|
|
|
|
|
|
|
|
|
|
|
|
|
|
|
| Segment Adjusted EBITDA |
|
|
|
|
|
|
|
|
|
|
| |||||||
|
| Consumer(1) |
| (6,866) |
|
| (7,610) |
|
| (20,871) |
|
| (19,395) | ||||||
|
| Merchant |
| 1,271 |
|
| 273 |
|
| 3,951 |
|
| 4,471 | ||||||
|
| Other |
| 87 |
|
| (3,315) |
|
| 353 |
|
| (10,285) | ||||||
|
|
| Total Segment Adjusted EBITDA |
| (5,508) |
|
| (10,652) |
|
| (16,567) |
|
| (25,209) | |||||
|
|
| Corporate/Eliminations |
| (2,560) |
|
| (1,404) |
|
| (8,775) |
|
| (8,943) | |||||
|
|
|
| Subtotal |
| (8,068) |
|
| (12,056) |
|
| (25,342) |
|
| (34,152) | ||||
|
|
|
|
| Less: Lease adjustments |
| 890 |
|
| 1,104 |
|
| 2,647 |
|
| 2,991 | |||
|
|
|
|
| Less: Depreciation and amortization |
| 463 |
|
| 1,132 |
|
| 2,084 |
|
| 3,129 | |||
|
|
|
|
|
| Total operating loss |
| (9,421) |
|
| (14,292) |
|
| (30,073) |
|
| (40,272) | ||
|
|
|
|
|
|
|
|
|
|
|
|
|
|
|
|
|
|
|
|
| Depreciation and amortization |
|
|
|
|
|
|
|
|
|
|
| |||||||
|
| Consumer |
| 226 |
|
| 798 |
|
| 1,377 |
|
| 2,275 | ||||||
|
| Merchant |
| 207 |
|
| 176 |
|
| 613 |
|
| 487 | ||||||
|
| Other |
| 13 |
|
| 66 |
|
| 43 |
|
| 106 | ||||||
|
|
| Subtotal: Operating segments |
| 446 |
|
| 1,040 |
|
| 2,033 |
|
| 2,868 | |||||
|
|
| Corporate/Eliminations |
| 17 |
|
| 92 |
|
| 51 |
|
| 261 | |||||
|
|
|
| Total |
| 463 |
|
| 1,132 |
|
| 2,084 |
|
| 3,129 | ||||
|
|
|
|
|
|
|
|
|
|
|
|
|
|
|
|
|
|
|
|
| Expenditures for long-lived assets |
|
|
|
|
|
|
|
|
|
|
| |||||||
|
| Consumer |
| 713 |
|
| 99 |
|
| 1,523 |
|
| 3,343 | ||||||
|
| Merchant |
| 120 |
|
| 550 |
|
| 196 |
|
| 581 | ||||||
|
| Other |
| 1 |
|
| 0 |
|
| 2 |
|
| 23 | ||||||
|
|
| Subtotal: Operating segments |
| 834 |
|
| 649 |
|
| 1,721 |
|
| 3,947 | |||||
|
|
| Corporate/Eliminations |
| 0 |
|
| 0 |
|
| 0 |
|
| 0 | |||||
|
|
|
| Total | $ | 834 |
| $ | 649 |
| $ | 1,721 |
| $ | 3,947 | ||||
(1) Consumer Segment Adjusted EBITDA for the three and nine months ended March 31, 2022, includes reorganization costs of $5.9 million (refer also Note 1).
| Three months ended | Six months ended | |||||||||||
| December 31, | December 31, | |||||||||||
| 2017 | 2016 | 2017 | 2016 | |||||||||
| Revenues | ||||||||||||
| South African transaction processing | $ | 64,148 | $ | 59,862 | $ | 130,585 | $ | 117,430 | ||||
| International transaction processing | 44,185 | 44,000 | 90,207 | 90,190 | ||||||||
| Financial inclusion and applied technologies | 54,131 | 59,258 | 108,444 | 122,800 | ||||||||
| Total | 162,464 | 163,120 | 329,236 | 330,420 | ||||||||
| Operating income (loss) | ||||||||||||
| South African transaction processing | 13,470 | 15,372 | 25,802 | 28,920 | ||||||||
| International transaction processing | (4,991 | ) | 3,904 | 325 | 9,721 | |||||||
| Financial inclusion and applied technologies | 12,737 | 14,107 | 26,657 | 29,290 | ||||||||
| Subtotal: Operating segments | 21,216 | 33,383 | 52,784 | 67,931 | ||||||||
| Corporate/Eliminations | (4,909 | ) | (7,794 | ) | (11,471 | ) | (10,161 | ) | ||||
| Total | 16,307 | 25,589 | 41,313 | 57,770 | ||||||||
| Depreciation and amortization | ||||||||||||
| South African transaction processing | 1,087 | 1,137 | 2,240 | 2,294 | ||||||||
| International transaction processing | 4,381 | 5,521 | 9,013 | 11,357 | ||||||||
| Financial inclusion and applied technologies | 309 | 354 | 664 | 691 | ||||||||
| Subtotal: Operating segments | 5,777 | 7,012 | 11,917 | 14,342 | ||||||||
| Corporate/Eliminations | 2,946 | 3,611 | 5,772 | 6,485 | ||||||||
| Total | 8,723 | 10,623 | 17,689 | 20,827 | ||||||||
| Expenditures for long-lived assets | ||||||||||||
| South African transaction processing | 900 | 635 | 1,377 | 1,042 | ||||||||
| International transaction processing | 892 | 2,167 | 1,798 | 4,966 | ||||||||
| Financial inclusion and applied technologies | 311 | 324 | 401 | 541 | ||||||||
| Subtotal: Operating segments | 2,103 | 3,126 | 3,576 | 6,549 | ||||||||
| Corporate/Eliminations | - | - | - | - | ||||||||
| Total | $ | 2,103 | $ | 3,126 | $ | 3,576 | $ | 6,549 | ||||
The segment information as reviewed by the chief operating decision maker does not include a measure of segment assets per segment as all of the significant assets are used in the operations of all, rather than any one, of the segments. The Company does not have dedicated assets assigned to a particular operating segment. Accordingly, it is not meaningful to attempt an arbitrary allocation and segment asset allocation is therefore not presented.
36
It is impractical to disclose revenues from external customers for each product and service or each group of similar products and services.
27
17. 18.Income tax
Income tax in interim periods
For the purposes of interim financial reporting, the Company determines the appropriate income tax provision by first applying the effective tax rate expected to be applicable for the full fiscal year to ordinary income. This amount is then adjusted for the tax effect of significant unusual or extraordinary items, for instance, changes in tax law, valuation allowances and non-deductible transaction-related expenses that are reported separately, and have an impact on the tax charge. The cumulative effect of any change in the enacted tax rate, if and when applicable, on the opening balance of deferred tax assets and liabilities is also included in the tax charge as a discrete event in the interim period in which the enactment date occurs.
The South African corporate income tax rate is expected to reduce from 28% to 27% from July 1, 2022. The change in the income tax rate has not been enacted as of March 31, 2022, and accordingly all deferred taxes assets and liabilities related to the Company’s South African operations are still recorded using the enacted corporate income tax rate of 28%.
For the three and sixnine months ended DecemberMarch 31, 2017,2022, the tax charge was calculated using the expected effective tax rate for the year. The Company’s effective tax rate forwas impacted by the tax expense recorded by the Company’s profitable South African operations, non-deductible expenses, the on-going losses incurred by certain of the Company’s South African businesses and the associated valuation allowances created related to the deferred tax assets recognized regarding net operating losses incurred by these entities.
For the three and six months ended DecemberMarch 31, 2017,2021, the Company’s effective tax rate was 53.8% and 43.6%impacted by the tax effect of the change in the fair value of our equity securities (refer to Note 5), respectively, was higherwhich is at a lower tax rate than the South African statutory rate, as a resultthe tax expense recorded by the Company’s profitable South African operations, non-deductible expenses, the on-going losses incurred by IPG and certain of athe Company’s South African businesses and the associated valuation allowance providedallowances created related to an allowance for doubtful working capital finance receivables created, non-deductible expenses (including transaction-related expenditure and non-deductible interest on our South African long-term facility) and the impact of the changes in U.S. federal statutorydeferred tax rates described below.assets recognized regarding net operating losses incurred by these entities.
For the three and sixnine months ended DecemberMarch 31, 2016,2021, the tax charge was calculated using the expected effective tax rate for the year. The Company’s effective tax rate for the three and six months ended December 31, 2016, was 36.4% and 33.6%, respectively, and was higher than the South African statutory rate as a result of additional taxes payable resulting from the finalization of a tax review in South Korea, non-deductible expenses andimpacted by the tax impact attributable to distributions from our South African subsidiary.
New U.S. Tax Legislation
On December 22, 2017, the Tax Cuts and Jobs Act (the “ TCJA”), was enacted into law, significantly modifying U.S. federal tax laws. The TCJA reduces the federal statutory tax rate for corporations from 35% to 21% effective from January 1, 2018, eliminates alternative minimum tax for corporations, limits net operating loss carryforwards (and eliminates carrybacks), limits the deductibility of interest expense and transitions the system of U.S. international taxation of corporations from a worldwide tax system to a territorial tax system. Specifically, the transition to a territorial tax system is not expected to have a significant impact on the Company’s future consolidated effective tax rate as it generates the majority of its taxable income in tax jurisdictions with tax rates higher (mainly South Africa, where its income is taxed at 28%, and Korea, where our income is taxed at 22%) than the new federal statutory tax rate of 21%.
The Company is currently analyzing the impact of these changes; therefore, an estimate of the full impact on deferred tax assets and liabilities, income tax expense, net income and other affected accounts is not yet available. The Company has a June year end and therefore it will use a blended rate of 28.10% for its tax year ending June 30, 2018, in the U.S. Certain of the Company’s deferred tax assets and liabilities which it expects will be utilized/ reversed during the period ended June 30, 2018, have been re-measured at this blended rate and those deferred taxes that the Company believes will only be utilized/ reversed in subsequent tax years, have been remeasured at 21%. The impacteffect of the change in thefair value referred to above, tax rate onexpense recorded by the Company’s profitable South African operations, non-deductible expenses, the on-going losses incurred by IPG and certain of the Company’s South African businesses and the associated valuation allowances created related to the deferred taxes included in income tax expenseassets recognized regarding net operating losses incurred by these entities, which was partially offset by the reversal of the deferred tax liability related to one of the Company’s equity-accounted investments following its impairment.
Uncertain tax positions
The Company had no significant uncertain tax positions during the three and six months ended DecemberMarch 31, 2017, was $0.3 million. The Company has also provided an additional valuation allowance of approximately $0.6 million related to net operating loss carryforwards that it does not believe will be utilized as a result of the enactment of the TCJA.
The TCJA also requires a U.S. shareholder of a specified foreign corporation to include a deemed repatriation of foreign earnings as part of the transition to a territorial tax system; however, the Company does not currently believe that it has a deemed repatriation transition tax liability.
Uncertain tax positions
There were no significant changes during the three2022, and six months ended December 31, 2017. As of December 31, 2017,therefore, the Company had no accrued interest related to uncertain tax positions of approximately $0.1 million on its balance sheet.
The Company does not expect changes related to its unrecognized tax benefits will have a significant impact on its results of operations or financial position in the next 12 months.
As of December 31, 2017 and June 30, 2017, the
The Company hadhas 0 unrecognized tax benefits of $0.5 million and $0.5 million, respectively, all of which would impact the Company’s effective tax rate.benefits. The Company files income tax returns mainly in South Africa, South Korea, Germany, Hong Kong, India, the United Kingdom, Botswana and in the U.S. federal jurisdiction. As of DecemberMarch 31, 2017,2022, the Company’s South African subsidiaries are no longer subject to income tax examination by the South African Revenue Service for periods before June 30, 2013.2017. The Company is subject to income tax in other jurisdictions outside South Africa, none of which are individually material to its financial position, statement of cash flows, or results of operations.
28
18. 19.Commitments and contingencies
Guarantees
Guarantees
The South African Revenue Service and certain of the Company’s customers, suppliers and other business partners have asked the Company to provide them with guarantees, including standby letters of credit, issued by a South African bank. The Company is required to procure these guarantees for these third parties to operate its business.
Nedbank has issued guarantees to these third parties amounting to ZAR 126.0155.1 million ($10.210.7 million, translated at exchange rates applicable as of DecemberMarch 31, 2017) and2022) thereby utilizing part of the Company’s short-term facility. The Company in turn has provided nonrecourse, unsecured counter-guarantees to Nedbank for ZAR 126.0 million ($10.2 million, translated at exchange rates applicable as of December 31, 2017).facilities. The Company pays commission of between 0.4% per annum to 2.0%1.82% per annum of the face value of these guarantees and does not recover any of the commission from third parties.
37
19.Commitments and contingencies (continued)
Guarantees (continued)
The Company has not recognized any obligation related to these counter-guaranteesguarantees in its consolidated balance sheet as of DecemberMarch 31, 2017.2022. The maximum potential amount that the Company could pay under these guarantees is ZAR 126.0155.1 million ($10.210.7 million, translated at exchange rates applicable as of DecemberMarch 31, 2017)2022). As discussed in Note 8, the Company has ceded and pledged certain bank accounts to Nedbank as security for these guarantees with an aggregate value of ZAR 155.1 million ($10.7 million translated at exchange rates applicable as of March 31, 2022). The guarantees have reduced the amount available for borrowings under its indirect and derivative facilities in the Company’s short-term credit facility described in Note 9.8.
As described in Note 9, Net1 has specifically provided guarantees to Bank Frick related to the EUR 40.0 million ($47.9 million) and CHF 20 million ($20.5 million) revolving overdraft facilities provided to Masterpayment. As of December 31, 2017, Masterpayment had utilized approximately $30.7 million of the EUR 40.0 million facility and $4.8 million of the CHF 20 million facility and these obligations are recorded as short-term facilities in the Company’s consolidated balance sheet. The maximum potential amount that the Company could pay under the guarantees to Bank Frick was $35.5 million. As described in Note 9, the overdraft facilities were repaid in full in January 2018 and Net1 will be released from these guarantees once the facilities have been cancelled.
Contingencies
The Company is subject to a variety of insignificant claims and suits that arise from time to time in the ordinary course of business.
Management currently believes that the resolution of these other matters, individually or in the aggregate, will not have a material adverse impact on the Company’s financial position, results of operations or cash flows.
29
20. Subsequent events
2022 Acquisitions
April 2022 acquisition of Connect
On October 31, 2021, the Company entered into a Sale of Shares Agreement (the “Sale Agreement”) with the Sellers (as defined in the Sale Agreement), Cash Connect Management Solutions Proprietary Limited (“CCMS”), Ovobix (RF) Proprietary Limited (“Ovobix”), Luxiano 227 Proprietary Limited (“Luxiano”) and K2021477132 (South Africa) Proprietary Limited (“K2021” and together with CCMS, Ovobix and Luxiano, “Connect”). Pursuant to the Sale Agreement, and subject to its terms and conditions, the Company’s wholly-owned subsidiary, Net1 SA, agreed to acquire, and the Sellers agreed to sell, all of the outstanding equity interests and certain claims in Connect. The transaction closed on April 14, 2022. The Company has commenced the purchase price allocation related to this transaction however the process had not been completed as of the date of filing this Quarterly Report on Form 10-Q on May 10, 2022. The Company expects to include its preliminary allocation of the purchase consideration related to this acquisition in its audited financial statements to be included in its Annual Report on Form 10-K for the year ended June 30, 2022.
The total purchase consideration was ZAR 3.8 billion ($262.0 million), comprising ZAR 3.5 billion ($238.2 million) in cash and ZAR 0.4 billion ($23.9 million) in 3,185,079 shares of the Company’s common stock. The 3,185,079 shares of common stock will be issued in three tranches on each of the first, second and third anniversaries of the closing and was calculated as ZAR 350.0 million divided by the sum of $7.50 multiplied by the closing date exchange rate (as defined in the Sale Agreement) of $1:ZAR 14.65165.
The closing of the transaction was subject to customary closing conditions, including (i) approval from the competition authorities of South Africa, Namibia and Botswana, (ii) exchange control approval from the financial surveillance department of the South African Reserve Bank, and (iii) obtaining certain third-party consents. In addition, the closing of the transaction was subject to entry into definitive financing agreements by each of Net1 SA and CCMS for an aggregate of ZAR 2.35 billion in debt financing provided by Rand Merchant Bank and satisfying the conditions precedent for funding thereunder, of which ZAR 1.1 billion relates to the financing agreements described below and ZAR 1.25 billion related to finance agreements signed between CCMS and RMB. Of the ZAR1.25 billion related to CCMS, ZAR 250 million related to new debt as part of the funding of the acquisition. The definitive loan agreements became effective upon closing the transaction.
The South African competition authorities approved the transaction subject to certain public interest conditions relating to employment, increasing the spread of ownership by historically disadvantaged people (“HDPs”) and workers, and investing in supplier and enterprise development. Further to increasing the spread of ownership by HDPs, Net1 is required to establish an employee share ownership scheme (“ESOP”) within 24 months of the implementation of the Connect acquisition, that complies with certain design principles for the benefit of the workers of the merged entity to receive a shareholding in Net1 equal in value to at least 3% of the issued shares in Net1 at the date of the Connect acquisition. If within 24 months of the implementation date of the transaction, Net1generates a positive net profit for three consecutive quarters, the ESOP shall increase to 5% of the issued shares in Net1 at the date of the Connect acquisition. The final structure of the ESOP is contingent on Net1 shareholder approval and relevant regulatory and governance approvals. The ESOP had not been established as of May 10, 2022.
The Company believes that the acquisition significantly advances its vision to transform into the leading fintech platform for underserved consumers and merchants in South Africa. The combination is strategically important because it combines complementary product offerings to drive stronger unit economics, facilitates expansion of the addressable market to informal MSMEs, Connect has an attractive financial profile with strong and profitable growth, merges highly skilled teams with complementary expertise and allows the combined group to better serve the underserved in South Africa through the provision of dignified financial services to people and businesses who are underserved by the financial system.
38
20. Subsequent events (continued)
New borrowings – South Africa
July 2017 Facilities, as amended, comprising long-term borrowings (Facility G and Facility H) and a short-term facility (Facility E)
Long-term facilities - Facility G and Facility H
The Company, through Net1 SA, entered into a Fourth Amendment and Restatement Agreement, which includes, among other agreements, an Amended and Restated Common Terms Agreement, a Senior Facility G Agreement and a Senior Facility H Agreement (collectively, the “Loan Documents”) with RMB and Main Street 1692 (RF) Proprietary Limited (“Debt Guarantor”), a South African company incorporated for the sole purpose of holding collateral for the benefit of the Lenders and acting as debt guarantor, and certain other parties. The Loan Documents were further amended through letter agreements, which form part of the Loan Documents, in March 2022 and the disclosure in this note includes the amended terms. Net1 agreed to guarantee the obligations of Net1 SA to the Lenders. The Loan Documents became effective upon closing the transaction and the Company drew down on the facilities on April 14, 2022.
The Loan Documents contain customary covenants that require Net1 SA to maintain a specified total asset cover ratio, maintain group cash balances (as defined in the Loan Documents) above ZAR 300.0 million, and restrict the ability of Net1, Net1 SA, and certain of its subsidiaries to make certain distributions with respect to their capital stock, prepay other debt, encumber their assets, incur additional indebtedness, make investment above specified levels, engage in certain business combinations and engage in other corporate activities. The group cash balances may go below ZAR 300 million to the extent equivalent credit support is provided by the VCP Investment Fund and/ or VCP Investment Portfolios (“VCP Investors”), and such support exceeds ZAR 350 million, but such reduction below ZAR 300 million is limited by a further ZAR 80 million to ZAR 220 million.
Pursuant to the Senior Facility G Agreement, Net1 SA may borrow up to an aggregate of ZAR 768.975 million (“Facility G”) for the sole purposes of funding the acquisition of the Target Companies and paying transaction costs. Facility G is required to be repaid on the date which is 18 months after the first utilization of Facility G. Interest on Facility G is payable quarterly in arrears based on the 3-month Johannesburg Interbank Agreed Rate (“JIBAR”) in effect from time to time plus a margin of (i) 3.00% per annum for the first nine months occurring after the effective date (as defined in the Loan Documents); and then (ii) from the date after the nine month period in (i), (x) 2.50% per annum if the Facility G balance outstanding is less than or equal to ZAR 250.0 million, or (y) 3.00% per annum if the Facility G balance is between ZAR 250.0 million to ZAR 450.0 million, or (z) 3.50% per annum if the Facility G balance is greater than ZAR 450.0 million. The interest rate shall increase by a further 2.00% per annum in the event of default (as defined in the Loan Documents). Net1 SA paid a non-refundable deal origination fee of ZAR 11.25 million to the Lenders related to Facility G on closing.
Pursuant to the Senior Facility H Agreement, Net1 SA may borrow up to an aggregate of ZAR 350.0 million (“Facility H”) for the sole purposes of funding the acquisition of the Target Companies and paying transaction costs. Facility H is required to be repaid on the date which is 18 months after the first utilization of Facility H. Interest on Facility H is payable quarterly in arrears based on JIBAR in effect from time to time plus a margin of 2.00% per annum which increases by a further 2.00% per annum in the event of default (as defined in the Loan Documents). Net1 SA paid a non-refundable deal origination fee of ZAR 5.25 million to the Lenders related to Facility H on closing.
Facility G and Facility H are secured by a pledge of certain of the Company’s bank accounts, and the cession of Net1’s shareholding in certain of its subsidiaries.
The Facility H Agreement provides the Lenders with a right to discuss the capitalization of the Net1 group with its management and Value Capital Partners Proprietary Limited (“VCP”) if Net1’s market capitalization on the NASDAQ Global Select Market (based on the closing price on the NASDAQ Global Select Market) on any day falls below the USD equivalent of ZAR 3.250 billion (or such other amount agreed by the parties). VCP is required to maintain an asset cover ratio above 5.00:1.00, calculated as the total VCP investment fund net asset value (as defined in the Facility H agreement) divided by the Facility H borrowings outstanding, measured as of March, June, September and December each year (as applicable) (each a “Measurement Date”). The Lenders require Net1 SA to deliver a compliance certificate procured from VCP as of each applicable Measurement Date, which shows the computation of the asset cover ratio.
39
20. Subsequent events (continued)
Connect’s borrowing
The Company, through CCMS, entered into a Facilities Agreement (the “CCMS Facilities Agreement”) with RMB in January 2022. The CCMS Facilities Agreement was further amended through letter agreements, which form part of the CCMS Facilities Agreement, in March and April 2022, respectively, and the disclosure in this note includes the amended terms. The CCMS Facilities Agreement became effective upon closing the transaction.
The CCMS Facilities Agreement provides for total facilities of ZAR 1.3 billion comprising a Facility A term loan of ZAR 700 million (“Facility A Loan”), a Facility B term loan of ZAR 350 million (“Facility B Loan”), and a general banking facility of ZAR 205.0 million. The amount available under the general banking facility will reduce to ZAR 125.0 million on March 23, 2023. CCMS paid a non-refundable structuring fee of approximately ZAR 4.8 million in April 2022. Interest on the loans is payable quarterly based on JIBAR plus a margin in effect from time to time.
On April 14, 2022, the CCMS utilized the entire amount of Facility A and Facility B and approximately ZAR 211.0 million of the general banking facility to repay its existing borrowings and to settle obligations under the Sales Agreement. Principal repayments related to the Facility A Loan and the Facility B Loan are due at the end of each of the Company’s fiscal quarters. The table below presents payments due within the twelve months ended March 31, for each of the periods specified:
|
|
|
| Facility A Loan |
| Facility B Loan | ||
|
| ZAR '000 |
| ZAR '000 | ||||
| Total facility | ZAR | 700,000 |
| ZAR | 350,000 | ||
| Repayments due within the twelve months ended: |
|
|
|
|
| ||
|
| March 31, 2023 |
| 0 |
|
| (56,250) | |
|
| March 31, 2024 |
| 0 |
|
| (75,000) | |
|
| March 31, 2025 |
| 0 |
|
| (93,750) | |
|
| March 31, 2026 |
| 0 |
|
| (118,750) | |
|
| March 31, 2027 |
| (137,500) |
|
| (6,250) | |
|
| March 31, 2028 | ZAR | (562,500) |
| ZAR | 0 | |
Borrowings under the CCMS Facilities Agreement are secured by a pledge by CCMS of, among other things, all of its equity shares, its entire equity interests in equity securities it owns and any claims outstanding. The CCMS Facilities Agreement contains customary covenants that require CCMS to maintain a specified debt service and interest cover and leverage ratio.
Interest on the Facility A Loan and the Facility B Loan is payable quarterly in arrears based on the Johannesburg Interbank Agreed Rate (“JIBAR”) in effect from time to time for the interest period (as defined in the CCMS Facilities Agreement) plus a margin of (i) 4.00% per annum while the leverage ratio is greater than or equal to 3.50 times; (ii) 3.75% per annum while the leverage ratio is between 2.50 times and 3.50 times, or (iii) 3.40% per annum while the leverage ratio is less than or equal to 2.50 times.
VCP Securities Purchase Agreement
On March 22, 2022, Net1 and Net1 SA entered into a Securities Purchase Agreement (the “VCP Agreement”) with Value Capital Partners Proprietary Limited (“VCP”) whereby VCP will procure that one or more funds under its management (the “Purchasing Funds”) will subscribe for, and Net1 will have the obligation to issue and sell to the Purchasing Funds, ZAR 350.0 million of common stock of Net1 if (i) an event of default occurs under Facility G or Facility H, (ii) Net1 SA fails to pay all outstanding amounts in respect of Facility H on the maturity date of such facility, or (iii) the market capitalization of Net1 on the Nasdaq Global Select Market (based on the closing price on such exchange) falls and remains below the U.S. dollar equivalent of ZAR 2.6 billion on more than one day. The VCP Agreement contains customary representations and warranties from Net1 and VCP and covenants from Net1 and Net1 SA. In connection with the VCP Agreement, Net1 SA agreed to pay VCP a commitment fee in an amount equal to ZAR 5.25 million.
Additionally, Net1, Net1 SA and VCP entered into a Step-In Rights Letter on March 22, 2022 with RMB, which provides RMB with step in rights to perform the obligations or enforce the rights of Net1 and Net1 SA under the VCP Agreement to the extent that Net1 and Net1 SA fail to do so and do not remedy such failure within two business days of notice of such failure.
Grant of shares of restricted stock to Connect employees
On April 14, 2022, the Company granted 1,250,486 shares of restricted stock to employees of Connect pursuant to the Sale Agreement. The award includes an equalization mechanism to maintain a return of $7.50 per share of restricted stock upon vesting through the issue of restricted stock units. The conversion of restricted stock units to shares cannot exceed 50% under the terms of the award. The Company has not finalized the accounting for the grant of these equity awards and expects to conclude this matter together with its purchase accounting process referenced above.
40
Item 2. Management’s Discussion and Analysis of Financial Condition and Results of Operations
The following discussion should be read in conjunction with our Annual Report on Form 10-K for the year ended June 30, 2017,2021, and the unaudited condensed consolidated financial statements and the accompanying notes included in this Form 10-Q.
Forward-looking statements
Some of the statements in this Form 10-Q constitute forward-looking statements. These statements relate to future events or our future financial performance and involve known and unknown risks, uncertainties and other factors that may cause our or our industry’s actual results, levels of activity, performance or achievements to be materially different from any future results, levels of activity, performance or achievements expressed, implied or inferred by these forward-looking statements. Such factors include, among other things, those listed under Item 1A.—“Risk Factors” and elsewhere in our Annual Report on Form 10-K for the year ended June 30, 2017.2021. In some cases, you can identify forward-looking statements by terminology such as “may,” “will,” “should,” “could,” “would,” “expects,” “plans,” “intends,” “anticipates,” “believes,” “estimates,” “predicts,” “potential” or “continue” or the negative of such terms and other comparable terminology.
Although we believe that the expectations reflected in the forward-looking statements are reasonable, we do not know whether we can achieve positive future results, levels of activity, performance, or goals. Actual events or results may differ materially. We undertake no obligation to update any of the forward-looking statements after the date of this Form 10-Q to conform those statements to reflect the occurrence of unanticipated events, except as required by applicable law.
You should read this Form 10-Q and the documents that we reference herein and the documents we have filed as exhibits hereto and thereto and which we have filed with the United States Securities and Exchange Commission completely and with the understanding that our actual future results, levels of activity, performance and achievements may be materially different from what we expect. We qualify all of our forward-looking statements by these cautionary statements.
Recent Developments
SASSA Update
Our current contractAdopting a new brand and identity
As we embarked on creating a world class financial technology platform and repositioning ourselves for growth, it became evident we required a new identity that would resonate with SASSA is scheduledour customers and employees. It was important for our new identity to expire on March 31, 2018. SASSAauthentically express our commitment to the local communities we serve and our ambition to drive financial inclusion by giving ordinary people and small businesses access to essential financial services.
For thousands of years livestock have been seen as a symbol of security, community and wealth and protecting one’s livestock was central to preserving the expert panel appointed bydignity and pride of a community. To ensure the court filed the regular progress reportsbest possible protection, an enclosure commonly known as a “kraal” in accordance with the Constitutional Court’s order. We have provided the expert panel with all the information required from us.
On December 10, 2017, the MinisterSouth Africa, was built in the Presidency, Jeff Radebe, announcedcenter of the community. A kraal is seen as the social and economic heart of a village and only the most reliable people are entrusted with its care and protection. The word Lesaka means Kraal in Setswana and Sesotho, two of South Africa’s official languages, and it was agreed by our shareholders that the Inter-ministerial Committee appointedexisting company name Net1, should change to Lesaka, which aptly represents our new group and its vision.
As Lesaka, we are on a mission to build and protect the financial wellbeing of our communities and our intention is to protect the vulnerable and underserved, by providing widespread access to essential financial services.
Update on our strategic focus areas
In the prior quarter we communicated the following four key pillars, that remain critical to the successful transformation of our company, to becoming a leading South African Presidentfull-service fintech platform:
Growing the existing merchant business;
Returning the consumer business to overseebreakeven;
Transforming our organization into a world class fintech platform; and
Strengthening our relationships with key stakeholders.
Focused effort throughout the transitionthird quarter to deliver on each of grant payments brokered a high-level cooperation agreement betweenthese pillars delivered positive momentum, repositioning the South African Post Office, or SAPO,business to capture the long-term growth opportunities across both our merchant and SASSA, in termsconsumer businesses.
Growing the existing Merchant business
On April 14, 2022, we announced the closing of which SAPO will assume responsibility for the distribution of social grants with effect from April 1, 2018.
On January 15, 2018, SASSA filed a report with the Constitutional Court stating the following: “The process of continuing with cash payments will require a tender process, since SAPO has indicated that they are unable to undertake the cash payment function within the time period left, although they indicated that they can do this by December 2018.” On January 12, 2018, SASSA issued a tender for the cash payment of grantsConnect Group acquisition for a five year period which is due for submission on February 28, 2018. SAPO issued three tenders on December 22, 2018, forconsideration of ZAR 3.8 billion ($264.0 million). This transformational acquisition positions the production of smart cards,Group as a multi-mode biometric verification engine and an integrated grant payments system.
In the same report to the court, SASSA also stated: “A phase in period of at least 6 months would be required to take over payments from the existing provider, CPS. This implies that the court will have to be approached to extend the suspension of the invalidity of the current payment contract until 30 September 2018, to allow forleading fintech company, offering a managed phase out process over a period of 6 months, which will see the new service provider progressively taking more responsibility for payments, while CPS is still in the background. This process will be managed by SASSA.”
On February 6, 2018, SASSA filed a notice of motion with the Constitutional Court, applying for the following order: " Cash Paymaster Services (CPS) is to continue to provide cash payment services to the social grant beneficiaries of SASSA who receive their social grants by way of cash payments without personal identification numbers on an interim basis and on the same terms and conditions as to payment as those currently in place between CPS and SASSA for the period 1 April 2018 up to 30 September 2018, provided CPS shall be paid only in respect of such limited services to be rendered to SASSA and in respect of this categories (sic) of beneficiaries only."
In line with the recommendations made by the expert panel in its second and third reports to the Constitutional Court, we wrote a letter to SASSA on December 27, 2017 advocating the use of commercial bank accounts, subsidized by SASSA to limit the impact of bank charges, for the distribution of grant payments. SASSA has indicated that the subsidization of bank accounts will be considered if agreement can be reached with prospective participating banks regarding the functionality of the accounts being offered. SASSA has since engaged the South African banks to determine the feasibility of such an approach.
30
On February 6, 2018, CPS launched an application with the Constitutional Court seeking an order declaring that CPS is not prohibited by the Constitutional Court’s order of March 17, 2017, from participating in the tender for “the provision of cash payment services for social assistance” issued by SASSA, because SASSA has previously reported that CPS is not entitled to participate in any future tenders.
We continue to deliver our grant payment solution in accordance with our current agreement and we have paid all 10.7 million social grant recipients, without interruption, every month since our contract was extended in March 2017. We will continue to cooperate with SASSA, the expert panel and any other delegated government entity to assist them in finding a solution and ensuring a smooth handover to any entity legally appointed to render the grant payment service.
Progressbroad range of financial inclusion initiatives in South Africaservices and products to consumers (“B2C”) and merchants (“B2B”) across both the formal and informal sectors.
In June 2015, we began the rollout of EPE, our business-to-consumer, or B2C, offering
41
There are approximately 1.4 million informal and approximately 700,000 formal micro, small and medium enterprises (“MSME”) in South Africa. At January 31, 2018, we had more than 2.3 million active EPE accounts, comparedWith market leading affordable products and technologies, the Connect Group is well positioned to 2.1 million at October 31, 2017. EPE iscontinue its growth in the MSME sector. The Connect Group’s MSME offering, combined with our EasyPay platform targeting the larger merchants, and our point-of-sale business, provides a fully transactional, low cost account created to serve the needs of South Africa’s unbanked and under-banked population, most of whom are social grant recipients. The EPE account offers customers a comprehensive suite of financial and various financial inclusion services, such as prepaid products, in an economical, convenient and secure solution. EPE provides account holders with a UEPS-EMV debit MasterCard, mobile and internet banking services, ATM and POS services, as well as loans, insurance and other financial products and value-added services. However, SASSA and a non—profit organization continue to challenge the ability of beneficiaries to freely transact with the grants that they receive as described under “Item 1—Legal Proceedings.”
In order for us to address the sizeable opportunity for EPE and related financial inclusion services in South Africa, in fiscal 2016, we started to expand our brick-and-mortar financial services branch infrastructure, which supplements our nationwide distribution, with a UEPS/EMV-enabled ATM network, and hired a dedicated sales force. We believe that the growth in our brick-and-mortar branch infrastructure has reached saturation and therefore we have embarked on a program to increase our financial services revenues through a roaming sales force equipped with a UEPS/EMV-enabled card-issuing work station. In January 2018, we deployed 500 portable card-issuing working stations and employed 625 temporary staff to achieve this objective. At January 31, 2018, we had 152 branches (October 31, 2017: 146), 1,073 ATMs (October 31, 2017: 1,008), and 2,394 (October 31, 2017: 1,925) dedicated employees, including the temporary staff.
During the seven months since July 1, 2017, we sold approximately 109,000 new policies related to our simple, low-cost life insurance products, in addition to the free basic life insurance policy provided with every EPE account opened.
The graph below presents the growth of the number of EPE cards and Smart Life policies:

31
Strategic investments
Investments in Cell C Proprietary Limited and DNI-4PL Contracts Proprietary Limited
On August 2, 2017, we purchased 15% of Cell C, for an aggregate purchase price of ZAR 2.0 billion ($151.0 million)) in cash. Cell C is one of the three major licensed mobile operators in South Africa with approximately 16 million active subscribers. We funded the transaction through a combination of cash and credit facilities.
On July 27, 2017, we subscribed for 44,999,999 ordinary A shares in DNI, representing a 45% voting and economic interest in DNI, for a subscription price of ZAR 945.0 million ($72.0 million) in cash. Under the terms of our agreements with DNI, we are required to pay to DNI an additional amount of up to ZAR 360 million ($29.1 million, translated at the foreign exchange rates applicable as of December 31, 2017), in cash, subject to the achievement of certain performance targets by DNI.
The investments in Cell C and DNI are consistent with our approach of leveraging our significant and established infrastructures, and pursuing strategic acquisition opportunities or partnerships to gain access to new markets or complementary products. We identified the need to offer customers a truly bespoke, affordable and comprehensive package that will go beyond basic telephony. An integrated mobile-based digital product will therefore likely differentiate the offerings of all the relevant stakeholders in this transaction including Net1. The Cell C and DNI investments allow us to address the needs of the broaderentire spectrum of merchants in South African population through ownership inAfrica.
Mr. Steve Heilbron, CEO of the value chain includingConnect Group, joined our board on April 14, 2022, and will be responsible for heading up our Merchant business. Integrating the network, payment, product, distribution and hardware. Connect Group will be a focus area for us for the remainder of the fiscal year, to ensure we capitalize on the growth opportunity delivered by this acquisition.
Refer to Note 20 to our unaudited condensed consolidated financial statements for additional information related to the acquisition.
Returning the Consumer business to breakeven
We have pledged, among other things,made significant progress in returning the Consumer segment to break-even and are encouraged with the Segment Adjusted EBITDA loss of $6.9 million (which includes reorganization costs of $5.9 million), or $1.0 million after adjusting for the $5.9 million of reorganization costs related to Project Spring. However, transforming the business and culture, from one which was focused on the logistics of efficiently distributing grant to over ten million grant recipients each month, to a sales focused organization remains a challenge we are focused on. We have commenced the work on training and building our entire equity interestssales force, but this will take time. We continue to work towards achieving a monthly Segment Adjusted EBITDA break-even position for our consumer business by the end of the fourth quarter, however certain elements may take longer than originally anticipated.
The Consumer segment continues to show considerable improvement in Cell Cperformance from a year ago and DNIpositive momentum was achieved during the third quarter of fiscal 2022, through focusing on the three levers previously communicated:
Increasing active EPE account numbers, through driving customer acquisition;
Improving ARPU, underpinned by increased cross selling; and
Optimizing the cost structure, in line with a focus on customer centricity.
Progress on driving customer acquisition
We grew our total customer base by approximately 38,300 net active customers of which around 9,700 were EPE lite customers and around 28,600 were EPE customers, ending the quarter with just over 1.1 million active customers. This active account growth is slower than what we had anticipated. We did, however, register 136,000 gross account openings during the quarter, and have initiated a workstream focusing on improving account activation and utilization. This included the introduction of a dedicated call center focused on assisting customers with activating their accounts and proactively resolving any issues they may be facing during the activation process. Additionally, our salesforce is now incentivized on account activations and not account openings.
Utilizing improved data analytics and ongoing market research, we continue to gain better insights into our customers and their needs, allowing us to develop effective marketing campaigns and incentives to drive customer growth. A promotional campaign was launched late March 2022, which had a positive impact on new account openings and activations, and we expect this momentum to continue into the fourth quarter of fiscal 2022.
Progress on cross selling
ARPU remains broadly in line with our targeted ARPU range. We had approximately 415,000 active loans at the end of the quarter, representing a 38% penetration of our active EPE customer base, with a total loan book of ZAR 359 million ($24.7 million) as securityof March 31, 2022, up 6% in ZAR compared with March 2021. Despite the average loan size growing to R1,417, up 10% year on year, the portfolio loss ratio, calculated as the loans written off during the period as a percentage of the total loan book, remains encouragingly low at around 1.0% for the quarter, as a result of our ongoing application of prudent credit scoring and a culture of responsible lending.
Our funeral insurance product provides an important growth opportunity for our cross-selling strategy, with penetration levels averaging 18% of the active account base. Over 5,500 new standalone policies were initiated during the quarter, growing the total number of active policies to approximately 247,300, up 3.8% compared with March 2021.
A delivery of fifty-two ATMs were received during the quarter. These ATMs will provide additional cross-selling opportunities as the year progresses, as they are enabled to include the added functionality of selling value added services, loans and insurance. Their “through the wall” installations allow them to be deployed in locations which are accessible to customers 24/7.
42
Progress on cost optimization
In order to optimize the overall cost base and to move the business towards a sales-focused and client solution driven financial services organization, we launched Project Spring during the 2022 financial year. Project Spring focused on the restructuring of our financial services business and the rationalization of the distribution network. Pursuant to Project Spring, a detailed review of the distribution network was performed, to identify underperforming branches and optimize our points of presence, while a significant exercise is underway to ensure our ATM footprint meets the needs of our customer base. We also embarked on a retrenchment process pursuant to Section 189A of the South African facilities usedLabour Relations Act (“Labour Act”). The Section 189A process requires an employer, before retrenching, to partially fundconsult with any person affected by the acquisitionretrenchment process for 60 days. We commenced this process on January 10, 2022, and completed the process during March 2022, recording a total charge during the third quarter of Cell C,fiscal 2022 of $5.9 million. Please refer alsoto Note 101 to our unaudited condensed consolidated financial statements.statements for additional information.
Investment
The Section 189A process, which is now complete, was a difficult and uncertain time for many employees.
Significant progress has been made on optimizing the cash distribution and ATM network. Our large fleet of mobile ATMs and the associated distribution and security costs have been eliminated. Following a review of the ATM placements, over 50% of our ATM network are now positioned in Bank Frickretailers, providing greater footfall and longer operating hours compared to our branches.
We estimate that the aggregate annualized cost saving for Project Spring is over ZAR 300.0 million.
Transforming our organization into a world class fintech platform
Building a world class fintech platform requires highly talented people, an environment where they can outperform and a clear vision and strategy, where everyone is aligned and understands their role in achieving that vision.
On October 2, 2017,March 1, 2022, Mr. Naeem Kola joined our board and became our Group CFO. On the same date, Mr. Alex Smith stepped down as CFO, resigned from our board and took up his new role as Chief Accounting Officer. During this quarter, we acquiredalso successfully recruited a 30% interesthead of Legal and Company Secretarial, Verna Douman. Verna is a qualified seasoned attorney, with over 25 years experience in Bank Frick & Co AG,corporate, banking and finance sectors.
The majority of the new senior leadership team has been finalized and have all now commenced their employment contracts. The leadership team has deep and relevant experience to deliver on the mission of the Company, with the necessary governance structures in place.
Further to the South African Competition Tribunal’s approval of the Connect Group acquisition, their approval was subject to the company implementing an employee share transaction (“ESOP”) of at least 3% of the issued shares of the company, to increase the spread of ownership by historically disadvantaged people and workers. If within 24 months of the implementation date of the Connect Group transaction, the company generates a fully licensed bank basedpositive net profit for 3 consecutive quarters, the ESOP shall increase to 5% of the issued shares. The final structure of the ESOP is contingent on shareholder approval and relevant regulatory and governance approvals.
Improving stakeholder engagements
We continue to build our relationship with SASSA, through proactive engagement at a local, provincial and national level, to gain a better understanding of their needs and how we can help and improve the delivery of social grants to over 12 million grant recipients. Good progress has been made in Balzers, Liechtenstein, fromthis regard during the Kuno Frick Family Foundationquarter.
Investments
There has been no change to the carrying value of our investment in MobiKwik during this quarter. MobiKwik filed its draft red herring prospectus in July 2021, with the original intention of completing its initial public offering in November 2021. MobiKwik decided to delay its initial public offering given prevailing market conditions and will reassess their options as market conditions change. MobiKwik has been focusing on its buy now pay later (BNPL) offering and has seen significant growth in that area in the last year.
On March 15, 2022, Blue Label Telecoms Limited, the largest shareholder in Cell C, announced that it has concluded a non-binding term sheet (“Umbrella Restructure Term Sheet”) with Cell C and various Cell C financial stakeholders. In terms of the Umbrella Restructure Term Sheet, Cell C will be restructured and refinanced with the purpose of deleveraging its balance sheet, providing it with liquidity with which to operate and grow its businesses and to position itself to achieve long term success for approximately CHF 39.8 million ($40.8 million translatedthe benefit of its customers, employees, creditors, shareholders, and other stakeholders. The long form agreements, which will be binding, are currently in process of preparation and will incorporate the terms and conditions contained in the Umbrella Restructure Term Sheet. Our investment in Cell C is held at exchange rates applicablea carrying value of $0 (zero) as of DecemberMarch 31, 2017). On January 26, 2018, the parties entered into an addendum to the Bank Frick shareholders agreement pursuant to which we agreed to purchase an additional 5% in Bank Frick from the Frick Foundation for CHF 10.43 million ($10.9 million) and the Frick Foundation agreed to contribute approximately CHF 3.8 million ($3.9 million) to Bank Frick to facilitate the development2022.
43
Impact of Bank Frick’s Fintech and blockchain businesses. We have an option, exercisable until October 2, 2019, to acquire an additional 35% interest in Bank Frick.COVID-19
Bank Frick provides a complete suite of banking services, with one of its key strategic pillars being the provision of payment services and funding of financial technology opportunities. Bank Frick holds acquiring licenses from both Visa and MasterCard and operates a branch in London. We have jointly identified several funding opportunities, including for our card issuing and acquiring, remittance and transaction processing activities as well new opportunities in cryptocurrency and blockchain. The investment in Bank Frick has the potential to provide us with a stable, long term and strategic relationship with a fully licensed bank.
Masterpayment – Processing for Bitstamp
In November 2017, Masterpayment was appointed as a new partner for credit card processing and acquiring for cryptocurrency purchases for Bitstamp, a leading global digital currency exchange and the largest Bitcoin exchange in the EU in terms of volume. This partnership will allow Bitstamp customers to enjoy faster and more convenient transactions, while maintaining the same high-caliber security and has resulted in higher processing revenue as of a result of the increase in the number of transactions processed by Masterpayment. Masterpayment transaction volumes in December 2017 more than doubled compared to November 2017 as a result of its new cryptocurrency processing initiatives.
Mastertrading - Exit from Working Capital Financing and Supply Chain Solutions Business
During the second quarter of fiscal 2018, we re-evaluated the operating performance and ongoing viability of Masterpayment’s working capital financing and supply chain solutions offering and have determined to exit this portion of its business. While we believe we could scale this offering in the medium to long-term by focusing on customers and industries outside our initial target market, this standalone offering does not fit the International Payments Group strategy of providing payment solutions and working capital to small and medium-sized merchants. In order to focus on our stated international strategy, we have decided to wind-down the traditional working capital finance book issued to non-payment solutions customers.
The working capital book has reduced to $35.8 million, net of an allowance of $11.8 million allowance, as of December 31, 2017, from $56.5 million, net of an allowance of $4.0 million, as of September 2017. We have performed a detailed analysis of our U.S. and European books and have identified two customers included on the U.S. book servicing customers in the petroleum industry, totaling approximately $7.8 million, that we believe may not be able to settle their loan obligations due to us. We had expected repayment of the amounts due by these customers by November 2017, however, repayments were not received and we have not been ableexperienced significant disruptions thus far from the COVID-19 outbreak, we are unable to negotiate a reasonable settlement plan with them.
32
While weaccurately predict the impact that COVID-19 will have due to numerous uncertainties, including the severity of the disease, the duration of the outbreak, actions that may be taken by governmental authorities, the impact on our customers and other factors identified in Part I, Item 1A. “Risk Factors— We are unable to ascertain the full impact the COVID-19 pandemic will have on our future financial position, operations, cash flows and stock price” in our Annual Report on Form 10-K for the year ended June 30, 2021. We will continue to discuss recovery alternativesevaluate the nature and procedures with these customers and our lawyers, it appears more likely than not at this stage that these customers will not be able to settle their obligations due to us in full, or even in part. We have created an allowance for doubtful working capital finance receivables related to the total amount due to us by these two customers.
Regarding the European componentextent of the book, we have entered into an arrangement with Bank Frick under which they purchased the remaining bookimpact to our business, consolidated results of $35.8 million from us in January 2018 at its face value. We have used the proceeds from this transaction to settle the amounts due by us to Bank Frick under the EUR 40 millionoperations, and CHF 20 million revolving overdraft facilities in full and these facilities will be cancelled and we will be released from our guarantees.financial condition.
Critical Accounting Policies
Our unaudited condensed consolidated financial statements have been prepared in accordance with U.S. GAAP, which requires management to make estimates and assumptions about future events that affect the reported amount of assets and liabilities and disclosure of contingent assets and liabilities.liabilities, including the ongoing uncertainty in the current economic environment due to the outbreak of COVID-19. As future events and their effects cannot be determined with absolute certainty, the determination of estimates requires management’s judgment based on a variety of assumptions and other determinants such as historical experience, current and expected market conditions and certain scientific evaluation techniques.
Critical accounting policies are those that reflect significant judgments or uncertainties and may potentially may result in materially different results under different assumptions and conditions. Management hasWe have identified the following critical accounting policies that are described in more detail in our Annual Report on Form 10-K for the year ended June 30, 2017:2021:
Valuation of investment in Cell C;
Recoverability of equity-accounted investments and other equity securities;
Business combinations and the recoverability of goodwill;
Intangible assets acquired through acquisitions;
Deferred taxation;
Stock-based compensation; and
Accounts receivable and allowance for doubtful accounts receivable.
Recent accounting pronouncements adopted
Refer to Note 1 to our unaudited condensed consolidated financial statements for a full description of recent accounting pronouncements adopted, including the dates of adoption and the effects on our unaudited condensed consolidated financial statements.
Recent accounting pronouncements not yet adopted as of DecemberMarch 31, 20172022
Refer to Note 1 to our unaudited condensed consolidated financial statements for a full description of recent accounting pronouncements not yet adopted as of DecemberMarch 31, 2017,2022, including the expected dates of adoption and effects on our financial condition, results of operations and cash flows.
New U.S. Tax Legislation
On December 22, 2017, the “Tax Cuts and Jobs Act”, or TCJA, was enacted into law, significantly modifying U.S. federal tax laws. The TCJA reduces the federal statutory tax rate for corporations from 35% to 21% effective from January 1, 2018, eliminates alternative minimum tax for corporations, limits net operating loss carryforwards (and eliminates carrybacks), limits the deductibility of interest expense and transitions the system of U.S. international taxation of corporations from a worldwide tax system to a territorial tax system. Specifically, the transition to a territorial tax system is not expected to have a significant impact on our future consolidated effective tax rate as we generate the majority of our taxable income in tax jurisdictions with tax rates higher (mainly South Africa, where our income is taxed at 28%, and Korea, where our income is taxed at 22%) than the new federal statutory tax rate of 21%.
We are currently analyzing the impact of these changes on us; therefore, an estimate of the full impact on our deferred tax assets and liabilities, income tax expense, net income and other affected accounts is not yet available. We have a June year end and therefore we will use a blended rate of 28.10% for our tax year ending June 30, 2018, in the U.S. Certain of our deferred tax assets and liabilities which we expect will be utilized/ reversed during the period ended June 30, 2018, have been re-measured at this blended rate and those deferred taxes that we believe will only be utilized/ reversed in subsequent tax years, have been re-measured at 21%. The impact of the change in the tax rate on our deferred taxes included in our income tax expense during the three and six months ended December 31, 2017, was $0.3 million. We have also provided an additional valuation allowance of approximately $0.6 million related to net operating loss carryforwards that we do not believe will be utilized as a result of the enactment of the TCJA.
The TCJA also requires a U.S. shareholder of a specified foreign corporation to include a deemed repatriation of foreign earnings as part of the transition to a territorial tax system; however, we do not currently believe that we have a deemed repatriation transition tax liability.
33
Currency Exchange Rate Information
Actual exchange rates
The actual exchange rates for and at the end of the periods presented were as follows:
| Table 1 | Three months ended | Six months ended | Year ended | ||||||||||||
| December 31, | December 31, | June 30, | |||||||||||||
| 2017 | 2016 | 2017 | 2016 | 2017 | |||||||||||
| ZAR : $ average exchange rate | 13.6318 | 13.9300 | 13.4025 | 14.0095 | 13.6147 | ||||||||||
| Highest ZAR : $ rate during period | 14.4645 | 14.4618 | 14.4645 | 14.8114 | 14.8114 | ||||||||||
| Lowest ZAR : $ rate during period | 12.3268 | 13.3634 | 12.3268 | 13.3000 | 12.4379 | ||||||||||
| Rate at end of period | 12.3689 | 13.7392 | 12.3689 | 13.7392 | 13.0535 | ||||||||||
| KRW : $ average exchange rate | 1,107 | 1,159 | 1,120 | 1,140 | 1,141 | ||||||||||
| Highest KRW : $ rate during period | 1,148 | 1,210 | 1,156 | 1,210 | 1,210 | ||||||||||
| Lowest KRW : $ rate during period | 1,067 | 1,100 | 1,067 | 1,092 | 1,092 | ||||||||||
| Rate at end of period | 1,067 | 1,207 | 1,067 | 1,207 | 1,144 | ||||||||||
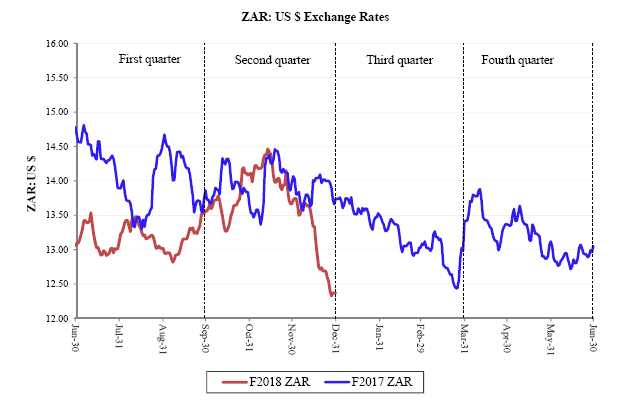
34
Table 1 | Three months ended |
| Nine months ended |
| Year ended | ||||
| March 31, |
| March 31, |
| June 30, | ||||
| 2022 |
| 2021 |
| 2022 |
| 2021 |
| 2021 |
ZAR : $ average exchange rate | 15.2360 |
| 14.9650 |
| 15.0965 |
| 15.8390 |
| 15.4146 |
Highest ZAR : $ rate during period | 15.9536 |
| 15.4724 |
| 16.2968 |
| 17.6866 |
| 17.6866 |
Lowest ZAR : $ rate during period | 14.4916 |
| 14.4689 |
| 14.1630 |
| 14.4689 |
| 13.4327 |
Rate at end of period | 14.5526 |
| 14.8278 |
| 14.5526 |
| 14.8278 |
| 14.3010 |
KRW: US $ Exchange Rates
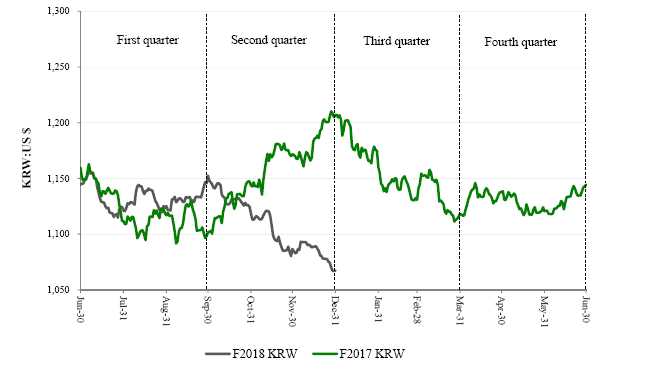
44
Translation exchange rates for financial reporting purposes
We are required to translate our results of operations from ZAR and KRW to U.S. dollars on a monthly basis. Thus, the average rates used to translate this data for the three and sixnine months ended DecemberMarch 31, 20172022 and 2016,2021, vary slightly from the averages shown in the table above. The translation rates we use in presenting our results of operations are the rates shown in the following table:
| Table 2 | Three months ended | Six months ended | Year ended | ||||||||||||
| December 31, | December 31, | June 30, | |||||||||||||
| 2017 | 2016 | 2017 | 2016 | 2017 | |||||||||||
| Income and expense items: $1 = ZAR | 13.6675 | 13.9434 | 13.4127 | 14.0292 | 13.6182 | ||||||||||
| Income and expense items: $1 = KRW | 1,107 | 1,172 | 1,125 | 1,152 | 1,146 | ||||||||||
| Balance sheet items: $1 = ZAR | 12.3689 | 13.7392 | 12.3689 | 13.7392 | 13.0535 | ||||||||||
| Balance sheet items: $1 = KRW | 1,067 | 1,207 | 1,067 | 1,207 | 1,144 | ||||||||||
|
|
|
|
|
|
|
|
|
|
| Three months ended |
| Nine months ended |
| Year ended | ||||
Table 2 | March 31, |
| March 31, |
| June 30, | ||||
| 2022 |
| 2021 |
| 2022 |
| 2021 |
| 2021 |
Income and expense items: $1 = ZAR | 15.6119 |
| 14.9575 |
| 14.9875 |
| 16.1174 |
| 15.7162 |
Balance sheet items: $1 = ZAR | 14.5526 |
| 14.8278 |
| 14.5526 |
| 14.8278 |
| 14.3010 |
Results of operationsOperations
The discussion of our consolidated overall results of operations is based on amounts as reflected in our unaudited condensed consolidated financial statements which are prepared in accordance with U.S. GAAP. We analyze our results of operations both in U.S. dollars, as presented in the unaudited condensed consolidated financial statements, and supplementally in ZAR, because ZAR is the functional currency of the entities which contribute the majority of our profitsrevenue and is the currency in which the majority of our transactions are initially incurred and measured. Due to the significant impact of currency fluctuations between the U.S. dollar and the ZAR on our reported results and because we use the U.S. dollar as our reporting currency, we believe that the supplemental presentation of our results of operations in ZAR is useful to investors to understand the changes in the underlying trends of our business.
Fiscal 2018 includes the results of Pros Software and C4U Malta for the entire period and excludes XeoHealth from November 1, 2017 as a result of the sale of the business. Fiscal 2017 includes the results of Pros Software from October 1, 2016, and C4U Malta from November 1, 2016.
Our operating segment revenue presented in “—Results of operations by operating segment” represents total revenue per operating segment before inter-segmentintercompany eliminations. ReconciliationA reconciliation between total operating segment revenue and revenue presented in our unaudited condensed consolidated financial statements is included in Note 1617 to those statements. Our CODM evaluates segment performance based on segment earnings before interest, tax, depreciation and amortization (“EBITDA”), adjusted for items mentioned in the next sentence (“Segment Adjusted EBITDA”). We do not allocate depreciation and amortization, impairment of goodwill or other intangible assets, certain lease charges (“Lease adjustments”), non-recurring items (including gains or losses on disposal of investments, fair value adjustments to equity securities, fair value adjustments to currency options), interest income, interest expense, income tax expense or loss from equity-accounted investments to our reportable segments. The Lease adjustments reflect lease charges excluded from the calculation of Segment Adjusted EBITDA and are therefore reported as a reconciling item to reconcile the reportable segments’ Segment Adjusted EBITDA to the Company’s loss before income tax expense. A reconciliation of this Segment Adjusted EBITDA to the nearest GAAP measure (net income (loss) before income tax) is included in Note 17 to our unaudited condensed consolidated financial statements. Unless otherwise stated, reference to EBITDA in the discussion below relates to Segment Adjusted EBITDA.
3545
We analyze our business and operations in terms of three inter-related but independent operating segments: (1) South African transaction processing,Consumer, (2) International transaction processingMerchant and (3) Financial inclusion and applied technologies.Other. In addition, corporate and corporate office activities that are impracticable to ascribeallocate directly to any of the other operating segments, as well as any inter-segment eliminations, are included in corporate/eliminations.Corporate/Eliminations.
Second
Third quarter of fiscal 20182022 compared to secondthird quarter of fiscal 20172021
The following factors had a significant influenceimpact on our results of operations during the secondthird quarter of fiscal 20182022 as compared with the same period in the prior year:
Favorable impact fromHigher revenue: Our revenues increased 27% in ZAR primarily due to an increase in hardware sales, an increase in merchant transaction processing fees, and moderate increases in lending and insurance revenues, which was partially offset by lower prepaid airtime sales;
Lower operating losses: Operating losses decreased, delivering an improvement of 31% in ZAR compared with the
weakeningprior period primarily due to an increase in revenue, the closure of theU.S. dollar against South African Rand:loss-making IPG operations and the implementation of various cost reduction initiatives in our Consumer business. During the quarter, we recorded a reorganization charge of $5.9 million related to the retrenchment process we commenced in January 2022; andForeign exchange movements:The U.S. dollar
depreciated by 2%was 4% stronger against the ZARand 6% against the KRWduring thesecondthird quarter of fiscal2018,2022, whichpositivelyimpacted our reportedresults;Growth in insurance and lending businesses:Volume growth and operating efficiencies in our insurance and lending businesses during the second quarter of fiscal 2018, resulted in an improved contribution to our financial inclusion revenue and operating income. The significant growth in our South African lending book during December 2017 resulted in a substantial increase in the allowance for doubtful finance loans receivable, in accordance with our policy of providing for doubtful finance loans receivable at the time that a loan is originated;Ongoing contributions from EasyPay Everywhere:EPE revenue and operating income growth was driven primarily by ongoing EPE adoption as we further expanded our customer base utilizing our ATM infrastructure;Higher equity-accounted earnings related to DNI and Bank Frick:The acquisition of 45% of DNI and 30% of Bank Frick positively impacted our reported results by approximately $2.3 million, before amortization of intangible assets, net of deferred taxes;Higher revenue from Masterpayment and allowance for credit losses:Masterpayment contributed higher revenues as a result of an increase in processing activities, particularly related to its cryptocurrency processing launched in December 2017, as well as from its working capital financing and supply chain solutions. An allowance for credit losses related to doubtful working capital finance receivable of $7.8 million was created. A valuation allowance has been provided for any potential tax benefit from this event as it is unlikely that this amount would be utilized for taxation purposes;Regulatory changes in South Korea pertaining to fees on card transactions:The regulations governing the fees that may be charged on card transactions adversely impacted our revenues and operating income in South Korea;Lower net interest income resulting from investments in Cell C, DNI and Bank Frick:Interest income was $1.8 million lower as a result of cash utilized to purchase non-controlling stakes in Cell C, DNI and Bank Frick, while interest expense increased due to the South African lending facility we obtained in August 2017 to partially fund our 15% investment in Cell C;Lower prepaid sales and ad hoc terminal sales:The number of transacting users purchasing prepaid products through our mobile channel decreased due to security features introduced in fiscal 2017. In addition, our results were adversely impacted by fewer ad hoc terminal sales; andLower transaction-related costs in fiscal 2018:We incurred $0.6 million in transaction-related costs in connection with various investment initiatives pursued during the second quarter of fiscal 2018 compared with $1.2 million in fiscal 2017.
36
Consolidated overall results of operations
This discussion is based on the amounts prepared in accordance with U.S. GAAP.
The following tables show the changes in the items comprising our statements of operations, both in U.S. dollars and in ZAR:
Table 3 | In United States Dollars | ||||
| Three months ended March 31, | ||||
| 2022 |
| 2021 |
|
|
| $ ’000 |
| $ ’000 | change | |
Revenue | 35,202 |
| 28,828 |
| 22% |
Cost of goods sold, IT processing, servicing and support | 23,008 |
| 23,096 |
| (0%) |
Selling, general and administration | 15,184 |
| 18,892 |
| (20%) |
Depreciation and amortization | 463 |
| 1,132 |
| (59%) |
Reorganization costs | 5,852 |
| - |
| nm |
Transaction costs related to Connect Group acquisition | 116 |
| - |
| nm |
Operating loss | (9,421) |
| (14,292) |
| (34%) |
Change in fair value of equity securities | - |
| 10,814 |
| nm |
Gain related to fair value adjustment to currency options | 6,120 |
| - |
| nm |
Loss on disposal of equity-accounted investment | 346 |
| - |
| nm |
Gain on disposal of equity securities | 720 |
| - |
| nm |
Loss on disposal of equity-accounted investment - Bank Frick | - |
| 472 |
| nm |
Interest income | 761 |
| 606 |
| 26% |
Interest expense | 691 |
| 744 |
| (7%) |
Loss before income tax expense | (2,857) |
| (4,088) |
| (30%) |
Income tax expense | 470 |
| 2,171 |
| (78%) |
Net loss before earnings from equity-accounted investments | (3,327) |
| (6,259) |
| (47%) |
Earnings from equity-accounted investments | - |
| 55 |
| nm |
Net loss attributable to us | (3,327) |
| (6,204) |
| (46%) |
| In U.S. Dollars | |||||||||
| Table 3 | (U.S. GAAP) | ||||||||
| Three months ended December 31, | |||||||||
| 2017 | 2016 | $ | % | ||||||
| $ ’000 | $ ’000 | change | |||||||
| Revenue | 148,416 | 151,433 | (2% | ) | |||||
| Cost of goods sold, IT processing, servicing and support | 73,994 | 73,518 | 1% | ||||||
| Selling, general and administration | 49,392 | 41,703 | 18% | ||||||
| Depreciation and amortization | 8,723 | 10,623 | (18% | ) | |||||
| Operating income | 16,307 | 25,589 | (36% | ) | |||||
| Interest income | 4,705 | 5,061 | (7% | ) | |||||
| Interest expense | 2,325 | 510 | 356% | ||||||
| Income before income tax expense | 18,687 | 30,140 | (38% | ) | |||||
| Income tax expense | 10,062 | 10,984 | (8% | ) | |||||
| Net income before earnings from equity-accounted investments | 8,625 | 19,156 | (55% | ) | |||||
| Earnings from equity-accounted investments | 1,354 | 74 | 1,730% | ||||||
| Net income | 9,979 | 19,230 | (48% | ) | |||||
| Less net income attributable to non-controlling interest | 357 | 589 | (39% | ) | |||||
| Net income attributable to us | 9,622 | 18,641 | (48% | ) | |||||
46
| In South African Rand | |||||||||
| Table 4 | (U.S. GAAP) | ||||||||
| Three months ended December 31, | |||||||||
| 2017 | 2016 | ||||||||
| ZAR | ZAR | ZAR % | |||||||
| ’000 | ’000 | change | |||||||
| Revenue | 2,028,475 | 2,111,493 | (4% | ) | |||||
| Cost of goods sold, IT processing, servicing and support | 1,011,312 | 1,025,093 | (1% | ) | |||||
| Selling, general and administration | 675,065 | 581,482 | 16% | ||||||
| Depreciation and amortization | 119,222 | 148,120 | (20% | ) | |||||
| Operating income | 222,876 | 356,798 | (38% | ) | |||||
| Interest income | 64,306 | 70,568 | (9% | ) | |||||
| Interest expense | 31,777 | 7,111 | 347% | ||||||
| Income before income tax expense | 255,405 | 420,255 | (39% | ) | |||||
| Income tax expense | 137,522 | 153,154 | (10% | ) | |||||
| Net income before earnings from equity-accounted investments | 117,883 | 267,101 | (56% | ) | |||||
| Earnings from equity-accounted investments | 18,506 | 1,032 | 1,693% | ||||||
| Net income | 136,389 | 268,133 | (49% | ) | |||||
| Less net income attributable to non-controlling interest | 4,879 | 8,213 | (41% | ) | |||||
| Net income attributable to us | 131,510 | 259,920 | (49% | ) | |||||
Table 4 | In South African Rand | ||||
| Three months ended March 31, | ||||
| 2022 |
| 2021 |
|
|
| ZAR ’000 |
| ZAR ’000 | change | |
Revenue | 549,571 |
| 431,195 |
| 27% |
Cost of goods sold, IT processing, servicing and support | 359,199 |
| 345,458 |
| 4% |
Selling, general and administration | 237,051 |
| 282,577 |
| (16%) |
Depreciation and amortization | 7,228 |
| 16,932 |
| (57%) |
Reorganization costs | 91,361 |
| - |
| nm |
Transaction costs related to Connect Group acquisition | 1,811 |
| - |
| nm |
Operating loss | (147,079) |
| (213,772) |
| (31%) |
Change in fair value of equity securities | - |
| 161,750 |
| nm |
Gain related to fair value adjustment to currency options | 95,545 |
| - |
| nm |
Loss on disposal of equity-accounted investment | 5,402 |
| - |
| nm |
Gain on disposal of equity securities | 11,241 |
| - |
| nm |
Loss on disposal of equity-accounted investment - Bank Frick | - |
| 7,060 |
| nm |
Interest income | 11,881 |
| 9,064 |
| 31% |
Interest expense | 10,788 |
| 11,128 |
| (3%) |
Loss before income tax expense | (44,602) |
| (61,146) |
| (27%) |
Income tax expense | 7,338 |
| 32,473 |
| (77%) |
Net loss before earnings from equity-accounted investments | (51,940) |
| (93,619) |
| (45%) |
Earnings from equity-accounted investments | - |
| 823 |
| nm |
Net loss attributable to us | (51,940) |
| (92,796) |
| (44%) |
The decreaseincrease in revenue was primarily due to lower prepaid airtimean increase in hardware sales, fewer ad hoc terminal sales,an increase in merchant transaction processing fees, and a lower contribution from KSNET due to regulatory changesmoderate increases in South Korea,lending and insurance revenues, which was partially offset by an improved contribution from Masterpayment, more fees generated from our EPE and ATM offerings, improved insurance activities, and a modestlower prepaid airtime sales.
The increase in the number of SASSA UEPS/EMV beneficiaries paid.
In ZAR, the decrease in cost of goods sold, IT processing, servicing and support was primarily due to fewer prepaid airtimehigher costs related to hardware sales and ad hoc terminal sales,higher expenses related to an increase in merchant transaction processing activities, which was partially offset by increasesthe implementation of various cost reduction initiatives in goods and services purchased from third parties, higher expenses incurred due to increased usageour Consumer business, as well as a lower cost of prepaid airtime.
In ZAR, the South African National Payment System by beneficiaries and expenses incurred to operate our EPE and ATM offerings.
The increasedecrease in selling, general and administration expense was primarily due to an allowance for doubtful working capital finance receivables of $7.8 million, the impact of October 2017 annual salary increases forboth lower IPG-related expenses incurred following its closure and some benefits from our South African employees, an increase in our allowance for doubtful finance loans receivable resulting from a commensurate increase in our lending book in the last lending cycle of calendar 2017, as well as increases in goods and services purchased from third parties. These increasescost reduction initiatives, which were partially offset by fewer agent incentive costs paidhigher employee-related expenses related to the growth in Korea due to weaker trading conditions in fiscal 2018, lower executive remunerationour senior management team, and lower transaction-related expendituresthe year-over-year impact of $0.6 million, compared to $1.2 million in the prior year.inflationary increases on employee-related expenses.
37
Depreciation and amortization decreased primarily due to lower overall amortization of intangible assets that are fully amortized anddepreciation related to tangible assets that arewere fully depreciated.depreciated during the last 12 months.
Our operating income margin for second
We embarked on a retrenchment process on January 10, 2022, and incurred reorganization expenses of $5.9 million during the third quarter of fiscal 20182022.
Transaction costs related to the Connect Group acquisition include fees paid to external service providers for various advisory services procured.
Our operating loss margin for the third quarter of fiscal 2022 and 20172021 was 11%(22.9%) and 17%(41.8%), respectively. Operating income margin excluding the $7.8 million valuation allowance would have been 16% in fiscal 2018. We discuss the components of operating incomeloss margin under “—Results of operations by operating segment.”
The decrease was primarily attributablechange in fair value of equity securities during the third quarter of fiscal 2021, represents a non-cash fair value adjustment gain related to higher cost of goods sold, IT processing, servicing and support relativeMobiKwik. We continue to the reduction in revenue.
Interest on surplus cash decreased to $4.7 million (ZAR 64.3 million) from $5.1 million (ZAR 70.6 million), due primarily to the lower average daily ZAR cash balances, partially offset by interest earned on the loan to Finbond.
Interest expense increased to $2.3 million (ZAR 31.8 million) from $0.5 million (ZAR 7.1 million), due primarily to interest on the South African facility we obtained to partially fundcarry our investment in Cell C partially offset by lowerat $0 (zero). Refer to Note 5 to our unaudited condensed consolidated financial statements for the methodology and inputs used in the fair value calculation for MobiKwik and Note 4 for the methodology and inputs used in the fair value calculation for Cell C.
Gain related to fair value adjustment to currency options represents the net mark-to-market adjustments to foreign exchange option contracts entered into in November 2021 in order to manage the risk of currency volatility and to fix the USD amount to be utilized for part of the Connect Group purchase consideration settlement. The foreign exchange option contract matured on February 24, 2022. Refer to Note 4 to our unaudited condensed consolidated financial statements for additional information related to these currency options.
We recorded a gain of $0.7 million related to the disposal of our entire interest in an equity security during the third quarter of fiscal 2022. Refer to Note 5 to our unaudited condensed consolidated financial statements for additional information regarding this gain.
47
We recorded a loss of $0.3 million related to the disposal of a minor portion of our investment in Finbond during the third quarter of fiscal 2022. Refer to Note 5 to our unaudited condensed consolidated financial statements for additional information regarding this disposal.
We recorded a loss of $0.5 million related to the disposal of Bank Frick during the third quarter of fiscal 2021.
Interest on surplus cash increased to $0.8 million (ZAR 11.9 million) from $0.6 million (ZAR 9.1 million), primarily due to higher average long-term debt balance on our South Korean debtZAR denominated cash balances and higher interest rates during the third quarter of fiscal 2022. The higher ZAR denominated cash balances arose as we converted dollar funds into ZAR in anticipation of the Connect Group acquisition closing.
Interest expense decreased to $0.7 million (ZAR 10.8 million) from $0.7 million (ZAR 11.1 million), primarily as a result of repaymenta lower utilization of our ATM facilities to fund our ATMs, which decrease was partially offset by higher rates during the debt in full in October 2017.third quarter of fiscal 2022.
Fiscal 20182022 tax expense was $10.1$0.5 million (ZAR 137.57.3 million) compared to $11.0$2.2 million (ZAR 153.232.5 million) in fiscal 2017. 2021. Our effective tax rate for fiscal 2018,2022 was 53.8%impacted by the tax expense recorded by our profitable South African operations, non-deductible expenses, the on-going losses incurred by certain of our South African businesses and the associated valuation allowances created related to the deferred tax assets recognized regarding net operating losses incurred by these entities.
Our effective tax rate for fiscal 2021 was higherimpacted by the tax effect on the change in the fair value of our equity securities, which is at a lower tax rate than the South African statutory rate, as a result of a valuation allowance providedthe tax charge related to an allowance for doubtful working capital finance receivables created,our profitable South African operations, non-deductible expenses, (including transaction-related expenditure and non-deductible interest onthe on-going losses incurred by certain of our South African long-term facility)businesses and the impactassociated valuation allowances created related to the deferred tax assets recognized regarding net operating losses incurred by these entities.
Bank Frick was sold in the third quarter of the changes in U.S. federal statutory tax law. Our effective tax rate for fiscal 2017, was 36.4%2021 and was higher thanaccounted for using the South African statutory rate as a result of non-deductible expenses.
Earnings from equity-accounted investments increased primarily due toequity method up until disposal. Finbond is listed on the inclusion ofJohannesburg Stock Exchange and reports its six-month results during our portion of DNIfirst quarter and Bank Frick.its annual results during our fourth quarter. The table below presents the relative (loss) earnings (loss) from our equity accounted investments:
| Table 5 | Three months ended December 31, | ||||||||
| 2017 | 2016 | $ % | |||||||
| $ ’000 | $ ’000 | change | |||||||
| DNI | 1,046 | - | nm | ||||||
| Share of net income | 1,832 | - | nm | ||||||
| Amortization of intangible assets, net of deferred tax | (786 | ) | - | nm | |||||
| Bank Frick | 322 | - | nm | ||||||
| Share of net income | 487 | - | nm | ||||||
| Amortization of intangible assets, net of deferred tax | (165 | ) | - | nm | |||||
| Finbond | - | - | nm | ||||||
| Other | (14 | ) | 74 | (119% | ) | ||||
| Earnings from equity accounted investments | 1,354 | 74 | 1,730% | ||||||
38
Table 5 | Three months ended March 31, | |||
| 2022 |
| 2021 | $ % |
| $ ’000 |
| $ ’000 | change |
Bank Frick | - |
| 177 | nm |
Share of net income | - |
| 177 | nm |
Other | - |
| (122) | nm |
Share of net loss | - |
| (122) | nm |
Total loss from equity-accounted investments | - |
| 55 | nm |
Results of operations by operating segment
The composition of revenue and the contributions of our business activities to operating (loss) income are illustrated below:
| Table 6 | In U.S. Dollars (U.S. GAAP) | ||||||||||||||
| Three months ended December 31, | |||||||||||||||
| 2017 | % of | 2016 | % of | % | |||||||||||
| Operating Segment | $ ’000 | total | $ ’000 | total | change | ||||||||||
| Revenue: | |||||||||||||||
| South African transaction processing | 64,148 | 43% | 59,862 | 40% | 7% | ||||||||||
| International transaction processing | 44,185 | 30% | 44,000 | 29% | - | ||||||||||
| Financial inclusion and applied technologies | 54,131 | 36% | 59,258 | 39% | (9% | ) | |||||||||
| Subtotal: Operating segments | 162,464 | 109% | 163,120 | 108% | - | ||||||||||
| Intersegment eliminations | (14,048 | ) | (9% | ) | (11,687 | ) | (8% | ) | 20% | ||||||
| Consolidated revenue | 148,416 | 100% | 151,433 | 100% | (2% | ) | |||||||||
| Operating income (loss): | |||||||||||||||
| South African transaction processing | 13,470 | 83% | 15,372 | 60% | (12% | ) | |||||||||
| International transaction processing | (4,991 | ) | (31% | ) | 3,904 | 15% | (228% | ) | |||||||
| Financial inclusion and applied technologies | 12,737 | 78% | 14,107 | 55% | (10% | ) | |||||||||
| Subtotal: Operating segments | 21,216 | 130% | 33,383 | 130% | (36% | ) | |||||||||
| Corporate/Eliminations | (4,909 | ) | (30% | ) | (7,794 | ) | (30% | ) | (37% | ) | |||||
| Consolidated operating income | 16,307 | 100% | 25,589 | 100% | (36% | ) | |||||||||
| Table 7 | In South African Rand (U.S. GAAP) | ||||||||||||||
| Three months ended December 31, | |||||||||||||||
| 2017 | 2016 | ||||||||||||||
| ZAR | % of | ZAR | % of | % | |||||||||||
| Operating Segment | ’000 | total | ’000 | total | change | ||||||||||
| Revenue: | |||||||||||||||
| South African transaction processing | 876,743 | 43% | 834,680 | 40% | 5% | ||||||||||
| International transaction processing | 603,898 | 30% | 613,510 | 29% | (2% | ) | |||||||||
| Financial inclusion and applied technologies | 739,835 | 36% | 826,258 | 39% | (10% | ) | |||||||||
| Subtotal: Operating segments | 2,220,476 | 109% | 2,274,448 | 108% | (2% | ) | |||||||||
| Intersegment eliminations | (192,001 | ) | (9% | ) | (162,955 | ) | (8% | ) | 18% | ||||||
| Consolidated revenue | 2,028,475 | 100% | 2,111,493 | 100% | (4% | ) | |||||||||
| Operating income (loss): | |||||||||||||||
| South African transaction processing | 184,101 | 83% | 214,338 | 60% | (14% | ) | |||||||||
| International transaction processing | (68,214 | ) | (31% | ) | 54,435 | 15% | (225% | ) | |||||||
| Financial inclusion and applied technologies | 174,083 | 78% | 196,700 | 55% | (11% | ) | |||||||||
| Subtotal: Operating segments | 289,970 | 130% | 465,473 | 130% | (38% | ) | |||||||||
| Corporate/Eliminations | (67,094 | ) | (30% | ) | (108,675 | ) | (30% | ) | (38% | ) | |||||
| Consolidated operating income | 222,876 | 100% | 356,798 | 100% | (38% | ) | |||||||||
South African transaction processing
The increase in segment
Table 6 |
| In United States Dollars | ||||||||
|
| Three months ended March 31, | ||||||||
|
| 2022 |
| % of |
| 2021 |
| % of |
| % change |
Operating Segment | $ ’000 | total | $ ’000 | total | ||||||
Consolidated revenue: |
|
|
|
|
|
|
|
|
|
|
Consumer |
| 16,429 |
| 47% |
| 16,236 |
| 56% |
| 1% |
Merchant |
| 18,478 |
| 52% |
| 12,171 |
| 42% |
| 52% |
Other |
| 397 |
| 1% |
| 421 |
| 1% |
| (6%) |
Subtotal: Operating segments |
| 35,304 |
| 100% |
| 28,828 |
| 99% |
| 22% |
Corporate/Eliminations |
| (102) |
| - |
| - |
| 1% |
| nm |
Total consolidated revenue |
| 35,202 |
| 100% |
| 28,828 |
| 100% |
| 22% |
Segment Adjusted EBITDA: |
|
|
|
|
|
|
|
|
|
|
Consumer |
| (6,866) |
| 85% |
| (7,610) |
| 63% |
| (10%) |
Merchant |
| 1,271 |
| (16%) |
| 273 |
| (2%) |
| 366% |
Other |
| 87 |
| (1%) |
| (3,315) |
| 27% |
| nm |
Total Segment Adjusted EBITDA |
| (5,508) |
| 68% |
| (10,652) |
| 88% |
| (48%) |
Corporate/eliminations |
| (2,560) |
| 32% |
| (1,404) |
| 12% |
| 82% |
Subtotal |
| (8,068) |
| 100% |
| (12,056) |
| 100% |
| (33%) |
Less: Lease adjustments |
| 890 |
|
|
| 1,104 |
|
|
|
|
Less: Depreciation and amortization |
| 463 |
|
|
| 1,132 |
|
|
|
|
Total consolidated operating loss |
| (9,421) |
|
|
| (14,292) |
|
|
|
|
48
Table 7 |
| In South African Rand | ||||||||
|
| Three months ended March 31, | ||||||||
|
| 2022 |
| % of |
| 2021 |
| % of |
| % change |
Operating Segment | ZAR ’000 | total | ZAR ’000 | total | ||||||
Consolidated revenue: |
|
|
|
|
|
|
|
|
|
|
Consumer |
| 256,488 |
| 47% |
| 242,850 |
| 56% |
| 6% |
Merchant |
| 288,477 |
| 52% |
| 182,048 |
| 42% |
| 58% |
Other |
| 6,198 |
| 1% |
| 6,297 |
| 1% |
| (2%) |
Subtotal: Operating segments |
| 551,163 |
| 100% |
| 431,195 |
| 99% |
| 28% |
Corporate/Eliminations |
| (1,592) |
| - |
| - |
| 1% |
| nm |
Total consolidated revenue |
| 549,571 |
| 100% |
| 431,195 |
| 100% |
| 27% |
Segment Adjusted EBITDA: |
|
|
|
|
|
|
|
|
|
|
Consumer |
| (107,191) |
| 85% |
| (113,827) |
| 63% |
| (6%) |
Merchant |
| 19,843 |
| (16%) |
| 4,083 |
| (2%) |
| 386% |
Other |
| 1,358 |
| (1%) |
| (49,584) |
| 27% |
| nm |
Total Segment Adjusted EBITDA |
| (85,990) |
| 68% |
| (159,328) |
| 88% |
| (46%) |
Corporate/eliminations |
| (39,966) |
| 32% |
| (21,000) |
| 12% |
| 90% |
Subtotal |
| (125,956) |
| 100% |
| (180,328) |
| 100% |
| (30%) |
Less: Lease adjustments |
| 13,895 |
|
|
| 16,513 |
|
|
|
|
Less: Depreciation and amortization |
| 7,228 |
|
|
| 16,932 |
|
|
|
|
Total consolidated operating loss |
| (147,079) |
|
|
| (213,773) |
|
|
|
|
Consumer
Segment revenue wasincreased primarily due to higher EPE transaction revenue aslending and insurance revenues and moderately higher account holder fees. We embarked on a resultretrenchment process during the third quarter of increased usagefiscal 2022 and recorded an expense of our ATMs, increased inter-segment transaction processing activities and a modest increase$5.9 million which is included in the numberSegment EBITDA loss, refer to Note 1 to our unaudited condensed consolidated financial statements for additional information regarding this process. Segment EBITDA loss has decreased primarily due to the implementation of social welfare grants distributed. Operating income decreased primarilyvarious cost reduction initiatives.
Our EBITDA loss margin (calculated as EBITDA loss divided by revenue) for the third quarter of fiscal 2022 and 2021 was (41.8%) and (46.9%), respectively.
The table below presents EBITDA for our Consumer operating segment and illustrates EBITDA for the third quarter of fiscal 2022 including and excluding the reorganization costs:
Table 8 |
|
|
|
|
| In South African Rand | ||||
|
|
|
|
|
| Three months ended March 31, | ||||
|
|
|
|
|
| 2022 |
| 2021 |
| % change |
Operating Segment |
|
|
|
|
| ZAR ’000 | ZAR ’000 | |||
EBITDA: |
|
|
|
|
|
|
|
|
|
|
Consumer |
|
|
|
|
| (107,191) |
| (113,827) |
| (6%) |
Reorganization costs |
|
|
|
|
| 91,361 |
| - |
| nm |
Consumer excluding reorganization costs |
|
|
|
|
| (15,830) |
| (113,827) |
| (86%) |
EBITDA margin: |
|
|
|
|
|
|
|
|
|
|
Consumer |
|
|
|
|
| (42%) |
| (47%) |
|
|
Consumer excluding reorganization costs |
|
|
|
|
| (6%) |
| (47%) |
|
|
Merchant
Segment revenue increased due to an increase in inter-segment charges, the impact of annual salary increases granted to our South African employees in October 2017hardware sales and increases in goods and services purchased from third parties. These decreases wereprocessing fees, which was partially offset by the aforementioned increasesfewer prepaid airtime sales. The increase in segment revenue.EBITDA is primarily due to the increase in hardware sales.
Our operating incomeEBITDA margin for the secondthird quarter of fiscal 20182022 and 20172021 was 21%6.9% and 26%2.2%, respectively. Our
49
Other
Other includes the activities of IPG in fiscal 2018 margin was adversely impacted by the annual salary increases granted to2021 and our other business outside South African employees in October 2017 and increases in goods and services purchased from third parties.Africa, principally Botswana.
International transaction-based activities
Segment revenue was slightly higherdecreased due to lower revenue following the closure of IPG in fiscal 2021. We recorded an EBITDA contribution during the secondthird quarter of fiscal 2018, primarily due to ongoing impact2022 following the closure of regulatory changes in South Korea on KSNET’s revenue, largely offset by increased contributions from Masterpayment. Operating incomeour loss-making activities performed through IPG.
Our EBITDA (loss) margin for the Other segment was 21.9% and (787.4%) during the secondthird quarter of fiscal 2018 was lower due to an allowance for doubtful working capital finance receivable of $7.8 million, a decrease in revenue at KSNET2022 and losses incurred by all other major contributors to the segment. Operating income and margin for the second quarter of fiscal 2017 was positively impacted by a refund of approximately $0.8 million that had been paid several years ago in connection with industry-wide litigation that has now been finalized.2021, respectively.
39
Operating (loss) income margin for the second quarter of fiscal 2018 and 2017 was (11%) and 9%, respectively. Excluding the Mastertrading allowance for doubtful working capital finance receivables, segment operating income and margin were $2.8 million and 6% respectively.
Financial inclusion and applied technologiesCorporate/Eliminations
Financial inclusion and applied technologies revenue decreased primarily due to fewer prepaid airtime and other value added services sales, as well as lower ad hoc terminal sales, partially offset by increased volumes in our insurance businesses, and an increase in inter-segment revenues. Operating income was also impacted by these factors as well as an increase in the allowance for doubtful finance loans receivable resulting from a commensurate increase in our lending book in the last lending cycle of calendar 2017.
Operating income margin for the Financial inclusion and applied technologies segment was 24% during each of the second quarter of fiscal 2018 and 2017, respectively, and was impacted by fewer low margin prepaid product sales, improved revenues from our insurance businesses and an increase in inter-segment revenues, offset by fewer ad hoc terminal and annual salary increases granted to our South African employees and the increase in the allowance for credit losses.
Corporate/Eliminations
Our corporate expenses generally include acquisition-related intangible asset amortization; expenses incurred related to acquisitions and investments pursued; expenditurecorporate actions; expenditures related to compliance with the Sarbanes-Oxley Act of 2002; non-employee directors’ fees; certain employee and executive bonuses; stock-based compensation; legal fees; audit fees; directors and officersofficer’s insurance premiums; telecommunications expenses; property-related expenditures including utilities, rental, securityelimination entries; and maintenance; and elimination entries.from fiscal 2022 our group CEO’s compensation.
Our corporate expenses have decreased primarilyfor fiscal 2022 increased compared with the prior period due to lower transaction-related expenditures, a $0.5higher employee costs, an increase in director and officer’s insurance premiums, and higher stock-based compensation charges. Fiscal 2021 includes an unrealized foreign exchange gain of $0.6 million profitwhich also impacts comparability. Our corporate expenses for fiscal 2022 includes transaction related expenses of $0.1 million (ZAR 1.8 million) related to the sale of XeoHealth, and lower executive compensation, which was partially offset by a modest increasesConnect Group acquisition. We expect to incur additional expenses related to the Connect Group transaction in U.S. dollar denominated goods and services purchased from third parties and directors’ fees.
First halfthe fourth quarter of fiscal 20182022.
50
Year to date fiscal 2022 compared to first half ofyear to date fiscal 20172021
The following factors had a significant influenceimpact on our results of operations during the first half ofyear to date fiscal 20182022 as compared with the same period in the prior year:
Favorable impact fromLower revenue: Our revenues decreased 3% in ZAR, primarily due to lower prepaid airtime sales, which was partially offset by increase in hardware sales, an increase in merchant transaction processing fees, and moderate increases in lending and insurance revenues;
Lower operating losses: Operating losses decreased, delivering an improvement of 31% in ZAR compared with the
weakeningprior period primarily due to the closure of theU.S. dollar against South African Rand:loss-making IPG operations and the implementation of various cost reduction initiatives in our Consumer business. During the year to date fiscal 2022, we recorded a reorganization charge of $5.9 million related to the retrenchment process we commenced in January 2022;Significant transaction costs: We expensed $1.8 million of transaction costs related to the Connect Group acquisition; and
Foreign exchange movements:The U.S. dollar
depreciated bywas 4% weaker against the ZARduring thefirst half ofyear to date fiscal2018,2022, whichpositivelyimpacted our reportedresults;Growth in insurance businesses:Volume growth and operating efficiencies in our insurance businesses during the first half of fiscal 2018, resulted in an improved contribution to our financial inclusion revenue and operating income. The significant growth in our South African lending book during December 2017 resulted in a substantial increase in the allowance for doubtful finance loans receivable, in accordance with our policy of providing for doubtful finance loans receivable at the time that a loan is originated;Ongoing contributions from EasyPay Everywhere:EPE revenue and operating income growth was driven primarily by ongoing EPE adoption as we further expanded our customer base utilizing our ATM infrastructure;Higher equity-accounted earnings related to DNI:The acquisition of 45% of DNI has positively impacted our reported results by approximately $3.7 million, before amortization of intangible assets, net of deferred taxes;Higher revenue from Masterpayment and allowance for credit losses:Masterpayment contributed higher revenues as a result of an increase in processing activities, particularly related to its cryptocurrency processing launched in December 2017, as well as from its working capital financing and supply chain solutions. An allowance for credit losses related to doubtful working capital finance receivable of $7.8 million was created. A valuation allowance has been provided for any potential tax benefit from this event as it is unlikely that this amount would be utilized for taxation purposes;Lower net interest income resulting from investments in Cell C, DNI and Bank Frick:Interest income was $2.9 million lower as a result of cash utilized to purchase non-controlling stakes in Cell C, DNI and Bank Frick, while interest expense increased due to the South African lending facility we obtained in August 2017 to partially fund our 15% investment in Cell C;Regulatory changes in South Korea pertaining to fees on card transactions:The regulations governing the fees that may be charged on card transactions adversely impacted our revenues and operating income in South Korea;Lower prepaid sales and ad hoc terminal sales:The number of transacting users purchasing prepaid products through our mobile channel decreased due to security features introduced in fiscal 2017. In addition, our results were adversely impacted by few ad hoc terminal sales; andHigher transaction-related costs in fiscal 2018:We incurred $2.1 million in transaction-related costs in connection with various acquisition and investment initiatives pursued during the first half of fiscal 2018 compared with $1.5 million in fiscal 2017.
40
Consolidated overall results of operations
This discussion is based on the amounts prepared in accordance with U.S. GAAP.
The following tables show the changes in the items comprising our statements of operations, both in U.S. dollars and in ZAR:
| In U.S. Dollars | |||||||||
| Table 8 | (U.S. GAAP) | ||||||||
| Six months ended December 31, | |||||||||
| 2017 | 2016 | $ % | |||||||
| $ ’000 | $ ’000 | change | |||||||
| Revenue | 300,974 | 307,066 | (2% | ) | |||||
| Cost of goods sold, IT processing, servicing and support | 148,646 | 148,298 | 0% | ||||||
| Selling, general and administration | 93,326 | 80,171 | 16% | ||||||
| Depreciation and amortization | 17,689 | 20,827 | (15% | ) | |||||
| Operating income | 41,313 | 57,770 | (28% | ) | |||||
| Interest income | 9,749 | 9,365 | 4% | ||||||
| Interest expense | 4,446 | 1,306 | 240% | ||||||
| Income before income tax expense | 46,616 | 65,829 | (29% | ) | |||||
| Income tax expense | 20,339 | 22,087 | (8% | ) | |||||
| Net income before earnings from equity-accounted investments | 26,277 | 43,742 | (40% | ) | |||||
| Earnings from equity-accounted investments | 3,429 | 733 | 368% | ||||||
| Net income | 29,706 | 44,475 | (33% | ) | |||||
| Less net income attributable to non-controlling interest | 601 | 1,202 | (50% | ) | |||||
| Net income attributable to us | 29,105 | 43,273 | (33% | ) | |||||
| In South African Rand | ||||||||||||||
| Table 9 | (U.S. GAAP) | In United States Dollars | ||||||||||||
| Six months ended December 31, | ||||||||||||||
| 2017 | 2016 | Nine months ended March 31, | ||||||||||||
| ZAR | ZAR | ZAR % | 2022 |
| 2021 |
|
| |||||||
| ’000 | ’000 | change | $ ’000 |
| $ ’000 | change | ||||||||
| Revenue | 4,036,874 | 4,307,891 | (6% | ) | 100,820 |
| 96,269 |
| 5% | |||||
| Cost of goods sold, IT processing, servicing and support | 1,993,745 | 2,080,503 | (4% | ) | 67,795 |
| 73,895 |
| (8%) | |||||
| Selling, general and administration | 1,251,754 | 1,124,735 | 11% | 53,372 |
| 59,517 |
| (10%) | ||||||
| Depreciation and amortization | 237,257 | 292,187 | (19% | ) | 2,084 |
| 3,129 |
| (33%) | |||||
| Operating income | 554,118 | 810,466 | (32% | ) | ||||||||||
Reorganization costs | 5,852 |
| - |
| nm | |||||||||
Transaction costs related to Connect Group acquisition | 1,790 |
| - |
| nm | |||||||||
Operating loss | (30,073) |
| (40,272) |
| (25%) | |||||||||
Change in fair value of equity securities | - |
| 25,942 |
| nm | |||||||||
Gain related to fair value adjustment to currency options | 3,691 |
| - |
| nm | |||||||||
Loss on disposal of equity-accounted investment | 346 |
| 13 |
| 2,562% | |||||||||
Gain on disposal of equity securities | 720 |
| - |
| nm | |||||||||
Loss on disposal of equity-accounted investment - Bank Frick | - |
| 472 |
| nm | |||||||||
| Interest income | 130,760 | 131,383 | (0% | ) | 1,463 |
| 1,934 |
| (24%) | |||||
| Interest expense | 59,633 | 18,322 | 225% | 2,272 |
| 2,168 |
| 5% | ||||||
| Income before income tax expense | 625,245 | 923,527 | (32% | ) | ||||||||||
Loss before income tax expense | (26,817) |
| (15,049) |
| 78% | |||||||||
| Income tax expense | 272,801 | 309,863 | (12% | ) | 754 |
| 4,549 |
| (83%) | |||||
| Net income before earnings from equity-accounted investments | 352,444 | 613,664 | (43% | ) | ||||||||||
| Earnings from equity-accounted investments | 45,992 | 10,283 | 347% | |||||||||||
| Net income | 398,436 | 623,947 | (36% | ) | ||||||||||
| Less net income attributable to non-controlling interest | 8,061 | 16,863 | (52% | ) | ||||||||||
| Net income attributable to us | 390,375 | 607,084 | (36% | ) | ||||||||||
Net loss before loss from equity-accounted investments | (27,571) |
| (19,598) |
| 41% | |||||||||
Loss from equity-accounted investments | (1,156) |
| (20,098) |
| (94%) | |||||||||
Net loss attributable to us | (28,727) |
| (39,696) |
| (28%) | |||||||||
51
Table 10 | In South African Rand | ||||
| Nine months ended March 31, | ||||
| 2022 |
| 2021 |
|
|
| ZAR ’000 |
| ZAR ’000 | change | |
Revenue | 1,511,040 |
| 1,551,606 |
| (3%) |
Cost of goods sold, IT processing, servicing and support | 1,016,078 |
| 1,190,996 |
| (15%) |
Selling, general and administration | 799,912 |
| 959,260 |
| (17%) |
Depreciation and amortization | 31,233 |
| 50,431 |
| (38%) |
Reorganization costs | 87,706 |
| - |
| nm |
Transaction costs related to Connect Group acquisition | 26,828 |
| - |
| nm |
Operating loss | (450,717) |
| (649,081) |
| (31%) |
Change in fair value of equity securities | - |
| 418,118 |
| nm |
Gain related to fair value adjustment to currency options | 55,319 |
| - |
| nm |
Loss on disposal of equity-accounted investment | 5,186 |
| 210 |
| 2,370% |
Gain on disposal of equity securities | 10,791 |
| - |
| nm |
Loss on disposal of equity-accounted investment - Bank Frick | - |
| 7,607 |
| nm |
Interest income | 21,927 |
| 31,171 |
| (30%) |
Interest expense | 34,052 |
| 34,943 |
| (3%) |
Loss before income tax expense | (401,918) |
| (242,552) |
| 66% |
Income tax expense | 11,301 |
| 73,318 |
| (85%) |
Net loss before loss from equity-accounted investments | (413,219) |
| (315,870) |
| 31% |
Loss from equity-accounted investments | (17,326) |
| (323,928) |
| (95%) |
Net loss attributable to us | (430,545) |
| (639,798) |
| (33%) |
The decrease in revenue was primarily due to lower prepaid airtime sales, fewer ad hoc terminal sales, and a lower contribution from KSNET due to regulatory changes in South Korea, which was partially offset by an improved contribution from Masterpayment and Transact 24, more fees generated from our EPE and ATM offerings, improved insurance activities, andincrease in hardware sales, an increase in the number of SASSA UEPS/EMV beneficiaries paid.merchant transaction processing fees, and moderate increases in lending and insurance revenues.
In ZAR, the
The decrease in cost of goods sold, IT processing, servicing and support was primarily due to fewerthe implementation of various cost reduction initiatives in our Consumer business, lower cost of prepaid airtime and ad hoc terminal sales, which was partially offset by increasesan increase in goodsthe cost of hardware sales, higher costs related to transaction fees and services purchased from third parties, higher expenses incurred due to increased usage ofan increase in insurance-related claims experience.
In ZAR, the South African National Payment System by beneficiaries, and expenses incurred to operate our EPE and ATM offerings.
41
Ourdecrease in selling, general and administration expense increasedexpenses was primarily due to an allowance for doubtful working capital finance receivables of $7.8 million, the impact of October 2017 annual salary increases forlower IPG-related expenses incurred following its closure and some benefits from our South African employees, an increase in our allowance for doubtful finance loans receivable, higher transaction related expenditures, and an increase in goods and services purchased from third parties. These increasescost reduction initiatives, which were partially offset by fewer agent incentive costs paid in Korea due to weaker trading conditions in fiscal 2018 and lower executive remuneration in fiscal 2018. Fiscal 2017 includes $1.8 millionhigher employee-related expenses related to the reversalgrowth in our senior management team, and the year-over-year impact of stock-based compensation charges related to awards of restricted stock with performance conditions which we believe will not be achieved.inflationary increases on employee-related expenses.
Depreciation and amortization decreased primarily due to lower overall amortization of intangible assets that are fully amortized anddepreciation related to tangible assets that arewere fully depreciated.depreciated during the last twelve months.
Transaction costs related to Connect Group acquisition includes fees paid to external service providers associated with the contract drafting and negotiations; legal, financial and tax due diligence activities performed; warranty and indemnity insurance related to the transaction; and other advisory services procured; as well as our portion of the fees paid to competition authorities related to the regulatory filings made in various jurisdictions.
Our operating incomeloss margin for first half ofthe year to date fiscal 20182022 and 20172021 was 14%(25.1%) and 19%(35.5%), respectively. Excluding the $7.8 million valuation allowance for Masterpayment, fiscal 2018 operating income margin would have been 16%. We discuss the components of operating incomeloss margin under “—Results of operations by operating segment.”
The decrease was primarily attributablechange in fair value of equity securities during the year to higher costdate fiscal 2021, represents a non-cash fair value adjustment gain related to MobiKwik. We continue to carry our investment in Cell C at $0 (zero). Refer to Note 5 to our unaudited condensed consolidated financial statements for the methodology and inputs used in the fair value calculation for MobiKwik and Note 4 for the methodology and inputs used in the fair value calculation for Cell C.
Gain related to fair value adjustment to currency options represents the realized gain related to foreign exchange option contracts entered into in November 2021 in order to manage the risk of goods sold, IT processing, servicingcurrency volatility and support relativeto fix the USD amount to be utilized for part of the Connect Group purchase consideration settlement. The foreign exchange option contract matured on February 24, 2022. Refer to Note 4 to our unaudited condensed consolidated financial statements for additional information related to these currency options.
We recorded a gain of $0.7 million related to the reductiondisposal of our entire interest in revenue.an equity security during the third quarter of fiscal 2022. Refer to Note 5 to our unaudited condensed consolidated financial statements for additional information regarding this gain.
In ZAR, interest
We recorded a loss of $0.3 million related to the disposal of a minor portion of our investment in Finbond during the third quarter of fiscal 2022. Refer to Note 5 to our unaudited condensed consolidated financial statements for additional information regarding this disposal.
52
We recorded a loss of $0.5 million related to the disposal of Bank Frick during the year to date fiscal 2021.
Interest on surplus cash decreased to $9.6$1.5 million (ZAR 130.821.9 million) from $9.4$1.9 million (ZAR 131.431.2 million), primarily due primarily to lower average daily ZAR cash balances, partially offset by interest earned on the loan to Finbond.balances.
Interest expense increased to $4.4$2.3 million (ZAR 59.634.1 million) from $1.3$2.2 million (ZAR 18.334.9 million), due primarily as a result of a higher utilization of our ATM facilities to interest on the South African facility we obtained to partially fund our investment in Cell C, somewhat offset by lower average long-term debt balance on our South Korean debt and a lower interest rate.ATMs.
Fiscal 20182022 tax expense was $20.3$0.8 million (ZAR 272.811.3 million) compared to $21.9$4.5 million (ZAR 239.773.3 million) in fiscal 2017. 2022. Our effective tax rate for fiscal 2018,2022 was 43.6%impacted by the tax expense recorded by our profitable South African operations, non-deductible expenses, the on-going losses incurred by certain of our South African businesses and the associated valuation allowances created related to the deferred tax assets recognized regarding net operating losses incurred by these entities.
Our effective tax rate for fiscal 2021 was higherimpacted by the tax effect on the change in the fair value of our equity securities, which is at a lower tax rate than the South African statutory rate, as a result of a valuation allowance providedthe tax charge related to an allowance for doubtful working capital finance receivables created,our profitable South African operations, non-deductible expenses, (including transaction-related expenditure and non-deductible interest onthe on-going losses incurred by certain of our South African long-term facility)businesses and the impactassociated valuation allowances created related to the deferred tax assets recognized regarding net operating losses incurred by these entities, which was partially offset by the reversal of the changesdeferred tax liability related to one of our equity-accounted investments following its impairment.
Bank Frick was sold in U.S. federal statutory tax law. Our effective tax rate forthe third quarter of fiscal 2017, was 33.6%2021 and was higher thanaccounted for using the South African statutory rate as a result of non-deductible expenses andequity method during the tax impact attributableyear to distributions from our South African subsidiary.
Earnings from equity-accounted investments increased primarily due to the inclusion of our portion of DNI and Bank Frick and an increase, in USD, in Finbond’s net income.date fiscal 2021 up until it was disposed. Finbond is listed on the Johannesburg Stock Exchange and reports its six-month results during our first halfquarter and its annual results during our fourth quarter. The table below presents the relative(loss) earnings (loss) from our equity accounted investments:
| Table 10 | Six months ended December 31, | |||||||||
| 2017 | 2016 | $ % | ||||||||
| $ ’000 | $ ’000 | change | ||||||||
| DNI | 1,911 | - | nm | |||||||
| Share of net income | 3,240 | - | nm | |||||||
| Amortization of intangible assets, net of deferred tax | (1,329 | ) | - | nm | ||||||
| Bank Frick | 322 | - | nm | |||||||
| Share of net income | 487 | - | nm | |||||||
| Amortization of intangible assets, net of deferred tax | (165 | ) | - | nm | ||||||
| Finbond | 1,101 | 930 | 18% | |||||||
| Other | 95 | (197 | ) | (148% | ) | |||||
| Earnings from equity accounted investments | 3,429 | 733 | 368% | |||||||
42
Table 11 | Nine months ended March 31, | |||
| 2022 |
| 2021 | $ % |
| $ ’000 |
| $ ’000 | change |
Finbond | (1,156) |
| (20,267) | (94%) |
Share of net loss | (1,156) |
| (2,617) | (56%) |
Impairment | - |
| (17,650) | nm |
Bank Frick | - |
| 1,156 | nm |
Share of net income | - |
| 1,156 | nm |
Other | - |
| (987) | nm |
Share of net loss | - |
| (439) | nm |
Impairment | - |
| (548) | nm |
| (1,156) |
| (20,098) | (94%) |
53
Results of operations by operating segment
The composition of revenue and the contributions of our business activities to operating (loss) income are illustrated below:
| Table 11 | In U.S. Dollars (U.S. GAAP) | ||||||||||||||
| Six months ended December 31, | |||||||||||||||
| 2017 | % of | 2016 | % of | % | |||||||||||
| Operating Segment | $ ’000 | total | $ ’000 | total | change | ||||||||||
| Revenue: | |||||||||||||||
| South African transaction processing | 130,585 | 43% | 117,430 | 38% | 11% | ||||||||||
| International transaction processing | 90,207 | 30% | 90,190 | 29% | - | ||||||||||
| Financial inclusion and applied technologies | 108,444 | 36% | 122,800 | 40% | (12% | ) | |||||||||
| Subtotal: Operating segments | 329,236 | 109% | 330,420 | 107% | - | ||||||||||
| Intersegment eliminations | (28,262 | ) | (9% | ) | (23,354 | ) | (7% | ) | 21% | ||||||
| Consolidated revenue | 300,974 | 100% | 307,066 | 100% | (2% | ) | |||||||||
| Operating income (loss): | |||||||||||||||
| South African transaction processing | 25,802 | 62% | 28,920 | 50% | (11% | ) | |||||||||
| International transaction processing | 325 | 1% | 9,721 | 17% | (97% | ) | |||||||||
| Financial inclusion and applied technologies | 26,657 | 65% | 29,290 | 51% | (9% | ) | |||||||||
| Subtotal: Operating segments | 52,784 | 128% | 67,931 | 118% | (22% | ) | |||||||||
| Corporate/Eliminations | (11,471 | ) | (28% | ) | (10,161 | ) | (18% | ) | 13% | ||||||
| Consolidated operating income | 41,313 | 100% | 57,770 | 100% | (28% | ) | |||||||||
| Table 12 | In South African Rand (U.S. GAAP) | ||||||||||||||
| Six months ended December 31, | |||||||||||||||
| 2017 | 2016 | ||||||||||||||
| ZAR | % of | ZAR | % of | % | |||||||||||
| Operating Segment | ’000 | total | ’000 | total | change | ||||||||||
| Revenue: | |||||||||||||||
| South African transaction processing | 1,751,497 | 43% | 1,647,449 | 38% | 6% | ||||||||||
| International transaction processing | 1,209,919 | 30% | 1,265,294 | 29% | (4% | ) | |||||||||
| Financial inclusion and applied technologies | 1,454,527 | 36% | 1,722,786 | 40% | (16% | ) | |||||||||
| Subtotal: Operating segments | 4,415,943 | 109% | 4,635,529 | 107% | (5% | ) | |||||||||
| Intersegment eliminations | (379,069 | ) | (9% | ) | (327,638 | ) | (7% | ) | 16% | ||||||
| Consolidated revenue | 4,036,874 | 100% | 4,307,891 | 100% | (6% | ) | |||||||||
| Operating income (loss): | |||||||||||||||
| South African transaction processing | 346,074 | 62% | 405,724 | 50% | (15% | ) | |||||||||
| International transaction processing | 4,359 | 1% | 136,378 | 17% | (97% | ) | |||||||||
| Financial inclusion and applied technologies | 357,542 | 65% | 410,915 | 51% | (13% | ) | |||||||||
| Subtotal: Operating segments | 707,975 | 128% | 953,017 | 118% | (26% | ) | |||||||||
| Corporate/Eliminations | (153,857 | ) | (28% | ) | (142,551 | ) | (18% | ) | 8% | ||||||
| Consolidated operating income | 554,118 | 100% | 810,466 | 100% | (32% | ) | |||||||||
South African transaction processing
Table 12 |
| In United States Dollars | ||||||||
|
| Nine months ended March 31, | ||||||||
|
| 2022 |
| % of |
| 2021 |
| % of |
| % change |
Operating Segment | $ ’000 | total | $ ’000 | total | ||||||
Consolidated revenue: |
|
|
|
|
|
|
|
|
|
|
Consumer |
| 50,232 |
| 50% |
| 47,867 |
| 50% |
| 5% |
Merchant |
| 49,652 |
| 49% |
| 45,623 |
| 47% |
| 9% |
Other |
| 1,220 |
| 1% |
| 2,855 |
| 3% |
| (57%) |
Subtotal: Operating segments |
| 101,104 |
| 100% |
| 96,345 |
| 100% |
| 5% |
Corporate/Eliminations |
| (284) |
| - |
| (76) |
| - |
| 274% |
Total consolidated revenue |
| 100,820 |
| 100% |
| 96,269 |
| 100% |
| 5% |
Segment Adjusted EBITDA: |
|
|
|
|
|
|
|
|
|
|
Consumer |
| (20,871) |
| 82% |
| (19,395) |
| 57% |
| 8% |
Merchant |
| 3,951 |
| (16%) |
| 4,471 |
| (13%) |
| (12%) |
Other |
| 353 |
| (1%) |
| (10,285) |
| 30% |
| nm |
Total Segment Adjusted EBITDA |
| (16,567) |
| 65% |
| (25,209) |
| 74% |
| (34%) |
Corporate/eliminations |
| (8,775) |
| 35% |
| (8,943) |
| 26% |
| (2%) |
Subtotal |
| (25,342) |
| 100% |
| (34,152) |
| 100% |
| (26%) |
Less: Lease adjustments |
| 2,647 |
|
|
| 2,991 |
|
|
|
|
Less: Depreciation and amortization |
| 2,084 |
|
|
| 3,129 |
|
|
|
|
Total consolidated operating loss |
| (30,073) |
|
|
| (40,272) |
|
|
|
|
54
Table 13 |
| In South African Rand | ||||||||
|
| Nine months ended March 31, | ||||||||
|
| 2022 |
| % of |
| 2021 |
| % of |
| % change |
Operating Segment | ZAR ’000 | total | ZAR ’000 | total | ||||||
Consolidated revenue: |
|
|
|
|
|
|
|
|
|
|
Consumer |
| 752,852 |
| 50% |
| 771,492 |
| 50% |
| (2%) |
Merchant |
| 744,159 |
| 49% |
| 735,324 |
| 47% |
| 1% |
Other |
| 18,285 |
| 1% |
| 46,015 |
| 3% |
| (60%) |
Subtotal: Operating segments |
| 1,515,296 |
| 100% |
| 1,552,831 |
| 100% |
| (2%) |
Corporate/Eliminations |
| (4,256) |
| - |
| (1,225) |
| - |
| 247% |
Total consolidated revenue |
| 1,511,040 |
| 100% |
| 1,551,606 |
| 100% |
| (3%) |
Segment Adjusted EBITDA: |
|
|
|
|
|
|
|
|
|
|
Consumer |
| (312,804) |
| 82% |
| (312,597) |
| 57% |
| 0% |
Merchant |
| 59,216 |
| (16%) |
| 72,060 |
| (13%) |
| (18%) |
Other |
| 5,291 |
| (1%) |
| (165,768) |
| 30% |
| nm |
Total Segment Adjusted EBITDA |
| (248,297) |
| 65% |
| (406,305) |
| 74% |
| (39%) |
Corporate/eliminations |
| (131,515) |
| 35% |
| (144,138) |
| 26% |
| (9%) |
Subtotal |
| (379,812) |
| 100% |
| (550,443) |
| 100% |
| (31%) |
Less: Lease adjustments |
| 39,672 |
|
|
| 48,207 |
|
|
|
|
Less: Depreciation and amortization |
| 31,233 |
|
|
| 50,431 |
|
|
|
|
Total consolidated operating loss |
| (450,717) |
|
|
| (649,081) |
|
|
|
|
Consumer
The increaseunderlying decrease in segment revenue was primarily due to lower processing fees, partially offset by higher EPE transactioninsurance and lending revenue asand account holder fees. We embarked on a resultretrenchment process during the third quarter of increased usagefiscal 2022 and recorded an expense of our ATMs, increased inter-segment transaction processing activities and a modest increase$5.9 million which is included in the number of social welfare grants distributed. Operating incomeSegment EBITDA loss, refer to Note 1 to our unaudited condensed consolidated financial statements for additional information regarding this process. Segment EBITDA loss, excluding the reorganization charge, has decreased primarily due to the implementation of various cost reduction initiatives, which was partially offset by an increase in inter-segment charges, the impact of annual salary increases granted to our South African employees in October 2017 and increases in goods and services purchased from third parties, partially offset by higher EPE transaction revenue as a result of increased usage of our ATMs, increased inter-segment transaction processing activities and a modest increase in the number of social welfare grants distributed.
Our operating income margin for the first half of fiscal 2018 and 2017 was 20% and 25%, respectively. Our fiscal 2018 margin was adversely impacted by the annual salary increases granted to our South African employees in October 2017 and increases in goods and services purchased from third parties.
International transaction-based activities
Segment revenue was slightly higher during the first half of fiscal 2018, primarily due to increased contributions from Masterpayment and Transact24, largely offset by the ongoing impact of regulatory changes in South Korea on KSNET’s revenue. Operating income during the first half of fiscal 2018 was lower due to an allowance for doubtful working capital finance receivable of $7.8 million, a decrease in revenue at KSNET, partially offset by a smaller loss incurred by Masterpayment.
43
Operating income and margin for the first half of fiscal 2017, was also positively impacted by a refund of approximately $0.8 million that had been paid several years ago in connection with industry-wide litigation that has now been finalized.
Operating income margin for the first half of fiscal 2018 and 2017 was 0% and 11%, respectively. Excluding the Mastertrading allowance for doubtful working capital finance receivables, segment operating income and margin were $8.1 million and 9% respectively.
Financial inclusion and applied technologies
Financial inclusion and applied technologies revenue decreased primarily due to fewer prepaid airtime and other value added services sales, as well as lower ad hoc terminal sales, partially offset by increased volumes in our insurance businesses,insurance-related claims experience and an increase in inter-segment revenues. Operating income was also impacted by these factors as well as an increase in theour allowance for doubtful finance loans receivable resulting from a commensurate increase in our lending book in the last lending cycle of calendar 2017.recorded.
Operating income
Our EBITDA loss margin for the Financial inclusionyear to date fiscal 2022 and applied technologies segment2021 was 25%(41.5%) and 24% during the first half of fiscal 2018 and 2017, respectively, and has(40.5%), respectively.
Merchant
Segment revenue increased primarily due to fewer low margin prepaid product sales, improved revenues from our insurance businesses and an increase in inter-segment revenues,hardware sales and processing fees, which was partially offset by fewer ad hoc terminal and annual salary increases granted to our South African employees and the increaseprepaid airtime sales. The decrease in the allowance for credit losses.
Corporate/Eliminations
Our corporate expenses have increasedsegment EBITDA is primarily due to higher transaction-related expenditurescosts related to transaction fees and modest increaseshigher employee-related expenses.
Our EBITDA margin for the year to date fiscal 2022 and 2021 was 8.0% and 9.8%, respectively.
Other
Segment revenue decreased due to lower revenue following the closure of IPG in U.S. dollar denominated goodsfiscal 2021. We recorded an EBITDA contribution during the year to date fiscal 2022 following the closure of our loss-making activities performed through IPG.
Our EBITDA (loss) margin for the Other segment was 28.9% and services purchased from third parties(360.2%) during the year to date fiscal 2022 and directors’ fees. 2021, respectively.
Corporate/Eliminations
Our corporate expenses for fiscal 2022 decreased compared with fiscal 2021 due to higher consulting fees incurred in fiscal 2021 and the first halfinclusion of an allowance on doubtful loans receivable from equity-accounted investments of $0.7 million in fiscal 2017,2021. Our corporate expenses for fiscal 2022 includes the reversaltransaction related expenses of $1.8 million (ZAR 26.8 million) related to the Connect Group acquisition.
55
Presentation of stock-based compensation charges.quarterly revenue and Segment Adjusted EBITDA by segment for fiscal 2021 and 2020
During the third quarter of fiscal 2022, our chief operating decision maker changed our operating and internal reporting structures following the establishment of a new management team and our decision to focus primarily on the South African market. We have restated previously reported segment information. The tables below present quarterly revenue and EBITDA generated by our three reportable segments for fiscal 2021 and 2020, and reconciliations to consolidated revenue and operating (loss) income, as well as the U.S. dollar/ ZAR exchange rates applicable per fiscal quarter and year:
Table 14 | Fiscal 2021 | ||||||||
| In United States Dollars | ||||||||
| Quarter 1 |
| Quarter 2 |
| Quarter 3 |
| Quarter 4 |
| F2021 |
| $ '000 |
| $ '000 |
| $ '000 |
| $ '000 |
| $ '000 |
Consolidated revenue: |
|
|
|
|
|
|
|
|
|
Consumer | 15,372 |
| 16,259 |
| 16,236 |
| 18,282 |
| 66,149 |
Merchant | 18,246 |
| 15,206 |
| 12,171 |
| 15,855 |
| 61,478 |
Other | 1,556 |
| 878 |
| 421 |
| 463 |
| 3,318 |
Subtotal: Operating segments | 35,174 |
| 32,343 |
| 28,828 |
| 34,600 |
| 130,945 |
Corporate/Eliminations | (38) |
| (38) |
| - |
| (83) |
| (159) |
Total consolidated revenue | 35,136 |
| 32,305 |
| 28,828 |
| 34,517 |
| 130,786 |
|
|
|
|
|
|
|
|
|
|
Segment Adjusted EBITDA: |
|
|
|
|
|
|
|
|
|
Consumer | (6,571) |
| (5,214) |
| (7,610) |
| (6,908) |
| (26,303) |
Merchant | 2,971 |
| 1,227 |
| 273 |
| 257 |
| 4,728 |
Other | (2,631) |
| (4,339) |
| (3,315) |
| (89) |
| (10,374) |
Total Segment Adjusted EBITDA | (6,231) |
| (8,326) |
| (10,652) |
| (6,740) |
| (31,949) |
Corporate/eliminations | (2,796) |
| (4,743) |
| (1,404) |
| (4,485) |
| (13,428) |
Subtotal | (9,027) |
| (13,069) |
| (12,056) |
| (11,225) |
| (45,377) |
Less: Lease adjustments | 825 |
| 1,062 |
| 1,104 |
| 1,157 |
| 4,148 |
Less: Depreciation and amortization | 923 |
| 1,074 |
| 1,132 |
| 1,218 |
| 4,347 |
Total consolidated operating loss | (10,775) |
| (15,205) |
| (14,292) |
| (13,600) |
| (53,872) |
|
|
|
|
|
|
|
|
|
|
Income and expense items: $1 = ZAR | 16.7738 |
| 15.4653 |
| 14.9575 |
| 14.1687 |
| 15.7162 |
56
Table 15 | Fiscal 2020 | ||||||||
| In United States Dollars | ||||||||
| Quarter 1 |
| Quarter 2 |
| Quarter 3 |
| Quarter 4 |
| F2020 |
| $ '000 |
| $ '000 |
| $ '000 |
| $ '000 |
| $ '000 |
Consolidated revenue: |
|
|
|
|
|
|
|
|
|
Consumer | 21,674 |
| 18,618 |
| 18,491 |
| 12,215 |
| 70,998 |
Merchant | 23,564 |
| 19,502 |
| 14,677 |
| 10,916 |
| 68,659 |
Other | 1,199 |
| 850 |
| 1,564 |
| 1,428 |
| 5,041 |
Subtotal: Operating segments | 46,437 |
| 38,970 |
| 34,732 |
| 24,559 |
| 144,698 |
Corporate/Eliminations | (221) |
| (52) |
| (118) |
| (8) |
| (399) |
Total consolidated revenue | 46,216 |
| 38,918 |
| 34,614 |
| 24,551 |
| 144,299 |
|
|
|
|
|
|
|
|
|
|
Segment Adjusted EBITDA: |
|
|
|
|
|
|
|
|
|
Consumer | (2,784) |
| (2,809) |
| (3,889) |
| (4,507) |
| (13,989) |
Merchant | 2,778 |
| 1,471 |
| 1,710 |
| (783) |
| 5,176 |
Other | (1,969) |
| (2,979) |
| (3,043) |
| (4,024) |
| (12,015) |
Total Segment Adjusted EBITDA | (1,975) |
| (4,317) |
| (5,222) |
| (9,314) |
| (20,828) |
Corporate/eliminations | (2,304) |
| (3,931) |
| (510) |
| (2,028) |
| (8,773) |
Subtotal | (4,279) |
| (8,248) |
| (5,732) |
| (11,342) |
| (29,601) |
Less: Lease adjustments | 833 |
| 998 |
| 991 |
| 842 |
| 3,664 |
Less: Depreciation and amortization | 1,324 |
| 1,174 |
| 1,153 |
| 996 |
| 4,647 |
Less: Impairments | - |
| - |
| 6,336 |
| - |
| 6,336 |
Total consolidated operating loss | (6,436) |
| (10,420) |
| (14,212) |
| (13,180) |
| (44,248) |
|
|
|
|
|
|
|
|
|
|
Income and expense items: $1 = ZAR | 14.7520 |
| 14.6022 |
| 15.3667 |
| 17.2810 |
| 17.5686 |
Liquidity and Capital Resources
At DecemberMarch 31, 2017,2022, our cash and cash equivalents were $64.9$183.7 million and comprised mainly KRW-denominatedof U.S. dollar-denominated balances of KRW 28.1 billion ($24.4 million),$11.3 million, ZAR-denominated balances of ZAR 272.0 million2.5 billion ($22.0169.9 million), U.S. dollar-denominated balances of $11.4 million, and other currency deposits, primarily euros,Botswana pula, of $7.1$2.4 million, all amounts translated at exchange rates applicable as of DecemberMarch 31, 2017.2022. The decrease in our unrestricted cash balances from June 30, 2017,2021 was primarily due to utilization of cash reserves to fund our investments in DNI, Bank Frick, Cell Coperations and a $9 million listed note, scheduled repaymentspayment of our South African long-term debt, unscheduled repayment of Korean debt in full, growth in our South African lending book, and capital expenditures,reorganization costs, which was partially offset by cash generated by mostthe receipt of our core businesses.$7.5 million related to the sale of Bank Frick in fiscal 2021 and a $3.7 million gain on the foreign currency options.
We currently believe that our cash and credit facilities are sufficient to fund our future operations for at least the next four quarters.
We generally invest theany surplus cash held by our South African operations in overnight call accounts that we maintain at South African banking institutions, and any surplus cash held by our non-South African companies in U.S. dollar denominateddollar-denominated money market accounts. We have invested surplus cash in Korea in short-term investment accounts at Korean banking institutions.
Historically, we have financed most of our operations, research and development, working capital, and capital expenditures, as well as acquisitions and acquisitionsstrategic investments, through internally generated cash.cash and our financing facilities. When considering whether to borrow under our financing facilities, we consider the cost of capital, cost of financing, opportunity cost of utilizing surplus cash and availability of tax efficient structures to moderate financing costs.
We have a short-term South African credit facility with Nedbankclosed the acquisition of Connect in April 2022 as described in Note 20 to our unaudited condensed consolidated financial statements. The total purchase consideration was ZAR 3.8 billion ($262.0 million), comprising ZAR 3.5 billion ($238.2 million) in cash and ZAR 0.4 billion ($23.9 million) in 3,185,079 shares of our common stock. The cash component was funded through ZAR 2.1 billion of our cash, the utilization of new Net1 banking facilities of ZAR 400 million ($32.3 million), which consists1.1 billion, and an increase in Connect’s debt of (i) a primary amountZAR 0.3 billion in April 2022.
57
Available short-term borrowings
Summarized below are our short-term facilities available and utilized as of upMarch 31, 2022:
Table 16 | RMB |
| Nedbank | ||||
| $ ’000 |
| ZAR ’000 |
| $ ’000 |
| ZAR ’000 |
Total short-term facilities available, comprising: |
|
|
|
|
|
|
|
Overdraft restricted as to use(1) | 96,203 |
| 1,400,000 |
| 17,179 |
| 250,000 |
Total overdraft | 96,203 |
| 1,400,000 |
| 17,179 |
| 250,000 |
Indirect and derivative facilities(2) | - |
| - |
| 10,758 |
| 156,552 |
Total short-term facilities available | 96,203 |
| 1,400,000 |
| 27,937 |
| 406,552 |
|
|
|
|
|
|
|
|
Utilized short-term facilities: |
|
|
|
|
|
|
|
Overdraft restricted as to use(1) | 45,678 |
| 664,728 |
| - |
| - |
Indirect and derivative facilities(2) | - |
| - |
| 10,659 |
| 155,110 |
|
|
|
|
|
|
|
|
Interest rate, based on South African prime rate |
|
| 7.75% |
|
|
|
|
Interest rate, based on South African prime rate less 1.15% |
|
|
|
|
|
| 6.60% |
(1) Overdraft may only be used to ZAR 200 million,fund ATMs and (ii) a secondary amount of up to ZAR 200 million. The primary amounts comprise an overdraft facility of up to ZAR 50 million and indirectupon utilization is considered restricted cash.
(2) Indirect and derivative facilities of up to ZAR 150 million, which include letters of guarantee,may only be used for guarantees, letters of credit and forward exchange contracts.
As of December 31, 2017, we had used none of the overdraft and ZAR 126.0 million ($10.2 million, translated at exchange rates applicable as of December 31, 2017) of the indirect and derivative facilities to obtain foreign exchange contracts and to support guarantees issued by Nedbank to various third parties on our behalf.
Long-term borrowings
We obtained EUR 40.0 million ($47.9 million) and CHF 20 million ($20.5 million) revolving overdraft facilities from Bank Frick. Aslong-term borrowings of December 31, 2017, we had utilized approximately EUR 25.7 million ($30.7 million)ZAR 1.1 billion to partially fund the acquisition of Connect. In contemplation of the EUR 40 million facilityConnect transaction, Connect obtained total facilities of ZAR 1.3 billion which were utilized to repay its existing borrowings and CHF 4.7 million ($4.8 million)to settle obligations under the Sales Agreement. Our total long-term borrowings following the acquisition of Connect are ZAR 2.2 billion, comprising the CHF 20 million facility. AsZAR 1.1 billion and ZAR 1.1 billion of December 31, 2017, the interest rate on eachConnect’s total facilities of these facilities was 5.00%. We have assigned all claims against amounts due from Masterpayment customers, which have been financed from the CHF 20 million facility, plus all secondary rights and preferential rights as collateral for this facility to Bank Frick. Our Masterpayment subsidiary was required to open a primary business account with Bank Frick, and this account has been pledged to Bank Frick as collateral for the EUR 40 million facility. The initial term of the EUR 40 million facility ends on December 31, 2019, but it will automatically be extended for one year if it is not terminated with 12 months written notice.
44
The CHF 20 million facility does not have a fixed term; however, it may be terminated by either party with six months written notice at the end of a calendar month.ZAR 1.3 billion. Refer to Note 1220 to our audited consolidated financial statements included in our Annual Report on Form 10-K for the year ended June 30, 2017, for additional information related to our short-term facilities and Note 9 to our unaudited condensed consolidated financial statements for the three and six months ended December 31, 2017, for additional information related to these borrowings.
Restricted cash
We have credit facilities with RMB and Nedbank in order to access cash to fund our short-term facilities.
AsATMs in South Africa. Our cash, cash equivalents and restricted cash presented in our unaudited condensed consolidated statement of December 31, 2017, we had outstanding long-term debt of ZAR 870.7 million (approximately $70.4 million translated at exchange rates applicablecash flows as of DecemberMarch 31, 2017) under2022, includes restricted cash of approximately $45.7 million related to cash withdrawn from our loan South African facilities. Interest duevarious debt facilities to fund ATMs. This cash may only be used to fund ATMs and is considered restricted as to use and therefore is classified as restricted cash on our unaudited condensed consolidated balance sheet.
We have also entered into cession and pledge agreements with Nedbank related to certain of our Nedbank credit facilities and we have ceded and pledged certain bank accounts to Nedbank. The funds included in these bank accounts are restricted as they may not be withdrawn without the facility is based on the Johannesburg Interbank Agreed Rate, or JIBAR,express permission of Nedbank. Our cash, cash equivalents and restricted cash presented in effect from time to time plus a marginour unaudited condensed consolidated statement of 2.25% for the Facility A loan, 3.5% for the Facility B loan and 2.25% for the Facility C loan. The JIBAR ratecash flows as of March 31, 2022, includes restricted cash of approximately $10.7 million that has been set at 7.158% for the period to March 29, 2018. Principal repayments on the Facility Aceded and Facility B loans are due in eight equal quarterly installments, which began on September 30, 2017. Principal repayment on the Facility C loan is to be determined by the Lenders based on the date of the repayment of any borrowings under the Facility A loan. Voluntary prepayments are permitted without early repayment fees or penalties.pledged.
58
Cash flows from operating activities
Second
Third quarter
Net cash provided byused in operating activities forduring the secondthird quarter of fiscal 2018 2022 was $13.3$8.8 million (ZAR 182.0137.0 million) compared to $15.7$8.3 million (ZAR 218.8123.5 million) forduring the secondthird quarter of fiscal 2017.2021. Excluding the impact of interest received, interest paid underincome taxes, our Korean and South Africa debt and taxes presentedcash used in operating activities during the table below, the decrease relates primarily to the expansion of our South African lending book and weaker trading activity during fiscal 2018 compared to 2017, offset partially by the receipt of certain working capital loans outstanding.
During the secondthird quarter of fiscal 2018,2022 was impacted by the utilization of cash reserves to fund certain of our operations and payment of the reorganization costs, which was partially offset by the $3.7 million gain on the foreign currency options and profits realized by certain of our operations.
During the third quarter of fiscal 2022, we paid our first provisional South African tax payments of $0.1 million (ZAR 2.2 million) related to our 2022 tax year and received tax refunds of $0.0 million (ZAR 0.0 million). During the third quarter of fiscal 2021, we paid our first provisional South African tax payments of $0.2 million (ZAR 2.6 million) related to our 2021 tax year.
Taxes paid during the third quarter of fiscal 2022 and 2021 were as follows:
Table 17 | Three months ended March 31, | ||||||
| 2022 |
| 2021 |
| 2022 |
| 2021 |
$ | $ | ZAR | ZAR | ||||
‘000 | ‘000 | ‘000 | ‘000 | ||||
First provisional payments | 148 |
| 176 |
| 2,209 |
| 2,596 |
Tax refund received | (1) |
| - |
| (12) |
| - |
Total South African taxes paid (received) | 147 |
| 176 |
| 2,197 |
| 2,596 |
Foreign taxes paid | 34 |
| 35 |
| 509 |
| 525 |
Total tax paid | 181 |
| 211 |
| 2,706 |
| 3,121 |
Year to date
Net cash used in operating activities during the year to date fiscal 2022 was $30.5 million (ZAR 457.2 million) compared to $50.1 million (ZAR 807.7 million) during the year to date fiscal 2021. Excluding the impact of income taxes, our cash used in operating activities during the third quarter of fiscal 2022 was impacted by the utilization of cash reserves to fund certain of our operations and payment of the reorganization costs, which was partially offset by the $3.7 million gain on the foreign currency options and profits realized by certain of our operations.
During the year to date fiscal 2022, we paid our first provisional South African tax payments of $0.6 million (ZAR 9.1 million) related to our 2022 tax year and received tax refunds of $0.2 million (ZAR (3.2) million). During the year to date fiscal 2021, we paid our first provisional South African tax payments of $0.9 million (ZAR 12.7 million) related to our 2021 tax year. During the year to date fiscal 2021, we paid South African tax of $16.5$0.2 million (ZAR 216.73.4 million) related to our 20182020 tax year in South Africa.year. We also paid taxes totaling $2.4$15.3 million in other tax jurisdictions, primarily South Korea. Duringin the second quarter of fiscal 2017, we paid South African tax of $17.8 million (ZAR 246.6 million) related to our 2017 tax year in South Africa. We also paid taxes totaling $5.0 million in other tax jurisdictions, primarily South Korea.U.S.
59
Taxes paid during the second quarter ofyear to date fiscal 20182022 and 20172021 were as follows:
| Table 13 | Three months ended December 31, | |||||||||||
| 2017 | 2016 | 2017 | 2016 | |||||||||
| $ | $ | ZAR | ZAR | |||||||||
| ‘000 | ‘000 | ‘000 | ‘000 | |||||||||
| First provisional payments | 16,511 | 17,775 | 216,654 | 246,558 | ||||||||
| Taxation paid related to prior years | - | 1 | - | 13 | ||||||||
| Taxation refunds received | (251 | ) | (166 | ) | (3,292 | ) | (2,315 | ) | ||||
| Total South African taxes paid | 16,260 | 17,610 | 213,362 | 244,256 | ||||||||
| Foreign taxes paid | 2,353 | 4,954 | 32,738 | 69,186 | ||||||||
| Total tax paid | 18,613 | 22,564 | 246,100 | 313,442 | ||||||||
We expect to make additional first provisional tax payments in South Africa of approximately $1.1 million (ZAR 14 million), translated at exchange rates applicable as of December 31, 2017, related to our 2018 tax year in the third quarter of fiscal 2018.
First half
Table 18 | Nine months ended March 31, | ||||||
| 2022 |
| 2021 |
| 2022 |
| 2021 |
$ | $ | ZAR | ZAR | ||||
‘000 | ‘000 | ‘000 | ‘000 | ||||
First provisional payments | 585 |
| 853 |
| 9,142 |
| 12,680 |
Taxation paid related to prior years | - |
| 205 |
| - |
| 3,423 |
Tax refund received | (218) |
| (12) |
| (3,239) |
| (205) |
Total South African taxes paid | 367 |
| 1,046 |
| 5,903 |
| 15,898 |
Foreign taxes paid | 104 |
| 15,336 |
| 1,574 |
| 256,366 |
Total tax paid | 471 |
| 16,382 |
| 7,477 |
| 272,264 |
Net cash provided by operating activities for the first half of fiscal 2018 was $12.5 million (ZAR 167.9 million) compared to cash provided by operating activities of $69.6 million (ZAR 976.5 million) for the first half of fiscal 2017. Excluding the impact of interest received, interest paid under our Korean and South Africa debt and taxes presented in the table below, the decrease relates primarily to the expansion of our lending book and weaker trading activity during fiscal 2018 compared to 2017.
During the first half of fiscal 2018, we paid South African tax of $16.5 million (ZAR 216.7 million) related to our 2017 tax year in South Africa. During the first half of fiscal 2017, we made an additional tax payment of $1.2 million (ZAR 16.7 million) related to our 2016 tax year in South Africa and received a refund of approximately $0.3 million (ZAR 3.3 million) related to taxes overpaid in previous tax years in South Africa. We also paid taxes totaling $2.5 million in other tax jurisdictions, primarily South Korea. During the first half of fiscal 2017, we paid South African tax of $17.8 million (ZAR 246.6 million) related to our 2017 tax year and $1.2 million (ZAR 16.7 million) related to prior tax years. We also received a refund of approximately $1.4 million (ZAR 18.9 million) related to taxes overpaid in previous tax years in South Africa. We paid dividend withholding taxes of $1.5 million (ZAR 21.3 million) during the first half of fiscal 2017. We also paid taxes totaling $5.0 million in other tax jurisdictions, primarily South Korea.
45
Taxes paid during the first half of fiscal 2018 and 2017 were as follows:
| Table 14 | Six months ended December 31, | |||||||||||
| 2017 | 2016 | 2017 | 2016 | |||||||||
| $ | $ | ZAR | ZAR | |||||||||
| ‘000 | ‘000 | ‘000 | ‘000 | |||||||||
| First provisional payments | 16,511 | 17,775 | 216,654 | 246,558 | ||||||||
| Taxation paid related to prior years | 1,919 | 1,187 | 25,227 | 16,721 | ||||||||
| Taxation refunds received | (251 | ) | (1,369 | ) | (3,292 | ) | (18,878 | ) | ||||
| Dividend withholding taxation | - | 1,471 | - | 21,300 | ||||||||
| Total South African taxes paid | 18,179 | 19,064 | 238,589 | 265,701 | ||||||||
| Foreign taxes paid | 2,470 | 5,003 | 34,276 | 69,877 | ||||||||
| Total tax paid | 20,649 | 24,067 | 272,865 | 335,578 | ||||||||
Cash flows from investing activities
Second
Third quarter
Cash used in investing activities for the secondthird quarter of fiscal 2018 includes2022 included capital expenditureexpenditures of $2.1$0.8 million (ZAR 28.713.0 million), primarily fordue to the acquisition of payment processing terminalsATMs. During the third quarter of fiscal 2022, we received proceeds of $1.5 million from sale of property, plant and equipment, and $0.8 million and $0.7 million, respectively, related to the sale of minor positions in Korea. We also paid approximately $40.9 million for a 30%Finbond and from the disposal of our entire interest in Bank Frick and $9.0 million for a 7.625% interest in a listed note.Revix.
Cash used in investing activities for the secondthird quarter of fiscal 2017 includes2021 included capital expenditureexpenditures of $3.1$0.6 million (ZAR 43.69.7 million), primarily fordue to the acquisition of payment processing terminalscomputer equipment. During the third quarter of fiscal 2021 we disposed of our investment in Korea. Our Korean capital expenditures have declined dueBank Frick and received $18.6 million of the $30.0 million sales proceeds.
Year to regulatory changes in South Korea which now prohibit the provision of payment equipment to the majority of merchants. We also provided a $10.0 million loan to Finbond and paid approximately $2.9 million and $1.7 million, respectively, net of cash received, to acquire 100% of each of C4U Malta and Pros Software’s ordinary shares.date
First half
Cash used in investing activities for the first halfyear to date fiscal 2022 included capital expenditures of fiscal 2018 includes capital expenditure of $3.6$1.7 million (ZAR 48.025.8 million), primarily fordue to the roll out of our new express branches, acquisitions of ATMs and the acquisition of computer equipment. During the year to date fiscal 2022, we received a scheduled payment processing terminalsof $7.5 million related to the sale of Bank Frick in Korea. We also paid approximately $151.0fiscal 2021, proceeds from sale of property, plant and equipment of $3.5 million, (ZAR 2.0 billion) for a 15%and proceeds of $0.8 million and $0.7 million, respectively, related to the sale of minor positions in Finbond and from the disposal of our entire interest in Cell C, $72.0 million (ZAR 945.0 million) for a 45% interest in DNI, $40.9 million for a 30% interest in Bank Frick and $9.0 million for a 7.625% interest in a listed note.Revix.
Cash used in investing activities for the first halfyear to date fiscal 2021 included capital expenditures of fiscal 2017 includes capital expenditure of $6.5$3.9 million (ZAR 91.963.6 million), primarily fordue to the acquisition of payment processing terminalsmotor vehicles, which largely comprised a fleet of customized mobile ATMs used to deliver a service to rural communities, computer equipment and leasehold improvements in Korea.South Africa. We received $20.1 million related to the sale of our Korean business following the successful refund application of the amounts withheld and paid to the South Korean tax authorities pursuant to that transaction. We received $18.6 million related to the disposal of Bank Frick and the amount due on the deferred sale proceeds related to the April 2020 sale of DNI. We also paid approximately $15.3extended loan funding of $1.0 million for a 7.5% interest in MobiKwik; provided a $10.0to V2 and $0.2 million loan to Finbond and paid approximately $2.9 million and $1.7 million, respectively, net of cash received, to acquire 100% of each of C4U Malta and Pros Software’s ordinary shares.Revix.
Cash flows from financing activities
Second
Third quarter
During the secondthird quarter of fiscal 2018,2022, we made an unscheduled $16.6utilized approximately $95.0 million repayment to settlefrom our outstanding South Korean debt facility in full and made a scheduled South African debt facility payment of $14.3 million (ZAR 187.5 million). We alsooverdraft facilities to fund our ATMs and repaid $11.4$100.8 million of our overdraftthese facilities.
During the secondthird quarter of fiscal 2017, we made a $1.8 million unscheduled repayment of our Korean debt and paid a guarantee fee of $1.1 million related to the guarantee issued by RMB.
First half
During the first half of fiscal 2018,2021, we utilized approximately $94.3$55.3 million (ZAR 1.25 billion) offrom our South African facilityoverdraft facilities to part-fundfund our investment in Cell CATMs and repaid $103.2 million of these facilities.
Year to date
During the year to date fiscal 2022, we received $0.8 million from the exercise of stock options, and utilized approximately $0.3$406.4 million offrom our Korean facility to pay a portion of our quarterly interest due. We made accumulated scheduled South African debt facility payments of $28.5 million (ZAR 375 million) and made a $16.6 million payment to settle our outstanding South Korean debt facility in full. We also utilized $32.6 million of our overdraft facilities to fund our ATMs and repaid $14.3$372.5 million of these overdraft facilities.
During the first halfyear to date of fiscal 2017,2021, we paidutilized approximately $31.6$261.8 million from our South African overdraft facilities to repurchase 3,137,609 sharesfund our ATMs and repaid $268.3 million of our common stock and also paid $0.5 million, on July 1, 2016, related to settlement of amounts outstanding related to the repurchases at the end of June 2016. We also made a $28.5 million unscheduled repayment of our Korean debt. In addition, we paid a guarantee fee of $1.1 million related to the guarantee issued by RMB and paid a dividend of approximately $0.6 million to certain of our non-controlling interests.these facilities.
4660
Off-Balance Sheet Arrangements
We have no off-balance sheet arrangements.
Capital Expenditures
We expect capital spending for the thirdfourth quarter of fiscal 20182022 to primarily include the acquisition of payment terminals for the expansion of our operations in Korea and expansion oflimited investments into our ATM infrastructure and branch network in South Africa.
Africa as well as IT equipment, and through Connect, spending for POS devices, vehicles, computer and office equipment. Our historical capital expenditures for the secondthird quarter of fiscal 20182022 and 20172021 are discussed under “—Liquidity and Capital Resources—Cash flows from investing activities.” All of our capital expenditures for the past three fiscal years were funded through internally generated funds. We had outstanding capital commitments as of DecemberMarch 31, 2017,2022, of $0.7 million related mainly to the procurement of ATMs.$0.1 million. We expect to fund these expenditures through internally generated funds.
Contingent Liabilities, Commitmentsfunds and Contractual Obligationsavailable facilities.
The following table sets forth our contractual obligations as of December 31, 2017:61
| Table 15 | Payments due by Period, as of December 31, 2017 (in $ ’000s) | ||||||||||||||
| Less | More | ||||||||||||||
| than 1 | 1-3 | 3-5 | than 5 | ||||||||||||
| Total | year | years | years | years | |||||||||||
| South African long-term debt obligations (A) | 76,494 | 55,515 | 20,979 | - | - | ||||||||||
| Contingent amount related to DNI investment (B) | 29,105 | 29,105 | - | - | - | ||||||||||
| Short-term credit facilities | 35,553 | 35,553 | - | - | - | ||||||||||
| Operating lease obligations | 8,501 | 4,275 | 3,514 | 712 | - | ||||||||||
| Purchase obligations | 3,211 | 3,211 | - | - | - | ||||||||||
| Capital commitments | 659 | 659 | - | - | - | ||||||||||
| Other long-term obligations (C)(D) | 2,449 | - | - | - | 2,449 | ||||||||||
| Total | 155,972 | 128,318 | 24,493 | 712 | 2,449 | ||||||||||
| ||
| ||
| ||
|
47
Item 3. Quantitative and Qualitative Disclosures About Market Risk
In addition to the tables below, see Note 54 to the unaudited condensed consolidated financial statements for a discussion of market risk.
We have short-term borrowings which attract interest at rates that fluctuate based on changes in the South African prime interest rate. The following table illustrates the effect on our annual expected interest charge, translated at exchange rates applicable as of DecemberMarch 31, 2017,2022, as a result of changes in JIBAR rates.the South African prime interest rate, assuming hypothetical short-term borrowings of ZAR 1.0 billion as of March 31, 2022. The effect of a hypothetical 1% (i.e. 100 basis points) increase and a 1% decrease in each of JIBAR ratesthe South African prime interest rate as of DecemberMarch 31, 2017,2022, are shown. The selected 1% hypothetical change does not reflect what could be considered the best or worst case scenarios.
Table 19 | As of March 31, 2022 | ||||
| Annual expected interest charge ($ ’000) |
| Hypothetical change in interest rates |
| Estimated annual expected interest charge after hypothetical change in interest rates ($ ’000) |
Interest on South Africa overdraft (South African prime interest rate) | 4,810 |
| 1% |
| 5,497 |
|
|
| 1% |
| 4,123 |
| As of December 31, 2017 | |||||||||
| Table 16 | Estimated annual | ||||||||
| Annual | expected interest | ||||||||
| expected | charge after | ||||||||
| interest | Hypothetical | hypothetical change in | |||||||
| charge | change in | JIBAR | |||||||
| ($ ’000) | JIBAR | ($ ’000) | |||||||
| Interest on South Africa long-term debt (JIBAR) | 7,158 | 1% | 7,865 | ||||||
| (1% | ) | 6,450 | |||||||
62
Item 4. Controls and Procedures
Evaluation of disclosure controls and procedures
Under the supervision and with the participation of our management, including our group chief executive officer and our group chief financial officer, we conducted an evaluation of our disclosure controls and procedures, as such term is defined under Rule 13a-15(e) promulgated under the Securities Exchange Act of 1934, as amended, as of DecemberMarch 31, 2017.2022. Management recognizes that any controls and procedures, no matter how well designed and operated, can provide only reasonable assurance of achieving their objectives and management necessarily applies its judgment in evaluating the cost-benefit relationship of possible controls and procedures. Based on this evaluation, the group chief executive officer and the group chief financial officer concluded that our disclosure controls and procedures were effective as of DecemberMarch 31, 2017.2022.
Changes in Internal Control over Financial Reporting
There have not been any changes in our internal control over financial reporting during the fiscal quarter ended DecemberMarch 31, 2017,2022, that have materially affected, or are reasonably likely to materially affect, our internal control over financial reporting.
48
63
Part II. Other Information
Item 1. Legal Proceedings1A. Risk Factors
Litigation Regarding Legality
See “Item 1A RISK FACTORS” in Part I of Debit Orders under Social Assistance Act Regulations
Asour Annual Report on Form 10-K for the fiscal year ended June 30, 2021, for a discussion of risk factors relating to (i) our business, (ii) operating in South Africa and other foreign markets, (iii) government regulation, and (iv) our common stock. Except as set forth below, there have been no material changes from the risk factors previously disclosed eachin our Annual Report on Form 10-K for the fiscal year ended June 30, 2021.
We may not be able to successfully integrate Connect’s operations with our business.
On April 14, 2022, we announced the closing of SASSAour ZAR 3.8 billion ($262.0 million) investment to acquire a 100% interest in Connect. The acquisition of Connect is strategically important for us because we believe that (i) the combination of complementary product offerings will assist to drive stronger unit economics, (ii) the transaction facilitates expansion of the addressable market in the informal MSMEs sector, (iii) Connect has an attractive financial profile with strong and profitable growth, (iv) we have merged highly skilled teams with complementary expertise, and (v) will be able to better serve the underserved.
Integrating Connect into our company will require significant attention from our senior management which may divert their attention from our day-to-day business. The difficulties of integration may be increased by cultural differences between our two organizations and the Black Sash Trust,necessity of retaining and integrating personnel, including Connect Group’s key employees and management team. The services of these individuals will be important to the continued growth and success of Connect’s business and to our ability to integrate Connect with us. If we were to lose the services of these key employees or Black Sash, served applications petitioningfail to sufficiently integrate them, our ability to operate Connect successfully would likely be materially and adversely impacted.
As such, if we are unable to successfully integrate Connect’s operations into our business we could be required to record material impairments, and as a result, our financial condition, results of operations, cash flows and stock price could suffer.
We may not achieve the South African Supreme Courtexpected benefits from our recent acquisition of Appeal, orConnect.
Our expectations regarding Connect’s business and prospects may not be realized, including as a result of changes in the Supreme Court, to grant them leave to appeal to either the Supreme Court or to a full benchfinancial condition of the High Courtmarkets that Connect serves. In addition, there are risks associated with Connect’s product and service offerings or results of operations, including the risk of reduced cash settlements through Connect’s vault infrastructure or higher cash losses, lower than expected growth in Connect’s value-added services, lower than expected levels of loan advances or higher credit losses and slower than expected growth in card transactions. Furthermore, attempting to combine and integrate service offerings may be disruptive to us or unsuccessful, and our customers may not use our combined services to the extent that we hope they will. Any such failure could adversely impact our own business as well as Connect’s, which could then reduce the value of our investment and adversely impact our other business and operational relationships.
Our inability to achieve the expected synergies from the Connect transaction may have a material adverse effect on our business, results of operations or financial condition. For example, our revenues and operating income may be adversely affected and we could be required to impair all, or a part of, our investment. If some or all of the Republicaforementioned or other risks materialize, our ability to realize the anticipated benefits of South Africa Gauteng Division, Pretoria.
On September 29, 2017, the Supreme Court referred the petitions to oral argument. The record of appeal has been filedConnect Group could be materially impaired, and SASSA and the Black Sash must file written arguments by February 28, 2018, and we must file our written arguments within one month of receipt of SASSA and Black Sash’s written arguments. The Supreme Court will provide a hearing date after all written arguments have been filed.
We believe that SASSA and the Black Sash’s claim is without merit, and we intend to defend it vigorously. However, we cannot predict how the courts will rule on the matter.
NCR application for the cancelation of Moneyline’s registration as a credit providerresult, our financial condition, results of operations, cash flows and stock price could suffer.
Our appeal
We have a significant amount of the November 27, 2015, High Court ruling in this matter was initially scheduledindebtedness that requires us to be heard on December 6, 2017, however, the matter was subsequently removed from the rollcomply with restrictive and a new hearing date has not been set.financial covenants. If we are successful,unable to comply with these covenants, we could default on this debt, which would have a material adverse effect on our business and financial condition.
We financed our recent investment in Connect through South African bank borrowings of ZAR 1.1 billion ($71.7 million, translated at closing date exchange rate (as defined in the Sale Agreement) of $1:ZAR 14.65165). The borrowings are secured by a pledge of certain of our bank accounts, and the cession of Net1’s shareholding in certain of its subsidiaries. These borrowings contain customary covenants that require Net1 SA to maintain a specified total asset cover ratio, maintain group cash balances (as defined in the Loan Documents) above ZAR 300.0 million, and restrict the ability of Net1, Net1 SA, and certain of its subsidiaries to make certain distributions with respect to their capital stock, prepay other debt, encumber their assets, incur additional indebtedness, make investment above specified levels, engage in certain business combinations and engage in other corporate activities. The group cash balances may go below ZAR 300 million to the extent credit support is provided by the VCP Investment Fund and/ or VCP Investment Portfolios (“VCP Investors”), and such support exceeds ZAR 350 million, but such reduction below ZAR 300 million is limited to ZAR 80 million.
The loan agreements also include a credit enhancement mechanism of ZAR 350 million ($23.9 million, translated at closing date exchange rate), which has been provided by investment funds managed by Net1’s largest shareholder, Value Capital Partners (Pty) Ltd (“VCP”), on commercially agreed terms, which include a contingent subscription for new shares. There can be no assurance that VCP will perform under the commercially agreed terms and failure by it to fulfil its obligation under the credit enhancement mechanism may put our funding or future repayments at risk.
64
We have also obtained total facilities through the Connect acquisition of ZAR 1.3 billion comprising a Facility A term loan of up to ZAR 750 million (“Facility A Loan”), a Facility B term loan of up to ZAR 350 million (“Facility B Loan”), and a general banking facility of ZAR 206.0 million. The amount available under the general banking facility will disposereduce to ZAR 125.0 million on March 23, 2023. These borrowings are secured by a pledge of, among other things, CCMS entire equity interests in equity securities it owns and any claims outstanding. These borrowings contain customary covenants that require CCMS to maintain specified debt service, interest cover and leverage ratios.
These security arrangements and covenants may reduce our operating flexibility or our ability to engage in other transactions that may be beneficial to us. If we are unable to comply with the covenants, we could be in default and the indebtedness could be accelerated. If this were to occur, we might not be able to obtain waivers of default or to refinance the debt with another lender and as a result, our business and financial condition would suffer.
We will likely not include Connect in our internal control certification and attestation for fiscal 2022.
As noted above, integrating Connect into our company will require significant attention from our senior management which may divert their attention from our day to day business. Our management certification and auditor attestation regarding the effectiveness of our internal control over financial reporting as of June 30, 2022, will likely exclude the operations of the application.Connect Group. If we doare unable to successfully integrate Connect’s operations into our internal control over financial reporting, our internal control over financial reporting may not prevail, thenbe effective.
Geopolitical conflicts, including the National Credit Regulator’s, or NCR’s, application will be set down beforeconflict between Russia and Ukraine, may adversely affect our business and results of operations.
The current conflict between Russia and Ukraine is creating substantial uncertainty about the Consumer Tribunal for argumentfuture impact on the main issues raisedglobal economy. Countries across the globe are instituting sanctions and other penalties against Russia. The retaliatory measures that have been taken, and could be taken in the future, by the NCR, as dealtU.S., NATO, and other countries have created global security concerns that could result in broader European military and political conflicts and otherwise have a substantial impact on regional and global economies, any or all of which could adversely affect our business.
While the broader consequences are uncertain at this time, the continuation and/or escalation of the Russian and Ukraine conflict, along with above.any expansion of the conflict to surrounding areas, create a number of risks that could adversely impact our business, including:
increased inflation and significant volatility in the macroeconomic environment;
disruptions to our technology infrastructure, including through cyberattacks, ransom attacks or cyber-intrusion;
adverse changes in international trade policies and relations;
disruptions in global supply chains;
constraints, volatility or disruption in the credit and capital markets; and
exacerbating the other risks disclosed in our Annual Report on Form 10-K.
All of these risks could materially and adversely affect our business and results of operations. We cannot predictare continuing to monitor the outcome of this litigation.
Constitutional Court order regarding extension of contract with SASSA for 12 months
Various reports have been filed by SASSAsituation in the Ukraine and the panel of experts pursuant to the Constitutional Court’s March 17, 2017 orderglobally and various directives received from it. On February 6, 2018, we launched an application with the Constitutional Court requesting clarityassess its potential impact on whether CPS may participate in any future SASSA tender processes.our business.
65
Item 6. Exhibits
The following exhibits are filed as part of this Form 10-Q:
|
|
|
| Incorporated by Reference Herein | ||
Exhibit No. |
| Description of Exhibit | Included Herewith | Form | Exhibit | Filing Date |
|
|
|
|
|
|
|
10.49 |
|
| 8-K | 10.1 | January 28, 2022 | |
10.50 |
|
| 8-K | 10.2 | January 28, 2022 | |
10.51 |
|
| 8-K | 10.3 | January 28, 2022 | |
10.52 |
|
| 8-K | 10.1 | March 28, 2022 | |
10.53 |
|
| 8-K | 10.2 | March 28, 2022 | |
10.54 |
|
| 8-K | 10.3 | March 28, 2022 | |
10.55 |
| X |
|
|
| |
10.56 |
| X |
|
|
| |
66
10.57 | X | |||||
10.58 | ||||||
X | ||||||
31.1 | Certification of Principal Executive Officer pursuant to Rule 13a-14(a) under the Exchange Act | X | ||||
31.2 | Certification of Principal Financial Officer pursuant to Rule 13a-14(a) under the Exchange Act | X | ||||
32 | X | |||||
101.INS | XBRL Instance Document | X | ||||
101.SCH | XBRL Taxonomy Extension Schema | X | ||||
101.CAL | XBRL Taxonomy Extension Calculation Linkbase | X | ||||
101.DEF | XBRL Taxonomy Extension Definition Linkbase | X | ||||
101.LAB | XBRL Taxonomy Extension Label Linkbase | X | ||||
101.PRE | XBRL Taxonomy Extension Presentation Linkbase | X | ||||
104 | Cover page formatted as Inline XBRL and contained in Exhibit 101 |
49
SIGNATURES
Pursuant to the requirements of the Securities Exchange Act of 1934, the registrant has caused this report to be signed on its behalf by the undersigned, thereunto duly authorized, on February 8, 2018.May 10, 2022.
NET 1 UEPS TECHNOLOGIES, INC.
By: /s/ Herman G. KotzéChris G.B. Meyer
Herman G. Kotzé
Chris G.B. Meyer
Group Chief Executive Officer
By: /s/ Naeem E. Kola
Naeem E. Kola
Group Chief Financial Officer, Treasurer and Secretary Director
5067