0001069157us-gaap:AccumulatedTranslationAdjustmentMember2020-01-012020-03-31
UNITED STATES
SECURITIES AND EXCHANGE COMMISSION
Washington, D.C. 20549
FORM 10-Q
☒ QUARTERLY REPORT PURSUANT TO SECTION 13 OR 15(d) OF
THE SECURITIES EXCHANGE ACT OF 1934
For the quarterly period ended September 30, 2017March 31, 2021
OR
☐ TRANSITION REPORT PURSUANT TO SECTION 13 OR 15(d) OF
THE SECURITIES EXCHANGE ACT OF 1934
For the transition period from to
Commission file number 000-24939
EAST WEST BANCORP, INC.
(Exact name of registrant as specified in its charter)
|
| | |
Delaware
(State or other jurisdiction of incorporation or organization) | | 95-4703316
(I.R.S. Employer Identification No.)
|
| | |
135 North Los Robles Ave., 7th Floor, Pasadena, California 91101
(Address of principal executive offices)(Zip Code)
|
95-4703316
(I.R.S. Employer Identification No.)
135 North Los Robles Ave., 7th Floor, Pasadena, California 91101
(Address of principal executive offices) (Zip Code)
Registrant’s telephone number, including area code:
(626) 768-6000
Securities registered pursuant to Section 12(b) of the Act:
| | | | | | | | | | | | | | | | | | | |
| Title of each class | | Trading
Symbol(s) | | Name of each exchange
on which registered | |
| Common Stock, par value $0.001 per share | | EWBC | | The Nasdaq Global Select Market | |
Indicate by check mark whether the registrant (1) has filed all reports required to be filed by Section 13 or 15(d) of the Securities Exchange Act of 1934 during the preceding 12 months (or for such shorter period that the registrant was required to file such reports), and (2) has been subject to such filing requirements for the past 90 days.
Yes x☒ No ¨☐
Indicate by check mark whether the registrant has submitted electronically and posted on its corporate Web site, if any, every Interactive Data File required to be submitted and posted pursuant to Rule 405 of Regulation S-T (§232.405 of this chapter) during the preceding 12 months (or for such shorter period that the registrant was required to submit and post such files).
Yes x☒ No ¨☐
Indicate by check mark whether the registrant is a large accelerated filer, an accelerated filer, a non-accelerated filer, a smaller reporting company, or an emerging growth company. See the definitions of “large accelerated filer,” “accelerated filer,” “smaller reporting company,” and “emerging growth company” in Rule 12b-2 of the Exchange Act.
|
| | | | | | | | | | | | | |
| Large accelerated filer | x☒ | | Accelerated filer | ¨☐ |
| Non-accelerated filer | ¨☐ | (Do not check if a smaller reporting company) | Smaller reporting company | ¨☐ |
| | Emerging growth company | ¨☐ |
If an emerging growth company, indicate by check mark if the registrant has elected not to use the extended transition period for complying with any new or revised financial accounting standards provided pursuant to Section 13(a) of the Exchange Act. ¨☐
Indicate by check mark whether the registrant is a shell company (as defined in Rule 12b-2 of the Exchange Act).
Yes ¨☐ No x☒
Number of shares outstanding of the issuer’s common stock on the latest practicable date: 144,542,911141,863,399 shares as of October 31, 2017.
TABLE OF CONTENTS
Forward-Looking Statements
Certain matters discussed in this Quarterly Report on Form 10-Q (“Form 10-Q”) contain or incorporate statements that East West Bancorp, Inc. (referred to herein on an unconsolidated basis as “East West” and on a consolidated basis as the “Company”) believes are “forward-looking statements” within the meaning of Section 27A of the Securities Act of 1933, as amended, and Rule 175 promulgated thereunder, and Section 21E of the Securities Exchange Act of 1934, as amended, and Rule 3b-6 promulgated thereunder. These statements relate to the Company’s financial condition, results of operations, plans, objectives, future performance or business. They usually can be identified by the use of forward-looking language, such as “likely result in,” “expects,” “anticipates,” “estimates,” “forecasts,” “projects,” “intends to,” or may include other similar words or phrases, such as “believes,” “plans,” “trend,” “objective,” “continues,” “remains,” or similar expressions, or future or conditional verbs, such as “will,” “would,” “should,” “could,” “may,” “might,” “can,” or similar verbs. You should not place undue reliance on these statements, as they are subject to risks and uncertainties, including, but not limited to, those described in the documents incorporated by reference. When considering these forward-looking statements, you should keep in mind these risks and uncertainties, as well as any cautionary statements the Company may make. Moreover, you should treat these statements as speaking only as of the date they are made and based only on information then actually known to the Company.
There are a number of important factors that could cause future results to differ materially from historical performance and these forward-looking statements. Factors that might cause such differences, some of which are beyond the Company’s control, include, but are not limited to:
the Company’s ability to compete effectively against other financial institutions in its banking markets;
changes in the commercial and consumer real estate markets;
changes in the Company’s costs of operation, compliance and expansion;
changes in the United States (“U.S.”) economy, including inflation, employment levels, rate of growth and general business conditions;
changes in government interest rate policies;
changes in laws or the regulatory environment including regulatory reform initiatives and policies of the U.S. Department of Treasury, the Board of Governors of the Federal Reserve Board System, the Federal Deposit Insurance Corporation, the U.S. Securities and Exchange Commission, the Consumer Financial Protection Bureau and the California Department of Business Oversight — Division of Financial Institutions;
heightened regulatory and governmental oversight and scrutiny of the Company’s business practices, including dealings with consumers;
changes in the economy of and monetary policy in the People’s Republic of China;
changes in income tax laws and regulations;
changes in accounting standards as may be required by the Financial Accounting Standards Board (“FASB”) or other regulatory agencies and their impact on critical accounting policies and assumptions;
changes in the equity and debt securities markets;
future credit quality and performance, including the Company’s expectations regarding future credit losses and allowance levels;
fluctuations in the Company’s stock price;
fluctuations in foreign currency exchange rates;
success and timing of the Company’s business strategies;
ability of the Company to adopt and successfully integrate new technologies into its business in a strategic manner;
impact of reputational risk from negative publicity, fines and penalties and other negative consequences from regulatory violations and legal actions;
impact of potential federal tax changes and spending cuts;
impact of adverse judgments or settlements in litigation;
impact of regulatory enforcement actions;
changes in the Company’s ability to receive dividends from its subsidiaries;
impact of political developments, wars or other hostilities that may disrupt or increase volatility in securities or otherwise affect economic conditions;
impact of natural or man-made disasters or calamities or conflicts or other events that may directly or indirectly result in a negative impact on the Company’s financial performance;
continuing consolidation in the financial services industry;
the Company’s capital requirements and its ability to generate capital internally or raise capital on favorable terms;
impact of the Dodd-Frank Wall Street Reform and Consumer Protection Act on the Company’s business, business practices and cost of operations;
impact of adverse changes to the Company’s credit ratings from the major credit rating agencies;
impact of failure in, or breach of, the Company’s operational or security systems or infrastructure, or those of third parties with whom the Company does business, including as a result of cyber attacks; and other similar matters which could result in, among other things, confidential and/or proprietary information being disclosed or misused;
adequacy of the Company’s risk management framework, disclosure controls and procedures and internal control over financial reporting;
the effect of the current low interest rate environment or changes in interest rates on the Company’s net interest income and net interest margin;
the effect of changes in the level of checking or savings account deposits on the Company’s funding costs and net interest margin; and
a recurrence of significant turbulence or disruption in the capital or financial markets, which could result in, among other things, a reduction in the availability of funding or increased funding costs, reduced investor demand for mortgage loans and declines in asset values and/or recognition of other-than-temporary impairment (“OTTI”) on securities held in the Company’s available-for-sale investment securities portfolio.
For a more detailed discussion of some of the factors that might cause such differences, see the Company’s annual report on Form 10-K for the year ended December 31, 2016, filed with the U.S. Securities and Exchange Commission on February 27, 2017 (the “Company’s 2016 Form 10-K”), under the heading “ITEM 1A. RISK FACTORS” and the information set forth under “ITEM 1A. RISK FACTORS” in this Form 10-Q. The Company does not undertake, and specifically disclaims any obligation to update any forward-looking statements to reflect the occurrence of events or circumstances after the date of such statements except as required by law.
PART I — FINANCIAL INFORMATION
ITEM 1. CONSOLIDATED FINANCIAL STATEMENTS
EAST WEST BANCORP, INC. AND SUBSIDIARIES
CONSOLIDATED BALANCE SHEETSSHEET
($ in thousands, except shares)
(Unaudited)
| | | | | | | | | | | | | | |
|
| | March 31,
2021 | | December 31,
2020 |
| | (Unaudited) | | |
| ASSETS | | | | |
| Cash and due from banks | | $ | 582,270 | | | $ | 592,117 | |
| Interest-bearing cash with banks | | 4,036,863 | | | 3,425,854 | |
| Cash and cash equivalents | | 4,619,133 | | | 4,017,971 | |
| Interest-bearing deposits with banks | | 741,923 | | | 809,728 | |
| Assets purchased under resale agreements (“resale agreements”) | | 2,160,038 | | | 1,460,000 | |
| Securities: | | | | |
| Available-for-sale (“AFS”) debt securities, at fair value (amortized cost of $7,904,546 in 2021 and $5,470,523 in 2020; includes assets pledged as collateral of $590,858 in 2021 and $588,484 in 2020) | | 7,789,213 | | | 5,544,658 | |
| Restricted equity securities, at cost | | 83,250 | | | 83,046 | |
| Loans held-for-sale | | 0 | | | 1,788 | |
| Loans held-for-investment (net of allowance for loan losses of $607,506 in 2021 and $619,983 in 2020; includes assets pledged as collateral of $23,591,704 in 2021 and $23,263,517 in 2020) | | 38,981,242 | | | 37,770,972 | |
| Investments in qualified affordable housing partnerships, net | | 284,862 | | | 213,555 | |
| Investments in tax credit and other investments, net | | 361,438 | | | 266,525 | |
| Premises and equipment (net of accumulated depreciation of $130,926 in 2021 and $127,884 in 2020) | | 102,120 | | | 103,251 | |
| Goodwill | | 465,697 | | | 465,697 | |
| Operating lease right-of-use assets | | 94,483 | | | 95,460 | |
| Other assets | | 1,190,747 | | | 1,324,262 | |
| TOTAL | | $ | 56,874,146 | | | $ | 52,156,913 | |
| LIABILITIES | | | | |
| Deposits: | | | | |
| Noninterest-bearing | | $ | 18,919,298 | | | $ | 16,298,301 | |
| Interest-bearing | | 30,627,838 | | | 28,564,451 | |
| Total deposits | | 49,547,136 | | | 44,862,752 | |
| Short-term borrowings | | 0 | | | 21,009 | |
| | | | |
| Federal Home Loan Bank (“FHLB”) advances | | 653,035 | | | 652,612 | |
| Assets sold under repurchase agreements (“repurchase agreements”) | | 300,000 | | | 300,000 | |
| Long-term debt and finance lease liabilities | | 152,195 | | | 151,739 | |
| Operating lease liabilities | | 101,828 | | | 102,830 | |
| Accrued expenses and other liabilities | | 834,925 | | | 796,796 | |
| Total liabilities | | 51,589,119 | | | 46,887,738 | |
| COMMITMENTS AND CONTINGENCIES (Note 10) | | 0 | | 0 |
| STOCKHOLDERS’ EQUITY | | | | |
| Common stock, $0.001 par value, 200,000,000 shares authorized; 167,716,333 and 167,240,600 shares issued in 2021 and 2020, respectively | | 168 | | | 167 | |
| Additional paid-in capital | | 1,865,933 | | | 1,858,352 | |
| Retained earnings | | 4,158,032 | | | 4,000,414 | |
| Treasury stock, at cost 25,873,297 shares in 2021 and 25,675,371 shares in 2020 | | (649,066) | | | (634,083) | |
| Accumulated other comprehensive (loss) income (“AOCI”), net of tax | | (90,040) | | | 44,325 | |
| Total stockholders’ equity | | 5,285,027 | | | 5,269,175 | |
| TOTAL | | $ | 56,874,146 | | | $ | 52,156,913 | |
|
|
| | | | | | | | |
| |
| | | September 30,
2017 | | December 31,
2016 |
| | | (Unaudited) | | |
| ASSETS | | | | |
| Cash and due from banks | | $ | 364,328 |
| | $ | 460,559 |
|
| Interest-bearing cash with banks | | 1,372,421 |
| | 1,417,944 |
|
| Cash and cash equivalents | | 1,736,749 |
| | 1,878,503 |
|
| Interest-bearing deposits with banks | | 404,946 |
| | 323,148 |
|
| Securities purchased under resale agreements (“resale agreements”) | | 1,250,000 |
| | 2,000,000 |
|
| Securities : | | | | |
| Available-for-sale investment securities, at fair value (includes assets pledged as collateral of $584,907 in 2017 and $767,437 in 2016) | | 2,956,776 |
| | 3,335,795 |
|
| Held-to-maturity investment security, at cost (fair value of $144,593 in 2016) | | — |
| | 143,971 |
|
| Restricted equity securities, at cost | | 73,322 |
| | 72,775 |
|
| Loans held-for-sale | | 178 |
| | 23,076 |
|
| Loans held-for-investment (net of allowance for loan losses of $285,926 in 2017 and $260,520 in 2016; includes assets pledged as collateral of $18,182,265 in 2017 and $16,441,068 in 2016) | | 28,239,431 |
| | 25,242,619 |
|
| Investments in qualified affordable housing partnerships, net | | 178,344 |
| | 183,917 |
|
| Investments in tax credit and other investments, net | | 203,758 |
| | 173,280 |
|
| Premises and equipment (net of accumulated depreciation of $109,296 in 2017 and $114,890 in 2016) | | 131,311 |
| | 159,923 |
|
| Goodwill | | 469,433 |
| | 469,433 |
|
| Other assets | | 663,718 |
| | 782,400 |
|
| TOTAL | | $ | 36,307,966 |
| | $ | 34,788,840 |
|
| LIABILITIES | | |
| | |
|
| Customer deposits: | | |
| | |
|
| Noninterest-bearing | | $ | 10,992,674 |
| | $ | 10,183,946 |
|
| Interest-bearing | | 20,318,988 |
| | 19,707,037 |
|
| Total deposits | | 31,311,662 |
| | 29,890,983 |
|
| Short-term borrowings | | 24,813 |
| | 60,050 |
|
| Federal Home Loan Bank (“FHLB”) advances | | 323,323 |
| | 321,643 |
|
| Securities sold under repurchase agreements (“repurchase agreements”) | | 50,000 |
| | 350,000 |
|
| Long-term debt | | 176,513 |
| | 186,327 |
|
| Accrued expenses and other liabilities | | 639,759 |
| | 552,096 |
|
| Total liabilities | | 32,526,070 |
| | 31,361,099 |
|
| COMMITMENTS AND CONTINGENCIES (Note 11) | |
|
| |
|
|
| STOCKHOLDERS’ EQUITY | | | | |
| Common stock, $0.001 par value, 200,000,000 shares authorized; 165,178,075 and 164,604,072 shares issued in 2017 and 2016, respectively | | 165 |
| | 164 |
|
| Additional paid-in capital | | 1,745,181 |
| | 1,727,434 |
|
| Retained earnings | | 2,520,817 |
| | 2,187,676 |
|
| Treasury stock at cost — 20,667,132 shares in 2017 and 20,436,621 shares in 2016 | | (452,050 | ) | | (439,387 | ) |
| Accumulated other comprehensive loss, net of tax | | (32,217 | ) | | (48,146 | ) |
| Total stockholders’ equity | | 3,781,896 |
| | 3,427,741 |
|
| TOTAL | | $ | 36,307,966 |
| | $ | 34,788,840 |
|
| |
See accompanying Notes to Consolidated Financial Statements.
53
EAST WEST BANCORP, INC. AND SUBSIDIARIES
CONSOLIDATED STATEMENTSSTATEMENT OF INCOME
($ and shares in thousands, except per share data)
| | | | | |
| | | Three Months Ended
September 30, | | Nine Months Ended
September 30, | | Three Months Ended March 31, | |
| | | 2017 | | 2016 | | 2017 | | 2016 | | 2021 | | 2020 | |
| INTEREST AND DIVIDEND INCOME | | | | | | |
| | |
| INTEREST AND DIVIDEND INCOME | | | | | |
| Loans receivable, including fees | | $ | 306,939 |
| | $ | 255,316 |
| | $ | 872,039 |
| | $ | 763,189 |
| Loans receivable, including fees | | $ | 342,008 | | | $ | 411,869 | | |
| Investment securities | | 14,828 |
| | 13,388 |
| | 43,936 |
| | 37,433 |
| |
| AFS debt securities | | AFS debt securities | | 29,100 | | | 20,142 | | |
| | Resale agreements | | 7,901 |
| | 7,834 |
| | 25,222 |
| | 22,479 |
| Resale agreements | | 6,099 | | | 5,625 | | |
| Restricted equity securities | | 612 |
| | 611 |
| | 1,859 |
| | 2,008 |
| Restricted equity securities | | 547 | | | 446 | | |
| Interest-bearing cash and deposits with banks | | 9,630 |
| | 3,168 |
| | 22,298 |
| | 10,245 |
| Interest-bearing cash and deposits with banks | | 3,632 | | | 11,108 | | |
| Total interest and dividend income | | 339,910 |
| | 280,317 |
| | 965,354 |
| | 835,354 |
| Total interest and dividend income | | 381,386 | | | 449,190 | | |
| INTEREST EXPENSE | | | | | | |
| | |
| INTEREST EXPENSE | | | | | |
| Customer deposits | | 31,086 |
| | 21,049 |
| | 81,803 |
| | 60,708 |
| |
| Federal funds purchased and other short-term borrowings | | 212 |
| | 212 |
| | 877 |
| | 390 |
| |
| Deposits | | Deposits | | 21,822 | | | 76,403 | | |
| Short-term borrowings | | Short-term borrowings | | 42 | | | 556 | | |
| FHLB advances | | 1,947 |
| | 1,361 |
| | 5,738 |
| | 4,153 |
| FHLB advances | | 3,069 | | | 4,166 | | |
| Repurchase agreements | | 2,122 |
| | 2,319 |
| | 7,538 |
| | 6,441 |
| Repurchase agreements | | 1,978 | | | 3,991 | | |
| Long-term debt | | 1,388 |
| | 1,228 |
| | 4,030 |
| | 3,726 |
| |
| Long-term debt and finance lease liabilities | | Long-term debt and finance lease liabilities | | 780 | | | 1,367 | | |
| Total interest expense | | 36,755 |
| | 26,169 |
| | 99,986 |
| | 75,418 |
| Total interest expense | | 27,691 | | | 86,483 | | |
| Net interest income before provision for credit losses |
| 303,155 |
| | 254,148 |
| | 865,368 |
| | 759,936 |
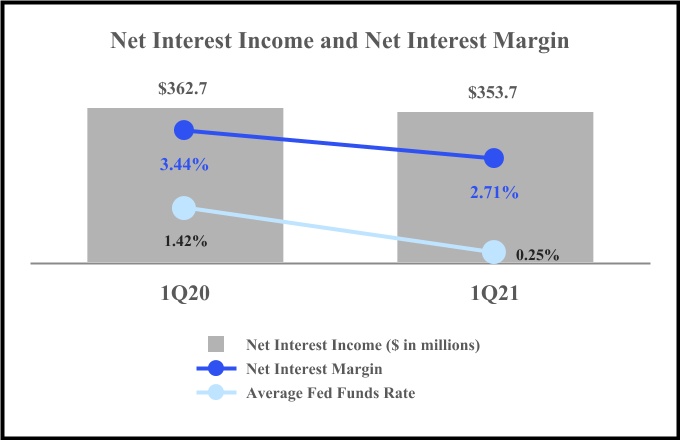
| Net interest income before provision for credit losses | | 353,695 | | | 362,707 | | |
| Provision for credit losses | | 12,996 |
| | 9,525 |
| | 30,749 |
| | 17,018 |
| Provision for credit losses | | 0 | | | 73,870 | | |
| Net interest income after provision for credit losses | | 290,159 |
| | 244,623 |
| | 834,619 |
| | 742,918 |
| Net interest income after provision for credit losses | | 353,695 | | | 288,837 | | |
| NONINTEREST INCOME | | | | | | |
| | |
| NONINTEREST INCOME | | | | | |
| Branch fees | | 10,803 |
| | 10,408 |
| | 31,799 |
| | 30,983 |
| |
| Letters of credit fees and foreign exchange income | | 10,154 |
| | 10,908 |
| | 33,209 |
| | 31,404 |
| |
| Ancillary loan fees and other income | | 5,987 |
| | 6,135 |
| | 16,876 |
| | 13,997 |
| |
| Lending fees | | Lending fees | | 18,357 | | | 15,773 | | |
| Deposit account fees | | Deposit account fees | | 15,383 | | | 10,447 | | |
| Interest rate contracts and other derivative income | | Interest rate contracts and other derivative income | | 16,997 | | | 7,073 | | |
| Foreign exchange income | | Foreign exchange income | | 9,526 | | | 7,819 | | |
| Wealth management fees | | 3,615 |
| | 4,033 |
| | 11,682 |
| | 9,862 |
| Wealth management fees | | 6,911 | | | 5,353 | | |
| Derivative fees and other income | | 6,663 |
| | 5,791 |
| | 12,934 |
| | 9,778 |
| |
| Net gains on sales of loans | | 2,361 |
| | 2,158 |
| | 6,660 |
| | 6,965 |
| Net gains on sales of loans | | 1,781 | | | 950 | | |
| Net gains on sales of available-for-sale investment securities | | 1,539 |
| | 1,790 |
| | 6,733 |
| | 8,468 |
| |
| Net gains on sales of fixed assets | | 1,043 |
| | 486 |
| | 74,092 |
| | 2,916 |
| |
| Net gain on sale of business | | 3,807 |
| | — |
| | 3,807 |
| | — |
| |
| Other fees and operating income | | 3,652 |
| | 7,632 |
| | 15,255 |
| | 19,745 |
| |
| Gains on sales of AFS debt securities | | Gains on sales of AFS debt securities | | 192 | | | 1,529 | | |
| | Other investment income | | Other investment income | | 925 | | | 3,378 | | |
| Other income | | Other income | | 2,794 | | | 3,184 | | |
| Total noninterest income | | 49,624 |
| | 49,341 |
| | 213,047 |
| | 134,118 |
| Total noninterest income | | 72,866 | | | 55,506 | | |
| NONINTEREST EXPENSE | | | | | | |
| | |
| NONINTEREST EXPENSE | | | | | |
| Compensation and employee benefits | | 79,583 |
| | 75,042 |
| | 244,930 |
| | 220,166 |
| Compensation and employee benefits | | 107,808 | | | 101,960 | | |
| Occupancy and equipment expense | | 16,635 |
| | 15,456 |
| | 47,829 |
| | 45,619 |
| Occupancy and equipment expense | | 15,922 | | | 17,076 | | |
| Deposit insurance premiums and regulatory assessments | | 5,676 |
| | 6,450 |
| | 17,384 |
| | 17,341 |
| Deposit insurance premiums and regulatory assessments | | 3,876 | | | 3,427 | | |
| Deposit account expense | | Deposit account expense | | 3,892 | | | 3,563 | | |
| Data processing | | Data processing | | 4,478 | | | 3,826 | | |
| Computer software expense | | Computer software expense | | 7,159 | | | 6,166 | | |
| Consulting expense | | Consulting expense | | 1,475 | | | 1,217 | | |
| Legal expense | | 3,316 |
| | 5,361 |
| | 8,930 |
| | 12,714 |
| Legal expense | | 1,502 | | | 3,197 | | |
| Data processing | | 3,004 |
| | 2,729 |
| | 9,009 |
| | 8,712 |
| |
| Consulting expense | | 4,087 |
| | 4,594 |
| | 10,775 |
| | 19,027 |
| |
| Deposit related expense | | 2,413 |
| | 3,082 |
| | 7,283 |
| | 7,675 |
| |
| Computer software expense | | 4,393 |
| | 3,331 |
| | 13,823 |
| | 9,267 |
| |
| Other operating expense | | 19,830 |
| | 19,814 |
| | 55,357 |
| | 58,508 |
| Other operating expense | | 19,607 | | | 21,119 | | |
| Amortization of tax credit and other investments | | 23,827 |
| | 32,618 |
| | 66,059 |
| | 60,779 |
| Amortization of tax credit and other investments | | 25,358 | | | 18,782 | | |
| Amortization of core deposit intangibles | | 1,735 |
| | 2,023 |
| | 5,314 |
| | 6,177 |
| |
| | Total noninterest expense | | 164,499 |
| | 170,500 |
| | 486,693 |
| | 465,985 |
| Total noninterest expense | | 191,077 | | | 180,333 | | |
| INCOME BEFORE INCOME TAXES | | 175,284 |
| | 123,464 |
| | 560,973 |
| | 411,051 |
| INCOME BEFORE INCOME TAXES | | 235,484 | | | 164,010 | | |
| INCOME TAX EXPENSE | | 42,624 |
| | 13,321 |
| | 140,247 |
| | 90,108 |
| INCOME TAX EXPENSE | | 30,490 | | | 19,186 | | |
| NET INCOME | | $ | 132,660 |
| | $ | 110,143 |
| | $ | 420,726 |
| | $ | 320,943 |
| NET INCOME | | $ | 204,994 | | | $ | 144,824 | | |
| EARNINGS PER SHARE (“EPS”) | | | | | | | | | EARNINGS PER SHARE (“EPS”) | | | | | |
| BASIC | | $ | 0.92 |
| | $ | 0.76 |
| | $ | 2.91 |
| | $ | 2.23 |
| BASIC | | $ | 1.45 | | | $ | 1.00 | | |
| DILUTED | | $ | 0.91 |
| | $ | 0.76 |
| | $ | 2.88 |
| | $ | 2.21 |
| DILUTED | | $ | 1.44 | | | $ | 1.00 | | |
| WEIGHTED AVERAGE NUMBER OF SHARES OUTSTANDING | | | | | | | | | |
| WEIGHTED-AVERAGE NUMBER OF SHARES OUTSTANDING | | WEIGHTED-AVERAGE NUMBER OF SHARES OUTSTANDING | | |
| BASIC | | 144,498 |
| | 144,122 |
| | 144,412 |
| | 144,061 |
| BASIC | | 141,646 | | | 144,814 | | |
| DILUTED | | 145,882 |
| | 145,238 |
| | 145,849 |
| | 145,086 |
| DILUTED | | 142,844 | | | 145,285 | | |
| DIVIDENDS DECLARED PER COMMON SHARE | | $ | 0.20 |
| | $ | 0.20 |
| | $ | 0.60 |
| | $ | 0.60 |
| |
| | | |
See accompanying Notes to Consolidated Financial Statements.
64
EAST WEST BANCORP, INC. AND SUBSIDIARIES
CONSOLIDATED STATEMENTSSTATEMENT OF COMPREHENSIVE INCOME
($ in thousands)
(Unaudited)
| | | | | | | | | | | | | | | | | | | | |
|
| | Three Months Ended March 31, | | | | |
| | 2021 | | 2020 | | | | | | |
| Net income | | $ | 204,994 | | | $ | 144,824 | | | | | | | |
| Other comprehensive (loss) income, net of tax: | | | | | | | | | | |
| Net changes in unrealized (losses) gains on AFS debt securities | | (133,448) | | | 27,453 | | | | | | | |
| Net changes in unrealized gains on cash flow hedges | | 432 | | | 0 | | | | | | | |
| Foreign currency translation adjustments | | (1,349) | | | (2,164) | | | | | | | |
| Other comprehensive (loss) income | | (134,365) | | | 25,289 | | | | | | | |
| COMPREHENSIVE INCOME | | $ | 70,629 | | | $ | 170,113 | | | | | | | |
|
|
| | | | | | | | | | | | | | | | |
| |
| | | Three Months Ended
September 30, | | Nine Months Ended
September 30, |
| | | 2017 | | 2016 | | 2017 | | 2016 |
| Net income | | $ | 132,660 |
| | $ | 110,143 |
| | $ | 420,726 |
| | $ | 320,943 |
|
| Other comprehensive income (loss), net of tax: | | | | | | | | |
| Net change in unrealized (losses) gains on available-for-sale investment securities | | (1,906 | ) | | (4,907 | ) | | 7,916 |
| | 12,993 |
|
| Foreign currency translation adjustments | | 3,870 |
| | (555 | ) | | 8,013 |
| | (5,226 | ) |
| Other comprehensive income (loss) | | 1,964 |
| | (5,462 | ) | | 15,929 |
| | 7,767 |
|
| COMPREHENSIVE INCOME | | $ | 134,624 |
| | $ | 104,681 |
| | $ | 436,655 |
| | $ | 328,710 |
|
| |
See accompanying Notes to Consolidated Financial Statements.
75
EAST WEST BANCORP, INC. AND SUBSIDIARIES
CONSOLIDATED STATEMENTSSTATEMENT OF CHANGES IN STOCKHOLDERS’ EQUITY
($ in thousands, except share data)shares)
|
| | | | | | | | | | | | | | | | | | | | | | | |
| |
| | | Common Stock and Additional Paid-in Capital | | Retained Earnings | | Treasury Stock | | Accumulated Other Comprehensive Loss, Net of Tax | | Total Stockholders’ Equity |
| | | Shares | | Amount | | | | |
| BALANCE, JANUARY 1, 2016 | | 143,909,233 |
| | $ | 1,701,459 |
| | $ | 1,872,594 |
| | $ | (436,162 | ) | | $ | (14,941 | ) | | $ | 3,122,950 |
|
| Net income | | — |
| | — |
| | 320,943 |
| | — |
| | — |
| | 320,943 |
|
| Other comprehensive income | | — |
| | — |
| | — |
| | — |
| | 7,767 |
| | 7,767 |
|
| Stock compensation costs | | — |
| | 13,973 |
| | — |
| | — |
| | — |
| | 13,973 |
|
| Net activity of common stock pursuant to various stock compensation plans and agreements, and related tax benefits | | 224,071 |
| | 2,981 |
| | — |
| | (3,144 | ) | | — |
| | (163 | ) |
| Cash dividends on common stock | | — |
| | — |
| | (87,416 | ) | | — |
| | — |
| | (87,416 | ) |
| BALANCE, SEPTEMBER 30, 2016 | | 144,133,304 |
| | $ | 1,718,413 |
| | $ | 2,106,121 |
| | $ | (439,306 | ) | | $ | (7,174 | ) | | $ | 3,378,054 |
|
| BALANCE, JANUARY 1, 2017 | | 144,167,451 |
| | $ | 1,727,598 |
| | $ | 2,187,676 |
| | $ | (439,387 | ) | | $ | (48,146 | ) | | $ | 3,427,741 |
|
| Net income | | — |
| | — |
| | 420,726 |
| | — |
| | — |
| | 420,726 |
|
| Other comprehensive income | | — |
| | — |
| | — |
| | — |
| | 15,929 |
| | 15,929 |
|
| Stock compensation costs | | — |
| | 15,780 |
| | — |
| | — |
| | — |
| | 15,780 |
|
| Net activity of common stock pursuant to various stock compensation plans and agreements | | 343,492 |
| | 1,968 |
| | — |
| | (12,663 | ) | | — |
| | (10,695 | ) |
| Cash dividends on common stock | | — |
| | — |
| | (87,585 | ) | | — |
| | — |
| | (87,585 | ) |
| BALANCE, SEPTEMBER 30, 2017 | | 144,510,943 |
| | $ | 1,745,346 |
| | $ | 2,520,817 |
| | $ | (452,050 | ) | | $ | (32,217 | ) | | $ | 3,781,896 |
|
| |
| | | | | | | | | | | | | | | | | | | | | | | | | | | | | | | | | | | | | | |
|
| | Common Stock and
Additional Paid-in Capital | | Retained Earnings | | Treasury Stock | | AOCI,
Net of Tax | | Total
Stockholders’ Equity |
| | Shares | | Amount | | | | |
| BALANCE, JANUARY 1, 2020 | | 145,625,385 | | | $ | 1,826,512 | | | $ | 3,689,377 | | | $ | (479,864) | | | $ | (18,408) | | | $ | 5,017,617 | |
Cumulative-effect of change in accounting principle related to credit losses (1) | | — | | | — | | | (97,967) | | | — | | | — | | | (97,967) | |
| Net income | | — | | | — | | | 144,824 | | | — | | | — | | | 144,824 | |
| Other comprehensive income | | — | | | — | | | — | | | — | | | 25,289 | | | 25,289 | |
| | | | | | | | | | | | |
| | | | | | | | | | | | |
| | | | | | | | | | | | |
| Net activity of common stock pursuant to various stock compensation plans and agreements | | 281,396 | | | 7,272 | | | — | | | (7,609) | | | — | | | (337) | |
| Repurchase of common stock pursuant to the Stock Repurchase Program | | (4,471,682) | | | — | | | — | | | (145,966) | | | — | | | (145,966) | |
| Cash dividends on common stock ($0.275 per share) | | — | | | — | | | (40,475) | | | — | | | — | | | (40,475) | |
| BALANCE, MARCH 31, 2020 | | 141,435,099 | | | $ | 1,833,784 | | | $ | 3,695,759 | | | $ | (633,439) | | | $ | 6,881 | | | $ | 4,902,985 | |
| BALANCE, JANUARY 1, 2021 | | 141,565,229 | | | $ | 1,858,519 | | | $ | 4,000,414 | | | $ | (634,083) | | | $ | 44,325 | | | $ | 5,269,175 | |
| | | | | | | | | | | | |
| Net income | | — | | | — | | | 204,994 | | | — | | | — | | | 204,994 | |
| Other comprehensive income | | — | | | — | | | — | | | — | | | (134,365) | | | (134,365) | |
| | | | | | | | | | | | |
| | | | | | | | | | | | |
| | | | | | | | | | | | |
| Net activity of common stock pursuant to various stock compensation plans and agreements | | 277,807 | | | 7,582 | | | — | | | (14,983) | | | — | | | (7,401) | |
| | | | | | | | | | | | |
| Cash dividends on common stock ($0.330 per share) | | — | | | — | | | (47,376) | | | — | | | — | | | (47,376) | |
| BALANCE, MARCH 31, 2021 | | 141,843,036 | | | $ | 1,866,101 | | | $ | 4,158,032 | | | $ | (649,066) | | | $ | (90,040) | | | $ | 5,285,027 | |
| | | | | | | | | | | | |
(1)Represents the impact of the adoption of Accounting Standards Update (“ASU”) 2016-13, Financial Instruments — Credit Losses (Topic 326) on January 1, 2020.
See accompanying Notes to Consolidated Financial Statements.
86
EAST WEST BANCORP, INC. AND SUBSIDIARIES
CONSOLIDATED STATEMENTSSTATEMENT OF CASH FLOWS
($ in thousands)
(Unaudited)
| | | | | | | | | | | | | | | | |
|
| | Three Months Ended March 31, | | |
| | 2021 | | 2020 | | |
| CASH FLOWS FROM OPERATING ACTIVITIES | | | | | | |
| Net income | | $ | 204,994 | | | $ | 144,824 | | | |
| Adjustments to reconcile net income to net cash provided by operating activities: | | | | | | |
| Depreciation and amortization | | 37,490 | | | 31,186 | | | |
| Amortization of premiums and accretion of discount , net | | 5,770 | | | (4,519) | | | |
| Stock compensation costs | | 7,817 | | | 7,209 | | | |
| Deferred income tax benefit | | 224 | | | 28 | | | |
| Provision for credit losses | | 0 | | | 73,870 | | | |
| Net gains on sales of loans | | (1,781) | | | (950) | | | |
| Gains on sales of AFS debt securities | | (192) | | | (1,529) | | | |
| | | | | | |
| | | | | | |
| Loans held-for-sale: | | | | | | |
| Originations and purchases | | (5,718) | | | (5,802) | | | |
| Proceeds from sales and paydowns/payoffs of loans originally classified as held-for-sale | | 7,644 | | | 4,657 | | | |
| | | | | | |
| | | | | | |
| Proceeds from distributions received from equity method investees | | 2,505 | | | 973 | | | |
| Net change in accrued interest receivable and other assets | | 185,677 | | | (462,766) | | | |
| Net change in accrued expenses and other liabilities | | (72,935) | | | 304,680 | | | |
| Other net operating activities | | 20 | | | (158) | | | |
| Total adjustments | | 166,521 | | | (53,121) | | | |
| Net cash provided by operating activities | | 371,515 | | | 91,703 | | | |
| CASH FLOWS FROM INVESTING ACTIVITIES | | | | | | |
| Net (increase) decrease in: | | | | | | |
| Investments in qualified affordable housing partnerships, tax credit and other investments | | (52,756) | | | (27,581) | | | |
| Interest-bearing deposits with banks | | 29,000 | | | (115,419) | | | |
| Resale agreements: | | | | | | |
| Proceeds from paydowns and maturities | | 223,952 | | | 250,000 | | | |
| Purchases | | (923,990) | | | 0 | | | |
| AFS debt securities: | | | | | | |
| Proceeds from sales | | 46,397 | | | 306,463 | | | |
| Proceeds from repayments, maturities and redemptions | | 473,808 | | | 308,620 | | | |
| Purchases | | (2,969,640) | | | (987,130) | | | |
| Loans held-for-investment: | | | | | | |
| Proceeds from sales of loans originally classified as held-for-investment | | 147,115 | | | 110,945 | | | |
| Purchases | | (311,030) | | | (133,185) | | | |
| Other changes in loans held-for-investment, net | | (1,046,727) | | | (1,116,358) | | | |
| | | | | | |
| | | | | | |
| Purchases of premises and equipment | | (1,563) | | | (916) | | | |
| | | | | | |
| | | | | | |
| | | | | | |
| | | | | | |
| Proceeds from distributions received from equity method investees | | 2,832 | | | 374 | | | |
| | | | | | |
| Other net investing activities | | (1,307) | | | (1,143) | | | |
| Net cash used in investing activities | | (4,383,909) | | | (1,405,330) | | | |
| | | | | | |
| | | | | | |
| | | | | | |
| | | | | | |
| | | | | | |
| | | | | | |
| | | | | | |
| | | | | | |
| | | | | | |
| | | | | | |
| | | | | | |
| | | | | | |
| | | | | | |
| | | | | | |
| | | | | | |
| | | | | | |
| | | | | | |
| | | | | | |
| | | | | | |
| | | | | | |
| | | | | | |
| | | | | | |
| | | | | | |
| | | | | | |
| | | | | | |
|
| | | | | | | | |
| |
| | | Nine Months Ended September 30, |
| | | 2017 | | 2016 |
| CASH FLOWS FROM OPERATING ACTIVITIES | | |
| | |
|
| Net income | | $ | 420,726 |
| | $ | 320,943 |
|
| Adjustments to reconcile net income to net cash provided by operating activities: | | |
| | |
|
| Depreciation and amortization | | 123,008 |
| | 98,561 |
|
| Accretion of discount and amortization of premiums, net | | (19,237 | ) | | (37,881 | ) |
| Stock compensation costs | | 15,780 |
| | 13,973 |
|
| Deferred income tax (benefit) expense | | (14,500 | ) | | 3,730 |
|
| Provision for credit losses | | 30,749 |
| | 17,018 |
|
| Net gains on sales of loans | | (6,660 | ) | | (6,965 | ) |
| Net gains on sales of available-for-sale investment securities | | (6,733 | ) | | (8,468 | ) |
| Net gains on sales of premises and equipment | | (74,092 | ) | | (2,916 | ) |
| Net gain on sale of business | | (3,807 | ) | | — |
|
| Originations and purchases of loans held-for-sale | | (15,069 | ) | | (10,901 | ) |
| Proceeds from sales and paydowns/payoffs in loans held-for-sale | | 15,792 |
| | 15,065 |
|
| Net change in accrued interest receivable and other assets | | 105,729 |
| | (2,591 | ) |
| Net change in accrued expenses and other liabilities | | 95,432 |
| | 19,217 |
|
| Other net operating activities | | (2,135 | ) | | (1,181 | ) |
| Total adjustments | | 244,257 |
| | 96,661 |
|
| Net cash provided by operating activities | | 664,983 |
| | 417,604 |
|
| CASH FLOWS FROM INVESTING ACTIVITIES | | |
| | |
|
| Net increase in: | | |
| | |
|
| Loans held-for-investment | | (2,967,873 | ) | | (776,277 | ) |
| Interest-bearing deposits with banks | | (74,254 | ) | | (13,469 | ) |
| Investments in qualified affordable housing partnerships, tax credit and other investments, net | | (121,590 | ) | | (57,742 | ) |
| Purchases of: | | |
| | |
|
| Resale agreements | | (550,000 | ) | | (1,150,000 | ) |
| Available-for-sale investment securities | | (501,669 | ) | | (1,330,724 | ) |
| Loans held-for-investment | | (441,141 | ) | | (1,038,083 | ) |
| Premises and equipment | | (11,598 | ) | | (10,412 | ) |
| Proceeds from sale of: | | |
| | |
|
| Available-for-sale investment securities | | 676,776 |
| | 1,008,256 |
|
| Loans held-for-investment | | 448,679 |
| | 545,256 |
|
| Other real estate owned (“OREO”) | | 5,431 |
| | 3,271 |
|
| Premises and equipment | | 116,021 |
| | 8,163 |
|
| Business, net of cash transferred | | 3,633 |
| | — |
|
| Paydowns and maturities of resale agreements | | 1,000,000 |
| | 1,450,000 |
|
| Repayments, maturities and redemptions of available-for-sale investment securities | | 323,463 |
| | 870,965 |
|
| Other net investing activities | | 27,914 |
| | 17,527 |
|
| Net cash used in investing activities | | (2,066,208 | ) | | (473,269 | ) |
| CASH FLOWS FROM FINANCING ACTIVITIES | | |
| | |
|
| Net increase (decrease) in: | | |
| | |
|
| Customer deposits | | 1,385,625 |
| | 1,130,022 |
|
| Short-term borrowings | | (36,604 | ) | | 37,699 |
|
| Proceeds from: | | | | |
| Issuance of common stock pursuant to various stock compensation plans and agreements | | 1,008 |
| | 1,962 |
|
| Payments for: | | |
| | |
|
| Repayment of FHLB advances | | — |
| | (700,000 | ) |
| Repayment of long-term debt | | (10,000 | ) | | (15,000 | ) |
| Repurchase of vested shares due to employee tax liability | | (12,663 | ) | | (3,144 | ) |
| Cash dividends on common stock | | (87,880 | ) | | (86,984 | ) |
| Other net financing activities | | — |
| | 1,019 |
|
| Net cash provided by financing activities | | 1,239,486 |
| | 365,574 |
|
| Effect of exchange rate changes on cash and cash equivalents | | 19,985 |
| | (3,964 | ) |
| NET (DECREASE) INCREASE IN CASH AND CASH EQUIVALENTS | | (141,754 | ) | | 305,945 |
|
| CASH AND CASH EQUIVALENTS, BEGINNING OF PERIOD | | 1,878,503 |
| | 1,360,887 |
|
| CASH AND CASH EQUIVALENTS, END OF PERIOD | | $ | 1,736,749 |
| | $ | 1,666,832 |
|
| |
See accompanying Notes to Consolidated Financial Statements.
97
EAST WEST BANCORP, INC. AND SUBSIDIARIES
CONSOLIDATED STATEMENTSSTATEMENT OF CASH FLOWS
($ in thousands)
(Unaudited)
|
| | | | | | | | |
| |
| | | Nine Months Ended September 30, |
| | | 2017 | | 2016 |
| SUPPLEMENTAL CASH FLOW INFORMATION: | | | | |
| Cash paid during the period for: | | |
| | |
|
| Interest paid | | $ | 98,409 |
| | $ | 76,750 |
|
| Income taxes paid | | $ | 11,800 |
| | $ | 20,652 |
|
| Noncash investing and financing activities: | | |
| | |
|
| Loans transferred from held-for-investment to held-for-sale | | $ | 418,489 |
| | $ | 720,670 |
|
| Investment security transferred from held-to-maturity to available-for-sale | | $ | 115,615 |
| | $ | — |
|
| Held-to-maturity investment security retained from securitization of loans | | $ | — |
| | $ | 160,135 |
|
| Loans transferred to OREO | | $ | 456 |
| | $ | 6,086 |
|
| | | | | |
| | | | | | | | | | | | | | | | |
|
| | Three Months Ended March 31, | | |
| | 2021 | | 2020 | | |
| | | | | | |
| | | | | | |
| | | | | | |
| | | | | | |
| | | | | | |
| | | | | | |
| | | | | | |
| | | | | | |
| | | | | | |
| | | | | | |
| | | | | | |
| | | | | | |
| | | | | | |
| | | | | | |
| | | | | | |
| | | | | | |
| | | | | | |
| | | | | | |
| | | | | | |
| | | | | | |
| | | | | | |
| | | | | | |
| | | | | | |
| | | | | | |
| | | | | | |
| | | | | | |
| | | | | | |
| | | | | | |
| | | | | | |
| | | | | | |
| | | | | | |
| | | | | | |
| | | | | | |
| | | | | | |
| | | | | | |
| | | | | | |
| | | | | | |
| | | | | | |
| | | | | | |
| | | | | | |
| | | | | | |
| | | | | | |
| | | | | | |
| | | | | | |
| | | | | | |
| | | | | | |
| | | | | | |
| | | | | | |
| | | | | | |
| CASH FLOWS FROM FINANCING ACTIVITIES | | | | | | |
| Net increase in deposits | | 4,559,929 | | | 1,374,287 | | | |
| Net (decrease) increase in short-term borrowings | | (21,143) | | | 39,962 | | | |
| | | | | | |
| | | | | | |
| | | | | | |
| Repayment of FHLB advances | | 0 | | | (99,999) | | | |
| | | | | | |
| | | | | | |
| | | | | | |
| | | | | | |
| | | | | | |
| | | | | | |
| Repayment of long-term debt and lease liabilities | | (315) | | | (289) | | | |
| Common stock: | | | | | | |
| Repurchase of common stocks pursuant to the Stock Repurchase Program | | 0 | | | (145,966) | | | |
| | | | | | |
| Stocks tendered for payment of withholding taxes | | (14,983) | | | (7,609) | | | |
| Cash dividends paid | | (48,213) | | | (41,358) | | | |
| Net cash provided by financing activities | | 4,475,275 | | | 1,119,028 | | | |
| Effect of exchange rate changes on cash and cash equivalents | | 138,281 | | | 13,492 | | | |
| NET INCREASE (DECREASE) IN CASH AND CASH EQUIVALENTS | | 601,162 | | | (181,107) | | | |
| CASH AND CASH EQUIVALENTS, BEGINNING OF PERIOD | | 4,017,971 | | | 3,261,149 | | | |
| CASH AND CASH EQUIVALENTS, END OF PERIOD | | $ | 4,619,133 | | | $ | 3,080,042 | | | |
| | | | | | |
| SUPPLEMENTAL CASH FLOW INFORMATION | | | | | | |
| Cash paid during the period for: | | | | | | |
| Interest | | $ | 29,680 | | | $ | 88,520 | | | |
| Income taxes, net | | $ | 0 | | | $ | 2,904 | | | |
| Noncash investing and financing activities: | | | | | | |
| | | | | | |
| Loans transferred from held-for-investment to held-for-sale | | $ | 145,872 | | | $ | 110,223 | | | |
| | | | | | |
| | | | | | |
| | | | | | |
| | | | | | |
| Loans transferred to other real estate owned (“OREO”) and other nonperforming assets | | $ | 10,360 | | | $ | 23,394 | | | |
|
See accompanying Notes to Consolidated Financial Statements.
108
EAST WEST BANCORP, INC. AND SUBSIDIARIES
NOTES TO CONSOLIDATED FINANCIAL STATEMENTS
(Unaudited)
Note 1—Basis of Presentation
East West Bancorp, Inc. (referred to herein on an unconsolidated basis as “East West” and on a consolidated basis as the “Company”) is a registered bank holding company that offers a full range of banking services to individuals and businesses through its subsidiary bank, East West Bank and its subsidiaries (“East West Bank” or the “Bank”). The unaudited interim Consolidated Financial Statements in this Quarterly Report on Form 10-Q (“this Form 10-Q”) include the accounts of East West, East West Bank and East West’s various subsidiaries. Intercompany transactions and accounts have been eliminated in consolidation. As of September 30, 2017,March 31, 2021, East West also has six wholly-owned6 wholly owned subsidiaries that are statutory business trusts (the “Trusts”). In accordance with FASBFinancial Accounting Standards Board (“FASB”) Accounting Standards Codification (“ASC”) Topic 810,Consolidation, the Trusts are not included on the Consolidated Financial Statements.
The unaudited interim Consolidated Financial Statements are presented in accordance with United States Generally Accepted Accounting Principles (“U.S.”) generally accepted accounting principles (“GAAP”), applicable guidelines prescribed by regulatory authorities and general practices in the banking industry,industry. They reflect all adjustments that, in the opinion of management, are necessary for fair statementpresentation of the interim period Consolidated Financial Statements. Certain items on the Consolidated Financial Statements and notes for the prior periods have been reclassified to conform to the current period presentation.
The current period’s results of operations are not necessarily indicative of results that may be expected for any otherfuture interim period or for the year as a whole. Events subsequent to the Consolidated Balance Sheet date have been evaluated through the date the Consolidated Financial Statements are issued for inclusion in the accompanying Consolidated Financial Statements. The unaudited interim Consolidated Financial Statements should be read in conjunction with the audited Consolidated Financial Statements and notes thereto included in the Company’s 2016annual report on Form 10-K.10-K for the year ended December 31, 2020, filed with the U.S. Securities and Exchange Commission on February 26, 2021 (the “Company’s 2020 Form 10-K”).
Note 2 — Current Accounting Developments
New Accounting Pronouncements Adopted
| | | | | | | | | | | |
| Standard | Required Date of Adoption | Description | Effect on Financial Statements |
| Standards Adopted in 2021 |
ASU 2020-04, Reference Rate Reform (Topic 848): Facilitation of the Effects of Reference Rate Reform on Financial Reporting and subsequent related ASU 2021-01, Reference Rate Reform (Topic 848): Scope
| Effective for all entities from the dates of issuance through December 31, 2022. | In March 2020, the FASB issued an ASU related to contracts or hedging relationships that reference London Interbank Offered Rate (“LIBOR”) or other reference rates that are expected to be discontinued due to reference rate reform. This ASU provides temporary optional expedients and exceptions regarding the accounting requirements related to the modification of certain contracts, hedging relationships and other transactions that are affected by the reference rate reform. The guidance permits the Company to make a one-time election to sell and/or transfer qualifying held-to-maturity securities, and not to apply modification accounting or remeasure lease payments in lease contracts if the changes to the contract are related to the discontinuation of the reference rate. If certain criteria are met, the amendments also allow exceptions to the de-designation criteria of the hedging relationships and the assessment of hedge effectiveness during the transition period. This one time election may be made at any time after March 12, 2020, but no later than December 31, 2022. In January 2021, the FASB issued ASU 2021-01 as subsequent amendments, which expanded the scope of Topic 848 to include all affected derivatives and clarified certain optional expedients and exceptions regarding the hedge accounting for derivative contracts affected by the discounting transition.
The amendments of this guidance could be elected retrospectively or prospectively to new modifications made on or after the date of issuance of this ASU, January 7, 2021. | The Company adopted this guidance on a prospective basis in January 2021. At the time of adoption, the guidance did not have a material impact on the Company’s Consolidated Financial Statements. The Company will continue to track the exposure as of each reporting period and to assess the impact as the reference rate transition occurs through the cessation of LIBOR. |
ASU 2019-12, Income Taxes (Topic 740): Simplifying the Accounting for Income Taxes | January 1, 2021
Early adoption is permitted on January 1, 2020. | This ASU simplifies the accounting for income taxes by removing certain exceptions to the existing guidance. This includes removing exceptions to: 1) the incremental approach for intraperiod tax allocation, 2) the requirement to recognize a deferred tax liability for equity method investments when a foreign subsidiary becomes an equity method investment, 3) the ability not to recognize a deferred tax liability when a foreign equity method investment becomes a subsidiary, and 4) the general methodology for calculating income taxes in an interim period when a year-to-date loss exceeds the anticipated loss for the year.
In addition, this ASU simplifies the accounting for income taxes related to franchise taxes, the tax basis of goodwill and the method for recognizing an enacted change in tax laws. This ASU also specifies that an entity is not required to allocate the consolidated amount of tax expense to a legal entity that is not subject to tax in its separate financial statements. This ASU also makes improvements in the accounting for income taxes related to employee stock ownership plans and equity method investments in qualified affordable housing projects.
This guidance should be applied on either a retrospective, modified retrospective or prospective basis depending on the amendments. | The Company adopted this guidance in January 2021 using the transition guidance prescribed by this ASU. At the time of adoption, this guidance did not have a material impact on the Company’s Consolidated Financial Statements. |
| | | |
| | | |
In March 2016, the FASB issued Accounting Standards Update (“ASU”) 2016-05, Derivatives and Hedging (Topic 815): Effect of Derivative Contract Novations on Existing Hedge Accounting Relationships, to clarify that a change in the counterparty to a derivative instrument that has been designated as the hedging instrument in an existing hedging relationship would not be considered a termination of the derivative instrument or a change in a critical term of the hedging relationship provided that all other hedge accounting criteria in ASC 815 continue to be met. This clarification applies to both cash flow and fair value hedging relationships. The Company adopted this guidance prospectively in the first quarter of 2017. The adoption of this guidance did not have an impact on the Company’s Consolidated Financial Statements.
In March 2016, the FASB issued ASU 2016-06, Derivatives and Hedging (Topic 815): Contingent Put and Call Options in Debt Instruments, which requires an entity to use a four-step decision model when assessing contingent call (put) options that can accelerate the payment of principal on debt instruments to determine whether they are clearly and closely related to their debt hosts. The Company adopted this guidance on a modified retrospective basis in the first quarter of 2017. The adoption of this guidance did not have an impact on the Company’s Consolidated Financial Statements.
In March 2016, the FASB issued ASU 2016-07, Investments — Equity Method and Joint Ventures (Topic 323):Simplifying the Transition to the Equity Method of Accounting, to eliminate the requirement for an investor to retroactively apply the equity method when its increase in ownership interest (or degree of influence) in an investee triggers equity method accounting. The amendments in ASU 2016-07 also require that an entity that has an available-for-sale equity security that becomes qualified for the equity method of accounting recognize through earnings the unrealized holding gain or loss in accumulated other comprehensive income (loss) (“AOCI”) at the date the investment becomes qualified for use of the equity method. The Company adopted this guidance prospectively in the first quarter of 2017. The adoption of this guidance did not have an impact on the Company’s Consolidated Financial Statements.
In March 2016, the FASB issued ASU 2016-09, Compensation — Stock Compensation (Topic 718): Improvements to Employee Share-Based Payment Accounting, to simplify several aspects of the accounting for share-based payment transactions, including the income tax consequences, classification of awards as either equity or liabilities and classification in the statements of cash flows. The Company adopted this guidance in the first quarter of 2017. The changes that impacted the Company included a requirement that excess tax benefits and deficiencies be recognized as a component of Income tax expense on the Consolidated Statements of Income rather than Additional paid-in capital on the Consolidated Statements of Changes in Stockholders’ Equity as required in the previous guidance. The adoption of this guidance results in increased volatility to the Company’s income tax expense, but does not have a material impact on the Consolidated Balance Sheets or the Consolidated Statements of Changes in Stockholders’ Equity. The income tax expense volatility is dependent on the Company’s stock price on the dates the restricted stock units (“RSUs”) vest, which occur primarily in the first quarter of each year. Net excess tax benefits for RSUs of $4.6 million have been recognized by the Company as a component of Income tax expense on the Consolidated Statements of Income during the nine months ended September 30, 2017. The guidance also removes the impact of the excess tax benefits and deficiencies from the calculation of diluted EPS. In addition, ASU 2016-09 no longer requires a presentation of excess tax benefits and deficiencies as both an operating outflow and a financing inflow on the Consolidated Statements of Cash Flows. Instead, excess tax benefits and deficiencies are recorded along with other income tax cash flows as an operating activity. These changes to the guidance were applied on a prospective basis. The Company has also elected to retain its existing accounting policy election to estimate award forfeitures.
Recent Accounting Pronouncements
In May 2014, the FASB issued ASU 2014-09, Revenue from Contracts with Customers (Topic 606), which clarifies the principles for recognizing revenue for contracts to provide goods or services to customers and will replace most existing revenue recognition guidance in the U.S. GAAP when it becomes effective. Quantitative and qualitative disclosures regarding the nature, amount, timing and uncertainty of revenue and cash flows arising from contracts with customers are also required. ASU 2014-09 is effective on January 1, 2018. The guidance should be applied on either a modified retrospective or full retrospective basis. The Company’s revenue is mainly comprised of net interest income and noninterest income. The scope of the guidance explicitly excludes net interest income, as well as other revenues from financial instruments such as loans, leases, securities and derivatives. The Company has completed a comprehensive scoping exercise to determine the revenue streams that are in the scope of the guidance and the review of its contracts to ascertain whether certain noninterest income revenue items are within the scope of the new guidance. Based on the completed contract reviews thus far, the adoption of this guidance is not expected to have a material impact on its Consolidated Balance Sheets or Consolidated Statements of Income. The next phase of the Company’s implementation work will be to evaluate any changes that may be required to its applicable disclosures.
In January 2016, the FASB issued ASU 2016-01, Financial Instruments — Overall (Subtopic 825-10): Recognition and Measurement of Financial Assets and Financial Liabilities, which requires equity investments, except those accounted for under the equity method of accounting or consolidated, to be measured at fair value with changes recognized in net income, thus eliminating eligibility for the current available-for-sale category. If there is no readily determinable fair value, the guidance allows entities to measure equity investments at cost less impairment, whereby impairment is based on a qualitative assessment. Furthermore, investments in Federal Reserve Bank and FHLB stock are not subject to this guidance and will continue to be presented at cost. The guidance eliminates the requirement to disclose the methods and significant assumptions used to estimate the fair value of financial instruments measured at amortized cost and changes the presentation of financial assets and financial liabilities on the Consolidated Balance Sheets or in the footnotes. If an entity has elected the fair value option to measure liabilities, the guidance requires the portion of the change in the fair value of a liability resulting from credit risk to be presented in Other comprehensive income. ASU 2016-01 is effective on January 1, 2018. Early adoption is not permitted except for certain specific changes under the fair value option guidance. The amendments related to equity securities without readily determinable fair values (including disclosure requirements) should be applied prospectively to equity investments that exist as of the adoption date. The Company does not have a significant amount of equity securities classified as available-for-sale. Additionally, the Company does not have any financial liabilities accounted for under the fair value option. For the guidance that is applicable to us, the accounting will be implemented on a modified retrospective basis through a cumulative-effect adjustment to the Consolidated Balance Sheets as of January 1, 2018, except for the guidance related to equity securities without readily determinable fair values, which should be applied on a prospective basis. The adoption of this guidance is not expected to have a material impact on the Company’s Consolidated Balance Sheets or Consolidated Statements of Income.
In February 2016, the FASB issued ASU 2016-02, Leases (Topic 842), which is intended to increase transparency and comparability in the accounting for lease transactions. The guidance requires lessees to recognize right-of-use assets and related lease liabilities for all leases with lease terms of more than 12 months on the Consolidated Balance Sheets, and provide quantitative and qualitative disclosures regarding key information about the leasing arrangements. For short-term leases with a term of 12 months or less, lessees can make a policy election not to recognize lease assets and lease liabilities. Lessor accounting is largely unchanged. ASU 2016-02 is effective on January 1, 2019, with early adoption permitted. The guidance should be applied using a modified retrospective transition method through a cumulative-effect adjustment. The Company is currently evaluating the potential impact on its Consolidated Financial Statements by reviewing its existing lease contracts and service contracts that may include embedded leases. The Company expects the adoption of ASU 2016-02 to result in additional assets and liabilities, as the Company will be required to recognize operating leases on its Consolidated Balance Sheets. The Company does not expect a material impact to its recognition of operating lease expense on its Consolidated Statements of Income. Upon completion of the contract reviews and consideration of system requirements, the Company will evaluate the impacts of adopting the new accounting guidance on its disclosures.
In June 2016, the FASB issued ASU 2016-13, Financial Instruments — Credit Losses (Topic 326): Measurement of Credit Losses on Financial Instruments, to introduce a new approach based on expected losses to estimate credit losses on certain types of financial instruments, which modifies the impairment model for available-for-sale debt securities and provides for a simplified accounting model for purchased financial assets with credit deterioration since their origination. The new “expected credit loss” impairment model will apply to most financial assets measured at amortized cost and certain other instruments, including trade and other receivables, loan receivables, available-for-sale and held-to-maturity debt securities, net investments in leases and off-balance sheet credit exposures. For available-for-sale debt securities with unrealized losses, ASU 2016-13 does not change the measurement method of credit losses, except that the losses will be recognized as allowances rather than reductions in the amortized cost of the securities. ASU 2016-13 also expands the disclosure requirements regarding an entity’s assumptions, models and methods for estimating the allowance for loan and lease losses, and requires disclosure of the amortized cost balance for each class of financial asset by credit quality indicator, disaggregated by the year of origination (i.e., by vintage year). ASU 2016-13 is effective on January 1, 2020, with early adoption permitted on January 1, 2019. The guidance should be applied using a modified retrospective approach through a cumulative-effect adjustment to retained earnings as of the beginning of the reporting period of adoption. While the Company is still evaluating the impact on its Consolidated Financial Statements, the Company expects that ASU 2016-13 may result in an increase in the allowance for credit losses due to the following factors: 1) the allowance for credit losses provides for expected credit losses over the remaining expected life of the loan portfolio, and will consider expected future changes in macroeconomic conditions; 2) the nonaccretable difference on the purchased credit impaired (“PCI”) loans will be recognized as an allowance, offset by an increase in the carrying value of the PCI loans; and 3) an allowance may be established for estimated credit losses on available-for-sale and held-to-maturity debt securities. The amount of the increase will be impacted by the portfolio composition and quality, as well as the economic conditions and forecasts as of the adoption date. The Company has begun its implementation efforts by identifying key interpretive issues, assessing its processes and identifying the system requirements against the new guidance to determine what modifications may be required.
In August 2016, the FASB issued ASU 2016-15, Statement of Cash Flows (Topic 230): Classification of Certain Cash Receipts and Cash Payments, to provide guidance on eight specific issues related to classification on the Consolidated Statements of Cash Flows in order to reduce diversity in practice. The specific issues cover cash payments for debt prepayment or debt extinguishment costs; cash outflows for settlement of zero-coupon debt instruments or other debt instruments with coupon interest rates that are insignificant in relation to the effective interest rate of the borrowing; contingent consideration payments that are not made soon after a business combination; proceeds from the settlement of insurance claims; proceeds from the settlement of corporate-owned life insurance policies, including bank-owned life insurance policies; distributions received from equity method investees; beneficial interests received in securitization transactions; and clarification regarding when no specific U.S. GAAP guidance exists and the sources of the cash flows are not separately identifiable, the classification should be based on the activity that is likely to be the predominant source or use of the cash flows. ASU 2016-15 is effective on January 1, 2018, with early adoption permitted. The guidance should be applied using a retrospective transition method. The Company does not expect the adoption of this guidance to have a material impact on its Consolidated Financial Statements.
In November 2016, the FASB issued ASU 2016-18, Statement of Cash Flows (Topic 230): Restricted Cash, whichrequires the Company to include those amounts that are deemed to be restricted cash and restricted cash equivalents in its cash and cash equivalent balances on the Consolidated Statements of Cash Flows. In addition, the Company is required to explain the changes in the combined total of restricted and unrestricted balances on the Consolidated Statements of Cash Flows. ASU 2016-18 is effective on January 1, 2018, with early adoption permitted. The guidance should be applied using a retrospective transition method to each period presented. The Company does not expect the adoption of this guidance to have a material impact on its Consolidated Financial Statements.
In January 2017, the FASB issued ASU 2017-04, Intangibles — Goodwill and Other (Topic 350): Simplifying the Test for Goodwill Impairment, to simplify the accounting for goodwill impairment. An entity will no longer perform a hypothetical purchase price allocation to measure goodwill impairment. Instead, impairment will be measured using the difference between the carrying amount and the fair value of the reporting unit. The guidance also eliminates the requirements for any reporting units with a zero or negative carrying amount to perform a qualitative assessment. ASU 2017-04 is effective on January 1, 2020 and should be applied prospectively. Early adoption is permitted for interim or annual goodwill impairment tests with measurement dates after January 1, 2017. The Company does not expect the adoption of this guidance to have a material impact on the Consolidated Financial Statements.
In March 2017, the FASB issued ASU 2017-08, Receivables — Nonrefundable Fees and Other Costs (Subtopic 310-20): Premium Amortization on Purchased Callable Debt Securities, which amends the amortization period for certain purchased callable debt securities held at a premium, shortening such period to the earliest call date. The guidance does not require any accounting changes for debt securities held at a discount; the discount continues to be amortized as an adjustment of yield over the contractual life (to maturity) of the instrument. ASU 2017-08 is effective on January 1, 2019, with early adoption permitted. The guidance should be applied using a modified retrospective transition method, with the cumulative-effect adjustment recognized to retained earnings as of the beginning of the period of adoption. The Company is currently evaluating the impact on its Consolidated Financial Statements.
In May 2017, the FASB issued ASU 2017-09, Compensation — Stock Compensation (Topic 718): Scope of Modification Accounting, which amends the scope of modification accounting for share-based payment arrangements. Specifically, an entity would not apply modification accounting if the fair value, vesting conditions and classification of the awards are the same immediately before and after the modification. ASU 2017-09 is effective on January 1, 2018, with early adoption permitted. The guidance should be applied prospectively to awards modified on or after the adoption date. The Company plans to adopt this guidance in the first quarter of 2018 prospectively.
In August 2017, the FASB issued ASU 2017-12, Derivatives and Hedging (Topic 815): Targeted Improvements to Accounting for Hedging Activities, which better aligns the Company’s risk management activities and financial reporting for hedging relationships through changes to both the description and measurement guidance for qualifying hedging relationships and the presentation of hedge results, expands and refines hedge accounting for both nonfinancial and financial risk components, and aligns the recognition and presentation of the effects of the hedging instrument and the hedged item on the Consolidated Financial Statements. ASU 2017-12 is effective on January 1, 2019, with early adoption permitted. Upon adoption, the guidance should be applied using a retrospective transition method to any existing cash flows or net investment hedges through a cumulative-effect adjustment to AOCI to eliminate the separate measurement of ineffectiveness. The amended presentation and disclosure guidance is applied prospectively. The Company is currently evaluating the impact on its Consolidated Financial Statements.
Note 3 — Dispositions
In the first quarter of 2017, the Company completed the sale and leaseback of a commercial property in San Francisco, California for cash consideration of $120.6 million and entered into a leaseback with the buyer for part of the property, consisting of a retail branch and office facilities. The property had a net book value of $31.6 million at the time of sale, resulting in a pre-tax gain of $85.4 million after considering $3.6 million in selling costs. As the leaseback is an operating lease, $71.7 million of the gain was recognized on the closing date, and $13.7 million was deferred and will be recognized over the term of the lease agreement. The first quarter 2017 diluted EPS impact from the sale of the commercial property was $0.28 per share, net of tax.
In the third quarter of 2017, the Company sold its insurance brokerage business, East West Insurance Services, Inc., for $4.3 million, and recorded a pre-tax gain of $3.8 million. The third quarter 2017 diluted EPS impact from the sale of the Company’s insurance brokerage business was $0.02 per share, net of tax.
Note 4 —Fair Value Measurement and Fair Value of Financial Instruments
Fair Value Determination
Fair value is defined as the price that would be received to sell an asset or the price that would be paid to transfer a liability in an orderly transaction between market participants at the measurement date. In determining the fair value of financial instruments, the Company uses various methods including market and income approaches. Based on these approaches, the Company utilizes certain assumptions that market participants would use in pricing an asset or a liability. These inputs can be readily observable, market corroborated or generally unobservable. The Company utilizes valuation techniques that maximize the use of observable inputs and minimize the use of unobservable inputs. The fair value hierarchy noted below is based on the quality and reliability of the information used to determine fair value. The fair value hierarchy gives the highest priority to quoted prices available in active markets and the lowest priority to prices derived from data lacking transparency. The fair value of the Company’s assets and liabilities is classified and disclosed in one of the following three categories:
|
| | | |
• | Level 1 | — | Valuation is based on quoted prices for identical instruments traded in active markets. |
• | Level 2 | — | Valuation is based on quoted prices for similar instruments in active markets; quoted prices for identical or similar instruments in markets that are not active; and model-derived valuations whose inputs are observable and can be corroborated by market data. |
• | Level 3 | — | •Level 1 — Valuation is based on quoted prices for identical instruments traded in active markets. •Level 2 — Valuation is based on quoted prices for similar instruments traded in active markets; quoted prices for identical or similar instruments traded in markets that are not active; and model-derived valuations whose inputs are observable and can be corroborated by market data. •Level 3 — Valuation is based on significant unobservable inputs for determining the fair value of assets or liabilities. These significant unobservable inputs reflect assumptions that market participants may use in pricing the assets or liabilities. |
In determining the appropriate hierarchy levels,fair value of assets or liabilities. These significant unobservable inputs reflect assumptions that market participants may use in pricing the Company performs an analysisassets or liabilities.
The classification of the assets and liabilities thatwithin the hierarchy is based on whether inputs to the valuation methodology used are subject toobservable or unobservable, and the significance of those inputs in the fair value disclosure.measurement. The Company’s assets and liabilities are classified in their entirety based on the lowest level of input that is significant to their fair value measurements.
Assets and Liabilities Measured at Fair Value on a Recurring Basis
The following tables present financial assets and liabilities that are measured at fair value on a recurring basis as of September 30, 2017 and December 31, 2016:
|
| | | | | | | | | | | | | | | | | |
| | | | | | | | | | |
| | | Assets (Liabilities) Measured at Fair Value on a Recurring Basis
as of September 30, 2017 |
| ($ in thousands) | | Fair Value Measurements | | Quoted Prices in Active Markets for Identical Assets (Level 1) | | Significant Other Observable Inputs (Level 2) | | Significant Unobservable Inputs (Level 3) |
| Available-for-sale investment securities: | | |
| | |
| | |
| | |
| |
| U.S. Treasury securities | | $ | 526,332 |
| | $ | 526,332 |
| | $ | — |
| | $ | — |
| |
| U.S. government agency and U.S. government sponsored enterprise debt securities | | 189,185 |
| | — |
| | 189,185 |
| | — |
| |
| U.S. government agency and U.S. government sponsored enterprise mortgage-backed securities: | | |
| | |
| | |
| | |
| |
| Commercial mortgage-backed securities | | 315,172 |
| | — |
| | 315,172 |
| | — |
| |
| Residential mortgage-backed securities | | 1,150,934 |
| | — |
| | 1,150,934 |
| | — |
| |
| Municipal securities | | 117,242 |
| | — |
| | 117,242 |
| | — |
| |
| Non-agency residential mortgage-backed securities: | | |
| | |
| | |
| | |
| |
| Investment grade | | 9,694 |
| | — |
| | 9,694 |
| | — |
| |
| Corporate debt securities: | | |
| | |
| | |
| | |
| |
| Investment grade | | 2,327 |
| | — |
| | 2,327 |
| | — |
| |
| Non-investment grade | | 9,615 |
| | — |
| | 9,615 |
| | — |
| |
| Foreign bonds: | | | | | | | | | |
| Investment grade | | 489,140 |
| | — |
| | 489,140 |
| | — |
| |
| Other securities | | 147,135 |
| | 31,418 |
| | 102 |
| | 115,615 |
| (1) |
| Total available-for-sale investment securities | | $ | 2,956,776 |
| | $ | 557,750 |
| | $ | 2,283,411 |
| | $ | 115,615 |
| |
| | | | | | | | | | |
| Derivative assets: | | | | | | | | | |
| Interest rate swaps and options | | $ | 64,822 |
| | $ | — |
| | $ | 64,822 |
| | $ | — |
| |
| Foreign exchange contracts | | 14,187 |
| | — |
| | 14,187 |
| | — |
| |
| Credit risk participation agreements (“RPAs”) | | 2 |
| | — |
| | 2 |
| | — |
| |
| Warrants | | 1,455 |
| | — |
| | 856 |
| | 599 |
| |
| Total derivative assets | | $ | 80,466 |
| | $ | — |
| | $ | 79,867 |
| | $ | 599 |
| |
| | | | | | | | | | |
| Derivative liabilities: | | | | | | | | | |
| Interest rate swaps on certificates of deposit | | $ | (6,648 | ) | | $ | — |
| | $ | (6,648 | ) | | $ | — |
| |
| Interest rate swaps and options | | (64,212 | ) | | — |
| | (64,212 | ) | | — |
| |
| Foreign exchange contracts | | (20,054 | ) | | — |
| | (20,054 | ) | | — |
| |
| RPAs | | (1 | ) | | — |
| | (1 | ) | | — |
| |
| Total derivative liabilities | | $ | (90,915 | ) | | $ | — |
| | $ | (90,915 | ) | | $ | — |
| |
| | | | | | | | | | |
| |
(1) | During the third quarter of 2017, the Company transferred a non-agency commercial mortgage-backed security with a net carrying amount of $115.6 million from held- to-maturity to available-for-sale. |
|
| | | | | | | | | | | | | | | | |
| |
| | | Assets (Liabilities) Measured at Fair Value on a Recurring Basis
as of December 31, 2016 |
| ($ in thousands) | | Fair Value Measurements | | Quoted Prices in
Active Markets
for Identical
Assets
(Level 1) | | Significant
Other
Observable
Inputs
(Level 2) | | Significant Unobservable Inputs (Level 3) |
| Available-for-sale investment securities: | | |
| | |
| | |
| | |
|
| U.S. Treasury securities | | $ | 720,479 |
| | $ | 720,479 |
| | $ | — |
| | $ | — |
|
| U.S. government agency and U.S. government sponsored enterprise debt securities | | 274,866 |
| | — |
| | 274,866 |
| | — |
|
| U.S. government agency and U.S. government sponsored enterprise mortgage-backed securities: | | |
| | |
| | |
| | |
|
| Commercial mortgage-backed securities | | 266,799 |
| | — |
| | 266,799 |
| | — |
|
| Residential mortgage-backed securities | | 1,258,747 |
| | — |
| | 1,258,747 |
| | — |
|
| Municipal securities | | 147,654 |
| | — |
| | 147,654 |
| | — |
|
| Non-agency residential mortgage-backed securities: | | |
| | |
| | |
| | |
|
| Investment grade | | 11,477 |
| | — |
| | 11,477 |
| | — |
|
| Corporate debt securities: | | |
| | |
| | |
| | |
|
| Investment grade | | 222,377 |
| | — |
| | 222,377 |
| | — |
|
| Non-investment grade | | 9,173 |
| | — |
| | 9,173 |
| | — |
|
| Foreign bonds: | | | | | | | | |
| Investment grade | | 383,894 |
| | — |
| | 383,894 |
| | — |
|
| Other securities | | 40,329 |
| | 30,991 |
| | 9,338 |
| | — |
|
| Total available-for-sale investment securities | | $ | 3,335,795 |
| | $ | 751,470 |
| | $ | 2,584,325 |
| | $ | — |
|
| | | | | | | | | |
| Derivative assets: | | | | | | | | |
| Foreign currency forward contracts | | $ | 4,325 |
| | $ | — |
| | $ | 4,325 |
| | $ | — |
|
| Interest rate swaps and options | | 67,578 |
| | — |
| | 67,578 |
| | — |
|
| Foreign exchange contracts | | 11,874 |
| | — |
| | 11,874 |
| | — |
|
| RPAs | | 3 |
| | — |
| | 3 |
| | — |
|
| Total derivative assets | | $ | 83,780 |
| | $ | — |
| | $ | 83,780 |
| | $ | — |
|
| | | | | | | | | |
| Derivative liabilities: | | | | | | | | |
| Interest rate swaps on certificates of deposit | | $ | (5,976 | ) | | $ | — |
| | $ | (5,976 | ) | | $ | — |
|
| Interest rate swaps and options | | (65,131 | ) | | — |
| | (65,131 | ) | | — |
|
| Foreign exchange contracts | | (11,213 | ) | | — |
| | (11,213 | ) | | — |
|
| RPAs | | (3 | ) | | — |
| | (3 | ) | | — |
|
| Total derivative liabilities | | $ | (82,323 | ) | | $ | — |
| | $ | (82,323 | ) | | $ | — |
|
| | | | | | | | | |
At each reporting period, all assets and liabilities for which the fair value measurement is based on significant unobservable inputs are classified as Level 3. There were no assets or liabilities measured using significant unobservable inputs (Level 3) on a recurring basis as of December 31, 2016, and during the three and nine months ended September 30, 2016. The following table presents a reconciliation of the beginning and ending balances for other securities and warrants measured at fair value on a recurring basis using significant unobservable inputs (Level 3) for the three and nine months ended September 30, 2017:
|
| | | | | | | | | | | | | | | | |
| | | Three Months Ended September 30, 2017 | | Nine Months Ended September 30, 2017 |
| ($ in thousands) | | Other securities | | Warrants | | Other securities | | Warrants |
| Beginning balance | | $ | — |
| | $ | — |
| | $ | — |
| | $ | — |
|
| Issuances | | — |
| | 599 |
| | — |
| | 599 |
|
| Transfer from held-to-maturity investment security to available-for-sale investment security | | 115,615 |
| | — |
| | 115,615 |
| | — |
|
| Ending balance | | $ | 115,615 |
|
| $ | 599 |
|
| $ | 115,615 |
|
| $ | 599 |
|
| | | | | | | | | |
Transfers into or out of fair value hierarchy classifications are made if the significant inputs used in the financial models measuring the fair values of the assets and liabilities become unobservable or observable in the current marketplace. The Company’s policy, with respect to transfers between levels of the fair value hierarchy, is to recognize transfers into and out of each level as of the end of the reporting period. There were no transfers of assets and liabilities measured on a recurring basis into and out of Level 1, Level 2 and Level 3 during the three and nine months ended September 30, 2017 and 2016. During the three and nine months ended September 30, 2017, the Company transferred a non-agency commercial mortgage-backed security with a net carrying amount of $115.6 million from held-to-maturity to available-for-sale to reflect the Company’s intent to sell the security under active liquidity management.
The following table presents quantitative information about significant unobservable inputs used in the valuation of assets measured on a recurring basis classified as Level 3 as of September 30, 2017. Significant unobservable inputs presented in the table below are those that the Company considers significant to the fair value of the Level 3 assets or liabilities. The Company considers unobservable inputs to be significant if, by their exclusion, the fair value of the Level 3 assets or liabilities would be impacted by a predetermined percentage change.
|
| | | | | | | | | | |
| | | | | | | | | |
| ($ in thousands) | | Fair Value Measurements (Level 3) | | Valuation Technique | | Unobservable Input(s) | | Weighted Average |
Available-for-sale investment securities:
| | | | | | | | |
| Other securities | | $ | 115,615 |
| | Discounted cash flows | | Discount margin | | 191 Basis points |
| | | | | | | | | |
| Derivative assets: | | | | | | | | |
| Warrants | | $ | 599 |
| | Black-Scholes option pricing model | | Volatility | | 44% |
| | | | | | | Liquidity discount | | 47% |
| | | | | | | | | |
Assets measured at fair value on a nonrecurring basis include certain non-purchased credit impaired (“non-PCI”) loans that were impaired, OREO and loans held-for-sale. These fair value adjustments result from impairments recognized during the period on certain non-PCI impaired loans, application of fair value less cost to sell on OREO and application of the lower of cost or fair value on loans held-for-sale.
The following tables present the carrying amounts of assets included on the Consolidated Balance Sheets that had fair value changes measured on a nonrecurring basis as of September 30, 2017 and December 31, 2016:
|
| | | | | | | | | | | | | | | | |
| | | | | | | | | |
| | | Assets Measured at Fair Value on a Nonrecurring Basis
as of September 30, 2017 |
| ($ in thousands) | | Fair Value Measurements | | Quoted Prices in
Active Markets
for Identical
Assets
(Level 1) | | Significant
Other
Observable
Inputs
(Level 2) | | Significant Unobservable Inputs (Level 3) |
| Non-PCI impaired loans: | | |
| | |
| | |
| | |
|
| Commercial real estate (“CRE”) | | $ | 9,172 |
| | $ | — |
| | $ | — |
| | $ | 9,172 |
|
| Commercial and industrial (“C&I”) | | 32,053 |
| | — |
| | — |
| | 32,053 |
|
| Residential | | 6,079 |
| | — |
| | — |
| | 6,079 |
|
| Consumer | | 633 |
| | — |
| | — |
| | 633 |
|
| Total non-PCI impaired loans | | $ | 47,937 |
| | $ | — |
| | $ | — |
| | $ | 47,937 |
|
| OREO | | $ | 1,789 |
| | $ | — |
| | $ | — |
| | $ | 1,789 |
|
| | | | | | | | | |
|
| | | | | | | | | | | | | | | | |
| | | | | | | | | |
| | | Assets Measured at Fair Value on a Nonrecurring Basis
as of December 31, 2016 |
| ($ in thousands) | | Fair Value Measurements | | Quoted Prices in
Active Markets
for Identical
Assets
(Level 1) | | Significant
Other
Observable
Inputs
(Level 2) | | Significant Unobservable Inputs (Level 3) |
| Non-PCI impaired loans: | | |
| | |
| | |
| | |
|
| CRE | | $ | 14,908 |
| | $ | — |
| | $ | — |
| | $ | 14,908 |
|
| C&I | | 52,172 |
| | — |
| | — |
| | 52,172 |
|
| Residential | | 2,464 |
| | — |
| | — |
| | 2,464 |
|
| Consumer | | 610 |
| | — |
| | — |
| | 610 |
|
| Total non-PCI impaired loans | | $ | 70,154 |
| | $ | — |
| | $ | — |
| | $ | 70,154 |
|
| OREO | | $ | 345 |
| | $ | — |
| | $ | — |
| | $ | 345 |
|
| Loans held-for-sale | | $ | 22,703 |
| | $ | — |
| | $ | 22,703 |
| | $ | — |
|
| | | | | | | | | |
The following table presents the fair value adjustments of assets measured on a nonrecurring basis recognized during the three and nine months ended and which were included on the Consolidated Balance Sheets as of September 30, 2017 and 2016:
|
| | | | | | | | | | | | | | | | |
| | | | | | | | | |
| | | Three Months Ended September 30, | | Nine Months Ended September 30, |
| ($ in thousands) | | 2017 | | 2016 | | 2017 | | 2016 |
| Non-PCI impaired loans: | | | | | | |
| | |
|
| CRE | | $ | 6 |
| | $ | (282 | ) | | $ | (66 | ) | | $ | 1,741 |
|
| C&I | | (16,954 | ) | | 77 |
| | (17,648 | ) | | (5,497 | ) |
| Residential | | (3 | ) | | (14 | ) | | 49 |
| | (14 | ) |
| Consumer | | — |
| | — |
| | 25 |
| | 17 |
|
| Total non-PCI impaired loans | | $ | (16,951 | ) | | $ | (219 | ) | | $ | (17,640 | ) | | $ | (3,753 | ) |
| OREO | | $ | (285 | ) | | $ | (41 | ) | | $ | (286 | ) | | $ | (994 | ) |
| Loans held-for-sale | | $ | — |
| | $ | — |
| | $ | — |
| | $ | (2,351 | ) |
| | | | | | | | | |
The following table presents the quantitative information about the significant unobservable inputs used in the valuation of assets measured on a nonrecurring basis classified as Level 3 as of September 30, 2017 and December 31, 2016:
|
| | | | | | | | | | | | |
| |
| ($ in thousands) | | Fair Value
Measurements
(Level 3) | | Valuation
Technique(s) | | Unobservable Input(s) | | Range of Input(s) | | Weighted
Average |
| September 30, 2017 | | |
| | | | | | | | |
| Non-PCI impaired loans | | $ | 30,563 |
| | Discounted cash flows | | Discount | | 0% — 82% | | 19% |
| | | $ | 17,374 |
| | Market comparables | | Discount (1) | | 0% — 100% | | 40% |
| OREO | | $ | 1,789 |
| | Appraisal | | Selling cost | | 8% | | 8% |
| December 31, 2016 | | | | | | | | | | |
| Non-PCI impaired loans | | $ | 31,835 |
| | Discounted cash flows | | Discount | | 0% — 62% | | 7% |
| | | $ | 38,319 |
| | Market comparables | | Discount (1) | | 0% — 100% | | 18% |
| OREO | | $ | 345 |
| | Appraisal | | Selling cost | | 8% | | 8% |
| | | | | | | | | | | |
| |
(1) | Discount is adjusted for factors such as liquidation cost of collateral and selling cost. |
The following tables present the carrying and fair values per the fair value hierarchy of certain financial instruments, excluding those measured at fair value on a recurring basis, as of September 30, 2017 and December 31, 2016:
|
| | | | | | | | | | | | | | | | | | | | |
| |
| ($ in thousands) | | September 30, 2017 |
| | Carrying Amount | | Level 1 | | Level 2 | | Level 3 | | Estimated Fair Value |
| Financial assets: | | | | | | | | | | |
| Cash and cash equivalents | | $ | 1,736,749 |
| | $ | 1,736,749 |
| | $ | — |
| | $ | — |
| | $ | 1,736,749 |
|
| Interest-bearing deposits with banks | | $ | 404,946 |
| | $ | — |
| | $ | 404,946 |
| | $ | — |
| | $ | 404,946 |
|
Resale agreements (1) | | $ | 1,250,000 |
| | $ | — |
| | $ | 1,236,413 |
| | $ | — |
| | $ | 1,236,413 |
|
| Restricted equity securities | | $ | 73,322 |
| | $ | — |
| | $ | 73,322 |
| | $ | — |
| | $ | 73,322 |
|
| Loans held-for-sale | | $ | 178 |
| | $ | — |
| | $ | 178 |
| | $ | — |
| | $ | 178 |
|
| Loans held-for-investment, net | | $ | 28,239,431 |
| | $ | — |
| | $ | — |
| | $ | 27,635,961 |
| | $ | 27,635,961 |
|
| Accrued interest receivable | | $ | 111,710 |
| | $ | — |
| | $ | 111,710 |
| | $ | — |
| | $ | 111,710 |
|
| Financial liabilities: | | |
| | |
| | |
| | |
| | |
|
| Customer deposits: | | |
| | |
| | |
| | |
| | |
|
| Demand, checking, savings and money market deposits | | $ | 25,517,121 |
| | $ | — |
| | $ | 25,517,121 |
| | $ | — |
| | $ | 25,517,121 |
|
| Time deposits | | $ | 5,794,541 |
| | $ | — |
| | $ | 5,787,188 |
| | $ | — |
| | $ | 5,787,188 |
|
| Short-term borrowings | | $ | 24,813 |
| | $ | — |
| | $ | 24,813 |
| | $ | — |
| | $ | 24,813 |
|
| FHLB advances | | $ | 323,323 |
| | $ | — |
| | $ | 336,741 |
| | $ | — |
| | $ | 336,741 |
|
Repurchase agreements (1) | | $ | 50,000 |
| | $ | — |
| | $ | 105,269 |
| | $ | — |
| | $ | 105,269 |
|
| Long-term debt | | $ | 176,513 |
| | $ | — |
| | $ | 139,649 |
| | $ | — |
| | $ | 139,649 |
|
| Accrued interest payable | | $ | 11,017 |
| | $ | — |
| | $ | 11,017 |
| | $ | — |
| | $ | 11,017 |
|
| |
| |
(1) | Resale and repurchase agreements are reported net pursuant to ASC 210-20-45, Balance Sheet Offsetting. As of September 30, 2017, $400.0 millionout of $450.0 millionof repurchase agreements were eligible for netting against resale agreements.
|
|
| | | | | | | | | | | | | | | | | | | | |
| |
| ($ in thousands) | | December 31, 2016 |
| | Carrying
Amount | | Level 1 | | Level 2 | | Level 3 | | Estimated
Fair Value |
| Financial assets: | | |
| | |
| | |
| | |
| | |
|
| Cash and cash equivalents | | $ | 1,878,503 |
| | $ | 1,878,503 |
| | $ | — |
| | $ | — |
| | $ | 1,878,503 |
|
| Interest-bearing deposits with banks | | $ | 323,148 |
| | $ | — |
| | $ | 323,148 |
| | $ | — |
| | $ | 323,148 |
|
Resale agreements (1) | | $ | 2,000,000 |
| | $ | — |
| | $ | 1,980,457 |
| | $ | — |
| | $ | 1,980,457 |
|
| Held-to-maturity investment security | | $ | 143,971 |
| | $ | — |
| | $ | — |
| | $ | 144,593 |
| | $ | 144,593 |
|
| Restricted equity securities | | $ | 72,775 |
| | $ | — |
| | $ | 72,775 |
| | $ | — |
| | $ | 72,775 |
|
| Loans held-for-sale | | $ | 23,076 |
| | $ | — |
| | $ | 23,076 |
| | $ | — |
| | $ | 23,076 |
|
| Loans held-for-investment, net | | $ | 25,242,619 |
| | $ | — |
| | $ | — |
| | $ | 24,915,143 |
| | $ | 24,915,143 |
|
| Accrued interest receivable | | $ | 100,524 |
| | $ | — |
| | $ | 100,524 |
| | $ | — |
| | $ | 100,524 |
|
| Financial liabilities: | | |
| | |
| | |
| | |
| | |
|
| Customer deposits: | | |
| | |
| | |
| | |
| | |
|
| Demand, checking, savings and money market deposits | | $ | 24,275,714 |
| | $ | — |
| | $ | 24,275,714 |
| | $ | — |
| | $ | 24,275,714 |
|
| Time deposits | | $ | 5,615,269 |
| | $ | — |
| | $ | 5,611,746 |
| | $ | — |
| | $ | 5,611,746 |
|
| Short-term borrowings | | $ | 60,050 |
| | $ | — |
| | $ | 60,050 |
| | $ | — |
| | $ | 60,050 |
|
| FHLB advances | | $ | 321,643 |
| | $ | — |
| | $ | 334,859 |
| | $ | — |
| | $ | 334,859 |
|
Repurchase agreements (1) | | $ | 350,000 |
| | $ | — |
| | $ | 411,368 |
| | $ | — |
| | $ | 411,368 |
|
| Long-term debt | | $ | 186,327 |
| | $ | — |
| | $ | 186,670 |
| | $ | — |
| | $ | 186,670 |
|
| Accrued interest payable | | $ | 9,440 |
| | $ | — |
| | $ | 9,440 |
| | $ | — |
| | $ | 9,440 |
|
| |
| |
(1) | Resale and repurchase agreements are reported net pursuant to ASC 210-20-45, Balance Sheet Offsetting. As of December 31, 2016, $100.0 millionout of $450.0 millionof repurchase agreements were eligible for netting against resale agreements.
|
The following is a description ofsection describes the valuation methodologies and significant assumptions used by the Company to measure financial assets and liabilities at fair value, andon a recurring basis, as well as the general classification of these instruments pursuant to estimate fair value for certain financial instruments not recorded at fair value. The description also includes the level of the fair value hierarchy in which the assets or liabilities are classified.hierarchy.
Cash and Cash EquivalentsAvailable-for-SaleDebt Securities — The carrying amount approximates fair value due to the short-term nature of these instruments. As such, the estimated fair value is classified as Level 1.
Interest-bearing Deposits with Banks — The fair value of interest-bearing deposits with banks generally approximates their book value due to their short maturities. In addition, due to the observable nature of the inputs used in deriving the estimated fair value, these instruments are classified as Level 2.
Resale Agreements — The fair value of resale agreements is estimated by discounting the cash flows based on expected maturities or repricing dates utilizing estimated market discount rates. In addition, due to the observable nature of the inputs used in deriving the estimated fair value, these instruments are classified as Level 2.
Held-to-Maturity Investment Security — The held-to-maturity investment security as of December 31, 2016 was comprised of a floating rate non-agency commercial mortgage-backed security that was subsequently transferred from held-to-maturity to available-for-sale during the three months ended September 30, 2017. This security was categorized under Available-for-sale investment securities — other securities as of September 30, 2017.The fair value of this security is estimated by discounting the future expected cash flows utilizing the underlying index and a discount margin. Other unobservable inputs include conditional prepayment rate, constant default rate and loss severity. Due to the significant unobservable inputs used in estimating the fair value, this security is classified as Level 3.
Available-for-SaleInvestment Securities — When available, the Company uses quoted market prices to determine the fair value of available-for-sale investmentAFS debt securities, which are classified as Level 1. Level 1 available-for-sale investmentAFS debt securities are primarily comprised of U.S. Treasury securities. Other than the non-agency commercial mortgage-backed security, the fair value of which is described above, theThe fair value of other available-for-sale investmentAFS debt securities areis generally determined by independent external pricing service providers who have experience in valuing these securities or by taking the average quoted market prices obtained from independent external brokers. The valuations provided by the third-party pricing service providers are based on observable market inputs, which include benchmark yields, reported trades, issuer spreads, benchmark securities, bids, offers, prepayment expectation and reference data obtained from market research publications. Inputs used by the third-party pricing service providers in valuing collateralized mortgage obligations and other securitization structures also include new issue data, monthly payment information, whole loan collateral performance, tranche evaluation and “To Be Announced” prices. In obtaining such valuation information from third parties,valuing securities issued by state and political subdivisions, inputs used by third-party pricing service providers also include material event notices.
On a monthly basis, the Company reviewedvalidates the methodologiesvaluations provided by third-party pricing service providers to ensure that the fair value determination is consistent with the applicable accounting guidance and the financial instruments are properly classified in the fair value hierarchy. To perform this validation, the Company evaluates the fair values of securities by comparing the fair values provided by the third-party pricing service providers to prices from other available independent sources for the same securities. When significant variances in prices are identified, the Company further compares inputs used by different sources to developascertain the resulting fair values. The available-for-sale investmentreliability of these sources. On a quarterly basis, the Company reviews the documentation received from the third-party pricing service providers regarding the valuation inputs and methodology used for each category of securities.
When pricing is unavailable from third-party pricing service providers for certain securities, valued using such methodsthe Company requests market quotes from various independent external brokers and utilizes the average quoted market prices. These valuations are based on observable inputs in the current marketplace and are classified as Level 2. The Company periodically communicates with the independent external brokers to validate their pricing methodology. Information such as pricing sources, pricing assumptions, data inputs and valuation technique are reviewed.
Loans Held-for-SaleEquity Securities — The Company’s loans held-for-sale are carried at the lower Equity securities consisted of cost or fair value. Loans held-for-sale were comprised of single-family residential loansmutual funds as of September 30, 2017,both March 31, 2021 and were primarily comprised of consumer loans as of December 31, 2016.2020. The Company invested in these mutual funds for Community Reinvestment Act (“CRA”) purposes. The Company uses net asset value (“NAV”) information to determine the fair value of loans held-for-salethese equity securities. When NAV is derived from current market pricesavailable periodically and comparative current sales. The Company records any fair value adjustments on a nonrecurring basis. Loans held-for-sale are classified as Level 2.
Non-PCI Impaired Loans — The fair value of non-PCI impaired loans is measured using the market comparables or discounted cash flow techniques. For CRE and C&I loans,equity securities can be put back to the fair value is based on each loan’s observable market price ortransfer agents at the publicly available NAV, the fair value of the collateral less cost to sell, if the loan is collateral dependent. The fair value of collateral is generally based on third party appraisals (or internal evaluation if third party appraisal is not required by regulations) which utilize one or more valuation techniques (income, market and/or cost approaches). All third party appraisals and evaluations are reviewed and validated by independent appraisers or the Company’s appraisal department staffed by licensed appraisers and/or experienced real estate reviewers. The third party appraisals are ordered through the appraisal department (except for one-to-four unit residential appraisals which are typically ordered through an approved appraisal management company or an approved residential appraiser) at the inception, renewal or, for all real estate related loans, upon the occurrence of any events causing a downgrade to an adverse grade (i.e., “substandard” or “doubtful”). Updated appraisals and evaluations are generally obtained within the last 12 months. The Company increases the frequency of obtaining updated appraisals for adversely graded credits when declining market conditions exist. All appraisals include an “as is” market value without conditions as of the effective date of the appraisal. For certain impaired loans, the Company utilizes the discounted cash flow approach and applies a discount derived from historical data. The significant unobservable inputs used in the fair value measurement of non-PCI impaired loans are discounts applied based on the liquidation cost of collateral and selling cost. On a quarterly basis, all nonperforming assets are reviewed to assess whether the current carrying value is supported by the collateral or cash flow and to ensure that the current carrying value is appropriate. Non-PCI impaired loans are classified as Level 3.
Loans Held-for-Investment, net — The fair value of loans held-for-investment other than non-PCI impaired loans is determined based on a discounted cash flow approach considered for an exit price value. The discount rate is derived from the associated yield curve plus spreads that reflect the rates in the market for loans with similar financial characteristics. No adjustments have been made for changes in credit within any of the loan portfolios. It is management’s opinion that the allowance for loan losses pertaining to performing and nonperforming loans results in a fair value adjustment of credit for such loans. Due to the unobservable nature of the inputs used in deriving the estimated fair value, these instruments are classified as Level 3.
Other Real Estate Owned — The Company’s OREO represents properties acquired through foreclosure, or through full or partial satisfaction of loans held-for-investment, which are recorded at estimated fair value less cost to sell at the time of foreclosure and at the lower of cost or estimated fair value less the cost to sell subsequent to acquisition. The fair values of OREO properties are based on third party appraisals or accepted written offers. Refer to the Non-PCI Impaired Loans section above for a detailed discussion on the Company’s policies and procedures related to appraisals and evaluations. On a monthly basis, the current fair market value of each OREO property is reviewed to ensure that the current carrying value is appropriate. The significant unobservable input used is the selling cost. OREO properties are classified as Level 3.
Restricted Equity Securities — Restricted equity securities are comprised of Federal Reserve Bank stock and FHLB stock. Ownership of these securities is restricted to member banks and these securities do not have a readily determinable fair value. Purchases and sales of these securities are at par value. The carrying amounts of the Company’s restricted equity securities approximate fair value. The valuation of these investments is classified as Level 2.
Accrued Interest Receivable — The carrying amount approximates1. When NAV is available periodically but the equity securities may not be readily marketable at its periodic NAV in the secondary market, the fair value due to the short-term nature of these instruments. Considering the observable nature of the inputs used in deriving the estimated fair value, these instruments areequity securities is classified as Level 2.
Interest Rate Swaps and OptionsContracts— The Company enters into interest rate swap and option contracts that are not designated as hedging instruments with institutional counterparties to hedge against interest rate swap and option products offered to bank customers. These products allowits borrowers to lock in attractive intermediate and long-term interest rates, by entering into an interest rate swap or option contract with the Company, resulting in the customer obtaining a synthetic fixedfixed-rate loan. To economically hedge against the interest rate loan.risks in the products offered to its customers, the Company enters into mirrored offsetting interest rate contracts with third-party financial institutions. The Company also enters into interest rate swap contracts with institutional counterparties to hedge against certificates of deposit issued. This product allows the Company to lock in attractive floatingcertain variable interest rate funding.borrowings. These interest rate swap contracts with institutional counterparties were designated as cash flow hedges. The fair value of the interest rate swaps is determined using the market standard methodology of netting the discounted future fixed cash payments (or receipts) and the discounted expected variable cash receipts (or payments). The variable cash receipts (or payments) are based on the expectation of future interest rates (forward curves) derived from observed market interest rate curves. The fair value of the interest rate options, consistingwhich consist of floors and caps, is determined using the market standard methodology of discounting the future expected cash receipts that would occur if variable interest rates fellfall below (rise above) the strike rate of the floors (caps). The variable interest rates used in the calculation of projected receipts on the floor (cap) are based on an expectation of future interest rates derived from observable market interest rate curves and volatilities. In addition, to comply with the provisions of ASC 820,Fair Value Measurement, the Company incorporates credit valuation adjustments to appropriately reflect both its own nonperformance risk and the respective counterparty’s nonperformance risk in the fair value measurements of its derivatives. The credit valuation adjustments associated with the Company’s derivatives utilize model-derived credit spreads, which are Level 3 inputs, model-derived credit spreads.inputs. As of September 30, 2017,March 31, 2021 and December 31, 2020, the Company has assessed the significance of the impact of the credit valuation adjustments on the overall valuation of these interest rate contracts and has determined that the credit valuation adjustments arewere not significant to the overall valuation of its derivative portfolios. As a result, theThe Company classifies these derivative instruments as Level 2 of the fair value hierarchy due to the observable nature of the significant inputs utilized.
Foreign Exchange Contracts— The Company enters into short-term foreign exchange contracts to purchase/sell foreign currencies at set rates inaccommodate the future. These contracts economically hedge againstbusiness needs of its customers. For a majority of the foreign exchange rate fluctuations.contracts entered with its customers, the Company entered into offsetting foreign exchange contracts with third-party financial institutions to manage its exposure. The Company also enters into contracts with institutional counterparties to hedge againstutilizes foreign exchange products offeredcontracts that are not designated as hedging instruments to bankmitigate the economic effect of fluctuations in certain foreign currency on-balance sheet assets and liabilities, primarily foreign currency denominated deposits that it offers to its customers. These products allow customers to hedge the foreign exchange risk of their deposits and loans denominated in foreign currencies. The Company assumes minimal foreign exchange rate risk because the contracts with the customer and the institutional party mirror each other. The fair value is determined at each reporting period based on changes in the foreign exchange rate.rates. These are over-the-counter contracts where quoted market prices are not readily available. Valuation is measured using conventional valuation methodologies with observable market data. Valuation depends on the type of derivative, and the nature of the underlying rate and contractual terms including period of maturity, price and index upon which the derivative’s value is based. Key inputs include foreign exchange rates (spot and/or forward rates), volatility of currencies and the correlation of such inputs. Due to the short-term nature of the majority of these contracts, the counterparties’ credit risks are considered nominal and resultedresult in no adjustments to the valuation of the foreign exchange contracts. Due to the observable nature of the inputs used in deriving the fair value of these contracts, the valuation of foreign exchange contracts isare classified as Level 2. As of September 30, 2017, foreign exchange forward contracts used to economically hedge the Company’s net investment in East West Bank (China) Limited, a non-U.S. Dollar (“USD”) functional currency subsidiary in China, are included in this caption. See Foreign Currency Forward Contracts in the section below for details on valuation methodologiesMarch 31, 2021 and significant assumptions.
Customer Deposits — The fair value of deposits with no stated maturity, such as noninterest-bearing demand deposits, interest-bearing checking, savings and money market deposits, approximates the carrying amount as these deposits are payable on demand at the measurement date. Due to the observable nature of the inputs used in deriving the estimated fair value, these instruments are classified as Level 2. For time deposits, the fair value is based on the discounted value of contractual cash flows using current market rates for instruments with similar maturities. Due to the observable nature of the inputs used in deriving the estimated fair value, time deposits are classified as Level 2.
Federal Home Loan Bank Advances — The fair value of FHLB advances is estimated based on the discounted value of contractual cash flows, using rates currently offered by the FHLB of San Francisco for advances with similar remaining maturities at each reporting date. Due to the observable nature of the inputs used in deriving the estimated fair value, these instruments are classified as Level 2.
Repurchase Agreements — The fair value of the repurchase agreements is calculated by discounting future cash flows based on expected maturities or repricing dates, utilizing estimated market discount rates and taking into consideration the call features of each instrument. Due to the observable nature of the inputs used in deriving the estimated fair value, these instruments are classified as Level 2.
Accrued Interest Payable — The carrying amount approximates fair value due to the short-term nature of these instruments. Due to the observable nature of the inputs used in deriving the estimated fair value, these instruments are classified as Level 2.
Long-Term Debt — The fair value of long-term debt is estimated by discounting the cash flows through maturity based on current market rates the Company would pay for new issuances. Due to the observable nature of the inputs used in deriving the estimated fair value, long-term debt is classified as Level 2.
Foreign Currency Forward Contracts — During the three months ended December 31, 2015,2020, the Company began entering intoBank held foreign currency non-deliverable forward contracts to hedge its net investment in its China subsidiary, East West Bank (China) Limited. Previously, theLimited, a non-U.S. dollar (“USD”) functional currency subsidiary in China. These foreign currency non-deliverable forward contracts were eligible for hedge accounting. During the nine months ended September 30, 2017, the foreign currency forward contracts were dedesignated when the hedge relationship ceased to be highly effective. The Company continues to economically hedge its foreign currency exposure resulting from East West Bank (China) Limited and the foreign currency forward contracts are includeddesignated as part of the “Foreign Exchange Contracts” caption as of September 30, 2017.net investment hedges. The fair value of foreign currency forward contracts is valueddetermined by comparing the contracted foreign exchange rate to the current market foreign exchange rate. InputsKey inputs of the current market exchange rate include spot rates and forward rates and the interest rate curves of the domestic and foreign currency. Interest ratecontractual currencies. Foreign exchange forward curves are used to determine which forward rate pertains to a specific maturity. Due to the observable nature of the inputs used in deriving the estimated fair value, these instruments are classified as Level 2.
Credit Risk Participation Agreements Contracts — The Company entersmay periodically enter into RPAs, under which the Company assumes its pro-rata share ofcredit risk participation agreements (“RPAs”) to manage the credit exposure on interest rate contracts associated with the borrower’s performance related to interest rate derivative contracts.syndicated loans. The Company may enter into protection sold or protection purchased RPAs with institutional counterparties. The fair value of RPAs is calculated by determining the total expected asset or liability exposure of the derivatives to the borrowers and applying the borrowers’ credit spread to that exposure. Total expected exposure incorporates both the current and potential future exposure of the derivatives, derived from using observable inputs, such as yield curves and volatilities. The credit spreads of the borrowers used in the calculation are estimated by the Company based on current market conditions, including consideration of current borrowing spreads for similar customers and transactions, review of existing collateralization or other credit enhancements, and changes in credit sector and entity-specific credit information. The Company has determined that the majority of the inputs used to value the RPAs are observable. Accordingly,observable; accordingly, RPAs fall within Level 22.
Equity Contracts — As part of the fair value hierarchy.
Warrants — Theloan origination process, the Company obtainedperiodically obtains warrants to purchase preferred andand/or common stock of technology and life sciences companies as part of the loan origination process.to which it provides loans. As of September 30, 2017,March 31, 2021, the warrants included on the Consolidated Financial Statements were only from private companies. As of December 31, 2020, the warrants included on the Consolidated Financial Statements were from both public and private companies. The Company valuedvalues these warrants based on the Black-Scholes option pricing model. For warrants from public companies, the model uses the underlying stock price, stated strike price, warrant expiration date, risk-free interest rate based on a duration-matched U.S. Treasury rate, and market-observable company-specific option volatility as inputs to value the warrants. Due to the observable nature of the inputs used in deriving the estimated fair value, warrants from public companies are classified as Level 2. For warrants from private companies, the model uses inputs such as the offering price observed in the most recent round of funding, stated strike price, warrant expiration date, risk-free interest rate based on duration-matched U.S. Treasury rate and option volatility. The option volatility assumption wasCompany applies proxy volatilities based on public market indices that include members that operate in similar industries as the companies in ourindustry sectors of the private company portfolio.companies. The model values were furtherare then adjusted for a general lack of liquidity due to the private nature of the underlying companies. Since both option volatility and liquidity discount assumptions are subject to management’s judgment, measurement uncertainty is inherent in the valuation of private companies’ warrants. Due to the unobservable nature of the option volatility and liquidity discount assumptions used in deriving the estimated fair value, warrants from private companies are classified as Level 3. There is a direct correlation between changesGiven that the Company holds long positions in theall warrants, an increase in volatility assumption and thewould generally result in an increase in fair value measurement of warrants from private companies, while there is an inverse correlation between changes in thevalue. A higher liquidity discount assumption and thewould generally result in a decrease in fair value measurement of warrants from private companies.value. On a quarterly basis, the changes in the fair value of warrants from private companies are reviewed for reasonableness, and a sensitivitymeasurement uncertainty analysis on the option volatility and liquidity discount assumptions is performed.
Commodity Contracts — The Company enters into energy commodity contracts in the form of swaps and options with its commercial loan customers to allow them to hedge against the risk of fluctuation in energy commodity prices. The fair value estimates presented hereinof the commodity option contracts is determined using the Black-Scholes model and assumptions that include expectations of future commodity price and volatility. The future commodity contract price is derived from observable inputs such as the market price of the commodity. Commodity swaps are structured as an exchange of fixed cash flows for floating cash flows. The fixed cash flows are predetermined based on pertinent information availablethe known volumes and fixed price as specified in the swap agreement. The floating cash flows are correlated with the change of forward commodity prices, which is derived from market corroborated futures settlement prices. The fair value of the commodity swaps is determined using the market standard methodology of netting the discounted future fixed cash payments (or receipts) and the discounted expected variable cash receipts (or payments) based on the market prices of the commodity. As a result, the Company classifies these derivative instruments as Level 2 due to managementthe observable nature of the significant inputs utilized.
The following tables present financial assets and liabilities that are measured at fair value on a recurring basis as of each reporting date. AlthoughMarch 31, 2021 and December 31, 2020:
| | | | | | | | | | | | | | | | | | | | | | | | | | |
|
| ($ in thousands) | | Assets and Liabilities Measured at Fair Value on a Recurring Basis
as of March 31, 2021 |
| Quoted Prices in
Active Markets
for Identical
Assets
(Level 1) | | Significant
Other
Observable
Inputs
(Level 2) | | Significant
Unobservable
Inputs
(Level 3) | | Total
Fair Value |
| AFS debt securities: | | | | | | | | |
| U.S. Treasury securities | | $ | 826,342 | | | $ | 0 | | | $ | 0 | | | $ | 826,342 | |
| U.S. government agency and U.S. government-sponsored enterprise debt securities | | 0 | | | 1,194,005 | | | 0 | | | 1,194,005 | |
| U.S. government agency and U.S. government-sponsored enterprise mortgage-backed securities: | | | | | | | | |
| Commercial mortgage-backed securities | | 0 | | | 1,169,391 | | | 0 | | | 1,169,391 | |
| Residential mortgage-backed securities | | 0 | | | 2,247,406 | | | 0 | | | 2,247,406 | |
| Municipal securities | | 0 | | | 420,065 | | | 0 | | | 420,065 | |
| Non-agency mortgage-backed securities: | | | | | | | | |
| Commercial mortgage-backed securities | | 0 | | | 281,027 | | | 0 | | | 281,027 | |
| Residential mortgage-backed securities | | 0 | | | 523,500 | | | 0 | | | 523,500 | |
| Corporate debt securities | | 0 | | | 496,643 | | | 0 | | | 496,643 | |
| Foreign government bonds | | 0 | | | 276,328 | | | 0 | | | 276,328 | |
| Asset-backed securities | | 0 | | | 63,040 | | | 0 | | | 63,040 | |
| Collateralized loan obligations (“CLOs”) | | 0 | | | 291,466 | | | 0 | | | 291,466 | |
| Total AFS debt securities | | $ | 826,342 | | | $ | 6,962,871 | | | $ | 0 | | | $ | 7,789,213 | |
| | | | | | | | |
| Investments in tax credit and other investments: | | | | | | | | |
Equity securities (1) | | $ | 22,233 | | | $ | 4,460 | | | $ | 0 | | | $ | 26,693 | |
| Total investments in tax credit and other investments | | $ | 22,233 | | | $ | 4,460 | | | $ | 0 | | | $ | 26,693 | |
| | | | | | | | |
| Derivative assets: | | | | | | | | |
| Interest rate contracts | | $ | 0 | | | $ | 319,049 | | | $ | 0 | | | $ | 319,049 | |
| Foreign exchange contracts | | 0 | | | 39,562 | | | 0 | | | 39,562 | |
| Credit contracts | | 0 | | | 5 | | | 0 | | | 5 | |
| Equity contracts | | 0 | | | 0 | | | 272 | | | 272 | |
| Commodity contracts | | 0 | | | 98,429 | | | 0 | | | 98,429 | |
| Gross derivative assets | | $ | 0 | | | $ | 457,045 | | | $ | 272 | | | $ | 457,317 | |
Netting adjustments (2) | | $ | 0 | | | $ | (108,235) | | | $ | 0 | | | $ | (108,235) | |
| Net derivative assets | | $ | 0 | | | $ | 348,810 | | | $ | 272 | | | $ | 349,082 | |
| | | | | | | | |
| Derivative liabilities: | | | | | | | | |
| Interest rate contracts | | $ | 0 | | | $ | 230,290 | | | $ | 0 | | | $ | 230,290 | |
| Foreign exchange contracts | | 0 | | | 27,287 | | | 0 | | | 27,287 | |
| Credit contracts | | 0 | | | 153 | | | 0 | | | 153 | |
| Commodity contracts | | 0 | | | 86,405 | | | 0 | | | 86,405 | |
| Gross derivative liabilities | | $ | 0 | | | $ | 344,135 | | | $ | 0 | | | $ | 344,135 | |
Netting adjustments (2) | | $ | 0 | | | $ | (186,687) | | | $ | 0 | | | $ | (186,687) | |
| Net derivative liabilities | | $ | 0 | | | $ | 157,448 | | | $ | 0 | | | $ | 157,448 | |
|
(1)Equity securities consist of mutual funds with readily determinable fair values. The Company invested in these mutual funds for CRA purposes.
(2)Represents balance sheet netting of derivative assets and liabilities and related cash collateral under master netting agreements or similar agreements. See Note 6 — Derivatives to the Consolidated Financial Statements in this Form 10-Q for additional information.
| | | | | | | | | | | | | | | | | | | | | | | | | | |
|
| ($ in thousands) | | Assets and Liabilities Measured at Fair Value on a Recurring Basis
as of December 31, 2020 |
| Quoted Prices in
Active Markets
for Identical
Assets
(Level 1) | | Significant
Other
Observable
Inputs
(Level 2) | | Significant
Unobservable
Inputs
(Level 3) | | Total
Fair Value |
| AFS debt securities: | | | | | | | | |
| U.S. Treasury securities | | $ | 50,761 | | | $ | 0 | | | $ | 0 | | | $ | 50,761 | |
| U.S. government agency and U.S. government-sponsored enterprise debt securities | | 0 | | | 814,319 | | | 0 | | | 814,319 | |
| U.S. government agency and U.S. government-sponsored enterprise mortgage-backed securities: | | | | | | | | |
| Commercial mortgage-backed securities | | 0 | | | 1,153,770 | | | 0 | | | 1,153,770 | |
| Residential mortgage-backed securities | | 0 | | | 1,660,894 | | | 0 | | | 1,660,894 | |
| Municipal securities | | 0 | | | 396,073 | | | 0 | | | 396,073 | |
| Non-agency mortgage-backed securities: | | | | | | | | |
| Commercial mortgage-backed securities | | 0 | | | 239,842 | | | 0 | | | 239,842 | |
| Residential mortgage-backed securities | | 0 | | | 289,775 | | | 0 | | | 289,775 | |
| Corporate debt securities | | 0 | | | 405,968 | | | 0 | | | 405,968 | |
| Foreign government bonds | | 0 | | | 182,531 | | | 0 | | | 182,531 | |
| Asset-backed securities | | 0 | | | 63,231 | | | 0 | | | 63,231 | |
| CLOs | | 0 | | | 287,494 | | | 0 | | | 287,494 | |
| Total AFS debt securities | | $ | 50,761 | | | $ | 5,493,897 | | | $ | 0 | | | $ | 5,544,658 | |
| | | | | | | | |
| Investments in tax credit and other investments: | | | | | | | | |
Equity securities (1) | | $ | 22,548 | | | $ | 8,724 | | | $ | 0 | | | $ | 31,272 | |
| Total investments in tax credit and other investments | | $ | 22,548 | | | $ | 8,724 | | | $ | 0 | | | $ | 31,272 | |
| | | | | | | | |
| Derivative assets: | | | | | | | | |
| Interest rate contracts | | $ | 0 | | | $ | 489,132 | | | $ | 0 | | | $ | 489,132 | |
| Foreign exchange contracts | | 0 | | | 30,300 | | | 0 | | | 30,300 | |
| Credit contracts | | 0 | | | 13 | | | 0 | | | 13 | |
| Equity contracts | | 0 | | | 585 | | | 273 | | | 858 | |
| Commodity contracts | | 0 | | | 82,451 | | | 0 | | | 82,451 | |
| Gross derivative assets | | $ | 0 | | | $ | 602,481 | | | $ | 273 | | | $ | 602,754 | |
Netting adjustments (2) | | $ | 0 | | | $ | (101,512) | | | $ | 0 | | | $ | (101,512) | |
| Net derivative assets | | $ | 0 | | | $ | 500,969 | | | $ | 273 | | | $ | 501,242 | |
| | | | | | | | |
| Derivative liabilities: | | | | | | | | |
| Interest rate contracts | | $ | 0 | | | $ | 317,698 | | | $ | 0 | | | $ | 317,698 | |
| Foreign exchange contracts | | 0 | | | 22,759 | | | 0 | | | 22,759 | |
| Credit contracts | | 0 | | | 206 | | | 0 | | | 206 | |
| Commodity contracts | | 0 | | | 84,165 | | | 0 | | | 84,165 | |
| Gross derivative liabilities | | $ | 0 | | | $ | 424,828 | | | $ | 0 | | | $ | 424,828 | |
Netting adjustments (2) | | $ | 0 | | | $ | (184,697) | | | $ | 0 | | | $ | (184,697) | |
| Net derivative liabilities | | $ | 0 | | | $ | 240,131 | | | $ | 0 | | | $ | 240,131 | |
|
(1)Equity securities consist of mutual funds with readily determinable fair values. The Company invested in these mutual funds for CRA purposes.
(2)Represents balance sheet netting of derivative assets and liabilities and related cash collateral under master netting agreements or similar agreements. See Note 6 — Derivatives to the Consolidated Financial Statements in this Form 10-Q for additional information.
For the three months ended March 31, 2021 and 2020, Level 3 fair value measurements that were measured on a recurring basis consisted of warrants issued by private companies. The following table provides a reconciliation of the beginning and ending balances of these equity warrants for the three months ended March 31, 2021 and 2020:
| | | | | | | | | | | | | | | | | | |
|
| ($ in thousands) | | Three Months Ended March 31, | | |
| 2021 | | 2020 | | | | |
| Equity Contracts | | | | | | | | |
| Beginning balance | | $ | 273 | | | $ | 421 | | | | | |
| | | | | | | | |
Total (losses) gains included in earnings (1) | | (1) | | | 292 | | | | | |
| | | | | | | | |
| | | | | | | | |
| | | | | | | | |
| | | | | | | | |
| | | | | | | | |
| | | | | | | | |
| | | | | | | | |
| | | | | | | | |
| Ending balance | | $ | 272 | | | $ | 713 | | | | | |
|
(1)Includes unrealized (losses) gains of $(1) thousand and $292 thousand for the three months ended March 31, 2021 and 2020, respectively. The realized/unrealized gains (losses) of equity warrants are included in Lending fees on the Consolidated Statement of Income.
The following table presents quantitative information about the significant unobservable inputs used in the valuation of Level 3 fair value measurements as of March 31, 2021 and December 31, 2020, respectively. The significant unobservable inputs presented in the table below are those that the Company considers significant to the fair value of the Level 3 assets. The Company considers unobservable inputs to be significant if, by their exclusion, the fair value of the Level 3 assets would be impacted by a predetermined percentage change.
| | | | | | | | | | | | | | | | | | | | | | | | | | | | | | | | |
|
| ($ in thousands) | | Fair Value
Measurements
(Level 3) | | Valuation
Technique | | Unobservable
Inputs | | Range of Inputs | | Weighted- Average (1) |
| March 31, 2021 | | | | | | | | | | |
| Derivative assets: | | | | | | | | | | |
| Equity contracts | | $ | 272 | | | Black-Scholes option pricing model | | Equity volatility | | 48% — 56% | | 52% |
| | | | | | Liquidity discount | | 47% | | 47% |
| December 31, 2020 | | | | | | | | | | |
| Derivative assets: | | | | | | | | | | |
| Equity contracts | | $ | 273 | | | Black-Scholes option pricing model | | Equity volatility | | 46% — 61% | | 53% |
| | | | | | Liquidity discount | | 47% | | 47% |
|
(1)Weighted-average is calculated based on the fair value of equity warrants as of March 31, 2021 and December 31, 2020.
Assets and Liabilities Measured at Fair Value on a Nonrecurring Basis
Assets measured at fair value on a nonrecurring basis include certain individually evaluated loans held-for-investment, investments in qualified affordable housing partnerships, tax credit and other investments, OREO, loans held-for-sale, and other nonperforming assets. Nonrecurring fair value adjustments result from impairment on certain individually evaluated loans held-for-investment and investments in qualified affordable housing partnerships, tax credit and other investments, write-downs of OREO and other nonperforming assets, or from the application of lower of cost or fair value on loans held-for-sale.
Individually Evaluated Loans Held-For-Investment — Individually evaluated loans held-for-investment are classified as Level 3 assets. The following two methods are used to derive the fair value of individually evaluated loans held-for-investment:
•Discounted cash flow valuation techniques that consist of developing an expected stream of cash flows over the life of the loans, and then calculating the present value of the loans by discounting the expected cash flows at a designated discount rate.
•When an individually evaluated loan is collateral-dependent, the fair value of the loan is determined based on the fair value of the underlying collateral, which may take the form of real estate, inventory, equipment, contracts or guarantees. The fair value of the underlying collateral is generally based on third-party appraisals, or an internal valuation if a third-party appraisal is not awarerequired by regulations, or unavailable. An internal valuation utilizes one or more valuation techniques such as the income, market and/or cost approaches.
Investments in Qualified Affordable Housing Partnerships, Tax Credit and Other Investments, Net — The Company conducts due diligence on its investments in qualified affordable housing partnerships, tax credit and other investments prior to the initial investment date and through the placed-in-service date. After these investments are either acquired or placed into service, the Company continues its periodic monitoring process, which includes the quarterly review of anythe financial statements, the annual review of tax returns of the investment entity, the annual review of the financial statements of the guarantor (if any) and a comparison of the actual performance of the investment against the financial projections prepared at the time when the investment was made. The Company assesses its tax credit and other investments for possible other-than-temporary impairment (“OTTI”) on an annual basis or when events or circumstances suggest that the carrying amount of the investments may not be realizable. These circumstances can include, but are not limited to the following factors:
•expected future cash flows that are less than the carrying amount of the investment;
•changes in the economic, market or technological environment that could adversely affect the investee’s operations; and
•other factors that raise doubt about the investee’s ability to continue as a going concern, such as negative cash flows from operations and the continuing prospects of the underlying operations of the investment.
All available evidence is considered in assessing whether a decline in value is other-than-temporary. Generally, none of the aforementioned factors are individually conclusive and the relative importance placed on individual facts may vary depending on the situation. In accordance with ASC 323-10-35-32, an impairment charge would significantly affect theonly be recognized in earnings for a decline in value that is determined to be other-than-temporary.
Other Real Estate Owned — The Company’s OREO represents properties acquired through foreclosure, or through full or partial satisfaction of loans held-for-investment. These OREO properties are recorded at estimated fair value amounts, such amounts have not been comprehensively revalued for purposesless the costs to sell at the time of these Consolidated Financial Statements sinceforeclosure and at the lower of cost or estimated fair value less the costs to sell subsequent to acquisition. On a monthly basis, the current fair market value of each OREO property is reviewed to ensure that date, and therefore,the current carrying value is appropriate. OREO properties are classified as Level 3.
Other Nonperforming Assets—Other nonperforming assets are recorded at fair value upon transfers from loans to foreclosed assets. Subsequently, foreclosed assets are recorded at the lower of carrying value or fair value. Fair value is based on independent market prices, appraised values of the collateral or management’s estimates of the foreclosed asset. The Company records an impairment when the foreclosed asset’s fair value may differ significantly fromdeclines below its carrying value. Other nonperforming assets are classified as Level 3.
The following tables present the carrying amounts of assets that were still held and had fair value changes measured on a nonrecurring basis as of March 31, 2021 and December 31, 2020:
| | | | | | | | | | | | | | | | | | | | | | | | | | |
|
| ($ in thousands) | | Assets Measured at Fair Value on a Nonrecurring Basis
as of March 31, 2021 |
| Quoted Prices in
Active Markets
for Identical
Assets
(Level 1) | | Significant
Other
Observable
Inputs
(Level 2) | | Significant
Unobservable
Inputs
(Level 3) | | Fair Value
Measurements |
| Loans held-for-investment: | | | | | | | | |
| Commercial: | | | | | | | | |
| Commercial and industrial (“C&I”) | | $ | 0 | | | $ | 0 | | | $ | 143,630 | | | $ | 143,630 | |
| Commercial real estate (“CRE”): | | | | | | | | |
| CRE | | 0 | | | 0 | | | 47,639 | | | 47,639 | |
| Multifamily residential | | 0 | | | 0 | | | 2,332 | | | 2,332 | |
| Construction and land | | 0 | | | 0 | | | 4,191 | | | 4,191 | |
| | | | | | | | |
| Total commercial | | 0 | | | 0 | | | 197,792 | | | 197,792 | |
| Consumer: | | | | | | | | |
| Residential mortgage: | | | | | | | | |
| | | | | | | | |
| Home equity lines of credit (“HELOCs”) | | 0 | | | 0 | | | 4,791 | | | 4,791 | |
| | | | | | | | |
| | | | | | | | |
| Total consumer | | 0 | | | 0 | | | 4,791 | | | 4,791 | |
| Total loans held-for-investment | | $ | 0 | | | $ | 0 | | | $ | 202,583 | | | $ | 202,583 | |
| | | | | | | | |
| | | | | | | | |
| | | | | | | | |
| | | | | | | | |
| | | | | | | | | | | | | | | | | | | | | | | | | | |
|
| ($ in thousands) | | Assets Measured at Fair Value on a Nonrecurring Basis
as of December 31, 2020 |
| Quoted Prices in
Active Markets
for Identical
Assets
(Level 1) | | Significant
Other
Observable
Inputs
(Level 2) | | Significant
Unobservable
Inputs
(Level 3) | | Fair Value
Measurements |
| Loans held-for-investment: | | | | | | | | |
| Commercial: | | | | | | | | |
| C&I | | $ | 0 | | | $ | 0 | | | $ | 143,331 | | | $ | 143,331 | |
| CRE: | | | | | | | | |
| CRE | | 0 | | | 0 | | | 42,894 | | | 42,894 | |
| | | | | | | | |
| | | | | | | | |
| | | | | | | | |
| Total commercial | | 0 | | | 0 | | | 186,225 | | | 186,225 | |
| Consumer: | | | | | | | | |
| Residential mortgage: | | | | | | | | |
| | | | | | | | |
| HELOCs | | 0 | | | 0 | | | 1,146 | | | 1,146 | |
| | | | | | | | |
| Other consumer | | 0 | | | 0 | | | 2,491 | | | 2,491 | |
| Total consumer | | 0 | | | 0 | | | 3,637 | | | 3,637 | |
| Total loans held-for-investment | | $ | 0 | | | $ | 0 | | | $ | 189,862 | | | $ | 189,862 | |
| Investments in tax credit and other investments, net | | $ | 0 | | | $ | 0 | | | $ | 3,140 | | | $ | 3,140 | |
OREO (1) | | $ | 0 | | | $ | 0 | | | $ | 15,824 | | | $ | 15,824 | |
| | | | | | | | |
| | | | | | | | |
(1)Amounts are included in Other assets on the Consolidated Balance Sheet and represent the carrying value of OREO properties that were written down subsequent to their initial classification as OREO.
The following table presents the increase (decrease) in fair value of assets for which a nonrecurring fair value adjustment has been recognized for the three months ended March 31, 2021 and 2020:
| | | | | | | | | | | | | | | | | | |
|
| ($ in thousands) | | Three Months Ended March 31, | | |
| 2021 | | 2020 | | | | |
| | | | | | | | |
| Loans held-for-investment: | | | | | | | | |
| Commercial: | | | | | | | | |
| C&I | | $ | (5,309) | | | $ | (21,501) | | | | | |
| CRE: | | | | | | | | |
| CRE | | (7,062) | | | (5) | | | | | |
| Multifamily residential | | (16) | | | 0 | | | | | |
| Construction and land | | (71) | | | 0 | | | | | |
| | | | | | | | |
| Total commercial | | (12,458) | | | (21,506) | | | | | |
| Consumer: | | | | | | | | |
| Residential mortgage: | | | | | | | | |
| | | | | | | | |
| HELOCs | | (37) | | | (193) | | | | | |
| | | | | | | | |
| Other consumer | | 0 | | | 2,491 | | | | | |
| Total consumer | | (37) | | | 2,298 | | | | | |
| Total loans held-for-investment | | $ | (12,495) | | | $ | (19,208) | | | | | |
| Investments in tax credit and other investments, net | | $ | 0 | | | $ | 150 | | | | | |
| | | | | | | | |
| Other nonperforming assets | | $ | (3,890) | | | $ | (300) | | | | | |
|
The following table presents the quantitative information about the significant unobservable inputs used in the valuation of Level 3 fair value measurements that are measured on a nonrecurring basis as of March 31, 2021 and December 31, 2020:
| | | | | | | | | | | | | | | | | | | | | | | | | | | | | | | | |
|
| ($ in thousands) | | Fair Value
Measurements
(Level 3) | | Valuation
Techniques | | Unobservable
Inputs | | Range of
Inputs | | Weighted- Average of Inputs (1) |
| March 31, 2021 | | | | | | | | | | |
| Loans held-for-investment | | $ | 108,918 | | | Discounted cash flows | | Discount | | 4% — 15% | | 11% |
| | $ | 24,356 | | | Fair value of collateral | | Discount | | 10% — 20% | | 15% |
| | $ | 9,902 | | | Fair value of collateral | | Contract value | | NM | | NM |
| | $ | 59,407 | | | Fair value of property | | Selling cost | | 8% — 26% | | 9% |
| | | | | | | | | | |
| | | | | | | | | | |
| | | | | | | | | | |
| | | | | | | | | | |
| December 31, 2020 | | | | | | | | | | |
| Loans held-for-investment | | $ | 104,783 | | | Discounted cash flows | | Discount | | 3% — 15% | | 11% |
| | | | | | | | | | |
| | $ | 22,207 | | | Fair value of collateral | | Discount | | 10% — 26% | | 15% |
| | $ | 15,879 | | | Fair value of collateral | | Contract value | | NM | | NM |
| | $ | 46,993 | | | Fair value of property | | Selling cost | | 7% — 26% | | 10% |
| Investments in tax credit and other investments, net | | $ | 3,140 | | | Individual analysis of each investment | | Expected future tax benefits and distributions | | NM | | NM |
| OREO | | $ | 15,824 | | | Fair value of property | | Selling cost | | 8% | | 8% |
| | | | | | | | | | |
|
NM — Not meaningful.
(1)Weighted-average of inputs is based on the relative fair value of the respective assets as of March 31, 2021 and December 31, 2020.
Disclosures about Fair Value of Financial Instruments
The following tables present the fair value estimates for financial instruments as of March 31, 2021 and December 31, 2020, excluding financial instruments recorded at fair value on a recurring basis as they are included in the tables presented herein.elsewhere in this Note. The carrying amounts in the following tables are recorded on the Consolidated Balance Sheet under the indicated captions, except for accrued interest receivable and mortgage servicing rights that are included in Other assets, and accrued interest payable that is included in Accrued expenses and other liabilities. These financial assets and liabilities are measured at amortized cost basis on the Company’s Consolidated Balance Sheet.
| | | | | | | | | | | | | | | | | | | | | | | | | | | | | | | | |
|
| ($ in thousands) | | March 31, 2021 |
| Carrying
Amount | | Level 1 | | Level 2 | | Level 3 | | Estimated
Fair Value |
| Financial assets: | | | | | | | | | | |
| Cash and cash equivalents | | $ | 4,619,133 | | | $ | 4,619,133 | | | $ | 0 | | | $ | 0 | | | $ | 4,619,133 | |
| Interest-bearing deposits with banks | | $ | 741,923 | | | $ | 0 | | | $ | 741,923 | | | $ | 0 | | | $ | 741,923 | |
| Resale agreements | | $ | 2,160,038 | | | $ | 0 | | | $ | 2,152,392 | | | $ | 0 | | | $ | 2,152,392 | |
| | | | | | | | | | |
| Restricted equity securities, at cost | | $ | 83,250 | | | $ | 0 | | | $ | 83,250 | | | $ | 0 | | | $ | 83,250 | |
| | | | | | | | | | |
| Loans held-for-investment, net | | $ | 38,981,242 | | | $ | 0 | | | $ | 0 | | | $ | 38,922,550 | | | $ | 38,922,550 | |
| Mortgage servicing rights | | $ | 5,506 | | | $ | 0 | | | $ | 0 | | | $ | 8,740 | | | $ | 8,740 | |
| Accrued interest receivable | | $ | 149,953 | | | $ | 0 | | | $ | 149,953 | | | $ | 0 | | | $ | 149,953 | |
| Financial liabilities: | | | | | | | | | | |
| Demand, checking, savings and money market deposits | | $ | 40,748,303 | | | $ | 0 | | | $ | 40,748,303 | | | $ | 0 | | | $ | 40,748,303 | |
| Time deposits | | $ | 8,798,833 | | | $ | 0 | | | $ | 8,811,048 | | | $ | 0 | | | $ | 8,811,048 | |
| | | | | | | | | | |
| | | | | | | | | | |
| FHLB advances | | $ | 653,035 | | | $ | 0 | | | $ | 657,460 | | | $ | 0 | | | $ | 657,460 | |
| Repurchase agreements | | $ | 300,000 | | | $ | 0 | | | $ | 316,099 | | | $ | 0 | | | $ | 316,099 | |
| Long-term debt | | $ | 147,445 | | | $ | 0 | | | $ | 151,015 | | | $ | 0 | | | $ | 151,015 | |
| Accrued interest payable | | $ | 9,966 | | | $ | 0 | | | $ | 9,966 | | | $ | 0 | | | $ | 9,966 | |
|
| | | | | | | | | | | | | | | | | | | | | | | | | | | | | | | | |
|
| ($ in thousands) | | December 31, 2020 |
| Carrying
Amount | | Level 1 | | Level 2 | | Level 3 | | Estimated
Fair Value |
| Financial assets: | | | | | | | | | | |
| Cash and cash equivalents | | $ | 4,017,971 | | | $ | 4,017,971 | | | $ | 0 | | | $ | 0 | | | $ | 4,017,971 | |
| Interest-bearing deposits with banks | | $ | 809,728 | | | $ | 0 | | | $ | 809,728 | | | $ | 0 | | | $ | 809,728 | |
| Resale agreements | | $ | 1,460,000 | | | $ | 0 | | | $ | 1,464,635 | | | $ | 0 | | | $ | 1,464,635 | |
| | | | | | | | | | |
| Restricted equity securities, at cost | | $ | 83,046 | | | $ | 0 | | | $ | 83,046 | | | $ | 0 | | | $ | 83,046 | |
| Loans held-for-sale | | $ | 1,788 | | | $ | 0 | | | $ | 1,788 | | | $ | 0 | | | $ | 1,788 | |
| Loans held-for-investment, net | | $ | 37,770,972 | | | $ | 0 | | | $ | 0 | | | $ | 37,803,940 | | | $ | 37,803,940 | |
| | | | | | | | | | |
| Mortgage servicing rights | | $ | 5,522 | | | $ | 0 | | | $ | 0 | | | $ | 8,435 | | | $ | 8,435 | |
| Accrued interest receivable | | $ | 150,140 | | | $ | 0 | | | $ | 150,140 | | | $ | 0 | | | $ | 150,140 | |
| Financial liabilities: | | | | | | | | | | |
| | | | | | | | | | |
| Demand, checking, savings and money market deposits | | $ | 35,862,403 | | | $ | 0 | | | $ | 35,862,403 | | | $ | 0 | | | $ | 35,862,403 | |
| Time deposits | | $ | 9,000,349 | | | $ | 0 | | | $ | 9,016,884 | | | $ | 0 | | | $ | 9,016,884 | |
| Short-term borrowings | | $ | 21,009 | | | $ | 0 | | | $ | 21,009 | | | $ | 0 | | | $ | 21,009 | |
| FHLB advances | | $ | 652,612 | | | $ | 0 | | | $ | 659,631 | | | $ | 0 | | | $ | 659,631 | |
| Repurchase agreements | | $ | 300,000 | | | $ | 0 | | | $ | 317,850 | | | $ | 0 | | | $ | 317,850 | |
| Long-term debt | | $ | 147,376 | | | $ | 0 | | | $ | 150,131 | | | $ | 0 | | | $ | 150,131 | |
| Accrued interest payable | | $ | 11,956 | | | $ | 0 | | | $ | 11,956 | | | $ | 0 | | | $ | 11,956 | |
|
Note 54 —SecuritiesAssets Purchased under Resale Agreements and Sold under Repurchase Agreements
Assets Purchased under Resale Agreements
ResaleIn resale agreements, are recorded at the balances at whichCompany is exposed to credit risk for both counterparties and the securities were acquired.underlying collateral. The market valuesCompany manages credit exposure from certain transactions by entering into master netting agreements and collateral arrangements with counterparties. The relevant agreements allow for the efficient closeout of the underlying securities collateralizingtransaction, liquidation and set-off of collateral against the related receivablenet amount owed by the counterparty following a default. It is also the Company’s policy to take possession, where possible, of the assets underlying resale agreements. As a result of the Company’s credit risk mitigation practices with respect to resale agreements including accrued interest, are monitored. Additional collateral may be requested byas described above, the Company from the counterparty when deemed appropriate. Grossdid not hold any reserves for credit impairment with respect to these agreements as of March 31, 2021 and December 31, 2020.
Securities Purchased under Resale Agreements — Total securities purchased under resale agreements were $1.65$1.31 billion and $2.10$1.16 billion as of September 30, 2017March 31, 2021 and December 31, 2016,2020, respectively. The weighted average interest ratesweighted-average yields were 2.30%1.57% and 1.84%2.50% for the three months ended March 31, 2021 and 2020, respectively.
Loans Purchased under Resale Agreements — The Company participated in resale agreements collateralized with loans with multiple counterparties starting in the fourth quarter of 2020. Total loans purchased under resale agreements were $850.0 million and $300.0 million as of September 30, 2017March 31, 2021 and December 31, 2016,2020, respectively. The weighted-average yield was 2.02% for the three months ended March 31, 2021.
Assets Sold under Repurchase Agreements
Long-term repurchase agreements are accounted for as collateralized financing transactions and recorded at — As of March 31, 2021, the balances at which the securities were sold. The collateral for the repurchase agreements is primarilywere comprised of U.S. Treasury securities, U.S. government agency and U.S. government sponsoredgovernment-sponsored enterprise mortgage-backed securities and U.S. government agency and U.S. government sponsored enterprise debtTreasury securities. The Company may have to provide additional collateral for the repurchase agreements, as necessary. Gross repurchase agreements were $450.0$300.0 million as of each of September 30, 2017both March 31, 2021 and December 31, 2016.2020. The weighted averageweighted-average interest rates were 3.56%2.67% and 3.15% as4.10% for the three months ended March 31, 2021 and 2020, respectively. As of September 30, 2017 and DecemberMarch 31, 2016, respectively.2021, all repurchase agreements will mature in 2023.
Balance Sheet Offsetting
The Company’s resale and repurchase agreements are transacted under legally enforceable master repurchase agreements that, provide the Company, in the event of default by the counterparty, provide the Company the right to liquidate securities held and to offset receivables and payables with the same counterparty. The Company nets resale and repurchase transactions with the same counterparty on the Consolidated Balance SheetsSheet when it has a legally enforceable master netting agreement and the transactions are eligible for netting under ASC 210-20-45.210-20-45-11, Balance Sheet Offsetting: Repurchase and Reverse Repurchase Agreements. Collateral acceptedreceived includes securities that are not recognized on the Consolidated Balance Sheets.Sheet. Collateral pledged consists of securities that are not netted on the Consolidated Balance SheetsSheet against the related collateralized liability. Collateral acceptedreceived or pledged in resale and repurchase agreements with other financial institutions may also be sold or re-pledged by the secured party, butand is usually delivered to and held by the third partythird-party trustees. The collateral amounts received/posted are limited for presentation purposes to the related recognized asset/liability balance for each counterparty, and accordingly, do not include excess collateral received/pledged.
The following tables present the resale and repurchase agreements included on the Consolidated Balance SheetsSheet as of September 30, 2017March 31, 2021 and December 31, 2016:2020:
| | | | | | | | | | | | | | | | | | | | | | | | | | | | | | | | |
|
| ($ in thousands) | | March 31, 2021 |
| | | | | | | | | | |
| | Gross
Amounts
of Recognized
Assets | | Gross Amounts
Offset on the
Consolidated
Balance Sheet | | Net Amounts of
Assets Presented
on the Consolidated
Balance Sheet | | Gross Amounts Not Offset on the
Consolidated Balance Sheet | | |
| Assets | | | | | | Net
Amount |
| | | | Collateral Received | |
| Resale agreements | | $ | 2,160,038 | | | $ | 0 | | | $ | 2,160,038 | | | $ | (2,138,721) | | (1) | $ | 21,317 | |
| | | | | | | | | | |
| | Gross
Amounts
of Recognized
Liabilities | | Gross Amounts
Offset on the
Consolidated
Balance Sheet | | Net Amounts of
Liabilities Presented
on the Consolidated
Balance Sheet | | Gross Amounts Not Offset on the
Consolidated Balance Sheet | | |
| Liabilities | | | | | | Net
Amount |
| | | | Collateral Pledged | |
| Repurchase agreements | | $ | 300,000 | | | $ | 0 | | | $ | 300,000 | | | $ | (300,000) | | (2) | $ | 0 | |
|
| | | | | |
| ($ in thousands) | | As of September 30, 2017 | ($ in thousands) | | December 31, 2020 |
| | | Gross Amounts
of Recognized
Assets | | Gross Amounts
Offset on the
Consolidated
Balance Sheets | | Net Amounts of
Assets Presented
on the
Consolidated
Balance Sheets | | Gross Amounts Not Offset on the
Consolidated Balance Sheets | | | |
| | | | Gross
Amounts
of Recognized
Assets | | Gross Amounts
Offset on the
Consolidated
Balance Sheet | | Net Amounts of
Assets Presented
on the Consolidated
Balance Sheet | | Gross Amounts Not Offset on the
Consolidated Balance Sheet | |
| Assets | | Assets | | Net
Amount |
| | Gross Amounts
of Recognized
Assets | | Gross Amounts
Offset on the
Consolidated
Balance Sheets | | Net Amounts of
Assets Presented
on the
Consolidated
Balance Sheets | | Financial
Instruments | | Collateral
Pledged | | Net Amount | | Gross
Amounts
of Recognized
Assets | Gross Amounts
Offset on the
Consolidated
Balance Sheet | Net Amounts of
Assets Presented
on the Consolidated
Balance Sheet | Collateral Received | |
| Resale agreements | | $ | — |
| | $ | (1,240,568 | ) | (2) | $ | 9,432 |
| Resale agreements | | $ | 1,460,000 | | $ | 0 | | $ | 1,460,000 | | $ | (1,458,700) | | (1) | $ | 1,300 | |
| | | | | | | | | | | | | | | | | |
| | | Gross Amounts
of Recognized
Liabilities | | Gross Amounts
Offset on the
Consolidated
Balance Sheets | | Net Amounts of
Liabilities
Presented on the
Consolidated
Balance Sheets | | Gross Amounts Not Offset on the
Consolidated Balance Sheets | | | | Gross
Amounts
of Recognized
Liabilities | | Gross Amounts
Offset on the
Consolidated
Balance Sheet | | Net Amounts of
Liabilities Presented
on the Consolidated
Balance Sheet | | Gross Amounts Not Offset on the
Consolidated Balance Sheet | |
| Liabilities | | Financial
Instruments | | Collateral
Posted | | Net Amount | Liabilities | | Net
Amount |
| Liabilities | | | Gross
Amounts
of Recognized
Liabilities | Gross Amounts
Offset on the
Consolidated
Balance Sheet | Net Amounts of
Liabilities Presented
on the Consolidated
Balance Sheet | Collateral Pledged | |
| | $ | 450,000 |
| | $ | (400,000 | ) | | $ | 50,000 |
| | $ | — |
| | $ | (50,000 | ) | (3) | $ | — |
| Repurchase agreements | | $ | 300,000 | | $ | 0 | | $ | 300,000 | | $ | (300,000) | | (2) | $ | 0 | |
| | | |
(1)Represents the fair value of securities the Company has received under resale agreements, limited to the amount of the recognized asset due from each counterparty for presentation purposes. The application of collateral cannot reduce the net position below zero. Therefore, excess collateral, if any, is not reflected above. |
| | | | | | | | | | | | | | | | | | | | | | | | |
| |
| ($ in thousands) | | As of December 31, 2016 |
| | | Gross Amounts
of Recognized
Assets | | Gross Amounts
Offset on the
Consolidated
Balance Sheets | | Net Amounts of
Assets Presented
on the
Consolidated
Balance Sheets | | Gross Amounts Not Offset on the
Consolidated Balance Sheets | | |
| Assets | | | | | Financial
Instruments | | Collateral
Pledged | | Net Amount |
| Resale agreements | | $ | 2,100,000 |
| | $ | (100,000 | ) | | $ | 2,000,000 |
| | $ | (150,000 | ) | (1) | $ | (1,839,120 | ) | (2) | $ | 10,880 |
|
| | | | | | | | | | | | | |
| | | Gross Amounts
of Recognized
Liabilities | | Gross Amounts
Offset on the
Consolidated
Balance Sheets | | Net Amounts of
Liabilities
Presented
on the
Consolidated
Balance Sheets | | Gross Amounts Not Offset on the
Consolidated Balance Sheets | | |
| Liabilities | | | | | Financial
Instruments | | Collateral
Posted | | Net Amount |
| Repurchase agreements | | $ | 450,000 |
| | $ | (100,000 | ) | | $ | 350,000 |
| | $ | (150,000 | ) | (1) | $ | (200,000 | ) | (3) | $ | — |
|
| |
| |
(1) | Represents financial instruments subject to enforceable master netting arrangements that are not eligible to be offset under ASC 210-20-45 but would be eligible for offsetting to the extent that an event of default has occurred. |
| |
(2) | Represents the fair value of securities the Company has received under resale agreements, limited for table presentation purposes to the amount of the recognized asset due from each counterparty. |
| |
(3) | Represents the fair value of securities the Company has pledged under repurchase agreements, limited for table presentation purposes to the amount of the recognized liability owed to each counterparty. |
(2)Represents the fair value of securities the Company has pledged under repurchase agreements, limited to the amount of the recognized liability due to each counterparty for presentation purpose. The application of collateral cannot reduce the net position below zero. Therefore, excess collateral, if any, is not reflected above.
In addition to the amounts included in the tables above, the Company also has balance sheet netting related to derivatives, referderivatives. Refer to Note 7 6 — Derivatives to the Consolidated Financial Statements in this Form 10-Q for additional information.
Note 65 — Securities
The following tables present the amortized cost, gross unrealized gains and losses and fair value by major categories of available-for-sale investmentAFS debt securities which are carried at fair value, and the held-to-maturity investment security, which is carried at amortized cost, as of September 30, 2017March 31, 2021 and December 31, 2016:2020:
| | | | | | | | | | | | | | | | | | | | | | | | | | | | |
|
| ($ in thousands) | | March 31, 2021 |
| Amortized
Cost | | | | Gross
Unrealized
Gains | | Gross
Unrealized
Losses | | Fair
Value |
| AFS debt securities: | | | | | | | | | | |
| U.S. Treasury securities | | $ | 841,711 | | | | | $ | 328 | | | $ | (15,697) | | | $ | 826,342 | |
| U.S. government agency and U.S. government-sponsored enterprise debt securities | | 1,236,446 | | | | | 5,145 | | | (47,586) | | | 1,194,005 | |
| U.S. government agency and U.S. government-sponsored enterprise mortgage-backed securities: | | | | | | | | | | |
| Commercial mortgage-backed securities | | 1,178,238 | | | | | 16,407 | | | (25,254) | | | 1,169,391 | |
| Residential mortgage-backed securities | | 2,271,645 | | | | | 17,026 | | | (41,265) | | | 2,247,406 | |
| Municipal securities | | 417,676 | | | | | 7,348 | | | (4,959) | | | 420,065 | |
| Non-agency mortgage-backed securities: | | | | | | | | | | |
| Commercial mortgage-backed securities | | 281,099 | | | | | 4,311 | | | (4,383) | | | 281,027 | |
| Residential mortgage-backed securities | | 525,560 | | | | | 1,599 | | | (3,659) | | | 523,500 | |
| Corporate debt securities | | 517,309 | | | | | 4,677 | | | (25,343) | | | 496,643 | |
| Foreign government bonds | | 278,100 | | | | | 320 | | | (2,092) | | | 276,328 | |
| Asset-backed securities | | 62,762 | | | | | 292 | | | (14) | | | 63,040 | |
| CLOs | | 294,000 | | | | | 0 | | | (2,534) | | | 291,466 | |
| Total AFS debt securities | | $ | 7,904,546 | | | | | $ | 57,453 | | | $ | (172,786) | | | $ | 7,789,213 | |
|
|
| | | | | | | | | | | | | | | | |
| |
| | | As of September 30, 2017 |
| ($ in thousands) | | Amortized
Cost | | Gross
Unrealized
Gains | | Gross
Unrealized
Losses | | Fair
Value |
| Available-for-sale investment securities: | | |
| | |
| | |
| | |
|
| U.S. Treasury securities | | $ | 533,035 |
| | $ | — |
| | $ | (6,703 | ) | | $ | 526,332 |
|
| U.S. government agency and U.S. government sponsored enterprise debt securities | | 191,727 |
| | 81 |
| | (2,623 | ) | | 189,185 |
|
| U.S. government agency and U.S. government sponsored enterprise mortgage-backed securities: | | |
| | |
| | |
| | |
|
| Commercial mortgage-backed securities | | 321,943 |
| | 326 |
| | (7,097 | ) | | 315,172 |
|
| Residential mortgage-backed securities | | 1,154,026 |
| | 4,790 |
| | (7,882 | ) | | 1,150,934 |
|
| Municipal securities | | 116,798 |
| | 900 |
| | (456 | ) | | 117,242 |
|
| Non-agency residential mortgage-backed securities: | | | | | | | | |
|
Investment grade (1) | | 9,680 |
| | 21 |
| | (7 | ) | | 9,694 |
|
| Corporate debt securities: | | | | | | | | |
|
Investment grade (1) | | 2,464 |
| | — |
| | (137 | ) | | 2,327 |
|
Non-investment grade (1) | | 10,191 |
| | — |
| | (576 | ) | | 9,615 |
|
| Foreign bonds: | | | | | | | |
|
|
Investment grade (1) (2) | | 505,395 |
| | 229 |
| | (16,484 | ) | | 489,140 |
|
Other securities (3) | | 147,504 |
| | 3 |
| | (372 | ) | | 147,135 |
|
| Total available-for-sale investment securities | | $ | 2,992,763 |
| | $ | 6,350 |
| | $ | (42,337 | ) | | $ | 2,956,776 |
|
| Held-to-maturity investment security: | | | | | | | | |
| Non-agency commercial mortgage-backed security | | $ | — |
| | $ | — |
| | $ | — |
| | $ | — |
|
| Total investment securities | | $ | 2,992,763 |
| | $ | 6,350 |
| | $ | (42,337 | ) | | $ | 2,956,776 |
|
| | | | | | | | | |
| | | | | | | | | |
| | | As of December 31, 2016 |
| ($ in thousands) | | Amortized
Cost | | Gross
Unrealized
Gains | | Gross
Unrealized
Losses | | Fair
Value |
| Available-for-sale investment securities: | | |
| | |
| | |
| | |
|
| U.S. Treasury securities | | $ | 730,287 |
| | $ | 21 |
| | $ | (9,829 | ) | | $ | 720,479 |
|
| U.S. government agency and U.S. government sponsored enterprise debt securities | | 277,891 |
| | 224 |
| | (3,249 | ) | | 274,866 |
|
| U.S. government agency and U.S. government sponsored enterprise mortgage-backed securities: | | |
| | |
| | |
| | |
|
| Commercial mortgage-backed securities | | 272,672 |
| | 345 |
| | (6,218 | ) | | 266,799 |
|
| Residential mortgage-backed securities | | 1,266,372 |
| | 3,924 |
| | (11,549 | ) | | 1,258,747 |
|
| Municipal securities | | 148,302 |
| | 1,252 |
| | (1,900 | ) | | 147,654 |
|
| Non-agency residential mortgage-backed securities: | | | | | | | | |
|
Investment grade (1) | | 11,592 |
| | — |
| | (115 | ) | | 11,477 |
|
| Corporate debt securities: | | | | | | | | |
|
Investment grade (1) | | 222,190 |
| | 562 |
| | (375 | ) | | 222,377 |
|
Non-investment grade (1) | | 10,191 |
| | — |
| | (1,018 | ) | | 9,173 |
|
| Foreign bonds: | | | | | | | | |
Investment grade (1) (2) | | 405,443 |
| | 30 |
| | (21,579 | ) | | 383,894 |
|
| Other securities | | 40,501 |
| | 337 |
| | (509 | ) | | 40,329 |
|
| Total available-for-sale investment securities | | $ | 3,385,441 |
| | $ | 6,695 |
| | $ | (56,341 | ) | | $ | 3,335,795 |
|
| Held-to-maturity investment security: | | | | | | | | |
Non-agency commercial mortgage-backed security (3) | | $ | 143,971 |
| | $ | 622 |
| | $ | — |
| | $ | 144,593 |
|
| Total investment securities | | $ | 3,529,412 |
| | $ | 7,317 |
| | $ | (56,341 | ) | | $ | 3,480,388 |
|
| | | | | | | | | |
| |
(1) | Available-for-sale investment securities rated BBB- or higher by Standard &Poor’s (“S&P”) or Baa3 or higher by Moody’s are considered investment grade. Conversely, available-for-sale investment securities rated lower than BBB- by S&P or lower than Baa3 by Moody’s are considered non-investment grade. Classifications are based on the lower of the credit ratings by S&P or Moody’s. |
| |
(2) | Fair values of foreign bonds include $458.9 million and $353.6 million of multilateral development bank bonds as of September 30, 2017 and December 31, 2016, respectively. |
| |
(3) | During the third quarter of 2017, the Company transferred a non-agency commercial mortgage-backed security with a net carrying amount of $115.6 million from held-to-maturity to available-for-sale. |
| | | | | | | | | | | | | | | | | | | | | | | | | | | | |
|
| ($ in thousands) | | December 31, 2020 |
| Amortized
Cost | | | | Gross
Unrealized
Gains | | Gross
Unrealized
Losses | | Fair
Value |
| AFS debt securities: | | | | | | | | | | |
| U.S. Treasury securities | | $ | 50,310 | | | | | $ | 451 | | | $ | 0 | | | $ | 50,761 | |
| U.S. government agency and U.S. government-sponsored enterprise debt securities | | 806,814 | | | | | 8,765 | | | (1,260) | | | 814,319 | |
| U.S. government agency and U.S. government-sponsored enterprise mortgage-backed securities: | | | | | | | | | | |
| Commercial mortgage-backed securities | | 1,125,174 | | | | | 34,306 | | | (5,710) | | | 1,153,770 | |
| Residential mortgage-backed securities | | 1,634,553 | | | | | 27,952 | | | (1,611) | | | 1,660,894 | |
| Municipal securities | | 382,573 | | | | | 13,588 | | | (88) | | | 396,073 | |
| Non-agency mortgage-backed securities: | | | | | | | | | | |
| Commercial mortgage-backed securities | | 234,965 | | | | | 6,107 | | | (1,230) | | | 239,842 | |
| Residential mortgage-backed securities | | 288,520 | | | | | 1,761 | | | (506) | | | 289,775 | |
| Corporate debt securities | | 406,323 | | | | | 3,493 | | | (3,848) | | | 405,968 | |
| Foreign government bonds | | 183,828 | | | | | 163 | | | (1,460) | | | 182,531 | |
| Asset-backed securities | | 63,463 | | | | | 10 | | | (242) | | | 63,231 | |
| CLOs | | 294,000 | | | | | 0 | | | (6,506) | | | 287,494 | |
| Total AFS debt securities | | $ | 5,470,523 | | | | | $ | 96,596 | | | $ | (22,461) | | | $ | 5,544,658 | |
|
As of March 31, 2021 and December 31, 2020, the amortized cost of AFS debt securities excluded accrued interest receivables of $22.9 million and $22.3 million, respectively, which are included in Other assets on the Consolidated Balance Sheet. For the Company’s accounting policy related to AFS debt securities’ accrued interest receivable, see Note 1 — Summary of Significant Accounting Policies — Allowance for Credit Losses on Available-for-Sale Debt Securities to the Consolidated Financial Statements in the Company’s 2020 Form 10-K.
Unrealized Losses
The following tables present the fair value and the associated gross unrealized losses and related fair values of the Company’s investment portfolio,AFS debt securities, aggregated by investment category and the length of time that individualthe securities have been in a continuous unrealized loss position as of September 30, 2017March 31, 2021 and December 31, 2016:2020.
| | | | | | | | | | | | | | | | | | | | | | | | | | | | | | | | | | | | | | |
|
| ($ in thousands) | | March 31, 2021 |
| Less Than 12 Months | | 12 Months or More | | Total |
| Fair
Value | | Gross
Unrealized
Losses | | Fair
Value | | Gross
Unrealized
Losses | | Fair
Value | | Gross
Unrealized
Losses |
| AFS debt securities: | | | | | | | | | | | | |
| U.S. Treasury securities | | $ | 775,801 | | | $ | (15,697) | | | $ | 0 | | | $ | 0 | | | $ | 775,801 | | | $ | (15,697) | |
| U.S. government agency and U.S. government sponsored enterprise debt securities | | 954,894 | | | (47,586) | | | 0 | | | 0 | | | 954,894 | | | (47,586) | |
| U.S. government agency and U.S. government-sponsored enterprise mortgage-backed securities: | | | | | | | | | | | | |
| Commercial mortgage-backed securities | | 615,193 | | | (25,203) | | | 3,474 | | | (51) | | | 618,667 | | | (25,254) | |
| Residential mortgage-backed securities | | 1,464,574 | | | (41,264) | | | 358 | | | (1) | | | 1,464,932 | | | (41,265) | |
| Municipal securities | | 199,225 | | | (4,959) | | | 0 | | | 0 | | | 199,225 | | | (4,959) | |
| Non-agency mortgage-backed securities: | | | | | | | | | | | | |
| Commercial mortgage-backed securities | | 114,971 | | | (4,374) | | | 15,578 | | | (9) | | | 130,549 | | | (4,383) | |
| Residential mortgage-backed securities | | 391,444 | | | (3,659) | | | 0 | | | 0 | | | 391,444 | | | (3,659) | |
| Corporate debt securities | | 347,934 | | | (25,316) | | | 9,974 | | | (27) | | | 357,908 | | | (25,343) | |
| Foreign government bonds | | 155,299 | | | (2,092) | | | 0 | | | 0 | | | 155,299 | | | (2,092) | |
| Asset-backed securities | | 11,904 | | | (14) | | | 0 | | | 0 | | | 11,904 | | | (14) | |
| CLOs | | 0 | | | 0 | | | 291,466 | | | (2,534) | | | 291,466 | | | (2,534) | |
| Total AFS debt securities | | $ | 5,031,239 | | | $ | (170,164) | | | $ | 320,850 | | | $ | (2,622) | | | $ | 5,352,089 | | | $ | (172,786) | |
|
| | | | | | | | | | | | | | | | | | | | | | | | | | | | | | | | | | | | | | |
|
| ($ in thousands) | | December 31, 2020 |
| Less Than 12 Months | | 12 Months or More | | Total |
| Fair
Value | | Gross
Unrealized
Losses | | Fair
Value | | Gross
Unrealized
Losses | | Fair
Value | | Gross
Unrealized
Losses |
| AFS debt securities: | | | | | | | | | | | | |
| U.S. Treasury securities | | $ | 352,521 | | | $ | (1,260) | | | $ | 0 | | | $ | 0 | | | $ | 352,521 | | | $ | (1,260) | |
| | | | | | | | | | | | |
| U.S. government agency and U.S. government-sponsored enterprise mortgage-backed securities: | | | | | | | | | | | | |
| Commercial mortgage-backed securities | | 292,596 | | | (5,656) | | | 3,543 | | | (54) | | | 296,139 | | | (5,710) | |
| Residential mortgage-backed securities | | 342,561 | | | (1,611) | | | 0 | | | 0 | | | 342,561 | | | (1,611) | |
| Municipal securities | | 24,529 | | | (88) | | | 0 | | | 0 | | | 24,529 | | | (88) | |
| Non-agency mortgage-backed securities: | | | | | | | | | | | | |
| Commercial mortgage-backed securities | | 58,738 | | | (1,230) | | | 7,920 | | | 0 | | | 66,658 | | | (1,230) | |
| Residential mortgage-backed securities | | 90,156 | | | (506) | | | 0 | | | 0 | | | 90,156 | | | (506) | |
| Corporate debt securities | | 251,674 | | | (3,645) | | | 9,798 | | | (203) | | | 261,472 | | | (3,848) | |
| Foreign government bonds | | 106,828 | | | (1,460) | | | 0 | | | 0 | | | 106,828 | | | (1,460) | |
| Asset-backed securities | | 0 | | | 0 | | | 34,104 | | | (242) | | | 34,104 | | | (242) | |
| CLOs | | 0 | | | 0 | | | 287,494 | | | (6,506) | | | 287,494 | | | (6,506) | |
| Total AFS debt securities | | $ | 1,519,603 | | | $ | (15,456) | | | $ | 342,859 | | | $ | (7,005) | | | $ | 1,862,462 | | | $ | (22,461) | |
|
|
| | | | | | | | | | | | | | | | | | | | | | | | |
| |
| | | As of September 30, 2017 |
| ($ in thousands) | | Less Than 12 Months | | 12 Months or More | | Total |
| | Fair Value | | Gross Unrealized Losses | | Fair Value | | Gross Unrealized Losses | | Fair Value | | Gross Unrealized Losses |
| Available-for-sale investment securities: | | |
| | |
| | |
| | |
| | |
| | |
|
| U.S. Treasury securities | | $ | 415,507 |
| | $ | (4,615 | ) | | $ | 110,825 |
| | $ | (2,088 | ) | | $ | 526,332 |
| | $ | (6,703 | ) |
| U.S. government agency and U.S. government sponsored enterprise debt securities | | 96,681 |
| | (367 | ) | | 54,512 |
| | (2,256 | ) | | 151,193 |
| | (2,623 | ) |
| U.S. government agency and U.S. government sponsored enterprise mortgage-backed securities: | | |
| | |
| | |
| | |
| | |
| | |
|
| Commercial mortgage-backed securities | | 120,070 |
| | (1,721 | ) | | 155,128 |
| | (5,376 | ) | | 275,198 |
| | (7,097 | ) |
| Residential mortgage-backed securities | | 365,038 |
| | (2,344 | ) | | 288,768 |
| | (5,538 | ) | | 653,806 |
| | (7,882 | ) |
| Municipal securities | | 22,010 |
| | (222 | ) | | 11,256 |
| | (234 | ) | | 33,266 |
| | (456 | ) |
| Non-agency residential mortgage-backed securities: | | |
| | |
| | |
| | |
| | |
| | |
|
| Investment grade | | 4,715 |
| | (7 | ) | | — |
| | — |
| | 4,715 |
| | (7 | ) |
| Corporate debt securities: | | |
| | |
| | |
| | |
| | |
| | |
|
| Investment grade | | — |
| | — |
| | 2,327 |
| | (137 | ) | | 2,327 |
| | (137 | ) |
| Non-investment grade | | — |
| | — |
| | 9,615 |
| | (576 | ) | | 9,615 |
| | (576 | ) |
| Foreign bonds: | | | | | | | | | | | | |
| Investment grade | | 73,619 |
| | (873 | ) | | 344,298 |
| | (15,611 | ) | | 417,917 |
| | (16,484 | ) |
| Other securities | | 31,223 |
| | (372 | ) | | — |
| | — |
| | 31,223 |
| | (372 | ) |
| Total available-for-sale investment securities | | $ | 1,128,863 |
| | $ | (10,521 | ) | | $ | 976,729 |
| | $ | (31,816 | ) | | $ | 2,105,592 |
| | $ | (42,337 | ) |
| Held-to-maturity investment security: | | | | | | | | | | | | |
| Non-agency commercial mortgage-backed security | | $ | — |
| | $ | — |
| | $ | — |
| | $ | — |
| | $ | — |
| | $ | — |
|
| Total investment securities | | $ | 1,128,863 |
| | $ | (10,521 | ) | | $ | 976,729 |
| | $ | (31,816 | ) | | $ | 2,105,592 |
| | $ | (42,337 | ) |
| | | | | | | | | | | | | |
| | | | | | | | | | | | | |
| | | As of December 31, 2016 |
| ($ in thousands) | | Less Than 12 Months | | 12 Months or More | | Total |
| | Fair Value | | Gross Unrealized Losses | | Fair Value | | Gross Unrealized Losses | | Fair Value | | Gross Unrealized Losses |
| Available-for-sale investment securities: | | |
| | |
| | |
| | |
| | |
| | |
|
| U.S. Treasury securities | | $ | 670,268 |
| | $ | (9,829 | ) | | $ | — |
| | $ | — |
| | $ | 670,268 |
| | $ | (9,829 | ) |
| U.S. government agency and U.S. government sponsored enterprise debt securities | | 203,901 |
| | (3,249 | ) | | — |
| | — |
| | 203,901 |
| | (3,249 | ) |
| U.S. government agency and U.S. government sponsored enterprise mortgage-backed securities: | | | | | | | | | | |
| | |
|
| Commercial mortgage-backed securities | | 202,106 |
| | (5,452 | ) | | 29,201 |
| | (766 | ) | | 231,307 |
| | (6,218 | ) |
| Residential mortgage-backed securities | | 629,324 |
| | (9,594 | ) | | 119,603 |
| | (1,955 | ) | | 748,927 |
| | (11,549 | ) |
| Municipal securities | | 57,655 |
| | (1,699 | ) | | 2,692 |
| | (201 | ) | | 60,347 |
| | (1,900 | ) |
| Non-agency residential mortgage-backed securities: | | | | | | | | | | |
| | |
|
| Investment grade | | 5,033 |
| | (101 | ) | | 6,444 |
| | (14 | ) | | 11,477 |
| | (115 | ) |
| Corporate debt securities: | | | | | | | | | | |
| | |
|
| Investment grade | | — |
| | — |
| | 71,667 |
| | (375 | ) | | 71,667 |
| | (375 | ) |
| Non-investment grade | | — |
| | — |
| | 9,173 |
| | (1,018 | ) | | 9,173 |
| | (1,018 | ) |
| Foreign bonds: | | | | | | | | | | | | |
| Investment grade | | 363,618 |
| | (21,327 | ) | | 14,258 |
| | (252 | ) | | 377,876 |
| | (21,579 | ) |
| Other securities | | 30,991 |
| | (509 | ) | | — |
| | — |
| | 30,991 |
| | (509 | ) |
| Total available-for-sale investment securities | | $ | 2,162,896 |
| | $ | (51,760 | ) | | $ | 253,038 |
| | $ | (4,581 | ) | | $ | 2,415,934 |
| | $ | (56,341 | ) |
| Held-to-maturity investment security: | | | | | | | | | | | | |
| Non-agency commercial mortgage-backed security | | $ | — |
| | $ | — |
| | $ | — |
| | $ | — |
| | $ | — |
| | $ | — |
|
| Total investment securities | | $ | 2,162,896 |
| | $ | (51,760 | ) | | $ | 253,038 |
| | $ | (4,581 | ) | | $ | 2,415,934 |
| | $ | (56,341 | ) |
| |
Allowance for Credit Losses
For each
Each reporting period, the Company examines all individual securitiesassesses each AFS debt security that areis in an unrealized loss position for OTTI.to determine whether the decline in fair value below the amortized cost basis resulted from a credit loss or other factors. For a discussion of the factors and criteria the Company uses in analyzing securities for OTTI,impairment related to credit losses, see Note 1 — Summary of Significant Accounting Policies — Allowance for Credit Losses on Available-for-Sale InvestmentDebt Securitiestoto the Consolidated Financial Statements ofin the Company’s 20162020 Form 10-K.
The gross unrealized losses presented in the above tables were primarily attributable to the yield curve movements and widened spreads. Securities that were in unrealized loss positions as of March 31, 2021 were mainly comprised of the following:
•U.S. government agency and U.S. government-sponsored enterprise mortgage-backed securities — The market value decline as of March 31, 2021 was primarily due to interest rate movement. Since these securities (issued by Fannie Mae, Ginnie Mae and Freddie Mac) are guaranteed or sponsored by agencies of the U.S. government, and the credit profiles are strong (rated Aaa, AA+ and AAA by Moody’s Investors Service (“Moody’s”), Standard and Poor's (“S&P”) and Fitch Ratings (“Fitch”), respectively), the Company expects to receive all contractual interest payments on-time, and believes the risk of credit losses on these securities is remote.
•U.S. government agency and U.S. government-sponsored enterprise debt securities — The market value decline as of March 31, 2021 was primarily due to interest rate movement. The securities consisted of the debt securities issued by:
–Federal Farm Credit Bank, Fannie Mae, Freddie Mac, and U.S. International Development Finance Corporation (rated Aaa, AA+ and AAA rated by Moody’s, S&P and Fitch, respectively).
–FHLB debt obligations (rated Aaa and AA+ rated by Moody’s and S&P, respectively).
As these securities are guaranteed or sponsored by the U.S. government and the credit profiles are strong, the Company expects to receive all contractual interest payments on time, and believes the risk of credit losses on these securities is remote.
•Corporate debt securities — The market value decline as of March 31, 2021 was primarily due to interest rate movement and the widening in additionspreads. Since credit profiles of the securities are strong (rated BBB- or higher by Moody’s, S&P, Kroll Bond Rating Agency and Fitch), and the contractual payments from these bonds have been and are expected to widened liquiditybe received on time, the Company believes that the risk of credit losses on these securities is remote.
The impact of the Coronavirus Disease 2019 (“COVID-19”) pandemic has been muted by the government’s aggressive monetary policy, including benchmark rate cuts, and various relief measures that contributed to the gradual and steady recovery of the market to pre-pandemic levels. Overall, the Company believes that the credit spreads.support levels of the AFS debt securities are strong and, based on current assessments and macroeconomic forecasts, expects that full contractual cash flows will be received even if near-term credit performance could possibly suffer from future unpredictable impacts of the COVID-19 pandemic.
As of March 31, 2021 and December 31, 2020, the Company had the intent to hold the AFS debt securities with unrealized losses through the anticipated recovery period and it was more-likely-than-not that the Company will not have to sell these securities before recovery of their amortized cost. The issuers of these securities have not, to the Company’s knowledge, established any cause for default on these securities. These securities have fluctuated in value since their purchase dates as market interest rates have fluctuated. The Company believes that the gross unrealized losses detailed in the previous tables are temporary and not due to reasons of credit quality. As a result, the Company expects to recover the entire amortized cost basis of these securities. Accordingly, no impairment lossthere was recorded on the Company’s Consolidated Statements of Income0 allowance for the three and nine months ended September 30, 2017 and 2016. As of September 30, 2017, the Company had 146 available-for-sale investment securities in an unrealized loss position with no credit impairment, primarily comprised of 79 U.S. government agency and U.S. government sponsored enterprise mortgage-backed securities, 22 U.S. Treasury securities and 14 investment grade foreign bonds. In comparison,losses as of March 31, 2021 and December 31, 2016, the Company had 170 available-for-sale investment securities in an unrealized loss position with no2020 provided against these securities. In addition, there was 0 provision for credit impairment, primarily comprised of 82 U.S. government agency and U.S. government sponsored enterprise mortgage-backed securities, 26 U.S. Treasury securities and 13 investment grade foreign bonds.
During the first quarter of 2016, the Company obtained a non-agency commercial mortgage-backed security, through the securitization of multifamily real estate loans, which was classified as held-to-maturity and recorded at amortized cost. During the third quarter of 2017, the Company transferred this non-agency commercial mortgage-backed security with a net carrying amount of $115.6 million from held-to-maturity to available-for-sale. The transfer reflects the Company’s intent to sell the security under active liquidity management.
Other-Than-Temporary Impairment
No OTTI credit losses were recognized for the three and nine months ended September 30, 2017March 31, 2021 and 2016.2020.
Realized Gains and Losses
The following table presents the proceeds, gross realized gains and losses, and tax expense related to the sales of available-for-sale investmentAFS debt securities for the three and nine months ended September 30, 2017March 31, 2021 and 2016:2020:
| | | | | | | | | | | | | | | | | | |
|
| ($ in thousands) | | Three Months Ended March 31, | | |
| 2021 | | 2020 | | | | |
| | | | | | | | |
| Gross realized gains | | $ | 192 | | | $ | 1,529 | | | | | |
| Related tax expense | | $ | 57 | | | $ | 452 | | | | | |
|
|
| | | | | | | | | | | | | | | | |
| |
| ($ in thousands) | | Three Months Ended September 30, | | Nine Months Ended September 30, |
| | 2017 | | 2016 | | 2017 | | 2016 |
| Proceeds from sales | | $ | 124,887 |
| | $ | 143,513 |
| | $ | 676,776 |
| | $ | 1,008,256 |
|
| Gross realized gains | | $ | 1,539 |
| | $ | 1,790 |
| | $ | 6,733 |
| | $ | 8,593 |
|
| Gross realized losses | | $ | — |
| | $ | — |
| | $ | — |
| | $ | (125 | ) |
| Related tax expense | | $ | 647 |
| | $ | 752 |
| | $ | 2,831 |
| | $ | 3,560 |
|
| |
ScheduledContractual Maturities of InvestmentAvailable-for-Sale Debt Securities
The following table presents the scheduledcontractual maturities of available-for-sale investmentAFS debt securities as of September 30, 2017:
|
| | | | | | | | |
| |
| ($ in thousands) | | Amortized Cost | | Estimated Fair Value |
| Due within one year | | $ | 638,257 |
| | $ | 621,343 |
|
| Due after one year through five years | | 629,892 |
| | 623,058 |
|
| Due after five years through ten years | | 176,117 |
| | 172,902 |
|
| Due after ten years | | 1,548,497 |
| | 1,539,473 |
|
| Total available-for-sale investment securities | | $ | 2,992,763 |
| | $ | 2,956,776 |
|
| |
ActualMarch 31, 2021. Expected maturities of mortgage-backed securities canwill differ from contractual maturities becauseon certain securities as the issuers and borrowers of the underlying collateral may have the right to call or prepay obligations. In addition, factors such as prepaymentsobligations with or without prepayment penalties.
| | | | | | | | | | | | | | |
|
| ($ in thousands) | | Amortized Cost | | Fair Value |
| Due within one year | | $ | 1,403,404 | | | $ | 1,347,808 | |
| Due after one year through five years | | 688,387 | | | 681,602 | |
| Due after five years through ten years | | 1,427,893 | | | 1,414,362 | |
| Due after ten years | | 4,384,862 | | | 4,345,441 | |
| Total AFS debt securities | | $ | 7,904,546 | | | $ | 7,789,213 | |
|
As of March 31, 2021 and interest rates may affect the yields on the carrying values of mortgage-backed securities.
Available-for-sale investmentDecember 31, 2020, AFS debt securities with fair valuesvalue of $584.9$590.9 million and $767.4$588.5 million, as of September 30, 2017 and December 31, 2016, respectively, were pledged to secure public deposits, repurchase agreements the Federal Reserve Bank’s discount window and for other purposes required or permitted by law.
Restricted Equity Securities
Restricted equity securities include stock of the Federal Reserve Bank and of the FHLB. Restricted equity securities are carried at cost as these securities do not have a readily determinable fair value. The following table presents the restricted equity securities on the Consolidated Balance Sheet as of September 30, 2017March 31, 2021 and December 31, 2016:2020:
| | | | | | | | | | | | | | |
|
| ($ in thousands) | | March 31, 2021 | | December 31, 2020 |
| Federal Reserve Bank of San Francisco (“FRBSF”) stock | | $ | 59,453 | | | $ | 59,249 | |
| FHLB stock | | 23,797 | | | 23,797 | |
| Total restricted equity securities | | $ | 83,250 | | | $ | 83,046 | |
|
|
| | | | | | | | |
| | | | | |
| ($ in thousands) | | September 30, 2017 | | December 31, 2016 |
| Federal Reserve Bank stock | | $ | 56,072 |
| | $ | 55,525 |
|
| FHLB stock | | 17,250 |
| | 17,250 |
|
| Total | | $ | 73,322 |
| | $ | 72,775 |
|
| | | | | |
Note 76 — Derivatives
The Company uses derivatives to manage exposure to market risk, primarily including interest rate risk andor foreign currency risk, andas well as to assist customers with their risk management objectives. The Company’s goal is to manage interest rate sensitivity and volatility so that movements in interest rates aredo not significant tosignificantly affect earnings or capital. The Company also uses foreign exchange contracts to manage the foreign exchange rate risk associated with certain foreign currency-denominated assets and liabilities, as well as the Company’sBank’s investment in its China subsidiary, East West Bank (China) Limited. The Company recognizes all derivatives on the Consolidated Balance SheetsSheet at fair value. While the Company designates certain derivatives as hedging instruments in a qualifying hedge accounting relationship, other derivatives consist of economic hedges. For additional information on the Company’s derivatives and hedging activities, seeNote 1 — Summary of Significant Accounting Policies — Significant Accounting Policies — Derivativesto the Consolidated Financial Statements of the Company’s 20162020 Form 10-K.
The following table presents the total notional amounts and gross fair valuevalues of the Company’s derivatives, as well as the balance sheet netting adjustments on an aggregate basis as of September 30, 2017March 31, 2021 and December 31, 2016:2020. The derivative assets and liabilities are presented on a gross basis prior to the application of bilateral collateral and master netting agreements, but after the variation margin payments with central clearing organizations have been applied as settlement, as applicable. Total derivative assets and liabilities are adjusted to take into consideration the effects of legally enforceable master netting agreements and cash collateral received or paid as of March 31, 2021 and December 31, 2020. The resulting net derivative asset and liability fair values are included in Other assets and Accrued expenses and other liabilities, respectively, on the Consolidated Balance Sheet.
| | | | | | | | | | | | | | | | | | | | | | | | | | | | | | | | | | | | | | |
|
| ($ in thousands) | | March 31, 2021 | | December 31, 2020 |
| Notional
Amount | | Fair Value | | Notional
Amount | | Fair Value |
| | Derivative
Assets | | Derivative
Liabilities | | | Derivative
Assets | | Derivative
Liabilities |
| Derivatives designated as hedging instruments: | | | | | | | | | | | | |
| | | | | | | | | | | | |
| | | | | | | | | | | | |
| Cash flow hedges: | | | | | | | | | | | | |
| Interest rate contracts | | $ | 275,000 | | | $ | 0 | | | $ | 1,258 | | | $ | 275,000 | | | $ | 0 | | | $ | 1,864 | |
| Net investment hedges: | | | | | | | | | | | | |
| Foreign exchange contracts | | 83,936 | | | 908 | | | 0 | | | 84,269 | | | 0 | | | 235 | |
| Total derivatives designated as hedging instruments | | $ | 358,936 | | | $ | 908 | | | $ | 1,258 | | | $ | 359,269 | | | $ | 0 | | | $ | 2,099 | |
| Derivatives not designated as hedging instruments: | | | | | | | | | | | | |
| Interest rate contracts | | $ | 17,891,960 | | | $ | 319,049 | | | $ | 229,032 | | | $ | 18,155,678 | | | $ | 489,132 | | | $ | 315,834 | |
| Foreign exchange contracts | | 4,036,958 | | | 38,654 | | | 27,287 | | | 3,108,488 | | | 30,300 | | | 22,524 | |
| Credit contracts | | 76,992 | | | 5 | | | 153 | | | 76,992 | | | 13 | | | 206 | |
| Equity contracts | | 0 | | | 272 | | | 0 | | | 0 | | | 858 | | | 0 | |
| Commodity contracts | | 0 | | | 98,429 | | | 86,405 | | | 0 | | | 82,451 | | | 84,165 | |
| Total derivatives not designated as hedging instruments | | $ | 22,005,910 | | | $ | 456,409 | | | $ | 342,877 | | | $ | 21,341,158 | | | $ | 602,754 | | | $ | 422,729 | |
| Gross derivative assets/liabilities | | | | $ | 457,317 | | | $ | 344,135 | | | | | $ | 602,754 | | | $ | 424,828 | |
| Less: Master netting agreements | | | | (100,454) | | | (100,454) | | | | | (93,063) | | | (93,063) | |
| Less: Cash collateral received/paid | | | | (7,781) | | | (86,233) | | | | | (8,449) | | | (91,634) | |
| Net derivative assets/liabilities | | | | $ | 349,082 | | | $ | 157,448 | | | | | $ | 501,242 | | | $ | 240,131 | |
|
|
| | | | | | | | | | | | | | | | | | | | | | | | |
| |
| ($ in thousands) | | September 30, 2017 | | December 31, 2016 |
| | Notional Amount | | Fair Value | | Notional Amount | | Fair Value |
| | | Derivative Assets (1) | | Derivative Liabilities (1) | | | Derivative Assets (1) | | Derivative Liabilities (1) |
| Derivatives designated as hedging instruments: | | | | | | | | | | | | |
| Interest rate swaps on certificates of deposit | | $ | 42,566 |
| | $ | — |
| | $ | 6,648 |
| | $ | 48,365 |
| | $ | — |
| | $ | 5,976 |
|
| Foreign currency forward contracts | | — |
| | — |
| | — |
| | 83,026 |
| | 4,325 |
| | — |
|
| Total derivatives designated as hedging instruments | | $ | 42,566 |
| | $ | — |
| | $ | 6,648 |
| | $ | 131,391 |
| | $ | 4,325 |
| | $ | 5,976 |
|
| Derivatives not designated as hedging instruments: | | | | | | | | | | | | |
| Interest rate swaps and options | | $ | 8,742,980 |
| | $ | 64,822 |
| | $ | 64,212 |
| | $ | 7,668,482 |
| | $ | 67,578 |
| | $ | 65,131 |
|
| Foreign exchange contracts | | 1,131,414 |
| | 14,187 |
| | 20,054 |
| | 767,764 |
| | 11,874 |
| | 11,213 |
|
| RPAs | | 68,387 |
| | 2 |
| | 1 |
| | 71,414 |
| | 3 |
| | 3 |
|
| Warrants | | — |
| (2) | 1,455 |
| | — |
| | — |
| | — |
| | — |
|
| Total derivatives not designated as hedging instruments | | $ | 9,942,781 |
| | $ | 80,466 |
| | $ | 84,267 |
| | $ | 8,507,660 |
| | $ | 79,455 |
| | $ | 76,347 |
|
| |
| |
(1) | Derivative assets and derivative liabilities are included in Other assets and Accrued expenses and other liabilities, respectively,on the Consolidated Balance Sheets.
|
| |
(2) | The Company held four warrants in public companies and 32 warrants in private companies as of September 30, 2017. |
(1)The Company held equity contracts in 18 private companies as of March 31, 2021. In comparison, the Company held equity contracts in 2 public companies and 17 private companies as of December 31, 2020.
(2)The notional amount of the Company’s commodity contracts entered with its customers totaled 8,258 thousand barrels of crude oil and 102,996 thousand units of natural gas, measured in million British thermal units (“MMBTUs”) as of March 31, 2021. In comparison, the notional amount of the Company’s commodity contracts entered with its customers totaled 6,321 thousand barrels of crude oil and 109,635 thousand MMBTUs of natural gas as of December 31, 2020. The Company simultaneously entered into the offsetting commodity contracts with mirrored terms with third-party financial institutions.
Derivatives Designated as Hedging Instruments
Interest Rate Swaps on Certificates of Deposit Fair Value Hedges — The Company is exposedentered into interest rate swaps designated as fair value hedges to hedge changes in the fair value of certain fixed rate certificates of deposit due to changes in the benchmark interest rate, London Interbank Offered Rate. Interestrate. The interest rate swaps designated as fair value hedges involveinvolved the receiptexchange of fixed rate amounts from a counterparty in exchange for the Company making variable ratevariable-rate payments over the life of the agreements without the exchange ofexchanging the underlying notional amount.
Asamounts. During the fourth quarter of September 30, 2017 and December 31, 2016,2020, both the total notional amounts of thehedging interest rate swaps onand hedged certificates of deposit were $42.6 million and $48.4 million, respectively. The fair value liabilitiescalled.
As of the interest rate swaps were $6.6 million and $6.0 million as of September 30, 2017both March 31, 2021 and December 31, 2016, respectively.
The following table presents the net2020, there were 0 fair value hedges or hedged certificates of deposit outstanding. There were 0 gains (losses)or losses recognized on the Consolidated StatementsStatement of Income related to the derivatives designated as fair value hedges for the three and nine months ended September 30, 2017March 31, 2021. The net gains recognized on interest rate swaps were $2.0 million and 2016:the net losses recognized on certificates of deposit were $1.4 million, both recorded in interest expense on the Consolidated Statement of Income for the three months ended March 31, 2020.
|
| | | | | | | | | | | | | | | | |
| |
| ($ in thousands) | | Three Months Ended
September 30, | | Nine Months Ended
September 30, |
| | 2017 | | 2016 | | 2017 | | 2016 |
| Gains (losses) recorded in interest expense: | | | | | | | | |
| Recognized on interest rate swaps | | $ | 37 |
| | $ | (1,327 | ) | | $ | (1,486 | ) | | $ | 3,044 |
|
| Recognized on certificates of deposit | | $ | (116 | ) | | $ | 674 |
| | $ | 1,236 |
| | $ | (2,688 | ) |
| |
The following table presents the pre-tax changes in AOCI from cash flow hedges for the three months ended March 31, 2021 and 2020. The after-tax impact of cash flow hedges on AOCI is shown in Note 13 — Accumulated Other Comprehensive Income (Loss) to the Consolidated Financial Statements in this Form-10-Q.
| | | | | | | | | | | | | | | | | | |
|
| ($ in thousands) | | Three Months Ended March 31, | | |
| 2021 | | 2020 | | | | |
| Gains recognized in AOCI | | $ | 426 | | | $ | 0 | | | | | |
| (Losses) reclassified from AOCI to interest expense | | $ | (177) | | | $ | 0 | | | | | |
|
Net Investment Hedges —ASC 830-20, Foreign Currency Matters — Foreign Currency Transactions and ASC 815, Derivatives and Hedging, allow hedging of the foreign currency risk of a net investment in a foreign operation. During the fourth quarter of 2015, theThe Company began enteringenters into foreign currency forward contracts to hedge itsa portion of the Bank’s investment in East West Bank (China) Limited, a non-USD functional currency subsidiary in China. The hedging instruments designated as net investment hedges involve hedging the risk of changes in the USD equivalent value of a designated monetary amount of the Company’sBank’s net investment in China,East West Bank (China) Limited, against the risk of adverse changes in the foreign currency exchange rate.rate of the Chinese Renminbi (“RMB”). The Company recorded the changes in the carrying amount of its China subsidiary in the Foreign currency translation adjustment account within AOCI. Simultaneously, the effective portion of the hedge of this exposure was also recorded in the Foreign currency translation adjustment account and the ineffective portion, if any, was recorded in current earnings. During the first quarter of 2017, the Company discontinued hedge accounting prospectively. The cumulative effective portion ofmay de-designate the net investment hedges recorded throughwhen the point of dedesignation remained inCompany expects the Foreign currency translation adjustment account within AOCI, andhedge will cease to be reclassified into earnings only upon the sale or liquidation of the China subsidiary. The Company continues to economically hedge its foreign currency exposure in its China subsidiary through foreign exchange forward contracts, which were included as part of the Derivatives Not Designated as Hedging Instruments — “Foreign Exchange Contracts” caption as of September 30, 2017.highly effective.
As of September 30, 2017, there were no derivative contracts designated as net investment hedges. As of December 31, 2016, the total notional amount and fair value of the foreign currency forward contracts designated as net investment hedges were $83.0 million and a $4.3 million asset, respectively. The following table presents the after-tax (losses) gains (losses) recordedrecognized in the Foreign currency translation adjustment account within AOCI related to the effective portion of theon net investment hedges and the ineffective portion recorded on the Consolidated Statements of Income for the three and nine months ended September 30, 2017March 31, 2021 and 2016:2020:
| | | | | | | | | | | | | | | | | | | | | | | | |
|
| ($ in thousands) | | Three Months Ended March 31, | | | | | | |
| 2021 | | 2020 | | | | | | | | | | |
| Gains recognized in AOCI | | $ | 101 | | | $ | 1,004 | | | | | | | | | | | |
| | | | | | | | | | | | | | |
|
|
| | | | | | | | | | | | | | | | |
| |
| ($ in thousands) | | Three Months Ended
September 30, | | Nine Months Ended
September 30, |
| | 2017 | | 2016 | | 2017 | | 2016 |
| Gains (losses) recognized in AOCI on net investment hedges (effective portion) | | $ | — |
| | $ | 69 |
| | $ | (648 | ) | | $ | 296 |
|
| Losses recognized in foreign exchange income (ineffective portion) | | $ | — |
| | $ | (236 | ) | | $ | (1,953 | ) | | $ | (667 | ) |
| |
Derivatives Not Designated as Hedging Instruments
Interest Rate Swaps and OptionsContracts— The Company enters into interest rate derivatives includingcontracts, which include interest rate swaps and options with its customers to allow themcustomers to hedge against the risk of rising interest rates on their variable rate loans. To economically hedge against the interest rate risks in the products offered to its customers, the Company enters into mirrored offsetting interest rate contracts with institutional counterparties. Asthird-party financial institutions, including central clearing organizations.
The following tables present the notional amounts and the gross fair values of September 30, 2017,interest rate derivative contracts outstanding as of March 31, 2021 and December 31, 2020:
| | | | | | | | | | | | | | | | | | | | | | | | | | | | | | | | | | | | | | | | | | | | |
|
| ($ in thousands) | | March 31, 2021 |
| Customer Counterparty | | ($ in thousands) | | Financial Counterparty |
| Notional
Amount | | Fair Value | | | Notional
Amount | | Fair Value |
| | Assets | | Liabilities | | | | Assets | | Liabilities |
| Written options | | $ | 800,962 | | | $ | 0 | | | $ | 544 | | | Purchased options | | $ | 800,962 | | | $ | 551 | | | $ | 0 | |
| Sold collars and corridors | | 531,840 | | | 5,849 | | | 158 | | | Collars and corridors | | 531,840 | | | 160 | | | 5,888 | |
| Swaps | | 7,597,856 | | | 279,361 | | | 53,975 | | | Swaps | | 7,628,500 | | | 33,128 | | | 168,467 | |
| Total | | $ | 8,930,658 | | | $ | 285,210 | | | $ | 54,677 | | | Total | | $ | 8,961,302 | | | $ | 33,839 | | | $ | 174,355 | |
|
| | | | | | | | | | | | | | | | | | | | | | | | | | | | | | | | | | | | | | | | | | | | |
|
| ($ in thousands) | | December 31, 2020 |
| Customer Counterparty | | ($ in thousands) | | Financial Counterparty |
| Notional
Amount | | Fair Value | | | Notional
Amount | | Fair Value |
| | Assets | | Liabilities | | | | Assets | | Liabilities |
| Written options | | $ | 957,393 | | | $ | 0 | | | $ | 115 | | | Purchased options | | $ | 957,393 | | | $ | 101 | | | $ | 15 | |
| Sold collars and corridors | | 518,477 | | | 7,673 | | | 0 | | | Collars and corridors | | 518,477 | | | 0 | | | 7,717 | |
| Swaps | | 7,586,414 | | | 479,634 | | | 1,364 | | | Swaps | | 7,617,524 | | | 1,724 | | | 306,623 | |
| Total | | $ | 9,062,284 | | | $ | 487,307 | | | $ | 1,479 | | | Total | | $ | 9,093,394 | | | $ | 1,825 | | | $ | 314,355 | |
|
In January 2018, the London Clearing House (“LCH”) amended its rulebook to legally characterize variation margin payments made to and received from LCH as settlements of derivatives, and not as collateral against derivatives. Included in the total notional amountsamount of $8.96 billion of interest rate contracts entered into with financial counterparties as of March 31, 2021, was a notional amount of $2.93 billion of interest rate swaps and options, including mirroredthat cleared through LCH. Applying variation margin payments as settlement to LCH cleared derivative transactions with institutional counterparties and the Company’s customers, totaled $4.37 billion for derivatives that were in an asset valuation position and $4.37 billion for derivatives that wereresulted in a reduction in derivative asset fair value of $27.2 million and liability valuation position. Asfair values of $116.2 million as of March 31, 2021. In comparison, included in the total notional amount of $9.09 billion of interest rate contracts entered into with financial counterparties as of December 31, 2016, the total2020, was a notional amountsamount of $2.98 billion of interest rate swaps and options, including mirroredthat cleared through LCH. Applying variation margin payments as settlement to LCH cleared derivative transactions with institutional counterparties and the Company’s customers, totaled $3.86 billion for derivatives that were in an asset valuation position and $3.81 billion for derivatives that wereresulted in a reduction in derivative asset fair values of $1.3 million and liability valuation position. The fair valuevalues of interest rate swap and option contracts with institutional counterparties and the Company’s customers amounted to a $64.8$187.4 million asset and a $64.2 million liability as of September 30, 2017. The fair value of interest rate swap and option contracts with institutional counterparties and the Company’s customers amounted to a $67.6 million asset and a $65.1 million liability as of December 31, 2016.2020.
Foreign Exchange Contracts — The Company enters into foreign exchange contracts with its customers, primarily comprisedconsisting of forward,forwards, spot, swap and spotoption contracts to enableaccommodate the business needs of its customers to hedge their transactions in foreign currencies against fluctuations in foreign exchange rates, and also to allow the Company to economically hedge against foreign currency fluctuations in certain foreign currency denominated deposits that it offers to its customers, as well as the Company’s investment in its China subsidiary, East West Bank (China) Limited. For a majority of the foreign exchange transactions entered with its customers, thecustomers. The Company enters into offsetting foreign exchange contracts with institutionalthird-party financial institutions to manage its foreign exchange exposure with its customers, or enters into bilateral collateral and master netting agreements with certain customer counterparties to manage its credit exposure. The Company also utilizes foreign exchange contracts, which are not designated as hedging instruments, to mitigate the economic effect of currency fluctuations on certain foreign exchange risk.currency-denominated on-balance sheet assets and liabilities, primarily foreign currency-denominated deposits offered to its customers. A majority of thesethe foreign exchange contracts havehad original maturities of one year or less. Asless as of September 30, 2017both March 31, 2021 and December 31, 2016,2020.
The following tables present the total notional amounts ofand the foreign exchange contracts were $1.13 billion and $767.8 million, respectively. Thegross fair values of the foreign exchange derivative contracts recorded were a $14.2 million asset and a $20.1 million liabilityoutstanding as of September 30, 2017. The fair values of the foreign exchange contracts recorded were an $11.9 million assetMarch 31, 2021 and an $11.2 million liability as of December 31, 2016.2020:
| | | | | | | | | | | | | | | | | | | | | | | | | | | | | | | | | | | | | | | | | | | | |
|
| ($ in thousands) | | March 31, 2021 |
| Customer Counterparty | | ($ in thousands) | | Financial Counterparty |
| Notional
Amount | | Fair Value | | | Notional
Amount | | Fair Value |
| | Assets | | Liabilities | | | | Assets | | Liabilities |
| Forwards and spot | | $ | 2,468,974 | | | $ | 27,803 | | | $ | 21,835 | | | Forwards and spot | | $ | 168,942 | | | $ | 869 | | | $ | 494 | |
| Swaps | | 184,584 | | | 1,902 | | | 247 | | | Swaps | | 974,974 | | | 7,733 | | | 4,364 | |
| Written options | | 116,575 | | | 0 | | | 336 | | | Purchased options | | 116,575 | | | 336 | | | 0 | |
| Collars | | 3,167 | | | 0 | | | 11 | | | Collars | | 3,167 | | | 11 | | | 0 | |
| Total | | $ | 2,773,300 | | | $ | 29,705 | | | $ | 22,429 | | | Total | | $ | 1,263,658 | | | $ | 8,949 | | | $ | 4,858 | |
|
| | | | | | | | | | | | | | | | | | | | | | | | | | | | | | | | | | | | | | | | | | | | |
|
| ($ in thousands) | | December 31, 2020 |
| Customer Counterparty | | ($ in thousands) | | Financial Counterparty |
| Notional
Amount | | Fair Value | | | Notional
Amount | | Fair Value |
| | Assets | | Liabilities | | | | Assets | | Liabilities |
| Forwards and spot | | $ | 1,522,888 | | | $ | 17,575 | | | $ | 17,928 | | | Forwards and spot | | $ | 145,197 | | | $ | 1,230 | | | $ | 273 | |
| Swaps | | 13,590 | | | 872 | | | 91 | | | Swaps | | 1,191,355 | | | 10,049 | | | 3,658 | |
| Written options | | 117,729 | | | 0 | | | 574 | | | Purchased options | | 117,729 | | | 574 | | | 0 | |
| | | | | | | | | | | | | | |
| Total | | $ | 1,654,207 | | | $ | 18,447 | | | $ | 18,593 | | | Total | | $ | 1,454,281 | | | $ | 11,853 | | | $ | 3,931 | |
|
Credit Risk Participation AgreementsContracts — The Company has enteredmay periodically enter into RPAs under which the Company assumed its pro-rata share ofRPA contracts with institutional counterparties to manage the credit exposure on interest rate contracts associated with the borrower’s performance related to interest rate derivative contracts.syndicated loans. The Company may enter into protection sold or may not be a party toprotection purchased RPAs. Under the interest rate derivative contract and enters into such RPAs, in instances where the Company is a party to the related loan participation agreement with the borrower. The Company will make or receive payments under the RPAsa payment if thea borrower defaults on its obligation to perform under the related interest rate derivative contract. The Company manages its creditCredit risk on the RPAs is managed by monitoring the credit worthiness of the borrowers and institutional counterparties, which is based on the normal credit review process. The majority of the reference entities of the protection sold RPAs were investment grade as of March 31, 2021, while all were investment grade as of December 31, 2020. Assuming the underlying borrower referenced in the interest rate contracts defaulted as of March 31, 2021 and December 31, 2020, the maximum exposure of protection sold RPAs would be $4.9 million and $6.0 million, respectively. As of March 31, 2021 and December 31, 2020, the weighted-average remaining maturities of the outstanding protection sold RPAs were 3.3 years and 3.5 years, respectively.
The notional amount of the RPAs reflectreflects the Company’s pro-rata share of the derivative instrument. As of September 30, 2017,The following table presents the notional amountamounts and the gross fair valuevalues of the RPAs purchased were $47.8 million and a $1 thousand liability, respectively. As of September 30, 2017, the notional amount and fair value of the RPAs sold were $20.6 million and a $2 thousand asset, respectively. As of December 31, 2016, the notional amount and fair value of the RPAs purchased were $48.3 million and a $3 thousand liability, respectively. As of December 31, 2016, the notional amount and fair value of the RPAs sold were $23.1 million and a $3 thousand asset, respectively. Assuming all underlying borrowers referenced in the interest rate derivative contracts defaultedoutstanding as of September 30, 2017March 31, 2021 and December 31, 2016, the exposures from the RPAs purchased would be $92 thousand and $179 thousand, respectively. As of September 30, 2017 and December 31, 2016, the weighted average remaining maturities2020:
| | | | | | | | | | | | | | | | | | | | | | | | | | | | | | | | | | | | | | |
|
| ($ in thousands) | | March 31, 2021 | | December 31, 2020 |
| Notional
Amount | | Fair Value | | Notional
Amount | | Fair Value |
| | Assets | | Liabilities | | | Assets | | Liabilities |
| RPAs - protection sold | | $ | 66,278 | | | $ | 0 | | | $ | 153 | | | $ | 66,278 | | | $ | 0 | | | $ | 206 | |
| RPAs - protection purchased | | 10,714 | | | 5 | | | 0 | | | 10,714 | | | 13 | | | 0 | |
| Total RPAs | | $ | 76,992 | | | $ | 5 | | | $ | 153 | | | $ | 76,992 | | | $ | 13 | | | $ | 206 | |
|
Equity Contracts — Periodically, as part of the outstanding RPAs were 3.0 years and 3.7 years, respectively.
Warrants — TheCompany’s loan origination process, the Company obtainedobtains warrants to purchase preferred andand/or common stock of technology and life sciences companies as partto which it provides loans. Warrants grant the Company the right to buy a certain class of the loan origination process. As of September 30, 2017, theunderlying company’s equity at a certain price before expiration. The Company held four warrants in 18 private companies as of March 31, 2021, and held warrants in 2 public companies and 3217 private companies as of December 31, 2020. The total fair value of the warrants held in both public and private companies.companies was $272 thousand and $858 thousand as of March 31, 2021 and December 31, 2020, respectively.
Commodity Contracts — The Company enters into energy commodity contracts in the form of swaps and options with its commercial loan customers to allow them to hedge against the risk of energy commodity price fluctuation. To economically hedge against the risk of commodity price fluctuation in the products offered to its customers, the Company enters into offsetting commodity contracts with third-party financial institutions to manage the exposure.
The following tables present the notional amounts and fair values of the warrants for publiccommodity derivative positions outstanding as of March 31, 2021 and private companies were an $856December 31, 2020:
| | | | | | | | | | | | | | | | | | | | | | | | | | | | | | | | | | | | | | | | | | | | | | | | | | | | | | | | |
|
| ($ and units in thousands) | | March 31, 2021 |
| Customer Counterparty | | ($ and units in thousands) | | Financial Counterparty |
| Notional
Unit | | Fair Value | | | Notional
Unit | | Fair Value |
| | Assets | | Liabilities | | | | Assets | | Liabilities |
| Crude oil: | | | | | | | | | | Crude oil: | | | | | | | | |
| Written options | | 248 | | | Barrels | | $ | 211 | | | $ | 25 | | | Purchased options | | 248 | | | Barrels | | $ | 0 | | | $ | 48 | |
| Collars | | 2,361 | | | Barrels | | 11,181 | | | 219 | | | Collars | | 2,361 | | | Barrels | | 219 | | | 10,989 | |
| Swaps | | 5,649 | | | Barrels | | 37,076 | | | 1,206 | | | Swaps | | 5,649 | | | Barrels | | 1,058 | | | 28,624 | |
| Total | | 8,258 | | | | | $ | 48,468 | | | $ | 1,450 | | | Total | | 8,258 | | | | | $ | 1,277 | | | $ | 39,661 | |
| | | | | | | | | | | | | | | | | | |
| Natural gas: | | | | | | | | | | Natural gas: | | | | | | | | |
| Written options | | 8,065 | | | MMBTUs | | $ | 52 | | | $ | 319 | | | Purchased options | | 8,065 | | | MMBTUs | | $ | 319 | | | $ | 52 | |
| Collars | | 10,823 | | | MMBTUs | | 879 | | | 0 | | | Collars | | 14,023 | | | MMBTUs | | 0 | | | 555 | |
| Swaps | | 84,108 | | | MMBTUs | | 28,878 | | | 18,449 | | | Swaps | | 91,790 | | | MMBTUs | | 18,556 | | | 25,919 | |
| Total | | 102,996 | | | | | $ | 29,809 | | | $ | 18,768 | | | Total | | 113,878 | | | | | $ | 18,875 | | | $ | 26,526 | |
| | | | | | | | | | | | | | | | | | |
| Total | | | | | | $ | 78,277 | | | $ | 20,218 | | | Total | | | | | | $ | 20,152 | | | $ | 66,187 | |
|
| | | | | | | | | | | | | | | | | | | | | | | | | | | | | | | | | | | | | | | | | | | | | | | | | | | | | | | | |
|
| ($ and units in thousands) | | December 31, 2020 |
| Customer Counterparty | | ($ and units in thousands) | | Financial Counterparty |
| Notional
Unit | | Fair Value | | | Notional
Unit | | Fair Value |
| | Assets | | Liabilities | | | | Assets | | Liabilities |
| Crude oil: | | | | | | | | | | Crude oil: | | | | | | | | |
| | | | | | | | | | | | | | | | | | |
| Collars | | 2,022 | | | Barrels | | $ | 2,344 | | | $ | 2,193 | | | Collars | | 2,022 | | | Barrels | | $ | 2,217 | | | $ | 2,402 | |
| Swaps | | 4,299 | | | Barrels | | 9,282 | | | 14,283 | | | Swaps | | 4,299 | | | Barrels | | 8,220 | | | 7,135 | |
| Total | | 6,321 | | | | | $ | 11,626 | | | $ | 16,476 | | | Total | | 6,321 | | | | | $ | 10,437 | | | $ | 9,537 | |
| | | | | | | | | | | | | | | | | | |
| Natural gas: | | | | | | | | | | Natural gas: | | | | | | | | |
| Written options | | 597 | | | MMBTUs | | $ | 0 | | | $ | 59 | | | Purchased options | | 597 | | | MMBTUs | | $ | 59 | | | $ | 0 | |
| Collars | | 12,733 | | | MMBTUs | | 1,063 | | | 205 | | | Collars | | 16,293 | | | MMBTUs | | 205 | | | 813 | |
| Swaps | | 96,305 | | | MMBTUs | | 32,073 | | | 27,238 | | | Swaps | | 103,973 | | | MMBTUs | | 26,988 | | | 29,837 | |
| Total | | 109,635 | | | | | $ | 33,136 | | | $ | 27,502 | | | Total | | 120,863 | | | | | $ | 27,252 | | | $ | 30,650 | |
| | | | | | | | | | | | | | | | | | |
| Total | | | | | | $ | 44,762 | | | $ | 43,978 | | | Total | | | | | | $ | 37,689 | | | $ | 40,187 | |
|
Beginning in January 2017, the Chicago Mercantile Exchange (“CME”) amended its rulebook to legally characterize variation margin payments made to and received from CME as settlements of derivatives and not as collateral against derivatives. As of March 31, 2021, the notional quantities that cleared through CME totaled 1,320 thousand barrels of crude oil and 27,850 thousand MMBTUs of natural gas. Applying the variation margin payments as settlement to CME-cleared derivative transactions resulted in reductions to the gross derivative asset fair value of $897 thousand and a $599 thousand asset, respectively, totaling $1.5to the liability fair value of $10.0 million as of September 30, 2017.March 31, 2021, to a net fair value of 0. In comparison, the notional quantities that cleared through CME totaled 1,275 thousand barrels of crude oil and 29,733 thousand MMBTUs of natural gas as of December 31, 2020. Applying the variation margin payments as settlement to CME-cleared derivative transactions resulted in a reduction to the gross derivative asset fair value of $7.9 million and to the liability fair value of $3.7 million, respectively, as of December 31, 2020, to a net fair value of 0.
The following table presents the net gains (losses) recognized on the Company’s Consolidated StatementsStatement of Income related to derivatives not designated as hedging instruments for the three and nine months ended September 30, 2017March 31, 2021 and 2016:2020:
| | | | | | | | | | | | | | | | | | | | | | | | |
|
| ($ in thousands) | | Classification on
Consolidated
Statement of Income | | Three Months Ended March 31, | | |
| | 2021 | | 2020 | | | | |
| Derivatives not designated as hedging instruments: | | | | | | | | | | |
| Interest rate contracts | | Interest rate contracts and other derivative income | | $ | 13,901 | | | $ | (7,011) | | | | | |
| Foreign exchange contracts | | Foreign exchange income | | 10,243 | | | 2,861 | | | | | |
| Credit contracts | | Interest rate contracts and other derivative income | | 45 | | | (23) | | | | | |
| Equity contracts | | Lending fees | | 311 | | | 309 | | | | | |
| Commodity contracts | | Interest rate contracts and other derivative income | | 169 | | | 24 | | | | | |
| Net gains (losses) | | | | $ | 24,669 | | | $ | (3,840) | | | | | |
|
|
| | | | | | | | | | | | | | | | | | |
| |
| ($ in thousands) | | Location in Consolidated Statements of Income | | Three Months Ended
September 30, | | Nine Months Ended
September 30, |
| | | 2017 | | 2016 | | 2017 | | 2016 |
| Derivatives not designated as hedging instruments: | | | | | | | | | | |
| Interest rate swaps and options | | Derivative fees and other income | | $ | (94 | ) | | $ | 411 |
| | $ | (1,838 | ) | | $ | (2,220 | ) |
| Foreign exchange contracts | | Foreign exchange income | | 3,720 |
| | 3,787 |
| | 17,936 |
| | 10,982 |
|
| RPAs | | Derivative fees and other income | | — |
| | 4 |
| | 1 |
| | (7 | ) |
| Warrants | | Ancillary loan fees and other income | | 669 |
| | — |
| | 1,455 |
| | — |
|
| Net gains | | | | $ | 4,295 |
| | $ | 4,202 |
| | $ | 17,554 |
| | $ | 8,755 |
|
| |
Credit-Risk-RelatedCredit Risk-Related Contingent Features— Certain over-the-counter derivative contracts of the Company contain early termination provisions that may require the Company to settle any outstanding balances upon the occurrence of a specified credit-risk-relatedcredit risk-related event. These events, which are defined by the existing derivative contracts, primarily relate to a downgrade in the credit rating of East West Bank to below investment grade.grade. As of March 31, 2021, the aggregate fair value amounts of all derivative instruments with credit risk-related contingent features that were in a net liability position totaled $64.9 million, in which $64.9 million of collateral was posted to cover these positions. As of December 31, 2020, the aggregate fair value amounts of all derivative instruments with credit risk-related contingent features that were in a net liability position totaled $107.4 million, in which $106.8 million of collateral was posted to cover these positions. In the event that the credit rating of East West Bank’s credit rating isBank had been downgraded to below investment grade, nominimal additional collateral would behave been required to be posted since the liabilities related to such contracts were fully collateralized as of September 30, 2017March 31, 2021 and December 31, 2016.2020.
Offsetting of Derivatives
The Company has entered into agreements with certain counterparty financial institutions, which include master netting agreements. However, the Company has elected to account for all derivatives with counterparty institutions on a gross basis. The following tables present the gross derivativesderivative fair values, the balance sheet netting adjustments and the resulting net fair values recorded on the Consolidated Balance Sheetsconsolidated balance sheet, as well as the cash and noncash collateral associated with master netting arrangements. The gross amounts of derivative assets and liabilities are presented after the respective collateral received or pledged in the formapplication of other financial instruments, which are generally marketable securities and/or cash.variation margin payments as settlements with central counterparties, where applicable. The collateral amounts in thesethe following tables are limited to the outstanding balances of the related asset or liability, (after netting is applied); thusafter the application of netting; therefore instances of overcollateralization are not shown:
| | | | | | | | | | | | | | | | | | | | | | | | | | | | | | | | | | | | | | |
|
| ($ in thousands) | | As of March 31, 2021 |
| | | | | | | | | | |
| | Gross Amounts Recognized (1) | | Gross Amounts Offset on the
Consolidated Balance Sheet | | Net Amounts
Presented
on the
Consolidated
Balance Sheet | | Gross Amounts Not Offset on the
Consolidated Balance Sheet | | Net Amount |
| | Master Netting Arrangements | | Cash Collateral Received (3) | | | Security Collateral Received (5) | |
| Derivative assets | | $ | 457,317 | | | $ | (100,454) | | | $ | (7,781) | | | $ | 349,082 | | | $ | 0 | | | $ | 349,082 | |
| | Gross Amounts Recognized (2) | | Gross Amounts Offset on the
Consolidated Balance Sheet | | Net Amounts
Presented
on the
Consolidated
Balance Sheet | | Gross Amounts Not Offset on the
Consolidated Balance Sheet | | Net Amount |
| | Master Netting Arrangements | | Cash Collateral Pledged (4) | | | Security Collateral Pledged (5) | |
| Derivative liabilities | | $ | 344,135 | | | $ | (100,454) | | | $ | (86,233) | | | $ | 157,448 | | | $ | (64,816) | | | $ | 92,632 | |
|
|
| | | | | | | | | | | | | | | | | | | | | | | | | | | | | | | | |
| |
| | | As of September 30, 2017 |
| ($ in thousands) | | Total | | Contracts Not Subject to Master Netting Arrangements | | Contracts Subject to Master Netting Arrangements |
| | | Gross Amounts Recognized | | Gross Amounts Recognized | | Gross Amounts Recognized | | Gross Amounts
Offset on the
Consolidated
Balance Sheets | | Net Amounts
Presented
on the
Consolidated
Balance Sheets | | Gross Amounts Not Offset on the
Consolidated Balance Sheets | | |
| | | | | | | | Derivative Amount | | Collateral
Received | | Net Amount |
| Derivatives Assets | | $ | 80,466 |
| | $ | 57,720 |
| | $ | 22,746 |
| | $ | — |
| | $ | 22,746 |
| | $ | (20,240 | ) | (1) | $ | (2,230 | ) | (2) | $ | 276 |
|
| | | | | | | | | | | | | | | | | |
| | | Gross Amounts Recognized | | Gross Amounts Recognized | | Gross Amounts Recognized | | Gross Amounts
Offset on the
Consolidated
Balance Sheets | | Net Amounts
Presented
on the
Consolidated
Balance Sheets | | Gross Amounts Not Offset on the
Consolidated Balance Sheets | | |
| | | | | | | | Derivative Amount | | Collateral
Posted | | Net Amount |
| Derivatives Liabilities | | $ | 90,915 |
| | $ | 17,814 |
| | $ | 73,101 |
| | $ | — |
| | $ | 73,101 |
| | $ | (20,240 | ) | (1) | $ | (52,851 | ) | (3) | $ | 10 |
|
| |
| | | | | | | | | | | | | | | | | | | | | | | | | | | | | | | | | | | | | | |
|
| ($ in thousands) | | As of December 31, 2020 |
| | | | | | | | | | |
| | Gross Amounts Recognized (1) | | Gross Amounts Offset on the
Consolidated Balance Sheet | | Net Amounts
Presented
on the
Consolidated
Balance Sheet | | Gross Amounts Not Offset on the
Consolidated Balance Sheet | | Net
Amount |
| | Master Netting Arrangements | | Cash Collateral Received (3) | | | Security Collateral Received (5) | |
| Derivative assets | | $ | 602,754 | | | $ | (93,063) | | | $ | (8,449) | | | $ | 501,242 | | | $ | (35) | | | $ | 501,207 | |
| | Gross Amounts Recognized (2) | | Gross Amounts Offset on the Consolidated Balance Sheet | | Net Amounts
Presented
on the
Consolidated
Balance Sheet | | Gross Amounts Not Offset on the
Consolidated Balance Sheet | | Net
Amount |
| | Master Netting Arrangements | | Cash Collateral Pledged (4) | | | Security Collateral Pledged (5) | |
| Derivative liabilities | | $ | 424,828 | | | $ | (93,063) | | | $ | (91,634) | | | $ | 240,131 | | | $ | (221,150) | | | $ | 18,981 | |
|
(1)Includes $532 thousand and $1.1 million of gross fair value assets with counterparties that were not subject to enforceable master netting arrangements or similar agreements as of March 31, 2021 and December 31, 2020, respectively. |
| | | | | | | | | | | | | | | | | | | | | | | | | | | | | | | | |
| |
| | | As of December 31, 2016 |
| ($ in thousands) | | Total | | Contracts Not Subject to Master Netting Arrangements | | Contracts Subject to Master Netting Arrangements |
| | | Gross Amounts Recognized | | Gross Amounts Recognized | | Gross Amounts Recognized | | Gross Amounts Offset on the Consolidated Balance Sheets | | Net Amounts
Presented
on the
Consolidated
Balance Sheets | | Gross Amounts Not Offset on the
Consolidated Balance Sheets | | |
| | | | | | | | Derivative
Amounts | | Collateral
Received | | Net Amount |
| Derivatives Assets | | $ | 83,780 |
| | $ | 51,218 |
| | $ | 32,562 |
| | $ | — |
| | $ | 32,562 |
| | $ | (20,991 | ) | (1) | $ | (10,687 | ) | (2) | $ | 884 |
|
| | | | | | | | | | | | | | | | | |
| | | Gross Amounts Recognized | | Gross Amounts Recognized | | Gross Amounts Recognized | | Gross Amounts Offset on the Consolidated Balance Sheets | | Net Amounts
Presented
on the
Consolidated
Balance Sheets | | Gross Amounts Not Offset on the
Consolidated Balance Sheets | | |
| | | | | | | | Derivative
Amounts | | Collateral
Posted | | Net Amount |
| Derivatives Liabilities | | $ | 82,323 |
| | $ | 24,097 |
| | $ | 58,226 |
| | $ | — |
| | $ | 58,226 |
| | $ | (20,991 | ) | (1) | $ | (36,349 | ) | (3) | $ | 886 |
|
| |
| |
(1) | Represents the netting of derivative receivable and payable balances for the same counterparty under enforceable master netting arrangements if the Company has elected to net. |
| |
(2) | Represents cash and securities received against derivative assets with the same counterparty that are subject to enforceable master netting arrangements. No cash collateral was received as of September 30, 2017. Includes $8.1 million of cash collateral received as of December 31, 2016. |
| |
(3) | Represents cash and securities pledged against derivative liabilities with the same counterparty that are subject to enforceable master netting arrangements. Includes $18.0 million and $170 thousand of cash collateral posted as of September 30, 2017 and December 31, 2016, respectively. |
(2)Includes $151 thousand and $220 thousand of gross fair value liabilities with counterparties that were not subject to enforceable master netting arrangements or similar agreements as of March 31, 2021 and December 31, 2020, respectively.
(3)Gross cash collateral received under master netting arrangements or similar agreements were $11.9 million and $15.8 million as of March 31, 2021 and December 31, 2020, respectively. Of the gross cash collateral received, $7.8 million and $8.4 million were used to offset against derivative assets, respectively, as of March 31, 2021 and December 31, 2020.
(4)Gross cash collateral pledged under master netting arrangements or similar agreements were $90.8 million and $91.6 million as of March 31, 2021 and December 31, 2020, respectively. Of the gross cash collateral pledged, $86.2 million and $91.6 million were used to offset against derivative liabilities, respectively, as of March 31, 2021 and December 31, 2020.
(5)Represents the fair value of security collateral received and pledged limited to derivative assets and liabilities that are subject to enforceable master netting arrangements or similar agreements. GAAP does not permit the netting of noncash collateral on the consolidated balance sheet but requires disclosure of such amounts.
In addition to the amounts included in the tables above, the Company also has balance sheet netting related to resale and repurchase agreements, referagreements. Refer to Note 54 — SecuritiesAssets Purchased under Resale Agreements and Sold under Repurchase Agreements to the Consolidated Financial Statements in this Form 10-Q for additional information. Refer toNote 4 3— Fair Value Measurement and Fair Value of Financial Instruments to the Consolidated Financial Statements in this Form 10-Q for fair value measurement disclosures on derivatives.
Note 87 — Loans Receivable and Allowance for Credit Losses
The Company’s held-for-investment loan portfolio includes originated and purchased loans. Originated and purchased loans with no evidence of credit deterioration at their acquisition date are referred to collectively as non-PCI loans. PCI loans are loans acquired with evidence of credit deterioration since their origination and it is probable at the acquisition date that the Company would be unable to collect all contractually required payments. PCI loans are accounted for under ASC Subtopic 310-30, Loans and Debt Securities Acquired with Deteriorated Credit Quality. The Company has elected to account for PCI loans on a pool level basis under ASC 310-30 at the time of acquisition.
The following table presents the composition of the Company’s non-PCI and PCI loans held-for-investment as of September 30, 2017March 31, 2021 and December 31, 2016:2020:
| | | | | | | | | | | | | | |
|
| ($ in thousands) | | March 31, 2021 | | December 31, 2020 |
| Commercial: | | | | |
C&I (1) | | $ | 14,081,110 | | | $ | 13,631,726 | |
| CRE: | | | | |
| CRE | | 11,563,034 | | | 11,174,611 | |
| Multifamily residential | | 3,066,515 | | | 3,033,998 | |
| Construction and land | | 459,254 | | | 599,692 | |
| Total CRE | | 15,088,803 | | | 14,808,301 | |
| Total commercial | | 29,169,913 | | | 28,440,027 | |
| Consumer: | | | | |
| Residential mortgage: | | | | |
| Single-family residential | | 8,524,287 | | | 8,185,953 | |
| HELOCs | | 1,749,172 | | | 1,601,716 | |
| Total residential mortgage | | 10,273,459 | | | 9,787,669 | |
| Other consumer | | 145,376 | | | 163,259 | |
| Total consumer | | 10,418,835 | | | 9,950,928 | |
Total loans held-for-investment (2) | | $ | 39,588,748 | | | $ | 38,390,955 | |
| Allowance for loan losses | | (607,506) | | | (619,983) | |
Loans held-for-investment, net (2) | | $ | 38,981,242 | | | $ | 37,770,972 | |
|
|
| | | | | | | | | | | | | | | | | | | | | | | | |
| |
| ($ in thousands) | | September 30, 2017 | | December 31, 2016 |
| | Non-PCI Loans (1) | | PCI Loans (2) | | Total (1)(2) | | Non-PCI Loans (1) | | PCI Loans (2) | | Total (1)(2) |
| CRE: | | | | | | | | | | | | |
| Income producing | | $ | 8,530,519 |
| | $ | 313,257 |
| | $ | 8,843,776 |
| | $ | 7,667,661 |
| | $ | 348,448 |
| | $ | 8,016,109 |
|
| Construction | | 572,027 |
| | — |
| | 572,027 |
| | 551,560 |
| | — |
| | 551,560 |
|
| Land | | 111,006 |
| | 371 |
| | 111,377 |
| | 121,276 |
| | 1,918 |
| | 123,194 |
|
| Total CRE | | 9,213,552 |
| | 313,628 |
| | 9,527,180 |
| | 8,340,497 |
| | 350,366 |
| | 8,690,863 |
|
| C&I: | | | | | | | | | | | | |
| Commercial business | | 9,763,688 |
| | 12,566 |
| | 9,776,254 |
| | 8,921,246 |
| | 38,387 |
| | 8,959,633 |
|
| Trade finance | | 868,902 |
| | — |
| | 868,902 |
| | 680,930 |
| | — |
| | 680,930 |
|
| Total C&I | | 10,632,590 |
| | 12,566 |
| | 10,645,156 |
| | 9,602,176 |
| | 38,387 |
| | 9,640,563 |
|
| Residential: | | | | | | | | | | | | |
| Single-family | | 4,234,017 |
| | 121,992 |
| | 4,356,009 |
| | 3,370,669 |
| | 139,110 |
| | 3,509,779 |
|
| Multifamily | | 1,808,311 |
| | 68,645 |
| | 1,876,956 |
| | 1,490,285 |
| | 95,654 |
| | 1,585,939 |
|
| Total residential | | 6,042,328 |
| | 190,637 |
| | 6,232,965 |
| | 4,860,954 |
| | 234,764 |
| | 5,095,718 |
|
| Consumer | | 2,104,614 |
| | 15,442 |
| | 2,120,056 |
| | 2,057,067 |
| | 18,928 |
| | 2,075,995 |
|
| Total loans held-for-investment | | $ | 27,993,084 |
| | $ | 532,273 |
| | $ | 28,525,357 |
| | $ | 24,860,694 |
| | $ | 642,445 |
| | $ | 25,503,139 |
|
| Allowance for loan losses | | (285,858 | ) | | (68 | ) | | (285,926 | ) | | (260,402 | ) | | (118 | ) | | (260,520 | ) |
| Loans held-for-investment, net | | $ | 27,707,226 |
| | $ | 532,205 |
| | $ | 28,239,431 |
| | $ | 24,600,292 |
| | $ | 642,327 |
| | $ | 25,242,619 |
|
| |
| |
(1) | Includes $(29.2) million and $1.2 million as of September 30, 2017 and December 31, 2016, respectively, of net deferred loan fees, unearned income, unamortized premiums and unaccreted discounts. |
| |
(2) | Loans net of ASC 310-30 discount. |
CRE(1)Includes Paycheck Protection Program (“PPP”) loans include income producing real estate, constructionof $2.07 billion and land loans where the interest rates may be fixed, variable or hybrid. Included in CRE loans are owner occupied and non-owner occupied loans where the borrowers rely on income from tenants to service the loan. Commercial business and trade finance in the C&I segment provide financing to businesses in a wide spectrum$1.57 billion as of industries.
Residential loans are comprised of single-family and multifamily loans. The Company offers first lien mortgage loans secured by one-to-four unit residential properties located in its primary lending areas. The Company offers a variety of first lien mortgage loan programs, including fixed rate conforming loans and adjustable rate mortgage loans with initial fixed periods of one to seven years, which adjust annually thereafter.
Consumer loans are comprised of home equity lines of credit (“HELOCs”), insurance premium financing loans, credit card and auto loans. As of September 30, 2017March 31, 2021 and December 31, 2016, the Company’s HELOCs were the largest component2020, respectively.
(2)Includes net deferred loan fees, unearned fees, unamortized premiums and unaccreted discounts of the consumer loan portfolio,$(76.9) million and were secured by one-to-four unit residential properties located in its primary lending areas. The HELOCs loan portfolio is largely comprised$(58.8) million as of loans originated through a reduced documentation loan program, where a substantial down payment is required, resulting in a low loan-to-value ratio, typically 60% or less at origination. The Company is in a first lien position for many of these reduced documentation HELOCs. These loans have historically experienced low delinquency and default rates.
All loans originated are subject to the Company’s underwriting guidelines and loan origination standards. Management believes that the Company’s underwriting criteria and procedures adequately consider the unique risks associated with these products. The Company conducts a variety of quality control procedures and periodic audits, including the review of lending and legal requirements to ensure that it is in compliance with these requirements.
As of September 30, 2017March 31, 2021 and December 31, 2016,2020, respectively. Net origination fees related to PPP loans were $(34.3) million and $(12.7) million as of March 31, 2021 and December 31, 2020, respectively.
Loans held-for-investment accrued interest receivable was $106.6 million and $107.5 million as of March 31, 2021 and December 31, 2020, respectively, and is presented in Other assets on the Consolidated Balance Sheets. For the accounting policy on accrued interest receivable related to loans held-for-investment, see Note 1 — Summary of Significant Accounting Policies — Significant Accounting Policies to the Consolidated Financial Statements of the Company’s 2020 Form 10-K.
Loans totaling $18.18$23.59 billion and $16.44$23.26 billion as of March 31, 2021 and December 31, 2020, respectively, were pledged to secure borrowings and to provide additional borrowing capacity from the Federal Reserve BankFRBSF and the FHLB.
Credit Quality Indicators
All loans are subject to the Company’s internal and external credit review and monitoring. LoansFor the commercial portfolio, loans are risk rated based on an analysis of the current state of the borrower’s credit quality. The analysis of credit quality includes a review of all repayment sources, the borrower’s current payment performance/performance or delinquency, currentrepayment sources, financial and liquidity statusfactors, including industry and all other relevant information.geographic considerations. For single-family residential loans,the majority of the consumer portfolio, payment performance/performance or delinquency is the driving indicator for the risk ratings. RiskFor the Company’s internal credit risk ratings, are the overall credit quality indicator for the Company and the credit quality indicator utilized for estimating the appropriate allowance foreach individual loan losses. The Company utilizesis given a risk rating system, which can be classified within the following categories:of 1 through 10. Loans risk rated 1 through 5 are assigned an internal risk rating of “Pass,” with loans risk rated 1 being fully secured by cash or U.S. government and its agencies. Pass Watch, Special Mention, Substandard, Doubtful and Loss. The risk ratings reflect the relative strength of the repayment sources.
Pass and Watch loans are generally considered to have sufficient sources of repayment in order to repay the loan in full, in accordance with all terms and conditions. Special Mention loans are considered toLoans assigned a risk rating of 6 have potential weaknesses that warrant closer attention by management. Special Mention is consideredmanagement; these are assigned an internal risk rating of “Special Mention.” Loans assigned a transitory grade. If potential weaknesses are resolved, the loan is upgraded to a Passrisk rating of 7 or Watch grade. If negative trends in the borrower’s financial status or other information indicate that the repayment sources may become inadequate, the loan is downgraded to a Substandard grade. Substandard loans are considered to8 have well-defined weaknesses that may jeopardize the full and timely repayment of the loan. Substandard loans haveloan; these are assigned an internal risk rating of “Substandard.” Loans assigned a distinct possibilityrisk rating of loss, if the deficiencies are not corrected. Additionally, when management has assessed a potential for loss but a distinct possibility of loss is not recognizable, the loan is still classified as Substandard. Doubtful loans9 have insufficient sources of repayment and a high probability of loss. Loss loansloss; these are considered to be uncollectibleassigned an internal risk rating of “Doubtful.” Loans assigned a risk rating of 10 are uncollectable and of such little value that they are no longer considered bankable assets. Theseassets; these are assigned an internal risk rating of “Loss.” Exposures categorized as criticized consist of special mention, substandard, doubtful and loss categories. The Company reviews the internal risk ratings are reviewed routinelyof its loan portfolio on a regular and adjustedongoing basis, and adjusts the ratings based on changes in the borrowers’ financial status and the loans’ collectability.collectability of the loans.
The following tables presentsummarize the credit risk ratings for non-PCICompany’s loans by portfolio segmentheld-for-investment as of September 30, 2017March 31, 2021 and December 31, 2016:
|
| | | | | | | | | | | | | | | | | | | | | | | | |
| |
| ($ in thousands) | | September 30, 2017 |
| | Pass/Watch | | Special Mention | | Substandard | | Doubtful | | Loss | | Total
Non-PCI
Loans |
| CRE: | | |
| | |
| | |
| | |
| | | | |
|
| Income producing | | $ | 8,341,970 |
| | $ | 74,028 |
| | $ | 114,521 |
| | $ | — |
| | $ | — |
| | $ | 8,530,519 |
|
| Construction | | 540,851 |
| | 22,176 |
| | 9,000 |
| | — |
| | — |
| | 572,027 |
|
| Land | | 96,160 |
| | — |
| | 14,846 |
| | — |
| | — |
| | 111,006 |
|
| C&I: | | | | | | | | |
| | | | |
|
| Commercial business | | 9,447,163 |
| | 142,531 |
| | 152,975 |
| | 21,019 |
| | — |
| | 9,763,688 |
|
| Trade finance | | 830,268 |
| | 18,631 |
| | 20,003 |
| | — |
| | — |
| | 868,902 |
|
| Residential: | | | | | | | | |
| | | | |
|
| Single-family | | 4,199,554 |
| | 11,501 |
| | 22,962 |
| | — |
| | — |
| | 4,234,017 |
|
| Multifamily | | 1,789,351 |
| | — |
| | 18,960 |
| | — |
| | — |
| | 1,808,311 |
|
| Consumer | | 2,080,056 |
| | 9,683 |
| | 14,875 |
| | — |
| | — |
| | 2,104,614 |
|
| Total | | $ | 27,325,373 |
| | $ | 278,550 |
| | $ | 368,142 |
| | $ | 21,019 |
| | $ | — |
| | $ | 27,993,084 |
|
| |
|
| | | | | | | | | | | | | | | | | | | | | | | | |
| |
| ($ in thousands) | | December 31, 2016 |
| | Pass/Watch | | Special Mention | | Substandard | | Doubtful | | Loss | | Total Non-PCI Loans |
| CRE: | | |
| | |
| | |
| | |
| | | | |
|
| Income producing | | $ | 7,476,804 |
| | $ | 29,005 |
| | $ | 161,852 |
| | $ | — |
| | $ | — |
| | $ | 7,667,661 |
|
| Construction | | 551,560 |
| | — |
| | — |
| | — |
| | — |
| | 551,560 |
|
| Land | | 107,976 |
| | — |
| | 13,290 |
| | 10 |
| | — |
| | 121,276 |
|
| C&I: | | |
| | |
| | |
| | |
| | | | |
|
| Commercial business | | 8,559,674 |
| | 155,276 |
| | 201,139 |
| | 5,157 |
| | — |
| | 8,921,246 |
|
| Trade finance | | 635,027 |
| | 9,435 |
| | 36,460 |
| | — |
| | 8 |
| | 680,930 |
|
| Residential: | | |
| | |
| | |
| | |
| | | | |
|
| Single-family | | 3,341,015 |
| | 10,179 |
| | 19,475 |
| | — |
| | — |
| | 3,370,669 |
|
| Multifamily | | 1,462,522 |
| | 2,268 |
| | 25,495 |
| | — |
| | — |
| | 1,490,285 |
|
| Consumer | | 2,043,405 |
| | 6,764 |
| | 6,898 |
| | — |
| | — |
| | 2,057,067 |
|
| Total | | $ | 24,177,983 |
| | $ | 212,927 |
| | $ | 464,609 |
| | $ | 5,167 |
| | $ | 8 |
| | $ | 24,860,694 |
|
| |
The following tables present the credit2020, presented by loan portfolio segments, internal risk ratings for PCI loans by portfolio segment asand vintage year. The vintage year is the year of September 30, 2017origination, renewal or major modification.
| | | | | | | | | | | | | | | | | | | | | | | | | | | | | | | | | | | | | | | | | | | | | | | | | | | | | | | | |
|
| ($ in thousands) | | March 31, 2021 |
| Term Loans | | Revolving Loans
Amortized Cost Basis | | Revolving Loans Converted to Term Loans Amortized Cost Basis | | Total |
| | | |
| | | |
| Amortized Cost Basis by Origination Year | | | |
| 2021 | | 2020 | | 2019 | | 2018 | | 2017 | | Prior | | | |
| Commercial: | | | | | | | | | | | | | | | | | | |
| C&I: | | | | | | | | | | | | | | | | | | |
| Pass | | $ | 1,661,034 | | | $ | 3,043,315 | | | $ | 1,220,618 | | | $ | 385,813 | | | $ | 228,364 | | | $ | 280,748 | | | $ | 6,492,230 | | | $ | 29,327 | | | $ | 13,341,449 | |
| Criticized (accrual) | | 55,239 | | | 145,506 | | | 83,989 | | | 29,315 | | | 18,541 | | | 6,809 | | | 274,726 | | | 0 | | | 614,125 | |
| Criticized (nonaccrual) | | 288 | | | 1,540 | | | 17,422 | | | 21,368 | | | 14,858 | | | 2,797 | | | 67,263 | | | 0 | | | 125,536 | |
| | | | | | | | | | | | | | | | | | |
| | | | | | | | | | | | | | | | | | |
| Total C&I | | 1,716,561 | | | 3,190,361 | | | 1,322,029 | | | 436,496 | | | 261,763 | | | 290,354 | | | 6,834,219 | | | 29,327 | | | 14,081,110 | |
| CRE: | | | | | | | | | | | | | | | | | | |
| CRE: | | | | | | | | | | | | | | | | | | |
| Pass | | 664,626 | | | 2,303,031 | | | 2,354,998 | | | 2,253,230 | | | 1,284,384 | | | 2,128,975 | | | 193,541 | | | 24,104 | | | 11,206,889 | |
| Criticized (accrual) | | 28,915 | | | 34,902 | | | 63,620 | | | 25,343 | | | 61,238 | | | 91,993 | | | 0 | | | 0 | | | 306,011 | |
| Criticized (nonaccrual) | | 0 | | | 0 | | | 0 | | | 42,067 | | | 5,868 | | | 2,199 | | | 0 | | | 0 | | | 50,134 | |
| | | | | | | | | | | | | | | | | | |
| | | | | | | | | | | | | | | | | | |
| Total CRE | | 693,541 | | | 2,337,933 | | | 2,418,618 | | | 2,320,640 | | | 1,351,490 | | | 2,223,167 | | | 193,541 | | | 24,104 | | | 11,563,034 | |
| Multifamily residential: | | | | | | | | | | | | | | | | | | |
| Pass | | 160,470 | | | 764,482 | | | 762,001 | | | 470,223 | | | 352,094 | | | 488,260 | | | 5,889 | | | 0 | | | 3,003,419 | |
| Criticized (accrual) | | 0 | | | 0 | | | 731 | | | 22,309 | | | 6,067 | | | 29,296 | | | 0 | | | 0 | | | 58,403 | |
| Criticized (nonaccrual) | | 0 | | | 0 | | | 0 | | | 1,447 | | | 1,125 | | | 2,121 | | | 0 | | | 0 | | | 4,693 | |
| | | | | | | | | | | | | | | | | | |
| | | | | | | | | | | | | | | | | | |
| Total multifamily residential | | 160,470 | | | 764,482 | | | 762,732 | | | 493,979 | | | 359,286 | | | 519,677 | | | 5,889 | | | 0 | | | 3,066,515 | |
| Construction and land: | | | | | | | | | | | | | | | | | | |
| Pass | | 5,642 | | | 141,475 | | | 146,701 | | | 121,364 | | | 0 | | | 20,691 | | | 0 | | | 0 | | | 435,873 | |
| Criticized (accrual) | | 3,481 | | | 0 | | | 0 | | | 0 | | | 0 | | | 0 | | | 0 | | | 0 | | | 3,481 | |
| Criticized (nonaccrual) | | 0 | | | 0 | | | 0 | | | 0 | | | 0 | | | 19,900 | | | 0 | | | 0 | | | 19,900 | |
| Total construction and land | | 9,123 | | | 141,475 | | | 146,701 | | | 121,364 | | | 0 | | | 40,591 | | | 0 | | | 0 | | | 459,254 | |
| Total CRE | | 863,134 | | | 3,243,890 | | | 3,328,051 | | | 2,935,983 | | | 1,710,776 | | | 2,783,435 | | | 199,430 | | | 24,104 | | | 15,088,803 | |
| Total commercial | | 2,579,695 | | | 6,434,251 | | | 4,650,080 | | | 3,372,479 | | | 1,972,539 | | | 3,073,789 | | | 7,033,649 | | | 53,431 | | | 29,169,913 | |
| Consumer: | | | | | | | | | | | | | | | | | | |
| Residential mortgage: | | | | | | | | | | | | | | | | | | |
| Single-family residential: | | | | | | | | | | | | | | | | | | |
Pass (1) | | 669,660 | | | 2,427,430 | | | 1,704,855 | | | 1,385,623 | | | 956,307 | | | 1,360,015 | | | 0 | | | 0 | | | 8,503,890 | |
| Criticized (accrual) | | 0 | | | 0 | | | 0 | | | 194 | | | 347 | | | 2,207 | | | 0 | | | 0 | | | 2,748 | |
Criticized (nonaccrual) (1) | | 0 | | | 0 | | | 1,205 | | | 1,038 | | | 2,246 | | | 13,160 | | | 0 | | | 0 | | | 17,649 | |
| Total single-family residential mortgage | | 669,660 | | | 2,427,430 | | | 1,706,060 | | | 1,386,855 | | | 958,900 | | | 1,375,382 | | | 0 | | | 0 | | | 8,524,287 | |
| HELOCs: | | | | | | | | | | | | | | | | | | |
| Pass | | 0 | | | 690 | | | 548 | | | 3,235 | | | 4,319 | | | 14,931 | | | 1,458,199 | | | 255,538 | | | 1,737,460 | |
| Criticized (accrual) | | 0 | | | 0 | | | 0 | | | 0 | | | 0 | | | 1 | | | 287 | | | 547 | | | 835 | |
| Criticized (nonaccrual) | | 0 | | | 0 | | | 151 | | | 188 | | | 4,019 | | | 1,838 | | | 449 | | | 4,232 | | | 10,877 | |
| Total HELOCs | | 0 | | | 690 | | | 699 | | | 3,423 | | | 8,338 | | | 16,770 | | | 1,458,935 | | | 260,317 | | | 1,749,172 | |
| Total residential mortgage | | 669,660 | | | 2,428,120 | | | 1,706,759 | | | 1,390,278 | | | 967,238 | | | 1,392,152 | | | 1,458,935 | | | 260,317 | | | 10,273,459 | |
| Other consumer: | | | | | | | | | | | | | | | | | | |
| Pass | | 849 | | | 8,168 | | | 0 | | | 0 | | | 1,830 | | | 83,547 | | | 48,455 | | | 0 | | | 142,849 | |
| | | | | | | | | | | | | | | | | | |
| Criticized (nonaccrual) | | 0 | | | 0 | | | 0 | | | 0 | | | 2,492 | | | 0 | | | 35 | | | 0 | | | 2,527 | |
| Total other consumer | | 849 | | | 8,168 | | | 0 | | | 0 | | | 4,322 | | | 83,547 | | | 48,490 | | | 0 | | | 145,376 | |
| Total consumer | | 670,509 | | | 2,436,288 | | | 1,706,759 | | | 1,390,278 | | | 971,560 | | | 1,475,699 | | | 1,507,425 | | | 260,317 | | | 10,418,835 | |
| Total | | $ | 3,250,204 | | | $ | 8,870,539 | | | $ | 6,356,839 | | | $ | 4,762,757 | | | $ | 2,944,099 | | | $ | 4,549,488 | | | $ | 8,541,074 | | | $ | 313,748 | | | $ | 39,588,748 | |
|
| | | | | | | | | | | | | | | | | | | | | | | | | | | | | | | | | | | | | | | | | | | | | | | | | | | | | | | | |
|
| ($ in thousands) | | December 31, 2020 |
| Term Loans | | Revolving Loans
Amortized Cost Basis | | Revolving Loans Converted to Term Loans Amortized Cost Basis | | Total |
| | | |
| | | |
| Amortized Cost Basis by Origination Year | | | |
| 2020 | | 2019 | | 2018 | | 2017 | | 2016 | | Prior | | | |
| Commercial: | | | | | | | | | | | | | | | | | | |
| C&I: | | | | | | | | | | | | | | | | | | |
| Pass | | $ | 3,912,147 | | | $ | 1,477,740 | | | $ | 483,725 | | | $ | 245,594 | | | $ | 69,482 | | | $ | 245,615 | | | $ | 6,431,003 | | | $ | 29,487 | | | $ | 12,894,793 | |
| Criticized (accrual) | | 120,183 | | | 74,601 | | | 56,785 | | | 19,426 | | | 1,487 | | | 5,872 | | | 324,640 | | | 0 | | | 602,994 | |
| Criticized (nonaccrual) | | 2,125 | | | 25,267 | | | 22,240 | | | 18,787 | | | 4,964 | | | 1,592 | | | 58,964 | | | 0 | | | 133,939 | |
| | | | | | | | | | | | | | | | | | |
| | | | | | | | | | | | | | | | | | |
| Total C&I | | 4,034,455 | | | 1,577,608 | | | 562,750 | | | 283,807 | | | 75,933 | | | 253,079 | | | 6,814,607 | | | 29,487 | | | 13,631,726 | |
| CRE: | | | | | | | | | | | | | | | | | | |
| CRE: | | | | | | | | | | | | | | | | | | |
| Pass | | 2,296,649 | | | 2,402,136 | | | 2,310,748 | | | 1,328,251 | | | 732,694 | | | 1,529,681 | | | 173,267 | | | 19,064 | | | 10,792,490 | |
| Criticized (accrual) | | 47,459 | | | 63,654 | | | 43,447 | | | 98,259 | | | 2,094 | | | 80,662 | | | 0 | | | 0 | | | 335,575 | |
| Criticized (nonaccrual) | | 0 | | | 0 | | | 42,067 | | | 1,115 | | | 0 | | | 3,364 | | | 0 | | | 0 | | | 46,546 | |
| | | | | | | | | | | | | | | | | | |
| | | | | | | | | | | | | | | | | | |
| Total CRE | | 2,344,108 | | | 2,465,790 | | | 2,396,262 | | | 1,427,625 | | | 734,788 | | | 1,613,707 | | | 173,267 | | | 19,064 | | | 11,174,611 | |
| Multifamily residential: | | | | | | | | | | | | | | | | | | |
| Pass | | 783,671 | | | 783,589 | | | 479,959 | | | 411,945 | | | 181,213 | | | 348,751 | | | 5,895 | | | 0 | | | 2,995,023 | |
| Criticized (accrual) | | 0 | | | 735 | | | 22,330 | | | 6,101 | | | 264 | | | 5,877 | | | 0 | | | 0 | | | 35,307 | |
| Criticized (nonaccrual) | | 0 | | | 0 | | | 1,475 | | | 0 | | | 0 | | | 2,193 | | | 0 | | | 0 | | | 3,668 | |
| | | | | | | | | | | | | | | | | | |
| | | | | | | | | | | | | | | | | | |
| Total multifamily residential | | 783,671 | | | 784,324 | | | 503,764 | | | 418,046 | | | 181,477 | | | 356,821 | | | 5,895 | | | 0 | | | 3,033,998 | |
| Construction and land: | | | | | | | | | | | | | | | | | | |
| Pass | | 224,924 | | | 172,707 | | | 156,712 | | | 0 | | | 20,897 | | | 1,028 | | | 0 | | | 0 | | | 576,268 | |
| Criticized (accrual) | | 3,524 | | | 0 | | | 0 | | | 0 | | | 0 | | | 19,900 | | | 0 | | | 0 | | | 23,424 | |
| Criticized (nonaccrual) | | 0 | | | 0 | | | 0 | | | 0 | | | 0 | | | 0 | | | 0 | | | 0 | | | 0 | |
| Total construction and land | | 228,448 | | | 172,707 | | | 156,712 | | | 0 | | | 20,897 | | | 20,928 | | | 0 | | | 0 | | | 599,692 | |
| Total CRE | | 3,356,227 | | | 3,422,821 | | | 3,056,738 | | | 1,845,671 | | | 937,162 | | | 1,991,456 | | | 179,162 | | | 19,064 | | | 14,808,301 | |
| Total commercial | | 7,390,682 | | | 5,000,429 | | | 3,619,488 | | | 2,129,478 | | | 1,013,095 | | | 2,244,535 | | | 6,993,769 | | | 48,551 | | | 28,440,027 | |
| Consumer: | | | | | | | | | | | | | | | | | | |
| Residential mortgage: | | | | | | | | | | | | | | | | | | |
| Single-family residential: | | | | | | | | | | | | | | | | | | |
Pass (1) | | 2,385,853 | | | 1,813,200 | | | 1,501,660 | | | 1,021,707 | | | 523,170 | | | 921,714 | | | 0 | | | 0 | | | 8,167,304 | |
| Criticized (accrual) | | 0 | | | 1,429 | | | 0 | | | 0 | | | 119 | | | 1,034 | | | 0 | | | 0 | | | 2,582 | |
Criticized (nonaccrual) (1) | | 0 | | | 226 | | | 812 | | | 1,789 | | | 1,994 | | | 11,246 | | | 0 | | | 0 | | | 16,067 | |
| Total single-family residential mortgage | | 2,385,853 | | | 1,814,855 | | | 1,502,472 | | | 1,023,496 | | | 525,283 | | | 933,994 | | | 0 | | | 0 | | | 8,185,953 | |
| HELOCs: | | | | | | | | | | | | | | | | | | |
| Pass | | 1,131 | | | 880 | | | 2,879 | | | 5,363 | | | 8,433 | | | 13,475 | | | 1,328,919 | | | 225,810 | | | 1,586,890 | |
| Criticized (accrual) | | 0 | | | 0 | | | 200 | | | 0 | | | 996 | | | 0 | | | 1,328 | | | 606 | | | 3,130 | |
| Criticized (nonaccrual) | | 0 | | | 151 | | | 285 | | | 4,617 | | | 164 | | | 1,962 | | | 0 | | | 4,517 | | | 11,696 | |
| Total HELOCs | | 1,131 | | | 1,031 | | | 3,364 | | | 9,980 | | | 9,593 | | | 15,437 | | | 1,330,247 | | | 230,933 | | | 1,601,716 | |
| Total residential mortgage | | 2,386,984 | | | 1,815,886 | | | 1,505,836 | | | 1,033,476 | | | 534,876 | | | 949,431 | | | 1,330,247 | | | 230,933 | | | 9,787,669 | |
| Other consumer: | | | | | | | | | | | | | | | | | | |
| Pass | | 9,531 | | | 0 | | | 0 | | | 1,830 | | | 0 | | | 83,255 | | | 66,136 | | | 0 | | | 160,752 | |
| Criticized (accrual) | | 16 | | | 0 | | | 0 | | | 0 | | | 0 | | | 0 | | | 0 | | | 0 | | | 16 | |
| Criticized (nonaccrual) | | 0 | | | 0 | | | 0 | | | 2,491 | | | 0 | | | 0 | | | 0 | | | 0 | | | 2,491 | |
| Total other consumer | | 9,547 | | | 0 | | | 0 | | | 4,321 | | | 0 | | | 83,255 | | | 66,136 | | | 0 | | | 163,259 | |
| Total consumer | | 2,396,531 | | | 1,815,886 | | | 1,505,836 | | | 1,037,797 | | | 534,876 | | | 1,032,686 | | | 1,396,383 | | | 230,933 | | | 9,950,928 | |
| Total | | $ | 9,787,213 | | | $ | 6,816,315 | | | $ | 5,125,324 | | | $ | 3,167,275 | | | $ | 1,547,971 | | | $ | 3,277,221 | | | $ | 8,390,152 | | | $ | 279,484 | | | $ | 38,390,955 | |
|
(1)As of March 31, 2021 and December 31, 2016:2020, $647 thousand and $747 thousand of nonaccrual loans whose payments are guaranteed by the Federal Housing Administration were classified with a pass rating.
|
| | | | | | | | | | | | | | | | | | | | | | | | |
| |
| ($ in thousands) | | September 30, 2017 |
| | Pass/Watch | | Special Mention | | Substandard | | Doubtful | | Loss | | Total PCI Loans |
| CRE: | | |
| | |
| | |
| | | | | | |
|
| Income producing | | $ | 261,907 |
| | $ | — |
| | $ | 51,350 |
| | $ | — |
| | $ | — |
| | $ | 313,257 |
|
| Land | | 44 |
| | — |
| | 327 |
| | — |
| | — |
| | 371 |
|
| C&I: | | | | | | | | | | | | |
| Commercial business | | 11,205 |
| | 90 |
| | 1,271 |
| | — |
| | — |
| | 12,566 |
|
| Residential: | | | | | | | | | | | | |
|
| Single-family | | 118,281 |
| | 1,769 |
| | 1,942 |
| | — |
| | — |
| | 121,992 |
|
| Multifamily | | 64,455 |
| | — |
| | 4,190 |
| | — |
| | — |
| | 68,645 |
|
| Consumer | | 13,962 |
| | 364 |
| | 1,116 |
| | — |
| | — |
| | 15,442 |
|
Total (1) | | $ | 469,854 |
| | $ | 2,223 |
| | $ | 60,196 |
| | $ | — |
| | $ | — |
| | $ | 532,273 |
|
| |
|
| | | | | | | | | | | | | | | | | | | | | | | | |
| |
| ($ in thousands) | | December 31, 2016 |
| | Pass/Watch | | Special Mention | | Substandard | | Doubtful | | Loss | | Total PCI Loans |
| CRE: | | |
| | |
| | |
| | | | | | |
|
| Income producing | | $ | 293,529 |
| | $ | 3,239 |
| | $ | 51,680 |
| | $ | — |
| | $ | — |
| | $ | 348,448 |
|
| Land | | 1,562 |
| | — |
| | 356 |
| | — |
| | — |
| | 1,918 |
|
| C&I: | | |
| | |
| | |
| | |
| | | | |
|
| Commercial business | | 33,885 |
| | 772 |
| | 3,730 |
| | — |
| | — |
| | 38,387 |
|
| Residential: | | |
| | |
| | |
| | | | | | |
|
| Single-family | | 136,245 |
| | 1,239 |
| | 1,626 |
| | — |
| | — |
| | 139,110 |
|
| Multifamily | | 86,190 |
| | — |
| | 9,464 |
| | — |
| | — |
| | 95,654 |
|
| Consumer | | 17,433 |
| | 316 |
| | 1,179 |
| | — |
| | — |
| | 18,928 |
|
Total (1) | | $ | 568,844 |
| | $ | 5,566 |
| | $ | 68,035 |
| | $ | — |
| | $ | — |
| | $ | 642,445 |
|
| |
| |
(1) | Loans net of ASC 310-30 discount. |
Nonaccrual and Past Due Loans
Non-PCI loansLoans that are 90 or more days past due are generally placed on nonaccrual status. Additionally, non-PCI loansstatus, unless the loan is well-collateralized and in the process of collection. Loans that are less than 90 days past due but have identified deficiencies, such as when the full collection of principal or interest becomes uncertain, are also placed on nonaccrual status. Payment deferral activities instituted in response to the COVID-19 pandemic could continue to delay the recognition of delinquencies for customers who otherwise would have moved into nonaccrual status. The following tables presenttable presents the aging analysis on non-PCIof total loans held-for-investment as of September 30, 2017March 31, 2021 and December 31, 2016:2020:
| | | | | | | | | | | | | | | | | | | | | | | | | | | | | | | | | | | | | | | | | | | | | | |
|
| ($ in thousands) | | March 31, 2021 |
| Current Accruing Loans (1) | | Accruing
Loans
30-59 Days
Past Due | | Accruing
Loans
60-89 Days
Past Due | | | | | | Total
Accruing
Past Due
Loans | | | | | | Total
Nonaccrual
Loans | | Total
Loans |
| Commercial: | | | | | | | | | | | | | | | | | | | | |
| C&I | | $ | 13,923,524 | | | $ | 26,417 | | | $ | 5,633 | | | | | | | $ | 32,050 | | | | | | | $ | 125,536 | | | $ | 14,081,110 | |
| CRE: | | | | | | | | | | | | | | | | | | | | |
| CRE | | 11,473,405 | | | 5,688 | | | 33,807 | | | | | | | 39,495 | | | | | | | 50,134 | | | 11,563,034 | |
| Multifamily residential | | 3,061,822 | | | 0 | | | 0 | | | | | | | 0 | | | | | | | 4,693 | | | 3,066,515 | |
| Construction and land | | 439,354 | | | 0 | | | 0 | | | | | | | 0 | | | | | | | 19,900 | | | 459,254 | |
| Total CRE | | 14,974,581 | | | 5,688 | | | 33,807 | | | | | | | 39,495 | | | | | | | 74,727 | | | 15,088,803 | |
| Total commercial | | 28,898,105 | | | 32,105 | | | 39,440 | | | | | | | 71,545 | | | | | | | 200,263 | | | 29,169,913 | |
| Consumer: | | | | | | | | | | | | | | | | | | | | |
| Residential mortgage: | | | | | | | | | | | | | | | | | | | | |
| Single-family residential | | 8,493,416 | | | 9,827 | | | 2,748 | | | | | | | 12,575 | | | | | | | 18,296 | | | 8,524,287 | |
| HELOCs | | 1,735,692 | | | 1,769 | | | 834 | | | | | | | 2,603 | | | | | | | 10,877 | | | 1,749,172 | |
| Total residential mortgage | | 10,229,108 | | | 11,596 | | | 3,582 | | | | | | | 15,178 | | | | | | | 29,173 | | | 10,273,459 | |
| Other consumer | | 142,604 | | | 242 | | | 4 | | | | | | | 246 | | | | | | | 2,526 | | | 145,376 | |
| Total consumer | | 10,371,712 | | | 11,838 | | | 3,586 | | | | | | | 15,424 | | | | | | | 31,699 | | | 10,418,835 | |
| Total | | $ | 39,269,817 | | | $ | 43,943 | | | $ | 43,026 | | | | | | | $ | 86,969 | | | | | | | $ | 231,962 | | | $ | 39,588,748 | |
|
|
| | | | | | | | | | | | | | | | | | | | | | | | | | | | | | | | |
| |
| ($ in thousands) | | September 30, 2017 |
| | Accruing Loans 30-59 Days Past Due | | Accruing Loans 60-89 Days Past Due | | Total Accruing Past Due Loans | | Nonaccrual Loans Less Than 90 Days Past Due | | Nonaccrual Loans 90 or More Days Past Due | | Total Nonaccrual Loans | | Current Accruing Loans | | Total Non-PCI Loans |
| CRE: | | |
| | |
| | |
| | |
| | |
| | |
| | |
| | |
|
| Income producing | | $ | 5,211 |
| | $ | 1,924 |
| | $ | 7,135 |
| | $ | 4,853 |
| | $ | 19,949 |
| | $ | 24,802 |
| | $ | 8,498,582 |
| | $ | 8,530,519 |
|
| Construction | | 9,000 |
| | — |
| | 9,000 |
| | — |
| | — |
| | — |
| | 563,027 |
| | 572,027 |
|
| Land | | — |
| | — |
| | — |
| | 10 |
| | 4,173 |
| | 4,183 |
| | 106,823 |
| | 111,006 |
|
| C&I: | | |
| | |
| | |
| | |
| | |
| | |
| | |
| | |
|
| Commercial business | | 16,315 |
| | 108 |
| | 16,423 |
| | 34,844 |
| | 38,540 |
| | 73,384 |
| | 9,673,881 |
| | 9,763,688 |
|
| Trade finance | | — |
| | — |
| | — |
| | — |
| | — |
| | — |
| | 868,902 |
| | 868,902 |
|
| Residential: | | |
| | |
| | |
| | |
| | |
| | |
| | |
| | |
|
| Single-family | | 16,765 |
| | 1,560 |
| | 18,325 |
| | — |
| | 6,639 |
| | 6,639 |
| | 4,209,053 |
| | 4,234,017 |
|
| Multifamily | | 7,476 |
| | 664 |
| | 8,140 |
| | 1,456 |
| | 1,164 |
| | 2,620 |
| | 1,797,551 |
| | 1,808,311 |
|
| Consumer | | 8,837 |
| | 5,346 |
| | 14,183 |
| | 93 |
| | 3,004 |
| | 3,097 |
| | 2,087,334 |
| | 2,104,614 |
|
| Total | | $ | 63,604 |
| | $ | 9,602 |
| | $ | 73,206 |
| | $ | 41,256 |
| | $ | 73,469 |
| | $ | 114,725 |
| | $ | 27,805,153 |
| | $ | 27,993,084 |
|
| |
| | | | | | | | | | | | | | | | | | | | | | | | | | | | | | | | | | | | | | | | | | | | |
|
| ($ in thousands) | | December 31, 2020 |
| Current Accruing Loans (1) | | Accruing
Loans
30-59 Days
Past Due | | Accruing
Loans
60-89 Days
Past Due | | | | Total
Accruing
Past Due
Loans | | | | | | Total
Nonaccrual
Loans | | Total
Loans |
| Commercial: | | | | | | | | | | | | | | | | | | |
| C&I | | $ | 13,488,070 | | | $ | 8,993 | | | $ | 724 | | | | | $ | 9,717 | | | | | | | $ | 133,939 | | | $ | 13,631,726 | |
| CRE: | | | | | | | | | | | | | | | | | | |
| CRE | | 11,127,690 | | | 375 | | | 0 | | | | | 375 | | | | | | | 46,546 | | | 11,174,611 | |
| Multifamily residential | | 3,028,512 | | | 1,818 | | | 0 | | | | | 1,818 | | | | | | | 3,668 | | | 3,033,998 | |
| Construction and land | | 579,792 | | | 19,900 | | | 0 | | | | | 19,900 | | | | | | | 0 | | | 599,692 | |
| Total CRE | | 14,735,994 | | | 22,093 | | | 0 | | | | | 22,093 | | | | | | | 50,214 | | | 14,808,301 | |
| Total commercial | | 28,224,064 | | | 31,086 | | | 724 | | | | | 31,810 | | | | | | | 184,153 | | | 28,440,027 | |
| Consumer: | | | | | | | | | | | | | | | | | | |
| Residential mortgage: | | | | | | | | | | | | | | | | | | |
| Single-family residential | | 8,156,645 | | | 9,911 | | | 2,583 | | | | | 12,494 | | | | | | | 16,814 | | | 8,185,953 | |
| HELOCs | | 1,583,968 | | | 2,922 | | | 3,130 | | | | | 6,052 | | | | | | | 11,696 | | | 1,601,716 | |
| Total residential mortgage | | 9,740,613 | | | 12,833 | | | 5,713 | | | | | 18,546 | | | | | | | 28,510 | | | 9,787,669 | |
| Other consumer | | 160,534 | | | 217 | | | 17 | | | | | 234 | | | | | | | 2,491 | | | 163,259 | |
| Total consumer | | 9,901,147 | | | 13,050 | | | 5,730 | | | | | 18,780 | | | | | | | 31,001 | | | 9,950,928 | |
| Total | | $ | 38,125,211 | | | $ | 44,136 | | | $ | 6,454 | | | | | $ | 50,590 | | | | | | | $ | 215,154 | | | $ | 38,390,955 | |
|
|
| | | | | | | | | | | | | | | | | | | | | | | | | | | | | | | | |
| |
| ($ in thousands) | | December 31, 2016 |
| | Accruing Loans 30-59 Days Past Due | | Accruing Loans 60-89 Days Past Due | | Total Accruing Past Due Loans | | Nonaccrual Loans Less Than 90 Days Past Due | | Nonaccrual Loans 90 or More Days Past Due | | Total Nonaccrual Loans | | Current Accruing Loans | | Total
Non-PCI
Loans |
| CRE: | | |
| | |
| | |
| | |
| | |
| | |
| | |
| | |
|
| Income producing | | $ | 6,233 |
| | $ | 14,080 |
| | $ | 20,313 |
| | $ | 14,872 |
| | $ | 12,035 |
| | $ | 26,907 |
| | $ | 7,620,441 |
| | $ | 7,667,661 |
|
| Construction | | 4,994 |
| | — |
| | 4,994 |
| | — |
| | — |
| | — |
| | 546,566 |
| | 551,560 |
|
| Land | | — |
| | — |
| | — |
| | 433 |
| | 4,893 |
| | 5,326 |
| | 115,950 |
| | 121,276 |
|
| C&I: | | |
| | |
| | |
| | |
| | |
| | |
| | |
| | |
|
| Commercial business | | 45,052 |
| | 2,279 |
| | 47,331 |
| | 60,511 |
| | 20,737 |
| | 81,248 |
| | 8,792,667 |
| | 8,921,246 |
|
| Trade finance | | — |
| | — |
| | — |
| | 8 |
| | — |
| | 8 |
| | 680,922 |
| | 680,930 |
|
| Residential: | | |
| | |
| | |
| | | | |
| | |
| | |
| | |
|
| Single-family | | 9,595 |
| | 8,076 |
| | 17,671 |
| | — |
| | 4,214 |
| | 4,214 |
| | 3,348,784 |
| | 3,370,669 |
|
| Multifamily | | 3,951 |
| | 374 |
| | 4,325 |
| | 2,790 |
| | 194 |
| | 2,984 |
| | 1,482,976 |
| | 1,490,285 |
|
| Consumer | | 3,327 |
| | 3,228 |
| | 6,555 |
| | 165 |
| | 1,965 |
| | 2,130 |
| | 2,048,382 |
| | 2,057,067 |
|
| Total | | $ | 73,152 |
| | $ | 28,037 |
| | $ | 101,189 |
| | $ | 78,779 |
| | $ | 44,038 |
| | $ | 122,817 |
| | $ | 24,636,688 |
| | $ | 24,860,694 |
|
| | | | | | | | | | | | | | | | | |
For information on the policy for recording payments received and resuming accrual of interest on non-PCI loans that are placed on nonaccrual status, see Note 1 — Summary of Significant Accounting Policies to the Consolidated Financial Statements of the Company’s 2016 Form 10-K.
PCI loans are excluded from the above aging analysis tables as the Company has elected to account for these loans on a pool level basis under ASC 310-30 at the time of acquisition. Refer to the discussion on PCI loans within this note for additional details on interest income recognition. (1)As of September 30, 2017March 31, 2021 and December 31, 2016, PCI2020, the “Current Accruing Loans” balance of loans in payment deferral programs offered in response to the COVID-19 pandemic which are performing according to their modified terms are generally not considered delinquent.
The following table presents the amortized cost of loans on nonaccrual status totaled $5.7 million and $11.7 million, respectively.
Loans in Processfor which there was no related allowance for loan losses as of Foreclosure
As of September 30, 2017March 31, 2021 and December 31, 2016,2020. Nonaccrual loans may not have an allowance for credit losses if the loss expectation is zero as the loan balances are supported by the collateral value.
| | | | | | | | | | | | | | | | | | | | | | |
|
| ($ in thousands) | | | March 31, 2021 | | | December 31, 2020 |
| | | | | | | | |
| Commercial: | | | | | | | | |
| C&I | | | | $ | 63,312 | | | | | $ | 62,040 | |
| CRE: | | | | | | | | |
| CRE | | | | 49,137 | | | | | 45,537 | |
| Multifamily residential | | | | 3,578 | | | | | 2,519 | |
| Construction and land | | | | 19,900 | | | | | 0 | |
| Total CRE | | | | 72,615 | | | | | 48,056 | |
| Total commercial | | | | 135,927 | | | | | 110,096 | |
| Consumer: | | | | | | | | |
| Residential mortgage: | | | | | | | | |
| Single-family residential | | | | 6,014 | | | | | 6,013 | |
| HELOCs | | | | 7,353 | | | | | 8,076 | |
| Total residential mortgage | | | | 13,367 | | | | | 14,089 | |
| Other consumer | | | | 2,491 | | | | | 2,491 | |
| Total consumer | | | | 15,858 | | | | | 16,580 | |
| Total nonaccrual loans with no related allowance for loan losses | | | | $ | 151,785 | | | | | $ | 126,676 | |
|
Foreclosed Assets
Foreclosed assets, consisting of OREO and other nonperforming assets, are included in Other assets on the Consolidated Balance Sheet. The Company had $6.3$26.2 million and $3.1 million, respectively, of recorded investments in residential and consumer mortgage loans secured by residential real estate properties, for which formal foreclosure proceedings were in process according to local requirements of the applicable jurisdictions, which were not included in OREO. A foreclosed residential real estate property with a carrying amount of $391 thousand was included in total net OREO of $2.3 million assets as of September 30, 2017. In comparison, foreclosed residential real estate propertiesMarch 31, 2021 compared with a carrying amount of $401 thousand were included in total net OREO of $6.7$19.7 million as of December 31, 2016.2020. The Company commences the foreclosure process on consumer mortgage loans when a borrower becomes more than 120 days delinquent in accordance with Consumer Finance Protection Bureau guidelines. The carrying value of consumer real estate loans that were in the process of active or suspended foreclosure was $5.8 million and $4.1 million as of March 31, 2021 and December 31, 2020, respectively. The Company has suspended certain mortgage foreclosure activities in connection with our actions to support our customers during the COVID-19 pandemic.
Troubled Debt Restructurings
Potential troubledTroubled debt restructurings (“TDRs”) are individually evaluated, and the type of restructuring is selected based on the loan type and the circumstances of the borrower’s financial difficulty in order to maximize the Company’s recovery.difficulty. A TDR is a modification of the terms of a loan when the Company, for economic or legal reasons related to the borrower’s financial difficulties, grants a concession to the borrower that it would not have otherwise considered. Since March 2020, the Company has implemented various commercial and consumer loan modification programs to provide its borrowers relief from the economic impacts of the COVID-19 pandemic. These COVID-related modifications are generally not classified as TDRs due to the relief under the Coronavirus Aid, Relief, and Economic Security Act, as amended by the Consolidated Appropriations Act, 2021, and the Interagency Statement on Loan Modifications and Reporting for Financial Institutions Working with Customers Affected by the Coronavirus (Revised), and therefore are not included in the discussion below. Assistance provided in response to the COVID-19 pandemic could delay the recognition of delinquencies, nonaccrual status, and net charge-offs for those borrowers who would have otherwise moved into past due or nonaccrual status. See Note 1 — Summary of Significant Accounting Policies — Significant Accounting Policies to the Consolidated Financial Statements of the Company’s 2020 Form 10-K.
The following tables presenttable presents the additions to non-PCI TDRs for the three and nine months ended September 30, 2017March 31, 2021 and 2016:2020:
| | | | | | | | | | | | | | | | | | | | | | | | | | | | | | | | | | | | | | | | | | | | | | | | | | |
|
| ($ in thousands) | | Loans Modified as TDRs During the Three Months Ended March 31, |
| 2021 | | 2020 |
| Number
of
Loans | | Pre-
Modification
Outstanding
Recorded
Investment | | Post- Modification Outstanding Recorded Investment (1) | | Financial Impact (2) | | Number
of
Loans | | Pre-
Modification
Outstanding
Recorded
Investment | | Post- Modification Outstanding Recorded Investment (1) | | Financial Impact (2) |
| Commercial: | | | | | | | | | | | | | | | | |
| C&I | | 1 | | $ | 443 | | | $ | 433 | | | $ | 203 | | | 3 | | $ | 16,604 | | | $ | 15,735 | | | $ | 98 | |
| | | | | | | | | | | | | | | | |
| | | | | | | | | | | | | | | | |
| | | | | | | | | | | | | | | | |
| | | | | | | | | | | | | | | | |
| | | | | | | | | | | | | | | | |
| | | | | | | | | | | | | | | | |
| | | | | | | | | | | | | | | | |
| | | | | | | | | | | | | | | | |
| | | | | | | | | | | | | | | | |
| | | | | | | | | | | | | | | | |
| | | | | | | | | | | | | | | | |
| | | | | | | | | | | | | | | | |
| | | | | | | | | | | | | | | | |
| Total | | 1 | | $ | 443 | | | $ | 433 | | | $ | 203 | | | 3 | | $ | 16,604 | | | $ | 15,735 | | | $ | 98 | |
|
|
| | | | | | | | | | | | | | | | | | | | | | | | | | | | |
| |
| | | Loans Modified as TDRs During the Three Months Ended September 30, |
| ($ in thousands) | | 2017 | | 2016 |
| | Number
of
Loans | | Pre- Modification
Outstanding
Recorded
Investment | | Post- Modification
Outstanding
Recorded
Investment (1) | | Financial
Impact (2) | | Number
of
Loans | | Pre- Modification
Outstanding
Recorded
Investment | | Post- Modification
Outstanding
Recorded
Investment (1) | | Financial
Impact (2) |
| CRE: | | | | �� |
| | |
| | |
| | | | | | | | |
| Income producing | | 1 | | $ | 172 |
| | $ | 172 |
| | $ | 8 |
| | — | | $ | — |
| | $ | — |
| | $ | — |
|
| C&I: | | | | | | | | | | | | | | | | |
| Commercial business | | 10 | | $ | 15,143 |
| | $ | 14,927 |
| | $ | 65 |
| | 3 | | $ | 493 |
| | $ | 475 |
| | $ | 93 |
|
| |
(2)Includes charge-offs and specific reserves recorded since the modification date. |
| | | | | | | | | | | | | | | | | | | | | | | | | | | | |
| |
| | | Loans Modified as TDRs During the Nine Months Ended September 30, |
| ($ in thousands) | | 2017 | | 2016 |
| | Number
of
Loans | | Pre- Modification
Outstanding
Recorded
Investment | | Post- Modification
Outstanding
Recorded
Investment (1) | | Financial
Impact (2) | | Number
of
Loans | | Pre- Modification
Outstanding
Recorded
Investment | | Post- Modification
Outstanding
Recorded
Investment (1) | | Financial
Impact (2) |
| CRE: | | | | |
| | |
| | |
| | | | | | | | |
| Income producing | | 2 | | $ | 1,699 |
| | $ | 1,648 |
| | $ | 8 |
| | 3 | | $ | 15,899 |
| | $ | 15,730 |
| | $ | 43 |
|
| Land | | — | | $ | — |
| | $ | — |
| | $ | — |
| | 1 | | $ | 5,522 |
| | $ | 5,233 |
| | $ | — |
|
| C&I: | | | | | | | | | | | | | | | | |
| Commercial business | | 15 | | $ | 29,541 |
| | $ | 28,796 |
| | $ | 10,365 |
| | 8 | | $ | 22,182 |
| | $ | 9,113 |
| | $ | 2,711 |
|
| Trade finance | | — | | $ | — |
| | $ | — |
| | $ | — |
| | 2 | | $ | 7,901 |
| | $ | 3,025 |
| | $ | — |
|
| Residential: | | | | | | | | | | | | | | | | |
| Single-family | | — | | $ | — |
| | $ | — |
| | $ | — |
| | 2 | | $ | 1,071 |
| | $ | 1,065 |
| | $ | — |
|
| Multifamily | | 1 | | $ | 3,655 |
| | $ | 3,620 |
| | $ | 112 |
| | — | | $ | — |
| | $ | — |
| | $ | — |
|
| Consumer | | — | | $ | — |
| | $ | — |
| | $ | — |
| | 1 | | $ | 344 |
| | $ | 337 |
| | $ | 1 |
|
| |
| |
(1) | Includes subsequent payments after modification and reflects the balance as of September 30, 2017 and 2016. |
| |
(2) | The financial impact includes charge-offs and specific reserves recorded at the modification date. |
The following tables presenttable presents the non-PCI TDR modificationspost-modification outstanding balances for the three and nine months ended September 30, 2017March 31, 2021 and 20162020 by modification type:
| | | | | | | | | | | | | | | | | | | | | | | | | | | | | | | | | | | | | | | | | | | | | | | | |
|
| ($ in thousands) | | Modification Type During the Three Months Ended March 31, |
| 2021 | | 2020 |
| Principal (1) | | Principal and Interest (2) | | | | | | Total | | Principal (1) | | Principal and Interest (2) | | | | | | | | Total |
| Commercial: | | | | | | | | | | | | | | | | | | | | | | |
| C&I | | $ | 433 | | | $ | 0 | | | | | | | $ | 433 | | | $ | 4,564 | | | $ | 11,171 | | | | | | | | | $ | 15,735 | |
| | | | | | | | | | | | | | | | | | | | | | |
| | | | | | | | | | | | | | | | | | | | | | |
| | | | | | | | | | | | | | | | | | | | | | |
| | | | | | | | | | | | | | | | | | | | | | |
| | | | | | | | | | | | | | | | | | | | | | |
| | | | | | | | | | | | | | | | | | | | | | |
| | | | | | | | | | | | | | | | | | | | | | |
| | | | | | | | | | | | | | | | | | | | | | |
| | | | | | | | | | | | | | | | | | | | | | |
| | | | | | | | | | | | | | | | | | | | | | |
| | | | | | | | | | | | | | | | | | | | | | |
| | | | | | | | | | | | | | | | | | | | | | |
| | | | | | | | | | | | | | | | | | | | | | |
| Total | | $ | 433 | | | $ | 0 | | | | | | | $ | 433 | | | $ | 4,564 | | | $ | 11,171 | | | | | | | | | $ | 15,735 | |
|
(1)Includes forbearance payments, term extensions and principal deferments that modify the terms of the loan from principal and interest payments to interest payments only.
(2)Includes principal and interest deferments or reductions.
|
| | | | | | | | | | | | | | | | | | | | | | | | |
| |
| ($ in thousands) | | Modification Type During the Three Months Ended September 30, 2017 |
| | Principal (1) | | Principal and Interest (2) | | Interest Rate Reduction | | Interest Deferments | | Other | | Total |
| CRE | | $ | 172 |
| | $ | — |
| | $ | — |
| | $ | — |
| | $ | — |
| | $ | 172 |
|
| C&I | | 14,903 |
| | 24 |
| | — |
| | — |
| | — |
| | 14,927 |
|
| Total | | $ | 15,075 |
| | $ | 24 |
| | $ | — |
| | $ | — |
| | $ | — |
| | $ | 15,099 |
|
| | |
|
| | | | | | | | | | | | | | | | | | | | | | | | |
| |
| ($ in thousands) | | Modification Type During the Three Months Ended September 30, 2016 |
| | Principal (1) | | Principal
and
Interest (2) | | Interest
Rate
Reduction | | Interest
Deferments | | Other | | Total |
| C&I | | $ | 444 |
| | $ | — |
| | $ | — |
| | $ | 31 |
| | $ | — |
| | $ | 475 |
|
| Total | | $ | 444 |
| | $ | — |
| | $ | — |
| | $ | 31 |
| | $ | — |
| | $ | 475 |
|
| | |
|
| | | | | | | | | | | | | | | | | | | | | | | | |
| |
| ($ in thousands) | | Modification Type During the Nine Months Ended September 30, 2017 |
| | Principal (1) | | Principal
and
Interest (2) | | Interest
Rate
Reduction | | Interest
Deferments | | Other | | Total |
| CRE | | $ | 1,648 |
| | $ | — |
| | $ | — |
| | $ | — |
| | $ | — |
| | $ | 1,648 |
|
| C&I | | 18,289 |
| | 10,507 |
| | — |
| | — |
| | — |
| | 28,796 |
|
| Residential | | 3,620 |
| | — |
| | — |
| | — |
| | — |
| | 3,620 |
|
| Total | | $ | 23,557 |
| | $ | 10,507 |
| | $ | — |
| | $ | — |
| | $ | — |
| | $ | 34,064 |
|
| | |
|
| | | | | | | | | | | | | | | | | | | | | | | | |
| |
| ($ in thousands) | | Modification Type During the Nine Months Ended September 30, 2016 |
| | Principal (1) | | Principal
and
Interest (2) | | Interest
Rate
Reduction | | Interest
Deferments | | Other | | Total |
| CRE | | $ | 19,812 |
| | $ | — |
| | $ | — |
| | $ | — |
| | $ | 1,151 |
| | $ | 20,963 |
|
| C&I | | 10,218 |
| | — |
| | 1,288 |
| | 32 |
| | 600 |
| | 12,138 |
|
| Residential | | 266 |
| | — |
| | 799 |
| | — |
| | — |
| | 1,065 |
|
| Consumer | | 337 |
| | — |
| | — |
| | — |
| | — |
| | 337 |
|
| Total | | $ | 30,633 |
| | $ | — |
| | $ | 2,087 |
| | $ | 32 |
| | $ | 1,751 |
| | $ | 34,503 |
|
| | | | | | | | | | | | |
| |
(1) | Includes forbearance payments, term extensions and principal deferments that modify the terms of the loan from principal and interest payments to interest payments only. |
| |
(2) | Includes principal and interest deferments or reductions. |
SubsequentAfter a loan is modified as TDR, the Company continues to restructuring, amonitor its performance under its most recent restructured terms. A TDR that becomesmay become delinquent generally beyondand result in payment default (generally 90 days is consideredpast due) subsequent to have defaulted. As TDRs are individually evaluated for impairment under the specific reserve methodology, subsequent defaults do not generally have a significant additional impact on the allowance for loan losses.restructuring. The following tables presenttable presents information on loans for loanswhich a subsequent payment default occurred during the three months ended March 31, 2021, which had been modified as TDRsTDR within the previous 12 months that have subsequently defaulted during the three and nine months ended September 30, 2017 and 2016,of its default, and were still in default atas of March 31, 2021. In comparison, there were 0 TDRs that experienced payment default after modifications within the respective period end:previous 12 months during the three months ended March 31, 2020.
| | | | | | | | | | | | | | | | | | |
|
| ($ in thousands) | | Loans Modified as TDRs that Subsequently Defaulted
During the Three Months Ended March 31, |
| 2021 | | |
| Number of
Loans | | Recorded
Investment | | | | |
| Commercial: | | | | | | | | |
| C&I | | 1 | | | $ | 11,538 | | | | | |
| | | | | | | | |
| | | | | | | | |
| | | | | | | | |
| | | | | | | | |
| | | | | | | | |
| | | | | | | | |
| | | | | | | | |
| | | | | | | | |
| | | | | | | | |
| | | | | | | | |
| | | | | | | | |
| | | | | | | | |
| | | | | | | | |
| Total | | 1 | | | $ | 11,538 | | | | | |
|
|
| | | | | | | | | | | | | | |
| |
| ($ in thousands) | | Loans Modified as TDRs that Subsequently Defaulted During the Three Months Ended September 30, |
| | 2017 | | 2016 |
| | Number of
Loans | | Recorded
Investment | | Number of
Loans | | Recorded
Investment |
| CRE: | | |
| | |
| | |
| | |
|
| Income producing | | — |
| | $ | — |
| | 1 |
| | $ | 1,000 |
|
| C&I: | | | | | | | | |
| Commercial business | | 1 |
| | $ | 9,386 |
| | — |
| | $ | — |
|
| |
|
| | | | | | | | | | | | | | |
| |
| ($ in thousands) | | Loans Modified as TDRs that Subsequently Defaulted During the Nine Months Ended September 30, |
| | 2017 | | 2016 |
| | Number of
Loans | | Recorded
Investment | | Number of
Loans | | Recorded
Investment |
| CRE: | | |
| | |
| | |
| | |
|
| Income producing | | — |
| | $ | — |
| | 1 |
| | $ | 1,000 |
|
| C&I: | | |
| | |
| | |
| | |
|
| Commercial business | | 1 |
| | $ | 9,386 |
| | 2 |
| | $ | 119 |
|
| Consumer | | 1 |
| | $ | 48 |
| | — |
| | $ | — |
|
| |
The amount of additional funds committed to lend to borrowers whose terms have been modified as TDRs was $612 thousand$2.2 million and $9.9$3.0 million as of September 30, 2017March 31, 2021 and December 31, 2016,2020, respectively.
Impaired LoansAllowance for Credit Losses
The Company’s loans are grouped into heterogeneousCompany has an allowance framework under ASU 2016-13 for all financial assets measured at amortized cost and homogeneous (mostly consumer loans) categories. Classified loanscertain off-balance sheet credit exposures. The measurement of the allowance for credit losses is based on management’s best estimate of lifetime expected credit losses inherent in the heterogeneous categoryCompany’s relevant financial assets.
The allowance for credit losses is deducted from the amortized cost basis of a financial asset or a group of financial assets so that the balance sheet reflects the net amount the Company expects to collect. Amortized cost is the principal balance outstanding, net of purchase premiums and discounts, and deferred fees and costs. Subsequent changes in expected credit losses are identifiedrecognized in net income as a provision for credit loss expense or a reversal of credit loss expense.
The process of the allowance for credit losses involves procedures to consider the unique risk characteristics of the portfolio segments. The majority of the Company’s credit exposures share risk characteristics with other similar exposures, and as a result are collectively evaluated. The collectively evaluated for impairmentloans cover performing risk-rated loans and unfunded credit commitments. If an exposure does not share risk characteristics with other exposures, the Company generally estimates expected credit losses on an individual basis. The individually assessed loans cover loans modified in a TDR, collateral-dependent loans, as well as, risk-rated loans that have been placed on nonaccrual status.
Allowance for Collectively Evaluated Loans
The allowance for collectively evaluated loans consists of a quantitative component that assesses many different risk factors that we consider in our models and a qualitative component that considers risk factors external to the models. Each of these components are described below.
Quantitative Component — The allowance for loan losses is estimated using quantitative methods that consider a variety of factors such as historical loss experience, the current credit quality of the portfolio, as well as an economic outlook over the life of the loan. The Company incorporates forward-looking information using macroeconomic scenarios applied over the forecasted life of the loans. The forward-looking information is limited to the reasonable and supportable period. These macroeconomic scenarios include variables that are considered key drivers of increases and decreases in credit losses. The Company utilizes a probability-weighted multiple scenario forecast approach. These scenarios may consist of a base forecast representing management's view of the most likely outcome, combined with downside and upside scenarios reflecting possible worsening or improving economic conditions. A loanprobability-weighted average of these macroeconomic scenarios over a reasonable and supportable forecast period is incorporated into the quantitative models. If the loans’ life extends beyond the reasonable and supportable forecast period, then historical experience, or long-run macroeconomic trends is considered impaired when, basedover the remaining life of the loans in estimation of the allowance for loan losses.
Qualitative Component — The Company also considers the following qualitative factors in the determination of the collectively evaluated allowance, if these factors have not already been captured by the quantitative model. Such qualitative factors may include, but are not limited to:
•Loan growth trends;
•The volume and severity of past due financial assets, and the volume and severity of adversely classified or rated financial assets;
•The Company’s lending policies and procedures, including changes in lending strategies, underwriting standards, collection, write-off and recovery practices,
•Knowledge of the borrower’s operations;
•The quality of the Company’s credit review system;
•The experience, ability and depth of the Company’s management, lending staff and other relevant staff;
•The effect of other external factors such as the regulatory, legal and technological environments; and
•Actual and expected changes in international, national, regional, and local economic and business conditions in which the Company operates, including the actual and expected conditions of various market segments.
The magnitude of the impact of these factors on the Company’s qualitative assessment of the allowance for credit losses changes from period to period according to changes made by management in its assessment of these factors. The extent to which these factors change may be dependent on whether they are already reflected in quantitative loss estimates during the current informationperiod and events, it is probablethe extent changes in these factors diverge from period to period. For the three months ended March 31, 2021 and 2020, there were no changes to the reasonable and supportable forecast period and reversion to historical loss experience method.
The following table provides key credit risk characteristics and macroeconomic variables that the Company willuses to estimate the expected credit losses by portfolio segment:
| | | | | | | | | | | | | | |
| | | | |
| Portfolio Segment | | Risk Characteristics | | Macroeconomic Variables |
| C&I | | Internal risk rating; size and credit spread at origination, and time to maturity | | Unemployment rate, and two and ten year treasury spread |
| CRE, Multifamily residential, and Construction and land | | Delinquency status; maturity date; collateral value; property type, and geographic location | | Unemployment rate; GDP, and U.S. Treasury rates |
| Single-family residential and HELOCs | | FICO; delinquency status; maturity date; collateral value, and geographic location | | Unemployment rate; GDP, and home price index |
| Other consumer | | Historical loss experience | | Immaterial (1) |
| | | | |
(1)Macroeconomic variables are included in the qualitative estimate.
Allowance for Loan Losses for the Commercial Loan Portfolio — The Company’s C&I loan lifetime loss rate model estimates credit losses by estimating a loss rate expected over the life of a loan. This loss rate is applied to the amortized cost basis, excluding accrued interest receivable, to determine expected credit losses. The lifetime loss rate model’s reasonable and supportable period spans eight quarters, thereafter immediately reverting to the historical average loss rate, expressed through the loan-level lifetime loss rate.
For CRE loans, projected probability of defaults (“PDs”) and loss given defaults (“LGDs”) are applied to the estimated exposure at default, considering the term and payment structure of the loan, to generate estimates of expected loss at the loan level. Within the reasonable and supportable period, the forecast of future economic conditions returns to long-run historical economic trends.
In order to estimate the life of a loan under both models, the contractual term of the loan is adjusted for estimated prepayments, which are based on historical prepayment experience.
Allowance for Loan Losses for the Consumer Loan Portfolio — For single-family residential and HELOC loans, projected PDs and LGDs are applied to the estimated exposure at default, considering the term and payment structure of the loan, to generate estimates of expected loss at the loan level. Within the reasonable and supportable period, the forecast of future economic conditions returns to long-run historical economic trends.
For other consumer loans, the Company uses a loss rate approach. In order to estimate the life of a loan, the contractual term of the loan is adjusted for estimated prepayments, which are based on historical prepayment experience.
Qualitative Allowance for Collectively Evaluated Loans — While the Company’s allowance methodologies strive to reflect all relevant credit risk factors, there continues to be uncertainty associated with, but not be ablelimited to, collect all scheduled paymentspotential imprecision in the estimation process due to the inherent time lag of principalobtaining information and normal variations between expected and actual outcomes. The Company may hold additional qualitative reserves that are designed to provide coverage for losses attributable to such risk. The allowance for loan losses as of March 31, 2021 and December 31, 2020 also included qualitative adjustments for certain industry sectors, such as oil & gas, included as part of the C&I loan portfolio.
Allowance for Individually Evaluated Loans
When a loan no longer shares similar risk characteristics with other loans, such as in the case for certain nonaccrual or interest due in accordance withTDR loans, the original contractual terms. ImpairedCompany estimates the allowance for loan losses on an individual loan basis. The allowance for loan losses for individually evaluated loans areis measured based onas the difference between the recorded value of the loans and their fair value. For loans evaluated individually, the Company uses one of three different asset valuation measurement methods: (1) the fair value of collateral less costs to sell; (2) the present value of expected future cash flows discounted atflows; and (3) the loan’s effective interest rate or, as expedient, at the loan’sloan's observable market price orprice. If an individually evaluated loan is determined to be collateral dependent, the Company applies the fair value of the collateral ifless costs to sell method. If an individually evaluated loan is determined not to be collateral dependent, the Company uses the present value of future cash flows or the observable market value of the loan.
Collateral-Dependent Loans — When a loan is collateral dependent, less coststhe allowance is measured on an individual loan basis and is limited to sell. When the difference between the recorded value and fair value of an impaired loan isthe collateral less thancost of disposal or sale. As of March 31, 2021, collateral-dependent commercial and consumer loans totaled $99.9 million and $16.6 million, respectively. In comparison, collateral-dependent commercial and consumer loans totaled $97.2 million and $17.3 million as of December 31, 2020, respectively. The Company's commercial collateral-dependent loans were secured by real estate or other collateral. The Company's consumer collateral-dependent loans were all residential mortgage loans, secured by the underlying real estate. As of both March 31, 2021 and December 31, 2020, the collateral value of the properties securing each of these collateral-dependent loans, net of selling costs, exceeded therecorded investment andvalue of the loan is classified as nonperforming and uncollectible, the deficiency is charged-off against the allowance for loan losses. Impaired loans exclude the homogeneous consumer loan portfolio, which is evaluated collectively for impairment. The Company’s impaired loans include predominantly non-PCI loans held-for-investment on nonaccrual status and any non-PCI loans modified in a TDR, which may be on accrual or nonaccrual status.individual loans.
The following tables present information onsummarize the non-PCI impaired loans as of September 30, 2017 and December 31, 2016:
|
| | | | | | | | | | | | | | | | | | | | |
| |
| ($ in thousands) | | September 30, 2017 |
| | Unpaid Principal Balance | | Recorded Investment With No Allowance | | Recorded Investment With Allowance | | Total Recorded Investment | | Related Allowance |
| CRE: | | |
| | |
| | |
| | |
| | |
|
| Income producing | | $ | 35,133 |
| | $ | 28,908 |
| | $ | 6,241 |
| | $ | 35,149 |
| | $ | 1,011 |
|
| Land | | 4,183 |
| | 4,173 |
| | 10 |
| | 4,183 |
| | 1 |
|
| C&I: | | |
| | |
| | |
| | |
| | |
|
| Commercial business | | 89,233 |
| | 50,700 |
| | 38,392 |
| | 89,092 |
| | 18,183 |
|
| Trade finance | | 4,786 |
| | — |
| | 4,708 |
| | 4,708 |
| | 786 |
|
| Residential: | | |
| | |
| | |
| | |
| | |
|
| Single-family | | 15,868 |
| | 1,867 |
| | 14,032 |
| | 15,899 |
| | 572 |
|
| Multifamily | | 12,224 |
| | 6,062 |
| | 6,170 |
| | 12,232 |
| | 194 |
|
| Consumer | | 4,298 |
| | 1,303 |
| | 2,998 |
| | 4,301 |
| | 4 |
|
| Total | | $ | 165,725 |
| | $ | 93,013 |
| | $ | 72,551 |
| | $ | 165,564 |
| | $ | 20,751 |
|
| |
|
| | | | | | | | | | | | | | | | | | | | |
| |
| ($ in thousands) | | December 31, 2016 |
| | Unpaid Principal Balance | | Recorded Investment With No Allowance | | Recorded Investment With Allowance | | Total Recorded Investment | | Related Allowance |
| CRE: | | |
| | |
| | |
| | |
| | |
|
| Income producing | | $ | 50,718 |
| | $ | 32,507 |
| | $ | 14,001 |
| | $ | 46,508 |
| | $ | 1,263 |
|
| Land | | 6,457 |
| | 5,427 |
| | 443 |
| | 5,870 |
| | 63 |
|
| C&I: | | |
| | |
| | |
| | | | |
|
| Commercial business | | 162,239 |
| | 78,316 |
| | 42,137 |
| | 120,453 |
| | 10,443 |
|
| Trade finance | | 5,227 |
| | — |
| | 5,166 |
| | 5,166 |
| | 34 |
|
| Residential: | | |
| | |
| | |
| | | | |
|
| Single-family | | 15,435 |
| | — |
| | 14,335 |
| | 14,335 |
| | 687 |
|
| Multifamily | | 11,181 |
| | 5,684 |
| | 4,357 |
| | 10,041 |
| | 180 |
|
| Consumer | | 4,016 |
| | — |
| | 3,682 |
| | 3,682 |
| | 31 |
|
| Total | | $ | 255,273 |
| | $ | 121,934 |
| | $ | 84,121 |
| | $ | 206,055 |
| | $ | 12,701 |
|
| |
The following table presents the average recorded investment and interest income recognized on non-PCI impaired loans for the three and nine months ended September 30, 2017 and 2016:
|
| | | | | | | | | | | | | | | | | | | | | | | | | | | | | | | | |
| |
| ($ in thousands) | | Three Months Ended September 30, | | Nine Months Ended September 30, |
| | 2017 | | 2016 | | 2017 | | 2016 |
| | Average
Recorded
Investment | | Recognized Interest Income (1) | | Average
Recorded
Investment | | Recognized Interest Income (1) | | Average Recorded Investment | | Recognized Interest Income (1) | | Average
Recorded
Investment | | Recognized Interest Income (1) |
| CRE: | | | | | | | | | | | | | | | | |
| Income producing | | $ | 37,489 |
| | $ | 179 |
| | $ | 52,116 |
| | $ | 464 |
| | $ | 37,238 |
| | $ | 535 |
| | $ | 52,221 |
| | $ | 1,368 |
|
| Land | | 4,337 |
| | — |
| | 6,622 |
| | 9 |
| | 4,484 |
| | — |
| | 6,777 |
| | 26 |
|
| C&I: | | | | | | | | | | | | | | | | |
| Commercial business | | 93,278 |
| | 242 |
| | 91,290 |
| | 258 |
| | 94,709 |
| | 799 |
| | 92,805 |
| | 648 |
|
| Trade finance | | 4,216 |
| | 53 |
| | 9,005 |
| | 33 |
| | 4,444 |
| | 122 |
| | 10,028 |
| | 166 |
|
| Residential: | | | | | | | | | | | | | | | | |
| Single-family | | 16,124 |
| | 111 |
| | 13,438 |
| | 72 |
| | 16,141 |
| | 325 |
| | 13,517 |
| | 220 |
|
| Multifamily | | 12,532 |
| | 108 |
| | 20,585 |
| | 77 |
| | 12,540 |
| | 324 |
| | 20,646 |
| | 231 |
|
| Consumer | | 4,492 |
| | 14 |
| | 1,571 |
| | 16 |
| | 4,455 |
| | 41 |
| | 1,575 |
| | 48 |
|
| Total non-PCI impaired loans | | $ | 172,468 |
| | $ | 707 |
| | $ | 194,627 |
| | $ | 929 |
| | $ | 174,011 |
| | $ | 2,146 |
| | $ | 197,569 |
| | $ | 2,707 |
|
| |
| |
(1) | Includes interest recognized on accruing non-PCI TDRs. Interest payments received on nonaccrual non-PCI loans are reflected as a reduction to principal and not as interest income. |
Allowance for Credit Losses
The following tables present a summary of activitiesactivity in the allowance for loan losses by portfolio segmentsegments for the three and nine months ended September 30, 2017 March 31, 2021 and 2016:2020:
| | | | | | | | | | | | | | | | | | | | | | | | | | | | | | | | | | | | | | | | | | | | | | | | | | |
|
| ($ in thousands) | | Three Months Ended March 31, 2021 |
| Commercial | | Consumer | | Total |
| C&I | | CRE | | Residential Mortgage | | Other
Consumer | |
| | CRE | | Multifamily
Residential | | Construction
and Land | | Single-
Family
Residential | | HELOCs | | |
| Allowance for loan losses, beginning of period | | $ | 398,040 | | | $ | 163,791 | | | $ | 27,573 | | | $ | 10,239 | | | $ | 15,520 | | | $ | 2,690 | | | $ | 2,130 | | | $ | 619,983 | |
| Provision for (reversal of) credit losses on loans | (a) | 3,839 | | | (10,277) | | | (1,391) | | | 8,592 | | | 376 | | | 22 | | | (113) | | | 1,048 | |
| Gross charge-offs | | (8,436) | | | (7,195) | | | (17) | | | (71) | | | (134) | | | (45) | | | (1) | | | (15,899) | |
| Gross recoveries | | 760 | | | 80 | | | 1,242 | | | 329 | | | 77 | | | 3 | | | 2 | | | 2,493 | |
| Total net (charge-offs) recoveries | | (7,676) | | | (7,115) | | | 1,225 | | | 258 | | | (57) | | | (42) | | | 1 | | | (13,406) | |
| Foreign currency translation adjustment | | (119) | | | 0 | | | 0 | | | 0 | | | 0 | | | 0 | | | 0 | | | (119) | |
| Allowance for loan losses, end of period | | $ | 394,084 | | | $ | 146,399 | | | $ | 27,407 | | | $ | 19,089 | | | $ | 15,839 | | | $ | 2,670 | | | $ | 2,018 | | | $ | 607,506 | |
| | | | | | | | | | | | | | | | |
| | | | | | | | | | | | | | | | |
| | | | | | | | | | | | | | | | |
| | | | | | | | | | | | | | | | |
| | | | | | | | | | | | | | | | |
| | | | | | | | | | | | | | | | |
|
| | | | | | | | | | | | | | | | | | | | | | | | | | | | |
| |
| ($ in thousands) | | Three Months Ended September 30, 2017 |
| | Non-PCI Loans | | PCI Loans | | Total |
| | CRE | | C&I | | Residential | | Consumer | | Total | | |
| Beginning balance | | $ | 73,985 |
| | $ | 150,136 |
| | $ | 43,679 |
| | $ | 8,438 |
| | $ | 276,238 |
| | $ | 78 |
| | $ | 276,316 |
|
| (Reversal of) provision for loan losses | | (346 | ) | | 15,656 |
| | (583 | ) | | (1,269 | ) | | 13,458 |
| | (10 | ) | | 13,448 |
|
| Charge-offs | | — |
| | (7,359 | ) | | — |
| | (65 | ) | | (7,424 | ) | | — |
| | (7,424 | ) |
| Recoveries | | 610 |
| | 2,165 |
| | 809 |
| | 2 |
| | 3,586 |
| | — |
| | 3,586 |
|
| Net recoveries (charge-offs) | | 610 |
| | (5,194 | ) | | 809 |
| | (63 | ) | | (3,838 | ) | | — |
| | (3,838 | ) |
| Ending balance | | $ | 74,249 |
| | $ | 160,598 |
| | $ | 43,905 |
| | $ | 7,106 |
| | $ | 285,858 |
| | $ | 68 |
| | $ | 285,926 |
|
| |
| | | | | | | | | | | | | | | | | | | | | | | | | | | | | | | | | | | | | | | | | | | | | | | | | | |
|
| ($ in thousands) | | Three Months Ended March 31, 2020 |
| Commercial | | Consumer | | Total |
| C&I | | CRE | | Residential Mortgage | | Other
Consumer | |
| | CRE | | Multifamily
Residential | | Construction
and Land | | Single-
Family
Residential | | HELOCs | | |
| Allowance for loan losses, beginning of period | | $ | 238,376 | | | $ | 40,509 | | | $ | 22,826 | | | $ | 19,404 | | | $ | 28,527 | | | $ | 5,265 | | | $ | 3,380 | | | $ | 358,287 | |
| Impact of ASU 2016-13 adoption | | 74,237 | | | 72,169 | | | (8,112) | | | (9,889) | | | (3,670) | | | (1,798) | | | 2,221 | | | 125,158 | |
| Provision for (reversal of) credit losses on loans | (a) | 60,618 | | | 11,435 | | | 1,281 | | | 1,482 | | | 1,700 | | | 412 | | | (2,272) | | | 74,656 | |
| | | | | | | | | | | | | | | | |
| Gross charge-offs | | (11,977) | | | (954) | | | 0 | | | 0 | | | 0 | | | 0 | | | (26) | | | (12,957) | |
| Gross recoveries | | 1,575 | | | 9,660 | | | 535 | | | 21 | | | 265 | | | 2 | | | 1 | | | 12,059 | |
| Total net (charge-offs) recoveries | | (10,402) | | | 8,706 | | | 535 | | | 21 | | | 265 | | | 2 | | | (25) | | | (898) | |
| Foreign currency translation adjustment | | (200) | | | 0 | | | 0 | | | 0 | | | 0 | | | 0 | | | 0 | | | (200) | |
| Allowance for loan losses, end of period | | $ | 362,629 | | | $ | 132,819 | | | $ | 16,530 | | | $ | 11,018 | | | $ | 26,822 | | | $ | 3,881 | | | $ | 3,304 | | | $ | 557,003 | |
| | | | | | | | | | | | | | | | |
| | | | | | | | | | | | | | | | |
| | | | | | | | | | | | | | | | |
| | | | | | | | | | | | | | | | |
| | | | | | | | | | | | | | | | |
| | | | | | | | | | | | | | | | |
| | | | | | | | | | | | | | | | |
The following table summarizes the activities in the allowance for unfunded credit commitments for the three months ended March 31, 2021 and 2020:
| | | | | | | | | | | | | | |
|
| ($ in thousands) | | Three Months Ended March 31, |
| 2021 | | 2020 |
| Unfunded credit facilities | | | | |
| Allowance for unfunded credit commitments, beginning of period | | $ | 33,577 | | | $ | 11,158 | |
| Impact of ASU 2016-13 adoption | | 0 | | | 10,457 | |
| Reversal of credit losses on unfunded credit commitments | (b) | (1,048) | | | (786) | |
| Allowance for unfunded credit commitments, end of period | | 32,529 | | | 20,829 | |
| | | | |
| Provision for credit losses | (a) + (b) | $ | 0 | | | $ | 73,870 | |
|
|
| | | | | | | | | | | | | | | | | | | | | | | | | | | | |
| |
| ($ in thousands) | | Three Months Ended September 30, 2016 |
| | Non-PCI Loans | | PCI Loans | | Total |
| | CRE | | C&I | | Residential | | Consumer | | Total | | |
| Beginning balance | | $ | 78,102 |
| | $ | 148,427 |
| | $ | 31,561 |
| | $ | 8,421 |
| | $ | 266,511 |
| | $ | 257 |
| | $ | 266,768 |
|
| (Reversal of) provision for loan losses | | (6,598 | ) | | 18,548 |
| | 309 |
| | (644 | ) | | 11,615 |
| | (101 | ) | | 11,514 |
|
| Charge-offs | | (309 | ) | | (23,696 | ) | | (29 | ) | | (13 | ) | | (24,047 | ) | | — |
| | (24,047 | ) |
| Recoveries | | 634 |
| | 165 |
| | 654 |
| | 124 |
| | 1,577 |
| | — |
| | 1,577 |
|
| Net recoveries (charge-offs) | | 325 |
| | (23,531 | ) | | 625 |
| | 111 |
| | (22,470 | ) | | — |
| | (22,470 | ) |
| Ending balance | | $ | 71,829 |
| | $ | 143,444 |
| | $ | 32,495 |
| | $ | 7,888 |
| | $ | 255,656 |
| | $ | 156 |
| | $ | 255,812 |
|
| |
|
| | | | | | | | | | | | | | | | | | | | | | | | | | | | |
| |
| ($ in thousands) | | Nine Months Ended September 30, 2017 |
| | Non-PCI Loans | | PCI Loans | | Total |
| | CRE | | C&I | | Residential | | Consumer | | Total | | |
| Beginning balance | | $ | 72,804 |
| | $ | 142,166 |
| | $ | 37,333 |
| | $ | 8,099 |
| | $ | 260,402 |
| | $ | 118 |
| | $ | 260,520 |
|
| (Reversal of) provision for loan losses | | (120 | ) | | 28,576 |
| | 4,815 |
| | (1,087 | ) | | 32,184 |
| | (50 | ) | | 32,134 |
|
| Charge-offs | | (149 | ) | | (19,802 | ) | | (1 | ) | | (72 | ) | | (20,024 | ) | | — |
| | (20,024 | ) |
| Recoveries | | 1,714 |
| | 9,658 |
| | 1,758 |
| | 166 |
| | 13,296 |
| | — |
| | 13,296 |
|
| Net recoveries (charge-offs) | | 1,565 |
| | (10,144 | ) | | 1,757 |
| | 94 |
| | (6,728 | ) | | — |
| | (6,728 | ) |
| Ending balance | | $ | 74,249 |
| | $ | 160,598 |
| | $ | 43,905 |
| | $ | 7,106 |
| | $ | 285,858 |
| | $ | 68 |
| | $ | 285,926 |
|
| |
|
| | | | | | | | | | | | | | | | | | | | | | | | | | | | |
| |
| ($ in thousands) | | Nine Months Ended September 30, 2016 |
| | Non-PCI Loans | | PCI Loans | | Total |
| | CRE | | C&I | | Residential | | Consumer | | Total | | |
| Beginning balance | | $ | 81,191 |
| | $ | 134,597 |
| | $ | 39,292 |
| | $ | 9,520 |
| | $ | 264,600 |
| | $ | 359 |
| | $ | 264,959 |
|
| (Reversal of) provision for loan losses | | (9,731 | ) | | 38,549 |
| | (7,679 | ) | | (1,887 | ) | | 19,252 |
| | (203 | ) | | 19,049 |
|
| Charge-offs | | (504 | ) | | (31,770 | ) | | (166 | ) | | (17 | ) | | (32,457 | ) | | — |
| | (32,457 | ) |
| Recoveries | | 873 |
| | 2,068 |
| | 1,048 |
| | 272 |
| | 4,261 |
| | — |
| | 4,261 |
|
| Net recoveries (charge-offs) | | 369 |
| | (29,702 | ) | | 882 |
| | 255 |
| | (28,196 | ) | | — |
| | (28,196 | ) |
| Ending balance | | $ | 71,829 |
| | $ | 143,444 |
| | $ | 32,495 |
| | $ | 7,888 |
| | $ | 255,656 |
| | $ | 156 |
| | $ | 255,812 |
|
| |
For further information on accounting policies and the methodologies used to estimateThe allowance for credit losses as of March 31, 2021 was $640.0 million, a decrease of $13.6 million compared with $653.6 million as of December 31, 2020. The decrease in the allowance for credit losses was comprised of a net decrease of $12.5 million in the allowance for loan losses and a $1.1 million decrease in the allowance for unfunded credit commitments. The improved macroeconomic outlook resulted in an overall decrease in the required allowance for credit losses as of March 31, 2021, and 0 provision for credit losses was recorded for the three months ended March 31, 2021. The Company uses a multi-scenario approach in calculating the allowance for loan charge-offs, see losses and applies management judgment to add qualitative factors for the impact of the COVID-19 pandemic on industry and CRE sectors that are affected by the pandemic.
The allowance for unfunded credit commitments is maintained at a level that management believes to be sufficient to absorb estimated expected credit losses related to unfunded credit facilities. See Note 10 — Commitments and Contingencies to the Consolidated Financial Statements in this Form 10-Q for additional information related to unfunded credit commitments.
Loans Held-for-Sale
As of March 31, 2021, the Company had 0 loans held-for-sale. As of December 31, 2020, loans held-for-sale of $1.8 million consisted of single-family residential loans. Refer to Note 1 — Summary of Significant Accounting Policies— Significant Accounting Policies — Loans Held-for-Sale to the Consolidated Financial Statements of the Company’s 20162020 Form 10-K.10-K for additional details related to the Company’s loans held-for-sale.
Loan Transfers, Sales and Purchases
The following table presents a summary of activitiesCompany purchases and sells loans in the allowance for unfunded credit reserves for the three and nine months ended September 30, 2017 and 2016:
|
| | | | | | | | | | | | | | | | |
| | | | | | | | | |
| ($ in thousands) | | Three Months Ended
September 30, | | Nine Months Ended
September 30, |
| | 2017 | | 2016 | | 2017 | | 2016 |
| Beginning balance | | $ | 15,188 |
| | $ | 20,318 |
| | $ | 16,121 |
| | $ | 20,360 |
|
| Reversal of unfunded credit reserves | | (452 | ) | | (1,989 | ) | | (1,385 | ) | | (2,031 | ) |
| Ending balance | | $ | 14,736 |
| | $ | 18,329 |
| | $ | 14,736 |
| | $ | 18,329 |
|
| | | | | | | | | |
The allowance for unfunded credit reserves is maintained at a level management believes to be sufficient to absorb estimated probable losses related to unfunded credit facilities. The allowance for unfunded credit reserves is included in Accrued expense and other liabilities on the Consolidated Balance Sheets. See Note 11 — Commitments and Contingencies to the Consolidated Financial Statements for additional information related to unfunded credit reserves.
The following tables present the Company’s allowance for loan losses and recorded investments by portfolio segment and impairment methodology as of September 30, 2017 and December 31, 2016:
|
| | | | | | | | | | | | | | | | | | | | |
| |
| ($ in thousands) | | September 30, 2017 |
| | CRE | | C&I | | Residential | | Consumer | | Total |
| Allowance for loan losses | | | | | | | | | | |
| Individually evaluated for impairment | | $ | 1,012 |
| | $ | 18,969 |
| | $ | 766 |
| | $ | 4 |
| | $ | 20,751 |
|
| Collectively evaluated for impairment | | 73,237 |
| | 141,629 |
| | 43,139 |
| | 7,102 |
| | 265,107 |
|
Acquired with deteriorated credit quality | | 68 |
| | — |
| | — |
| | — |
| | 68 |
|
| Ending balance | | $ | 74,317 |
| | $ | 160,598 |
| | $ | 43,905 |
| | $ | 7,106 |
| | $ | 285,926 |
|
| | | | | | | | | | | |
| Recorded investment in loans | | | | | | | | | | |
| Individually evaluated for impairment | | $ | 39,332 |
| | $ | 93,800 |
| | $ | 28,131 |
| | $ | 4,301 |
| | $ | 165,564 |
|
| Collectively evaluated for impairment | | 9,174,220 |
| | 10,538,790 |
| | 6,014,197 |
| | 2,100,313 |
| | 27,827,520 |
|
Acquired with deteriorated credit quality (1) | | 313,628 |
| | 12,566 |
| | 190,637 |
| | 15,442 |
| | 532,273 |
|
Ending balance (1) | | $ | 9,527,180 |
| | $ | 10,645,156 |
| | $ | 6,232,965 |
| | $ | 2,120,056 |
| | $ | 28,525,357 |
|
| |
|
| | | | | | | | | | | | | | | | | | | | |
| |
| ($ in thousands) | | December 31, 2016 |
| | CRE | | C&I | | Residential | | Consumer | | Total |
| Allowance for loan losses | | | | | | | | | | |
| Individually evaluated for impairment | | $ | 1,326 |
| | $ | 10,477 |
| | $ | 867 |
| | $ | 31 |
| | $ | 12,701 |
|
| Collectively evaluated for impairment | | 71,478 |
| | 131,689 |
| | 36,466 |
| | 8,068 |
| | 247,701 |
|
| Acquired with deteriorated credit quality | | 112 |
| | 1 |
| | 5 |
| | — |
| | 118 |
|
| Ending balance | | $ | 72,916 |
| | $ | 142,167 |
| | $ | 37,338 |
| | $ | 8,099 |
| | $ | 260,520 |
|
| | | | | | | | | | | |
| Recorded investment in loans | | | | | | | | | | |
| Individually evaluated for impairment | | $ | 52,378 |
| | $ | 125,619 |
| | $ | 24,376 |
| | $ | 3,682 |
| | $ | 206,055 |
|
| Collectively evaluated for impairment | | 8,288,119 |
| | 9,476,557 |
| | 4,836,578 |
| | 2,053,385 |
| | 24,654,639 |
|
Acquired with deteriorated credit quality (1) | | 350,366 |
| | 38,387 |
| | 234,764 |
| | 18,928 |
| | 642,445 |
|
Ending balance (1) | | $ | 8,690,863 |
| | $ | 9,640,563 |
| | $ | 5,095,718 |
| | $ | 2,075,995 |
| | $ | 25,503,139 |
|
| |
| |
(1) | Loans net of ASC 310-30 discount. |
Purchased Credit Impaired Loans
At the date of acquisition, PCI loans are pooled and accounted for at fair value, which represents the discounted value of the expected cash flows of the loan portfolio. A pool is accounted for as a single asset with a single interest rate, cumulative loss rate and cash flow expectation. The cash flows expected over the life of the pools are estimated by an internal cash flow model that projects cash flows and calculates the carrying values of the pools, book yields, effective interest income and impairment, if any, based on pool level events. Assumptions as to cumulative loss rates, loss curves and prepayment speeds are utilized to calculate the expected cash flows. The amount of expected cash flows over the initial investmentsecondary market in the loan represents the “accretable yield,” which is recognized as interest income on a level yield basis over the lifeordinary course of the loan. Prepayments affect the estimated life of PCIbusiness. Purchased loans which may change the amount of interest income, and possibly principal, expected to be collected. The excess of total contractual cash flows over the cash flows expected to be received at origination is deemed to be the “nonaccretable difference.”
The following table presents the changes in accretable yield for PCI loans for the three and nine months ended September 30, 2017 and 2016:
|
| | | | | | | | | | | | | | | | |
| |
| ($ in thousands) | | Three Months Ended September 30, | | Nine Months Ended September 30, |
| | 2017 | | 2016 | | 2017 | | 2016 |
| Beginning balance | | $ | 118,625 |
| | $ | 166,777 |
| | $ | 136,247 |
| | $ | 214,907 |
|
| Accretion | | (10,747 | ) | | (14,827 | ) | | (32,108 | ) | | (53,510 | ) |
| Changes in expected cash flows | | 2,078 |
| | 311 |
| | 5,817 |
| | (9,136 | ) |
| Ending balance | | $ | 109,956 |
| | $ | 152,261 |
| | $ | 109,956 |
| | $ | 152,261 |
|
| |
Loans Held-for-Sale
Loans held-for-sale are carried at the lower of cost or fair value. When a determination is made at the time of commitment to originate or purchase loans as held-for-investment, it is the Company’s intent to hold these loans to maturity or for the “foreseeable future,” subject to periodic reviews under the Company’s management evaluation processes, including asset/liability management. When the Company subsequently changes its intent to hold certain loans, the loans are transferred from held-for-investment to held-for-sale, atand write-downs to allowance for loan losses are recorded, when appropriate. The following tables provide information about the lowercarrying value of cost or fair value.
As of September 30, 2017, loans held-for-sale amounted to $178 thousand, which were comprised of single-family residential loans. In comparison, as of December 31, 2016,purchased for the held-for-investment portfolio, loans held-for-sale amounted to $23.1 million, which were primarily comprised of consumer loans. Loanssold and loans transferred from held-for-investment to held-for-sale were $74.5 million and $418.5 million during the three and nine months ended September 30, 2017, respectively. These loan transfers were primarily comprisedMarch 31, 2021 and 2020:
| | | | | | | | | | | | | | | | | | | | | | | | | | | | | | | | | | | | | | |
|
| ($ in thousands) | | Three Months Ended March 31, 2021 |
| Commercial | | Consumer | | | | | | Total |
| C&I | | CRE | | Residential Mortgage | | | | | |
| | CRE | | Multifamily
Residential | | | | Single-Family
Residential | | | | | |
Loans transferred from held-for-investment to held-for-sale (1) | | $ | 125,840 | | | $ | 20,032 | | | $ | 0 | | | | | $ | 0 | | | | | | | $ | 145,872 | |
| | | | | | | | | | | | | | | | |
Sales (2)(3)(4) | | $ | 125,879 | | | $ | 20,032 | | | $ | 0 | | | | | $ | 7,506 | | | | | | | $ | 153,417 | |
Purchases (5) | | $ | 178,678 | | | $ | 0 | | | $ | 370 | | | | | $ | 131,800 | | | | | | | $ | 310,848 | |
|
| | | | | | | | | | | | | | | | | | | | | | | | | | | | | | | | | | | | | | |
|
| ($ in thousands) | | Three Months Ended March 31, 2020 |
| Commercial | | Consumer | | | | | | Total |
| C&I | | CRE | | Residential Mortgage | | | | | |
| | CRE | | Multifamily
Residential | | | | Single-Family
Residential | | | | |
Loans transferred from held-for-investment to held-for-sale (1) | | $ | 102,973 | | | $ | 7,250 | | | $ | 0 | | | | | $ | 0 | | | | | | | $ | 110,223 | |
| | | | | | | | | | | | | | | | |
Sales (2)(3)(4) | | $ | 102,973 | | | $ | 7,250 | | | $ | 0 | | | | | $ | 4,642 | | | | | | | $ | 114,865 | |
Purchases (5) | | $ | 130,583 | | | $ | 0 | | | $ | 1,513 | | | | | $ | 1,084 | | | | | | | $ | 133,180 | |
|
(1)Includes write-downs of C&I loans for both periods. In comparison, $144.9 million and $720.7 million of loans were transferred from held-for-investment to held-for-sale during the three and nine months ended September 30, 2016, respectively. These loan transfers were primarily comprised of C&I, multifamily residential and CRE loans for both periods. The Company recorded $232$39 thousand and $441 thousand in write-downs to the allowance for loan losses related to loans transferred from held-for-investment to held-for-sale for the three and nine months ended September 30, 2017, respectively. In comparison, thereMarch 31, 2021. There were no0 write-downs and $1.9 million of write-downs recorded to the allowance for loan losses related to loans transferred from held-for-investment to held-for-sale for the three and nine months ended September 30, 2016, respectively.March 31, 2020.
During(2)Includes originated loans sold of $131.0 million and $114.9 million for the three and nine months ended September 30, 2017, the Company sold $33.8 millionMarch 31, 2021 and $101.4 million, respectively, in originated loans, resulting in net gains of $2.3 million and $5.5 million,2020, respectively. Originated loans sold during these periods wereconsisted primarily comprised of C&I and CRE loans. In comparison,loans for both periods.
(3)Includes $22.4 million of purchased loans sold in the Company sold $107.3 million in originated loans duringsecondary market for the three months ended September 30, 2016, resulting in net gains of $2.2 million. OriginatedMarch 31, 2021. There were 0 purchased loans sold during this period were primarily comprised of C&I and CRE loans. During the nine months ended September 30, 2016, the Company sold or securitized $529.5 million in originated loans, resulting in net gains of $9.3 million. Included in these amounts were $201.7 million of multifamily residential loans securitized during the first quarter of 2016, which resulted in net gains of $1.1 million, $641 thousand in mortgage servicing rights and $160.1 million of held-to-maturity investment security that were recorded. The remaining $327.8 million of originated loans sold during the nine months ended September 30, 2016, primarily comprising of CRE and C&I loans, resulted in net gains of $8.2 million.
During the three and nine months ended September 30, 2017, the Company purchased $72.4 million and $441.1 million loans, respectively, compared to $256.2 million and $1.04 billion during the three and nine months ended September 30, 2016, respectively. Purchased loans for each of the three and nine months ended September 30, 2017 were primarily comprised of C&I syndication loans. Purchased loans for each of the three and nine months ended September 30, 2016 were primarily comprised of C&I syndication loans and single-family residential loans. The higher loans purchased for the three and nine months ended September 30, 2016, primarily included $165.8 million and $488.3 million, respectively, of single-family residential loans purchased for Community Reinvestment Act (“CRA”) purposes.
From time to time, the Company purchases and sells loans in the secondary market. Certain purchased loans are transferred from held-for-investment to held-for-sale and write-downs to allowance for loan losses are recorded, when appropriate. During the three and nine months ended September 30, 2017, the Company sold loans of $57.4 million and $354.5 million, respectively, in the secondary market at net gains of $19 thousand and $1.2 million, respectively. In comparison, the Company sold loans of $45.8 million and $179.4 million for the three and nine months ended September 30, 2016, respectively, in the secondary market. Loan sales in the secondary market resulted in no gains or losses and $69 thousand in net gains recorded for the three and nine months ended September 30, 2016, respectively.March 31, 2020.
The Company records valuation adjustments in (4)Net gains on sales of loans on the Consolidated Statements of Income to carry the loans held-for-sale portfolio at the lower of cost or fair value. For each of were $1.8 million and $950 thousand for the three months ended September 30, 2017March 31, 2021 and 2016, no valuation adjustments2020, respectively.
(5)C&I loan purchases were recorded. For the nine months ended September 30, 2017 and 2016, the Company recorded $61 thousand and $2.4 million, respectively, in valuation adjustments.comprised primarily of syndicated C&I term loans.
Note 98 — Investments in Qualified Affordable Housing Partnerships, Tax Credit and Other Investments, Net and Variable Interest Entities
The CRA encourages banks to meet the credit needs of their communities, for housingparticularly low- and other purposes, particularly in neighborhoods with low or moderate income.moderate-income individuals and neighborhoods. The Company invests in certain affordable housing projects in the form of ownership interests in limited partnerships or limited liability companies that qualify for CRA consideration and tax credits. Such limited partnershipsThese entities are formed to develop and operate apartment complexes designed as high-quality affordable housing for lower income tenants throughout the U.S. EachTo fully utilize the available tax credits, each of the partnershipsthese entities must meet the regulatory requirements for affordable housing requirements for a minimum 15-year compliance period to fully utilize the tax credits.period. In addition to affordable housing limited partnerships,projects, the Company also invests in new market tax creditNew Market Tax Credit projects that qualify for CRA credits andconsideration, as well as eligible projects that qualify for renewable energy and historic tax credits. Investments in renewable energy tax credits help promote the development of renewable energy sources, whileand the investments in historic tax credits promote the rehabilitation of historic buildings and economic revitalization of the surrounding areas.
Investments in Qualified Affordable Housing Partnerships, Net
The Company records its investments in qualified affordable housing partnerships, net, using the proportional amortization method. Under the proportional amortization method, the Company amortizes the initial cost of the investment in proportion to the tax credits and other tax benefits received, and recognizes the amortization in Income tax expense on the Consolidated StatementsStatement of Income.
The following table presents the balances of the Company’s investments in qualified affordable housing partnerships, net, and related unfunded commitments as of the periods indicated:March 31, 2021 and December 31, 2020:
| | | | | | | | | | | | | | |
|
| ($ in thousands) | | March 31, 2021 | | December 31, 2020 |
| Investments in qualified affordable housing partnerships, net | | $ | 284,862 | | | $ | 213,555 | |
| Accrued expenses and other liabilities — Unfunded commitments | | $ | 142,103 | | | $ | 77,444 | |
|
|
| | | | | | | | |
| |
| ($ in thousands) | | September 30, 2017 | | December 31, 2016 |
| Investments in qualified affordable housing partnerships, net | | $ | 178,344 |
| | $ | 183,917 |
|
| Accrued expenses and other liabilities — Unfunded commitments | | $ | 63,607 |
| | $ | 57,243 |
|
| |
The following table presents additional information related to the Company’s investments in qualified affordable housing partnerships, net, for the periods indicated:three months ended March 31, 2021 and 2020:
| | | | | | | | | | | | | | | | | | |
|
| ($ in thousands) | | Three Months Ended March 31, | | |
| 2021 | | 2020 | | | | |
| Tax credits and other tax benefits recognized | | $ | 11,028 | | | $ | 11,031 | | | | | |
| Amortization expense included in income tax expense | | $ | 8,712 | | | $ | 8,384 | | | | | |
|
|
| | | | | | | | | | | | | | | | |
| | | | | | | | | |
| ($ in thousands) | | Three Months Ended
September 30, | | Nine Months Ended
September 30, |
| | 2017 | | 2016 | | 2017 | | 2016 |
| Tax credits and other tax benefits recognized | | $ | 15,840 |
| | $ | 8,591 |
| | $ | 35,027 |
| | $ | 26,561 |
|
| Amortization expense included in income tax expense | | $ | 8,944 |
| | $ | 6,612 |
| | $ | 22,945 |
| | $ | 20,923 |
|
| | | | | | | | | |
Investments in Tax Credit and Other Investments, Net
Investments in tax credit and other investments, net, were $203.8 million and $173.3 million as of September 30, 2017 and December 31, 2016, respectively. The Company is not the primary beneficiary in these partnerships and, therefore, is not required to consolidate its investments in tax credit and other investments on the Consolidated Financial Statements. Depending on the ownership percentage and the influence the Company has on the limited partnership,investments in tax credit and other investments, net, the Company applies either the equity or cost method of accounting.accounting, or the measurement alternative as elected under ASU 2016-01 for equity investments without readily determinable fair value.
TotalThe following table presents the Company’s investments in tax credit and other investments, net, and related unfunded commitments for these investments were $103.0 million and $117.0 million as of September 30, 2017March 31, 2021 and December 31, 2016, respectively, and are included in Accrued expenses and other liabilities on the Consolidated Balance Sheets. 2020:
| | | | | | | | | | | | | | |
|
| ($ in thousands) | | March 31, 2021 | | December 31, 2020 |
| Investments in tax credit and other investments, net | | $ | 361,438 | | | $ | 266,525 | |
| Accrued expenses and other liabilities — Unfunded commitments | | $ | 192,644 | | | $ | 105,282 | |
|
Amortization of tax credit and other investments was $23.8$25.4 million and $32.6$18.8 million for the three months ended September 30, 2017March 31, 2021 and 2016,2020, respectively.
The Company held equity securities that are mutual funds with readily determinable fair values of $26.7 million and $31.3 million, as of March 31, 2021 and December 31, 2020, respectively. The Company invested in these mutual funds for CRA purposes. These equity securities were measured at fair value with changes in fair value recorded in net income. For these investments, the Company recorded a $497 thousand unrealized loss compared to a $38 thousand unrealized gain during the three months ended March 31, 2021 and 2020, respectively. Equity securities with readily determinable fair value were included in Investments in tax credit and other investments, net on the Consolidated Balance Sheet.
The Company held equity securities without readily determinable fair values totaling $27.2 million and $23.7 million as of March 31, 2021 and December 31, 2020, respectively, which were measured using the measurement alternative at cost less impairment and adjusted for observable price changes. For the three months ended March 31, 2021 and 2020, there were 0 adjustments made to these securities. Equity securities without readily determinable fair values were included in Investments in tax credit and other investments, net and Other assets on the Consolidated Balance Sheet.
Tax credit investments are evaluated for possible OTTI on an annual basis or when events or changes in circumstances suggest that the carrying amount of the tax credit investments may not be realizable. OTTI charges are recorded within Amortization of tax credit and other investments, net on the Consolidated Statement of Income. Refer to Note 3 — Fair Value Measurement and Fair Value of Financial Instruments to the Consolidated Financial Statements in this Form 10-Q for a discussion on the Company’s impairment evaluation and monitoring process of tax credit investments. For the three months ended March 31, 2021, the Company recorded an impairment recovery of $374 thousand related to 1 historic tax credit and recorded 0 OTTI charge within Amortization of tax credit and other investments on the Consolidated Statement of Income. In comparison, the Company recorded an impairment recovery of $150 thousand related to 1 historic tax credit and recorded 0 OTTI charge for the three months ended March 31, 2020.
Variable Interest Entities
The Company invests in unconsolidated limited partnerships and similar entities that construct, own and operate affordable housing, historic rehabilitation, wind and solar projects, of which the majority of such investments are variable interest entities (“VIEs”). As a limited partner in these partnerships, these investments are designed to generate a return primarily through the realization of federal tax credits and tax benefits. An unrelated third party is typically the general partner or managing member who has control over the significant activities of such investments. While the Company’s interest in some of the investments may exceed 50% of the outstanding equity interests, the Company does not consolidate these structures due to the general partner or managing member’s ability to manage the entity, which is indicative of power over them. The Company’s maximum exposure to loss in connection with these partnerships consist of the unamortized investment balance and any tax credits claimed that may become subject to recapture.
Special purpose entities formed in connection with securitization transactions are generally considered VIEs. A CLO is a VIE that purchases a pool of assets consisting primarily of non-investment grade corporate loans, and issues multiple tranches of notes to investors to fund the asset purchases and pay upfront expenses associated with forming the CLO. The Company served as the collateral manager of a CLO that closed in 2019 and subsequently reassigned its portfolio manager responsibilities in 2020. The Company retained the top 3 investment grade-rated tranches issued by the CLO, for which the total carrying amount was $66.1$291.5 million and $60.8$287.5 million for the nine months ended September 30, 2017as of March 31, 2021 and 2016,December 31, 2020, respectively.
Note 109—Goodwill and Other Intangible Assets
Goodwill
Total goodwill of $469.4was $465.7 million remained unchanged as of September 30, 2017 compared toboth March 31, 2021 and December 31, 2016. Goodwill2020. The Company’s annual goodwill impairment testing is tested for impairment on an annual basisperformed as of December 31st, of each year, or more frequently as events occur or circumstances change that would more likely than notmore-likely-than-not reduce the fair value of a reporting unit below its carrying amount. The Company’s three operating segments, Retail Banking, Commercial Banking and Other, are equivalentvalue. Additional information pertaining to the Company’s reporting units. For complete discussion and disclosure, see our accounting policy for goodwill is summarized in Note 151 — Business Segments to the Consolidated Financial Statements.
Impairment Analysis
The Company performed its annual impairment analysis as Summary of December 31, 2016 and concluded that there was no goodwill impairment as the fair values of all reporting units exceeded the carrying amounts of goodwill. There were no triggering events during the nine months ended September 30, 2017, and therefore, no additional goodwill impairment analysis was performed. No assurance can be given that goodwill will not be written down in future periods. Refer to Note 9 Significant Accounting Policies — Goodwill and Other Intangible Assets to the Consolidated Financial Statements of the Company’s 20162020 Form 10-K for additional details related to the Company’s10-K. The Company completed an annual goodwill impairment analysis.testing as of December 31, 2020, and determined there was 0 goodwill impairment.
As of March 31, 2021, while COVID-19 cases have begun to ease from the January 2021 peak, the spread of new, more contagious variants could impact the magnitude and duration of this health crisis. However, ongoing virus containment efforts and vaccination progress, as well as the possibility of further government stimulus, could accelerate the macroeconomic recovery. The Company conducted a qualitative interim impairment test as of March 31, 2021, and concluded goodwill was not impaired. There were 0 changes in the carrying amount of goodwill during the three months ended March 31, 2021 and 2020.
Core Deposit Intangibles
Core deposit intangibles represent the intangible value of depositor relationships resulting from deposit liabilities assumed in various acquisitions and were included in Other assets on the Consolidated Balance Sheets. These intangibles are tested for impairment on an annual basis, or more frequently as events occur, or as current circumstances and conditions warrant. There were no impairment write-downs on core deposit intangibles for the nine months ended September 30, 2017 and 2016.
The following table presents the gross carrying valueamount of core deposit intangible assets and accumulated amortization as of September 30, 2017March 31, 2021 and December 31, 2016:2020:
| | | | | | | | | | | | | | |
|
| ($ in thousands) | | March 31, 2021 | | December 31, 2020 |
Gross balance (1) | | $ | 86,099 | | | $ | 86,099 | |
Accumulated amortization (1) | | (80,454) | | | (79,722) | |
Net carrying balance (1) | | $ | 5,645 | | | $ | 6,377 | |
|
|
| | | | | | | | |
| |
| ($ in thousands) | | September 30, 2017 | | December 31, 2016 |
| Gross balance | | $ | 108,814 |
| | $ | 108,814 |
|
| Accumulated amortization | | (86,140 | ) | | (80,825 | ) |
| Net carrying balance | | $ | 22,674 |
| | $ | 27,989 |
|
| |
There were 0 impairment write-downs of the core deposit intangibles for the three months ended March 31, 2021 and 2020.
Amortization Expense
The Company amortizes the core deposit intangibles based on the projected useful lives of the related deposits. The amortization expense related to the core deposit intangible assets was $1.7 million$732 thousand and $2.0 million$953 thousand for the three months ended September 30, 2017March 31, 2021 and 2016, respectively, and $5.3 million and $6.2 million for the nine months ended September 30, 2017 and 2016,2020, respectively.
The following table presents the estimated future amortization expense of core deposit intangibles:intangibles as of March 31, 2021:
| | | | | | | | |
|
| ($ in thousands) | | Amount |
| Remainder of 2021 | | $ | 2,017 | |
| 2022 | | 1,865 | |
| 2023 | | 1,199 | |
| 2024 | | 553 | |
| 2025 | | 11 | |
| | |
| Total | | $ | 5,645 | |
|
|
| | | | |
| |
| Year Ended December 31, | | Amount ($ in thousands) |
| Remainder of 2017 | | $ | 1,620 |
|
| 2018 | | 5,883 |
|
| 2019 | | 4,864 |
|
| 2020 | | 3,846 |
|
| 2021 | | 2,833 |
|
| Thereafter | | 3,628 |
|
| Total | | $ | 22,674 |
|
| |
Note 1110—Commitments and Contingencies
Commitments to Extend Credit Extensions — In the normal course of business, the Company has variousprovides customers loan commitments on predetermined terms. These outstanding commitments to extend credit that are not reflected in the accompanying Consolidated Financial Statements. While the Company does not anticipate losses as a result of these transactions, commitments to extend credit are included in determining the appropriate level of the allowance for unfunded credit commitments, and outstanding commercial and standby letters of creditcredits (“SBLCs”).
The following table presents the Company’s credit-related commitments as of the periods indicated:March 31, 2021 and December 31, 2020:
| | | | | | | | | | | | | | | | | | | | | | | | | | | | | | | | | | | | | | |
|
| ($ in thousands) | | March 30, 2021 | | December 31, 2020 |
| Expire in One Year or Less | | Expire After One Year Through Three Years | | Expire After Three Years Through
Five Years | | Expire After Five Years | | Total | | Total |
| Loan commitments | | $ | 3,090,244 | | | $ | 1,943,216 | | | $ | 638,815 | | | $ | 172,171 | | | $ | 5,844,446 | | | $ | 5,690,917 | |
| Commercial letters of credit and SBLCs | | 1,263,991 | | | 398,670 | | | 166,496 | | | 513,202 | | | 2,342,359 | | | 2,240,813 | |
| Total | | $ | 4,354,235 | | | $ | 2,341,886 | | | $ | 805,311 | | | $ | 685,373 | | | $ | 8,186,805 | | | $ | 7,931,730 | |
|
| | | | |
| | | | | | | | | | | | |
| | | | | | | | | | | | |
| | | | | | | | | | | | |
|
| | | | | | | | |
| |
| ($ in thousands) | | September 30, 2017 | | December 31, 2016 |
| Loan commitments | | $ | 4,956,515 |
| | $ | 5,077,869 |
|
| Commercial letters of credit and SBLCs | | $ | 1,757,648 |
| | $ | 1,525,613 |
|
| |
Loan commitments are agreements to lend to a customercustomers provided that there are no violations of any conditions established in the agreement. Commitments generally have fixed expiration dates or other termination clauses and may require maintenance of compensatory balances. Since many of the commitments are expected to expire without being drawn upon, the total commitment amounts do not necessarily represent future funding requirements.
Commercial letters of credit are issued to facilitate domestic and foreign trade transactions, while SBLCs are generally contingent upon the failure of the customers to perform according to the terms of the underlying contract with the third party. As a result, the total contractual amounts do not necessarily represent future funding requirements. The Company’s historical experience is that SBLCs typically expire without being funded. Additionally, in many cases, the Company holds collateral in various forms against these SBLCs. As a part of its risk management activities, the Company monitors the creditworthiness of customers in conjunction with its SBLC exposure. Customers are obligated to reimburse the Company for any payment made on the customers’ behalf. If the customers fail to pay, the Company would, as applicable, liquidate the collateral and/or offset accounts. As of September 30, 2017,March 31, 2021, total letters of credit which amounted to $1.76of $2.34 billion were comprisedconsisted of SBLCs of $1.70$2.22 billion and commercial letters of credit of $59.1$125.0 million. As of December 31, 2020, total letters of credit of $2.24 billion consisted of SBLCs of $2.12 billion and commercial letters of credit of $124.9 million.
The Company usesapplies the same credit underwriting criteria in extendingto extend loans, commitments and conditional obligations to customers. Each customer’s creditworthiness is evaluated on a case-by-case basis. Collateral and financial guarantees may be obtained based on management’s assessment of thea customer’s credit. Collateral may include cash, accounts receivable, inventory, property, plant and equipment, and income-producing commercial property.
Estimated exposure to loss from these commitments is included in the allowance for unfunded credit reserves,commitments and amounted to $14.0$32.4 million and $33.5 million as of September 30, 2017March 31, 2021 and $15.7 million as of December 31, 2016. These amounts are included in Accrued expenses2020, respectively.
Guarantees — From time to time, the Company sells or securitizes single-family and other liabilities on the Consolidated Balance Sheets.
Guarantees — The Company has sold or securitizedmultifamily residential loans with recourse in the ordinary course of business. The Company is obligated to repurchase up to the recourse component inpercentage of the loans if the loans default. The following table presents the carrying amounts of loans sold or securitized with recourse is considered a guarantee. Asand the guarantor, the Company is obligated to makemaximum potential future payments when the loans default. Asas of September 30, 2017March 31, 2021 and December 31, 2016, the unpaid principal balance of total single-family and multifamily residential loans sold or securitized with recourse amounted to $121.2 million and $150.5 million, respectively. 2020:
| | | | | | | | | | | | | | | | | | | | | | | | | | | | | | | | | | | | | | | | | | | | | | |
|
| ($ in thousands) | | | | Maximum Potential Future Payments | | Carrying Value |
| | | March 31, 2021 | | December 31, 2020 | | March 31, 2021 | | December 31, 2020 |
| | | Expire After One Year Through Three Years | | Expire After Three Years Through
Five Years | | Expire After Five Years | | Total | | Total | | Total | | Total |
| Single-family residential loans sold or securitized with recourse | | | | $ | 392 | | | $ | 369 | | | $ | 9,525 | | | $ | 10,286 | | | $ | 10,526 | | | $ | 10,286 | | | $ | 10,526 | |
| Multi-family residential loans sold or securitized with recourse | | | | 195 | | | 0 | | | 14,995 | | | 15,190 | | | 15,672 | | | 25,117 | | | 26,619 | |
| Total | | | | $ | 587 | | | $ | 369 | | | $ | 24,520 | | | $ | 25,476 | | | $ | 26,198 | | | $ | 35,403 | | | $ | 37,145 | |
|
| | | | | | |
| | | | | | | | | | | | | | | | |
| | | | | | | | | | | | | | | | |
| | | | | | | | | | | | | | | | |
The Company’s recourse reserve related to these guarantees is included in the allowance for unfunded credit reserves,commitments and totaled $256$83 thousand and $373$88 thousand as of September 30, 2017March 31, 2021 and December 31, 2016,2020, respectively. The allowance for unfunded credit reservescommitments is included inAccrued expenses and other liabilities on the Consolidated Balance Sheets.Sheet. The Company continues to experience minimal losses from the single-family and multifamily residential loan portfolios sold or securitized with recourse.
Litigation — The Company is a party to various legal actions arising in the ordinary course of its business. In accordance with ASC 450, Contingencies,, the Company accrues reserves for outstanding lawsuits, claims and proceedings when a loss contingency is probable and can be reasonably estimated. The Company estimates the amount of loss contingencies using current available information from legal proceedings, advice from legal counsel and available insurance coverage. Due to the inherent subjectivity of the assessments and unpredictability of the outcomes of the legal proceedings, any amounts accrued or included in this aggregate amount may not represent the ultimate loss to the Company from the legal proceedings in question. Thus, the Company’s exposure and ultimate losses may be higher, and possibly significantly more, than the amounts accrued.
Other Commitments — The Company has commitments to invest in qualified affordable housing partnerships, tax credit and other investments as discussed in Note 9 8 — Investments in Qualified Affordable Housing Partnerships, Tax Credit and Other Investments, Net and Variable Interest Entitiesto the Consolidated Financial Statements. These commitments are payable on demand.Statements in this Form 10-Q. As of September 30, 2017March 31, 2021 and December 31, 2016,2020, these commitments were $166.6$334.7 million and $174.3$182.7 million, respectively. These commitments are included in Accrued expenses and other liabilities on the Consolidated Balance Sheets.Sheet.
Note 1211—Stock Compensation Plans
Pursuant to the Company’s 2016 Stock Incentive Plan, as amended, the Company may issue stocks, stock options, restricted stock, awardsrestricted stock units (“RSAs”RSUs”), RSUs,stock purchase warrants, stock appreciation rights, stock purchase warrants, phantom stock and dividend equivalents to certaineligible employees, and non-employee directors, consultants, and other service providers of the Company and its subsidiaries. There were no outstandingThe Company has granted RSUs as its primary incentive awards. Stock options have not been issued during the last three years and 0 stock options or unvested RSAswere outstanding as of September 30, 2017both March 31, 2021 and 2016.December 31, 2020.
RSUs are granted under the Company’s long-term incentive plan at no cost to the recipient. RSUs vest ratably over three years or cliff vest after three or five years of continued employment from the date of the grant. RSUs entitle the recipient to receive cash dividends equivalent to any dividends paid on the underlying common stock during the period the RSUs are outstanding. RSU dividends are accrued during the vesting period and are paid at the time of vesting. While a portion of RSUs are time-vesting awards, others vest subject to the attainment of specified performance goals referred to as “Performance-based RSUs.” All RSUs are subject to forfeiture until vested.
Performance-based RSUs are granted at the target amount of awards. Based on the Company’s attainment of specified performance goals and consideration of market conditions, the number of shares that vest can be adjusted to a minimum of zero and to a maximum of 200% of the target. The amount of performance-based RSUs that are eligible to vest is determined at the end of each performance period and is then added together to determine the total number of performance shares that are eligible to vest. Performance-based RSUs cliff vest three years from the date of grant.
Compensation costs for the time-based awards are based on the quoted market price of the Company’s stock at the grant date. Compensation costs associated with performance-based RSUs are based on grant date fair value which considers both market and performance conditions, and is subject to subsequent adjustments based on the changes in the Company’s stock price and the projected outcome of the performance criteria. Compensation costs of both time-based and performance-based awards are recognized on a straight-line basis from the grant date until the vesting date of each grant.
The following table presents a summary of the total share-based compensation expense and the related net tax benefitbenefits (deficiencies) associated with the Company’s various employee share-based compensation plans for the three and nine months ended September 30, 2017March 31, 2021 and 2016:2020:
| | | | | | | | | | | | | | | | | | |
|
| ($ in thousands) | | Three Months Ended March 31, | | |
| 2021 | | 2020 | | | | |
| Stock compensation costs | | $ | 7,817 | | | $ | 7,209 | | | | | |
| Related net tax benefits (deficiencies) for stock compensation plans | | $ | 1,620 | | | $ | (1,566) | | | | | |
|
|
| | | | | | | | | | | | | | | | |
| |
| ($ in thousands) | | Three Months Ended
September 30, | | Nine Months Ended
September 30, |
| | 2017 | | 2016 | | 2017 | | 2016 |
| Stock compensation costs | | $ | 5,665 |
| | $ | 4,763 |
| | $ | 15,780 |
| | $ | 13,973 |
|
| Related net tax benefits for stock compensation plans | | $ | 151 |
| | $ | 14 |
| | $ | 4,614 |
| | $ | 1,019 |
|
| |
Effective January 1, 2017,Restricted Stock Units — RSUs are granted under the Company adopted ASU 2016-09, Compensation — Stock Compensation (Topic 718): ImprovementsCompany’s long-term incentive plan at no cost to Employee Share-Based Payment Accounting. As a resultthe recipient. RSUs generally cliff vest after three years of continued employment from the date of the adoptiongrant, and are authorized to settle predominantly in shares of this new guidance, all excess tax benefitsthe Company’s common stock. Certain RSUs are settled in cash. Dividend are accrued during the vesting period and deficiencies on share-based paymentpaid at the time of vesting. While a portion of RSUs are time-based vesting awards, were recognized within Income tax expenseothers vest subject to the attainment of specified performance goals referred to as “performance-based RSUs.” Performance-based RSUs are granted annually upon approval by the Company’s Compensation Committee based on the performance in the year prior to the grant date of the award. The number of awards that vest can range from 0 to a maximum of 200% of the granted number of awards based on the Company’s achievement of specified performance criteria over a performance period of three years.
Compensation costs are calculated using the quoted market price of the Company’s common stock at the grant date. Compensation costs for certain time-based awards that will be settled in cash are adjusted to fair value based on changes in the share price of the Company’s common stock up to the settlement date. For performance-based RSUs, the compensation costs are based on grant date fair value which considers both performance and market conditions, and is subject to subsequent adjustments based on the Company’s outcome of meeting the performance criteria at the end of performance period. Compensation costs of both time-based and performance-based awards are estimated based on awards ultimately expected to vest, and are recognized net of estimated forfeitures on a straight-line basis from the grant date until the vesting date of each grant. For accounting on stock-based compensation plans, see Note 1 — Summary of Significant Accounting Policies — Stock-Based Compensation to the Consolidated Financial Statements of Incomethe Company’s 2020 Form 10-K for the three and nine months ended September 30, 2017. For the three and nine months ended September 30, 2016, these tax benefits were recorded as increases to Additional paid-in capital on the Consolidated Statements of Changes in Stockholders’ Equity.additional information.
The following table presents a summary of the activityactivities for the Company’s time-based and performance-based RSUs that will be settled in shares for the ninethree months ended September 30, 2017 basedMarch 31, 2021. The number of performance-based RSUs stated below reflects the number of awards granted on the target amountgrant date.
| | | | | | | | | | | | | | | | | | | | | | | | | | | | | | | | | | |
|
| | | | |
| | | | | | | | | | |
| | | | | | Time-Based RSUs | | Performance-Based RSUs |
| | | | | | | | | Shares | | Weighted-Average
Grant Date
Fair Value | | Shares | | Weighted-Average
Grant Date
Fair Value |
| Outstanding, January 1, 2021 | | | | | | | | | | 1,345,635 | | | $ | 50.22 | | | 398,057 | | | $ | 53.66 | |
| Granted | | | | | | | | | | 374,875 | | | 71.40 | | | 91,960 | | | 77.67 | |
| Vested | | | | | | | | | | (275,503) | | | 67.30 | | | (120,286) | | | 70.13 | |
| Forfeited | | | | | | | | | | (26,369) | | | 60.94 | | | 0 | | | 0 | |
| Outstanding, March 31, 2021 | | | | | | | | | | 1,418,638 | | | $ | 52.30 | | | 369,731 | | | $ | 54.28 | |
|
The following table presents a summary of awards:the activities for the Company’s time-based RSUs that will be vested in cash for the three months ended March 31, 2021:
| | | | | | | | | | |
|
| | | | |
| | | | Shares |
| Outstanding, January 1, 2021 | | | | 21,802 | |
| Granted | | | | 15,803 | |
| Vested | | | | 0 | |
| Forfeited | | | | (4,075) | |
| Outstanding, March 31, 2021 | | | | 33,530 | |
|
|
| | | | | | | | | | | | | | |
| |
| | | Nine Months Ended September 30, 2017 |
| | Time-Based RSUs | | Performance-Based RSUs |
| | Shares | | Weighted Average Grant-Date Fair Value | | Shares | | Weighted Average Grant-Date Fair Value |
| Outstanding, beginning of period | | 1,218,714 |
| | $ | 35.92 |
| | 410,746 |
| | $ | 35.27 |
|
| Granted | | 370,514 |
| | 54.71 |
| | 131,597 |
| | 56.59 |
|
| Vested | | (299,164 | ) | | 36.68 |
| | (118,044 | ) | | 36.85 |
|
| Forfeited | | (131,472 | ) | | 40.05 |
| | — |
| | — |
|
| Outstanding, end of period | | 1,158,592 |
| | $ | 41.26 |
| | 424,299 |
| | $ | 41.44 |
|
| |
As of September 30, 2017,March 31, 2021, there were $37.0 million and $22.1 million of total unrecognized compensation costs related to unvested time-based and performance-based RSUs, amounted to $28.2 million and $15.3 million, respectively. These costs are expected to be recognized over a weighted averageweighted-average period of 2.002.21 years and 2.022.29 years, respectively.
Note 1312 — Stockholders’ Equity and Earnings Per Share
Warrant — The Company acquired MetroCorp Bancshares, Inc., (“MetroCorp”)following table presents the basic and diluted EPS calculations for the three months ended March 31, 2021 and 2020. For more information on January 17, 2014. Prior to the acquisition, MetroCorp had an outstanding warrant to purchase 771,429 shares of its common stock. Upon the acquisition, the rights of the warrant holder were converted into the right to acquire 230,282 shares of East West’s common stock until January 16, 2019. The warrant has not been exercised as of September 30, 2017.
Earnings Per Share— Basic EPS is computed by dividing net income available to common stockholders by the weighted average number of common shares outstanding during each period. Diluted EPS is computed by dividing net income available to common stockholders by the weighted average number of common shares outstanding during each period, plus common share equivalents calculated for warrants and RSUs outstanding using the treasury stock method. With the adoption of ASU 2016-09 during the first quarter of 2017, the impact of excess tax benefits and deficiencies is no longer included in the calculation of diluted EPS. As a resultEPS, see Note 1 — Summary of applying ASU 2016-09, the Company recorded income tax benefits of $151 thousand or $0 per common share, and $4.6 million or $0.03 per common share for the three and nine months ended September 30, 2017, respectively, related to the vesting of the RSUs. See Note 2 — CurrentSignificant Accounting Developments Policies— Significant Accounting Policies —Earnings Per Shareto the Consolidated Financial Statements for additional information.of the Company’s 2020 Form 10-K.
| | | | | | | | | | | | | | | | | | | | | |
|
| ($ and shares in thousands, except per share data) | | Three Months Ended March 31, | | | | | |
| 2021 | | 2020 | | | | | | | |
| Basic: | | | | | | | | | | | |
| Net income | | $ | 204,994 | | | $ | 144,824 | | | | | | | | |
| Basic weighted-average number of shares outstanding | | 141,646 | | | 144,814 | | | | | | | | |
| Basic EPS | | $ | 1.45 | | | $ | 1.00 | | | | | | | | |
| Diluted: | | | | | | | | | | | |
| Net income | | $ | 204,994 | | | $ | 144,824 | | | | | | | | |
| Basic weighted-average number of shares outstanding | | 141,646 | | | 144,814 | | | | | | | | |
Diluted potential common shares (1) | | 1,198 | | | 471 | | | | | | | | |
Diluted weighted-average number of shares outstanding (1) | | 142,844 | | | 145,285 | | | | | | | | |
| Diluted EPS | | $ | 1.44 | | | $ | 1.00 | | | | | | | | |
|
The following table presents the EPS calculations(1)Includes dilutive shares from RSUs for the three and nine months ended September 30, 2017March 31, 2021 and 2016:2020.
|
| | | | | | | | | | | | | | | | |
| |
| | | Three Months Ended
September 30, | | Nine Months Ended
September 30, |
| ($ and shares in thousands, except per share data) | | 2017 | | 2016 | | 2017 | | 2016 |
| Basic | | | | | | | | |
| Net income | | $ | 132,660 |
| | $ | 110,143 |
| | $ | 420,726 |
| | $ | 320,943 |
|
| | | | | | | | | |
| Basic weighted average number of shares outstanding | | 144,498 |
| | 144,122 |
| | 144,412 |
| | 144,061 |
|
| Basic EPS | | $ | 0.92 |
| | $ | 0.76 |
| | $ | 2.91 |
| | $ | 2.23 |
|
| | | | | | | | | |
| Diluted | | | | | | | | |
| Net income | | $ | 132,660 |
| | $ | 110,143 |
| | $ | 420,726 |
| | $ | 320,943 |
|
| | | | | | | | | |
| Basic weighted average number of shares outstanding | | 144,498 |
| | 144,122 |
| | 144,412 |
| | 144,061 |
|
Diluted potential common shares (1) | | 1,384 |
| | 1,116 |
| | 1,437 |
| | 1,025 |
|
| Diluted weighted average number of shares outstanding | | 145,882 |
| | 145,238 |
| | 145,849 |
| | 145,086 |
|
| Diluted EPS | | $ | 0.91 |
| | $ | 0.76 |
| | $ | 2.88 |
| | $ | 2.21 |
|
| |
| |
(1) | Includes dilutive shares from RSUs and warrants for the three and nine months ended September 30, 2017 and 2016. |
For the three and nine months ended September 30, 2017, 4March 31, 2021 and 2020, 140 thousand and 6328 thousand weighted averageweighted-average shares of anti-dilutive shares from RSUs, respectively, were excluded from the diluted EPS computation. For the three and nine months ended September 30, 2016, 2 thousand and 7 thousand weighted average anti-dilutive shares from RSUs, respectively, were excluded from the diluted EPS computation.
Stock Repurchase Program — In 2020, the Company’s Board of Directors authorized a stock repurchase program to buy back up to $500.0 million of the Company’s common stock, and the Company repurchased 4,471,682 shares at an average price of $32.64 per share and a total cost of $146.0 million. The Company did not repurchase any shares during the three months ended March 31, 2021.
Note 1413 — Accumulated Other Comprehensive Income (Loss)
The following tables presenttable presents the changes in the components of AOCI balances for the three and nine months ended September 30, 2017March 31, 2021 and 2016:2020:
| | | | | | | | | | | | | | | | | | | | | | | | | | |
|
| ($ in thousands) | | AFS
Debt
Securities | | Cash
Flow
Hedges | | Foreign Currency Translation Adjustments (1) | | Total |
| Balance, January 1, 2020 | | $ | (2,419) | | | $ | 0 | | | $ | (15,989) | | | $ | (18,408) | |
| Net unrealized gains (losses) arising during the period | | 28,530 | | | 0 | | | (2,164) | | | 26,366 | |
| Amounts reclassified from AOCI | | (1,077) | | | 0 | | | 0 | | | (1,077) | |
| Changes, net of tax | | 27,453 | | | 0 | | | (2,164) | | | 25,289 | |
| Balance, March 31, 2020 | | $ | 25,034 | | | $ | 0 | | | $ | (18,153) | | | $ | 6,881 | |
| | | | | | | | |
| Balance, January 1, 2021 | | $ | 52,247 | | | $ | (1,230) | | | $ | (6,692) | | | $ | 44,325 | |
| Net unrealized (losses) gains arising during the period | | (133,313) | | | 305 | | | (1,349) | | | (134,357) | |
| Amounts reclassified from AOCI | | (135) | | | 127 | | | 0 | | | (8) | |
| Changes, net of tax | | (133,448) | | | 432 | | | (1,349) | | | (134,365) | |
| Balance, March 31, 2021 | | $ | (81,201) | | | $ | (798) | | | $ | (8,041) | | | $ | (90,040) | |
|
(1)Represents foreign currency translation adjustments related to the Company’s net investment in non-U.S. operations, including related hedges. The functional currency and reporting currency of the Company’s foreign subsidiary was RMB and USD, respectively.
|
| | | | | | | | | | | | | | | | | | | | | | | | |
| |
| ($ in thousands) | | Three Months Ended September 30, |
| | 2017 | | 2016 |
| | Available-
for-Sale
Investment
Securities | | Foreign
Currency
Translation
Adjustments (1) | | Total | | Available-
for-Sale
Investment
Securities | | Foreign
Currency
Translation
Adjustments (1) | | Total |
| Beginning balance | | $ | (18,950 | ) | | $ | (15,231 | ) | | $ | (34,181 | ) | | $ | 11,756 |
| | $ | (13,468 | ) | | $ | (1,712 | ) |
| Net unrealized (losses) gains arising during the period | | (1,014 | ) | | 3,870 |
| | 2,856 |
| | (3,869 | ) | | (555 | ) | | (4,424 | ) |
| Amounts reclassified from AOCI | | (892 | ) | | — |
| | (892 | ) | | (1,038 | ) | | — |
| | (1,038 | ) |
| Changes, net of taxes | | (1,906 | ) | | 3,870 |
| | 1,964 |
| | (4,907 | ) | | (555 | ) | | (5,462 | ) |
| Ending balance | | $ | (20,856 | ) | | $ | (11,361 | ) | | $ | (32,217 | ) | | $ | 6,849 |
| | $ | (14,023 | ) | | $ | (7,174 | ) |
| |
|
| | | | | | | | | | | | | | | | | | | | | | | | |
| |
| ($ in thousands) | | Nine Months Ended September 30, |
| | 2017 | | 2016 |
| | Available-
for-Sale
Investment
Securities | | Foreign
Currency
Translation
Adjustments (1) | | Total | | Available-
for-Sale
Investment
Securities | | Foreign
Currency
Translation
Adjustments (1) | | Total |
| Beginning balance | | $ | (28,772 | ) | | $ | (19,374 | ) | | $ | (48,146 | ) | | $ | (6,144 | ) | | $ | (8,797 | ) | | $ | (14,941 | ) |
| Net unrealized gains (losses) arising during the period | | 11,818 |
| | 8,013 |
| | 19,831 |
| | 17,901 |
| | (5,226 | ) | | 12,675 |
|
| Amounts reclassified from AOCI | | (3,902 | ) | | — |
| | (3,902 | ) | | (4,908 | ) | | — |
| | (4,908 | ) |
| Changes, net of taxes | | 7,916 |
| | 8,013 |
| | 15,929 |
| | 12,993 |
| | (5,226 | ) | | 7,767 |
|
| Ending balance | | $ | (20,856 | ) | | $ | (11,361 | ) | | $ | (32,217 | ) | | $ | 6,849 |
| | $ | (14,023 | ) | | $ | (7,174 | ) |
| | | | | | | | | | | | | |
| |
(1) | Represents foreign currency translation adjustments related to the Company’s net investment in non-U.S. operations, including related hedges. The functional currency and reporting currency of the Company’s foreign subsidiary was Chinese Renminbi and USD, respectively. |
The following tables presenttable presents the components of other comprehensive income (loss), reclassifications to net income and the related tax effects for the three and nine months ended September 30, 2017March 31, 2021 and 2016:2020:
| | | | | | | | | | | | | | | | | | | | | | | | | | | | | | | | | | | | | | |
|
| ($ in thousands) | | Three Months Ended March 31, |
| 2021 | | 2020 |
| Before-Tax | | Tax Effect | | Net-of-Tax | | Before-Tax | | Tax Effect | | Net-of-Tax |
| AFS debt securities: | | | | | | | | | | | | |
| Net unrealized (losses) gains arising during the period | | $ | (189,276) | | | $ | 55,963 | | | $ | (133,313) | | | $ | 40,493 | | | $ | (11,963) | | | $ | 28,530 | |
Net realized (gains) reclassified into net income (1) | | (192) | | | 57 | | | (135) | | | (1,529) | | | 452 | | | (1,077) | |
| Net change | | (189,468) | | | 56,020 | | | (133,448) | | | 38,964 | | | (11,511) | | | 27,453 | |
| Cash flow hedges: | | | | | | | | | | | | |
| Net unrealized gains arising during the period | | 426 | | | (121) | | | 305 | | | 0 | | | 0 | | | 0 | |
Net realized losses reclassified into net income (2) | | 177 | | | (50) | | | 127 | | | 0 | | | 0 | | | 0 | |
| Net change | | 603 | | | (171) | | | 432 | | | 0 | | | 0 | | | 0 | |
| Foreign currency translation adjustments, net of hedges: | | | | | | | | | | | | |
| Net unrealized losses arising during the period | | (1,309) | | | (40) | | | (1,349) | | | (1,766) | | | (398) | | | (2,164) | |
| Net change | | (1,309) | | | (40) | | | (1,349) | | | (1,766) | | | (398) | | | (2,164) | |
| Other comprehensive (loss) income | | $ | (190,174) | | | $ | 55,809 | | | $ | (134,365) | | | $ | 37,198 | | | $ | (11,909) | | | $ | 25,289 | |
|
(1)For the three months ended March 31, 2021 and 2020, pre-tax amounts were reported in Gains on sales of AFS debt securities on the Consolidated Statement of Income.
(2)For the three months ended March 31, 2021 and 2020, pre-tax amounts were reported in Interest expense on the Consolidated Statement of Income.
|
| | | | | | | | | | | | | | | | | | | | | | | | |
| |
| ($ in thousands) | | Three Months Ended September 30, |
| | 2017 | | 2016 |
| | Before-Tax | | Tax Effect | | Net-of-Tax | | Before-Tax | | Tax Effect | | Net-of-Tax |
| Available-for-sale investment securities: | | |
| | |
| | |
| | |
| | |
| | |
|
| Net unrealized losses arising during the period | | $ | (1,749 | ) | | $ | 735 |
| | $ | (1,014 | ) | | $ | (6,677 | ) | | $ | 2,808 |
| | $ | (3,869 | ) |
Net realized gains reclassified into net income (1) | | (1,539 | ) | | 647 |
| | (892 | ) | | (1,790 | ) | | 752 |
| | (1,038 | ) |
| Net change | | (3,288 | ) | | 1,382 |
| | (1,906 | ) | | (8,467 | ) | | 3,560 |
| | (4,907 | ) |
| | | | | | | | | | | | | |
| Foreign currency translation adjustments: | | | | | | | | | | | | |
| Net unrealized gains (losses) arising during period | | 3,870 |
| | — |
| | 3,870 |
| | (555 | ) | | — |
| | (555 | ) |
| Net change | | 3,870 |
| | — |
| | 3,870 |
| | (555 | ) | | — |
| | (555 | ) |
| Other comprehensive income (loss) | | $ | 582 |
| | $ | 1,382 |
| | $ | 1,964 |
| | $ | (9,022 | ) | | $ | 3,560 |
| | $ | (5,462 | ) |
| |
|
| | | | | | | | | | | | | | | | | | | | | | | | |
| |
| ($ in thousands) | | Nine Months Ended September 30, |
| | 2017 | | 2016 |
| | Before-Tax | | Tax Effect | | Net-of-Tax | | Before-Tax | | Tax Effect | | Net-of-Tax |
| Available-for-sale investment securities: | | |
| | |
| | |
| | |
| | |
| | |
|
| Net unrealized gains arising during the period | | $ | 20,392 |
| | $ | (8,574 | ) | | $ | 11,818 |
| | $ | 30,888 |
| | $ | (12,987 | ) | | $ | 17,901 |
|
Net realized gains reclassified into net income (1) | | (6,733 | ) | | 2,831 |
| | (3,902 | ) | | (8,468 | ) | | 3,560 |
| | (4,908 | ) |
| Net change | | 13,659 |
| | (5,743 | ) | | 7,916 |
| | 22,420 |
| | (9,427 | ) | | 12,993 |
|
| | | | | | | | | | | | | |
| Foreign currency translation adjustments: | | | | | | | | | | | | |
| Net unrealized gains (losses) arising during period | | 8,013 |
| | — |
| | 8,013 |
| | (5,226 | ) | | — |
| | (5,226 | ) |
| Net change | | 8,013 |
| | — |
| | 8,013 |
| | (5,226 | ) | | — |
| | (5,226 | ) |
| Other comprehensive income | | $ | 21,672 |
| | $ | (5,743 | ) | | $ | 15,929 |
| | $ | 17,194 |
| | $ | (9,427 | ) | | $ | 7,767 |
|
| |
| |
(1) | For the three and nine months ended September 30, 2017 and 2016, pre-tax amounts were reported in Net gains on sales of available-for-sale investment securities on the Consolidated Statements of Income.
|
Note 1514 —Business Segments
The Company utilizes an internal reporting system to measure the performance of variousorganizes its operations into 3 reportable operating segments within the Banksegments: (1) Consumer and the Company. The Company has identified three operating segments for purposes of management reporting: (1) RetailBusiness Banking; (2) Commercial Banking; and (3) Other. These three business segments meet the criteria of an operating segment: the segment engages in business activities from which it earns revenues and incurs expenses; its operating results are regularly revieweddefined by the Company’s chief operating decision-maker to render decisions about resources to be allocated totype of customers served, and the related products and services provided. The segments and assess its performance; and discretereflect how financial information is available.
The Retail Banking segment focuses primarily on retail operations through the Bank’s branch network. The Commercial Banking segment, which includes C&I and CRE operations, primarily generates commercial loans and deposits through the bank’s commercial lending offices. Furthermore, the Company’s Commercial Banking segment offers a wide variety of international finance, trade finance, and cash management services and products. The remaining centralized functions, including treasury activities and eliminations of inter-segment amounts, have been aggregated and included in the “Other” segment, which provides broad administrative support to the two core segments.
currently evaluated by management. Operating segment results are based on the Company’s internal management reporting process, which reflects assignments and allocations of certain operatingbalance sheet and income statement items. The information presented is not indicative of how the segments would perform if they operated as independent entities due to the interrelationships among the segments.
The Consumer and Business Banking segment primarily provides financial products and services to consumer and commercial customers through the Company’s domestic branch network. This segment offers consumer and commercial deposits, mortgage and home equity loans, and other products and services. It also originates commercial loans for small and medium-sized enterprises through the Company’s branch network. Other products and services provided by this segment include wealth management, treasury management and foreign exchange services.
The Commercial Banking segment primarily generates commercial loans and deposits. Commercial loan products include commercial business loans and lines of credit, trade finance loans and letters of credit, CRE loans, construction and land loans, affordable housing loans and letters of credit, asset-based lending and equipment financing. Commercial deposit products and other financial services include treasury management, foreign exchange services and interest rate and commodity risk hedging.
The remaining centralized functions, including the corporate treasury activities of the Company and eliminations of inter-segment amounts, have been aggregated and included in the Other segment, which provides broad administrative costssupport to the 2 core segments, namely the Consumer and Business Banking and the provisionCommercial Banking segments.
The Company utilizes an internal reporting process to measure the performance of the 3 operating segments within the Company. The internal reporting process derives operating segment results by utilizing allocation methodologies for credit losses.revenues and expenses. Net interest income is allocated basedof each segment represents the difference between actual interest earned on assets and interest incurred on liabilities of the segment, adjusted for funding charges or credits through the Company’s internal funds transfer pricing system, which assigns a cost of funds or a credit for funds to assets or liabilities based on their type, maturity or repricing characteristics.(“FTP”) process. Noninterest income and noninterest expense including depreciation and amortization, directly attributable to a business segment are assigned to the related businessthat segment. Indirect costs, including technology-related costs and corporate overhead, expense, are allocated to the segments based on severala segment’s estimated usage using factors including but not limited to, full-time equivalent employees, net interest income, and loan volume and deposit volume. TheCharge-offs are booked to the segment directly associated with the loans charged off, and the provision for credit losses is allocatedbooked to segments based on actual charge-offsrelated loans for the period as well as average loan balances for each segment during the period. The Company evaluates overall performance based on profit or loss from operations before income taxes excluding nonrecurring gains and losses.
which allowances are evaluated. The Company’s internal funds transfer pricing assumptionsreporting process utilizes a full-allocation methodology. Under this methodology, corporate and indirect expenses incurred by the Other segment are intendedallocated to promote core deposit growththe Consumer and to reflectBusiness Banking and the current risk profiles of various loan categoriesCommercial Banking segments, except certain corporate treasury-related expenses and insignificant unallocated expenses.
The corporate treasury function within the credit portfolio. Internal funds transfer pricing assumptions and methodologies are reviewed at least annually to ensure thatOther segment is responsible for the Company’s liquidity and interest rate management. The Company’s internal FTP process is reflective of current market conditions.also managed by the corporate treasury function within the Other segment. The internal funds transfer pricing process is formulated with the goal of encouraging loan and deposit growth that is consistent with the Company’s overall profitability objectives, as well as to provide a reasonable and consistent basis for the measurement of the Company’sits business segments and productsegments’ net interest margins.
Changesmargins and profitability. The FTP process charges a cost to fund loans (“FTP charges for loans”) and allocates credits for funds provided from deposits (“FTP credits for deposits”) using internal FTP rates. FTP charges for loans are determined based on a matched cost of funds, which is tied to the pricing and term characteristics of the loans. FTP credits for deposits are based on matched funding credit rates, which are tied to the implied or stated maturity of the deposits. FTP credits for deposits reflect the long-term value generated by the deposits. The net spread between the total internal FTP charges and credits is recorded as part of net interest income in the Other segment. The FTP process transfers the corporate interest rate risk exposure to the treasury function within the Other segment, where such exposures are centrally managed. The Company’s management structure or reportinginternal FTP assumptions and methodologies may result in changes inare reviewed at least annually to ensure that the measurementprocess is reflective of operating segment results. Results for prior year periods are generally restated for comparability for changes in management structure or reporting methodologies unless it is deemed not practicable to do so.current market conditions.
The following tables present the operating results and other key financial measures for the individual operating segments as of and for the three and nine months ended September 30, 2017March 31, 2021 and 2016:2020:
| | | | | | | | | | | | | | | | | | | | | | | | | | |
|
| ($ in thousands) | | Consumer and
Business
Banking | | Commercial
Banking | | Other | | Total |
| Three Months Ended March 31, 2021 | | | | | | | | |
| | | | | | | | |
| | | | | | | | |
| | | | | | | | |
| | | | | | | | |
| | | | | | | | |
| | | | | | | | |
| Net interest income before (reversal of) provision for credit losses | | $ | 149,899 | | | $ | 177,092 | | | $ | 26,704 | | | $ | 353,695 | |
| (Reversal of) provision for credit losses | | (4,249) | | | 4,249 | | | 0 | | | 0 | |
| Noninterest income | | 20,828 | | | 50,010 | | | 2,028 | | | 72,866 | |
| Noninterest expense | | 89,286 | | | 69,257 | | | 32,534 | | | 191,077 | |
| Segment income (loss) before income taxes | | 85,690 | | | 153,596 | | | (3,802) | | | 235,484 | |
| | | | | | | | |
| Segment net income | | $ | 61,378 | | | $ | 110,080 | | | $ | 33,536 | | | $ | 204,994 | |
| As of March 31, 2021 | | | | | | | | |
| | | | | | | | |
| Segment assets | | $ | 14,147,094 | | | $ | 27,222,272 | | | $ | 15,504,780 | | | $ | 56,874,146 | |
|
| | | | | | | | | | | | | | | | | | | | | | | | | | |
|
| ($ in thousands) | | Consumer and
Business
Banking | | Commercial
Banking | | Other | | Total |
| Three Months Ended March 31, 2020 | | | | | | | | |
| | | | | | | | |
| | | | | | | | |
| | | | | | | | |
| | | | | | | | |
| | | | | | | | |
| | | | | | | | |
| Net interest income before provision for credit losses | | $ | 152,591 | | | $ | 183,501 | | | $ | 26,615 | | | $ | 362,707 | |
| Provision for credit losses | | 7,788 | | | 66,082 | | | 0 | | | 73,870 | |
| Noninterest income | | 16,402 | | | 32,456 | | | 6,648 | | | 55,506 | |
| Noninterest expense | | 86,964 | | | 70,126 | | | 23,243 | | | 180,333 | |
| Segment income before income taxes | | 74,241 | | | 79,749 | | | 10,020 | | | 164,010 | |
| | | | | | | | |
| Segment net income | | $ | 53,195 | | | $ | 57,131 | | | $ | 34,498 | | | $ | 144,824 | |
| As of March 31, 2020 | | | | | | | | |
| | | | | | | | |
| Segment assets | | $ | 11,894,691 | | | $ | 26,412,726 | | | $ | 7,641,128 | | | $ | 45,948,545 | |
|
|
| | | | | | | | | | | | | | | | |
| |
| ($ in thousands) | | Three Months Ended September 30, 2017 |
| | Retail Banking | | Commercial Banking | | Other | | Total |
| Interest income | | $ | 93,714 |
| | $ | 218,397 |
| | $ | 27,799 |
| | $ | 339,910 |
|
| Charge for funds used | | (37,979 | ) | | (87,071 | ) | | (7,589 | ) | | (132,639 | ) |
| Interest spread on funds used | | 55,735 |
| | 131,326 |
| | 20,210 |
| | 207,271 |
|
| Interest expense | | (20,090 | ) | | (5,943 | ) | | (10,722 | ) | | (36,755 | ) |
| Credit on funds provided | | 111,812 |
| | 12,770 |
| | 8,057 |
| | 132,639 |
|
| Interest spread on funds provided (used) | | 91,722 |
| | 6,827 |
| | (2,665 | ) | | 95,884 |
|
| Net interest income before provision for credit losses | | $ | 147,457 |
| | $ | 138,153 |
| | $ | 17,545 |
| | $ | 303,155 |
|
| Provision for credit losses | | $ | 2,058 |
| | $ | 10,938 |
| | $ | — |
| | $ | 12,996 |
|
| Depreciation, amortization and (accretion), net | | $ | 3,401 |
| | $ | (5,449 | ) | | $ | 40,001 |
| | $ | 37,953 |
|
| Segment income before income taxes | | $ | 68,554 |
| | $ | 99,025 |
| | $ | 7,705 |
| | $ | 175,284 |
|
| As of September 30, 2017: | | | | | | | |
|
|
| Goodwill | | $ | 357,207 |
| | $ | 112,226 |
| | $ | — |
| | $ | 469,433 |
|
| Segment assets | | $ | 8,877,186 |
| | $ | 21,216,848 |
| | $ | 6,213,932 |
| | $ | 36,307,966 |
|
| |
|
| | | | | | | | | | | | | | | | |
| |
| ($ in thousands) | | Three Months Ended September 30, 2016 |
| | Retail
Banking | | Commercial
Banking | | Other | | Total |
| Interest income | | $ | 77,186 |
| | $ | 180,095 |
| | $ | 23,036 |
| | $ | 280,317 |
|
| Charge for funds used | | (24,320 | ) | | (53,262 | ) | | (3,858 | ) | | (81,440 | ) |
| Interest spread on funds used | | 52,866 |
| | 126,833 |
| | 19,178 |
| | 198,877 |
|
| Interest expense | | (14,855 | ) | | (3,699 | ) | | (7,615 | ) | | (26,169 | ) |
| Credit on funds provided | | 68,622 |
| | 8,206 |
| | 4,612 |
| | 81,440 |
|
| Interest spread on funds provided (used) | | 53,767 |
| | 4,507 |
| | (3,003 | ) | | 55,271 |
|
| Net interest income before (reversal of) provision for credit losses | | $ | 106,633 |
| | $ | 131,340 |
| | $ | 16,175 |
| | $ | 254,148 |
|
| (Reversal of) provision for credit losses | | $ | (3,709 | ) | | $ | 13,234 |
| | $ | — |
| | $ | 9,525 |
|
| Depreciation, amortization, and (accretion), net | | $ | 782 |
| | $ | (5,875 | ) | | $ | 40,541 |
| | $ | 35,448 |
|
| Segment income before income taxes | | $ | 32,304 |
| | $ | 80,393 |
| | $ | 10,767 |
| | $ | 123,464 |
|
| As of September 30, 2016: | | | | | | | |
|
|
| Goodwill | | $ | 357,207 |
| | $ | 112,226 |
| | $ | — |
| | $ | 469,433 |
|
| Segment assets | | $ | 7,606,611 |
| | $ | 18,549,562 |
| | $ | 7,099,102 |
| | $ | 33,255,275 |
|
| |
|
| | | | | | | | | | | | | | | | |
| |
| ($ in thousands) | | Nine Months Ended September 30, 2017 |
| | Retail Banking | | Commercial Banking | | Other | | Total |
| Interest income | | $ | 263,491 |
| | $ | 616,689 |
| | $ | 85,174 |
| | $ | 965,354 |
|
| Charge for funds used | | (98,856 | ) | | (229,330 | ) | | (50,273 | ) | | (378,459 | ) |
| Interest spread on funds used | | 164,635 |
| | 387,359 |
| | 34,901 |
| | 586,895 |
|
| Interest expense | | (54,650 | ) | | (16,225 | ) | | (29,111 | ) | | (99,986 | ) |
| Credit on funds provided | | 320,452 |
| | 37,436 |
| | 20,571 |
| | 378,459 |
|
| Interest spread on funds provided (used) | | 265,802 |
| | 21,211 |
| | (8,540 | ) | | 278,473 |
|
| Net interest income before provision for credit losses | | $ | 430,437 |
| | $ | 408,570 |
| | $ | 26,361 |
| | $ | 865,368 |
|
| Provision for credit losses | | $ | 1,772 |
| | $ | 28,977 |
| | $ | — |
| | $ | 30,749 |
|
| Depreciation, amortization and (accretion), net | | $ | 6,741 |
| | $ | (14,609 | ) | | $ | 111,639 |
| | $ | 103,771 |
|
| Segment income before income taxes | | $ | 204,601 |
| | $ | 284,195 |
| | $ | 72,177 |
| | $ | 560,973 |
|
| As of September 30, 2017: | | | | | | | | |
| Goodwill | | $ | 357,207 |
| | $ | 112,226 |
| | $ | — |
| | $ | 469,433 |
|
| Segment assets | | $ | 8,877,186 |
| | $ | 21,216,848 |
| | $ | 6,213,932 |
| | $ | 36,307,966 |
|
| |
|
| | | | | | | | | | | | | | | | |
| |
| ($ in thousands) | | Nine Months Ended September 30, 2016 |
| | Retail
Banking | | Commercial
Banking | | Other | | Total |
| Interest income | | $ | 233,192 |
| | $ | 534,603 |
| | $ | 67,559 |
| | $ | 835,354 |
|
| Charge for funds used | | (70,770 | ) | | (159,734 | ) | | (22,465 | ) | | (252,969 | ) |
| Interest spread on funds used | | 162,422 |
| | 374,869 |
| | 45,094 |
| | 582,385 |
|
| Interest expense | | (44,133 | ) | | (11,965 | ) | | (19,320 | ) | | (75,418 | ) |
| Credit on funds provided | | 210,831 |
| | 26,655 |
| | 15,483 |
| | 252,969 |
|
| Interest spread on funds provided (used) | | 166,698 |
| | 14,690 |
| | (3,837 | ) | | 177,551 |
|
| Net interest income before (reversal of) provision for credit losses | | $ | 329,120 |
| | $ | 389,559 |
| | $ | 41,257 |
| | $ | 759,936 |
|
| (Reversal of) provision for credit losses | | $ | (2,846 | ) | | $ | 19,864 |
| | $ | — |
| | $ | 17,018 |
|
| Depreciation, amortization and (accretion), net | | $ | 279 |
| | $ | (25,915 | ) | | $ | 86,316 |
| | $ | 60,680 |
|
| Segment income before income taxes | | $ | 114,513 |
| | $ | 268,401 |
| | $ | 28,137 |
| | $ | 411,051 |
|
| As of September 30, 2016: | | | | | | | | |
| Goodwill | | $ | 357,207 |
| | $ | 112,226 |
| | $ | — |
| | $ | 469,433 |
|
| Segment assets | | $ | 7,606,611 |
| | $ | 18,549,562 |
| | $ | 7,099,102 |
| | $ | 33,255,275 |
|
| |
Note 1615 — Subsequent Events
On October 19, 2017,April 22, 2021, the Company’s Board of Directors declared fourthsecond quarter 20172021 cash dividends for the Company’s common stock. The common stock cash dividend of $0.20$0.33 per share is payable on November 15, 2017May 17, 2021 to stockholders of record as of November 1, 2017.
May 3, 2021.
ITEM 2. MANAGEMENT’S DISCUSSION AND ANALYSIS OF FINANCIAL CONDITION AND RESULTS OF OPERATIONS
| | | | | | | | | | | |
| | | Page |
ITEM 2. | MANAGEMENT’S DISCUSSION AND ANALYSIS OF FINANCIAL CONDITION AND RESULTS OF OPERATIONS | |
| | |
| | |
| | |
| | | |
| | | |
| | | |
| | | |
| | | |
| | |
| | | |
| | | |
| | | |
| | | |
| | | |
| | | |
| | |
| | |
| | |
| | | |
| | | |
| | | |
| | |
| | |
| | |
Overview
The following discussion provides information about the results of operations, financial condition, liquidity and capital resources of East West Bancorp, Inc. (referred to herein on an unconsolidated basis as “East West” and on a consolidated basis as the “Company”“Company,” “we” or “EWBC”), and its various subsidiaries, including theits subsidiary bank, East West Bank and its subsidiaries (referred to herein as “East West Bank” or the “Bank”). This information is intended to facilitate the understanding and assessment of significant changes and trends related to the Company’s results of operations and financial condition. This discussion and analysis should be read in conjunction with the Consolidated Financial Statements and the accompanying notes presented elsewhere in this report, and the Company’s annual report on Form 10-K for the year ended December 31, 20162020, filed with the United States (“U.S.”) Securities and Exchange Commission (“SEC”) on February 27, 201726, 2021 (the “Company’s 20162020 Form 10-K”).
Company Overview
East West is a bank holding company incorporated in Delaware on August 26, 1998 and is registered under the Bank Holding Company Act of 1956, as amended.Act. The Company commenced business on December 30, 1998 when, pursuant to a reorganization, it acquired all of the voting stock of the Bank, which became its principal asset. The Bank is an independent commercial bank headquartered in California and is the largest bank in the United States (“U.S.”) that has a strong focus on the financial service needs of the Chinese AmericanAsian-American community. The Bank operates both in the U.S. and Greater China.
The Company’s vision is to serve as the financial bridge between the U.S. and Greater China. The Company’s primary strategy to achieve this vision is to expand the Company’s global network of contacts and resources to better meet its customers’ diverse financial needs in and between the world’s two largest markets. WithThrough over 130120 locations in the U.S. and Greater China, andthe Company provides a full range of cross-borderconsumer and commercial products and services through three business segments: Consumer and Business Banking, Commercial Banking, and Other (which includes the remaining operations). The Company’s principal activity is lending to and accepting deposits from businesses and individuals. The primary source of revenue is net interest income, which is principally derived from the difference between interest earned on loans and debt securities and interest paid on deposits and other funding sources. As of March 31, 2021, the Company continueshad $56.87 billion in assets and approximately 3,200 full-time equivalent employees. For additional information on products and services provided by the Bank, see Item 1. Business — Banking Services of the Company’s 2020 Form 10-K.
Corporate Strategy
We are committed to seek attractive opportunities for growth in pursuing its cross-border business banking strategy.
Inenhancing long-term shareholder value by executing our strategic vision, we remain focused on the fundamentals of growing loans, deposits and revenue, and improving profitability, whileand investing for the future andwhile managing risk,risks, expenses and capital. Our business model is built on customer loyalty and engagement, understanding our customers’ financial goals, and meeting theirour customers’ financial needs through our offering of diverse products and services. The Company’s approach is concentrated on organically growingseeking out and deepening client relationships that meet our risk/return measures. This focus guides our decision-making across every aspect of our operations: the products we develop, the expertise we cultivate and the infrastructure we build to help our customers conduct businesses. We expect our relationship-focused business model to continue to generate organic growth and to expand our targeted customer bases. On an ongoing basis, we invest in technology to improve the customer user experience, strengthen critical business infrastructure, and streamline core processes, while appropriately managing operating expenses. Our risk management activities are focused on ensuring that the Company identifies and manages risks to maintain safety and soundness while maximizing profitability.
Financial HighlightsCoronavirus Disease 2019 Global Pandemic
The Company delivered strongCoronavirus Disease 2019 (“COVID-19”) pandemic has caused significant disruption around the world, as well as economic and financial performancemarket deterioration. The economic and operating conditions caused by the COVID-19 pandemic have created financial difficulties for many of the Company’s commercial and consumer customers. As a result, some borrowers may not be able to satisfy their obligations to us. As many of the Company’s loans are secured by real estate, a potential decline in the real estate markets could also negatively impact the Company’s business, financial condition and the credit quality of the Company’s loan portfolio. We do not know and cannot quantify all of the specific impacts, and the extent to which the COVID-19 pandemic may negatively affect our business, financial condition and results of operations, as well as our regulatory capital and liquidity ratios, in 2021. The impact will depend on future developments which are highly uncertain and cannot be predicted, including the scope and duration of the pandemic; actions taken by governmental authorities and other third parties in response to the pandemic, including vaccinations; the effect on our customers and employees; and the effect on the economy and markets. While COVID-19 cases have begun to ease during the first quarter of 2017 across key2021, the spread of new, more contagious variants could impact the magnitude and duration of this health crisis. However, ongoing virus containment efforts and vaccination progress, as well as the possibility of further government stimulus measures, could accelerate the macroeconomic recovery.
Regulatory Developments Relating to the COVID-19 Pandemic
Coronavirus Aid, Relief, and Economic Security Act —The Coronavirus Aid, Relief, and Economic Security Act (the “CARES Act”) was enacted on March 27, 2020 to lessen the economic impact of the COVID-19 pandemic on individuals, businesses and local economies. The CARES Act initiatives included extended unemployment benefits, mortgage forbearance, the Small Business Administration (“SBA”) Paycheck Protection Program (“PPP”) and funding, and authorization for the Main Street Lending Program (“MSLP”). The Company participated in the Board of Governors of the Federal Reserve System’s (the “Federal Reserve”) MSLP and funded $233.6 million in MSLP loans as of December 31, 2020. The related Main Street special purpose vehicle purchased participations in these loans amounting to $221.9 million or 95% of the total amount of MSLP loans funded as of March 31, 2021. The MSLP was terminated on January 8, 2021 and the Company did not further participate in the program during the first quarter of 2021. The CARES Act also required mortgage servicers to grant, on a borrower’s request, forbearance for up to 180 days (which could be extended for up to another 180 days) on a federally-backed single-family mortgage loan or forbearance up to 30 days (which could be extended for two additional 30-day periods) on a federally-backed multifamily mortgage loan, when the borrowers experience financial hardship due to the COVID-19 pandemic.
In response to the continued market disruption and economic impact of the COVID-19 pandemic, the Consolidated Appropriations Act, 2021 (“CAA”) enacted on December 27, 2020, contained a number of provisions that affect banking organizations. Among other things, the CAA provided additional funding to the PPP in early January 2021, expanded eligibility of businesses for the PPP, extended the PPP to March 31, 2021, and allowed eligible borrowers to obtain a second PPP loan (“second draw”) up to a maximum amount of $2.0 million. The SBA pays the originating bank a processing fee ranging from 3% to 5% based on the size of the loans. Second draw PPP borrowers are eligible for loan forgiveness on the same terms as the first draw borrowers. The CAA also simplified the loan forgiveness process for first and second draw borrowers with PPP loans of $150,000 or less. The PPP for first draw loans reopened in January 2021. The SBA also started allowing certain eligible borrowers, who previously received a PPP loan to apply for a second draw PPP with the same general terms as their first draw PPP loan and an extended maturity date of five years.
On March 11, 2021, President Biden signed the American Rescue Plan Act of 2021 (“ARPA”) to provide additional relief for individuals and businesses affected by the COVID-19 pandemic, including additional funding for the PPP, expansion of eligibility criteria for both first and second draw PPP loans and revision of the exclusions from payroll costs for purposes of loan growth, revenue and net income growth, and credit quality. It isforgiveness. The PPP Extension Act of 2021, enacted on March 30, 2021, extended the Company’s priorityPPP through May 31, 2021.
Paycheck Protection Program — The PPP provides forgivable loans to focus on strengthening its risk management infrastructure and compliancebusinesses in order to keep their employees on the payroll and make certain other eligible payments. PPP loans carry an interest rate of 1%. The SBA guarantees 100% of the PPP loans made to eligible borrowers. The entire principal amount and any accrued interest on the loans are eligible to be forgiven in whole or in part, if certain conditions are met, at which point the SBA will pay the bank that originated the PPP loan the forgiven amount. The Company is a participant in the PPP and elected to extend the application deadline to May 31, 2021. As of March 31, 2021, the Company had approximately 8,300 PPP loans outstanding with balances totaling $2.07 billion, which were recorded in the commercial and industrial (“C&I”) portfolio. During the first quarter of 2021, the Company funded 5,075 new PPP loans totaling $828.2 million. Related to the PPP loans made in 2020, as of May 6, 2021, the Company had submitted and received SBA approval for the forgiveness of approximately 5,300 PPP loan applications, totaling $647.5 million.
Other U.S. Government Facilities and Programs — During the second quarter of 2020, the Federal Reserve established the Paycheck Protection Program Liquidity Facility (“PPPLF”) to allow eligible lenders to facilitate lending under the SBA’s PPP, taking PPP loans as collateral. The Company participated in the PPPLF during 2020, borrowing $1.44 billion, which it repaid in full in October 2020. As of both March 31, 2021 and December 31, 2020, the Company had no outstanding borrowings under the PPPLF.
Loan Modifications —The CARES Act and related guidance from the federal banking agencies provide financial institutions the option to temporarily suspend requirements under generally accepted accounting principles (“GAAP”) related to the classification of certain loan modifications as troubled debt restructurings (“TDRs”) to account for the current and anticipated effects of the COVID-19 pandemic. The CARES Act, as amended by the CAA, specified that COVID-19 related loan modifications executed between March 1, 2020 and the earlier of (i) 60 days after the date of termination of the national emergency declared by the President and (ii) January 1, 2022, on loans that were current as of December 31, 2019 are not TDRs. Additionally, under guidance from the federal banking agencies, other short-term modifications made on a good faith basis in response to the COVID-19 pandemic to borrowers that were current prior to any relief are not TDRs under Accounting Standards Codification (“ASC”) Subtopic 310-40, “Troubled Debt Restructuring by Creditors.” These modifications include short-term (e.g., up to six months) modifications such as payment deferrals, fee waivers, extensions of repayment terms, or delays in payment that are insignificant. We have granted loan modifications to our customers in the form of maturity extensions, payment deferrals and forbearance. For a summary of the loans that we have modified in response to the COVID-19 pandemic, please refer to Item 2. Management’s Discussion and Analysis of Financial Condition and Results of Operations (“MD&A”) — Risk Management — Credit Risk Management in this Quarterly Report on Form 10-Q (“this Form 10-Q”).
Our Response to the COVID-19 Pandemic
In response to the pandemic, the Company has implemented protocols and processes to execute its business continuity plans to help protect its employees and support its customers. The Company is managing its response to the COVID-19 pandemic according to its Enterprise Business Continuity Policy, which invokes centralized management of the crisis event and the integration of its response. The CEO and key members of the Company’s management team meet increasing regulatory expectations,regularly with senior executives to help drive decisions, communication and consistency of response across all businesses and functions. In addition, we have implemented measures to assist our employees and customers as discussed below:
•Employees:
The majority of the Company’s employees are able to work from home. The Company continues to evaluate its continuity plans and work-from-home strategy to best protect the health and safety of its employees, and the Company has developed workplace re-entry plans with proper protocols. For employees with jobs that are required to be performed on-site, we have taken significant actions to ensure employee safety by providing personal protection equipment, adopting social distancing measures, placing visual safety reminders related to social distancing, implementing an enhanced cleaning program, installing plexiglass panels, requiring temperature screenings and the wearing of masks for all employees.
•Customers:
We assisted our commercial, consumer and small business clients affected by the COVID-19 pandemic through payment deferrals, suspension of foreclosures on certain residential mortgage loans and participation in the SBA PPP and the MSLP.We intend to evaluate participation in additional new government-sponsored programs, as they are established. In addition, the Company continues to make a wide range of banking services accessible to customers through mobile and other digital channels to reduce the need for in-person branch visits.
Impact on our Financial Position and Results of Operations— Our financial position and results of operations are sensitive to the ability of our customers to meet their loan obligations, the availability of our workforce and the decline in the value of assets which we hold. While its effects continue to materialize, the COVID-19 pandemic has resulted in a significant decrease in commercial activity throughout our operating footprint. This decrease in commercial activity has caused and may continue to cause our customers to be unable to meet existing payment or other obligations to us. Despite the financial impact of the COVID-19 pandemic, we maintained solid profitability for the first quarter of 2021, earning a 1.50% return on average assets (“ROA”) and a 15.57% return on average equity (“ROE”). Our capital ratios are strong, and we remain well-positioned from a liquidity perspective, enabling us to weather adverse economic scenarios while still providing strong returnscontinuing to stockholders.support our customers and invest in our business.
For additional information, see Item 2. MD&A — Risk Management — Credit Risk Management and — Liquidity Risk Management, and — Balance Sheet Analysis — Regulatory Capital and Ratios in this Form 10-Q. Further discussion of the potential impacts on our business from the COVID-19 pandemic is provided in Part I, Item 1A — Risk Factors of the Company’s 2020 Form 10-K.
Selected Financial Data
| | | | | | | | | | | | | | | | | | | | | |
| |
| ($ and shares in thousands, except per share, ratio and headcount data) | | Three Months Ended | |
| March 31,
2021 | | December 31,
2020 | | March 31,
2020 | |
| Summary of operations: | | | | | | | |
Net interest income before provision for credit losses (1) | | $ | 353,695 | | | $ | 346,581 | | | $ | 362,707 | | |
| Noninterest income | | 72,866 | | | 69,832 | | | 55,506 | | |
| Total revenue | | 426,561 | | | 416,413 | | | 418,213 | | |
| Provision for credit losses | | — | | | 24,340 | | | 73,870 | | |
| | | | | | | |
| | | | | | | |
Noninterest expense (2) | | 191,077 | | | 178,651 | | | 180,333 | | |
| Income before income taxes | | 235,484 | | | 213,422 | | | 164,010 | | |
Income tax expense (3) | | 30,490 | | | 49,338 | | | 19,186 | | |
| | | | | | | |
Net income (1)(2)(3) | | $ | 204,994 | | | $ | 164,084 | | | $ | 144,824 | | |
| | | | | | | |
| Per common share: | | | | | | | |
| Basic earnings | | $ | 1.45 | | | $ | 1.16 | | | $ | 1.00 | | |
| Diluted earnings | | $ | 1.44 | | | $ | 1.15 | | | $ | 1.00 | | |
| Dividends declared | | $ | 0.33 | | | $ | 0.28 | | | $ | 0.28 | | |
| Book value | | $ | 37.26 | | | $ | 37.22 | | | $ | 34.67 | | |
| | | | | | | |
Non-GAAP tangible common equity per share (4) | | $ | 33.90 | | | $ | 33.85 | | | $ | 31.27 | | |
| Weighted-average number of shares outstanding: | | | | | | | |
| Basic | | 141,646 | | | 141,564 | | | 144,814 | | |
| Diluted | | 142,844 | | | 142,529 | | | 145,285 | | |
| Common shares outstanding at period-end | | 141,843 | | | 141,565 | | | 141,435 | | |
| | | | | | | |
| Performance metrics: | | | | | | | |
| ROA | | 1.50 | % | | 1.24 | % | | 1.30 | % | |
| ROE | | 15.57 | % | | 12.45 | % | | 11.60 | % | |
Return on average non-GAAP tangible equity (4) | | 17.17 | % | | 13.77 | % | | 12.93 | % | |
| Total average equity to total average assets | | 9.60 | % | | 9.99 | % | | 11.22 | % | |
| Common dividend payout ratio | | 23.11 | % | | 24.00 | % | | 27.95 | % | |
| Net interest margin | | 2.71 | % | | 2.77 | % | | 3.44 | % | |
Efficiency ratio (5) | | 44.79 | % | | 42.90 | % | | 43.12 | % | |
Non-GAAP efficiency ratio (4) | | 38.68 | % | | 39.76 | % | | 38.40 | % | |
| At period end: | | | | | | | |
| Total assets | | $ | 56,874,146 | | | $ | 52,156,913 | | | $ | 45,948,545 | | |
| Interest earning assets | | $ | 54,400,035 | | | $ | 49,716,029 | | | $ | 43,475,811 | | |
Total loans (6) | | $ | 39,588,748 | | | $ | 38,392,743 | | | $ | 35,894,987 | | |
| Available-for-sale (“AFS”) debt securities | | $ | 7,789,213 | | | $ | 5,544,658 | | | $ | 3,695,943 | | |
| Total deposits | | $ | 49,547,136 | | | $ | 44,862,752 | | | $ | 38,686,958 | | |
| Long-term debt | | $ | 147,445 | | | $ | 147,376 | | | $ | 147,169 | | |
| Federal Home Loan Bank (“FHLB”) advances | | $ | 653,035 | | | $ | 652,612 | | | $ | 646,336 | | |
Stockholders’ equity (7) | | $ | 5,285,027 | | | $ | 5,269,175 | | | $ | 4,902,985 | | |
| | | | | | | |
Non-GAAP tangible common equity (4) | | $ | 4,808,179 | | | $ | 4,791,579 | | | $ | 4,422,519 | | |
| Head count (full-time equivalent) | | 3,180 | | | 3,214 | | | 3,285 | | |
| | | | | | | |
| | | | | | | |
| | | | | | | |
| | | | | | | |
| | | | | | | |
| | | | | | | |
| | | | | | | |
| | | | | | | |
| | | | | | | |
| | | | | | | |
| | | | | | | |
| | | | | | | |
| | | | | | | |
| | | | | | | |
| | | | | | | |
| | | | | | | |
| | | | | | | |
| EWBC capital ratios: | | | | | | | |
| | | | | | | |
| | | | | | | |
| Common Equity Tier 1 (“CET1”) capital | | 12.7 | % | | 12.7 | % | | 12.4 | % | |
| Tier 1 capital | | 12.7 | % | | 12.7 | % | | 12.4 | % | |
| Total capital | | 14.3 | % | | 14.3 | % | | 13.9 | % | |
| Tier 1 leverage capital | | 9.1 | % | | 9.4 | % | | 10.2 | % | |
| Total stockholders’ equity to total assets | | 9.3 | % | | 10.1 | % | | 10.7 | % | |
| | | | | | | |
Non-GAAP tangible common equity to tangible assets (4) | | 8.5 | % | | 9.3 | % | | 9.7 | % | |
| |
(1)Included $15.0 million and $14.2 million of interest income related to PPP loans for the first quarter of 2021 and fourth quarter of 2020, respectively.
(2)Fourth quarter 2020 included $10.7 million in recoveries related to DC Solar and affiliates (“DC Solar”) tax credit investments, of which $1.1 million was recorded as an impairment recovery.
(3)Included $5.1 million of uncertain tax position related to DC Solar for the fourth quarter of 2020.
(4)For a discussion of non-GAAP tangible common equity per share, return on average non-GAAP tangible equity, non-GAAP efficiency ratio, non-GAAP tangible common equity and non-GAAP tangible common equity to tangible assets, refer to Item 2. MD&A — Reconciliation of GAAP to Non-GAAP Financial Measures in this Form 10-Q.
(5)The efficiency ratio is noninterest expense divided by total revenue.
(6)Includes $2.07 billion and $1.57 billion of PPP loans as of March 31, 2021 and December 31, 2020, respectively.
(7)On January 1, 2020, the Company adopted Accounting Standards Update (“ASU”) 2016-13, Financial Instruments — Credit Losses (Topic 326): Measurement of Credit Losses on Financial Instruments using the modified retrospective approach. The Company recorded a $125.2 million increase to allowance for loan losses and $98.0 million after-tax decrease to opening retained earnings as of January 1, 2020.
Financial PerformanceReview
Noteworthy items onabout the Company’s performance included:
Net income totaled $132.7 million for the three months ended September 30, 2017,first quarter of 2021 included:
•Earnings: First quarter 2021 net income was $205.0 million, or $1.44 per diluted share, compared with first quarter 2020 net income of $144.8 million, or $1.00 per diluted share, an increase of $22.5$60.2 million or 20%, from $110.1 million for the same period in 2016. This42%. The increase was primarily due to higher net interest income, partially offset by higher income tax expense, reflecting a higher effective tax rate. Net income totaled $420.7 millionno provision for credit losses in the nine months ended September 30, 2017,first quarter of 2021 and an increase of $99.8 million or 31%, from $320.9 million for the same period in 2016. This increase was primarily due to higher net interest income and noninterest income, partially offset by higherincreases in income tax expense due to a higher effective tax rate. The higherand noninterest expense, and lower net interest income during the threeincome.
•Net Interest Income and nine months ended September 30, 2017 was primarily due to growth in the loan portfolio and higher yields. The higher noninterest income during the nine months ended September 30, 2017 was primarily due to a $41.5 million after-tax net gain recognized from the sale of a commercial property in San Francisco, California during the firstNet Interest Margin: First quarter of 2017 and a $2.2 million after-tax net gain recognized from the sale of East West Insurance Services, Inc.’s (“EWIS”) business during the third quarter of 2017.
Diluted earnings per share (“EPS”) was $0.91 and $0.76 for the three months ended September 30, 2017 and 2016, respectively, which reflected an increase of $0.15 or 20%. Diluted EPS was $2.88 and $2.21 for the nine months ended September 30, 2017 and 2016, respectively, an increase of $0.67 or 30%. The diluted EPS impact from the sale of EWIS’s business in the third quarter of 2017 was $0.02, and the diluted EPS impact from the commercial property sale in the first quarter of 2017 was $0.28.
Revenue, or the sum of2021 net interest income before provision for credit losses and noninterest income, increased $49.3was $353.7 million, a decrease of $9.0 million or 16% to $352.82%, compared with first quarter 2020 net interest income of $362.7 million. First quarter 2021 net interest margin was 2.71%, a decrease of 73 basis points from 3.44% for the first quarter of 2020. The net interest income and net interest margin decreases reflect the current low interest rate environment with the upper limit of the federal funds target range of 0.25%; the federal funds rate was cut by 150 basis points in March 2020.
•Provision for Credit Losses: During the first quarter of 2021, the Company did not record a provision for credit losses, compared with a provision of $73.9 million for the three months ended September 30, 2017,first quarter of 2020. The year-over-year change in the provision for credit losses was primarily due to an improved macroeconomic outlook as compared towith the same period in 2016, and increased $184.4first quarter of 2020. First quarter 2021 net charge-offs were $13.4 million or 21% to $1.08 billionannualized 0.14% of average loans held-for-investment, compared with $898 thousand or annualized 0.01% of average loans held-for-investment, for the nine months ended September 30, 2017, compared tofirst quarter of 2020.
•Tax: Income tax expense was $30.5 million and the same period in 2016.
Noninterest expense decreased $6.0 million or 4% to $164.5 million for the three months ended September 30, 2017, compared to the same period in 2016. For the nine months ended September 30, 2017, noninterest expense increased $20.7 million or 4% to $486.7 million, compared to the same period in 2016.
The Company’s effective tax rate was 12.9% for the threefirst quarter of 2021, compared with income tax expense of $19.2 million and nine months ended September 30, 2017 was 24.3% and 25.0%, respectively, compared to 10.8% and 21.9%, respectively,an effective tax rate of 11.7% for the same periods in 2016.first quarter of 2020.
Return on average assets increased 13 and 28 basis points to 1.46% and 1.59%
•Profitability: First quarter 2021 ROA was 1.50%, compared with 1.30% for the three and nine months ended September 30, 2017, respectively,first quarter of 2020. First quarter 2021 ROE was 15.57%, compared to 1.33% and 1.31%, respectively,with 11.60% for the same periods in 2016. Return on average equity increased 93 and 238 basis points to 14.01% and 15.50% for the three and nine months ended September 30, 2017, respectively, compared to 13.08% and 13.12%, respectively, for the same periods in 2016.first quarter of 2020.
Balance Sheet and Liquidity
The Company experienced growth•Total Assets: As of $1.52March 31, 2021, total assets were $56.87 billion, an increase of $4.71 billion or 4% in total assets9% from $52.16 billion as of September 30, 2017 compared to December 31, 2016. This growth was largely attributable2020, primarily due to purchases of AFS debt securities, loan growth, partially offset by decreasesand an increase in securitiesassets purchased under resale agreements (“resale agreements”) and available-for-sale investment securities..
Gross•Loans: Total loans held-for-investment increased $3.02 billion or 12% to $28.53were $39.59 billion as of September 30, 2017, compared to $25.50March 31, 2021, an increase of $1.20 billion or 3% from $38.39 billion as of December 31, 2016, while2020. Loan growth was well-diversified across each of the allowance forCompany’s major loan losses to loans held-for-investment ratio slightly declinedportfolios, with increases from C&I, driven by two basis points to 1.00% asPPP loan funding, commercial real estate (“CRE”) and residential mortgage.
•Total Liabilities: As of September 30, 2017, compared to 1.02% asMarch 31, 2021, total liabilities were $51.59 billion, an increase of December 31, 2016. Deposits increased $1.42$4.70 billion or 5% to $31.31 billion as of September 30, 2017, compared to $29.8910% from $46.89 billion as of December 31, 2016, consisting of a $1.24 billion or 5% increase in core2020, primarily due to deposit growth.
•Deposits: Total deposits and a $179.3 million or 3% increase in time deposits. Core deposits comprised 81% of total deposits as of each of September 30, 2017 and December 31, 2016.
Capital
Our financial performance in the nine months ended September 30, 2017 resulted in strong capital generation, which increased total stockholders’ equity by $354.2 million or 10% to $3.78were $49.55 billion as of September 30, 2017, compared toMarch 31, 2021, an increase of $4.69 billion or 10% from $44.86 billion as of December 31, 2016. We2020. Growth was primarily driven by noninterest-bearing demand deposits, money market accounts and interest-bearing checking.
•Allowance for Loan Losses: The allowance for loan losses was $607.5 million or 1.53% of loans held-for-investment as of March 31, 2021, compared with $620.0 million or 1.61% of loans held-for-investment as of December 31, 2020.
•Asset Quality Metrics: As of March 31, 2021, criticized loans totaled $1.22 billion or 3.07% of loans held-for-investment, compared with the same amount of $1.22 billion or 3.17% of loans held-for-investment as of December 31, 2020. Nonperforming assets were $258.1 million or 0.45% of total assets as of March 31, 2021, compared with $234.9 million or 0.45% of total assets as of December 31, 2020.
•Capital Levels: Our capital levels are strong. As of March 31, 2021, all of the Company’s and the Bank’s regulatory capital ratios were well above the regulatory requirements to be considered well-capitalized. See Item 2. MD&A — Balance Sheet Analysis — Regulatory Capital and Ratios in this Form 10-Q for more information regarding capital.
•Capital Return: The quarterly cash common stock dividend for the first quarter of 2021 was $0.33 per share, an increase of $0.055 or 20% from $0.275 per share for the first quarter of 2020. The Company returned $29.2 million and $87.6$47.4 million in cash dividends to our stockholders during the three and nine months ended September 30, 2017, respectively. Book value per common share increased 10% to $26.17 asfirst quarter of September 30, 2017,2021, compared to $23.78 aswith $40.5 million during the first quarter of December 31, 2016.2020.
From a capital management perspective, the Company continued to maintain a strong capital position with its Common Equity Tier 1 (“CET1”) capital ratio at 11.4% as of September 30, 2017, compared to 10.9% as of December 31, 2016. The total risk-based capital ratio was 12.9% and 12.4% as of September 30, 2017 and December 31, 2016, respectively. The Tier 1 leverage capital ratio was 9.4% as of September 30, 2017, compared to 8.7% as of December 31, 2016.
Results of Operations
Components of Net Income
|
| | | | | | | | | | | | | | | | | | | | | | |
| |
| ($ in thousands, except per share data and ratios) | | Three Months Ended September 30, | | Nine Months Ended September 30, |
| | 2017 | | 2016 | | % Change / Basis Point (“BP”) Change | | 2017 | | 2016 | | % Change / BP Change |
| Interest and dividend income | | $ | 339,910 |
| | $ | 280,317 |
| | 21 | % | | $ | 965,354 |
| | $ | 835,354 |
| | 16 | % |
| Interest expense | | 36,755 |
| | 26,169 |
| | 40 | % | | 99,986 |
| | 75,418 |
| | 33 | % |
| Net interest income before provision for credit losses | | 303,155 |
| | 254,148 |
| | 19 | % | | 865,368 |
| | 759,936 |
| | 14 | % |
| Provision for credit losses | | 12,996 |
| | 9,525 |
| | 36 | % | | 30,749 |
| | 17,018 |
| | 81 | % |
| Noninterest income | | 49,624 |
| | 49,341 |
| | 1 | % | | 213,047 |
| | 134,118 |
| | 59 | % |
| Noninterest expense | | 164,499 |
| | 170,500 |
| | (4 | )% | | 486,693 |
| | 465,985 |
| | 4 | % |
| Income tax expense | | 42,624 |
| | 13,321 |
| | 220 | % | | 140,247 |
| | 90,108 |
| | 56 | % |
| Net income | | $ | 132,660 |
| | $ | 110,143 |
| | 20 | % | | $ | 420,726 |
| | $ | 320,943 |
| | 31 | % |
| Diluted EPS | | $ | 0.91 |
| | $ | 0.76 |
| | 20 | % | | $ | 2.88 |
| | $ | 2.21 |
| | 30 | % |
| Annualized return on average assets | | 1.46 | % | | 1.33 | % | | 13 | bps | | 1.59 | % | | 1.31 | % | | 28 | bps |
| Annualized return on average equity | | 14.01 | % | | 13.08 | % | | 93 | bps | | 15.50 | % | | 13.12 | % | | 238 | bps |
| |
Net income increased $22.5 million or 20% to $132.7 million for the three months ended September 30, 2017, from $110.1 million for the same period in 2016. Diluted EPS was $0.91 for the three months ended September 30, 2017, an increase of $0.15 or 20% from the prior year period. Net income increased $99.8 million or 31% to $420.7 million for the nine months ended September 30, 2017, from $320.9 million for the same period in 2016. Diluted EPS was $2.88 for the nine months ended September 30, 2017, an increase of $0.67 or 30% from the prior year period. As discussed in Note 3 — Dispositions to the Consolidated Financial Statements, the Company completed the sale and leaseback of a commercial property, which resulted in an after-tax net gain of $41.5 million recorded during the first quarter of 2017. Additionally, the Company sold its insurance brokerage business, EWIS, and recorded an after-tax net gain of $2.2 million during the third quarter of 2017. Excluding the net gains on the sales of the commercial property and EWIS’s business during the nine months ended September 30, 2017, non-Generally Accepted Accounting Principles (“non-GAAP”) net income of $377.0 million and non-GAAP diluted EPS of $2.58 increased $56.1 million and $0.37 per share, respectively, from the same prior year period (see reconciliations of non-GAAP measures used below under “Use of Non-GAAP Financial Measures”).
Revenue, or the sum of net interest income before provision for credit losses and noninterest income, increased $49.3 million or 16% to $352.8 million during the three months ended September 30, 2017, from $303.5 million during the same period in 2016. This increase was primarily due to a $49.0 million increase in net interest income, reflecting the growth in the loan portfolio and the positive impact of short-term interest rate increases in 2017. Revenue increased $184.4 million or 21% to $1.08 billion during the nine months ended September 30, 2017, from $894.1 million during the same period in 2016. This increase was due to a $105.4 million increase in net interest income, reflecting the growth in the loan portfolio and the positive impact of short-term interest rate increases in 2017; and a $78.9 million increase in noninterest income, primarily due to the $71.7 million pre-tax gain recognized from the sale of the commercial property during the first quarter of 2017 and the $3.8 million pre-tax gain recognized from the sale of EWIS’s business.
Noninterest expense was $164.5 million for the three months ended September 30, 2017, a decrease of $6.0 million or 4% from $170.5 million for the same period in 2016. This decrease was largely driven by lower amortization expense of tax credits and other investments and lower legal expense, partially offset by an increase in compensation and employee benefits. Noninterest expense was $486.7 million for the nine months ended September 30, 2017, an increase of $20.7 million or 4% from $466.0 million for the same period in 2016. This increase was largely driven by higher compensation and employee benefits and amortization expense of tax credit and other investments, partially offset by lower consulting and legal expenses.
Strong returns on average assets and average equity during the three and nine months ended September 30, 2017 reflected the Company’s ability to achieve higher profitability while expanding the loan and deposit base. The return on average assets increased 13 basis points to 1.46% while the return on average equity increased 93 basis points to 14.01% for the three months ended September 30, 2017, compared to the same period in 2016. The return on average assets increased 28 basis points to 1.59% while the return on average equity increased 238 basis points to 15.50% for the nine months ended September 30, 2017, compared to the same period in 2016. Excluding the impact of the after-tax gains on the sales of the commercial property and EWIS’s business that were recognized in the first and third quarters of 2017, respectively, non-GAAP return on average assets was 1.43% for the nine months ended September 30, 2017, a 12 basis point increase from the same prior year period, while non-GAAP return on average equity was 13.89% for the nine months ended September 30, 2017, a 77 basis point increase from the same prior year period. (See reconciliations of non-GAAP measures used below under “Use of Non-GAAP Financial Measures”.)
Use of Non-GAAP Financial Measures
To supplement the Company’s unaudited interim Consolidated Financial Statements presented in accordance with Generally Accepted Accounting Principles (“GAAP”), the Company uses certain non-GAAP measures of financial performance. Non-GAAP financial measures are not in accordance with, or an alternative for, GAAP. Generally, a non-GAAP financial measure is a numerical measure of a company’s performance that either excludes or includes amounts that are not normally excluded or included in the most directly comparable measure calculated and presented in accordance with GAAP. A non-GAAP financial measure may also be a financial metric that is not required by GAAP or other applicable requirement.
The Company believes these non-GAAP financial measures, when taken together with the corresponding GAAP financial measures, provide meaningful supplemental information regarding its performance. Management believes that excluding the non-recurring after-tax effect of the gains on sales of the commercial property and EWIS’s business from net income, diluted EPS, and returns on average assets and average equity, will make it easier to analyze the results by presenting them on a more comparable basis. However, note that these non-GAAP financial measures should be considered in addition to, not as a substitute for or preferable to, financial measures prepared in accordance with GAAP.
The following table presents a reconciliation of GAAP to non-GAAP financial measures for the nine months ended September 30, 2017 and 2016:
|
| | | | | | | | | | |
| |
| | | | | Nine Months Ended September 30, |
| ($ and shares in thousands, except per share data) | | | | 2017 | | 2016 |
| Net income | | (a) | | $ | 420,726 |
| | $ | 320,943 |
|
Less: Gain on sale of the commercial property, net of tax (1) | | (b) | | (41,526 | ) | | — |
|
Gain on sale of business, net of tax (1) | | | | (2,206 | ) | | — |
|
| Non-GAAP net income | | (c) | | $ | 376,994 |
|
| $ | 320,943 |
|
| | | | | | | |
| Diluted weighted average number of shares outstanding | | (d) | | 145,849 |
| | 145,086 |
|
| | | | | | | |
| Diluted EPS | | (a)/(d) | | $ | 2.88 |
| | $ | 2.21 |
|
| Diluted EPS impact of the gain on sale of the commercial property, net of tax | | (b)/(d) | | (0.28 | ) | | — |
|
| Diluted EPS impact of the gain on sale of business, net of tax | | | | (0.02 | ) | | — |
|
| Non-GAAP diluted EPS | | (c)/(d) | | $ | 2.58 |
|
| $ | 2.21 |
|
| | | | | | | |
| Average total assets | | (e) | | $ | 35,290,542 |
| | $ | 32,662,445 |
|
| Average stockholders’ equity | | (f) | | $ | 3,630,062 |
| | $ | 3,266,485 |
|
Return on average assets (2) | | (a)/(e) | | 1.59 | % | | 1.31 | % |
Non-GAAP return on average assets (2) | | (c)/(e) | | 1.43 | % | | 1.31 | % |
Return on average equity (2) | | (a)/(f) | | 15.50 | % | | 13.12 | % |
Non-GAAP return on average equity (2) | | (c)/(f) | | 13.89 | % | | 13.12 | % |
| | | | | | | |
| |
(1) | Applied statutory tax rate of 42.05%. |
A discussion of net interest income, noninterest income, noninterest expense, income taxes and operating segment results are presented below.
Net Interest Income
The Company’s primary source of revenue is net interest income, which is the difference between interest income earned on loans, investment securities, resale agreements and other interest-earning assets less interest expense paid on customer deposits, securities sold under repurchase agreements (“repurchase agreements”), borrowings and other interest-bearing liabilities. Net interest margin is calculated by dividing the annualizedratio of net interest income byto average interest-earning assets. Net interest income and net interest margin are affectedimpacted by several factors, including changes in average balances and the composition of interest-earning assets and funding sources, market interest rate fluctuations and the slope of the yield curve, repricing characteristics and maturity of interest-earning assets and interest-bearing liabilities, volume of noninterest-bearing sources of funds and asset quality.
Net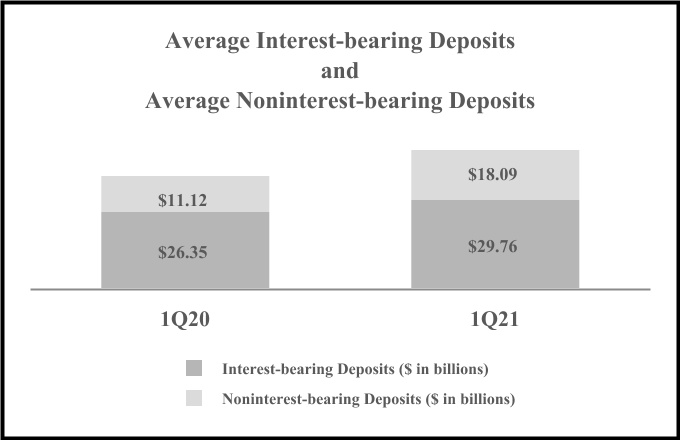

First quarter 2021 net interest income for the three months ended September 30, 2017 was $303.2$353.7 million, an increasea decrease of $49.0$9.0 million or 19%2%, compared to $254.1with $362.7 million for the same period in 2016. Net interest income for the nine months ended September 30, 2017 was $865.4 million, an increasefirst quarter of $105.4 million or 14% compared to $759.9 million for the same period in 2016.2020. The notable increasesyear-over-year decline in net interest income for the three and nine months ended September 30, 2017, compared to the same periods in 2016, were primarilywas due to increaseda decrease in interest-earning asset yields, which reflected significantly lower benchmark interest income resulting from loan growth and higher yields on interest-earning assets,rates, partially offset by a 16 and 12 basis point increasedecrease in the cost of interest-bearing deposits during the three and nine months ended September 30, 2017, respectively. The cost of interest-bearing deposits was 0.60% and 0.55% for the three and nine months ended September 30, 2017, respectively, compared to 0.44% and 0.43% for the three and nine months ended September 30, 2016.
For the three months ended September 30, 2017,funds. First quarter 2021 net interest margin increased to 3.52%was 2.71%, compared to 3.26%a decrease of 73 basis points from 3.44% for the same periodfirst quarter of 2020. The upper limit of the federal funds target range was 0.25% in 2016. For the nine months ended September 30, 2017, net interest margin increased to 3.45%, compared to 3.29% forfirst quarter of 2021; the same periodfederal funds rate was cut by 150 basis points in 2016. The increases in net interest margin for the three and nine months ended September 30, 2017 were due to higher yields fromMarch 2020.
Average interest-earning assets (primarily due to an increase in loan yields for the three months ended September 30, 2017 compared to the same prior year period, and primarily due to increases in yields of loans, interest-bearing cash and deposits with banks and investment securities during the nine months ended September 30, 2017), as a result of the short-term interest rate increases in 2017. The higher loan yields for the three and nine months ended September 30, 2017 were partially offset by lower accretion income from the purchased credit impaired (“PCI”) loans accounted for under Accounting Standard Codification (“ASC”) 310-30, Loans and Debt Securities Acquired with Deteriorated Credit Quality. During the three and nine months ended September 30, 2017, total accretion income from loans accounted for under ASC 310-30 was $4.5 million and $14.0 million, respectively, compared to $7.1 million and $33.8 million, respectively, for the same periods in 2016.
For the three months ended September 30, 2017, average interest-earning assets increased $3.15 billion or 10% to $34.21 billion from $31.06$52.85 billion for the same period in 2016.first quarter of 2021, an increase of $10.49 billion or 25% from $42.36 billion for the first quarter of 2020. This increase was primarily due to increases of $3.22 billion or 13%driven by growth in average loans, average AFS debt securities, and $751.0 million or 47% in average interest-bearing cash and deposits with banks, partially offsetwhich increased by decreases of $508.2 million or 28% in average resale agreements$3.58 billion, $3.19 billion and $310.7 million or 9% in average investment securities. For the nine months ended September 30, 2017,$3.14 billion, respectively.
The yield on average interest-earning assets increased $2.73 billion or 9% to $33.54 billion from $30.81 billion for the samefirst quarter of 2021 was 2.93%, a decrease of 133 basis points from 4.26% for the first quarter of 2020. The year-over-year change reflected yield compression for all earning asset categories, in response to the drop in benchmark interest rate at the end of the first quarter 2020. The average loan yield for the first quarter of 2021 was 3.58%, a decrease of 113 basis points from 4.71% for the first quarter of 2020. Approximately 64% and 69% of loans held-for-investment were variable-rate or hybrid loans in their adjustable rate period in 2016. This increase was primarily due to increasesas of $2.78 billion or 12% in average loans,March 31, 2021 and $305.1 million or 17% in average interest-bearing cash and deposits with banks, partially offset by a $228.3 million or 7% decrease in average investment securities.2020, respectively.
Deposits are an important source of fundingfunds and affectimpact both net interest income and net interest margin. Deposits are comprisedAverage total deposits were $47.85 billion for the first quarter of 2021, an increase of $10.38 billion or 28% from $37.47 billion for the first quarter of 2020. Average noninterest-bearing demand deposits were $18.09 billion for the first quarter of 2021, an increase of $6.96 billion or 63% from $11.12 billion for the first quarter of 2020. Average interest-bearing deposits were $29.76 billion for the first quarter of 2021, an increase of $3.41 billion or 13% from $26.35 billion for the first quarter of 2020. Due to the strong growth in average noninterest-bearing deposits, the share of noninterest-bearing demand interest-bearing checking, money market, savings and time deposits. Average deposits increased $2.79 billion or 10% to $31.07 billion for38% of average total deposits in the three months ended September 30, 2017,first quarter of 2021, compared to $28.28 billion forwith 30% in the same period in 2016. The ratio of average noninterest-bearing demand deposits to total deposits increased to 34% for the three months ended September 30, 2017, from 33% for the three months ended September 30, 2016. Average deposits increased $2.27 billion or 8% to $30.33 billion for the nine months ended September 30, 2017, compared to $28.06 billion for the same period in 2016. The ratio of average noninterest-bearing demand deposits to total deposits increased to 34% for the nine months ended September 30, 2017, from 32% for the nine months ended September 30, 2016. 2020.
The average loans to average deposits ratio increased to 89% for the three months ended September 30, 2017, from 86% for the three months ended September 30, 2016. The average loans to average deposits ratio increased to 88% for the nine months ended September 30, 2017, from 86% for the nine months ended September 30, 2016. In addition, cost of funds increased 10was 0.23% for the first quarter of 2021, a decrease of 67 basis points to 0.46%from 0.90% for the three months ended September 30, 2017 from 0.36%first quarter of 2020. The decrease in the average cost of funds primarily reflected the changed interest rate environment. The average cost of interest-bearing deposits was 0.30% for the same periodfirst quarter of 2021, a decrease of 87 basis points from 1.17% for the first quarter of 2020. Other sources of funding included in 2016. Costthe calculation of the average cost of funds increased eight basis points to 0.43% for the nine months ended September 30, 2017 from 0.35% for the same period in 2016.primarily consist of FHLB advances, assets sold under repurchase agreements (“repurchase agreements”), long-term debt and short-term borrowings.
The Company utilizes various tools to manage interest rate risk. Refer to the “InterestInterest Rate Risk Management”Management section of Management’s Discussion and Analysis of Financial Condition and Results of Operations (“Item 2. MD&A”) &A — Asset Liability and Risk Management —Market Risk Management for details.in this Form 10-Q.
The following table presents the interest spread, net interest margin, average balances, interest income and expense, and the average yield/rate by asset and liability component for the three months ended September 30, 2017first quarters of 2021 and 2016:2020:
| | | | | | | | | | | | | | | | | | | | | | | | | | | | | | | | | | | | | | |
|
| ($ in thousands) | | Three Months Ended March 31, |
| 2021 | | 2020 |
| Average
Balance | | Interest | | Average Yield/ Rate (1) | | Average
Balance | | Interest | | Average Yield/ Rate (1) |
| ASSETS | | | | | | | | | | | | |
| Interest-earning assets: | | | | | | | | | | | | |
| Interest-bearing cash and deposits with banks | | $ | 6,117,799 | | | $ | 3,632 | | | 0.24 | % | | $ | 2,973,006 | | | $ | 11,108 | | | 1.50 | % |
Resale agreements (2) | | 1,461,900 | | | 6,099 | | | 1.69 | % | | 882,142 | | | 5,625 | | | 2.56 | % |
AFS debt securities (3)(4) | | 6,459,875 | | | 29,100 | | | 1.83 | % | | 3,274,740 | | | 20,142 | | | 2.47 | % |
Loans (5)(6) | | 38,729,307 | | | 342,008 | | | 3.58 | % | | 35,153,968 | | | 411,869 | | | 4.71 | % |
| Restricted equity securities | | 83,164 | | | 547 | | | 2.67 | % | | 78,675 | | | 446 | | | 2.28 | % |
| Total interest-earning assets | | $ | 52,852,045 | | | $ | 381,386 | | | 2.93 | % | | $ | 42,362,531 | | | $ | 449,190 | | | 4.26 | % |
| Noninterest-earning assets: | | | | | | | | | | | | |
| Cash and due from banks | | 580,277 | | | | | | | 510,512 | | | | | |
| Allowance for loan losses | | (618,589) | | | | | | | (492,297) | | | | | |
| Other assets | | 2,780,550 | | | | | | | 2,374,763 | | | | | |
| Total assets | | $ | 55,594,283 | | | | | | | $ | 44,755,509 | | | | | |
| LIABILITIES AND STOCKHOLDERS’ EQUITY | | | | | | | | | | | | |
| Interest-bearing liabilities: | | | | | | | | | | | | |
| Checking deposits | | $ | 6,393,034 | | | $ | 4,214 | | | 0.27 | % | | $ | 5,001,672 | | | $ | 10,246 | | | 0.82 | % |
| Money market deposits | | 11,573,847 | | | 4,711 | | | 0.17 | % | | 9,013,381 | | | 22,248 | | | 0.99 | % |
| Savings deposits | | 2,674,476 | | | 1,741 | | | 0.26 | % | | 2,076,270 | | | 1,817 | | | 0.35 | % |
| Time deposits | | 9,112,662 | | | 11,156 | | | 0.50 | % | | 10,264,007 | | | 42,092 | | | 1.65 | % |
| Short-term borrowings | | 4,703 | | | 42 | | | 3.62 | % | | 59,978 | | | 556 | | | 3.73 | % |
| FHLB advances | | 652,758 | | | 3,069 | | | 1.91 | % | | 693,357 | | | 4,166 | | | 2.42 | % |
Repurchase agreements (2) | | 300,000 | | | 1,978 | | | 2.67 | % | | 332,417 | | | 3,991 | | | 4.83 | % |
| Long-term debt and finance lease liabilities | | 152,088 | | | 780 | | | 2.08 | % | | 152,259 | | | 1,367 | | | 3.61 | % |
| Total interest-bearing liabilities | | $ | 30,863,568 | | | $ | 27,691 | | | 0.36 | % | | $ | 27,593,341 | | | $ | 86,483 | | | 1.26 | % |
| Noninterest-bearing liabilities and stockholders’ equity: | | | | | | | | | | | | |
| Demand deposits | | 18,093,696 | | | | | | | 11,117,710 | | | | | |
| Accrued expenses and other liabilities | | 1,298,921 | | | | | | | 1,022,453 | | | | | |
| Stockholders’ equity | | 5,338,098 | | | | | | | 5,022,005 | | | | | |
| Total liabilities and stockholders’ equity | | $ | 55,594,283 | | | | | | | $ | 44,755,509 | | | | | |
| Interest rate spread | | | | | | 2.57 | % | | | | | | 3.00 | % |
| Net interest income and net interest margin | | | | $ | 353,695 | | | 2.71 | % | | | | $ | 362,707 | | | 3.44 | % |
|
|
| | | | | | | | | | | | | | | | | | | | | | |
| |
| ($ in thousands) | | Three Months Ended September 30, |
| | 2017 | | 2016 |
| | Average Balance | | Interest | | Average Yield/ Rate(1) | | Average
Balance | | Interest | | Average Yield/ Rate(1) |
| ASSETS | | | | | | | | | | | | |
| Interest-earning assets: | | | | | | | | | | | | |
| Interest-bearing cash and deposits with banks | | $ | 2,344,561 |
| | $ | 9,630 |
| | 1.63 | % | | $ | 1,593,577 |
| | $ | 3,168 |
| | 0.79 | % |
Resale agreements (2) | | 1,297,826 |
| | 7,901 |
| | 2.42 | % | | 1,805,978 |
| | 7,834 |
| | 1.73 | % |
Investment securities (3) | | 2,963,122 |
| | 14,828 |
| (4) | 1.99 | % | | 3,273,861 |
| | 13,388 |
| (4) | 1.63 | % |
Loans (5) | | 27,529,779 |
| | 306,939 |
| (6) | 4.42 | % | | 24,309,313 |
| | 255,316 |
| (6) | 4.18 | % |
| Restricted equity securities | | 73,245 |
| | 612 |
| | 3.31 | % | | 72,625 |
| | 611 |
| | 3.35 | % |
| Total interest-earning assets | | 34,208,533 |
| | 339,910 |
| | 3.94 | % | | 31,055,354 |
| | 280,317 |
| | 3.59 | % |
| Noninterest-earning assets: | | | | | | | | | | | | |
| Cash and due from banks | | 387,705 |
| | | | | | 354,053 |
| | | | |
| Allowance for loan losses | | (276,467 | ) | | | | | | (266,763 | ) | | | | |
| Other assets | | 1,617,796 |
| | | | | | 1,763,889 |
| | | | |
| Total assets | | $ | 35,937,567 |
| | | | | | $ | 32,906,533 |
| | | | |
| LIABILITIES AND STOCKHOLDERS’ EQUITY | | | | | | | | |
| Interest-bearing liabilities: | | | | | | | | | | |
| Checking deposits | | $ | 4,014,290 |
| | $ | 4,768 |
| | 0.47 | % | | $ | 3,553,477 |
| | $ | 3,253 |
| | 0.36 | % |
| Money market deposits | | 7,997,648 |
| | 11,828 |
| | 0.59 | % | | 7,548,835 |
| | 6,663 |
| | 0.35 | % |
| Savings deposits | | 2,423,312 |
| | 1,810 |
| | 0.30 | % | | 2,133,036 |
| | 1,160 |
| | 0.22 | % |
| Time deposits | | 5,974,793 |
| | 12,680 |
| | 0.84 | % | | 5,627,084 |
| | 9,973 |
| | 0.71 | % |
| Federal funds purchased and other short-term borrowings | | 29,661 |
| | 212 |
| | 2.84 | % | | 32,137 |
| | 212 |
| | 2.62 | % |
| Federal Home Loan Bank (“FHLB”) advances | | 322,973 |
| | 1,947 |
| | 2.39 | % | | 320,743 |
| | 1,361 |
| | 1.69 | % |
Repurchase agreements (2) | | 50,000 |
| | 2,122 |
| | 16.84 | % | | 200,000 |
| | 2,319 |
| | 4.61 | % |
| Long-term debt | | 176,472 |
| | 1,388 |
| | 3.12 | % | | 196,170 |
| | 1,228 |
| | 2.49 | % |
| Total interest-bearing liabilities | | 20,989,149 |
| | 36,755 |
| | 0.69 | % | | 19,611,482 |
| | 26,169 |
| | 0.53 | % |
| Noninterest-bearing liabilities and stockholders’ equity: | | | | | | | | | | |
| Demand deposits | | 10,655,860 |
| | | | | | 9,413,031 |
| | | | |
| Accrued expenses and other liabilities | | 536,351 |
| | | | | | 532,779 |
| | | | |
| Stockholders’ equity | | 3,756,207 |
| | | | | | 3,349,241 |
| | | | |
| Total liabilities and stockholders’ equity | | $ | 35,937,567 |
| | | | | | $ | 32,906,533 |
| | | | |
| Interest rate spread | | |
| | | | 3.25 | % | | | | | | 3.06 | % |
| Net interest income and net interest margin | | |
| | $ | 303,155 |
| | 3.52 | % | | | | $ | 254,148 |
| | 3.26 | % |
| |
| |
(2) | (2)Average balances of resale and repurchase agreements are reported net, pursuant to ASC 210-20-45, Balance Sheet Offsetting. |
| |
(3) | Yields on tax-exempt securities are not presented on a tax-equivalent basis. |
| |
(4) | Includes the amortization of net premiums on investment securities of $5.2 million and $5.4 million for the three months ended September 30, 2017 and 2016, respectively. |
| |
(5) | Average balance includes nonperforming loans. |
| |
(6) | Interest income on loans includes net deferred loan fees, accretion of ASC 310-30 discounts and amortization of premiums, which totaled $6.5 million and $8.5 million for the three months ended September 30, 2017 and 2016, respectively. |
The following table presents the interest spread, net interest margin, average balances, interest income and expense, and the average yield/rates by asset and liability component for the nine months ended September 30, 2017first quarter of 2020 have been reported net, pursuant to ASC 210-20-45-11, Balance Sheet Offsetting: Repurchase and 2016:Reverse Repurchase Agreements. The weighted-average yields of gross resale agreements were 1.69% and 2.50% for the first quarters of 2021 and 2020, respectively. The weighted-average interest rates of gross repurchase agreements were 2.67% and 4.10% for the first quarters of 2021 and 2020, respectively.
(3)Yields on tax-exempt securities are not presented on a tax-equivalent basis.
(4)Includes the amortization of premiums on debt securities of $19.0 million and $3.3 million for the first quarters of 2021 and 2020, respectively.
(5)Average balances include nonperforming loans and loans held-for-sale.
(6)Loans include the accretion of net deferred loan fees, unearned fees and amortization of premiums, which totaled $13.9 million and $8.0 million for the first quarters of 2021 and 2020, respectively.
|
| | | | | | | | | | | | | | | | | | | | | | |
| | | | | | | | | | | | | |
| ($ in thousands) | | Nine Months Ended September 30, |
| | 2017 | | 2016 |
| | Average Balance | | Interest | | Average Yield/ Rate(1) | | Average
Balance | | Interest | | Average Yield/ Rate(1) |
| ASSETS | | | | | | | | | | | | |
| Interest-earning assets: | | | | | | | | | | | | |
| Interest-bearing cash and deposits with banks | | $ | 2,073,322 |
| | $ | 22,298 |
| | 1.44 | % | | $ | 1,768,252 |
| | $ | 10,245 |
| | 0.77 | % |
Resale agreements (2) | | 1,552,198 |
| | 25,222 |
| | 2.17 | % | | 1,672,993 |
| | 22,479 |
| | 1.79 | % |
Investment securities (3) | | 3,060,688 |
| | 43,936 |
| (4) | 1.92 | % | | 3,289,014 |
| | 37,433 |
| (4) | 1.52 | % |
Loans (5) | | 26,783,082 |
| | 872,039 |
| (6) | 4.35 | % | | 24,006,926 |
| | 763,189 |
| (6) | 4.25 | % |
| Restricted equity securities | | 73,651 |
| | 1,859 |
| | 3.37 | % | | 76,122 |
| | 2,008 |
| | 3.52 | % |
| Total interest-earning assets | | 33,542,941 |
| | 965,354 |
| | 3.85 | % | | 30,813,307 |
| | 835,354 |
| | 3.62 | % |
| Noninterest-earning assets: | | | | | | | | | | | | |
| Cash and due from banks | | 387,440 |
| | | | | | 349,721 |
| | | | |
| Allowance for loan losses | | (268,477 | ) | | | | | | (264,088 | ) | | | | |
| Other assets | | 1,628,638 |
| | | | | | 1,763,505 |
| | | | |
| Total assets | | $ | 35,290,542 |
| | | | | | $ | 32,662,445 |
| | | | |
| LIABILITIES AND STOCKHOLDERS’ EQUITY | | | | | | | | |
| Interest-bearing liabilities: | | | | | | | | | | |
| Checking deposits | | $ | 3,830,004 |
| | $ | 12,538 |
| | 0.44 | % | | $ | 3,445,996 |
| | $ | 9,058 |
| | 0.35 | % |
| Money market deposits | | 7,968,457 |
| | 30,409 |
| | 0.51 | % | | 7,519,261 |
| | 19,295 |
| | 0.34 | % |
| Saving deposits | | 2,334,752 |
| | 4,525 |
| | 0.26 | % | | 2,043,547 |
| | 3,207 |
| | 0.21 | % |
| Time deposits | | 5,873,217 |
| | 34,331 |
| | 0.78 | % | | 5,941,760 |
| | 29,148 |
| | 0.66 | % |
| Federal funds purchased and other short-term borrowings | | 40,772 |
| | 877 |
| | 2.88 | % | | 19,384 |
| | 390 |
| | 2.69 | % |
| FHLB advances | | 414,355 |
| | 5,738 |
| | 1.85 | % | | 400,850 |
| | 4,153 |
| | 1.38 | % |
Repurchase agreements (2) | | 170,330 |
| | 7,538 |
| | 5.92 | % | | 182,482 |
| | 6,441 |
| | 4.71 | % |
| Long-term debt | | 181,337 |
| | 4,030 |
| | 2.97 | % | | 201,060 |
| | 3,726 |
| | 2.48 | % |
| Total interest-bearing liabilities | | 20,813,224 |
| | 99,986 |
| | 0.64 | % | | 19,754,340 |
| | 75,418 |
| | 0.51 | % |
| Noninterest-bearing liabilities and stockholders’ equity: | | | | | | | | | | |
| Demand deposits | | 10,323,254 |
| | | | | | 9,107,051 |
| | | | |
| Accrued expenses and other liabilities | | 524,002 |
| | | | | | 534,569 |
| | | | |
| Stockholders’ equity | | 3,630,062 |
| | | | | | 3,266,485 |
| | | | |
| Total liabilities and stockholders’ equity | | $ | 35,290,542 |
| | | | | | $ | 32,662,445 |
| | | | |
| Interest rate spread | | | | | | 3.21 | % | | | | | | 3.11 | % |
| Net interest income and net interest margin | | | | $ | 865,368 |
| | 3.45 | % | | | | $ | 759,936 |
| | 3.29 | % |
| | | | | | | | | | | | | |
| |
(2) | Average balances of resale and repurchase agreements are reported net, pursuant to ASC 210-20-45, Balance Sheet Offsetting.
|
| |
(3) | Yields on tax-exempt securities are not presented on a tax-equivalent basis. |
| |
(4) | Includes the amortization of net premiums on investment securities of $16.3 million and $18.2 million for the nine months ended September 30, 2017 and 2016, respectively. |
| |
(5) | Average balance includes nonperforming loans. |
| |
(6) | Interest income on loans includes net deferred loan fees, accretion of ASC 310-30 discounts and amortization of premiums, which totaled $21.1 million and $39.7 million for the nine months ended September 30, 2017 and 2016, respectively. |
The following table summarizes the extent to which changes in (1) interest rates, and changes in(2) volume of average interest-earning assets and average interest-bearing liabilities affected the Company’s net interest income for the periods presented. The total change for each category of interest-earning assets and interest-bearing liabilities is segmented into the changechanges attributable to variations in volume and the change attributable to variations in interest rates.yield/rate. Changes that are not solely due to either volume or yield/rate are allocated proportionally based on the absolute value of the change related to average volume and average rate. Nonaccrual loans are included in average loans used to compute the table below:
| | | | | | | | | | | | | | | | | | | | | | | | | | | | | | | | | | | | | | |
|
| ($ in thousands) | | Three Months Ended March 31, | | | | | | | | | | |
| 2021 vs. 2020 | | | | | | |
| Total
Change | | Changes Due to | | | | | | | | | | | | |
| | Volume | | Yield/Rate | | | | | | | | | | | | | | | |
| Interest-earning assets: | | | | | | | | | | | | | | | | | | | | | | | | |
| Interest-bearing cash and deposits with banks | | $ | (7,476) | | | $ | 6,146 | | | $ | (13,622) | | | | | | | | | | | | | | | | | | | |
| Resale agreements | | 474 | | | 2,814 | | | (2,340) | | | | | | | | | | | | | | | | | | | |
| AFS debt securities | | 8,958 | | | 15,293 | | | (6,335) | | | | | | | | | | | | | | | | | | | |
| Loans | | (69,861) | | | 37,560 | | | (107,421) | | | | | | | | | | | | | | | | | | | |
| Restricted equity securities | | 101 | | | 25 | | | 76 | | | | | | | | | | | | | | | | | | | |
| Total interest and dividend income | | $ | (67,804) | | | $ | 61,838 | | | $ | (129,642) | | | | | | | | | | | | | | | | | | | |
| Interest-bearing liabilities: | | | | | | | | | | | | | | | | | | | | | | | | |
| Checking deposits | | $ | (6,032) | | | $ | 2,245 | | | $ | (8,277) | | | | | | | | | | | | | | | | | | | |
| Money market deposits | | (17,537) | | | 4,893 | | | (22,430) | | | | | | | | | | | | | | | | | | | |
| Savings deposits | | (76) | | | 442 | | | (518) | | | | | | | | | | | | | | | | | | | |
| Time deposits | | (30,936) | | | (4,278) | | | (26,658) | | | | | | | | | | | | | | | | | | | |
| Short-term borrowings | | (514) | | | (499) | | | (15) | | | | | | | | | | | | | | | | | | | |
| FHLB advances | | (1,097) | | | (238) | | | (859) | | | | | | | | | | | | | | | | | | | |
| Repurchase agreements | | (2,013) | | | (361) | | | (1,652) | | | | | | | | | | | | | | | | | | | |
| Long-term debt and finance lease liabilities | | (587) | | | (2) | | | (585) | | | | | | | | | | | | | | | | | | | |
| Total interest expense | | $ | (58,792) | | | $ | 2,202 | | | $ | (60,994) | | | | | | | | | | | | | | | | | | | |
| Change in net interest income | | $ | (9,012) | | | $ | 59,636 | | | $ | (68,648) | | | | | | | | | | | | | | | | | | | |
|
|
| | | | | | | | | | | | | | | | | | | | | | | | |
| |
| ($ in thousands) | | Three Months Ended September 30, | | Nine Months Ended September 30, |
| | 2017 vs. 2016 | | 2017 vs. 2016 |
| | Total Change | | Changes Due to | | Total Change | | Changes Due to |
| | | Volume | | Yield/Rate | | | Volume | | Yield/Rate |
| Interest-earning assets: | | | | | | | | |
| | |
| | |
|
| Interest-bearing cash and deposits with banks | | $ | 6,462 |
| | $ | 1,988 |
| | $ | 4,474 |
| | $ | 12,053 |
| | $ | 2,018 |
| | $ | 10,035 |
|
| Resale agreements | | 67 |
| | (2,566 | ) | | 2,633 |
| | 2,743 |
| | (1,714 | ) | | 4,457 |
|
| Investment securities | | 1,440 |
| | (1,348 | ) | | 2,788 |
| | 6,503 |
| | (2,746 | ) | | 9,249 |
|
| Loans | | 51,623 |
| | 35,780 |
| | 15,843 |
| | 108,850 |
| | 89,417 |
| | 19,433 |
|
| Restricted equity securities | | 1 |
| | 6 |
| | (5 | ) | | (149 | ) | | (65 | ) | | (84 | ) |
| Total interest and dividend income | | $ | 59,593 |
| | $ | 33,860 |
| | $ | 25,733 |
| | $ | 130,000 |
| | $ | 86,910 |
| | $ | 43,090 |
|
| Interest-bearing liabilities: | | |
| | | | | | |
| | |
| | |
|
| Checking deposits | | $ | 1,515 |
| | $ | 464 |
| | $ | 1,051 |
| | $ | 3,480 |
| | $ | 1,083 |
| | $ | 2,397 |
|
| Money market deposits | | 5,165 |
| | 420 |
| | 4,745 |
| | 11,114 |
| | 1,211 |
| | 9,903 |
|
| Savings deposits | | 650 |
| | 175 |
| | 475 |
| | 1,318 |
| | 496 |
| | 822 |
|
| Time deposits | | 2,707 |
| | 654 |
| | 2,053 |
| | 5,183 |
| | (341 | ) | | 5,524 |
|
| Federal funds purchased and other short-term borrowings | | — |
| | (17 | ) | | 17 |
| | 487 |
| | 458 |
| | 29 |
|
| FHLB advances | | 586 |
| | 10 |
| | 576 |
| | 1,585 |
| | 144 |
| | 1,441 |
|
| Repurchase agreements | | (197 | ) | | (2,762 | ) | | 2,565 |
| | 1,097 |
| | (452 | ) | | 1,549 |
|
| Long-term debt | | 160 |
| | (132 | ) | | 292 |
| | 304 |
| | (390 | ) | | 694 |
|
| Total interest expense | | $ | 10,586 |
| | $ | (1,188 | ) | | $ | 11,774 |
| | $ | 24,568 |
| | $ | 2,209 |
| | $ | 22,359 |
|
| Change in net interest income | | $ | 49,007 |
| | $ | 35,048 |
| | $ | 13,959 |
| | $ | 105,432 |
| | $ | 84,701 |
| | $ | 20,731 |
|
| |
Noninterest Income
Noninterest income increased $283 thousand or 1% to $49.6 million for the three months ended September 30, 2017, compared to $49.3 million for the same period in 2016. This increase was primarily due to a $3.8 million increase in net gain on sale of EWIS’s business and an $872 thousand increase in derivative fees and other income, partially offset by a $4.0 million decrease in other fees and operating income. Noninterest income increased $78.9 million or 59% to $213.0 million for the nine months ended September 30, 2017, compared to $134.1 million for the same period in 2016. This increase was comprised of a $71.2 million increase in net gains on sales of fixed assets, primarily related to the sale of a commercial property, and a $3.8 million increase in net gain on the sale of EWIS’s business, partially offset by a $4.5 million decrease in other fees and operating income. Noninterest income represented 14% and 20% of revenue for the three and nine months ended September 30, 2017, respectively, compared to 16% and 15%, respectively, for the same periods in 2016.
The following table presents the components of noninterest income for the periods indicated:first quarters of 2021 and 2020: |
| | | | | | | | | | | | | | | | | | | | | | |
| |
| ($ in thousands) | | Three Months Ended
September 30, | | Nine Months Ended
September 30, |
| | 2017 | | 2016 | | % Change | | 2017 | | 2016 | | % Change |
| Branch fees | | $ | 10,803 |
| | $ | 10,408 |
| | 4 | % | | $ | 31,799 |
| | $ | 30,983 |
| | 3 | % |
| Letters of credit fees and foreign exchange income | | 10,154 |
| | 10,908 |
| | (7 | )% | | 33,209 |
| | 31,404 |
| | 6 | % |
| Ancillary loan fees and other income | | 5,987 |
| | 6,135 |
| | (2 | )% | | 16,876 |
| | 13,997 |
| | 21 | % |
| Wealth management fees | | 3,615 |
| | 4,033 |
| | (10 | )% | | 11,682 |
| | 9,862 |
| | 18 | % |
| Derivative fees and other income | | 6,663 |
| | 5,791 |
| | 15 | % | | 12,934 |
| | 9,778 |
| | 32 | % |
| Net gains on sales of loans | | 2,361 |
| | 2,158 |
| | 9 | % | | 6,660 |
| | 6,965 |
| | (4 | )% |
| Net gains on sales of available-for-sale investment securities | | 1,539 |
| | 1,790 |
| | (14 | )% | | 6,733 |
| | 8,468 |
| | (20 | )% |
| Net gains on sales of fixed assets | | 1,043 |
| | 486 |
| | 115 | % | | 74,092 |
| | 2,916 |
| | NM |
|
| Net gain on sale of business | | 3,807 |
| | — |
| | NM |
| | 3,807 |
| | — |
| | NM |
|
| Other fees and operating income | | 3,652 |
| | 7,632 |
| | (52 | )% | | 15,255 |
| | 19,745 |
| | (23 | )% |
| Total noninterest income | | $ | 49,624 |
| | $ | 49,341 |
| | 1 | % | | $ | 213,047 |
| | $ | 134,118 |
| | 59 | % |
| |
| | | | | | | | | | | | | | | | | | | | | | | | | | | | | | | | |
|
| ($ in thousands) | | Three Months Ended March 31, | | |
| 2021 | | 2020 | | Change from 2020 | | | | | | |
| | | $ | | % | | | | | | |
| Lending fees | | $ | 18,357 | | | $ | 15,773 | | | $ | 2,584 | | | 16 | % | | | | | | |
| Deposit account fees | | 15,383 | | | 10,447 | | | 4,936 | | | 47 | % | | | | | | |
| Interest rate contracts and other derivative income | | 16,997 | | | 7,073 | | | 9,924 | | | 140 | % | | | | | | |
| Foreign exchange income | | 9,526 | | | 7,819 | | | 1,707 | | | 22 | % | | | | | | |
| Wealth management fees | | 6,911 | | | 5,353 | | | 1,558 | | | 29 | % | | | | | | |
| Net gains on sales of loans | | 1,781 | | | 950 | | | 831 | | | 87 | % | | | | | | |
| Gains on sales of AFS debt securities | | 192 | | | 1,529 | | | (1,337) | | | (87) | % | | | | | | |
| | | | | | | | | | | | | | |
| | | | | | | | | | | | | | |
| Other investment income | | 925 | | | 3,378 | | | (2,453) | | | (73) | % | | | | | | |
| Other income | | 2,794 | | | 3,184 | | | (390) | | | (12) | % | | | | | | |
| Total noninterest income | | $ | 72,866 | | | $ | 55,506 | | | $ | 17,360 | | | 31 | % | | | | | | |
|
NM Not Meaningful.
The following discussion providesNoninterest income comprised 17% and 13% of total revenue for the compositionfirst quarters of the major changes in2021 and 2020, respectively. First quarter of 2021 noninterest income and the factors contributing to the changes.
Net gains on saleswas $72.9 million, an increase of fixed assets increased $71.2$17.4 million to $74.1 million for the nine months ended September 30, 2017,or 31%, compared to $2.9with $55.5 million for the same period in 2016. This2020. The increase was primarily due to the $71.7interest rate contracts and other derivative income, deposit account fees, and lending fees, partially offset by a decrease in other investment income.
Lending fees were $18.4 million of pre-tax gain recognized from the sale of the commercial property in California duringfor the first quarter of 2017. In the first quarter2021, an increase of 2017, East West Bank completed the sale and leaseback of a commercial property in California for cash consideration of $120.6 million and entered into a lease agreement for part of the property, consisting of a retail branch and office facilities. The total pre-tax profit from the sale was $85.4 million, of which $71.7 million was recognized in the first quarter of 2017, and $13.7 million was deferred and recognized over the term of the lease agreement.
In the third quarter of 2017, the Company sold its insurance brokerage business, EWIS, for $4.3 million and recognized a pre-tax gain of $3.8 million.
Other fees and operating income decreased $4.0$2.6 million or 52% to $3.7 million for the three months ended September 30, 2017 from $7.616%, compared with $15.8 million for the same period in 2016, and decreased $4.5 million or 23%2020. The increase was primarily due to $15.3an increase in letter of credit issuance fees.
Deposit account fees were $15.4 million for the nine months ended September 30, 2017 from $19.7first quarter of 2021, an increase of $5.0 million or 47%, compared with $10.4 million for the same period in 2016.2020. The $4.0increase was primarily due to an increase in customer-driven transactions.
Interest rate contracts and other derivative income was $17.0 million decrease forthe three months ended September 30, 2017,first quarter of 2021, an increase of $9.9 million or 140%, compared towith $7.1 million for the same period in 2016,2020. The increase was mainly attributableprimarily due to decreases in rentalfavorable credit valuation adjustments, partially offset by lower transaction volumes.
Other investment income as a result of the commercial property sale duringwas $925 thousand for the first quarter of 2017, and decreases in dividend income from other investments. The $4.52021, a decrease of $2.5 million decreaseor 73%, compared with $3.4 million for the nine months ended September 30, 2017, compared to the same period in 2016,2020. The decrease was largelyprimarily due to a decreasedecreased distributions from investments in rental income as a result of sale of the commercial property during the first quarter of 2017.qualified affordable housing partnerships and lower unrealized gains on mutual funds.
Noninterest Expense
NoninterestThe following table presents the components of noninterest expense totaled $164.5 million for the three months ended September 30, 2017, a decreasefirst quarters of $6.02021 and 2020:
| | | | | | | | | | | | | | | | | | | | | | | | | | | | | | | | |
|
| ($ in thousands) | | Three Months Ended March 31, | | |
| 2021 | | 2020 | | Change from 2020 | | | | | | |
| | | $ | | % | | | | | | |
| Compensation and employee benefits | | $ | 107,808 | | | $ | 101,960 | | | $ | 5,848 | | | 6 | % | | | | | | |
| Occupancy and equipment expense | | 15,922 | | | 17,076 | | | (1,154) | | | (7) | % | | | | | | |
| Deposit insurance premiums and regulatory assessments | | 3,876 | | | 3,427 | | | 449 | | | 13 | % | | | | | | |
| Deposit account expense | | 3,892 | | | 3,563 | | | 329 | | | 9 | % | | | | | | |
| Data processing | | 4,478 | | | 3,826 | | | 652 | | | 17 | % | | | | | | |
| Computer software expense | | 7,159 | | | 6,166 | | | 993 | | | 16 | % | | | | | | |
| Consulting expense | | 1,475 | | | 1,217 | | | 258 | | | 21 | % | | | | | | |
| Legal expense | | 1,502 | | | 3,197 | | | (1,695) | | | (53) | % | | | | | | |
| Other operating expense | | 19,607 | | | 21,119 | | | (1,512) | | | (7) | % | | | | | | |
| Amortization of tax credit and other investments | | 25,358 | | | 18,782 | | | 6,576 | | | 35 | % | | | | | | |
| | | | | | | | | | | | | | |
| | | | | | | | | | | | | | |
| Total noninterest expense | | $ | 191,077 | | | $ | 180,333 | | | $ | 10,744 | | | 6 | % | | | | | | |
Efficiency ratio (1) | | 44.79 | % | | 43.12 | % | | | | | | | | | | |
|
(1)Refer to Item 2. MD&A — Reconciliation of GAAP to Non-GAAP Financial Measures in this Form 10-Q for the detailed calculation of GAAP and non-GAAP efficiency ratios.
First quarter of 2021 noninterest expense was $191.1 million, an increase of $10.8 million or 4%6%, compared to $170.5with $180.3 million for the same period in 2016.2020. This decreaseincrease was primarily due to an $8.8 million decreaseincreases in amortization of tax credit and other investments, and a $2.0 million decrease in legal expense, partially offset by a $4.5 million increase in compensation and employee benefits. Noninterest expense totaled $486.7
Compensation and employee benefits were $107.8 million for the nine months ended September 30, 2017,first quarter of 2021, an increase of $20.7$5.8 million or 4%6%, compared to $466.0with $102.0 million for the same period in 2016. This2020. The year-over-year increase was primarily due to a $24.8 million increase in compensation and employee benefits and a $5.3 million increase in amortization of tax credit and other investments, partially offset by an $8.3 million decrease in consulting expense and a $3.8 million decrease in legal expense.
The following table presents the various components of noninterest expense for the periods indicated:
|
| | | | | | | | | | | | | | | | | | | | | | |
| |
| | | Three Months Ended
September 30, | | Nine Months Ended
September 30, |
| ($ in thousands) | | 2017 | | 2016 | | % Change | | 2017 | | 2016 | | % Change |
| Compensation and employee benefits | | $ | 79,583 |
| | $ | 75,042 |
| | 6 | % | | $ | 244,930 |
| | $ | 220,166 |
| | 11 | % |
| Occupancy and equipment expense | | 16,635 |
| | 15,456 |
| | 8 | % | | 47,829 |
| | 45,619 |
| | 5 | % |
| Deposit insurance premiums and regulatory assessments | | 5,676 |
| | 6,450 |
| | (12 | )% | | 17,384 |
| | 17,341 |
| | — | % |
| Legal expense | | 3,316 |
| | 5,361 |
| | (38 | )% | | 8,930 |
| | 12,714 |
| | (30 | )% |
| Data processing | | 3,004 |
| | 2,729 |
| | 10 | % | | 9,009 |
| | 8,712 |
| | 3 | % |
| Consulting expense | | 4,087 |
| | 4,594 |
| | (11 | )% | | 10,775 |
| | 19,027 |
| | (43 | )% |
| Deposit related expenses | | 2,413 |
| | 3,082 |
| | (22 | )% | | 7,283 |
| | 7,675 |
| | (5 | )% |
| Computer software expense | | 4,393 |
| | 3,331 |
| | 32 | % | | 13,823 |
| | 9,267 |
| | 49 | % |
| Other operating expense | | 19,830 |
| | 19,814 |
| | — | % | | 55,357 |
| | 58,508 |
| | (5 | )% |
| Amortization of tax credit and other investments | | 23,827 |
| | 32,618 |
| | (27 | )% | | 66,059 |
| | 60,779 |
| | 9 | % |
| Amortization of core deposit intangibles | | 1,735 |
| | 2,023 |
| | (14 | )% | | 5,314 |
| | 6,177 |
| | (14 | )% |
| Total noninterest expense | | $ | 164,499 |
| | $ | 170,500 |
| | (4 | )% | | $ | 486,693 |
| | $ | 465,985 |
| | 4 | % |
| |
The following provides a discussion of the major changes in noninterest expense and the factors contributing to the changes.
Compensation and employee benefits increased $4.5 million or 6% to $79.6 million for the three months ended September 30, 2017, compared to $75.0 million for the same period in 2016, and increased $24.8 million or 11% to $244.9 million for the nine months ended September 30, 2017, compared to $220.2 million for the same period in 2016. The increases for the three and nine months ended September 30, 2017 were primarily attributablerelated to an increase in headcount to support the Company’s growing business and risk management and compliance requirements, as well as additional severance expenses.bonus accrual.
Amortization of tax credit and other investments decreased $8.8 million or 27% to $23.8was $25.4 million for the three months ended September 30, 2017,first quarter of 2021, an increase of $6.6 million or 35%, compared to $32.6with $18.8 million for the same period in 2016,2020. The year-over-year increase was primarily due to new tax credit investments that were placed in service during the first quarter of 2021.
Efficiency ratio, calculated as noninterest expense divided by total revenue, was 44.79% and increased $5.3 million or 9% to $66.1 million43.12% for the nine months ended September 30, 2017, compared to $60.8 millionfirst quarters of 2021 and 2020, respectively. Non-GAAP efficiency ratio, adjusted for the amortization of tax credit and other investments and the amortization of core deposit intangibles, was 38.68% for the first quarter of 2021, an increase of 28 basis points from 38.40% for the same period in 2016. The decrease 2020. For additional details, see the reconciliations of non-GAAP measures presented under Item 2. MD&A — Reconciliation of GAAP to Non-GAAP Financial Measures in the third quarter of 2017, compared with the prior year period, was mainly driven by higher amortization, which resulted from a renewable energy tax credit investment newly placed in service in the third quarter of 2016. Likewise, the increase in the first nine months of 2017, compared with the prior year period, was primarily driven by additional renewable energy and historical rehabilitation tax credit investments placed in service during the nine months ended September 30, 2017.this Form 10-Q.
Legal expense decreased $2.0 million or 38% to $3.3 million for the three months ended September 30, 2017, compared to $5.4 million for the same period in 2016, and decreased $3.8 million or 30% to $8.9 million for the nine months ended September 30, 2017, compared to $12.7 million for the same period in 2016. The decreases for the three and nine months ended September 30, 2017 were predominantly due to lower legal fees and litigation expense following the resolution of previously outstanding litigation.
Consulting expense decreased $507 thousand or 11% to $4.1 million for the three months ended September 30, 2017, compared to $4.6 million for the same period in 2016, and decreased $8.3 million or 43% to $10.8 million for the nine months ended September 30, 2017, compared to $19.0 million for the same period in 2016. The decreases for both periods were primarily attributable to a decline in Bank Secrecy Act (“BSA”) and Anti-Money Laundering (“AML”) related consulting expense.
Income Taxes
| | | | | | | | | | | | | | | | | | | | | | | | | | | | | | | | |
|
| ($ in thousands) | | Three Months Ended March 31, | | | | |
| 2021 | | 2020 | | % Change | | | | | | | | | | | | |
| Income before income taxes | | $ | 235,484 | | | $ | 164,010 | | | 44 | % | | | | | | | | | | | | |
| Income tax expense | | $ | 30,490 | | | $ | 19,186 | | | 59 | % | | | | | | | | | | | | |
| Effective tax rate | | 12.9 | % | | 11.7 | % | | | | | | | | | | | | | | |
|
Income tax expense was $42.6$30.5 million and $140.2 million for the three and nine months ended September 30, 2017, respectively, compared to $13.3 million and $90.1 million, respectively, for the same periods in 2016. The effective tax rate was 24.3% and 25.0%12.9% for the threefirst quarter of 2021, compared with first quarter 2020 income tax expense of $19.2 million and nine months ended September 30, 2017, respectively, compared to 10.8% and 21.9%, respectively,effective tax rate of 11.7%. The increase in effective tax rate for the same periods in 2016.
The higher effective tax rates for the three and nine months ended September 30, 2017,first quarter of 2021, compared towith the same periodsperiod in 2016, were mainly2020 was primarily due to higher projectedan increase in income before income taxes, that was partially offset by increasesa year-over-year increase in investments in tax credits primarily generated from investments in renewable energy, historic rehabilitation and affordable housing partnership projects. For the three and nine months ended September 30, 2017, tax credits generated from these investments were $40.0 million and $106.4 million, respectively, compared to $33.3 million and $83.7 million, respectively, for the same periods in 2016. In addition, the effective tax rates for the three and nine months ended September 30, 2017 were further reduced by the adoption of Accounting Standards Update (“ASU”) 2016-09, Compensation — Stock Compensation (Topic 718): Improvements to Employee Share-Based Payment Accounting, beginning January 1, 2017. As a result of the adoption of this ASU, net excess tax benefits for restricted stock units of $151 thousand and $4.6 million were recognized in Income tax expense on the Consolidated Statements of Income during the three and nine months ended September 30, 2017, respectively, which partially offset the higher effective tax rates for the same periods.other investments.
Management regularly reviews the Company’s tax positions and deferred tax assets. Factors considered in this analysis include the Company’s ability to generate future taxable income, implement tax-planning strategies and utilize taxable income from prior carryback years (if such carryback is permitted under the applicable tax law), as well as future reversals of existing taxable temporary differences. The Company accounts for income taxes using the asset and liability approach, the objective of which is to establish deferred tax assets and liabilities for the temporary differences between the financial reporting basis and the tax basis of the Company’s assets and liabilities at enacted tax rates expected to be in effect when such amounts are realized and settled. As of September 30, 2017 and December 31, 2016, the Company had net deferred tax assets of $142.0 million and $129.7 million, respectively.
A valuation allowance is established for deferred tax assets if, based on the weight of all positive evidence against all negative evidence, it is more likely than not that some portion or all of the deferred tax assets will not be realized. A valuation allowance is used, as needed, to reduce the deferred tax assets to the amount that is more likely than not to be realized. Management has concluded that it is more likely than not that all of the benefits of the deferred tax assets will be realized, with the exception of the deferred tax assets related to net operating losses in certain states. Accordingly, a valuation allowance has been recorded for these amounts. The Company believes that adequate provisions have been made for all income tax uncertainties consistent with ASC 740-10, Income Taxes.
Operating Segment Results
The Company definesorganizes its operating segments based on its core strategy and has identifiedoperations into three reportable operating segments: Retail Banking,(1) Consumer and Business Banking; (2) Commercial BankingBanking; and (3) Other.
These segments are defined by the type of customers served and the related products and services provided. The Retail Banking segment focuses primarily on retail operations throughsegments reflect how financial information is currently evaluated by management. For additional description of the Bank’s branch network. The Commercial Banking segment, which includes commercial and industrial (“C&I”) and commercial real estate (“CRE”) operations, primarily generates commercial loans and deposits through domestic commercial lending offices located in California, New York, Texas, Washington, Massachusetts, Nevada and Georgia, and foreign commercial lending offices located in China and Hong Kong. Furthermore, the Commercial Banking segment offers a wide variety of international finance, trade finance, and cashCompany’s internal management services and products. The remaining centralized functions,reporting process, including the treasury activitiessegment cost allocation methodology, see Note 14 — Business Segments to the Consolidated Financial Statements in this Form 10-Q.
Segment net interest income represents the difference between actual interest earned on assets and interest incurred on liabilities of the Company and eliminations of inter-segment amounts have been aggregated and included insegment, adjusted for funding charges or credits through the “Other” segment, which provides broad administrative support to the two core segments.
Changes in the Company’s management structure or reporting methodologies may result in changes in the measurement of operating segment results. Results for prior periods are generally restated for comparability when there are changes in management structure or reporting methodologies, unless it is deemed not practicable to do so.
The Company’s internal funds transfer pricing process is formulated with the goal of encouraging loan and deposit growth that is consistent with the Company’s overall profitability objectives, as well as to provide a reasonable and consistent basis for the measurement of its business segments and product net interest margins. The Company’s internal funds transfer pricing assumptions and methodologies are reviewed at least annually to ensure that the process is reflective of current market conditions. (“FTP”) process.
Note 15 — Business Segments to the Consolidated Financial Statements describes the Company’s segment reporting methodology and the business activities of each business segment, and presents financial results of these business segments for the three and nine months ended September 30, 2017 and 2016.
The following tables presenttable presents the selectedresults by operating segment for the periods indicated:
| | | | | | | | | | | | | | | | | | | | | | | | | | | | | | | | | | | | | | |
|
| ($ in thousands) | | Three Months Ended March 31, |
| Consumer and Business Banking | | Commercial Banking | | Other |
| 2021 | | 2020 | | 2021 | | 2020 | | 2021 | | 2020 |
| Total revenue | | $ | 170,727 | | | $ | 168,993 | | | $ | 227,102 | | | $ | 215,957 | | | $ | 28,732 | | | $ | 33,263 | |
| (Reversal of) provision for credit losses | | (4,249) | | | 7,788 | | | 4,249 | | | 66,082 | | | — | | | — | |
| | | | | | | | | | | | |
| | | | | | | | | | | | |
| | | | | | | | | | | | |
| | | | | | | | | | | | |
| | | | | | | | | | | | |
| | | | | | | | | | | | |
| | | | | | | | | | | | |
| | | | | | | | | | | | |
| | | | | | | | | | | | |
| | | | | | | | | | | | |
| | | | | | | | | | | | |
| | | | | | | | | | | | |
| | | | | | | | | | | | |
| | | | | | | | | | | | |
| | | | | | | | | | | | |
| | | | | | | | | | | | |
| | | | | | | | | | | | |
| | | | | | | | | | | | |
| | | | | | | | | | | | |
| | | | | | | | | | | | |
| | | | | | | | | | | | |
| | | | | | | | | | | | |
| | | | | | | | | | | | |
| Noninterest expense | | 89,286 | | | 86,964 | | | 69,257 | | | 70,126 | | | 32,534 | | | 23,243 | |
| Segment income (loss) before income taxes | | 85,690 | | | 74,241 | | | 153,596 | | | 79,749 | | | (3,802) | | | 10,020 | |
| | | | | | | | | | | | |
| Segment net income | | $ | 61,378 | | | $ | 53,195 | | | $ | 110,080 | | | $ | 57,131 | | | $ | 33,536 | | | $ | 34,498 | |
|
Consumer and Business Banking
The Consumer and Business Banking segment primarily provides financial products and services to consumer and commercial customers through the Company’s domestic branch network. This segment offers consumer and commercial deposits, mortgage and home equity loans, and other products and services. It also originates commercial loans for small- and medium-sized enterprises. Other products and services provided by this segment include wealth management, treasury management and foreign exchange services. The integration of digital channels and our brick and mortar channels has been a priority for the Bank. The Company is developing a digital consumer banking platform to enhance the customer user experience and offer a full suite of banking services. Customer adoption of the digital banking application is in progress, and has contributed to growth in segment fee income and deposit growth.
The following table presents additional financial information for the threeConsumer and nine months ended September 30, 2017 and 2016:
|
| | | | | | | | | | | | | | | | |
| |
| ($ in thousands) | | Three Months Ended September 30, 2017 |
| | Retail Banking | | Commercial Banking | | Other | | Total |
| Net interest income | | $ | 147,457 |
| | $ | 138,153 |
| | $ | 17,545 |
| | $ | 303,155 |
|
| Noninterest income | | $ | 16,218 |
| | $ | 30,320 |
| | $ | 3,086 |
| | $ | 49,624 |
|
| Noninterest expense | | $ | 56,062 |
| | $ | 45,686 |
| | $ | 62,751 |
| | $ | 164,499 |
|
| Pre-tax income | | $ | 68,554 |
| | $ | 99,025 |
| | $ | 7,705 |
| | $ | 175,284 |
|
| | | |
|
| | | | | | | | | | | | | | | | |
| | | |
| ($ in thousands) | | Three Months Ended September 30, 2016 |
| | Retail Banking | | Commercial Banking | | Other | | Total |
| Net interest income | | $ | 106,633 |
| | $ | 131,340 |
| | $ | 16,175 |
| | $ | 254,148 |
|
| Noninterest income | | $ | 14,700 |
| | $ | 26,218 |
| | $ | 8,423 |
| | $ | 49,341 |
|
| Noninterest expense | | $ | 55,942 |
| | $ | 45,306 |
| | $ | 69,252 |
| | $ | 170,500 |
|
| Pre-tax income | | $ | 32,304 |
| | $ | 80,393 |
| | $ | 10,767 |
| | $ | 123,464 |
|
| | | |
|
| | | | | | | | | | | | | | | | |
| | | |
| ($ in thousands) | | Nine Months Ended September 30, 2017 |
| | Retail Banking | | Commercial Banking | | Other | | Total |
| Net interest income | | $ | 430,437 |
| | $ | 408,570 |
| | $ | 26,361 |
| | $ | 865,368 |
|
| Noninterest income | | $ | 43,767 |
| | $ | 82,645 |
| | $ | 86,635 |
| | $ | 213,047 |
|
| Noninterest expense | | $ | 181,811 |
| | $ | 149,510 |
| | $ | 155,372 |
| | $ | 486,693 |
|
| Pre-tax income | | $ | 204,601 |
| | $ | 284,195 |
| | $ | 72,177 |
| | $ | 560,973 |
|
| | | |
|
| | | | | | | | | | | | | | | | |
| | | |
| ($ in thousands) | | Nine Months Ended September 30, 2016 |
| | Retail Banking | | Commercial Banking | | Other | | Total |
| Net interest income | | $ | 329,120 |
| | $ | 389,559 |
| | $ | 41,257 |
| | $ | 759,936 |
|
| Noninterest income | | $ | 37,798 |
| | $ | 70,450 |
| | $ | 25,870 |
| | $ | 134,118 |
|
| Noninterest expense | | $ | 173,337 |
| | $ | 145,695 |
| | $ | 146,953 |
| | $ | 465,985 |
|
| Pre-tax income | | $ | 114,513 |
| | $ | 268,401 |
| | $ | 28,137 |
| | $ | 411,051 |
|
| | | |
RetailBusiness Banking
The Retail Banking segment reported pre-tax income of $68.6 million and $204.6 million for the three and nine months ended September 30, 2017, respectively, compared to $32.3 million and $114.5 million, respectively, for the same periods in 2016. The increases in pre-tax income for this segment for the three and nine months ended September 30, 2017,periods indicated:
| | | | | | | | | | | | | | | | | | | | | | | | | | |
|
| ($ in thousands) | | Three Months Ended March 31, |
| | | | | Change from 2020 |
| 2021 | | 2020 | | $ | | % |
| Net interest income before provision for credit losses | | $ | 149,899 | | | $ | 152,591 | | | $ | (2,692) | | | (2) | % |
| Noninterest income | | 20,828 | | | 16,402 | | | 4,426 | | | 27 | % |
| Total revenue | | 170,727 | | | 168,993 | | | 1,734 | | | 1 | % |
| (Reversal of) provision for credit losses | | (4,249) | | | 7,788 | | | (12,037) | | | (155) | % |
| Noninterest expense | | 89,286 | | | 86,964 | | | 2,322 | | | 3 | % |
| Segment income before income taxes | | 85,690 | | | 74,241 | | | 11,449 | | | 15 | % |
| Income tax expense | | 24,312 | | | 21,046 | | | 3,266 | | | 16 | % |
| Segment net income | | $ | 61,378 | | | $ | 53,195 | | | $ | 8,183 | | | 15 | % |
| Average loans | | $ | 13,300,153 | | | $ | 11,269,489 | | | $ | 2,030,664 | | | 18 | % |
| Average deposits | | $ | 30,224,844 | | | $ | 25,593,064 | | | $ | 4,631,780 | | | 18 | % |
|
Segment net income increased $8.2 million or 15% to$61.4 million during the first quarter of 2021, compared towith $53.2 million in the same periodsperiod in 2016, were2020, primarily driven by an increase in net interestdue to lower provision for credit losses and higher noninterest income, partially offset by lower net interest income before provision for credit losses and an increase in income tax expense. The increase in income tax expense reflected higher segment income before income taxes.
Net interest income before provision for credit losses.
Net interest income for this segment increased $40.8losses decreased $2.7 million or 38%2% to $147.5$149.9 million forduring the three months ended September 30, 2017,first quarter of 2021, compared to $106.6with $152.6 million forin the same period in 2016. Net2020, primarily reflecting a lower credit assigned to deposits under the FTP system in a near-zero interest income increased $101.3rate environment.
The Consumer and Business Banking segment recorded a $4.2 million or 31% to $430.4reversal of provision for credit losses during the first quarter of 2021, compared with a $7.8 million provision for the nine months ended September 30, 2017, compared to $329.1 million forcredit losses recorded in the same period in 2016.2020. The increasesyear-over-year decrease in net interestthe provision for credit losses was primarily driven by improved macroeconomic conditions and outlook.
First quarter of 2021 noninterest income for the three and nine months ended September 30, 2017, compared to the same periods in 2016, were primarily due to the growth in core deposits for the segment, for which the segment receives interest income credit under the Bank’s internal funds transfer pricing system.
Noninterest income for this segment increased $1.5$4.4 million or 10%27% to $16.2$20.8 million, for the three months ended September 30, 2017, compared to $14.7with $16.4 million forin the same period in 2016. Noninterest income increased $6.0 million or 16% to $43.8 million for the nine months ended September 30, 2017, compared to $37.8 million for the same period in 2016.2020. The increase was primarily driven by increases in noninterest income for the three and nine months ended September 30, 2017, compared to the same periods in 2016, were primarily attributable to increases in branchdeposit account fees, derivative fees and other income, wealth management fees and net gains on sales of loans. This was partially offset by a decrease in ancillary loan fees and other income.
Noninterest expense for this segment increased slightly by $120 thousand to $56.1 million for the three months ended September 30, 2017, compared to $55.9 million for the same period in 2016. Noninterest expense increased $8.5 million or 5% to $181.8 million for the nine months ended September 30, 2017, compared to $173.3 million for the same period in 2016. The increases in noninterest expense for the three and nine months ended September 30, 2017, compared to the same periods in 2016, were primarilyforeign exchange income due to increases in compensation and employee benefits, occupancy and equipment expense, and data processing expense, partially offset by a decrease in consulting expense.higher customer-driven transactions.
Commercial Banking
The Commercial Banking segment reported pre-tax incomeprimarily generates commercial loans and deposits. Commercial loan products include commercial business loans and lines of $99.0 millioncredit, trade finance loans and $284.2 millionletters of credit, CRE loans, construction and land lending, affordable housing loans and letters of credit, asset-based lending, and equipment financing. Commercial deposit products and other financial services include treasury management, foreign exchange services, and interest rate and commodity risk hedging.
The following table presents additional financial information for Commercial Banking for the three and nine months ended September 30, 2017, respectively,periods indicated:
| | | | | | | | | | | | | | | | | | | | | | | | | | |
|
| ($ in thousands) | | Three Months Ended March 31, |
| | | | | Change from 2020 |
| 2021 | | 2020 | | $ | | % |
| Net interest income before provision for credit losses | | $ | 177,092 | | | $ | 183,501 | | | $ | (6,409) | | | (3) | % |
| Noninterest income | | 50,010 | | | 32,456 | | | 17,554 | | | 54 | % |
| Total revenue | | 227,102 | | | 215,957 | | | 11,145 | | | 5 | % |
| Provision for credit losses | | 4,249 | | | 66,082 | | | (61,833) | | | (94) | % |
| Noninterest expense | | 69,257 | | | 70,126 | | | (869) | | | (1) | % |
| Segment income before income taxes | | 153,596 | | | 79,749 | | | 73,847 | | | 93 | % |
| Income tax expense | | 43,516 | | | 22,618 | | | 20,898 | | | 92 | % |
| Segment net income | | $ | 110,080 | | | $ | 57,131 | | | $ | 52,949 | | | 93 | % |
| Average loans | | $ | 25,429,154 | | | $ | 23,884,479 | | | $ | 1,544,675 | | | 6 | % |
| Average deposits | | $ | 15,095,700 | | | $ | 9,175,430 | | | $ | 5,920,270 | | | 65 | % |
|
Segment net income increased $52.9 million or 93% to $110.1 million during the first quarter of 2021, compared to $80.4with $57.1 million and $268.4 million, respectively, forin the same periodsperiod in 2016. The increases in pre-tax2020, reflecting a lower provision for credit losses and higher noninterest income, for this segment for the three and nine months ended September 30, 2017, compared to the same periods in 2016, were attributable to increases inpartially offset by lower net interest income before provision for credit losses and noninterest income.an increase in income tax expense. The increase in income tax expense reflected higher segment income before income taxes.
Net interest income before provision for this segment increased $6.8credit losses decreased $6.4 million or 5%3% to $138.2$177.1 million during the first quarter of 2021, compared with $183.5 million in the same period in 2020, primarily driven by lower interest income earned on loans, partially offset by lower FTP charges assessed for loans due to the lower interest rate environment.
The first quarter of 2021 provision for credit losses for the three months ended September 30, 2017,Commercial Banking segment was $4.2 million, compared with $66.1 million in the same period of 2020. The year-over-year decrease in the provision for credit losses was primarily driven by improved macroeconomic conditions and outlook.
Noninterest income increased $17.6 million or 54% to $131.3$50.0 million in the first quarter 2021, compared with $32.5 million in the same period in 2020, primarily driven by higher interest rate contracts and other derivative income, deposit account fees and lending fees.
Other
Centralized functions, including the corporate treasury activities of the Company and eliminations of inter-segment amounts, have been aggregated and included in the Other segment, which provides broad administrative support to the two core segments, namely the Consumer and Business Banking and the Commercial Banking segments.
The following table presents additional financial information for the Other segment for the periods indicated:
| | | | | | | | | | | | | | | | | | | | | | | | | | |
|
| ($ in thousands) | | Three Months Ended March 31, |
| | | | | Change from 2020 |
| 2021 | | 2020 | | $ | | % |
| Net interest income before provision for credit losses | | $ | 26,704 | | | $ | 26,615 | | | $ | 89 | | | 0 | % |
| Noninterest income | | 2,028 | | | 6,648 | | | (4,620) | | | (69) | % |
| Total revenue | | 28,732 | | | 33,263 | | | (4,531) | | | (14) | % |
| | | | | | | | |
| Noninterest expense | | 32,534 | | | 23,243 | | | 9,291 | | | 40 | % |
| Segment (loss) income before income taxes | | (3,802) | | | 10,020 | | | (13,822) | | | (138) | % |
| Income tax benefit | | (37,338) | | | (24,478) | | | (12,860) | | | 53 | % |
| Segment net income | | $ | 33,536 | | | $ | 34,498 | | | $ | (962) | | | (3) | % |
| | | | | | | | |
| Average deposits | | $ | 2,527,171 | | | $ | 2,704,546 | | | $ | (177,375) | | | (7) | % |
|
Segment net income decreased $1.0 million or 3% to $33.5 million during the first quarter of 2021, compared with $34.5 million in the same period in 2020, primarily driven by higher noninterest expense and lower noninterest income.
Noninterest expense increased $9.3 million or 40% to $32.5 million during the first quarter of 2021, compared with $23.2 million in the same period in 2020, primarily reflecting higher amortization of tax credit and other investments.
Noninterest income decreased $4.6 million or 69% to $2.0 million compared with $6.6 million for the same period in 2016. Net interest2020, primarily reflecting decreases in other investment income, increased $19.0 million or 5% to $408.6 million for the nine months ended September 30, 2017, compared to $389.6 million for the same period in 2016. The increases in net interest income for the three and nine months ended September 30, 2017, compared to the same periods in 2016, were due to the growth in commercial loans and commercial core deposits, for which the segment receives interest income credit under the Bank’s internal funds transfer pricing system.
Noninterest income for this segment increased $4.1 million or 16% to $30.3 million for the three months ended September 30, 2017, compared to $26.2 million for the same period in 2016. Noninterest income increased $12.2 million or 17% to $82.6 million for the nine months ended September 30, 2017, compared to $70.5 million for the same period in 2016. The increases in noninterest income for the three and nine months ended September 30, 2017, compared to the same periods in 2016, were primarily due to a net gaingains on salesales of the Company’s insurance brokerage business, EWIS, during the three and nine months ended September 30, 2017, and increases in branch fees, ancillary loan fees and other income, as well as letters of credit feesAFS debt securities and foreign exchange income.
Noninterest
The income tax expense for thisor benefit in the Other segment increased slightly by $380 thousand to $45.7 million forconsists of the three months ended September 30, 2017, compared to $45.3 million for the same period in 2016. Noninterestremaining unallocated income tax expense increased $3.8 million or 3% to $149.5 million for the nine months ended September 30, 2017, compared to $145.7 million for the same period in 2016. The increases in noninterestbenefit after allocating income tax expense for the three and nine months ended September 30, 2017, compared to the same periods in 2016, were primarily duetwo core segments. Income tax expense is allocated to increases in compensationthe Consumer and employee benefits,Business Banking and consulting expense, partially offset by a decrease in legal expense.
Other
The Other segment includes the activities of the treasury function, which is responsible for liquidity and interest rate risk management of the Company, and supports the Retail Banking and Commercial Banking segments through internal funds transfer pricing credits and charges, which are included in net interest income. The Otherbased on statutory income tax rates, applied to segment reported pre-tax income of $7.7 million and $72.2 million for the three and nine months ended September 30, 2017, respectively, compared to $10.8 million and $28.1 million, respectively, for the same periods in 2016. The decrease in pre-taxbefore income for this segment for the three months ended September 30, 2017, compared to the same period in 2016, was primarily driven by decreases in noninterest income and internal funds transfer pricing credits, partially offset by a decrease in noninterest expense and an increase in net interest income. The increase in pre-tax income for this segment for the nine months ended September 30, 2017, compared to the same period in 2016, was primarily driven by an increase in noninterest income as the result of the net gain on sale of the commercial property, partially offset by a decrease in net interest income and an increase in noninterest expense.taxes.
Net interest income for this segment increased $1.4 million or 8% to $17.5 million for the three months ended September 30, 2017, compared to $16.2 million for the same period in 2016. Net interest income decreased $14.9 million or 36% to $26.4 million for the nine months ended September 30, 2017, compared to $41.3 million for the same period in 2016. The increase in net interest income for the three months ended September 30, 2017, compared to the same period in 2016, was primarily due to an increase in interest income from investments. The decrease in net interest income for the nine months ended September 30, 2017, compared to the same period in 2016, was due to increases in interest expense on borrowings and deposits.
Noninterest income for this segment decreased $5.3 million or 63% to $3.1 million for the three months ended September 30, 2017, compared to $8.4 million for the same period in 2016. Noninterest income increased $60.8 million or 235% to $86.6 million for the nine months ended September 30, 2017, compared to $25.9 million for the same period in 2016. The decrease in noninterest income for the three months ended September 30, 2017, compared to the same period in 2016, was primarily due to decreases in foreign exchange income arising from valuation changes associated with currency hedges and decreases in rental income. The increase in noninterest income for the nine months ended September 30, 2017, compared to the same period in 2016, was primarily due to the $71.7 million net gain on sale of the commercial property, as discussed in the Noninterest income section of MD&A.
Noninterest expense for this segment decreased $6.5 million or 9% to $62.8 million for the three months ended September 30, 2017, compared to $69.3 million for the same period in 2016. Noninterest expense increased $8.4 million or 6% to $155.4 million for the nine months ended September 30, 2017, compared to $147.0 million for the same period in 2016. The decrease in noninterest expense for the three months ended September 30, 2017, compared to the same period in 2016, was primarily attributable to a decrease of $8.8 million in amortization of tax credit and other investments, partially offset by increases of $2.5 million in compensation and employee benefits. The increase in noninterest expense for the nine months ended September 30, 2017, compared to the same period in 2016, was primarily attributable to increases of $5.3 million in amortization of tax credit and other investments, and $6.5 million in compensation and employee benefits.
Balance Sheet Analysis
The following is a discussion of the significant changes between September 30, 2017 and December 31, 2016.
Selected Consolidated Balance Sheets Data
|
| | | | | | | | | | | | | | | |
| | | | | |
| | | | | | | Change |
| ($ in thousands) | | September 30, 2017 | | December 31, 2016 | | $ | | % |
| | | (Unaudited) | | | | | | |
| ASSETS | | | | | | | | |
| Cash and cash equivalents | | $ | 1,736,749 |
| | $ | 1,878,503 |
| | $ | (141,754 | ) | | (8 | )% |
| Interest-bearing deposits with banks | | 404,946 |
| | 323,148 |
| | 81,798 |
| | 25 | % |
| Resale agreements | | 1,250,000 |
| | 2,000,000 |
| | (750,000 | ) | | (38 | )% |
| Available-for-sale investment securities, at fair value | | 2,956,776 |
| | 3,335,795 |
| | (379,019 | ) | | (11 | )% |
| Held-to-maturity investment security, at cost | | — |
| | 143,971 |
| | (143,971 | ) | | (100 | )% |
| Restricted equity securities, at cost | | 73,322 |
| | 72,775 |
| | 547 |
| | 1 | % |
| Loans held-for-sale | | 178 |
| | 23,076 |
| | (22,898 | ) | | (99 | )% |
| Loans held-for-investment (net of allowance for loan losses of $285,926 in 2017 and $260,520 in 2016) | | 28,239,431 |
| | 25,242,619 |
| | 2,996,812 |
| | 12 | % |
| Investments in qualified affordable housing partnerships, net | | 178,344 |
| | 183,917 |
| | (5,573 | ) | | (3 | )% |
| Investments in tax credit and other investments, net | | 203,758 |
| | 173,280 |
| | 30,478 |
| | 18 | % |
| Premises and equipment | | 131,311 |
| | 159,923 |
| | (28,612 | ) | | (18 | )% |
| Goodwill | | 469,433 |
| | 469,433 |
| | — |
| | — | % |
| Other assets | | 663,718 |
| | 782,400 |
| | (118,682 | ) | | (15 | )% |
| TOTAL | | $ | 36,307,966 |
| | $ | 34,788,840 |
| | $ | 1,519,126 |
| | 4 | % |
| LIABILITIES | | |
| | |
| | | |
|
|
| Customer deposits | | $ | 31,311,662 |
| | $ | 29,890,983 |
| | $ | 1,420,679 |
| | 5 | % |
| Short-term borrowings | | 24,813 |
| | 60,050 |
| | (35,237 | ) | | (59 | )% |
| FHLB advances | | 323,323 |
| | 321,643 |
| | 1,680 |
| | 1 | % |
| Repurchase agreements | | 50,000 |
| | 350,000 |
| | (300,000 | ) | | (86 | )% |
| Long-term debt | | 176,513 |
| | 186,327 |
| | (9,814 | ) | | (5 | )% |
| Accrued expenses and other liabilities | | 639,759 |
| | 552,096 |
| | 87,663 |
| | 16 | % |
| Total liabilities | | 32,526,070 |
| | 31,361,099 |
| | 1,164,971 |
| | 4 | % |
| STOCKHOLDERS’ EQUITY | | 3,781,896 |
| | 3,427,741 |
| | 354,155 |
| | 10 | % |
| TOTAL | | $ | 36,307,966 |
| | $ | 34,788,840 |
| | $ | 1,519,126 |
| | 4 | % |
| | | | | |
As of September 30, 2017, total assets were $36.31 billion, an increase of $1.52 billion or 4% from December 31, 2016. The predominant area of asset growth was in loans, which was driven by strong increases across all of the Company’s commercial and retail lines of business. These increases were partially offset by maturities of resale agreements, and decreases in investment securities, cash and cash equivalents, and other assets.
As of September 30, 2017, total liabilities were $32.53 billion, an increase of $1.16 billion or 4% from December 31, 2016, primarily due to increases in customer deposits, reflecting the continued strong growth from existing and new customers. This increase was partially offset by a decrease in repurchase agreements primarily due to an increase in resale agreements that were eligible for netting against repurchase agreements under ASC 210-20-45, Balance Sheet Offsetting.
Stockholders’ equity growth benefited primarily from $420.7 million in net income, partially offset by $87.6 million of cash dividends on common stock.
InvestmentDebt Securities
The Company aims to maintain an investmentmaintains a portfolio that consists of high quality and liquid debt securities with relatively shortmoderate durations to minimize overall interest rate and liquidity risks. The Company’s available-for-sale investmentdebt securities provide:
•interest income for earnings and yield enhancement;
•availability for funding needs arising during the normal course of business;
•the ability to execute interest rate risk management strategies duein response to changes in economic or market conditions, which influence loan origination, prepayment speeds, or deposit balancesconditions; and mix; and
•collateral to support pledging agreements as required and/or to enhance the Company’s borrowing capacity.
Held-to-maturity investment securityAvailable-for-Sale Debt Securities
During the first quarter of 2016, the Company securitized $201.7 million of multifamily residential loans and retained $160.1 million of the senior tranche of the resulting securities from the securitization as held-to-maturity, which is carried at amortized cost. The held-to-maturity investment security is a non-agency commercial mortgage-backed security maturing on April 25, 2046. During the third quarter of 2017, the Company transferred this non-agency commercial mortgage-backed security with a net carrying amount of $115.6 million from held-to-maturity to available-for-sale. The transfer reflects the Company’s intent to sell the security under active liquidity management.
Available-for-sale investment securities
As of September 30, 2017 and December 31, 2016, the Company’s available-for-sale investment securities portfolio was primarily comprised of U.S. government agency and U.S. government sponsored enterprise mortgage-backed securities, U.S. Treasury securities and foreign bonds. InvestmentDebt securities classified as available-for-saleAFS are carried at their estimated fair value with the corresponding changes in fair value recorded in Accumulated other comprehensive loss,income (loss), net of tax,, as a component of Stockholders’ equity on the Consolidated Balance Sheets.Sheet.
The following table presents the breakoutdistribution of the amortized cost andCompany’s AFS debt securities portfolio by fair value and percentage of available-for-sale investment securities by major categoriesfair value as of September 30, 2017March 31, 2021 and December 31, 2016:2020, and by credit ratings as of March 31, 2021:
| | | | | | | | | | | | | | | | | | | | | | | | | | | | | | | | | | | | | | | | | | | | | | | | | | | | | | | | | | | |
| |
| | March 31, 2021 | | December 31, 2020 | | | | | | Ratings as of March 31, 2021 (2) | |
| Fair
Value | | | % of Total | | Fair
Value | | | % of Total | | | | | | AAA/AA | | A | | BBB | | | | No Rating | |
| AFS debt securities: | | | | | | | | | | | | | | | | | | | | | | | | | |
| U.S. Treasury securities | | $ | 826,342 | | | | 11 | % | | $ | 50,761 | | | | 1 | % | | | | | | 100 | % | | — | % | | — | % | | | | — | % | |
| U.S. government agency and U.S. government-sponsored enterprise debt securities | | 1,194,005 | | | | 15 | % | | 814,319 | | | | 15 | % | | | | | | 100 | % | | — | % | | — | % | | | | — | % | |
| U.S. government agency and U.S. government-sponsored enterprise mortgage-backed securities | | 3,416,797 | | | | 44 | % | | 2,814,664 | | | | 51 | % | | | | | | 100 | % | | — | % | | — | % | | | | — | % | |
Municipal securities (1) | | 420,065 | | | | 5 | % | | 396,073 | | | | 7 | % | | | | | | 92 | % | | 4 | % | | — | % | | | | 4 | % | |
Non-agency mortgage-backed securities (1) | | 804,527 | | | | 10 | % | | 529,617 | | | | 10 | % | | | | | | 91 | % | | — | % | | — | % | | | | 9 | % | |
Corporate debt securities (1) | | 496,643 | | | | 6 | % | | 405,968 | | | | 7 | % | | | | | | — | % | | 28 | % | | 72 | % | | | | — | % | |
Foreign government bonds (1) | | 276,328 | | | | 4 | % | | 182,531 | | | | 3 | % | | | | | | 45 | % | | 55 | % | | — | % | | | | — | % | |
Asset-backed securities (1) | | 63,040 | | | | 1 | % | | 63,231 | | | | 1 | % | | | | | | 100 | % | | — | % | | — | % | | | | — | % | |
Collateralized loan obligations (CLOs) (1) | | 291,466 | | | | 4 | % | | 287,494 | | | | 5 | % | | | | | | 92 | % | | 8 | % | | — | % | | | | — | % | |
| Total AFS debt securities | | $ | 7,789,213 | | | | 100 | % | | $ | 5,544,658 | | | | 100 | % | | | | | | 90 | % | | 4 | % | | 5 | % | | | | 1 | % | |
| |
(1)There were no securities of a single non-federal governmental agency issuer that exceeded 10% of stockholder’s equity as of both March 31, 2021 and December 31, 2020.
(2)Primarily based upon the lowest of the credit ratings issued by Standard and Poor's (“S&P”), Moody’s Investors Service (“Moody’s”) or Fitch Ratings (“Fitch”). Rating percentages are allocated based on fair value.
|
| | | | | | | | | | | | | | | | |
| |
| ($ in thousands) | | September 30, 2017 | | December 31, 2016 |
| | Amortized Cost | | Fair Value | | Amortized Cost | | Fair Value |
| Available-for-sale investment securities: | | | | | | | | |
| U.S. Treasury securities | | $ | 533,035 |
| | $ | 526,332 |
| | $ | 730,287 |
| | $ | 720,479 |
|
| U.S. government agency and U.S. government sponsored enterprise debt securities | | 191,727 |
| | 189,185 |
| | 277,891 |
| | 274,866 |
|
| U.S. government agency and U.S. government sponsored enterprise mortgage-backed securities | | 1,475,969 |
| | 1,466,106 |
| | 1,539,044 |
| | 1,525,546 |
|
| Municipal securities | | 116,798 |
| | 117,242 |
| | 148,302 |
| | 147,654 |
|
| Non-agency residential mortgage-backed securities | | 9,680 |
| | 9,694 |
| | 11,592 |
| | 11,477 |
|
| Corporate debt securities | | 12,655 |
| | 11,942 |
| | 232,381 |
| | 231,550 |
|
| Foreign bonds | | 505,395 |
| | 489,140 |
| | 405,443 |
| | 383,894 |
|
Other securities (1) | | 147,504 |
| | 147,135 |
| | 40,501 |
| | 40,329 |
|
| Total available-for-sale investment securities | | $ | 2,992,763 |
| | $ | 2,956,776 |
| | $ | 3,385,441 |
| | $ | 3,335,795 |
|
| |
| |
(1) | During the third quarter of 2017, the Company transferred a non-agency commercial mortgage-backed security with a net carrying amount of $115.6 million from held-to-maturity to available-for-sale. |
The fair value of the available-for-sale investmentAFS debt securities totaled $2.96$7.79 billion as of September 30, 2017, compared to $3.34March 31, 2021, an increase of $2.24 billion or 40% from $5.54 billion as of December 31, 2016.2020. The decrease of $379.0 million or 11% primarily reflected the sales of corporate debt securities,largest changes came from U.S. Treasury securities, which increased $775.6 million, followed by U.S. government agency and U.S. government sponsoredgovernment-sponsored enterprise mortgage-backed securities, which increased $602.1 million, and municipal securities; and paydowns, maturities and calls of U.S. government agency and U.S. government sponsoredgovernment-sponsored enterprise mortgage-backeddebt securities, which increased $379.7 million.
The Company’s debt securities portfolio had an effective duration, defined as a change in the price of a portfolio due to a 100 basis point shift in the yield curve, of 6.3 as of March 31, 2021 which increased from 4.2 as of December 31, 2020, primarily due to an increase in the target duration of securities purchased to achieve enhancement in portfolio yield. As of March 31, 2021, 90% of the carrying value of the Company’s debt securities portfolio was rated “AA-” or “Aa3” or higher by nationally recognized credit rating agencies, compared with 88% as of December 31, 2020. The increase in higher-rated securities was primarily due to the growth in U.S. Treasury securities and U.S. government agency and U.S. government sponsored enterprise debt securities, and U.S. Treasury securities. The decrease was partially offset by purchases of U.S. government agency and U.S. government sponsoredgovernment-sponsored enterprise mortgage-backed securities foreign bonds, U.S. government agencywithin the portfolio mix. Credit ratings of BBB- or higher by S&P and U.S. government sponsored enterprise debt securities, U.S. Treasury securities and municipal securities; and the transfer of a non-agency commercial mortgage-backed security from held-to-maturity security.Fitch, or Baa3 or higher by Moody’s, are considered investment grade.
The Company’s available-for-sale investmentAFS debt securities are carried at fair value with changesnoncredit-related unrealized gains and losses, net of tax, reported in fair value reflected in Other comprehensive income (loss) unless a security is deemed to be other-than-temporarily impaired. Ason the Consolidated Statement of September 30, 2017, the Company’sComprehensive Income. Pre-tax net unrealized losses on available-for-sale investmentAFS debt securities were $36.0$115.3 million compared to $49.6as of March 31, 2021, a net change of $189.4 million from pre-tax net unrealized gains of $74.1 million as of December 31, 2016. The favorable2020. This change in the net unrealized losses was primarily attributeddue to the flatteningincreases in the yield curve with long-termbenchmark interest rates falling. Gross unrealized losses on available-for-sale investment securities totaled $42.3 million asand widening of September 30, 2017, compared to $56.3 million as of December 31, 2016.spreads. As of September 30, 2017,March 31, 2021, the Company had no intention to sell securities with unrealized losses and believesbelieved it is more likely than notmore-likely-than-not that it would not be required to sell such securities before recovery of their amortized cost. No other-than-temporarycosts.
Of the securities with gross unrealized losses, substantially all were rated investment grade as of both March 31, 2021 and December 31, 2020, as classified based upon the lowest of the credit ratings issued by S&P, Moody’s, or Fitch. The Company believes that the gross unrealized losses were due to non-credit related factors and the gross unrealized losses were primarily attributable to yield curve movement and widened spreads. The impact of the COVID-19 pandemic has been muted by the government’s aggressive monetary policy, including benchmark rate cuts, resulting in the overall recovery of the market to pre-pandemic levels. The Company believes that the credit support levels of the AFS debt securities are strong and, based on current assessments and macroeconomic forecasts, expects that full contractual cash flows will be received.
If a credit loss exists, the Company records an impairment wasrelated to credit losses through the allowance for credit losses with a corresponding Provision for credit losses on the Consolidated Statement of Income. There were no credit losses recognized in earnings for both the threefirst quarter of 2021 and nine months ended September 30, 20172020. The Company assesses individual securities for credit losses for each reporting period. For additional information of the Company’s accounting policies, valuation and 2016. For a complete discussioncomposition, see Note 1— Summary of Significant Accounting Policies to the Consolidated Financial Statements of the Company’s2020 Form 10-K and disclosure, see Note 43 — Fair Value Measurement and Fair Value of Financial Instruments, and Note 65 — Securities to the Consolidated Financial Statements.Statements in this Form 10-Q.
As of September 30, 2017 and December 31, 2016, available-for-sale investment securities with a fair value of $584.9 million and $767.4 million, respectively, were pledged to secure public deposits, repurchase agreements, the Federal Reserve Bank’s discount window and for other purposes required or permitted by law.
The following table presents the weighted averageweighted-average yields and contractual maturity distributions,distribution, excluding periodic principal payments, of the Company’s investmentAFS debt securities as of the periods indicated.March 31, 2021 and December 31, 2020. Actual maturities of mortgage-backedcertain securities can differ from contractual maturities as the borrowers have the right to prepay the obligations.obligations with or without prepayment penalties. In addition, factors such factors as prepayments and interest rate changesrates may affect the yields on the carrying valuevalues of mortgage-backedthese securities.
| | | | | | | | | | | | | | | | | | | | | | | | | | | | | | | | | | | | | | |
|
| ($ in thousands) | | March 31, 2021 | | December 31, 2020 |
| Amortized
Cost | | Fair
Value | | Yield (1) | | Amortized
Cost | | Fair
Value | | Yield (1) |
| AFS debt securities: | | | | | | | | | | | | |
| U.S. Treasury securities: | | | | | | | | | | | | |
| Maturing in one year or less | | $ | 50,213 | | | $ | 50,541 | | | 1.26 | % | | $ | 50,310 | | | $ | 50,761 | | | 1.26 | % |
| | | | | | | | | | | | |
| Maturing after five years through ten years | | 791,498 | | | 775,801 | | | 0.95 | % | | — | | | — | | | — | % |
| | | | | | | | | | | | |
| Total | | 841,711 | | | 826,342 | | | 0.97 | % | | 50,310 | | | 50,761 | | | 1.26 | % |
| U.S. government agency and U.S. government- sponsored enterprise debt securities: | | | | | | | | | | | | |
| Maturing in one year or less | | 1,068,821 | | | 1,024,439 | | | 1.86 | % | | 640,153 | | | 640,366 | | | 1.78 | % |
| Maturing after one year through five years | | 114,316 | | | 114,854 | | | 2.38 | % | | 118,053 | | | 122,012 | | | 2.38 | % |
| Maturing after five years through ten years | | 9,064 | | | 9,438 | | | 2.60 | % | | 11,091 | | | 11,697 | | | 2.54 | % |
| Maturing after ten years | | 44,245 | | | 45,274 | | | 2.58 | % | | 37,517 | | | 40,244 | | | 2.74 | % |
| Total | | 1,236,446 | | | 1,194,005 | | | 1.94 | % | | 806,814 | | | 814,319 | | | 1.92 | % |
| U.S. government agency and U.S. government- sponsored enterprise mortgage-backed securities: | | | | | | | | | | | | |
| Maturing in one year or less | | 10,578 | | | 10,679 | | | 2.77 | % | | 4,185 | | | 4,232 | | | 3.46 | % |
| Maturing after one year through five years | | 14,968 | | | 15,762 | | | 2.89 | % | | 21,566 | | | 22,668 | | | 2.72 | % |
| Maturing after five years through ten years | | 248,668 | | | 248,359 | | | 2.05 | % | | 216,332 | | | 222,905 | | | 2.17 | % |
| Maturing after ten years | | 3,175,669 | | | 3,141,997 | | | 1.76 | % | | 2,517,644 | | | 2,564,859 | | | 2.11 | % |
| Total | | 3,449,883 | | | 3,416,797 | | | 1.79 | % | | 2,759,727 | | | 2,814,664 | | | 2.12 | % |
Municipal securities (2): | | | | | | | | | | | | |
| Maturing in one year or less | | 18,598 | | | 18,777 | | | 2.98 | % | | 18,663 | | | 18,868 | | | 3.04 | % |
| Maturing after one year through five years | | 34,862 | | | 36,207 | | | 2.88 | % | | 36,000 | | | 37,716 | | | 2.89 | % |
| Maturing after five years through ten years | | 236,146 | | | 239,229 | | | 2.06 | % | | 230,851 | | | 239,883 | | | 2.07 | % |
| Maturing after ten years | | 128,070 | | | 125,852 | | | 2.05 | % | | 97,059 | | | 99,606 | | | 2.08 | % |
| Total | | 417,676 | | | 420,065 | | | 2.17 | % | | 382,573 | | | 396,073 | | | 2.20 | % |
| Non-agency mortgage-backed securities: | | | | | | | | | | | | |
| Maturing in one year or less | | 7,920 | | | 7,920 | | | 2.46 | % | | 7,920 | | | 7,920 | | | 0.63 | % |
| Maturing after one year through five years | | 62,606 | | | 62,771 | | | 3.81 | % | | 49,704 | | | 49,870 | | | 3.80 | % |
| Maturing after five years through ten years | | 60,517 | | | 60,524 | | | 1.11 | % | | 21,332 | | | 21,376 | | | 1.50 | % |
| Maturing after ten years | | 675,616 | | | 673,312 | | | 1.84 | % | | 444,529 | | | 450,451 | | | 2.48 | % |
| Total | | 806,659 | | | 804,527 | | | 1.95 | % | | 523,485 | | | 529,617 | | | 2.48 | % |
| Corporate debt securities: | | | | | | | | | | | | |
| Maturing in one year or less | | 156,306 | | | 145,377 | | | 1.81 | % | | 126,250 | | | 124,846 | | | 1.71 | % |
| Maturing after one year through five years | | 324,503 | | | 315,902 | | | 3.37 | % | | 276,073 | | | 277,103 | | | 3.56 | % |
| Maturing after five years through ten years | | 32,000 | | | 30,864 | | | 2.59 | % | | 4,000 | | | 4,019 | | | 4.50 | % |
| Maturing after ten years | | 4,500 | | | 4,500 | | | 3.50 | % | | — | | | — | | | — | % |
| Total | | 517,309 | | | 496,643 | | | 2.85 | % | | 406,323 | | | 405,968 | | | 2.99 | % |
| Foreign government bonds: | | | | | | | | | | | | |
| Maturing in one year or less | | 90,968 | | | 90,075 | | | 1.19 | % | | 45,681 | | | 45,655 | | | 0.85 | % |
| Maturing after one year through five years | | 137,132 | | | 136,106 | | | 2.41 | % | | 138,147 | | | 136,876 | | | 2.41 | % |
| Maturing after five years through ten years | | 50,000 | | | 50,147 | | | 0.39 | % | | — | | | — | | | — | % |
| Total | | 278,100 | | | 276,328 | | | 1.65 | % | | 183,828 | | | 182,531 | | | 2.02 | % |
| Asset-backed securities: | | | | | | | | | | | | |
| Maturing after ten years | | 62,762 | | | 63,040 | | | 0.80 | % | | 63,463 | | | 63,231 | | | 0.85 | % |
| | | | | | | | | | | | |
| CLOs: | | | | | | | | | | | | |
| Maturing after ten years | | 294,000 | | | 291,466 | | | 1.35 | % | | 294,000 | | | 287,494 | | | 1.34 | % |
| Total AFS debt securities | | $ | 7,904,546 | | | $ | 7,789,213 | | | 1.80 | % | | $ | 5,470,523 | | | $ | 5,544,658 | | | 2.13 | % |
| | | | | | | | | | | | |
| Total aggregated by maturities: | | | | | | | | | | | | |
| Maturing in one year or less | | $ | 1,403,404 | | | $ | 1,347,808 | | | 1.82 | % | | $ | 893,162 | | | $ | 892,648 | | | 1.72 | % |
| Maturing after one year through five years | | 688,387 | | | 681,602 | | | 3.02 | % | | 639,543 | | | 646,245 | | | 3.05 | % |
| Maturing after five years through ten years | | 1,427,893 | | | 1,414,362 | | | 1.36 | % | | 483,606 | | | 499,880 | | | 2.12 | % |
| Maturing after ten years | | 4,384,862 | | | 4,345,441 | | | 1.75 | % | | 3,454,212 | | | 3,505,885 | | | 2.08 | % |
| Total AFS debt securities | | $ | 7,904,546 | | | $ | 7,789,213 | | | 1.80 | % | | $ | 5,470,523 | | | $ | 5,544,658 | | | 2.13 | % |
|
(1)Weighted-average yields are computed based on amortized cost balances.
(2)Yields on tax-exempt securities are not presented on a tax-equivalent basis.
|
| | | | | | | | | | | | | | | | | | | | | | |
| |
| ($ in thousands) | | September 30, 2017 | | December 31, 2016 |
| | Amortized
Cost | | Fair Value | | Yield (1) | | Amortized
Cost | | Fair Value | | Yield (1) |
| Available-for-sale investment securities: | | | | | | | | | | | | |
| U.S. Treasury securities: | | | | | | | | | | | | |
| Maturing in one year or less | | $ | 150,431 |
| | $ | 150,134 |
| | 0.96 | % | | $ | 100,707 |
| | $ | 100,653 |
| | 0.65 | % |
| Maturing after one year through five years | | 382,604 |
| | 376,198 |
| | 1.35 | % | | 376,580 |
| | 371,917 |
| | 1.27 | % |
| Maturing after five years through ten years | | — |
| | — |
| | — | % | | 253,000 |
| | 247,909 |
| | 1.59 | % |
| Total | | 533,035 |
| | 526,332 |
| | 1.24 | % | | 730,287 |
| | 720,479 |
| | 1.29 | % |
| U.S. government agency and U.S. government sponsored enterprise debt securities: | | | | | | | | | | | | |
| Maturing in one year or less | | 24,999 |
| | 24,916 |
| | 1.02 | % | | 118,966 |
| | 118,982 |
| | 0.94 | % |
| Maturing after one year through five years | | 9,732 |
| | 9,774 |
| | 2.37 | % | | 52,622 |
| | 52,630 |
| | 1.38 | % |
| Maturing after five years through ten years | | 103,394 |
| | 101,030 |
| | 2.19 | % | | 81,829 |
| | 78,977 |
| | 2.07 | % |
| Maturing after ten years | | 53,602 |
| | 53,465 |
| | 2.58 | % | | 24,474 |
| | 24,277 |
| | 2.50 | % |
| Total | | 191,727 |
| | 189,185 |
| | 2.15 | % | | 277,891 |
| | 274,866 |
| | 1.49 | % |
| U.S. government agency and U.S. government sponsored enterprise mortgage-backed securities: | | | | | | | | | | | | |
| Maturing after one year through five years | | 52,312 |
| | 52,055 |
| | 2.33 | % | | 47,278 |
| | 46,950 |
| | 1.74 | % |
| Maturing after five years through ten years | | 66,351 |
| | 65,534 |
| | 2.45 | % | | 79,379 |
| | 78,903 |
| | 3.11 | % |
| Maturing after ten years | | 1,357,306 |
| | 1,348,517 |
| | 2.20 | % | | 1,412,387 |
| | 1,399,693 |
| | 2.34 | % |
| Total | | 1,475,969 |
| | 1,466,106 |
| | 2.22 | % | | 1,539,044 |
| | 1,525,546 |
| | 2.36 | % |
Municipal securities (2): | | | | | | | | | | | | |
| Maturing in one year or less | | 12,987 |
| | 13,058 |
| | 3.56 | % | | 6,404 |
| | 6,317 |
| | 2.56 | % |
| Maturing after one year through five years | | 85,244 |
| | 85,767 |
| | 2.29 | % | | 127,178 |
| | 127,080 |
| | 2.31 | % |
| Maturing after five years through ten years | | 6,274 |
| | 6,235 |
| | 2.50 | % | | 9,785 |
| | 9,515 |
| | 2.50 | % |
| Maturing after ten years | | 12,293 |
| | 12,182 |
| | 4.31 | % | | 4,935 |
| | 4,742 |
| | 3.95 | % |
| Total | | 116,798 |
| | 117,242 |
| | 2.67 | % | | 148,302 |
| | 147,654 |
| | 2.40 | % |
| Non-agency residential mortgage-backed securities: | | | | | | | | | | | | |
| Maturing after ten years | | 9,680 |
| | 9,694 |
| | 2.72 | % | | 11,592 |
| | 11,477 |
| | 2.52 | % |
| Corporate debt securities: | | | | | | | | | | | | |
| Maturing in one year or less | | 12,655 |
| | 11,942 |
| | 2.19 | % | | 12,671 |
| | 11,347 |
| | 1.80 | % |
| Maturing after five years through ten years | | — |
| | — |
| | — | % | | 40,479 |
| | 40,500 |
| | 2.40 | % |
| Maturing after ten years | | — |
| | — |
| | — | % | | 179,231 |
| | 179,703 |
| | 2.26 | % |
| Total | | 12,655 |
| | 11,942 |
| | 2.19 | % | | 232,381 |
| | 231,550 |
| | 2.26 | % |
| Foreign bonds: | | | | | | | | | | | | |
| Maturing in one year or less | | 405,395 |
| | 389,876 |
| | 2.13 | % | | 304,427 |
| | 287,695 |
| | 2.09 | % |
| Maturing after one year through five years | | 100,000 |
| | 99,264 |
| | 2.70 | % | | 101,016 |
| | 96,199 |
| | 2.11 | % |
| Total | | 505,395 |
| | 489,140 |
| | 2.24 | % | | 405,443 |
| | 383,894 |
| | 2.09 | % |
| Other securities: | | | | | | | | | | | | |
| Maturing in one year or less | | 31,790 |
| | 31,417 |
| | — | % | | 40,501 |
| | 40,329 |
| | 2.72 | % |
| Maturing after five years through ten years | | 99 |
| | 103 |
| | 1.43 | % | | — |
| | — |
| | — | % |
| Maturing after ten years | | 115,615 |
| | 115,615 |
| | 3.78 | % | | — |
| | — |
| | — | % |
| Total | | 147,504 |
| | 147,135 |
| | 2.96 | % | | 40,501 |
| | 40,329 |
| | 2.72 | % |
| | | | | | | | | | | | | |
| Total: | | | | | | | | | | | | |
| Maturing in one year or less | | 638,257 |
| | 621,343 |
| | | | 583,676 |
| | 565,323 |
| | |
| Maturing after one year through five years | | 629,892 |
| | 623,058 |
| | | | 704,674 |
| | 694,776 |
| | |
| Maturing after five years through ten years | | 176,118 |
| | 172,902 |
| | | | 464,472 |
| | 455,804 |
| | |
| Maturing after ten years | | 1,548,496 |
| | 1,539,473 |
| | | | 1,632,619 |
| | 1,619,892 |
| | |
| Total available-for-sale investment securities | | $ | 2,992,763 |
| | $ | 2,956,776 |
| | | | $ | 3,385,441 |
| | $ | 3,335,795 |
| | |
| | | | | | | | | | | | | |
| Held-to-maturity investment security: | | | | | | | | | | | | |
| Non-agency commercial mortgage-backed security: | | | | | | | | | | | | |
| Maturing after ten years | | $ | — |
| | $ | — |
| | — | % | | $ | 143,971 |
| | $ | 144,593 |
| | 3.91 | % |
| |
| |
(1) | Weighted average yields are computed based on amortized cost balances. |
| |
(2) | Yields on tax-exempt securities are not presented on a tax-equivalent basis. |
The following sections discuss additional information on the Company’s loan portfolios, non-purchased credit impaired (“non-PCI”) nonperforming assets and allowance for credit losses.
Total Loan Portfolio
The Company offers a broad range of financial products designed to meet the credit needs of its borrowers. The Company’s loan portfolio segments include CRE,commercial loans, which consist of C&I, CRE, multifamily residential, and construction and land loans; and consumer loans, which consist of single-family residential, home equity lines of credit (“HELOCs”) and other consumer loans. NetTotal net loans including loans held-for-sale, increased $2.97 billion or 12% to $28.24were $38.98 billion as of September 30, 2017March 31, 2021, an increase of $1.21 billion or 3% from $25.27$37.77 billion as of December 31, 2016. The increase2020. This was broad based andprimarily driven by strong increases of $1.14 billion$449.4 million or 22% in residential loans, $1.00 billion or 10%3% in C&I loans, $836.3 million or 10% in CRE loans and $44.1primarily driven by PPP loan growth; $280.5 million or 2% in consumer loans.
|
| | | | | | | | | | | | | | |
| |
| ($ in thousands) | | September 30, 2017 | | December 31, 2016 |
| | Amount (1) | | Percent | | Amount (1) | | Percent |
| CRE: | | | | | | | | |
| Income producing | | $ | 8,843,776 |
| | 31 | % | | $ | 8,016,109 |
| | 31 | % |
| Construction | | 572,027 |
| | 2 | % | | 551,560 |
| | 2 | % |
| Land | | 111,377 |
| | — | % | | 123,194 |
| | 1 | % |
| Total CRE | | 9,527,180 |
| | 33 | % | | 8,690,863 |
| | 34 | % |
| C&I: | | | | | | | | |
| Commercial business | | 9,776,254 |
| | 34 | % | | 8,959,633 |
| | 35 | % |
| Trade finance | | 868,902 |
| | 3 | % | | 680,930 |
| | 3 | % |
| Total C&I | | 10,645,156 |
| | 37 | % | | 9,640,563 |
| | 38 | % |
| Residential: | | | | | | | | |
| Single-family | | 4,356,009 |
| | 16 | % | | 3,509,779 |
| | 14 | % |
| Multifamily | | 1,876,956 |
| | 7 | % | | 1,585,939 |
| | 6 | % |
| Total residential | | 6,232,965 |
| | 23 | % | | 5,095,718 |
| | 20 | % |
| Consumer | | 2,120,056 |
| | 7 | % | | 2,075,995 |
| | 8 | % |
Total loans held-for-investment (2) | | $ | 28,525,357 |
| | 100 | % | | $ | 25,503,139 |
| | 100 | % |
| Allowance for loan losses | | (285,926 | ) | | | | (260,520 | ) | | |
| Loans held-for-sale | | 178 |
| | | | 23,076 |
| | |
| Total loans, net | | $ | 28,239,609 |
| | | | $ | 25,265,695 |
| | |
| |
| |
(1) | Includes $(29.2) million and $1.2 million as of September 30, 2017 and December 31, 2016, respectively, of net deferred loan fees, unearned income, unamortized premiums and unaccreted discounts. |
| |
(2) | Loans net of ASC 310-30 discount. |
Althoughtotal CRE loans; and $484.0 million or 5% in residential mortgage. As of March 31, 2021, the loan portfolio grew 12% during the nine months ended September 30, 2017, the loan typeCompany had no loans held-for-sale. The composition remained relatively unchanged from December 31, 2016. The Company’s largest credit risks are concentrated in the commercial lending portfolios, which are comprised of C&I and CRE loans. The commercial lending portfolios comprised 70% and 72% of the total loan portfolio as of September 30, 2017March 31, 2021 was similar to the composition as of December 31, 2020.
The following table presents the composition of the Company’s total loan portfolio by loan type as of March 31, 2021 and December 31, 2016, respectively,2020:
| | | | | | | | | | | | | | | | | | | | | | | | | | | | | | |
|
| ($ in thousands) | | March 31, 2021 | | December 31, 2020 | | |
| Amount (1) | | % | | Amount (1) | | % | | | | |
| Commercial: | | | | | | | | | | | | |
C&I (2) | | $ | 14,081,110 | | | 36 | % | | $ | 13,631,726 | | | 36 | % | | | | |
| CRE: | | | | | | | | | | | | |
| CRE | | 11,563,034 | | | 29 | % | | 11,174,611 | | | 29 | % | | | | |
| Multifamily residential | | 3,066,515 | | | 8 | % | | 3,033,998 | | | 8 | % | | | | |
| Construction and land | | 459,254 | | | 1 | % | | 599,692 | | | 2 | % | | | | |
| Total CRE | | 15,088,803 | | | 38 | % | | 14,808,301 | | | 39 | % | | | | |
| Total commercial | | 29,169,913 | | | 74 | % | | 28,440,027 | | | 75 | % | | | | |
| Consumer: | | | | | | | | | | | | |
| Residential mortgage: | | | | | | | | | | | | |
| Single-family residential | | 8,524,287 | | | 22 | % | | 8,185,953 | | | 21 | % | | | | |
| HELOCs | | 1,749,172 | | | 4 | % | | 1,601,716 | | | 4 | % | | | | |
| Total residential mortgage | | 10,273,459 | | | 26 | % | | 9,787,669 | | | 25 | % | | | | |
| Other consumer | | 145,376 | | | 0 | % | | 163,259 | | | 0 | % | | | | |
| Total consumer | | 10,418,835 | | | 26 | % | | 9,950,928 | | | 25 | % | | | | |
| Total loans held-for-investment | | 39,588,748 | | | 100 | % | | 38,390,955 | | | 100 | % | | | | |
| Allowance for loan losses | | (607,506) | | | | | (619,983) | | | | | | | |
Loans held-for-sale (3) | | — | | | | | 1,788 | | | | | | | |
| Total loans, net | | $ | 38,981,242 | | | | | $ | 37,772,760 | | | | | | | |
|
(1)Includes net deferred loan fees, unearned fees, unamortized premiums and unaccreted discounts of $(76.9) million and $(58.8) million as of March 31, 2021 and December 31, 2020, respectively. Net origination fees related to PPP loans were $(34.3) million and $(12.7) million as of March 31, 2021 and December 31, 2020, respectively.
(2)Includes $2.07 billion and $1.57 billion of PPP loans as of March 31, 2021 and December 31, 2020, respectively.
(3)Consists of single-family residential loans as of December 31, 2020.
Actions to Support Customers during the COVID-19 Pandemic
In response to the COVID-19 pandemic, the Company assists customers by offering SBA PPP loans to help struggling businesses in our communities pay their employees and sustain their businesses. Given that PPP loans are discussed further below.guaranteed by the SBA, the Company does not expect to realize credit losses on these loans. PPP processing fees are deferred and accreted into interest income over the estimated life of the loans, but may be accelerated upon forgiveness or prepayment. For more information on PPP loans, refer to Item 2. MD&A — Overview — Regulatory Developments Relating to the COVID-19 Pandemic — Paycheck Protection Program in this Form 10-Q and Note 1 — Summary of Significant Accounting Policies — Paycheck Protection Program to the Consolidated Financial Statements of the Company’s 2020 Form 10-K.
C&I Loans.In addition, the Company also provides payment relief through various loan modification programs. For a summary of the loans that the Company has modified in response to the COVID-19 pandemic, refer to Item 2. MD&A — Risk Management — Credit Risk Management in this Form 10-Q.
Commercial
The commercial loan portfolio comprised 74% of total loans as of March 31, 2021, compared with 75% of total loans as of December 31, 2020. The Company actively monitors the commercial lending portfolio for elevated levels of credit risk and reviews credit exposures for sensitivity to changing economic conditions.
Commercial — Commercial and Industrial Loans. C&I loans of $10.65 billion and $9.64 billion, which accounted for 37% and 38% of the total loan portfolio as of September 30, 2017 and December 31, 2016, respectively, include commercial business and trade finance loans, which comprised the largest sector in the lending portfolio. Over the last few years, the Company has experienced higher growth in specialized lending verticals in industries such as private equity, energy, entertainment and structured specialty finance. As of September 30, 2017 and December 31, 2016, specialized lending verticals comprised 42% and 37% of total C&I loans, respectively.
Although the C&I industry sectors in which the Company provides financing are diversified, the Company has higher concentrations in the industry sectors of wholesale trade, manufacturing, real estate and leasing, entertainment and private equity. The Company’s C&I loan exposures within the wholesale trade sector, which totaled $1.63 billion and $1.38$14.08 billion as of September 30, 2017 andMarch 31, 2021, compared with $13.63 billion as of December 31, 2016, respectively, are largely related to U.S. domiciled companies, which import goods from Greater China2020, and accounted for U.S. consumer consumption, many36% of which are companies basedtotal loans held-for-investment as of both dates. Year-to-date, C&I loans increased $449.4 million or 3%, primarily driven by PPP loan funding. The C&I loan portfolio includes loans and financing for businesses in California. The private equity loans are largely capital calla wide spectrum of industries, and includes asset-based lending, equipment financing and leasing, project-based finance, revolving lines of credit.credit, SBA lending, structured finance, term loans and trade finance. The Company also has a portfolio of broadly syndicated loan portfolio withinC&I loans, primarily Term B, which totaled $999.0 million and $892.1 million as of March 31, 2021 and December 31, 2020, respectively. The majority of the C&I loanloans have variable interest rates.
The C&I portfolio which totaled $627.9 million and $758.5 million as of September 30, 2017 and December 31, 2016, respectively.is well-diversified by industry. The Company monitors concentrations within the C&I loan portfolio by customer exposure and industry classifications, setting limits for specialized lending verticals andclassification, setting diversification targets.targets and exposure limits by industry or loan product. The following charts illustrate the industry mix within our C&I portfolio as of March 31, 2021 and December 31, 2020.
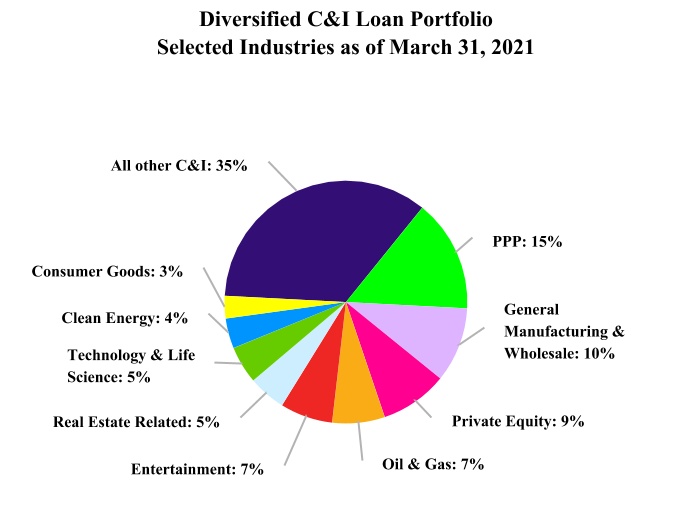
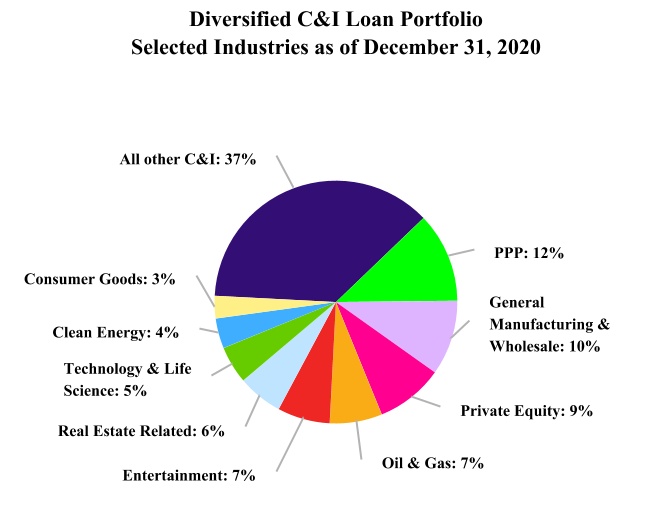
Commercial — Commercial Real Estate Loans. The totalCRE Loans.loan portfolio consists of income-producing CRE, multifamily residential, and construction and land loans. Total CRE loans include income producing real estate,outstanding totaled $15.09 billion as of March 31, 2021, or 38% of total loans held-for-investment, compared with $14.81 billion or 39% of total loans held-for-investment as of December 31, 2020. Year-to-date total CRE loans increased $280.5 million or 2%, primarily driven by growth in income-producing CRE, partially offset by declines in construction and land loans.
The Company’s total CRE portfolio is granular and broadly diversified by property type, which serves partially to mitigate its geographical concentration in California. The average size of total CRE loans was $2.4 million as of both March 31, 2021 and December 31, 2020. The following table summarizes the Company’s total CRE loan portfolio by property type as of March 31, 2021 and December 31, 2020:
| | | | | | | | | | | | | | | | | | | | | | | | | | |
|
| ($ in thousands) | | March 31, 2021 | | December 31, 2020 |
| Amount | | % | | Amount | | % |
| Property types: | | | | | | | | |
| Retail | | $ | 3,590,096 | | | 24 | % | | $ | 3,466,141 | | | 23 | % |
| Multifamily | | 3,066,515 | | | 20 | % | | 3,033,998 | | | 20 | % |
| Offices | | 2,821,985 | | | 19 | % | | 2,747,082 | | | 19 | % |
| Industrial | | 2,531,512 | | | 17 | % | | 2,407,594 | | | 16 | % |
| Hospitality | | 1,953,478 | | | 13 | % | | 1,888,797 | | | 13 | % |
| Construction and land | | 459,254 | | | 3 | % | | 599,692 | | | 4 | % |
| Other | | 665,963 | | | 4 | % | | 664,997 | | | 5 | % |
| Total CRE loans | | $ | 15,088,803 | | | 100 | % | | $ | 14,808,301 | | | 100 | % |
|
The weighted-average loan-to-value (“LTV”) ratio of the total CRE portfolio was 51% as of both March 31, 2021 and December 31, 2020. The low weighted-average LTV ratio was consistent by CRE property type. Approximately 90% of total CRE loans had an LTV ratio of 65% or lower as of March 31, 2021, compared with 89% as of December 31, 2020. The consistency of the Company’s low LTV underwriting standards has historically resulted in lower credit losses for income-producing CRE and multifamily residential loans.
The following tables provide a summary of the Company’s income-producing CRE, multifamily residential, and construction and land loans where the interest rates may be fixed, variable or hybrid.by geography as of March 31, 2021 and December 31, 2020. The Company focuses on providing financing to experienced real estate investors and developers who are long-time customers and have moderate levels of leverage. Loans are generally underwritten with high standards for cash flows, debt service coverage ratios and loan-to-value ratios. Due to the nature of the Company’s geographical footprint and market presence, the Company has CRE loan concentrations primarily in California, which comprised 74%distribution of the CRE loan portfolio reflects the Company’s geographical footprint, which is concentrated in California:
| | | | | | | | | | | | | | | | | | | | | | | | | | | | | | | | | | | | | | | | | | | | | | | | | | |
|
| ($ in thousands) | | March 31, 2021 |
| CRE | | % | | Multifamily
Residential | | % | | Construction
and Land | | % | | Total CRE | | % |
| Geographic markets: | | | | | | | | | | | | | | | | |
| Southern California | | $ | 6,174,824 | | | | | $ | 1,904,193 | | | | | $ | 154,643 | | | | | $ | 8,233,660 | | | |
| Northern California | | 2,546,418 | | | | | 674,848 | | | | | 169,569 | | | | | 3,390,835 | | | |
| California | | 8,721,242 | | | 75 | % | | 2,579,041 | | | 84 | % | | 324,212 | | | 71 | % | | 11,624,495 | | | 77 | % |
| New York | | 708,214 | | | 6 | % | | 142,056 | | | 5 | % | | 79,599 | | | 17 | % | | 929,869 | | | 6 | % |
| Texas | | 898,278 | | | 8 | % | | 118,285 | | | 4 | % | | 2,557 | | | 1 | % | | 1,019,120 | | | 7 | % |
| Washington | | 310,307 | | | 3 | % | | 96,057 | | | 3 | % | | 11,329 | | | 2 | % | | 417,693 | | | 3 | % |
| Arizona | | 150,091 | | | 1 | % | | 951 | | | 0 | % | | — | | | — | % | | 151,042 | | | 1 | % |
| Nevada | | 89,374 | | | 1 | % | | 86,206 | | | 3 | % | | 27,272 | | | 6 | % | | 202,852 | | | 1 | % |
| Other markets | | 685,528 | | | 6 | % | | 43,919 | | | 1 | % | | 14,285 | | | 3 | % | | 743,732 | | | 5 | % |
| Total loans | | $ | 11,563,034 | | | 100 | % | | $ | 3,066,515 | | | 100 | % | | $ | 459,254 | | | 100 | % | | $ | 15,088,803 | | | 100 | % |
|
| | | | | | | | | | | | | | | | | | | | | | | | | | | | | | | | | | | | | | | | | | | | | | | | | | |
|
| ($ in thousands) | | December 31, 2020 |
| CRE | | % | | Multifamily
Residential | | % | | Construction
and Land | | % | | Total CRE | | % |
| Geographic markets: | | | | | | | | | | | | | | | | |
| Southern California | | $ | 5,884,691 | | | | | $ | 1,867,646 | | | | | $ | 249,282 | | | | | $ | 8,001,619 | | | |
| Northern California | | 2,476,510 | | | | | 674,813 | | | | | 197,195 | | | | | 3,348,518 | | | |
| California | | 8,361,201 | | | 75 | % | | 2,542,459 | | | 84 | % | | 446,477 | | | 74 | % | | 11,350,137 | | | 77 | % |
| New York | | 696,712 | | | 6 | % | | 137,114 | | | 4 | % | | 93,806 | | | 16 | % | | 927,632 | | | 6 | % |
| Texas | | 864,639 | | | 8 | % | | 116,367 | | | 4 | % | | 2,581 | | | 0 | % | | 983,587 | | | 7 | % |
| Washington | | 341,374 | | | 3 | % | | 91,824 | | | 3 | % | | 22,724 | | | 4 | % | | 455,922 | | | 3 | % |
| Arizona | | 147,187 | | | 1 | % | | 12,406 | | | 0 | % | | — | | | — | % | | 159,593 | | | 1 | % |
| Nevada | | 88,959 | | | 1 | % | | 86,644 | | | 3 | % | | 22,384 | | | 4 | % | | 197,987 | | | 1 | % |
| Other markets | | 674,539 | | | 6 | % | | 47,184 | | | 2 | % | | 11,720 | | | 2 | % | | 733,443 | | | 5 | % |
| Total loans | | $ | 11,174,611 | | | 100 | % | | $ | 3,033,998 | | | 100 | % | | $ | 599,692 | | | 100 | % | | $ | 14,808,301 | | | 100 | % |
|
Since 77% of these loans were concentrated in California as of each of September 30, 2017both March 31, 2021 and December 31, 2016. Accordingly,2020, changes in the CaliforniaCalifornia’s economy and real estate values could have a significant impact on the collectability of these loans and the required level of allowance for loan losses. 19%For additional information related to the risk of real estate markets in California, see Item 1A. Risk Factors to the Consolidated Financial Statements of the Company’s2020 Form 10-K.
Commercial — Income-Producing Commercial Real Estate Loans. The Company focuses on providing financing to experienced real estate investors and developers who have moderate levels of leverage, many of whom are long-time customers of the Bank. Income-producing CRE loans totaled $11.56 billion as of March 31, 2021, compared with $11.17 billion as of December 31, 2020, and accounted for 29% of total loans held-for-investment as of both dates. Interest rates on CRE loans may be fixed, variable or hybrid. Loans are underwritten with conservative standards for cash flows, debt service coverage and LTV.
Owner-occupied properties comprised 19% and 20% of the income-producing CRE loans as of each of September 30, 2017March 31, 2021 and December 31, 20162020, respectively. The remainder were owner occupiednon-owner-occupied properties, while the remaining 81% were non-owner occupied properties (wherewhere 50% or more of the debt service for the loan is typically provided by unaffiliated rental income). Asincome from a third party.
Commercial —Multifamily Residential Loans. The multifamily residential loan portfolio is largely made up of September 30, 2017 and December 31, 2016, the Company had an income-producing CRE portfolio that was broadly diversified across all property types.
The Company had $572.0 million of construction loans and $507.3 million of unfunded commitmentssecured by residential properties with five or more units. Multifamily residential loans totaled $3.07 billion as of September 30, 2017,March 31, 2021, compared to $551.6 million of construction loans and $526.4 million of unfunded commitmentswith $3.03 billion as of December 31, 2016. The construction portfolio2020, and accounted for 8% of total loans held-for-investment as of September 30, 2017 and December 31, 2016 was largely comprised of financing for the construction of hotels, multifamily and residential condominiums, as well as mixed use (residential and retail) structures.
Residential Loans. Residential loans are comprised of single-family and multifamily residential loans. The Company offers first lien mortgage loans secured by one-to-four unit residential properties located in its primary lending areas.both dates. The Company offers a variety of first lien mortgage loan programs,mortgages, including fixed rate conformingfixed- and variable-rate loans, and adjustable rate mortgageas well as hybrid loans with initial fixed periods of one to seven years, whichinterest rates that adjust annually thereafter. after an initial fixed-rate period of three to ten years.
Commercial —Construction and Land Loans. Construction and land loans provide financing for a portfolio of projects diversified by real estate property type. These loans totaled $459.3 million or 1% of total loans held-for-investment as of March 31, 2021, compared with $599.7 million or 2% of total loans held-for-investment as of December 31, 2020. Construction loans exposure was made up of $415.6 million in loans outstanding and $255.9 million in unfunded commitments as of March 31, 2021, compared with $554.7 million in loans outstanding, plus $288.2 million in unfunded commitments as of December 31, 2020.
Consumer
The Company’s multifamily loan portfolio is largely comprised of loans secured by smaller multifamily properties ranging from 5 to 15 units in its primary lending areas. 71% and 73% offollowing tables summarize the Company’s single-family residential loans were concentrated in Californiaand HELOC loan portfolios by geography as of September 30, 2017March 31, 2021 and December 31, 2016, respectively. Many2020:
| | | | | | | | | | | | | | | | | | | | | | | | | | | | | | | | | | | | | | |
|
| ($ in thousands) | | March 31, 2021 |
| Single-
Family
Residential | | % | | HELOCs | | % | | Total
Residential
Mortgage | | % |
| Geographic markets: | | | | | | | | | | | | |
| Southern California | | $ | 3,511,096 | | | | | $ | 794,333 | | | | | $ | 4,305,429 | | | |
| Northern California | | 1,038,503 | | | | | 402,700 | | | | | 1,441,203 | | | |
| California | | 4,549,599 | | | 53 | % | | 1,197,033 | | | 68 | % | | 5,746,632 | | | 57 | % |
| New York | | 2,557,497 | | | 30 | % | | 254,019 | | | 15 | % | | 2,811,516 | | | 27 | % |
| Washington | | 577,234 | | | 7 | % | | 192,408 | | | 11 | % | | 769,642 | | | 7 | % |
| Massachusetts | | 257,540 | | | 3 | % | | 54,888 | | | 3 | % | | 312,428 | | | 3 | % |
| Texas | | 217,532 | | | 3 | % | | — | | | — | % | | 217,532 | | | 2 | % |
| Georgia | | 227,781 | | | 3 | % | | 17,973 | | | 1 | % | | 245,754 | | | 2 | % |
| Other markets | | 137,104 | | | 1 | % | | 32,851 | | | 2 | % | | 169,955 | | | 2 | % |
| Total | | $ | 8,524,287 | | | 100 | % | | $ | 1,749,172 | | | 100 | % | | $ | 10,273,459 | | | 100 | % |
| Lien priority: | | | | | | | | | | | | |
| First mortgage | | $ | 8,524,287 | | | 100 | % | | $ | 1,516,570 | | | 87 | % | | $ | 10,040,857 | | | 98 | % |
| Junior lien mortgage | | — | | | — | % | | 232,602 | | | 13 | % | | 232,602 | | | 2 | % |
| Total | | $ | 8,524,287 | | | 100 | % | | $ | 1,749,172 | | | 100 | % | | $ | 10,273,459 | | | 100 | % |
|
| | | | | | | | | | | | | | | | | | | | | | | | | | | | | | | | | | | | | | |
|
| ($ in thousands) | | December 31, 2020 |
| Single-
Family
Residential | | % | | HELOCs | | % | | Total
Residential
Mortgage | | % |
| Geographic markets: | | | | | | | | | | | | |
| Southern California | | $ | 3,462,067 | | | | | $ | 728,733 | | | | | $ | 4,190,800 | | | |
| Northern California | | 1,059,832 | | | | | 354,014 | | | | | 1,413,846 | | | |
| California | | 4,521,899 | | | 55 | % | | 1,082,747 | | | 68 | % | | 5,604,646 | | | 57 | % |
| New York | | 2,277,722 | | | 28 | % | | 244,425 | | | 15 | % | | 2,522,147 | | | 26 | % |
| Washington | | 597,231 | | | 7 | % | | 180,765 | | | 11 | % | | 777,996 | | | 8 | % |
| Massachusetts | | 259,368 | | | 3 | % | | 44,633 | | | 3 | % | | 304,001 | | | 3 | % |
| Texas | | 209,737 | | | 3 | % | | — | | | — | % | | 209,737 | | | 2 | % |
| | | | | | | | | | | | |
| Other markets | | 319,996 | | | 4 | % | | 49,146 | | | 3 | % | | 369,142 | | | 4 | % |
| Total | | $ | 8,185,953 | | | 100 | % | | $ | 1,601,716 | | | 100 | % | | $ | 9,787,669 | | | 100 | % |
| Lien priority: | | | | | | | | | | | | |
| First mortgage | | $ | 8,185,953 | | | 100 | % | | $ | 1,372,270 | | | 86 | % | | $ | 9,558,223 | | | 98 | % |
| Junior lien mortgage | | — | | | — | % | | 229,446 | | | 14 | % | | 229,446 | | | 2 | % |
| Total | | $ | 8,185,953 | | | 100 | % | | $ | 1,601,716 | | | 100 | % | | $ | 9,787,669 | | | 100 | % |
|
Consumer — Single-Family Residential Loans. Single-family residential loans totaled $8.52 billion as of March 31, 2021, compared with $8.19 billion as of December 31, 2020, and accounted for 22% and 21% of total loans held-for-investment as of March 31, 2021 and December 31, 2020. Year-to-date single-family residential loans increased $336.5 million or 4%, primarily driven by net growth in New York. The Company was in a first lien position for virtually all of the single-family residential loans within the Company’s portfolioas of both March 31, 2021 and December 31, 2020. Many of these loans are reduced documentation loans, wherefor which a substantial down payment is required, resulting in a low loan-to-valueLTV ratio at origination, typically 65% or less. These loans have historically experienced low delinquency and loss rates. The Company offers a variety of single-family residential first lien mortgage loan programs, including fixed- and variable-rate loans, as well as hybrid loans with interest rates that adjust annually after an initial fixed-rate period.
Consumer — Home Equity Lines of Credit. HELOCs totaled $1.75 billion as of March 31, 2021, compared with $1.60 billion as of December 31, 2020, and accounted for 4% of total loans held-for-investment as of both dates. Year-to-date HELOCs increased $147.5 million or 9%, primarily driven by growth in California. The Company was in a first lien position for 87% and 86% of total HELOCs as of March 31, 2021 and December 31, 2020, respectively. Many of the loans within this portfolio are reduced documentation loans, for which a substantial down payment is required, resulting in a low LTV ratio at origination, typically 60% or less. These loans have historically experienced low delinquency and defaultloss rates.
Consumer Loans. Consumer loans are comprised Virtually all of home equity lines of credit (“HELOCs”), insurance premium financing loans, credit card and auto loans. As of September 30, 2017 and December 31, 2016, the Company’s HELOCs were variable-rate loans.
All originated commercial and consumer loans are subject to the largest component ofCompany’s underwriting guidelines and loan origination standards. Management believes that the consumer loan portfolio,Company’s underwriting criteria and were secured by one-to-four unit residential properties located in its primary lending areas. The HELOC loan portfolio is largely comprised of loans originated through a reduced documentation loan program where a substantial down payment is required, resulting in a low loan-to-value ratio, typically 60% or less.procedures adequately consider the unique risks associated with these products. The Company conducts a variety of quality control procedures and periodic audits, including the review of lending and legal requirements, to ensure that the Company is in a first lien position for manycompliant with these requirements.
Loans Held-for-Sale
As of these reduced documentation HELOCs. TheseMarch 31, 2021, the Company had no loans have historically experienced low delinquency and default rates.
The Company’s total loan portfolio includes originated and purchased loans. Originated and purchased loans, for which there was no evidenceheld-for-sale. As of credit deterioration at their acquisition date, are collectively referred to as non-PCI loans. Acquired loans for which there was, at the acquisition date, evidence of credit deterioration are referred to as PCI loans. PCI loans are recorded net of ASC 310-30 discount and totaled $532.3 million and $642.4 million as of September 30, 2017 and December 31, 2016, respectively. For additional details regarding PCI2020, loans see Note 8 — Loans Receivable and Allowance for Credit Losses to the Consolidated Financial Statements.
The Company’s overseas offices include the branch in Hong Kong and the subsidiary bank in China. Asheld-for-sale of September 30, 2017 and December 31, 2016, loans held in the Hong Kong branch totaled $686.3$1.8 million and $733.3 million, respectively. Asconsisted of September 30, 2017 and December 31, 2016, loans held in the subsidiary bank in China totaled $499.5 million and $425.3 million, respectively. These overseas loans are comprised mainly of C&I loans made to cross-border or trade finance companies. In total, these loans represented 3% of total consolidated assets as of September 30, 2017 and December 31, 2016.
When a determination is made atsingle-family residential loans. At the time of commitment to originate or purchase loans asa loan, a loan is determined to be held-for-investment if it is the Company’s intent to hold these loansthe loan to maturity or for the “foreseeable future,” subject to periodic reviews under the Company’s management evaluation processes, including asset/liabilityliquidity and credit risk management. WhenIf the Company subsequently changes its intent to hold certain loans, thethose loans are transferred from held-for-investment to held-for-sale at the lower of cost or fair value. As
Sales of September 30, 2017,Originated Loans and Purchased Loans
All loans held-for-sale amountedoriginated by the Company are underwritten pursuant to $178 thousand, which were comprised of single-family residential loans. In comparison, as of December 31, 2016,the Company’s policies and procedures. Although the Company’s primary focus is on directly originated loans, held-for-sale amounted to $23.1 million, which were primarily comprised of consumer loans. Loans transferred from held-for-investment to held-for-sale were $74.5 millionin certain circumstances, the Company also purchases loans and $418.5 million during the three and nine months ended September 30, 2017, respectively. These loan transfers were primarily comprised of C&Iparticipates in loans for both periods. In comparison, $144.9 million and $720.7 million of loans were transferred from held-for-investment to held-for-sale during the three and nine months ended September 30, 2016, respectively. These loan transfers were primarily comprised of C&I, multifamily residential and CRE loans for both periods.with other banks. The Company recorded $232 thousand and $441 thousandalso participates out interests in write-downsdirectly originated commercial loans to the allowance for loan losses related to loans transferred from held-for-investment to held-for-sale for the three and nine months ended September 30, 2017, respectively. In comparison, there were no write-downs and $1.9 million of write-downs recorded to the allowance for loan losses related to loans transferred from held-for-investment to held-for-sale for the three and nine months ended September 30, 2016, respectively.
During the three and nine months ended September 30, 2017, the Company sold $33.8 million and $101.4 million, respectively, in originated loans, resulting in net gains of $2.3 million and $5.5 million, respectively. Originated loans sold during the three months ended September 30, 2017 were primarily comprised of $15.7 million of CRE loans and $12.3 million of C&I loans. Originated loans sold during the nine months ended September 30, 2017 were primarily comprised of $50.5 million of C&I loans and $34.8 million of CRE loans. In comparison, the Company sold $107.3 million in originated loans during the three months ended September 30, 2016, resulting in net gains of $2.2 million. Originated loans sold during this period were primarily comprised of $53.9 million of C&I loans and $46.0 million of CRE loans. During the nine months ended September 30, 2016, the Company sold or securitized $529.5 million in originated loans, resulting in net gains of $9.3 million. Included in these amounts were $201.7 million of multifamily residential loans securitized during the first quarter of 2016, which resulted in net gains of $1.1 million, $641 thousand in mortgage servicing rights and $160.1 million of held-to-maturity investment security that were recorded. The remaining $327.8 million of originated loans sold during the nine months ended September 30, 2016, primarily comprising of $171.9 million of CRE loans and $99.6 million of C&I loans, resulted in net gains of $8.2 million.
During the three and nine months ended September 30, 2017, the Company purchased $72.4 million and $441.1 million loans, respectively, compared to $256.2 million and $1.04 billion during the three and nine months ended September 30, 2016, respectively. Purchased loans for each of the three and nine months ended September 30, 2017 were primarily comprised of C&I syndication loans. Purchased loans for each of the three and nine months ended September 30, 2016 were primarily comprised of C&I syndication loans and single-family residential loans. The higher loans purchased for the three and nine months ended September 30, 2016, primarily included $165.8 million and $488.3 million, respectively, of single-family residential loans purchased for Community Reinvestment Act purposes.
From time to time, the Company purchasesother financial institutions and sells loans in the secondary market. Certain purchased loans are transferred from held-for-investment to held-for-sale and write-downs to allowance for loan losses are recorded, when appropriate. During the three and nine months ended September 30, 2017, the Company sold loansnormal course of $57.4 million and $354.5 million, respectively, in the secondary market at net gains of $19 thousand and $1.2 million, respectively. In comparison, the Company sold loans of $45.8 million and $179.4 million for the three and nine months ended September 30, 2016, respectively, in the secondary market. Loan sales in the secondary market resulted in no gains or losses and $69 thousand in net gains recorded for the three and nine months ended September 30, 2016, respectively.business.
The Company records valuation adjustments in Net gains on sales of loans on the Consolidated Statements of Income to carry the loans held-for-sale portfolio at the lower of cost or fair value. For each of the three months ended September 30, 2017 and 2016, no valuation adjustments were recorded. For the nine months ended September 30, 2017 and 2016, the Company recorded $61 thousand and $2.4 million, respectively, in valuation adjustments.
Non-PCI Nonperforming Assets
Non-PCI nonperforming assets are comprised of nonaccrual loans and other real estate owned (“OREO”), net. Loans are placed on nonaccrual status when they become 90 days past due or when the full collection of principal or interest becomes uncertain regardless of the length of past due status. The following table presentstables provide information regarding non-PCI nonperforming assets as of September 30, 2017 and December 31, 2016:
|
| | | | | | | | |
| |
| ($ in thousands) | | September 30, 2017 | | December 31, 2016 |
| Nonaccrual loans: | | | | |
| Real estate - commercial | | $ | 24,802 |
| | $ | 26,907 |
|
| Real estate - land and construction | | 4,183 |
| | 5,326 |
|
| Commercial | | 73,384 |
| | 81,256 |
|
| Real estate - single-family | | 6,639 |
| | 4,214 |
|
| Real estate - multifamily | | 2,620 |
| | 2,984 |
|
| Consumer | | 3,097 |
| | 2,130 |
|
| Total nonaccrual loans | | 114,725 |
| | 122,817 |
|
| OREO, net | | 2,289 |
| | 6,745 |
|
| Total nonperforming assets | | $ | 117,014 |
| | $ | 129,562 |
|
Non-PCI nonperforming assets to total assets (1) | | 0.32 | % | | 0.37 | % |
Non-PCI nonaccrual loans to loans held-for-investment (1) | | 0.40 | % | | 0.48 | % |
| Allowance for loan losses to non-PCI nonaccrual loans | | 249.23 | % | | 212.12 | % |
| |
| |
(1) | Total assets and loans held-for-investment include PCI loans of $532.3 million and $642.4 million as of September 30, 2017 and December 31, 2016, respectively. |
Typically, changes to nonaccrual loans period-over-period represent inflows for loans that are placed on nonaccrual status in accordance with the Company’s accounting policy, offset by reductions for loans that are paid down, charged off, sold, foreclosed, or no longer classified as nonaccrual as a result of continued performance and improvement in the borrower’s financial condition and loan repayment capabilities. Nonaccrual loans decreased by $8.1 million or 7% to $114.7 million as of September 30, 2017 from $122.8 million as of December 31, 2016. The decrease in nonaccrual loans was primarily due to payoffs and paydowns of nonaccrual loans of $70.2 million, transfers of nonaccrual loans to accrual status of $37.2 million, and charge-offs of nonaccrual loans of $19.5 million, partially offset by loans transferred to nonaccrual status of $119.4 million,sales during the nine months ended September 30, 2017. Nonaccrual loans as a percentagefirst quarters of loans held-for-investment declined from 0.48% as of December 31, 20162021 and 2020. Refer to 0.40% as of September 30, 2017. C&I loans comprised 64% and 66% of total nonaccrual loans as of September 30, 2017 and December 31, 2016, respectively. Credit risks related to the C&I nonaccrual loans were mitigated by the collateral. In addition, the risk of loss of all nonaccrual loans had been considered as of September 30, 2017 and December 31, 2016 and the Company believes that this was appropriately covered by the allowance for loan losses.
In addition, 36% and 64% of non-PCI nonaccrual loans consisted of loans that were less than 90 days delinquent as of September 30, 2017 and December 31, 2016, respectively.
For additional details regarding the Company’s non-PCI nonaccrual loans policy, see Note 1 — Summary of Significant Accounting Policies to the Consolidated Financial Statements of the Company’s 2016 Form 10-K.
Troubled debt restructurings (“TDRs”) may be designated as performing or nonperforming. A TDR may be designated as performing, if the loan has demonstrated sustained performance under the modified terms. The period of sustained performance may include the periods prior to modification if prior performance has met or exceeded the modified terms. A loan will remain on nonaccrual status until the borrower demonstrates a sustained period of performance, generally six consecutive months of payments.
The following table presents the performing and nonperforming TDRs by loan segment as of September 30, 2017 and December 31, 2016:
|
| | | | | | | | | | | | | | | | |
| |
| ($ in thousands) | | September 30, 2017 | | December 31, 2016 |
| | Performing TDRs | | Nonperforming TDRs | | Performing TDRs | | Nonperforming TDRs |
| CRE | | $ | 10,347 |
| | $ | 19,830 |
| | $ | 20,145 |
| | $ | 14,446 |
|
| C&I | | 20,416 |
| | 44,292 |
| | 44,363 |
| | 23,771 |
|
| Residential | | 18,872 |
| | 486 |
| | 17,178 |
| | 717 |
|
| Consumer | | 1,204 |
| | 375 |
| | 1,552 |
| | 49 |
|
| Total TDRs | | $ | 50,839 |
| | $ | 64,983 |
| | $ | 83,238 |
| | $ | 38,983 |
|
| |
Performing TDRs decreased by $32.4 million or 39% to $50.8 million as of September 30, 2017, primarily due to the transfers of one CRE and two C&I loans from performing to nonperforming status during the nine months ended September 30, 2017. Nonperforming TDRs increased by $26.0 million or 67% to $65.0 million as of September 30, 2017, primarily due to the aforementioned transfers of CRE and C&I loans between performing and nonperforming status and a C&I loan becoming a TDR loan during the nine months ended September 30, 2017.
The Company’s impaired loans include predominantly non-PCI loans held-for-investment on nonaccrual status and non-PCI loans modified as a TDR, on either accrual or nonaccrual status. See Note 1 — Summary of Significant Accounting Policies to the Consolidated Financial Statements of the Company’s 2016 Form 10-K for additional information regarding the Company’s TDRs and impaired loan policies. As of September 30, 2017, the allowance for loan losses included $20.8 million for impaired loans with a total recorded investment balance of $72.6 million. In comparison, the allowance for loan losses included $12.7 million for impaired loans with a total recorded investment balance of $84.1 million as of December 31, 2016.
The following table presents the recorded investment balances for non-PCI impaired loans as of September 30, 2017 and December 31, 2016:
|
| | | | | | | | | | | | | | |
| |
| ($ in thousands) | | September 30, 2017 | | December 31, 2016 |
| | Amount | | Percent | | Amount | | Percent |
| CRE: | | | | | | | | |
| Income producing | | $ | 35,149 |
| | 21 | % | | $ | 46,508 |
| | 23 | % |
| Land | | 4,183 |
| | 3 | % | | 5,870 |
| | 3 | % |
| Total CRE impaired loans | | 39,332 |
| | 24 | % | | 52,378 |
| | 26 | % |
| C&I: | | | | | | | | |
| Commercial business | | 89,092 |
| | 54 | % | | 120,453 |
| | 58 | % |
| Trade finance | | 4,708 |
| | 3 | % | | 5,166 |
| | 2 | % |
| Total C&I impaired loans | | 93,800 |
| | 57 | % | | 125,619 |
| | 60 | % |
| Residential: | | | | | | | | |
| Single-family | | 15,899 |
| | 10 | % | | 14,335 |
| | 7 | % |
| Multifamily | | 12,232 |
| | 7 | % | | 10,041 |
| | 5 | % |
| Total residential impaired loans | | 28,131 |
| | 17 | % | | 24,376 |
| | 12 | % |
| Consumer | | 4,301 |
| | 2 | % | | 3,682 |
| | 2 | % |
| Total impaired loans | | $ | 165,564 |
| | 100 | % | | $ | 206,055 |
| | 100 | % |
| |
Allowance for Credit Losses
Allowance for credit losses consists of allowance for loan losses and allowance for unfunded credit reserves. Unfunded credit reserves include reserves provided for unfunded lending commitments, issued commercial letters of credit and standby letters of credit (“SBLCs”), and recourse obligations for loans sold. The allowance for credit losses is increased by the provision for credit losses which is charged against current period operating results, and is increased or decreased by the amount of net recoveries or charge-offs, respectively, during the period. The allowance for unfunded credit reserves is included in Accrued expenses and other liabilities on the Consolidated Balance Sheets. Net adjustments to the allowance for unfunded credit reserves are included in Provision for credit losses on the Consolidated Statements of Income.
The Company is committed to maintaining the allowance for credit losses at a level that is commensurate with the estimated inherent loss in the loan portfolio, including unfunded credit reserves. In addition to regular quarterly reviews of the adequacy of the allowance for credit losses, the Company performs an ongoing assessment of the risks inherent in the loan portfolio. While the Company believes that the allowance for loan losses is appropriate as of September 30, 2017, future allowance levels may increase or decrease based on a variety of factors, including loan growth, portfolio performance and general economic conditions. For additional details on the Company’s allowance for credit losses, including the methodologies used, see Note 87 — Loans Receivable and Allowance for Credit Losses to the Consolidated Financial Statements in this Form 10-Q for additional information on loan purchases and Item 7. MD&A — Critical Accounting Policiestransfers.
| | | | | | | | | | | | | | | | | | | | | | | | | | | | | | | | | |
|
| ($ in thousands) | | Three Months Ended March 31, 2021 |
| Commercial | | | | | | Consumer | | | | | Total |
| C&I | | Total CRE | | | | | | Residential Mortgage | | | | |
| | CRE | | | | | | Single-Family
Residential | | | |
| | | | | | | | | | | | | | | |
| | | | | | | | | | | | | | | |
| | | | | | | | | | | | | | | |
| Loans sold: | | | | | | | | | | | | | | | |
| Originated loans: | | | | | | | | | | | | | | | |
| Amount | | $ | 103,485 | | | $ | 20,032 | | | | | | | $ | 7,506 | | | | | | $ | 131,023 | |
| Net gains | | $ | 229 | | | $ | 1,263 | | | | | | | $ | 214 | | | | | | $ | 1,706 | |
| | | | | | | | | | | | | | | |
| Purchased loans: | | | | | | | | | | | | | | | |
| Amount | | $ | 22,394 | | | $ | — | | | | | | | $ | — | | | | | | $ | 22,394 | |
| Net gains | | $ | 75 | | | $ | — | | | | | | | $ | — | | | | | | $ | 75 | |
| | | | | | | | | | | | | | | |
|
| | | | | | | | | | | | | | | | | | | | | | | | | | | | | | | | | | |
|
| ($ in thousands) | | Three Months Ended March 31, 2020 |
| Commercial | | Consumer | | Total |
| C&I | | Total CRE | | Residential Mortgage | | | |
| | CRE | | | | | | Single-Family
Residential | | | | |
| | | | | | | | | | | | | | | | |
| | | | | | | | | | | | | | | | |
| | | | | | | | | | | | | | | | |
| Loans sold: | | | | | | | | | | | | | | | | |
| Originated loans: | | | | | | | | | | | | | | | | |
| Amount | | $ | 102,973 | | | $ | 7,250 | | | | | | | $ | 4,642 | | | | | | | $ | 114,865 | |
| Net gains | | $ | 235 | | | $ | 665 | | | | | | | $ | 50 | | | | | | | $ | 950 | |
| | | | | | | | | | | | | | | | |
| | | | | | | | | | | | | | | | |
| | | | | | | | | | | | | | | | |
| | | | | | | | | | | | | | | | |
| | | | | | | | | | | | | | | | |
|
Foreign Outstandings
The Company’s overseas offices, which include the branch in Hong Kong and Estimates and Note 1 — Summary of Significant Accounting Policies the subsidiary bank in China, are subject to the Consolidated Financial Statements ofgeneral risks inherent in conducting business in foreign countries, such as regulations, or economic and political uncertainties. In addition, the Company’s 2016 Form 10-K.
financial assets held in the Hong Kong branch and the subsidiary bank in China may be affected by fluctuations in currency exchange rates or other factors. The Company’s country risk exposure is largely concentrated in these locations. The following table presents a summary of activitiesthe major financial assets held in the allowance for credit losses for the threeCompany’s overseas offices as of March 31, 2021 and nine months ended September 30, 2017December 31, 2020:
| | | | | | | | | | | | | | | | | | | | | | | | | | |
|
| ($ in thousands) | | March 31, 2021 | | December 31, 2020 |
| Amount | | % of Total
Consolidated
Assets | | Amount | | % of Total
Consolidated
Assets |
| Hong Kong branch: | | | | | | | | |
| Cash and cash equivalents | | $ | 626,081 | | | 1 | % | | $ | 647,883 | | | 1 | % |
| | | | | | | | |
AFS debt securities (1) | | $ | 256,160 | | | 0 | % | | $ | 66,170 | | | 0 | % |
Loans held-for-investment (2) | | $ | 670,406 | | | 1 | % | | $ | 704,415 | | | 1 | % |
| Total assets | | $ | 1,561,250 | | | 3 | % | | $ | 1,426,479 | | | 3 | % |
| Subsidiary bank in China: | | | | | | | | |
| Cash and cash equivalents | | $ | 660,323 | | | 1 | % | | $ | 611,088 | | | 1 | % |
| Interest-bearing deposits with banks | | $ | 6,674 | | | 0 | % | | $ | 74,079 | | | 0 | % |
AFS debt securities (3) | | $ | 151,343 | | | 0 | % | | $ | 152,219 | | | 0 | % |
Loans held-for-investment (2) | | $ | 789,789 | | | 1 | % | | $ | 796,153 | | | 2 | % |
| Total assets | | $ | 1,605,617 | | | 3 | % | | $ | 1,634,896 | | | 3 | % |
|
(1)Comprised of U.S. Treasury securities, corporate debt securities and 2016:
|
| | | | | | | | | | | | | | | | |
| |
| ($ in thousands) | | Three Months Ended September 30, | | Nine Months Ended September 30, |
| | 2017 | | 2016 | | 2017 | | 2016 |
| Allowance for loan losses, beginning of period | | $ | 276,316 |
| | $ | 266,768 |
| | $ | 260,520 |
| | $ | 264,959 |
|
| Provision for loan losses | | 13,448 |
| | 11,514 |
| | 32,134 |
| | 19,049 |
|
| Gross charge-offs: | | | | | | | | |
| CRE | | — |
| | (309 | ) | | (149 | ) | | (504 | ) |
| C&I | | (7,359 | ) | | (23,696 | ) | | (19,802 | ) | | (31,770 | ) |
| Residential | | — |
| | (29 | ) | | (1 | ) | | (166 | ) |
| Consumer | | (65 | ) | | (13 | ) | | (72 | ) | | (17 | ) |
| Total gross charge-offs | | (7,424 | ) | | (24,047 | ) | | (20,024 | ) | | (32,457 | ) |
| Gross recoveries: | | | | | | | | |
| CRE | | 610 |
| | 634 |
| | 1,714 |
| | 873 |
|
| C&I | | 2,165 |
| | 165 |
| | 9,658 |
| | 2,068 |
|
| Residential | | 809 |
| | 654 |
| | 1,758 |
| | 1,048 |
|
| Consumer | | 2 |
| | 124 |
| | 166 |
| | 272 |
|
| Total gross recoveries | | 3,586 |
| | 1,577 |
| | 13,296 |
| | 4,261 |
|
| Net charge-offs | | (3,838 | ) | | (22,470 | ) | | (6,728 | ) | | (28,196 | ) |
| Allowance for loan losses, end of period | | 285,926 |
| | 255,812 |
| | 285,926 |
| | 255,812 |
|
| | | | | | | | | |
| Allowance for unfunded credit reserves, beginning of period | | 15,188 |
| | 20,318 |
| | 16,121 |
| | 20,360 |
|
| Reversal of unfunded credit reserves | | (452 | ) | | (1,989 | ) | | (1,385 | ) | | (2,031 | ) |
| Allowance for unfunded credit reserves, end of period | | 14,736 |
| | 18,329 |
| | 14,736 |
| | 18,329 |
|
| Allowance for credit losses | | $ | 300,662 |
| | $ | 274,141 |
| | $ | 300,662 |
| | $ | 274,141 |
|
| | | | | | | | | |
| Average loans held-for-investment | | $ | 27,529,103 |
| | $ | 24,258,913 |
| | $ | 26,764,327 |
| | $ | 23,961,288 |
|
| Loans held-for-investment, end of period | | $ | 28,525,357 |
| | $ | 24,731,962 |
| | $ | 28,525,357 |
| | $ | 24,731,962 |
|
| Annualized net charge-offs to average loans held-for-investment | | (0.06 | )% | | (0.37 | )% | | (0.03 | )% | | (0.16 | )% |
| Allowance for loan losses to loans held-for-investment | | 1.00 | % | | 1.03 | % | | 1.00 | % | | 1.03 | % |
Asforeign government bonds as of September 30, 2017, the allowance for loan losses amounted to $285.9 million or 1.00%March 31, 2021; comprised of loans held-for-investment, compared to $260.5 million or 1.02%U.S. Treasury securities and $255.8 million or 1.03% of loans held-for-investmentforeign government bonds as of December 31, 2016 and September 30, 2016, respectively. The increase in the allowance for loan losses was largely due to the overall growth in the loan portfolio. The allowance for loan losses to2020.
(2)Primarily comprised of C&I loans held-for-investment ratio as of September 30, 2017 decreased slightly compared to both DecemberMarch 31, 2016 and September 30, 2016. The decrease in this ratio was primarily attributable to the higher credit quality of newly originated loans, resulting in loans held-for-investment increasing at a higher rate than the estimated allowance for loan losses. In addition, the extended good economic cycle and sound credit risk management practices have led to continued declines in the Company’s historical loss rate experience, which has resulted in a slower rate of change in the allowance for loan losses compared to the Company’s loan growth.Provision for credit losses includes provision for loan losses and unfunded credit reserves. Provision for credit losses is charged to income to bring the allowance for credit losses to a level deemed appropriate by the Company based on the factors described above. The fluctuation in the provision for credit losses is highly dependent on the historical loss rates trend along with the net charge-offs experienced during the period. The increase in the provision for credit losses for the three and nine months ended September 30, 2017, compared to the same periods in 2016, was reflective of the overall loan portfolio growth, partially offset by a decline in the historical loss factor during the same periods. The Company believes the allowance for credit losses as of September 30, 20172021 and December 31, 2016 was appropriate to cover credit losses inherent in the loan portfolio, including unfunded credit commitments, at that date.2020.
(3)Comprised of foreign government bonds as of both March 31, 2021 and December 31, 2020.
The following table presents the total revenue generated by the Company’s allocationoverseas offices for the first quarters of the allowance for loan losses by segment2021 and the ratio of each loan segment to total loans held-for-investment as of September 30, 2017 and December 31, 2016:2020:
| | | | | | | | | | | | | | | | | | | | | | | | | | |
|
| ($ in thousands) | | Three Months Ended March 31, |
| 2021 | | 2020 |
| Amount | | % of Total
Consolidated
Revenue | | Amount | | % of Total
Consolidated
Revenue |
| Hong Kong branch: | | | | | | | | |
| Total revenue | | $ | 5,467 | | | 1 | % | | $ | 6,929 | | | 2 | % |
| Subsidiary bank in China: | | | | | | | | |
| Total revenue | | $ | 6,521 | | | 2 | % | | $ | 7,179 | | | 2 | % |
|
Capital
|
| | | | | | | | | | | | | | |
| ($ in thousands) | | September 30, 2017 | | December 31, 2016 |
| | Allowance Allocation | | % of Total Loans | | Allowance Allocation | | % of Total Loans |
| CRE | | $ | 74,317 |
| | 33 | % | | $ | 72,916 |
| | 34 | % |
| C&I | | 160,598 |
| | 37 | % | | 142,167 |
| | 38 | % |
| Residential | | 43,905 |
| | 23 | % | | 37,338 |
| | 20 | % |
| Consumer | | 7,106 |
| | 7 | % | | 8,099 |
| | 8 | % |
| Total | | $ | 285,926 |
| | 100 | % | | $ | 260,520 |
| | 100 | % |
| |
The Company maintains a strong capital base to support its anticipated asset growth, operating needs and credit risks, and to ensure that the Company and the Bank are compliant with applicable regulatory capital guidelines. The Company engages in regular capital planning processes on at least an allowanceannual basis to optimize the use of available capital and to appropriately plan for future capital needs, allocating capital to existing and future business activities. Furthermore, the Company conducts capital stress tests as part of its capital planning process. The stress tests enable the Company to assess the impact of adverse changes in the economy and interest rates on non-PCI and PCI loans. Based onits capital base.
In March 2020, the Company’s estimatesBoard of cash flows expectedDirectors authorized the repurchase of up to be collected,$500.0 million of the Company’s common stock. This $500.0 million repurchase authorization was inclusive of the Company’s $100.0 million stock repurchase authorization previously outstanding. The Company determines the timing and amount of stock repurchases, based on its assessment of various factors, including prevailing market conditions, alternate uses of capital, liquidity and the economic environment. During the first quarter of 2020, the Company repurchased 4,471,682 shares at an allowance foraverage price of $32.64 per share and a total cost of $146.0 million. The Company did not repurchase any shares during the PCI loans is established, with a charge to income throughremainder of 2020 or in the provision for loan losses. PCI loan losses are estimated collectively for groupsfirst quarter of loans with similar characteristics.2021. As of September 30, 2017,March 31, 2021, the Company establishedtotal remaining available capital authorized for repurchase was $354.0 million.
The Company’s stockholders’ equity was $5.29 billion as of March 31, 2021, an allowanceincrease of $68 thousand on $532.3$15.9 million of PCI loans. In comparison, an allowance of $118 thousand was established on $642.4 million of PCI loansor 0.3% from $5.27 billion as of December 31, 2016.2020. The allowance balancesincrease in the Company’s stockholders’ equity was primarily due to net income of $205.0 million for both periods were attributed mainlythe first quarter of 2021, partially offset by an increase in other comprehensive loss of $134.4 million and cash dividends declared of $47.4 million during the first quarter of 2021. For other factors that contributed to the PCI CRE loans.changes in stockholders’ equity, refer to Item 1. Consolidated Financial Statements — Consolidated Statement of Changes in Stockholders’ Equity in this Form 10-Q.
Book value was $37.26 per common share as of March 31, 2021, an increase of 0.1% from $37.22 per common share as of December 31, 2020. The Company paid a quarterly cash dividends of $0.33 and $0.275 per common share for the first quarters of 2021 and 2020, respectively. In April 2021, the Company’s Board of Directors declared second quarter 2021 cash dividends of $0.33 per common share. The dividend is payable on May 17, 2021 to stockholders of record as of May 3, 2021.
Deposits and Other Sources of Funds
Deposits are the Company’s primary source of funding, the cost of which has a significant impact on the Company’s net interest income and net interest margin. Additional funding is provided by short- and long-term borrowings, and long-term debt. See Item 2.MD&A — Risk Management — Liquidity Risk Management — Liquidity in this Form 10-Q for a discussion of the Company’s liquidity management. The following table summarizes the Company’s sources of funds as of March 31, 2021 and December 31, 2020:
| | | | | | | | | | | | | | | | | | | | | | | | | | | | | | | | | | | | | | |
|
| ($ in thousands) | | March 31, 2021 | | December 31, 2020 | | Change |
| Amount | | % | | Amount | | % | | $ | | % |
| Deposits | | | | | | | | | | | | |
| | | | | | | | | | | | |
| Noninterest-bearing demand | | $ | 18,919,298 | | | 38 | % | | $ | 16,298,301 | | | 36 | % | | $ | 2,620,997 | | | 16 | % |
| Interest-bearing checking | | 7,005,693 | | | 14 | % | | 6,142,193 | | | 14 | % | | 863,500 | | | 14 | % |
| Money market | | 12,218,957 | | | 25 | % | | 10,740,667 | | | 24 | % | | 1,478,290 | | | 14 | % |
| Savings | | 2,604,355 | | | 5 | % | | 2,681,242 | | | 6 | % | | (76,887) | | | (3) | % |
| | | | | | | | | | | | |
| | | | | | | | | | | | |
| | | | | | | | | | | | |
| | | | | | | | | | | | |
| Time deposits | | 8,798,833 | | | 18 | % | | 9,000,349 | | | 20 | % | | (201,516) | | | (2) | % |
| Total deposits | | $ | 49,547,136 | | | 100 | % | | $ | 44,862,752 | | | 100 | % | | $ | 4,684,384 | | | 10 | % |
| Other Funds | | | | | | | | | | | | |
| Short-term borrowings | | $ | — | | | | | $ | 21,009 | | | | | $ | (21,009) | | | (100) | % |
| | | | | | | | | | | | |
| FHLB advances | | 653,035 | | | | | 652,612 | | | | | 423 | | | 0 | % |
| Repurchase agreements | | 300,000 | | | | | 300,000 | | | | | — | | | — | % |
| Long-term debt | | 147,445 | | | | | 147,376 | | | | | 69 | | | 0 | % |
| Total other funds | | $ | 1,100,480 | | | | | $ | 1,120,997 | | | | | $ | (20,517) | | | (2) | % |
| Total sources of funds | | $ | 50,647,616 | | | | | $ | 45,983,749 | | | | | $ | 4,663,867 | | | 10 | % |
|
Deposits
The Company offers a wide variety of deposit products to both consumer and commercial customers. Deposits are an important low-cost source of funding, and affect net interest income and net interest margin. The following table presents the balances for customer deposits as of September 30, 2017 and December 31, 2016:
|
| | | | | | | | | | | | | | | | | | | | | |
| |
| ($ in thousands) | | | Change |
| | September 30, 2017 | | % of total deposits | | December 31, 2016 | | % of total
deposits | | $ | | % |
| Core deposits: | | | | | | | | | | | | |
| Noninterest-bearing demand | | $ | 10,992,674 |
| | 35 | % | | $ | 10,183,946 |
| | 34 | % | | $ | 808,728 |
| | 8 | % |
| Interest-bearing checking | | 4,108,859 |
| | 13 | % | | 3,674,417 |
| | 12 | % | | 434,442 |
| | 12 | % |
| Money market | | 7,939,031 |
| | 25 | % | | 8,174,854 |
| | 27 | % | | (235,823 | ) | | (3 | )% |
| Savings | | 2,476,557 |
| | 8 | % | | 2,242,497 |
| | 8 | % | | 234,060 |
| | 10 | % |
| Total core deposits | | 25,517,121 |
| | 81 | % | | 24,275,714 |
| | 81 | % | | 1,241,407 |
| | 5 | % |
| Time deposits | | 5,794,541 |
| | 19 | % | | 5,615,269 |
| | 19 | % | | 179,272 |
| | 3 | % |
| Total deposits | | $ | 31,311,662 |
| | 100 | % | | $ | 29,890,983 |
| | 100 | % | | $ | 1,420,679 |
| | 5 | % |
| | | | | | | |
Total deposits increased mainly due to growth in noninterest-bearing demand and interest-bearing checking deposits from existing and new customers. The Company’s deposit strategy is to grow and retain relationship-based deposits, which provides a stable and provide alow-cost source of low-cost funding and liquidity to the Company. Core
Total deposits comprised 81%were $49.55 billion as of March 31, 2021, an increase of $4.68 billion or 10% from $44.86 billion as of December 31, 2020. Deposit growth was attributable to strong growth from both commercial and consumer customers, partially offset by a reduction in higher-cost time deposits. The strongest growth was in noninterest-bearing demand deposits, which increased by $2.62 billion or 16% compared with December 31, 2020. Noninterest-bearing demand deposits were $18.92 billion or 38% of total deposits as of each of September 30, 2017 and DecemberMarch 31, 2016. The $1.242021, up from $16.30 billion or 5% increase in core deposits was primarily due to the increases in noninterest-bearing demand deposits and interest-bearing checking deposits. Noninterest-bearing demand deposits comprised 35% and 34%36% of total deposits as of September 30, 2017 and December 31, 2016, respectively. Interest-bearing checking2020. Additional information regarding the impact of deposits comprised 13%on net interest income, with a comparison of average deposit balances and 12%rates, is provided in Item 2. MD&A — Results of total depositsOperations — Net Interest Income in this Form 10-Q.
Other Sources of Funding
There were no short-term borrowings as of September 30, 2017 and DecemberMarch 31, 2016, respectively. As2021. Short-term borrowings of September 30, 2017, deposits were 110% of total loans, compared to 117%$21.0 million as of December 31, 2016, as the growth in total loans outpaced deposit growth.
Borrowings
The Company utilizes short-term and long-term2020 consisted of borrowings to manage its liquidity position. Borrowings include short-term borrowings, long-term FHLB advances and repurchase agreements.
As of September 30, 2017 and December 31, 2016, short-term borrowings were comprised ofentered into by the Company’s subsidiary, East West Bank (China) Limited’s borrowings of $24.8 million and $60.1 million, respectively. The interest rates of these borrowings ranged from 2.96% to 3.27% and 2.80% to 3.27% as of September 30, 2017 and December 31, 2016, respectively. As of September 30, 2017, the short-term borrowings of $24.8 million are due to mature in the fourth quarter of 2017. Limited.
FHLB advances increased by $1.7 million to $323.3were $653.0 million as of September 30, 2017March 31, 2021, an increase of $423 thousand from $321.6$652.6 million as of December 31, 2016.2020. As of September 30, 2017,March 31, 2021, FHLB advances had fixed and floating interest rates ranging from 1.48%zero percent to 1.72% with2.34% and remaining maturities between 1.4one month and 5.11.6 years. Of these, $405.0 million have a blended interest rate of 2.22% and will mature in the second quarter of 2021.
Gross repurchase agreements totaled $450.0$300.0 million as of each of September 30, 2017both March 31, 2021 and December 31, 2016.2020. Resale and repurchase agreements are reported net, pursuant to ASC 210-20-45, 210-20-45-11, Balance Sheet OffsettingOffsetting: Repurchase and Reverse Repurchase Agreements. Net repurchase agreements totaled $50.0 million and $350.0 million asAs of September 30, 2017both March 31, 2021 and December 31, 2016, respectively. As of September 30, 2017, $400.0 million of repurchase2020, the Company did not have any gross resale agreements that were eligible for netting against resale agreements, resulting in $50.0 millionpursuant to ASC 210-20-45-11. As of net repurchase agreements reported. In comparison, $100.0 million ofMarch 31, 2021, gross repurchase agreements were eligible for netting against resale agreements, resulting in $350.0 million of net repurchase agreements reported as of December 31, 2016. As of September 30, 2017, gross repurchase agreements of $450.0 million had interest rates ranging between 3.54%from 2.41% to 3.58% and2.49%, with original terms ranging between 10.04.0 years and 16.58.5 years and remaining maturities between 2.3 years and 2.4 years. The remaining maturity terms of the repurchase agreements range between 5.1 and 5.9 years.
Repurchase agreements are accounted for as collateralized financing transactions and recorded atas liabilities based on the balancesvalues at which the securities wereassets are sold. TheAs of March 31, 2021, the collateral for the repurchase agreements is primarilywas comprised of U.S. Treasury securities, U.S. government agency and U.S. government sponsoredgovernment-sponsored enterprise mortgage-backed securities, and U.S. government agency and U.S. government sponsored enterprise debtTreasury securities. To ensure that the market value of the underlying collateral remains sufficient, the Company monitors the fair value of collateral pledged relative to the principal amounts borrowed under repurchase agreements. The Company manages liquidity risks related to the repurchase agreements by sourcing fundingfunds from a diverse group of counterparties, and entering into repurchase agreements with longer durations, when appropriate. For additional details, see Note 5 4 — Securities Assets Purchased under Resale Agreements and Sold under Repurchase Agreements to the Consolidated Financial Statements.Statements in this Form 10-Q.
Long-Term Debt
The Company uses long-term debt to provide funding to acquire income earninginterest-earning assets, and to enhance liquidity.liquidity and regulatory capital adequacy. Long-term debt whichtotaled $147.4 million as of both March 31, 2021 and December 31, 2020, respectively. Long-term debt consists of junior subordinated debt, and a term loan, decreased $9.8 million or 5% from $186.3 millionwhich qualifies as of December 31, 2016 to $176.5 million as of September 30, 2017. The decrease was primarily due to the quarterly repayment on the term loan, totaling $10.0 million, during the nine months ended September 30, 2017.
Tier 2 capital for regulatory purposes. The junior subordinated debt was issued in connection with the Company’s various pooled trust preferred securities offerings. Junior subordinated debt is recordedofferings, as a component of long-term debt and includes the value of thewell as with common stock issued by the six wholly-ownedwholly owned subsidiaries of the Company in conjunction with these transactions. The junior subordinated debt totaled $152.6 million and $146.3 million as of September 30, 2017 and December 31, 2016, respectively.offerings. The junior subordinated debt had a weighted averageweighted-average interest rate of 2.73%1.78% and 2.22%3.13% for the nine months ended September 30, 2017first quarters of 2021 and 2016,2020, respectively, with remaining maturities ranging between 13.7 years and remaining maturity terms of 17.2 to 20.016.5 years as of September 30, 2017. Beginning in 2016, trust preferred securities no longer qualify as Tier 1 capital and are limited to Tier 2 capital for regulatory purposes, based on Basel III Capital Rules. For further discussion, see Item 1. Business — Supervision and Regulation — Capital Requirements of the Company’s 2016 Form 10-K.March 31, 2021.
In 2013, the Company entered into a $100.0 million three-year term loan agreement. The terms of the agreement were modified in 2015 to extend the term loan maturity from July 1, 2016 to December 31, 2018, where principal repayments of $5.0 million are due quarterly. The term loan bears interest at the rate of the three-month London Interbank Offered Rate plus 150 basis points and the weighted average interest rate was 2.65% and 2.19% for the nine months ended September 30, 2017 and 2016, respectively. The outstanding balance of the term loan was $30.0 million and $40.0 million as of September 30, 2017 and December 31, 2016, respectively.
Capital
The Company maintains an adequate capital base to support its anticipated asset growth, operating needs and credit risks, and to ensure that East West and the Bank are in compliance with all regulatory capital guidelines. The Company engages in regular capital planning processes to optimize the use of available capital and to appropriately plan for future capital needs. The capital plan considers capital needs for the foreseeable future and allocates capital to both existing and future business activities. In addition, the Company conducts capital stress tests as part of its annual capital planning process. The stress tests enable the Company to assess the impact of adverse changes in the economy and interest rates on its capital base.
The Company’s stockholders’ equity increased by $354.2 million or 10% to $3.78 billion as of September 30, 2017, compared to $3.43 billion as of December 31, 2016. The Company’s primary source of capital is the retention of its operating earnings. Retained earnings increased by $333.1 million or 15%to $2.52 billion as of September 30, 2017, compared to $2.19 billion as of December 31, 2016. The increase was primarily due to net income of $420.7 million, reduced by $87.6 million of cash dividends during the nine months ended September 30, 2017. In addition, common stock and additional paid-in capital increased by $17.7 million or 1.0% primarily due to the activities in employee stock compensation plans. For other factors that contributed to the changes in stockholders’ equity, refer to the Consolidated Statements of Changes in Stockholders’ Equity.
Book value was $26.17 per common share based on 144.5 million common shares outstanding as of September 30, 2017, compared to $23.78 per common share based on 144.2 million common shares outstanding as of December 31, 2016. The Company made dividend payments of $0.20 per common share in each quarter during the nine months ended September 30, 2017 and 2016. In October 2017, the Company’s Board of Directors (the “Board”) declared fourth quarter 2017 cash dividends for the Company’s common stock. The common stock cash dividend of $0.20 per share is payable on November 15, 2017 to stockholders of record as of November 1, 2017.
Regulatory Capital and Ratios
The federal banking agencies have risk-based capital adequacy guidelines intended to ensure that are designed to reflectbanking organizations maintain capital that is commensurate with the degree of risk associated with a banking organization’s operationsoperations. The Company and transactions.the Bank are subject to regulatory capital adequacy requirements. The guidelines cover transactions that are reported on the balance sheet as well as those recorded as off-balance sheet items. In 2013,Bank is a member bank of the Federal Reserve Board,System and is primarily regulated by the Federal Deposit Insurance CorporationReserve and Officethe California Department of Financial Protection and Innovation (“DFPI”). The Company and the Comptroller ofBank are required to comply with the Currency issued the final Basel III Capital Rules establishing a new comprehensive capital framework for strengthening international capital standards as well as implementing certain provisions ofadopted by the “Dodd-Frank Act”.federal banking agencies. Both the Company and the Bank are standardized approaches institutions under Basel III Capital Rules. See Item 1. Business — Supervision and Regulation — Regulatory Capital Requirements and Recent Regulatory Capital-Related Development of the Company’s 20162020 Form 10-K for additional details.
The Basel III Capital Rules became effective for the Company and the Bankadopted ASU 2016-13 on January 1, 2015 (subject2020. The Company has elected the phase-in option provided by regulatory guidance, which delays the estimated impact of Current Expected Credit Losses (“CECL”) on regulatory capital for two years and phases the impact over three years. As a result, the effects of CECL on the Company’s and the Bank’s regulatory capital will be delayed through the year 2021, after which the effects will be phased-in over a three-year period from January 1, 2022 through December 31, 2024. In April 2020, in recognition of CARES Act requirements, and to phase-in periods for certain components).
The Basel III Capital Rules requirefacilitate the use of the PPPLF, the U.S. banking agencies issued an interim final rule that banking organizations maintainmay exclude from leverage and risk-based capital requirements any eligible assets sold or pledged to the Federal Reserve on a minimum CET1 rationon-recourse basis as part of 4.5%,the PPPLF. In addition, under the CARES Act, loans originated by a Tier 1 capital ratio of 6.0%, and a total capital ratio of 8.0%. Moreover,banking organization under the rules require that banking organizations maintain a capital conservation buffer of 2.5% abovePPP (whether or not sold or pledged in the capital minimums are being phased-in over four years beginning in 2016 (increasing by 0.625% on each subsequent January 1, until it reaches 2.5% on January 1, 2019). When fully phased-in in 2019, the banking organizationsPPPLF) will be requiredrisk-weighted at zero percent for regulatory capital purposes. Accordingly, the March 31, 2021 capital ratios exclude the impact of the increased allowance for loan losses due to maintain a minimum CET1 capital ratioCECL, and PPP loans are risk-weighted at zero percent. As of 7.0%, a minimum Tier 1 capital ratio of 8.5% and a minimum total capital ratio of 10.5% to avoid limitations on capital distributions (including common stock dividends and share repurchases) and certain discretionary incentive compensation payments.
The Company is committed to maintaining capital at a level sufficient to assure the Company’s stockholders, customers and regulators thatMarch 31, 2021, the Company anddid not have any PPP loans pledged as collateral to the Bank are financially sound. As of September 30, 2017 and December 31, 2016, both the Company and the Bank were considered “well-capitalized,” and met all capital requirements on a fully phased-in basis under the Basel III Capital Rules.PPPLF.
The following table presents the Company’s and the Bank’s capital ratios as of September 30, 2017March 31, 2021 and December 31, 20162020 under the Basel III Capital Rules, and those required by regulatory agencies for capital adequacy and well-capitalized classification purposes:
| | | | | | | | | | | | | | | | | | | | | | | | | | | | | | | | | | | | | | | | | | | | | | |
|
| | Basel III Capital Rules | | |
| March 31, 2021 | | December 31, 2020 | | Minimum
Regulatory
Requirements | | Fully Phased-in Minimum Regulatory Requirements (2) | | Well-
Capitalized
Requirements | | |
| Company | | East West
Bank | | Company | | East West
Bank | | | | |
| Risk-based capital ratios: | | | | | | | | | | | | | | | | |
| CET1 capital | | 12.7 | % | | 12.2 | % | | 12.7 | % | | 12.1 | % | | 4.5 | % | | 7.0 | % | | 6.5 | % | | |
| Tier 1 capital | | 12.7 | % | | 12.2 | % | | 12.7 | % | | 12.1 | % | | 6.0 | % | | 8.5 | % | | 8.0 | % | | |
| Total capital | | 14.3 | % | | 13.4 | % | | 14.3 | % | | 13.4 | % | | 8.0 | % | | 10.5 | % | | 10.0 | % | | |
Tier 1 leverage (1) | | 9.1 | % | | 8.7 | % | | 9.4 | % | | 9.0 | % | | 4.0 | % | | 4.0 | % | | 5.0 | % | | |
|
|
| | | | | | | | | | | | | | | | | | | | | |
| |
| | | Basel III Capital Rules |
| | September 30, 2017 | | December 31, 2016 | | Minimum Regulatory Requirements | | Well- Capitalized Requirements | | Fully Phased-in Minimum Regulatory Requirements |
| | Company | | East
West
Bank | | Company | | East
West
Bank | | | |
| CET1 risk-based capital | | 11.4 | % | | 11.3 | % | | 10.9 | % | | 11.3 | % | | 4.5 | % | | 6.5 | % | | 7.0 | % |
| Tier 1 risk-based capital | | 11.4 | % | | 11.3 | % | | 10.9 | % | | 11.3 | % | | 6.0 | % | | 8.0 | % | | 8.5 | % |
| Total risk-based capital | | 12.9 | % | | 12.3 | % | | 12.4 | % | | 12.3 | % | | 8.0 | % | | 10.0 | % | | 10.5 | % |
| Tier 1 leverage capital | | 9.4 | % | | 9.3 | % | | 8.7 | % | | 9.1 | % | | 4.0 | % | | 5.0 | % | | 4.0 | % |
| |
(1)The Company’s CET1 and Tier 1 capital ratios have improved by 49 basis points, while the total risk-based and Tier 1 leverage well-capitalized requirement applies only to the Bank since there is no Tier 1 leverage ratio component in the definition of a well-capitalized bank-holding company.
(2)As of January 1, 2019, the 2.5% capital conservation buffer above the minimum risk-based capital ratios increased by 48was required in order to avoid limitations on distributions, including dividend payments and 65 basis points, respectively, duringcertain discretionary bonus payments to executive officers.
The Company is committed to maintaining strong capital levels to assure the nine months ended September 30, 2017. The improvement was primarily driven byCompany’s investors, customers and regulators that the increases in revenues, primarily dueCompany and the Bank are financially sound. As of March 31, 2021 and December 31, 2020, both the Company and the Bank continued to exceed all “well-capitalized” capital requirements and the fully phased-in required minimum capital requirements under the Basel III Capital Rules. Total risk-weighted assets were $39.57 billion as of March 31, 2021, an increase in net interest income and net gains recorded from the sale of commercial property during the first quarter of 2017. The $1.82$1.17 billion or 7% increase in risk-weighted assets increased3% from $27.36$38.41 billion as of December 31, 2016 to $29.18 billion as of September 30, 20172020. The increase in the risk-weighted assets was primarily due to loan growth and increased AFS debt securities.
Other Matters
London Interbank Offered Rate Transition
On March 5, 2021, the growthUnited Kingdom’s Financial Conduct Authority (“FCA”) confirmed that the 1-week and 2-month U.S. dollar (“USD”) London Interbank Offered Rate (“LIBOR”) settings will permanently cease following the LIBOR publication on December 31, 2021, and that the overnight and 12-month USD LIBOR settings will permanently cease following the LIBOR publication on June 30, 2023. The 1-month, 3-month and 6-month USD LIBOR settings will either cease to be provided or will be provided on a synthetic basis, subject to FCA consideration, after the LIBOR publication on June 30, 2023. To the extent the 1-month, 3-month and 6-month USD LIBOR settings are provided on a synthetic basis, they will not be considered representative of the underlying market or economic reality they are intended to measure. The federal banking agencies have continued to encourage banks to transition away from LIBOR as soon as practicable. The Alternative Reference Rates Committee (“ARRC”) has proposed the Secured Overnight Financing Rate (“SOFR”) as its preferred rate as an alternative to LIBOR, although the ARRC has not proposed that SOFR be required.
Given LIBOR’s extensive use across financial markets, the transition away from LIBOR presents various risks and challenges to financial markets and institutions, including to the Company. The majority of the Company’s Consolidated Balance Sheets. As of SeptemberLIBOR-based loans, derivatives, debt securities, resale agreements, junior subordinated debt and repurchase agreements are indexed to LIBOR tenors that will cease to be published on June 30, 2017, the Company’s CET1 risk-based capital, Tier 1 risk-based capital, total risk-based capital ratios and Tier 1 leverage capital ratios were 11.4%, 11.4%, 12.9% and 9.4%, respectively, well above the well-capitalized requirements of 6.5%, 8.0%, 10.0% and 5.0%, respectively.
Regulatory Matters
2023. The Bank entered into a Written Agreement, dated November 9, 2015, with the Federal Reserve Bank of San Francisco (the “Written Agreement”), to correct less than satisfactory BSA and AML programs detailed in a joint examination by the Federal Reserve Bank of San Francisco (“FRB”) and the California Department of Business Oversight (“DBO”). The Bank also entered into a related Memorandum of Understanding (“MOU”) with the DBO in 2015. See Item 7. MD&A — Regulatory Matters and Note 18 — Regulatory Requirements and Matters to the Consolidated Financial Statementsvolume of the Company’s 2016 Form 10-KLIBOR-based products that mature after June 30, 2023 is significant and, if not sufficiently planned for, further details.the discontinuation of LIBOR could result in financial, operational, legal, reputational or compliance risks to the Company.
The transition is anticipated to span several reporting periods through mid-2023 (depending on the setting) with the recently confirmed LIBOR cessation dates. The Company believeshas created a cross-functional team to manage the communication of the Company’s transition plans with both internal and external stakeholders and to ensure that the Bank is making progress in executingCompany appropriately updates its business processes, analytical tools, information systems and contract language to minimize disruptions during and after the compliance plansLIBOR transition. The Company has completed a review of LIBOR contracts maturing after the LIBOR cessation dates and programs required by the Written Agreement and MOU, although there can be no assurances that our plans and progress will be foundhas begun taking steps to be satisfactory by our regulators. To date, the Bank has added significant resourcesconvert these contracts to meet the monitoring and reporting obligations imposed by the Written Agreement and will continue to require significant management and third party consultant resources to comply with the Written Agreement and MOU, and to address anyalternative rates. For additional findings or recommendations by the regulators. These incremental administrative and third party costs, as well as the operational restrictions imposed by the Written Agreement, may adversely affect the Bank’s results of operations.
If additional compliance issues are identified or the regulators determine the Bank has not satisfactorily complied with the terms of the Written Agreement, the regulators could take further actions with respectinformation related to the Bank and, if such further actions were taken, such actions could have a material adverse effectpotential impact surrounding the transition from LIBOR on the Bank. The operating and other conditionsCompany’s business, see Item 1A. Risk Factors in the BSA and AML program and the auditing and oversight of the program that led to the Written Agreement and MOU could also lead to an increased risk of being subject to additional actions by the DBO and FRB, an increased risk of future examinations that may downgrade the regulatory ratings of the Bank, and an increased risk investigations by other government agencies may result in fines, penalties, increased expenses or restrictions on operations. Company’s 2020 Form 10-K.
Off-Balance Sheet Arrangements
In the course of the Company’s business, the Company may enter into or be a party to transactions that are not recorded on the Consolidated Balance SheetsSheet and are considered to be off-balance sheet arrangements. Off-balance sheet arrangements are any contractual arrangements whereby an unconsolidatedto which a nonconsolidated entity is a party and under which the Company has: (1) any obligation under a guarantee contract; (2) a retained or contingent interest in assets transferred to an unconsolidated entity or similar arrangement that serves as credit, liquidity or market risk support to that entity for such assets; (3) any obligation under certain derivative instruments; or (4) any obligation under a material variable interest held by the Company in an unconsolidateda nonconsolidated entity that provides financing, liquidity, market risk or credit risk support to the Company, or engages in leasing, hedging or research and development services with the Company.
Commitments to Extend Credit
As a financial service provider, the Company routinely enters into commitments to extend credit to customers, such as loan commitments, commercial letters of credit for foreign and domestic trade, SBLCsstandby letters of credit (“SBLCs”) and financial guarantees.guarantees to meet the financing needs of its customers. Many of these commitments to extend credit may expire without being drawn upon. The credit policies used in underwriting loans to customers are also used to extend these commitments. Under some of these contractual agreements, the Company may also have liabilities contingent upon the occurrence of certain events. The Company’s liquidity sources have been, and are expected to be, sufficient to meet the cash requirements of its lending activities. The following table presentsInformation about the Company’s loan commitments, commercial letters of credit and SBLCs asis provided in Note 10 — Commitments and Contingencies to the Consolidated Financial Statements in this Form 10-Q.
Guarantees
In the ordinary course of September 30, 2017:business, the Company periodically enters into various guarantee agreements in which the Company sells or securitizes loans with recourse. Under these guarantee arrangements, the Company is contingently obligated to repurchase the recourse component of the loans when the loans default. Additional information regarding guarantees is provided in Note 10 —Commitments and Contingencies to the Consolidated Financial Statements in this Form 10-Q.
|
| | | | |
| |
| ($ in thousands) | | Commitments
Outstanding |
| Loan commitments | | $ | 4,956,515 |
|
| Commercial letters of credit and SBLCs | | $ | 1,757,648 |
|
| |
A discussion of significant contractual arrangements under which the Company may be held contingently liable is included in Note 11 10—Commitments and Contingenciesto the Consolidated Financial Statements.Statements in this Form 10-Q. In addition, the Company has commitments and obligations under post-retirement benefit plans as described in Note 15 14 — Employee Benefit Plans to the Consolidated Financial Statements of the Company’s 20162020 Form 10-K, and has contractual obligations for future payments on debts, borrowings and lease obligations as detailed in Item 7 —7. MD&A — Off-Balance Sheet Arrangements and Aggregate Contractual Obligations of the Company’s 20162020 Form 10-K.
Asset Liability and Market Risk Management
LiquidityOverview
Liquidity refersIn conducting its businesses, the Company is exposed to a variety of risks, some of which are inherent to the financial services industry and others of which are more specific to the Company’s abilitybusinesses. The Company operates under a Board-approved enterprise risk management (“ERM”) framework, which outlines the company-wide approach to risk management and oversight, and describes the structures and practices employed to manage the current and emerging risks inherent to the Company. The Company’s ERM program incorporates risk management throughout the organization in identifying, managing, monitoring, and reporting risks. It identifies the Company’s major risk categories as credit risk; liquidity risk; capital risk; market risk; operational risk; regulatory, compliance and legal risks; accounting and tax risks, and strategic and reputational risks.
The Board of Directors monitors the ERM program to ensure independent review and oversight of the Company’s risk appetite and control environment. The Risk Oversight Committee provides focused oversight of the Company’s identified enterprise risk categories on behalf of the full Board of Directors. Under the direction of the Risk Oversight Committee, management committees apply targeted strategies to reduce the risks to which the Company’s operations are exposed.
The Company’s ERM program is executed along the three lines of defense model, which provides for a consistent and standardized risk management control environment across the enterprise. The first line of defense is comprised of production, operational, and support units. The second line of defense is comprised of various risk management and control functions charged with monitoring and managing specific major risk categories and/or risk subcategories. The third line of defense is comprised of the Internal Audit function and Independent Asset Review. Internal Audit provides assurance and evaluates the effectiveness of risk management, control and governance processes as established by the Company. Internal Audit has organizational independence and objectivity, reporting directly to the Board’s Audit Committee. Further discussion and analysis of each major risk area are included in the following sub-sections of Risk Management.
Credit Risk Management
Credit risk is the risk that a borrower or counterparty will fail to perform according to the terms and conditions of a loan or investment and expose the Company to loss. Credit risk exists with many of the Company’s assets and exposures such as loans and certain derivatives. The majority of the Company’s credit risk is associated with lending activities.
The Risk Oversight Committee has primary oversight responsibility of identifying enterprise risk categories including credit risk. The Risk Oversight Committee monitors management’s assessment of asset quality and credit risk trends, credit quality administration and underwriting standards; as well as portfolio credit risk management strategies and processes, such as diversification and liquidity; all of which enable management to control credit risk. At the management level, the Credit Risk Management Committee has primary oversight responsibility for credit risk. The Senior Credit Supervision function manages credit policy and provides the resources to manage the line of business transactional credit risk, assuring that all exposure is risk-rated according to the requirements of the credit risk rating policy. The Senior Credit Supervision function evaluates and reports the overall credit risk exposure to senior management and the Risk Oversight Committee. The Independent Asset Review function supports a strong credit risk management culture by providing independent and objective assessment of underwriting and documentation quality, reporting directly to the Board’s Risk Oversight Committee. A key focus of the Company’s credit risk management is adherence to a well-controlled underwriting process.
The Company assesses overall credit quality performance of the loan held-for-investment portfolio through an integrated analysis of specific performance ratios. This approach forms the basis of the discussion in the sections immediately following: Criticized loans, Nonperforming Assets, TDRs and Allowance for Credit Losses.
Credit Quality
The Company utilizes a credit risk rating system to assist in monitoring credit quality. Loans are evaluated using the Company’s internal credit risk rating of 1 through 10. Loans risk rated 1 through 5 are assigned an internal risk rating of “Pass.” Loans assigned with a credit risk rating of 6 have potential weaknesses that warrant closer attention by management and are assigned an internal risk rating of “Special mention.” Loans assigned a credit risk rating of 7 or 8 have well-defined weaknesses that may jeopardize the full and timely repayment of the loan; these are assigned an internal risk rating of “Substandard.” Loans assigned a credit risk rating of 9 have insufficient sources of repayment and a high probability of loss; these are assigned an internal risk rating of “Doubtful.” Loans assigned a credit risk rating of 10 are uncollectible and of such little value that they are no longer considered bankable assets; these are assigned an internal risk rating of “Loss.” Exposures categorized as criticized consist of “Special mention,” “Substandard,” “Doubtful” and “Loss” categories. Exposures categorized as classified consist of “Substandard,” “Doubtful” and “Loss” categories. For more information on credit quality indicators, refer to Note 7 — Loans Receivable and Allowance for Credit Losses to the Consolidated Financial Statements in this Form 10-Q.
The following table presents the Company’s criticized loans as of March 31, 2021 and December 31, 2020.
| | | | | | | | | | | | | | | | | | | | | | | | | | |
|
| ($ in thousands) | | | | | | Change |
| March 31, 2021 | | December 31, 2020 | | $ | | % |
| Criticized loans | | | | | | | | |
| | | | | | | | |
| | | | | | | | |
| | | | | | | | |
| | | | | | | | |
| | | | | | | | |
| | | | | | | | |
| | | | | | | | |
| | | | | | | | |
| | | | | | | | |
| | | | | | | | |
| | | | | | | | |
| | | | | | | | |
| | | | | | | | |
| | | | | | | | |
| | | | | | | | |
| | | | | | | | |
| | | | | | | | |
| | | | | | | | |
| | | | | | | | |
| | | | | | | | |
| | | | | | | | |
| | | | | | | | |
| | | | | | | | |
| | | | | | | | |
| | | | | | | | |
| | | | | | | | |
| | | | | | | | |
| | | | | | | | |
| | | | | | | | |
| | | | | | | | |
| | | | | | | | |
| | | | | | | | |
| | | | | | | | |
| | | | | | | | |
| | | | | | | | |
| | | | | | | | |
| Special mention loans | | $ | 504,226 | | | $ | 564,555 | | | $ | (60,329) | | | (11) | % |
| Classified loans | | 712,693 | | | 652,880 | | | 59,813 | | | 9 | % |
| Total criticized loans | | $ | 1,216,919 | | | $1,217,435 | | $ | (516) | | | 0 | % |
| | | | | | | | |
| Special mention loans to loans held-for-investment | | 1.27 | % | | 1.47 | % | | | | |
| Classified loans to loans held-for-investment | | 1.80 | % | | 1.70 | % | | | | |
| Criticized loans to loans held-for-investment | | 3.07 | % | | 3.17 | % | | | | |
|
As of March 31, 2021, criticized loans totaled $1.22 billion, or 3.07% of loans held-for-investment, compared with $1.22 billion, or 3.17% of loans held-for-investment, as of December 31, 2020. Quarter-over-quarter, special mention loans decreased to $504.2 million as of March 31, 2021, from $564.6 million as of December 31, 2020. Classified loans increased to $712.7 million as of March 31, 2021, from $652.9 million as of December 31, 2020. The quarter-over-quarter increase in classified loans was more than offset by the quarter-over-quarter decrease in special mention loans.
Nonperforming Assets
Nonperforming assets are comprised of nonaccrual loans, other real estate owned (“OREO”) and other nonperforming assets. Other nonperforming assets and OREO are repossessed assets and properties, respectively, acquired through foreclosure, or through full or partial satisfaction of loans held-for-investment. Loans are generally placed on nonaccrual status when they become 90 days past due or when the full collection of principal or interest becomes uncertain regardless of the length of past due status. Collectability is generally assessed based on economic and business conditions, the borrower’s financial condition and the adequacy of collateral, if any. For additional details regarding the Company’s nonaccrual loan policy, see Note 1 — Summary of Significant Accounting Policies — Loans Held-for-Investment to the Consolidated Financial Statements of the Company’s 2020 Form 10-K.
The following table presents information regarding nonperforming assets as of the periods indicated:
| | | | | | | | | | | | | | | | | | | | | | | | | | |
|
| ($ in thousands) | | | | | | Change |
| | March 31, 2021 | | December 31, 2020 | | $ | | % |
| Commercial: | | | | | | | | |
| C&I | | $ | 125,536 | | | $ | 133,939 | | | $ | (8,403) | | | (6) | % |
| CRE: | | | | | | | | |
| CRE | | 50,134 | | | 46,546 | | | 3,588 | | | 8 | % |
| Multifamily residential | | 4,693 | | | 3,668 | | | 1,025 | | | 28 | % |
| Construction and land | | 19,900 | | | — | | | 19,900 | | | 100 | % |
| Total CRE | | 74,727 | | | 50,214 | | | 24,513 | | | 49 | % |
| Consumer: | | | | | | | | |
| Residential mortgage: | | | | | | | | |
| Single-family residential | | 18,296 | | | 16,814 | | | 1,482 | | | 9 | % |
| HELOCs | | 10,877 | | | 11,696 | | | (819) | | | (7) | % |
| Total residential mortgage | | 29,173 | | | 28,510 | | | 663 | | | 2 | % |
| Other consumer | | 2,526 | | | 2,491 | | | 35 | | | 1 | % |
| Total nonaccrual loans | | 231,962 | | | 215,154 | | | 16,808 | | | 8 | % |
| OREO, net | | 15,824 | | | 15,824 | | | — | | | — | % |
| Other nonperforming assets | | 10,360 | | | 3,890 | | | 6,470 | | | 166 | % |
| Total nonperforming assets | | $ | 258,146 | | | $ | 234,868 | | | $ | 23,278 | | | 10 | % |
Nonperforming assets to total assets | | 0.45 | % | | 0.45 | % | | | | |
| Nonaccrual loans to loans held-for-investment | | 0.59 | % | | 0.56 | % | | | | |
| Allowance for loan losses to nonaccrual loans | | 261.90 | % | | 288.16 | % | | | | |
| | | | | | | | |
| TDRs included in nonperforming loans | | $ | 83,732 | | | $ | 71,924 | | | | | |
|
Period-over-period changes to nonaccrual loans represent loans that are placed on nonaccrual status in accordance with the Company’s accounting policy, offset by reductions from loans that are repaid, paid down, charged off, sold, foreclosed or no longer classified as nonaccrual as a result of continued performance and improvement in the borrowers’ financial condition and loan repayment capabilities. Nonaccrual loans were $232.0 million or 0.59% of loans held-for-investment as of March 31, 2021, compared with $215.2 million or 0.56% of loans held-for-investment as of December 31, 2020. Quarter-over-quarter, nonaccrual loans increased by $16.8 million or 8%, primarily driven by the inflow of a construction and land loan, and a CRE loan to nonaccrual status, partially offset by paydowns. C&I nonaccrual loans were 54% and 62% of total nonaccrual loans as of March 31, 2021 and December 31, 2020, respectively. As of March 31, 2021, $123.6 million or 53% of nonaccrual loans were less than 90 days delinquent. In comparison, $106.4 million or 49% of nonaccrual loans were less than 90 days delinquent as of December 31, 2020.
OREO was $15.8 million as of both March 31, 2021 and December 31, 2020 due to the Company taking possession of one retail CRE property located in Southern California.
Other nonperforming assets totaled $10.4 million and $3.9 million as of March 31, 2021 and December 31, 2020, respectively, an increase of $6.5 million or 166% due to one oil & gas loan that was transferred to foreclosed assets.
The following table presents the accruing loans past due by portfolio segment as of March 31, 2021 and December 31, 2020:
| | | | | | | | | | | | | | | | | | | | | | | | | | | | | | | | | | | | | | | | |
|
| ($ in thousands) | | | | Total Accruing Past Due Loans (1) | | Change | | Percentage of
Total Loans Outstanding |
| | | March 31,
2021 | | December 31,
2020 | | $ | | % | | March 31,
2021 | | December 31,
2020 |
| Commercial: | | | | | | | | | | | | | | |
| C&I | | | | $ | 32,050 | | | $ | 9,717 | | | $ | 22,333 | | | 230 | % | | 0.23 | % | | 0.07 | % |
| CRE: | | | | | | | | | | | | | | |
| CRE | | | | 39,495 | | | 375 | | | 39,120 | | | NM | | 0.34 | % | | 0.00 | % |
| Multifamily residential | | | | — | | | 1,818 | | | (1,818) | | | (100) | % | | — | % | | 0.06 | % |
| Construction and land | | | | — | | | 19,900 | | | (19,900) | | | (100 | %) | | — | % | | 3.32 | % |
| Total CRE | | | | 39,495 | | | 22,093 | | | 17,402 | | | 79 | % | | 0.26 | % | | 0.15 | % |
| Total commercial | | | | 71,545 | | | 31,810 | | | 39,735 | | | 125 | % | | 0.25 | % | | 0.11 | % |
| Consumer: | | | | | | | | | | | | | | |
| Residential mortgage: | | | | | | | | | | | | | | |
| Single-family residential | | | | 12,575 | | | 12,494 | | | 81 | | | 1 | % | | 0.15 | % | | 0.15 | % |
| HELOCs | | | | 2,603 | | | 6,052 | | | (3,449) | | | (57) | % | | 0.15 | % | | 0.38 | % |
| Total residential mortgage | | | | 15,178 | | | 18,546 | | | (3,368) | | | (18) | % | | 0.15 | % | | 0.19 | % |
| Other consumer | | | | 246 | | | 234 | | | 12 | | | 5 | % | | 0.17 | % | | 0.14 | % |
| Total consumer | | | | 15,424 | | | 18,780 | | | (3,356) | | | (18) | % | | 0.15 | % | | 0.19 | % |
| Total | | | | $ | 86,969 | | | $ | 50,590 | | | $ | 36,379 | | | 72 | % | | 0.22 | % | | 0.13 | % |
|
NM — Not meaningful.
(1)There were no accruing loans past due 90 days or more as of both March 31, 2021 and December 31, 2020.
Troubled Debt Restructurings
TDRs are loans for which contractual terms have been modified by the Company for economic or legal reasons related to a borrower’s financial difficulties, and for which a concession to the borrower was granted that the Company would not otherwise consider. The Company’s loan modifications are handled on a case-by-case basis and are negotiated to achieve mutually agreeable terms that maximize loan collectability and to meet the borrower’s financial needs. The following table presents the performing and nonperforming TDRs by portfolio segment as of March 31, 2021 and December 31, 2020. The allowance for loan losses for TDRs was $5.3 million as of March 31, 2021 and $10.3 million as of December 31, 2020.
| | | | | | | | | | | | | | | | | | | | | | | | | | | | | | | | | | | | | | | | | | | | |
|
| ($ in thousands) | | March 31, 2021 | | December 31, 2020 | | | | | | |
| Performing
TDRs | | Nonperforming
TDRs | | Total | | Performing
TDRs | | Nonperforming
TDRs | | Total | | | | | | |
| Commercial: | | | | | | | | | | | | | | | | | | |
| C&I | | $ | 85,553 | | | $ | 60,405 | | | $ | 145,958 | | | $ | 85,767 | | | $ | 68,451 | | | $ | 154,218 | | | | | | | |
| CRE: | | | | | | | | | | | | | | | | | | |
| CRE | | 24,798 | | | — | | | 24,798 | | | 24,851 | | | — | | | 24,851 | | | | | | | |
| Multifamily residential | | 3,305 | | | 1,423 | | | 4,728 | | | 3,310 | | | 1,448 | | | 4,758 | | | | | | | |
| Construction and land | | — | | | 19,900 | | | 19,900 | | | 19,900 | | | — | | | 19,900 | | | | | | | |
| Total CRE | | 28,103 | | | 21,323 | | | 49,426 | | | 48,061 | | | 1,448 | | | 49,509 | | | | | | | |
| Consumer: | | | | | | | | | | | | | | | | | | |
| Residential mortgage: | | | | | | | | | | | | | | | | | | |
| Single-family residential | | 6,822 | | | 1,150 | | | 7,972 | | | 6,748 | | | 1,169 | | | 7,917 | | | | | | | |
| HELOCs | | 2,617 | | | 854 | | | 3,471 | | | 2,631 | | | 856 | | | 3,487 | | | | | | | |
| Total residential mortgage | | 9,439 | | | 2,004 | | | 11,443 | | | 9,379 | | | 2,025 | | | 11,404 | | | | | | | |
| | | | | | | | | | | | | | | | | | |
| Total TDRs | | $ | 123,095 | | | $ | 83,732 | | | $ | 206,827 | | | $ | 143,207 | | | $ | 71,924 | | | $ | 215,131 | | | | | | | |
| | | | | | |
Performing TDRs were $123.1 million as of March 31, 2021, a decrease of $20.1 million or 14% from $143.2 million as of December 31, 2020. This decrease primarily reflected the transfer of one construction loan of $19.0 million from performing TDR to nonperforming TDR. The C&I performing TDRs are mainly comprised of borrowers from the oil and gas, and general manufacturing & wholesale sectors. Over 99% and 85% of the performing TDRs were current as of March 31, 2021 and December 31, 2020, respectively.
Nonperforming TDRs were $83.7 million as of March 31, 2021, an increase of $11.8 million or 16% from $71.9 million as of December 31, 2020. This increase primarily reflected the migration of a construction loan from performing TDR to nonperforming TDR, partially offset by paydowns and a transfer of one C&I loan to other nonperforming assets. The C&I nonperforming TDRs are mainly comprised of borrowers from the oil and gas sector.
Existing TDRs that were subsequently modified in response to the COVID-19 pandemic continue to be classified as TDRs. As of March 31, 2021, there were six TDRs totaling $21.8 million that were provided subsequent modifications related to the COVID-19 pandemic.
Loan Modifications Due to COVID-19 Pandemic
Since late March 2020, the Company has granted various commercial and consumer loan accommodation programs, predominantly in the form of payment deferrals, to provide relief to borrowers experiencing financial hardship due to the COVID-19 pandemic. Section 4013 of the CARES Act, as amended by the CAA, permits a financial institution to elect to temporarily suspend TDR accounting under ASC Subtopic 310-40 in certain circumstances. To be eligible under Section 4013 of the CARES Act, as modified by the CAA, a loan modification must be (1) related to the COVID-19 pandemic; (2) executed on a loan that was not more than 30 days past due as of December 31, 2019; and (3) executed between March 1, 2020, and the earlier of (a) 60 days after the date of termination of the federal National Emergency or (b) January 1, 2022. The federal banking regulators, in consultation with the Financial Accounting Standards Board (“FASB”), issued the Interagency Statement on Loan Modifications and Reporting for Financial Institutions Working with Customer Affected by the Coronavirus (Revised) (the “Interagency Statement”) on April 7, 2020 confirming that, for loans not subject to Section 4013 of the CARES Act, short-term modifications (i.e., six months or less) made on a good faith basis in response to the COVID-19 pandemic to borrowers who were current as of the implementation date of a loan modification, or modifications granted under government mandated modification programs, are not considered as TDRs under ASC Subtopic 310-40. See additional information in Note 1 — Summary of Significant Accounting Policies — Troubled Debt Restructurings to the Consolidated Financial Statements of the Company’s 2020 Form 10-K.
The delinquency aging of loans modified related to the COVID-19 pandemic is frozen at the time of the modification. As a result, the recognition of delinquent loans, nonaccrual status and loan net charge-offs may be delayed for certain borrowers who are enrolled in these loan modification programs, which would have otherwise moved into past due or nonaccrual status. Interest income continues to be recognized over the accommodation period.
The following table provides a summary of the COVID-19 pandemic-related loan modifications that remained under their modified terms as of March 31, 2021 and December 31, 2020. These amounts represent loan modifications that meet the criteria under Section 4013 of the CARES Act, as amended by the CAA, or Interagency Statement and therefore are not considered TDRs. These amounts also exclude loan modifications related to the COVID-19 pandemic made on existing TDRs. A loan is counted once in the table regardless of the number of accommodations the borrower has received.
| | | | | | | | | | | | | | | | | | | | | | | | | | | | | | | | | | | | | | |
|
| ($ in thousands) | | March 31, 2021 | | December 31, 2020 |
| | | | | | | | | |
| Number of Loans | | Outstanding Balance | | % of Balance
to Respective Loan Portfolio | | Number of Loans | | Outstanding Balance | | % of Balance
to Respective Loan Portfolio |
| Payment deferral and forbearance | | | | | | | | | | | | |
| Commercial: | | | | | | | | | | | | |
| C&I | | 20 | | $ | 57,004 | | | 0 | % | | 16 | | $ | 54,215 | | | 0 | % |
| CRE: | | | | | | | | | | | | |
| CRE | | 78 | | 719,526 | | 6 | % | | 63 | | 597,972 | | 5 | % |
| Multifamily residential | | 9 | | 62,738 | | 2 | % | | 4 | | 17,111 | | 1 | % |
| Construction and land | | 2 | | 54,160 | | 12 | % | | 3 | | 66,629 | | 11 | % |
| Total CRE | | 89 | | 836,424 | | | 6 | % | | 70 | | 681,712 | | | 5 | % |
| Total commercial | | 109 | | 893,428 | | | 3 | % | | 86 | | 735,927 | | | 3 | % |
| Consumer: | | | | | | | | | | | | |
| Residential mortgage: | | | | | | | | | | | | |
| Single-family residential | | 460 | | 214,830 | | 3 | % | | 498 | | 207,797 | | 3 | % |
| HELOCs | | 86 | | 35,964 | | 2 | % | | 102 | | 39,469 | | 2 | % |
| Total residential mortgage | | 546 | | 250,794 | | | 2 | % | | 600 | | 247,266 | | | 3 | % |
| Total consumer | | 546 | | 250,794 | | | 2 | % | | 600 | | 247,266 | | | 2 | % |
| Total payment deferral and forbearance | | 655 | | $ | 1,144,222 | | | 3 | % | | 686 | | $ | 983,193 | | | 3 | % |
|
The above table excludes loan modifications related to the COVID-19 pandemic that did not meet the criteria provided under Section 4013 of the CARES Act, as amended by the CAA, or the Interagency Statement, and that were evaluated and deemed to not be classified as TDRs. The determination to not consider a modification a TDR was made on the premise that the amount of the delayed restructured payments was insignificant relative to the unpaid principal or collateral value of the loan, resulting in an insignificant shortfall in the contractual amount due from the borrower, or an insignificant delay in the timing of the restructured payment period relative to the payment frequency under the loan’s original contractual maturity or expected duration.
The COVID-19 pandemic-related loan modifications primarily consisted of payment deferrals six months or less in duration, in the form of either principal payment deferrals, where the borrower was still paying interest, or full principal and interest payment deferrals. Other forbearance programs consisted of interest rate concessions. The deferred payments for commercial loans are either repaid at contractual maturity, or spread over the remaining contractual term of the loan. The deferred payments for consumer loans are repaid under defined payment plans between six to 60 months after the deferral period ends, or the loan term is extended beyond the contractual maturity by the number of payments deferred.
As of March 31, 2021, the Company had $1.14 billion of loans under payment deferral and forbearance programs, an increase of $161.0 million or 16% from $983.2 million as of December 31, 2020. The loans on deferral as of March 31, 2021 and December 31, 2020 largely consist of CRE loans (hotel, retail and others) and residential mortgage loans. The increase in deferrals during the three months ended March 31, 2021 was primarily driven by an increase in hotel CRE loans on deferral, reflecting the impact of resumed COVID-19-related business shutdowns, restrictions on travel and limitations on restaurant dining over the winter months. Of the CRE COVID-19 loan modifications, 92% were making partial payments, generally interest-only payments, while 8% were under full payment deferral as of March 31, 2021. This contrasts with 73% which were making partial payments, generally as interest-only payments and 27% which were under full payment deferral as of December 31, 2020. Modifications are considered to have exited active accommodation after the borrower exited the modification program or after the modification period expired. The loans with expired COVID-19 modifications were predominantly current as of March 31, 2021. The Company monitors the delinquency status of loans exiting relief programs on an ongoing basis. The impacts of the COVID-19 loan modifications were considered in the determination of the allowance for credit loss.
Allowance for Credit Losses
The Company’s measurement of the allowance for credit losses is based on management’s best estimate of lifetime expected credit losses inherent in the Company’s relevant financial assets. The allowance for credit losses estimate uses various models and estimation techniques based on historical loss experience, current borrower characteristics, current conditions, reasonable and supportable forecasts and other relevant factors. In the case of loans and securities, allowance for credit losses are contra-asset valuation accounts that are deducted from the amortized cost basis of these assets to present the net amount expected to be collected. In the case of unfunded credit commitments, the allowance for credit losses is a liability account that is reported as a component of Accrued expenses and other liabilities in our Consolidated Balance Sheet.
The Company’s methodology for determining the allowance for loan losses includes an estimate of expected credit losses on a collective basis for loan groups with similar risk characteristics, and a specific allowance for loans that are individually evaluated. For collectively evaluated loans, the Company uses quantitative models to forecast expected credit losses and these models consider historical credit loss experience, current market and economic conditions, and forecasted changes in market and economic conditions, if such forecasts are considered reasonable and supportable. The Company also considers qualitative factors in determining the allowance for loan losses. Qualitative adjustments are used to capture characteristics in the portfolio that impact expected credit losses, and which are not otherwise fully captured within the Company’s expected credit loss models.
In addition to the allowance for loan losses, the Company maintains an allowance for unfunded credit commitments. The Company has three general areas for which it provides the allowance for unfunded credit commitments: recourse obligations for loans sold, letters of credit, and unfunded lending commitments. The Company’s methodology for determining the allowance for unfunded lending commitments calculation uses the lifetime loss rates of the on-balance sheet commitment. Recourse obligations for loans sold and letters of credit use the weighted loss rates for the segment of the individual credit.
The Company employs a disciplined process and methodology to establish its allowance for loan losses each quarter. The process for estimating the allowance for loan losses takes into consideration many factors, including historical and forecasted loan loss trends, loan-level credit quality ratings and loan-specific risk characteristics. In addition to regular quarterly reviews of the adequacy of the allowance for loan losses, the Company performs ongoing assessments of the risks inherent in the loan portfolio. Determining the appropriateness of the allowance for loan losses is complex and requires judgement by management about the effect of matters that are inherently uncertain.
The Company is committed to maintaining the allowance for credit losses at a level that is commensurate with the estimated inherent losses in the loan portfolio, including unfunded credit facilities. While the Company believes that the allowance for credit losses as of March 31, 2021 was appropriate to absorb losses inherent in the loan portfolio and in unfunded credit commitments based on the information available, future allowance levels may increase or decrease based on a variety of factors, including but not limited to, accounting standard and regulatory changes, loan growth, portfolio performance and general economic conditions. For a description of the policies, methodologies and judgements used to determine the allowance for credit losses, see Item 7. MD&A — Critical Accounting Policies and Estimates and Note 1 — Summary of Significant Accounting Policies to the Consolidated Financial Statements of the Company’s 2020 Form 10-K, and Note 7—Loans Receivable and Allowance for Credit Losses to the Consolidated Financial Statements in this Form 10-Q.
The following table presents an allocation of the allowance for loan losses by loan portfolio segments and unfunded credit commitments as of March 31, 2021 and December 31, 2020:
| | | | | | | | | | | | | | | | | | | | | | | | | | |
|
| ($ in thousands) | | March 31, 2021 | | December 31, 2020 |
| Allowance
Allocation | | % of Loan Type to Total Loans | | Allowance
Allocation | | % of Loan Type to Total Loans |
| Allowance for loan losses | | | | | | | | |
| Commercial: | | | | | | | | |
| C&I | | $ | 394,084 | | | 36 | % | | $ | 398,040 | | | 36 | % |
| CRE: | | | | | | | | |
| CRE | | 146,399 | | | 29 | % | | 163,791 | | | 29 | % |
| Multifamily residential | | 27,407 | | | 8 | % | | 27,573 | | | 8 | % |
| Construction and land | | 19,089 | | | 1 | % | | 10,239 | | | 2 | % |
| Total CRE | | 192,895 | | | 38 | % | | 201,603 | | | 39 | % |
| Total commercial | | 586,979 | | | 74 | % | | 599,643 | | | 75 | % |
| Consumer: | | | | | | | | |
| Residential mortgage: | | | | | | | | |
| Single-family residential | | 15,839 | | | 22 | % | | 15,520 | | | 21 | % |
| HELOCs | | 2,670 | | | 4 | % | | 2,690 | | | 4 | % |
| Total residential mortgage | | 18,509 | | | 26 | % | | 18,210 | | | 25 | % |
| Other consumer | | 2,018 | | | 0 | % | | 2,130 | | | 0 | % |
| Total consumer | | 20,527 | | | 26 | % | | 20,340 | | | 25 | % |
| Total | | $ | 607,506 | | | 100 | % | | $ | 619,983 | | | 100 | % |
| Allowance for unfunded credit commitments | | $ | 32,529 | | | | | $ | 33,577 | | | |
| Total allowance for credit losses | | $ | 640,035 | | | | | $ | 653,560 | | | |
| | | | | | | | |
| | Three Months Ended March 31, |
| | 2021 | | 2020 |
| Average loans held-for-investment | | $ | 38,728,635 | | | $ | 35,153,522 | |
| Loans held-for-investment | | $ | 39,588,748 | | | $ | 35,893,393 | |
| Allowance for loan losses to loans held-for-investment | | 1.53 | % | | 1.55 | % |
| Annualized net charge-offs to average loans held-for-investment | | 0.14 | % | | 0.01 | % |
|
The allowance for loan losses was $607.5 million as of March 31, 2021, a decrease of $12.5 million from $620.0 million as of December 31, 2020. The decrease in the allowance largely reflected an improvement in the macroeconomic forecast, partially offset by loan growth, resulting in $8.7 million and $4.0 million reductions in the allowance for loan losses against the CRE and C&I loan portfolios, respectively.
The Company considers multiple economic scenarios to develop the estimate of the allowance for loans. The scenarios consist of a base forecast representing management's view of the most likely outcome, combined with downside and upside scenarios reflecting possible worsening or improving economic conditions. The base forecast assumed better near-term economic conditions with a steadier long-term recovery period, based on economic stimulus from the government and the Federal Reserve maintaining its target fed funds range. The downside scenario assumed COVID-19 mortality increasing and causing a pull-back in the expected economic recovery and decline in consumer confidence and spending, as compared to the base forecast. The upside scenario assumed a more optimistic view for the economic recovery, as compared with the base forecast, including faster GDP growth, declining unemployment rate and improved consumer optimism based on more rapid distribution of COVID-19 vaccines. The Company applies management judgment to add qualitative factors for the impact of the COVID-19 pandemic on industry sectors that are affected by the pandemic.
As of March 31, 2021 and December 31, 2020, PPP loans outstanding were $2.07 billion and $1.57 billion, respectively. As these loans are 100% guaranteed by SBA, the Company believes they will have zero expected loss. Accordingly, as of March 31, 2021 and December 31, 2020, these loans had no related allowance for loan losses.
First quarter of 2021 net charge-offs were $13.4 million or annualized 0.14% of average loans-held-for-investment, compared with $898 thousand or 0.01% of average loan held-for-investment for the first quarter of 2020. The year-over-year change in net loan charge-offs was largely due to higher CRE charge-offs in the first quarter of 2021, compared with CRE recoveries in the first quarter of 2020. Although the COVID-19 pandemic may continue to impact the credit quality of our loan portfolio, the potential effects have been considered in our allowance for loan losses. However, payment deferral activities instituted in response to the COVID-19 pandemic could delay the recognition of certain loan charge-offs.
The following tables summarize activity in the allowance for loan losses for loans by portfolio segments for the first quarters of 2021 and 2020:
| | | | | | | | | | | | | | | | | | | | | | | | | | | | | | | | | | | | | | | | | | | | | | | | | | |
|
| ($ in thousands) | | Three Months Ended March 31, 2021 |
| Commercial | | Consumer | | Total |
| C&I | | CRE | | Residential Mortgage | | Other
Consumer | |
| | CRE | | Multifamily
Residential | | Construction
and Land | | Single-
Family
Residential | | HELOCs | | |
| Allowance for loan losses, beginning of period | | $ | 398,040 | | | $ | 163,791 | | | $ | 27,573 | | | $ | 10,239 | | | $ | 15,520 | | | $ | 2,690 | | | $ | 2,130 | | | $ | 619,983 | |
| Provision for (reversal of) credit losses on loans | (a) | 3,839 | | | (10,277) | | | (1,391) | | | 8,592 | | | 376 | | | 22 | | | (113) | | | 1,048 | |
| Gross charge-offs | | (8,436) | | | (7,195) | | | (17) | | | (71) | | | (134) | | | (45) | | | (1) | | | (15,899) | |
| Gross recoveries | | 760 | | | 80 | | | 1,242 | | | 329 | | | 77 | | | 3 | | | 2 | | | 2,493 | |
| Total net (charge-offs) recoveries | | (7,676) | | | (7,115) | | | 1,225 | | | 258 | | | (57) | | | (42) | | | 1 | | | (13,406) | |
| Foreign currency translation adjustment | | (119) | | | — | | | — | | | — | | | — | | | — | | | — | | | (119) | |
| Allowance for loan losses, end of period | | $ | 394,084 | | | $ | 146,399 | | | $ | 27,407 | | | $ | 19,089 | | | $ | 15,839 | | | $ | 2,670 | | | $ | 2,018 | | | $ | 607,506 | |
| | | | | | | | | | | | | | | | |
| | | | | | | | | | | | | | | | |
| | | | | | | | | | | | | | | | |
| | | | | | | | | | | | | | | | |
| | | | | | | | | | | | | | | | |
| | | | | | | | | | | | | | | | |
| | | | | | | | | | | | | | | | | | | | | | | | | | | | | | | | | | | | | | | | | | | | | | | | | | |
|
| ($ in thousands) | | Three Months Ended March 31, 2020 |
| Commercial | | Consumer | | Total |
| C&I | | CRE | | Residential Mortgage | | Other
Consumer | |
| | CRE | | Multifamily
Residential | | Construction
and Land | | Single-
Family
Residential | | HELOCs | | |
| Allowance for loan losses, beginning of period | | $ | 238,376 | | | $ | 40,509 | | | $ | 22,826 | | | $ | 19,404 | | | $ | 28,527 | | | $ | 5,265 | | | $ | 3,380 | | | $ | 358,287 | |
| Impact of ASU 2016-13 adoption | | 74,237 | | | 72,169 | | | (8,112) | | | (9,889) | | | (3,670) | | | (1,798) | | | 2,221 | | | 125,158 | |
| Provision for (reversal of) credit losses on loans | (a) | 60,618 | | | 11,435 | | | 1,281 | | | 1,482 | | | 1,700 | | | 412 | | | (2,272) | | | 74,656 | |
| | | | | | | | | | | | | | | | |
| Gross charge-offs | | (11,977) | | | (954) | | | — | | | — | | | — | | | — | | | (26) | | | (12,957) | |
| Gross recoveries | | 1,575 | | | 9,660 | | | 535 | | | 21 | | | 265 | | | 2 | | | 1 | | | 12,059 | |
| Total net (charge-offs) recoveries | | (10,402) | | | 8,706 | | | 535 | | | 21 | | | 265 | | | 2 | | | (25) | | | (898) | |
| Foreign currency translation adjustment | | (200) | | | — | | | — | | | — | | | — | | | — | | | — | | | (200) | |
| Allowance for loan losses, end of period | | $ | 362,629 | | | $ | 132,819 | | | $ | 16,530 | | | $ | 11,018 | | | $ | 26,822 | | | $ | 3,881 | | | $ | 3,304 | | | $ | 557,003 | |
| | | | | | | | | | | | | | | | |
| | | | | | | | | | | | | | | | |
| | | | | | | | | | | | | | | | |
| | | | | | | | | | | | | | | | |
| | | | | | | | | | | | | | | | |
| | | | | | | | | | | | | | | | |
| | | | | | | | | | | | | | | | |
The following table summarizes activity in the allowance for unfunded credit commitments for the first quarters of 2021 and 2020:
| | | | | | | | | | | | | | |
|
| ($ in thousands) | | Three Months Ended March 31, |
| 2021 | | 2020 |
| Unfunded credit facilities | | | | |
| Allowance for unfunded credit commitments, beginning of period | | $ | 33,577 | | | $ | 11,158 | |
| Impact of ASU 2016-13 adoption | | — | | | 10,457 | |
| Reversal of credit losses on unfunded credit commitments | (b) | (1,048) | | | (786) | |
| Allowance for unfunded credit commitments, end of period | | 32,529 | | | 20,829 | |
| | | | |
| Provision for credit losses | (a) + (b) | $ | — | | | $ | 73,870 | |
|
The allowance for unfunded credit commitments was $32.5 million as of March 31, 2021, compared with $33.6 million as of December 31, 2020.
Liquidity Risk Management
Liquidity
Liquidity is a financial institution’s capacity to meet its contractualdeposit and contingent financialother counterparties’ obligations on or off-balance sheet, as they become due.come due, or to obtain adequate funding at a reasonable cost to meet those obligations. The Company’s primaryobjective of liquidity management objective is to provide sufficient funding for its businesses throughout market cyclesmanage the potential mismatch of asset and be ableliability cash flows. Maintaining an adequate level of liquidity depends on the institution’s ability to manageefficiently meet both expected and unexpected cash flowflows, and collateral needs and requirements without adversely impactingaffecting daily operations or the financial healthcondition of the Company.institution. To achieve this objective, the Company analyzes its liquidity risk, maintains readily available liquid assets and accessesutilizes diverse funding sources including its stable core deposit base.
The Board of Directors’ Risk Oversight Committee has primary oversight responsibility. At the management level, the Company’s Asset/Liability Committee (“ALCO”) setsestablishes the liquidity guidelines that govern the day-to-day active management of the Company’s liquidity position.position by requiring sufficient asset-based liquidity to cover potential funding requirements and avoid over-dependence on volatile, less reliable funding markets. These guidelines are established and monitored for both the Bank and for East West on a stand-alone basis to ensure that the Company is a source of strength for its subsidiaries. The ALCO regularly monitors the Company’s liquidity status and related management processes, and providesproviding regular reports to the Board.Board of Directors. The Company’s liquidity management practices have been effective under normal operating and stressed market conditions.
Liquidity Risk — Liquidity Sources. The Company’s primary source of funding is from deposits generated by its banking business, which are relatively stable and low-cost. Total deposits amounted to $49.55 billion as of March 31, 2021, compared with $44.86 billion as of December 31, 2020. The Company’s loan-to-deposit ratio was 80% as of March 31, 2021, compared with 86% as of December 31, 2020.
In addition to deposits, the Company has access to various sources of wholesale funding, as well as borrowing capacity at the FHLB and Federal Reserve Bank of San Francisco (“FRBSF”) to sustain an adequate liquid asset portfolio, meet daily cash demands and allow management flexibility to execute its business strategy. Economic conditions and the stability of capital markets impact the Company’s access to and the cost of wholesale financing. The Company’s access to capital markets is also affected by the ratings received from various credit rating agencies. See Item 2— MD&A — Balance Sheet Analysis — Deposits and Other Sources of Funds in this Form 10-Q for further detail related to the Company’s funding sources.
The Company maintains liquidity in the form of cash and cash equivalents, interest-bearing deposits with banks, short-term resale agreements and available-for-sale investmentunencumbered high-quality and liquid AFS debt securities. These assets totaled $5.10 billion and $5.54 billion, accounting for 14% and 16% of totalThe following table presents the Company’s liquid assets as of September 30, 2017March 31, 2021 and December 31, 2016, respectively. Traditional forms of funding such as customer deposits and borrowings augment these2020:
| | | | | | | | | | | | | | | | | | | | | | | | | | | | | | | | | | | | | | |
|
| ($ in thousands) | | March 31, 2021 | | December 31, 2020 |
| Encumbered | | Unencumbered | | Total | | Encumbered | | Unencumbered | | Total |
| Cash and cash equivalents | | $ | — | | | $ | 4,619,133 | | | $ | 4,619,133 | | | $ | — | | | $ | 4,017,971 | | | $ | 4,017,971 | |
| Interest-bearing deposits with banks | | — | | | 741,923 | | | 741,923 | | | — | | | 809,728 | | | 809,728 | |
| Short-term resale agreements | | — | | | 1,550,037 | | | 1,550,037 | | | — | | | 900,000 | | | 900,000 | |
| U.S. Treasury, and U.S. government agency and U.S. government-sponsored enterprise debt securities | | 77,795 | | | 1,942,552 | | | 2,020,347 | | | 91,637 | | | 773,443 | | | 865,080 | |
| U.S. government agency and U.S. government-sponsored enterprise mortgage-backed securities | | 510,438 | | | 2,906,359 | | | 3,416,797 | | | 494,132 | | | 2,320,532 | | | 2,814,664 | |
| Foreign government bonds | | — | | | 276,328 | | | 276,328 | | | — | | | 182,531 | | | 182,531 | |
| Municipal securities | | 1,031 | | | 419,034 | | | 420,065 | | | 1,033 | | | 395,040 | | | 396,073 | |
| Non-agency mortgage-backed securities, asset-backed securities and CLOs | | 356 | | | 1,158,677 | | | 1,159,033 | | | 434 | | | 879,908 | | | 880,342 | |
| Corporate debt securities | | 1,238 | | | 495,405 | | | 496,643 | | | 1,249 | | | 404,719 | | | 405,968 | |
| Total | | $ | 590,858 | | | $ | 14,109,448 | | | $ | 14,700,306 | | | $ | 588,485 | | | $ | 10,683,872 | | | $ | 11,272,357 | |
|
Unencumbered liquid assets. Total customer deposits amounted to $31.31assets totaled $14.11 billion as of September 30, 2017,March 31, 2021, compared to $29.89with $10.68 billion as of December 31, 2016,2020. AFS debt securities, included as part of which core deposits comprised 81%liquidity sources, consist of total deposits ashigh quality and liquid securities with moderate durations to minimize overall interest rate and liquidity risks. The Company believes these AFS debt securities provide quick sources of eachliquidity to obtain financing, regardless of September 30, 2017 and December 31, 2016. market conditions, through sale or pledging.
As a means of augmenting the Company’sto generate incremental liquidity, the Company maintains available borrowing capacity under secured borrowing lines with the FHLB and FRB,FRBSF, unsecured federal funds’funds lines of credit with various correspondent banks, for purchase of overnight funds, and several master repurchase agreements with major brokerage companies. The Company’sAs of March 31, 2021, the Company had available borrowing capacity of $20.78 billion, including $7.37 billion with the FHLB and FRB was $6.45$6.06 billion and $3.23 billion, respectively, as of September 30, 2017. The Bank’s unsecured federal funds’ lines of credit, subject to availability, totaled $731.0 million with correspondent banks as of September 30, 2017.the FRBSF. The Company believes that its liquidity sources are sufficient to meet all reasonably foreseeable short-term needs over the next 12 months. Unencumbered loans and/or securities were pledged to the FHLB and intermediate-term needs.
the FRBSF discount window as collateral. The Company experienced net cash inflowshas established operational procedures to enable borrowing against these assets, including regular monitoring of the total pool of loans and securities eligible as collateral. Eligibility of collateral is defined in guidelines from operating activitiesthe FHLB and FRBSF and is subject to change at their discretion. The Bank’s unsecured federal funds lines of $665.0 millioncredit with correspondent banks, subject to availability, totaled $1.01 billion as of March 31, 2021. Estimated borrowing capacity from unpledged AFS debt securities totaled $6.34 billion as of March 31, 2021.
In connection with the Company’s participation in the PPP under the CARES Act, the Company has the ability to pledge loans originated under the SBA’s PPP program to the PPPLF, and $417.6 millionreceive term funding matching the balance and term of the pledged loans. As of March 31, 2021, the Company did not have any outstanding balance under the PPPLF. In comparison, the Company drew down $1.44 billion from the Federal Reserve PPPLF and pledged the same amount in PPP loans as collateral in the second quarter of 2020 and paid off the outstanding amounts under the PPPLF in full during the nine months ended September 30, 2017 and 2016, respectively. The $247.4 million increase in net cash inflows from operating activities between these periods was primarily duefourth quarter of 2020.
Liquidity Risk — Liquidity for East West. In addition to a $99.8 million increase in net income, a $108.3 million increase in net changes in cash flows receivable from other assets and a $76.2 million increase in net changes in the cash flows from accrued expenses and other liabilities, partially offset by a $32.5 million change in non-cash amounts. The $108.3 million increase in net changes in cash flows receivable from other assets, comparing the nine months ended September 30, 2017 to the same period in 2016, was primarily due to a reduction in tax receivables, and an increase in fair value of interest rate swaps and options during the nine months ended September 30, 2016 contributing to operating cash outflows in that period. The $76.2 million increase in net changes in the cash flows from accrued expenses and other liabilities, comparing the nine months ended September 30, 2017 to the same period in 2016, was primarily due to a larger wire transfer in transit and an increase in tax payables.
Net cash used in investing activities totaled $2.07 billion and $473.3 million during the nine months ended September 30, 2017 and 2016, respectively. The $1.59 billion increase in net cash used in investing activities was primarily due to a $1.69 billion increase in net cash outflows from loans held-for-investment, partially offset by a $150.0 million increase in net cash inflows from resale agreements.
During the nine months ended September 30, 2017 and 2016,bank level liquidity management, the Company experienced netmanages liquidity at the parent company level for various operating needs including payment of dividends, repurchases of common stock, principal and interest payments on its borrowings, acquisitions and additional investments in its subsidiaries. East West’s primary source of liquidity is from cash inflows from financing activitiesdividends distributed by its subsidiary, East West Bank. The Bank is subject to various statutory and regulatory restrictions on its ability to pay dividends as discussed in Item 1. Business — Supervision and Regulation — Dividends and Other Transfers of $1.24 billion and $365.6 million, respectively. Net cash inflows from financing activities Funds of $1.24 billion during the nine months ended September 30, 2017 was primarily comprisedCompany’s 2020 Form 10-K. As of a $1.39 billion net increase in customer deposits, partially offset by $87.9March 31, 2021, East West held $340.1 million in cash and cash equivalents, after receiving $50.0 million in dividends paid. Net cash inflows from financing activitiesthe Bank. In comparison, as of $365.6 million during the same period in 2016 were primarily comprised of a $1.13 billion net increase in customer deposits and a $37.7 million increase in short-term borrowings, partially offset by a $700.0 million repayment of short-term FHLB advances and $87.0December 31, 2020, East West held $439.1 million in cash and cash equivalents. Each year, the dividends paid.from the Bank to East West are sufficient to meet the projected cash obligations of the parent company for the coming year.
Liquidity Risk — Liquidity Stress Testing. Liquidity stress testing is performed at the Company level, as well as at the foreign subsidiary and foreign branch levels. Stress tests and scenario analyses are intended to quantify the potential impact of a liquidity event on the financial and liquidity position of the entity. Scenario analyses include assumptions about significant changes in key funding sources, market triggers, potential uses of funding and economic conditions in certain countries. In addition, Company specific events are incorporated into the stress testing. Liquidity stress tests are conducted to ascertain potential mismatches between liquidity sources and uses over a variety of time horizons, both immediate and longer term, and over a variety of stressed conditions. Given the range of potential stresses, the Company maintains contingency funding plans on a consolidated basis and for individual entities.
Liquidity Risk — COVID-19 Pandemic. In response to the ongoing developments related to the COVID-19 pandemic, the Company continues to closely monitor the impact of the pandemic on its business. The uncertainty surrounding the COVID-19 pandemic, and its impact on the financial services industry, could potentially impact the liquidity of the Company. The prolonged strained economic, capital, credit and/or financial market conditions may expose the Company to liquidity risk. However, the Company believes that market conditions have shown signs of improvement after the Federal Reserve stepped in with a broad array of actions to stabilize financial markets and to lower borrowing costs. In December 2020, the CAA, which issued new relief provisions, extended certain provisions of the CARES Act, and provided additional stimulus funding, was signed into law. In addition, the ARPA was signed into law to provide additional relief for individuals and businesses affected by the COVID-19 pandemic in March 2021. The combination of the CAA and additional stimulus legislation passed in 2021 may further enhance economic recovery.
As of September 30, 2017,March 31, 2021, the Company is not aware of any trends, events or uncertainties that had or were reasonably likely to have a material effect on its liquidity position. Furthermore, the Company iswas not aware of any material commitments for capital expenditures in the foreseeable future.future and believes it has adequate liquidity resources to conduct operations and meet other needs in the ordinary course of business. Given the uncertainty and the rapidly changing market and economic conditions related to the COVID-19 pandemic, the Company will continue to actively evaluate the nature and extent of the impact on its business and financial position.
Consolidated Cash Flows Analysis
East West’s
The following table presents a summary of the Company’s Consolidated Statement of Cash Flows for the periods indicated. While this information may be helpful to highlight business strategies and certain macroeconomic trends, the cash flow analysis may not be as relevant when analyzing changes in the Company’s net earnings and assets. The Company believes that in addition to this traditional cash flow analysis, the discussion related to liquidity has historically been dependent onin Item 2. MD&A — Risk Management — Liquidity Risk Management — Liquidity in this Form 10-Q may provide a useful context in evaluating the paymentCompany’s liquidity position and related activity.
| | | | | | | | | | | | | | |
|
| ($ in thousands) | | Three Months Ended March 31, |
| 2021 | | 2020 |
| Net cash provided by operating activities | | $ | 371,515 | | | $ | 91,703 | |
| Net cash used in investing activities | | (4,383,909) | | | (1,405,330) | |
| Net cash provided by financing activities | | 4,475,275 | | | 1,119,028 | |
| Effect of exchange rate changes on cash and cash equivalents | | 138,281 | | | 13,492 | |
| Net increase (decrease) in cash and cash equivalents | | 601,162 | | | (181,107) | |
| Cash and cash equivalents, beginning of period | | 4,017,971 | | | 3,261,149 | |
| Cash and cash equivalents, end of period | | $ | 4,619,133 | | | $ | 3,080,042 | |
| | | | |
Operating Activities — Net cash provided by operating activities was $371.5 million and $91.7 million for the first quarters of 2021 and 2020, respectively. During the first quarter of 2021, net cash provided by operating activities mainly reflected inflow of $205.0 million from net income, $185.7 million decrease in accrued interest receivable and other assets primarily driven by lower derivative assets, and net income adjusted for certain noncash items of $49.3 million, partially offset by $72.9 million decrease in accrued expenses and other liabilities. In comparison, during the same period in 2020, net cash provided by operating activities mainly reflected inflow of $144.8 million from net income, net income adjusted for certain noncash items of $105.3 million primarily driven by higher provision for credit losses recognized and $304.7 million increase in accrued expenses and other liabilities, partially offset by $462.8 million increase in accrued interest receivable and other assets.
Investing Activities —Net cash used in investing activities was $4.38 billion and $1.41 billion for the first quarters of 2021 and 2020, respectively. During the first quarter of 2021, cash used in investing activities primarily reflected $2.45 billion from net purchases of AFS debt securities (net of sales, maturities and paydowns), $1.21 billion used cash for growth in the loan portfolio, and $700.0 million net increase in resale agreements (net of maturities and paydowns). During the same period in 2020, net cash used in investing activities primarily reflected growth in the loan portfolio of $1.14 billion in used cash, $372.0 million net purchases of AFS debt securities (net of sales, maturities and paydowns), and $115.4 million in cash used for interest-bearing deposits with banks. The cash used was partially offset by proceeds of $250.0 million from resale agreements.
Financing Activities —Net cash provided by financing activities was $4.48 billion and $1.12 billion for the first quarters of 2021 and 2020, respectively. During the first quarter of 2021, net cash provided by financing activities primarily reflected a net increase of $4.56 billion in deposits, partially offset by $48.2 million in cash dividends paid. During the same period in 2020, net cash provided by financing activities primarily reflected net increases of $1.37 billion in deposits and $40.0 million in short-term borrowings, partially offset by $146.0 million of cash dividends by its subsidiary, East West Bank, subject to applicable statutes, regulations and special approval. The Bank paid total dividends of $255.0 million andused in shares repurchased, $100.0 million to East West duringrepayment in FHLB advances and $41.4 million in cash dividends paid.
Market Risk Management
Market risk is the nine months ended September 30, 2017 and 2016, respectively. In addition, in October 2017, the Board declared a quarterly cash dividend of $0.20 per share forrisk that the Company’s common stock payablefinancial condition may change resulting from adverse movements in market rates or prices including interest rates, foreign exchange rates, interest rate contracts, investment securities prices, credit spreads and related risk resulting from mismatches in rate sensitive assets and liabilities. In the event of market stress, the risk could have a material impact on November 15, 2017our results of operations and financial condition.
The Board’s Risk Oversight Committee has primary oversight responsibility. At the management level, the ALCO establishes and monitors compliance with the policies and risk limits pertaining to stockholders of record on November 1, 2017.market risk management activities. Corporate Treasury supports the ALCO in measuring, monitoring and managing interest rate risk as well as all other market risks.
Interest Rate Risk Management
Interest rate risk results primarily from the Company’s traditional banking activities of gathering deposits and extending loans, andwhich is the primary market risk for the Company. Economic and financial conditions, movements in interest rates, and consumer preferences impact the level of noninterest-bearing funding sources at the Company, as well as affect the difference between the interest the Company earns on interest-earning assets and pays on interest-bearing liabilities, and the level of the noninterest-bearing funding sources.liabilities. In addition, changes in interest rates can influence the rate of principal prepayments on loans and the speed of deposit withdrawals. Due to the pricing term mismatches and the embedded options inherent in certain products, changes in market interest rates not only affect expected near-term earnings, but also the economic value of these interest-earning assets and interest-bearing liabilities. Other market risks include foreign currency exchange risk and equity price risk. These risks are not considered significant to the Company’s interest rate riskCompany and no separate quantitative information concerning these risks is presented herein.
With oversight by the Company’s Board of Directors, the ALCO coordinates the overall management of the Company’s interest rate risk. The ALCO meets regularly and is responsible for reviewing the Company’s open market positions and establishing policies to monitor and limit exposure to market risk. Management of interest rate risk is carried out primarily through strategies involving the Company’s investmentdebt securities portfolio, loan portfolio, available funding channels and capital market activities. In addition, the Company’s policies permit the use of off-balance sheet derivative instruments to assist in managing interest rate risk.
The interest rate risk exposure is measured and monitored through various risk management tools, which include a simulation model that performs interest rate sensitivity analysisanalyses under multiple interest rate scenarios. The model includesincorporates the Company’s cash instruments, loans, investmentdebt securities, resale agreements, customer deposits, borrowings and borrowing portfolios, including repurchase agreements. Theagreements, as well as financial instruments from the Company’s domestic and foreign operations, forecasted noninterest income and noninterest expense items are also incorporated in the simulation. The interest rate scenarios simulated include an instantaneous parallel shift and non-parallel shift in the yield curve. In addition, the Company also performs various simulations using alternative interest rate scenarios. The alternative interest rate scenarios include yield curve flattening, yield curve steepening and yield curve inverting. In order to apply the assumed interest rate environment, adjustments are made to reflect the shift in the U.S. Treasury and other appropriate yield curves.operations. The Company incorporatesuses both a static balance sheet and a forward growth balance sheet in order to perform these evaluations.analyses. The simulated interest rate scenarios include a non-parallel shift in the yield curve (“rate shock”) and a gradual non-parallel shift in the yield curve (“rate ramp”). In addition, the Company also performs simulations using alternative interest rate scenarios, including various permutations of the yield curve flattening, steepening or inverting. Results of these various simulations are used to formulate and gauge strategies to achieve a desired risk profile within the Company’s capital and liquidity guidelines.
The net interest income simulation model is based on the actual maturity and re-pricingrepricing characteristics of the Company’s interest-rate sensitive assets, liabilities and related derivative contracts. It also incorporates various assumptions, which management believes to be reasonable but may have a significant impact on results. These assumptions include, but are not limited to, the timing and magnitude of changes in interest rates, the yield curve evolution and shape, the correlation between various interest rate indices, financial instrument future repricing characteristics and spread relative to benchmark rates, and the effect of interest rate floors and caps. The modeled results are highly sensitive to the deposit decay and deposit beta assumptions, used for deposits that do not have specific maturities. The Company uses historicalwhich are derived from a regression analysis of the Company’s internalhistorical deposit data as a guidedata. Deposit beta commonly refers to set deposit decay assumptions. In addition, the model is also highly sensitive to certain assumptions on the correlation of the changechanges in interest rates paid on core deposits to changes in benchmark market interest rates, commonly referred to as deposit beta assumptions. Deposit beta assumptions are based on the Company’s historical experience.rates. The model is also sensitive to the loan and investment prepayment assumption. The loanassumptions, based on an independent model and investmentthe Company’s historical prepayment assumption,data, which considers theconsider anticipated prepayments under different interest rate environments, is based on an independent model, as well as the Company’s historical prepayment experiences.environments.
Existing investment securities, loans, customer deposits and borrowings are assumed to roll into new instruments at a similar spread relative to benchmark interest rates and internal pricing guidelines. The assumptions applied in the model are documented and supported for reasonableness. Changes to key model assumptions are reviewed by the ALCO. Due to the sensitivity of the model results, the Company performs periodic testing to assess the impact of the assumptions. The Company also makes appropriate calibrations when necessary. Scenarios do not reflect strategies that management could employ to limit the impact as interest rate expectations change. Simulation results are highly dependent on theseinput assumptions. To the extent actual behavior is different from the assumptions in the models, there could be a material change in interest rate sensitivity. The assumptions applied in the model are documented and supported for reasonableness, and periodically back-tested to assess their effectiveness. The Company makes appropriate calibrations to the model as needed, continually refining the model, methodology and results. Changes to key model assumptions are reviewed by the ALCO. Scenario results do not reflect strategies that management could employ to limit the impact of changing interest rate expectations.
Since the federal funds rate range was lowered to near zero in March 2020 and the Federal Reserve has committed its resources to support the financial markets, business, and state and local governments, it is not expected that rates will decline further, nor is it expected that rates will enter into the negative territory. Consequently, the simulation results for the downward interest rate scenarios as of March 31, 2021 are not provided.
Twelve-Month Net Interest Income Simulation
Net interest income simulation modeling looks at interest rate risk through earnings. It projects the changes in interest rate sensitive asset and liability cash flows, expressed in terms of net interest income, over a specified time horizon for defined interest rates scenarios. Net interest income simulations generate insight into the impact of market rates changes on earnings and guide risk management decisions. The Company assesses interest rate risk by comparing net interest income using different interest rate scenarios.
The federal funds rate range was between 0.00% and 0.25% as of both March 31, 2021 and December 31, 2020. After lowering the range to between 0.00% and 0.25% in March 2020, the Federal Open Market Committee (“FOMC”) pledged to maintain monetary support for the economy. Moreover, in December 2020, acknowledging the uncertain and likely lengthy path to a full post-pandemic economic recovery, the majority of FOMC members projected that the federal funds rate range will likely remain unchanged through 2023. The FOMC statement indicated that the federal funds target rate will remain unchanged until maximum employment has been reached and inflation rises to and remains at 2% for some time. In April 2021, the FOMC confirmed the federal funds target rate at between 0.00% and 0.25% and continuance of its quantitative easing program which suggests a low probability of increases in short term interest rates over the next two years.
The following table presents the Company’s net interest income and economic value of equity (“EVE”) sensitivity as of September 30, 2017 and December 31, 2016 related to an instantaneous and sustained non-parallel shift in market interest rates of 100 and 200 basis points in both directions:upward direction as of March 31, 2021 and December 31, 2020.
| | | | | | | | | | | | | | | | | | |
|
Change in Interest Rates
(Basis Points) | | Net Interest Income Volatility (1) | | |
| March 31, 2021 | | December 31, 2020 | | | | |
| +200 | | 13.2 | % | | 12.6 | % | | | | |
| +100 | | 6.0 | % | | 5.6 | % | | | | |
| -100 | | NM | | NM | | | | |
| -200 | | NM | | NM | | | | |
|
NM — Not meaningful.
(1)The percentage change represents net interest income over 12 months in a stable interest rate environment versus net interest income in the various rate scenarios.
|
| | | | | | | | | | | | |
| |
Change in Interest Rates (BP) | | Net Interest Income Volatility (1) | | EVE Volatility (2) |
| | September 30, 2017 | | December 31, 2016 | | September 30, 2017 | | December 31, 2016 |
| +200 | | 20.5 | % | | 22.4 | % | | 13.4 | % | | 12.3 | % |
| +100 | | 11.4 | % | | 12.0 | % | | 7.0 | % | | 7.5 | % |
| -100 | | (8.0 | )% | | (6.8 | )% | | (3.7 | )% | | (5.0 | )% |
| -200 | | (10.4 | )% | | (7.5 | )% | | (9.6 | )% | | (9.3 | )% |
| |
| |
(1) | The percentage change represents net interest income over 12 months in a stable interest rate environment versus net interest income in the various rate scenarios. |
| |
(2) | The percentage change represents net portfolio value of the Company in a stable interest rate environment versus net portfolio value in the various rate scenarios. |
The Company’s net interest income profile as of March 31, 2021 reflects an asset sensitive position. Net interest income would be expected to increase if interest rates rise and to decrease if interest rates decline. The potential impact of rate decreases is somewhat muted due to the current low rate environment with the federal funds rate floored and the federal funds rate range between 0.00% and 0.25%. The Company is naturally asset sensitive due to the large share of variable rate loans in its loan portfolio, which are primarily linked to Prime and LIBOR indices. The Company’s interest income is vulnerable to changes in short-term interest rates. However, given the current low level of interest rates, the potential for further rate decreases is limited, which reduces the Bank’s exposure to risks associated with falling rates. The Company’s deposit portfolio is primarily comprised of non-maturity deposits, which are not directly tied to short-term interest rate indices, but are, nevertheless, sensitive to changes in short-term interest rates.
Twelve-Month Net Interest Income Simulation
The Company’s estimated twelve-month net interest income sensitivity as of September 30, 2017March 31, 2021 was slightly lowerhigher as compared to December 31, 2016 for both upward interest rate scenarios, as simulated increases in interest income are offset by an increase inwith the rate of repricing for the Company’s deposit portfolio. In a simulated downward interest rate scenario, sensitivity increased overall for both of the downward interest rate scenarios, mainly due to the impact of the recent interest rate increases on December 14, 2016, March 15, 2017, and June 14, 2017. As interest rates rise further away from all time historical lows, there is more room for the Company’s simulated interest income to decline in a downward interest rate scenario, relative to previous simulations.
Under most rising interest rate environments, the Company would expect some customers to move balances in demand deposits into higher interest-bearing deposits such as money market, savings or time deposits. The models are particularly sensitive to the assumption about the rate of such migration. The federal funds target rate was between 0.50% and 0.75% as of December 31, 2016,2020 under both higher rate scenarios. This reflects both an increased asset rate sensitivity in the Company’s assets and between 1.00%an increase in noninterest bearing deposits.
While an instantaneous and 1.25% as of September 30, 2017. It should be noted that despitesustained non-parallel shift in market interest rates was used in the two interest rate increasessimulation model described in 2017, as of September 30, 2017,the preceding paragraphs, the Company has not experienced this deposit movement, though there canbelieves that any shift in interest rates would likely be no assurance as to how long this is expected to last.more gradual and would therefore have a more modest impact. The rate ramp table below shows the net income volatility under a gradual non-parallel shift of the yield curve upward direction, in even quarterly increments over the first 12 months, followed by rates held constant thereafter:
| | | | | | | | | | | | | | |
|
Change in Interest Rates
(Basis Points) | | Net Interest Income Volatility (1) |
| March 31, 2021 | | December 31, 2020 |
| +200 Rate Ramp | | 5.4 | % | | 4.9 | % |
| +100 Rate Ramp | | 2.2 | % | | 2.2 | % |
| -100 Rate Ramp | | NM | | NM |
| -200 Rate Ramp | | NM | | NM |
|
NM — Not meaningful.
(1)The following table presents the Company’spercentage change represents net interest income under a gradual non-parallel shift in even quarterly increments over 12 months.
The Company believes that the rate ramp table, shown above, when evaluated together with the results of the rate shock simulation, presents a more meaningful indication of the potential impact of rising interest rates to the Company’s twelve-month net interest income. During the first quarter of 2021, the Company’s modeled asset sensitivity as of September 30, 2017increased slightly under a ramp simulation for the +100up 200 basis point ramp scenario and +200remained virtually unchanged for the up 100 basis pointspoint ramp interest rate scenarios assuming a $1.00 billion, $2.00 billion and $3.00 billion demand deposit migrations:scenario.
|
| | | | | | | | | |
| |
Change in Interest Rates
(BP) | | Net Interest Income Volatility |
| | September 30, 2017 |
| | $1.00 Billion Migration 12 Months | | $2.00 Billion Migration
12 Months | | $3.00 Billion Migration
12 Months |
| +200 | | 18.3 | % | | 16.0 | % | | 13.8 | % |
| +100 | | 9.9 | % | | 8.5 | % | | 7.0 | % |
| | | |
Economic Value of Equity at Risk
Economic value of equity (“EVE”) is a cash flow calculation that takes the present value of all asset cash flows and subtracts the present value of all liability cash flows. This calculation is used for asset/liability management and measures changes in the economic value of the bank. The fair market values of a bank's assets and liabilities are directly linked to interest rates. The economic value approach provides a comparatively broader scope than the net income volatility approach since it captures all anticipated cash flows.
EVE simulation reflects the effect of interest rate shifts on the value of the Company and is used to assess the degree of interest rate risk exposure. In contrast to the earnings perspective, the economic perspective identifies risks arising from repricing or maturity gaps over the life of the balance sheet. Changes in economic value indicate anticipated changes in the value of the bank’s future cash flows. Thus, the economic perspective can provide a leading indicator of the bank’s future earnings and capital values. The economic value method also reflects sensitivity across the full maturity spectrum of the bank’s assets and liabilities.
The following table presents the Company’s EVE sensitivity increased as of September 30, 2017, comparedrelated to December 31, 2016, for both of the upwardan instantaneous and sustained non-parallel shift in market interest rate scenarios. In the simulated upward 100 basis points and 200 basis points interest rate scenarios, EVE sensitivity was 7.0% and 13.4%, respectively. The increase in sensitivity as of September 30, 2017 compared to December 31, 2016 in the upward interest rate scenario was primarily due to changes in the balance sheet portfolio mix. EVE declined 3.7% and 9.6% of the base level as of September 30, 2017 in declining rate scenariosrates of 100 and 200 basis points respectively.in an upward direction as of March 31, 2021 and December 31, 2020:
| | | | | | | | | | | | | | |
| | | | |
Change in Interest Rates
(Basis Points) | | EVE Volatility (1) |
| March 31, 2021 | | December 31, 2020 |
| +200 | | 4.6 | % | | 9.6 | % |
| +100 | | 2.4 | % | | 4.8 | % |
| -100 | | NM | | NM |
| -200 | | NM | | NM |
| | | | |
NM — Not meaningful.
(1)The percentage change represents net portfolio value of the Company in a stable interest rate environment versus net portfolio value in the various rate scenarios.
The Company’s netEVE sensitivity for the upward interest incomerate scenarios decreased as of March 31, 2021 compared with the results as of December 31, 2020. The changes in EVE sensitivity during this period were primarily due to changes in level and shape of the yield curve.
The Company’s EVE profile as of September 30, 2017, as presented in the net interest income and EVE tables,March 31, 2021 reflects an asset sensitive netEVE position under the higher interest income position and an asset sensitive EVE position. The Company is naturally asset sensitive due to its large portfolio of rate-sensitive loans that are funded in part by noninterest-bearing and rate-stable core deposits. As a result, if there are no significant changes in the mix of assets and liabilities, net interest income increases when interest rates increase, and decreases when interest rates decrease.rate scenarios. Given the uncertainty of the magnitude, timing and direction of future interest rate movements, and the shape of the yield curve, actual results may vary from those predicted by the Company’s model.
Derivatives
It is the Company’s policy not to speculate on the future direction of interest rates, or foreign currency exchange rates.rates and commodity prices. However, the Company will from time to time,periodically enter into derivativesderivative transactions in order to reduce its exposure to market risks, includingprimarily interest rate risk and foreign currency risk. The Company believes that these derivative transactions, when properly structured and managed, may provide a hedge against inherent risk in certain assets orand liabilities and against risk in specific transactions. Hedging transactions may be implemented using a variety of derivative instruments such as swaps, caps, floors, financial futures, forwards and options. Prior to entering into any hedging activities, the Company analyzes the costs and benefits of the hedge in comparison to alternative strategies. In addition, the Company enters into derivative transactions in order to assist customers with their risk management objectives, such as managing exposure to fluctuations in interest rates, foreign currencies and commodity prices. To economically hedge against the derivative contracts entered into with the Company’s customers, the Company enters into mirrored derivative contracts with third-party financial institutions. The exposures from derivative transactions are collateralized by cash and/or eligible securities based on limits as set forth in the respective agreements entered between the Company and counterparty financial institutions.
Interest Rate Swaps on CertificatesThe Company is subject to credit risk associated with the counterparties to the derivative contracts. This counterparty credit risk is a multi-dimensional form of Deposit — Asrisk, affected by both the exposure and credit quality of September 30, 2017the counterparty, both of which are sensitive to market-induced changes. The Company’s Credit Risk Management Committee provides oversight of credit risks and the Company has guidelines in place to manage counterparty concentration, tenor limits and collateral. The Company manages the credit risk of its derivative positions by diversifying its positions among various counterparties, by entering into legally enforceable master netting arrangements and by requiring collateral arrangements, where possible. The Company may also transfer counterparty credit risk-related to interest rate swaps to institutional third parties through the use of credit risk participation agreements. Certain derivative contracts are required to be centrally cleared through clearinghouses to further mitigate counterparty credit risk. The Company incorporates credit value adjustments and other market standard methodologies to appropriately reflect its own nonperformance risk and the respective counterparty’s nonperformance risk in the fair value measurements of its derivatives.
The following table summarizes certain information concerning derivative financial instruments utilized by the Company in its management of interest rate risk and foreign currency risk as of March 31, 2021 and December 31, 2016,2020:
| | | | | | | | | | | | | | | | | | | | | | | | | | |
|
| ($ in thousands) | | March 31, 2021 | | December 31, 2020 |
| | Interest Rate Contracts | | Foreign Exchange Contracts | | Interest Rate Contracts | | Foreign Exchange Contracts |
| Derivatives designated as hedging instruments: | | Cash Flow Hedges | | Net Investment Hedges | | Cash Flow Hedges | | Net Investment Hedges |
| Notional amounts: | | $ | 275,000 | | | $ | 83,936 | | | $ | 275,000 | | | $ | 84,269 | |
| Fair value: | | | | | | | | |
| Recognized as an asset | | — | | | 908 | | | — | | | — | |
| Recognized as a liability | | 1,258 | | | — | | | 1,864 | | | 235 | |
| Net fair value | | $ | (1,258) | | | $ | 908 | | | $ | (1,864) | | | $ | (235) | |
| Weighted average interest rates: | | | | | | | | |
| Pay fixed (receive floating) | | 0.483%
(3-month USD-LIBOR) | | NM | | 0.483%
(3-month USD-LIBOR) | | NM |
| Weighted average remaining term to maturity (in months): | | 22.9 | | | 2.8 | | | 25.8 | | | 2.6 | |
| Derivatives not designated as hedging instruments: | | Interest Rate Contracts | | Foreign Exchange Contracts | | Interest Rate Contracts | | Foreign Exchange Contracts |
| Notional amounts: | | $ | 17,891,960 | | | $ | 4,036,958 | | | $ | 18,155,678 | | | $ | 3,108,488 | |
| Fair value: | | | | | | | | |
| Recognized as an asset | | 319,049 | | 38,654 | | 489,132 | | 30,300 |
| Recognized as a liability | | 229,032 | | 27,287 | | 315,834 | | 22,524 |
| Net fair value | | $ | 90,017 | | | $ | 11,367 | | | $ | 173,298 | | | $ | 7,776 | |
|
NM — Not meaningful.
Derivatives Designated as Hedging Instruments — Interest rate and foreign exchange derivative contracts are utilized in our asset and liability management activities and serve as an efficient tool to manage the Company’s interest rate risk and foreign exchange risk. We use derivatives to hedge the risk of variable cash flows that the Company had two cancellableis exposed to from its variable interest rate swap contracts with original termsborrowings, including repurchase agreements and FHLB advances. The Company also uses derivatives to hedge the risk of 20 years. changes in the USD equivalent value of a designated monetary amount of the Company’s net investment in East West Bank (China) Limited. For both cash flow and net investment hedges, the change in the fair value of the hedging instruments is recognized in Accumulated other comprehensive (loss) income, net of tax, on the Consolidated Balance Sheet.
The objectivefluctuation in foreign currency translation of thesethe hedged exposure is expected to be offset by changes in the fair value of the forwards. As of March 31, 2021, the outstanding foreign currency forwards effectively hedged approximately 50% of the Chinese Renminbi exposure in East West Bank (China) Limited.
Changes to the composition of the Company’s derivatives designated as hedging instruments reflect actions taken for interest rate swaps, which were designated as fair value hedges, wasrisk and foreign exchange rate risk management. The decisions to obtain low-cost floating rate fundingreposition our derivatives portfolio are based on the Company’s brokered certificatescurrent assessment of deposit. As of September 30, 2017economic and December 31, 2016, underfinancial conditions, including the terms of the swap contracts, the Company received a fixed interest rate and paid a variable interest rate. Asforeign currency environments, balance sheet composition and trends, and the relative mix of September 30, 2017our cash and December 31, 2016, the notional amounts of the Company’s brokered certificates of deposit interest rate swaps were $42.6 million and $48.4 million, respectively. The fair value liabilities of the interest rate swaps were $6.6 million and $6.0 millionderivative positions.
Derivatives Not Designated as of September 30, 2017 and December 31, 2016, respectively.
Interest Rate Swaps and OptionsHedging Instruments — The Company also offers variousenters into interest rate, derivative productsforeign exchange and energy commodity contracts to support the business requirements of its customers. When derivative transactions are executed with its customers, the derivative contracts are offset by paired trades with registered swap dealers. Thesethird-party financial institutions. The Company may enter into derivative contracts that are either exchange-traded, centrally cleared through a clearinghouse or over-the-counter.
The Company offers various interest rate derivative contracts to its customers. For the interest rate contracts entered into with its customers, the Company managed its interest rate risk by entering into offsetting interest rate contracts with third-party financial institutions including with central clearing organizations. Certain derivative contracts entered with central clearing organizations are settled-to-market daily to the extent the central clearing organizations’ rulebooks legally characterize the variation margin as settlement. Derivative contracts allow borrowers to lock in attractive intermediate and long-term fixed rate financing while not increasing the interest rate risk to the Company. These transactions are not linked to specific Company assets or liabilities on the Consolidated Balance SheetsSheet, or to forecasted transactions in a hedgehedging relationship, and are therefore are economic hedges. The contracts are marked to marketmarked-to-market at each reporting period. Fair values are determined from verifiable third-party sources that have considerable experience with derivative markets. The Company provides data to the third party source to calculate the credit valuation component of thechanges in fair values of the client derivative contracts.
As of September 30, 2017,contracts traded with third-party financial institutions are expected to be largely comparable to the total notional amounts of interest rate swaps and options, including mirrored transactions with institutional counterparties and the Company’s customers, totaled $4.37 billion for derivatives that werechanges in an asset valuation position and $4.37 billion for derivatives that were in a liability valuation position. As of December 31, 2016, the total notional amounts of interest rate swaps and options, including mirrored transactions with institutional counterparties and the Company’s customers, totaled $3.86 billion for derivatives that were in an asset valuation position and $3.81 billion for derivatives that were in a liability valuation position. The fair values of interest rate swap and optionthe derivative transactions executed with customers throughout the terms of these contracts, with institutional counterpartiesexcept for the credit valuation adjustment component. The Company records credit valuation adjustments on derivatives to properly reflect the variances of credit worthiness between the Company and the Company’s customers amounted to a $64.8 million assetcounterparties, considering the effects of enforceable master netting agreements and a $64.2 million liability as of September 30, 2017. The fair values of interest rate swap and option contracts with institutional counterparties and the Company’s customers amounted to a $67.6 million asset and a $65.1 million liability as of December 31, 2016.collateral arrangements.
Foreign Exchange Contracts — The Company enters into foreign exchange contracts with its customers, primarily comprisedconsisting of forward, spot, swap and spotoption contracts to enableaccommodate the business needs of its customers to hedge their transactions in foreign currencies from fluctuations in foreign exchange rates, and also to allow the Company to economically hedge against foreign currency fluctuations in certain foreign currency denominated deposits that it offers to its customers, as well as the Company’s investment in its China subsidiary, East West Bank (China) Limited.
customers. For a majority of the foreign exchange transactionscontracts entered into with its customers, the Company entersmanaged its foreign exchange and credit exposures by entering into offsetting foreign exchange contracts with institutionalthird-party financial institutions and/or entering into bilateral collateral and master netting agreements with customer counterparties. The changes in the fair values entered with third-party financial institutions are expected to be largely comparable to the changes in fair values of the foreign exchange transactions executed with customers throughout the terms of these contracts. As of March 31, 2021, the Company anticipates performance by all counterparties and has not experienced nonperformance by any of its counterparties, and therefore did not incur any related losses. The Company also utilizes foreign exchange contracts that are not designated as hedging instruments to mitigate the economic effect of fluctuations in certain foreign exchange risk. These transactions are economic hedgescurrency on-balance sheet assets and the Company does not apply hedge accounting.liabilities, primarily foreign currency denominated deposits offered to its customers. The Company’s policies also permit taking proprietary currency positions within approved limits, in compliance with theexemptions to proprietary trading exemptionrestrictions provided under Section 619 of the Dodd-Frank Act.Wall Street Reform and Consumer Protection Act, or the Volcker Rule. The Company does not speculate in the foreign exchange markets, and actively manages its foreign exchange exposures within prescribed risk limits and defined controls.
ASC 830-20, Foreign Currency Matters — Foreign Currency Transactions and ASC 815, Derivatives and Hedging, The Company enters into energy commodity contracts with its customers to allow hedging of the foreign currency risk of a net investment in a foreign operation. During the fourth quarter of 2015, the Company began entering into foreign currency forward contractsthem to hedge its investment in East West Bank (China) Limited, a non-U.S. dollar (“USD”) functional currency subsidiary in China. The hedging instruments, designated as net investment hedges, involve hedging the risk of changes in the USD equivalent value of a designated monetary amount of the Company’s net investment in China, against the risk of adversefluctuation in energy commodity prices. To economically hedge against the risk of fluctuation in commodity prices in the products offered to its customers, the Company enters into offsetting commodity contracts with third-party financial institutions, including with central clearing organizations. Certain derivative contracts entered into with central clearing organizations are settled to market daily, to the extent the central clearing organizations’ rulebooks legally characterize the variation margin as settlement. The changes in the foreign currency exchange rate. The notional amount and fair value of the net investment hedges were $83.0 million and a $4.3 million asset, respectively, as of December 31, 2016. Since recent policy changes by the People’s Bank of China, the central bank of the People’s Republic of China, as well as market sentiments have caused a divergence in the exchange rate movements of the on-shore Chinese Renminbi and off-shore Chinese Renminbi, the net investment hedge relationships were dedesignated during the first quarter of 2017, even though they continued to meet the hedge effectiveness test. As of September 30, 2017, the notional amount and fair value of these two foreign exchange forward contracts designated as economic hedges were $93.3 million and a $4.8 million liability, respectively, and have been included in the foreign exchange contracts’ notional amount of $1.13 billion and fair value of $14.2 million disclosed below.
As of September 30, 2017 and December 31, 2016, the Company’s total notional amounts of the foreign exchange contracts that were not designated as hedging instruments were $1.13 billion and $767.8 million, respectively. The fair values of the foreign exchangeenergy commodity contracts were a $14.2 million asset and a $20.1 million liability, respectively, as of September 30, 2017 and an $11.9 million asset and an $11.2 million liability, respectively, as of December 31, 2016.
Credit Risk Participation Agreements — The Company has entered into credit risk participation agreements (“RPAs”) under whichtraded with third-party financial institutions are expected to be largely comparable to the Company assumed its pro-rata sharechanges in fair values of the credit exposure associatedenergy commodity transactions executed with customers throughout the borrower’s performance related to interest rate derivativeterms of these contracts. The Company may or may not be a party to the interest rate derivative contract and enters into such RPAs in instances where the Company is a party to the related loan participation agreement with the borrower. The Company will make/receive payments under the RPAs if the borrower defaults on its obligation to perform under the interest rate derivative contract. The Company manages its credit risk on the RPAs by monitoring the credit worthiness of the borrowers, which is based on the normal credit review process. The notional amount of the RPAs reflects the Company’s pro-rata share of the derivative instrument. As of September 30, 2017, the notional amount and fair value of the RPAs purchased were $47.8 million and a $1 thousand liability, respectively. As of September 30, 2017, the notional amount and fair value of the RPAs sold were $20.6 million and a $2 thousand asset, respectively. As of December 31, 2016, the notional amount and fair value of the RPAs purchased were $48.3 million and a $3 thousand liability, respectively. As of December 31, 2016, the notional amount and fair value of the RPAs sold were $23.1 million and a $3 thousand asset, respectively.
Warrants — The Company obtained warrants to purchase preferred and common stock of technology and life sciences companies, as part of the loan origination process. As of September 30, 2017, the warrants included on the Consolidated Financial Statements were from public and private companies. The Company valued these warrants based on the Black-Scholes option pricing model. For warrants from public companies, the model uses the underlying stock price, stated strike price, warrant expiration date, risk-free interest rate based on duration-matched U.S. Treasury rate and market-observable company-specific option volatility as inputs to value the warrants. For warrants from private companies, the model uses inputs such as the offering price observed in the most recent round of funding, stated strike price, warrant expiration date, risk-free interest rate based on duration-matched U.S. Treasury rate and option volatility. The option volatility assumption was based on public market indices that include members that operate in similar industries as the companies in our private company portfolio. The model values were further adjusted for a general lack of liquidity due to the private nature of the underlying companies. As of September 30, 2017, the total fair value of the warrants held in public and private companies was a $1.5 million asset.
Additional information on the Company’s derivatives is presented in Note 1 — Summary of Significant Accounting Policies — Derivatives to the Consolidated Financial Statements of the Company’s 20162020 Form 10-K, and Note 4 3 —Fair Value Measurement and Fair Value of Financial Instruments and Note 7 6 — Derivatives to the Consolidated Financial Statements.Statements in this Form 10-Q.
The consolidated financial statements and related financial data presented in this report have been prepared according to GAAP, which require the measurement of financial and operating results in terms of historical dollars without considering the change in the relative purchasing power of money over time due to inflation. The primary impact of inflation on our operations is reflected in increased operating costs and the effect that inflation may have on both short- and long-term interest rates. Since almost all the assets and liabilities of a financial institution are monetary in nature, interest rates generally have a more significant impact on a financial institution's performance than inflation. While inflation expectations do affect interest rates, interest rates do not necessarily move in the same direction or to the same extent as the prices of goods and services.
Critical Accounting Policies and Estimates
SignificantThe Company’s significant accounting policies (see Note 1 — Summaryand use of Significant Accounting Policies to the Consolidated Financial Statements and Item 7. MD&A — Critical Accounting Policies and Estimates of the Company’s 2016 Form 10-K)estimates are fundamental to understanding the Company’s reported results.its results of operations and financial condition. Some accounting policies, by their nature, are inherently subject to estimation techniques, valuation assumptions and other subjective assessments. In addition, some significant accounting policies require significant judgmentjudgments in applying complex accounting principles to individual transactions to determinetransaction and determining the most appropriate treatment. The Company has procedures and processes in place to facilitate making these judgments. For significant accounting policies and use of estimates, see Note 1 — Summary of Significant Accounting Policies to the Consolidated Financial Statements of the Company’s 2020 Form 10-K.
Certain accounting policies are considered to have a critical effect on the Company’s Consolidated Financial StatementsStatements. Critical accounting policies are defined as those that require the most complex or subjective judgments and are reflective of significant uncertainties, and whose actual results could differ from the Company’s estimates. Future changes in the Company’s judgment.key variables could change future valuations and impact the results of operations. In each area, the Company has identified the most important variables in the estimation process. The Company has used the best information available to make the estimations necessary for the related assets and liabilities. ActualThe following accounting policies are critical to the Company’s Consolidated Financial Statements as they require management to make subjective and complex judgments about matters that are inherently uncertain where actual results could differ materially from the Company’s estimates, and future changes in the key variables could change future valuations and impact the results of operations. The following is a list of the more judgmental and complex accounting estimates and principles:estimates:
•fair value of financial instruments;
available-for-sale investment securities;
PCI loans;
•allowance for loan losses and unfunded credit losses;commitments;
•goodwill impairment; and
•income taxes.
Recently Issued Accounting Standards
For a detailed discussion and disclosure on new accounting pronouncements adopted, and recent accounting pronouncements issued, see Note 2—Current Accounting Developments to the Consolidated Financial Statements.Statements in this Form 10-Q.
Reconciliation of GAAP to Non-GAAP Financial Measures
To supplement the Company’s unaudited interim Consolidated Financial Statements presented in accordance with GAAP, the Company uses certain non-GAAP measures of financial performance. Non-GAAP financial measures are not in accordance with, or an alternative to GAAP. Generally, a non-GAAP financial measure is a numerical measure of a company’s performance that either excludes or includes amounts that are not normally excluded or included in the most directly comparable measure calculated and presented in accordance with GAAP. A non-GAAP financial measure may also be a financial metric that is not required by GAAP or other applicable requirements. The Company believes these non-GAAP financial measures, when taken together with the corresponding GAAP financial measures, provide meaningful supplemental information regarding its performance, and allow comparability to prior periods. These non-GAAP financial measures may be different from non-GAAP financial measures used by other companies, limiting their usefulness for comparison purposes.
The following tables present the reconciliations of GAAP to non-GAAP financial measures for the periods presented:
| | | | | | | | | | | | | | | | | | | | | | | |
|
| ($ in thousands) | | | Three Months Ended |
| March 31, 2021 | | December 31, 2020 | | March 31, 2020 |
| Net interest income before provision for credit losses | (a) | | $ | 353,695 | | | $ | 346,581 | | | $ | 362,707 | |
Total noninterest income (1) | | | 72,866 | | | 69,832 | | | 55,506 | |
| Total revenue | (b) | | $ | 426,561 | | | $ | 416,413 | | | $ | 418,213 | |
| | | | | | | |
| | | | | | | |
| | | | | | | |
| | | | | | | |
| | | | | | | |
Total noninterest expense (1) | (c) | | $ | 191,077 | | | $ | 178,651 | | | $ | 180,333 | |
Less: Amortization of tax credit and other investments (1) | | | (25,358) | | | (12,263) | | | (18,782) | |
| Amortization of core deposit intangibles | | | (732) | | | (823) | | | (953) | |
| | | | | | | |
| Non-GAAP noninterest expense | (d) | | $ | 164,987 | | | $ | 165,565 | | | $ | 160,598 | |
| | | | | | | |
| Efficiency ratio | (c)/(b) | | 44.79 | % | | 42.90 | % | | 43.12 | % |
| Non-GAAP efficiency ratio | (d)/(b) | | 38.68 | % | | 39.76 | % | | 38.40 | % |
|
(1)In the fourth quarter of 2020, the Company reclassified certain income/losses from equity-method investments from Amortization of tax credit and other investments to Other investment income, with no effect on net income. Prior-period amounts have been revised to conform with the current presentation.
| | | | | | | | | | | | | | | | | | | | | | | |
| | |
($ and shares in thousands, except per share data) | | | March 31, 2021 | | December 31, 2020 | | March 31, 2020 |
| Stockholders’ equity | (a) | | $ | 5,285,027 | | | $ | 5,269,175 | | | $ | 4,902,985 | |
| Less: Goodwill | | | (465,697) | | | (465,697) | | | (465,697) | |
Other intangible assets (1) | | | (11,151) | | | (11,899) | | | (14,769) | |
| Non-GAAP tangible common equity | (b) | | $ | 4,808,179 | | | $ | 4,791,579 | | | $ | 4,422,519 | |
| | | | | | | |
| Total assets | (c) | | $ | 56,874,146 | | | $ | 52,156,913 | | | $ | 45,948,545 | |
| Less: Goodwill | | | (465,697) | | | (465,697) | | | (465,697) | |
Other intangible assets (1) | | | (11,151) | | | (11,899) | | | (14,769) | |
| Non-GAAP tangible assets | (d) | | $ | 56,397,298 | | | $ | 51,679,317 | | | $ | 45,468,079 | |
| | | | | | | |
| Total stockholders’ equity to total assets | (a)/(c) | | 9.29 | % | | 10.10 | % | | 10.67 | % |
| Non-GAAP tangible common equity to tangible assets | (b)/(d) | | 8.53 | % | | 9.27 | % | | 9.73 | % |
| | | | | | | |
| Number of common shares at period-end | (e) | | 141,843 | | | 141,565 | | | 141,435 | |
| Non-GAAP tangible common equity per share | (b)/(e) | | $ | 33.90 | | | $ | 33.85 | | | $ | 31.27 | |
| | |
(1)Includes core deposit intangibles and mortgage servicing assets.
| | | | | | | | | | | | | | | | | | | | | | | |
|
| ($ in thousands) | | | Three Months Ended |
| March 31, 2021 | | December 31, 2020 | | March 31, 2020 |
| Net income | | | $ | 204,994 | | | $ | 164,084 | | | $ | 144,824 | |
| Add: Amortization of core deposit intangibles | | | 732 | | | 823 | | | 953 | |
| Amortization of mortgage servicing assets | | | 414 | | | 428 | | | 584 | |
Tax effect of adjustments (1) | | | (325) | | | (355) | | | (436) | |
| Non-GAAP tangible net income | (a) | | $ | 205,815 | | | $ | 164,980 | | | $ | 145,925 | |
| | | | | | | |
| | | | | | | |
| | | | | | | |
| | | | | | | |
| | | | | | | |
| | | | | | | |
| Average stockholders’ equity | | | $ | 5,338,098 | | | $ | 5,243,203 | | | $ | 5,022,005 | |
| Less: Average goodwill | | | (465,697) | | | (465,697) | | | (465,697) | |
Average other intangible asset (2) | | | (11,594) | | | (12,182) | | | (15,588) | |
| Average non-GAAP tangible equity | (b) | | $ | 4,860,807 | | | $ | 4,765,324 | | | $ | 4,540,720 | |
| | | | | | | |
Return on average non-GAAP tangible equity (3) | (a)/(b) | | 17.17 | % | | 13.77 | % | | 12.93 | % |
|
(1)Applied statutory rates of 28.37% for the three month ended March 31, 2021 and December 31, 2020, and 28.35% for the three months ended March 31, 2020.
(2)Includes core deposit intangibles and mortgage servicing assets.
(3)Annualized.
Forward-Looking Statements
Certain matters discussed in this Form 10-Q contain forward-looking statements that are intended to be covered by the safe harbor for such statements provided by the Private Securities Litigation Reform Act of 1995. In addition, the Company may make forward-looking statements in other documents that it files with, or furnishes to, the SEC and management may make forward-looking statements to analysts, investors, media members and others. Forward-looking statements are statements that are not historical facts, and are based on current expectations, estimates and projections about the Company’s industry, management’s beliefs and certain assumptions made by management, many of which, by their nature, are inherently uncertain and beyond the Company’s control, particularly with regard to developments related to the COVID-19 pandemic. These statements relate to the Company’s financial condition, results of operations, plans, objectives, future performance and/or business. They usually can be identified by the use of forward-looking language, such as “likely result in,” “expects,” “anticipates,” “estimates,” “forecasts,” “projects,” “intends to,” “assumes,” “believes,” “plans,” “trend,” “objective,” “continues,” “remains,” “will,” “would,” “should,” “could,” “may,” “might,” “can,” or similar expressions, and the negative thereof. You should not place undue reliance on these statements, as they are subject to risks and uncertainties, including, but not limited to, those described in the documents incorporated by reference. When considering these forward-looking statements, you should keep in mind these risks and uncertainties, as well as any cautionary statements the Company may make. Moreover, you should treat these statements as speaking only as of the date they are made and based only on information then actually known to the Company.
There are a number of important factors that could cause future results to differ materially from historical performance and these forward-looking statements. Factors that might cause such differences, some of which are beyond the Company’s control, include, but are not limited to:
•the impact of disease pandemics, such as the resurgences and subsequent waves of the COVID-19 pandemic, on the Company, its operations, customers and employees and the markets in which the Company operates and in which its loans are concentrated; and the measures that international, federal, state and local governments, agencies, law enforcement and/or health authorities implement to address such a pandemic, which may precipitate or exacerbate one or more of the below-mentioned or other risks, and significantly disrupt or prevent the Company from operating its business in the ordinary course for an extended period;
•changes in governmental policy and regulation, including measures taken in response to economic, business, political and social conditions, such as the SBA’s PPP, the CARES Act and any similar or related rules and regulations, efforts of the Federal Reserve to provide liquidity to the U.S. financial system, including changes in government interest rate policies, and to provide credit to private commercial and municipal borrowers, and other programs designed to address the effects of the COVID-19 pandemic, as well as the resulting effect of all such items on the Company’s operations, liquidity and capital position, and on the financial condition of the Company’s borrowers and other customers;
•changes in the U.S. economy, including an economic slowdown or recession, inflation, deflation, housing prices, employment levels, rate of growth and general business conditions;
•changes in laws or the regulatory environment including regulatory reform initiatives and policies of the U.S. Department of Treasury, the Federal Reserve, the Federal Deposit Insurance Corporation, the Office of the Comptroller of the Currency, the SEC, the Consumer Financial Protection Bureau, the DFPI - Division of Financial Institutions and the SBA;
•the changes and effects thereof in trade, monetary and fiscal policies and laws, including the ongoing trade dispute between the U.S. and the People’s Republic of China;
•changes in the commercial and consumer real estate markets;
•changes in consumer spending and savings habits;
•fluctuations in the Company’s stock price;
•changes in income tax laws and regulations;
•the Company’s ability to compete effectively against other financial institutions in its banking markets;
•the soundness of other financial institutions;
•success and timing of the Company’s business strategies;
•the Company’s ability to retain key officers and employees;
•impact on the Company’s funding costs, net interest income and net interest margin from changes in key variable market interest rates, competition, regulatory requirements and the Company’s product mix;
•changes in the Company’s costs of operation, compliance and expansion;
•the Company’s ability to adopt and successfully integrate new technologies into its business in a strategic manner;
•impact of the benchmark interest rate reform in the U.S. including the transition away from USD LIBOR to alternative reference rates;
•impact of a communications or technology disruption, failure in, or breach of, the Company’s operational or security systems or infrastructure, or those of third parties with whom the Company does business, including as a result of cyber-attacks; and other similar matters which could result in, among other things, confidential and/or proprietary information being disclosed or misused, and materially impact the Company’s ability to provide services to its clients;
•adequacy of the Company’s risk management framework, disclosure controls and procedures and internal control over financial reporting;
•future credit quality and performance, including the Company’s expectations regarding future credit losses and allowance levels;
•impact of adverse changes to the Company’s credit ratings from major credit rating agencies;
•impact of adverse judgments or settlements in litigation;
•impact on the Company’s international operations due to political developments, disease pandemics, wars or other hostilities that may disrupt or increase volatility in securities or otherwise affect economic conditions;
•heightened regulatory and governmental oversight and scrutiny of the Company’s business practices, including dealings with consumers;
•impact of reputational risk from negative publicity, fines and penalties and other negative consequences from regulatory violations and legal actions and from the Company’s interactions with business partners, counterparties, service providers and other third parties;
•impact of regulatory enforcement actions;
•changes in accounting standards as may be required by the FASB or other regulatory agencies and their impact on critical accounting policies and assumptions;
•impact of other potential federal tax changes and spending cuts;
•the Company’s capital requirements and its ability to generate capital internally or raise capital on favorable terms;
•impact on the Company’s liquidity due to changes in the Company’s ability to pay dividends and repurchase common stock and to receive dividends from its subsidiaries;
•any future strategic acquisitions or divestitures;
•changes in the equity and debt securities markets;
•fluctuations in foreign currency exchange rates;
•impact of climate change, social and sustainability concerns;
•significant turbulence or disruption in the capital or financial markets, which could result in, among other things, a reduction in the availability of funding or increases in funding costs, a reduction in investor demand for mortgage loans and declines in asset values and/or recognition of allowance for credit losses on securities held in the Company’s AFS debt securities portfolio; and
•impact of natural or man-made disasters or calamities, such as wildfires and earthquakes, which are particular to California, or conflicts, terrorism or other events that may directly or indirectly result in a negative impact on the Company’s financial performance.
Given the ongoing and dynamic nature of the COVID-19 pandemic, it is difficult to predict the full impact of the COVID-19 pandemic on the Company’s business. The extent to which the COVID-19 pandemic impacts the Company will depend on future developments that are uncertain and unpredictable, including the scope, severity and duration of the pandemic and its impact on the Company’s customers, the actions taken by governmental authorities in response to the pandemic as well as its impact on global and regional economies, and the pace of recovery when the COVID-19 pandemic subsides, among others.
For a more detailed discussion of some of the factors that might cause such differences, see the Company’s 2020 Form 10-K under the heading Item 1A. Risk Factors and the information set forth under Item 1A. Risk Factors in this Form 10-Q. The Company does not undertake, and specifically disclaims, any obligation to update or revise any forward-looking statements to reflect the occurrence of events or circumstances after the date of such statements except as required by law.
ITEM 3. QUANTITATIVE AND QUALITATIVE DISCLOSURES ABOUT MARKET RISK
For quantitative and qualitative disclosures regarding market risk in the Company’s portfolio, see Item 1. Consolidated Financial Statements — Note 76 — Derivatives and Item 2. MD&A — Asset Liability andRisk Management — Market Risk Management in Part I of this report. Form 10-Q.
ITEM 4. CONTROLS AND PROCEDURES
Disclosure Controls and Procedures
As of September 30, 2017,March 31, 2021, pursuant to Rule 13a-15(b) of the Securities Exchange Act of 1934, as amended (the “Exchange Act”), the Company conducted an evaluation, under the supervision and with the participation of the Company’s management, including the Chief Executive Officer and Chief Financial Officer, of the effectiveness of the design and operation of the Company’s disclosure controls and procedures (as defined in Rule 13a-15(e) of the Exchange Act). Based upon that evaluation, the Company’s Chief Executive Officer and Chief Financial Officer concluded that the Company’s disclosure controls and procedures were effective as of September 30, 2017.March 31, 2021.
The Company’s disclosure controls and procedures are designed to ensure that information required to be disclosed by the Company in the reports that the Company files or submits under the Exchange Act is recorded, processed, summarized, and reported within the time periods specified in the rules and forms of the U.S. Securities and Exchange Commission.SEC. The Company’s disclosure controls and procedures include, without limitation, controls and procedures designed to ensure that information required to be disclosed by the Company in the reports that the Company files under the Exchange Act is accumulated and communicated to the Company’s management, including the Chief Executive Officer and Chief Financial Officer, as appropriate, to allow timely decisions regarding required disclosure.
Change in Internal Control over Financial Reporting
There has beenwere no changechanges in the Company’s internal control over financial reporting (as defined in Rule 13a-15(f) of the Exchange Act) during the quarter ended September 30, 2017,March 31, 2021, that hashave materially affected or isare reasonably likely to materially affect the Company’s internal control over financial reporting.
PART II — OTHER INFORMATION
ITEM 1. LEGAL PROCEEDINGS
See Item 1. Consolidated Financial Statements —Note 1110 —Commitments and Contingencies— Litigation in Part I of this report,Form 10-Q, incorporated herein by reference.
ITEM 1A. RISK FACTORS
The Company’s 20162020 Form 10-K contains disclosure regarding the risks and uncertainties related to the Company’s business under the heading Item 1A. Risk Factors. There has been no material change to the Company’s risk factors as presented in the Company’s 20162020 Form 10-K.
ITEM 2. UNREGISTERED SALES OF EQUITY SECURITIES AND USE OF PROCEEDS
There were no unregistered sales of equity securities or repurchase activities during the three months ended September 30, 2017.March 31, 2021.
ITEM 6. EXHIBITS
The following exhibit index lists Exhibits filed, or in the case of Exhibits 32.1 and 32.2 furnished, with this report:
| | | | | | | | |
| Exhibit No. | | Exhibit Description |
| | |
| 3.1 | | |
| | |
| 3.1.1 | | |
| | |
| 3.1.2 | | |
| | |
| 3.1.3 | | |
| | |
| 3.2 | | |
| | |
| 10.1 | | |
| | |
| 10.2 | | |
| | |
| | |
Exhibit No. | | Exhibit Description |
| | |
| | |
| | |
| | |
| | |
| | |
| 31.1 | | |
| | |
| | |
| | |
| | |
| | |
| | |
| | |
| 101.INS | | The instance document does not appear in the interactive data file because its XBRL Instance Document.tags are embedded within the inline XBRL document. |
| | |
| 101.SCH | | Inline XBRL Taxonomy Extension Schema Document. Filed herewith. |
| | |
| 101.CAL | | Inline XBRL Taxonomy Extension Calculation Linkbase Document. Filed herewith. |
| | |
| 101.DEF | | Inline XBRL Taxonomy Extension Definition Linkbase Document. Filed herewith. |
| | |
| 101.LAB | | Inline XBRL Taxonomy Extension Label Linkbase Document. Filed herewith. |
| | |
| 101.PRE | | Inline XBRL Taxonomy Extension Presentation Linkbase Document. Filed herewith. |
| | |
| 104 | | Cover Page Interactive Data (formatted as Inline XBRL and contained in Exhibit 101 filed herewith). Filed herewith. |
| | |
| * Denotes management contract or compensatory plan or arrangement. |
| | |
|
All other material referenced in this report which is required to be filed as an exhibit hereto has previously been submitted.
GLOSSARY OF ACRONYMS
|
| | | | | | | | | | |
ALCOAFS | Available-for-sale | LCH | London Clearing House |
| ALCO | Asset/Liability Committee | LGD | Loss given default |
AMLAOCI | Anti-Money Laundering |
AOCI | Accumulated other comprehensive (loss) income (loss) | LIBOR | London Interbank Offered Rate |
ASCARPA | American Rescue Plan Act of 2021 | LTV | Loan-to-value |
| ASC | Accounting Standards Codification |
ASU | Accounting Standards Update |
BPMD&A | Basis point |
BSA | Bank Secrecy Act |
C&I | Commercial and industrial |
CET1 | Common Equity Tier 1 |
CRA | Community Reinvestment Act |
CRE | Commercial real estate |
DBO | California Department of Business Oversight |
EPS | Earnings per share |
EVE | Economic value of equity |
EWIS | East West Insurance Service, Inc. |
FASB | Financial Accounting Standards Board |
FHLB | Federal Home Loan Bank |
FRB | Federal Reserve Bank of San Francisco |
GAAP | Generally Accepted Accounting Principles |
HELOCs | Home equity lines of credit |
MD&A | Management’s Discussion and Analysis of Financial Condition and Results of Operations |
MOUASU | Memorandum of UnderstandingAccounting Standards Update | MMBTU | Million British thermal unit |
Non-GAAPC&I | Non-Generally Accepted Accounting PrinciplesCommercial and industrial | Moody's | Moody’s Investors Service |
Non-PCICAA | Non-purchased credit impairedConsolidated Appropriations Act, 2021 | MSLP | Main Street Lending Program |
OREOCARES Act | Coronavirus Aid, Relief, and Economic Security Act | NAV | Net asset value |
| CECL | Current expected credit Losses | OREO | Other real estate owned |
OTTICET1 | Common Equity Tier 1 | OTTI | Other-than-temporary impairment |
PCICLO | Purchased credit impairedCollateralized loan obligation | PD | Probability of default |
RPAsCME | Chicago Mercantile Exchange | PPP | Paycheck Protection Program |
| COVID-19 | Coronavirus Disease 2019 | PPPLF | Paycheck Protection Program Liquidity Facility |
| CRA | Community Reinvestment Act | RMB | Chinese Renminbi |
| CRE | Commercial real estate | ROA | Return on average assets |
| DFPI | California Department of Financial Protection and Innovation | ROE | Return on average equity |
| EPS | Earnings per share | RPA | Credit risk participation agreementsagreement |
RSAsEVE | Economic value of equity | RSU | Restricted stock awardsunit |
RSUsFASB | Restricted stock unitsFinancial Accounting Standards Board | S&P | Standard and Poor's |
SBLCsFCA | Financial Conduct Authority | SBA | Small Business Administration |
| FHLB | Federal Home Loan Bank | SBLC | Standby lettersletter of credit |
S&PFOMC | StandardFederal Open Market Committee | SEC | U.S. Securities and Poor’sExchange Commission |
TDRsFRBSF | Federal Reserve Bank of San Francisco | TDR | Troubled debt restructuringsrestructuring |
U.S.FTP | Funds transfer pricing | U.S. | United States |
| GAAP | Generally accepted accounting principles | USD | U.S. GAAP | United States Generally Accepted Accounting Principlesdollar |
USDHELOC | U.S. DollarHome equity line of credit | VIE | Variable interest entity |
| | | |
| | | |
SIGNATURE
Pursuant to the requirements of the Securities Exchange Act of 1934, the registrant has duly caused this report to be signed on its behalf by the undersigned thereunto duly authorized.
|
| | | | | | | | | | | | | |
| Dated: | NovemberMay 7, 20172021 | |
| | |
| | EAST WEST BANCORP, INC.
(Registrant)
|
| | |
| | By | /s/ IRENE H. OH | |
| | | Irene H. Oh |
| | | Executive Vice President and
Chief Financial Officer
|
EXHIBIT INDEX
The following exhibit index lists Exhibits filed, or in the case of Exhibits 32.1 and 32.2, furnished with this report:
|
| | |
Exhibit No. | | Exhibit DescriptionEAST WEST BANCORP, INC.
(Registrant) |
| | |
| | By | /s/ IRENE H. OH | |
| | | Irene H. Oh |
| | | Executive Vice President and
Chief Financial Officer pursuant to Section 302 of the Sarbanes-Oxley Act of 2002. |
| | |
| | |
| | |
| | |
| | |
101.INS | | XBRL Instance Document. |
| | |
101.SCH | | XBRL Taxonomy Extension Schema Document. |
| | |
101.CAL | | XBRL Taxonomy Extension Calculation Linkbase Document. |
| | |
101.DEF | | XBRL Taxonomy Extension Definition Linkbase Document. |
| | |
101.LAB | | XBRL Taxonomy Extension Label Linkbase Document. |
| | |
101.PRE | | XBRL Taxonomy Extension Presentation Linkbase Document. |
All other material referenced in this report which is required to be filed as an exhibit hereto has previously been submitted.