Washington, D.C. 20549
Indicate by check mark whether the registrant (1) has filed all reports required to be filed by Section 13 or 15(d) of the Securities Exchange Act of 1934 during the preceding 12 months (or for such shorter period that the registrant was required to file such reports), and (2) has been subject to such filing requirements for the past 90 days.
Indicate by check mark whether the registrant is a large accelerated filer, an accelerated filer, a non-accelerated filer, a smaller reporting company, or an emerging growth company. See the definitions of “large accelerated filer,” “accelerated filer,” “smaller reporting company,” and “emerging growth company” in Rule 12b-2 of the Exchange Act.
Indicate by check mark whether the registrant is a shell company (as defined in Rule 12b-2 of the Exchange Act).
EAST WEST BANCORP, INC. AND SUBSIDIARIES
NOTES TO CONSOLIDATED FINANCIAL STATEMENTS
(Unaudited)
Note 1—Basis of Presentation
East West Bancorp, Inc. (referred to herein on an unconsolidated basis as “East West” and on a consolidated basis as the “Company”) is a registered bank holding company that offers a full range of banking services to individuals and businesses through its subsidiary bank, East West Bank and its subsidiaries (“East West Bank” or the “Bank”). The unaudited interim Consolidated Financial Statements in this Form 10-Q include the accounts of East West, East West Bank and East West’s various subsidiaries. Intercompany transactions and accounts have been eliminated in consolidation. As of September 30, 2017,March 31, 2024, East West also has sixone wholly-owned subsidiariessubsidiary that areis a statutory business truststrust (the “Trusts”“Trust”). In accordance with FASB Accounting Standards Codification (“ASC”) Topic 810, Consolidation, the Trusts areTrust is not included on the Consolidated Financial Statements.
The unaudited interim Consolidated Financial Statements are presented in accordance with United StatesU.S. Generally Accepted Accounting Principles (“U.S. GAAP”), applicable guidelines prescribed by regulatory authorities and general practices in the banking industry,industry. While the unaudited interim Consolidated Financial Statements reflect all adjustments that, in the opinion of management, are necessary for fair statementpresentation, they primarily serve to update the most recently filed annual report on Form 10-K, and may not include all the information and notes necessary to constitute a complete set of financial statements. Accordingly, they should be read in conjunction with the audited Consolidated Financial Statements and notes thereto included in the Company’s 2023 Form 10-K.
The preparation of the Consolidated Financial Statements in conformity with U.S. GAAP requires management to make estimates and assumptions that affect the reported amounts of assets and liabilities as of the date of the Consolidated Financial Statements, income and expenses during the reporting periods, and the related disclosures. Although our estimates consider current conditions and how we expect them to change in the future, it is reasonably possible that actual results could be materially different from those estimates. Hence, the current period’s results of operations are not necessarily indicative of results that may be expected for any future interim period Consolidated Financial Statements.or for the year as a whole. Certain items on the Consolidated Financial Statements and notes for the prior periods have been reclassified to conform to the current period presentation.
The current period’s results of operations are not necessarily indicative of results that may be expected for any other interim period or for the year as a whole. Events subsequent to the Consolidated Balance Sheet date have been evaluated through the date the Consolidated Financial Statements are issued for inclusion in the accompanying Consolidated Financial Statements. The unaudited interim Consolidated Financial Statements should be read in conjunction with the audited Consolidated Financial Statements and notes thereto, included in the Company’s 2016 Form 10-K.
Note 2— Current Accounting Developments and Summary of Significant Accounting Policies
New Accounting Pronouncements Adopted in 2024
| | | | | | | | | | | |
| Standard | Required Date of Adoption | Description | Effect on Financial Statements |
| | | |
| | | |
| | | |
ASU 2023-02, Investments — Equity Method and Joint Ventures (Topic 323): Accounting for Investments in Tax Credit Structures Using the Proportional Amortization Method
| January 1, 2024 | ASU 2023-02 expands the scope of the proportional amortization method (“PAM”) to equity tax credit investment programs if certain conditions are met. Previously, PAM could only be used for investments in low-income housing tax credit structures. Under this guidance, companies are able to elect, on a tax credit program-by-tax credit program basis, to apply PAM to all equity investments meeting the criteria in ASC 323-740-25-1.
The amendments in this guidance must be applied on a modified retrospective or a retrospective basis. | The Company adopted ASU 2023-02 on January 1, 2024, for all tax credit investments under a modified retrospective basis. The impact of the adoption decreased opening retained earnings on January 1, 2024 by $9 million. |
In March 2016, the FASB issued Accounting Standards Update (“ASU”) 2016-05, Derivatives and Hedging (Topic 815): Effect of Derivative Contract Novations on Existing Hedge Accounting Relationships, to clarify that a change in the counterparty to a derivative instrument that has been designated as the hedging instrument in an existing hedging relationship would not be considered a termination of the derivative instrument or a change in a critical term of the hedging relationship provided that all other hedge accounting criteria in ASC 815 continue to be met. This clarification applies to both cash flow and fair value hedging relationships.
The Companyfollowing standards were adopted this guidance prospectively in the first quarter of 2017. The adoption of this guidance did not have an impact on the Company’s Consolidated Financial Statements.
In March 2016, the FASB issued ASU 2016-06, Derivatives and Hedging (Topic 815): Contingent Put and Call Options in Debt Instruments, which requires an entity to use a four-step decision model when assessing contingent call (put) options that can accelerate the payment of principal on debt instruments to determine whether they are clearly and closely related to their debt hosts. The Company adopted this guidance on a modified retrospective basis in the first quarter of 2017. The adoption of this guidance did not have an impact on the Company’s Consolidated Financial Statements.
In March 2016, the FASB issued ASU 2016-07, Investments — Equity Method and Joint Ventures (Topic 323):Simplifying the Transition to the Equity Method of Accounting, to eliminate the requirement for an investor to retroactively apply the equity method when its increase in ownership interest (or degree of influence) in an investee triggers equity method accounting. The amendments in ASU 2016-07 also require that an entity that has an available-for-sale equity security that becomes qualified for the equity method of accounting recognize through earnings the unrealized holding gain or loss in accumulated other comprehensive income (loss) (“AOCI”) at the date the investment becomes qualified for use of the equity method. The Company adopted this guidance prospectively in the first quarter of 2017. The adoption of this guidance did not have an impact on the Company’s Consolidated Financial Statements.
In March 2016, the FASB issued ASU 2016-09, Compensation — Stock Compensation (Topic 718): Improvements to Employee Share-Based Payment Accounting, to simplify several aspects of the accounting for share-based payment transactions, including the income tax consequences, classification of awards as either equity or liabilities and classification in the statements of cash flows. The Company adopted this guidance in the first quarter of 2017. The changes that impacted the Company included a requirement that excess tax benefits and deficiencies be recognized as a component of Income tax expense on the Consolidated Statements of Income rather than Additional paid-in capital on the Consolidated Statements of Changes in Stockholders’ Equity as required in the previous guidance. The adoption of this guidance results in increased volatility to the Company’s income tax expense, but does not have a material impact on the Consolidated Balance Sheets or the Consolidated Statements of Changes in Stockholders’ Equity. The income tax expense volatility is dependent on the Company’s stock price on the dates the restricted stock units (“RSUs”) vest, which occur primarily in the first quarter of each year. Net excess tax benefits for RSUs of $4.6 million have been recognized by the Company as a component of Income tax expense on the Consolidated Statements of Income during the nine months ended September 30, 2017. The guidance also removes the impact of the excess tax benefits and deficiencies from the calculation of diluted EPS. In addition, ASU 2016-09 no longer requires a presentation of excess tax benefits and deficiencies as both an operating outflow and a financing inflow on the Consolidated Statements of Cash Flows. Instead, excess tax benefits and deficiencies are recorded along with other income tax cash flows as an operating activity. These changes to the guidance were applied on a prospective basis. The Company has also elected to retain its existing accounting policy election to estimate award forfeitures.
Recent Accounting Pronouncements
In May 2014, the FASB issued ASU 2014-09, Revenue from Contracts with Customers (Topic 606), which clarifies the principles for recognizing revenue for contracts to provide goods or services to customers and will replace most existing revenue recognition guidance in the U.S. GAAP when it becomes effective. Quantitative and qualitative disclosures regarding the nature, amount, timing and uncertainty of revenue and cash flows arising from contracts with customers are also required. ASU 2014-09 is effective on January 1, 2018. The guidance should be applied on either a modified retrospective or full retrospective basis. The Company’s revenue is mainly comprised of net interest income and noninterest income. The scope of the guidance explicitly excludes net interest income, as well as other revenues from financial instruments such as loans, leases, securities and derivatives. The Company has completed a comprehensive scoping exercise to determine the revenue streams that are in the scope of the guidance and the review of its contracts to ascertain whether certain noninterest income revenue items are within the scope of the new guidance. Based on the completed contract reviews thus far, the adoption of this guidance is2024, but they did not expected to have a material impact on its Consolidated Balance Sheets or Consolidated Statements of Income. The next phase of the Company’s implementation work will be to evaluate any changes that may be required to its applicable disclosures.
In January 2016, the FASB issued ASU 2016-01, Financial Instruments — Overall (Subtopic 825-10): Recognition and Measurement of Financial Assets and Financial Liabilities, which requires equity investments, except those accounted for under the equity method of accounting or consolidated, to be measured at fair value with changes recognized in net income, thus eliminating eligibility for the current available-for-sale category. If there is no readily determinable fair value, the guidance allows entities to measure equity investments at cost less impairment, whereby impairment is based on a qualitative assessment. Furthermore, investments in Federal Reserve Bank and FHLB stock are not subject to this guidance and will continue to be presented at cost. The guidance eliminates the requirement to disclose the methods and significant assumptions used to estimate the fair value of financial instruments measured at amortized cost and changes the presentation of financial assets and financial liabilities on the Consolidated Balance Sheets or in the footnotes. If an entity has elected the fair value option to measure liabilities, the guidance requires the portion of the change in the fair value of a liability resulting from credit risk to be presented in Other comprehensive income. ASU 2016-01 is effective on January 1, 2018. Early adoption is not permitted except for certain specific changes under the fair value option guidance. The amendments related to equity securities without readily determinable fair values (including disclosure requirements) should be applied prospectively to equity investments that exist as of the adoption date. The Company does not have a significant amount of equity securities classified as available-for-sale. Additionally, the Company does not have any financial liabilities accounted for under the fair value option. For the guidance that is applicable to us, the accounting will be implemented on a modified retrospective basis through a cumulative-effect adjustment to the Consolidated Balance Sheets as of January 1, 2018, except for the guidance related to equity securities without readily determinable fair values, which should be applied on a prospective basis. The adoption of this guidance is not expected to have a material impact on the Company’s Consolidated Balance Sheets or Consolidated StatementsFinancial Statements:
•ASU 2023-01, Leases (Topic 842): Common Control Arrangements
•ASU 2022-03, Fair Value Measurement (Topic 820) Fair Value Measurement of Income.Equity Securities Subject to Contractual Sale Restrictions
Significant Accounting Policies Update
In February 2016,
Income Taxes — The Company has elected to apply PAM to qualifying affordable housing partnership, new markets, historic, production and renewable energy tax credit investments. Under PAM, the FASB issued ASU 2016-02, Leases (Topic 842), which is intendedCompany amortizes the initial cost of the investment in proportion to increase transparencythe income tax credits and comparabilityother income tax benefits received, and recognizes the amortization in the accounting for lease transactions. The guidance requires lessees to recognize right-of-use assets and related lease liabilities for all leases with lease terms of more than 12 monthsIncome tax expense on the Consolidated Balance Sheets, and provide quantitative and qualitative disclosures regarding key information about the leasing arrangements. For short-term leases with a term of 12 months or less, lessees can make a policy election not to recognize lease assets and lease liabilities. Lessor accounting is largely unchanged. ASU 2016-02 is effective on January 1, 2019, with early adoption permitted. The guidance should be applied using a modified retrospective transition method through a cumulative-effect adjustment. The Company is currently evaluating the potential impact on its Consolidated Financial Statements by reviewing its existing lease contracts and service contracts that may include embedded leases. The Company expects the adoption of ASU 2016-02 to result in additional assets and liabilities, as the Company will be required to recognize operating leases on its Consolidated Balance Sheets. The Company does not expect a material impact to its recognition of operating lease expense on its Consolidated Statements of Income. Upon completion of the contract reviews and consideration of system requirements, the Company will evaluate the impacts of adopting the new accounting guidance on its disclosures.
In June 2016, the FASB issued ASU 2016-13, Financial Instruments — Credit Losses (Topic 326): Measurement of Credit Losses on Financial Instruments, to introduce a new approach based on expected losses to estimate credit losses on certain types of financial instruments, which modifies the impairment model for available-for-sale debt securities and provides for a simplified accounting model for purchased financial assets with credit deterioration since their origination. The new “expected credit loss” impairment model will apply to most financial assets measured at amortized cost and certain other instruments, including trade and other receivables, loan receivables, available-for-sale and held-to-maturity debt securities, net investments in leases and off-balance sheet credit exposures. For available-for-sale debt securities with unrealized losses, ASU 2016-13 does not change the measurement method of credit losses, except that the losses will be recognized as allowances rather than reductions in the amortized cost of the securities. ASU 2016-13 also expands the disclosure requirements regarding an entity’s assumptions, models and methods for estimating the allowance for loan and lease losses, and requires disclosure of the amortized cost balance for each class of financial asset by credit quality indicator, disaggregated by the year of origination (i.e., by vintage year). ASU 2016-13 is effective on January 1, 2020, with early adoption permitted on January 1, 2019. The guidance should be applied using a modified retrospective approach through a cumulative-effect adjustment to retained earnings as of the beginning of the reporting period of adoption. While the Company is still evaluating the impact on its Consolidated Financial Statements, the Company expects that ASU 2016-13 may result in an increase in the allowance for credit losses due to the following factors: 1) the allowance for credit losses provides for expected credit losses over the remaining expected life of the loan portfolio, and will consider expected future changes in macroeconomic conditions; 2) the nonaccretable difference on the purchased credit impaired (“PCI”) loans will be recognized as an allowance, offset by an increase in the carrying value of the PCI loans; and 3) an allowance may be established for estimated credit losses on available-for-sale and held-to-maturity debt securities. The amount of the increase will be impacted by the portfolio composition and quality, as well as the economic conditions and forecasts as of the adoption date. The Company has begun its implementation efforts by identifying key interpretive issues, assessing its processes and identifying the system requirements against the new guidance to determine what modifications may be required.
In August 2016, the FASB issued ASU 2016-15, Statement of Cash Flows (Topic 230): Classification of Certain Cash Receipts and Cash Payments, to provide guidance on eight specific issues related to classification on the Consolidated Statements of Cash Flows in order to reduce diversity in practice. The specific issues cover cash payments for debt prepayment or debt extinguishment costs; cash outflows for settlement of zero-coupon debt instruments or other debt instruments with coupon interest rates that are insignificant in relation to the effective interest rate of the borrowing; contingent consideration payments that are not made soon after a business combination; proceeds from the settlement of insurance claims; proceeds from the settlement of corporate-owned life insurance policies, including bank-owned life insurance policies; distributions received from equity method investees; beneficial interests received in securitization transactions; and clarification regarding when no specific U.S. GAAP guidance exists and the sources of the cash flows are not separately identifiable, the classification should be based on the activity that is likely to be the predominant source or use of the cash flows. ASU 2016-15 is effective on January 1, 2018, with early adoption permitted. The guidance should be applied using a retrospective transition method. The Company does not expect the adoption of this guidance to have a material impact on its Consolidated Financial Statements.Income.
In November 2016, the FASB issued ASU 2016-18, Statement of Cash Flows (Topic 230): Restricted Cash, whichrequires the Company to include those amounts that are deemed to be restricted cash and restricted cash equivalents in its cash and cash equivalent balances on the Consolidated Statements of Cash Flows. In addition, the Company is required to explain the changes in the combined total of restricted and unrestricted balances on the Consolidated Statements of Cash Flows. ASU 2016-18 is effective on January 1, 2018, with early adoption permitted. The guidance should be applied using a retrospective transition method to each period presented. The Company does not expect the adoption of this guidance to have a material impact on its Consolidated Financial Statements.
In January 2017, the FASB issued ASU 2017-04, Intangibles — Goodwill and Other (Topic 350): Simplifying the Test for Goodwill Impairment, to simplify the accounting for goodwill impairment. An entity will no longer perform a hypothetical purchase price allocation to measure goodwill impairment. Instead, impairment will be measured using the difference between the carrying amount and the fair value of the reporting unit. The guidance also eliminates the requirements for any reporting units with a zero or negative carrying amount to perform a qualitative assessment. ASU 2017-04 is effective on January 1, 2020 and should be applied prospectively. Early adoption is permitted for interim or annual goodwill impairment tests with measurement dates after January 1, 2017. The Company does not expect the adoption of this guidance to have a material impact on the Consolidated Financial Statements.
In March 2017, the FASB issued ASU 2017-08, Receivables — Nonrefundable Fees and Other Costs (Subtopic 310-20): Premium Amortization on Purchased Callable Debt Securities, which amends the amortization period for certain purchased callable debt securities held at a premium, shortening such period to the earliest call date. The guidance does not require any accounting changes for debt securities held at a discount; the discount continues to be amortized as an adjustment of yield over the contractual life (to maturity) of the instrument. ASU 2017-08 is effective on January 1, 2019, with early adoption permitted. The guidance should be applied using a modified retrospective transition method, with the cumulative-effect adjustment recognized to retained earnings as of the beginning of the period of adoption. The Company is currently evaluating the impact on its Consolidated Financial Statements.
In May 2017, the FASB issued ASU 2017-09, Compensation — Stock Compensation (Topic 718): Scope of Modification Accounting, which amends the scope of modification accounting for share-based payment arrangements. Specifically, an entity would not apply modification accounting if the fair value, vesting conditions and classification of the awards are the same immediately before and after the modification. ASU 2017-09 is effective on January 1, 2018, with early adoption permitted. The guidance should be applied prospectively to awards modified on or after the adoption date. The Company plans to adopt this guidance in the first quarter of 2018 prospectively.
In August 2017, the FASB issued ASU 2017-12, Derivatives and Hedging (Topic 815): Targeted Improvements to Accounting for Hedging Activities, which better aligns the Company’s risk management activities and financial reporting for hedging relationships through changes to both the description and measurement guidance for qualifying hedging relationships and the presentation of hedge results, expands and refines hedge accounting for both nonfinancial and financial risk components, and aligns the recognition and presentation of the effects of the hedging instrument and the hedged item on the Consolidated Financial Statements. ASU 2017-12 is effective on January 1, 2019, with early adoption permitted. Upon adoption, the guidance should be applied using a retrospective transition method to any existing cash flows or net investment hedges through a cumulative-effect adjustment to AOCI to eliminate the separate measurement of ineffectiveness. The amended presentation and disclosure guidance is applied prospectively. The Company is currently evaluating the impact on its Consolidated Financial Statements.
Note 3 — Dispositions
In the first quarter of 2017, the Company completed the sale and leaseback of a commercial property in San Francisco, California for cash consideration of $120.6 million and entered into a leaseback with the buyer for part of the property, consisting of a retail branch and office facilities. The property had a net book value of $31.6 million at the time of sale, resulting in a pre-tax gain of $85.4 million after considering $3.6 million in selling costs. As the leaseback is an operating lease, $71.7 million of the gain was recognized on the closing date, and $13.7 million was deferred and will be recognized over the term of the lease agreement. The first quarter 2017 diluted EPS impact from the sale of the commercial property was $0.28 per share, net of tax.
In the third quarter of 2017, the Company sold its insurance brokerage business, East West Insurance Services, Inc., for $4.3 million, and recorded a pre-tax gain of $3.8 million. The third quarter 2017 diluted EPS impact from the sale of the Company’s insurance brokerage business was $0.02 per share, net of tax.
Note 4 —Fair Value Measurement and Fair Value of Financial Instruments
In determining the fair value of financial instruments,Under applicable accounting standards, the Company uses various methods including market and income approaches. Based on these approaches, the Company utilizes certain assumptions that market participants would use in pricing an asset ormeasures a liability. These inputs can be readily observable, market corroborated or generally unobservable. The Company utilizes valuation techniques that maximize the useportion of observable inputs and minimize the use of unobservable inputs. The fair value hierarchy noted below is based on the quality and reliability of the information used to determine fair value. The fair value hierarchy gives the highest priority to quoted prices available in active markets and the lowest priority to data lacking transparency. The fair value of the Company’sits assets and liabilities is classified and disclosed in one of the following three categories:
|
| | | |
• | Level 1 | — | Valuation is based on quoted prices for identical instruments traded in active markets. |
• | Level 2 | — | Valuation is based on quoted prices for similar instruments in active markets; quoted prices for identical or similar instruments in markets that are not active; and model-derived valuations whose inputs are observable and can be corroborated by market data. |
• | Level 3 | — | Valuation is based on significant unobservable inputs for determining the fair value of assets or liabilities.at fair value. These significant unobservable inputs reflect assumptions that market participants may use in pricing the assets or liabilities. |
In determining the appropriate hierarchy levels, the Company performs an analysis of the assets and liabilities that are subject to fair value disclosure. The Company’s assets and liabilities are classified in their entirety based on the lowest level of input that is significant to theirpredominantly recorded at fair value measurements.
The following tables present financialon a recurring basis. From time to time, certain assets and liabilities that are measured at fair value on a recurring basis as of September 30, 2017 and December 31, 2016:
|
| | | | | | | | | | | | | | | | | |
| | | | | | | | | | |
| | | Assets (Liabilities) Measured at Fair Value on a Recurring Basis
as of September 30, 2017 |
| ($ in thousands) | | Fair Value Measurements | | Quoted Prices in Active Markets for Identical Assets (Level 1) | | Significant Other Observable Inputs (Level 2) | | Significant Unobservable Inputs (Level 3) |
| Available-for-sale investment securities: | | |
| | |
| | |
| | |
| |
| U.S. Treasury securities | | $ | 526,332 |
| | $ | 526,332 |
| | $ | — |
| | $ | — |
| |
| U.S. government agency and U.S. government sponsored enterprise debt securities | | 189,185 |
| | — |
| | 189,185 |
| | — |
| |
| U.S. government agency and U.S. government sponsored enterprise mortgage-backed securities: | | |
| | |
| | |
| | |
| |
| Commercial mortgage-backed securities | | 315,172 |
| | — |
| | 315,172 |
| | — |
| |
| Residential mortgage-backed securities | | 1,150,934 |
| | — |
| | 1,150,934 |
| | — |
| |
| Municipal securities | | 117,242 |
| | — |
| | 117,242 |
| | — |
| |
| Non-agency residential mortgage-backed securities: | | |
| | |
| | |
| | |
| |
| Investment grade | | 9,694 |
| | — |
| | 9,694 |
| | — |
| |
| Corporate debt securities: | | |
| | |
| | |
| | |
| |
| Investment grade | | 2,327 |
| | — |
| | 2,327 |
| | — |
| |
| Non-investment grade | | 9,615 |
| | — |
| | 9,615 |
| | — |
| |
| Foreign bonds: | | | | | | | | | |
| Investment grade | | 489,140 |
| | — |
| | 489,140 |
| | — |
| |
| Other securities | | 147,135 |
| | 31,418 |
| | 102 |
| | 115,615 |
| (1) |
| Total available-for-sale investment securities | | $ | 2,956,776 |
| | $ | 557,750 |
| | $ | 2,283,411 |
| | $ | 115,615 |
| |
| | | | | | | | | | |
| Derivative assets: | | | | | | | | | |
| Interest rate swaps and options | | $ | 64,822 |
| | $ | — |
| | $ | 64,822 |
| | $ | — |
| |
| Foreign exchange contracts | | 14,187 |
| | — |
| | 14,187 |
| | — |
| |
| Credit risk participation agreements (“RPAs”) | | 2 |
| | — |
| | 2 |
| | — |
| |
| Warrants | | 1,455 |
| | — |
| | 856 |
| | 599 |
| |
| Total derivative assets | | $ | 80,466 |
| | $ | — |
| | $ | 79,867 |
| | $ | 599 |
| |
| | | | | | | | | | |
| Derivative liabilities: | | | | | | | | | |
| Interest rate swaps on certificates of deposit | | $ | (6,648 | ) | | $ | — |
| | $ | (6,648 | ) | | $ | — |
| |
| Interest rate swaps and options | | (64,212 | ) | | — |
| | (64,212 | ) | | — |
| |
| Foreign exchange contracts | | (20,054 | ) | | — |
| | (20,054 | ) | | — |
| |
| RPAs | | (1 | ) | | — |
| | (1 | ) | | — |
| |
| Total derivative liabilities | | $ | (90,915 | ) | | $ | — |
| | $ | (90,915 | ) | | $ | — |
| |
| | | | | | | | | | |
| |
(1) | During the third quarter of 2017, the Company transferred a non-agency commercial mortgage-backed security with a net carrying amount of $115.6 million from held- to-maturitynonrecurring basis; that is, they are subject to available-for-sale. |
|
| | | | | | | | | | | | | | | | |
| |
| | | Assets (Liabilities) Measured at Fair Value on a Recurring Basis
as of December 31, 2016 |
| ($ in thousands) | | Fair Value Measurements | | Quoted Prices in
Active Markets
for Identical
Assets
(Level 1) | | Significant
Other
Observable
Inputs
(Level 2) | | Significant Unobservable Inputs (Level 3) |
| Available-for-sale investment securities: | | |
| | |
| | |
| | |
|
| U.S. Treasury securities | | $ | 720,479 |
| | $ | 720,479 |
| | $ | — |
| | $ | — |
|
| U.S. government agency and U.S. government sponsored enterprise debt securities | | 274,866 |
| | — |
| | 274,866 |
| | — |
|
| U.S. government agency and U.S. government sponsored enterprise mortgage-backed securities: | | |
| | |
| | |
| | |
|
| Commercial mortgage-backed securities | | 266,799 |
| | — |
| | 266,799 |
| | — |
|
| Residential mortgage-backed securities | | 1,258,747 |
| | — |
| | 1,258,747 |
| | — |
|
| Municipal securities | | 147,654 |
| | — |
| | 147,654 |
| | — |
|
| Non-agency residential mortgage-backed securities: | | |
| | |
| | |
| | |
|
| Investment grade | | 11,477 |
| | — |
| | 11,477 |
| | — |
|
| Corporate debt securities: | | |
| | |
| | |
| | |
|
| Investment grade | | 222,377 |
| | — |
| | 222,377 |
| | — |
|
| Non-investment grade | | 9,173 |
| | — |
| | 9,173 |
| | — |
|
| Foreign bonds: | | | | | | | | |
| Investment grade | | 383,894 |
| | — |
| | 383,894 |
| | — |
|
| Other securities | | 40,329 |
| | 30,991 |
| | 9,338 |
| | — |
|
| Total available-for-sale investment securities | | $ | 3,335,795 |
| | $ | 751,470 |
| | $ | 2,584,325 |
| | $ | — |
|
| | | | | | | | | |
| Derivative assets: | | | | | | | | |
| Foreign currency forward contracts | | $ | 4,325 |
| | $ | — |
| | $ | 4,325 |
| | $ | — |
|
| Interest rate swaps and options | | 67,578 |
| | — |
| | 67,578 |
| | — |
|
| Foreign exchange contracts | | 11,874 |
| | — |
| | 11,874 |
| | — |
|
| RPAs | | 3 |
| | — |
| | 3 |
| | — |
|
| Total derivative assets | | $ | 83,780 |
| | $ | — |
| | $ | 83,780 |
| | $ | — |
|
| | | | | | | | | |
| Derivative liabilities: | | | | | | | | |
| Interest rate swaps on certificates of deposit | | $ | (5,976 | ) | | $ | — |
| | $ | (5,976 | ) | | $ | — |
|
| Interest rate swaps and options | | (65,131 | ) | | — |
| | (65,131 | ) | | — |
|
| Foreign exchange contracts | | (11,213 | ) | | — |
| | (11,213 | ) | | — |
|
| RPAs | | (3 | ) | | — |
| | (3 | ) | | — |
|
| Total derivative liabilities | | $ | (82,323 | ) | | $ | — |
| | $ | (82,323 | ) | | $ | — |
|
| | | | | | | | | |
At each reporting period, all assets and liabilities for which the fair value measurement is based on significant unobservable inputs are classified as Level 3. There were no assets or liabilities measured using significant unobservable inputs (Level 3) on a recurring basis as of December 31, 2016, and during the three and nine months ended September 30, 2016. The following table presents a reconciliation of the beginning and ending balances for other securities and warrants measured at fair value on a recurring basis using significant unobservable inputs (Level 3) for the three and nine months ended September 30, 2017:
|
| | | | | | | | | | | | | | | | |
| | | Three Months Ended September 30, 2017 | | Nine Months Ended September 30, 2017 |
| ($ in thousands) | | Other securities | | Warrants | | Other securities | | Warrants |
| Beginning balance | | $ | — |
| | $ | — |
| | $ | — |
| | $ | — |
|
| Issuances | | — |
| | 599 |
| | — |
| | 599 |
|
| Transfer from held-to-maturity investment security to available-for-sale investment security | | 115,615 |
| | — |
| | 115,615 |
| | — |
|
| Ending balance | | $ | 115,615 |
|
| $ | 599 |
|
| $ | 115,615 |
|
| $ | 599 |
|
| | | | | | | | | |
Transfers into or out of fair value hierarchy classifications are made if the significant inputs used in the financial models measuring the fair values of the assets and liabilities become unobservable or observable in the current marketplace. The Company’s policy, with respect to transfers between levels of the fair value hierarchy, is to recognize transfers into and out of each level as of the end of the reporting period. There were no transfers of assets and liabilities measured on a recurring basis into and out of Level 1, Level 2 and Level 3 during the three and nine months ended September 30, 2017 and 2016. During the three and nine months ended September 30, 2017, the Company transferred a non-agency commercial mortgage-backed security with a net carrying amount of $115.6 million from held-to-maturity to available-for-sale to reflect the Company’s intent to sell the security under active liquidity management.
The following table presents quantitative information about significant unobservable inputs used in the valuation of assets measured on a recurring basis classified as Level 3 as of September 30, 2017. Significant unobservable inputs presented in the table below are those that the Company considers significant to the fair value of the Level 3 assets or liabilities. The Company considers unobservable inputs to be significant if, by their exclusion, the fair value of the Level 3 assets or liabilities would be impacted by a predetermined percentage change.
|
| | | | | | | | | | |
| | | | | | | | | |
| ($ in thousands) | | Fair Value Measurements (Level 3) | | Valuation Technique | | Unobservable Input(s) | | Weighted Average |
Available-for-sale investment securities:
| | | | | | | | |
| Other securities | | $ | 115,615 |
| | Discounted cash flows | | Discount margin | | 191 Basis points |
| | | | | | | | | |
| Derivative assets: | | | | | | | | |
| Warrants | | $ | 599 |
| | Black-Scholes option pricing model | | Volatility | | 44% |
| | | | | | | Liquidity discount | | 47% |
| | | | | | | | | |
Assets measured at fair value on a nonrecurring basis include certain non-purchased credit impaired (“non-PCI”) loans that were impaired, OREO and loans held-for-sale. These fair value adjustments result from impairments recognized duringonly as required through the period on certain non-PCI impaired loans, application of fair value less cost to sell on OREO and application of thean accounting method such as lower of cost or fair value on loans held-for-sale.
or write-down of individual assets. The following tables present the carrying amounts ofCompany categorizes its assets includedand liabilities into three levels based on the Consolidated Balance Sheets that hadestablished fair value changes measuredhierarchy and conducts a review of fair value hierarchy classifications on a nonrecurring basis as of September 30, 2017 and December 31, 2016:
|
| | | | | | | | | | | | | | | | |
| | | | | | | | | |
| | | Assets Measured at Fair Value on a Nonrecurring Basis
as of September 30, 2017 |
| ($ in thousands) | | Fair Value Measurements | | Quoted Prices in
Active Markets
for Identical
Assets
(Level 1) | | Significant
Other
Observable
Inputs
(Level 2) | | Significant Unobservable Inputs (Level 3) |
| Non-PCI impaired loans: | | |
| | |
| | |
| | |
|
| Commercial real estate (“CRE”) | | $ | 9,172 |
| | $ | — |
| | $ | — |
| | $ | 9,172 |
|
| Commercial and industrial (“C&I”) | | 32,053 |
| | — |
| | — |
| | 32,053 |
|
| Residential | | 6,079 |
| | — |
| | — |
| | 6,079 |
|
| Consumer | | 633 |
| | — |
| | — |
| | 633 |
|
| Total non-PCI impaired loans | | $ | 47,937 |
| | $ | — |
| | $ | — |
| | $ | 47,937 |
|
| OREO | | $ | 1,789 |
| | $ | — |
| | $ | — |
| | $ | 1,789 |
|
| | | | | | | | | |
|
| | | | | | | | | | | | | | | | |
| | | | | | | | | |
| | | Assets Measured at Fair Value on a Nonrecurring Basis
as of December 31, 2016 |
| ($ in thousands) | | Fair Value Measurements | | Quoted Prices in
Active Markets
for Identical
Assets
(Level 1) | | Significant
Other
Observable
Inputs
(Level 2) | | Significant Unobservable Inputs (Level 3) |
| Non-PCI impaired loans: | | |
| | |
| | |
| | |
|
| CRE | | $ | 14,908 |
| | $ | — |
| | $ | — |
| | $ | 14,908 |
|
| C&I | | 52,172 |
| | — |
| | — |
| | 52,172 |
|
| Residential | | 2,464 |
| | — |
| | — |
| | 2,464 |
|
| Consumer | | 610 |
| | — |
| | — |
| | 610 |
|
| Total non-PCI impaired loans | | $ | 70,154 |
| | $ | — |
| | $ | — |
| | $ | 70,154 |
|
| OREO | | $ | 345 |
| | $ | — |
| | $ | — |
| | $ | 345 |
|
| Loans held-for-sale | | $ | 22,703 |
| | $ | — |
| | $ | 22,703 |
| | $ | — |
|
| | | | | | | | | |
The following table presents the fair value adjustments of assets measured on a nonrecurring basis recognized during the three and nine months ended and which were included on the Consolidated Balance Sheets as of September 30, 2017 and 2016:
|
| | | | | | | | | | | | | | | | |
| | | | | | | | | |
| | | Three Months Ended September 30, | | Nine Months Ended September 30, |
| ($ in thousands) | | 2017 | | 2016 | | 2017 | | 2016 |
| Non-PCI impaired loans: | | | | | | |
| | |
|
| CRE | | $ | 6 |
| | $ | (282 | ) | | $ | (66 | ) | | $ | 1,741 |
|
| C&I | | (16,954 | ) | | 77 |
| | (17,648 | ) | | (5,497 | ) |
| Residential | | (3 | ) | | (14 | ) | | 49 |
| | (14 | ) |
| Consumer | | — |
| | — |
| | 25 |
| | 17 |
|
| Total non-PCI impaired loans | | $ | (16,951 | ) | | $ | (219 | ) | | $ | (17,640 | ) | | $ | (3,753 | ) |
| OREO | | $ | (285 | ) | | $ | (41 | ) | | $ | (286 | ) | | $ | (994 | ) |
| Loans held-for-sale | | $ | — |
| | $ | — |
| | $ | — |
| | $ | (2,351 | ) |
| | | | | | | | | |
The following table presents the quantitativequarterly basis. For more information about the significant unobservable inputs used in the valuation of assets measured on a nonrecurring basis classified as Level 3 as of September 30, 2017 and December 31, 2016:
|
| | | | | | | | | | | | |
| |
| ($ in thousands) | | Fair Value
Measurements
(Level 3) | | Valuation
Technique(s) | | Unobservable Input(s) | | Range of Input(s) | | Weighted
Average |
| September 30, 2017 | | |
| | | | | | | | |
| Non-PCI impaired loans | | $ | 30,563 |
| | Discounted cash flows | | Discount | | 0% — 82% | | 19% |
| | | $ | 17,374 |
| | Market comparables | | Discount (1) | | 0% — 100% | | 40% |
| OREO | | $ | 1,789 |
| | Appraisal | | Selling cost | | 8% | | 8% |
| December 31, 2016 | | | | | | | | | | |
| Non-PCI impaired loans | | $ | 31,835 |
| | Discounted cash flows | | Discount | | 0% — 62% | | 7% |
| | | $ | 38,319 |
| | Market comparables | | Discount (1) | | 0% — 100% | | 18% |
| OREO | | $ | 345 |
| | Appraisal | | Selling cost | | 8% | | 8% |
| | | | | | | | | | | |
| |
(1) | Discount is adjusted for factors such as liquidation cost of collateral and selling cost. |
The following tables present the carrying and fair values perregarding the fair value hierarchy of certain financial instruments, excluding those measured atand how the Company measures fair value, see Note 1 — Summary of Significant Accounting Policies — Significant Accounting Policies — Fair Value to the Consolidated Financial Statements in the Company’s 2023 Form 10-K.
Assets and Liabilities Measured at Fair Value on a recurring basis, as of September 30, 2017 and December 31, 2016:Recurring Basis
|
| | | | | | | | | | | | | | | | | | | | |
| |
| ($ in thousands) | | September 30, 2017 |
| | Carrying Amount | | Level 1 | | Level 2 | | Level 3 | | Estimated Fair Value |
| Financial assets: | | | | | | | | | | |
| Cash and cash equivalents | | $ | 1,736,749 |
| | $ | 1,736,749 |
| | $ | — |
| | $ | — |
| | $ | 1,736,749 |
|
| Interest-bearing deposits with banks | | $ | 404,946 |
| | $ | — |
| | $ | 404,946 |
| | $ | — |
| | $ | 404,946 |
|
Resale agreements (1) | | $ | 1,250,000 |
| | $ | — |
| | $ | 1,236,413 |
| | $ | — |
| | $ | 1,236,413 |
|
| Restricted equity securities | | $ | 73,322 |
| | $ | — |
| | $ | 73,322 |
| | $ | — |
| | $ | 73,322 |
|
| Loans held-for-sale | | $ | 178 |
| | $ | — |
| | $ | 178 |
| | $ | — |
| | $ | 178 |
|
| Loans held-for-investment, net | | $ | 28,239,431 |
| | $ | — |
| | $ | — |
| | $ | 27,635,961 |
| | $ | 27,635,961 |
|
| Accrued interest receivable | | $ | 111,710 |
| | $ | — |
| | $ | 111,710 |
| | $ | — |
| | $ | 111,710 |
|
| Financial liabilities: | | |
| | |
| | |
| | |
| | |
|
| Customer deposits: | | |
| | |
| | |
| | |
| | |
|
| Demand, checking, savings and money market deposits | | $ | 25,517,121 |
| | $ | — |
| | $ | 25,517,121 |
| | $ | — |
| | $ | 25,517,121 |
|
| Time deposits | | $ | 5,794,541 |
| | $ | — |
| | $ | 5,787,188 |
| | $ | — |
| | $ | 5,787,188 |
|
| Short-term borrowings | | $ | 24,813 |
| | $ | — |
| | $ | 24,813 |
| | $ | — |
| | $ | 24,813 |
|
| FHLB advances | | $ | 323,323 |
| | $ | — |
| | $ | 336,741 |
| | $ | — |
| | $ | 336,741 |
|
Repurchase agreements (1) | | $ | 50,000 |
| | $ | — |
| | $ | 105,269 |
| | $ | — |
| | $ | 105,269 |
|
| Long-term debt | | $ | 176,513 |
| | $ | — |
| | $ | 139,649 |
| | $ | — |
| | $ | 139,649 |
|
| Accrued interest payable | | $ | 11,017 |
| | $ | — |
| | $ | 11,017 |
| | $ | — |
| | $ | 11,017 |
|
| |
| |
(1) | Resale and repurchase agreements are reported net pursuant to ASC 210-20-45, Balance Sheet Offsetting. As of September 30, 2017, $400.0 millionout of $450.0 millionof repurchase agreements were eligible for netting against resale agreements.
|
|
| | | | | | | | | | | | | | | | | | | | |
| |
| ($ in thousands) | | December 31, 2016 |
| | Carrying
Amount | | Level 1 | | Level 2 | | Level 3 | | Estimated
Fair Value |
| Financial assets: | | |
| | |
| | |
| | |
| | |
|
| Cash and cash equivalents | | $ | 1,878,503 |
| | $ | 1,878,503 |
| | $ | — |
| | $ | — |
| | $ | 1,878,503 |
|
| Interest-bearing deposits with banks | | $ | 323,148 |
| | $ | — |
| | $ | 323,148 |
| | $ | — |
| | $ | 323,148 |
|
Resale agreements (1) | | $ | 2,000,000 |
| | $ | — |
| | $ | 1,980,457 |
| | $ | — |
| | $ | 1,980,457 |
|
| Held-to-maturity investment security | | $ | 143,971 |
| | $ | — |
| | $ | — |
| | $ | 144,593 |
| | $ | 144,593 |
|
| Restricted equity securities | | $ | 72,775 |
| | $ | — |
| | $ | 72,775 |
| | $ | — |
| | $ | 72,775 |
|
| Loans held-for-sale | | $ | 23,076 |
| | $ | — |
| | $ | 23,076 |
| | $ | — |
| | $ | 23,076 |
|
| Loans held-for-investment, net | | $ | 25,242,619 |
| | $ | — |
| | $ | — |
| | $ | 24,915,143 |
| | $ | 24,915,143 |
|
| Accrued interest receivable | | $ | 100,524 |
| | $ | — |
| | $ | 100,524 |
| | $ | — |
| | $ | 100,524 |
|
| Financial liabilities: | | |
| | |
| | |
| | |
| | |
|
| Customer deposits: | | |
| | |
| | |
| | |
| | |
|
| Demand, checking, savings and money market deposits | | $ | 24,275,714 |
| | $ | — |
| | $ | 24,275,714 |
| | $ | — |
| | $ | 24,275,714 |
|
| Time deposits | | $ | 5,615,269 |
| | $ | — |
| | $ | 5,611,746 |
| | $ | — |
| | $ | 5,611,746 |
|
| Short-term borrowings | | $ | 60,050 |
| | $ | — |
| | $ | 60,050 |
| | $ | — |
| | $ | 60,050 |
|
| FHLB advances | | $ | 321,643 |
| | $ | — |
| | $ | 334,859 |
| | $ | — |
| | $ | 334,859 |
|
Repurchase agreements (1) | | $ | 350,000 |
| | $ | — |
| | $ | 411,368 |
| | $ | — |
| | $ | 411,368 |
|
| Long-term debt | | $ | 186,327 |
| | $ | — |
| | $ | 186,670 |
| | $ | — |
| | $ | 186,670 |
|
| Accrued interest payable | | $ | 9,440 |
| | $ | — |
| | $ | 9,440 |
| | $ | — |
| | $ | 9,440 |
|
| |
| |
(1) | Resale and repurchase agreements are reported net pursuant to ASC 210-20-45, Balance Sheet Offsetting. As of December 31, 2016, $100.0 millionout of $450.0 millionof repurchase agreements were eligible for netting against resale agreements.
|
The following is a description ofsection describes the valuation methodologies and significant assumptions used by the Company to measure financial assets and liabilities at fair value, and to estimate fair value for certain financialon a recurring basis, as well as the general classification of these instruments not recorded at fair value. The description also includes the level ofwithin the fair value hierarchy in which the assets or liabilities are classified.hierarchy.
Cash and Cash EquivalentsAvailable-for-SaleDebt Securities — The carrying amount approximates fair value due to the short-term nature of these instruments. As such, the estimated fair value is classified as Level 1.
Interest-bearing Deposits with Banks — The fair value of interest-bearing deposits with banks generally approximates their book value due to their short maturities. In addition, due to the observable nature of the inputs used in deriving the estimated fair value, these instruments are classified as Level 2.
Resale Agreements — The fair value of resale agreementsAFS debt securities is estimated by discounting the cash flows based on expected maturities or repricing dates utilizing estimated market discount rates. In addition, due to the observable nature of the inputs used in deriving the estimated fair value, these instruments are classified as Level 2.
Held-to-Maturity Investment Security — The held-to-maturity investment security as of December 31, 2016 was comprised of a floating rate non-agency commercial mortgage-backed security that was subsequently transferred from held-to-maturity to available-for-sale during the three months ended September 30, 2017. This security was categorized under Available-for-sale investment securities — other securities as of September 30, 2017.The fair value of this security is estimated by discounting the future expected cash flows utilizing the underlying index and a discount margin. Other unobservable inputs include conditional prepayment rate, constant default rate and loss severity. Due to the significant unobservable inputs used in estimating the fair value, this security is classified as Level 3.
Available-for-SaleInvestment Securities — When available, the Company uses quoted market prices to determine the fair value of available-for-sale investment securities, which are classified as Level 1. Level 1 available-for-sale investment securities are primarily comprised of U.S. Treasury securities. Other than the non-agency commercial mortgage-backed security, the fair value of which is described above, the fair value of other available-for-sale investment securities are generally determined by independent external pricing service providers who have experience in valuing these securities or by taking the average quoted market prices obtained from independent external brokers. The valuations provided by the third-party pricing service providers are based on observable market inputs, which include benchmark yields, reported trades, issuer spreads, benchmark securities, bids, offers, prepayment expectations and reference data obtained from market research publications. Inputs used by the third-party pricing service providers in valuing collateralized mortgage obligations and other securitization structures also include newly issued data, monthly payment information, whole loan collateral performance, tranche evaluation and “To Be Announced” prices. In obtaining such valuationvaluing securities issued by state and political subdivisions, inputs used by third-party pricing service providers also include material event notices. The valuations provided by the brokers incorporate information from third parties,their trading desks, research and other market data.
On a monthly basis, the Company reviewedvalidates the methodologiesvaluations provided by third-party pricing service providers to ensure that the fair value determination is consistent with the applicable accounting guidance and the financial instruments are properly classified in the fair value hierarchy. To perform this validation, the Company evaluates the fair values of securities by comparing the fair values provided by the third-party pricing service providers to prices from other available independent sources for the same securities. When significant variances in prices are identified, the Company further compares inputs used by different sources to ascertain the reliability of these sources. On a quarterly basis, the Company reviews the valuation inputs and methodology furnished by third-party pricing service providers for each security category. On an annual basis, the Company assesses the reasonableness of broker pricing by reviewing the related pricing methodologies. This review includes corroborating pricing with market data, performing pricing input reviews under current market-related conditions, and investigating security pricing by instrument as needed.
When a quoted price in an active market exists for the identical security, this price is used to developdetermine the resulting fair values. The available-for-sale investmentvalue and the AFS debt security is classified as Level 1. Level 1 AFS debt securities valued using such methodsconsist of U.S. Treasury securities. When pricing is unavailable from third-party pricing service providers for certain securities, the Company requests market quotes from various independent external brokers and utilizes the average quoted market prices. In addition, the Company obtains market quotes from other official published sources. As these valuations are based on observable inputs in the current marketplace, they are classified as Level 2.
Loans Held-for-SaleEquity Securities — The Company’s loans held-for-sale are carried at the lower Equity securities consisted of cost or fair value. Loans held-for-sale were comprised of single-family residential loansmutual funds as of September 30, 2017,both March 31, 2024 and were primarily comprised of consumer loans as of December 31, 2016.2023. The Company invested in these mutual funds for CRA purposes. The Company uses net asset value (“NAV”) information to determine the fair value of loans held-for-salethese equity securities. When NAV is derived from current market pricesavailable periodically and comparative current sales. The Company records any fair value adjustments on a nonrecurring basis. Loans held-for-sale are classified as Level 2.
Non-PCI Impaired Loans — The fair value of non-PCI impaired loans is measured using the market comparables or discounted cash flow techniques. For CRE and C&I loans,equity securities can be put back to the fair value is based on each loan’s observable market price ortransfer agents at the publicly available NAV, the fair value of the collateral less cost to sell, if the loan is collateral dependent. The fair value of collateral is generally based on third party appraisals (or internal evaluation if third party appraisal is not required by regulations) which utilize one or more valuation techniques (income, market and/or cost approaches). All third party appraisals and evaluations are reviewed and validated by independent appraisers or the Company’s appraisal department staffed by licensed appraisers and/or experienced real estate reviewers. The third party appraisals are ordered through the appraisal department (except for one-to-four unit residential appraisals which are typically ordered through an approved appraisal management company or an approved residential appraiser) at the inception, renewal or, for all real estate related loans, upon the occurrence of any events causing a downgrade to an adverse grade (i.e., “substandard” or “doubtful”). Updated appraisals and evaluations are generally obtained within the last 12 months. The Company increases the frequency of obtaining updated appraisals for adversely graded credits when declining market conditions exist. All appraisals include an “as is” market value without conditions as of the effective date of the appraisal. For certain impaired loans, the Company utilizes the discounted cash flow approach and applies a discount derived from historical data. The significant unobservable inputs used in the fair value measurement of non-PCI impaired loans are discounts applied based on the liquidation cost of collateral and selling cost. On a quarterly basis, all nonperforming assets are reviewed to assess whether the current carrying value is supported by the collateral or cash flow and to ensure that the current carrying value is appropriate. Non-PCI impaired loans are classified as Level 3.
Loans Held-for-Investment, net — The fair value of loans held-for-investment other than non-PCI impaired loans is determined based on a discounted cash flow approach considered for an exit price value. The discount rate is derived from the associated yield curve plus spreads that reflect the rates in the market for loans with similar financial characteristics. No adjustments have been made for changes in credit within any of the loan portfolios. It is management’s opinion that the allowance for loan losses pertaining to performing and nonperforming loans results in a fair value adjustment of credit for such loans. Due to the unobservable nature of the inputs used in deriving the estimated fair value, these instruments are classified as Level 3.
Other Real Estate Owned — The Company’s OREO represents properties acquired through foreclosure, or through full or partial satisfaction of loans held-for-investment, which are recorded at estimated fair value less cost to sell at the time of foreclosure and at the lower of cost or estimated fair value less the cost to sell subsequent to acquisition. The fair values of OREO properties are based on third party appraisals or accepted written offers. Refer to the Non-PCI Impaired Loans section above for a detailed discussion on the Company’s policies and procedures related to appraisals and evaluations. On a monthly basis, the current fair market value of each OREO property is reviewed to ensure that the current carrying value is appropriate. The significant unobservable input used is the selling cost. OREO properties are classified as Level 3.
Restricted Equity Securities — Restricted equity securities are comprised of Federal Reserve Bank stock and FHLB stock. Ownership of these securities is restricted to member banks and these securities do not have a readily determinable fair value. Purchases and sales of these securities are at par value. The carrying amounts of the Company’s restricted equity securities approximate fair value. The valuation of these investments is classified as Level 2.
Accrued Interest Receivable — The carrying amount approximates1. When NAV is available periodically, but the equity securities may not be readily marketable at its periodic NAV in the secondary market, the fair value due to the short-term nature of these instruments. Considering the observable nature of the inputs used in deriving the estimated fair value, these instruments areequity securities is classified as Level 2.
Interest Rate Swaps and OptionsContracts— The Company enters intoInterest rate contracts consist of interest rate swapswaps and option contracts with institutional counterparties to hedge against interest rate swap and option products offered to bank customers. These products allow borrowers to lock in attractive intermediate and long-term interest rates by entering into an interest rate swap or option contract with the Company, resulting in the customer obtaining a synthetic fixed rate loan. The Company also enters into interest rate swap contracts with institutional counterparties to hedge against certificates of deposit issued. This product allows the Company to lock in attractive floating rate funding.options. The fair value of the interest rate swaps is determined using the market standard methodology of netting the discounted future fixed cash payments (or receipts) and the discounted expected variable cash receipts (or payments). The variable cash receipts (or payments) are based on the expectation of future interest rates (forward curves) derived from observed market interest rate curves. The fair value of the interest rate options, consistingwhich consist of floors and caps, is determined using the market standard methodology of discounting the future expected cash receipts that wouldwill occur if variable interest rates fellfall below (rise above) the strike rate of the floors (caps). The variable interest rates used in the calculation of projected receipts on the floor (cap) are based on an expectation of future interest rates derived from observable market interest rate curves and volatilities. In addition, to comply with the provisions of ASC 820,Fair Value Measurement, the Company incorporates credit valuation adjustments to appropriately reflect both its own nonperformance risk and the respective counterparty’s nonperformance risk in the fair value measurements of its derivatives. The credit valuation adjustments associated with the Company’s derivatives utilize model-derived credit spreads, which are Level 3 inputs. Considering the observable nature of all other significant inputs model-derived credit spreads. As of September 30, 2017, the Company has assessed the significance of the impact of the credit valuation adjustments on the overall valuation of these interest rate contracts and has determined that the credit valuation adjustments are not significant to the overall valuation of its derivative portfolios. As a result,utilized, the Company classifies these derivative instruments as Level 2 of the2.
Foreign Exchange Contracts— The fair value hierarchy due to the observable nature of the significant inputs utilized.
Foreign Exchange Contracts — The Company enters into short-term foreign exchange contracts to purchase/sell foreign currencies at set rates in the future. These contracts economically hedge against foreign exchange rate fluctuations. The Company also enters into contracts with institutional counterparties to hedge against foreign exchange products offered to bank customers. These products allow customers to hedge the foreign exchange risk of their deposits and loans denominated in foreign currencies. The Company assumes minimal foreign exchange rate risk because the contracts with the customer and the institutional party mirror each other. The fair value is determined at each reporting period based on changes in the foreign exchange rate.rates. These are over-the-counter contracts where quoted market prices are not readily available. Valuation is measured using conventional valuation methodologies with observable market data. Valuation depends on the type of derivative, and the nature of the underlying rate and contractual terms including period of maturity, price and index upon which the derivative’s value is based. Key inputs include foreign exchange rates (spot and/or forward rates), volatility of currencies and the correlation of such inputs. Due to the short-term nature of the majority of these contracts, the counterparties’ credit risks are considered nominal and resultedresult in no adjustments to the valuation of the foreign exchange contracts. Due to the observable nature of the inputs used in deriving the fair value of these contracts, the valuation of foreign exchange contracts is classified as Level 2. As of September 30, 2017, foreign exchange forward contracts used to economically hedgeIn addition, the Company’s net investment in East West Bank (China) Limited, a non-U.S. Dollar (“USD”) functional currency subsidiary in China, are included in this caption. See Foreign Currency Forward Contracts in the section below for details on valuation methodologies and significant assumptions.
Customer Deposits — The fair value of deposits with no stated maturity, such as noninterest-bearing demand deposits, interest-bearing checking, savings and money market deposits, approximates the carrying amount as these deposits are payable on demand at the measurement date. Due to the observable nature of the inputs used in deriving the estimated fair value, these instruments are classified as Level 2. For time deposits, the fair value is based on the discounted value of contractual cash flows using current market rates for instruments with similar maturities. Due to the observable nature of the inputs used in deriving the estimated fair value, time deposits are classified as Level 2.
Federal Home Loan Bank Advances — The fair value of FHLB advances is estimated based on the discounted value of contractual cash flows, using rates currently offered by the FHLB of San Francisco for advances with similar remaining maturities at each reporting date. Due to the observable nature of the inputs used in deriving the estimated fair value, these instruments are classified as Level 2.
Repurchase Agreements — The fair value of the repurchase agreements is calculated by discounting future cash flows based on expected maturities or repricing dates, utilizing estimated market discount rates and taking into consideration the call features of each instrument. Due to the observable nature of the inputs used in deriving the estimated fair value, these instruments are classified as Level 2.
Accrued Interest Payable — The carrying amount approximates fair value due to the short-term nature of these instruments. Due to the observable nature of the inputs used in deriving the estimated fair value, these instruments are classified as Level 2.
Long-Term Debt — The fair value of long-term debt is estimated by discounting the cash flows through maturity based on current market rates the Company would pay for new issuances. Due to the observable nature of the inputs used in deriving the estimated fair value, long-term debt is classified as Level 2.
Foreign Currency Forward Contracts — During the three months ended December 31, 2015, the Company began entering intomanaged its foreign currency forward contracts to hedge itsexposure in the net investment in its China subsidiary, East West Bank (China) Limited. Previously, theLimited, a non-U.S. dollar (“USD”) functional currency subsidiary, with foreign currency non-deliverable forward contracts. These foreign currency non-deliverable forward contracts were eligible for hedge accounting. During the nine months ended September 30, 2017, the foreign currency forward contracts were dedesignated when the hedge relationship ceased to be highly effective. The Company continues to economically hedge its foreign currency exposure resulting from East West Bank (China) Limited and the foreign currency forward contracts are includeddesignated as part of the “Foreign Exchange Contracts” caption as of September 30, 2017.net investment hedges. The fair value of foreign currency non-deliverable forward contracts is valueddetermined by comparing the contracted foreign exchange rate to the current market foreign exchange rate. InputsKey inputs of the current market exchange rate include the spot rates,and forward rates and the interest rate curves of the domestic and foreign currency. Interest ratecontractual currencies. Foreign exchange forward curves are used to determine which forward rate pertains to a specific maturity. Due to the observable nature of the inputs used in deriving the estimated fair value, these instruments are classified as Level 2.
Credit Risk Participation Agreements Contracts — The Company enters into RPAs, under which Credit contracts utilized by the Company assumes its pro-rata shareare comprised of credit risk participation agreements (“RPAs”) entered into by the credit exposure associatedCompany with the borrower’s performance related to interest rate derivative contracts.institutional counterparties. The fair value of the RPAs is calculated by determining the total expected asset or liability exposure of the derivatives to the borrowers and applying the borrowers’ credit spread to that exposure. Total expected exposure incorporates both the current and potential future exposure of the derivatives, derived from using observable inputs, such as yield curves and volatilities. The credit spreadsDue to the observable nature of the borrowersall other significant inputs used in deriving the calculation are estimated by the Company based on current market conditions, including consideration of current borrowing spreads for similar customers and transactions, review of existing collateralization or other credit enhancements, and changes in credit sector and entity-specific credit information. The Company has determined that the majority of the inputs used to value RPAs are observable. Accordingly, RPAs fall within Level 2 of the fair value, hierarchy.credit contracts are classified as Level 2.
Warrants Equity Contracts — The Company obtained Equity contracts consist of warrants to purchase common or preferred and common stock of technology and life sciences companies as part of the loan origination process. As of September 30, 2017, the warrants included on the Consolidated Financial Statements were from public and private companies.companies, and any liability-classified contingently issuable shares of the Company. The Company valued thesefair value of the warrants is based on the Black-Scholes option pricing model. For warrants from public companies, the model uses the underlying stock price, stated strike price, warrant expiration date, risk-free interest rate based on a duration-matched U.S. Treasury rate, and market-observable company-specific optionequity volatility as inputs to value the warrants. Due to the observable nature of the inputs used in deriving the estimated fair value, warrants from public companies are classified as Level 2. For warrants from private companies, the model uses inputs such as the offering price observed in the most recent round of funding, stated strike price, warrant expiration date, risk-free interest rate based on duration-matched U.S. Treasury rate and optionequity volatility. The option volatility assumption wasCompany applies proxy volatilities based on public market indices that include members that operate in similar industries as the companies in ourindustry sectors of the private company portfolio.companies. The model values were furtherare then adjusted for a general lack of liquidity due to the private nature of the underlying companies. Since both equity volatility and liquidity discount assumptions are subject to management’s judgment, measurement uncertainty is inherent in the valuation of private company warrants. Due to the unobservable nature of the optionequity volatility and liquidity discount assumptions used in deriving the estimated fair value, warrants from private companies are classified as Level 3. There is a direct correlation between changes in the volatility assumption and the fair value measurement of warrants from private companies, while there is an inverse correlation between changes in the liquidity discount assumption and the fair value measurement of warrants from private companies. On a quarterly basis, the changes in the fair value of warrants from private companies are reviewed for reasonableness, and a sensitivitymeasurement of uncertainty analysis on the optionequity volatility and liquidity discount assumptions is performed.
In connection with the Company’s acquisition of a 49.99% equity interest in Rayliant Global Advisors Limited (“Rayliant”) during the third quarter of 2023, the Company granted 349,138 shares of performance-based restricted stock units (“RSUs”) as part of its consideration, in addition to $95 million in cash. The vesting of these equity contracts on September 1, 2028, is contingent on Rayliant meeting certain financial performance targets during the performance period. The fair value estimates presented herein areof liability-classified equity contracts varies based on pertinentthe operating revenue and operating EBITDA of Rayliant to be achieved during the future performance period, and these performance-based RSUs are expected to vest into a variable number of the Company’s common stock, ranging from 20% to 200% of the target performance-based RSUs granted. Due to the unobservable nature of the input assumptions, these equity contracts are classified as Level 3. For additional information availableon the equity contracts, refer to managementNote 6— Derivatives to the Consolidated Financial Statements in this Form 10-Q.
Commodity Contracts — Commodity contracts consist of swaps and options referencing commodity products. The fair value of the commodity option contracts is determined using the Black-Scholes model and assumptions that include expectations of future commodity price and volatility. The future commodity contract price is derived from observable inputs such as the market price of the commodity. Commodity swaps are structured as an exchange of fixed cash flows for floating cash flows. The fair value of the commodity swaps is determined using the market standard methodology of netting the discounted future fixed cash payments (or receipts) and the discounted expected variable cash receipts (or payments) based on the market prices of the commodity. The fixed cash flows are predetermined based on the known volumes and fixed price as specified in the swap agreement. The floating cash flows are correlated with the change of forward commodity prices, which is derived from market corroborated futures settlement prices. As a result, the Company classifies these derivative instruments as Level 2 due to the observable nature of the significant inputs utilized.
The following tables present financial assets and liabilities that are measured at fair value on a recurring basis as of each reporting date. AlthoughMarch 31, 2024 and December 31, 2023:
| | | | | | | | | | | | | | | | | | | | | | | | | | |
|
| | Assets and Liabilities Measured at Fair Value on a Recurring Basis
as of March 31, 2024 |
| ($ in thousands) | | Level 1 | | Level 2 | | Level 3 | | Total
Fair Value |
| AFS debt securities: | | | | | | | | |
| U.S. Treasury securities | | $ | 621,094 | | | $ | — | | | $ | — | | | $ | 621,094 | |
| U.S. government agency and U.S. government-sponsored enterprise debt securities | | — | | | 360,802 | | | — | | | 360,802 | |
U.S. government agency and U.S. government-sponsored enterprise mortgage-backed securities (1): | | | | | | | | |
| Commercial mortgage-backed securities | | — | | | 455,619 | | | — | | | 455,619 | |
| Residential mortgage-backed securities | | — | | | 4,992,399 | | | — | | | 4,992,399 | |
| Municipal securities | | — | | | 258,495 | | | — | | | 258,495 | |
| Non-agency mortgage-backed securities: | | | | | | | | |
| Commercial mortgage-backed securities | | — | | | 333,996 | | | — | | | 333,996 | |
| Residential mortgage-backed securities | | — | | | 519,657 | | | — | | | 519,657 | |
| Corporate debt securities | | — | | | 502,647 | | | — | | | 502,647 | |
| Foreign government bonds | | — | | | 227,196 | | | — | | | 227,196 | |
| Asset-backed securities | | — | | | 40,712 | | | — | | | 40,712 | |
| Collateralized loan obligations (“CLOs”) | | — | | | 87,851 | | | — | | | 87,851 | |
| Total AFS debt securities | | $ | 621,094 | | | $ | 7,779,374 | | | $ | — | | | $ | 8,400,468 | |
| | | | | | | | |
| Affordable housing partnership, tax credit and CRA investments, net: | | | | | | | | |
| Equity securities | | $ | 20,402 | | | $ | 4,137 | | | $ | — | | | $ | 24,539 | |
| Total affordable housing partnership, tax credit and CRA investments, net | | $ | 20,402 | | | $ | 4,137 | | | $ | — | | | $ | 24,539 | |
| | | | | | | | |
| Derivative assets: | | | | | | | | |
| Interest rate contracts | | $ | — | | | $ | 484,794 | | | $ | — | | | $ | 484,794 | |
| Foreign exchange contracts | | — | | | 60,499 | | | — | | | 60,499 | |
| | | | | | | | |
| Equity contracts | | — | | | — | | | 330 | | | 330 | |
| Commodity contracts | | — | | | 76,615 | | | — | | | 76,615 | |
| Gross derivative assets | | $ | — | | | $ | 621,908 | | | $ | 330 | | | $ | 622,238 | |
Netting adjustments (2) | | $ | — | | | $ | (489,262) | | | $ | — | | | $ | (489,262) | |
| Net derivative assets | | $ | — | | | $ | 132,646 | | | $ | 330 | | | $ | 132,976 | |
| | | | | | | | |
| Derivative liabilities: | | | | | | | | |
| Interest rate contracts | | $ | — | | | $ | 518,330 | | | $ | — | | | $ | 518,330 | |
| Foreign exchange contracts | | — | | | 53,153 | | | — | | | 53,153 | |
Equity contracts (3) | | — | | | — | | | 15,119 | | | 15,119 | |
| Credit contracts | | — | | | 16 | | | — | | | 16 | |
| Commodity contracts | | — | | | 106,930 | | | — | | | 106,930 | |
| Gross derivative liabilities | | $ | — | | | $ | 678,429 | | | $ | 15,119 | | | $ | 693,548 | |
Netting adjustments (2) | | $ | — | | | $ | (134,963) | | | $ | — | | | $ | (134,963) | |
| Net derivative liabilities | | $ | — | | | $ | 543,466 | | | $ | 15,119 | | | $ | 558,585 | |
|
| | | | | | | | | | | | | | | | | | | | | | | | | | |
|
| | Assets and Liabilities Measured at Fair Value on a Recurring Basis
as of December 31, 2023 |
| ($ in thousands) | | Level 1 | | Level 2 | | Level 3 | | Total
Fair Value |
| AFS debt securities: | | | | | | | | |
| U.S. Treasury securities | | $ | 1,060,375 | | | $ | — | | | $ | — | | | $ | 1,060,375 | |
| U.S. government agency and U.S. government-sponsored enterprise debt securities | | — | | | 364,446 | | | — | | | 364,446 | |
U.S. government agency and U.S. government-sponsored enterprise mortgage-backed securities (1): | | | | | | | | |
| Commercial mortgage-backed securities | | — | | | 468,259 | | | — | | | 468,259 | |
| Residential mortgage-backed securities | | — | | | 1,727,594 | | | — | | | 1,727,594 | |
| Municipal securities | | — | | | 261,016 | | | — | | | 261,016 | |
| Non-agency mortgage-backed securities: | | | | | | | | |
| Commercial mortgage-backed securities | | — | | | 367,516 | | | — | | | 367,516 | |
| Residential mortgage-backed securities | | — | | | 553,671 | | | — | | | 553,671 | |
| Corporate debt securities | | — | | | 502,425 | | | — | | | 502,425 | |
| Foreign government bonds | | — | | | 227,874 | | | — | | | 227,874 | |
| Asset-backed securities | | — | | | 42,300 | | | — | | | 42,300 | |
| CLOs | | — | | | 612,861 | | | — | | | 612,861 | |
| Total AFS debt securities | | $ | 1,060,375 | | | $ | 5,127,962 | | | $ | — | | | $ | 6,188,337 | |
| | | | | | | | |
| Affordable housing partnership, tax credit and CRA investments, net: | | | | | | | | |
| Equity securities | | $ | 20,509 | | | $ | 4,150 | | | $ | — | | | $ | 24,659 | |
| Affordable housing partnership, tax credit and CRA investments, net | | $ | 20,509 | | | $ | 4,150 | | | $ | — | | | $ | 24,659 | |
| | | | | | | | |
| Derivative assets: | | | | | | | | |
| Interest rate contracts | | $ | — | | | $ | 473,907 | | | $ | — | | | $ | 473,907 | |
| Foreign exchange contracts | | — | | | 57,072 | | | — | | | 57,072 | |
| Credit contracts | | — | | | 1 | | | — | | | 1 | |
| Equity contracts | | — | | | — | | | 336 | | | 336 | |
| Commodity contracts | | — | | | 79,604 | | | — | | | 79,604 | |
| Gross derivative assets | | $ | — | | | $ | 610,584 | | | $ | 336 | | | $ | 610,920 | |
Netting adjustments (2) | | $ | — | | | $ | (312,792) | | | $ | — | | | $ | (312,792) | |
| Net derivative assets | | $ | — | | | $ | 297,792 | | | $ | 336 | | | $ | 298,128 | |
| | | | | | | | |
| Derivative liabilities: | | | | | | | | |
| Interest rate contracts | | $ | — | | | $ | 433,936 | | | $ | — | | | $ | 433,936 | |
| Foreign exchange contracts | | — | | | 42,564 | | | — | | | 42,564 | |
Equity contracts (3) | | — | | | — | | | 15,119 | | | 15,119 | |
| Credit contracts | | — | | | 25 | | | — | | | 25 | |
| Commodity contracts | | — | | | 121,670 | | | — | | | 121,670 | |
| Gross derivative liabilities | | $ | — | | | $ | 598,195 | | | $ | 15,119 | | | $ | 613,314 | |
Netting adjustments (2) | | $ | — | | | $ | (76,170) | | | $ | — | | | $ | (76,170) | |
| Net derivative liabilities | | $ | — | | | $ | 522,025 | | | $ | 15,119 | | | $ | 537,144 | |
|
(1)Includes Government National Mortgage Association (“GNMA”) AFS debt securities totaling $4.4 billion and $1.2 billion of fair value as of March 31, 2024 and December 31, 2023, respectively.
(2)Represents the balance sheet netting of derivative assets and liabilities and related cash collateral under master netting agreements or similar agreements. See Note 6 — Derivatives to the Consolidated Financial Statements in this Form 10-Q for additional information.
(3)Equity contracts classified as derivative liabilities consist of performance-based RSUs granted as part of EWBC’s consideration in its investment in Rayliant.
For the three months ended March 31, 2024 and 2023, Level 3 fair value measurements that were measured on a recurring basis consisted of warrant equity contracts issued by private companies and liability-classified contingently issuable shares of the Company. The following table provides a reconciliation of the beginning and ending balances of these equity contracts for the three months ended March 31, 2024 and 2023:
| | | | | | | | | | | | | | | | | | | | | | |
|
| | Three Months Ended March 31, | | | | |
| ($ in thousands) | | 2024 | | 2023 | | | | | | | | |
| Derivative assets: | | | | | | | | | | | | |
| Equity contracts | | | | | | | | | | | | |
| Beginning balance | | $ | 336 | | | $ | 323 | | | | | | | | | |
| | | | | | | | | | | | |
Total losses included in earnings (1) | | (6) | | | (46) | | | | | | | | | |
| | | | | | | | | | | | |
| | | | | | | | | | | | |
| | | | | | | | | | | | |
| | | | | | | | | | | | |
| | | | | | | | | | | | |
| | | | | | | | | | | | |
| | | | | | | | | | | | |
| | | | | | | | | | | | |
| | | | | | | | | | | | |
| Ending balance | | $ | 330 | | | $ | 277 | | | | | | | | | |
| Derivative liabilities: | | | | | | | | | | | | |
Equity contracts (2) | | | | | | | | | | | | |
| Beginning balance | | $ | 15,119 | | | $ | — | | | | | | | | | |
| Total gains (losses) included in earnings | | — | | | — | | | | | | | | | |
| | | | | | | | | | | | |
| Ending balance | | $ | 15,119 | | | $ | — | | | | | | | | | |
|
| | | | | | | | | | | | |
| | | | | | | | | | | | |
| | | | | | | | | | | | |
| | | | | | | | | | | | |
| | | | | | | | | | | | |
| | | | | | | | | | | | |
| | | | | | | | | | | | |
| | | | | | | | | | | | |
(1)Includes unrealized losses recorded in Lending fees on the Consolidated Statement of Income.
(2)Equity contracts classified as derivative liabilities consist of performance-based RSUs granted as part of EWBC’s consideration in its investment in Rayliant.
The following table presents quantitative information about the significant unobservable inputs used in the valuation of Level 3 fair value measurements as of March 31, 2024 and December 31, 2023. The significant unobservable inputs presented in the table below are those that the Company considers significant to the fair value of the Level 3 assets. The Company considers unobservable inputs to be significant if, by their exclusion, the fair value of the Level 3 assets would be impacted by a predetermined percentage change.
| | | | | | | | | | | | | | | | | | | | | | | | | | | | | | | | | | | |
| |
| ($ in thousands) | | Fair Value Measurements (Level 3) | | Valuation Technique | | Unobservable Inputs | | Range of Inputs | | Weighted-Average of Inputs | |
| March 31, 2024 | | | | | | | | | | | |
| Derivative assets: | | | | | | | | | | | |
| Equity contracts | | $ | 330 | | | Black-Scholes option pricing model | | Equity volatility | | 39% — 50% | | 46 | % | (1) |
| | | | | | Liquidity discount | | 47% | | 47 | % | |
| Derivative liabilities: | | | | | | | | | | | |
Equity contracts (2) | | $ | 15,119 | | | Internal model | | Payout % designated based on operating revenue and operating EBITDA of investee | | 84% | | 84 | % | |
| December 31, 2023 | | | | | | | | | | | |
| Derivative assets: | | | | | | | | | | | |
| Equity contracts | | $ | 336 | | | Black-Scholes option pricing model | | Equity volatility | | 37% — 48% | | 45 | % | (1) |
| | | | | | Liquidity discount | | 47% | | 47 | % | |
| Derivative liabilities: | | | | | | | | | | | |
Equity contracts (2) | | $ | 15,119 | | | Internal model | | Payout % designated based on operating revenue and operating EBITDA of investee | | 84% | | 84 | % | |
| |
(1)Weighted-average of inputs is calculated based on the fair value of equity contracts as of both March 31, 2024 and December 31, 2023.
(2)Equity contracts classified as derivative liabilities consist of performance-based RSUs granted as part of EWBC’s consideration in its investment in Rayliant.
Assets and Liabilities Measured at Fair Value on a Nonrecurring Basis
Assets measured at fair value on a nonrecurring basis include certain individually evaluated loans held-for-investment, affordable housing partnership, tax credit and CRA investments, OREO, loans held-for-sale, and other nonperforming assets. Nonrecurring fair value adjustments result from the impairment on certain individually evaluated loans held-for-investment and affordable housing partnership, tax credit and CRA investments, from the write-downs of OREO and other nonperforming assets, or from the application of lower of cost or fair value on loans held-for-sale.
Individually Evaluated Loans Held-for-Investment — Individually evaluated loans held-for-investment are classified as Level 3 assets. The following two methods are used to derive the fair value of individually evaluated loans held-for-investment:
•Discounted cash flow valuation techniques consist of developing an expected stream of cash flows over the life of the loans, and then calculating the present value of the loans by discounting the expected cash flows at a designated discount rate.
•When the repayment of an individually evaluated loan is dependent on the sale of the collateral, the fair value of the loan is determined based on the fair value of the underlying collateral, which may take the form of real estate, inventory, equipment, contracts or guarantees. The fair value of the underlying collateral is generally based on third-party appraisals, or an internal valuation if a third-party appraisal is not awarerequired by regulations, or is unavailable. An internal valuation utilizes one or more valuation techniques such as the income, market and/or cost approaches.
Affordable Housing Partnership, Tax Credit and CRA Investments, Net — The Company conducts due diligence on its affordable housing partnership, tax credit and CRA investments prior to the initial investment date and through the placed-in-service date. After these investments are either acquired or placed into service, the Company continues its periodic monitoring process to ensure book values are realizable and that there is no significant tax credit recapture risk. This monitoring process includes reviewing the investment entity’s quarterly financial statements and annual tax returns, the annual financial statements of anythe guarantor (if any) and a comparison of the actual performance of the investment against the financial projections prepared at the time the investment was made. The Company assesses its tax credit and other investments for possible other-than-temporary impairment on an annual basis or when events or circumstances suggest that the carrying amount of the investments may not be realizable. These circumstances can include, but are not limited to the following factors:
•expected future cash flows that are less than the carrying amount of the investment;
•changes in the economic, market or technological environment that could adversely affect the investee’s operations;
•the potential for tax credit recapture; and
•other factors that raise doubt about the investee’s ability to continue as a going concern, such as negative cash flows from operations and the continuing prospects of the underlying operations of the investment.
All available information is considered in assessing whether a decline in value is other-than-temporary. Generally, none of the aforementioned factors are individually conclusive and the relative importance placed on individual facts may vary depending on the situation. In accordance with ASC 323-10-35-32, Investments — Equity Method and Joint Ventures, an impairment charge would significantly affect theonly be recognized in earnings for a decline in value that is determined to be other-than-temporary.
Other Real Estate Owned — The Company’s OREO represents properties acquired through foreclosure, or through full or partial satisfaction of loans held-for-investment such as an acceptance of a deed-in-lieu of foreclosure. These OREO properties are recorded at estimated fair value amounts, such amounts have not been comprehensively revaluedless the costs to sell at the time of foreclosure or at the lower of cost or estimated fair value less the costs to sell subsequent to acquisition. On a monthly basis, the current fair market value of each OREO property is reviewed to ensure that the current carrying value is appropriate. OREO properties are classified as Level 3.
Loans Held-for-Sale— Loans held-for-investment subsequently transferred to held-for-sale are recorded at the lower of cost or fair value upon transfer. Loans held-for-sale may be measured at fair value on a nonrecurring basis when fair value is less than cost. Fair value is generally determined based on available market data for purposes of these Consolidated Financial Statements since that date,similar loans and therefore, current estimates ofloans held-for-sale are classified as Level 2.
Other Nonperforming Assets—Other nonperforming assets are recorded at fair value may differ significantlyupon transfer from loans to foreclosed assets. Subsequently, foreclosed assets are recorded at the lower of carrying value or fair value. Fair value is based on independent market prices, appraised values of the collateral or management’s estimated recovery of the foreclosed asset. The Company records an impairment when the foreclosed asset’s fair value declines below its carrying value. The fair value measurement of other nonperforming assets is classified within one of the three levels in a valuation hierarchy based upon the observability of inputs to the valuation as of the measurement date.
The following tables present the carrying amounts of assets that were still held and had fair value adjustments measured on a nonrecurring basis as of March 31, 2024 and December 31, 2023:
| | | | | | | | | | | | | | | | | | | | | | | | | | |
|
| | Assets Measured at Fair Value on a Nonrecurring Basis
as of March 31, 2024 |
| ($ in thousands) | | Level 1 | | Level 2 | | Level 3 | | Fair Value Measurements |
| Loans held-for-investment: | | | | | | | | |
| Commercial: | | | | | | | | |
| Commercial and industrial (“C&I”) | | $ | — | | | $ | — | | | $ | 25,914 | | | $ | 25,914 | |
| Commercial real estate (“CRE”): | | | | | | | | |
| CRE | | — | | | — | | | 10,028 | | | 10,028 | |
| | | | | | | | |
| Construction and land | | — | | | — | | | 12,236 | | | 12,236 | |
| | | | | | | | |
| Total commercial | | — | | | — | | | 48,178 | | | 48,178 | |
| Consumer: | | | | | | | | |
| Residential mortgage: | | | | | | | | |
| Single-family residential | | — | | | — | | | 116 | | | 116 | |
| | | | | | | | |
| | | | | | | | |
| | | | | | | | |
| Total consumer | | — | | | — | | | 116 | | | 116 | |
| Total loans held-for-investment | | $ | — | | | $ | — | | | $ | 48,294 | | | $ | 48,294 | |
| | | | | | | | |
| | | | | | | | |
| | | | | | | | |
| | | | | | | | |
| | | | | | | | | | | | | | | | | | | | | | | | | | |
|
| | Assets Measured at Fair Value on a Nonrecurring Basis
as of December 31, 2023 |
| ($ in thousands) | | Level 1 | | Level 2 | | Level 3 | | Fair Value Measurements |
| Loans held-for-investment: | | | | | | | | |
| Commercial: | | | | | | | | |
| C&I | | $ | — | | | $ | — | | | $ | 22,035 | | | $ | 22,035 | |
| CRE: | | | | | | | | |
| CRE | | — | | | — | | | 22,653 | | | 22,653 | |
| | | | | | | | |
| | | | | | | | |
| | | | | | | | |
| Total commercial | | — | | | — | | | 44,688 | | | 44,688 | |
| Consumer: | | | | | | | | |
| Residential mortgage: | | | | | | | | |
| | | | | | | | |
| Home equity lines of credit (“HELOCs”) | | — | | | — | | | 1,204 | | | 1,204 | |
| | | | | | | | |
| | | | | | | | |
| Total consumer | | — | | | — | | | 1,204 | | | 1,204 | |
| Total loans held-for-investment | | $ | — | | | $ | — | | | $ | 45,892 | | | $ | 45,892 | |
| Affordable housing partnership, tax credit and CRA investments, net | | $ | — | | | $ | — | | | $ | 868 | | | $ | 868 | |
| | | | | | | | |
| | | | | | | | |
The following table presents the (decrease) increase in the fair value of certain assets held at the end of the respective reporting periods, for which a nonrecurring fair value adjustment was recognized for the three months ended March 31, 2024 and 2023:
| | | | | | | | | | | | | | | | | | | | | | |
|
| | Three Months Ended March 31, | | | | |
| ($ in thousands) | | 2024 | | 2023 | | | | | | | | |
| Loans held-for-investment: | | | | | | | | | | | | |
| Commercial: | | | | | | | | | | | | |
| C&I | | $ | (12,843) | | | $ | (1,255) | | | | | | | | | |
| CRE: | | | | | | | | | | | | |
| CRE | | (2,006) | | | — | | | | | | | | | |
| | | | | | | | | | | | |
| Construction and land | | (1,224) | | | — | | | | | | | | | |
| | | | | | | | | | | | |
| Total commercial | | (16,073) | | | (1,255) | | | | | | | | | |
| Consumer: | | | | | | | | | | | | |
| Residential mortgage: | | | | | | | | | | | | |
| Single-family residential | | (1,384) | | | — | | | | | | | | | |
| | | | | | | | | | | | |
| | | | | | | | | | | | |
| | | | | | | | | | | | |
| Total consumer | | (1,384) | | | — | | | | | | | | | |
| Total loans held-for-investment | | $ | (17,457) | | | $ | (1,255) | | | | | | | | | |
| | | | | | | | | | | | |
| Affordable housing partnership, tax credit and CRA investments, net | | $ | — | | | $ | 174 | | | | | | | | | |
| | | | | | | | | | | | |
| | | | | | | | | | | | |
| | | | | | | | | | | | |
| | | | | | | | | | | | |
The following table presents the quantitative information about the significant unobservable inputs used in the valuation of Level 3 fair value measurements that are measured on a nonrecurring basis as of March 31, 2024 and December 31, 2023:
| | | | | | | | | | | | | | | | | | | | | | | | | | | | | | | | | | | |
| |
| ($ in thousands) | | Fair Value Measurements (Level 3) | | Valuation Techniques | | Unobservable Inputs | | Range of Inputs | | Weighted-Average of Inputs | |
| March 31, 2024 | | | | | | | | | | | |
| | | | | | | | | | | |
| Loans held-for-investment | | $ | 6,917 | | | Fair value of collateral | | Discount | | 20% | | 20% | |
| | $ | 8,471 | | | Fair value of collateral | | Contract value | | NM | | NM | |
| | $ | 32,906 | | | Fair value of property | | Selling cost | | 8% | | 8% | |
| | | | | | | | | | | |
| | | | | | | | | | | |
| | | | | | | | | | | |
| | | | | | | | | | | |
| December 31, 2023 | | | | | | | | | | | |
| | | | | | | | | | | |
| | | | | | | | | | | |
| Loans held-for-investment | | $ | 16,328 | | | Fair value of collateral | | Discount | | 15% — 75% | | 45% | (1) |
| | $ | 3,009 | | | Fair value of collateral | | Contract value | | NM | | NM | |
| | $ | 26,555 | | | Fair value of property | | Selling cost | | 8% | | 8% | |
| Affordable housing partnership, tax credit and CRA investments, net | | $ | 868 | | | Individual analysis of each investment | | Expected future tax benefits and distributions | | NM | | NM | |
| | | | | | | | | | | |
| | | | | | | | | | | |
| |
NM — Not meaningful.
(1)Weighted-average of inputs is based on the relative fair value of the respective assets as of December 31, 2023.
Disclosures about the Fair Value of Financial Instruments
The following tables present the fair value estimates for financial instruments as of March 31, 2024 and December 31, 2023, excluding financial instruments recorded at fair value on a recurring basis as they are included in the tables presented herein.elsewhere in this Note. The carrying amounts in the following tables are recorded on the Consolidated Balance Sheet under the indicated captions, except for accrued interest receivable, restricted equity securities, at cost, and mortgage servicing rights that are included in Other assets, and accrued interest payable which is included in Accrued expenses and other liabilities. These financial instruments are measured on an amortized cost basis on the Company’s Consolidated Balance Sheet.
| | | | | | | | | | | | | | | | | | | | | | | | | | | | | | | | |
|
| | March 31, 2024 |
| ($ in thousands) | | Carrying Amount | | Level 1 | | Level 2 | | Level 3 | | Estimated Fair Value |
| Financial assets: | | | | | | | | | | |
| Cash and cash equivalents | | $ | 4,210,801 | | | $ | 4,210,801 | | | $ | — | | | $ | — | | | $ | 4,210,801 | |
| Interest-bearing deposits with banks | | $ | 24,593 | | | $ | — | | | $ | 24,593 | | | $ | — | | | $ | 24,593 | |
| Resale agreements | | $ | 485,000 | | | $ | — | | | $ | 391,403 | | | $ | — | | | $ | 391,403 | |
| HTM debt securities | | $ | 2,948,642 | | | $ | 485,400 | | | $ | 1,929,078 | | | $ | — | | | $ | 2,414,478 | |
| Restricted equity securities, at cost | | $ | 164,402 | | | $ | — | | | $ | 164,402 | | | $ | — | | | $ | 164,402 | |
| Loans held-for-sale | | $ | 13,280 | | | $ | — | | | $ | 13,280 | | | $ | — | | | $ | 13,280 | |
| Loans held-for-investment, net | | $ | 51,322,224 | | | $ | — | | | $ | — | | | $ | 49,849,727 | | | $ | 49,849,727 | |
| Mortgage servicing rights | | $ | 6,234 | | | $ | — | | | $ | — | | | $ | 10,787 | | | $ | 10,787 | |
| Accrued interest receivable | | $ | 336,428 | | | $ | — | | | $ | 336,428 | | | $ | — | | | $ | 336,428 | |
| Financial liabilities: | | | | | | | | | | |
| Demand, checking, savings and money market deposits | | $ | 37,789,344 | | | $ | — | | | $ | 37,789,344 | | | $ | — | | | $ | 37,789,344 | |
| Time deposits | | $ | 20,771,280 | | | $ | — | | | $ | 20,715,628 | | | $ | — | | | $ | 20,715,628 | |
| Short-term borrowings | | $ | 19,173 | | | $ | — | | | $ | 19,173 | | | $ | — | | | $ | 19,173 | |
| | | | | | | | | | |
| FHLB advances | | $ | 3,500,000 | | | $ | — | | | $ | 3,500,000 | | | $ | — | | | $ | 3,500,000 | |
| | | | | | | | | | |
| Long-term debt | | $ | 31,768 | | | $ | — | | | $ | 30,201 | | | $ | — | | | $ | 30,201 | |
| Accrued interest payable | | $ | 63,470 | | | $ | — | | | $ | 63,470 | | | $ | — | | | $ | 63,470 | |
|
| | | | | | | | | | | | | | | | | | | | | | | | | | | | | | | | |
|
| | December 31, 2023 |
| ($ in thousands) | | Carrying Amount | | Level 1 | | Level 2 | | Level 3 | | Estimated Fair Value |
| Financial assets: | | | | | | | | | | |
| Cash and cash equivalents | | $ | 4,614,984 | | | $ | 4,614,984 | | | $ | — | | | $ | — | | | $ | 4,614,984 | |
| Interest-bearing deposits with banks | | $ | 10,498 | | | $ | — | | | $ | 10,498 | | | $ | — | | | $ | 10,498 | |
| Resale agreements | | $ | 785,000 | | | $ | — | | | $ | 699,056 | | | $ | — | | | $ | 699,056 | |
| HTM debt securities | | $ | 2,956,040 | | | $ | 488,551 | | | $ | 1,965,420 | | | $ | — | | | $ | 2,453,971 | |
| Restricted equity securities, at cost | | $ | 79,811 | | | $ | — | | | $ | 79,811 | | | $ | — | | | $ | 79,811 | |
| Loans held-for-sale | | $ | 116 | | | $ | — | | | $ | 116 | | | $ | — | | | $ | 116 | |
| Loans held-for-investment, net | | $ | 51,542,039 | | | $ | — | | | $ | — | | | $ | 50,256,565 | | | $ | 50,256,565 | |
| | | | | | | | | | |
| Mortgage servicing rights | | $ | 6,602 | | | $ | — | | | $ | — | | | $ | 9,470 | | | $ | 9,470 | |
| Accrued interest receivable | | $ | 331,490 | | | $ | — | | | $ | 331,490 | | | $ | — | | | $ | 331,490 | |
| Financial liabilities: | | | | | | | | | | |
| | | | | | | | | | |
| Demand, checking, savings and money market deposits | | $ | 38,048,974 | | | $ | — | | | $ | 38,048,974 | | | $ | — | | | $ | 38,048,974 | |
| Time deposits | | $ | 18,043,464 | | | $ | — | | | $ | 18,004,951 | | | $ | — | | | $ | 18,004,951 | |
| | | | | | | | | | |
| | | | | | | | | | |
| BTFP borrowings | | $ | 4,500,000 | | | $ | — | | | $ | 4,500,000 | | | $ | — | | | $ | 4,500,000 | |
| Long-term debt | | $ | 148,249 | | | $ | — | | | $ | 150,896 | | | $ | — | | | $ | 150,896 | |
| Accrued interest payable | | $ | 205,430 | | | $ | — | | | $ | 205,430 | | | $ | — | | | $ | 205,430 | |
|
Note 54 —Securities Purchased under Resale Agreements
The Company’s resale agreements expose it to credit risk from both the counterparties and the underlying collateral. The Company manages credit exposure from certain transactions by entering into master netting agreements and collateral arrangements with the counterparties. The relevant agreements allow for an efficient closeout of the transaction, liquidation and set-off of collateral against the net amount owed by the counterparty following a default. It is the Company’s policy to take possession, where possible, of the assets underlying resale agreements. As a result of the Company’s credit risk mitigation practices with respect to resale agreements as described above, the Company did not hold any reserves for credit impairment with respect to these agreements as of both March 31, 2024 and December 31, 2023.
Securities Purchased under Resale Agreements and Sold— Total securities purchased under Repurchase Agreements
Resale Agreements
Resale agreements are recorded at the balances at which the securities were acquired. The market values of the underlying securities collateralizing the related receivable of the resale agreements, including accrued interest, are monitored. Additional collateral may be requested by the Company from the counterparty when deemed appropriate. Gross resale agreements were $1.65 billion$485 million and $2.10 billion$785 million as of September 30, 2017March 31, 2024 and December 31, 2016,2023, respectively. The weighted average interest ratesweighted-average yields were 2.30%3.39% and 1.84% as of September 30, 2017 and December 31, 2016, respectively.
Repurchase Agreements
Long-term repurchase agreements are accounted for as collateralized financing transactions and recorded at the balances at which the securities were sold. The collateral2.50% for the repurchase agreements is primarily comprised of U.S. Treasury securities, U.S. government agencythree months ended March 31, 2024 and U.S. government sponsored enterprise mortgage-backed securities, and U.S. government agency and U.S. government sponsored enterprise debt securities. The Company may have to provide additional collateral for the repurchase agreements, as necessary. Gross repurchase agreements were $450.0 million as of each of September 30, 2017 and December 31, 2016. The weighted average interest rates were 3.56% and 3.15% as of September 30, 2017 and December 31, 2016,2023, respectively.
Balance Sheet Offsetting
The Company’s resale and repurchase agreements are transacted under legally enforceable master repurchasenetting agreements that, provide the Company, in the event of default by the counterparty, provide the Company the right to liquidate securities held and to offset receivables and payables with the same counterparty. The Company nets resale and repurchase transactions with the same counterparty on the Consolidated Balance SheetsSheet when it has a legally enforceable master netting agreement and the transactions are eligible for netting under ASC 210-20-45.210-20-45-11, Balance Sheet Offsetting Repurchase and Reverse Repurchase Agreements. Collateral acceptedreceived includes securities and loans that are not recognized on the Consolidated Balance Sheets.Sheet. Collateral pledged consists of securities that are not netted on the Consolidated Balance SheetsSheet against the related collateralized liability. Collateral acceptedSecurities received or pledged as collateral in resale and repurchase agreements with other financial institutions may also be sold or re-pledged by the secured party, but isand are usually delivered to and held by the third partythird-party trustees. The collateral amounts received/posted are limited for presentation purposes to the related recognized asset/liability balance for each counterparty, and accordingly, do not include excess collateral received/pledged.
The following tables presenttable presents the resale and repurchase agreements included on the Consolidated Balance SheetsSheet as of September 30, 2017March 31, 2024 and December 31, 2016:2023:
| | | | | | | | | | | | | | | | | | | | | | | | | | | | | | | | |
|
| | |
| | | | | | | | | | |
| | | | | | | | | | |
| | Gross Amounts of Recognized Assets | | Gross Amounts Offset on the Consolidated Balance Sheet | | Net Amounts of Assets Presented on the Consolidated Balance Sheet | | Gross Amounts Not Offset on the Consolidated Balance Sheet | | |
| ($ in thousands) | | | | | Collateral Received (1) | | Net Amount |
| Resale agreements as of March 31, 2024 | | $ | 485,000 | | | $ | — | | | $ | 485,000 | | | $ | (404,004) | | | $ | 80,996 | |
| | | | | | | | | | |
| Resale agreements as of December 31, 2023 | | $ | 785,000 | | | $ | — | | | $ | 785,000 | | | $ | (715,358) | | | $ | 69,642 | |
| | | | | | | | | | |
| | | | | |
| | | | | | |
| | | | | | | | | | |
|
|
| | | | | | | | | | | | | | | | | | | | | | | | |
| |
| ($ in thousands) | | As of September 30, 2017 |
| | | Gross Amounts
of Recognized
Assets | | Gross Amounts
Offset on the
Consolidated
Balance Sheets | | Net Amounts of
Assets Presented
on the
Consolidated
Balance Sheets | | Gross Amounts Not Offset on the
Consolidated Balance Sheets | | |
| Assets | | | | | Financial
Instruments | | Collateral
Pledged | | Net Amount |
| Resale agreements | | $ | 1,650,000 |
| | $ | (400,000 | ) | | $ | 1,250,000 |
| | $ | — |
| | $ | (1,240,568 | ) | (2) | $ | 9,432 |
|
| | | | | | | | | | | | | |
| | | Gross Amounts
of Recognized
Liabilities | | Gross Amounts
Offset on the
Consolidated
Balance Sheets | | Net Amounts of
Liabilities
Presented on the
Consolidated
Balance Sheets | | Gross Amounts Not Offset on the
Consolidated Balance Sheets | | |
| Liabilities | | | | | Financial
Instruments | | Collateral
Posted | | Net Amount |
| Repurchase agreements | | $ | 450,000 |
| | $ | (400,000 | ) | | $ | 50,000 |
| | $ | — |
| | $ | (50,000 | ) | (3) | $ | — |
|
| |
|
| | | | | | | | | | | | | | | | | | | | | | | | |
| |
| ($ in thousands) | | As of December 31, 2016 |
| | | Gross Amounts
of Recognized
Assets | | Gross Amounts
Offset on the
Consolidated
Balance Sheets | | Net Amounts of
Assets Presented
on the
Consolidated
Balance Sheets | | Gross Amounts Not Offset on the
Consolidated Balance Sheets | | |
| Assets | | | | | Financial
Instruments | | Collateral
Pledged | | Net Amount |
| Resale agreements | | $ | 2,100,000 |
| | $ | (100,000 | ) | | $ | 2,000,000 |
| | $ | (150,000 | ) | (1) | $ | (1,839,120 | ) | (2) | $ | 10,880 |
|
| | | | | | | | | | | | | |
| | | Gross Amounts
of Recognized
Liabilities | | Gross Amounts
Offset on the
Consolidated
Balance Sheets | | Net Amounts of
Liabilities
Presented
on the
Consolidated
Balance Sheets | | Gross Amounts Not Offset on the
Consolidated Balance Sheets | | |
| Liabilities | | | | | Financial
Instruments | | Collateral
Posted | | Net Amount |
| Repurchase agreements | | $ | 450,000 |
| | $ | (100,000 | ) | | $ | 350,000 |
| | $ | (150,000 | ) | (1) | $ | (200,000 | ) | (3) | $ | — |
|
| |
| |
(1) | Represents financial instruments subject to enforceable master netting arrangements that are not eligible to be offset under ASC 210-20-45 but would be eligible for offsetting to the extent that an event of default has occurred. |
| |
(2) | Represents the fair value of securities the Company has received under resale agreements, limited for table presentation purposes to the amount of the recognized asset due from each counterparty. |
| |
(3) | Represents the fair value of securities the Company has pledged under repurchase agreements, limited for table presentation purposes to the amount of the recognized liability owed to each counterparty. |
In addition to the amounts included in the tablestable above, the Company also has balance sheet netting related to derivatives, referderivatives. Refer to Note 7 6 — Derivatives to the Consolidated Financial Statements in this Form 10-Q for additional information.
Note 65 — Securities
The following tables present the amortized cost, gross unrealized gains and losses and fair value by major categories of available-for-sale investmentAFS and HTM debt securities which are carried at fair value, and the held-to-maturity investment security, which is carried at amortized cost, as of September 30, 2017March 31, 2024 and December 31, 2016:2023:
| | | | | | | | | | | | | | | | | | | | | | | | | | | | |
|
| | March 31, 2024 |
| ($ in thousands) | | Amortized Cost (1) | | | | Gross Unrealized Gains | | Gross Unrealized Losses | | Fair Value |
| AFS debt securities: | | | | | | | | | | |
| U.S. Treasury securities | | $ | 676,290 | | | | | $ | — | | | $ | (55,196) | | | $ | 621,094 | |
| U.S. government agency and U.S. government-sponsored enterprise debt securities | | 410,676 | | | | | — | | | (49,874) | | | 360,802 | |
U.S. government agency and U.S. government-sponsored enterprise mortgage-backed securities (2): | | | | | | | | | | |
| Commercial mortgage-backed securities | | 513,159 | | | | | 129 | | | (57,669) | | | 455,619 | |
| Residential mortgage-backed securities | | 5,229,549 | | | | | 4,212 | | | (241,362) | | | 4,992,399 | |
| Municipal securities | | 296,360 | | | | | 47 | | | (37,912) | | | 258,495 | |
| Non-agency mortgage-backed securities: | | | | | | | | | | |
| Commercial mortgage-backed securities | | 373,834 | | | | | — | | | (39,838) | | | 333,996 | |
| Residential mortgage-backed securities | | 609,705 | | | | | — | | | (90,048) | | | 519,657 | |
| Corporate debt securities | | 653,501 | | | | | — | | | (150,854) | | | 502,647 | |
| Foreign government bonds | | 238,592 | | | | | 605 | | | (12,001) | | | 227,196 | |
| Asset-backed securities | | 41,287 | | | | | — | | | (575) | | | 40,712 | |
| CLOs | | 89,000 | | | | | — | | | (1,149) | | | 87,851 | |
| Total AFS debt securities | | 9,131,953 | | | | | 4,993 | | | (736,478) | | | 8,400,468 | |
| HTM debt securities: | | | | | | | | | | |
| U.S. Treasury securities | | 530,921 | | | | | — | | | (45,521) | | | 485,400 | |
| U.S. government agency and U.S. government-sponsored enterprise debt securities | | 1,002,697 | | | | | — | | | (196,898) | | | 805,799 | |
U.S. government agency and U.S. government-sponsored enterprise mortgage-backed securities (3): | | | | | | | | | | |
| Commercial mortgage-backed securities | | 491,842 | | | | | — | | | (93,850) | | | 397,992 | |
| Residential mortgage-backed securities | | 734,577 | | | | | — | | | (153,299) | | | 581,278 | |
| Municipal securities | | 188,605 | | | | | — | | | (44,596) | | | 144,009 | |
| Total HTM debt securities | | 2,948,642 | | | | | — | | | (534,164) | | | 2,414,478 | |
| Total debt securities | | $ | 12,080,595 | | | | | $ | 4,993 | | | $ | (1,270,642) | | | $ | 10,814,946 | |
|
|
| | | | | | | | | | | | | | | | |
| |
| | | As of September 30, 2017 |
| ($ in thousands) | | Amortized
Cost | | Gross
Unrealized
Gains | | Gross
Unrealized
Losses | | Fair
Value |
| Available-for-sale investment securities: | | |
| | |
| | |
| | |
|
| U.S. Treasury securities | | $ | 533,035 |
| | $ | — |
| | $ | (6,703 | ) | | $ | 526,332 |
|
| U.S. government agency and U.S. government sponsored enterprise debt securities | | 191,727 |
| | 81 |
| | (2,623 | ) | | 189,185 |
|
| U.S. government agency and U.S. government sponsored enterprise mortgage-backed securities: | | |
| | |
| | |
| | |
|
| Commercial mortgage-backed securities | | 321,943 |
| | 326 |
| | (7,097 | ) | | 315,172 |
|
| Residential mortgage-backed securities | | 1,154,026 |
| | 4,790 |
| | (7,882 | ) | | 1,150,934 |
|
| Municipal securities | | 116,798 |
| | 900 |
| | (456 | ) | | 117,242 |
|
| Non-agency residential mortgage-backed securities: | | | | | | | | |
|
Investment grade (1) | | 9,680 |
| | 21 |
| | (7 | ) | | 9,694 |
|
| Corporate debt securities: | | | | | | | | |
|
Investment grade (1) | | 2,464 |
| | — |
| | (137 | ) | | 2,327 |
|
Non-investment grade (1) | | 10,191 |
| | — |
| | (576 | ) | | 9,615 |
|
| Foreign bonds: | | | | | | | |
|
|
Investment grade (1) (2) | | 505,395 |
| | 229 |
| | (16,484 | ) | | 489,140 |
|
Other securities (3) | | 147,504 |
| | 3 |
| | (372 | ) | | 147,135 |
|
| Total available-for-sale investment securities | | $ | 2,992,763 |
| | $ | 6,350 |
| | $ | (42,337 | ) | | $ | 2,956,776 |
|
| Held-to-maturity investment security: | | | | | | | | |
| Non-agency commercial mortgage-backed security | | $ | — |
| | $ | — |
| | $ | — |
| | $ | — |
|
| Total investment securities | | $ | 2,992,763 |
| | $ | 6,350 |
| | $ | (42,337 | ) | | $ | 2,956,776 |
|
| | | | | | | | | |
| | | | | | | | | |
| | | As of December 31, 2016 |
| ($ in thousands) | | Amortized
Cost | | Gross
Unrealized
Gains | | Gross
Unrealized
Losses | | Fair
Value |
| Available-for-sale investment securities: | | |
| | |
| | |
| | |
|
| U.S. Treasury securities | | $ | 730,287 |
| | $ | 21 |
| | $ | (9,829 | ) | | $ | 720,479 |
|
| U.S. government agency and U.S. government sponsored enterprise debt securities | | 277,891 |
| | 224 |
| | (3,249 | ) | | 274,866 |
|
| U.S. government agency and U.S. government sponsored enterprise mortgage-backed securities: | | |
| | |
| | |
| | |
|
| Commercial mortgage-backed securities | | 272,672 |
| | 345 |
| | (6,218 | ) | | 266,799 |
|
| Residential mortgage-backed securities | | 1,266,372 |
| | 3,924 |
| | (11,549 | ) | | 1,258,747 |
|
| Municipal securities | | 148,302 |
| | 1,252 |
| | (1,900 | ) | | 147,654 |
|
| Non-agency residential mortgage-backed securities: | | | | | | | | |
|
Investment grade (1) | | 11,592 |
| | — |
| | (115 | ) | | 11,477 |
|
| Corporate debt securities: | | | | | | | | |
|
Investment grade (1) | | 222,190 |
| | 562 |
| | (375 | ) | | 222,377 |
|
Non-investment grade (1) | | 10,191 |
| | — |
| | (1,018 | ) | | 9,173 |
|
| Foreign bonds: | | | | | | | | |
Investment grade (1) (2) | | 405,443 |
| | 30 |
| | (21,579 | ) | | 383,894 |
|
| Other securities | | 40,501 |
| | 337 |
| | (509 | ) | | 40,329 |
|
| Total available-for-sale investment securities | | $ | 3,385,441 |
| | $ | 6,695 |
| | $ | (56,341 | ) | | $ | 3,335,795 |
|
| Held-to-maturity investment security: | | | | | | | | |
Non-agency commercial mortgage-backed security (3) | | $ | 143,971 |
| | $ | 622 |
| | $ | — |
| | $ | 144,593 |
|
| Total investment securities | | $ | 3,529,412 |
| | $ | 7,317 |
| | $ | (56,341 | ) | | $ | 3,480,388 |
|
| | | | | | | | | |
| |
(1) | Available-for-sale investment securities rated BBB- or higher by Standard &Poor’s (“S&P”) or Baa3 or higher by Moody’s are considered investment grade. Conversely, available-for-sale investment securities rated lower than BBB- by S&P or lower than Baa3 by Moody’s are considered non-investment grade. Classifications are based on the lower of the credit ratings by S&P or Moody’s. |
| |
(2) | Fair values of foreign bonds include $458.9 million and $353.6 million of multilateral development bank bonds as of September 30, 2017 and December 31, 2016, respectively. |
| |
(3) | During the third quarter of 2017, the Company transferred a non-agency commercial mortgage-backed security with a net carrying amount of $115.6 million from held-to-maturity to available-for-sale. |
| | | | | | | | | | | | | | | | | | | | | | | | | | | | |
|
| | December 31, 2023 |
| ($ in thousands) | | Amortized Cost (1) | | | | Gross Unrealized Gains | | Gross Unrealized Losses | | Fair Value |
| AFS debt securities: | | | | | | | | | | |
| U.S. Treasury securities | | $ | 1,112,587 | | | | | $ | 101 | | | $ | (52,313) | | | $ | 1,060,375 | |
| U.S. government agency and U.S. government-sponsored enterprise debt securities | | 412,086 | | | | | — | | | (47,640) | | | 364,446 | |
U.S. government agency and U.S. government-sponsored enterprise mortgage-backed securities (2): | | | | | | | | | | |
| Commercial mortgage-backed securities | | 531,377 | | | | | 158 | | | (63,276) | | | 468,259 | |
| Residential mortgage-backed securities | | 1,956,927 | | | | | 380 | | | (229,713) | | | 1,727,594 | |
| Municipal securities | | 297,283 | | | | | 75 | | | (36,342) | | | 261,016 | |
| Non-agency mortgage-backed securities: | | | | | | | | | | |
| Commercial mortgage-backed securities | | 409,578 | | | | | — | | | (42,062) | | | 367,516 | |
| Residential mortgage-backed securities | | 643,335 | | | | | — | | | (89,664) | | | 553,671 | |
| Corporate debt securities | | 653,501 | | | | | — | | | (151,076) | | | 502,425 | |
| Foreign government bonds | | 239,333 | | | | | 69 | | | (11,528) | | | 227,874 | |
| Asset-backed securities | | 43,234 | | | | | — | | | (934) | | | 42,300 | |
| CLOs | | 617,250 | | | | | — | | | (4,389) | | | 612,861 | |
| Total AFS debt securities | | 6,916,491 | | | | | 783 | | | (728,937) | | | 6,188,337 | |
| HTM debt securities: | | | | | | | | | | |
| U.S. Treasury securities | | 529,548 | | | | | — | | | (40,997) | | | 488,551 | |
| U.S. government agency and U.S. government-sponsored enterprise debt securities | | 1,001,836 | | | | | — | | | (186,904) | | | 814,932 | |
U.S. government agency and U.S. government-sponsored enterprise mortgage-backed securities (3): | | | | | | | | | | |
| Commercial mortgage-backed securities | | 493,348 | | | | | — | | | (88,968) | | | 404,380 | |
| Residential mortgage-backed securities | | 742,436 | | | | | — | | | (142,119) | | | 600,317 | |
| Municipal securities | | 188,872 | | | | | — | | | (43,081) | | | 145,791 | |
| Total HTM debt securities | | 2,956,040 | | | | | — | | | (502,069) | | | 2,453,971 | |
| Total debt securities | | $ | 9,872,531 | | | | | $ | 783 | | | $ | (1,231,006) | | | $ | 8,642,308 | |
| | | | | | | | | | |
| | | | | | | | | | |
(1)Amortized cost excludes accrued interest receivables which are presented within Other assets on the Consolidated Balance Sheet. As of March 31, 2024 and December 31, 2023, the accrued interest receivables were $40 million and $44 million, respectively. For the Company’s accounting policy related to debt securities’ accrued interest receivables, see Note 1 — Summary of Significant Accounting Policies — Significant Accounting Policies — Allowance for Credit Losses on Available-for-Sale Debt Securities and Allowance for Credit Losses on Held-to-Maturity Debt Securities to the Consolidated Financial Statements in the Company’s 2023 Form 10-K.
(2)Includes GNMA AFS debt securities totaling $4.5 billion of amortized cost and $4.4 billion of fair value as of March 31, 2024, and $1.3 billion of amortized cost and $1.2 billion of fair value as of December 31, 2023.
(3)Includes GNMA HTM debt securities totaling $91 million of amortized cost and $73 million of fair value as of March 31, 2024, and $92 million of amortized cost and $75 million of fair value of as of December 31, 2023.
Unrealized Losses of Available-for-Sale Debt Securities
The following tables present the fair value and the associated gross unrealized losses and related fair values of the Company’s investment portfolio,AFS debt securities, aggregated by investment category and the length of time that individualthe securities have been in a continuous unrealized loss position as of September 30, 2017March 31, 2024 and December 31, 2016:2023.
| | | | | | | | | | | | | | | | | | | | | | | | | | | | | | | | | | | | | | |
|
| | March 31, 2024 |
| | Less Than 12 Months | | 12 Months or More | | Total |
| ($ in thousands) | | Fair Value | | Gross Unrealized Losses | | Fair Value | | Gross Unrealized Losses | | Fair Value | | Gross Unrealized Losses |
| AFS debt securities: | | | | | | | | | | | | |
| U.S. Treasury securities | | $ | — | | | $ | — | | | $ | 621,094 | | | $ | (55,196) | | | $ | 621,094 | | | $ | (55,196) | |
| U.S. government agency and U.S. government sponsored enterprise debt securities | | — | | | — | | | 360,802 | | | (49,874) | | | 360,802 | | | (49,874) | |
| U.S. government agency and U.S. government-sponsored enterprise mortgage-backed securities: | | | | | | | | | | | | |
| Commercial mortgage-backed securities | | — | | | — | | | 450,965 | | | (57,669) | | | 450,965 | | | (57,669) | |
| Residential mortgage-backed securities | | 1,577,361 | | | (4,504) | | | 1,642,455 | | | (236,858) | | | 3,219,816 | | | (241,362) | |
| Municipal securities | | 4,189 | | | (6) | | | 252,268 | | | (37,906) | | | 256,457 | | | (37,912) | |
| Non-agency mortgage-backed securities: | | | | | | | | | | | | |
| Commercial mortgage-backed securities | | — | | | — | | | 333,996 | | | (39,838) | | | 333,996 | | | (39,838) | |
| Residential mortgage-backed securities | | — | | | — | | | 519,657 | | | (90,048) | | | 519,657 | | | (90,048) | |
| Corporate debt securities | | — | | | — | | | 502,647 | | | (150,854) | | | 502,647 | | | (150,854) | |
| Foreign government bonds | | 18,567 | | | (61) | | | 88,060 | | | (11,940) | | | 106,627 | | | (12,001) | |
| Asset-backed securities | | — | | | — | | | 40,712 | | | (575) | | | 40,712 | | | (575) | |
| CLOs | | — | | | — | | | 87,851 | | | (1,149) | | | 87,851 | | | (1,149) | |
| Total AFS debt securities | | $ | 1,600,117 | | | $ | (4,571) | | | $ | 4,900,507 | | | $ | (731,907) | | | $ | 6,500,624 | | | $ | (736,478) | |
|
| | | | | | | | | | | | | | | | | | | | | | | | | | | | | | | | | | | | | | |
|
| | December 31, 2023 |
| | Less Than 12 Months | | 12 Months or More | | Total |
| ($ in thousands) | | Fair Value | | Gross Unrealized Losses | | Fair Value | | Gross Unrealized Losses | | Fair Value | | Gross Unrealized Losses |
| AFS debt securities: | | | | | | | | | | | | |
| U.S. Treasury securities | | $ | — | | | $ | — | | | $ | 623,978 | | | $ | (52,313) | | | $ | 623,978 | | | $ | (52,313) | |
| U.S. government agency and U.S. government-sponsored enterprise debt securities | | — | | | — | | | 364,446 | | | (47,640) | | | 364,446 | | | (47,640) | |
| U.S. government agency and U.S. government-sponsored enterprise mortgage-backed securities: | | | | | | | | | | | | |
| Commercial mortgage-backed securities | | — | | | — | | | 463,572 | | | (63,276) | | | 463,572 | | | (63,276) | |
| Residential mortgage-backed securities | | 9,402 | | | (558) | | | 1,661,112 | | | (229,155) | | | 1,670,514 | | | (229,713) | |
| Municipal securities | | 2,825 | | | (15) | | | 254,773 | | | (36,327) | | | 257,598 | | | (36,342) | |
| Non-agency mortgage-backed securities: | | | | | | | | | | | | |
| Commercial mortgage-backed securities | | 2,742 | | | (4) | | | 364,774 | | | (42,058) | | | 367,516 | | | (42,062) | |
| Residential mortgage-backed securities | | — | | | — | | | 553,671 | | | (89,664) | | | 553,671 | | | (89,664) | |
| Corporate debt securities | | — | | | — | | | 502,425 | | | (151,076) | | | 502,425 | | | (151,076) | |
| Foreign government bonds | | 110,955 | | | (144) | | | 88,616 | | | (11,384) | | | 199,571 | | | (11,528) | |
| Asset-backed securities | | — | | | — | | | 42,300 | | | (934) | | | 42,300 | | | (934) | |
| CLOs | | — | | | — | | | 612,861 | | | (4,389) | | | 612,861 | | | (4,389) | |
| Total AFS debt securities | | $ | 125,924 | | | $ | (721) | | | $ | 5,532,528 | | | $ | (728,216) | | | $ | 5,658,452 | | | $ | (728,937) | |
|
|
| | | | | | | | | | | | | | | | | | | | | | | | |
| |
| | | As of September 30, 2017 |
| ($ in thousands) | | Less Than 12 Months | | 12 Months or More | | Total |
| | Fair Value | | Gross Unrealized Losses | | Fair Value | | Gross Unrealized Losses | | Fair Value | | Gross Unrealized Losses |
| Available-for-sale investment securities: | | |
| | |
| | |
| | |
| | |
| | |
|
| U.S. Treasury securities | | $ | 415,507 |
| | $ | (4,615 | ) | | $ | 110,825 |
| | $ | (2,088 | ) | | $ | 526,332 |
| | $ | (6,703 | ) |
| U.S. government agency and U.S. government sponsored enterprise debt securities | | 96,681 |
| | (367 | ) | | 54,512 |
| | (2,256 | ) | | 151,193 |
| | (2,623 | ) |
| U.S. government agency and U.S. government sponsored enterprise mortgage-backed securities: | | |
| | |
| | |
| | |
| | |
| | |
|
| Commercial mortgage-backed securities | | 120,070 |
| | (1,721 | ) | | 155,128 |
| | (5,376 | ) | | 275,198 |
| | (7,097 | ) |
| Residential mortgage-backed securities | | 365,038 |
| | (2,344 | ) | | 288,768 |
| | (5,538 | ) | | 653,806 |
| | (7,882 | ) |
| Municipal securities | | 22,010 |
| | (222 | ) | | 11,256 |
| | (234 | ) | | 33,266 |
| | (456 | ) |
| Non-agency residential mortgage-backed securities: | | |
| | |
| | |
| | |
| | |
| | |
|
| Investment grade | | 4,715 |
| | (7 | ) | | — |
| | — |
| | 4,715 |
| | (7 | ) |
| Corporate debt securities: | | |
| | |
| | |
| | |
| | |
| | |
|
| Investment grade | | — |
| | — |
| | 2,327 |
| | (137 | ) | | 2,327 |
| | (137 | ) |
| Non-investment grade | | — |
| | — |
| | 9,615 |
| | (576 | ) | | 9,615 |
| | (576 | ) |
| Foreign bonds: | | | | | | | | | | | | |
| Investment grade | | 73,619 |
| | (873 | ) | | 344,298 |
| | (15,611 | ) | | 417,917 |
| | (16,484 | ) |
| Other securities | | 31,223 |
| | (372 | ) | | — |
| | — |
| | 31,223 |
| | (372 | ) |
| Total available-for-sale investment securities | | $ | 1,128,863 |
| | $ | (10,521 | ) | | $ | 976,729 |
| | $ | (31,816 | ) | | $ | 2,105,592 |
| | $ | (42,337 | ) |
| Held-to-maturity investment security: | | | | | | | | | | | | |
| Non-agency commercial mortgage-backed security | | $ | — |
| | $ | — |
| | $ | — |
| | $ | — |
| | $ | — |
| | $ | — |
|
| Total investment securities | | $ | 1,128,863 |
| | $ | (10,521 | ) | | $ | 976,729 |
| | $ | (31,816 | ) | | $ | 2,105,592 |
| | $ | (42,337 | ) |
| | | | | | | | | | | | | |
| | | | | | | | | | | | | |
| | | As of December 31, 2016 |
| ($ in thousands) | | Less Than 12 Months | | 12 Months or More | | Total |
| | Fair Value | | Gross Unrealized Losses | | Fair Value | | Gross Unrealized Losses | | Fair Value | | Gross Unrealized Losses |
| Available-for-sale investment securities: | | |
| | |
| | |
| | |
| | |
| | |
|
| U.S. Treasury securities | | $ | 670,268 |
| | $ | (9,829 | ) | | $ | — |
| | $ | — |
| | $ | 670,268 |
| | $ | (9,829 | ) |
| U.S. government agency and U.S. government sponsored enterprise debt securities | | 203,901 |
| | (3,249 | ) | | — |
| | — |
| | 203,901 |
| | (3,249 | ) |
| U.S. government agency and U.S. government sponsored enterprise mortgage-backed securities: | | | | | | | | | | |
| | |
|
| Commercial mortgage-backed securities | | 202,106 |
| | (5,452 | ) | | 29,201 |
| | (766 | ) | | 231,307 |
| | (6,218 | ) |
| Residential mortgage-backed securities | | 629,324 |
| | (9,594 | ) | | 119,603 |
| | (1,955 | ) | | 748,927 |
| | (11,549 | ) |
| Municipal securities | | 57,655 |
| | (1,699 | ) | | 2,692 |
| | (201 | ) | | 60,347 |
| | (1,900 | ) |
| Non-agency residential mortgage-backed securities: | | | | | | | | | | |
| | |
|
| Investment grade | | 5,033 |
| | (101 | ) | | 6,444 |
| | (14 | ) | | 11,477 |
| | (115 | ) |
| Corporate debt securities: | | | | | | | | | | |
| | |
|
| Investment grade | | — |
| | — |
| | 71,667 |
| | (375 | ) | | 71,667 |
| | (375 | ) |
| Non-investment grade | | — |
| | — |
| | 9,173 |
| | (1,018 | ) | | 9,173 |
| | (1,018 | ) |
| Foreign bonds: | | | | | | | | | | | | |
| Investment grade | | 363,618 |
| | (21,327 | ) | | 14,258 |
| | (252 | ) | | 377,876 |
| | (21,579 | ) |
| Other securities | | 30,991 |
| | (509 | ) | | — |
| | — |
| | 30,991 |
| | (509 | ) |
| Total available-for-sale investment securities | | $ | 2,162,896 |
| | $ | (51,760 | ) | | $ | 253,038 |
| | $ | (4,581 | ) | | $ | 2,415,934 |
| | $ | (56,341 | ) |
| Held-to-maturity investment security: | | | | | | | | | | | | |
| Non-agency commercial mortgage-backed security | | $ | — |
| | $ | — |
| | $ | — |
| | $ | — |
| | $ | — |
| | $ | — |
|
| Total investment securities | | $ | 2,162,896 |
| | $ | (51,760 | ) | | $ | 253,038 |
| | $ | (4,581 | ) | | $ | 2,415,934 |
| | $ | (56,341 | ) |
| |
For each reporting period,As of March 31, 2024, the Company examines all individualhad 560 AFS debt securities that are in ana gross unrealized loss position with no credit impairment, primarily consisting of 288 U.S. government agency and U.S. government-sponsored enterprise mortgage-backed securities, 66 corporate debt securities, and 95 non-agency mortgage-backed securities. In comparison, as of December 31, 2023, the Company had 547 AFS debt securities in a gross unrealized loss position with no credit impairment, primarily consisting of 255 U.S. government agency and U.S. government-sponsored enterprise mortgage-backed securities, 66 corporate debt securities, and 99 non-agency mortgage-backed securities.
Allowance for OTTI.Credit Losses on Available-for-Sale Debt Securities
The Company evaluates each AFS debt security where the fair value declines below amortized cost. For a discussion of the factors and criteria the Company uses in analyzing securities for OTTI,impairment related to credit losses, see Note 1 — Summary of Significant Accounting Policies — Significant Accounting Policies — Allowance for Credit Losses on Available-for-Sale InvestmentDebt Securitiesto to the Consolidated Financial Statements ofin the Company’s 20162023 Form 10-K.
The gross unrealized losses presented in the preceding tables were primarily attributable to interest rate movement and the yield curve movement, in addition to widenedwidening of liquidity andand/or credit spreads. U.S. Treasury, U.S. government agency, U.S. government-sponsored agency, and U.S. government-sponsored enterprise debt and mortgage-backed securities are issued, guaranteed, or otherwise supported by the U.S. government and have a zero credit loss assumption. The remaining securities that were in an unrealized loss position as of March 31, 2024 were mainly comprised of the following:
•Corporate debt securities — The market value decline as of March 31, 2024 was primarily due to interest rate movement and spread widening. A portion of the corporate debt securities is comprised of subordinated debt securities issued by U.S. banks. Despite the reduction of the market value of these securities after the banking sector disruption in 2023, these securities are nearly all rated investment grade by nationally recognized statistical rating organizations (“NRSROs”) or issued by well-capitalized financial institutions with strong profitability. The contractual payments from these corporate debt securities have been and are expected to be received on time. The Company will continue to monitor the market developments in the banking sector and the credit performance of these securities.
•Non-agency mortgage-backed securities — The market value decline as of March 31, 2024 was primarily due to interest rate movement and spread widening. Since these securities are rated investment grade by NRSROs, or have high priority in the cash flow waterfall within the securitization structure, and the contractual payments have historically been on time, the Company believes the risk of credit losses on these securities is low.
As of both March 31, 2024 and December 31, 2023, the Company intended to hold the AFS debt securities with unrealized losses through the anticipated recovery period and it was more-likely-than-not that the Company would not have to sell these securities before the recovery of their amortized cost. The issuers of these securities have not, to the Company’s knowledge, established any cause for default on these securities. These securities have fluctuated in value since their purchase dates as market interest rates have fluctuated. The Company believes that the gross unrealized losses detailed in the previous tables are temporary and not due to reasons of credit quality. As a result, the Company expects to recover the entire amortized cost basis of these securities. Accordingly, there was no impairment loss was recorded on the Company’s Consolidated Statements of Incomeallowance for the three and nine months ended September 30, 2017 and 2016. As of September 30, 2017, the Company had 146 available-for-sale investmentcredit losses provided against these securities in an unrealized loss position with no credit impairment, primarily comprised of 79 U.S. government agency and U.S. government sponsored enterprise mortgage-backed securities, 22 U.S. Treasury securities and 14 investment grade foreign bonds. In comparison, as of both March 31, 2024 and December 31, 2016, the Company had 170 available-for-sale investment securities in an unrealized loss position with2023. In addition, there was no credit impairment, primarily comprised of 82 U.S. government agency and U.S. government sponsored enterprise mortgage-backed securities, 26 U.S. Treasury securities and 13 investment grade foreign bonds.
During the first quarter of 2016, the Company obtained a non-agency commercial mortgage-backed security, through the securitization of multifamily real estate loans, which was classified as held-to-maturity and recorded at amortized cost. During the third quarter of 2017, the Company transferred this non-agency commercial mortgage-backed security with a net carrying amount of $115.6 million from held-to-maturity to available-for-sale. The transfer reflects the Company’s intent to sell the security under active liquidity management.
Other-Than-Temporary Impairment
No OTTIprovision for credit losses were recognized for the three and nine months ended September 30, 2017March 31, 2024 and 2016.2023.
Allowance for Credit Losses on Held-to-Maturity Debt Securities
The Company separately evaluates its HTM debt securities for any credit losses using an expected loss model, similar to the methodology used for loans. For additional information on the Company’s credit loss methodology, refer to Note 1 — Summary of Significant Accounting Policies — Significant Accounting Policies — Allowance for Credit Losses on Held-to-Maturity Debt Securities to the Consolidated Financial Statements in the Company’s 2023 Form 10-K.
The Company monitors the credit quality of the HTM debt securities using external credit ratings. As of March 31, 2024, all HTM securities were rated investment grade by NRSROs and issued, guaranteed, or supported by U.S. government entities and agencies. Accordingly, the Company applied a zero credit loss assumption and no allowance for credit losses was recorded as of both March 31, 2024 and December 31, 2023. Overall, the Company believes that the credit support levels of the debt securities are strong, and based on current assessments and macroeconomic forecasts, expects that full contractual cash flows will be received.
Realized Gains and Losses
The following table presents the proceeds, gross realized gains from the sales and losses,impairment write-off of AFS debt securities and the related tax expense related to the sales of available-for-sale investment securities(benefit) included in earnings for the three and nine months ended September 30, 2017March 31, 2024 and 2016:2023:
| | | | | | | | | | | | | | | | | | | | | | |
|
| | Three Months Ended March 31, | | | | |
| ($ in thousands) | | 2024 | | 2023 | | | | | | | | |
| | | | | | | | | | | | |
| Gross realized gains from sales | | $ | 49 | | | $ | — | | | | | | | | | |
Impairment write-off (1) | | $ | — | | | $ | (10,000) | | | | | | | | | |
| Related tax expense (benefit) | | $ | 14 | | | $ | (2,956) | | | | | | | | | |
|
|
| | | | | | | | | | | | | | | | |
| |
| ($ in thousands) | | Three Months Ended September 30, | | Nine Months Ended September 30, |
| | 2017 | | 2016 | | 2017 | | 2016 |
| Proceeds from sales | | $ | 124,887 |
| | $ | 143,513 |
| | $ | 676,776 |
| | $ | 1,008,256 |
|
| Gross realized gains | | $ | 1,539 |
| | $ | 1,790 |
| | $ | 6,733 |
| | $ | 8,593 |
|
| Gross realized losses | | $ | — |
| | $ | — |
| | $ | — |
| | $ | (125 | ) |
| Related tax expense | | $ | 647 |
| | $ | 752 |
| | $ | 2,831 |
| | $ | 3,560 |
|
| |
Scheduled Maturities of Investment SecuritiesInterest Income
The following table presents the scheduledcomposition of interest income on debt securities for the three months ended March 31, 2024 and 2023:
| | | | | | | | | | | | | | | | | | | | | | |
|
| | Three Months Ended March 31, | | | | |
| ($ in thousands) | | 2024 | | 2023 | | | | | | | | |
| | | | | | | | | | | | |
| Taxable interest | | $ | 70,328 | | | $ | 61,049 | | | | | | | | | |
| Nontaxable interest | | 5,064 | | | 4,882 | | | | | | | | | |
| Total interest income on debt securities | | $ | 75,392 | | | $ | 65,931 | | | | | | | | | |
|
Contractual Maturities of Available-for-Sale and Held-to-Maturity Debt Securities
The following tables present the contractual maturities, amortized cost, fair value and weighted-average yields of available-for-sale investmentAFS and HTM debt securities as of September 30, 2017:
|
| | | | | | | | |
| |
| ($ in thousands) | | Amortized Cost | | Estimated Fair Value |
| Due within one year | | $ | 638,257 |
| | $ | 621,343 |
|
| Due after one year through five years | | 629,892 |
| | 623,058 |
|
| Due after five years through ten years | | 176,117 |
| | 172,902 |
|
| Due after ten years | | 1,548,497 |
| | 1,539,473 |
|
| Total available-for-sale investment securities | | $ | 2,992,763 |
| | $ | 2,956,776 |
|
| |
ActualMarch 31, 2024. Expected maturities of mortgage-backed securities canwill differ from contractual maturities becauseon certain securities as the issuers and borrowers of the underlying collateral may have the right to call or prepay obligations. In addition, factors such as prepayments and interest rates may affect theobligations with or without prepayment penalties.
| | | | | | | | | | | | | | | | | | | | | | | | | | | | | | | | |
|
| ($ in thousands) | | Within One Year | | After One Year through Five Years | | After Five Years through Ten Years | | After Ten Years | | Total |
| AFS debt securities: | | | | | | | | | | |
| U.S. Treasury securities | | | | | | | | | | |
| Amortized cost | | $ | 34,901 | | | $ | 641,389 | | | $ | — | | | $ | — | | | $ | 676,290 | |
| Fair value | | 33,920 | | | 587,174 | | | — | | | — | | | 621,094 | |
Weighted-average yield (1) | | 1.83 | % | | 1.17 | % | | — | % | | — | % | | 1.20 | % |
| U.S. government agency and U.S. government-sponsored enterprise debt securities | | | | | | | | | | |
| Amortized cost | | 51,238 | | | 94,159 | | | 127,833 | | | 137,446 | | | 410,676 | |
| Fair value | | 51,163 | | | 90,935 | | | 106,727 | | | 111,977 | | | 360,802 | |
Weighted-average yield (1) | | 4.94 | % | | 3.16 | % | | 1.60 | % | | 2.33 | % | | 2.62 | % |
| U.S. government agency and U.S. government-sponsored enterprise mortgage-backed securities | | | | | | | | | | |
| Amortized cost | | 3,219 | | | 36,135 | | | 137,555 | | | 5,565,799 | | | 5,742,708 | |
| Fair value | | 3,130 | | | 34,513 | | | 125,890 | | | 5,284,485 | | | 5,448,018 | |
Weighted-average yield (1) (2) | | 2.68 | % | | 3.15 | % | | 2.73 | % | | 5.32 | % | | 5.24 | % |
| Municipal securities | | | | | | | | | | |
| Amortized cost | | 2,240 | | | 34,998 | | | 9,621 | | | 249,501 | | | 296,360 | |
| Fair value | | 2,219 | | | 32,747 | | | 8,885 | | | 214,644 | | | 258,495 | |
Weighted-average yield (1) (2) | | 3.39 | % | | 2.23 | % | | 3.22 | % | | 2.23 | % | | 2.27 | % |
| Non-agency mortgage-backed securities | | | | | | | | | | |
| Amortized cost | | 82,941 | | | 46,116 | | | — | | | 854,482 | | | 983,539 | |
| Fair value | | 82,055 | | | 45,322 | | | — | | | 726,276 | | | 853,653 | |
Weighted-average yield (1) | | 3.67 | % | | 3.70 | % | | — | % | | 2.54 | % | | 2.69 | % |
| Corporate debt securities | | | | | | | | | | |
| Amortized cost | | — | | | — | | | 349,501 | | | 304,000 | | | 653,501 | |
| Fair value | | — | | | — | | | 294,845 | | | 207,802 | | | 502,647 | |
Weighted-average yield (1) | | — | % | | — | % | | 3.50 | % | | 1.97 | % | | 2.79 | % |
| Foreign government bonds | | | | | | | | | | |
| Amortized cost | | 32,724 | | | 105,868 | | | 50,000 | | | 50,000 | | | 238,592 | |
| Fair value | | 32,665 | | | 106,471 | | | 49,640 | | | 38,420 | | | 227,196 | |
Weighted-average yield (1) | | 3.01 | % | | 2.28 | % | | 5.72 | % | | 1.50 | % | | 2.94 | % |
| Asset-backed securities | | | | | | | | | | |
| Amortized cost | | — | | | — | | | — | | | 41,287 | | | 41,287 | |
| Fair value | | — | | | — | | | — | | | 40,712 | | | 40,712 | |
Weighted-average yield (1) | | — | % | | — | % | | — | % | | 6.06 | % | | 6.06 | % |
| CLOs | | | | | | | | | | |
| Amortized cost | | — | | | — | | | 69,000 | | | 20,000 | | | 89,000 | |
| Fair value | | — | | | — | | | 67,924 | | | 19,927 | | | 87,851 | |
Weighted-average yield (1) | | — | % | | — | % | | 7.10 | % | | 6.84 | % | | 7.04 | % |
| Total AFS debt securities | | | | | | | | | | |
| Amortized cost | | $ | 207,263 | | | $ | 958,665 | | | $ | 743,510 | | | $ | 7,222,515 | | | $ | 9,131,953 | |
| Fair value | | $ | 205,152 | | | $ | 897,162 | | | $ | 653,911 | | | $ | 6,644,243 | | | $ | 8,400,468 | |
Weighted-average yield (1) | | 3.55 | % | | 1.72 | % | | 3.51 | % | | 4.67 | % | | 4.24 | % |
|
| | | | | | | | | | | | | | | | | | | | | | | | | | | | | | | | |
|
| ($ in thousands) | | Within One Year | | After One Year through Five Years | | After Five Years through Ten Years | | After Ten Years | | Total |
| HTM debt securities: | | | | | | | | | | |
| U.S. Treasury securities | | | | | | | | | | |
| Amortized cost | | $ | — | | $ | 530,921 | | $ | — | | $ | — | | $ | 530,921 |
| Fair value | | — | | 485,400 | | — | | — | | 485,400 |
Weighted-average yield (1) | | — | % | | 1.05 | % | | — | % | | — | % | | 1.05 | % |
| U.S. government agency and U.S. government-sponsored enterprise debt securities | | | | | | | | | | |
| Amortized cost | | — | | — | | 343,666 | | 659,031 | | 1,002,697 |
| Fair value | | — | | — | | 291,586 | | 514,213 | | 805,799 |
Weighted-average yield (1) | | — | % | | — | % | | 1.90 | % | | 1.89 | % | | 1.90 | % |
| U.S. government agency and U.S. government-sponsored enterprise mortgage-backed securities | | | | | | | | | | |
| Amortized cost | | — | | 4,852 | | 94,536 | | 1,127,031 | | 1,226,419 |
| Fair value | | — | | 4,401 | | 79,571 | | 895,298 | | 979,270 |
Weighted-average yield (1) (2) | | — | % | | 1.40 | % | | 1.59 | % | | 1.69 | % | | 1.68 | % |
| Municipal securities | | | | | | | | | | |
| Amortized cost | | — | | — | | — | | 188,605 | | 188,605 |
| Fair value | | — | | — | | — | | 144,009 | | 144,009 |
Weighted-average yield (1) (2) | | — | % | | — | % | | — | % | | 1.99 | % | | 1.99 | % |
| Total HTM debt securities | | | | | | | | | | |
| Amortized cost | | $ | — | | $ | 535,773 | | $ | 438,202 | | $ | 1,974,667 | | $ | 2,948,642 |
| Fair value | | $ | — | | $ | 489,801 | | $ | 371,157 | | $ | 1,553,520 | | $ | 2,414,478 |
Weighted-average yield (1) | | — | % | | 1.05 | % | | 1.83 | % | | 1.79 | % | | 1.66 | % |
|
(1)Weighted-average yields are computed based on the carrying valuesamortized cost balances.
(2)Yields on tax-exempt securities are not presented on a tax-equivalent basis.
As of mortgage-backed securities.
Available-for-sale investment securities with fair values of $584.9 million and $767.4 million as of September 30, 2017March 31, 2024 and December 31, 2016, 2023, AFS and HTM debt securities with carrying values of $5.8 billion and $7.0 billion, respectively, were pledged to secure borrowings, public deposits repurchase agreements, the Federal Reserve Bank’s discount window and for other purposes required or permitted by law.
Restricted Equity Securities
Restricted equity securities include stock of the Federal Reserve Bank and of the FHLB. Restricted equity securities are carried at cost as these securities do not have a readily determinable fair value. The following table presents the restricted equity securities included in Other assets on the Consolidated Balance Sheet as of September 30, 2017March 31, 2024 and December 31, 2016:2023:
| | | | | | | | | | | | | | |
|
| ($ in thousands) | | March 31, 2024 | | December 31, 2023 |
| Federal Reserve Bank of San Francisco (“FRBSF”) stock | | $ | 62,858 | | | $ | 62,561 | |
| FHLB stock | | 101,544 | | | 17,250 | |
| Total restricted equity securities | | $ | 164,402 | | | $ | 79,811 | |
|
|
| | | | | | | | |
| | | | | |
| ($ in thousands) | | September 30, 2017 | | December 31, 2016 |
| Federal Reserve Bank stock | | $ | 56,072 |
| | $ | 55,525 |
|
| FHLB stock | | 17,250 |
| | 17,250 |
|
| Total | | $ | 73,322 |
| | $ | 72,775 |
|
| | | | | |
Note 76 — Derivatives
The Company uses derivativesderivative instruments to manage exposure to market risk, primarily including interest rate risk and foreign currency risk, andrisks, as well as to assist customers with their risk management objectives. The Company’s goal is to manage interest rate sensitivity and volatility so that movements into mitigate the effect of interest rates are not significant torate changes on earnings or capital. The Company also uses foreign exchange contracts to manage the foreign exchange rate risk associated with certain foreign currency-denominated assets and liabilities, as well as the Company’sBank’s investment in its China subsidiary, East West Bank (China) Limited. The Company recognizes all derivatives on the Consolidated Balance SheetsSheet at fair value. While the Company designates certain derivatives as hedging instruments in a qualifying hedge accounting relationship, other derivatives consist ofserve as economic hedges. For additional information on the Company’s derivatives and hedging activities, seeNote 1 — Summary of Significant Accounting Policies — Significant Accounting Policies — Derivativesto the Consolidated Financial Statements of the Company’s 20162023 Form 10-K.
The following table presents the total notional amounts and fair valuevalues of the Company’s derivatives as of September 30, 2017March 31, 2024 and December 31, 2016:2023. Certain derivative contracts are cleared though central clearing organizations where variation margin is applied daily as settlement to the fair values of the contracts. The fair values are presented on a gross basis prior to the application of bilateral collateral and master netting agreements, but after the application of variation margin payments as settlement to fair values of contracts cleared through central clearing organizations. Applying variation margin payments as settlement to the fair values of derivative contracts cleared through the London Clearing House (“LCH”) and the Chicago Mercantile Exchange (“CME”) resulted in reductions in the derivative asset and liability fair values by $41 million and $47 million, respectively, as of March 31, 2024. In comparison, applying variation margin payments as settlement to LCH- and CME-cleared derivative transactions resulted in reductions in both the derivative asset and liability fair values by $43 million as of December 31, 2023. Total derivative asset and liability fair values are adjusted to reflect the effects of legally enforceable master netting agreements and cash collateral received or paid. The resulting net derivative asset and liability fair values are included in Other assets and Accrued expenses and other liabilities, respectively, on the Consolidated Balance Sheet.
| | | | | | | | | | | | | | | | | | | | | | | | | | | | | | | | | | | | | | | | | | |
| |
| | March 31, 2024 | | December 31, 2023 | | |
| | | | Fair Value | | | | Fair Value | | |
| ($ in thousands) | | Notional Amount | | Assets | | Liabilities | | Notional Amount | | Assets | | Liabilities | | |
| Derivatives designated as hedging instruments: | | | | | | | | | | | | | | |
| | | | | | | | | | | | | | |
| | | | | | | | | | | | | | |
| Cash flow hedges: | | | | | | | | | | | | | | |
| Interest rate contracts | | $ | 5,250,000 | | | $ | 15,707 | | | $ | 49,616 | | | $ | 5,250,000 | | | $ | 50,421 | | | $ | 13,124 | | | |
| Net investment hedges: | | | | | | | | | | | | | | |
| Foreign exchange contracts | | — | | | — | | | — | | | 81,480 | | | 3,394 | | | — | | | |
| Total derivatives designated as hedging instruments | | $ | 5,250,000 | | | $ | 15,707 | | | $ | 49,616 | | | $ | 5,331,480 | | | $ | 53,815 | | | $ | 13,124 | | | |
| Derivatives not designated as hedging instruments: | | | | | | | | | | | | | | |
| Interest rate contracts | | $ | 16,910,462 | | | $ | 469,087 | | | $ | 468,714 | | | $ | 17,387,909 | | | $ | 423,486 | | | $ | 420,812 | | | |
Commodity contracts (1) | | — | | | 76,615 | | | 106,930 | | | — | | | 79,604 | | | 121,670 | | | |
| Foreign exchange contracts | | 4,898,429 | | | 60,499 | | | 53,153 | | | 5,827,149 | | | 53,678 | | | 42,564 | | | |
Credit contracts (2) | | 118,144 | | | — | | | 16 | | | 118,391 | | | 1 | | | 25 | | | |
| Equity contracts | | — | | | 330 | | (3) | 15,119 | | (4) | — | | | 336 | | (3) | 15,119 | | (4) | |
| Total derivatives not designated as hedging instruments | | $ | 21,927,035 | | | $ | 606,531 | | | $ | 643,932 | | | $ | 23,333,449 | | | $ | 557,105 | | | $ | 600,190 | | | |
| Gross derivative assets/liabilities | | | | $ | 622,238 | | | $ | 693,548 | | | | | $ | 610,920 | | | $ | 613,314 | | | |
| Less: Master netting agreements | | | | (132,555) | | | (132,555) | | | | | (75,534) | | | (75,534) | | | |
| Less: Cash collateral received | | | | (356,707) | | | (2,408) | | | | | (237,258) | | | (636) | | | |
| Net derivative assets/liabilities | | | | $ | 132,976 | | | $ | 558,585 | | | | | $ | 298,128 | | | $ | 537,144 | | | |
| | |
|
| | | | | | | | | | | | | | | | | | | | | | | | |
| |
| ($ in thousands) | | September 30, 2017 | | December 31, 2016 |
| | Notional Amount | | Fair Value | | Notional Amount | | Fair Value |
| | | Derivative Assets (1) | | Derivative Liabilities (1) | | | Derivative Assets (1) | | Derivative Liabilities (1) |
| Derivatives designated as hedging instruments: | | | | | | | | | | | | |
| Interest rate swaps on certificates of deposit | | $ | 42,566 |
| | $ | — |
| | $ | 6,648 |
| | $ | 48,365 |
| | $ | — |
| | $ | 5,976 |
|
| Foreign currency forward contracts | | — |
| | — |
| | — |
| | 83,026 |
| | 4,325 |
| | — |
|
| Total derivatives designated as hedging instruments | | $ | 42,566 |
| | $ | — |
| | $ | 6,648 |
| | $ | 131,391 |
| | $ | 4,325 |
| | $ | 5,976 |
|
| Derivatives not designated as hedging instruments: | | | | | | | | | | | | |
| Interest rate swaps and options | | $ | 8,742,980 |
| | $ | 64,822 |
| | $ | 64,212 |
| | $ | 7,668,482 |
| | $ | 67,578 |
| | $ | 65,131 |
|
| Foreign exchange contracts | | 1,131,414 |
| | 14,187 |
| | 20,054 |
| | 767,764 |
| | 11,874 |
| | 11,213 |
|
| RPAs | | 68,387 |
| | 2 |
| | 1 |
| | 71,414 |
| | 3 |
| | 3 |
|
| Warrants | | — |
| (2) | 1,455 |
| | — |
| | — |
| | — |
| | — |
|
| Total derivatives not designated as hedging instruments | | $ | 9,942,781 |
| | $ | 80,466 |
| | $ | 84,267 |
| | $ | 8,507,660 |
| | $ | 79,455 |
| | $ | 76,347 |
|
| |
| |
(1) | Derivative assets and derivative liabilities are included in Other assets and Accrued expenses and other liabilities, respectively,on the Consolidated Balance Sheets.
|
| |
(2) | The Company held four warrants in public companies and 32 warrants in private companies as of September 30, 2017. |
(1)The notional amount of the Company’s commodity contracts totaled 18,468 thousand barrels of crude oil and 350,942 thousand units of natural gas, measured in million British thermal units (“MMBTUs”) as of March 31, 2024. In comparison, the notional amount of the Company’s commodity contracts totaled 18,631 thousand barrels of crude oil and 328,844 thousand MMBTUs of natural gas as of December 31, 2023.
(2)The notional amount of the credit contracts reflects the Company’s pro-rata share of the underlying derivative instruments in RPAs.
(3)The Company held warrant equity contracts in 11 private companies and one public company as of both March 31, 2024 and December 31, 2023.
(4)Equity contracts classified as derivative liabilities consist of 349,138 performance-based RSUs granted as part of EWBC’s consideration in its investment in Rayliant.
Derivatives Designated as Hedging Instruments
Interest Rate Swaps on Certificates of Deposit Cash Flow Hedges— The Company is exposeduses interest rate swaps to changeshedge the variability in the fair value ofinterest amount received on certain fixed rate certificates of depositfloating-rate commercial loans, or paid on certain floating-rate borrowings due to changes in the benchmarkcontractually specified interest rates. As of March 31, 2024, interest rate London Interbank Offered Rate. Interest rate swaps designated as fair value hedges involve the receipt of fixed rate amounts from a counterpartycontracts in exchange for the Company making variable rate payments over the life of the agreements without the exchange of the underlying notional amount.
As of September 30, 2017 and December 31, 2016, the total notional amounts of $5.3 billion were designated as cash flow hedges to convert certain variable-rate loans from floating-rate payments to fixed-rate payments. Gains and losses on the hedging derivative instruments are recognized in AOCI and reclassified to earnings in the same period the hedged cash flows impact earnings and within the same income statement line item as the hedged cash flows. Considering the interest rate swaps on certificates of deposit were $42.6 millionrates, yield curve and $48.4 million, respectively. The fair value liabilities of the interest rate swaps were $6.6 million and $6.0 millionnotional amount as of September 30, 2017 and DecemberMarch 31, 2016, respectively.2024, the Company expects to reclassify an estimated $50 million of after-tax net losses on derivative instruments designated as cash flow hedges from AOCI into earnings during the next 12 months.
The following table presents the net gains (losses) recognized on the Consolidated Statements of Income related to the derivatives designated as fair valuepre-tax changes in AOCI from cash flow hedges for the three and nine months ended September 30, 2017March 31, 2024 and 2016:2023. The after-tax impact of cash flow hedges on AOCI is shown in Note 14 — Accumulated Other Comprehensive Income (Loss) to the Consolidated Financial Statements in this Form-10-Q.
| | | | | | | | | | | | | | | | | | | | |
|
| | Three Months Ended March 31, | | |
| ($ in thousands) | | 2024 | | 2023 | | | | |
| (Losses) gains recognized in AOCI: | | | | | | | | |
| Interest rate contracts | | $ | (90,376) | | | $ | 29,843 | | | | | |
| | | | | | | | |
| | | | | | | | |
| (Losses) gains reclassified from AOCI into earnings: | | | | | | | | |
| Interest expense (for cash flow hedges on borrowings) | | $ | — | | | $ | 696 | | | | | |
| Interest and dividend income (for cash flow hedges on loans) | | (24,605) | | | (12,954) | | | | | |
| Noninterest income | | — | | | 1,614 | | (1) | | | |
| Total | | $ | (24,605) | | | $ | (10,644) | | | | | |
|
|
| | | | | | | | | | | | | | | | |
| |
| ($ in thousands) | | Three Months Ended
September 30, | | Nine Months Ended
September 30, |
| | 2017 | | 2016 | | 2017 | | 2016 |
| Gains (losses) recorded in interest expense: | | | | | | | | |
| Recognized on interest rate swaps | | $ | 37 |
| | $ | (1,327 | ) | | $ | (1,486 | ) | | $ | 3,044 |
|
| Recognized on certificates of deposit | | $ | (116 | ) | | $ | 674 |
| | $ | 1,236 |
| | $ | (2,688 | ) |
| |
Net Investment Hedges — ASC 830-20, Foreign Currency Matters — Foreign Currency Transactions and ASC 815, Derivatives and Hedging, allow hedging of the foreign currency risk of a net investment in a foreign operation. During the fourth quarter of 2015, theThe Company began enteringenters into foreign currency forward contracts to hedge itsa portion of the Bank’s investment in East West Bank (China) Limited, a non-USD functional currency subsidiary in China. The hedging instruments designated as net investment hedges involve hedging the risk of changes in the USD equivalent value of a designated monetary amount of the Company’s net investment in China,were used to hedge against the risk of adverse changes in the foreign currency exchange rate. The Company recorded the changes in the carrying amount of its China subsidiary in the Foreign currency translation adjustment account within AOCI. Simultaneously, the effective portionrate of the hedge of this exposure was also recorded in the Foreign currency translation adjustment account and the ineffective portion, if any, was recorded in current earnings. During the first quarter of 2017, the Company discontinued hedge accounting prospectively.Chinese Renminbi (“RMB”). The cumulative effective portion of the net investment hedges recorded through the point of dedesignation remainedhedge in the Foreign currency translation adjustment account within AOCI, and will be reclassified into earnings only upon the sale or liquidation of the China subsidiary. The Company continues to economically hedge its foreign currency exposure in its China subsidiary through foreign exchange forward contracts, which were includedplace as part of the Derivatives Not Designated as Hedging Instruments — “Foreign Exchange Contracts” caption as of September 30, 2017.
As of September 30, 2017, there were no derivative contracts designated as net investment hedges. As of December 31, 2016,2023 expired during the total notional amount and fair value of the foreign currency forward contracts designated as net investment hedges were $83.0 million and a $4.3 million asset, respectively.three months ended March 31, 2024. The following table presents the pre-tax gains (losses) recordedor losses recognized in the Foreign currency translation adjustment account within AOCI related to the effective portion of theon net investment hedges and the ineffective portion recorded on the Consolidated Statements of Income for the three and nine months ended September 30, 2017March 31, 2024 and 2016:2023:
| | | | | | | | | | | | | | | | | | |
|
| | Three Months Ended March 31, | | |
| ($ in thousands) | | 2024 | | 2023 | | | | |
| Gains (losses) recognized in AOCI | | $ | 586 | | | $ | (1,076) | | | | | |
| | | | | | | | |
|
|
| | | | | | | | | | | | | | | | |
| |
| ($ in thousands) | | Three Months Ended
September 30, | | Nine Months Ended
September 30, |
| | 2017 | | 2016 | | 2017 | | 2016 |
| Gains (losses) recognized in AOCI on net investment hedges (effective portion) | | $ | — |
| | $ | 69 |
| | $ | (648 | ) | | $ | 296 |
|
| Losses recognized in foreign exchange income (ineffective portion) | | $ | — |
| | $ | (236 | ) | | $ | (1,953 | ) | | $ | (667 | ) |
| |
Derivatives Not Designated as Hedging Instruments
Interest Rate SwapsCustomer-Related Positions and OptionsEconomic Hedge Derivatives —The Company enters into interest rate, commodity, and foreign exchange derivatives including interest rate swaps and options withat the request of its customers to allow them to hedge against the risk of rising interest rates on their variable rate loans. To economically hedge against the interest rate risks in the products offered to its customers, the Companyand generally enters into mirrored interest rateoffsetting derivative contracts with institutional counterparties. As of September 30, 2017,third-party financial institutions to mitigate the total notional amounts of interest rate swaps and options, including mirrored transactions with institutional counterparties and the Company’s customers, totaled $4.37 billion for derivatives that were in an asset valuation position and $4.37 billion for derivatives that were in a liability valuation position. As of December 31, 2016, the total notional amounts of interest rate swaps and options, including mirrored transactions with institutional counterparties and the Company’s customers, totaled $3.86 billion for derivatives that were in an asset valuation position and $3.81 billion for derivatives that were in a liability valuation position. The fair value of interest rate swap and option contracts with institutional counterparties and the Company’s customers amounted to a $64.8 million asset and a $64.2 million liability as of September 30, 2017. The fair value of interest rate swap and option contracts with institutional counterparties and the Company’s customers amounted to a $67.6 million asset and a $65.1 million liability as of December 31, 2016.
Foreign Exchange Contracts —inherent market risk. The Company enters intoalso utilizes foreign exchange contracts with its customers, primarily comprisedto mitigate the effect of forward, swap and spot contracts to enable its customers to hedge their transactions in foreign currencies against fluctuations in foreign exchange rates, and also to allow the Company to economically hedge against foreign currency fluctuations inon certain foreign currency-denominated on-balance sheet assets and liabilities, primarily foreign currency denominated deposits that it offers to its customers, as well as the Company’s investment in its China subsidiary, East West Bank (China) Limited. For acustomers. A majority of the foreign exchange transactions entered with its customers, the Company enters into offsetting foreign exchange contracts with institutional counterparties to mitigate the foreign exchange risk. A majority of these contracts havehad original maturities of one year or less. Asless as of September 30, 2017both March 31, 2024 and December 31, 2016,2023.
The following table presents the total notional amounts ofand the foreign exchange contracts were $1.13 billion and $767.8 million, respectively. Thegross fair values of the interest rate and foreign exchange contracts recorded were a $14.2 million assetderivatives entered into with customers and a $20.1 million liabilitywith third-party financial institutions as economic hedges to customers’ positions as of September 30, 2017. March 31, 2024 and December 31, 2023:
| | | | | | | | | | | | | | | | | | | | | | | | | | | | | | | | | | | | | | | | | | |
| | | | |
| | March 31, 2024 | | December 31, 2023 | | | | |
| | | | Fair Value | | | | Fair Value | | | | |
| ($ in thousands) | | Notional Amount | | Assets | | Liabilities | | Notional Amount | | Assets | | Liabilities | | | | |
| Customer-related positions: | | | | | | | | | | | | | | | | |
| Interest rate contracts: | | | | | | | | | | | | | | | | |
| Swaps | | $ | 6,874,132 | | | $ | 9,521 | | | $ | 442,960 | | | $ | 6,835,822 | | | $ | 25,649 | | | $ | 377,388 | | | | | |
| Written options | | 1,287,121 | | | — | | | 11,909 | | | 1,522,531 | | | — | | | 12,756 | | | | | |
| Collars and corridors | | 281,117 | | | 130 | | | 3,371 | | | 322,732 | | | 440 | | | 4,481 | | | | | |
| Subtotal | | 8,442,370 | | | 9,651 | | | 458,240 | | | 8,681,085 | | | 26,089 | | | 394,625 | | | | | |
| Foreign exchange contracts: | | | | | | | | | | | | | | | | |
| Forwards and spot | | 643,298 | | | 4,124 | | | 7,548 | | | 956,618 | | | 9,466 | | | 6,756 | | | | | |
| Swaps | | 1,577,082 | | | 19,020 | | | 24,839 | | | 1,588,491 | | | 5,801 | | | 18,118 | | | | | |
| Purchased options | | 129,000 | | | 2,580 | | | — | | | 136,000 | | | 1,839 | | | — | | | | | |
| Subtotal | | 2,349,380 | | | 25,724 | | | 32,387 | | | 2,681,109 | | | 17,106 | | | 24,874 | | | | | |
| Total | | $ | 10,791,750 | | | $ | 35,375 | | | $ | 490,627 | | | $ | 11,362,194 | | | $ | 43,195 | | | $ | 419,499 | | | | | |
| Economic hedges: | | | | | | | | | | | | | | | | |
| Interest rate contracts: | | | | | | | | | | | | | | | | |
| Swaps | | $ | 6,899,692 | | | $ | 444,094 | | | $ | 10,337 | | | $ | 6,861,561 | | | $ | 380,123 | | | $ | 25,731 | | | | | |
| Purchased options | | 1,287,283 | | | 11,962 | | | — | | | 1,522,531 | | | 12,783 | | | — | | | | | |
| | | | | | | | | | | | | | | | |
| Collars and corridors | | 281,117 | | | 3,380 | | | 137 | | | 322,732 | | | 4,491 | | | 456 | | | | | |
| Subtotal | | 8,468,092 | | | 459,436 | | | 10,474 | | | 8,706,824 | | | 397,397 | | | 26,187 | | | | | |
| Foreign exchange contracts: | | | | | | | | | | | | | | | | |
| Forwards and spot | | 33,003 | | | 42 | | | 18 | | | 148,003 | | | 292 | | | 94 | | | | | |
| Swaps | | 2,387,046 | | | 34,733 | | | 18,168 | | | 2,862,037 | | | 36,280 | | | 15,757 | | | | | |
| Written options | | 129,000 | | | — | | | 2,580 | | | 136,000 | | | — | | | 1,839 | | | | | |
| Subtotal | | 2,549,049 | | | 34,775 | | | 20,766 | | | 3,146,040 | | | 36,572 | | | 17,690 | | | | | |
| Total | | $ | 11,017,141 | | | $ | 494,211 | | | $ | 31,240 | | | $ | 11,852,864 | | | $ | 433,969 | | | $ | 43,877 | | | | | |
| | | | |
The Company enters into energy commodity contracts with its customers in the oil and gas sector, which allow them to hedge against the risk of fluctuation in energy commodity prices. Offsetting contracts entered with third-party financial institutions are used as economic hedges to manage the Company’s exposure on its customer-related positions. The following table presents the notional amounts in units and the gross fair values of the foreign exchange contracts recorded were an $11.9 million assetcommodity derivatives issued for customer-related positions and an $11.2 million liabilityeconomic hedges as of March 31, 2024 and December 31, 2016.2023:
| | | | | | | | | | | | | | | | | | | | | | | | | | | | | | | | | | | | | | | | | | | | | | | | | | | | | | |
| | | | |
| | March 31, 2024 | | December 31, 2023 | | | | |
| | | | | | Fair Value | | | | | | Fair Value | | | | |
| ($ and unit in thousands) | | Notional Units | | Assets | | Liabilities | | Notional Units | | Assets | | Liabilities | | | | |
| Customer-related positions: | | | | | | | | | | | | | | | | | | | | |
| Commodity contracts: | | | | | | | | | | | | | | | | | | | | |
| Crude oil: | | | | | | | | | | | | | | | | | | | | |
| Swaps | | 3,608 | | | Barrels | | $ | 15,370 | | | $ | 685 | | | 3,277 | | | Barrels | | $ | 3,735 | | | $ | 15,445 | | | | | |
| Collars | | 5,576 | | | Barrels | | 11,901 | | | 115 | | | 5,966 | | | Barrels | | 1,820 | | | 5,103 | | | | | |
| | | | | | | | | | | | | | | | | | | | |
| Subtotal | | 9,184 | | | Barrels | | 27,271 | | | 800 | | | 9,243 | | | Barrels | | 5,555 | | | 20,548 | | | | | |
| Natural gas: | | | | | | | | | | | | | | | | | | | | |
| Swaps | | 127,102 | | | MMBTUs | | 1,420 | | | 70,028 | | | 118,325 | | | MMBTUs | | 438 | | | 73,793 | | | | | |
| Collars | | 47,953 | | | MMBTUs | | 672 | | | 17,107 | | | 45,854 | | | MMBTUs | | 21 | | | 20,400 | | | | | |
| Written options | | 1,976 | | | MMBTUs | | 132 | | | 33 | | | 1,874 | | | MMBTUs | | — | | | 233 | | | | | |
| Subtotal | | 177,031 | | | MMBTUs | | 2,224 | | | 87,168 | | | 166,053 | | | MMBTUs | | 459 | | | 94,426 | | | | | |
| Total | | | | | | $ | 29,495 | | | $ | 87,968 | | | | | | | $ | 6,014 | | | $ | 114,974 | | | | | |
| Economic hedges: | | | | | | | | | | | | | | | | | | | | |
| Commodity contracts: | | | | | | | | | | | | | | | | | | | | |
| Crude oil: | | | | | | | | | | | | | | | | | | | | |
| Swaps | | 3,708 | | | Barrels | | $ | 1,788 | | | $ | 12,997 | | | 3,422 | | | Barrels | | $ | 9,166 | | | $ | 4,924 | | | | | |
| Collars | | 5,576 | | | Barrels | | 1 | | | 4,902 | | | 5,966 | | | Barrels | | 1,685 | | | 1,467 | | | | | |
| | | | | | | | | | | | | | | | | | | | |
| Subtotal | | 9,284 | | | Barrels | | 1,789 | | | 17,899 | | | 9,388 | | | Barrels | | 10,851 | | | 6,391 | | | | | |
| Natural gas: | | | | | | | | | | | | | | | | | | | | |
| Swaps | | 124,582 | | | MMBTUs | | 37,170 | | | 629 | | | 116,463 | | | MMBTUs | | 49,941 | | | 305 | | | | | |
| Collars | | 47,353 | | | MMBTUs | | 8,120 | | | 318 | | | 44,454 | | | MMBTUs | | 12,565 | | | — | | | | | |
| Purchased options | | 1,976 | | | MMBTUs | | 41 | | | 116 | | | 1,874 | | | MMBTUs | | 233 | | | — | | | | | |
| Subtotal | | 173,911 | | | MMBTUs | | 45,331 | | | 1,063 | | | 162,791 | | | MMBTUs | | 62,739 | | | 305 | | | | | |
| Total | | | | | | $ | 47,120 | | | $ | 18,962 | | | | | | | $ | 73,590 | | | $ | 6,696 | | | | | |
| | | | |
Credit Risk Participation AgreementsContracts — The Company has enteredperiodically enters into credit RPAs under whichwith institutional counterparties to manage the Company assumed its pro-rata sharecredit exposure of the interest rate contracts associated with syndication loans. Under the RPAs, a portion of the credit exposure associated withis transferred from one party (the purchaser of credit protection) to another party (the seller of credit protection). The seller of credit protection is required to make payments to the borrower’s performancepurchaser of credit protection if the underlying borrower defaults on the related to interest rate derivative contracts. contract. The Company may enter into protection sold or may not be a party to the interest rate derivative contract and enters into such RPAs in instances where the Company is a party to the related loan participation agreement with the borrower. The Company will make or receive payments under the RPAs if the borrower defaults on its obligation to perform under the interest rate derivative contract. The Company manages its creditprotection purchased RPAs.Credit risk on the RPAs is managed by monitoring the credit worthiness of the borrowers and the institutional counterparties, which is based ona part of the Company’s normal credit review and monitoring process. The notional amountAll referenced entities of the protection sold RPAs reflectwere investment grade and the Company’s pro-rata shareweighted-average remaining maturity was 2.6 years and 2.8 years as of the derivative instrument. As of September 30, 2017, the notional amountMarch 31, 2024 and fair value of the RPAs purchased were $47.8 million and a $1 thousand liability, respectively. As of September 30, 2017, the notional amount and fair value of the RPAs sold were $20.6 million and a $2 thousand asset, respectively. As of December 31, 2016, the notional amount and fair value of the RPAs purchased were $48.3 million and a $3 thousand liability, respectively. As of December 31, 2016, the notional amount and fair value of the RPAs sold were $23.1 million and a $3 thousand asset,2023, respectively. Assuming allthe underlying borrowers referenced in the interest rate derivative contracts defaulted, the maximum exposure in the protection sold RPAs would be $82 thousand and $177 thousand as of September 30, 2017March 31, 2024 and December 31, 2016, the exposures from the RPAs purchased would be $92 thousand and $179 thousand,2023, respectively.
As of September 30, 2017both March 31, 2024 and December 31, 2016,2023, the weighted average remaining maturitiesCompany had one outstanding protection purchased RPA with notional amount of the outstanding RPAs were 3.0 years$25 million and 3.7 years, respectively.minimal fair value.
Equity Contracts — The Company obtained warrants to purchase preferred and common stock of technology and life sciences companies, as As part of the loan origination process. As of September 30, 2017,process, the Company held fourmay obtain warrants in public companies and 32 warrants in private companies. The fair valuesto purchase the preferred and/or common stock of the warrants for publicborrowers’ companies, which are mainly in the technology and private companies were an $856 thousand assetlife sciences sectors. Warrants grant the Company the right to buy a certain class of the underlying company’s equity at a certain price before expiration. In connection with the Company’s investment in Rayliant during the third quarter of 2023, the Company granted performance-based RSUs as part of its consideration. The vesting of these equity contracts is contingent on Rayliant meeting certain financial performance targets during the future performance period. For additional information on these equity contracts, refer to Note 3— Fair Value Measurement and a $599 thousand asset, respectively, totaling $1.5 million asFair Value of September 30, 2017.Financial Instruments to the Consolidated Financial Statements in this Form 10-Q.
The following table presents the net gains (losses) recognized on the Company’s Consolidated StatementsStatement of Income related to derivatives not designated as hedging instruments for the three and nine months ended September 30, 2017March 31, 2024 and 2016:2023:
| | | | | | | | | | | | | | | | | | | | | | | | |
|
| | | | Three Months Ended March 31, | | |
| ($ in thousands) | | Classification on Consolidated Statement of Income | | 2024 | | 2023 | | | | |
| Derivatives not designated as hedging instruments: | | | | | | | | | | |
| Interest rate contracts | | Customer derivative income | | $ | 484 | | | $ | (2,484) | | | | | |
| Foreign exchange contracts | | Foreign exchange income | | 12,780 | | | 10,442 | | | | | |
| Credit contracts | | Customer derivative income | | (5) | | | (5) | | | | | |
| Equity contracts - warrants | | Lending fees | | (6) | | | (45) | | | | | |
| | | | | | | | | | |
| Commodity contracts | | Customer derivative income | | 134 | | | 6 | | | | | |
| Net gains | | | | $ | 13,387 | | | $ | 7,914 | | | | | |
|
|
| | | | | | | | | | | | | | | | | | |
| |
| ($ in thousands) | | Location in Consolidated Statements of Income | | Three Months Ended
September 30, | | Nine Months Ended
September 30, |
| | | 2017 | | 2016 | | 2017 | | 2016 |
| Derivatives not designated as hedging instruments: | | | | | | | | | | |
| Interest rate swaps and options | | Derivative fees and other income | | $ | (94 | ) | | $ | 411 |
| | $ | (1,838 | ) | | $ | (2,220 | ) |
| Foreign exchange contracts | | Foreign exchange income | | 3,720 |
| | 3,787 |
| | 17,936 |
| | 10,982 |
|
| RPAs | | Derivative fees and other income | | — |
| | 4 |
| | 1 |
| | (7 | ) |
| Warrants | | Ancillary loan fees and other income | | 669 |
| | — |
| | 1,455 |
| | — |
|
| Net gains | | | | $ | 4,295 |
| | $ | 4,202 |
| | $ | 17,554 |
| | $ | 8,755 |
|
| |
Credit-Risk-Related Contingent Features— Certain of the Company’s over-the-counter derivative contracts of the Company contain early termination provisions that may require the Company to settle any outstanding balances upon the occurrence of a specified credit-risk-related event. These events, which are defined by the existing derivative contracts,Such an event primarily relaterelates to a downgrade inof the credit rating of East West Bank to below investment grade.grade. As of March 31, 2024, the aggregate fair value amounts of all derivative instruments with credit risk-related contingent features that were in a net liability position totaled $2 million, for which $2 million collateral was posted to cover these positions. In comparison, as of December 31, 2023, the aggregate fair value amounts of all derivative instruments with credit risk-related contingent features that were in a net liability position totaled $9 thousand, for which no collateral was posted to cover these positions. In the event that the credit rating of East West Bank’s credit rating isBank had been downgraded to below investment grade, nothe Company would have been required to post minimal additional collateral would be required to be posted, since the liabilities related to such contracts were fully collateralized as of September 30, 2017both March 31, 2024 and December 31, 2016.2023.
Offsetting of Derivatives
The Company has entered into agreements with certain counterparty financial institutions, which include master netting agreements. However, the Company has elected to account for all derivatives with counterparty institutions on a gross basis. The following tables present the gross derivativesderivative fair values, the balance sheet netting adjustments, and the resulting net fair values recorded on the Consolidated Balance SheetsSheet, as well as the cash and noncash collateral associated with master netting arrangements. The gross amounts of derivative assets and liabilities are presented after the respective collateral received or pledged inapplication of variation margin payments as settlements to the formfair values of other financial instruments, which are generally marketable securities and/or cash.contracts cleared through central clearing organizations, where applicable. The collateral amounts in thesethe following tables are limited to the outstanding balances of the related asset or liability (after netting is applied); thusliability. Therefore, instances of overcollateralizationover-collateralization are not shown:
| | | | | | | | | | | | | | | | | | | | | | | | | | | | | | | | | | | | | | |
|
| ($ in thousands) | | As of March 31, 2024 |
| | | | | | | | | | |
| | Gross Amounts Recognized (1) | | Gross Amounts Offset on the Consolidated Balance Sheet | | Net Amounts Presented on the Consolidated Balance Sheet | | Gross Amounts Not Offset on the Consolidated Balance Sheet | | Net Amount |
| | | Master Netting Arrangements | | Cash Collateral Received (3) | | | Security Collateral Received (5) | |
| Derivative assets | | $ | 622,238 | | | $ | (132,555) | | | $ | (356,707) | | | $ | 132,976 | | | $ | (99,877) | | | $ | 33,099 | |
| | | | | | | | | | | | |
| | Gross Amounts Recognized (2) | | Gross Amounts Offset on the Consolidated Balance Sheet | | Net Amounts Presented on the Consolidated Balance Sheet | | Gross Amounts Not Offset on the Consolidated Balance Sheet | | Net Amount |
| | | Master Netting Arrangements | | Cash Collateral Pledged (4) | | | Security Collateral Pledged (5) | |
| Derivative liabilities | | $ | 693,548 | | | $ | (132,555) | | | $ | (2,408) | | | $ | 558,585 | | | $ | — | | | $ | 558,585 | |
|
|
| | | | | | | | | | | | | | | | | | | | | | | | | | | | | | | | |
| |
| | | As of September 30, 2017 |
| ($ in thousands) | | Total | | Contracts Not Subject to Master Netting Arrangements | | Contracts Subject to Master Netting Arrangements |
| | | Gross Amounts Recognized | | Gross Amounts Recognized | | Gross Amounts Recognized | | Gross Amounts
Offset on the
Consolidated
Balance Sheets | | Net Amounts
Presented
on the
Consolidated
Balance Sheets | | Gross Amounts Not Offset on the
Consolidated Balance Sheets | | |
| | | | | | | | Derivative Amount | | Collateral
Received | | Net Amount |
| Derivatives Assets | | $ | 80,466 |
| | $ | 57,720 |
| | $ | 22,746 |
| | $ | — |
| | $ | 22,746 |
| | $ | (20,240 | ) | (1) | $ | (2,230 | ) | (2) | $ | 276 |
|
| | | | | | | | | | | | | | | | | |
| | | Gross Amounts Recognized | | Gross Amounts Recognized | | Gross Amounts Recognized | | Gross Amounts
Offset on the
Consolidated
Balance Sheets | | Net Amounts
Presented
on the
Consolidated
Balance Sheets | | Gross Amounts Not Offset on the
Consolidated Balance Sheets | | |
| | | | | | | | Derivative Amount | | Collateral
Posted | | Net Amount |
| Derivatives Liabilities | | $ | 90,915 |
| | $ | 17,814 |
| | $ | 73,101 |
| | $ | — |
| | $ | 73,101 |
| | $ | (20,240 | ) | (1) | $ | (52,851 | ) | (3) | $ | 10 |
|
| |
| | | | | | | | | | | | | | | | | | | | | | | | | | | | | | | | | | | | | | |
|
| ($ in thousands) | | As of December 31, 2023 |
| | | | | | | | | | |
| | Gross Amounts Recognized (1) | | Gross Amounts Offset on the Consolidated Balance Sheet | | Net Amounts Presented on the Consolidated Balance Sheet | | Gross Amounts Not Offset on the Consolidated Balance Sheet | | Net Amount |
| | | Master Netting Arrangements | | Cash Collateral Received (3) | | | Security Collateral Received (5) | |
| Derivative assets | | $ | 610,920 | | | $ | (75,534) | | | $ | (237,258) | | | $ | 298,128 | | | $ | (246,259) | | | $ | 51,869 | |
| | | | | | | | | | | | |
| | Gross Amounts Recognized (2) | | Gross Amounts Offset on the Consolidated Balance Sheet | | Net Amounts Presented on the Consolidated Balance Sheet | | Gross Amounts Not Offset on the Consolidated Balance Sheet | | Net Amount |
| | | Master Netting Arrangements | | Cash Collateral Pledged (4) | | | Security Collateral Pledged (5) | |
| Derivative liabilities | | $ | 613,314 | | | $ | (75,534) | | | $ | (636) | | | $ | 537,144 | | | $ | — | | | $ | 537,144 | |
|
(1)Includes $2 million and $3 million of gross fair value assets with counterparties that were not subject to enforceable master netting arrangements or similar agreements as of March 31, 2024 and December 31, 2023, respectively. |
| | | | | | | | | | | | | | | | | | | | | | | | | | | | | | | | |
| |
| | | As of December 31, 2016 |
| ($ in thousands) | | Total | | Contracts Not Subject to Master Netting Arrangements | | Contracts Subject to Master Netting Arrangements |
| | | Gross Amounts Recognized | | Gross Amounts Recognized | | Gross Amounts Recognized | | Gross Amounts Offset on the Consolidated Balance Sheets | | Net Amounts
Presented
on the
Consolidated
Balance Sheets | | Gross Amounts Not Offset on the
Consolidated Balance Sheets | | |
| | | | | | | | Derivative
Amounts | | Collateral
Received | | Net Amount |
| Derivatives Assets | | $ | 83,780 |
| | $ | 51,218 |
| | $ | 32,562 |
| | $ | — |
| | $ | 32,562 |
| | $ | (20,991 | ) | (1) | $ | (10,687 | ) | (2) | $ | 884 |
|
| | | | | | | | | | | | | | | | | |
| | | Gross Amounts Recognized | | Gross Amounts Recognized | | Gross Amounts Recognized | | Gross Amounts Offset on the Consolidated Balance Sheets | | Net Amounts
Presented
on the
Consolidated
Balance Sheets | | Gross Amounts Not Offset on the
Consolidated Balance Sheets | | |
| | | | | | | | Derivative
Amounts | | Collateral
Posted | | Net Amount |
| Derivatives Liabilities | | $ | 82,323 |
| | $ | 24,097 |
| | $ | 58,226 |
| | $ | — |
| | $ | 58,226 |
| | $ | (20,991 | ) | (1) | $ | (36,349 | ) | (3) | $ | 886 |
|
| |
| |
(1) | Represents the netting of derivative receivable and payable balances for the same counterparty under enforceable master netting arrangements if the Company has elected to net. |
| |
(2) | Represents cash and securities received against derivative assets with the same counterparty that are subject to enforceable master netting arrangements. No cash collateral was received as of September 30, 2017. Includes $8.1 million of cash collateral received as of December 31, 2016. |
| |
(3) | Represents cash and securities pledged against derivative liabilities with the same counterparty that are subject to enforceable master netting arrangements. Includes $18.0 million and $170 thousand of cash collateral posted as of September 30, 2017 and December 31, 2016, respectively. |
(2)Includes $17 million and $16 million of gross fair value liabilities with counterparties that were not subject to enforceable master netting arrangements or similar agreements as of March 31, 2024 and December 31, 2023, respectively.
(3)Gross cash collateral received under master netting arrangements or similar agreements was $362 million and $244 million as of March 31, 2024 and December 31, 2023, respectively. Of the gross cash collateral received, $357 million and $237 million were used to offset derivative assets as of March 31, 2024 and December 31, 2023, respectively.
(4)Gross cash collateral pledged under master netting arrangements or similar agreements was $3 million and $1 million as of March 31, 2024 and December 31, 2023, respectively. Of the gross cash collateral pledged, $2 million and $1 millionwere used to offset derivative liabilities as of March 31, 2024 and December 31, 2023, respectively.
(5)Represents the fair value of security collateral received or pledged limited to derivative assets or liabilities that are subject to enforceable master netting arrangements or similar agreements. U.S. GAAP does not permit the netting of noncash collateral on the Consolidated Balance Sheet but requires the disclosure of such amounts.
In addition to the amounts included in the tables above, the Company also has balance sheet netting related to resale and repurchase agreements, referagreements. Refer to Note 54 — Securities Purchased under Resale Agreements and Sold under Repurchase Agreements to the Consolidated Financial Statements in this Form 10-Q for additional information. Refer toNote 4 3— Fair Value Measurement and Fair Value of Financial Instruments to the Consolidated Financial Statements in this Form 10-Q for fair value measurement disclosures on derivatives.
Note 87 — Loans Receivable and Allowance for Credit Losses
The Company’s held-for-investment loan portfolio includes originated and purchased loans. Originated and purchased loans with no evidence of credit deterioration at their acquisition date are referred to collectively as non-PCI loans. PCI loans are loans acquired with evidence of credit deterioration since their origination and it is probable at the acquisition date that the Company would be unable to collect all contractually required payments. PCI loans are accounted for under ASC Subtopic 310-30, Loans and Debt Securities Acquired with Deteriorated Credit Quality. The Company has elected to account for PCI loans on a pool level basis under ASC 310-30 at the time of acquisition.
The following table presents the composition of the Company’s non-PCI and PCI loans held-for-investment outstanding as of September 30, 2017March 31, 2024 and December 31, 2016:2023:
| | | | | | | | | | | | | | |
|
| ($ in thousands) | | March 31, 2024 | | December 31, 2023 |
| Commercial: | | | | |
| C&I | | $ | 16,350,191 | | | $ | 16,581,079 | |
| CRE: | | | | |
| CRE | | 14,609,655 | | | 14,777,081 | |
| Multifamily residential | | 5,010,245 | | | 5,023,163 | |
| Construction and land | | 673,939 | | | 663,868 | |
| Total CRE | | 20,293,839 | | | 20,464,112 | |
| Total commercial | | 36,644,030 | | | 37,045,191 | |
| Consumer: | | | | |
| Residential mortgage: | | | | |
| Single-family residential | | 13,563,738 | | | 13,383,060 | |
| HELOCs | | 1,731,233 | | | 1,722,204 | |
| Total residential mortgage | | 15,294,971 | | | 15,105,264 | |
| Other consumer | | 53,503 | | | 60,327 | |
| Total consumer | | 15,348,474 | | | 15,165,591 | |
Total loans held-for-investment (1) | | $ | 51,992,504 | | | $ | 52,210,782 | |
| Allowance for loan losses | | (670,280) | | | (668,743) | |
Loans held-for-investment, net (1) | | $ | 51,322,224 | | | $ | 51,542,039 | |
|
|
| | | | | | | | | | | | | | | | | | | | | | | | |
| |
| ($ in thousands) | | September 30, 2017 | | December 31, 2016 |
| | Non-PCI Loans (1) | | PCI Loans (2) | | Total (1)(2) | | Non-PCI Loans (1) | | PCI Loans (2) | | Total (1)(2) |
| CRE: | | | | | | | | | | | | |
| Income producing | | $ | 8,530,519 |
| | $ | 313,257 |
| | $ | 8,843,776 |
| | $ | 7,667,661 |
| | $ | 348,448 |
| | $ | 8,016,109 |
|
| Construction | | 572,027 |
| | — |
| | 572,027 |
| | 551,560 |
| | — |
| | 551,560 |
|
| Land | | 111,006 |
| | 371 |
| | 111,377 |
| | 121,276 |
| | 1,918 |
| | 123,194 |
|
| Total CRE | | 9,213,552 |
| | 313,628 |
| | 9,527,180 |
| | 8,340,497 |
| | 350,366 |
| | 8,690,863 |
|
| C&I: | | | | | | | | | | | | |
| Commercial business | | 9,763,688 |
| | 12,566 |
| | 9,776,254 |
| | 8,921,246 |
| | 38,387 |
| | 8,959,633 |
|
| Trade finance | | 868,902 |
| | — |
| | 868,902 |
| | 680,930 |
| | — |
| | 680,930 |
|
| Total C&I | | 10,632,590 |
| | 12,566 |
| | 10,645,156 |
| | 9,602,176 |
| | 38,387 |
| | 9,640,563 |
|
| Residential: | | | | | | | | | | | | |
| Single-family | | 4,234,017 |
| | 121,992 |
| | 4,356,009 |
| | 3,370,669 |
| | 139,110 |
| | 3,509,779 |
|
| Multifamily | | 1,808,311 |
| | 68,645 |
| | 1,876,956 |
| | 1,490,285 |
| | 95,654 |
| | 1,585,939 |
|
| Total residential | | 6,042,328 |
| | 190,637 |
| | 6,232,965 |
| | 4,860,954 |
| | 234,764 |
| | 5,095,718 |
|
| Consumer | | 2,104,614 |
| | 15,442 |
| | 2,120,056 |
| | 2,057,067 |
| | 18,928 |
| | 2,075,995 |
|
| Total loans held-for-investment | | $ | 27,993,084 |
| | $ | 532,273 |
| | $ | 28,525,357 |
| | $ | 24,860,694 |
| | $ | 642,445 |
| | $ | 25,503,139 |
|
| Allowance for loan losses | | (285,858 | ) | | (68 | ) | | (285,926 | ) | | (260,402 | ) | | (118 | ) | | (260,520 | ) |
| Loans held-for-investment, net | | $ | 27,707,226 |
| | $ | 532,205 |
| | $ | 28,239,431 |
| | $ | 24,600,292 |
| | $ | 642,327 |
| | $ | 25,242,619 |
|
| |
| |
(1) | Includes $(29.2)(1)Includes $63 million and $1.2 million as of September 30, 2017 and December 31, 2016, respectively, of net deferred loan fees, unearned income, unamortized premiums and unaccreted discounts. |
| |
(2) | Loans net of ASC 310-30 discount. |
CRE loans include income producing real estate, construction and land loans where the interest rates may be fixed, variable or hybrid. Included in CRE loans are owner occupied$71 million of net deferred loan fees and non-owner occupied loans where the borrowers rely on income from tenants to service the loan. Commercial business and trade finance in the C&I segment provide financing to businesses in a wide spectrumnet unamortized premiums as of industries.
Residential loans are comprised of single-family and multifamily loans. The Company offers first lien mortgage loans secured by one-to-four unit residential properties located in its primary lending areas. The Company offers a variety of first lien mortgage loan programs, including fixed rate conforming loans and adjustable rate mortgage loans with initial fixed periods of one to seven years, which adjust annually thereafter.
Consumer loans are comprised of home equity lines of credit (“HELOCs”), insurance premium financing loans, credit card and auto loans. As of September 30, 2017March 31, 2024 and December 31, 2016, the Company’s HELOCs were the largest component2023, respectively.
Accrued interest receivable on loans held-for-investment was $268 million and $267 million as of the consumer loan portfolio, and were secured by one-to-four unit residential properties located in its primary lending areas. The HELOCs loan portfolio is largely comprised of loans originated through a reduced documentation loan program, where a substantial down payment is required, resulting in a low loan-to-value ratio, typically 60% or less at origination. The Company is in a first lien position for many of these reduced documentation HELOCs. These loans have historically experienced low delinquency and default rates.
All loans originated are subject to the Company’s underwriting guidelines and loan origination standards. Management believes that the Company’s underwriting criteria and procedures adequately consider the unique risks associated with these products. The Company conducts a variety of quality control procedures and periodic audits, including the review of lending and legal requirements to ensure that it is in compliance with these requirements.
As of September 30, 2017March 31, 2024 and December 31, 2016,2023, respectively, and was included in Other assets on the Consolidated Balance Sheet. The interest income reversed was insignificant for both the three months ended March 31, 2024 and 2023. For the Company’s accounting policy on accrued interest receivable related to loans held-for-investment, see Note 1 — Summary of Significant Accounting Policies — Significant Accounting Policies — Loans Held-for-Investment to the Consolidated Financial Statements of the Company’s 2023 Form 10-K. The Company also has loans held-for-sale. For the Company’s accounting policy on loans held-for-sale, refer to Note 1 — Summary of Significant Accounting Policies — Significant Accounting Policies — Loans Held-for-Sale to the Consolidated Financial Statements in the Company’s 2023 Form 10-K.
The Company’s FRBSF and FHLB borrowings are primarily secured by loans held-for-investment. Loans held-for-investment totaling $18.18$37.1 billion and $16.44$37.2 billion, respectively, were pledged to secure borrowings and to provide additional borrowing capacity from the Federal Reserve Bankas of March 31, 2024 and the FHLB.December 31, 2023.
Credit Quality Indicators
All loans are subject to the Company’s internal and external credit review and monitoring. Loansmonitoring process. For the commercial loan portfolio, loans are risk rated based on an analysis of the current state of the borrower’s credit quality. The analysis of credit quality includes a review of all repayment sources, the borrower’s current payment performance/performance or delinquency, currentrepayment sources, financial and liquidity statusfactors, including industry and all other relevant information.geographic considerations. For single-family residential loans,the consumer loan portfolio, payment performance/performance or delinquency is typically the driving indicator for the risk ratings. Risk ratings are the overall credit quality indicator for the Company and the credit quality indicator utilized for estimating the appropriate allowance for loan losses.
The Company utilizes internal credit risk ratings to assign each individual loan a risk rating system, which can be classified within the following categories:of 1 through 10:
•Pass — loans risk rated 1 through 5 are assigned an internal risk rating category of “Pass.” Loans risk rated 1 are typically loans fully secured by cash. Pass Watch, Special Mention, Substandard, Doubtful and Loss. The risk ratings reflect the relative strength of the repayment sources.
Pass and Watch loans are generally considered to have sufficient sources of repayment in order to repay the loan in full, in accordance with all terms and conditions.
•Special Mentionmention — loans are considered toassigned a risk rating of 6 have potential weaknesses that warrant closer attention by management. Special Mention is consideredmanagement; these are assigned an internal risk rating category of “Special Mention.”
•Substandard — loans assigned a transitory grade. If potential weaknesses are resolved, the loan is upgraded to a Passrisk rating of 7 or Watch grade. If negative trends in the borrower’s financial status or other information indicate that the repayment sources may become inadequate, the loan is downgraded to a Substandard grade. Substandard loans are considered to8 have well-defined weaknesses that may jeopardize the full and timely repayment of the loan. Substandardloan; these are assigned an internal risk rating category of “Substandard.”
•Doubtful — loans haveassigned a distinct possibilityrisk rating of loss, if the deficiencies are not corrected. Additionally, when management has assessed a potential for loss but a distinct possibility of loss is not recognizable, the loan is still classified as Substandard. Doubtful loans9 have insufficient sources of repayment and a high probability of loss. loss; these are assigned an internal risk rating category of “Doubtful.”
•Loss — loans assigned a risk rating of 10 are considered to be uncollectible and of such little value that they are no longer considered bankable assets. Theseassets; these are assigned an internal risk rating category of “Loss.”
Loan exposures categorized as criticized consist of special mention, substandard, doubtful and loss categories. The Company reviews the internal risk ratings are reviewed routinelyof its loan portfolio on a regular basis, and adjustedadjusts the ratings based on changes in the borrowers’ financial status and the loans’ collectability.collectability of the loans.
The following tables presentsummarize the creditCompany’s loans held-for-investment and year-to-date gross write-offs by loan portfolio segments, internal risk ratings for non-PCIand vintage year as of the periods presented. The vintage year is the year of loan origination, renewal or major modification. Revolving loans that are converted to term loans presented in the tables below are excluded from term loans by portfolio segment asvintage year columns.
| | | | | | | | | | | | | | | | | | | | | | | | | | | | | | | | | | | | | | | | | | | | | | | | | | | | | | | | | | |
| | |
| | March 31, 2024 | | |
| | | | | | | | | | | | | | | | | | | | |
| | | | | | | | | | | | | | | | | | | | |
| | Term Loans by Origination Year | | | | | | | | |
| | | | | | | | | | |
| ($ in thousands) | | 2024 | | 2023 | | 2022 | | 2021 | | 2020 | | Prior | | Revolving Loans | | Revolving Loans Converted to Term Loans (1) | | Total | | |
| Commercial: | | | | | | | | | | | | | | | | | | | | |
| C&I: | | | | | | | | | | | | | | | | | | | | |
| Pass | | $ | 494,511 | | | $ | 2,181,627 | | | $ | 1,390,042 | | | $ | 1,162,380 | | | $ | 290,790 | | | $ | 357,396 | | | $ | 9,858,874 | | | $ | 23,801 | | | $ | 15,759,421 | | | |
| Criticized (accrual) | | 15 | | | 80,137 | | | 146,122 | | | 126,563 | | | 8,378 | | | 61,936 | | | 118,657 | | | — | | | 541,808 | | | |
| Criticized (nonaccrual) | | — | | | 15,676 | | | 10,179 | | | 631 | | | 4,193 | | | 17,313 | | | 970 | | | — | | | 48,962 | | | |
| | | | | | | | | | | | | | | | | | | | |
| | | | | | | | | | | | | | | | | | | | |
| Total C&I | | 494,526 | | | 2,277,440 | | | 1,546,343 | | | 1,289,574 | | | 303,361 | | | 436,645 | | | 9,978,501 | | | 23,801 | | | 16,350,191 | | | |
| | | | | | | | | | | | | | | | | | | | |
Gross write-offs for the three months ended March 31, 2024 (2) | | — | | | 221 | | | 11,550 | | | 3,047 | | | 488 | | | 1,528 | | | (56) | | (3) | — | | | 16,778 | | | |
| | | | | | | | | | | | | | | | | | | | |
| CRE: | | | | | | | | | | | | | | | | | | | | |
| | | | | | | | | | | | | | | | | | | | |
| Pass | | 310,715 | | | 2,415,104 | | | 3,940,346 | | | 2,125,414 | | | 1,412,088 | | | 3,815,741 | | | 90,300 | | | 48,880 | | | 14,158,588 | | | |
| Criticized (accrual) | | — | | | 66,187 | | | 54,141 | | | 26,402 | | | 53,926 | | | 200,610 | | | — | | | 14,795 | | | 416,061 | | | |
| Criticized (nonaccrual) | | — | | | 1,750 | | | — | | | — | | | — | | | 33,256 | | | — | | | — | | | 35,006 | | | |
| | | | | | | | | | | | | | | | | | | | |
| | | | | | | | | | | | | | | | | | | | |
| Subtotal CRE | | 310,715 | | | 2,483,041 | | | 3,994,487 | | | 2,151,816 | | | 1,466,014 | | | 4,049,607 | | | 90,300 | | | 63,675 | | | 14,609,655 | | | |
| | | | | | | | | | | | | | | | | | | | |
| Gross write-offs for the three months ended March 31, 2024 | | — | | | — | | | — | | | — | | | — | | | 2,398 | | | — | | | — | | | 2,398 | | | |
| | | | | | | | | | | | | | | | | | | | |
| Multifamily residential: | | | | | | | | | | | | | | | | | | | | |
| Pass | | 43,746 | | | 652,947 | | | 1,482,963 | | | 794,023 | | | 645,391 | | | 1,329,341 | | | 6,831 | | | 1,275 | | | 4,956,517 | | | |
| Criticized (accrual) | | — | | | 13,939 | | | — | | | 31,882 | | | — | | | 3,261 | | | — | | | — | | | 49,082 | | | |
| Criticized (nonaccrual) | | — | | | — | | | — | | | — | | | — | | | 4,646 | | | — | | | — | | | 4,646 | | | |
| | | | | | | | | | | | | | | | | | | | |
| | | | | | | | | | | | | | | | | | | | |
| Subtotal multifamily residential | | 43,746 | | | 666,886 | | | 1,482,963 | | | 825,905 | | | 645,391 | | | 1,337,248 | | | 6,831 | | | 1,275 | | | 5,010,245 | | | |
| | | | | | | | | | | | | | | | | | | | |
| Gross write-offs for the three months ended March 31, 2024 | | — | | | — | | | — | | | — | | | — | | | 6 | | | — | | | — | | | 6 | | | |
| | | | | | | | | | | | | | | | | | | | |
| Construction and land: | | | | | | | | | | | | | | | | | | | | |
| Pass | | 2,980 | | | 266,224 | | | 234,093 | | | 124,830 | | | 1,603 | | | 6,290 | | | 8,795 | | | — | | | 644,815 | | | |
| Criticized (accrual) | | — | | | — | | | 16,888 | | | — | | | — | | | — | | | — | | | — | | | 16,888 | | | |
| Criticized (nonaccrual) | | — | | | — | | | 12,236 | | | — | | | — | | | — | | | — | | | — | | | 12,236 | | | |
| Subtotal construction and land | | 2,980 | | | 266,224 | | | 263,217 | | | 124,830 | | | 1,603 | | | 6,290 | | | 8,795 | | | — | | | 673,939 | | | |
| | | | | | | | | | | | | | | | | | | | |
| Gross write-offs for the three months ended March 31, 2024 | | — | | | — | | | 1,224 | | | — | | | — | | | — | | | — | | | — | | | 1,224 | | | |
| | | | | | | | | | | | | | | | | | | | |
| Total CRE | | 357,441 | | | 3,416,151 | | | 5,740,667 | | | 3,102,551 | | | 2,113,008 | | | 5,393,145 | | | 105,926 | | | 64,950 | | | 20,293,839 | | | |
| | | | | | | | | | | | | | | | | | | | |
| Total CRE gross write-offs for the three months ended March 31, 2024 | | — | | | — | | | 1,224 | | | — | | | — | | | 2,404 | | | — | | | — | | | 3,628 | | | |
| | | | | | | | | | | | | | | | | | | | |
| Total commercial | | $ | 851,967 | | | $ | 5,693,591 | | | $ | 7,287,010 | | | $ | 4,392,125 | | | $ | 2,416,369 | | | $ | 5,829,790 | | | $ | 10,084,427 | | | $ | 88,751 | | | $ | 36,644,030 | | | |
| | | | | | | | | | | | | | | | | | | | |
Total commercial gross write-offs for the three months ended March 31, 2024 (2) | | $ | — | | | $ | 221 | | | $ | 12,774 | | | $ | 3,047 | | | $ | 488 | | | $ | 3,932 | | | $ | (56) | | (3) | $ | — | | | $ | 20,406 | | | |
|
| | | | | | | | | | | | | | | | | | | | |
| | | | | | | | | | | | | | | | | | | | |
| | | | | | | | | | | | | | | | | | | | | | | | | | | | | | | | | | | | | | | | | | | | | | | | | | | | | | | | | | |
| | March 31, 2024 | | |
| | | | | | | | | | | | | | | | | | | | |
| | | | | | | | | | | | | | | | | | | | |
| | Term Loans by Origination Year | | | | | | | | |
| ($ in thousands) | | 2024 | | 2023 | | 2022 | | 2021 | | 2020 | | Prior | | Revolving Loans | | Revolving Loans Converted to Term Loans (1) | | Total | | |
| Consumer: | | | | | | | | | | | | | | | | | | | | |
| Residential mortgage: | | | | | | | | | | | | | | | | | | | | |
| Single-family residential: | | | | | | | | | | | | | | | | | | | | |
Pass (4) | | $ | 547,073 | | | $ | 3,077,628 | | | $ | 3,285,262 | | | $ | 2,236,107 | | | $ | 1,553,848 | | | $ | 2,814,348 | | | $ | — | | | $ | — | | | $ | 13,514,266 | | | |
| Criticized (accrual) | | — | | | 3,196 | | | — | | | 1,764 | | | 3,910 | | | 5,583 | | | — | | | — | | | 14,453 | | | |
Criticized (nonaccrual) (4) | | — | | | 7,860 | | | 5,874 | | | 3,389 | | | 3,718 | | | 14,178 | | | — | | | — | | | 35,019 | | | |
| Subtotal single-family residential mortgage | | 547,073 | | | 3,088,684 | | | 3,291,136 | | | 2,241,260 | | | 1,561,476 | | | 2,834,109 | | | — | | | — | | | 13,563,738 | | | |
| | | | | | | | | | | | | | | | | | | | |
| | | | | | | | | | | | | | | | | | | | |
| HELOCs: | | | | | | | | | | | | | | | | | | | | |
| Pass | | 4,798 | | | 3,655 | | | 3,394 | | | 2,817 | | | 5,107 | | | 9,288 | | | 1,561,308 | | | 123,131 | | | 1,713,498 | | | |
| Criticized (accrual) | | — | | | 808 | | | 2,435 | | | 360 | | | — | | | 670 | | | 718 | | | 1,246 | | | 6,237 | | | |
| Criticized (nonaccrual) | | — | | | 65 | | | 518 | | | 219 | | | — | | | 5,906 | | | — | | | 4,790 | | | 11,498 | | | |
| Subtotal HELOCs | | 4,798 | | | 4,528 | | | 6,347 | | | 3,396 | | | 5,107 | | | 15,864 | | | 1,562,026 | | | 129,167 | | | 1,731,233 | | | |
| | | | | | | | | | | | | | | | | | | | |
| | | | | | | | | | | | | | | | | | | | |
| Total residential mortgage | | 551,871 | | | 3,093,212 | | | 3,297,483 | | | 2,244,656 | | | 1,566,583 | | | 2,849,973 | | | 1,562,026 | | | 129,167 | | | 15,294,971 | | | |
| | | | | | | | | | | | | | | | | | | | |
| | | | | | | | | | | | | | | | | | | | |
| Other consumer: | | | | | | | | | | | | | | | | | | | | |
| Pass | | 2,132 | | | 632 | | | 18,101 | | | 134 | | | — | | | 6,861 | | | 22,481 | | | — | | | 50,341 | | | |
| Criticized (accrual) | | — | | | — | | | — | | | — | | | — | | | — | | | 3,000 | | | — | | | 3,000 | | | |
| Criticized (nonaccrual) | | — | | | — | | | — | | | — | | | — | | | — | | | 162 | | | — | | | 162 | | | |
| Total other consumer | | 2,132 | | | 632 | | | 18,101 | | | 134 | | | — | | | 6,861 | | | 25,643 | | | — | | | 53,503 | | | |
Gross write-offs for the three months ended March 31, 2024 (2) | | — | | | — | | | — | | | — | | | — | | | — | | | 2 | | | — | | | 2 | | | |
| | | | | | | | | | | | | | | | | | | | |
| Total consumer | | $ | 554,003 | | | $ | 3,093,844 | | | $ | 3,315,584 | | | $ | 2,244,790 | | | $ | 1,566,583 | | | $ | 2,856,834 | | | $ | 1,587,669 | | | $ | 129,167 | | | $ | 15,348,474 | | | |
Total consumer gross write-offs for the three months ended March 31, 2024 (2) | | $ | — | | | $ | — | | | $ | — | | | $ | — | | | $ | — | | | $ | — | | | $ | 2 | | | $ | — | | | $ | 2 | | | |
| | | | | | | | | | | | | | | | | | | | |
| Total loans held-for-investment: | | | | | | | | | | | | | | | | | | | | |
| Pass | | $ | 1,405,955 | | | $ | 8,597,817 | | | $ | 10,354,201 | | | $ | 6,445,705 | | | $ | 3,908,827 | | | $ | 8,339,265 | | | $ | 11,548,589 | | | $ | 197,087 | | | $ | 50,797,446 | | | |
| Criticized (accrual) | | 15 | | | 164,267 | | | 219,586 | | | 186,971 | | | 66,214 | | | 272,060 | | | 122,375 | | | 16,041 | | | 1,047,529 | | | |
| Criticized (nonaccrual) | | — | | | 25,351 | | | 28,807 | | | 4,239 | | | 7,911 | | | 75,299 | | | 1,132 | | | 4,790 | | | 147,529 | | | |
| | | | | | | | | | | | | | | | | | | | |
| | | | | | | | | | | | | | | | | | | | |
| | | | | | | | | | | | | | | | | | | | |
| Total | | $ | 1,405,970 | | | $ | 8,787,435 | | | $ | 10,602,594 | | | $ | 6,636,915 | | | $ | 3,982,952 | | | $ | 8,686,624 | | | $ | 11,672,096 | | | $ | 217,918 | | | $ | 51,992,504 | | | |
Total loans held-for-investment gross write-offs for the three months ended March 31, 2024 (2) | | $ | — | | | $ | 221 | | | $ | 12,774 | | | $ | 3,047 | | | $ | 488 | | | $ | 3,932 | | | $ | (54) | | (3) | $ | — | | | $ | 20,408 | | | |
| | |
| | | | | | | | | | | | | | | | | | | | | | | | | | | | | | | | | | | | | | | | | | | | | | | | | | | | | | | | |
|
| | December 31, 2023 |
| | | | | | | | | | | | | | | | | | |
| | | | | | | | | | | | | | | | | | |
| | Term Loans by Origination Year | | | | | | |
| | | | | | | | |
| ($ in thousands) | | 2023 | | 2022 | | 2021 | | 2020 | | 2019 | | Prior | | Revolving Loans | | Revolving Loans Converted to Term Loans (1) | | Total |
| Commercial: | | | | | | | | | | | | | | | | | | |
| C&I: | | | | | | | | | | | | | | | | | | |
| Pass | | $ | 2,314,463 | | | $ | 1,628,560 | | | $ | 1,296,936 | | | $ | 331,982 | | | $ | 245,173 | | | $ | 164,159 | | | $ | 10,053,757 | | | $ | 20,143 | | | $ | 16,055,173 | |
| Criticized (accrual) | | 105,119 | | | 67,899 | | | 120,574 | | | 15,064 | | | 40,920 | | | 22,098 | | | 117,196 | | | — | | | 488,870 | |
| Criticized (nonaccrual) | | 2,104 | | | 7,916 | | | 131 | | | 4,819 | | | 2,979 | | | 18,137 | | | 950 | | | — | | | 37,036 | |
| | | | | | | | | | | | | | | | | | |
| | | | | | | | | | | | | | | | | | |
| Total C&I | | 2,421,686 | | | 1,704,375 | | | 1,417,641 | | | 351,865 | | | 289,072 | | | 204,394 | | | 10,171,903 | | | 20,143 | | | 16,581,079 | |
Gross write-offs for the year ended December 31, 2023 (2) | | 350 | | | 10,454 | | | 424 | | | 3,758 | | | 9,748 | | | 2,648 | | | 1,593 | | | — | | | 28,975 | |
| | | | | | | | | | | | | | | | | | |
| CRE: | | | | | | | | | | | | | | | | | | |
| Pass | | 2,492,915 | | | 4,086,385 | | | 2,216,257 | | | 1,428,724 | | | 1,600,844 | | | 2,494,382 | | | 92,851 | | | 62,771 | | | 14,475,129 | |
| Criticized (accrual) | | 36,855 | | | 34,485 | | | 30,336 | | | 48,250 | | | 24,437 | | | 104,340 | | | — | | | — | | | 278,703 | |
| Criticized (nonaccrual) | | — | | | — | | | — | | | — | | | 444 | | | 22,805 | | | — | | | — | | | 23,249 | |
| | | | | | | | | | | | | | | | | | |
| | | | | | | | | | | | | | | | | | |
| Subtotal CRE | | 2,529,770 | | | 4,120,870 | | | 2,246,593 | | | 1,476,974 | | | 1,625,725 | | | 2,621,527 | | | 92,851 | | | 62,771 | | | 14,777,081 | |
Gross write-offs for the year ended December 31, 2023 (2) | | — | | | — | | | — | | | — | | | — | | | 1,329 | | | — | | | — | | | 1,329 | |
| | | | | | | | | | | | | | | | | | |
| Multifamily residential: | | | | | | | | | | | | | | | | | | |
| Pass | | 665,780 | | | 1,481,161 | | | 808,333 | | | 612,408 | | | 498,491 | | | 857,713 | | | 8,690 | | | 1,281 | | | 4,933,857 | |
| Criticized (accrual) | | — | | | 3,356 | | | 54,614 | | | — | | | 693 | | | 25,974 | | | — | | | — | | | 84,637 | |
| Criticized (nonaccrual) | | — | | | — | | | — | | | — | | | — | | | 4,669 | | | — | | | — | | | 4,669 | |
| | | | | | | | | | | | | | | | | | |
| | | | | | | | | | | | | | | | | | |
| Subtotal multifamily residential | | 665,780 | | | 1,484,517 | | | 862,947 | | | 612,408 | | | 499,184 | | | 888,356 | | | 8,690 | | | 1,281 | | | 5,023,163 | |
| Gross write-offs for the year ended December 31, 2023 | | — | | | — | | | — | | | — | | | — | | | 3 | | | — | | | — | | | 3 | |
| | | | | | | | | | | | | | | | | | |
| Construction and land: | | | | | | | | | | | | | | | | | | |
| Pass | | 209,775 | | | 280,151 | | | 120,724 | | | 39,928 | | | 808 | | | 5,501 | | | 6,981 | | | — | | | 663,868 | |
| | | | | | | | | | | | | | | | | | |
| | | | | | | | | | | | | | | | | | |
| Subtotal construction and land | | 209,775 | | | 280,151 | | | 120,724 | | | 39,928 | | | 808 | | | 5,501 | | | 6,981 | | | — | | | 663,868 | |
| | | | | | | | | | | | | | | | | | |
| Total CRE | | 3,405,325 | | | 5,885,538 | | | 3,230,264 | | | 2,129,310 | | | 2,125,717 | | | 3,515,384 | | | 108,522 | | | 64,052 | | | 20,464,112 | |
Total CRE gross write-offs for the year ended December 31, 2023 (2) | | — | | | — | | | — | | | — | | | — | | | 1,332 | | | — | | | — | | | 1,332 | |
| | | | | | | | | | | | | | | | | | |
| Total commercial | | $ | 5,827,011 | | | $ | 7,589,913 | | | $ | 4,647,905 | | | $ | 2,481,175 | | | $ | 2,414,789 | | | $ | 3,719,778 | | | $ | 10,280,425 | | | $ | 84,195 | | | $ | 37,045,191 | |
Total commercial gross write-offs for the year ended December 31, 2023 (2) | | 350 | | | 10,454 | | | 424 | | | 3,758 | | | 9,748 | | | 3,980 | | | 1,593 | | | — | | | 30,307 | |
| | | | | | | | | | | | | | | | | | |
| | | | | | | | | | | | | | | | | | | | | | | | | | | | | | | | | | | | | | | | | | | | | | | | | | | | | | | | |
| | | | | | | | | | | | | | | | | | |
| | December 31, 2023 |
| | Term Loans by Origination Year | | | | | | |
| ($ in thousands) | | 2023 | | 2022 | | 2021 | | 2020 | | 2019 | | Prior | | Revolving Loans | | Revolving Loans Converted to Term Loans (1) | | Total |
| Consumer: | | | | | | | | | | | | | | | | | | |
| Residential mortgage: | | | | | | | | | | | | | | | | | | |
| Single-family residential: | | | | | | | | | | | | | | | | | | |
Pass (4) | | $ | 3,188,830 | | | $ | 3,340,789 | | | $ | 2,279,802 | | | $ | 1,594,525 | | | $ | 980,686 | | | $ | 1,959,974 | | | $ | — | | | $ | — | | | $ | 13,344,606 | |
| Criticized (accrual) | | 2,680 | | | 4,471 | | | 566 | | | 1,440 | | | 1,503 | | | 4,167 | | | — | | | — | | | 14,827 | |
Criticized (nonaccrual) (4) | | 4,466 | | | 837 | | | 3,902 | | | 2,081 | | | 3,626 | | | 8,715 | | | — | | | — | | | 23,627 | |
| Subtotal single-family residential mortgage | | 3,195,976 | | | 3,346,097 | | | 2,284,270 | | | 1,598,046 | | | 985,815 | | | 1,972,856 | | | — | | | — | | | 13,383,060 | |
| | | | | | | | | | | | | | | | | | |
| HELOCs: | | | | | | | | | | | | | | | | | | |
| Pass | | 3,641 | | | 3,882 | | | 1,734 | | | 3,153 | | | 729 | | | 9,251 | | | 1,551,074 | | | 126,280 | | | 1,699,744 | |
| Criticized (accrual) | | 565 | | | 1,219 | | | 1,872 | | | 101 | | | 185 | | | 1,470 | | | 2,548 | | | 1,089 | | | 9,049 | |
| Criticized (nonaccrual) | | 815 | | | 856 | | | 413 | | | 72 | | | 584 | | | 6,863 | | | 279 | | | 3,529 | | | 13,411 | |
| Subtotal HELOCs | | 5,021 | | | 5,957 | | | 4,019 | | | 3,326 | | | 1,498 | | | 17,584 | | | 1,553,901 | | | 130,898 | | | 1,722,204 | |
Gross write-offs for the year ended December 31, 2023 (2) | | — | | | — | | | — | | | — | | | — | | | 41 | | | — | | | 6 | | | 47 | |
| | | | | | | | | | | | | | | | | | |
| Total residential mortgage | | 3,200,997 | | | 3,352,054 | | | 2,288,289 | | | 1,601,372 | | | 987,313 | | | 1,990,440 | | | 1,553,901 | | | 130,898 | | | 15,105,264 | |
Total residential mortgage gross write-offs for the year ended December 31, 2023 (2) | | — | | | — | | | — | | | — | | | — | | | 41 | | | — | | | 6 | | | 47 | |
| | | | | | | | | | | | | | | | | | |
| Other consumer: | | | | | | | | | | | | | | | | | | |
| Pass | | 2,286 | | | 18,098 | | | 135 | | | — | | | — | | | 13,244 | | | 26,432 | | | — | | | 60,195 | |
| | | | | | | | | | | | | | | | | | |
| Criticized (nonaccrual) | | — | | | — | | | — | | | — | | | — | | | — | | | 132 | | | — | | | 132 | |
| Total other consumer | | 2,286 | | | 18,098 | | | 135 | | | — | | | — | | | 13,244 | | | 26,564 | | | — | | | 60,327 | |
| | | | | | | | | | | | | | | | | | |
| | | | | | | | | | | | | | | | | | |
| Total consumer | | $ | 3,203,283 | | | $ | 3,370,152 | | | $ | 2,288,424 | | | $ | 1,601,372 | | | $ | 987,313 | | | $ | 2,003,684 | | | $ | 1,580,465 | | | $ | 130,898 | | | $ | 15,165,591 | |
Total consumer gross write-offs for the year ended December 31, 2023 (2) | | $ | — | | | $ | — | | | $ | — | | | $ | — | | | $ | — | | | $ | 41 | | | $ | — | | | $ | 6 | | | $ | 47 | |
| | | | | | | | | | | | | | | | | | |
| Total by Risk Rating: | | | | | | | | | | | | | | | | | | |
| Pass | | $ | 8,877,690 | | | $ | 10,839,026 | | | $ | 6,723,921 | | | $ | 4,010,720 | | | $ | 3,326,731 | | | $ | 5,504,224 | | | $ | 11,739,785 | | | $ | 210,475 | | | $ | 51,232,572 | |
| Criticized (accrual) | | 145,219 | | | 111,430 | | | 207,962 | | | 64,855 | | | 67,738 | | | 158,049 | | | 119,744 | | | 1,089 | | | 876,086 | |
| Criticized (nonaccrual) | | 7,385 | | | 9,609 | | | 4,446 | | | 6,972 | | | 7,633 | | | 61,189 | | | 1,361 | | | 3,529 | | | 102,124 | |
| | | | | | | | | | | | | | | | | | |
| | | | | | | | | | | | | | | | | | |
| | | | | | | | | | | | | | | | | | |
| Total | | $ | 9,030,294 | | | $ | 10,960,065 | | | $ | 6,936,329 | | | $ | 4,082,547 | | | $ | 3,402,102 | | | $ | 5,723,462 | | | $ | 11,860,890 | | | $ | 215,093 | | | $ | 52,210,782 | |
Total loans held-for-investment gross write-offs for the year ended December 31, 2023 (2) | | $ | 350 | | | $ | 10,454 | | | $ | 424 | | | $ | 3,758 | | | $ | 9,748 | | | $ | 4,021 | | | $ | 1,593 | | | $ | 6 | | | $ | 30,354 | |
| | | | | | | | | | | | | | | | | | |
(1)$7 million and $12 million of September 30, 2017total commercial loans, comprised of C&I and CRE revolving loans, converted to term loans during the three months ended March 31, 2024 and 2023, respectively. During the three months ended March 31, 2024 and 2023, respectively, $15 million and $5 million of total consumer loans, comprised of HELOCs, converted to term loans.
(2)Excludes gross write-offs associated with loans the Company sold or settled.
(3)Represents the remaining unamortized deferred loan fee related to a zero balance loan with no previous charge-offs.
(4)As of both March 31, 2024 and December 31, 2016:2023, $1 million of nonaccrual loans whose payments were guaranteed by the Federal Housing Administration were classified with a “Pass” rating.
|
| | | | | | | | | | | | | | | | | | | | | | | | |
| |
| ($ in thousands) | | September 30, 2017 |
| | Pass/Watch | | Special Mention | | Substandard | | Doubtful | | Loss | | Total
Non-PCI
Loans |
| CRE: | | |
| | |
| | |
| | |
| | | | |
|
| Income producing | | $ | 8,341,970 |
| | $ | 74,028 |
| | $ | 114,521 |
| | $ | — |
| | $ | — |
| | $ | 8,530,519 |
|
| Construction | | 540,851 |
| | 22,176 |
| | 9,000 |
| | — |
| | — |
| | 572,027 |
|
| Land | | 96,160 |
| | — |
| | 14,846 |
| | — |
| | — |
| | 111,006 |
|
| C&I: | | | | | | | | |
| | | | |
|
| Commercial business | | 9,447,163 |
| | 142,531 |
| | 152,975 |
| | 21,019 |
| | — |
| | 9,763,688 |
|
| Trade finance | | 830,268 |
| | 18,631 |
| | 20,003 |
| | — |
| | — |
| | 868,902 |
|
| Residential: | | | | | | | | |
| | | | |
|
| Single-family | | 4,199,554 |
| | 11,501 |
| | 22,962 |
| | — |
| | — |
| | 4,234,017 |
|
| Multifamily | | 1,789,351 |
| | — |
| | 18,960 |
| | — |
| | — |
| | 1,808,311 |
|
| Consumer | | 2,080,056 |
| | 9,683 |
| | 14,875 |
| | — |
| | — |
| | 2,104,614 |
|
| Total | | $ | 27,325,373 |
| | $ | 278,550 |
| | $ | 368,142 |
| | $ | 21,019 |
| | $ | — |
| | $ | 27,993,084 |
|
| |
|
| | | | | | | | | | | | | | | | | | | | | | | | |
| |
| ($ in thousands) | | December 31, 2016 |
| | Pass/Watch | | Special Mention | | Substandard | | Doubtful | | Loss | | Total Non-PCI Loans |
| CRE: | | |
| | |
| | |
| | |
| | | | |
|
| Income producing | | $ | 7,476,804 |
| | $ | 29,005 |
| | $ | 161,852 |
| | $ | — |
| | $ | — |
| | $ | 7,667,661 |
|
| Construction | | 551,560 |
| | — |
| | — |
| | — |
| | — |
| | 551,560 |
|
| Land | | 107,976 |
| | — |
| | 13,290 |
| | 10 |
| | — |
| | 121,276 |
|
| C&I: | | |
| | |
| | |
| | |
| | | | |
|
| Commercial business | | 8,559,674 |
| | 155,276 |
| | 201,139 |
| | 5,157 |
| | — |
| | 8,921,246 |
|
| Trade finance | | 635,027 |
| | 9,435 |
| | 36,460 |
| | — |
| | 8 |
| | 680,930 |
|
| Residential: | | |
| | |
| | |
| | |
| | | | |
|
| Single-family | | 3,341,015 |
| | 10,179 |
| | 19,475 |
| | — |
| | — |
| | 3,370,669 |
|
| Multifamily | | 1,462,522 |
| | 2,268 |
| | 25,495 |
| | — |
| | — |
| | 1,490,285 |
|
| Consumer | | 2,043,405 |
| | 6,764 |
| | 6,898 |
| | — |
| | — |
| | 2,057,067 |
|
| Total | | $ | 24,177,983 |
| | $ | 212,927 |
| | $ | 464,609 |
| | $ | 5,167 |
| | $ | 8 |
| | $ | 24,860,694 |
|
| |
The following tables present the credit risk ratings for PCI loans by portfolio segment as of September 30, 2017 and December 31, 2016:
|
| | | | | | | | | | | | | | | | | | | | | | | | |
| |
| ($ in thousands) | | September 30, 2017 |
| | Pass/Watch | | Special Mention | | Substandard | | Doubtful | | Loss | | Total PCI Loans |
| CRE: | | |
| | |
| | |
| | | | | | |
|
| Income producing | | $ | 261,907 |
| | $ | — |
| | $ | 51,350 |
| | $ | — |
| | $ | — |
| | $ | 313,257 |
|
| Land | | 44 |
| | — |
| | 327 |
| | — |
| | — |
| | 371 |
|
| C&I: | | | | | | | | | | | | |
| Commercial business | | 11,205 |
| | 90 |
| | 1,271 |
| | — |
| | — |
| | 12,566 |
|
| Residential: | | | | | | | | | | | | |
|
| Single-family | | 118,281 |
| | 1,769 |
| | 1,942 |
| | — |
| | — |
| | 121,992 |
|
| Multifamily | | 64,455 |
| | — |
| | 4,190 |
| | — |
| | — |
| | 68,645 |
|
| Consumer | | 13,962 |
| | 364 |
| | 1,116 |
| | — |
| | — |
| | 15,442 |
|
Total (1) | | $ | 469,854 |
| | $ | 2,223 |
| | $ | 60,196 |
| | $ | — |
| | $ | — |
| | $ | 532,273 |
|
| |
|
| | | | | | | | | | | | | | | | | | | | | | | | |
| |
| ($ in thousands) | | December 31, 2016 |
| | Pass/Watch | | Special Mention | | Substandard | | Doubtful | | Loss | | Total PCI Loans |
| CRE: | | |
| | |
| | |
| | | | | | |
|
| Income producing | | $ | 293,529 |
| | $ | 3,239 |
| | $ | 51,680 |
| | $ | — |
| | $ | — |
| | $ | 348,448 |
|
| Land | | 1,562 |
| | — |
| | 356 |
| | — |
| | — |
| | 1,918 |
|
| C&I: | | |
| | |
| | |
| | |
| | | | |
|
| Commercial business | | 33,885 |
| | 772 |
| | 3,730 |
| | — |
| | — |
| | 38,387 |
|
| Residential: | | |
| | |
| | |
| | | | | | |
|
| Single-family | | 136,245 |
| | 1,239 |
| | 1,626 |
| | — |
| | — |
| | 139,110 |
|
| Multifamily | | 86,190 |
| | — |
| | 9,464 |
| | — |
| | — |
| | 95,654 |
|
| Consumer | | 17,433 |
| | 316 |
| | 1,179 |
| | — |
| | — |
| | 18,928 |
|
Total (1) | | $ | 568,844 |
| | $ | 5,566 |
| | $ | 68,035 |
| | $ | — |
| | $ | — |
| | $ | 642,445 |
|
| |
| |
(1) | Loans net of ASC 310-30 discount. |
Nonaccrual and Past Due Loans
Non-PCI loansLoans that are 90 or more days past due are generally placed on nonaccrual status. Additionally, non-PCI loansstatus unless the loan is well-collateralized and in the process of collection. Loans that are less than 90 days past due but have identified deficiencies, such as when the full collection of principal or interest becomes uncertain, are also placed on nonaccrual status. The following tables present the aging analysis on non-PCIof loans held-for-investment as of September 30, 2017March 31, 2024 and December 31, 2016:2023:
| | | | | | | | | | | | | | | | | | | | | | | | | | | | | | | | | | | | | | | | | | | | | | |
|
| | March 31, 2024 |
| ($ in thousands) | | Current Accruing Loans | | Accruing Loans 30-59 Days Past Due | | Accruing Loans 60-89 Days Past Due | | | | | | Total Accruing Past Due Loans | | | | | | Total Nonaccrual Loans | | Total Loans |
| Commercial: | | | | | | | | | | | | | | | | | | | | |
| C&I | | $ | 16,281,903 | | | $ | 4,559 | | | $ | 14,767 | | | | | | | $ | 19,326 | | | | | | | $ | 48,962 | | | $ | 16,350,191 | |
| CRE: | | | | | | | | | | | | | | | | | | | | |
| CRE | | 14,555,923 | | | 18,726 | | | — | | | | | | | 18,726 | | | | | | | 35,006 | | | 14,609,655 | |
| Multifamily residential | | 5,005,231 | | | 368 | | | — | | | | | | | 368 | | | | | | | 4,646 | | | 5,010,245 | |
| Construction and land | | 661,703 | | | — | | | — | | | | | | | — | | | | | | | 12,236 | | | 673,939 | |
| Total CRE | | 20,222,857 | | | 19,094 | | | — | | | | | | | 19,094 | | | | | | | 51,888 | | | 20,293,839 | |
| Total commercial | | 36,504,760 | | | 23,653 | | | 14,767 | | | | | | | 38,420 | | | | | | | 100,850 | | | 36,644,030 | |
| Consumer: | | | | | | | | | | | | | | | | | | | | |
| Residential mortgage: | | | | | | | | | | | | | | | | | | | | |
| Single-family residential | | 13,478,789 | | | 33,911 | | | 15,369 | | | | | | | 49,280 | | | | | | | 35,669 | | | 13,563,738 | |
| HELOCs | | 1,699,628 | | | 13,877 | | | 6,230 | | | | | | | 20,107 | | | | | | | 11,498 | | | 1,731,233 | |
| Total residential mortgage | | 15,178,417 | | | 47,788 | | | 21,599 | | | | | | | 69,387 | | | | | | | 47,167 | | | 15,294,971 | |
| Other consumer | | 53,224 | | | 60 | | | 57 | | | | | | | 117 | | | | | | | 162 | | | 53,503 | |
| Total consumer | | 15,231,641 | | | 47,848 | | | 21,656 | | | | | | | 69,504 | | | | | | | 47,329 | | | 15,348,474 | |
| Total | | $ | 51,736,401 | | | $ | 71,501 | | | $ | 36,423 | | | | | | | $ | 107,924 | | | | | | | $ | 148,179 | | | $ | 51,992,504 | |
|
| | | | | | | | | | | | | | | | | | | | | | | | | | | | | | | | | | | | | | | | | | | | |
|
| | December 31, 2023 |
| ($ in thousands) | | Current Accruing Loans | | Accruing Loans 30-59 Days Past Due | | Accruing Loans 60-89 Days Past Due | | | | Total Accruing Past Due Loans | | | | | | Total Nonaccrual Loans | | Total Loans |
| Commercial: | | | | | | | | | | | | | | | | | | |
| C&I | | $ | 16,508,394 | | | $ | 28,550 | | | $ | 7,099 | | | | | $ | 35,649 | | | | | | | $ | 37,036 | | | $ | 16,581,079 | |
| CRE: | | | | | | | | | | | | | | | | | | |
| CRE | | 14,750,315 | | | 1,719 | | | 1,798 | | | | | 3,517 | | | | | | | 23,249 | | | 14,777,081 | |
| Multifamily residential | | 5,017,897 | | | 597 | | | — | | | | | 597 | | | | | | | 4,669 | | | 5,023,163 | |
| Construction and land | | 650,617 | | | 13,251 | | | — | | | | | 13,251 | | | | | | | — | | | 663,868 | |
| Total CRE | | 20,418,829 | | | 15,567 | | | 1,798 | | | | | 17,365 | | | | | | | 27,918 | | | 20,464,112 | |
| Total commercial | | 36,927,223 | | | 44,117 | | | 8,897 | | | | | 53,014 | | | | | | | 64,954 | | | 37,045,191 | |
| Consumer: | | | | | | | | | | | | | | | | | | |
| Residential mortgage: | | | | | | | | | | | | | | | | | | |
| Single-family residential | | 13,313,455 | | | 29,285 | | | 15,943 | | | | | 45,228 | | | | | | | 24,377 | | | 13,383,060 | |
| HELOCs | | 1,687,301 | | | 12,266 | | | 9,226 | | | | | 21,492 | | | | | | | 13,411 | | | 1,722,204 | |
| Total residential mortgage | | 15,000,756 | | | 41,551 | | | 25,169 | | | | | 66,720 | | | | | | | 37,788 | | | 15,105,264 | |
| Other consumer | | 56,930 | | | 3,123 | | | 142 | | | | | 3,265 | | | | | | | 132 | | | 60,327 | |
| Total consumer | | 15,057,686 | | | 44,674 | | | 25,311 | | | | | 69,985 | | | | | | | 37,920 | | | 15,165,591 | |
| Total | | $ | 51,984,909 | | | $ | 88,791 | | | $ | 34,208 | | | | | $ | 122,999 | | | | | | | $ | 102,874 | | | $ | 52,210,782 | |
|
|
| | | | | | | | | | | | | | | | | | | | | | | | | | | | | | | | |
| |
| ($ in thousands) | | September 30, 2017 |
| | Accruing Loans 30-59 Days Past Due | | Accruing Loans 60-89 Days Past Due | | Total Accruing Past Due Loans | | Nonaccrual Loans Less Than 90 Days Past Due | | Nonaccrual Loans 90 or More Days Past Due | | Total Nonaccrual Loans | | Current Accruing Loans | | Total Non-PCI Loans |
| CRE: | | |
| | |
| | |
| | |
| | |
| | |
| | |
| | |
|
| Income producing | | $ | 5,211 |
| | $ | 1,924 |
| | $ | 7,135 |
| | $ | 4,853 |
| | $ | 19,949 |
| | $ | 24,802 |
| | $ | 8,498,582 |
| | $ | 8,530,519 |
|
| Construction | | 9,000 |
| | — |
| | 9,000 |
| | — |
| | — |
| | — |
| | 563,027 |
| | 572,027 |
|
| Land | | — |
| | — |
| | — |
| | 10 |
| | 4,173 |
| | 4,183 |
| | 106,823 |
| | 111,006 |
|
| C&I: | | |
| | |
| | |
| | |
| | |
| | |
| | |
| | |
|
| Commercial business | | 16,315 |
| | 108 |
| | 16,423 |
| | 34,844 |
| | 38,540 |
| | 73,384 |
| | 9,673,881 |
| | 9,763,688 |
|
| Trade finance | | — |
| | — |
| | — |
| | — |
| | — |
| | — |
| | 868,902 |
| | 868,902 |
|
| Residential: | | |
| | |
| | |
| | |
| | |
| | |
| | |
| | |
|
| Single-family | | 16,765 |
| | 1,560 |
| | 18,325 |
| | — |
| | 6,639 |
| | 6,639 |
| | 4,209,053 |
| | 4,234,017 |
|
| Multifamily | | 7,476 |
| | 664 |
| | 8,140 |
| | 1,456 |
| | 1,164 |
| | 2,620 |
| | 1,797,551 |
| | 1,808,311 |
|
| Consumer | | 8,837 |
| | 5,346 |
| | 14,183 |
| | 93 |
| | 3,004 |
| | 3,097 |
| | 2,087,334 |
| | 2,104,614 |
|
| Total | | $ | 63,604 |
| | $ | 9,602 |
| | $ | 73,206 |
| | $ | 41,256 |
| | $ | 73,469 |
| | $ | 114,725 |
| | $ | 27,805,153 |
| | $ | 27,993,084 |
|
| |
|
| | | | | | | | | | | | | | | | | | | | | | | | | | | | | | | | |
| |
| ($ in thousands) | | December 31, 2016 |
| | Accruing Loans 30-59 Days Past Due | | Accruing Loans 60-89 Days Past Due | | Total Accruing Past Due Loans | | Nonaccrual Loans Less Than 90 Days Past Due | | Nonaccrual Loans 90 or More Days Past Due | | Total Nonaccrual Loans | | Current Accruing Loans | | Total
Non-PCI
Loans |
| CRE: | | |
| | |
| | |
| | |
| | |
| | |
| | |
| | |
|
| Income producing | | $ | 6,233 |
| | $ | 14,080 |
| | $ | 20,313 |
| | $ | 14,872 |
| | $ | 12,035 |
| | $ | 26,907 |
| | $ | 7,620,441 |
| | $ | 7,667,661 |
|
| Construction | | 4,994 |
| | — |
| | 4,994 |
| | — |
| | — |
| | — |
| | 546,566 |
| | 551,560 |
|
| Land | | — |
| | — |
| | — |
| | 433 |
| | 4,893 |
| | 5,326 |
| | 115,950 |
| | 121,276 |
|
| C&I: | | |
| | |
| | |
| | |
| | |
| | |
| | |
| | |
|
| Commercial business | | 45,052 |
| | 2,279 |
| | 47,331 |
| | 60,511 |
| | 20,737 |
| | 81,248 |
| | 8,792,667 |
| | 8,921,246 |
|
| Trade finance | | — |
| | — |
| | — |
| | 8 |
| | — |
| | 8 |
| | 680,922 |
| | 680,930 |
|
| Residential: | | |
| | |
| | |
| | | | |
| | |
| | |
| | |
|
| Single-family | | 9,595 |
| | 8,076 |
| | 17,671 |
| | — |
| | 4,214 |
| | 4,214 |
| | 3,348,784 |
| | 3,370,669 |
|
| Multifamily | | 3,951 |
| | 374 |
| | 4,325 |
| | 2,790 |
| | 194 |
| | 2,984 |
| | 1,482,976 |
| | 1,490,285 |
|
| Consumer | | 3,327 |
| | 3,228 |
| | 6,555 |
| | 165 |
| | 1,965 |
| | 2,130 |
| | 2,048,382 |
| | 2,057,067 |
|
| Total | | $ | 73,152 |
| | $ | 28,037 |
| | $ | 101,189 |
| | $ | 78,779 |
| | $ | 44,038 |
| | $ | 122,817 |
| | $ | 24,636,688 |
| | $ | 24,860,694 |
|
| | | | | | | | | | | | | | | | | |
For information onThe following table presents the policy for recording payments received and resuming accrualamortized cost of interest on non-PCI loans that are placed on nonaccrual status, see Note 1 — Summary of Significant Accounting Policies to the Consolidated Financial Statements of the Company’s 2016 Form 10-K.
PCI loans are excluded from the above aging analysis tables as the Company has elected to account for these loans on a pool level basis under ASC 310-30 at the time of acquisition. Refer to the discussion on PCI loans within this note for additional details on interest income recognition. As of September 30, 2017 and December 31, 2016, PCI loans on nonaccrual status totaled $5.7 million and $11.7 million, respectively.
Loans in Processfor which there was no related allowance for loan losses as of Foreclosure
As of September 30, 2017both March 31, 2024 and December 31, 2016,2023. Nonaccrual loans may not have an allowance for credit losses if the loan balances are well secured by collateral values and there is no loss expectation.
| | | | | | | | | | | | | | | | |
|
| ($ in thousands) | | | March 31, 2024 | | | December 31, 2023 |
| | | | | | |
| Commercial: | | | | | | |
| C&I | | | $ | 40,617 | | | | $ | 33,089 | |
| | | | | | |
| CRE | | | 34,431 | | | | 22,653 | |
| Multifamily residential | | | 4,235 | | | | 4,235 | |
| Construction and land | | | 12,236 | | | | — | |
| | | | | | |
| Total commercial | | | 91,519 | | | | 59,977 | |
| Consumer: | | | | | | |
| | | | | | |
| Single-family residential | | | 15,380 | | | | 4,852 | |
| HELOCs | | | 6,287 | | | | 7,256 | |
| | | | | | |
| | | | | | |
| Total consumer | | | 21,667 | | | | 12,108 | |
| Total nonaccrual loans with no related allowance for loan losses | | | $ | 113,186 | | | | $ | 72,085 | |
|
Foreclosed Assets
The Company acquires assets from borrowers through loan restructurings, workouts, or foreclosures. Assets acquired may include real properties (e.g., real estate, land, and buildings) and commercial and personal properties. The Company recognizes foreclosed assets upon receiving assets in satisfaction of a loan (e.g., taking legal title or physical possession).
Foreclosed assets, consisting of OREO and other nonperforming assets, are included in Other assets on the Consolidated Balance Sheet. The Company had $6.3$17 million and $3.1 million, respectively, of recorded investments in residential and consumer mortgage loans secured by residential real estate properties, for which formal foreclosure proceedings were in process according to local requirements of the applicable jurisdictions, which were not included in OREO. A foreclosed residential real estate property with a carrying amount of $391 thousand was included in total net OREO of $2.3 millionassets as of September 30, 2017. In comparison, foreclosed residential real estate propertiesMarch 31, 2024, compared with a carrying amount of $401 thousand were included in total net OREO of $6.7$11 million as of December 31, 2016.
Troubled Debt Restructurings
Potential troubled debt restructurings (“TDRs”) are individually evaluated and2023. The Company commences the type of restructuring is selected basedforeclosure process on consumer mortgage loans after a borrower becomes more than 120 days delinquent in accordance with the loan type and the circumstancesCFPB guidelines. The carrying value of the borrower’s financial difficultyconsumer real estate loans that were in orderan active or suspended foreclosure process was $8 million as of both March 31, 2024 and December 31, 2023.
Loan Modifications to maximizeBorrowers Experiencing Financial Difficulty
As part of the Company’s recovery. A TDR is a modification ofloss mitigation efforts, the Company may agree to modify the contractual terms of a loan when theto assist borrowers experiencing financial difficulty. The Company for economic or legal reasons relatednegotiates loan modifications on a case-by-case basis to achieve mutually agreeable terms that maximize loan collectability and meet the borrower’s financial difficulties, grantsneeds. The Company considers various factors to identify borrowers experiencing financial difficulty. The primary factor for consumer borrowers is delinquency status. For commercial loan borrowers, these factors include credit risk ratings, the probability of loan risk rating downgrades, and overall risk profile changes. The modification may include, but is not limited to, payment deferrals, interest rate reductions, term extensions, principal forgiveness, or a concession tocombination of such modifications. Commercial loan borrowers that require immaterial modifications such as insignificant interest rate changes, short-term extensions (90 days or less) from the borrower that itoriginal maturity date, or temporary waivers or extensions of financial covenants which would not have otherwise considered.constitute material credit actions, are generally not considered to be experiencing financial difficulty and are not included in the disclosure. Insignificant payment deferrals (three months or less in the last 12 months) are also not included in the disclosure.
The following tables present the additions to non-PCI TDRs foramortized cost of loans that were modified during the three and nine months ended September 30, 2017March 31, 2024 and 2016:2023 by loan class and modification type:
| | | | | | | | | | | | | | | | | | | | | | | | | | | | | | | | | | | | | | | | | | | | |
|
| | Three Months Ended March 31, 2024 |
| | Modification Type | | | | | | |
| ($ in thousands) | | Term Extension | | Payment Delay | | | | | | | | Combination: Rate Reduction/ Payment Delay | | Total | | Modification as a % of Loan Class | | | | | | |
| Commercial: | | | | | | | | | | | | | | | | | | | | | | |
| C&I | | $ | 4,013 | | | $ | 22,155 | | | | | | | | | $ | — | | | $ | 26,168 | | | 0.16 | % | | | | | | |
| | | | | | | | | | | | | | | | | | | | | | |
| CRE | | 24,488 | | | — | | | | | | | | | 19,325 | | | 43,813 | | | 0.22 | % | | | | | | |
| | | | | | | | | | | | | | | | | | | | | | |
| | | | | | | | | | | | | | | | | | | | | | |
| | | | | | | | | | | | | | | | | | | | | | |
| Total commercial | | 28,501 | | | 22,155 | | | | | | | | | 19,325 | | | 69,981 | | | | | | | | | |
| Consumer: | | | | | | | | | | | | | | | | | | | | | | |
| | | | | | | | | | | | | | | | | | | | | | |
| Single-family residential | | — | | | 3,996 | | | | | | | | | — | | | 3,996 | | | 0.03 | % | | | | | | |
| HELOCs | | — | | | 5,501 | | | | | | | | | 517 | | | 6,018 | | | 0.35 | % | | | | | | |
| | | | | | | | | | | | | | | | | | | | | | |
| | | | | | | | | | | | | | | | | | | | | | |
| | | | | | | | | | | | | | | | | | | | | | |
| | | | | | | | | | | | | | | | | | | | | | |
| Total consumer | | — | | | 9,497 | | | | | | | | | 517 | | | 10,014 | | | | | | | | | |
| Total | | $ | 28,501 | | | $ | 31,652 | | | | | | | | | $ | 19,842 | | | $ | 79,995 | | | | | | | | | |
|
|
| | | | | | | | | | | | | | | | | | | | | | | | | | | | |
| |
| | | Loans Modified as TDRs During the Three Months Ended September 30, |
| ($ in thousands) | | 2017 | | 2016 |
| | Number
of
Loans | | Pre- Modification
Outstanding
Recorded
Investment | | Post- Modification
Outstanding
Recorded
Investment (1) | | Financial
Impact (2) | | Number
of
Loans | | Pre- Modification
Outstanding
Recorded
Investment | | Post- Modification
Outstanding
Recorded
Investment (1) | | Financial
Impact (2) |
| CRE: | | | | �� |
| | |
| | |
| | | | | | | | |
| Income producing | | 1 | | $ | 172 |
| | $ | 172 |
| | $ | 8 |
| | — | | $ | — |
| | $ | — |
| | $ | — |
|
| C&I: | | | | | | | | | | | | | | | | |
| Commercial business | | 10 | | $ | 15,143 |
| | $ | 14,927 |
| | $ | 65 |
| | 3 | | $ | 493 |
| | $ | 475 |
| | $ | 93 |
|
| |
| | | | | | | | | | | | | | | | | | | | | | | | | | | | | | | | | | | | | | | | | | |
|
| | Three Months Ended March 31, 2023 |
| | Modification Type | | | | |
| ($ in thousands) | | Term Extension | | Payment Delay | | | | | | | | Combination: Rate Reduction/ Payment Delay | | Total | | Modification as a % of Loan Class | | | | |
| Commercial: | | | | | | | | | | | | | | | | | | | | |
| C&I | | $ | 19,974 | | | $ | 14,364 | | | | | | | | | $ | — | | | $ | 34,338 | | | 0.22 | % | | | | |
| | | | | | | | | | | | | | | | | | | | |
| CRE | | 543 | | | — | | | | | | | | | — | | | 543 | | | — | % | | | | |
| | | | | | | | | | | | | | | | | | | | |
| | | | | | | | | | | | | | | | | | | | |
| | | | | | | | | | | | | | | | | | | | |
| Total commercial | | 20,517 | | | 14,364 | | | | | | | | | — | | | 34,881 | | | | | | | |
| Consumer: | | | | | | | | | | | | | | | | | | | | |
| | | | | | | | | | | | | | | | | | | | |
| | | | | | | | | | | | | | | | | | | | |
| HELOCs | | 738 | | | — | | | | | | | | | — | | | 738 | | | 0.04 | % | | | | |
| | | | | | | | | | | | | | | | | | | | |
| | | | | | | | | | | | | | | | | | | | |
| | | | | | | | | | | | | | | | | | | | |
| | | | | | | | | | | | | | | | | | | | |
| Total consumer | | 738 | | | — | | | | | | | | | — | | | 738 | | | | | | | |
| Total | | $ | 21,255 | | | $ | 14,364 | | | | | | | | | $ | — | | | $ | 35,619 | | | | | | | |
|
|
| | | | | | | | | | | | | | | | | | | | | | | | | | | | |
| |
| | | Loans Modified as TDRs During the Nine Months Ended September 30, |
| ($ in thousands) | | 2017 | | 2016 |
| | Number
of
Loans | | Pre- Modification
Outstanding
Recorded
Investment | | Post- Modification
Outstanding
Recorded
Investment (1) | | Financial
Impact (2) | | Number
of
Loans | | Pre- Modification
Outstanding
Recorded
Investment | | Post- Modification
Outstanding
Recorded
Investment (1) | | Financial
Impact (2) |
| CRE: | | | | |
| | |
| | |
| | | | | | | | |
| Income producing | | 2 | | $ | 1,699 |
| | $ | 1,648 |
| | $ | 8 |
| | 3 | | $ | 15,899 |
| | $ | 15,730 |
| | $ | 43 |
|
| Land | | — | | $ | — |
| | $ | — |
| | $ | — |
| | 1 | | $ | 5,522 |
| | $ | 5,233 |
| | $ | — |
|
| C&I: | | | | | | | | | | | | | | | | |
| Commercial business | | 15 | | $ | 29,541 |
| | $ | 28,796 |
| | $ | 10,365 |
| | 8 | | $ | 22,182 |
| | $ | 9,113 |
| | $ | 2,711 |
|
| Trade finance | | — | | $ | — |
| | $ | — |
| | $ | — |
| | 2 | | $ | 7,901 |
| | $ | 3,025 |
| | $ | — |
|
| Residential: | | | | | | | | | | | | | | | | |
| Single-family | | — | | $ | — |
| | $ | — |
| | $ | — |
| | 2 | | $ | 1,071 |
| | $ | 1,065 |
| | $ | — |
|
| Multifamily | | 1 | | $ | 3,655 |
| | $ | 3,620 |
| | $ | 112 |
| | — | | $ | — |
| | $ | — |
| | $ | — |
|
| Consumer | | — | | $ | — |
| | $ | — |
| | $ | — |
| | 1 | | $ | 344 |
| | $ | 337 |
| | $ | 1 |
|
| |
| |
(1) | Includes subsequent payments after modification and reflects the balance as of September 30, 2017 and 2016. |
| |
(2) | The financial impact includes charge-offs and specific reserves recorded at the modification date. |
The following tables present the non-PCI TDRfinancial effects of the loan modifications for the three and nine months ended September 30, 2017March 31, 2024 and 20162023 by loan class and modification type:
| | | | | | | | | | | | | | | | | | | | | | |
|
| | | | Financial Effects of Loan Modifications |
| | | | Three Months Ended March 31, 2024 |
| | | | |
| ($ in thousands) | | | | Weighted-Average Interest Rate Reduction | | Weighted-Average Term Extension
(in years) | | Weighted-Average Payment Delay
(in years) |
| Commercial: | | | | | | | | |
| C&I | | | | — | | | 1.8 | | 1.7 |
| | | | | | | | |
| CRE | | | | 2.75 | % | | 1.5 | | 1.7 |
| | | | | | | | |
| | | | | | | | |
| | | | | | | | |
| | | | | | | | |
| Consumer: | | | | | | | | |
| | | | | | | | |
| Single-family residential | | | | — | | | 0.0 | | 0.7 |
| HELOCs | | | | 0.25 | % | | 0.0 | | 3.2 |
| | | | | | | | |
| | | | | | | | |
| | | | | | | | |
| | | | | | | | |
| | | | | | | | |
| | | | | | | | |
|
| | | | | | | | | | | | | | | Financial Effects of Loan Modifications | |
| | | | | | | | | | | | | | | Financial Effects of Loan Modifications | |
| | | | | | | | | | | | | | | Financial Effects of Loan Modifications | |
| | | | | | | | Three Months Ended March 31, 2023 | |
| | | | | | | | Three Months Ended March 31, 2023 | |
| | | | | | | | Three Months Ended March 31, 2023 | |
| | | | | | | | | | | ($ in thousands) | |
| | | | | | | | | | | ($ in thousands) | |
| | | | | | | | | | | ($ in thousands) | |
| | | | | | | | | | Commercial: | |
| | | | | | | | | | Commercial: | |
| | | | | | | | | | Commercial: | |
| | | | | | | | | | C&I | |
| | | | | | | | | | C&I | |
| | | | | | | | | | C&I | |
| | | | | | | | | | | CRE | |
| | | | | | | | | | | CRE | |
| | | | | | | | | | | CRE | |
| | | | ($ in thousands) | | Modification Type During the Three Months Ended September 30, 2017 |
| | Principal (1) | | Principal and Interest (2) | | Interest Rate Reduction | | Interest Deferments | | Other | | Total |
| CRE | | $ | 172 |
| | $ | — |
| | $ | — |
| | $ | — |
| | $ | — |
| | $ | 172 |
|
| C&I | | 14,903 |
| | 24 |
| | — |
| | — |
| | — |
| | 14,927 |
|
| Total | | $ | 15,075 |
| | $ | 24 |
| | $ | — |
| | $ | — |
| | $ | — |
| | $ | 15,099 |
|
| | | |
| | | | | | | | | | Consumer: | |
| | | | | | | | | | | Consumer: | |
| | | | | | | | | | | Consumer: | |
| | | | | | | | | | | HELOCs | |
| | | | | | | | | | | HELOCs | |
| | | | | | | | | | | HELOCs | |
|
|
| | | | | | | | | | | | | | | | | | | | | | | | |
| |
| ($ in thousands) | | Modification Type During the Three Months Ended September 30, 2016 |
| | Principal (1) | | Principal
and
Interest (2) | | Interest
Rate
Reduction | | Interest
Deferments | | Other | | Total |
| C&I | | $ | 444 |
| | $ | — |
| | $ | — |
| | $ | 31 |
| | $ | — |
| | $ | 475 |
|
| Total | | $ | 444 |
| | $ | — |
| | $ | — |
| | $ | 31 |
| | $ | — |
| | $ | 475 |
|
| | |
|
| | | | | | | | | | | | | | | | | | | | | | | | |
| |
| ($ in thousands) | | Modification Type During the Nine Months Ended September 30, 2017 |
| | Principal (1) | | Principal
and
Interest (2) | | Interest
Rate
Reduction | | Interest
Deferments | | Other | | Total |
| CRE | | $ | 1,648 |
| | $ | — |
| | $ | — |
| | $ | — |
| | $ | — |
| | $ | 1,648 |
|
| C&I | | 18,289 |
| | 10,507 |
| | — |
| | — |
| | — |
| | 28,796 |
|
| Residential | | 3,620 |
| | — |
| | — |
| | — |
| | — |
| | 3,620 |
|
| Total | | $ | 23,557 |
| | $ | 10,507 |
| | $ | — |
| | $ | — |
| | $ | — |
| | $ | 34,064 |
|
| | |
|
| | | | | | | | | | | | | | | | | | | | | | | | |
| |
| ($ in thousands) | | Modification Type During the Nine Months Ended September 30, 2016 |
| | Principal (1) | | Principal
and
Interest (2) | | Interest
Rate
Reduction | | Interest
Deferments | | Other | | Total |
| CRE | | $ | 19,812 |
| | $ | — |
| | $ | — |
| | $ | — |
| | $ | 1,151 |
| | $ | 20,963 |
|
| C&I | | 10,218 |
| | — |
| | 1,288 |
| | 32 |
| | 600 |
| | 12,138 |
|
| Residential | | 266 |
| | — |
| | 799 |
| | — |
| | — |
| | 1,065 |
|
| Consumer | | 337 |
| | — |
| | — |
| | — |
| | — |
| | 337 |
|
| Total | | $ | 30,633 |
| | $ | — |
| | $ | 2,087 |
| | $ | 32 |
| | $ | 1,751 |
| | $ | 34,503 |
|
| | | | | | | | | | | | |
| |
(1) | Includes forbearance payments, term extensions and principal deferments that modify the terms of the loan from principal and interest payments to interest payments only. |
| |
(2) | Includes principal and interest deferments or reductions. |
Subsequent to restructuring,A modified loan may become delinquent and result in a TDR that becomes delinquent, generally beyondpayment default (generally 90 days is consideredpast due) subsequent to have defaulted. As TDRs are individually evaluated for impairment under the specific reserve methodology, subsequent defaults do not generally have a significant additional impact on the allowance for loan losses.modification. The following tables presenttable presents information foron loans modified as TDRs withinthat defaulted during the previousthree months ended March 31, 2024 that received modifications during the 12 months preceding payment default:
| | | | | | | | | | | | | | | | | | | | | | | | | | | | | | | | | | | | |
| | | |
| | | | | | Loans Modified Subsequently Defaulted |
| | | | | | Three Months Ended March 31, 2024 | | | |
| ($ in thousands) | | | | | | Term Extension | | Payment Delay | | Combination: Term Extension/ Payment Delay | | | | Total | | | | |
| Commercial: | | | | | | | | | | | | | | | | | | |
| C&I | | | | | | $ | 7,828 | | | $ | — | | | — | | | | | $ | 7,828 | | | | | |
| | | | | | | | | | | | | | | | | | |
| | | | | | | | | | | | | | | | | | |
| | | | | | | | | | | | | | | | | | |
| | | | | | | | | | | | | | | | | | |
| | | | | | | | | | | | | | | | | | |
| Total commercial | | | | | | 7,828 | | | — | | | — | | | | | 7,828 | | | | | |
| Consumer: | | | | | | | | | | | | | | | | | | |
| | | | | | | | | | | | | | | | | | |
| Single-family residential | | | | | | — | | | 3,972 | | | 383 | | | | | 4,355 | | | | | |
| | | | | | | | | | | | | | | | | | |
| | | | | | | | | | | | | | | | | | |
| | | | | | | | | | | | | | | | | | |
| | | | | | | | | | | | | | | | | | |
| | | | | | | | | | | | | | | | | | |
| Total consumer | | | | | | — | | | 3,972 | | | 383 | | | | | 4,355 | | | | | |
| Total | | | | | | $ | 7,828 | | | $ | 3,972 | | | $ | 383 | | | | | $ | 12,183 | | | | | |
| | | |
In comparison, there were no loans that havereceived modifications, which subsequently defaulted during the three and nine months ended September 30, 2017 and 2016, and were still in default at the respective period end:March 31, 2023.
|
| | | | | | | | | | | | | | |
| |
| ($ in thousands) | | Loans Modified as TDRs that Subsequently Defaulted During the Three Months Ended September 30, |
| | 2017 | | 2016 |
| | Number of
Loans | | Recorded
Investment | | Number of
Loans | | Recorded
Investment |
| CRE: | | |
| | |
| | |
| | |
|
| Income producing | | — |
| | $ | — |
| | 1 |
| | $ | 1,000 |
|
| C&I: | | | | | | | | |
| Commercial business | | 1 |
| | $ | 9,386 |
| | — |
| | $ | — |
|
| |
|
| | | | | | | | | | | | | | |
| |
| ($ in thousands) | | Loans Modified as TDRs that Subsequently Defaulted During the Nine Months Ended September 30, |
| | 2017 | | 2016 |
| | Number of
Loans | | Recorded
Investment | | Number of
Loans | | Recorded
Investment |
| CRE: | | |
| | |
| | |
| | |
|
| Income producing | | — |
| | $ | — |
| | 1 |
| | $ | 1,000 |
|
| C&I: | | |
| | |
| | |
| | |
|
| Commercial business | | 1 |
| | $ | 9,386 |
| | 2 |
| | $ | 119 |
|
| Consumer | | 1 |
| | $ | 48 |
| | — |
| | $ | — |
|
| |
The amountCompany closely monitors the performance of modified loans to borrowers experiencing financial difficulty to understand the effectiveness of its modification efforts. The following tables present the performance of loans that were modified in the twelve months ended March 31, 2024. For the comparative period, the amounts represent the performance of loans that were modified in the three months ended March 31, 2023, subsequent to the adoption of ASU 2022-02 on January 1, 2023:
| | | | | | | | | | | | | | | | | | | | | | | | | | | | | | | | | | | | | | |
|
| | | | Payment Performance as of March 31, 2024 |
| ($ in thousands) | | | | | | | | | | | | | | Current | | 30 - 89 Days Past Due | | 90+ Days Past Due | | Total |
| Commercial: | | | | | | | | | | | | | | | | | | | | |
| C&I | | | | | | | | | | | | | | $ | 75,193 | | | $ | — | | | $ | 7,829 | | | $ | 83,022 | |
| | | | | | | | | | | | | | | | | | | | |
| CRE | | | | | | | | | | | | | | 76,028 | | | — | | | — | | | 76,028 | |
| | | | | | | | | | | | | | | | | | | | |
| | | | | | | | | | | | | | | | | | | | |
| | | | | | | | | | | | | | | | | | | | |
| Total commercial | | | | | | | | | | | | | | 151,221 | | | — | | | 7,829 | | | 159,050 | |
| Consumer: | | | | | | | | | | | | | | | | | | | | |
| | | | | | | | | | | | | | | | | | | | |
| Single-family residential | | | | | | | | | | | | | | 8,455 | | | 4,239 | | | 5,075 | | | 17,769 | |
| HELOCs | | | | | | | | | | | | | | 6,994 | | | 2,536 | | | — | | | 9,530 | |
| | | | | | | | | | | | | | | | | | | | |
| | | | | | | | | | | | | | | | | | | | |
| Total consumer | | | | | | | | | | | | | | 15,449 | | | 6,775 | | | 5,075 | | | 27,299 | |
| Total | | | | | | | | | | | | | | $ | 166,670 | | | $ | 6,775 | | | $ | 12,904 | | | $ | 186,349 | |
| | | | | | | | | | | | | | | | | | | | |
| | | | | | | | | | | | | | | | | | | | | | | | | | | | | | | | | | | | | | |
|
| | | | Payment Performance as of March 31, 2023 |
| ($ in thousands) | | | | | | | | | | | | | | Current | | 30 - 89 Days Past Due | | 90+ Days Past Due | | Total |
| Commercial: | | | | | | | | | | | | | | | | | | | | |
| C&I | | | | | | | | | | | | | | $ | 27,393 | | | $ | 6,945 | | | $ | — | | | $ | 34,338 | |
| | | | | | | | | | | | | | | | | | | | |
| CRE | | | | | | | | | | | | | | 543 | | | — | | | — | | | 543 | |
| | | | | | | | | | | | | | | | | | | | |
| | | | | | | | | | | | | | | | | | | | |
| | | | | | | | | | | | | | | | | | | | |
| Total commercial | | | | | | | | | | | | | | 27,936 | | | 6,945 | | | — | | | 34,881 | |
| Consumer: | | | | | | | | | | | | | | | | | | | | |
| | | | | | | | | | | | | | | | | | | | |
| | | | | | | | | | | | | | | | | | | | |
| HELOCs | | | | | | | | | | | | | | 738 | | | — | | | — | | | 738 | |
| | | | | | | | | | | | | | | | | | | | |
| | | | | | | | | | | | | | | | | | | | |
| Total consumer | | | | | | | | | | | | | | 738 | | | — | | | — | | | 738 | |
| Total | | | | | | | | | | | | | | $ | 28,674 | | | $ | 6,945 | | | $ | — | | | $ | 35,619 | |
| | | | | | | | | | | | | | | | | | | | |
As of March 31, 2024 and December 31, 2023, commitments to lend additional funds committed to lend to borrowers whose terms have beenloans were modified was $612 thousandwere $10 million and $9.9$4 million, as of September 30, 2017 and December 31, 2016, respectively.
Impaired LoansAllowance for Credit Losses
The Company has a current expected credit losses framework for all financial assets measured at amortized cost and certain off-balance sheet credit exposures. The Company’s allowance for credit losses, which includes both the allowance for loan losses and the allowance for unfunded credit commitments, is calculated with the objective of maintaining a reserve sufficient to absorb losses inherent in our credit portfolios. The measurement of the allowance for credit losses is based on management’s best estimate of lifetime expected credit losses, periodic evaluation of the loan portfolio, lending-related commitments and other relevant factors.
The allowance for credit losses is deducted from the amortized cost basis of a financial asset or a group of financial assets so that the balance sheet reflects the net amount the Company expects to collect. Amortized cost is the principal balance outstanding, net of purchase premiums and discounts, deferred fees and costs, and escrow advances. Subsequent changes in expected credit losses are recognized in net income as a provision for, or a reversal of, credit loss expense.
The allowance for credit losses estimation involves procedures to consider the unique risk characteristics of the portfolio segments. The majority of the Company’s credit exposures that share risk characteristics with other similar exposures are collectively evaluated. The collectively evaluated loans are grouped into heterogeneousinclude performing loans and homogeneous (mostly consumer loans) categories. Classified loans inunfunded credit commitments. If an exposure does not share risk characteristics with other exposures, the heterogeneous category are identified and evaluated for impairmentCompany generally estimates expected credit losses on an individual basis. A
Allowance for Collectively Evaluated Loans
The allowance for collectively evaluated loans consists of a quantitative component that assesses the different risk factors considered in our models and a qualitative component that considers risk factors external to the models. Each of these components are described below.
Quantitative Component — The Company applies quantitative methods to estimate loan islosses by considering a variety of factors such as historical loss experience, the current credit quality of the portfolio, and an economic outlook over the life of the loan. The Company incorporates forward-looking information using macroeconomic scenarios which include variables that are considered impaired when, based on current informationkey drivers of increases and events, it is probabledecreases in credit losses. The Company utilizes a probability-weighted, multiple-scenario forecast approach. These scenarios may consist of a base forecast representing management's view of the most likely outcome, combined with downside or upside scenarios reflecting possible worsening or improving economic conditions. The quantitative models incorporate a probability-weighted calculation of these macroeconomic scenarios over a reasonable and supportable forecast period. If the life of the loans extends beyond the reasonable and supportable forecast period, the Company will consider historical experience or long-run macroeconomic trends over the remaining life of the loans to estimate the allowance for loan losses.
There were no changes to the reasonable and supportable forecast period, except to the C&I segment, and no changes to the reversion to the historical loss experience method for the three months ended March 31, 2024 and 2023. The reasonable and supportable forecast period for the C&I segment changed from 11 quarters to eight quarters due to model redevelopment during the third quarter of 2023.
The following table provides key credit risk characteristics and macroeconomic variables that the Company willuses to estimate the expected credit losses by portfolio segment:
| | | | | | | | | | | | | | |
| | | | |
| Portfolio Segment | | Risk Characteristics | | Macroeconomic Variables |
| C&I | | Age percentage, size at origination, delinquency status, sector and risk rating | | Unemployment rate, Gross Domestic Product (“GDP”), and U.S. Treasury rates (1) |
| CRE, Multifamily residential, and Construction and land | | Delinquency status, maturity date, collateral value, property type, and geographic location | | Unemployment rate, GDP, and U.S. Treasury rates |
| Single-family residential and HELOCs | | FICO score, delinquency status, maturity date, collateral value, and geographic location | | Unemployment rate, GDP, and Home Price Indices |
| Other consumer | | Loss rate approach | | Immaterial (2) |
| | | | |
(1)Macroeconomic variables were updated due to model redevelopment.
(2)Macroeconomic variables are included in the qualitative estimate.
Quantitative Component — Allowance for Loan Losses for the Commercial Loan Portfolio
The Company’s C&I lifetime loss rate model estimates the loss rate expected over the life of a loan. This loss rate is applied to the amortized cost basis, excluding accrued interest receivable, to determine expected credit losses. The lifetime loss rate model’s reasonable and supportable period spans eight quarters, thereafter immediately reverting to the historical average loss rate, expressed through the loan-level lifetime loss rate.
To generate estimates of expected loss at the loan level for CRE, multifamily residential, and construction and land loans, projected probabilities of default (“PDs”) and loss given defaults (“LGDs”) are applied to the estimated exposure at default, considering the term and payment structure of the loan. The forecast of future economic conditions returns to long-run historical economic trends within the reasonable and supportable period.
To estimate the life of a loan under both models, the contractual term of the loan is adjusted for estimated prepayments based on historical prepayment experience.
Quantitative Component — Allowance for Loan Losses for the Consumer Loan Portfolio
For single-family residential and HELOC loans, projected PDs and LGDs are applied to the estimated exposure at default, considering the term and payment structure of the loan, to generate estimates of expected loss at the loan level. The forecast of future economic conditions returns to long-run historical economic trends after the reasonable and supportable period. To estimate the life of a loan for the single-family residential and HELOC loan portfolios, the contractual term of the loan is adjusted for estimated prepayments based on historical prepayment experience. For other consumer loans, the Company uses a loss rate approach.
Qualitative Component — The Company considers the following qualitative factors in the determination of the collectively evaluated allowance if these factors have not already been captured by the quantitative model. Such qualitative factors may include, but are not limited to:
•loan growth trends;
•the volume and severity of past due financial assets, and criticized or adversely classified financial assets;
•the Company’s lending policies and procedures, including changes in lending strategies, underwriting standards, collection, write-off and recovery practices;
•knowledge of a borrower’s operations;
•the quality of the Company’s credit review system;
•the experience, ability and depth of the Company’s management and associates;
•the effect of other external factors such as the regulatory and legal environments, or changes in technology;
•actual and expected changes in international, national, regional, and local economic and business conditions in which the Company operates; and
•risk factors in certain industry sectors not captured by the quantitative models.
The magnitude of the impact of these factors on the Company’s qualitative assessment of the allowance for credit losses changes from period to period according to changes made by management in its assessment of these factors. The extent to which these factors change may be abledependent on whether they are already reflected in quantitative loss estimates during the current period and the extent to collectwhich changes in these factors diverge from period to period.
While the Company’s allowance methodologies strive to reflect all scheduled paymentsrelevant credit risk factors, there continues to be uncertainty associated with, but not limited to, potential imprecision in the estimation process due to the inherent time lag of principal or interest dueobtaining information and normal variations between expected and actual outcomes. The Company may hold additional qualitative reserves that are designed to provide coverage for losses attributable to such risk.
Allowance for Individually Evaluated Loans
When a loan no longer shares similar risk characteristics with other loans, such as in accordance with the original contractual terms. Impairedcase of certain nonaccrual loans, arethe Company estimates the allowance for loan losses on an individual loan basis. The allowance for loan losses for individually evaluated loans is measured based onas the difference between the recorded value of the loans and their fair value. For loans evaluated individually, the Company uses one of three different asset valuation measurement methods: (1) the fair value of collateral less costs to sell; (2) the present value of expected future cash flows discounted atflows; or (3) the loan’s effective interest rate or, as expedient, at the loan’sloan's observable market price orprice. If an individually evaluated loan is determined to be collateral dependent, the Company applies the fair value of the collateral if the loan is collateral dependent, less costs to sell. Whensell method. If an individually evaluated loan is determined not to be collateral dependent, the Company uses the present value of an impairedfuture cash flows or the observable market value of the loan.
•Collateral-Dependent Loans — The allowance of a collateral-dependent loan is less thanlimited to the difference between the recorded investmentvalue and fair value of the loan is classifiedcollateral less cost of disposal or sale. As of March 31, 2024, collateral-dependent commercial and consumer loans totaled $63 million and $23 million, respectively. In comparison, collateral-dependent commercial and consumer loans totaled $30 million and $12 million, respectively, as nonperformingof December 31, 2023. The Company's collateral-dependent loans were secured by real estate. As of both March 31, 2024 and uncollectible,December 31, 2023, the deficiency is charged-off againstcollateral value of the allowance for loan losses. Impairedproperties securing the collateral-dependent loans, excludenet of selling costs, exceeded the homogeneous consumer loan portfolio, which is evaluated collectively for impairment. The Company’s impaired loans include predominantly non-PCI loans held-for-investment on nonaccrual status and any non-PCI loans modified in a TDR, which may be on accrual or nonaccrual status.recorded value of the majority of the loans.
The following tables present information onsummarize the non-PCI impaired loans as of September 30, 2017 and December 31, 2016:
|
| | | | | | | | | | | | | | | | | | | | |
| |
| ($ in thousands) | | September 30, 2017 |
| | Unpaid Principal Balance | | Recorded Investment With No Allowance | | Recorded Investment With Allowance | | Total Recorded Investment | | Related Allowance |
| CRE: | | |
| | |
| | |
| | |
| | |
|
| Income producing | | $ | 35,133 |
| | $ | 28,908 |
| | $ | 6,241 |
| | $ | 35,149 |
| | $ | 1,011 |
|
| Land | | 4,183 |
| | 4,173 |
| | 10 |
| | 4,183 |
| | 1 |
|
| C&I: | | |
| | |
| | |
| | |
| | |
|
| Commercial business | | 89,233 |
| | 50,700 |
| | 38,392 |
| | 89,092 |
| | 18,183 |
|
| Trade finance | | 4,786 |
| | — |
| | 4,708 |
| | 4,708 |
| | 786 |
|
| Residential: | | |
| | |
| | |
| | |
| | |
|
| Single-family | | 15,868 |
| | 1,867 |
| | 14,032 |
| | 15,899 |
| | 572 |
|
| Multifamily | | 12,224 |
| | 6,062 |
| | 6,170 |
| | 12,232 |
| | 194 |
|
| Consumer | | 4,298 |
| | 1,303 |
| | 2,998 |
| | 4,301 |
| | 4 |
|
| Total | | $ | 165,725 |
| | $ | 93,013 |
| | $ | 72,551 |
| | $ | 165,564 |
| | $ | 20,751 |
|
| |
|
| | | | | | | | | | | | | | | | | | | | |
| |
| ($ in thousands) | | December 31, 2016 |
| | Unpaid Principal Balance | | Recorded Investment With No Allowance | | Recorded Investment With Allowance | | Total Recorded Investment | | Related Allowance |
| CRE: | | |
| | |
| | |
| | |
| | |
|
| Income producing | | $ | 50,718 |
| | $ | 32,507 |
| | $ | 14,001 |
| | $ | 46,508 |
| | $ | 1,263 |
|
| Land | | 6,457 |
| | 5,427 |
| | 443 |
| | 5,870 |
| | 63 |
|
| C&I: | | |
| | |
| | |
| | | | |
|
| Commercial business | | 162,239 |
| | 78,316 |
| | 42,137 |
| | 120,453 |
| | 10,443 |
|
| Trade finance | | 5,227 |
| | — |
| | 5,166 |
| | 5,166 |
| | 34 |
|
| Residential: | | |
| | |
| | |
| | | | |
|
| Single-family | | 15,435 |
| | — |
| | 14,335 |
| | 14,335 |
| | 687 |
|
| Multifamily | | 11,181 |
| | 5,684 |
| | 4,357 |
| | 10,041 |
| | 180 |
|
| Consumer | | 4,016 |
| | — |
| | 3,682 |
| | 3,682 |
| | 31 |
|
| Total | | $ | 255,273 |
| | $ | 121,934 |
| | $ | 84,121 |
| | $ | 206,055 |
| | $ | 12,701 |
|
| |
The following table presents the average recorded investment and interest income recognized on non-PCI impaired loans for the three and nine months ended September 30, 2017 and 2016:
|
| | | | | | | | | | | | | | | | | | | | | | | | | | | | | | | | |
| |
| ($ in thousands) | | Three Months Ended September 30, | | Nine Months Ended September 30, |
| | 2017 | | 2016 | | 2017 | | 2016 |
| | Average
Recorded
Investment | | Recognized Interest Income (1) | | Average
Recorded
Investment | | Recognized Interest Income (1) | | Average Recorded Investment | | Recognized Interest Income (1) | | Average
Recorded
Investment | | Recognized Interest Income (1) |
| CRE: | | | | | | | | | | | | | | | | |
| Income producing | | $ | 37,489 |
| | $ | 179 |
| | $ | 52,116 |
| | $ | 464 |
| | $ | 37,238 |
| | $ | 535 |
| | $ | 52,221 |
| | $ | 1,368 |
|
| Land | | 4,337 |
| | — |
| | 6,622 |
| | 9 |
| | 4,484 |
| | — |
| | 6,777 |
| | 26 |
|
| C&I: | | | | | | | | | | | | | | | | |
| Commercial business | | 93,278 |
| | 242 |
| | 91,290 |
| | 258 |
| | 94,709 |
| | 799 |
| | 92,805 |
| | 648 |
|
| Trade finance | | 4,216 |
| | 53 |
| | 9,005 |
| | 33 |
| | 4,444 |
| | 122 |
| | 10,028 |
| | 166 |
|
| Residential: | | | | | | | | | | | | | | | | |
| Single-family | | 16,124 |
| | 111 |
| | 13,438 |
| | 72 |
| | 16,141 |
| | 325 |
| | 13,517 |
| | 220 |
|
| Multifamily | | 12,532 |
| | 108 |
| | 20,585 |
| | 77 |
| | 12,540 |
| | 324 |
| | 20,646 |
| | 231 |
|
| Consumer | | 4,492 |
| | 14 |
| | 1,571 |
| | 16 |
| | 4,455 |
| | 41 |
| | 1,575 |
| | 48 |
|
| Total non-PCI impaired loans | | $ | 172,468 |
| | $ | 707 |
| | $ | 194,627 |
| | $ | 929 |
| | $ | 174,011 |
| | $ | 2,146 |
| | $ | 197,569 |
| | $ | 2,707 |
|
| |
| |
(1) | Includes interest recognized on accruing non-PCI TDRs. Interest payments received on nonaccrual non-PCI loans are reflected as a reduction to principal and not as interest income. |
Allowance for Credit Losses
The following tables present a summary of activitiesactivity in the allowance for loan losses by portfolio segmentsegments for the three and nine months ended September 30, 2017 March 31, 2024 and 2016:2023:
| | | | | | | | | | | | | | | | | | | | | | | | | | | | | | | | | | | | | | | | | | | | | | | | | | |
|
| | Three Months Ended March 31, 2024 |
| | Commercial | | Consumer | | |
| | | | CRE | | Residential Mortgage | | | | |
| ($ in thousands) | | C&I | | CRE | | Multifamily Residential | | Construction and Land | | Single-Family Residential | | HELOCs | | Other Consumer | | Total |
| Allowance for loan losses, beginning of period | | $ | 392,685 | | | $ | 170,592 | | | $ | 34,375 | | | $ | 10,469 | | | $ | 55,018 | | | $ | 3,947 | | | $ | 1,657 | | | $ | 668,743 | |
| Provision for (reversal of) credit losses on loans | (a) | 275 | | | 18,939 | | | 3,032 | | | 1,574 | | | 899 | | | (432) | | | (132) | | | 24,155 | |
| Gross charge-offs | | (20,998) | | | (2,398) | | | (6) | | | (1,224) | | | — | | | — | | | (58) | | | (24,684) | |
| Gross recoveries | | 1,710 | | | 327 | | | 17 | | | — | | | 5 | | | 48 | | | — | | | 2,107 | |
| Total net (charge-offs) recoveries | | (19,288) | | | (2,071) | | | 11 | | | (1,224) | | | 5 | | | 48 | | | (58) | | | (22,577) | |
| Foreign currency translation adjustment | | (41) | | | — | | | — | | | — | | | — | | | — | | | — | | | (41) | |
| Allowance for loan losses, end of period | | $ | 373,631 | | | $ | 187,460 | | | $ | 37,418 | | | $ | 10,819 | | | $ | 55,922 | | | $ | 3,563 | | | $ | 1,467 | | | $ | 670,280 | |
| | | | | | | | | | | | | | | | |
| | | | | | | | | | | | | | | | |
| | | | | | | | | | | | | | | | |
| | | | | | | | | | | | | | | | |
| | | | | | | | | | | | | | | | |
| | | | | | | | | | | | | | | | |
|
| | | | | | | | | | | | | | | | | | | | | | | | | | | | |
| |
| ($ in thousands) | | Three Months Ended September 30, 2017 |
| | Non-PCI Loans | | PCI Loans | | Total |
| | CRE | | C&I | | Residential | | Consumer | | Total | | |
| Beginning balance | | $ | 73,985 |
| | $ | 150,136 |
| | $ | 43,679 |
| | $ | 8,438 |
| | $ | 276,238 |
| | $ | 78 |
| | $ | 276,316 |
|
| (Reversal of) provision for loan losses | | (346 | ) | | 15,656 |
| | (583 | ) | | (1,269 | ) | | 13,458 |
| | (10 | ) | | 13,448 |
|
| Charge-offs | | — |
| | (7,359 | ) | | — |
| | (65 | ) | | (7,424 | ) | | — |
| | (7,424 | ) |
| Recoveries | | 610 |
| | 2,165 |
| | 809 |
| | 2 |
| | 3,586 |
| | — |
| | 3,586 |
|
| Net recoveries (charge-offs) | | 610 |
| | (5,194 | ) | | 809 |
| | (63 | ) | | (3,838 | ) | | — |
| | (3,838 | ) |
| Ending balance | | $ | 74,249 |
| | $ | 160,598 |
| | $ | 43,905 |
| | $ | 7,106 |
| | $ | 285,858 |
| | $ | 68 |
| | $ | 285,926 |
|
| |
| | | | | | | | | | | | | | | | | | | | | | | | | | | | | | | | | | | | | | | | | | | | | | | | | | |
|
| | Three Months Ended March 31, 2023 |
| | Commercial | | Consumer | | |
| | | | CRE | | Residential Mortgage | | | | |
| ($ in thousands) | | C&I | | CRE | | Multifamily Residential | | Construction and Land | | Single-Family Residential | | HELOCs | | Other Consumer | | Total |
| Allowance for loan losses, December 31, 2022 | | $ | 371,700 | | | $ | 149,864 | | | $ | 23,373 | | | $ | 9,109 | | | $ | 35,564 | | | $ | 4,475 | | | $ | 1,560 | | | $ | 595,645 | |
| Impact of ASU 2022-02 adoption | | 5,683 | | | 337 | | | 6 | | | — | | | 1 | | | 1 | | | — | | | 6,028 | |
| Allowance for loan losses, January 1, 2023 | | 377,383 | | | 150,201 | | | 23,379 | | | 9,109 | | | 35,565 | | | 4,476 | | | 1,560 | | | 601,673 | |
| (Reversal of) provision for credit losses on loans | (a) | (678) | | | 4,676 | | | 1,135 | | | 210 | | | 12,442 | | | 580 | | | 155 | | | 18,520 | |
| Gross charge-offs | | (1,900) | | | (6) | | | — | | | — | | | — | | | (91) | | | (40) | | | (2,037) | |
| Gross recoveries | | 1,211 | | | 196 | | | 12 | | | 3 | | | — | | | 6 | | | — | | | 1,428 | |
| Total net (charge-offs) recoveries | | (689) | | | 190 | | | 12 | | | 3 | | | — | | | (85) | | | (40) | | | (609) | |
| Foreign currency translation adjustment | | 309 | | | — | | | — | | | — | | | — | | | — | | | — | | | 309 | |
| Allowance for loan losses, end of period | | $ | 376,325 | | | $ | 155,067 | | | $ | 24,526 | | | $ | 9,322 | | | $ | 48,007 | | | $ | 4,971 | | | $ | 1,675 | | | $ | 619,893 | |
| | | | | | | | | | | | | | | | |
| | | | | | | | | | | | | | | | |
| | | | | | | | | | | | | | | | |
| | | | | | | | | | | | | | | | |
| | | | | | | | | | | | | | | | |
| | | | | | | | | | | | | | | | |
| | | | | | | | | | | | | | | | |
|
| | | | | | | | | | | | | | | | | | | | | | | | | | | | |
| |
| ($ in thousands) | | Three Months Ended September 30, 2016 |
| | Non-PCI Loans | | PCI Loans | | Total |
| | CRE | | C&I | | Residential | | Consumer | | Total | | |
| Beginning balance | | $ | 78,102 |
| | $ | 148,427 |
| | $ | 31,561 |
| | $ | 8,421 |
| | $ | 266,511 |
| | $ | 257 |
| | $ | 266,768 |
|
| (Reversal of) provision for loan losses | | (6,598 | ) | | 18,548 |
| | 309 |
| | (644 | ) | | 11,615 |
| | (101 | ) | | 11,514 |
|
| Charge-offs | | (309 | ) | | (23,696 | ) | | (29 | ) | | (13 | ) | | (24,047 | ) | | — |
| | (24,047 | ) |
| Recoveries | | 634 |
| | 165 |
| | 654 |
| | 124 |
| | 1,577 |
| | — |
| | 1,577 |
|
| Net recoveries (charge-offs) | | 325 |
| | (23,531 | ) | | 625 |
| | 111 |
| | (22,470 | ) | | — |
| | (22,470 | ) |
| Ending balance | | $ | 71,829 |
| | $ | 143,444 |
| | $ | 32,495 |
| | $ | 7,888 |
| | $ | 255,656 |
| | $ | 156 |
| | $ | 255,812 |
|
| |
|
| | | | | | | | | | | | | | | | | | | | | | | | | | | | |
| |
| ($ in thousands) | | Nine Months Ended September 30, 2017 |
| | Non-PCI Loans | | PCI Loans | | Total |
| | CRE | | C&I | | Residential | | Consumer | | Total | | |
| Beginning balance | | $ | 72,804 |
| | $ | 142,166 |
| | $ | 37,333 |
| | $ | 8,099 |
| | $ | 260,402 |
| | $ | 118 |
| | $ | 260,520 |
|
| (Reversal of) provision for loan losses | | (120 | ) | | 28,576 |
| | 4,815 |
| | (1,087 | ) | | 32,184 |
| | (50 | ) | | 32,134 |
|
| Charge-offs | | (149 | ) | | (19,802 | ) | | (1 | ) | | (72 | ) | | (20,024 | ) | | — |
| | (20,024 | ) |
| Recoveries | | 1,714 |
| | 9,658 |
| | 1,758 |
| | 166 |
| | 13,296 |
| | — |
| | 13,296 |
|
| Net recoveries (charge-offs) | | 1,565 |
| | (10,144 | ) | | 1,757 |
| | 94 |
| | (6,728 | ) | | — |
| | (6,728 | ) |
| Ending balance | | $ | 74,249 |
| | $ | 160,598 |
| | $ | 43,905 |
| | $ | 7,106 |
| | $ | 285,858 |
| | $ | 68 |
| | $ | 285,926 |
|
| |
|
| | | | | | | | | | | | | | | | | | | | | | | | | | | | |
| |
| ($ in thousands) | | Nine Months Ended September 30, 2016 |
| | Non-PCI Loans | | PCI Loans | | Total |
| | CRE | | C&I | | Residential | | Consumer | | Total | | |
| Beginning balance | | $ | 81,191 |
| | $ | 134,597 |
| | $ | 39,292 |
| | $ | 9,520 |
| | $ | 264,600 |
| | $ | 359 |
| | $ | 264,959 |
|
| (Reversal of) provision for loan losses | | (9,731 | ) | | 38,549 |
| | (7,679 | ) | | (1,887 | ) | | 19,252 |
| | (203 | ) | | 19,049 |
|
| Charge-offs | | (504 | ) | | (31,770 | ) | | (166 | ) | | (17 | ) | | (32,457 | ) | | — |
| | (32,457 | ) |
| Recoveries | | 873 |
| | 2,068 |
| | 1,048 |
| | 272 |
| | 4,261 |
| | — |
| | 4,261 |
|
| Net recoveries (charge-offs) | | 369 |
| | (29,702 | ) | | 882 |
| | 255 |
| | (28,196 | ) | | — |
| | (28,196 | ) |
| Ending balance | | $ | 71,829 |
| | $ | 143,444 |
| | $ | 32,495 |
| | $ | 7,888 |
| | $ | 255,656 |
| | $ | 156 |
| | $ | 255,812 |
|
| |
For further information on accounting policies and the methodologies usedIn addition to estimate the allowance for loan losses, the Company maintains an allowance for unfunded credit losses and loan charge-offs, see Note 1 — Summary of Significant Accounting Policies to the Consolidated Financial Statements of the Company’s 2016 Form 10-K.
commitments. The following table presents a summary of activities inCompany has three general areas for which it provides the allowance for unfunded credit reservescommitments: (1) recourse obligations for the threeloans sold, (2) letters of credit, and nine months ended September 30, 2017 and 2016:
|
| | | | | | | | | | | | | | | | |
| | | | | | | | | |
| ($ in thousands) | | Three Months Ended
September 30, | | Nine Months Ended
September 30, |
| | 2017 | | 2016 | | 2017 | | 2016 |
| Beginning balance | | $ | 15,188 |
| | $ | 20,318 |
| | $ | 16,121 |
| | $ | 20,360 |
|
| Reversal of unfunded credit reserves | | (452 | ) | | (1,989 | ) | | (1,385 | ) | | (2,031 | ) |
| Ending balance | | $ | 14,736 |
| | $ | 18,329 |
| | $ | 14,736 |
| | $ | 18,329 |
|
| | | | | | | | | |
(3) unfunded lending commitments. The allowance for unfunded credit reservescommitments is maintained at a level that management believes to be sufficient to absorb estimated probableexpected credit losses related to unfunded credit facilities. The allowance for unfunded credit reserves is included in Accrued expense and other liabilities on the Consolidated Balance Sheets. See Note 11 — Commitments and Contingenciesto the Consolidated Financial Statements in this Form 10-Q for additional information related to unfunded credit reserves.commitments. The following table summarizes the activities in the allowance for unfunded credit commitments for the three months ended March 31, 2024 and 2023:
| | | | | | | | | | | | | | | | | | | | | | |
| | | | | | | | |
| | Three Months Ended March 31, | | | | |
| ($ in thousands) | | 2024 | | 2023 | | | | | | | | |
| Unfunded credit facilities | | | | | | | | | | | | |
| Allowance for unfunded credit commitments, beginning of period | | $ | 37,699 | | | $ | 26,264 | | | | | | | | | |
| | | | | | | | | | | | |
| Provision for credit losses on unfunded credit commitments | (b) | 845 | | | 1,480 | | | | | | | | | |
| Foreign currency translation adjustment | | — | | | (3) | | | | | | | | | |
| Allowance for unfunded credit commitments, end of period | | $ | 38,544 | | | $ | 27,741 | | | | | | | | | |
| | | | | | | | | | | | |
| Provision for credit losses | (a) + (b) | $ | 25,000 | | | $ | 20,000 | | | | | | | | | |
| | | | | | | | |
The following tables presentallowance for credit losses was $709 million as of March 31, 2024, an increase of $3 million, compared with $706 million as of December 31, 2023. The slight increase in the allowance for credit losses was primarily driven by the Company’s qualitative risk assessment and economic forecasts that reflected continued caution regarding inflation, the high interest rate environment and the CRE market outlook, while recognizing negative loan growth.
The Company considers multiple economic scenarios to develop the estimate of the allowance for loan losseslosses. The scenarios may consist of a baseline forecast representing management's view of the most likely outcome, and recorded investments by portfolio segmentdownside or upside scenarios that reflect possible worsening or improving economic conditions. As of March 31, 2024, the Company assigned the same weightings to its baseline, upside and impairment methodologydownside scenarios as of September 30, 2017 andcompared with December 31, 2016:
|
| | | | | | | | | | | | | | | | | | | | |
| |
| ($ in thousands) | | September 30, 2017 |
| | CRE | | C&I | | Residential | | Consumer | | Total |
| Allowance for loan losses | | | | | | | | | | |
| Individually evaluated for impairment | | $ | 1,012 |
| | $ | 18,969 |
| | $ | 766 |
| | $ | 4 |
| | $ | 20,751 |
|
| Collectively evaluated for impairment | | 73,237 |
| | 141,629 |
| | 43,139 |
| | 7,102 |
| | 265,107 |
|
Acquired with deteriorated credit quality | | 68 |
| | — |
| | — |
| | — |
| | 68 |
|
| Ending balance | | $ | 74,317 |
| | $ | 160,598 |
| | $ | 43,905 |
| | $ | 7,106 |
| | $ | 285,926 |
|
| | | | | | | | | | | |
| Recorded investment in loans | | | | | | | | | | |
| Individually evaluated for impairment | | $ | 39,332 |
| | $ | 93,800 |
| | $ | 28,131 |
| | $ | 4,301 |
| | $ | 165,564 |
|
| Collectively evaluated for impairment | | 9,174,220 |
| | 10,538,790 |
| | 6,014,197 |
| | 2,100,313 |
| | 27,827,520 |
|
Acquired with deteriorated credit quality (1) | | 313,628 |
| | 12,566 |
| | 190,637 |
| | 15,442 |
| | 532,273 |
|
Ending balance (1) | | $ | 9,527,180 |
| | $ | 10,645,156 |
| | $ | 6,232,965 |
| | $ | 2,120,056 |
| | $ | 28,525,357 |
|
| |
|
| | | | | | | | | | | | | | | | | | | | |
| |
| ($ in thousands) | | December 31, 2016 |
| | CRE | | C&I | | Residential | | Consumer | | Total |
| Allowance for loan losses | | | | | | | | | | |
| Individually evaluated for impairment | | $ | 1,326 |
| | $ | 10,477 |
| | $ | 867 |
| | $ | 31 |
| | $ | 12,701 |
|
| Collectively evaluated for impairment | | 71,478 |
| | 131,689 |
| | 36,466 |
| | 8,068 |
| | 247,701 |
|
| Acquired with deteriorated credit quality | | 112 |
| | 1 |
| | 5 |
| | — |
| | 118 |
|
| Ending balance | | $ | 72,916 |
| | $ | 142,167 |
| | $ | 37,338 |
| | $ | 8,099 |
| | $ | 260,520 |
|
| | | | | | | | | | | |
| Recorded investment in loans | | | | | | | | | | |
| Individually evaluated for impairment | | $ | 52,378 |
| | $ | 125,619 |
| | $ | 24,376 |
| | $ | 3,682 |
| | $ | 206,055 |
|
| Collectively evaluated for impairment | | 8,288,119 |
| | 9,476,557 |
| | 4,836,578 |
| | 2,053,385 |
| | 24,654,639 |
|
Acquired with deteriorated credit quality (1) | | 350,366 |
| | 38,387 |
| | 234,764 |
| | 18,928 |
| | 642,445 |
|
Ending balance (1) | | $ | 8,690,863 |
| | $ | 9,640,563 |
| | $ | 5,095,718 |
| | $ | 2,075,995 |
| | $ | 25,503,139 |
|
| |
| |
(1) | Loans net of ASC 310-30 discount. |
Purchased Credit Impaired Loans
At2023. The current baseline economic forecast continues to reflect key risks such as high inflation, high interest rates, concerns over global conflicts and oil prices. Compared to December 2023, the dateMarch 2024 baseline forecast for GDP growth and unemployment rate showed a slight improvement in the near term (full year 2024) while longer-term forecasts (2025 and beyond) slightly worsened for GDP growth. The downside scenario assumed the economy falls into recession in the second quarter of acquisition, PCI loans are pooled and accounted for at fair value, which represents the discounted value of the expected cash flows of the loan portfolio. A pool is accounted for2024 as a single asset withresult of an extended federal shutdown, global and domestic political tensions, high inflation, and increased unemployment. The upside scenario assumed a single interest rate, cumulative loss ratemore optimistic economic outlook for 2024, including stronger growth, stable financial market, and cash flow expectation. The cash flows expected over the life of the pools are estimated by an internal cash flow model that projects cash flows and calculates the carrying values of the pools, book yields, effective interest income and impairment, if any, based on pool level events. Assumptions as to cumulative loss rates, loss curves and prepayment speeds are utilized to calculate the expected cash flows. The amount of expected cash flows over the initial investmentfull employment starting in the loan represents the “accretable yield,” which is recognized as interest income on a level yield basis over the lifesecond quarter of the loan. Prepayments affect the estimated life of PCI loans, which may change the amount of interest income,2024.
Loan Transfers, Sales and possibly principal, expected to be collected. The excess of total contractual cash flows over the cash flows expected to be received at origination is deemed to be the “nonaccretable difference.”Purchases
The following table presentsCompany’s primary business focus is on directly originated loans. The Company also purchases loans and participates in loan financing with other banks. In the changesnormal course of doing business, the Company also provides other financial institutions with the ability to participate in accretable yield for PCIcommercial loans for the three and nine months ended September 30, 2017 and 2016:
|
| | | | | | | | | | | | | | | | |
| |
| ($ in thousands) | | Three Months Ended September 30, | | Nine Months Ended September 30, |
| | 2017 | | 2016 | | 2017 | | 2016 |
| Beginning balance | | $ | 118,625 |
| | $ | 166,777 |
| | $ | 136,247 |
| | $ | 214,907 |
|
| Accretion | | (10,747 | ) | | (14,827 | ) | | (32,108 | ) | | (53,510 | ) |
| Changes in expected cash flows | | 2,078 |
| | 311 |
| | 5,817 |
| | (9,136 | ) |
| Ending balance | | $ | 109,956 |
| | $ | 152,261 |
| | $ | 109,956 |
| | $ | 152,261 |
|
| |
Loans Held-for-Sale
Loans held-for-sale are carried at the lower of cost or fair value. When a determination is made at the time of commitment to originate or purchase loans as held-for-investment,that it is the Company’s intent to hold theseoriginates, by selling loans to maturity or for the “foreseeable future,” subject to periodic reviews under the Company’s management evaluation processes, including asset/liability management. When the Company subsequently changes its intent to hold certainsuch institutions. Purchased loans the loans aremay be transferred from held-for-investment to held-for-sale, atand write-downs to allowance for loan losses are recorded, when appropriate. The following tables provide information on the lowercarrying value of cost or fair value.
As of September 30, 2017, loans held-for-sale amounted to $178 thousand, which were comprised of single-family residential loans. In comparison, as of December 31, 2016, loans held-for-sale amounted to $23.1 million, which were primarily comprised of consumer loans. Loans transferred, fromsold and purchased for the held-for-investment to held-for-sale were $74.5 million and $418.5 millionportfolio, during the three and nine months ended September 30, 2017, respectively. These loan transfers were primarily comprisedMarch 31, 2024 and 2023:
| | | | | | | | | | | | | | | | | | | | | | | | | | | | | | | | |
|
| | Three Months Ended March 31, 2024 |
| | Commercial | | Consumer | | | | | | |
| | | | | | Residential Mortgage | | | | | | |
| ($ in thousands) | | C&I | | | | | | | | Single-Family Residential | | | | | | Total |
Loans transferred from held-for-investment to held-for-sale (1) | | $ | 199,974 | | | | | | | | | $ | — | | | | | | | $ | 199,974 | |
| | | | | | | | | | | | | | | | |
Sales (2)(3) | | $ | 187,202 | | | | | | | | | $ | 965 | | | | | | | $ | 188,167 | |
| Purchases | | $ | 33,344 | | (4) | | | | | | | $ | 74,736 | | | | | | | $ | 108,080 | |
|
| | | | | | | | | | | | | | | | | | | | | | | | | | | | | | | | | | |
|
| | Three Months Ended March 31, 2023 |
| | Commercial | | | | Consumer | | | | | | |
| | | | CRE | | | | Residential Mortgage | | | | | | |
| ($ in thousands) | | C&I | | CRE | | | | | | Single-Family Residential | | | | | | Total |
Loans transferred from held-for-investment to held-for-sale (1) | | $ | 156,876 | | | $ | 3,600 | | | | | | | $ | — | | | | | | | $ | 160,476 | |
| | | | | | | | | | | | | | | | |
Sales (2)(3) | | $ | 175,932 | | | $ | 3,600 | | | | | | | $ | — | | | | | | | $ | 179,532 | |
| Purchases | | $ | 22,683 | | (4) | $ | — | | | | | | | $ | 131,999 | | | | | | | $ | 154,682 | |
|
(1)Includes write-downs of C&I loans for both periods. In comparison, $144.9$1 million and $720.7 million of loans were transferred from held-for-investment to held-for-sale during the three and nine months ended September 30, 2016, respectively. These loan transfers were primarily comprised of C&I, multifamily residential and CRE loans for both periods. The Company recorded $232$273 thousand and $441 thousand in write-downs to the allowance for loan losses related to loans transferred from held-for-investment to held-for-sale for the three and nine months ended September 30, 2017,March 31, 2024, and 2023, respectively. In comparison, there were no write-downs
(2)Includes originated loans sold of $92 million and $1.9$111 million of write-downs recorded to the allowance for loan losses related to loans transferred from held-for-investment to held-for-sale for the three and nine months ended September 30, 2016, respectively.
During the threeMarch 31, 2024 and nine months ended September 30, 2017, the Company sold $33.8 million and $101.4 million, respectively, in originated loans, resulting in net gains of $2.3 million and $5.5 million,2023, respectively. Originated loans sold during these periods wereconsisted primarily comprised of C&I loans for both periods.
(3)Includes $96 million and CRE loans. In comparison,$69 million of purchased loans sold in the Company sold $107.3 million in originated loans duringsecondary market for the three months ended September 30, 2016, resulting in net gainsMarch 31, 2024 and 2023, respectively.
(4)C&I loan purchases were comprised primarily of $2.2 million. Originated loans sold during this period were primarily comprised ofsyndicated C&I and CREterm loans. During the nine months ended September 30, 2016, the Company sold or securitized $529.5 million in originated loans, resulting in net gains of $9.3 million. Included in these amounts were $201.7 million of multifamily residential loans securitized during the first quarter of 2016, which resulted in net gains of $1.1 million, $641 thousand in mortgage servicing rights and $160.1 million of held-to-maturity investment security that were recorded. The remaining $327.8 million of originated loans sold during the nine months ended September 30, 2016, primarily comprising of CRE and C&I loans, resulted in net gains of $8.2 million.
During the threeNote 8 — Affordable Housing Partnership, Tax Credit and nine months ended September 30, 2017, the Company purchased $72.4 million and $441.1 million loans, respectively, compared to $256.2 million and $1.04 billion during the three and nine months ended September 30, 2016, respectively. Purchased loans for each of the three and nine months ended September 30, 2017 were primarily comprised of C&I syndication loans. Purchased loans for each of the three and nine months ended September 30, 2016 were primarily comprised of C&I syndication loans and single-family residential loans. The higher loans purchased for the three and nine months ended September 30, 2016, primarily included $165.8 million and $488.3 million, respectively, of single-family residential loans purchased for Community Reinvestment Act (“CRA”) purposes.
From time to time, the Company purchases and sells loans in the secondary market. Certain purchased loans are transferred from held-for-investment to held-for-sale and write-downs to allowance for loan losses are recorded, when appropriate. During the three and nine months ended September 30, 2017, the Company sold loans of $57.4 million and $354.5 million, respectively, in the secondary market at net gains of $19 thousand and $1.2 million, respectively. In comparison, the Company sold loans of $45.8 million and $179.4 million for the three and nine months ended September 30, 2016, respectively, in the secondary market. Loan sales in the secondary market resulted in no gains or losses and $69 thousand in net gains recorded for the three and nine months ended September 30, 2016, respectively.
The Company records valuation adjustments in Net gains on sales of loans on the Consolidated Statements of Income to carry the loans held-for-sale portfolio at the lower of cost or fair value. For each of the three months ended September 30, 2017 and 2016, no valuation adjustments were recorded. For the nine months ended September 30, 2017 and 2016, the Company recorded $61 thousand and $2.4 million, respectively, in valuation adjustments.
Note 9 — Investments in Qualified Affordable Housing Partnerships, Tax Credit and Other Investments, Net
The CRA encourages banks to meet the credit needs of their communities, for housingparticularly low- and other purposes, particularly in neighborhoods with low or moderate income.moderate-income individuals and neighborhoods. The Company invests in certain affordable housing projects in the form of ownership interests in limited partnerships or limited liability companies that qualify for CRA consideration and tax credits. Such limited partnershipsThese entities are formed to develop and operate apartment complexes designed as high-quality affordable housing for lower income tenants throughout the U.S. EachTo fully utilize the available tax credits, each of the partnershipsthese entities must meet the affordable housing regulatory requirements for affordable housing for a 15-year minimum 15-year compliance period to fully utilize the tax credits. In addition to affordable housing limited partnerships, theperiod. The Company also invests in small business investment companies and new marketmarkets tax credit projects that qualify for CRA credits andconsideration, as well as eligible projects that qualify for production, historic and renewable energy and historic tax credits. Investments in new markets tax credits promote development in low-income communities, investments in production and renewable energy tax credits help promote the development of renewable energy sources, while theand investments in historic tax credits promote the rehabilitation of historic buildings and economic revitalization of the surrounding areas.
InvestmentsThe majority of affordable housing partnership, tax credit and CRA investments discussed above are variable interest entities where the Company is a limited partner in Qualified Affordable Housing Partnerships, Netthese investments, and an unrelated third party is typically the general partner or managing member who has control over the significant activities of these investments. While the Company’s interest in some of the investments may exceed 50% of the outstanding equity interests, the Company does not consolidate these investments due to the general partner’s or managing member’s ability to manage the entity, which is indicative of the general partner’s or managing member’s power over the entity. The Company’s maximum exposure to loss in connection with these partnerships consists of the unamortized investment balance and any tax credits claimed that may become subject to recapture.
The Company records its investments in qualifiedqualifying affordable housing partnerships, net, using PAM. Following the proportional amortization method. Under the proportional amortization method,adoption of ASU 2023-02 on January 1, 2024, the Company amortizeselects to account for its tax credit investments using PAM on a program-by-program basis if certain conditions are met. For the initial costCompany’s accounting policies on PAM, see Note 2— Current Accounting Developments and Summary of the investment in proportion Significant Accounting Policies — Significant Accounting Policies Update — Income Taxes to the tax credits and other tax benefits received, and recognizes the amortizationConsolidated Financial Statements in Income tax expensethis Form 10-Q. For discussion on the Company’s impairment evaluation and monitoring process of tax credit investments, refer to Note 3 — Fair Value Measurement and Fair Value of Financial Instruments— Affordable Housing Partnerships, Tax Credit and Community Reinvestment Act Investments, Net to the Consolidated Financial Statements of Income.in this Form 10-Q.
The following table presents the balancesinvestments and unfunded commitments of the Company’s investments in qualified affordable housing partnerships,partnership, tax credit, and CRA investments, net and related unfunded commitments as of March 31, 2024 and December 31, 2023:
| | | | | | | | | | | | | | | | | | | | | | | | | | |
|
| | March 31, 2024 | | December 31, 2023 |
| ($ in thousands) | | Assets | | Liabilities - Unfunded Commitments (1) | | Assets | | Liabilities - Unfunded Commitments (1) |
| | | | | | | | |
| PAM: | | | | | | | | |
| Affordable housing partnership investments | | $ | 432,073 | | | $ | 255,217 | | | $ | 419,785 | | | $ | 251,746 | |
| Tax credit and CRA investments | | 228,901 | | | 117,022 | | | — | | | — | |
| Equity method of accounting and other: | | | | | | | | |
| Tax credits and CRA investments | | 272,213 | | | 147,147 | | | 485,251 | | | 298,990 | |
| Total | | $ | 933,187 | | | $ | 519,386 | | | $ | 905,036 | | | $ | 550,736 | |
|
(1)Included in Accrued expenses and other liabilities on the periods indicated:Consolidated Balance Sheet.
|
| | | | | | | | |
| |
| ($ in thousands) | | September 30, 2017 | | December 31, 2016 |
| Investments in qualified affordable housing partnerships, net | | $ | 178,344 |
| | $ | 183,917 |
|
| Accrued expenses and other liabilities — Unfunded commitments | | $ | 63,607 |
| | $ | 57,243 |
|
| |
The following table presents additional information related to the Company’sinvestments in affordable housing partnership, tax credit and CRA investments for the three months ended March 31, 2024 and 2023:
| | | | | | | | | | | | | | | | | | | | | | |
|
| | Three Months Ended March 31, | | | |
| ($ in thousands) | | 2024 | | 2023 | | | | | | | | |
Tax credits and benefits(1): | | | | | | | | | | | | |
| PAM: | | | | | | | | | | | | |
| Affordable housing partnership investments | | $ | 18,419 | | | $ | 16,094 | | | | | | | | | |
| Tax credit and CRA investments | | 27,149 | | | — | | | | | | | | | |
| Equity method of accounting and other: | | | | | | | | | | | | |
| Tax credit and CRA investments | | 12,594 | | | 14,498 | | | | | | | | | |
| Total tax credits and benefits | | $ | 58,162 | | | $ | 30,592 | | | | | | | | | |
| | | | | | | | | | | | |
| Amortization: | | | | | | | | | | | | |
| PAM: | | | | | | | | | | | | |
Affordable housing partnership investments (2) | | $ | 13,869 | | | $ | 12,666 | | | | | | | | | |
Tax credit and CRA investments (3) | | 23,301 | | | — | | | | | | | | | |
| Equity method of accounting and other: | | | | | | | | | | | | |
Tax credit and CRA investments (4) | | 13,207 | | | 10,110 | | | | | | | | | |
| Total amortization | | $ | 50,377 | | | $ | 22,776 | | | | | | | | | |
| | | | | | | | | | | | |
| | | | | | | | | | | | |
| | | | | | | | | | | | |
(1)Included in Income tax expense on the Consolidated Statement of Income for the three months ended March 31, 2024 and 2023.
(2)Amortization related to investments in qualified affordable housing partnerships net,under PAM was recorded in Income tax expense on the Consolidated Statement of Income for the periods indicated:three months ended March 31, 2024 and 2023.
(3)Due to the adoption of ASU 2023-02 on January 1, 2024, amortization related to qualifying tax credit investments under PAM was recorded in Income tax expense on the Consolidated Statement of Income for the three months ended March 31, 2024. |
| | | | | | | | | | | | | | | | |
| | | | | | | | | |
| ($ in thousands) | | Three Months Ended
September 30, | | Nine Months Ended
September 30, |
| | 2017 | | 2016 | | 2017 | | 2016 |
| Tax credits and other tax benefits recognized | | $ | 15,840 |
| | $ | 8,591 |
| | $ | 35,027 |
| | $ | 26,561 |
|
| Amortization expense included in income tax expense | | $ | 8,944 |
| | $ | 6,612 |
| | $ | 22,945 |
| | $ | 20,923 |
|
| | | | | | | | | |
Investments in Tax Credit and Other Investments, Net
Investments in(4)Amortization related to tax credit and otherCRA investments net, were $203.8 million and $173.3 million as of September 30, 2017 and December 31, 2016, respectively. The Company is not the primary beneficiarywas recognized in these partnerships and, therefore, is not required to consolidate its investments in tax credit and other investments on the Consolidated Financial Statements. Depending on the ownership percentage and the influence the Company has on the limited partnership, the Company applies either the equity or cost method of accounting.
Total unfunded commitments for these investments were $103.0 million and $117.0 million as of September 30, 2017 and December 31, 2016, respectively, and are included in Accrued expenses and other liabilities on the Consolidated Balance Sheets. Amortization of tax credit and otherCRA investments was $23.8 million and $32.6 million as part of noninterest expense on the Consolidated Statement Income for the three months ended September 30, 2017March 31, 2024 and 2016,2023.
The Company also held equity securities without readily determinable fair values totaling $147 million and $146 million as of March 31, 2024 and December 31, 2023, respectively. Amortization ofEquity securities without readily determinable fair values are included in Other Assets and Affordable housing partnership, tax credit and otherCRA investments, was $66.1 million and $60.8 million fornet on the nine months ended September 30, 2017 and 2016, respectively.Consolidated Balance Sheet.
Note 10—Goodwill and Other Intangible Assets
Goodwill
Total goodwill of $469.4was $466 million remained unchanged as of September 30, 2017 compared toboth March 31, 2024 and December 31, 2016. Goodwill2023. The Company’s goodwill impairment test is tested for impairment on an annual basisperformed annually, as of December 31,st, or more frequently as events occur or circumstances change that would more likely than notmore-likely-than-not reduce the fair value of a reporting unit below its carrying amount. The Company’s three operating segments, Retail Banking, Commercial Banking and Other, are equivalent tovalue. Based on the Company’s reporting units. For complete discussion and disclosure, see Note 15 — Business Segments to the Consolidated Financial Statements.
Impairment Analysis
The Company performed its annual goodwill impairment analysistest as of December 31, 2016 and concluded that2023, there was no impairment. Additional information pertaining to the Company’s accounting policy for goodwill impairment as the fair valuesis summarized in Note 1 — Summary of all reporting units exceeded the carrying amounts of goodwill. There were no triggering events during the nine months ended September 30, 2017, and therefore, no additional goodwill impairment analysis was performed. No assurance can be given that goodwill will not be written down in future periods. Refer to Note 9 Significant Accounting Policies — Significant Accounting Policies — Goodwill and Other Intangible Assetsto the Consolidated Financial Statements ofin the Company’s 20162023 Form 10-K for10-K. The Company performed an analysis of goodwill during the first quarter of 2024 that consisted of a qualitative assessment to determine if it was more likely than not that the carrying values of each reporting unit exceeded their estimated fair values. The results of this analysis indicated that no impairment of goodwill existed as of March 31, 2024.
The Company has an equity method investment in Rayliant and its carrying value was $110 million as of March 31, 2024, of which $101 million was comprised of equity method goodwill. For additional details relatedinformation on this investment, Note 7 - Investments in Qualified Affordable Housing Partnerships, Tax Credit and Other Investments, Net and Variable Interest Entities to the Consolidated Financial Statements in the Company’s annual goodwill impairment analysis.2023 Form 10-K.
Core Deposit Intangibles
Note 10 — Short-Term Borrowings and Long-Term Debt
Core deposit intangibles represent the intangible value of depositor relationships resulting from deposit liabilities assumed in various acquisitions and were included in Other assets on the Consolidated Balance Sheets. These intangibles are tested for impairment on an annual basis, or more frequently as events occur, or as current circumstances and conditions warrant. There were no impairment write-downs on core deposit intangibles for the nine months ended September 30, 2017 and 2016.
The following table presents details of the gross carrying value of intangible assetsCompany’s short-term and accumulated amortizationBTFP borrowings, FHLB advances, and long-term debt as of September 30, 2017March 31, 2024 and December 31, 2016:2023:
| | | | | | | | | | | | | | | | | | | | | | | | | | | | |
|
| | | | | | | | March 31, 2024 | | December 31, 2023 |
| ($ in thousands) | | | | Interest Rates | | Maturity Dates | | Amount | | Amount |
| | | | | | | | | | |
| | | | | | | | | | |
| | | | | | | | | | |
| Bank | | | | | | | | | | |
| Short-term borrowings | | | | 4.75% — 4.83% | | April 2024 | | $ | 19,173 | | | $ | — | |
| BTFP borrowings | | | | 4.37% | | 3/19/2024 | | $ | — | | | $ | 4,500,000 | |
FHLB advances (1) — floating (2) | | | | 5.49% — 5.56% | | 2024 — 2025 | | $ | 3,500,000 | | | $ | — | |
| Parent company | | | | | | | | | | |
Junior subordinated debt (3) — floating (2) | | | | 7.14% | | 12/15/2035 | | $ | 31,768 | | | $ | 148,249 | |
| | | | | | | | | | |
| | | | | | | | | | |
| | | | | | | | | | |
|
|
| | | | | | | | |
| |
| ($ in thousands) | | September 30, 2017 | | December 31, 2016 |
| Gross balance | | $ | 108,814 |
| | $ | 108,814 |
|
| Accumulated amortization | | (86,140 | ) | | (80,825 | ) |
| Net carrying balance | | $ | 22,674 |
| | $ | 27,989 |
|
| |
Amortization Expense
The Company amortizes the core deposit intangibles(2)Floating interest rates are based on the projected useful livesSecured Overnight Financing Rate plus the established spread.
(3)The weighted-average interest rates for junior subordinated debt were 7.14% and 6.87% as of March 31, 2024 and December 31, 2023, respectively.
The Bank’s available borrowing capacity from FHLB advances totaled $7.6 billion as of March 31, 2024. The Bank’s available borrowing capacity from the related deposits. The amortization expense relatedFHLB is derived from its portfolio of loans that are pledged to the intangible assets was $1.7FHLB, reduced by any outstanding FHLB advances. As of March 31, 2024, all advances were secured by real estate loans.
During the first quarter of 2024, the Company redeemed approximately $117 million of junior subordinated debt and $2.0 million forrepaid $4.5 billion of BTFP borrowings upon maturity. For additional information on the three months ended September 30, 2017BTFP and 2016, respectively,junior subordinated debt, refer to Note 10— Short-Term Borrowings and $5.3 million and $6.2 million forLong-Term Debt to the nine months ended September 30, 2017 and 2016, respectively.Consolidated Financial Statements in the Company’s 2023 Form 10-K.
The following table presents the estimated future amortization expense of core deposit intangibles:
|
| | | | |
| |
| Year Ended December 31, | | Amount ($ in thousands) |
| Remainder of 2017 | | $ | 1,620 |
|
| 2018 | | 5,883 |
|
| 2019 | | 4,864 |
|
| 2020 | | 3,846 |
|
| 2021 | | 2,833 |
|
| Thereafter | | 3,628 |
|
| Total | | $ | 22,674 |
|
| |
Note 11—Commitments and Contingencies
Commitments to Extend Credit Extensions — In the normal course of business, the Company has variousprovides loan commitments and letters of credit to customers on predetermined terms. These outstanding commitments to extend credit that are not reflected in the accompanying Consolidated Financial Statements. While the Company does not anticipate losses as a result offrom these transactions, commitments to extend credit are included in determining the appropriate level of the allowance for unfunded commitments, and outstanding commercial and standby letters of credit (“SBLCs”). commitments.
The following table presents the Company’s credit-related commitments as of the periods indicated:March 31, 2024 and December 31, 2023:
| | | | | | | | | | | | | | | | | | | | | | | | | | | | | | | | | | | | | | |
|
| | March 31, 2024 | | December 31, 2023 |
| ($ in thousands) | | Expire in One Year or Less | | Expire After One Year Through Three Years | | Expire After Three Years Through Five Years | | Expire After Five Years | | Total | | Total |
| Loan commitments | | $ | 4,794,033 | | | $ | 3,622,191 | | | $ | 799,699 | | | $ | 151,877 | | | $ | 9,367,800 | | | $ | 9,141,447 | |
| Commercial letters of credit and standby letters of credit (“SBLCs”) | | 1,025,797 | | | 434,373 | | | 143,006 | | | 1,140,456 | | | 2,743,632 | | | 2,610,761 | |
| Total | | $ | 5,819,830 | | | $ | 4,056,564 | | | $ | 942,705 | | | $ | 1,292,333 | | | $ | 12,111,432 | | | $ | 11,752,208 | |
|
| | | | |
| | | | | | | | | | | | |
| | | | | | | | | | | | |
| | | | | | | | | | | | |
|
| | | | | | | | |
| |
| ($ in thousands) | | September 30, 2017 | | December 31, 2016 |
| Loan commitments | | $ | 4,956,515 |
| | $ | 5,077,869 |
|
| Commercial letters of credit and SBLCs | | $ | 1,757,648 |
| | $ | 1,525,613 |
|
| |
Loan commitments are agreements to lend to a customercustomers provided that there are no violations of any conditions established in the agreement. Commitments generally have fixed expiration dates or other termination clauses and may require maintenance of compensatory balances.commitment fees. Since many of the commitments are expected to expire without being drawn upon, the total commitment amounts do not necessarily represent future funding requirements.
Commercial letters of credit are issued to facilitate domestic and foreign trade transactions, while SBLCs are generally contingent upon the failure of the customers to perform according to the terms of the underlying contract with the third party. As a result, the total contractual amounts do not necessarily represent future funding requirements. The Company’s historical experience is that SBLCs typically expire without being funded. Additionally, in many cases, the Company holds collateral in various forms against these SBLCs. As a part of its risk management activities, the Company monitors the creditworthiness of customers in conjunction with its SBLC exposure. Customers are obligated to reimburse the Company for any payment made on the customers’ behalf. If the customers fail to pay, the Company would, as applicable, liquidate the collateral and/or offset existing accounts. As of September 30, 2017,March 31, 2024, total letters of credit which amounted to $1.76of $2.7 billion were comprisedconsisted of SBLCs of $1.70$2.7 billion and commercial letters of credit of $59.1$26 million. In comparison, as of December 31, 2023, total letters of credit of $2.6 billion consisted of SBLCs of $2.6 billion and commercial letters of credit of $24 million. As of both March 31, 2024 and December 31, 2023, substantially all letters of credit were graded “Pass” using the Bank’s internal credit risk rating system.
The Company usesapplies the same credit underwriting criteria in extendingto extend loans, commitments, and conditional obligations to customers. Each customer’s creditworthiness is evaluated on a case-by-case basis. Collateral and financial guarantees may be obtained based on management’s assessment of thea customer’s credit.credit risk. Collateral may include cash, accounts receivable, inventory, personal property, plant and equipment, and income-producing commercialreal estate property.
Estimated exposure to loss from these commitments is included in the allowance for unfunded credit reserves,commitments and amounted to $14.0$39 million and $38 million as of September 30, 2017March 31, 2024 and $15.7 million as of December 31, 2016. These amounts are included in Accrued expenses2023, respectively.
Guarantees — From time to time, the Company sells or securitizes single-family and other liabilities on the Consolidated Balance Sheets.
Guarantees — The Company has sold or securitizedmultifamily residential loans with recourse in the ordinary course of business. The Company is obligated to repurchase up to the recourse component inof the loans if the loans default. The following table presents the carrying amounts of loans sold or securitized with recourse is considered a guarantee. Asand the guarantor, the Company is obligated to makemaximum potential future payments when the loans default. Asas of September 30, 2017March 31, 2024 and December 31, 2016, the unpaid principal balance of total single-family and multifamily residential loans sold or securitized with recourse amounted to $121.2 million and $150.5 million, respectively. 2023:
| | | | | | | | | | | | | | | | | | | | | | | | | | | | | | | | | | | | | | | | | | | | | | | | | | | | | | | | | | | | |
| | | | | | | | |
| | Maximum Potential Future Payments | | Carrying Value | | | | | | | | |
| | March 31, 2024 | | December 31, 2023 | | March 31, 2024 | | December 31, 2023 | | | | | | | | |
| ($ in thousands) | | Expire in One Year or Less | | | | Expire After One Year Through Three Years | | Expire After Three Years Through Five Years | | Expire After Five Years | | Total | | Total | | Total | | Total | | | | | | | | |
| Single-family residential loans sold or securitized with recourse | | $ | 7 | | | | | $ | 17 | | | $ | 26 | | | $ | 5,363 | | | $ | 5,413 | | | $ | 5,888 | | | $ | 5,413 | | | $ | 5,888 | | | | | | | | | |
| Multifamily residential loans sold or securitized with recourse | | — | | | | | — | | | 160 | | | 14,836 | | | 14,996 | | | 14,996 | | | 18,756 | | | 19,020 | | | | | | | | | |
| Total | | $ | 7 | | | | | $ | 17 | | | $ | 186 | | | $ | 20,199 | | | $ | 20,409 | | | $ | 20,884 | | | $ | 24,169 | | | $ | 24,908 | | | | | | | | | |
| | | | | | | | |
| | | | | | | | | | | | |
| | | | | | | | | | | | | | | | | | | | | | | | | | |
| | | | | | | | | | | | | | | | | | | | | | | | | | |
| | | | | | | | | | | | | | | | | | | | | | | | | | |
The Company’s recourse reserve related to these guarantees is included in the allowance for unfunded credit reserves,commitments and totaled $256 thousand and $373$40 thousand as of September 30, 2017both March 31, 2024 and December 31, 2016, respectively.2023. The allowance for unfunded credit reservescommitments is included inAccrued expenses and other liabilities on the Consolidated Balance Sheets.Sheet. The Company continues to experience minimal losses from the single-family and multifamily residential loan portfolios sold or securitized with recourse.
Litigation — The Company is a party to various legal actions arising in the ordinary course of its business. In accordance with ASC 450, Contingencies,, the Company accrues reserves for outstanding lawsuits, claims and proceedings when a loss contingency is probable and can be reasonably estimated. The Company estimates the amount of loss contingencies using current available information from legal proceedings, advice from legal counsel and available insurance coverage. Due to the inherent subjectivity of the assessments and unpredictability of the outcomes of the legal proceedings, any amounts accrued or included in this aggregate amount may not represent the ultimate loss to the Company from the legal proceedings in question. Thus, the Company’s exposure and ultimate losses may be higher, and possibly significantly more, than the amounts accrued.
Other Commitments — The Company has commitmentsWhile it is impossible to invest in qualified affordable housing partnerships, tax credit and other investments as discussed in Note 9 — Investments in Qualified Affordable Housing Partnerships, Tax Credit and Other Investments, Net ascertain the ultimate resolution or range of financial liability, based on information known to the Consolidated Financial Statements. These commitmentsCompany as of March 31, 2024, the Company does not believe there are payable on demand. As of September 30, 2017 and December 31, 2016, these commitments were $166.6 million and $174.3 million, respectively. These commitments are includedany pending legal proceedings to which the Company is a party that, individually or in Accrued expenses and other liabilitiesthe aggregate, would reasonably be expected to have a material adverse effect on the Consolidated Balance Sheets.Company’s financial condition. In light of the inherent uncertainty in legal proceedings, however, there can be no assurance that the ultimate resolution will not exceed established reserves and it is possible that the outcome of a particular matter, or a combination of matters, may be material to the Company’s financial condition for a particular period, depending upon the size of the loss and the Company’s income for that particular period.
Note 12—Stock Compensation Plans
Pursuant to the Company’s 20162021 Stock Incentive Plan, as amended, the Company may issue stock, stock options, restricted stock, awards (“RSAs”),RSUs including performance-based RSUs, stock purchase warrants, stock appreciation rights, stock purchase warrants, phantom stock and dividend equivalents to certaineligible employees, and non-employee directors, consultants, and other service providers of the CompanyEast West and its subsidiaries. The Company has granted RSUs as its primary incentive awards. There were no outstanding stock options or unvested RSAsawards other than RSUs as of September 30, 2017both March 31, 2024 and 2016.December 31, 2023.
RSUs are granted under the Company’s long-term incentive plan at no cost to the recipient. RSUs vest ratably over three years or cliff vest after three or five years of continued employment from the date of the grant. RSUs entitle the recipient to receive cash dividends equivalent to any dividends paid on the underlying common stock during the period the RSUs are outstanding. RSU dividends are accrued during the vesting period and are paid at the time of vesting. While a portion of RSUs are time-vesting awards, others vest subject to the attainment of specified performance goals referred to as “Performance-based RSUs.” All RSUs are subject to forfeiture until vested.
Performance-based RSUs are granted at the target amount of awards. Based on the Company’s attainment of specified performance goals and consideration of market conditions, the number of shares that vest can be adjusted to a minimum of zero and to a maximum of 200% of the target. The amount of performance-based RSUs that are eligible to vest is determined at the end of each performance period and is then added together to determine the total number of performance shares that are eligible to vest. Performance-based RSUs cliff vest three years from the date of grant.
Compensation costs for the time-based awards are based on the quoted market price of the Company’s stock at the grant date. Compensation costs associated with performance-based RSUs are based on grant date fair value which considers both market and performance conditions, and is subject to subsequent adjustments based on the changes in the Company’s stock price and the projected outcome of the performance criteria. Compensation costs of both time-based and performance-based awards are recognized on a straight-line basis from the grant date until the vesting date of each grant.
The following table presents a summary of the total share-based compensation expense and the related net tax benefitbenefits associated with the Company’s various employee share-based compensation plans for the three and nine months ended September 30, 2017March 31, 2024 and 2016:2023:
| | | | | | | | | | | | | | | | | | | | |
|
| | | | | | Three Months Ended March 31, |
| ($ in thousands) | | | | | | | | 2024 | | 2023 |
| Stock compensation costs | | | | | | | | $ | 12,988 | | | $ | 11,075 | |
| Related net tax benefits for stock compensation plans | | | | | | | | $ | 783 | | | $ | 8,290 | |
|
|
| | | | | | | | | | | | | | | | |
| |
| ($ in thousands) | | Three Months Ended
September 30, | | Nine Months Ended
September 30, |
| | 2017 | | 2016 | | 2017 | | 2016 |
| Stock compensation costs | | $ | 5,665 |
| | $ | 4,763 |
| | $ | 15,780 |
| | $ | 13,973 |
|
| Related net tax benefits for stock compensation plans | | $ | 151 |
| | $ | 14 |
| | $ | 4,614 |
| | $ | 1,019 |
|
| |
Effective January 1, 2017,Restricted Stock Units — RSUs are granted under the Company adopted ASU 2016-09, Compensation — Stock Compensation (Topic 718): ImprovementsCompany’s long-term incentive plan at no cost to Employee Share-Based Payment Accounting. As a resultthe recipient. RSUs generally cliff vest after three years of continued employment from the date of the adoptiongrant, and are authorized to settle in shares of this new guidance, all excess tax benefitsthe Company’s common stock. Dividends are accrued during the vesting period and deficiencies on share-based paymentpaid at the time of vesting. While a portion of RSUs are time-based vesting awards, were recognized within Income tax expenseothers vest subject to the attainment of additional specified performance goals, referred to as “performance-based RSUs.” Performance-based RSUs are granted annually upon approval by the Company’s Compensation and Management Development Committee based on the performance in the year prior to the grant date of the award. The number of awards that vest can range from zero percent to a maximum of 200% of the granted number of awards based on the Company’s achievement of specified performance criteria over a performance period of three years. For information on accounting on stock-based compensation plans, see Note 1 — Summary of Significant Accounting Policies — Significant Accounting Policies — Stock-Based Compensation to the Consolidated Financial Statements of Income for the three and nine months ended September 30, 2017. For the three and nine months ended September 30, 2016, these tax benefits were recorded as increases to Additional paid-in capital on the Consolidated Statements of Changes in Stockholders’ Equity.Company’s 2023 Form 10-K.
The following table presents a summary of the activityactivities for the Company’s time-basedtime- and performance-based RSUs that were settled in shares for the ninethree months ended September 30, 2017 basedMarch 31, 2024. The number of performance-based RSUs stated below reflects the number of awards granted on the target amount of awards:grant date.
| | | | | | | | | | | | | | | | | | | | | | | | | | | | | | | | | | |
|
| | | | |
| | | | | | | | | | |
| | | | | | Time-Based RSUs | | Performance-Based RSUs |
| | | | | | | | | | Shares | | Weighted-Average Grant Date Fair Value | | Shares | | Weighted-Average Grant Date Fair Value |
| Outstanding, January 1, 2024 | | | | | | | | | | 1,206,518 | | | $ | 74.29 | | | 276,223 | | | $ | 78.59 | |
| | | | | | | | | | | | | | | | |
| Granted | | | | | | | | | | 515,235 | | | 75.79 | | | 97,798 | | | 80.28 | |
| Vested | | | | | | | | | | (299,381) | | | 71.68 | | | (91,960) | | | 77.67 | |
| Forfeited | | | | | | | | | | (12,163) | | | 75.24 | | | — | | | — | |
| Outstanding, March 31, 2024 | | | | | | | | | | 1,410,209 | | | $ | 75.39 | | | 282,061 | | | $ | 79.48 | |
|
|
| | | | | | | | | | | | | | |
| |
| | | Nine Months Ended September 30, 2017 |
| | Time-Based RSUs | | Performance-Based RSUs |
| | Shares | | Weighted Average Grant-Date Fair Value | | Shares | | Weighted Average Grant-Date Fair Value |
| Outstanding, beginning of period | | 1,218,714 |
| | $ | 35.92 |
| | 410,746 |
| | $ | 35.27 |
|
| Granted | | 370,514 |
| | 54.71 |
| | 131,597 |
| | 56.59 |
|
| Vested | | (299,164 | ) | | 36.68 |
| | (118,044 | ) | | 36.85 |
|
| Forfeited | | (131,472 | ) | | 40.05 |
| | — |
| | — |
|
| Outstanding, end of period | | 1,158,592 |
| | $ | 41.26 |
| | 424,299 |
| | $ | 41.44 |
|
| |
As of September 30, 2017, totalMarch 31, 2024, there were $51 million of unrecognized compensation costs related to unvested time-based and performance-based RSUs amounted to $28.2 million and $15.3 million, respectively. These costs are expected to be recognized over a weighted averageweighted-average period of 2.002.3 years, and 2.02 years, respectively.$25 million of unrecognized compensation costs related to unvested performance-based RSUs expected to be recognized over a weighted-average period of 2.3 years.
Note 13 — Stockholders’ Equity and Earnings Per Share
Warrant — The Company acquired MetroCorp Bancshares, Inc., (“MetroCorp”)following table presents the basic and diluted EPS calculations for the three months ended March 31, 2024 and 2023. For more information on January 17, 2014. Prior to the acquisition, MetroCorp had an outstanding warrant to purchase 771,429 shares of its common stock. Upon the acquisition, the rights of the warrant holder were converted into the right to acquire 230,282 shares of East West’s common stock until January 16, 2019. The warrant has not been exercised as of September 30, 2017.
Earnings Per Share— Basic EPS is computed by dividing net income available to common stockholders by the weighted average number of common shares outstanding during each period. Diluted EPS is computed by dividing net income available to common stockholders by the weighted average number of common shares outstanding during each period, plus common share equivalents calculated for warrants and RSUs outstanding using the treasury stock method. With the adoption of ASU 2016-09 during the first quarter of 2017, the impact of excess tax benefits and deficiencies is no longer included in the calculation of diluted EPS. As a resultEPS, see Note 1 — Summary of applying ASU 2016-09, the Company recorded income tax benefits of $151 thousand or $0 per common share, and $4.6 million or $0.03 per common share for the three and nine months ended September 30, 2017, respectively, related to the vesting of the RSUs. See Note 2 — CurrentSignificant Accounting Developments Policies— Significant Accounting Policies —Earnings Per Shareto the Consolidated Financial Statements for additional information.in the Company’s 2023 Form 10-K.
| | | | | | | | | | | | | | | | | | | | | | | | | | | | | |
|
| ($ and shares in thousands, except per share data) | | | | Three months ended March 31, | | | | | | | |
| | | | | 2024 | | 2023 | | | | | | | | | | | |
| Basic: | | | | | | | | | | | | | | | | | | | |
| Net income | | | | | | $ | 285,075 | | | $ | 322,439 | | | | | | | | | | | | |
| Weighted-average number of shares outstanding | | | | | | 139,409 | | | 141,112 | | | | | | | | | | | | |
| Basic EPS | | | | | | $ | 2.04 | | | $ | 2.28 | | | | | | | | | | | | |
| Diluted: | | | | | | | | | | | | | | | | | | | |
| Net income | | | | | | $ | 285,075 | | | $ | 322,439 | | | | | | | | | | | | |
| | | | | | | | | | | | | | | | | | | |
| Weighted-average number of shares outstanding | | | | | | 139,409 | | | 141,112 | | | | | | | | | | | | |
| Add: Dilutive impact of unvested RSUs | | | | | | 852 | | | 801 | | | | | | | | | | | | |
| Diluted weighted-average number of shares outstanding | | | | | | 140,261 | | | 141,913 | | | | | | | | | | | | |
| Diluted EPS | | | | | | $ | 2.03 | | | $ | 2.27 | | | | | | | | | | | | |
|
The following table presents the EPS calculations for the three and nine months ended September 30, 2017 and 2016:
|
| | | | | | | | | | | | | | | | |
| |
| | | Three Months Ended
September 30, | | Nine Months Ended
September 30, |
| ($ and shares in thousands, except per share data) | | 2017 | | 2016 | | 2017 | | 2016 |
| Basic | | | | | | | | |
| Net income | | $ | 132,660 |
| | $ | 110,143 |
| | $ | 420,726 |
| | $ | 320,943 |
|
| | | | | | | | | |
| Basic weighted average number of shares outstanding | | 144,498 |
| | 144,122 |
| | 144,412 |
| | 144,061 |
|
| Basic EPS | | $ | 0.92 |
| | $ | 0.76 |
| | $ | 2.91 |
| | $ | 2.23 |
|
| | | | | | | | | |
| Diluted | | | | | | | | |
| Net income | | $ | 132,660 |
| | $ | 110,143 |
| | $ | 420,726 |
| | $ | 320,943 |
|
| | | | | | | | | |
| Basic weighted average number of shares outstanding | | 144,498 |
| | 144,122 |
| | 144,412 |
| | 144,061 |
|
Diluted potential common shares (1) | | 1,384 |
| | 1,116 |
| | 1,437 |
| | 1,025 |
|
| Diluted weighted average number of shares outstanding | | 145,882 |
| | 145,238 |
| | 145,849 |
| | 145,086 |
|
| Diluted EPS | | $ | 0.91 |
| | $ | 0.76 |
| | $ | 2.88 |
| | $ | 2.21 |
|
| |
| |
(1) | Includes dilutive shares from RSUs and warrants for the three and nine months ended September 30, 2017 and 2016. |
For the three and nine months ended September 30, 2017, 4Approximately 170 thousand and 6417 thousand weighted averageweighted-average shares of anti-dilutive shares from RSUs respectively, were excluded from the diluted EPS computation.computations for the three months ended March 31, 2024 and 2023, respectively.
Stock Repurchase Program — In 2020, the Company’s Board of Directors authorized a stock repurchase program to buy back up to $500 million of the Company’s common stock. For the three and nine months ended September 30, 2016, 2 thousand and 7 thousand weightedMarch 31, 2024, the Company repurchased 1,181,851 shares at an average anti-dilutiveprice of $69.76 per share at $82 million. The Company did not repurchase any shares from RSUs, respectively, were excluded fromduring the diluted EPS computation.three months ended March 31, 2023. As of March 31, 2024, the Company had approximately $89 million available for repurchases under its stock repurchase program.
Note 14 — Accumulated Other Comprehensive Income (Loss)
The following tables presenttable presents the changes in the components of AOCI balances for the three and nine months ended September 30, 2017March 31, 2024 and 2016:2023:
| | | | ($ in thousands) | | Three Months Ended September 30, |
| | 2017 | | 2016 |
| | Available-
for-Sale
Investment
Securities | | Foreign
Currency
Translation
Adjustments (1) | | Total | | Available-
for-Sale
Investment
Securities | | Foreign
Currency
Translation
Adjustments (1) | | Total |
| Beginning balance | | $ | (18,950 | ) | | $ | (15,231 | ) | | $ | (34,181 | ) | | $ | 11,756 |
| | $ | (13,468 | ) | | $ | (1,712 | ) |
| ($ in thousands) | |
| ($ in thousands) | |
| ($ in thousands) | |
| ($ in thousands) | |
| ($ in thousands) | |
| ($ in thousands) | |
| ($ in thousands) | |
| ($ in thousands) | |
| ($ in thousands) | |
| ($ in thousands) | |
| ($ in thousands) | |
| ($ in thousands) | |
| ($ in thousands) | |
| ($ in thousands) | |
| ($ in thousands) | |
| ($ in thousands) | |
| ($ in thousands) | |
| ($ in thousands) | |
| ($ in thousands) | |
| ($ in thousands) | |
| ($ in thousands) | |
| ($ in thousands) | |
| ($ in thousands) | |
| ($ in thousands) | | | Debt Securities (1) | | Cash Flow Hedges | | Foreign Currency Translation Adjustments (2) | | Total |
| Balance, January 1, 2023 | |
| Net unrealized gains arising during the period | |
| Amounts reclassified from AOCI | |
| Changes, net of tax | |
| Balance, March 31, 2023 | |
| | Balance, January 1, 2024 | |
| Balance, January 1, 2024 | |
| Balance, January 1, 2024 | |
| Net unrealized (losses) gains arising during the period | | (1,014 | ) | | 3,870 |
| | 2,856 |
| | (3,869 | ) | | (555 | ) | | (4,424 | ) |
| Amounts reclassified from AOCI | | (892 | ) | | — |
| | (892 | ) | | (1,038 | ) | | — |
| | (1,038 | ) |
| Changes, net of taxes | | (1,906 | ) | | 3,870 |
| | 1,964 |
| | (4,907 | ) | | (555 | ) | | (5,462 | ) |
| Ending balance | | $ | (20,856 | ) | | $ | (11,361 | ) | | $ | (32,217 | ) | | $ | 6,849 |
| | $ | (14,023 | ) | | $ | (7,174 | ) |
| Changes, net of tax | |
| Balance, March 31, 2024 | |
|
|
| | | | | | | | | | | | | | | | | | | | | | | | |
| |
| ($ in thousands) | | Nine Months Ended September 30, |
| | 2017 | | 2016 |
| | Available-
for-Sale
Investment
Securities | | Foreign
Currency
Translation
Adjustments (1) | | Total | | Available-
for-Sale
Investment
Securities | | Foreign
Currency
Translation
Adjustments (1) | | Total |
| Beginning balance | | $ | (28,772 | ) | | $ | (19,374 | ) | | $ | (48,146 | ) | | $ | (6,144 | ) | | $ | (8,797 | ) | | $ | (14,941 | ) |
| Net unrealized gains (losses) arising during the period | | 11,818 |
| | 8,013 |
| | 19,831 |
| | 17,901 |
| | (5,226 | ) | | 12,675 |
|
| Amounts reclassified from AOCI | | (3,902 | ) | | — |
| | (3,902 | ) | | (4,908 | ) | | — |
| | (4,908 | ) |
| Changes, net of taxes | | 7,916 |
| | 8,013 |
| | 15,929 |
| | 12,993 |
| | (5,226 | ) | | 7,767 |
|
| Ending balance | | $ | (20,856 | ) | | $ | (11,361 | ) | | $ | (32,217 | ) | | $ | 6,849 |
| | $ | (14,023 | ) | | $ | (7,174 | ) |
| | | | | | | | | | | | | |
The following tables present the operating results and other key financial measures for the individual operating segments as of and for the three and nine months ended September 30, 2017March 31, 2024 and 2016:2023:
The following discussion provides information about the results of operations, financial condition, liquidity and capital resources of East West Bancorp, Inc. (referred to herein on an unconsolidated basis as “East West” and on a consolidated basis as the “Company”“Company,” “we” or “EWBC”), and its various subsidiaries, including theits subsidiary bank, East West Bank and its subsidiaries (referred to herein as “East West Bank” or the “Bank”). This information is intended to facilitate the understanding and assessment of significant changes and trends related to the Company’s results of operations and financial condition. This discussion and analysis should be read in conjunction with the Consolidated Financial Statements and the accompanying notes presented elsewhere in this report,Quarterly Report on Form 10-Q (this “Form 10-Q”), and the Company’s annual reportAnnual Report on Form 10-K for the year ended December 31, 20162023, filed with the United States (“U.S.”) Securities and Exchange Commission (“SEC”) on February 27, 201729, 2024 (the “Company’s 20162023 Form 10-K”).
The following table presents the interest spread, net interest margin, average balances, interest income and expense, and the average yield/rate by asset and liability component for the three months ended September 30, 2017first quarters of 2024 and 2016:2023:
|
| | | | | | | | | | | | | | | | | | | | | | |
| | | | | | | | | | | | | |
| ($ in thousands) | | Nine Months Ended September 30, |
| | 2017 | | 2016 |
| | Average Balance | | Interest | | Average Yield/ Rate(1) | | Average
Balance | | Interest | | Average Yield/ Rate(1) |
| ASSETS | | | | | | | | | | | | |
| Interest-earning assets: | | | | | | | | | | | | |
| Interest-bearing cash and deposits with banks | | $ | 2,073,322 |
| | $ | 22,298 |
| | 1.44 | % | | $ | 1,768,252 |
| | $ | 10,245 |
| | 0.77 | % |
Resale agreements (2) | | 1,552,198 |
| | 25,222 |
| | 2.17 | % | | 1,672,993 |
| | 22,479 |
| | 1.79 | % |
Investment securities (3) | | 3,060,688 |
| | 43,936 |
| (4) | 1.92 | % | | 3,289,014 |
| | 37,433 |
| (4) | 1.52 | % |
Loans (5) | | 26,783,082 |
| | 872,039 |
| (6) | 4.35 | % | | 24,006,926 |
| | 763,189 |
| (6) | 4.25 | % |
| Restricted equity securities | | 73,651 |
| | 1,859 |
| | 3.37 | % | | 76,122 |
| | 2,008 |
| | 3.52 | % |
| Total interest-earning assets | | 33,542,941 |
| | 965,354 |
| | 3.85 | % | | 30,813,307 |
| | 835,354 |
| | 3.62 | % |
| Noninterest-earning assets: | | | | | | | | | | | | |
| Cash and due from banks | | 387,440 |
| | | | | | 349,721 |
| | | | |
| Allowance for loan losses | | (268,477 | ) | | | | | | (264,088 | ) | | | | |
| Other assets | | 1,628,638 |
| | | | | | 1,763,505 |
| | | | |
| Total assets | | $ | 35,290,542 |
| | | | | | $ | 32,662,445 |
| | | | |
| LIABILITIES AND STOCKHOLDERS’ EQUITY | | | | | | | | |
| Interest-bearing liabilities: | | | | | | | | | | |
| Checking deposits | | $ | 3,830,004 |
| | $ | 12,538 |
| | 0.44 | % | | $ | 3,445,996 |
| | $ | 9,058 |
| | 0.35 | % |
| Money market deposits | | 7,968,457 |
| | 30,409 |
| | 0.51 | % | | 7,519,261 |
| | 19,295 |
| | 0.34 | % |
| Saving deposits | | 2,334,752 |
| | 4,525 |
| | 0.26 | % | | 2,043,547 |
| | 3,207 |
| | 0.21 | % |
| Time deposits | | 5,873,217 |
| | 34,331 |
| | 0.78 | % | | 5,941,760 |
| | 29,148 |
| | 0.66 | % |
| Federal funds purchased and other short-term borrowings | | 40,772 |
| | 877 |
| | 2.88 | % | | 19,384 |
| | 390 |
| | 2.69 | % |
| FHLB advances | | 414,355 |
| | 5,738 |
| | 1.85 | % | | 400,850 |
| | 4,153 |
| | 1.38 | % |
Repurchase agreements (2) | | 170,330 |
| | 7,538 |
| | 5.92 | % | | 182,482 |
| | 6,441 |
| | 4.71 | % |
| Long-term debt | | 181,337 |
| | 4,030 |
| | 2.97 | % | | 201,060 |
| | 3,726 |
| | 2.48 | % |
| Total interest-bearing liabilities | | 20,813,224 |
| | 99,986 |
| | 0.64 | % | | 19,754,340 |
| | 75,418 |
| | 0.51 | % |
| Noninterest-bearing liabilities and stockholders’ equity: | | | | | | | | | | |
| Demand deposits | | 10,323,254 |
| | | | | | 9,107,051 |
| | | | |
| Accrued expenses and other liabilities | | 524,002 |
| | | | | | 534,569 |
| | | | |
| Stockholders’ equity | | 3,630,062 |
| | | | | | 3,266,485 |
| | | | |
| Total liabilities and stockholders’ equity | | $ | 35,290,542 |
| | | | | | $ | 32,662,445 |
| | | | |
| Interest rate spread | | | | | | 3.21 | % | | | | | | 3.11 | % |
| Net interest income and net interest margin | | | | $ | 865,368 |
| | 3.45 | % | | | | $ | 759,936 |
| | 3.29 | % |
| | | | | | | | | | | | | |
| |
(2) | Average balances of resale and repurchase agreements are reported net, pursuant to ASC 210-20-45, Balance Sheet Offsetting.
|
| |
(3) | Yields on tax-exempt securities are not presented on a tax-equivalent basis. |
| |
(4) | Includes the amortization of net premiums on investment securities of $16.3 million and $18.2 million for the nine months ended September 30, 2017 and 2016, respectively. |
| |
(5) | Average balance includes nonperforming loans. |
| |
(6) | Interest income on loans includes net deferred loan fees, accretion of ASC 310-30 discounts and amortization of premiums, which totaled $21.1 million and $39.7 million for the nine months ended September 30, 2017 and 2016, respectively. |
The following table summarizes the extent to which changes in (1) interest rates, and changes in(2) volume of average interest-earning assets and average interest-bearing liabilities affectedimpacted the Company’s net interest income for the periods presented. The total change for each category of interest-earning assets and interest-bearing liabilities is segmented into the changechanges attributable to variations in volume and the change attributable to variations in interest rates.yield/rate. Changes that are not solely due to either volume or yield/rate are allocated proportionally based on the absolute value of the change related to average volume and average yield/rate. Nonaccrual
| | | | | | | | | | | | | | | | | | | | | | | | | | | | | | | | | | | | | | |
|
| | Three Months Ended March 31, | | | | | | | | | | |
| | 2024 vs. 2023 | | | | | | |
| | | | Changes Due to | | | | | | | | | | | | |
| ($ in thousands) | | Total Change | | Volume | | Yield/Rate | | | | | | | | | | | | | | | |
| Interest-earning assets: | | | | | | | | | | | | | | | | | | | | | | | | |
| Interest-bearing cash and deposits with banks | | $ | 38,735 | | | $ | 29,533 | | | $ | 9,202 | | | | | | | | | | | | | | | | | | | |
Assets purchased under resale agreements (1) | | 1,612 | | | 260 | | | 1,352 | | | | | | | | | | | | | | | | | | | |
| Debt securities: | | | | | | | | | | | | | | | | | | | | | | | | |
| AFS debt securities | | 9,661 | | | 4,384 | | | 5,277 | | | | | | | | | | | | | | | | | | | |
| HTM debt securities | | (200) | | | (125) | | | (75) | | | | | | | | | | | | | | | | | | | |
| Total debt securities | | 9,461 | | | 4,259 | | | 5,202 | | | | | | | | | | | | | | | | | | | |
| Loans: | | | | | | | | | | | | | | | | | | | | | | | | |
| C&I | | 50,237 | | | 16,678 | | | 33,559 | | | | | | | | | | | | | | | | | | | |
| CRE | | 41,623 | | | 19,582 | | | 22,041 | | | | | | | | | | | | | | | | | | | |
| Residential mortgage | | 46,180 | | | 24,098 | | | 22,082 | | | | | | | | | | | | | | | | | | | |
| Other consumer | | (37) | | | (198) | | | 161 | | | | | | | | | | | | | | | | | | | |
| Total loans | | 138,003 | | | 60,160 | | | 77,843 | | | | | | | | | | | | | | | | | | | |
| Restricted equity securities | | 300 | | | 27 | | | 273 | | | | | | | | | | | | | | | | | | | |
| Total interest and dividend income | | $ | 188,111 | | | $ | 94,239 | | | $ | 93,872 | | | | | | | | | | | | | | | | | | | |
| Interest-bearing liabilities: | | | | | | | | | | | | | | | | | | | | | | | | |
| Checking deposits | | $ | 30,647 | | | $ | 5,024 | | | $ | 25,623 | | | | | | | | | | | | | | | | | | | |
| Money market deposits | | 58,559 | | | 18,715 | | | 39,844 | | | | | | | | | | | | | | | | | | | |
| Savings deposits | | 451 | | | (1,103) | | | 1,554 | | | | | | | | | | | | | | | | | | | |
| Time deposits | | 99,748 | | | 38,819 | | | 60,929 | | | | | | | | | | | | | | | | | | | |
| Short-term and BTFP borrowings | | 33,281 | | | 33,338 | | | (57) | | | | | | | | | | | | | | | | | | | |
| FHLB advances | | 1,309 | | | 776 | | | 533 | | | | | | | | | | | | | | | | | | | |
| Repurchase agreements | | (1,017) | | | (1,314) | | | 297 | | | | | | | | | | | | | | | | | | | |
| Long-term debt and finance lease liabilities | | (145) | | | (469) | | | 324 | | | | | | | | | | | | | | | | | | | |
| Total interest expense | | $ | 222,833 | | | $ | 93,786 | | | $ | 129,047 | | | | | | | | | | | | | | | | | | | |
| Change in net interest income | | $ | (34,722) | | | $ | 453 | | | $ | (35,175) | | | | | | | | | | | | | | | | | | | |
|
(1)Includes the impact of securities and loans are included in average loans used to computepurchased under resale agreements for the table below:first quarter of 2023.
|
| | | | | | | | | | | | | | | | | | | | | | | | |
| |
| ($ in thousands) | | Three Months Ended September 30, | | Nine Months Ended September 30, |
| | 2017 vs. 2016 | | 2017 vs. 2016 |
| | Total Change | | Changes Due to | | Total Change | | Changes Due to |
| | | Volume | | Yield/Rate | | | Volume | | Yield/Rate |
| Interest-earning assets: | | | | | | | | |
| | |
| | |
|
| Interest-bearing cash and deposits with banks | | $ | 6,462 |
| | $ | 1,988 |
| | $ | 4,474 |
| | $ | 12,053 |
| | $ | 2,018 |
| | $ | 10,035 |
|
| Resale agreements | | 67 |
| | (2,566 | ) | | 2,633 |
| | 2,743 |
| | (1,714 | ) | | 4,457 |
|
| Investment securities | | 1,440 |
| | (1,348 | ) | | 2,788 |
| | 6,503 |
| | (2,746 | ) | | 9,249 |
|
| Loans | | 51,623 |
| | 35,780 |
| | 15,843 |
| | 108,850 |
| | 89,417 |
| | 19,433 |
|
| Restricted equity securities | | 1 |
| | 6 |
| | (5 | ) | | (149 | ) | | (65 | ) | | (84 | ) |
| Total interest and dividend income | | $ | 59,593 |
| | $ | 33,860 |
| | $ | 25,733 |
| | $ | 130,000 |
| | $ | 86,910 |
| | $ | 43,090 |
|
| Interest-bearing liabilities: | | |
| | | | | | |
| | |
| | |
|
| Checking deposits | | $ | 1,515 |
| | $ | 464 |
| | $ | 1,051 |
| | $ | 3,480 |
| | $ | 1,083 |
| | $ | 2,397 |
|
| Money market deposits | | 5,165 |
| | 420 |
| | 4,745 |
| | 11,114 |
| | 1,211 |
| | 9,903 |
|
| Savings deposits | | 650 |
| | 175 |
| | 475 |
| | 1,318 |
| | 496 |
| | 822 |
|
| Time deposits | | 2,707 |
| | 654 |
| | 2,053 |
| | 5,183 |
| | (341 | ) | | 5,524 |
|
| Federal funds purchased and other short-term borrowings | | — |
| | (17 | ) | | 17 |
| | 487 |
| | 458 |
| | 29 |
|
| FHLB advances | | 586 |
| | 10 |
| | 576 |
| | 1,585 |
| | 144 |
| | 1,441 |
|
| Repurchase agreements | | (197 | ) | | (2,762 | ) | | 2,565 |
| | 1,097 |
| | (452 | ) | | 1,549 |
|
| Long-term debt | | 160 |
| | (132 | ) | | 292 |
| | 304 |
| | (390 | ) | | 694 |
|
| Total interest expense | | $ | 10,586 |
| | $ | (1,188 | ) | | $ | 11,774 |
| | $ | 24,568 |
| | $ | 2,209 |
| | $ | 22,359 |
|
| Change in net interest income | | $ | 49,007 |
| | $ | 35,048 |
| | $ | 13,959 |
| | $ | 105,432 |
| | $ | 84,701 |
| | $ | 20,731 |
|
| |
Noninterest Income
Noninterest income increased $283 thousand or 1% to $49.6 million for the three months ended September 30, 2017, compared to $49.3 million for the same period in 2016. This increase was primarily due to a $3.8 million increase in net gain on sale of EWIS’s business and an $872 thousand increase in derivative fees and other income, partially offset by a $4.0 million decrease in other fees and operating income. Noninterest income increased $78.9 million or 59% to $213.0 million for the nine months ended September 30, 2017, compared to $134.1 million for the same period in 2016. This increase was comprised of a $71.2 million increase in net gains on sales of fixed assets, primarily related to the sale of a commercial property, and a $3.8 million increase in net gain on the sale of EWIS’s business, partially offset by a $4.5 million decrease in other fees and operating income. Noninterest income represented 14% and 20% of revenue for the three and nine months ended September 30, 2017, respectively, compared to 16% and 15%, respectively, for the same periods in 2016.
The following table presents the components of noninterest income for the periods indicated:first quarters of 2024 and 2023: |
| | | | | | | | | | | | | | | | | | | | | | |
| |
| ($ in thousands) | | Three Months Ended
September 30, | | Nine Months Ended
September 30, |
| | 2017 | | 2016 | | % Change | | 2017 | | 2016 | | % Change |
| Branch fees | | $ | 10,803 |
| | $ | 10,408 |
| | 4 | % | | $ | 31,799 |
| | $ | 30,983 |
| | 3 | % |
| Letters of credit fees and foreign exchange income | | 10,154 |
| | 10,908 |
| | (7 | )% | | 33,209 |
| | 31,404 |
| | 6 | % |
| Ancillary loan fees and other income | | 5,987 |
| | 6,135 |
| | (2 | )% | | 16,876 |
| | 13,997 |
| | 21 | % |
| Wealth management fees | | 3,615 |
| | 4,033 |
| | (10 | )% | | 11,682 |
| | 9,862 |
| | 18 | % |
| Derivative fees and other income | | 6,663 |
| | 5,791 |
| | 15 | % | | 12,934 |
| | 9,778 |
| | 32 | % |
| Net gains on sales of loans | | 2,361 |
| | 2,158 |
| | 9 | % | | 6,660 |
| | 6,965 |
| | (4 | )% |
| Net gains on sales of available-for-sale investment securities | | 1,539 |
| | 1,790 |
| | (14 | )% | | 6,733 |
| | 8,468 |
| | (20 | )% |
| Net gains on sales of fixed assets | | 1,043 |
| | 486 |
| | 115 | % | | 74,092 |
| | 2,916 |
| | NM |
|
| Net gain on sale of business | | 3,807 |
| | — |
| | NM |
| | 3,807 |
| | — |
| | NM |
|
| Other fees and operating income | | 3,652 |
| | 7,632 |
| | (52 | )% | | 15,255 |
| | 19,745 |
| | (23 | )% |
| Total noninterest income | | $ | 49,624 |
| | $ | 49,341 |
| | 1 | % | | $ | 213,047 |
| | $ | 134,118 |
| | 59 | % |
| |
| | | | | | | | | | | | | | | | | | | | | | | | | | | | | | | | | | |
|
| | Three Months Ended March 31, | | | | |
| | | | | | | | | | | | | | | | | | | | |
| ($ in thousands) | | 2024 | | 2023 | | | | % Change | | | | | | | | | | | | |
| Deposit account fees | | $ | 24,948 | | | $ | 23,054 | | | | | 8% | | | | | | | | | | | | |
| Lending fees | | 22,925 | | | 20,586 | | | | | 11% | | | | | | | | | | | | |
| Foreign exchange income | | 11,469 | | | 11,309 | | | | | 1% | | | | | | | | | | | | |
| Wealth management fees | | 8,592 | | | 6,304 | | | | | 36% | | | | | | | | | | | | |
| Customer derivative income | | 3,750 | | | 2,564 | | | | | 46% | | | | | | | | | | | | |
| Net losses on sales of loans | | (41) | | | (22) | | | | | (86)% | | | | | | | | | | | | |
| Net gains (losses) on AFS debt securities | | 49 | | | (10,000) | | | | | NM | | | | | | | | | | | | |
| | | | | | | | | | | | | | | | | | | | |
| | | | | | | | | | | | | | | | | | | | |
| Other investment income | | 2,815 | | | 1,921 | | | | | 47% | | | | | | | | | | | | |
| Other income | | 4,481 | | | 4,262 | | | | | 5% | | | | | | | | | | | | |
| Total noninterest income | | $ | 78,988 | | | $ | 59,978 | | | | | 32% | | | | | | | | | | | | |
|
NM — Not Meaningful.meaningful.
The following discussion providesNoninterest income comprised 12% of total revenue for the compositionfirst quarter of 2024, compared with 9% for the major changes in noninterestfirst quarter of 2023. Noninterest income andfor the factors contributing to the changes.
Net gains on salesfirst quarter of fixed assets increased $71.22024 was $79 million, to $74.1an increase of $19 million or 32%, compared with $60 million for the nine months ended September 30, 2017, compared to $2.9 million for the same period in 2016. Thisfirst quarter of 2023. The increase was primarily due to the $71.7net gains on AFS debt securities and increases in lending, wealth management and deposit account fees.
Deposit account fees were $25 million of pre-tax gain recognized from the sale of the commercial property in California duringfor the first quarter of 2017. In2024, an increase of $2 million or 8%, compared with $23 million for the first quarter of 2017, East West Bank completed the sale2023. The increase was primarily related to analysis charges, which reflected customer growth and leaseback of a commercial property in Californiafee increases.
Lending fees were $23 million for cash consideration of $120.6 million and entered into a lease agreement for part of the property, consisting of a retail branch and office facilities. The total pre-tax profit from the sale was $85.4 million, of which $71.7 million was recognized in the first quarter of 2017, and $13.7 million was deferred and recognized over the term2024, an increase of the lease agreement.
In the third quarter of 2017, the Company sold its insurance brokerage business, EWIS, for $4.3 million and recognized a pre-tax gain of $3.8 million.
Other fees and operating income decreased $4.0$2 million or 52% to $3.711%, compared with $21 million for the three months ended September 30, 2017 from $7.6 million for the same period in 2016, and decreased $4.5 million or 23% to $15.3 million for the nine months ended September 30, 2017 from $19.7 million for the same period in 2016. The $4.0 million decrease for the three months ended September 30, 2017, compared to the same period in 2016,was mainly attributable to decreases in rental income, as a result of the commercial property sale during the first quarter of 2017, and decreases in dividend income from other investments.2023. The $4.5 million decrease for the nine months ended September 30, 2017, compared to the same period in 2016,increase was largelyprimarily due to a decreasehigher unused commitment and trade finance fees driven by an increase in rental income as a result of sale of the commercial property duringcustomers.
Wealth management fees were $9 million for the first quarter of 2017.2024, an increase of approximately $2 million or 36%, compared with $6 million for the first quarter of 2023. The increase reflected customer demand for higher-yielding products in response to the interest rate environment and potential rate cuts.
Net gains on AFS debt securities were $49 thousand forthe first quarter of 2024. In comparison, net losses on AFS debt securities were $10 million for the first quarter of 2023 due to the write-off of an impaired subordinated AFS debt security.
Noninterest Expense
NoninterestThe following table presents the components of noninterest expense totaled $164.5for the first quarters of 2024 and 2023:
| | | | | | | | | | | | | | | | | | | | | | | | | | | | | | | | | | |
|
| | Three Months Ended March 31, | | | | |
| | | | | | | | | | | | | | | | | | | |
| ($ in thousands) | | 2024 | | 2023 | | | | % Change | | | | | | | | | | | | |
| Compensation and employee benefits | | $ | 141,812 | | | $ | 129,654 | | | | | 9 | % | | | | | | | | | | | | |
| Occupancy and equipment expense | | 15,230 | | | 15,587 | | | | | (2) | % | | | | | | | | | | | | |
| Deposit insurance premiums and regulatory assessments | | 19,649 | | | 7,910 | | | | | 148 | % | | | | | | | | | | | | |
| Deposit account expense | | 12,188 | | | 9,609 | | | | | 27 | % | | | | | | | | | | | | |
| | | | | | | | | | | | | | | | | | | | |
| Computer software and data processing expenses | | 11,344 | | | 10,707 | | | | | 6 | % | | | | | | | | | | | | |
| | | | | | | | | | | | | | | | | | | | |
| | | | | | | | | | | | | | | | | | | | |
| Other operating expense | | 33,445 | | | 34,870 | | | | | (4) | % | | | | | | | | | | | | |
| Amortization of tax credit and CRA investments | | 13,207 | | | 10,110 | | | | | 31 | % | | | | | | | | | | | | |
| | | | | | | | | | | | | | | | | | | | |
| | | | | | | | | | | | | | | | | | | | |
| Total noninterest expense | | $ | 246,875 | | | $ | 218,447 | | | | | 13 | % | | | | | | | | | | | | |
|
First quarter 2024 noninterest expense was $247 million, an increase of $28 million or 13%, compared with $218 million for the three months ended September 30, 2017, a decreasefirst quarter of $6.0 million or 4%, compared to $170.5 million for the same period in 2016. This decrease was primarily due to an $8.8 million decrease in amortization of tax credit and other investments and a $2.0 million decrease in legal expense, partially offset by a $4.5 million increase in compensation and employee benefits. Noninterest expense totaled $486.7 million for the nine months ended September 30, 2017, an increase of $20.7 million or 4%, compared to $466.0 million for the same period in 2016. This2023. The increase was primarily due to a $24.8 million increaseincreases in compensation and employee benefits and a $5.3 million increase in amortization of tax creditdeposit insurance premiums and other investments, partially offset by an $8.3 million decrease in consulting expense and a $3.8 million decrease in legal expense.regulatory assessments.
The following table presents the various components of noninterest expense for the periods indicated:
|
| | | | | | | | | | | | | | | | | | | | | | |
| |
| | | Three Months Ended
September 30, | | Nine Months Ended
September 30, |
| ($ in thousands) | | 2017 | | 2016 | | % Change | | 2017 | | 2016 | | % Change |
| Compensation and employee benefits | | $ | 79,583 |
| | $ | 75,042 |
| | 6 | % | | $ | 244,930 |
| | $ | 220,166 |
| | 11 | % |
| Occupancy and equipment expense | | 16,635 |
| | 15,456 |
| | 8 | % | | 47,829 |
| | 45,619 |
| | 5 | % |
| Deposit insurance premiums and regulatory assessments | | 5,676 |
| | 6,450 |
| | (12 | )% | | 17,384 |
| | 17,341 |
| | — | % |
| Legal expense | | 3,316 |
| | 5,361 |
| | (38 | )% | | 8,930 |
| | 12,714 |
| | (30 | )% |
| Data processing | | 3,004 |
| | 2,729 |
| | 10 | % | | 9,009 |
| | 8,712 |
| | 3 | % |
| Consulting expense | | 4,087 |
| | 4,594 |
| | (11 | )% | | 10,775 |
| | 19,027 |
| | (43 | )% |
| Deposit related expenses | | 2,413 |
| | 3,082 |
| | (22 | )% | | 7,283 |
| | 7,675 |
| | (5 | )% |
| Computer software expense | | 4,393 |
| | 3,331 |
| | 32 | % | | 13,823 |
| | 9,267 |
| | 49 | % |
| Other operating expense | | 19,830 |
| | 19,814 |
| | — | % | | 55,357 |
| | 58,508 |
| | (5 | )% |
| Amortization of tax credit and other investments | | 23,827 |
| | 32,618 |
| | (27 | )% | | 66,059 |
| | 60,779 |
| | 9 | % |
| Amortization of core deposit intangibles | | 1,735 |
| | 2,023 |
| | (14 | )% | | 5,314 |
| | 6,177 |
| | (14 | )% |
| Total noninterest expense | | $ | 164,499 |
| | $ | 170,500 |
| | (4 | )% | | $ | 486,693 |
| | $ | 465,985 |
| | 4 | % |
| |
The following provides a discussion of the major changes in noninterest expense and the factors contributing to the changes.
Compensation and employee benefits increased $4.5 million or 6% to $79.6were $142 million for the three months ended September 30, 2017,first quarter of 2024, an increase of $12 million or 9%, compared to $75.0with $130 million for the same period in 2016, and increased $24.8 million or 11% to $244.9 million for the nine months ended September 30, 2017, compared to $220.2 million for the same period in 2016. The increases for the three and nine months ended September 30, 2017 were primarily attributable to an increase in headcount to support the Company’s growing business and risk management and compliance requirements, as well as additional severance expenses.
Amortization of tax credit and other investments decreased $8.8 million or 27% to $23.8 million for the three months ended September 30, 2017, compared to $32.6 million for the same period in 2016, and increased $5.3 million or 9% to $66.1 million for the nine months ended September 30, 2017, compared to $60.8 million for the same period in 2016. The decrease in the thirdfirst quarter of 2017, compared with the prior year period, was mainly driven by higher amortization, which resulted from a renewable energy tax credit investment newly placed in service in the third quarter of 2016. Likewise, the2023. The increase in the first nine months of 2017, compared with the prior year period, was primarily driven by additional renewable energystaffing growth and historical rehabilitation tax credit investments placed in service during the nine months ended September 30, 2017.annual merit increases.
Legal expense decreased $2.0 million or 38% to $3.3Deposit insurance premiums and regulatory assessments were $20 million for the three months ended September 30, 2017,first quarter of 2024, an increase of $12 million or 148%, compared to $5.4with $8 million for the same period in 2016, and decreased $3.8 million or 30% to $8.9 million for the nine months ended September 30, 2017, compared to $12.7 million for the same period in 2016.first quarter of 2023. The decreases for the three and nine months ended September 30, 2017 were predominantlyincrease was primarily due to lower legal fees and litigation expense followingan additional $10 million FDIC charge. For additional information about the resolution of previously outstanding litigation.FDIC special assessment, refer to Item 2. MD&A — Overview —Current Developments in this Form 10-Q.
Consulting expense decreased $507 thousand or 11% to $4.1 million for the three months ended September 30, 2017, compared to $4.6 million for the same period in 2016, and decreased $8.3 million or 43% to $10.8 million for the nine months ended September 30, 2017, compared to $19.0 million for the same period in 2016. The decreases for both periods were primarily attributable to a decline in Bank Secrecy Act (“BSA”) and Anti-Money Laundering (“AML”) related consulting expense.
Income Taxes
| | | | | | | | | | | | | | | | | | | | | | | | | | | | | | | | | | | | | | |
|
| | Three Months Ended March 31, | | | | | | |
| ($ in thousands) | | 2024 | | 2023 | | % Change | | | | | | | | | | | | | | | | | | |
| Income before income taxes | | $ | 372,252 | | | $ | 421,392 | | | (12) | % | | | | | | | | | | | | | | | | | | |
| Income tax expense | | $ | 87,177 | | | $ | 98,953 | | | (12) | % | | | | | | | | | | | | | | | | | | |
| Effective tax rate | | 23.4 | % | | 23.5 | % | | | | | | | | | | | | | | | | | | | | |
|
Income
First quarter 2024 income tax expense was $42.6$87 million and $140.2 million for the three and nine months ended September 30, 2017, respectively, compared to $13.3 million and $90.1 million, respectively, for the same periods in 2016. The effective tax rate was 24.3%23.4%, compared with first quarter 2023 income tax expense of $99 million and 25.0%an effective tax rate of 23.5%. The decrease in income tax expense for the three and nine months ended September 30, 2017, respectively,first quarter of 2024 compared to 10.8% and 21.9%, respectively, forwith the same periods in 2016.
The higher effective tax rates for the three and nine months ended September 30, 2017, compared to the same periods in 2016, were mainlyyear-ago period was primarily due to higher projected income before income taxes that was partially offset by increases in tax credits primarily generated from investments in renewable energy, historic rehabilitation and affordable housing partnership projects. For the three and nine months ended September 30, 2017, tax credits generated from these investments were $40.0 million and $106.4 million, respectively, compared to $33.3 million and $83.7 million, respectively, for the same periods in 2016. In addition, the effective tax rates for the three and nine months ended September 30, 2017 were further reduced by the adoption of Accounting Standards Update (“ASU”) 2016-09, Compensation — Stock Compensation (Topic 718): Improvements to Employee Share-Based Payment Accounting, beginning January 1, 2017. As a result of the adoption of this ASU, net excess tax benefits for restricted stock units of $151 thousand and $4.6 million were recognized in Income tax expense on the Consolidated Statements of Income during the three and nine months ended September 30, 2017, respectively, which partially offset the higher effective tax rates for the same periods.lower pre-tax income.
Management regularly reviews the Company’s tax positions and deferred tax assets. Factors considered in this analysis include the Company’s ability to generate future taxable income, implement tax-planning strategies and utilize taxable income from prior carryback years (if such carryback is permitted under the applicable tax law), as well as future reversals of existing taxable temporary differences. The Company accounts for income taxes using the asset and liability approach, the objective of which is to establish deferred tax assets and liabilities for the temporary differences between the financial reporting basis and the tax basis of the Company’s assets and liabilities at enacted tax rates expected to be in effect when such amounts are realized and settled. As of September 30, 2017 and December 31, 2016, the Company had net deferred tax assets of $142.0 million and $129.7 million, respectively.
A valuation allowance is established for deferred tax assets if, based on the weight of all positive evidence against all negative evidence, it is more likely than not that some portion or all of the deferred tax assets will not be realized. A valuation allowance is used, as needed, to reduce the deferred tax assets to the amount that is more likely than not to be realized. Management has concluded that it is more likely than not that all of the benefits of the deferred tax assets will be realized, with the exception of the deferred tax assets related to net operating losses in certain states. Accordingly, a valuation allowance has been recorded for these amounts. The Company believes that adequate provisions have been made for all income tax uncertainties consistent with ASC 740-10, Income Taxes.
Operating Segment Results
The Company definesorganizes its operating segments based on its core strategy and has identifiedoperations into three reportable operating segments: Retail Banking,(1) Consumer and Business Banking; (2) Commercial BankingBanking; and (3) Other.
The Retail Banking segment focuses primarily on retail operations through These segments are defined by the Bank’s branch network. The Commercial Banking segment, which includes commercialtype of customers served and industrial (“C&I”)the related products and commercial real estate (“CRE”) operations, primarily generates commercial loans and deposits through domestic commercial lending offices located in California, New York, Texas, Washington, Massachusetts, Nevada and Georgia, and foreign commercial lending offices located in China and Hong Kong. Furthermore,services provided. For a description of the Commercial Banking segment offers a wide variety of international finance, trade finance, and cashCompany’s internal management services and products. The remaining centralized functions,reporting process, including the treasury activitiessegment cost allocation methodology, see Note 15 — Business Segments to the Consolidated Financial Statements in this Form 10-Q.
Segment net interest income represents the difference between actual interest earned on assets and interest incurred on liabilities of the Company and eliminations of inter-segment amounts have been aggregated and included insegment, adjusted for funding charges or credits through the “Other” segment, which provides broad administrative support to the two core segments.
Changes in the Company’s management structure or reporting methodologies may result in changes in the measurement of operating segment results. Results for prior periods are generally restated for comparability when there are changes in management structure or reporting methodologies, unless it is deemed not practicable to do so.
The Company’s internal funds transfer pricing process is formulated with the goal of encouraging loan and deposit growth that is consistent with the Company’s overall profitability objectives, as well as to provide a reasonable and consistent basis for the measurement of its business segments and product net interest margins. The Company’s internal funds transfer pricing assumptions and methodologies are reviewed at least annually to ensure that the process is reflective of current market conditions. process.
Note 15 — Business Segments to the Consolidated Financial Statements describes the Company’s segment reporting methodology and the business activities of each business segment, and presents financial results of these business segments for the three and nine months ended September 30, 2017 and 2016.
The following tables presenttable presents the selectedresults by operating segment for the periods indicated:
| | | | | | | | | | | | | | | | | | | | | | | | | | | | | | | | | | | | | | |
|
| | Three Months Ended March 31, |
| | Consumer and Business Banking | | Commercial Banking | | Other |
| ($ in thousands) | | 2024 | | 2023 | | 2024 | | 2023 | | 2024 | | 2023 |
| Total revenue | | $ | 317,306 | | | $ | 330,244 | | | $ | 306,815 | | | $ | 280,322 | | | $ | 20,006 | | | $ | 49,273 | |
| Provision for credit losses | | 2,565 | | | 15,012 | | | 22,435 | | | 4,988 | | | — | | | — | |
| | | | | | | | | | | | |
| | | | | | | | | | | | |
| | | | | | | | | | | | |
| | | | | | | | | | | | |
| | | | | | | | | | | | |
| | | | | | | | | | | | |
| | | | | | | | | | | | |
| | | | | | | | | | | | |
| | | | | | | | | | | | |
| | | | | | | | | | | | |
| | | | | | | | | | | | |
| | | | | | | | | | | | |
| | | | | | | | | | | | |
| | | | | | | | | | | | |
| | | | | | | | | | | | |
| | | | | | | | | | | | |
| | | | | | | | | | | | |
| | | | | | | | | | | | |
| | | | | | | | | | | | |
| | | | | | | | | | | | |
| | | | | | | | | | | | |
| | | | | | | | | | | | |
| | | | | | | | | | | | |
| Noninterest expense | | 119,300 | | | 113,823 | | | 106,307 | | | 87,248 | | | 21,268 | | | 17,376 | |
| Segment income (loss) before income taxes | | 195,441 | | | 201,409 | | | 178,073 | | | 188,086 | | | (1,262) | | | 31,897 | |
| | | | | | | | | | | | |
| Segment net income | | $ | 137,672 | | | $ | 142,247 | | | $ | 125,581 | | | $ | 134,457 | | | $ | 21,822 | | | $ | 45,735 | |
|
Consumer and Business Banking
The Consumer and Business Banking segment primarily provides financial products and services to consumer and commercial customers through the Company’s domestic branch network and digital banking platform. This segment offers consumer and commercial deposits, mortgage and home equity loans, and other products and services. It also originates commercial loans for small- and medium-sized enterprises through the Company’s branch network. Other products and services provided by this segment include wealth management, treasury management, interest rate risk hedging and foreign exchange services.
The following table presents additional financial information for the threeConsumer and nine months ended September 30, 2017 and 2016:
|
| | | | | | | | | | | | | | | | |
| |
| ($ in thousands) | | Three Months Ended September 30, 2017 |
| | Retail Banking | | Commercial Banking | | Other | | Total |
| Net interest income | | $ | 147,457 |
| | $ | 138,153 |
| | $ | 17,545 |
| | $ | 303,155 |
|
| Noninterest income | | $ | 16,218 |
| | $ | 30,320 |
| | $ | 3,086 |
| | $ | 49,624 |
|
| Noninterest expense | | $ | 56,062 |
| | $ | 45,686 |
| | $ | 62,751 |
| | $ | 164,499 |
|
| Pre-tax income | | $ | 68,554 |
| | $ | 99,025 |
| | $ | 7,705 |
| | $ | 175,284 |
|
| | | |
|
| | | | | | | | | | | | | | | | |
| | | |
| ($ in thousands) | | Three Months Ended September 30, 2016 |
| | Retail Banking | | Commercial Banking | | Other | | Total |
| Net interest income | | $ | 106,633 |
| | $ | 131,340 |
| | $ | 16,175 |
| | $ | 254,148 |
|
| Noninterest income | | $ | 14,700 |
| | $ | 26,218 |
| | $ | 8,423 |
| | $ | 49,341 |
|
| Noninterest expense | | $ | 55,942 |
| | $ | 45,306 |
| | $ | 69,252 |
| | $ | 170,500 |
|
| Pre-tax income | | $ | 32,304 |
| | $ | 80,393 |
| | $ | 10,767 |
| | $ | 123,464 |
|
| | | |
|
| | | | | | | | | | | | | | | | |
| | | |
| ($ in thousands) | | Nine Months Ended September 30, 2017 |
| | Retail Banking | | Commercial Banking | | Other | | Total |
| Net interest income | | $ | 430,437 |
| | $ | 408,570 |
| | $ | 26,361 |
| | $ | 865,368 |
|
| Noninterest income | | $ | 43,767 |
| | $ | 82,645 |
| | $ | 86,635 |
| | $ | 213,047 |
|
| Noninterest expense | | $ | 181,811 |
| | $ | 149,510 |
| | $ | 155,372 |
| | $ | 486,693 |
|
| Pre-tax income | | $ | 204,601 |
| | $ | 284,195 |
| | $ | 72,177 |
| | $ | 560,973 |
|
| | | |
|
| | | | | | | | | | | | | | | | |
| | | |
| ($ in thousands) | | Nine Months Ended September 30, 2016 |
| | Retail Banking | | Commercial Banking | | Other | | Total |
| Net interest income | | $ | 329,120 |
| | $ | 389,559 |
| | $ | 41,257 |
| | $ | 759,936 |
|
| Noninterest income | | $ | 37,798 |
| | $ | 70,450 |
| | $ | 25,870 |
| | $ | 134,118 |
|
| Noninterest expense | | $ | 173,337 |
| | $ | 145,695 |
| | $ | 146,953 |
| | $ | 465,985 |
|
| Pre-tax income | | $ | 114,513 |
| | $ | 268,401 |
| | $ | 28,137 |
| | $ | 411,051 |
|
| | | |
Retail Banking
The RetailBusiness Banking segment reported pre-taxfor the periods indicated:
| | | | | | | | | | | | | | | | | | | | | | | | | | |
|
| | Three Months Ended March 31, |
| | | | | | Change from 2023 |
| ($ in thousands) | | 2024 | | 2023 | | $ | | % |
| Net interest income before provision for credit losses | | $ | 291,764 | | | $ | 304,242 | | | $ | (12,478) | | | (4) | % |
| Noninterest income | | 25,542 | | | 26,002 | | | (460) | | | (2) | % |
| Total revenue | | 317,306 | | | 330,244 | | | (12,938) | | | (4) | % |
| Provision for credit losses | | 2,565 | | | 15,012 | | | (12,447) | | | (83) | % |
| Noninterest expense | | 119,300 | | | 113,823 | | | 5,477 | | | 5 | % |
| Segment income before income taxes | | 195,441 | | | 201,409 | | | (5,968) | | | (3) | % |
| Income tax expense | | 57,769 | | | 59,162 | | | (1,393) | | | (2) | % |
| Segment net income | | $ | 137,672 | | | $ | 142,247 | | | $ | (4,575) | | | (3) | % |
| Average loans | | $ | 19,137,292 | | | $ | 17,110,917 | | | $ | 2,026,375 | | | 12 | % |
| Average deposits | | $ | 33,786,818 | | | $ | 33,848,051 | | | $ | (61,233) | | | 0 | % |
|
Consumer and Business Banking segment net income of $68.6decreased by $5 million and $204.6or 3% year-over-year to $138 million for the three and nine months ended September 30, 2017, respectively, compared to $32.3 million and $114.5 million, respectively, for the same periods in 2016. The increases in pre-tax income for this segment for the three and nine months ended September 30, 2017, compared to the same periods in 2016, werefirst quarter of 2024. This decrease was primarily driven by an increasea decrease in net interest income partially offset byand an increase in provision for credit losses.
Net interest income for this segment increased $40.8 million or 38% to $147.5 million for the three months ended September 30, 2017, compared to $106.6 million for the same period in 2016. Net interest income increased $101.3 million or 31% to $430.4 million for the nine months ended September 30, 2017, compared to $329.1 million for the same period in 2016. The increases in net interest income for the three and nine months ended September 30, 2017, compared to the same periods in 2016, were primarily due to the growth in core deposits for the segment, for which the segment receives interest income credit under the Bank’s internal funds transfer pricing system.
Noninterest income for this segment increased $1.5 million or 10% to $16.2 million for the three months ended September 30, 2017, compared to $14.7 million for the same period in 2016. Noninterest income increased $6.0 million or 16% to $43.8 million for the nine months ended September 30, 2017, compared to $37.8 million for the same period in 2016. The increases in noninterest income for the three and nine months ended September 30, 2017, compared to the same periods in 2016, were primarily attributable to increases in branch fees, derivative fees and other income, wealth management fees, and net gains on sales of loans. This was partially offset by a decrease in ancillary loan fees and other income.
Noninterest expense for this segment increased slightly by $120 thousand to $56.1 million for the three months ended September 30, 2017, compared to $55.9 million for the same period in 2016. Noninterest expense increased $8.5 million or 5% to $181.8 million for the nine months ended September 30, 2017, compared to $173.3 million for the same period in 2016. The increases in noninterest expense for the three and nine months ended September 30, 2017, compared to the same periods in 2016, were primarily due to increases in compensation and employee benefits, occupancy and equipment expense, and data processing expense, partially offset by a decrease in consulting expense.provision for credit losses. Net interest income before provision for credit losses decreased by $12 million or 4% year-over-year to $292 million for the first quarter of 2024. This decrease was primarily driven by a higher cost of interest-bearing deposits and continued deposit mix shift. Provision for credit losses decreased by $12 million or 83% year-over-year to $3 million for the first quarter of 2024. This decrease was primarily driven by the substantial residential mortgage loan growth from the Bridge To Home Ownership program that required higher provision for credit losses in the first quarter of 2023. Noninterest expense increased $5 million or 5% year-over-year to $119 million for the first quarter of 2024, primarily due to an increase in deposit insurance premiums and regulatory assessments largely resulting from the FDIC charge.
Commercial Banking
The Commercial Banking segment reported pre-taxprimarily generates commercial loan and deposit products. Commercial loan products include CRE lending, construction finance, commercial business lending, working capital lines of credit, trade finance, letters of credit, affordable housing lending, asset-based lending, asset-backed finance, project finance and equipment financing. Commercial deposit products and other financial services include treasury management, foreign exchange services, and interest rate and commodity risk hedging.
The following table presents additional financial information for the Commercial Banking segment for the periods indicated:
| | | | | | | | | | | | | | | | | | | | | | | | | | |
|
| | Three Months Ended March 31, |
| | | | | | Change from 2023 |
| ($ in thousands) | | 2024 | | 2023 | | $ | | % |
| Net interest income before provision for credit losses | | $ | 260,349 | | | $ | 236,723 | | | $ | 23,626 | | | 10 | % |
| Noninterest income | | 46,466 | | | 43,599 | | | 2,867 | | | 7 | % |
| Total revenue | | 306,815 | | | 280,322 | | | 26,493 | | | 9 | % |
| Provision for credit losses | | 22,435 | | | 4,988 | | | 17,447 | | | 350 | % |
| Noninterest expense | | 106,307 | | | 87,248 | | | 19,059 | | | 22 | % |
| Segment income before income taxes | | 178,073 | | | 188,086 | | | (10,013) | | | (5) | % |
| Income tax expense | | 52,492 | | | 53,629 | | | (1,137) | | | (2) | % |
| Segment net income | | $ | 125,581 | | | $ | 134,457 | | | $ | (8,876) | | | (7) | % |
| Average loans | | $ | 32,787,548 | | | $ | 31,038,920 | | | $ | 1,748,628 | | | 6 | % |
| Average deposits | | $ | 21,054,189 | | | $ | 17,282,964 | | | $ | 3,771,225 | | | 22 | % |
|
Commercial Banking segment net income of $99.0decreased by $9 million and $284.2or 7% year-over-year to $126 million for the threefirst quarter of 2024. This decrease was due to higher noninterest expense and nine months ended September 30, 2017, respectively, compared to $80.4 million and $268.4 million, respectively,provision for the same periods in 2016. The increases in pre-tax income for this segment for the three and nine months ended September 30, 2017, compared to the same periods in 2016, were attributable to increases incredit losses, partially offset by higher net interest income and noninterest income.
Net interest income before provision for this segmentcredit losses increased $6.8$24 million or 5%10% year-over-year to $138.2$260 million for the three months ended September 30, 2017, comparedfirst quarter of 2024. This increase was primarily due to $131.3higher loan interest income from commercial loan growth. Provision for credit losses increased $17 million or 350% year-over-year to $22 million for the same period in 2016. Net interest incomefirst quarter of 2024, primarily driven by continued caution regarding the CRE market outlook. Noninterest expense increased $19.0$19 million or 5%22% year-over-year to $408.6$106 million for the nine months ended September 30, 2017, compared to $389.6 million for the same period in 2016. The increases in net interest income for the three and nine months ended September 30, 2017, compared to the same periods in 2016, were due to the growth in commercial loans and commercial core deposits, for which the segment receives interest income credit under the Bank’s internal funds transfer pricing system.
Noninterest income for this segment increased $4.1 million or 16% to $30.3 million for the three months ended September 30, 2017, compared to $26.2 million for the same period in 2016. Noninterest income increased $12.2 million or 17% to $82.6 million for the nine months ended September 30, 2017, compared to $70.5 million for the same period in 2016. The increases in noninterest income for the three and nine months ended September 30, 2017, compared to the same periods in 2016, werefirst quarter of 2024, primarily due to a net gain on sale of the Company’s insurance brokerage business, EWIS, during the three and nine months ended September 30, 2017, and increases in branch fees, ancillary loan fees and other income, as well as letters of credit fees and foreign exchange income.
Noninterest expense for this segment increased slightly by $380 thousand to $45.7 million for the three months ended September 30, 2017, compared to $45.3 million for the same period in 2016. Noninterest expense increased $3.8 million or 3% to $149.5 million for the nine months ended September 30, 2017, compared to $145.7 million for the same period in 2016. The increases in noninterest expense for the three and nine months ended September 30, 2017, compared to the same periods in 2016, were primarily due to increases inhigher compensation and employee benefits, deposit insurance premiums and consulting expense, partially offset by a decrease in legalregulatory assessments, and deposit account expense.
Other
Centralized functions, including the corporate treasury activities of the Company and eliminations of inter-segment amounts, have been aggregated and included in the Other segment, which provides broad administrative support to the two core segments, namely the Consumer and Business Banking and the Commercial Banking segments.
The following table presents additional financial information for the Other segment for the periods indicated:
| | | | | | | | | | | | | | | | | | | | | | | | | | |
|
| | Three Months Ended March 31, |
| | | | | | Change from 2023 |
| ($ in thousands) | | 2024 | | 2023 | | $ | | % |
| Net interest income before provision for credit losses | | $ | 13,026 | | | $ | 58,896 | | | $ | (45,870) | | | (78) | % |
| Noninterest income (loss) | | 6,980 | | | (9,623) | | | 16,603 | | | 173 | % |
| Total revenue | | 20,006 | | | 49,273 | | | (29,267) | | | (59) | % |
| | | | | | | | |
| Noninterest expense | | 21,268 | | | 17,376 | | | 3,892 | | | 22 | % |
| Segment (loss) income before income taxes | | (1,262) | | | 31,897 | | | (33,159) | | | (104) | % |
| Income tax benefit | | 23,084 | | | 13,838 | | | 9,246 | | | 67 | % |
| Segment net income | | $ | 21,822 | | | $ | 45,735 | | | $ | (23,913) | | | (52) | % |
| | | | | | | | |
| Average deposits | | $ | 2,601,396 | | | $ | 3,822,894 | | | $ | (1,221,498) | | | (32) | % |
|
The Other segment includes the activitiesreported segment loss before income taxes of the treasury function, which is responsible for liquidity$1 million and interest rate risk management of the Company, and supports the Retail Banking and Commercial Banking segments through internal funds transfer pricing credits and charges, which are included insegment net interest income. The Other segment reported pre-tax income of $7.7$22 million, and $72.2reflecting an income tax benefit of $23 million for the three and nine months ended September 30, 2017, respectively, compared to $10.8 million and $28.1 million, respectively, for the same periods in 2016.first quarter of 2024. The decrease in pre-taxsegment net income for this segment for the three months ended September 30, 2017, compared to the same period in 2016, was primarily driven by decreases in noninterest income and internal funds transfer pricing credits, partially offset by a decrease in noninterest expense and an increase inlower net interest income. The increase in pre-tax income, for this segment for the nine months ended September 30, 2017, compared to the same period in 2016, was primarily drivenpartially offset by an increase in noninterest income as the result of the net gain on sale of the commercial property, partially offset by aincome. The $46 million decrease in net interest income before provision for credit losses was primarily driven by the higher cost of BTFP borrowings. Noninterest income increased by $17 million for the first quarter of 2024, mainly due to a $10 million write-off of an impaired AFS debt security during the first quarter of 2023 and an increase in noninterest expense.foreign exchange income.
Net interest
The income for thistax expense or benefit in the Other segment increased $1.4 millionconsists of the remaining unallocated income tax expense or 8% to $17.5 million for the three months ended September 30, 2017, compared to $16.2 million for the same period in 2016. Net interestbenefit after allocating income decreased $14.9 million or 36% to $26.4 million for the nine months ended September 30, 2017, compared to $41.3 million for the same period in 2016. The increase in net interest income for the three months ended September 30, 2017, comparedtax expense to the same period in 2016, was primarily due to an increase in interest income from investments. The decrease in net interest income fortwo core segments, and reflects the nine months ended September 30, 2017, compared to the same period in 2016, was due to increases in interest expense on borrowings and deposits.
Noninterest income for this segment decreased $5.3 million or 63% to $3.1 million for the three months ended September 30, 2017, compared to $8.4 million for the same period in 2016. Noninterest income increased $60.8 million or 235% to $86.6 million for the nine months ended September 30, 2017, compared to $25.9 million for the same period in 2016. The decrease in noninterest income for the three months ended September 30, 2017, compared to the same period in 2016, was primarily due to decreases in foreign exchange income arising from valuation changes associated with currency hedges and decreases in rental income. The increase in noninterest income for the nine months ended September 30, 2017, compared to the same period in 2016, was primarily due to the $71.7 million net gain on sale of the commercial property, as discussed in the Noninterest income section of MD&A.
Noninterest expense for this segment decreased $6.5 million or 9% to $62.8 million for the three months ended September 30, 2017, compared to $69.3 million for the same period in 2016. Noninterest expense increased $8.4 million or 6% to $155.4 million for the nine months ended September 30, 2017, compared to $147.0 million for the same period in 2016. The decrease in noninterest expense for the three months ended September 30, 2017, compared to the same period in 2016, was primarily attributable to a decrease of $8.8 million in amortizationimpact of tax credit and other investments, partially offset by increases of $2.5 million in compensation and employee benefits. The increase in noninterestinvestment activity. Income tax expense for the nine months ended September 30, 2017, comparedis allocated to the same period in 2016, was primarily attributableConsumer and Business Banking and the Commercial Banking segments by applying statutory income tax rates to increases of $5.3 million inthe segment income before income taxes. Tax credit investment amortization of tax credit and other investments, and $6.5 million in compensation and employee benefits.is allocated to the Other segment.
Balance Sheet Analysis
The following is a discussion of the significant changes between September 30, 2017 and December 31, 2016.
Selected Consolidated Balance Sheets Data
|
| | | | | | | | | | | | | | | |
| | | | | |
| | | | | | | Change |
| ($ in thousands) | | September 30, 2017 | | December 31, 2016 | | $ | | % |
| | | (Unaudited) | | | | | | |
| ASSETS | | | | | | | | |
| Cash and cash equivalents | | $ | 1,736,749 |
| | $ | 1,878,503 |
| | $ | (141,754 | ) | | (8 | )% |
| Interest-bearing deposits with banks | | 404,946 |
| | 323,148 |
| | 81,798 |
| | 25 | % |
| Resale agreements | | 1,250,000 |
| | 2,000,000 |
| | (750,000 | ) | | (38 | )% |
| Available-for-sale investment securities, at fair value | | 2,956,776 |
| | 3,335,795 |
| | (379,019 | ) | | (11 | )% |
| Held-to-maturity investment security, at cost | | — |
| | 143,971 |
| | (143,971 | ) | | (100 | )% |
| Restricted equity securities, at cost | | 73,322 |
| | 72,775 |
| | 547 |
| | 1 | % |
| Loans held-for-sale | | 178 |
| | 23,076 |
| | (22,898 | ) | | (99 | )% |
| Loans held-for-investment (net of allowance for loan losses of $285,926 in 2017 and $260,520 in 2016) | | 28,239,431 |
| | 25,242,619 |
| | 2,996,812 |
| | 12 | % |
| Investments in qualified affordable housing partnerships, net | | 178,344 |
| | 183,917 |
| | (5,573 | ) | | (3 | )% |
| Investments in tax credit and other investments, net | | 203,758 |
| | 173,280 |
| | 30,478 |
| | 18 | % |
| Premises and equipment | | 131,311 |
| | 159,923 |
| | (28,612 | ) | | (18 | )% |
| Goodwill | | 469,433 |
| | 469,433 |
| | — |
| | — | % |
| Other assets | | 663,718 |
| | 782,400 |
| | (118,682 | ) | | (15 | )% |
| TOTAL | | $ | 36,307,966 |
| | $ | 34,788,840 |
| | $ | 1,519,126 |
| | 4 | % |
| LIABILITIES | | |
| | |
| | | |
|
|
| Customer deposits | | $ | 31,311,662 |
| | $ | 29,890,983 |
| | $ | 1,420,679 |
| | 5 | % |
| Short-term borrowings | | 24,813 |
| | 60,050 |
| | (35,237 | ) | | (59 | )% |
| FHLB advances | | 323,323 |
| | 321,643 |
| | 1,680 |
| | 1 | % |
| Repurchase agreements | | 50,000 |
| | 350,000 |
| | (300,000 | ) | | (86 | )% |
| Long-term debt | | 176,513 |
| | 186,327 |
| | (9,814 | ) | | (5 | )% |
| Accrued expenses and other liabilities | | 639,759 |
| | 552,096 |
| | 87,663 |
| | 16 | % |
| Total liabilities | | 32,526,070 |
| | 31,361,099 |
| | 1,164,971 |
| | 4 | % |
| STOCKHOLDERS’ EQUITY | | 3,781,896 |
| | 3,427,741 |
| | 354,155 |
| | 10 | % |
| TOTAL | | $ | 36,307,966 |
| | $ | 34,788,840 |
| | $ | 1,519,126 |
| | 4 | % |
| | | | | |
As of September 30, 2017, total assets were $36.31 billion, an increase of $1.52 billion or 4% from December 31, 2016. The predominant area of asset growth was in loans, which was driven by strong increases across all of the Company’s commercial and retail lines of business. These increases were partially offset by maturities of resale agreements, and decreases in investment securities, cash and cash equivalents, and other assets.
As of September 30, 2017, total liabilities were $32.53 billion, an increase of $1.16 billion or 4% from December 31, 2016, primarily due to increases in customer deposits, reflecting the continued strong growth from existing and new customers. This increase was partially offset by a decrease in repurchase agreements primarily due to an increase in resale agreements that were eligible for netting against repurchase agreements under ASC 210-20-45, Balance Sheet Offsetting.
Stockholders’ equity growth benefited primarily from $420.7 million in net income, partially offset by $87.6 million of cash dividends on common stock.
InvestmentDebt Securities
The Company aims to maintain an investmentmaintains a portfolio that consists of high quality and liquid debt securities with relatively short durations to minimizea moderate duration profile. It closely manages the overall portfolio credit, interest rate and liquidity risks. The Company’s available-for-sale investmentdebt securities provide:
•interest income for earnings and yield enhancement;
•funding availability for funding needs arising during the normal course of business;
•the ability to execute interest rate risk management strategies duein response to changes in economic or market conditions, which influence loan origination, prepayment speeds, or deposit balancesconditions; and mix; and
•collateral to support pledging agreements as required and/or to enhance the Company’s borrowing capacity.
Held-to-maturity investment security
During the first quarter of 2016,While the Company securitized $201.7 million of multifamily residential loans and retained $160.1 million of the senior tranche of the resulting securities from the securitization as held-to-maturity, which is carried at amortized cost. The held-to-maturity investment security is a non-agency commercial mortgage-backed security maturing on April 25, 2046. During the third quarter of 2017, the Company transferred this non-agency commercial mortgage-backed security with a net carrying amount of $115.6 million from held-to-maturity to available-for-sale. The transfer reflects the Company’s intentdoes not intend to sell the security under active liquidity management.
Available-for-sale investmentits debt securities,
As of September 30, 2017 and December 31, 2016, the Company’s available-for-sale investment it may sell AFS debt securities portfolio was primarily comprised of U.S. government agency and U.S. government sponsored enterprise mortgage-backed securities, U.S. Treasury securities and foreign bonds. Investment securities classified as available-for-sale are carried at their estimated fair value with the correspondingin response to changes in fair value recorded in Accumulated other comprehensive loss, net of tax, as a component of Stockholders’ equity on the Consolidated Balance Sheets.balance sheet and related interest rate risk to meet liquidity, regulatory and strategic requirements.
The following table presents the breakoutdistribution of the Company’s AFS and HTM debt securities portfolio as of March 31, 2024 and December 31, 2023, and by credit ratings as of March 31, 2024:
| | | | | | | | | | | | | | | | | | | | | | | | | | | | | | | | | | | | | | | | | | | | | | | | | | | | | | | | | | | | | | | | | | | | | | | | | | | |
| |
| | March 31, 2024 | | December 31, 2023 | | | | | | Ratings as of March 31, 2024 (1) | |
| ($ in thousands) | | Amortized Cost | | Fair Value | | | % of Fair Value | | Amortized Cost | | Fair Value | | | % of Fair Value | | | | | | AAA/AA | | A | | BBB | | BB and Lower | | No Rating (2) | |
| AFS debt securities: | | | | | | | | | | | | | | | | | | | | | | | | | | | | | |
| U.S. Treasury securities | | $ | 676,290 | | | $ | 621,094 | | | | 7 | % | | $ | 1,112,587 | | | $ | 1,060,375 | | | | 17 | % | | | | | | 100 | % | | — | % | | — | % | | — | % | | — | % | |
| U.S. government agency and U.S. government-sponsored enterprise debt securities | | 410,676 | | | 360,802 | | | | 4 | % | | 412,086 | | | 364,446 | | | | 6 | % | | | | | | 100 | % | | — | % | | — | % | | — | % | | — | % | |
U.S. government agency and U.S. government-sponsored enterprise mortgage-backed securities (3) | | 5,742,708 | | | 5,448,018 | | | | 65 | % | | 2,488,304 | | | 2,195,853 | | | | 35 | % | | | | | | 100 | % | | — | % | | — | % | | — | % | | — | % | |
| Municipal securities | | 296,360 | | | 258,495 | | | | 3 | % | | 297,283 | | | 261,016 | | | | 4 | % | | | | | | 98 | % | | — | % | | — | % | | — | % | | 2 | % | |
| Non-agency mortgage-backed securities | | 983,539 | | | 853,653 | | | | 10 | % | | 1,052,913 | | | 921,187 | | | | 15 | % | | | | | | 86 | % | | — | % | | — | % | | — | % | | 14 | % | |
| Corporate debt securities | | 653,501 | | | 502,647 | | | | 6 | % | | 653,501 | | | 502,425 | | | | 8 | % | | | | | | — | % | | 31 | % | | 66 | % | | 3 | % | | — | % | |
| Foreign government bonds | | 238,592 | | | 227,196 | | | | 3 | % | | 239,333 | | | 227,874 | | | | 4 | % | | | | | | 47 | % | | 53 | % | | — | % | | — | % | | — | % | |
| Asset-backed securities | | 41,287 | | | 40,712 | | | | 1 | % | | 43,234 | | | 42,300 | | | | 1 | % | | | | | | 100 | % | | — | % | | — | % | | — | % | | — | % | |
| Collateralized loan obligations | | 89,000 | | | 87,851 | | | | 1 | % | | 617,250 | | | 612,861 | | | | 10 | % | | | | | | 72 | % | | 28 | % | | — | % | | — | % | | — | % | |
| Total AFS debt securities | | $ | 9,131,953 | | | $ | 8,400,468 | | | | 100 | % | | $ | 6,916,491 | | | $ | 6,188,337 | | | | 100 | % | | | | | | 91 | % | | 4 | % | | 4 | % | | 0 | % | | 1 | % | |
| | | | | | | | | | | | | | | | | | | | | | | | | | | | | |
| HTM debt securities: | | | | | | | | | | | | | | | | | | | | | | | | | | | | | |
| U.S. Treasury securities | | $ | 530,921 | | | $ | 485,400 | | | | 20 | % | | $ | 529,548 | | | $ | 488,551 | | | | 20 | % | | | | | | 100 | % | | — | % | | — | % | | — | % | | — | % | |
| U.S. government agency and U.S. government-sponsored enterprise debt securities | | 1,002,697 | | | 805,799 | | | | 33 | % | | 1,001,836 | | | 814,932 | | | | 33 | % | | | | | | 100 | % | | — | % | | — | % | | — | % | | — | % | |
U.S. government agency and U.S. government-sponsored enterprise mortgage-backed securities (4) | | 1,226,419 | | | 979,270 | | | | 41 | % | | 1,235,784 | | | 1,004,697 | | | | 41 | % | | | | | | 100 | % | | — | % | | — | % | | — | % | | — | % | |
| Municipal securities | | 188,605 | | | 144,009 | | | | 6 | % | | 188,872 | | | 145,791 | | | | 6 | % | | | | | | 100 | % | | — | % | | — | % | | — | % | | — | % | |
| Total HTM debt securities | | $ | 2,948,642 | | | $ | 2,414,478 | | | | 100 | % | | $ | 2,956,040 | | | $ | 2,453,971 | | | | 100 | % | | | | | | 100 | % | | — | % | | — | % | | — | % | | — | % | |
| Total debt securities | | $ | 12,080,595 | | | $ | 10,814,946 | | | | | | $ | 9,872,531 | | | $ | 8,642,308 | | | | | | | | | | | | | | | | | | | |
| |
(1)Credit ratings express opinions about the credit quality of a debt security. The Company determines the credit rating of a security according to the lowest credit rating made available by nationally recognized statistical rating organizations (“NRSROs”). Debt securities rated investment grade, which are those with ratings similar to BBB- or above (as defined by NRSROs), are generally considered by the rating agencies and market participants to be low credit risk. Ratings percentages are allocated based on fair value.
(2)For debt securities not rated by NRSROs, the Company uses other factors which include but are not limited to the priority in collections within the securitization structure, and whether the contractual payments have historically been on time.
(3)Includes Government National Mortgage Association (“GNMA”) AFS debt securities totaling $4.5 billion of amortized cost and $4.4 billion of fair value as of March 31, 2024, and $1.3 billion of amortized cost and $1.2 billion of fair value as of December 31, 2023.
(4)Includes GNMA HTM debt securities totaling $91 million of amortized cost and $73 million of fair value as of March 31, 2024, and $92 million of amortized cost and $75 million of fair value of available-for-sale investment securities by major categories as of September 30, 2017 and December 31, 2016:2023.
|
| | | | | | | | | | | | | | | | |
| |
| ($ in thousands) | | September 30, 2017 | | December 31, 2016 |
| | Amortized Cost | | Fair Value | | Amortized Cost | | Fair Value |
| Available-for-sale investment securities: | | | | | | | | |
| U.S. Treasury securities | | $ | 533,035 |
| | $ | 526,332 |
| | $ | 730,287 |
| | $ | 720,479 |
|
| U.S. government agency and U.S. government sponsored enterprise debt securities | | 191,727 |
| | 189,185 |
| | 277,891 |
| | 274,866 |
|
| U.S. government agency and U.S. government sponsored enterprise mortgage-backed securities | | 1,475,969 |
| | 1,466,106 |
| | 1,539,044 |
| | 1,525,546 |
|
| Municipal securities | | 116,798 |
| | 117,242 |
| | 148,302 |
| | 147,654 |
|
| Non-agency residential mortgage-backed securities | | 9,680 |
| | 9,694 |
| | 11,592 |
| | 11,477 |
|
| Corporate debt securities | | 12,655 |
| | 11,942 |
| | 232,381 |
| | 231,550 |
|
| Foreign bonds | | 505,395 |
| | 489,140 |
| | 405,443 |
| | 383,894 |
|
Other securities (1) | | 147,504 |
| | 147,135 |
| | 40,501 |
| | 40,329 |
|
| Total available-for-sale investment securities | | $ | 2,992,763 |
| | $ | 2,956,776 |
| | $ | 3,385,441 |
| | $ | 3,335,795 |
|
| |
| |
(1) | During the third quarter of 2017, the Company transferred a non-agency commercial mortgage-backed security with a net carrying amount of $115.6 million from held-to-maturity to available-for-sale. |
As of March 31, 2024, the Company’s AFS and HTM debt securities portfolios had an effective duration (defined as the sensitivity of the value of the portfolio to interest rate changes) of 2.8 and 7.4, respectively, compared with 3.6 and 7.5, respectively, as of December 31, 2023. The decrease in the AFS effective duration was primarily due to the purchases of floating rate GNMA securities. The decrease in the HTM effective duration was due to the portfolio seasoning.
Available-for-Sale Debt Securities
The fair value of the available-for-sale investmentAFS debt securities totaled $2.96$8.4 billion as of September 30, 2017, compared to $3.34March 31, 2024, an increase of $2.2 billion or 36% from $6.2 billion as of December 31, 2016.2023. The decrease of $379.0 million or 11%increase was primarily reflecteddue to the sales of corporate debt securities, U.S. Treasury securities, U.S. government agency and U.S. government sponsored enterprise mortgage-backed securities, and municipal securities; and paydowns, maturities and calls of U.S. government agency and U.S. government sponsored enterprise mortgage-backed securities, U.S. government agency and U.S. government sponsored enterprise debt securities, and U.S. Treasury securities. The decrease was partially offset by purchases of U.S. government agency and U.S. government sponsored enterprise mortgage-backedGNMA securities, foreign bonds, U.S. government agency and U.S. government sponsored enterprise debt securities, U.S. Treasury securities and municipal securities; and the transfer of a non-agency commercial mortgage-backed security from held-to-maturity security.
which were mainly funded by an increase in deposits. The Company’s available-for-sale investmentAFS debt securities are carried at fair value with changesnon-credit related unrealized gains and losses, net of tax, reported in fair value reflected in Other comprehensive income (loss) unless a security is deemed to be other-than-temporarily impaired. Ason the Consolidated Statement of September 30, 2017, the Company’sComprehensive Income. Pre-tax net unrealized losses on available-for-sale investmentAFS debt securities were $36.0$731 million as of March 31, 2024, compared to $49.6with $728 million as of December 31, 2016. The favorable change2023.
As of March 31, 2024 and December 31, 2023, 99% and 97%, respectively, of the carrying value of the AFS debt securities portfolio was rated investment grade by NRSROs. Of the AFS debt securities with gross unrealized losses, substantially all were rated investment grade as of both March 31, 2024 and December 31, 2023. There was no allowance for credit losses provided against the AFS debt securities as of each of March 31, 2024 and December 31, 2023. Additionally, there were no credit losses recognized in earnings for the first quarters of 2024 and 2023.
Held-to-Maturity Debt Securities
All HTM debt securities were issued, guaranteed, or supported by the U.S. government or government-sponsored enterprises. Accordingly, the Company applied a zero credit loss assumption for these securities and no allowance for credit loss was recorded as of both March 31, 2024 and December 31, 2023.
For additional information on AFS and HTM securities, see Note 1— Summary of Significant Accounting Policies to the Consolidated Financial Statements in the net unrealized losses was primarily attributed to the flattening in the yield curve with long-term interest rates falling. Gross unrealized losses on available-for-sale investment securities totaled $42.3 million as of September 30, 2017, compared to $56.3 million as of December 31, 2016. As of September 30, 2017, the Company had no intention to sell securities with unrealized lossesCompany’s2023 Form 10-K and believes it is more likely than not that it would not be required to sell such securities before recovery of their amortized cost. No other-than-temporary impairment was recognized for the three and nine months ended September 30, 2017 and 2016. For a complete discussion and disclosure, see Note 43 — Fair Value Measurement and Fair Value of Financial Instruments, and Note 65 — Securities to the Consolidated Financial Statements.Statements in this Form 10-Q.
As of September 30, 2017 and December 31, 2016, available-for-sale investment securities with a fair value of $584.9 million and $767.4 million, respectively, were pledged to secure public deposits, repurchase agreements, the Federal Reserve Bank’s discount window and for other purposes required or permitted by law.
The following table presents the weighted average yields and contractual maturity distributions, excluding periodic principal payments, of the Company’s investment securities as of the periods indicated. Actual maturities of mortgage-backed securities can differ from contractual maturities as the borrowers have the right to prepay the obligations. In addition, such factors as prepayments and interest rate changes may affect the yields on the carrying value of mortgage-backed securities.
|
| | | | | | | | | | | | | | | | | | | | | | |
| |
| ($ in thousands) | | September 30, 2017 | | December 31, 2016 |
| | Amortized
Cost | | Fair Value | | Yield (1) | | Amortized
Cost | | Fair Value | | Yield (1) |
| Available-for-sale investment securities: | | | | | | | | | | | | |
| U.S. Treasury securities: | | | | | | | | | | | | |
| Maturing in one year or less | | $ | 150,431 |
| | $ | 150,134 |
| | 0.96 | % | | $ | 100,707 |
| | $ | 100,653 |
| | 0.65 | % |
| Maturing after one year through five years | | 382,604 |
| | 376,198 |
| | 1.35 | % | | 376,580 |
| | 371,917 |
| | 1.27 | % |
| Maturing after five years through ten years | | — |
| | — |
| | — | % | | 253,000 |
| | 247,909 |
| | 1.59 | % |
| Total | | 533,035 |
| | 526,332 |
| | 1.24 | % | | 730,287 |
| | 720,479 |
| | 1.29 | % |
| U.S. government agency and U.S. government sponsored enterprise debt securities: | | | | | | | | | | | | |
| Maturing in one year or less | | 24,999 |
| | 24,916 |
| | 1.02 | % | | 118,966 |
| | 118,982 |
| | 0.94 | % |
| Maturing after one year through five years | | 9,732 |
| | 9,774 |
| | 2.37 | % | | 52,622 |
| | 52,630 |
| | 1.38 | % |
| Maturing after five years through ten years | | 103,394 |
| | 101,030 |
| | 2.19 | % | | 81,829 |
| | 78,977 |
| | 2.07 | % |
| Maturing after ten years | | 53,602 |
| | 53,465 |
| | 2.58 | % | | 24,474 |
| | 24,277 |
| | 2.50 | % |
| Total | | 191,727 |
| | 189,185 |
| | 2.15 | % | | 277,891 |
| | 274,866 |
| | 1.49 | % |
| U.S. government agency and U.S. government sponsored enterprise mortgage-backed securities: | | | | | | | | | | | | |
| Maturing after one year through five years | | 52,312 |
| | 52,055 |
| | 2.33 | % | | 47,278 |
| | 46,950 |
| | 1.74 | % |
| Maturing after five years through ten years | | 66,351 |
| | 65,534 |
| | 2.45 | % | | 79,379 |
| | 78,903 |
| | 3.11 | % |
| Maturing after ten years | | 1,357,306 |
| | 1,348,517 |
| | 2.20 | % | | 1,412,387 |
| | 1,399,693 |
| | 2.34 | % |
| Total | | 1,475,969 |
| | 1,466,106 |
| | 2.22 | % | | 1,539,044 |
| | 1,525,546 |
| | 2.36 | % |
Municipal securities (2): | | | | | | | | | | | | |
| Maturing in one year or less | | 12,987 |
| | 13,058 |
| | 3.56 | % | | 6,404 |
| | 6,317 |
| | 2.56 | % |
| Maturing after one year through five years | | 85,244 |
| | 85,767 |
| | 2.29 | % | | 127,178 |
| | 127,080 |
| | 2.31 | % |
| Maturing after five years through ten years | | 6,274 |
| | 6,235 |
| | 2.50 | % | | 9,785 |
| | 9,515 |
| | 2.50 | % |
| Maturing after ten years | | 12,293 |
| | 12,182 |
| | 4.31 | % | | 4,935 |
| | 4,742 |
| | 3.95 | % |
| Total | | 116,798 |
| | 117,242 |
| | 2.67 | % | | 148,302 |
| | 147,654 |
| | 2.40 | % |
| Non-agency residential mortgage-backed securities: | | | | | | | | | | | | |
| Maturing after ten years | | 9,680 |
| | 9,694 |
| | 2.72 | % | | 11,592 |
| | 11,477 |
| | 2.52 | % |
| Corporate debt securities: | | | | | | | | | | | | |
| Maturing in one year or less | | 12,655 |
| | 11,942 |
| | 2.19 | % | | 12,671 |
| | 11,347 |
| | 1.80 | % |
| Maturing after five years through ten years | | — |
| | — |
| | — | % | | 40,479 |
| | 40,500 |
| | 2.40 | % |
| Maturing after ten years | | — |
| | — |
| | — | % | | 179,231 |
| | 179,703 |
| | 2.26 | % |
| Total | | 12,655 |
| | 11,942 |
| | 2.19 | % | | 232,381 |
| | 231,550 |
| | 2.26 | % |
| Foreign bonds: | | | | | | | | | | | | |
| Maturing in one year or less | | 405,395 |
| | 389,876 |
| | 2.13 | % | | 304,427 |
| | 287,695 |
| | 2.09 | % |
| Maturing after one year through five years | | 100,000 |
| | 99,264 |
| | 2.70 | % | | 101,016 |
| | 96,199 |
| | 2.11 | % |
| Total | | 505,395 |
| | 489,140 |
| | 2.24 | % | | 405,443 |
| | 383,894 |
| | 2.09 | % |
| Other securities: | | | | | | | | | | | | |
| Maturing in one year or less | | 31,790 |
| | 31,417 |
| | — | % | | 40,501 |
| | 40,329 |
| | 2.72 | % |
| Maturing after five years through ten years | | 99 |
| | 103 |
| | 1.43 | % | | — |
| | — |
| | — | % |
| Maturing after ten years | | 115,615 |
| | 115,615 |
| | 3.78 | % | | — |
| | — |
| | — | % |
| Total | | 147,504 |
| | 147,135 |
| | 2.96 | % | | 40,501 |
| | 40,329 |
| | 2.72 | % |
| | | | | | | | | | | | | |
| Total: | | | | | | | | | | | | |
| Maturing in one year or less | | 638,257 |
| | 621,343 |
| | | | 583,676 |
| | 565,323 |
| | |
| Maturing after one year through five years | | 629,892 |
| | 623,058 |
| | | | 704,674 |
| | 694,776 |
| | |
| Maturing after five years through ten years | | 176,118 |
| | 172,902 |
| | | | 464,472 |
| | 455,804 |
| | |
| Maturing after ten years | | 1,548,496 |
| | 1,539,473 |
| | | | 1,632,619 |
| | 1,619,892 |
| | |
| Total available-for-sale investment securities | | $ | 2,992,763 |
| | $ | 2,956,776 |
| | | | $ | 3,385,441 |
| | $ | 3,335,795 |
| | |
| | | | | | | | | | | | | |
| Held-to-maturity investment security: | | | | | | | | | | | | |
| Non-agency commercial mortgage-backed security: | | | | | | | | | | | | |
| Maturing after ten years | | $ | — |
| | $ | — |
| | — | % | | $ | 143,971 |
| | $ | 144,593 |
| | 3.91 | % |
| |
| |
(1) | Weighted average yields are computed based on amortized cost balances. |
| |
(2) | Yields on tax-exempt securities are not presented on a tax-equivalent basis. |
The following sections discuss additional information on the Company’s loan portfolios, non-purchased credit impaired (“non-PCI”) nonperforming assets and allowance for credit losses.
Total Loan Portfolio
The Company offers a broad range of financial products designed to meet the credit needs of its borrowers. The Company’s loan portfolio segments include CRE,commercial loans, which consist of C&I, CRE, multifamily residential, and construction and land loans, as well as consumer loans, which consist of single-family residential, home equity lines of credit (“HELOCs”) and other consumer loans. Net loans, including loans held-for-sale, increased $2.97Loans held-for-investment totaled $52.0 billion or 12% to $28.24and $52.2 billion as of September 30, 2017March 31, 2024 and December 31, 2023, respectively, and the composition of the loan portfolio as of March 31, 2024 was similar to the composition as of December 31, 2023.
The following table presents the composition of the Company’s total loan portfolio by loan type as of March 31, 2024 and December 31, 2023:
| | | | | | | | | | | | | | | | | | | | | | | | | | | | | | |
|
| | March 31, 2024 | | December 31, 2023 | | |
| ($ in thousands) | | Amount | | % | | Amount | | % | | | | |
| Commercial: | | | | | | | | | | | | |
| C&I | | $ | 16,350,191 | | | 31 | % | | $ | 16,581,079 | | | 32 | % | | | | |
| CRE: | | | | | | | | | | | | |
| CRE | | 14,609,655 | | | 28 | % | | 14,777,081 | | | 28 | % | | | | |
| Multifamily residential | | 5,010,245 | | | 10 | % | | 5,023,163 | | | 10 | % | | | | |
| Construction and land | | 673,939 | | | 1 | % | | 663,868 | | | 1 | % | | | | |
| Total CRE | | 20,293,839 | | | 39 | % | | 20,464,112 | | | 39 | % | | | | |
| Total commercial | | 36,644,030 | | | 70 | % | | 37,045,191 | | | 71 | % | | | | |
| Consumer: | | | | | | | | | | | | |
| Residential mortgage: | | | | | | | | | | | | |
| Single-family residential | | 13,563,738 | | | 26 | % | | 13,383,060 | | | 26 | % | | | | |
| HELOCs | | 1,731,233 | | | 4 | % | | 1,722,204 | | | 3 | % | | | | |
| Total residential mortgage | | 15,294,971 | | | 30 | % | | 15,105,264 | | | 29 | % | | | | |
| Other consumer | | 53,503 | | | 0 | % | | 60,327 | | | 0 | % | | | | |
| Total consumer | | 15,348,474 | | | 30 | % | | 15,165,591 | | | 29 | % | | | | |
Total loans held-for-investment (1) | | 51,992,504 | | | 100 | % | | 52,210,782 | | | 100 | % | | | | |
| Allowance for loan losses | | (670,280) | | | | | (668,743) | | | | | | | |
Loans held-for-sale (2) | | 13,280 | | | | | 116 | | | | | | | |
| Total loans, net | | $ | 51,335,504 | | | | | $ | 51,542,155 | | | | | | | |
|
(1)Includes $63 million and $71 million of net deferred loan fees and net unamortized premiums as of March 31, 2024 and December 31, 2023, respectively.
(2)Consists of C&I loans as of March 31, 2024 and a single family-residential loan as of December 31, 2023.
Commercial
The commercial loan portfolio comprised 70% and 71% of total loans as of March 31, 2024 and December 31, 2023, respectively. The Company actively monitors the commercial lending portfolio for credit risk and reviews credit exposures for sensitivity to changing economic conditions.
Commercial — Commercial and Industrial Loans. Total C&I loan commitments were $24.7 billion and $24.6 billion as of March 31, 2024 and December 31, 2023, respectively, with a utilization rate of 66% as of March 31, 2024, compared with 67% as of December 31, 2023. Total C&I loans were $16.4 billion as of March 31, 2024, a decrease of $231 million or 1% from $25.27$16.6 billion as of December 31, 2016. The increase was broad based and driven by strong increases of $1.14 billion or 22% in residential loans, $1.00 billion or 10% in2023. Total C&I loans $836.3 million or 10% in CREmade up 31% and 32% of total loans and $44.1 million or 2% in consumer loans.
|
| | | | | | | | | | | | | | |
| |
| ($ in thousands) | | September 30, 2017 | | December 31, 2016 |
| | Amount (1) | | Percent | | Amount (1) | | Percent |
| CRE: | | | | | | | | |
| Income producing | | $ | 8,843,776 |
| | 31 | % | | $ | 8,016,109 |
| | 31 | % |
| Construction | | 572,027 |
| | 2 | % | | 551,560 |
| | 2 | % |
| Land | | 111,377 |
| | — | % | | 123,194 |
| | 1 | % |
| Total CRE | | 9,527,180 |
| | 33 | % | | 8,690,863 |
| | 34 | % |
| C&I: | | | | | | | | |
| Commercial business | | 9,776,254 |
| | 34 | % | | 8,959,633 |
| | 35 | % |
| Trade finance | | 868,902 |
| | 3 | % | | 680,930 |
| | 3 | % |
| Total C&I | | 10,645,156 |
| | 37 | % | | 9,640,563 |
| | 38 | % |
| Residential: | | | | | | | | |
| Single-family | | 4,356,009 |
| | 16 | % | | 3,509,779 |
| | 14 | % |
| Multifamily | | 1,876,956 |
| | 7 | % | | 1,585,939 |
| | 6 | % |
| Total residential | | 6,232,965 |
| | 23 | % | | 5,095,718 |
| | 20 | % |
| Consumer | | 2,120,056 |
| | 7 | % | | 2,075,995 |
| | 8 | % |
Total loans held-for-investment (2) | | $ | 28,525,357 |
| | 100 | % | | $ | 25,503,139 |
| | 100 | % |
| Allowance for loan losses | | (285,926 | ) | | | | (260,520 | ) | | |
| Loans held-for-sale | | 178 |
| | | | 23,076 |
| | |
| Total loans, net | | $ | 28,239,609 |
| | | | $ | 25,265,695 |
| | |
| |
| |
(1) | Includes $(29.2) million and $1.2 million as of September 30, 2017 and December 31, 2016, respectively, of net deferred loan fees, unearned income, unamortized premiums and unaccreted discounts. |
| |
(2) | Loans net of ASC 310-30 discount. |
Although the loan portfolio grew 12% during the nine months ended September 30, 2017, the loan type composition remained relatively unchanged from December 31, 2016. The Company’s largest credit risks are concentrated in the commercial lending portfolios, which are comprised of C&I and CRE loans. The commercial lending portfolios comprised 70% and 72% of the total loan portfolioheld-for-investment as of September 30, 2017March 31, 2024 and December 31, 2016, respectively, and are discussed further below.
C&I Loans. C&I loans of $10.65 billion and $9.64 billion, which accounted for 37% and 38% of the total loan portfolio as of September 30, 2017 and December 31, 2016, respectively, include commercial business and trade finance loans, which comprised the largest sector in the lending portfolio. Over the last few years, the Company has experienced higher growth in specialized lending verticals in industries such as private equity, energy, entertainment and structured specialty finance. As of September 30, 2017 and December 31, 2016, specialized lending verticals comprised 42% and 37% of total C&I loans,2023, respectively.
Although the C&I industry sectors in which the Company provides financing are diversified, the Company has higher concentrations in the industry sectors of wholesale trade, manufacturing, real estate and leasing, entertainment and private equity. The Company’s C&I loan exposures within the wholesale trade sector, which totaled $1.63 billion and $1.38 billion as of September 30, 2017 and December 31, 2016, respectively, are largely related to U.S. domiciled companies, which import goods from Greater China for U.S. consumer consumption, many of which are companies based in California. The private equity loans are largely capital call lines of credit. The Company also has a syndicated loan portfolio within the C&I loan portfolio includes loans and financing for businesses across a wide spectrum of industries. The Company offers a variety of C&I products, including commercial business lending, working capital lines of credit, trade finance, letters of credit, asset-based lending, asset-backed finance, project finance and equipment financing. Additionally, the Company has a portfolio of broadly syndicated C&I loans, which represent revolving or term loan facilities that are marketed and sold primarily to institutional investors. This portfolio totaled $627.9$502 million and $758.5$645 million as of September 30, 2017March 31, 2024 and December 31, 2016,2023, respectively. The majority of the C&I loans had variable interest rates as of both March 31, 2024 and December 31, 2023.
The C&I portfolio is well-diversified by industry. The Company monitors concentrations within the C&I loan portfolio by industry and customer exposure, and has exposure limits by industry classifications, setting limits for specialized lending verticals and setting diversification targets.loan product. The following table presents the industry mix within the Company’s C&I loan portfolio as of March 31, 2024 and December 31, 2023:
| | | | | | | | | | | | | | | | | | | | | | | | | | | | | | | | |
| | | | | | | | | | |
| | March 31, 2024 | | | | December 31, 2023 (1) |
| ($ in thousands) | | Amount | | % | | ($ in thousands) | | Amount | | % |
| Industry: | | | | | | Industry: | | | | |
| Real estate investment & management | | $ | 2,067,855 | | | 13 | % | | Capital call lending | | $ | 2,171,367 | | | 13 | % |
| Capital call lending | | 1,944,730 | | | 12 | % | | Real estate investment & management | | 1,970,713 | | | 12 | % |
| Media & entertainment | | 1,801,303 | | | 11 | % | | Media & entertainment | | 1,891,199 | | | 11 | % |
| Manufacturing & wholesale | | 1,084,648 | | | 7 | % | | Financial services | | 1,136,731 | | | 7 | % |
| Financial services | | 1,041,937 | | | 6 | % | | Manufacturing & wholesale | | 1,110,544 | | | 7 | % |
| Infrastructure & clean energy | | 986,436 | | | 6 | % | | Infrastructure & clean energy | | 1,023,662 | | | 6 | % |
| Food production & distribution | | 686,035 | | | 4 | % | | Tech & telecom | | 729,922 | | | 4 | % |
| Tech & telecom | | 679,839 | | | 4 | % | | Food production & distribution | | 655,340 | | | 4 | % |
| Consumer finance | | 584,290 | | | 4 | % | | Consumer finance | | 586,468 | | | 4 | % |
| Oil & gas | | 581,122 | | | 3 | % | | Hospitality & leisure | | 576,328 | | | 3 | % |
| Other | | 4,891,996 | | | 30 | % | | Other | | 4,728,805 | | | 29 | % |
| Total C&I | | $ | 16,350,191 | | | 100 | % | | Total C&I | | $ | 16,581,079 | | | 100 | % |
| | | | | | | | | | |
(1)Revised segmentation to conform with the current presentation.
CRECommercial — Total Commercial Real Estate Loans. Total CRE loans include income producing real estate,totaled $20.3 billion and $20.5 billion as of March 31, 2024 and December 31, 2023, respectively, and accounted for 39% of total loans held-for-investment as of both March 31, 2024 and December 31, 2023. The total CRE portfolio consists of CRE, multifamily residential, and construction and land loans, where the interest rates may be fixed, variable or hybrid.and affordable housing lending. The Company focuses on providing financing to experienced real estate investors and developers whoCompany’s underwriting parameters for CRE loans are long-time customers and have moderate levels of leverage. Loans are generally underwrittenestablished in compliance with high standards for cash flows, debt service coverage ratiossupervisory guidance, including property type, geography and loan-to-value ratios. Due to the nature(“LTV”). The consistency of the Company’s geographical footprint and market presence, the Companylow LTV underwriting standards has CRE loan concentrations primarilyhistorically resulted in California, which comprised 74% of thelower credit losses.
The Company’s total CRE loan portfolio is well-diversified by property type with an average CRE loan size of $3 million as of each of September 30, 2017both March 31, 2024 and December 31, 2016. Accordingly, changes2023. The following table summarizes the Company’s total CRE loans by property type as of March 31, 2024 and December 31, 2023:
| | | | | | | | | | | | | | | | | | | | | | | | | | |
|
| | March 31, 2024 | | December 31, 2023 |
| ($ in thousands) | | Amount | | % | | Amount | | % |
| Property types: | | | | | | | | |
| Multifamily | | $ | 5,010,245 | | | 25 | % | | $ | 5,023,164 | | | 25 | % |
Retail (1) | | 4,256,919 | | | 21 | % | | 4,297,569 | | | 21 | % |
Industrial (1) | | 4,028,488 | | | 20 | % | | 3,997,764 | | | 20 | % |
Hotel (1) | | 2,431,463 | | | 12 | % | | 2,446,504 | | | 12 | % |
Office (1) | | 2,245,781 | | | 11 | % | | 2,271,508 | | | 11 | % |
Healthcare (1) | | 724,422 | | | 4 | % | | 852,362 | | | 4 | % |
| Construction and land | | 673,939 | | | 3 | % | | 663,868 | | | 3 | % |
Other (1) | | 922,582 | | | 4 | % | | 911,373 | | | 4 | % |
| Total CRE loans | | $ | 20,293,839 | | | 100 | % | | $ | 20,464,112 | | | 100 | % |
|
(1)Included in CRE loans, which is a subset of Total CRE loans.
The weighted-average LTV ratio of the Californiatotal CRE loan portfolio was 50% as of both March 31, 2024 and December 31, 2023. Weighted average LTV is based on the most recent LTV, which is based on the latest available appraisal and current loan commitment. Approximately 91% of total CRE loans had an LTV ratio of 65% or lower as of both March 31, 2024 and December 31, 2023.
The following tables provide a summary of the Company’s CRE, multifamily residential, and construction and land loans by geography as of March 31, 2024 and December 31, 2023. The distribution of the total CRE loan portfolio largely reflects the Company’s geographical branch footprint, which is primarily concentrated in California.
| | | | | | | | | | | | | | | | | | | | | | | | | | | | | | | | | | | | | | | | | | | | | | | | | | |
|
| | March 31, 2024 |
| ($ in thousands) | | CRE | | % | | Multifamily Residential | | % | | Construction and Land | | % | | Total CRE | | % |
| Geographic markets: | | | | | | | | | | | | | | | | |
| Southern California | | $ | 7,545,016 | | | 51 | % | | $ | 2,340,771 | | | 47 | % | | $ | 264,824 | | | 39 | % | | $ | 10,150,611 | | | 50 | % |
| Northern California | | 2,729,200 | | | 19 | % | | 1,059,018 | | | 21 | % | | 159,425 | | | 24 | % | | 3,947,643 | | | 19 | % |
| California | | 10,274,216 | | | 70 | % | | 3,399,789 | | | 68 | % | | 424,249 | | | 63 | % | | 14,098,254 | | | 69 | % |
| Texas | | 1,103,921 | | | 8 | % | | 443,215 | | | 9 | % | | 62,992 | | | 9 | % | | 1,610,128 | | | 8 | % |
| New York | | 703,714 | | | 5 | % | | 261,894 | | | 5 | % | | 43,406 | | | 6 | % | | 1,009,014 | | | 5 | % |
| Washington | | 492,470 | | | 3 | % | | 163,383 | | | 3 | % | | 10,380 | | | 2 | % | | 666,233 | | | 3 | % |
| Arizona | | 368,389 | | | 2 | % | | 148,591 | | | 3 | % | | 46,259 | | | 7 | % | | 563,239 | | | 3 | % |
| Nevada | | 256,218 | | | 2 | % | | 141,975 | | | 3 | % | | 11,244 | | | 2 | % | | 409,437 | | | 2 | % |
| Other markets | | 1,410,727 | | | 10 | % | | 451,398 | | | 9 | % | | 75,409 | | | 11 | % | | 1,937,534 | | | 10 | % |
| Total loans | | $ | 14,609,655 | | | 100 | % | | $ | 5,010,245 | | | 100 | % | | $ | 673,939 | | | 100 | % | | $ | 20,293,839 | | | 100 | % |
|
| | | | | | | | | | | | | | | | | | | | | | | | | | | | | | | | | | | | | | | | | | | | | | | | | | |
|
| | December 31, 2023 |
| ($ in thousands) | | CRE | | % | | Multifamily Residential | | % | | Construction and Land | | % | | Total CRE | | % |
| Geographic markets: | | | | | | | | | | | | | | | | |
| Southern California | | $ | 7,604,053 | | | 51 | % | | $ | 2,295,592 | | | 46 | % | | $ | 294,879 | | | 44 | % | | $ | 10,194,524 | | | 50 | % |
| Northern California | | 2,737,635 | | | 19 | % | | 1,055,852 | | | 21 | % | | 147,031 | | | 22 | % | | 3,940,518 | | | 19 | % |
| California | | 10,341,688 | | | 70 | % | | 3,351,444 | | | 67 | % | | 441,910 | | | 66 | % | | 14,135,042 | | | 69 | % |
| Texas | | 1,122,428 | | | 8 | % | | 445,391 | | | 9 | % | | 41,768 | | | 6 | % | | 1,609,587 | | | 8 | % |
| New York | | 696,950 | | | 5 | % | | 287,961 | | | 6 | % | | 43,227 | | | 7 | % | | 1,028,138 | | | 5 | % |
| Washington | | 495,577 | | | 3 | % | | 173,367 | | | 3 | % | | 10,375 | | | 2 | % | | 679,319 | | | 3 | % |
| Arizona | | 355,047 | | | 2 | % | | 148,970 | | | 3 | % | | 38,897 | | | 6 | % | | 542,914 | | | 3 | % |
| Nevada | | 257,105 | | | 2 | % | | 142,133 | | | 3 | % | | 6,325 | | | 1 | % | | 405,563 | | | 2 | % |
| Other markets | | 1,508,286 | | | 10 | % | | 473,897 | | | 9 | % | | 81,366 | | | 12 | % | | 2,063,549 | | | 10 | % |
| Total loans | | $ | 14,777,081 | | | 100 | % | | $ | 5,023,163 | | | 100 | % | | $ | 663,868 | | | 100 | % | | $ | 20,464,112 | | | 100 | % |
|
As of both March 31, 2024 and December 31, 2023, 69% of total CRE loans were concentrated in California. Changes in California’s economy and real estate values could have a significant impact on the collectability of these loans and the required level of allowance for loan losses. 19%For additional information related to the higher degree of risk from a downturn in the California economic and real estate markets, see Item 1A. Risk Factors — Risks Related to Geopolitical Uncertainties to the Company’s2023 Form 10-K.
Commercial — Commercial Real Estate Loans. The Company focuses on providing financing to experienced real estate investors and developers who have moderate levels of leverage, many of whom are long-time customers of the Bank. CRE loans totaled $14.6 billion as of March 31, 2024, compared with $14.8 billion as of December 31, 2023, and accounted for 28% of total loans held-for-investment as of both dates. Interest rates on CRE loans may be fixed, variable or hybrid. As of March 31, 2024, 57% of our CRE portfolio had variable rates, of which 52% had customer-level interest rate derivative contracts in place. These were hedging contracts offered by the Company to help our customers manage their interest rate risk while the Bank’s exposure remained variable rate.In comparison, as of December 31, 2023, 58% of our CRE portfolio had variable rates, of which 50% had customer-level interest rate derivative contracts in place. The Company seeks to underwrite loans with conservative standards for cash flows, debt service coverage and LTV.
Owner-occupied properties comprised 20% of the CRE loans as of each of September 30, 2017both March 31, 2024 and December 31, 20162023. The remainder were owner occupiednon-owner-occupied properties, while the remaining 81% were non-owner occupied properties (wherewhere 50% or more of the debt service for the loan is typically provided by rental income). As of September 30, 2017 and December 31, 2016, the Company hadincome from an income-producing CRE portfolio that was broadly diversified across all property types.unaffiliated third party.
The Company had $572.0 million of construction loans and $507.3 million of unfunded commitments as of September 30, 2017, compared to $551.6 million of construction loans and $526.4 million of unfunded commitments as of December 31, 2016. The construction portfolio as of September 30, 2017 and December 31, 2016 was largely comprised of financing for the construction of hotels, multifamily and residential condominiums, as well as mixed use (residential and retail) structures.
Commercial —Multifamily Residential Loans. Residential loans are comprised of single-family and The multifamily residential loans. The Company offers first lien mortgage loans secured by one-to-four unit residential properties located in its primary lending areas. The Company offers a variety of first lien mortgage loan programs, including fixed rate conforming loans and adjustable rate mortgage loans with initial fixed periods of one to seven years, which adjust annually thereafter. The Company’s multifamily loan portfolio is largely comprised of loans secured by smaller multifamilyresidential properties ranging from 5 to 15 units in its primary lending areas. 71% and 73% of the Company’swith five or more units. Multifamily residential loans were concentrated in Californiatotaled $5.0 billion and accounted for 10% of total loans held-for-investment as of September 30, 2017both March 31, 2024 and December 31, 2016,2023. The Company offers a variety of first lien mortgages, including fixed- and variable-rate loans, as well as hybrid loans with interest rates that adjust annually after an initial fixed rate period of three to ten years. As of both March 31, 2024 and December 31, 2023, 48% of our multifamily residential portfolio had variable rates, of which 40% had customer-level interest rate derivative contracts in place. These were hedging contracts offered by the Company to help our customers manage their interest rate risk while the Bank’s own exposure remained variable rate.
Commercial —Construction and Land Loans. Construction and land loans provide financing for a portfolio of projects diversified by real estate property type. Construction and land loans totaled $674 million as of March 31, 2024, compared with $664 million as of December 31, 2023, and accounted for 1% of total loans held-for-investment as of both dates. Construction loan exposure was made up of $538 million in loans outstanding, plus $641 million in unfunded commitments as of March 31, 2024, compared with $526 million in loans outstanding, plus $672 million in unfunded commitments as of December 31, 2023. Land loans totaled $136 million as of March 31, 2024, compared with $138 million as of December 31, 2023.
Consumer
Residential mortgage loans are primarily originated through the Bank’s branch network. The average total residential loan size was $435 thousand and $436 thousand as of March 31, 2024 and December 31, 2023, respectively. ManyThe following tables summarize the Company’s single-family residential and HELOC loan portfolios by geography as of theMarch 31, 2024 and December 31, 2023:
| | | | | | | | | | | | | | | | | | | | | | | | | | | | | | | | | | | | | | |
|
| | March 31, 2024 |
| ($ in thousands) | | Single-Family Residential | | % | | HELOCs | | % | | Total Residential Mortgage | | % |
| Geographic markets: | | | | | | | | | | | | |
| Southern California | | $ | 5,041,793 | | | 37 | % | | $ | 812,239 | | | 47 | % | | $ | 5,854,032 | | | 38 | % |
| Northern California | | 1,701,556 | | | 13 | % | | 372,302 | | | 21 | % | | 2,073,858 | | | 14 | % |
| California | | 6,743,349 | | | 50 | % | | 1,184,541 | | | 68 | % | | 7,927,890 | | | 52 | % |
| New York | | 4,396,997 | | | 33 | % | | 247,026 | | | 14 | % | | 4,644,023 | | | 30 | % |
| Washington | | 691,594 | | | 5 | % | | 182,112 | | | 11 | % | | 873,706 | | | 6 | % |
| Massachusetts | | 409,538 | | | 3 | % | | 65,516 | | | 4 | % | | 475,054 | | | 3 | % |
| Georgia | | 448,234 | | | 3 | % | | 18,879 | | | 1 | % | | 467,113 | | | 3 | % |
| Nevada | | 422,840 | | | 3 | % | | 31,658 | | | 2 | % | | 454,498 | | | 3 | % |
| Texas | | 435,538 | | | 3 | % | | — | | | — | % | | 435,538 | | | 3 | % |
| Other markets | | 15,648 | | | 0 | % | | 1,501 | | | 0 | % | | 17,149 | | | 0 | % |
| Total | | $ | 13,563,738 | | | 100 | % | | $ | 1,731,233 | | | 100 | % | | $ | 15,294,971 | | | 100 | % |
| Lien priority: | | | | | | | | | | | | |
| First mortgage | | $ | 13,563,738 | | | 100 | % | | $ | 1,324,007 | | | 76 | % | | $ | 14,887,745 | | | 97 | % |
| Junior lien mortgage | | — | | | — | % | | 407,226 | | | 24 | % | | 407,226 | | | 3 | % |
| Total | | $ | 13,563,738 | | | 100 | % | | $ | 1,731,233 | | | 100 | % | | $ | 15,294,971 | | | 100 | % |
|
| | | | | | | | | | | | | | | | | | | | | | | | | | | | | | | | | | | | | | |
|
| | December 31, 2023 |
| ($ in thousands) | | Single-Family Residential | | % | | HELOCs | | % | | Total Residential Mortgage | | % |
| Geographic markets: | | | | | | | | | | | | |
| Southern California | | $ | 4,990,848 | | | 37 | % | | $ | 799,571 | | | 46 | % | | $ | 5,790,419 | | | 38 | % |
| Northern California | | 1,650,905 | | | 13 | % | | 370,989 | | | 22 | % | | 2,021,894 | | | 13 | % |
| California | | 6,641,753 | | | 50 | % | | 1,170,560 | | | 68 | % | | 7,812,313 | | | 51 | % |
| New York | | 4,376,416 | | | 33 | % | | 247,202 | | | 14 | % | | 4,623,618 | | | 31 | % |
| Washington | | 696,028 | | | 5 | % | | 184,843 | | | 11 | % | | 880,871 | | | 6 | % |
| Massachusetts | | 391,666 | | | 3 | % | | 67,016 | | | 4 | % | | 458,682 | | | 3 | % |
| Georgia | | 432,258 | | | 3 | % | | 17,123 | | | 1 | % | | 449,381 | | | 3 | % |
| Nevada | | 404,837 | | | 3 | % | | 33,959 | | | 2 | % | | 438,796 | | | 3 | % |
| Texas | | 423,972 | | | 3 | % | | — | | | — | % | | 423,972 | | | 3 | % |
| Other markets | | 16,130 | | | 0 | % | | 1,501 | | | 0 | % | | 17,631 | | | 0 | % |
| Total | | $ | 13,383,060 | | | 100 | % | | $ | 1,722,204 | | | 100 | % | | $ | 15,105,264 | | | 100 | % |
| Lien priority: | | | | | | | | | | | | |
| First mortgage | | $ | 13,383,060 | | | 100 | % | | $ | 1,331,509 | | | 77 | % | | $ | 14,714,569 | | | 97 | % |
| Junior lien mortgage | | — | | | — | % | | 390,695 | | | 23 | % | | 390,695 | | | 3 | % |
| Total | | $ | 13,383,060 | | | 100 | % | | $ | 1,722,204 | | | 100 | % | | $ | 15,105,264 | | | 100 | % |
|
Consumer — Single-Family Residential Loans. Single-family residential loans totaled $13.6 billion as of March 31, 2024, compared with $13.4 billion as of December 31, 2023, and accounted for 26% of total loans held-for-investment as of both dates. The Company was in a first lien position for all of its single-family residential loans within the Company’s portfolioas of both March 31, 2024 and December 31, 2023. Many of these loans are reduced documentation loans, wherefor which a substantial down payment is required, resulting in a low loan-to-valueLTV ratio at origination, typically 60%65% or less. The weighted-average LTV ratio was 52% as of March 31, 2024 and 53% as of December 31, 2023. These loans have historically experienced low delinquency and defaultloss rates. The Company offers a variety of single-family residential first lien mortgage loan programs, including fixed- and variable-rate loans, as well as hybrid loans with interest rates that adjust on a regular basis, typically annually, after an initial fixed rate period.
Consumer Loans. Consumer loans are comprised— Home Equity Lines of home equity linesCredit. Total HELOC commitments were $5.2 billion, with a utilization rate of credit (“HELOCs”)33%, insurance premium financing loans, credit card and auto loans. Asas of September 30, 2017both March 31, 2024 and December 31, 2016,2023. Substantially all of the Company’s unfunded HELOC commitments are unconditionally cancellable. HELOCs were the largest componentoutstanding totaled $1.7 billion as of the consumer loan portfolio,both March 31, 2024 and were secured by one-to-four unit residential properties located in its primary lending areas. The HELOC loan portfolio is largely comprisedDecember 31, 2023, and accounted for 4% and 3% of total loans originated through a reduced documentation loan program where a substantial down payment is required, resulting in a low loan-to-value ratio, typically 60% or less.held-for-investment as of March 31, 2024 and December 31, 2023, respectively. The Company iswas in a first lien position for many76% and 77% of total outstanding HELOCs as of March 31, 2024 and December 31, 2023, respectively. The weighted-average LTV ratio was 48% on HELOC commitments as of both dates. Weighted-average LTV ratio represents the loan’s balance divided by the estimated current property value. Combined LTV ratios are used for junior lien home equity loans. Many of these loans are reduced documentation HELOCs. Theseloans, resulting in a low LTV ratio at origination, typically 65% or less. As a result, these loans have historically experienced low delinquency and defaultloss rates.
The Substantially all of the Company’s total loan portfolio includes originated and purchased loans. Originated and purchasedHELOCs were variable-rate loans for which there was no evidence of credit deterioration at their acquisition date, are collectively referred to as non-PCI loans. Acquired loans for which there was, at the acquisition date, evidence of credit deterioration are referred to as PCI loans. PCI loans are recorded net of ASC 310-30 discount and totaled $532.3 million and $642.4 million as of September 30, 2017both March 31, 2024 and December 31, 2016, respectively. For additional details regarding PCI2023.
All originated commercial and consumer loans see Note 8 — Loans Receivable and Allowance for Credit Lossesare subject to the Consolidated Financial Statements.Company’s conservative underwriting guidelines and loan origination standards. Management believes that the Company’s underwriting criteria and procedures adequately consider the unique risks associated with these products. The Company conducts a variety of quality control procedures and periodic audits, including the review of lending and legal requirements, to ensure that the Company is in compliance with these requirements.
Foreign Outstandings
The Company’s overseas offices, which include the branch in Hong Kong and the subsidiary bank in China.China, are subject to the general risks inherent in conducting business in foreign countries, such as regulatory, economic and political uncertainties. As of September 30, 2017such, the Company’s international operation risk exposure is largely concentrated in China and December 31, 2016, loansHong Kong. In addition, the Company’s financial assets held in the Hong Kong branch totaled $686.3 million and $733.3 million, respectively. As of September 30, 2017 and December 31, 2016, loans held in the subsidiary bank in China totaled $499.5 million and $425.3 million, respectively. Thesemay be affected by fluctuations in currency exchange rates or other factors. The following table presents the major financial assets held in the Company’s overseas loans are comprised mainly of C&I loans made to cross-border or trade finance companies. In total, these loans represented 3% of total consolidated assetsoffices as of September 30, 2017March 31, 2024 and December 31, 2016.2023:
| | | | | | | | | | | | | | | | | | | | | | | | | | |
|
| | March 31, 2024 | | December 31, 2023 |
| ($ in thousands) | | Amount | | % of Total Consolidated Assets | | Amount | | % of Total Consolidated Assets |
| Hong Kong branch: | | | | | | | | |
| Cash and cash equivalents | | $ | 543,831 | | | 1 | % | | $ | 631,487 | | | 1 | % |
| | | | | | | | |
AFS debt securities (1) | | $ | 541,262 | | | 1 | % | | $ | 546,495 | | | 1 | % |
Loans held-for-investment (2) | | $ | 807,506 | | | 1 | % | | $ | 934,734 | | | 1 | % |
| Total assets | | $ | 1,897,761 | | | 3 | % | | $ | 2,115,857 | | | 3 | % |
| Subsidiary bank in China: | | | | | | | | |
| Cash and cash equivalents | | $ | 753,207 | | | 1 | % | | $ | 719,058 | | | 1 | % |
| | | | | | | | |
AFS debt securities (3) | | $ | 120,570 | | | 0 | % | | $ | 120,167 | | | 0 | % |
Loans held-for-investment (2) | | $ | 1,358,047 | | | 2 | % | | $ | 1,328,383 | | | 2 | % |
| Total assets | | $ | 2,240,428 | | | 3 | % | | $ | 2,156,548 | | | 3 | % |
|
When a determination is made at the time(1)Comprised of commitment to originate or purchase loansU.S. government agency and U.S. government-sponsored enterprise mortgage-backed securities, U.S. Treasury securities, and foreign government bonds as held-for-investment, it is the Company’s intent to hold these loans to maturity or for the “foreseeable future,” subject to periodic reviews under the Company’s management evaluation processes, including asset/liability management. When the Company subsequently changes its intent to hold certain loans, the loans are transferred from held-for-investment to held-for-sale at the lower of cost or fair value. As of September 30, 2017, loans held-for-sale amounted to $178 thousand, which wereMarch 31, 2024; comprised of single-family residential loans. In comparison,foreign government bonds and U.S. Treasury securities as of December 31, 2016, loans held-for-sale amounted to $23.1 million, which were primarily comprised of consumer loans. Loans transferred from held-for-investment to held-for-sale were $74.5 million and $418.5 million during the three and nine months ended September 30, 2017, respectively. These loan transfers were primarily2023.
(2)Primarily comprised of C&I loans for both periods. In comparison, $144.9 million and $720.7 million of loans were transferred from held-for-investment to held-for-sale during the three and nine months ended September 30, 2016, respectively. These loan transfers were primarily comprised of C&I, multifamily residential and CRE loans for both periods. The Company recorded $232 thousand and $441 thousand in write-downs to the allowance for loan losses related to loans transferred from held-for-investment to held-for-sale for the three and nine months ended September 30, 2017, respectively. In comparison, there were no write-downs and $1.9 million of write-downs recorded to the allowance for loan losses related to loans transferred from held-for-investment to held-for-sale for the three and nine months ended September 30, 2016, respectively.
During the three and nine months ended September 30, 2017, the Company sold $33.8 million and $101.4 million, respectively, in originated loans, resulting in net gains of $2.3 million and $5.5 million, respectively. Originated loans sold during the three months ended September 30, 2017 were primarily comprised of $15.7 million of CRE loans and $12.3 million of C&I loans. Originated loans sold during the nine months ended September 30, 2017 were primarily comprised of $50.5 million of C&I loans and $34.8 million of CRE loans. In comparison, the Company sold $107.3 million in originated loans during the three months ended September 30, 2016, resulting in net gains of $2.2 million. Originated loans sold during this period were primarily comprised of $53.9 million of C&I loans and $46.0 million of CRE loans. During the nine months ended September 30, 2016, the Company sold or securitized $529.5 million in originated loans, resulting in net gains of $9.3 million. Included in these amounts were $201.7 million of multifamily residential loans securitized during the first quarter of 2016, which resulted in net gains of $1.1 million, $641 thousand in mortgage servicing rights and $160.1 million of held-to-maturity investment security that were recorded. The remaining $327.8 million of originated loans sold during the nine months ended September 30, 2016, primarily comprising of $171.9 million of CRE loans and $99.6 million of C&I loans, resulted in net gains of $8.2 million.
During the three and nine months ended September 30, 2017, the Company purchased $72.4 million and $441.1 million loans, respectively, compared to $256.2 million and $1.04 billion during the three and nine months ended September 30, 2016, respectively. Purchased loans for each of the three and nine months ended September 30, 2017 were primarily comprised of C&I syndication loans. Purchased loans for each of the three and nine months ended September 30, 2016 were primarily comprised of C&I syndication loans and single-family residential loans. The higher loans purchased for the three and nine months ended September 30, 2016, primarily included $165.8 million and $488.3 million, respectively, of single-family residential loans purchased for Community Reinvestment Act purposes.
From time to time, the Company purchases and sells loans in the secondary market. Certain purchased loans are transferred from held-for-investment to held-for-sale and write-downs to allowance for loan losses are recorded, when appropriate. During the three and nine months ended September 30, 2017, the Company sold loans of $57.4 million and $354.5 million, respectively, in the secondary market at net gains of $19 thousand and $1.2 million, respectively. In comparison, the Company sold loans of $45.8 million and $179.4 million for the three and nine months ended September 30, 2016, respectively, in the secondary market. Loan sales in the secondary market resulted in no gains or losses and $69 thousand in net gains recorded for the three and nine months ended September 30, 2016, respectively.
The Company records valuation adjustments in Net gains on sales of loans on the Consolidated Statements of Income to carry the loans held-for-sale portfolio at the lower of cost or fair value. For each of the three months ended September 30, 2017 and 2016, no valuation adjustments were recorded. For the nine months ended September 30, 2017 and 2016, the Company recorded $61 thousand and $2.4 million, respectively, in valuation adjustments.
Non-PCI Nonperforming Assets
Non-PCI nonperforming assets are comprised of nonaccrual loans and other real estate owned (“OREO”), net. Loans are placed on nonaccrual status when they become 90 days past due or when the full collection of principal or interest becomes uncertain regardless of the length of past due status. The following table presents information regarding non-PCI nonperforming assets as of September 30, 2017both March 31, 2024 and December 31, 2016:2023.
|
| | | | | | | | |
| |
| ($ in thousands) | | September 30, 2017 | | December 31, 2016 |
| Nonaccrual loans: | | | | |
| Real estate - commercial | | $ | 24,802 |
| | $ | 26,907 |
|
| Real estate - land and construction | | 4,183 |
| | 5,326 |
|
| Commercial | | 73,384 |
| | 81,256 |
|
| Real estate - single-family | | 6,639 |
| | 4,214 |
|
| Real estate - multifamily | | 2,620 |
| | 2,984 |
|
| Consumer | | 3,097 |
| | 2,130 |
|
| Total nonaccrual loans | | 114,725 |
| | 122,817 |
|
| OREO, net | | 2,289 |
| | 6,745 |
|
| Total nonperforming assets | | $ | 117,014 |
| | $ | 129,562 |
|
Non-PCI nonperforming assets to total assets (1) | | 0.32 | % | | 0.37 | % |
Non-PCI nonaccrual loans to loans held-for-investment (1) | | 0.40 | % | | 0.48 | % |
| Allowance for loan losses to non-PCI nonaccrual loans | | 249.23 | % | | 212.12 | % |
| |
| |
(1) | Total assets and loans held-for-investment include PCI loans of $532.3 million and $642.4 million as of September 30, 2017 and December 31, 2016, respectively. |
Typically, changes to nonaccrual loans period-over-period represent inflows for loans that are placed on nonaccrual status in accordance with the Company’s accounting policy, offset by reductions for loans that are paid down, charged off, sold, foreclosed, or no longer classified as nonaccrual as a result(3)Comprised of continued performance and improvement in the borrower’s financial condition and loan repayment capabilities. Nonaccrual loans decreased by $8.1 million or 7% to $114.7 millionforeign government bonds as of September 30, 2017 from $122.8 million as of Decemberboth March 31, 2016. The decrease in nonaccrual loans was primarily due to payoffs and paydowns of nonaccrual loans of $70.2 million, transfers of nonaccrual loans to accrual status of $37.2 million, and charge-offs of nonaccrual loans of $19.5 million, partially offset by loans transferred to nonaccrual status of $119.4 million, during the nine months ended September 30, 2017. Nonaccrual loans as a percentage of loans held-for-investment declined from 0.48% as of December 31, 2016 to 0.40% as of September 30, 2017. C&I loans comprised 64% and 66% of total nonaccrual loans as of September 30, 20172024 and December 31, 2016, respectively. Credit risks related to the C&I nonaccrual loans were mitigated by the collateral. In addition, the risk of loss of all nonaccrual loans had been considered as of September 30, 2017 and December 31, 2016 and the Company believes that this was appropriately covered by the allowance for loan losses.2023.
In addition, 36% and 64% of non-PCI nonaccrual loans consisted of loans that were less than 90 days delinquent as of September 30, 2017 and December 31, 2016, respectively.
For additional details regarding the Company’s non-PCI nonaccrual loans policy, see Note 1 — Summary of Significant Accounting Policies to the Consolidated Financial Statements of the Company’s 2016 Form 10-K.
Troubled debt restructurings (“TDRs”) may be designated as performing or nonperforming. A TDR may be designated as performing, if the loan has demonstrated sustained performance under the modified terms. The period of sustained performance may include the periods prior to modification if prior performance has met or exceeded the modified terms. A loan will remain on nonaccrual status until the borrower demonstrates a sustained period of performance, generally six consecutive months of payments.
The following table presents the performing and nonperforming TDRstotal revenue generated by loan segment as of September 30, 2017 and December 31, 2016:
|
| | | | | | | | | | | | | | | | |
| |
| ($ in thousands) | | September 30, 2017 | | December 31, 2016 |
| | Performing TDRs | | Nonperforming TDRs | | Performing TDRs | | Nonperforming TDRs |
| CRE | | $ | 10,347 |
| | $ | 19,830 |
| | $ | 20,145 |
| | $ | 14,446 |
|
| C&I | | 20,416 |
| | 44,292 |
| | 44,363 |
| | 23,771 |
|
| Residential | | 18,872 |
| | 486 |
| | 17,178 |
| | 717 |
|
| Consumer | | 1,204 |
| | 375 |
| | 1,552 |
| | 49 |
|
| Total TDRs | | $ | 50,839 |
| | $ | 64,983 |
| | $ | 83,238 |
| | $ | 38,983 |
|
| |
Performing TDRs decreased by $32.4 million or 39% to $50.8 million as of September 30, 2017, primarily due to the transfers of one CRE and two C&I loans from performing to nonperforming status during the nine months ended September 30, 2017. Nonperforming TDRs increased by $26.0 million or 67% to $65.0 million as of September 30, 2017, primarily due to the aforementioned transfers of CRE and C&I loans between performing and nonperforming status and a C&I loan becoming a TDR loan during the nine months ended September 30, 2017.
The Company’s impaired loans include predominantly non-PCI loans held-for-investment on nonaccrual status and non-PCI loans modified as a TDR, on either accrual or nonaccrual status. See Note 1 — Summary of Significant Accounting Policies to the Consolidated Financial Statements of the Company’s 2016 Form 10-K for additional information regarding the Company’s TDRs and impaired loan policies. As of September 30, 2017, the allowance for loan losses included $20.8 million for impaired loans with a total recorded investment balance of $72.6 million. In comparison, the allowance for loan losses included $12.7 million for impaired loans with a total recorded investment balance of $84.1 million as of December 31, 2016.
The following table presents the recorded investment balances for non-PCI impaired loans as of September 30, 2017 and December 31, 2016:
|
| | | | | | | | | | | | | | |
| |
| ($ in thousands) | | September 30, 2017 | | December 31, 2016 |
| | Amount | | Percent | | Amount | | Percent |
| CRE: | | | | | | | | |
| Income producing | | $ | 35,149 |
| | 21 | % | | $ | 46,508 |
| | 23 | % |
| Land | | 4,183 |
| | 3 | % | | 5,870 |
| | 3 | % |
| Total CRE impaired loans | | 39,332 |
| | 24 | % | | 52,378 |
| | 26 | % |
| C&I: | | | | | | | | |
| Commercial business | | 89,092 |
| | 54 | % | | 120,453 |
| | 58 | % |
| Trade finance | | 4,708 |
| | 3 | % | | 5,166 |
| | 2 | % |
| Total C&I impaired loans | | 93,800 |
| | 57 | % | | 125,619 |
| | 60 | % |
| Residential: | | | | | | | | |
| Single-family | | 15,899 |
| | 10 | % | | 14,335 |
| | 7 | % |
| Multifamily | | 12,232 |
| | 7 | % | | 10,041 |
| | 5 | % |
| Total residential impaired loans | | 28,131 |
| | 17 | % | | 24,376 |
| | 12 | % |
| Consumer | | 4,301 |
| | 2 | % | | 3,682 |
| | 2 | % |
| Total impaired loans | | $ | 165,564 |
| | 100 | % | | $ | 206,055 |
| | 100 | % |
| |
Allowance for Credit Losses
Allowance for credit losses consists of allowance for loan losses and allowance for unfunded credit reserves. Unfunded credit reserves include reserves provided for unfunded lending commitments, issued commercial letters of credit and standby letters of credit (“SBLCs”), and recourse obligations for loans sold. The allowance for credit losses is increased by the provision for credit losses which is charged against current period operating results, and is increased or decreased by the amount of net recoveries or charge-offs, respectively, during the period. The allowance for unfunded credit reserves is included in Accrued expenses and other liabilities on the Consolidated Balance Sheets. Net adjustments to the allowance for unfunded credit reserves are included in Provision for credit losses on the Consolidated Statements of Income.
The Company is committed to maintaining the allowance for credit losses at a level that is commensurate with the estimated inherent loss in the loan portfolio, including unfunded credit reserves. In addition to regular quarterly reviews of the adequacy of the allowance for credit losses, the Company performs an ongoing assessment of the risks inherent in the loan portfolio. While the Company believes that the allowance for loan losses is appropriate as of September 30, 2017, future allowance levels may increase or decrease based on a variety of factors, including loan growth, portfolio performance and general economic conditions. For additional details on the Company’s allowance for credit losses, including the methodologies used, see Note 8 — Loans Receivable and Allowance for Credit Losses to the Consolidated Financial Statements, and Item 7. MD&A — Critical Accounting Policies and Estimates and Note 1 — Summary of Significant Accounting Policies to the Consolidated Financial Statements of the Company’s 2016 Form 10-K.
The following table presents a summary of activities in the allowance for credit lossesoverseas offices for the threefirst quarters of 2024 and nine months ended September 30, 2017 and 2016:2023:
| | | | | | | | | | | | | | | | | | | | | | | | | | | | | | | | | | |
|
| | Three Months Ended March 31, | | |
| | 2024 | | 2023 | | | | |
| ($ in thousands) | | Amount | | % of Total Consolidated Revenue | | Amount | | % of Total Consolidated Revenue | | | | | | | | |
| Hong Kong Branch: | | | | | | | | | | | | | | | | |
| Total revenue | | $ | 18,093 | | | 3 | % | | $ | 15,318 | | | 2 | % | | | | | | | | |
| Subsidiary Bank in China: | | | | | | | | | | | | | | | | |
| Total revenue | | $ | 7,444 | | | 1 | % | | $ | 7,885 | | | 1 | % | | | | | | | | |
|
Capital
|
| | | | | | | | | | | | | | | | |
| |
| ($ in thousands) | | Three Months Ended September 30, | | Nine Months Ended September 30, |
| | 2017 | | 2016 | | 2017 | | 2016 |
| Allowance for loan losses, beginning of period | | $ | 276,316 |
| | $ | 266,768 |
| | $ | 260,520 |
| | $ | 264,959 |
|
| Provision for loan losses | | 13,448 |
| | 11,514 |
| | 32,134 |
| | 19,049 |
|
| Gross charge-offs: | | | | | | | | |
| CRE | | — |
| | (309 | ) | | (149 | ) | | (504 | ) |
| C&I | | (7,359 | ) | | (23,696 | ) | | (19,802 | ) | | (31,770 | ) |
| Residential | | — |
| | (29 | ) | | (1 | ) | | (166 | ) |
| Consumer | | (65 | ) | | (13 | ) | | (72 | ) | | (17 | ) |
| Total gross charge-offs | | (7,424 | ) | | (24,047 | ) | | (20,024 | ) | | (32,457 | ) |
| Gross recoveries: | | | | | | | | |
| CRE | | 610 |
| | 634 |
| | 1,714 |
| | 873 |
|
| C&I | | 2,165 |
| | 165 |
| | 9,658 |
| | 2,068 |
|
| Residential | | 809 |
| | 654 |
| | 1,758 |
| | 1,048 |
|
| Consumer | | 2 |
| | 124 |
| | 166 |
| | 272 |
|
| Total gross recoveries | | 3,586 |
| | 1,577 |
| | 13,296 |
| | 4,261 |
|
| Net charge-offs | | (3,838 | ) | | (22,470 | ) | | (6,728 | ) | | (28,196 | ) |
| Allowance for loan losses, end of period | | 285,926 |
| | 255,812 |
| | 285,926 |
| | 255,812 |
|
| | | | | | | | | |
| Allowance for unfunded credit reserves, beginning of period | | 15,188 |
| | 20,318 |
| | 16,121 |
| | 20,360 |
|
| Reversal of unfunded credit reserves | | (452 | ) | | (1,989 | ) | | (1,385 | ) | | (2,031 | ) |
| Allowance for unfunded credit reserves, end of period | | 14,736 |
| | 18,329 |
| | 14,736 |
| | 18,329 |
|
| Allowance for credit losses | | $ | 300,662 |
| | $ | 274,141 |
| | $ | 300,662 |
| | $ | 274,141 |
|
| | | | | | | | | |
| Average loans held-for-investment | | $ | 27,529,103 |
| | $ | 24,258,913 |
| | $ | 26,764,327 |
| | $ | 23,961,288 |
|
| Loans held-for-investment, end of period | | $ | 28,525,357 |
| | $ | 24,731,962 |
| | $ | 28,525,357 |
| | $ | 24,731,962 |
|
| Annualized net charge-offs to average loans held-for-investment | | (0.06 | )% | | (0.37 | )% | | (0.03 | )% | | (0.16 | )% |
| Allowance for loan losses to loans held-for-investment | | 1.00 | % | | 1.03 | % | | 1.00 | % | | 1.03 | % |
As of September 30, 2017, the allowance for loan losses amounted to $285.9 million or 1.00% of loans held-for-investment, compared to $260.5 million or 1.02% and $255.8 million or 1.03% of loans held-for-investment as of December 31, 2016 and September 30, 2016, respectively. The increase in the allowance for loan losses was largely due to the overall growth in the loan portfolio. The allowance for loan losses to loans held-for-investment ratio as of September 30, 2017 decreased slightly compared to both December 31, 2016 and September 30, 2016. The decrease in this ratio was primarily attributable to the higher credit quality of newly originated loans, resulting in loans held-for-investment increasing at a higher rate than the estimated allowance for loan losses. In addition, the extended good economic cycle and sound credit risk management practices have led to continued declines in the Company’s historical loss rate experience, which has resulted in a slower rate of change in the allowance for loan losses compared to the Company’s loan growth.Provision for credit losses includes provision for loan losses and unfunded credit reserves. Provision for credit losses is charged to income to bring the allowance for credit losses to a level deemed appropriate by the Company based on the factors described above. The fluctuation in the provision for credit losses is highly dependent on the historical loss rates trend along with the net charge-offs experienced during the period. The increase in the provision for credit losses for the three and nine months ended September 30, 2017, compared to the same periods in 2016, was reflective of the overall loan portfolio growth, partially offset by a decline in the historical loss factor during the same periods. The Company believes the allowance for credit losses as of September 30, 2017 and December 31, 2016 was appropriate to cover credit losses inherent in the loan portfolio, including unfunded credit commitments, at that date.
The following table presents the Company’s allocation of the allowance for loan losses by segment and the ratio of each loan segment to total loans held-for-investment as of September 30, 2017 and December 31, 2016:
|
| | | | | | | | | | | | | | |
| ($ in thousands) | | September 30, 2017 | | December 31, 2016 |
| | Allowance Allocation | | % of Total Loans | | Allowance Allocation | | % of Total Loans |
| CRE | | $ | 74,317 |
| | 33 | % | | $ | 72,916 |
| | 34 | % |
| C&I | | 160,598 |
| | 37 | % | | 142,167 |
| | 38 | % |
| Residential | | 43,905 |
| | 23 | % | | 37,338 |
| | 20 | % |
| Consumer | | 7,106 |
| | 7 | % | | 8,099 |
| | 8 | % |
| Total | | $ | 285,926 |
| | 100 | % | | $ | 260,520 |
| | 100 | % |
| |
The Company maintains an allowance on non-PCI and PCI loans. Based on the Company’s estimates of cash flows expected to be collected, an allowance for the PCI loans is established, with a charge to income through the provision for loan losses. PCI loan losses are estimated collectively for groups of loans with similar characteristics. As of September 30, 2017, the Company established an allowance of $68 thousand on $532.3 million of PCI loans. In comparison, an allowance of $118 thousand was established on $642.4 million of PCI loans as of December 31, 2016. The allowance balances for both periods were attributed mainly to the PCI CRE loans.
Deposits
The Company offers a wide variety of deposit products to both consumer and commercial customers. Deposits are an important low-cost source of funding, and affect net interest income and net interest margin. The following table presents the balances for customer deposits as of September 30, 2017 and December 31, 2016:
|
| | | | | | | | | | | | | | | | | | | | | |
| |
| ($ in thousands) | | | Change |
| | September 30, 2017 | | % of total deposits | | December 31, 2016 | | % of total
deposits | | $ | | % |
| Core deposits: | | | | | | | | | | | | |
| Noninterest-bearing demand | | $ | 10,992,674 |
| | 35 | % | | $ | 10,183,946 |
| | 34 | % | | $ | 808,728 |
| | 8 | % |
| Interest-bearing checking | | 4,108,859 |
| | 13 | % | | 3,674,417 |
| | 12 | % | | 434,442 |
| | 12 | % |
| Money market | | 7,939,031 |
| | 25 | % | | 8,174,854 |
| | 27 | % | | (235,823 | ) | | (3 | )% |
| Savings | | 2,476,557 |
| | 8 | % | | 2,242,497 |
| | 8 | % | | 234,060 |
| | 10 | % |
| Total core deposits | | 25,517,121 |
| | 81 | % | | 24,275,714 |
| | 81 | % | | 1,241,407 |
| | 5 | % |
| Time deposits | | 5,794,541 |
| | 19 | % | | 5,615,269 |
| | 19 | % | | 179,272 |
| | 3 | % |
| Total deposits | | $ | 31,311,662 |
| | 100 | % | | $ | 29,890,983 |
| | 100 | % | | $ | 1,420,679 |
| | 5 | % |
| | | | | | | |
Total deposits increased mainly due to growth in noninterest-bearing demand and interest-bearing checking deposits from existing and new customers. The Company’s deposit strategy is to grow and retain relationship-based deposits, and provide a source of low-cost funding and liquidity to the Company. Core deposits comprised 81% of total deposits as of each of September 30, 2017 and December 31, 2016. The $1.24 billion or 5% increase in core deposits was primarily due to the increases in noninterest-bearing demand deposits and interest-bearing checking deposits. Noninterest-bearing demand deposits comprised 35% and 34% of total deposits as of September 30, 2017 and December 31, 2016, respectively. Interest-bearing checking deposits comprised 13% and 12% of total deposits as of September 30, 2017 and December 31, 2016, respectively. As of September 30, 2017, deposits were 110% of total loans, compared to 117% as of December 31, 2016, as the growth in total loans outpaced deposit growth.
Borrowings
The Company utilizes short-term and long-term borrowings to manage its liquidity position. Borrowings include short-term borrowings, long-term FHLB advances and repurchase agreements.
As of September 30, 2017 and December 31, 2016, short-term borrowings were comprised of the Company’s subsidiary, East West Bank (China) Limited’s borrowings of $24.8 million and $60.1 million, respectively. The interest rates of these borrowings ranged from 2.96% to 3.27% and 2.80% to 3.27% as of September 30, 2017 and December 31, 2016, respectively. As of September 30, 2017, the short-term borrowings of $24.8 million are due to mature in the fourth quarter of 2017.
FHLB advances increased by $1.7 million to $323.3 million as of September 30, 2017 from $321.6 million as of December 31, 2016. As of September 30, 2017, FHLB advances had floating interest rates ranging from 1.48% to 1.72% with remaining maturities between 1.4 and 5.1 years.
Gross repurchase agreements totaled $450.0 million as of each of September 30, 2017 and December 31, 2016. Resale and repurchase agreements are reported net pursuant to ASC 210-20-45, Balance Sheet Offsetting. Net repurchase agreements totaled $50.0 million and $350.0 million as of September 30, 2017 and December 31, 2016, respectively. As of September 30, 2017, $400.0 million of repurchase agreements were eligible for netting against resale agreements, resulting in $50.0 million of net repurchase agreements reported. In comparison, $100.0 million of gross repurchase agreements were eligible for netting against resale agreements, resulting in $350.0 million of net repurchase agreements reported as of December 31, 2016. As of September 30, 2017, gross repurchase agreements of $450.0 million had interest rates ranging between 3.54% to 3.58% and original terms ranging between 10.0 and 16.5 years. The remaining maturity terms of the repurchase agreements range between 5.1 and 5.9 years.
Repurchase agreements are accounted for as collateralized financing transactions and recorded at the balances at which the securities were sold. The collateral for the repurchase agreements is primarily comprised of U.S. Treasury securities, U.S. government agency and U.S. government sponsored enterprise mortgage-backed securities, and U.S. government agency and U.S. government sponsored enterprise debt securities. To ensure that the market value of the underlying collateral remains sufficient, the Company monitors the fair value of collateral pledged relative to the principal amounts borrowed under repurchase agreements. The Company manages liquidity risks related to the repurchase agreements by sourcing funding from a diverse group of counterparties and entering into repurchase agreements with longer durations, when appropriate. For additional details, see Note 5 — Securities Purchased under Resale Agreements and Sold under Repurchase Agreements to the Consolidated Financial Statements.
Long-Term Debt
The Company uses long-term debt to provide funding to acquire income earning assets and enhance liquidity. Long-term debt, which consists of junior subordinated debt and a term loan, decreased $9.8 million or 5% from $186.3 million as of December 31, 2016 to $176.5 million as of September 30, 2017. The decrease was primarily due to the quarterly repayment on the term loan, totaling $10.0 million, during the nine months ended September 30, 2017.
The junior subordinated debt was issued in connection with the Company’s various pooled trust preferred securities offerings. Junior subordinated debt is recorded as a component of long-term debt and includes the value of the common stock issued by six wholly-owned subsidiaries in conjunction with these transactions. The junior subordinated debt totaled $152.6 million and $146.3 million as of September 30, 2017 and December 31, 2016, respectively. The junior subordinated debt had a weighted average interest rate of 2.73% and 2.22% for the nine months ended September 30, 2017 and 2016, respectively, and remaining maturity terms of 17.2 to 20.0 years as of September 30, 2017. Beginning in 2016, trust preferred securities no longer qualify as Tier 1 capital and are limited to Tier 2 capital for regulatory purposes, based on Basel III Capital Rules. For further discussion, see Item 1. Business — Supervision and Regulation — Capital Requirements of the Company’s 2016 Form 10-K.
In 2013, the Company entered into a $100.0 million three-year term loan agreement. The terms of the agreement were modified in 2015 to extend the term loan maturity from July 1, 2016 to December 31, 2018, where principal repayments of $5.0 million are due quarterly. The term loan bears interest at the rate of the three-month London Interbank Offered Rate plus 150 basis points and the weighted average interest rate was 2.65% and 2.19% for the nine months ended September 30, 2017 and 2016, respectively. The outstanding balance of the term loan was $30.0 million and $40.0 million as of September 30, 2017 and December 31, 2016, respectively.
Capital
The Company maintains an adequatestrong capital base to support its anticipated asset growth, operating needs, and credit risks, and to ensure that East Westthe Company and the Bank are in compliance with all regulatory capital guidelines. The Company engages in regular capital planning processes on at least an annual basis to optimize the use of available capital and to appropriately plan for future capital needs. Theneeds, allocating capital plan considers capital needs for the foreseeable future and allocates capital to both existing and future business activities. In addition,Furthermore, the Company conducts capital stress tests as part of its annual capital planning process. The stress tests enable the Company to assess the impact of adverse changes in the economy and interest rates on its capital base.
On March 3, 2020, the Company’s Board of Directors authorized the repurchase of $500 million of the Company’s common stock. During the first quarter of 2024, the Company repurchased $82 million of common stock or 1,181,851 shares at an average price of $69.76 per share. In comparison, the Company repurchased $82 million of common stock or 1,506,091 shares, at an average price of $54.56 per share in 2023. The total remaining available capital authorized for repurchase as of March 31, 2024 was $89 million.
The Company’s stockholders’ equity increased by $354.2 million or 10% to $3.78was $7.0 billion as of September 30, 2017, compared to $3.43 billion as ofboth March 31, 2024 and December 31, 2016. The Company’s primary source of capital is the retention of its operating earnings. Retained earnings2023, which increased by $333.1$72 million or 15%to $2.52 billion as1% during the first quarter of September 30, 2017, compared to $2.19 billion as of December 31, 2016.2024. The increase in the Company’s stockholders’ equity was primarily due to $285 million of net income, partially offset by $82 million of $420.7 million, reduced by $87.6common stock repurchases, $78 million of cash dividends during the nine months ended September 30, 2017. In addition, common stockdeclared, and additional paid-in capital increased by $17.7$42 million or 1.0% primarily due to the activities in employee stock compensation plans.of other comprehensive loss. For other factors that contributed to the changes in stockholders’ equity, refer to theItem 1. Consolidated Financial Statements — Consolidated Statement of Changes in Stockholders’ Equity.Equity in this Form 10-Q.
Book value per share was $26.17 per common share based on 144.5 million common shares outstanding$50.48 as of September 30, 2017, compared to $23.78March 31, 2024, an increase of 2% from $49.64 per common share based on 144.2 million common shares outstanding as of December 31, 2016. 2023, a result of both the increase in the Company’s stockholders’ equity described above and a decrease in the Company’s common shares outstanding. Tangible book value per share was $47.09 as of March 31, 2024, compared with $46.27 as of December 31, 2023. For additional details, see the reconciliation of non-GAAP measures presented under Item 2. MD&A — Reconciliation of GAAP to Non-GAAP Financial Measures in this Form 10-Q.
The Company madepaid a quarterly common stock cash dividend payments of $0.20$0.55 and $0.48 per common share in each quarter during the nine months ended September 30, 2017first quarters of 2024 and 2016.2023, respectively. In October 2017,April 2024, the Company’s Board of Directors (the “Board”) declared fourtha second quarter 2017 cash dividends for the Company’s common stock. The common stock2024 cash dividend of $0.20$0.55 per shareshare. The dividend is payable on November 15, 2017May 17, 2024, to stockholders of record as of November 1, 2017.May 3, 2024.
Deposits and Other Sources of Funding
Deposits are the Company’s primary source of funding, the cost of which has a significant impact on the Company’s net interest income and net interest margin. Additional funding is provided by short- and long-term borrowings, and long-term debt. See Item 2.MD&A — Risk Management — Liquidity Risk Management — Liquidity in this Form 10-Q for a discussion of the Company’s liquidity management. The following table summarizes the Company’s sources of funds as of March 31, 2024 and December 31, 2023:
| | | | | | | | | | | | | | | | | | | | | | | | | | | | | | | | | | | | | | |
|
| | March 31, 2024 | | December 31, 2023 | | Change |
| ($ in thousands) | | Amount | | % | | Amount | | % | | $ | | % |
| Deposits: | | | | | | | | | | | | |
| | | | | | | | | | | | |
| Noninterest-bearing demand | | $ | 14,798,927 | | | 25 | % | | $ | 15,539,872 | | | 28 | % | | $ | (740,945) | | | (5) | % |
| Interest-bearing checking | | 7,570,427 | | | 13 | % | | 7,558,908 | | | 14 | % | | 11,519 | | | 0 | % |
| Money market | | 13,585,597 | | | 23 | % | | 13,108,727 | | | 23 | % | | 476,870 | | | 4 | % |
| Savings | | 1,834,393 | | | 3 | % | | 1,841,467 | | | 3 | % | | (7,074) | | | 0 | % |
| | | | | | | | | | | | |
| | | | | | | | | | | | |
| | | | | | | | | | | | |
| | | | | | | | | | | | |
| Time deposits | | 20,771,280 | | | 36 | % | | 18,043,464 | | | 32 | % | | 2,727,816 | | | 15 | % |
| Total deposits | | $ | 58,560,624 | | | 100 | % | | $ | 56,092,438 | | | 100 | % | | $ | 2,468,186 | | | 4 | % |
| | | | | | | | | | | | |
| | | | | | | | | | | | |
| | | | | | | | | | | | |
| | | | | | | | | | | | |
| | | | | | | | | | | | |
| Other Funds: | | | | | | | | | | | | |
| Short-term borrowings | | $ | 19,173 | | | 0 | % | | $ | — | | | — | % | | 19,173 | | | 100 | % |
| BTFP borrowings | | — | | | — | % | | 4,500,000 | | | 97 | % | | (4,500,000) | | | (100) | % |
| | | | | | | | | | | | |
| FHLB advances | | 3,500,000 | | | 99 | % | | — | | | — | % | | 3,500,000 | | | 100 | % |
| | | | | | | | | | | | |
| Long-term debt | | 31,768 | | | 1 | % | | 148,249 | | | 3 | % | | (116,481) | | | (79) | % |
| Total other funds | | $ | 3,550,941 | | | 100 | % | | $ | 4,648,249 | | | 100 | % | | $ | (1,097,308) | | | (24) | % |
| Total sources of funds | | $ | 62,111,565 | | | | | $ | 60,740,687 | | | | | $ | 1,370,878 | | | 2 | % |
|
Deposits
The Company’s strategy is to grow and retain relationship-based deposits to provide a stable and low-cost source of funding and liquidity. Accordingly, the Company offers a wide variety of deposit products to meet the needs of its consumer and commercial customers. As a result, we believe our deposit base is seasoned, stable and well-diversified. The following chart presents the Company’s deposits by type as of March 31, 2024 and December 31, 2023.
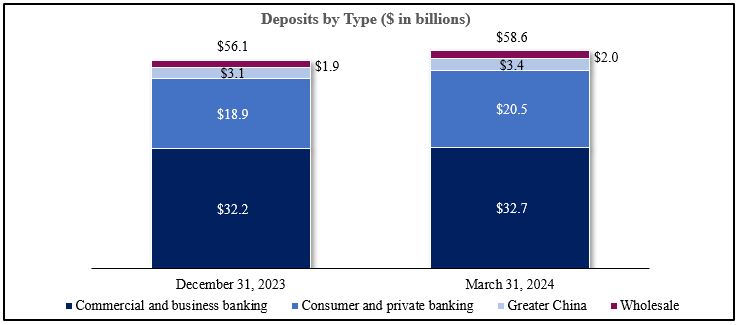
Total deposits were $58.6 billion as of March 31, 2024, an increase of $2.5 billion or 4% from $56.1 billion as of December 31, 2023. The increase in deposits was primarily driven by an increase in customer deposits. Time deposits comprised 36% and 32% of total deposits as of March 31, 2024 and December 31, 2023, respectively. Noninterest-bearing demand deposits comprised 25% and 28% of total deposits as of March 31, 2024 and December 31, 2023, respectively. The shift in deposit mix was primarily due to continued customer migration to higher yielding deposit products.
Uninsured deposits represent the portion of deposit accounts in U.S. offices that exceed the FDIC insurance limit. Management believes that presenting uninsured domestic deposits as reported on Schedule RC-OM item 2 of the Bank’s Call Report, with an adjustment to exclude collateralized and affiliate deposits provides a more accurate view of the deposits at risk, given that collateralized deposits are secured, and affiliate deposits are not customer-facing and are eliminated in consolidation.
The following table summarizes the Company’s uninsured domestic deposit balances reported on Schedule RC-OM item 2 of the Bank’s Call Report as of March 31, 2024 and December 31, 2023, after certain adjustments:
| | | | | | | | | | | | | | | | | |
| | | | | |
| ($ in thousands) | | | March 31, 2024 | | December 31, 2023 |
| Uninsured deposits, per regulatory reporting requirements | | | $ | 29,006,693 | | | $ | 27,592,714 | |
| Less: Collateralized deposits | | | (5,258,927) | | | (4,631,047) | |
| Affiliate deposits | | | (333,846) | | | (491,992) | |
| Uninsured deposits, excluding collateralized and affiliate deposits | (a) | | $ | 23,413,920 | | | $ | 22,469,675 | |
| | | | | |
| Total domestic deposits per Call Report | (b) | | $ | 55,684,012 | | | $ | 53,486,990 | |
| Uninsured deposits, excluding collateralized and affiliate deposits, ratio | (a) / (b) | | 42 | % | | 42 | % |
| | | | | |
Additional information regarding the impact of deposits on net interest income, with a comparison of average deposit balances and rates, is provided in Item 2. MD&A — Results of Operations — Net Interest Income in this Form 10-Q. See also the discussion of the impact of deposits on liquidity in Item 2. MD&A — Liquidity Risk Management — Liquidity in this Form 10-Q.
Other Sources of Funding
Short-term borrowings totaled $19 million as of March 31, 2024. Refer to Note 10—Short-Term Borrowings and Long-Term Debt to the Consolidated Financial Statements in this Form 10-Q for additional information on the short-term borrowings.
The Company had $4.5 billion of BTFP borrowings outstanding as of December 31, 2023. These borrowings were repaid upon maturity during the first quarter of 2024.
The Company had $3.5 billion of FHLB advances as of March 31, 2024, compared with no FHLB advances as of December 31, 2023. FHLB advances as of March 31, 2024 had floating interest rates of 5.49% to 5.56% with remaining maturities between six months and 1.5 years.
The Company uses long-term debt to provide funding to acquire interest-earning assets, and to enhance liquidity and regulatory capital adequacy. Long-term debt consists of junior subordinated debt, which qualifies as Tier 2 capital for regulatory capital purposes. During the first quarter of 2024, the Company redeemed approximately $117 million of junior subordinated debt. Refer to Note 10—Short-Term Borrowings and Long-Term Debt to the Consolidated Financial Statements in this Form 10-Q for additional information on the junior subordinated debt.
Regulatory Capital and Ratios
The federal banking agencies have risk-based capital adequacy guidelinesrequirements intended to ensure that are designed to reflectbanking organizations maintain capital that is commensurate with the degree of risk associated with a banking organization’s operationstheir operations. The Company and transactions. The guidelines cover transactions thatthe Bank are reported on the balance sheet as well as those recorded as off-balance sheet items. In 2013, the Federal Reserve Board, Federal Deposit Insurance Corporation and Office of the Comptroller of the Currency issued the final Basel III Capital Rules establishing a new comprehensiveeach subject to these regulatory capital framework for strengthening international capital standards as well as implementing certain provisions of the “Dodd-Frank Act”.adequacy requirements. See Item 1. Business — Supervision and Regulation — Regulatory Capital Requirements ofand Regulatory Capital-Related Development in the Company’s 20162023 Form 10-K for additional details.
The Basel III Capital Rules became effective for the Company and the Bankadopted Accounting Standards Update 2016-13 on January 1, 2015 (subject2020, which requires the measurement of the allowance for credit losses to be based on management’s best estimate of lifetime expected credit losses inherent in the Company’s relevant financial assets. The Company has elected the phase-in periodsoption provided by a final rule that delays an estimate of the current expected credit losses (“CECL”) effect on regulatory capital for certain components).
two years and phases in the impact over three years. The Basel III Capital Rules require thatrule permits certain banking organizations maintain a minimum CET1 ratioto exclude from regulatory capital the initial adoption impact of 4.5%, a Tier 1 capital ratioCECL, plus 25% of 6.0%, and a total capital ratio of 8.0%. Moreover, the rules require that banking organizations maintain a capital conservation buffer of 2.5% abovecumulative changes in the capital minimums are being phased-in over four years beginning in 2016 (increasing by 0.625% onallowance for credit losses under CECL for each subsequent January 1,period until it reaches 2.5% on January 1, 2019). When fully phased-in in 2019, the banking organizations will be required to maintain a minimum CET1 capital ratio of 7.0%, a minimum Tier 1 capital ratio of 8.5% and a minimum total capital ratio of 10.5% to avoid limitations on capital distributions (including common stock dividends and share repurchases) and certain discretionary incentive compensation payments.
The Company is committed to maintaining capital at a level sufficient to assure the Company’s stockholders, customers and regulators that the Company and the Bank are financially sound. As of September 30, 2017 and December 31, 2016, both2021, followed by a three-year phase-out period in which the Companyaggregate benefit is reduced by 25% in 2022, 50% in 2023 and 75% in 2024. Accordingly, our capital ratios as of March 31, 2024 reflect a delay of 25% of the Bank were considered “well-capitalized,” and met all capital requirementsestimated impact of CECL on a fully phased-in basis under the Basel III Capital Rules.regulatory capital.
The following table presents the Company’s and the Bank’s capital ratios as of September 30, 2017March 31, 2024 and December 31, 20162023 under the Basel III Capital Rules, and those required by regulatory agencies for capital adequacy and well-capitalized classification purposes:
| | | | | | | | | | | | | | | | | | | | | | | | | | | | | | | | | | | | | | | | | | | | | | |
|
| | Basel III Capital Rules | | |
| | March 31, 2024 | | December 31, 2023 | | | | | | | | |
| | Company | | Bank | | Company | | Bank | | Minimum Regulatory Requirements | | Minimum Regulatory Requirements including Capital Conservation Buffer | | Well-Capitalized Requirements | | |
| Risk-based capital ratios: | | | | | | | | | | | | | | | | |
Common Equity Tier 1 capital (1) | | 13.5 | % | | 12.9 | % | | 13.3 | % | | 12.6 | % | | 4.5 | % | | 7.0 | % | | 6.5 | % | | |
Tier 1 capital (2) | | 13.5 | % | | 12.9 | % | | 13.3 | % | | 12.6 | % | | 6.0 | % | | 8.5 | % | | 8.0 | % | | |
| Total capital | | 14.8 | % | | 14.1 | % | | 14.8 | % | | 13.8 | % | | 8.0 | % | | 10.5 | % | | 10.0 | % | | |
Tier 1 leverage (1) | | 10.1 | % | | 9.6 | % | | 10.2 | % | | 9.6 | % | | 4.0 | % | | 4.0 | % | | 5.0 | % | | |
|
|
| | | | | | | | | | | | | | | | | | | | | |
| |
| | | Basel III Capital Rules |
| | September 30, 2017 | | December 31, 2016 | | Minimum Regulatory Requirements | | Well- Capitalized Requirements | | Fully Phased-in Minimum Regulatory Requirements |
| | Company | | East
West
Bank | | Company | | East
West
Bank | | | |
| CET1 risk-based capital | | 11.4 | % | | 11.3 | % | | 10.9 | % | | 11.3 | % | | 4.5 | % | | 6.5 | % | | 7.0 | % |
| Tier 1 risk-based capital | | 11.4 | % | | 11.3 | % | | 10.9 | % | | 11.3 | % | | 6.0 | % | | 8.0 | % | | 8.5 | % |
| Total risk-based capital | | 12.9 | % | | 12.3 | % | | 12.4 | % | | 12.3 | % | | 8.0 | % | | 10.0 | % | | 10.5 | % |
| Tier 1 leverage capital | | 9.4 | % | | 9.3 | % | | 8.7 | % | | 9.1 | % | | 4.0 | % | | 5.0 | % | | 4.0 | % |
| |
(1)The Company’s CET1 andCommon Equity Tier 1 capital ratios have improved by 49 basis points, while the total risk-based and Tier 1 leverage well-capitalized requirements apply only to the Bank since there is no Common Equity Tier 1 capital ratios increased by 48component or Tier 1 leverage ratio component in the definition of a well-capitalized bank holding company.
(2)The well-capitalized Tier 1 capital ratio requirements for the Company and 65 basis points, respectively, during the nine months ended September 30, 2017. Bank are 6.0% and 8.0%, respectively.
The improvement was primarily driven byCompany is committed to maintaining strong capital levels to assure its investors, customers and regulators that the increases in revenues, primarily dueCompany and the Bank are financially sound. As of both March 31, 2024 and December 31, 2023, the Company and the Bank continued to increase in net interest incomeexceed all “well-capitalized” capital requirements and net gains recorded from the sale of commercial property duringminimum capital requirements under the first quarter of 2017. The $1.82 billion or 7% increase inBasel III Capital Rules. Total risk-weighted assets increasedwere $53.4 billion as of March 31, 2024, a decrease of $217 million from $27.36$53.7 billion as of December 31, 20162023.
Risk Management
Overview
In the normal course of business, the Company is exposed to $29.18 billion asa variety of September 30, 2017 was primarily duerisks, some of which are inherent to the growthfinancial services industry and others of which are more specific to the Company’s business. The Company operates under a Board-approved enterprise risk management (“ERM”) framework, which outlines the company-wide approach to risk management and oversight, and describes the structures and practices employed to manage the current and emerging risks inherent to the Company. The Company’s ERM program incorporates risk management throughout the organization in identifying, managing, monitoring, and reporting risks. It identifies the Company’s major risk categories as: credit, liquidity, capital, market, operational, compliance, legal, strategic, technology and reputational.
The Risk Oversight Committee (“ROC”) of the Board of Directors monitors the ERM program through such identified risk categories and provides oversight of the Company’s Consolidated Balance Sheets. Asrisk appetite and control environment. The ROC provides focused oversight of September 30, 2017, the Company’s CET1 risk-based capital, Tier 1 risk-based capital, total risk-based capital ratiosidentified enterprise risk categories on behalf of the full Board of Directors. Under the authority of the ROC, management committees apply targeted strategies to manage the risks to which the Company’s operations are exposed.
The Company’s ERM program is executed along the three lines of defense model, which provides for a consistent and Tier 1 leverage capital ratios were 11.4%, 11.4%, 12.9%standardized risk management control environment across the enterprise. The first line of defense is comprised of production, operational and 9.4%, respectively, well abovesupport units. The second line of defense is comprised of various risk management and control functions charged with monitoring and managing specific major risk categories and/or risk subcategories. The third line of defense is comprised of the well-capitalizedInternal Audit and Independent Asset Review (“IAR”) functions. Internal Audit reports to the Chief Audit Executive (“CAE”) who reports to the Board’s Audit Committee. Internal Audit provides assurance and evaluates the effectiveness of risk management, control, and governance processes as established by the Company. IAR serves as an internal loan review and independent credit risk monitoring function within the Bank that works under the direction of the CAE and reports to the Audit Committee. IAR provides management and the Audit Committee with an objective and independent assessment of the Bank’s credit profile and credit risk management processes. Further discussion and analysis of selected primary risk areas are discussed in the following subsections of Risk Management.
Credit Risk Management
Credit risk is the risk that a borrower or a counterparty will fail to perform according to the terms and conditions of a loan or investment and expose the Company to loss. Credit risk exists with many of the Company’s assets and exposures such as loans, debt securities and certain derivatives. The majority of the Company’s credit risk is associated with lending activities.
The ROC has primary oversight responsibility for the identified enterprise risk categories including credit risk. The ROC monitors management’s assessment of asset quality, credit risk trends, credit quality administration, underwriting standards, and portfolio credit risk management strategies and processes, such as diversification and liquidity, all of which enable management to control credit risk. At the management level, the Credit Risk Management Committee has primary oversight responsibility for credit risk. The Senior Credit Supervision function manages credit policy for the line of business transactional credit risk, assuring that all exposure is risk-rated according to the requirements of 6.5%, 8.0%, 10.0%the credit risk rating policy. The Senior Credit Supervision function evaluates and 5.0%, respectively.
Regulatory Matters
The Bank entered into a Written Agreement, dated November 9, 2015, withreports the Federal Reserve Bank of San Francisco (the “Written Agreement”),overall credit risk exposure to correct less than satisfactory BSA and AML programs detailed in a joint examination by the Federal Reserve Bank of San Francisco (“FRB”)senior management and the California DepartmentROC. Reporting directly to the Board’s Audit Committee, the IAR function provides additional support to the Company’s strong credit risk management culture by performing an independent and objective assessment of Business Oversight (“DBO”). underwriting and documentation quality. A key focus of our credit risk management is adherence to a well-controlled underwriting and loan monitoring process.
The Bank also entered intoCompany assesses the overall credit quality performance of the loans held-for-investment portfolio through an integrated analysis of specific performance ratios. This approach forms the basis of the discussion in the sections immediately following: Credit Quality, Nonperforming Assets and Allowance for Credit Losses.
Credit Quality
The Company utilizes a related Memorandumcredit risk rating system to assist in monitoring credit quality. Loans are evaluated using the Company’s internal credit risk rating of Understanding (“MOU”) with1 through 10. For more information on the DBO in 2015. See Item 7. MD&ACompany’s credit quality indicators and internal credit risk ratings, refer to Note 7 — Regulatory Matters Loans Receivable and Note 18 — Regulatory Requirements and Matters Allowance for Credit Lossesto the Consolidated Financial Statementsof the Company’s 2016 in this Form 10-K for further details.10-Q.
The Company believes that the Bank is making progress in executing the compliance plans and programs required by the Written Agreement and MOU, although there can be no assurances that our plans and progress will be found to be satisfactory by our regulators. To date, the Bank has added significant resources to meet the monitoring and reporting obligations imposed by the Written Agreement and will continue to require significant management and third party consultant resources to comply with the Written Agreement and MOU, and to address any additional findings or recommendations by the regulators. These incremental administrative and third party costs, as well as the operational restrictions imposed by the Written Agreement, may adversely affect the Bank’s results of operations.
If additional compliance issues are identified or the regulators determine the Bank has not satisfactorily complied with the terms of the Written Agreement, the regulators could take further actions with respect to the Bank and, if such further actions were taken, such actions could have a material adverse effect on the Bank. The operating and other conditions in the BSA and AML program and the auditing and oversight of the program that led to the Written Agreement and MOU could also lead to an increased risk of being subject to additional actions by the DBO and FRB, an increased risk of future examinations that may downgrade the regulatory ratings of the Bank, and an increased risk investigations by other government agencies may result in fines, penalties, increased expenses or restrictions on operations.
Off-Balance Sheet Arrangements
In the course of the Company’s business, the Company may enter into or be a party to transactions that are not recorded on the Consolidated Balance Sheets and are considered to be off-balance sheet arrangements. Off-balance sheet arrangements are any contractual arrangements whereby an unconsolidated entity is a party, under which the Company has: (1) any obligation under a guarantee contract; (2) a retained or contingent interest in assets transferred to an unconsolidated entity or similar arrangement that serves as credit, liquidity or market risk support to that entity for such assets; (3) any obligation under certain derivative instruments; or (4) any obligation under a material variable interest held by the Company in an unconsolidated entity that provides financing, liquidity, market risk or credit risk support to the Company, or engages in leasing, hedging or research and development services with the Company.
As a financial service provider, the Company routinely enters into commitments to extend credit to customers, such as loan commitments, commercial letters of credit for foreign and domestic trade, SBLCs and financial guarantees. Many of these commitments to extend credit may expire without being drawn upon. The credit policies used in underwriting loans to customers are also used to extend these commitments. Under some of these contractual agreements, the Company may also have liabilities contingent upon the occurrence of certain events. The Company’s liquidity sources have been, and are expected to be, sufficient to meet the cash requirements of its lending activities. The following table presents the Company’s loan commitments, commercial letters of credit and SBLCscriticized loans as of September 30, 2017:March 31, 2024 and December 31, 2023:
| | | | | | | | | | | | | | | | | | | | | | | | | | |
|
| | | | | | Change |
| ($ in thousands) | | March 31, 2024 | | December 31, 2023 | | $ | | % |
| Criticized loans: | | | | | | | | |
| | | | | | | | |
| | | | | | | | |
| | | | | | | | |
| | | | | | | | |
| | | | | | | | |
| | | | | | | | |
| | | | | | | | |
| | | | | | | | |
| | | | | | | | |
| | | | | | | | |
| | | | | | | | |
| | | | | | | | |
| | | | | | | | |
| | | | | | | | |
| | | | | | | | |
| | | | | | | | |
| | | | | | | | |
| | | | | | | | |
| | | | | | | | |
| | | | | | | | |
| | | | | | | | |
| | | | | | | | |
| | | | | | | | |
| | | | | | | | |
| | | | | | | | |
| | | | | | | | |
| | | | | | | | |
| | | | | | | | |
| | | | | | | | |
| | | | | | | | |
| | | | | | | | |
| | | | | | | | |
| | | | | | | | |
| | | | | | | | |
| | | | | | | | |
| | | | | | | | |
| Special mention loans | | $ | 543,573 | | | $ | 404,241 | | | $ | 139,332 | | | 34 | % |
Classified loans (1) | | 651,485 | | | 573,969 | | | 77,516 | | | 14 | % |
Total criticized loans (2) | | $ | 1,195,058 | | | $ | 978,210 | | | $ | 216,848 | | | 22 | % |
| | | | | | | | |
| Special mention loans to loans held-for-investment | | 1.05 | % | | 0.77 | % | | | | |
| Classified loans to loans held-for-investment | | 1.25 | % | | 1.10 | % | | | | |
| Criticized loans to loans held-for-investment | | 2.30 | % | | 1.87 | % | | | | |
|
(1)Consists of substandard, doubtful and loss categories.
(2)Excludes loans held-for-sale.
|
| | | | |
| |
| ($ in thousands) | | Commitments
Outstanding |
| Loan commitments | | $ | 4,956,515 |
|
| Commercial letters of credit and SBLCs | | $ | 1,757,648 |
|
| |
A discussion
Nonperforming Assets
Nonperforming assets are comprised of significant contractual arrangements under whichnonaccrual loans, other real estate owned (“OREO”) and other nonperforming assets. Other nonperforming assets and OREO are repossessed assets and properties, respectively, acquired through foreclosure, or through full or partial satisfaction of loans held-for-investment. Nonperforming assets were $165 million or 0.23% of total assets as of March 31, 2024, an increase of $51 million or 45%, compared with $114 million or 0.16% of total assets as of December 31, 2023.
The following table presents nonperforming assets information as of March 31, 2024 and December 31, 2023:
| | | | | | | | | | | | | | | | | | | | | | | | | | |
|
| | | | | | Change |
| ($ in thousands) | | March 31, 2024 | | December 31, 2023 | | $ | | % |
| Commercial: | | | | | | | | |
| C&I | | $ | 48,962 | | | $ | 37,036 | | | $ | 11,926 | | | 32 | % |
| CRE: | | | | | | | | |
| CRE | | 35,006 | | | 23,249 | | | 11,757 | | | 51 | % |
| Multifamily residential | | 4,646 | | | 4,669 | | | (23) | | | 0 | % |
| Construction and land | | 12,236 | | | — | | | 12,236 | | | 100 | % |
| Total CRE | | 51,888 | | | 27,918 | | | 23,970 | | | 86 | % |
| Consumer: | | | | | | | | |
| Residential mortgage: | | | | | | | | |
| Single-family residential | | 35,669 | | | 24,377 | | | 11,292 | | | 46 | % |
| HELOCs | | 11,498 | | | 13,411 | | | (1,913) | | | (14) | % |
| Total residential mortgage | | 47,167 | | | 37,788 | | | 9,379 | | | 25 | % |
| Other consumer | | 162 | | | 132 | | | 30 | | | 23 | % |
| Total nonaccrual loans | | 148,179 | | | 102,874 | | | 45,305 | | | 44 | % |
| OREO, net | | 16,692 | | | 11,141 | | | 5,551 | | | 50 | % |
| | | | | | | | |
| | | | | | | | |
| Total nonperforming assets | | $ | 164,871 | | | $ | 114,015 | | | $ | 50,856 | | | 45 | % |
Nonperforming assets to total assets | | 0.23 | % | | 0.16 | % | | | | |
| Nonaccrual loans to loans held-for-investment | | 0.29 | % | | 0.20 | % | | | | |
| Allowance for loan losses to nonaccrual loans | | 452.34 | % | | 650.06 | % | | | | |
| | | | | | | | |
| | | | | | | | |
|
Loans are generally placed on nonaccrual status when they become 90 days past due or when the Company may be held contingently liablefull collection of principal or interest becomes uncertain regardless of the length of past due status. Collectability is included in generally assessed based on economic and business conditions, the borrower’s financial condition, and the adequacy of collateral, if any. For additional details regarding the Company’s nonaccrual loan policy, see Note 11 1 — Commitments and Contingencies to the Consolidated Financial Statements. In addition, the Company has commitments and obligations under post-retirement benefit plans as described in Note 15 Summary of Significant Accounting Policies — Employee Benefit Plans Significant Accounting Policies — Loans Held-for-Investment to the Consolidated Financial Statements ofin the Company’s 20162023 Form 10-K.
Nonaccrual loans were $148 million as of March 31, 2024, an increase of $45 million or 44% from $103 million as of December 31, 2023. This increase was predominantly due to increases in construction, C&I, CRE and single-family residential nonaccrual loans. As of March 31, 2024, $27 million or 18% of nonaccrual loans were less than 90 days delinquent. In comparison, $40 million or 39% of nonaccrual loans were less than 90 days delinquent as of December 31, 2023.
The following table presents the accruing loans past due by portfolio segment as of March 31, 2024 and December 31, 2023:
| | | | | | | | | | | | | | | | | | | | | | | | | | | | | | | | | | | | | | | | |
|
| | | | Total Accruing Past Due Loans (1) | | Change | | Percentage of Total Loans Outstanding |
| ($ in thousands) | | | | March 31,
2024 | | December 31,
2023 | | $ | | % | | March 31,
2024 | | December 31,
2023 |
| Commercial: | | | | | | | | | | | | | | |
| C&I | | | | $ | 19,326 | | | $ | 35,649 | | | $ | (16,323) | | | (46) | % | | 0.12 | % | | 0.21 | % |
| CRE: | | | | | | | | | | | | | | |
| CRE | | | | 18,726 | | | 3,517 | | | 15,209 | | | 432 | % | | 0.13 | % | | 0.02 | % |
| Multifamily residential | | | | 368 | | | 597 | | | (229) | | | (38) | % | | 0.01 | % | | 0.01 | % |
| Construction and land | | | | — | | | 13,251 | | | (13,251) | | | (100) | % | | — | % | | 2.00 | % |
| Total CRE | | | | 19,094 | | | 17,365 | | | 1,729 | | | 10 | % | | 0.09 | % | | 0.08 | % |
| Total commercial | | | | 38,420 | | | 53,014 | | | (14,594) | | | (28) | % | | 0.10 | % | | 0.14 | % |
| Consumer: | | | | | | | | | | | | | | |
| Residential mortgage: | | | | | | | | | | | | | | |
| Single-family residential | | | | 49,280 | | | 45,228 | | | 4,052 | | | 9 | % | | 0.36 | % | | 0.34 | % |
| HELOCs | | | | 20,107 | | | 21,492 | | | (1,385) | | | (6) | % | | 1.16 | % | | 1.25 | % |
| Total residential mortgage | | | | 69,387 | | | 66,720 | | | 2,667 | | | 4 | % | | 0.45 | % | | 0.44 | % |
| Other consumer | | | | 117 | | | 3,265 | | | (3,148) | | | (96) | % | | 0.22 | % | | 5.41 | % |
| Total consumer | | | | 69,504 | | | 69,985 | | | (481) | | | (1) | % | | 0.45 | % | | 0.46 | % |
| Total | | | | $ | 107,924 | | | $ | 122,999 | | | $ | (15,075) | | | (12) | % | | 0.21 | % | | 0.24 | % |
|
(1)There were no accruing loans past due 90 days or more as of both March 31, 2024 and December 31, 2023.
Allowance for Credit Losses
The Company maintains its allowance for credit losses at a level sufficient to provide appropriate reserves to absorb estimated future credit losses in accordance with GAAP. For additional information on the policies, methodologies and judgments used to determine the allowance for credit losses, see Item 7. MD&A — Critical Accounting Estimates and Item 8. Financial Statements — Note 1 — Summary of Significant Accounting Policies to the Consolidated Financial Statements in the Company’s 2023 Form 10-K, and has contractual obligations for future payments on debts, borrowings and lease obligations as detailed in ItemNote 7 — MD&A — Off-Balance Sheet ArrangementsLoans Receivable and Aggregate Contractual Obligations Allowance for Credit Losses to the Consolidated Financial Statements in this Form 10-Q.
The following table presents an allocation of the Company’s 2016 Form 10-K.allowance for loan losses by loan portfolio segments and unfunded credit commitments as of March 31, 2024 and December 31, 2023:
| | | | | | | | | | | | | | | | | | | | | | | | | | | | | | |
| | | | |
| | March 31, 2024 | | December 31, 2023 | | | | |
| ($ in thousands) | | Allowance Allocation | | % of Loan Type to Total Loans | | Allowance Allocation | | % of Loan Type to Total Loans | | | | |
| Allowance for loan losses | | | | | | | | | | | | |
| Commercial: | | | | | | | | | | | | |
| C&I | | $ | 373,631 | | | 32 | % | | $ | 392,685 | | | 32 | % | | | | |
| CRE: | | | | | | | | | | | | |
| CRE | | 187,460 | | | 28 | % | | 170,592 | | | 28 | % | | | | |
| Multifamily residential | | 37,418 | | | 10 | % | | 34,375 | | | 10 | % | | | | |
| Construction and land | | 10,819 | | | 1 | % | | 10,469 | | | 1 | % | | | | |
| Total CRE | | 235,697 | | | 39 | % | | 215,436 | | | 39 | % | | | | |
| Total commercial | | 609,328 | | | 71 | % | | 608,121 | | | 71 | % | | | | |
| Consumer: | | | | | | | | | | | | |
| Residential mortgage: | | | | | | | | | | | | |
| Single-family residential | | 55,922 | | | 26 | % | | 55,018 | | | 26 | % | | | | |
| HELOCs | | 3,563 | | | 3 | % | | 3,947 | | | 3 | % | | | | |
| Total residential mortgage | | 59,485 | | | 29 | % | | 58,965 | | | 29 | % | | | | |
| Other consumer | | 1,467 | | | 0 | % | | 1,657 | | | 0 | % | | | | |
| Total consumer | | 60,952 | | | 29 | % | | 60,622 | | | 29 | % | | | | |
| Total allowance for loan losses | | $ | 670,280 | | | 100 | % | | $ | 668,743 | | | 100 | % | | | | |
| Allowance for unfunded credit commitments | | $ | 38,544 | | | | | $ | 37,699 | | | | | | | |
| Total allowance for credit losses | | $ | 708,824 | | | | | $ | 706,442 | | | | | | | |
| | | | | | | | | | | | |
| Loans held-for-investment | | $ | 51,992,504 | | | | | $ | 52,210,782 | | | | | | | |
| Allowance for loan losses to loans held-for-investment | | 1.29 | % | | | | 1.28 | % | | | | | | |
| | | | | | | | | | | | |
| | Three Months Ended March 31, | | | | |
| | 2024 | | 2023 | | | | |
| Average loans held-for-investment | | $ | 51,924,317 | | | $ | 48,144,120 | | | | | |
| | | | | | | | | | | | |
| Annualized net charge-offs to average loans held-for-investment | | 0.17 | % | | 0.01 | % | | | | |
| | | | |
Asset Liability and MarketFirst quarter of 2024 net charge-offs were $23 million, or annualized 0.17% of average loans held-for-investment, compared with net charge-offs of $1 million, or annualized 0.01% of average loans held-for-investment for the first quarter of 2023. The increase in net charge-offs was primarily driven by higher losses in the C&I portfolio.
Liquidity Risk Management
Liquidity
Liquidity refers torisk arises from the Company’s abilityinability to meet its contractualcustomer deposit withdrawals and contingent financial obligations on or off-balance sheet,to other counterparties as they become due.come due, or to obtain adequate funding at a reasonable cost to meet those obligations. Liquidity risk also considers the stability of deposits. The Company’s primaryobjective of liquidity management objective is to provide sufficient funding for its businesses throughout market cyclesmanage the potential mismatch of asset and be ableliability cash flows. Maintaining an adequate level of liquidity depends on the institution’s ability to manageefficiently meet both expected and unexpected cash flow needs and requirementscollateral needs without adversely impactingaffecting daily operations or the financial healthcondition of the Company.institution. To achieve this objective, the Company analyzes its liquidity risk, maintains readily available liquid assets, and accessesutilizes diverse funding sources including its stable core deposit base.
The ROC has primary oversight responsibility over liquidity risk management. At the management level, the Company’s Asset/Liability Committee (“ALCO”) setsestablishes the liquidity guidelines that govern the day-to-day active management of the Company’s liquidity position.position by requiring sufficient asset-based liquidity to cover potential funding requirements and avoid over-dependence on volatile, less reliable funding markets. These guidelines are established and monitored for both the Bank and East West on a stand-alone basis to ensure that the Company can serve as a source of strength for its subsidiaries. The ALCO regularly monitors the Company’s liquidity status and related management processes, and provides regular reports on the Company’s liquidity position relative to policy limits and guidelines to the Board.Board of Directors. The liquidity management practices have been effective under normal operating and stressed market conditions.
The Company also maintains a Liquidity Contingency Plan that provides an early-warning methodology to detect liquidity problems and provide a timely response. The Liquidity Contingency Plan describes the procedures, roles and responsibilities, and communication protocols for managing any identified liquidity problem. Management monitors the early-warning indicators defined in the Liquidity Contingency Plan, which include metrics for measuring the Company’s internal liquidity status as well as company-specific and market-wide external factors. When early-warning signals are detected, the ALCO is informed, and the problem is evaluated for severity. The ALCO will determine the course of action and appropriate contingency funding sources, if any, that are needed.
Liquidity Risk — Liquidity Sources. The Company’s primary source of funding is from deposits, generated by its banking business, which we believe is a relatively stable and low-cost source of funding. Our loans are funded by deposits, which amounted to $58.6 billion as of March 31, 2024, compared with $56.1 billion as of December 31, 2023. The Company’s loan-to-deposit ratio was 89% as of March 31, 2024, compared with 93% as of December 31, 2023.
In addition to deposits, the Company has access to various sources of wholesale financing, including borrowing capacity with the FHLB and Federal Reserve Bank of San Francisco (“FRBSF”), unsecured federal funds lines of credit with various correspondent banks, and several master repurchase agreements with major brokerage companies to sustain an adequate liquid asset portfolio, meet daily cash demands and allow management flexibility to execute its business strategy. However, general financial market and economic conditions could impact our access and cost of external funding. Additionally, the Company’s access to capital markets is affected by the ratings received from various credit rating agencies.
Unencumbered loans and/or debt securities were pledged to the FHLB and the FRBSF discount window as collateral. The Company has established operational procedures to enable borrowing against these assets, including regular monitoring of the total pool of loans and debt securities eligible as collateral. Eligibility of collateral is defined in guidelines from the FHLB and FRBSF and is subject to change at their discretion. See Item 2— MD&A — Balance Sheet Analysis — Deposits and Other Sources of Funding in this Form 10-Q for further details related to the Company’s funding sources. The Company believes its cash and cash equivalents, and available borrowing capacity described below provide sufficient liquidity above its expected cash needs.
The Company maintains its source of liquidity in the form of cash and cash equivalents interest-bearing depositsand borrowing capacity with banksits eligible loans and available-for-sale investment securities. These assets totaled $5.10 billiondebt securities as collateral. The following table presents the Company’s total cash and $5.54 billion, accounting for 14%cash equivalents and 16% of total assets,collateralized borrowing capacity as of September 30, 2017March 31, 2024 and December 31, 2016, respectively. Traditional forms of funding such as customer deposits2023:
| | | | | | | | | | | | | | | | | | | | | | | | | | |
| | | | |
| | | | | | Change |
| ($ in thousands) | | March 31, 2024 | | December 31, 2023 | | $ | | % |
| Cash and cash equivalents | | $ | 4,210,801 | | | $ | 4,614,984 | | | $ | (404,183) | | | (9) | % |
| Interest-bearing deposits with banks | | 24,593 | | | 10,498 | | | 14,095 | | | 134 | % |
| | | | | | | | |
| Collateralized borrowing capacity: | | | | | | | | |
| FHLB | | 7,617,334 | | | 12,373,002 | | | (4,755,668) | | | (38) | % |
| FRBSF | | 13,104,803 | | | 9,830,769 | | | 3,274,034 | | | 33 | % |
| Unpledged available securities | | 5,138,819 | | | 1,988,526 | | | 3,150,293 | | | 158 | % |
| | | | | | | | |
| | | | | | | | |
| | | | | | | | |
| | | | | | | | |
| | | | | | | | |
| | | | | | | | |
| | | | | | | | |
| | | | | | | | |
| | | | | | | | |
| | | | | | | | |
| | | | | | | | |
| | | | | | | | |
| Total | | $ | 30,096,350 | | | $ | 28,817,779 | | | $ | 1,278,571 | | | 4 | % |
| | | | |
The Company’s cash and borrowings augment these liquid assets. Total customer deposits amounted to $31.31cash equivalents and collateralized borrowing capacity totaled $30.1 billion as of September 30, 2017,March 31, 2024, compared to $29.89with $28.8 billion as of December 31, 2016, of which core deposits comprised 81% of total deposits as of each of September 30, 2017 and December 31, 2016. As a means of augmenting the Company’s liquidity, the Company maintains2023. The increase was primarily related to an increase in available borrowing capacity under secured borrowing lines withat the FHLBFRBSF due to the repayment of BTFP borrowings, and FRB, unsecured federal funds’ lines of credit with various correspondent banks for purchase of overnight funds, and several master repurchase agreements with major brokerage companies. The Company’s available borrowing capacity with the FHLB and FRB was $6.45 billion and $3.23 billion, respectively, as of September 30, 2017. The Bank’s unsecured federal funds’ lines of credit, subject to availability, totaled $731.0 million with correspondent banks as of September 30, 2017. The Company believes that its liquidity sources are sufficient to meet all reasonably foreseeable short-term and intermediate-term needs.
The Company experienced net cash inflows from operating activities of $665.0 million and $417.6 million during the nine months ended September 30, 2017 and 2016, respectively. The $247.4 millionan increase in net cash inflows from operating activities between these periodsunpledged available securities. This increase was primarily due to a $99.8 million increase in net income, a $108.3 million increase in net changes in cash flows receivable from other assets and a $76.2 million increase in net changes in the cash flows from accrued expenses and other liabilities, partially offset by a $32.5 million changedecrease in non-cash amounts. The $108.3 million increase in net changes in cash flows receivable from other assets, comparingavailable borrowing capacity at the nine months ended September 30, 2017 to the same period in 2016, wasFHLB, primarily due to a reduction in tax receivables, and anthe increase in fair value of interest rate swaps and optionsFHLB advances during the nine months ended September 30, 2016 contributingfirst quarter of 2024.
Liquidity Risk — Cash Requirements. In the ordinary course of business, the Company enters contractual obligations that require future cash payments, including funding for customer deposit withdrawals, repayments for short- and long-term borrowings, and other cash commitments. For additional information on these obligations, see Note 9 — Deposits to operating cash outflows in that period. The $76.2 million increase in net changesthe Consolidated Financial Statements in the cash flows from accrued expensesCompany’s 2023 Form 10-K, and other liabilities, comparing the nine months ended September 30, 2017 Note 8 — Affordable Housing Partnership, Tax Credit and Community Reinvestment Act Investments, Net and Note 10— Short-Term Borrowings and Long-Term Debt to the same periodConsolidated Financial Statements in 2016, was primarily duethis Form 10-Q. During the first quarter of 2024, the Company redeemed approximately $117 million of junior subordinated debt.
The Company also has off-balance sheet arrangements which represent transactions that are not recorded on the Consolidated Balance Sheet. The Company’s off-balance sheet arrangements include (1) commitments to extend credit, such as loan commitments, commercial letters of credit for foreign and domestic trade, standby letters of credit (“SBLCs”), and financial guarantees, to meet the financing needs of its customers, (2) future interest obligations related to customer deposits and the Company’s borrowings, and (3) transactions with unconsolidated entities that provide financing, liquidity, market risk or credit risk support to the Company, or engage in leasing, hedging or research and development services with the Company. Because many of these commitments are expected to expire without being drawn upon, the total commitment amounts do not necessarily represent future funding requirements. The Company does not expect the total commitment amounts as of March 31, 2024 to have a larger wire transfermaterial current or future impact on the Company’s financial conditions or results of operations. Information about the Company’s loan commitments, commercial letters of credit and SBLCs is provided in transitNote 11 — Commitments and an increaseContingencies to the Consolidated Financial Statements in tax payables.this Form 10-Q.
NetThe Consolidated Statement of Cash Flows summarizes the Company’s sources and uses of cash used inby type of activity for the first quarters of 2024 and 2023. Excess cash generated by operating and investing activities totaled $2.07 billion and $473.3 million during the nine months ended September 30, 2017 and 2016, respectively. The $1.59 billion increasemay be used to repay outstanding debt or invest in net cash used in investing activities was primarily dueliquid assets.
Liquidity Risk — Liquidity for East West. In addition to a $1.69 billion increase in net cash outflows from loans held-for-investment, partially offset by a $150.0 million increase in net cash inflows from resale agreements.
During the nine months ended September 30, 2017 and 2016,bank level liquidity management, the Company experienced netmanages liquidity at the parent company level for various operating needs including payment of dividends, repurchases of common stock, principal and interest payments on its borrowings, acquisitions and additional investments in its subsidiaries. East West’s primary source of liquidity is from cash inflows from financing activitiesdividends distributed by its subsidiary, East West Bank. The Bank is subject to various statutory and regulatory restrictions on its ability to pay dividends as discussed in Item 1. Business — Supervision and Regulation — Dividends and Other Transfers of $1.24 billionFunds in the Company’s 2023 Form 10-K. East West held $287 million and $365.6 million, respectively. Net cash inflows from financing activities of $1.24 billion during the nine months ended September 30, 2017 was primarily comprised of a $1.39 billion net increase in customer deposits, partially offset by $87.9$446 million in cash dividends paid. Netand cash inflows from financing activitiesequivalents as of $365.6 million duringMarch 31, 2024 and December 31, 2023, respectively. Management believes that East West has sufficient cash and cash equivalents to meet the same periodprojected cash obligations for the coming year.
Liquidity Risk — Liquidity Stress Testing. The Company utilizes liquidity stress analysis to determine the appropriate amounts of liquidity to maintain at the Company, foreign subsidiary and foreign branch to meet contractual and contingent cash outflows under a range of scenarios. Scenario analyses include assumptions about significant changes in 2016 were primarily comprisedkey funding sources, market triggers, potential uses of funding and economic conditions in certain countries. In addition, Company specific events are incorporated into the stress testing. Liquidity stress tests are conducted to ascertain potential mismatches between liquidity sources and uses over various time horizons and under a $1.13 billion net increase in customer depositsvariety of stressed conditions. Given the range of potential stresses, the Company maintains contingency funding plans on a consolidated basis and a $37.7 million increase in short-term borrowings, partially offset by a $700.0 million repayment of short-term FHLB advances and $87.0 million in cash dividends paid.for individual entities.
As of September 30, 2017,March 31, 2024, the Company believes it has adequate liquidity resources to conduct operations and meet other needs in the ordinary course of business, and is not aware of any trends, events or uncertainties that had or wereare reasonably likely to have a material adverse effect on its liquidity, position. Furthermore,capital resources or operations. Given the uncertain and rapidly changing market and economic conditions, the Company is not aware of any material commitments for capital expenditures will continue to actively evaluate the impact on its business and financial position. For more details on how economic conditions may impact our liquidity, see Item 1A. Risk Factors in the foreseeable future.Company’s 2023 Form 10-K.
Market Risk Management
East West’s liquidity has historically
Market risk refers to the risk of potential loss due to adverse movements in market risk factors, including interest rates, foreign exchange rates, commodity prices, and credit spreads. The Company is primarily exposed to interest rate risk through its core business activities of extending loans and acquiring deposits. There have been dependent on the payment of cash dividends by its subsidiary, East West Bank, subject to applicable statutes, regulations and special approval. The Bank paid total dividends of $255.0 million and $100.0 million to East West during the nine months ended September 30, 2017 and 2016, respectively. In addition,no significant changes in October 2017, the Board declared a quarterly cash dividend of $0.20 per share forour risk management practices as described in Item 7. MD&A — Market Risk Management in the Company’s common stock payable on November 15, 2017 to stockholders of record on November 1, 2017.2023 Form 10-K.
Interest Rate Risk Management
Interest rate risk results primarily from the Company’s traditional banking activities of gathering deposits and extending loans, and is the primaryrisk that market risk for the Company. Economic and financial conditions, movements in interest rates and consumer preferences affect the difference between the interest the Company earns on interest-earning assets and pays on interest-bearing liabilities, and the level of the noninterest-bearing funding sources. In addition, changesfluctuations in interest rates can influencehave a negative impact on the Company’s earnings and capital stemming from mismatches in the Company’s asset and liability cash flows primarily arising from customer-related activities such as lending and deposit-taking. The Company is subject to interest rate of principal prepayments on loansrisk because:
•Assets and speed of deposit withdrawals. Due toliabilities may mature or reprice at different times. If assets reprice faster than liabilities and interest rates are generally rising, earnings will initially increase;
•Assets and liabilities may reprice at the pricing term mismatchessame time but by different amounts;
•Short- and embedded options inherent in certain products, changes inlong-term market interest rates not onlymay change by different amounts. For example, the shape of the yield curve may affect expected near-term earnings, but also the economicyield of new loans and funding costs differently;
•The remaining maturity of various assets or liabilities may shorten or lengthen as interest rates change. For example, if long-term mortgage interest rates increase sharply, mortgage-related products may pay down at a slower rate than anticipated, which could impact portfolio income and valuation; or
•Interest rates may have a direct or indirect effect on loan demand, collateral values, mortgage origination volume, and the fair value of these interest-earning assets and interest-bearing liabilities. Other market risks include foreign currency exchange risk and equity price risk. These risks are not considered significant to the Company’s interest rate risk and no separate quantitative information concerning these risks is presented herein.other financial instruments.
With oversight by the Company’s Board, theThe ALCO coordinates the overall management of the Company’s interest rate risk. The ALCOrisk, meets regularly and is responsible for reviewingto review the Company’s open market positions and establishingestablishes policies to monitor and limit exposure to market risk. Management of interestInterest rate risk management is carried out primarily through strategies involving the Company’s investmentloan portfolio, debt securities portfolio, loan portfolio, available funding channels and capital market activities. In addition, the Company’s policies permit the use of off-balance sheet derivative instruments to assist in managing interest rate risk.
TheWe measure and monitor interest rate risk exposure is measured and monitored through various risk management tools, which include a simulation model that performs interest rate sensitivity analysisanalyses under multiple scenarios. The model includes the Company’s loans, investment securities, resale agreements, customer deposits and borrowing portfolios, including repurchase agreements. The financial instruments from the Company’s domestic and foreign operations, forecasted noninterest income and noninterest expense items are also incorporated in the simulation. The interest rate scenarios simulated include an instantaneous parallel shiftagainst a baseline. The simulation model incorporates the market’s forward rate expectations and non-parallel shift in the yield curve. In addition, the Company also performs various simulations using alternative interest rate scenarios. The alternative interest rate scenarios include yield curve flattening, yield curve steepeningCompany’s earning assets and yield curve inverting. In order to apply the assumed interest rate environment, adjustments are made to reflect the shift in the U.S. Treasury and other appropriate yield curves.liabilities. The Company incorporatesuses both a static balance sheet and a forward growth balance sheet in order to perform these evaluations. Resultsthe interest rate sensitivity analyses. The simulated interest rate scenarios include an instantaneous non-parallel shift in the yield curve and a gradual non-parallel shift in the yield curve (“rate ramp”). In addition, the Company also performs simulations using other alternative interest rate scenarios, including various permutations of the yield curve flattening, steepening or inverting. The Company uses the results of these various simulations are used to formulate and gauge strategies to achieve a desired risk profile within the Company’sits capital and liquidity guidelines.
The net interest income simulation model is based on the actual maturity and re-pricingrepricing characteristics of the Company’s interest-rateinterest rate sensitive assets, liabilities, and related derivative contracts. This model also incorporates various assumptions, which management believes to be reasonable but that may have a significant impact on the results. These key assumptions include the timing and magnitude of changes in interest rates, the yield curve evolution and shape, the correlation between various interest rate indices, financial instruments’ future repricing characteristics and spread relative to benchmark rates, and the effect of interest rate floors and caps. The modeled results are highly sensitive to the deposit decay and deposit beta assumptions, used for deposits that do not have specific maturities. The Company uses historicalwhich we derive from a regression analysis of the Company’s internalhistorical deposit datadata.
Simulation results are highly dependent on modeled behaviors and input assumptions. To the extent that actual behaviors are different from the assumptions used in the models, there could be material changes to the interest rate sensitivity results. The key behavioral models impacting interest rate sensitivity simulations include deposit repricing, deposit balance forecasts, and mortgage prepayments. These models and assumptions are documented, supported, and periodically back-tested to assess the reasonableness and effectiveness. The Company also regularly monitors the sensitivity of the other important modeling assumptions, such as a guideloan and security prepayments and early withdrawal on fixed-rate customer liabilities. The Company makes appropriate calibrations to set deposit decay assumptions. In addition, the model is also highly sensitive to certain assumptions on the correlation of the change in interest rates paid on core deposits to changes in benchmark market interest rates, commonly referred to as deposit beta assumptions. Deposit beta assumptions are based on the Company’s historical experience. The model is also sensitive to the loanneeded and investment prepayment assumption. The loan and investment prepayment assumption, which considers the anticipated prepayments under different interest rate environments, is based on an independent model, as well as the Company’s historical prepayment experiences.
Existing investment securities, loans, customer deposits and borrowings are assumed to roll into new instruments at a similar spread relative to benchmark interest rates and internal pricing guidelines. The assumptions applied incontinually validates the model, are documentedmethodology and supported for reasonableness.results. Changes to key model assumptions are reviewed by the ALCO. Due to the sensitivity of the modelScenario results the Company performs periodic testing to assess the impact of the assumptions. The Company also makes appropriate calibrations when necessary. Scenarios do not reflect strategies that the management could employ to limit the impact asof changing interest rate expectations. The simulation does not represent a forecast of the Company’s net interest income but is a tool utilized to assess the risk of the impact of changing market interest rates across a range of interest rate environments.
The Company employs a variety of quantitative and qualitative approaches to capture historical deposit repricing and balance behaviors. These historical observations are performed at a granular level based on key product characteristics, including distinctions for brokered, public, and large commercial deposits, which are then combined with forward-looking market expectations change. Simulation results are highly dependent onand the competitive landscape to generate the deposit repricing and balance forecasting models. The Company uses these assumptions. Todeposit repricing models to forecast deposit interest expense. The repricing models provide sufficient granularity to reflect key behavioral differences across product and customer types. The deposit beta is a key parameter of the extent actual behavior is differentdeposit rate forecast. The deposit beta defines the sensitivity of deposit rates to changes in the Effective Fed Funds Rate.
In March 2024, the Company assumed a weighted-average beta of 52% for total deposits, an increase of approximately 1.5% from December 31, 2023, which was due to deposit product mix changes as product level deposit beta assumptions were not updated. The Company updated the deposit mix assumptions in March of 2024 to assume that noninterest-bearing deposits would migrate to interest-bearing CDs. The updated assumptions reduced the proportion of noninterest-bearing deposits for the base case and decreasing interest rate scenarios, and reduced the repricing speed of the CD portfolio to better reflect its maturity profile.
As loan and security prepayment assumptions are key components of the Company’s model, the Company incorporates third-party vendor models there could beto forecast prepayment behavior on mortgage loans and securities, which have mortgage loans as underlying collateral. These third-party vendor models have access to more comprehensive industry-level data which can capture specific borrower and collateral characteristics over a material changevariety of interest rate cycles. The Company will periodically assess and adjust the vendor models when appropriate to include its own available observations and expectations. In 2023, the Company updated its version of the vendor prepayment model to better support the transition from London Interbank Offered Rate to Secured Overnight Financing Rate (“SOFR”) indexed loans and updated tuning factors to slow prepayment speeds on single-family residential mortgages to better align them with actual and expected prepayments.
Twelve-Month Net Interest Income Simulation
Net interest income simulation modeling measures interest rate risk through earnings volatility. The simulation projects the cash flow changes in interest rate sensitivity.sensitive assets and liabilities, expressed in terms of net interest income, over a specified time horizon for defined interest rate scenarios. Net interest income simulations provide insight into the impact of market rate changes on earnings, which help guide risk management decisions. The Company assesses interest rate risk by comparing the changes of net interest income in different interest rate scenarios.
The following table presents the Company’s net interest income and economic value of equity (“EVE”) sensitivity as of September 30, 2017 and December 31, 2016 related to an instantaneous and sustained non-parallel shift in market interest rates ofby 100 and 200 basis points in both directions:bps as of March 31, 2024 and December 31, 2023, on a balance sheet assuming flat forward rates and flat loan and deposit growth on the date of analysis. The non-parallel shift scenarios were calibrated internally based on historical analysis.
| | | | | | | | | | | | | | | | | | |
|
| | Net Interest Income Volatility (1) | | |
| Change in Interest Rates (in bps) | | March 31, 2024 | | December 31, 2023 | | | | |
| +200 | | 2.7 | % | | 1.3 | % | | | | |
| +100 | | 2.0 | % | | 1.2 | % | | | | |
| -100 | | (3.2) | % | | (1.8) | % | | | | |
| -200 | | (6.6) | % | | (4.1) | % | | | | |
|
|
| | | | | | | | | | | | |
| |
Change in Interest Rates (BP) | | Net Interest Income Volatility (1) | | EVE Volatility (2) |
| | September 30, 2017 | | December 31, 2016 | | September 30, 2017 | | December 31, 2016 |
| +200 | | 20.5 | % | | 22.4 | % | | 13.4 | % | | 12.3 | % |
| +100 | | 11.4 | % | | 12.0 | % | | 7.0 | % | | 7.5 | % |
| -100 | | (8.0 | )% | | (6.8 | )% | | (3.7 | )% | | (5.0 | )% |
| -200 | | (10.4 | )% | | (7.5 | )% | | (9.6 | )% | | (9.3 | )% |
| |
| |
(1) | (1)The percentage change represents net interest income over 12 months in a stable interest rate environment versus net interest income in the various rate scenarios. |
| |
(2) | The percentage change represents net portfolio value of the Company in a stable interest rate environment versus net portfolio value in the various rate scenarios. |
Twelve-Month Net Interest Income Simulation
The Company’s estimated twelve-month net interest income change over a 12-month period in a stable interest rate environment versus in the various interest rate scenarios.
The composition of the Company’s loan portfolio creates sensitivity to interest rate movements due to a mismatch of repricing behavior between the floating-rate loan portfolio and deposit products. In the table above, net interest income volatility expressed in relation to base-case net interest income increased as of September 30, 2017 was slightly lower compared to DecemberMarch 31, 20162024. This increase reflects updated deposit product mix assumptions, which better reflect the expected repricing profile of the CD portfolio and the amount of noninterest-bearing deposits for both upwardthe shocked interest rate scenarios.
The Company also models scenarios based on gradual shifts in interest rates and assesses the corresponding impacts. These interest rate scenarios as simulated increases inprovide additional information to estimate the Company’s underlying interest rate risk. The rate ramp table below shows the net interest income are offset by an increase in the rate of repricing for the Company’s deposit portfolio. Involatility under a simulated downward interest rate scenario, sensitivity increased overall for bothgradual non-parallel shift of the downward interest rate scenarios, mainly due toyield curve, in even monthly increments over the impactfirst 12 months, followed by rates held constant thereafter based on a flat balance sheet as of the recent interest rate increases on December 14, 2016,date of the analysis.
| | | | | | | | | | | | | | |
|
| | Net Interest Income Volatility |
| Change in Interest Rates (in bps) | | March 31, 2024 | | December 31, 2023 |
| +200 Rate Ramp | | 2.8 | % | | 0.8 | % |
| +100 Rate Ramp | | 1.6 | % | | 0.5 | % |
| -100 Rate Ramp | | (1.8) | % | | (0.6) | % |
| -200 Rate Ramp | | (3.6) | % | | (1.3) | % |
|
As of March 15, 2017, and June 14, 2017. As interest rates rise further away from all time historical lows, there is more room for the Company’s simulated interest income to decline in a downward interest rate scenario, relative to previous simulations.
Under most rising interest rate environments, the Company would expect some customers to move balances in demand deposits into higher interest-bearing deposits such as money market, savings or time deposits. The models are particularly sensitive to the assumption about the rate of such migration. The federal funds target rate was between 0.50% and 0.75% as of December 31, 2016, and between 1.00% and 1.25% as of September 30, 2017. It should be noted that despite the two interest rate increases in 2017, as of September 30, 2017, the Company has not experienced this deposit movement, though there can be no assurance as to how long this is expected to last.
The following table presents2024, the Company’s net interest income sensitivityprofile reflects an asset sensitive position, where assets reprice faster or more significantly than liabilities. Net interest income is expected to increase when interest rates rise as the Company has a large population of September 30, 2017 forvariable rate loans, primarily tied to Prime and Term SOFR indices. The Company’s interest income is sensitive to changes in short-term interest rates. As of March 31, 2024, the +100 and +200 basis pointsCompany designated interest rate scenarios assumingcontracts with a $1.00notional amount of $5.3 billion $2.00 billionas cash flow hedges, which reduced net interest income volatility by approximately 1.8% of the base net interest income for every 100 bps change in interest rate.
The Company’s deposit portfolio is primarily composed of non-maturity deposits, which are not directly tied to short-term interest rate indices, but are, nevertheless, sensitive to changes in short-term interest rates. The modeled results are highly sensitive to modeled behavior and $3.00 billion demandassumptions. Actual net interest income results may deviate from the model’s net interest income due to earning asset growth variation and deposit migrations:mix changes based on customer preferences relative to the interest rate environment. During a period of declining interest rates, balance sheet growth could offset headwinds to net interest income from yield compression.
|
| | | | | | | | | |
| |
Change in Interest Rates
(BP) | | Net Interest Income Volatility |
| | September 30, 2017 |
| | $1.00 Billion Migration 12 Months | | $2.00 Billion Migration
12 Months | | $3.00 Billion Migration
12 Months |
| +200 | | 18.3 | % | | 16.0 | % | | 13.8 | % |
| +100 | | 9.9 | % | | 8.5 | % | | 7.0 | % |
| | | |
Economic Value of Equity at Risk
The Company’s EVE sensitivity increased asEconomic value of September 30, 2017, compared to December 31, 2016,equity (“EVE”) is a cash flow calculation that takes the present value of all asset cash flows and subtracts the present value of all liability cash flows. This calculation is used for bothasset/liability management and measures changes in the economic value of the upward interest rate scenarios. In the simulated upward 100 basis pointsbank’s assets and 200 basis points interest rate scenarios, EVE sensitivity was 7.0% and 13.4%, respectively. The increase in sensitivity as of September 30, 2017 compared to December 31, 2016 in the upward interest rate scenario was primarilyliabilities due to changes in the balance sheet portfolio mix. EVE declined 3.7% and 9.6% of the base level as of September 30, 2017 in declining rate scenarios of 100 and 200 basis points, respectively.interest rates.
The Company’s net interest income and EVE profile as of September 30, 2017, as presented ineconomic value approach provides a comparatively broader scope than the net interest income volatility approach since it represents the discounted present value of cash flows over the expected life of the instruments. Due to this longer horizon, EVE is useful to identify risks arising from repricing, prepayment and maturity gaps between assets and liabilities on the balance sheet, as well as from off-balance sheet derivative exposures, over their lifetime. This long-term economic perspective into the Company’s interest rate risk profile allows the Company to identify anticipated negative effects of interest rate fluctuations.However, the difference in time horizons can cause the EVE tables, reflects an asset sensitiveanalysis to diverge from the shorter-term net interest income position and an asset sensitive EVE position. The Company is naturally asset sensitive due to its large portfolio of rate-sensitive loans that are funded in part by noninterest-bearing and rate-stable core deposits. As a result, if there are no significant changes in the mix of assets and liabilities, net interest income increases when interest rates increase, and decreases when interest rates decrease.analysis presented above. Given the uncertainty of the magnitude, timing and direction of future interest rate movements, and the shape of the yield curve, and potential changes to the balance sheet, actual results may vary from those predicted by the Company’s model.
The following table presents the Company’s EVE sensitivity related to an instantaneous non-parallel shift in market interest rates by 100 and 200 bps as of March 31, 2024 and December 31, 2023. The non-parallel shift scenarios were calibrated internally based on historical analysis. | | | | | | | | | | | | | | |
| | | | |
| | EVE Volatility (1) |
| Change in Interest Rates (in bps) | | March 31, 2024 | | December 31, 2023 |
| +200 | | (10.4) | % | | (10.3) | % |
| +100 | | (4.9) | % | | (5.4) | % |
| -100 | | 2.6 | % | | 3.0 | % |
| -200 | | 5.1 | % | | 6.0 | % |
| | | | |
(1)The percentage change represents net portfolio value change of the Company in a stable interest rate environment versus in the various interest rate scenarios.
As of March 31, 2024, the Company’s EVE is expected to decrease when interest rates rise. The change in EVE sensitivity was due to changes in the structure of the balance sheet as well as changes in the underlying valuations and durations of assets and liabilities.
Derivatives
It is the Company’s policy not to speculate on the future direction of interest rates, or foreign currency exchange rates.rates and commodity prices. However, the Company will, from time to time, enterperiodically enters into derivativesderivative transactions in order to reducemanage its exposure to market risks, includingrisk, primarily interest rate risk and foreign currency risk. The Company believes these derivative transactions, when properly structured and managed, may provide a hedge against inherent risk in certain assets orand liabilities andor against risk in specific transactions. Hedging transactions may be implemented using a variety of derivative instruments such as swaps, caps, floors, financial futures, forwards, options, and options.collars. The Company uses interest rate swaps to hedge the variability in interest received on certain floating-rate commercial loans and interest paid on certain floating-rate borrowings. Foreign exchange derivatives are used in net investment hedging strategies to mitigate the risk of changes in the U.S. dollar equivalent value of a designated monetary amount of the Company’s net investment in East West Bank (China) Limited. Prior to entering into any hedging activities,hedge accounting activity, the Company analyzes the costs and benefits of the hedge in comparison to alternative strategies.
Interest Rate Swaps on Certificates of Deposit — As of September 30, 2017 and December 31, 2016, the The Company had two cancellable interest rate swap contracts with original terms of 20 years. The objective of these interest rate swaps, which were designated as fair value hedges, was to obtain low-cost floating rate fundingalso repositions its hedging derivatives portfolio based on the Company’s brokered certificatescurrent assessment of deposit. As of September 30, 2017economic and December 31, 2016, underfinancial conditions, including the terms of the swap contracts, the Company received a fixed interest rate and paid a variable interest rate. Asforeign currency environments, balance sheet composition and trends, and the relative mix of September 30, 2017its cash and December 31, 2016,derivative positions.
In addition, the notional amounts of the Company’s brokered certificates of deposit interest rate swaps were $42.6 million and $48.4 million, respectively. The fair value liabilities of the interest rate swaps were $6.6 million and $6.0 million as of September 30, 2017 and December 31, 2016, respectively.
Interest Rate Swaps and Options — The Company also offers various interest rate derivative products to its customers. Whenenters into derivative transactions are executedin order to accommodate its customers with itstheir business needs or to assist customers with their risk management objectives, such as managing exposure to fluctuations in interest rates, foreign currencies and commodity prices. To economically hedge against the derivative contracts are offset by paired tradesentered into with registered swap dealers. These contracts allow borrowers to lock in attractive intermediate and long-term fixed rate financing while not increasing the interest rate risk to the Company. These transactions are not linked to specific Company assets or liabilities on the Consolidated Balance Sheets or to forecasted transactions in a hedge relationship and, therefore, are economic hedges. The contracts are marked to market at each reporting period. Fair values are determined from verifiable third-party sources that have considerable experience with derivative markets. The Company provides data to the third party source to calculate the credit valuation component of the fair values of the client derivative contracts.
As of September 30, 2017, the total notional amounts of interest rate swaps and options, including mirrored transactions with institutional counterparties and the Company’s customers, totaled $4.37 billion for derivatives that were in an asset valuation position and $4.37 billion for derivatives that were in a liability valuation position. As of December 31, 2016, the total notional amounts of interest rate swaps and options, including mirrored transactions with institutional counterparties and the Company’s customers, totaled $3.86 billion for derivatives that were in an asset valuation position and $3.81 billion for derivatives that were in a liability valuation position. The fair values of interest rate swap and option contracts with institutional counterparties and the Company’s customers amounted to a $64.8 million asset and a $64.2 million liability as of September 30, 2017. The fair values of interest rate swap and option contracts with institutional counterparties and the Company’s customers amounted to a $67.6 million asset and a $65.1 million liability as of December 31, 2016.
Foreign Exchange Contracts — The Company enters into foreign exchange contracts with its customers, primarily comprised of forward, swap and spot contracts to enable its customers to hedge their transactions in foreign currencies from fluctuations in foreign exchange rates, and also to allow the Company to economically hedge against foreign currency fluctuations in certain foreign currency denominated deposits that it offers to its customers, as well as the Company’s investment in its China subsidiary, East West Bank (China) Limited.
For a majority of the foreign exchange transactions entered with its customers, the Company enters into offsetting foreign exchangederivative contracts with institutional counterparties to mitigate the foreign exchange risk. Thesethird-party financial institutions, some of which are cleared through central clearing organizations. The exposures from derivative transactions are economic hedgescollateralized by cash and/or eligible securities based on limits as set forth in the respective agreements between the Company and counterparty financial institutions. The fair value changes of the derivative contracts traded with third-party financial institutions are expected to be largely comparable to the fair value changes of the derivative transactions executed with customers throughout the terms of these contracts, except for the credit valuation adjustment component in the contracts and the Company does not apply hedge accounting. The Company’s policies also permit taking proprietary currency positions within approved limits, in compliance withspread variances between the proprietary trading exemption provided under Section 619 ofcustomer derivatives and the Dodd-Frank Act.offsetting financial counterparty positions. The Company does not speculate in the foreign exchange markets, and actively manages its foreign exchange exposures within prescribed risk limits and defined controls.
ASC 830-20, Foreign Currency Matters — Foreign Currency Transactions and ASC 815, Derivatives and Hedging, allow hedging of the foreign currency risk of a net investment in a foreign operation. During the fourth quarter of 2015, the Company began entering into foreign currency forward contracts to hedge its investment in East West Bank (China) Limited, a non-U.S. dollar (“USD”) functional currency subsidiary in China. The hedging instruments, designated as net investment hedges, involve hedging the risk of changes in the USD equivalent value of a designated monetary amount of the Company’s net investment in China, against the risk of adverse changes in the foreign currency exchange rate. The notional amount and fair value of the net investment hedges were $83.0 million and a $4.3 million asset, respectively, as of December 31, 2016. Since recent policy changes by the People’s Bank of China, the central bank of the People’s Republic of China, as well as market sentiments have caused a divergence in the exchange rate movements of the on-shore Chinese Renminbi and off-shore Chinese Renminbi, the net investment hedge relationships were dedesignated during the first quarter of 2017, even though they continued to meet the hedge effectiveness test. As of September 30, 2017, the notional amount and fair value of these two foreign exchange forward contracts designated as economic hedges were $93.3 million and a $4.8 million liability, respectively, and have been included in the foreign exchange contracts’ notional amount of $1.13 billion and fair value of $14.2 million disclosed below.
As of September 30, 2017 and December 31, 2016, the Company’s total notional amounts of thealso utilizes foreign exchange contracts that wereare not designated as hedging instruments were $1.13 billionto mitigate the economic effect of fluctuations in certain foreign currency on-balance sheet assets and $767.8 million, respectively. The fair values of theliabilities, primarily foreign exchange contracts were a $14.2 million asset and a $20.1 million liability, respectively, as of September 30, 2017 and an $11.9 million asset and an $11.2 million liability, respectively, as of December 31, 2016.currency denominated deposits offered to its customers.
Credit Risk Participation Agreements — The Company has entered intois subject to credit risk participation agreements (“RPAs”) under which the Company assumed its pro-rata share of the credit exposure associated with the borrower’s performancecounterparties to the derivative contracts. This counterparty credit risk is a multi-dimensional form of risk, affected by both the exposure and credit quality of the counterparty, both of which are sensitive to market-induced changes. The Company’s Credit Risk Management Committee provides oversight of credit risk and the Company has guidelines in place to manage counterparty concentration, tenor limits, and collateral. The Company manages the credit risk of its derivative positions by diversifying its positions among various counterparties, by entering into legally enforceable master netting agreements, and by requiring collateral arrangements, where possible. The Company may also transfer counterparty credit risk related to interest rate swaps to third-party financial institutions through the use of credit risk participation agreements. Certain derivative contracts. The Company may or may notcontracts are required to be a partycleared through central clearinghouses, to further mitigate counterparty credit risk, where variation margin is applied daily as settlement to the interest rate derivative contract and enters into such RPAs in instances where the Company is a party to the related loan participation agreement with the borrower. The Company will make/receive payments under the RPAs if the borrower defaults on its obligation to perform under the interest rate derivative contract. The Company manages its credit risk on the RPAs by monitoring the credit worthiness of the borrowers, which is based on the normal credit review process. The notional amount of the RPAs reflects the Company’s pro-rata share of the derivative instrument. As of September 30, 2017, the notional amount and fair value of the RPAs purchased were $47.8 millionderivative contracts. In addition, the Company incorporates credit value adjustments and a $1 thousand liability, respectively.other market standard methodologies to appropriately reflect the counterparty’s and the Company’s own nonperformance risk in the fair value measurement of its derivatives. As of September 30, 2017,March 31, 2024, the Company anticipates performance by its counterparties and has not incurred any related credit losses.
The following table summarizes certain information on derivative instruments designated as accounting hedges and utilized by the Company in its management of interest rate and foreign currency risks as of March 31, 2024 and December 31, 2023:
| | | | | | | | | | | | | | | | | | |
|
| | March 31, 2024 | | December 31, 2023 |
| ($ in thousands) | | Interest Rate Contracts Hedging Loans (1)(2)(3) | | | | Interest Rate Contracts Hedging Loans (1)(2)(3) | | |
| Cash flow hedges | | | | | | | | |
| Notional amount | | $ | 4,000,000 | | | | | $ | 4,000,000 | | | |
| Weighted average: | | | | | | | | |
| Receive rate | | 4.95 | % | | | | 4.95 | % | | |
| Pay rate | | 7.31 | % | | | | 7.32 | % | | |
| Remaining term (in months) | | 32.8 | | | | | 35.8 | | | |
| | | | | | | | |
| | | | | | | | |
| ($ in thousands) | | Foreign Exchange Contracts | | Foreign Exchange Contracts |
| Net investment hedges | | | | | | | | |
| Notional amount | | $ | — | | | | | $ | 81,480 | | |
Hedged percentage (4) | | — | % | | | | 44 | % | | |
| Remaining term (in months) | | — | | | | | 2.7 | | | |
|
NA — Not applicable.
(1)Represents receive-fixed/pay-floating interest rate swaps and excludes interest rate collars. Floating rates paid are based on SOFR or Prime.
(2)Excludes interest rate collars in total notional amount of $250 million as of both March 31, 2024 and December 31, 2023.
(3)Excludes forward-starting swaps in total notional amount of $1.0 billion not effective as of both March 31, 2024 and December 31, 2023.
(4)Represents percentage between the notional amountof outstanding foreign exchange contracts and fair value of the RPAs sold were $20.6 million and a $2 thousand asset, respectively. As of December 31, 2016, the notional amount and fair value of the RPAs purchased were $48.3 million and a $3 thousand liability, respectively. As of December 31, 2016, the notional amount and fair value of the RPAs sold were $23.1 million and a $3 thousand asset, respectively.
Warrants —net RMB exposure from East West Bank (China) Limited. The Company obtained warrants to purchase preferred and common stockdoes not have active net investment hedges as of technology and life sciences companies, as part of the loan origination process. As of September 30, 2017, the warrants included on the Consolidated Financial Statements were from public and private companies. The Company valued these warrants based on the Black-Scholes option pricing model. For warrants from public companies, the model uses the underlying stock price, stated strike price, warrant expiration date, risk-free interest rate based on duration-matched U.S. Treasury rate and market-observable company-specific option volatility as inputs to value the warrants. For warrants from private companies, the model uses inputs such as the offering price observed in the most recent round of funding, stated strike price, warrant expiration date, risk-free interest rate based on duration-matched U.S. Treasury rate and option volatility. The option volatility assumption was based on public market indices that include members that operate in similar industries as the companies in our private company portfolio. The model values were further adjusted for a general lack of liquidity due to the private nature of the underlying companies. As of September 30, 2017, the total fair value of the warrants held in public and private companies was a $1.5 million asset.March 31, 2024.
Additional information on the Company’s derivatives is presented in Note 1 — Summary of Significant Accounting Policies — Significant Accounting Policies — Derivatives to the Consolidated Financial Statements ofin the Company’s 20162023 Form 10-K,, Note 4 3 —Fair Value Measurement and Fair Value of Financial Instruments, and Note 7 6 — Derivatives to the Consolidated Financial Statements.Statements in this Form 10-Q.
Critical Accounting Policies and Estimates
SignificantThe Company’s significant accounting policies (see are described in Note 1 — Summary of Significant Accounting Policies to the Consolidated Financial Statements and Item 7. MD&A — Critical Accounting Policies and Estimates ofin the Company’s 20162023 Form 10-K)10-K. Certain of these policies include critical accounting estimates, which are fundamentalsubject to understanding the Company’s reported results. Some accounting policies, by their nature,valuation assumptions, subjective or complex judgments about matters that are inherently subject to estimation techniques, valuationuncertain, and it is likely that materially different amounts could be reported under different assumptions and other subjective assessments. In addition, some accounting policies require significant judgment in applying complex accounting principles to individual transactions to determine the most appropriate treatment.conditions. The Company has procedures and processes in place to facilitate making these judgments.
Certain The following accounting policies are consideredcritical to have a critical effect on the Company’s Consolidated Financial Statements in the Company’s judgment. In each area, the Company has identified the most important variables in the estimation process. The Company has used the best information available to make the estimations necessary for the related assets and liabilities. Actual results could differ from the Company’s estimates, and future changes in the key variables could change future valuations and impact the results of operations. The following is a list of the more judgmental and complex accounting estimates and principles:Statements:
fair value of financial instruments;
available-for-sale investment securities;
PCI loans;
•allowance for credit losses;
•fair value estimates;
•goodwill impairment; and
•income taxes.
For additional information on the Company’s critical accounting estimates involving significant judgments, see Item 7. MD&A — Critical Accounting Estimates in the Company’s 2023 Form 10-K.
Recently Issued Accounting Standards
Reconciliation of GAAP to Non-GAAP Financial Measures
To supplement the Company’s unaudited interim Consolidated Financial Statements presented in accordance with U.S. GAAP, the Company uses certain non-GAAP measures of financial performance. Non-GAAP financial measures are not prepared in accordance with, or as an alternative to U.S. GAAP. Generally, a non-GAAP financial measure is a numerical measure of a company’s performance that either excludes or includes amounts, or is subject to adjustments that have such an effect, that are not normally excluded or included in the most directly comparable financial measure that is calculated and disclosurepresented in accordance with U.S. GAAP. The non-GAAP financial measures discussed in this Form 10-Q are return on new accounting pronouncements adoptedaverage TCE, adjusted efficiency ratio, adjusted diluted EPS, and recent accounting pronouncements issued, see Note 2 — Current Accounting Developments tangible book value per share. Certain additional non-GAAP financial measures that are components of the foregoing non-GAAP financial measures are also set forth and reconciled in the table below. The Company believes these non-GAAP financial measures, when taken together with the corresponding U.S. GAAP financial measures, provide meaningful supplemental information regarding its performance, and allow comparability to prior periods. These non-GAAP financial measures may be different from non-GAAP financial measures used by other companies, limiting their usefulness for comparison purposes.
The following tables present the reconciliations of U.S. GAAP to non-GAAP financial measures for the periods presented:
| | | | | | | | | | | | | | | | | | | | | |
| | | | |
| | | Three Months Ended March 31, | | |
| ($ in thousands) | | | 2024 | | 2023 | | | | |
| Net income | (a) | | $ | 285,075 | | | $ | 322,439 | | | | | |
| Add: Amortization of core deposit intangibles | | | — | | | 441 | | | | | |
| Amortization of mortgage servicing assets | | | 308 | | | 356 | | | | | |
Tax effect of amortization adjustments (1) | | | (91) | | | (233) | | | | | |
| Tangible net income (non-GAAP) | (b) | | $ | 285,292 | | | $ | 323,003 | | | | | |
| | | | | | | | | |
| Average stockholders’ equity | (c) | | $ | 6,992,558 | | | $ | 6,183,324 | | | | | |
| Less: Average goodwill | | | (465,697) | | | (465,697) | | | | | |
Average other intangible assets (2) | | | (6,473) | | | (7,696) | | | | | |
| Average tangible book value (non-GAAP) | (d) | | $ | 6,520,388 | | | $ | 5,709,931 | | | | | |
| | | | | | | | | |
ROE (3) | (a)/(c) | | 16.40 | % | | 21.15 | % | | | | |
Return on average TCE (3) (non-GAAP) | (b)/(d) | | 17.60 | % | | 22.94 | % | | | | |
| | | | | | | | | |
| | | | |
| | | | | | | | | | | | | | | | | | | | | |
| | |
| | | Three Months Ended March 31, | | |
| ($ in thousands) | | | 2024 | | 2023 | | | | |
| Net interest income before provision for credit losses | (a) | | $ | 565,139 | | | $ | 599,861 | | | | | |
| Total noninterest income | | | 78,988 | | | 59,978 | | | | | |
| Total revenue | (b) | | $ | 644,127 | | | $ | 659,839 | | | | | |
| Noninterest income | | | 78,988 | | | 59,978 | | | | | |
Add: Net loss on AFS debt security (4) | | | — | | | 10,000 | | | | | |
| Adjusted noninterest income (non-GAAP) | (c) | | 78,988 | | | 69,978 | | | | | |
| Adjusted revenue (non-GAAP) | (a)+(c)=(d) | | $ | 644,127 | | | $ | 669,839 | | | | | |
| | | | | | | | | |
Total noninterest expense | (e) | | $ | 246,875 | | | $ | 218,447 | | | | | |
| Less: Amortization of tax credit and other investments | | | (13,207) | | | (10,110) | | | | | |
| Amortization of core deposit intangibles | | | — | | | (441) | | | | | |
FDIC charge (5) | | | (10,305) | | | — | | | | | |
Repurchase agreements’ extinguishment cost (6) | | | — | | | (3,872) | | | | | |
| Adjusted noninterest expense (non-GAAP) | (f) | | $ | 223,363 | | | $ | 204,024 | | | | | |
| | | | | | | | | |
| Efficiency ratio | (e)/(b) | | 38.33 | % | | 33.11 | % | | | | |
| Adjusted efficiency ratio (non-GAAP) | (f)/(d) | | 34.68 | % | | 30.46 | % | | | | |
| | |
| | | | | | | | | | | | | | | | | | | | | |
|
| | | | | Three Months Ended March 31, |
| ($ and shares in thousands, except per share data) | | | | | | | 2024 | | 2023 |
| Net income | (a) | | | | | | $ | 285,075 | | | $ | 322,439 | |
Add: FDIC charge (5) | | | | | | | 10,305 | | | — | |
Net loss on AFS debt security (4) | | | | | | | — | | | 10,000 | |
Tax effect of adjustment (1) | | | | | | | (3,046) | | | (2,929) | |
| Adjusted net income (non-GAAP) | (b) | | | | | | $ | 292,334 | | | $ | 329,510 | |
| | | | | | | | | |
| Diluted weighted-average number of shares outstanding | (c) | | | | | | $ | 140,261 | | | $ | 141,913 | |
| Diluted EPS | (a)/(c) | | | | | | 2.03 | | | 2.27 | |
Add: FDIC charge (5) | | | | | | | 0.05 | | | — | |
Net loss on AFS debt security (4) | | | | | | | — | | | 0.05 | |
| Adjusted diluted EPS (non-GAAP) | (b)/(c) | | | | | | $ | 2.08 | | | $ | 2.32 | |
| | | | | | | | | |
| | | | | | | | | |
(1)Applied statutory tax rate of 29.56% for the first quarter of 2024 and 29.29% for the first quarter of 2023.
(2)Includes core deposit intangibles and mortgage servicing assets.
(3)Annualized.
(4)Represents the net loss related to an AFS debt security that was written-off in the first quarter of 2023.
(5)During the first quarter of 2024, the Company recorded a $10 million pre-tax FDIC charge (included in Deposit insurance premiums and regulatory assessments on the Consolidated Financial Statements.Statement of Income).
(6)The Company prepaid $300 million of repurchase agreements and incurred a debt extinguishment cost of $4 million in the first quarter of 2023.
| | | | | | | | | | | | | | | | | | | |
| | |
| ($ and shares in thousands, except per share data) | | | March 31, 2024 | | December 31, 2023 | | |
| Stockholders’ equity | (a) | | $ | 7,023,232 | | | $ | 6,950,834 | | | |
| Less: Goodwill | | | (465,697) | | | (465,697) | | | |
Other intangible assets (1) | | | (6,234) | | | (6,602) | | | |
| Tangible book value (non-GAAP) | (b) | | $ | 6,551,301 | | | $ | 6,478,535 | | | |
| | | | | | | |
| | | | | | | |
| | | | | | | |
| | | | | | | |
| | | | | | | |
| | | | | | | |
| | | | | | | |
| | | | | | | |
| | | | | | | |
| Number of common shares at period-end | (c) | | 139,121 | | | 140,027 | | | |
| Book value per share | (a)/(c) | | $ | 50.48 | | | $ | 49.64 | | | |
| Tangible book value per share (non-GAAP) | (b)/(c) | | $ | 47.09 | | | $ | 46.27 | | | |
| | |
(1)Includes core deposit intangibles and mortgage servicing assets.
ITEM 3. QUANTITATIVE AND QUALITATIVE DISCLOSURES ABOUT MARKET RISK
For quantitative and qualitative disclosures regarding market risk in the Company’s portfolio, see Item 1.Note 6 — Derivatives to the Consolidated Financial Statements — Note 7 — Derivativesin this Form 10-Q and Item 2. MD&A — Asset Liability andRisk Management — Market Risk Management in Part I of this report. Form 10-Q.
ITEM 4. CONTROLS AND PROCEDURES
Disclosure Controls and Procedures
As of September 30, 2017,March 31, 2024, pursuant to Rule 13a-15(b) of the Securities Exchange Act of 1934, as amended (the “Exchange Act”), the Company conducted an evaluation, under the supervision and with the participation of the Company’s management, including the Chief Executive Officer and Chief Financial Officer, of the effectiveness of the design and operation of the Company’s disclosure controls and procedures (as defined in Rule 13a-15(e) of the Exchange Act). Based upon that evaluation, the Company’s Chief Executive Officer and Chief Financial Officer concluded that the Company’s disclosure controls and procedures were effective as of September 30, 2017.March 31, 2024.
The Company’s disclosure controls and procedures are designed to ensure that information required to be disclosed by the Company in the reports that the Company files or submits under the Exchange Act is recorded, processed, summarized, and reported within the time periods specified in the rules and forms of the U.S. Securities and Exchange Commission.SEC. The Company’s disclosure controls and procedures include, without limitation, controls and procedures designed to ensure that information required to be disclosed by the Company in the reports that the Company files under the Exchange Act is accumulated and communicated to the Company’s management, including the Chief Executive Officer and Chief Financial Officer, as appropriate, to allow timely decisions regarding required disclosure.
Change in Internal Control over Financial Reporting
There has beenwere no changechanges in the Company’s internal control over financial reporting (as defined in Rule 13a-15(f) of the Exchange Act) during the quarter ended September 30, 2017,March 31, 2024, that hashave materially affected or isare reasonably likely to materially affect the Company’s internal control over financial reporting.
PART II — OTHER INFORMATION
ITEM 1. LEGAL PROCEEDINGS
See Note 11—Commitments and Contingencies— Litigation to the Consolidated Financial Statements in Part I of this report,Form 10-Q, incorporated herein by reference.
ITEM 1A. RISK FACTORS
The Company’s 20162023 Form 10-K contains disclosure regarding the risks and uncertainties related to the Company’s business under the heading Item 1A. Risk Factors. There hashave been no material changechanges to the Company’s risk factors as presented in the Company’s 20162023 Form 10-K.
ITEM 2. UNREGISTERED SALES OF EQUITY SECURITIES AND USE OF PROCEEDS
There wereRepurchases of Equity Securities by the Issuer and Affiliated Purchasers
The following table summarizes the Company’s common stock repurchase activity during the first quarter of 2024:
| | | | | | | | | | | | | | | | | | | | | | | | | | |
|
| Calendar Month | | Total Number of Shares Purchased (1) | | Average Price Paid per Share of Common Stock | | Total Number of Shares Purchased as Part of Publicly Announced Plans or Programs | | Approximate Dollar Value of Shares that May Yet Be Purchased Under the Plans or Programs (in millions) (2) |
| January | | — | | | $ | — | | | — | | | $ | 172 | |
| February | | 1,181,851 | | | $ | 69.76 | | | 1,181,851 | | | $ | 89 | |
| March | | — | | | $ | — | | | — | | | $ | 89 | |
| First quarter | | 1,181,851 | | | $ | 69.76 | | | 1,181,851 | | | |
|
(1)Excludes the repurchase of common stock pursuant to various stock compensation plans and agreements.
(2)On March 3, 2020, the Company’s Board of Directors authorized, and the Company announced, a stock repurchase program under which the Company may repurchase up to $500 million of its common stock. The stock repurchase authorization has no unregistered sales of equity securities or repurchase activities duringexpiration date.
ITEM 5. OTHER INFORMATION
During the three months ended September 30, 2017.March 31, 2024, none of the Company’s directors or Section 16 reporting officers adopted or terminated any Rule 10b5-1 trading arrangement or non-Rule 10b5-1 trading arrangement (as such terms are defined in Item 408 of the SEC’s Regulation S-K).
ITEM 6. EXHIBITS
The following exhibit index lists Exhibits filed, or in the case of Exhibits 32.1 and 32.2 furnished, with this report:
| | | | | | | | |
| Exhibit No. | | Exhibit Description |
| | |
| 3.1 | | |
| | |
| 3.1.1 | | | | Exhibit Description 000-24939).] |
| | |
| 3.1.2 | | |
| | |
| 3.1.3 | | |
| | |
| 3.1.4 | | |
| | |
| 3.1.5 | | |
| | |
| 3.1.6 | | |
| | |
| 3.2 | | |
| | |
| 10.1 | | |
| | |
| 10.2 | | |
| | |
| | |
| | |
| | |
| | |
| | |
| | |
| | |
| | |
| | |
| | |
| 31.1 | | |
| | |
| | |
| | |
| | |
| | |
| | |
| | |
| 101.INS | | The instance document does not appear in the interactive data file because its XBRL tags are embedded within the inline XBRL document. |
| 101.INS | | XBRL Instance Document.
| 101.SCH | | |
101.SCH | | Inline XBRL Taxonomy Extension Schema Document. Filed herewith. |
| | |
| 101.CAL | | Inline XBRL Taxonomy Extension Calculation Linkbase Document. Filed herewith. |
| | |
| 101.DEF | | Inline XBRL Taxonomy Extension Definition Linkbase Document. Filed herewith. |
| | |
| 101.LAB | | Inline XBRL Taxonomy Extension Label Linkbase Document. Filed herewith. |
| | |
| 101.PRE | | Inline XBRL Taxonomy Extension Presentation Linkbase Document. Filed herewith. |
| | |
| 104 | | Cover Page Interactive Data (formatted as Inline XBRL and contained in Exhibit 101 filed herewith). Filed herewith. |
| | |
|
| | |
|
All other material referenced in this report which is required to be filed as an exhibit hereto has previously been submitted.
GLOSSARY OF ACRONYMS
| | | | | | | | | | | |
| AFS | Available-for-sale | HELOC | Home equity lines of credit |
| ALCO | Asset/Liability Committee | HTM | Held-to-maturity |
ALCO | Asset/Liability Committee |
AML | Anti-Money Laundering |
| AOCI | Accumulated other comprehensive income (loss) | IAR | Independent Asset Review |
| ASC | Accounting Standards Codification | LCH | London Clearing House |
| ASU | Accounting Standards Update | LGD | Loss given default |
BPBTFP | Basis pointBank Term Funding Program | LTV | Loan-to-value |
BSAC&I | Bank Secrecy Act |
C&I | Commercial and industrial |
CET1 | Common Equity Tier 1 |
CRAMD&A | Community Reinvestment Act |
CRE | Commercial real estate |
DBO | California Department of Business Oversight |
EPS | Earnings per share |
EVE | Economic value of equity |
EWIS | East West Insurance Service, Inc. |
FASB | Financial Accounting Standards Board |
FHLB | Federal Home Loan Bank |
FRB | Federal Reserve Bank of San Francisco |
GAAP | Generally Accepted Accounting Principles |
HELOCs | Home equity lines of credit |
MD&A | Management’s Discussion and Analysis of Financial Condition and Results of Operations |
MOUCD | MemorandumCertificate of Understandingdeposit | MMBTU | Million British thermal unit |
Non-GAAPCECL | Non-Generally Accepted Accounting PrinciplesCurrent expected credit losses | NAV | Net asset value |
Non-PCICFPB | Non-purchased credit impairedConsumer Financial Protection Bureau | NRSRO | Nationally recognized statistical rating organizations |
OREOCLO | Collateralized loan obligations | OREO | Other real estate owned |
OTTICME | Other-than-temporary impairmentChicago Mercantile Exchange | PAM | Proportional amortization method |
PCICRA | Purchased credit impairedCommunity Reinvestment Act | PD | Probability of default |
RPAsCRE | Commercial real estate | RMB | Chinese Renminbi |
| DIF | Deposit Insurance Fund | ROA | Return on average assets |
| EPS | Earnings per share | ROC | Risk Oversight Committee |
| ERM | Enterprise risk management | ROE | Return on average common equity |
| EVE | Economic value of equity | RPA | Credit risk participation agreementsagreement |
RSAsFASB | Financial Accounting Standards Board | RSU | Restricted stock awardsunit |
RSUsFDIC | Restricted stock units |
SBLCsFederal Deposit Insurance Corporation | SBLC | Standby letters of credit |
S&PFHLB | StandardFederal Home Loan Bank | SEC | U.S. Securities and Poor’sExchange Commission |
TDRsFRBSF | Troubled debt restructuringsFederal Reserve Bank of San Francisco | SOFR | Secured Overnight Financing Rate |
U.S.FTP | United StatesFunds transfer pricing | TCE | Tangible Common Equity |
U.S. GAAP | United States Generally Accepted Accounting Principles | U.S. | United States |
USDGDP | Gross Domestic Product | USD | U.S. Dollardollar |
| GNMA | Government National Mortgage Association | | |
SIGNATURE
Pursuant to the requirements of the Securities Exchange Act of 1934, the registrant has duly caused this report to be signed on its behalf by the undersigned thereunto duly authorized.
| | | | | | | | | | | | | | |
| Dated: | May 9, 2024 | | | |
| Dated: | November 7, 2017 |
| | |
| | EAST WEST BANCORP, INC.
(Registrant)
|
| | |
| | By | /s/ IRENE H. OHChristopher J. Del Moral-Niles | |
| | | Christopher J. Del Moral-Niles |
| | | Irene H. Oh |
| | | Executive Vice President and
Chief Financial Officer
|
EXHIBIT INDEX
The following exhibit index lists Exhibits filed, or in the case of Exhibits 32.1 and 32.2, furnished with this report:
|
| | |
Exhibit No. | | Exhibit Description |
| | |
| | |
| | |
| | |
| | |
| | |
| | |
| | |
| | |
101.INS | | XBRL Instance Document. |
| | |
101.SCH | | XBRL Taxonomy Extension Schema Document. |
| | |
101.CAL | | XBRL Taxonomy Extension Calculation Linkbase Document. |
| | |
101.DEF | | XBRL Taxonomy Extension Definition Linkbase Document. |
| | |
101.LAB | | XBRL Taxonomy Extension Label Linkbase Document. |
| | |
101.PRE | | XBRL Taxonomy Extension Presentation Linkbase Document. |
All other material referenced in this report which is required to be filed as an exhibit hereto has previously been submitted.