0001069157 us-gaap:CertificatesOfDepositMemberCreditRiskContractMember us-gaap:FairValueHedgingMember us-gaap:DesignatedAsHedgingInstrumentMember us-gaap:InterestExpenseMember 2018-04-01 2018-06-30 0001069157 srt:MultifamilyMember us-gaap:CommercialPortfolioSegmentMember us-gaap:RealEstateLoanMember 2019-04-01 2019-06-30NondesignatedMember 2019-12-31
UNITED STATES
SECURITIES AND EXCHANGE COMMISSION
Washington, D.C. 20549
FORM 10-Q
☒ QUARTERLY REPORT PURSUANT TO SECTION 13 OR 15(d) OF
THE SECURITIES EXCHANGE ACT OF 1934
For the quarterly period ended June 30, 2019March 31, 2020
OR
☐ TRANSITION REPORT PURSUANT TO SECTION 13 OR 15(d) OF
THE SECURITIES EXCHANGE ACT OF 1934
For the transition period from to
Commission file number 000-24939
EAST WEST BANCORP, INC.
(Exact name of registrant as specified in its charter)
Delaware
(State or other jurisdiction of incorporation or organization)
95-4703316
(I.R.S. Employer Identification No.)
135 North Los Robles Ave., 7th Floor, Pasadena, California 91101
(Address of principal executive offices) (Zip Code)
Registrant’s telephone number, including area code:
(626) 768-6000
Securities registered pursuant to Section 12(b) of the Act:
|
| | | | | |
| Title of each class | | Trading Symbol(s) | | Name of each exchange on which registered |
| Common Stock, $0.001 Par Value | | EWBC | | The Nasdaq Global Select Market |
Indicate by check mark whether the registrant (1) has filed all reports required to be filed by Section 13 or 15(d) of the Securities Exchange Act of 1934 during the preceding 12 months (or for such shorter period that the registrant was required to file such reports), and (2) has been subject to such filing requirements for the past 90 days.
Yes ☒ No ☐
Indicate by check mark whether the registrant has submitted electronically every Interactive Data File required to be submitted pursuant to Rule 405 of Regulation S-T (§232.405 of this chapter) during the preceding 12 months (or for such shorter period that the registrant was required to submit such files).
Yes ☒ No ☐
Indicate by check mark whether the registrant is a large accelerated filer, an accelerated filer, a non-accelerated filer, a smaller reporting company, or an emerging growth company. See the definitions of “large accelerated filer,” “accelerated filer,” “smaller reporting company,” and “emerging growth company” in Rule 12b-2 of the Exchange Act.
|
| | | | |
| Large accelerated filer | ☒ | | Accelerated filer | ☐ |
| Non-accelerated filer | ☐ | | Smaller reporting company | ☐ |
| | | Emerging growth company | ☐ |
If an emerging growth company, indicate by check mark if the registrant has elected not to use the extended transition period for complying with any new or revised financial accounting standards provided pursuant to Section 13(a) of the Exchange Act. ☐
Indicate by check mark whether the registrant is a shell company (as defined in Rule 12b-2 of the Exchange Act).
Yes ☐ No ☒
Number of shares outstanding of the issuer’s common stock on the latest practicable date: 145,546,642141,486,290 shares as of July 31, 2019April 30, 2020.
TABLE OF CONTENTS
PART I — FINANCIAL INFORMATION
ITEM 1. CONSOLIDATED FINANCIAL STATEMENTS
EAST WEST BANCORP, INC. AND SUBSIDIARIES
CONSOLIDATED BALANCE SHEET
($ in thousands, except shares)
(Unaudited)
| | | | | | June 30,
2019 | | December 31,
2018 | | March 31,
2020 | | December 31,
2019 |
| | | (Unaudited) | | | | (Unaudited) | | |
| ASSETS | | | | | | | | |
| Cash and due from banks | | $ | 425,949 |
| | $ | 516,291 |
| | $ | 427,415 |
| | $ | 536,221 |
|
| Interest-bearing cash with banks | | 3,195,665 |
| | 2,485,086 |
| | 2,652,627 |
| | 2,724,928 |
|
| Cash and cash equivalents | | 3,621,614 |
| | 3,001,377 |
| | 3,080,042 |
| | 3,261,149 |
|
| Interest-bearing deposits with banks | | 150,273 |
| | 371,000 |
| | 293,509 |
| | 196,161 |
|
| Securities purchased under resale agreements (“resale agreements”) | | 1,010,000 |
| | 1,035,000 |
| | 860,000 |
| | 860,000 |
|
| Securities: | | | | | | | | |
| Available-for-sale investment securities, at fair value (includes assets pledged as collateral of $493,693 in 2019 and $435,833 in 2018) | | 2,592,913 |
| | 2,741,847 |
| |
| Available-for-sale (''AFS'') debt securities, at fair value (amortized cost of $3,660,413 in 2020; includes assets pledged as collateral of $742,410 in 2020 and $479,432 in 2019) | | | 3,695,943 |
| | 3,317,214 |
|
| Restricted equity securities, at cost | | 78,093 |
| | 74,069 |
| | 78,745 |
| | 78,580 |
|
| Loans held-for-sale | | 3,879 |
| | 275 |
| | 1,594 |
| | 434 |
|
| Loans held-for-investment (net of allowance for loan losses of $330,625 in 2019 and $311,322 in 2018; includes assets pledged as collateral of $21,056,804 in 2019 and $20,590,035 in 2018) | | 33,399,752 |
| | 32,073,867 |
| |
| Loans held-for-investment (net of allowance for loan losses of $557,003 in 2020 and $358,287 in 2019; includes assets pledged as collateral of $23,107,287 in 2020 and $22,431,092 in 2019) | | | 35,336,390 |
| | 34,420,252 |
|
| Investments in qualified affordable housing partnerships, net | | 198,466 |
| | 184,873 |
| | 198,653 |
| | 207,037 |
|
| Investments in tax credit and other investments, net | | 210,387 |
| | 231,635 |
| | 268,330 |
| | 254,140 |
|
| Premises and equipment (net of accumulated depreciation of $125,887 in 2019 and $118,547 in 2018) | | 121,498 |
| | 119,180 |
| |
| Premises and equipment (net of accumulated depreciation of $120,156 in 2020 and $116,790 in 2019) | | | 115,393 |
| | 118,364 |
|
| Goodwill | | 465,697 |
| | 465,547 |
| | 465,697 |
| | 465,697 |
|
| Operating lease right-of-use assets | | 109,032 |
| | — |
| | 101,381 |
| | 99,973 |
|
| Other assets | | 930,754 |
| | 743,686 |
| | 1,452,868 |
| | 917,095 |
|
| TOTAL | | $ | 42,892,358 |
| | $ | 41,042,356 |
| | $ | 45,948,545 |
| | $ | 44,196,096 |
|
| LIABILITIES | | | | | | | | |
| Deposits: | | | | | | | | |
| Noninterest-bearing | | $ | 10,599,088 |
| | $ | 11,377,009 |
| | $ | 11,833,397 |
| | $ | 11,080,036 |
|
| Interest-bearing | | 25,878,454 |
| | 24,062,619 |
| | 26,853,561 |
| | 26,244,223 |
|
| Total deposits | | 36,477,542 |
| | 35,439,628 |
| | 38,686,958 |
| | 37,324,259 |
|
| Short-term borrowings | �� | 19,972 |
| | 57,638 |
| | 66,924 |
| | 28,669 |
|
| Federal Home Loan Bank (“FHLB”) advances | | 745,074 |
| | 326,172 |
| | 646,336 |
| | 745,915 |
|
| Securities sold under repurchase agreements (“repurchase agreements”) | | 50,000 |
| | 50,000 |
| | 450,000 |
| | 200,000 |
|
| Long-term debt and finance lease liabilities | | 152,506 |
| | 146,835 |
| | 152,162 |
| | 152,270 |
|
| Operating lease liabilities | | 117,448 |
| | — |
| | 109,356 |
| | 108,083 |
|
| Accrued expenses and other liabilities | | 595,223 |
| | 598,109 |
| | 933,824 |
| | 619,283 |
|
| Total liabilities | | 38,157,765 |
| | 36,618,382 |
| | 41,045,560 |
| | 39,178,479 |
|
| COMMITMENTS AND CONTINGENCIES (Note 12) | |
|
| |
|
| |
| COMMITMENTS AND CONTINGENCIES (Note 10) | | |
|
| |
|
|
| STOCKHOLDERS’ EQUITY | | | | | | | | |
| Common stock, $0.001 par value, 200,000,000 shares authorized; 166,532,188 and 165,867,587 shares issued in 2019 and 2018, respectively | | 166 |
| | 166 |
| |
| Common stock, $0.001 par value, 200,000,000 shares authorized; 167,091,420 and 166,621,959 shares issued in 2020 and 2019, respectively | | | 167 |
| | 167 |
|
| Additional paid-in capital | | 1,808,896 |
| | 1,789,811 |
| | 1,833,617 |
| | 1,826,345 |
|
| Retained earnings | | 3,414,901 |
| | 3,160,132 |
| | 3,695,759 |
| | 3,689,377 |
|
| Treasury stock, at cost — 20,985,619 shares in 2019 and 20,906,224 shares in 2018 | | (479,398 | ) | | (467,961 | ) | |
| Treasury stock, at cost — 25,656,321 shares in 2020 and 20,996,574 shares in 2019 | | | (633,439 | ) | | (479,864 | ) |
| Accumulated other comprehensive loss (“AOCI”), net of tax | | (9,972 | ) | | (58,174 | ) | | 6,881 |
| | (18,408 | ) |
| Total stockholders’ equity | | 4,734,593 |
| | 4,423,974 |
| | 4,902,985 |
| | 5,017,617 |
|
| TOTAL | | $ | 42,892,358 |
| | $ | 41,042,356 |
| | $ | 45,948,545 |
| | $ | 44,196,096 |
|
|
See accompanying Notes to Consolidated Financial Statements.
3
EAST WEST BANCORP, INC. AND SUBSIDIARIES
CONSOLIDATED STATEMENT OF INCOME
($ and shares in thousands, except per share data)
| | | | | | Three Months Ended
June 30, | | Six Months Ended
June 30, | | Three Months Ended March 31, |
| | | 2019 | | 2018 | | 2019 | | 2018 | | 2020 | | 2019 |
| INTEREST AND DIVIDEND INCOME | | | | | | |
| | |
| | | | |
| Loans receivable, including fees | | $ | 434,450 |
| | $ | 365,555 |
| | $ | 857,984 |
| | $ | 703,459 |
| | $ | 411,869 |
| | $ | 423,534 |
|
| Available-for-sale investment securities | | 15,685 |
| | 15,059 |
| | 31,433 |
| | 30,515 |
| |
| AFS debt securities | | | 20,142 |
| | 15,748 |
|
| Resale agreements | | 7,343 |
| | 7,182 |
| | 15,189 |
| | 14,116 |
| | 5,565 |
| | 7,846 |
|
| Restricted equity securities | | 505 |
| | 800 |
| | 1,218 |
| | 1,434 |
| | 446 |
| | 713 |
|
| Interest-bearing cash and deposits with banks | | 16,861 |
| | 11,715 |
| | 32,331 |
| | 22,660 |
| | 11,168 |
| | 15,470 |
|
| Total interest and dividend income | | 474,844 |
| | 400,311 |
| | 938,155 |
| | 772,184 |
| | 449,190 |
| | 463,311 |
|
| INTEREST EXPENSE | | | | | | |
| | |
| | | | |
| Deposits | | 97,964 |
| | 51,265 |
| | 189,969 |
| | 90,401 |
| | 76,403 |
| | 92,005 |
|
| Federal funds purchased and other short-term borrowings | | 361 |
| | 124 |
| | 977 |
| | 131 |
| | 556 |
| | 616 |
|
| FHLB advances | | 4,011 |
| | 2,552 |
| | 6,990 |
| | 4,812 |
| | 4,166 |
| | 2,979 |
|
| Repurchase agreements | | 3,469 |
| | 3,042 |
| | 6,961 |
| | 5,348 |
| | 3,991 |
| | 3,492 |
|
| Long-term debt and finance lease liabilities | | 1,713 |
| | 1,649 |
| | 3,471 |
| | 3,120 |
| | 1,367 |
| | 1,758 |
|
| Total interest expense | | 107,518 |
| | 58,632 |
| | 208,368 |
| | 103,812 |
| | 86,483 |
| | 100,850 |
|
| Net interest income before provision for credit losses |
| 367,326 |
| | 341,679 |
| | 729,787 |
| | 668,372 |
|
| 362,707 |
| | 362,461 |
|
| Provision for credit losses | | 19,245 |
| | 15,536 |
| | 41,824 |
| | 35,754 |
| | 73,870 |
| | 22,579 |
|
| Net interest income after provision for credit losses | | 348,081 |
| | 326,143 |
| | 687,963 |
| | 632,618 |
| | 288,837 |
| | 339,882 |
|
| NONINTEREST INCOME | | | | | | |
| | |
| | | | |
| Lending fees | | 16,242 |
| | 14,692 |
| | 31,038 |
| | 28,705 |
| | 15,773 |
| | 14,969 |
|
| Deposit account fees | | 9,788 |
| | 10,140 |
| | 19,429 |
| | 20,570 |
| | 10,447 |
| | 9,468 |
|
| Foreign exchange income | | 7,286 |
| | 6,822 |
| | 12,301 |
| | 7,992 |
| | 7,819 |
| | 5,015 |
|
| Wealth management fees | | 3,800 |
| | 4,501 |
| | 7,612 |
| | 7,454 |
| | 5,357 |
| | 3,812 |
|
| Interest rate contracts and other derivative income | | 10,398 |
| | 6,570 |
| | 13,614 |
| | 13,260 |
| | 7,073 |
| | 3,216 |
|
| Net gains on sales of loans | | 15 |
| | 2,354 |
| | 930 |
| | 3,936 |
| | 950 |
| | 915 |
|
| Net gains on sales of available-for-sale investment securities | | 1,447 |
| | 210 |
| | 3,008 |
| | 2,339 |
| |
| Net gain on sale of business | | — |
| | — |
| | — |
| | 31,470 |
| |
| Net gains on sales of AFS debt securities | | | 1,529 |
| | 1,561 |
|
| Other investment income | | | 1,921 |
| | 1,202 |
|
| Other income | | 3,783 |
| | 2,979 |
| | 6,958 |
| | 6,986 |
| | 3,180 |
| | 1,973 |
|
| Total noninterest income | | 52,759 |
| | 48,268 |
| | 94,890 |
| | 122,712 |
| | 54,049 |
| | 42,131 |
|
| NONINTEREST EXPENSE | | | | | | |
| | |
| | | | |
| Compensation and employee benefits | | 100,531 |
| | 93,865 |
| | 202,830 |
| | 189,099 |
| | 101,960 |
| | 102,299 |
|
| Occupancy and equipment expense | | 17,362 |
| | 16,707 |
| | 34,680 |
| | 33,587 |
| | 17,076 |
| | 17,318 |
|
| Deposit insurance premiums and regulatory assessments | | 2,919 |
| | 5,832 |
| | 6,007 |
| | 12,105 |
| | 3,427 |
| | 3,088 |
|
| Legal expense | | 2,355 |
| | 2,837 |
| | 4,580 |
| | 5,092 |
| | 3,197 |
| | 2,225 |
|
| Data processing | | 3,460 |
| | 3,327 |
| | 6,617 |
| | 6,728 |
| | 3,826 |
| | 3,157 |
|
| Consulting expense | | 2,069 |
| | 5,120 |
| | 4,128 |
| | 7,472 |
| | 1,217 |
| | 2,059 |
|
| Deposit related expense | | 3,338 |
| | 2,922 |
| | 6,842 |
| | 5,601 |
| | 3,563 |
| | 3,504 |
|
| Computer software expense | | 6,211 |
| | 5,549 |
| | 12,289 |
| | 10,603 |
| | 6,166 |
| | 6,078 |
|
| Other operating expense | | 22,679 |
| | 20,779 |
| | 44,968 |
| | 38,386 |
| | 21,119 |
| | 22,289 |
|
| Amortization of tax credit and other investments | | 16,739 |
| | 20,481 |
| | 41,644 |
| | 37,881 |
| | 17,325 |
| | 24,905 |
|
| Total noninterest expense | | 177,663 |
| | 177,419 |
| | 364,585 |
| | 346,554 |
| | 178,876 |
| | 186,922 |
|
| INCOME BEFORE INCOME TAXES | | 223,177 |
| | 196,992 |
| | 418,268 |
| | 408,776 |
| | 164,010 |
| | 195,091 |
|
| INCOME TAX EXPENSE | | 72,797 |
| | 24,643 |
| | 103,864 |
| | 49,395 |
| | 19,186 |
| | 31,067 |
|
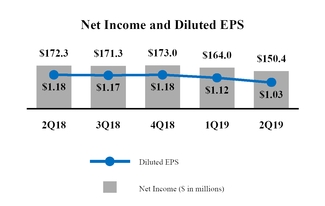
| NET INCOME | | $ | 150,380 |
| | $ | 172,349 |
| | $ | 314,404 |
| | $ | 359,381 |
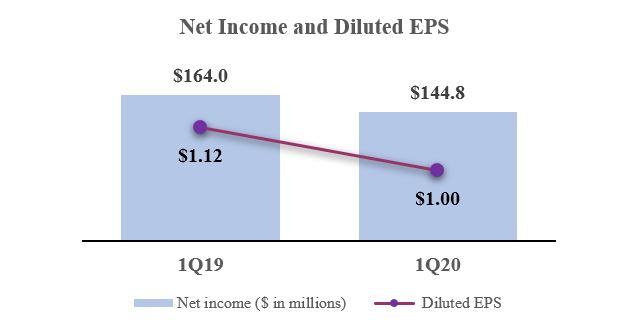
| | $ | 144,824 |
| | $ | 164,024 |
|
| EARNINGS PER SHARE (“EPS”) | | | | | | | | | | | | |
| BASIC | | $ | 1.03 |
| | $ | 1.19 |
| | $ | 2.16 |
| | $ | 2.48 |
| | $ | 1.00 |
| | $ | 1.13 |
|
| DILUTED | | $ | 1.03 |
| | $ | 1.18 |
| | $ | 2.15 |
| | $ | 2.46 |
| | $ | 1.00 |
| | $ | 1.12 |
|
| WEIGHTED-AVERAGE NUMBER OF SHARES OUTSTANDING | | | | | | | | | | | | |
| BASIC | | 145,546 |
| | 144,899 |
| | 145,402 |
| | 144,782 |
| | 144,814 |
| | 145,256 |
|
| DILUTED | | 146,052 |
| | 146,091 |
| | 146,016 |
| | 146,046 |
| | 145,285 |
| | 145,921 |
|
|
See accompanying Notes to Consolidated Financial Statements.
4
EAST WEST BANCORP, INC. AND SUBSIDIARIES
CONSOLIDATED STATEMENT OF COMPREHENSIVE INCOME
($ in thousands)
(Unaudited)
|
| | | | | | | | | | | | | | | | |
| |
| | | Three Months Ended
June 30, | | Six Months Ended
June 30, |
| | | 2019 | | 2018 | | 2019 | | 2018 |
| Net income | | $ | 150,380 |
| | $ | 172,349 |
| | $ | 314,404 |
| | $ | 359,381 |
|
| Other comprehensive income (loss), net of tax: | | | | | | | | |
| Net changes in unrealized gains (losses) on available-for-sale investment securities | | 29,027 |
| | (8,841 | ) | | 51,038 |
| | (27,653 | ) |
| Foreign currency translation adjustments | | (6,016 | ) | | (6,822 | ) | | (2,836 | ) | | (24 | ) |
| Other comprehensive income (loss) | | 23,011 |
| | (15,663 | ) | | 48,202 |
| | (27,677 | ) |
| COMPREHENSIVE INCOME | | $ | 173,391 |
| | $ | 156,686 |
| | $ | 362,606 |
| | $ | 331,704 |
|
| |
|
| | | | | | | | |
| |
| | | Three Months Ended March 31, |
| | | 2020 | | 2019 |
| Net income | | $ | 144,824 |
| | $ | 164,024 |
|
| Other comprehensive income (loss), net of tax: | | | | |
| Net changes in unrealized gains on AFS debt securities | | 27,453 |
| | 22,011 |
|
| Foreign currency translation adjustments | | (2,164 | ) | | 3,180 |
|
| Other comprehensive income | | 25,289 |
| | 25,191 |
|
| COMPREHENSIVE INCOME | | $ | 170,113 |
| | $ | 189,215 |
|
| |
See accompanying Notes to Consolidated Financial Statements.
5
EAST WEST BANCORP, INC. AND SUBSIDIARIES
CONSOLIDATED STATEMENT OF CHANGES IN STOCKHOLDERS’ EQUITY
($ in thousands, except shares)
(Unaudited) |
| | | | | | | | | | | | | | | | | | | | | | | |
| |
| | | Common Stock and
Additional Paid-in Capital | | Retained
Earnings | | Treasury
Stock | | AOCI,
Net of Tax | | Total
Stockholders’
Equity |
| | | Shares | | Amount | | | | |
| BALANCE, APRIL 1, 2018 | | 144,872,525 |
| | $ | 1,761,653 |
| | $ | 2,740,179 |
| | $ | (467,273 | ) | | $ | (55,804 | ) | | $ | 3,978,755 |
|
| Net income | | — |
| | — |
| | 172,349 |
| | — |
| | — |
| | 172,349 |
|
| Other comprehensive loss | | — |
| | — |
| | — |
| | — |
| | (15,663 | ) | | (15,663 | ) |
| Net activity of common stock pursuant to various stock compensation plans and agreements | | 32,104 |
| | 8,385 |
| | — |
| | (215 | ) | | — |
| | 8,170 |
|
| Cash dividends on common stock ($0.20 per share) | | — |
| | — |
| | (29,327 | ) | | — |
| | — |
| | (29,327 | ) |
| BALANCE, JUNE 30, 2018 | | 144,904,629 |
| | $ | 1,770,038 |
| | $ | 2,883,201 |
| | $ | (467,488 | ) | | $ | (71,467 | ) | | $ | 4,114,284 |
|
| BALANCE, APRIL 1, 2019 | | 145,501,301 |
| | $ | 1,799,124 |
| | $ | 3,305,054 |
| | $ | (479,265 | ) | | $ | (32,983 | ) | | $ | 4,591,930 |
|
| Net income | | — |
| | — |
| | 150,380 |
| | — |
| | — |
| | 150,380 |
|
| Other comprehensive income | | — |
| | — |
| | — |
| | — |
| | 23,011 |
| | 23,011 |
|
| Net activity of common stock pursuant to various stock compensation plans and agreements | | 45,268 |
| | 9,938 |
| | — |
| | (133 | ) | | — |
| | 9,805 |
|
| Cash dividends on common stock ($0.275 per share) | | — |
| | — |
| | (40,533 | ) | | — |
| | — |
| | (40,533 | ) |
| BALANCE, JUNE 30, 2019 | | 145,546,569 |
| | $ | 1,809,062 |
| | $ | 3,414,901 |
| | $ | (479,398 | ) | | $ | (9,972 | ) | | $ | 4,734,593 |
|
| |
|
| | | | | | | | | | | | | | | | | | | | | | | |
| |
| | | Common Stock and
Additional Paid-in Capital | | Retained
Earnings | | Treasury
Stock | | AOCI,
Net of Tax | | Total
Stockholders’
Equity |
| | | Shares | | Amount | | | | |
| BALANCE, JANUARY 1, 2018 | | 144,543,060 |
| | $ | 1,755,495 |
| | $ | 2,576,302 |
| | $ | (452,327 | ) | | $ | (37,519 | ) | | $ | 3,841,951 |
|
Cumulative effect of change in accounting principle related to marketable equity securities (1) | | — |
| | — |
| | (545 | ) | | — |
| | 385 |
| | (160 | ) |
Reclassification of tax effects in AOCI resulting from the new federal corporate income tax rate (2) | | — |
| | — |
| | 6,656 |
| | — |
| | (6,656 | ) | | — |
|
| Net income | | — |
| | — |
| | 359,381 |
| | — |
| | — |
| | 359,381 |
|
| Other comprehensive loss | | — |
| | — |
| | — |
| | — |
| | (27,677 | ) | | (27,677 | ) |
| Net activity of common stock pursuant to various stock compensation plans and agreements | | 361,569 |
| | 14,543 |
| | — |
| | (15,161 | ) | | — |
| | (618 | ) |
| Cash dividends on common stock ($0.40 per share) | | — |
| | — |
| | (58,593 | ) | | — |
| | — |
| | (58,593 | ) |
| BALANCE, JUNE 30, 2018 | | 144,904,629 |
| | $ | 1,770,038 |
| | $ | 2,883,201 |
| | $ | (467,488 | ) | | $ | (71,467 | ) | | $ | 4,114,284 |
|
| BALANCE, JANUARY 1, 2019 | | 144,961,363 |
| | $ | 1,789,977 |
| | $ | 3,160,132 |
| | $ | (467,961 | ) | | $ | (58,174 | ) | | $ | 4,423,974 |
|
Cumulative effect of change in accounting principle related to leases (3) | | — |
| | — |
| | 14,668 |
| | — |
| | — |
| | 14,668 |
|
| Net income | | — |
| | — |
| | 314,404 |
| | — |
| | — |
| | 314,404 |
|
| Other comprehensive income | | — |
| | — |
| | — |
| | — |
| | 48,202 |
| | 48,202 |
|
| Warrants exercised | | 180,226 |
| | 1,711 |
| | — |
| | 2,732 |
| | — |
| | 4,443 |
|
| Net activity of common stock pursuant to various stock compensation plans and agreements | | 404,980 |
| | 17,374 |
| | — |
| | (14,169 | ) | | — |
| | 3,205 |
|
| Cash dividends on common stock ($0.505 per share) | | — |
| | — |
| | (74,303 | ) | | — |
| | — |
| | (74,303 | ) |
| BALANCE, JUNE 30, 2019 | | 145,546,569 |
| | $ | 1,809,062 |
| | $ | 3,414,901 |
| | $ | (479,398 | ) | | $ | (9,972 | ) | | $ | 4,734,593 |
|
| |
|
| | | | | | | | | | | | | | | | | | | | | | | |
| |
| | | Common Stock and
Additional Paid-in Capital | | Retained
Earnings | | Treasury
Stock | | AOCI,
Net of Tax | | Total
Stockholders’
Equity |
| | | Shares | | Amount | | | | |
| Balance, January 1, 2019 | | 144,961,363 |
| | $ | 1,789,977 |
| | $ | 3,160,132 |
| | $ | (467,961 | ) | | $ | (58,174 | ) | | $ | 4,423,974 |
|
Cumulative-effect of change in accounting principle related to leases (1) | | — |
| | — |
| | 14,668 |
| | — |
| | — |
| | 14,668 |
|
| Net income | | — |
| | — |
| | 164,024 |
| | — |
| | — |
| | 164,024 |
|
| Other comprehensive loss | | — |
| | — |
| | — |
| | — |
| | 25,191 |
| | 25,191 |
|
| Warrants exercised | | 180,226 |
| | 1,711 |
| | — |
| | 2,732 |
| | — |
| | 4,443 |
|
| Net activity of common stock pursuant to various stock compensation plans and agreements | | 359,712 |
| | 7,436 |
| | — |
| | (14,036 | ) | | — |
| | (6,600 | ) |
| Cash dividends on common stock ($0.23 per share) | | — |
| | — |
| | (33,770 | ) | | — |
| | — |
| | (33,770 | ) |
| BALANCE, MARCH 31, 2019 | | 145,501,301 |
| | $ | 1,799,124 |
| | $ | 3,305,054 |
| | $ | (479,265 | ) | | $ | (32,983 | ) | | $ | 4,591,930 |
|
| Balance, January 1, 2020 | | 145,625,385 |
| | $ | 1,826,512 |
| | $ | 3,689,377 |
| | $ | (479,864 | ) | | $ | (18,408 | ) | | $ | 5,017,617 |
|
Cumulative-effect of change in accounting principle related to credit losses (2) | | — |
| | — |
| | (97,967 | ) | | — |
| | — |
| | (97,967 | ) |
| Net income | | — |
| | — |
| | 144,824 |
| | — |
| | — |
| | 144,824 |
|
| Other comprehensive income | | — |
| | — |
| | — |
| | — |
| | 25,289 |
| | 25,289 |
|
| Net activity of common stock pursuant to various stock compensation plans and agreements | | 281,396 |
| | 7,272 |
| | — |
| | (7,609 | ) | | — |
| | (337 | ) |
| Repurchase of common stock pursuant to the Stock Repurchase Program | | (4,471,682 | ) | | — |
| | — |
| | (145,966 | ) | | — |
| | (145,966 | ) |
| Cash dividends on common stock ($0.275 per share) | | — |
| | — |
| | (40,475 | ) | | — |
| | — |
| | (40,475 | ) |
| BALANCE, MARCH 31, 2020 | | 141,435,099 |
| | $ | 1,833,784 |
| | $ | 3,695,759 |
| | $ | (633,439 | ) | | $ | 6,881 |
| | $ | 4,902,985 |
|
| |
| |
| (1) | Represents the impact of the adoption of Accounting Standards Update (“ASU”) 2016-01, Financial Instruments—Overall (Subtopic 825-10): Recognition and Measurement of Financial Assets and Financial Liabilities in the first quarter of 2018. |
| |
(2) | Represents amounts reclassified from AOCI to retained earnings due to the early adoption of ASU 2018-02, Income Statement — Reporting Comprehensive Income (Topic 220): Reclassification of Certain Tax Effects from Accumulated Other Comprehensive Income in the first quarter of 2018.
|
| |
(3) | Represents the impact of the adoption of ASU 2016-02, Leases (Topic 842) and subsequent related ASUs in the first quarter of 2019.
|
| |
| (2) | Represents the impact of the adoption of ASU 2016-13, Financial Instruments - Credit Losses (Topic 326) in the first quarter of 2020. Refer to Note 2 — CurrentSummary of Significant Accounting Developments and Note 11 —LeasesPolicies to the Consolidated Financial Statements in this Quarterly Report on Form 10-Q (“this Form 10-Q”) for additional information. |
See accompanying Notes to Consolidated Financial Statements.
6
EAST WEST BANCORP, INC. AND SUBSIDIARIES
CONSOLIDATED STATEMENT OF CASH FLOWS
($ in thousands)
(Unaudited)
| | | | | | Six Months Ended June 30, | | Three Months Ended March 31, |
| | | 2019 | | 2018 | | 2020 | | 2019 |
| CASH FLOWS FROM OPERATING ACTIVITIES | | | | | | | | |
| Net income | | $ | 314,404 |
| | $ | 359,381 |
| | $ | 144,824 |
| | $ | 164,024 |
|
| Adjustments to reconcile net income to net cash provided by operating activities: | | |
| | |
| | |
| | |
|
| Depreciation and amortization | | 72,113 |
| | 62,329 |
| | 31,186 |
| | 39,498 |
|
| Accretion of discount and amortization of premiums, net | | (9,817 | ) | | (9,910 | ) | | (4,519 | ) | | (4,414 | ) |
| Stock compensation costs | | 15,525 |
| | 13,215 |
| | 7,209 |
| | 7,444 |
|
| Deferred income tax (benefit) expense | | (2,110 | ) | | 1,320 |
| |
| Deferred income tax expense (benefit) | | | 28 |
| | (406 | ) |
| Provision for credit losses | | 41,824 |
| | 35,754 |
| | 73,870 |
| | 22,579 |
|
| Net gains on sales of loans | | (930 | ) | | (3,936 | ) | | (950 | ) | | (915 | ) |
| Net gains on sales of available-for-sale investment securities | | (3,008 | ) | | (2,339 | ) | |
| Net gains on sales of fixed assets | | — |
| | (2,200 | ) | |
| Net gain on sale of business | | — |
| | (31,470 | ) | |
| Net gains on sales of AFS debt securities | | | (1,529 | ) | | (1,561 | ) |
| Net loss on sales of fixed assets | | | 3 |
| | — |
|
| Loans held-for-sale: | | | | | | | | |
| Originations and purchases | | (3,339 | ) | | (11,547 | ) | | (5,802 | ) | | (2,167 | ) |
| Proceeds from sales and paydowns/payoffs of loans originally classified as held-for-sale | | 3,632 |
| | 10,759 |
| | 4,657 |
| | 2,454 |
|
| Proceeds from distributions received from equity method investees | | 1,538 |
| | 1,814 |
| | 973 |
| | 1,150 |
|
| Net change in accrued interest receivable and other assets | | (150,154 | ) | | (32,226 | ) | | (462,766 | ) | | (27,639 | ) |
| Net change in accrued expenses and other liabilities | | 10,320 |
| | 44,016 |
| | 304,680 |
| | (60,806 | ) |
| Other net operating activities | | 3 |
| | (93 | ) | | (161 | ) | | — |
|
| Total adjustments | | (24,403 | ) | | 75,486 |
| | (53,121 | ) | | (24,783 | ) |
| Net cash provided by operating activities | | 290,001 |
| | 434,867 |
| | 91,703 |
| | 139,241 |
|
| CASH FLOWS FROM INVESTING ACTIVITIES | | |
| | |
| | |
| | |
|
| Net (increase) decrease in: | | |
| | |
| | |
| | |
|
| Investments in qualified affordable housing partnerships, tax credit and other investments | | (61,555 | ) | | (41,444 | ) | | (27,581 | ) | | (33,261 | ) |
| Interest-bearing deposits with banks | | 222,387 |
| | 28,525 |
| | (115,419 | ) | | 245,375 |
|
| Resale agreements: | | | | | | | | |
| Proceeds from paydowns and maturities | | 50,000 |
| | 175,000 |
| | 250,000 |
| | — |
|
| Purchases | | (25,000 | ) | | (100,000 | ) | |
| Available-for-sale investment securities: | | | | | |
| AFS debt securities: | | | | | |
| Proceeds from sales | | 375,102 |
| | 256,875 |
| | 306,463 |
| | 151,339 |
|
| Proceeds from repayments, maturities and redemptions | | 117,325 |
| | 211,303 |
| | 308,620 |
| | 55,712 |
|
| Purchases | | (316,740 | ) | | (235,360 | ) | | (987,130 | ) | | (69,805 | ) |
| Loans held-for-investment: | | | | | | | | |
| Proceeds from sales of loans originally classified as held-for-investment | | 170,174 |
| | 274,785 |
| | 110,945 |
| | 92,887 |
|
| Purchases | | (326,456 | ) | | (389,912 | ) | | (133,185 | ) | | (147,938 | ) |
| Other changes in loans held-for-investment, net | | (1,196,094 | ) | | (1,147,156 | ) | | (1,116,358 | ) | | (409,930 | ) |
| Premises and equipment: | | |
| | |
| | |
| | |
|
| Purchases | | (4,414 | ) | | (7,612 | ) | | (916 | ) | | (3,336 | ) |
| Payment on sale of business, net of cash transferred | | — |
| | (503,687 | ) | |
| Proceeds from sales of other real estate owned (“OREO”) | | — |
| | 3,595 |
| | 295 |
| | — |
|
| Proceeds from distributions received from equity method investees | | 3,636 |
| | 1,725 |
| | 374 |
| | 1,005 |
|
| Other net investing activities | | (5,516 | ) | | (2,200 | ) | | (1,438 | ) | | (729 | ) |
| Net cash used in investing activities | | (997,151 | ) | | (1,475,563 | ) | | (1,405,330 | ) | | (118,681 | ) |
| CASH FLOWS FROM FINANCING ACTIVITIES | | |
| | |
| | |
| | |
|
| Net increase in deposits | | 1,035,650 |
| | 1,195,796 |
| | 1,374,287 |
| | 800,053 |
|
| Net (decrease) increase in short-term borrowings | | (38,107 | ) | | 59,895 |
| |
| Net increase (decrease) in short-term borrowings | | | 39,962 |
| | (19,514 | ) |
| FHLB advances: | | | | | | | | |
| Proceeds | | 1,500,000 |
| | — |
| | — |
| | 300,000 |
|
| Repayment | | (1,082,000 | ) | | — |
| | (99,999 | ) | | (282,000 | ) |
| Repayment of long-term debt and finance lease liabilities | | (435 | ) | | (10,000 | ) | |
| Repayment of long-term debt and lease liabilities | | | (289 | ) | | (217 | ) |
| Common stock: | | | | | | | | |
| Proceeds from issuance pursuant to various stock compensation plans and agreements | | 1,894 |
| | 1,328 |
| |
| Stock tendered for payment of withholding taxes | | (14,169 | ) | | (15,161 | ) | |
| Repurchase of common stock pursuant to the Stock Repurchase Program | | | (145,966 | ) | | — |
|
| Stocks tendered for payment of withholding taxes | | | (7,609 | ) | | (14,036 | ) |
| Cash dividends paid | | (74,949 | ) | | (59,243 | ) | | (41,358 | ) | | (34,916 | ) |
| Net cash provided by financing activities | | 1,327,884 |
| | 1,172,615 |
| | 1,119,028 |
| | 749,370 |
|
| Effect of exchange rate changes on cash and cash equivalents | | (497 | ) | | (9,040 | ) | | 13,492 |
| | 14,018 |
|
| NET INCREASE IN CASH AND CASH EQUIVALENTS | | 620,237 |
| | 122,879 |
| |
| NET (DECREASE) INCREASE IN CASH AND CASH EQUIVALENTS | | | (181,107 | ) | | 783,948 |
|
| CASH AND CASH EQUIVALENTS, BEGINNING OF PERIOD | | 3,001,377 |
| | 2,174,592 |
| | 3,261,149 |
| | 3,001,377 |
|
| CASH AND CASH EQUIVALENTS, END OF PERIOD | | $ | 3,621,614 |
| | $ | 2,297,471 |
| | $ | 3,080,042 |
| | $ | 3,785,325 |
|
|
See accompanying Notes to Consolidated Financial Statements.
7
EAST WEST BANCORP, INC. AND SUBSIDIARIES
CONSOLIDATED STATEMENT OF CASH FLOWS
($ in thousands)
(Unaudited)
(Continued)
| | | | | | Six Months Ended June 30, | | Three Months Ended March 31, |
| | | 2019 | | 2018 | | 2020 | | 2019 |
| SUPPLEMENTAL CASH FLOW INFORMATION | | | | | | | | |
| Cash paid during the period for: | | | | | | | | |
| Interest | | $ | 203,577 |
| | $ | 99,176 |
| | $ | 88,520 |
| | $ | 97,930 |
|
| Income taxes, net | | $ | 76,153 |
| | $ | 67,431 |
| | $ | 2,904 |
| | $ | 303 |
|
| Noncash investing and financing activities: | | |
| | |
| | | | |
| Loans transferred from held-for-investment to held-for-sale | | $ | 173,394 |
| | $ | 285,631 |
| | $ | 110,223 |
| | $ | 92,228 |
|
| Loans transferred to OREO | | | $ | 19,504 |
| | $ | — |
|
| | | | | | |
See accompanying Notes to Consolidated Financial Statements.
8
EAST WEST BANCORP, INC. AND SUBSIDIARIES
NOTES TO CONSOLIDATED FINANCIAL STATEMENTS
(Unaudited)
Note 1 — Basis of Presentation
East West Bancorp, Inc. (referred to herein on an unconsolidated basis as “East West” and on a consolidated basis as the “Company”) is a registered bank holding company that offers a full range of banking services to individuals and businesses through its subsidiary bank, East West Bank and its subsidiaries (“East West Bank” or the “Bank”). The unaudited interim Consolidated Financial Statements in this Form 10-Q include the accounts of East West, East West Bank and East West’s subsidiaries. Intercompany transactions and accounts have been eliminated in consolidation. As of June 30, 2019,March 31, 2020, East West also has six6 wholly-owned subsidiaries that are statutory business trusts (the “Trusts”). In accordance with Financial Accounting Standards Board (“FASB”) Accounting Standards Codification (“ASC”) Topic 810, Consolidation, the Trusts are not included on the Consolidated Financial Statements. East West also owns East West Insurance Services, Inc. (“EWIS”). In the third quarter of 2017, the Company sold the insurance brokerage business of EWIS, which remains a subsidiary of East West and continues to maintain its insurance broker license. In the first quarter of 2019, the Company acquired Enstream Capital Markets, LLC, a non-publicprivate broker dealer entity, asand also established East West Investment Management LLC, a registered investment adviser. Both East West Markets, LLC and East West Investment Management LLC are wholly-owned subsidiarysubsidiaries of the Company.East West.
The unaudited interim Consolidated Financial Statements are presented in accordance with United States (“U.S.”) generally accepted accounting principles (“GAAP”), applicable guidelines prescribed by regulatory authorities, and general practices in the banking industry. They reflect all adjustments that, in the opinion of management, are necessary for fair statement of the interim period Consolidated Financial Statements. Certain items on the Consolidated Financial Statements and notes for the prior periods have been reclassified to conform to the current period presentation.
The current period’s results of operations are not necessarily indicative of results that may be expected for any other interim period or for the year as a whole. While the COVID-19 outbreak had a material impact on our provision for credit losses, the Company is unable to fully predict the impact that COVID-19 will have on its financial position and results of operations due to numerous uncertainties, and will continue to assess the potential impacts on its financial position and results of operations. Events subsequent to the Consolidated Balance Sheet date have been evaluated through the date the Consolidated Financial Statements are issued for inclusion in the accompanying Consolidated Financial Statements. The unaudited interim Consolidated Financial Statements should be read in conjunction with the audited Consolidated Financial Statements and notes thereto, included in the Company’s annual report on Form 10-K for the year ended December 31, 2018,2019, filed with the United StatesU.S. Securities and Exchange Commission on February 27, 20192020 (the “Company’s 20182019 Form 10-K”).
Note 2 — Current Accounting Developments and Summary of Significant Accounting Policies
New Accounting Pronouncements Adopted
|
| | | |
| Standard | Required Date of Adoption | Description | Effect on Financial Statements |
Standards Adopted in 2019 |
ASU 2016-02, Leases (Topic 842) and subsequent related ASUs
| January 1, 2019 for leases standards other than ASU 2019-01.
January 1, 2020 for ASU 2019-01
Early adoption is permitted.
| ASC Topic 842, Leases, supersedes ASC Topic 840, Leases. This ASU requires lessees to recognize right-of-use assets and related lease liabilities for all leases with lease terms of more than 12 months on the Consolidated Balance Sheet, and provide quantitative and qualitative disclosures regarding key information about the leasing arrangements. For short-term leases with a term of 12 months or less, lessees can make a policy election not to recognize lease assets and lease liabilities. The recognition, measurement and presentation of expenses and cash flows arising from a lease by a lessee primarily will depend on its classification as a finance or operating lease. Lessee accounting for finance leases, as well as lessor accounting are largely unchanged. The standard may be adopted using a modified retrospective approach through a cumulative-effect adjustment. In addition, the FASB issued ASU 2018-11, Leases (Topic 842) Targeted Improvements, which provides companies the option to continue to apply the legacy guidance in ASC 840, Leases, including its disclosure requirements, in the comparative periods presented in the year they adopt ASU 2016-02. Companies that elect this transition option can recognize a cumulative-effect adjustment to the opening balance of retained earnings in the period of adoption rather than in the earliest period presented.
| The Company adopted all the new lease standards on January 1, 2019 using the alternative transition method, which allows the adoption of the accounting standard prospectively without revising comparable prior periods’ financial information.
On January 1, 2019, the Company recognized $109.1 million and $117.7 million increase in right-of-use assets and associated lease liabilities, respectively, based on the present value of the expected remaining operating lease payments. In addition, the Company also recognized a cumulative-effect adjustment of $14.7 million to increase beginning balance of retained earnings as of January 1, 2019 related to the deferred gains on our prior sale and leaseback transactions that occurred prior to the date of adoption. The adoption of the new leases standards did not have a material impact on the Company’s Consolidated Statement of Income. Disclosures related to leases are included in Note 11 — Leases to the Consolidated Financial Statements in this Form 10-Q.
|
ASU 2018-16, Derivatives and Hedging (Topic 815): Inclusion of the Secured Overnight Financing Rate (“SOFR”) Overnight Index Swap (“OIS”) Rate as a Benchmark Interest Rate for Hedge Accounting Purposes
| January 1, 2019
Early adoption (including adoption in an interim period) is permitted for entities that already adopted ASU 2017-12. | This ASU amends ASC Topic 815, Derivatives and Hedging, by adding the OIS rate based on SOFR to the list of United States (“U.S.”) benchmark interest rates that are eligible to be hedged to facilitate the London Interbank Offered Rate to SOFR transition. The guidance should be applied prospectively for qualifying new or redesignated hedging relationships entered into on or after the date of adoption.
| The Company adopted ASU 2018-16 prospectively on January 1, 2019. The adoption of this guidance did not impact existing hedges but may impact new hedge relationships that are benchmarked against the SOFR OIS rate. |
Recent Accounting Pronouncements
|
| | | |
Standard | Required Date of Adoption | Description | Effect on Financial Statements |
Standards Not Yet Adopted |
ASU 2016-13, Financial Instruments — Credit Losses (Topic(Topic 326): Measurement of Credit Losses on Financial Instrumentsand subsequent related ASUs | January 1, 2020
Early adoption is permitted on January 1, 2019.
| The ASU introduces a new current expected credit loss (“CECL”) impairment model that applies to most financial assets measured at amortized cost and certain other instruments, including trade and other receivables, loan receivables, available-for-saleAFS and held-to-maturity debt securities, net investments in leases and off-balance sheet credit exposures. The CECL model utilizes a lifetime “expected credit loss” measurement objective for the recognition of credit losses at the time the financial asset is originated or acquired. The expected credit losses are adjusted in each period for changes in expected lifetime credit losses. ASU 2016-13 also eliminates the guidance for purchased credit impaired (“PCI”) loans, but requires an allowance for loan losses for purchased financial assets with more than an insignificant deterioration of credit since origination. The ASU also modifies the other-than-temporary impairment (“OTTI”) model for AFS debt securities to require an allowance for credit losses instead of a direct write-down. A reversal of the allowance for credit losses is allowed in future periods based on improvements in credit performance expectations. This ASU also expands the disclosure requirements regarding an entity’s assumptions, models and methods for estimating the allowance for loan and lease losses, and requires disclosure of the amortized cost balance for each class of financial asset by credit quality indicator, disaggregated by the year of origination (i.e., by vintage year). The guidance should be applied using a modified retrospective approach through a cumulative-effect adjustment to retained earnings as of the beginning of the reporting period of adoption.
In April 2019, the FASB issued ASU 2019-04, Codification Improvements to Topic 326, Financial Instruments-Credit Losses, Topic 815, Derivatives and Hedging, and Topic 825, Financial Instruments, which clarifies The new guidance also allows optional relief for certain aspects of accounting for credit losses, hedging activities, and financial instruments. The amendments related to credit losses (addressed by ASU 2016-13) clarify the scope of the credit losses standard and address issues related to accrued interest receivable balances, recoveries, variable interest rates, prepayments and contractual extensions and renewals, among other things.
In May 2019, the FASB issued ASU 2019-05, Financial Instruments-Credit Losses (Topic 326), which amends ASU 2016-13 to allow companiesinstruments measured at amortized cost with an option to irrevocably elect upon adoption of ASU 2016-13, the fair value option on financial instruments that were previously recorded at amortized cost and are within the scope of ASC 326-20 if the instruments are eligible for the fair value option under ASC 825-10.Topic 825,
| The Company’s implementation efforts include, but are not limited to, identifying and evaluating key interpretive issues, assessing, and modifying system and process requirements against the new guidance. The Company has completed model development and is undergoing validation and implementation. Additionally, the Company has started to analyze model results, review qualitative factors and update the allowance documentation. The Company will continue to address any gaps from recently issued interpretations and in data and operational processes arising from internal reviews, model validation and parallel runs during the second half of 2019.
The Company expects to adopt thisadopted ASU 2016-13 using a modified retrospective approach on January 1, 2020 without electing the fair value option on eligible financial instruments. Whileinstruments under ASU 2019-05. The Company has completed its implementation efforts, which includes the Company is still evaluatingimplementation of new processes and controls over the impact on its Consolidated Financial Statements,new credit and loss aggregation models, completion of parallel runs, updates to the Company expects thatallowance documentation, policies and reporting processes.
The adoption of this ASU may result inincreased the allowance for loan losses by $125.2 million, and allowance for unfunded credit commitments by $10.5 million. The Company also recorded an after-tax decrease to opening retained earnings of $98.0 million on January 1, 2020. The increase into allowance for loan losses was primarily related to the commercial and industrial (“C&I”) and commercial real estate (“CRE”) loan portfolios. The Company did not record an allowance for credit losses due to the following factors: 1) the allowance for credit losses provides for expected credit losses over the remaining expected life of the loan portfolio and 2) the nonaccretable difference on the purchased credit-impaired (“PCI”) loans willCompany’s AFS debt securities as a result of this adoption. Disclosures for periods after January 1, 2020 are presented in accordance with ASC 326 while prior period amounts continue to be recognized as an allowance, offset by an increasereported in accordance with previously applicable standards and the accounting policies described in the carrying valueCompany’s 2019 Form 10-K.
The Company has elected the CECL phase-in option provided by regulatory capital rules, which delays the impact of the PCI loans. The ultimate effect of this ASU will also dependCECL on the composition and credit quality of the portfolio and economic conditions at the time of adoption.regulatory capital for two years, followed by a three-year transition period. |
ASU 2017-04, Intangibles — Goodwill and Other(Topic (Topic 350): : Simplifying the Test for Goodwill Impairment | January 1, 2020
Early adoption is permitted for interim or annual goodwill impairment tests with measurement dates after January 1, 2017. | The ASU simplifies the accounting for goodwill impairment. Under this guidance, an entity will no longer perform a hypothetical purchase price allocation to measure goodwill impairment. Instead, an impairment loss will be recognized when the carrying amount of a reporting unit exceeds its fair value. The guidance also eliminates the requirement to perform a qualitative assessment for any reporting units with a zero or negative carrying amount. This guidance should be applied prospectively. | The Company does not expect theadopted this guidance on January 1, 2020. The adoption of this guidance todid not have a material impact on the Company’s Consolidated Financial Statements. The Company expects to adopt this ASU |
New Accounting Pronouncements Adopted
|
| | | |
| Standard | Required Date of Adoption | Description | Effect on January 1, 2020.Financial Statements |
| Standards Adopted in 2020 |
ASU 2018-15,Intangibles — Goodwill and Other — Internal-Use Software (Subtopic(Subtopic 350-40) Customer’s Accounting for Implementation Costs Incurred in a Cloud Computing Arrangement That Is a Service Contract | January 1, 2020
Early adoption is permitted. | The ASU amends ASC Topic 350-40 to align the accounting for costs incurred in a cloud computing arrangement with the guidance on developing internal use software. Specifically, if a cloud computing arrangement is deemed to be a service contract, certain implementation costs are eligible for capitalization. The new guidance prescribes the balance sheet and income statement presentation and cash flow classification for the capitalized costs and related amortization expense. The amendments in this ASU should be applied either retrospectively or prospectively to all implementation costs incurred after the date of adoption. | The Company does not expect theadopted this guidance on a prospective basis on January 1, 2020. The adoption of this guidance todid not have a material impact on the Company’s Consolidated Financial Statements. |
Recent Accounting Pronouncements
|
| | | |
| Standard | Required Date of Adoption | Description | Effect on Financial Statements |
| Standard Not Yet Adopted |
ASU 2020-04, Reference Rate Reform (Topic 848): Facilitation of the Effects of Reference Rate Reform on Financial Reporting
| Effective for all entities as of March 12, 2020 through December 31, 2022. | In March 2020, the FASB issued a new accounting standard related to contracts or hedging relationships that reference LIBOR or other reference rates that are expected to be discontinued due to reference rate reform. This ASU provide optional expedients and exceptions regarding the accounting related to the modification of certain contracts, hedging relationships and other transactions that are affected by the reference rate reform. The guidance permits the Company not to apply modification accounting or remeasure lease payments in lease contracts if the changes to the contract are related to the discontinuation of the reference rate. If certain criteria are met, the amendments also allow exceptions to the dedesignation criteria of the hedging relationship and the assessment of hedge effectiveness during the transition period. This one time election may be made at any time after March 12, 2020, but no later than December 31, 2022. | The Company expectshas not yet made a determination on whether it will make this election and is currently tracking the exposure as of each reporting period and assessing the significance of impact towards implementing any necessary modification in consideration of the election of this amendment. We will continue to adopt this ASU on January 1, 2020.assess the impact as the reference rate transition occurs over the next two years. |
Summary of Significant Accounting Policies
Note 3 — DispositionsThe Company has revised the following significant accounting policies as a result of the adoption of ASU 2016-13.
On March 17, 2018,Allowance for Loan Losses — The allowance for loan losses is established as management’s estimate of expected credit losses inherent in the Bank completedCompany’s lending activities and increased by the saleprovision for credit losses and decreased by net charge-offs. Subsequent recoveries, if any, are credited to the allowance for loan losses. The allowance for loan losses is evaluated quarterly by management based on periodic review of the collectability of the loans, and more often if deemed necessary. The Company develops and documents the allowance for loan losses methodology at the portfolio segment level —commercial loan portfolio comprising C&I, CRE, multifamily residential, and construction and land loans; and the consumer loan portfolio comprising single-family residential, home equity lines of credit (“HELOC”) and other consumer loans.
The allowance for loan losses represents the portion of the loan’s amortized cost basis that the Company does not expect to collect due to anticipated credit losses over the loan’s contractual life. The Company measures the expected loan losses on a collective pool basis when similar risk characteristics exist. Models consisting of quantitative and qualitative components are designed for each pool to develop the expected credit loss estimates. Reasonable and supportable forecast periods vary by loan portfolio. The collectively evaluated loans include non-classified and classified loans that have been determined as not impaired. The Company has adopted lifetime loss rate models for the portfolios, which use historical loss rates and forecast economic variables to calculate the expected credit losses for each loan pool.
When the loans do not share similar risk characteristics, the Company evaluates the loan for expected credit losses on an individual basis (e.g., impaired loans). The Company considers loans to be impaired if, based on current information and events, it is probable that the Company will be unable to collect all amounts due according to the original contractual terms of the loan agreement. For loans determined to be impaired, three different asset valuation measurement methods are available: (1) the present value of expected future cash flows, (2) the fair value of collateral less costs to sell, and (3) the loan's observable market price. The allowance for loan losses for collateral-dependent loans is determined based on the fair value of the collateral less costs to sell. For loans that are not collateral-dependent, the Company applies the present value of expected future cash flows valuation or the market value of the loan. When the loan is deemed uncollectible, the Company’s policy is to promptly charge off the estimated impaired amount.
The amortized cost of loans held-for-investment excludes accrued interest, which is included in Other assets on the Consolidated Balance Sheet. The Company has made an accounting policy election not to recognize an allowance for credit losses for accrued interest receivables on nonaccrual loans since the Company timely reverses any previously accrued interest when the borrower remains in default for an extended period.
The allowance for loan losses is reported separately on the Consolidated Balance Sheet and the Provision for credit losses is reported on the Consolidated Statement of Income.
Allowance for Unfunded Credit Commitments — The allowance for unfunded credit commitments includes reserves provided for unfunded loan commitments, letters of credit, standby letters of credit (“SBLCs”) and recourse obligations for loans sold. The Company estimates the allowance for unfunded credit commitments over the contractual period in which the entity is exposed to credit risk via a present contractual obligation to extend credit. Within the period of credit exposure, the estimate of credit losses will consider both the likelihood that funding will occur, and an estimate of the expected credit losses on the commitments that are expected to fund over their estimated lives.
The allowance for unfunded credit commitments is maintained at a level believed by management to be sufficient to absorb estimated expected credit losses related to unfunded credit facilities. The determination of the adequacy of the allowance is based on periodic evaluations of the unfunded credit facilities. For all off-balance-sheet instruments and commitments, including unfunded lending commitments, letters of credit, SBLCs and recourse obligations for loans sold, the unfunded credit exposure is calculated using utilization assumptions based on the Company's historical utilization experience in related portfolio segments. Loss rates are applied to the calculated exposure balances to estimate the allowance for unfunded credit commitments. Other elements such as credit risk factors for loans outstanding, terms and expiration dates of the unfunded credit facilities, and other pertinent information are considered to determine the adequacy of the allowance.
The allowance for unfunded credit commitments is included in Accrued expenses and other liabilities on the Consolidated Balance Sheet. Changes to the allowance for unfunded credit commitments are included in Provision for credit losses on the Consolidated Income Statements.
Allowance for Credit Losses on Available-for-Sale Debt Securities — ASU 2016-13 modifies the impairment model for AFS debt securities. For each reporting period, AFS debt securities that are in an unrealized loss position are individually analyzed as part of the Company’s ongoing assessments to determine whether a decline in fair value below the amortized cost basis has resulted from a credit loss or other factors. The initial indicator of impairment is a decline in fair value below the amortized cost, excluding accrued interest, of the AFS debt security. In determining whether an impairment is due to credit related factors, the Company considers the severity of the decline in fair value, the financial condition of the issuer, changes in the AFS debt securities’ ratings and other qualitative factors, as well as whether the Company either plans to sell the debt security or it is more-likely-than-not that it will be required to sell the debt security before recovery of the amortized cost. ASU 2016-13 removes the ability to consider the length of time the debt security has been in an unrealized loss position as a factor, either by itself or in combination with other factors, to conclude that a credit loss does not exist.
When the Company does not intend to sell the impaired AFS debt security and it is more-likely-than-not that the Company will not be required to sell the impaired debt security prior to recovery of its eight Desert Community Bank (“DCB”) branches located inamortized cost basis, the High Desert area of Southern California to Flagstar Bank, a wholly-owned subsidiary of Flagstar Bancorp, Inc. The assets and liabilitiescredit component of the DCB branches that were soldunrealized loss of the impaired AFS debt security is recognized as an allowance for credit losses, with a corresponding Provision for credit losses on the Consolidated Statement of Income and the non-credit component is recognized in this transaction primarily consistedOther comprehensive income (loss), net of $613.7 million of deposits, $59.1 million of loans, $9.0 million of cash and cash equivalents and $7.9 million of premises and equipment. The transaction resulted in a net cash payment of $499.9 million byapplicable taxes. At each reporting period, the Company increases or decreases the allowance for credit losses as appropriate, while limiting reversals of the allowance for credit losses to Flagstar Bank. After transaction costs, the sale resulted inextent of the amounts previously recorded. If the Company intends to sell the impaired debt security or it is more-likely-than-not that the Company will be required to sell the impaired debt security prior to recovering its amortized cost basis, the entire impairment amount is recognized as an adjustment to the debt security’s amortized cost basis, with a pre-tax gain of $31.5 millioncorresponding Provision for the six months ended June 30, 2018, which was reported as Net gain on sale of businesscredit losses on the Consolidated Statement of Income.
The amortized cost of the Company’s AFS debt securities excludes accrued interest, which is included in Other assets on the Consolidated Balance Sheet. The Company has made an accounting policy election not to measure an allowance for credit losses for accrued interest receivables on AFS debt securities since the Company timely reverses any previously accrued interest when the debt security remains in default for an extended period. As each AFS debt security has a unique security structure, where the accrual status is clearly determined when certain criteria listed in the terms are met, the Company assesses the default status of each security as defined by the debt security’s specific security structure.
Collateral-Dependent Financial Assets— A financial asset is considered collateral-dependent if repayment is expected to be provided substantially through the operation or sale of the collateral. The allowance for credit losses is measured on an individual basis for collateral-dependent financial assets and determined by comparing the fair value of the collateral, minus the cost to sell, to the amortized cost basis of the related financial asset at the reporting date. Other than impaired loans, collateral-dependent financial assets could also include resale agreements. In arrangements in which the borrower must continually adjust the collateral securing the asset to reflect changes in the collateral’s fair value (e.g., resale agreements), the Company estimates the expected credit losses on the basis of the unsecured portion of the amortized cost as of the balance sheet date. If the fair value of the collateral is equal to or greater than the amortized cost of the resale agreement, the expected losses would be zero. If the fair value of the collateral is less than the amortized cost of the asset, the expected losses are limited to the difference between the fair value of the collateral and the amortized cost basis of the resale agreement.
Purchased Credit Deteriorated Assets — ASU 2016-13 replaces the concept of PCI accounting under ASC 310-30 Receivables - Loans and Debt Securities Acquired with Deteriorated Credit Quality with the concept of purchased financial assets with credit deterioration (“PCD”). The Company adopted ASU 2016-13 using the prospective transition approach for PCD that were previously classified as PCI assets. PCD financial assets are defined as acquired individual financial assets (or groups with similar risk characteristics) that as of the date of acquisition, have experienced a more-than-insignificant deterioration in credit quality since origination. For PCD debt securities and PCD loans, the company records the allowance for credit losses by grossing up the initial amortized cost, which includes the purchase price and the allowance for credit losses. The expected credit losses of PCD debt securities are measured at the individual security level. The expected credit losses for PCD loans are measured based on the loan’s unpaid principal balance. Beginning January 1, 2020, for any asset designated as a PCD asset at the time of acquisition, the Company estimates and records an allowance for credit losses, which is added to the purchase price to establish the initial amortized cost basis of the financial asset. Hence, there is no income statement impact on the acquisition. Subsequent changes in the allowance for credit losses on PCD assets will be recognized in Provision for credit losses on the Consolidated Statement of Income. The noncredit discount or premium will be accreted to interest income based on the effective interest rate on the PCD assets determined after the gross-up for the allowance for credit losses.
Note 43 — Fair Value Measurement and Fair Value of Financial Instruments
Fair Value Determination
Fair value is defined as the price that would be received to sell an asset or the price that would be paid to transfer a liability in an orderly transaction between market participants at the measurement date. In determining the fair value of financial instruments, the Company uses various methods including market and income approaches. Based on these approaches, the Company utilizes certain assumptions that market participants would use in pricing an asset or a liability. These inputs can be readily observable, market corroborated or generally unobservable. The Company utilizes valuation techniques that maximize the use of observable inputs and minimize the use of unobservable inputs. The fair value hierarchy noted below is based on the quality and reliability of the information used to determine fair value. The fair value hierarchy gives the highest priority to quoted prices available in active markets and the lowest priority to data lacking transparency. The fair value of the Company’s assets and liabilities is classified and disclosed in one of the following three categories:
Level 1 — Valuation is based on quoted prices for identical instruments traded in active markets.
Level 2 — Valuation is based on quoted prices for similar instruments traded in active markets; quoted prices for identical or similar instruments traded in markets that are not active; and model-derived valuations whose inputs are observable and can be corroborated by market data.
Level 3 — Valuation is based on significant unobservable inputs for determining the fair value of assets or liabilities. These significant unobservable inputs reflect assumptions that market participants may use in pricing the assets or liabilities.
The classification of assets and liabilities within the hierarchy is based on whether inputs to the valuation methodology used are observable or unobservable, and the significance of those inputs in the fair value measurement. The Company’s assets and liabilities are classified in their entirety based on the lowest level of input that is significant to their fair value measurements.
Assets and Liabilities Measured at Fair Value on a Recurring Basis
The following section describes the valuation methodologies used by the Company to measure financial assets and liabilities on a recurring basis, as well as the general classification of these instruments pursuant to the fair value hierarchy.
Available-for-Sale InvestmentDebt Securities — When available, the Company uses quoted market prices to determine the fair value of available-for-sale investmentAFS debt securities, which are classified as Level 1. Level 1 available-for-sale investmentAFS debt securities are primarily comprised of U.S. Treasury securities. The fair value of other available-for-sale investmentAFS debt securities is generally determined by independent external pricing service providers who have experience in valuing these securities or by taking the average quoted market prices obtained from independent external brokers. The valuations provided by the third-party pricing service providers are based on observable market inputs, which include benchmark yields, reported trades, issuer spreads, benchmark securities, bids, offers, prepayment expectation and reference data obtained from market research publications. Inputs used by the third-party pricing service providers in valuing collateralized mortgage obligations and other securitization structures also include new issue data, monthly payment information, whole loan collateral performance, tranche evaluation and “To Be Announced” prices. In valuations ofvaluing securities issued by state and political subdivisions, inputs used by the third-party pricing service providers also include material event notices.
On a monthly basis, the Company validates the pricingvaluations provided by the third-party pricing service providers to ensure that the fair value determination is consistent with the applicable accounting guidance and the assetsfinancial instruments are properly classified in the fair value hierarchy. To perform this validation, the Company evaluates the fair values of securities by comparing the fair values provided by the third-party pricing service providers to prices from other available independent sources for the same securities. When variances in prices are identified, the Company further compares inputs used by different sources to ascertain the reliability of these sources. On a quarterly basis, the Company reviews the documentation received from the third-party pricing service providers regarding the valuation inputs and methodology used for each category of securities.
TheWhen pricing is unavailable from third-party pricing service providers may not provide pricing for all securities. Under such circumstances,certain securities, the Company requests market quotes from various independent external brokers and utilizes the average quoted market quotes.prices. These valuations are viewed asbased on observable inputs in the current marketplace and are classified as Level 2. The Company periodically communicates with the independent external brokers to validate their pricing methodology. Information such as pricing sources, pricing assumptions, data inputs and valuation technique are reviewed.
Equity Securities — Equity securities were comprisedconsisted of mutual funds as of both June 30, 2019March 31, 2020 and December 31, 2018.2019. The Company uses net asset valueNet Asset Value (“NAV”) information to determine the fair value of these equity securities. When NAV is available periodically and the equity securities can be put back to the transfer agents at the publicly available NAV, the fair value of the equity securities is classified as Level 1. When NAV is available periodically but the equity securities may not be readily marketable at its periodic NAV in the secondary market, the fair value of these equity securities is classified as Level 2.
Interest Rate Contracts — The Company enters into interest rate swap and option contracts with its borrowers to lock in attractive intermediate and long-term interest rates, resulting in the customer obtaining a synthetic fixed ratefixed-rate loan. To economically hedge against the interest rate risks in the products offered to its customers, the Company enters into mirrored offsetting interest rate contracts with third-party financial institutions. The Company also enters into interest rate swap contracts with institutional counterparties to hedge against certificates of deposit issued. The fair value of the interest rate swaps is determined using the market standard methodology of netting the discounted future fixed cash payments (or receipts) and the discounted expected variable cash receipts (or payments). The fair value of the interest rate options, which consist of floors and caps, is determined using the market standard methodology of discounting the future expected cash receipts that would occur if variable interest rates fall below (rise above) the strike rate of the floors (caps). In addition, to comply with the provisions of ASC 820, Fair Value Measurement, the Company incorporates credit valuation adjustments to appropriately reflect both its own nonperformance risk and the respective counterparty’s nonperformance risk in the fair value measurements of its derivatives. The credit valuation adjustments associated with the Company’s derivatives utilize model-derived credit spreads, which are Level 3 inputs. As of June 30, 2019March 31, 2020 and December 31, 2018,2019, the Company has assessed the significance of the impact of the credit valuation adjustments on the overall valuation of these interest rate contracts and has determined that the credit valuation adjustments arewere not significant to the overall valuation of its derivative portfolios. As a result, the Company classifies these derivative instruments as Level 2 due to the observable nature of the significant inputs utilized.
Foreign Exchange Contracts — The Company enters into foreign exchange contracts to accommodate the business needs of its customers. For a majority of the foreign exchange contracts entered into with its customers, the Company entered into offsetting foreign exchange contracts with third-party financial institutions to manage its exposure. The Company also utilizes foreign exchange contracts that are not designated as hedging instruments to mitigate the economic effect of fluctuations in certain foreign currency on-balance sheet assets and liabilities, primarily foreign currency denominated deposits that it offers to its customers. The fair value is determined at each reporting period based on changes in the foreign exchange rates. These are over-the-counter contracts where quoted market prices are not readily available. Valuation is measured using conventional valuation methodologies with observable market data. Due to the short-term nature of the majority of these contracts, the counterparties’ credit risks are considered nominal and result in no adjustments to the valuation of the foreign exchange contracts. Due to the observable nature of the inputs used in deriving the fair value of these contracts, the valuation of foreign exchange contracts are classified as Level 2. TheAs of March 31, 2020 and December 31, 2019, the Company held foreign currency non-deliverable forward contracts as of June 30, 2019 and held foreign swap contracts as of December 31, 2018 to hedge its net investment in its China subsidiary, East West Bank (China) Limited, a non-U.S. dollar (“USD”) functional currency subsidiary in China. These foreign currency non-deliverable forward and swap contracts were designated as net investment hedges. The fair value of foreign currency contracts is valueddetermined by comparing the contracted foreign exchange rate to the current market foreign exchange rate. Key inputs of the current market exchange rate include spot rates and forward rates of the contractual currencies. Foreign exchange forward curves are used to determine which forward rate pertains to a specific maturity. Due to the observable nature of the inputs used in deriving the estimated fair value, these instruments are classified as Level 2.
Credit Contracts — The Company may periodically enter into credit risk participation agreements (“RPAs”) to manage the credit exposure on interest rate contracts associated with the syndicated loans. The Company may enter into protection sold or protection purchased RPAs with institutional counterparties. The fair value of RPAs is calculated by determining the total expected asset or liability exposure of the derivatives to the borrowers and applying the borrowers’ credit spread to that exposure. Total expected exposure incorporates both the current and potential future exposure of the derivatives, derived from using observable inputs, such as yield curves and volatilities. The majority of the inputs used to value the RPAs are observable. Accordingly, RPAs fall within Level 2.
Equity Contracts — TheAs part of the loan origination process, from time to time, the Company obtains equity warrants to purchase preferred andand/or common stock of technology and life sciences companies as part of the loan origination process.it provides loans to. As of June 30, 2019March 31, 2020 and December 31, 2018,2019, the warrants included on the Consolidated Financial Statements were from both public and private companies. The Company values these warrants based on the Black-Scholes option pricing model. For equity warrants from public companies, the model uses the underlying stock price, stated strike price, warrant expiration date, risk-free interest rate based on a duration-matched U.S. Treasury rate and market-observable company-specific option volatility as inputs to value the warrants. Due to the observable nature of the inputs used in deriving the estimated fair value, warrants from public companies are classified as Level 2. For warrants from private companies, the model uses inputs such as the offering price observed in the most recent round of funding, stated strike price, warrant expiration date, risk-free interest rate based on duration-matched U.S. Treasury rate and option volatility. The Company applies proxy volatilities based on the industry sectors of the private companies. The model values are then adjusted for a general lack of liquidity due to the private nature of the underlying companies. Due to the unobservable nature of the option volatility and liquidity discount assumptions used in deriving the estimated fair value, warrants from private companies are classified as Level 3. Since both option volatility and liquidity discount assumptions are subject to managementmanagement’s judgment, measurement uncertainty is inherent in the valuation of private companies’ equity warrants. Given that the Company holds long positions in all equity warrants, an increase in volatility assumption would generally result in an increase in fair value measurement.value. A higher liquidity discount would result in a decrease in fair value measurement.value. On a quarterly basis, the changes in the fair value of warrants from private companies are reviewed for reasonableness, and a measurement uncertainty analysis on the option volatility and liquidity discount assumptions is performed.
Commodity Contracts — The Company enters into energy commodity contracts in the form of swaps and options with its commercial loan customers to allow them to hedge against the risk of fluctuation in energy commodity prices. The fair value of the commodity option contracts is determined using the Black’sBlack-Scholes model and assumptions that include expectations of future commodity price and volatility. The future commodity contract price is derived from observable inputs such as the market price of the commodity. Commodity swaps are structured as an exchange of fixed cash flows for floating cash flows. The fixed cash flows are predetermined based on the known volumes and fixed price as specified in the swap agreement. The floating cash flows are correlated with the change of forward commodity prices, which is derived from market corroborated futures settlement prices. The fair value of the commodity swaps is determined using the market standard methodology of netting the discounted future fixed cash payments (or receipts) and the discounted expected variable cash receipts (or payments) based on the market prices of the commodity. As a result, the Company classifies these derivative instruments as Level 2 due to the observable nature of the significant inputs utilized.
The following tables present financial assets and liabilities that are measured at fair value on a recurring basis as of June 30, 2019March 31, 2020 and December 31, 2018:2019:
|
| | | | | | | | | | | | | | | | |
| |
| ($ in thousands) | | Assets and Liabilities Measured at Fair Value on a Recurring Basis
as of June 30, 2019 |
| | Quoted Prices in Active Markets for Identical Assets (Level 1) | | Significant Other Observable Inputs (Level 2) | | Significant Unobservable Inputs (Level 3) | | Total Fair Value |
| Available-for-sale investment securities: | | | | | | | | |
| U.S. Treasury securities | | $ | 326,535 |
| | $ | — |
| | $ | — |
| | $ | 326,535 |
|
| U.S. government agency and U.S. government sponsored enterprise debt securities | | — |
| | 241,967 |
| | — |
| | 241,967 |
|
| U.S. government agency and U.S. government sponsored enterprise mortgage-backed securities: | | | | | | | |
|
|
| Commercial mortgage-backed securities | | — |
| | 474,832 |
| | — |
| | 474,832 |
|
| Residential mortgage-backed securities | | — |
| | 843,574 |
| | — |
| | 843,574 |
|
| Municipal securities | | — |
| | 87,529 |
| | — |
| | 87,529 |
|
| Non-agency mortgage-backed securities: | | | | | | | | |
| Commercial mortgage-backed securities | | — |
| | 70,549 |
| | — |
| | 70,549 |
|
| Residential mortgage-backed securities | | — |
| | 24,539 |
| | — |
| | 24,539 |
|
| Corporate debt securities | | — |
| | 11,156 |
| | — |
| | 11,156 |
|
| Foreign bonds | | — |
| | 484,416 |
| | — |
| | 484,416 |
|
| Asset-backed securities | | — |
| | 27,816 |
| | — |
| | 27,816 |
|
| Total available-for-sale investment securities | | $ | 326,535 |
| | $ | 2,266,378 |
| | $ | — |
| | $ | 2,592,913 |
|
| | | | | | | | | |
| Investments in tax credit and other investments: | | | | | | | | |
Equity securities (1) | | $ | 21,466 |
| | $ | 9,957 |
| | $ | — |
| | $ | 31,423 |
|
| Total investments in tax credit and other investments | | $ | 21,466 |
| | $ | 9,957 |
| | $ | — |
| | $ | 31,423 |
|
| | | | | | | | | |
| Derivative assets: | | | | | | | | |
| Interest rate contracts | | $ | — |
| | $ | 190,388 |
| | $ | — |
| | $ | 190,388 |
|
| Foreign exchange contracts | | — |
| | 27,849 |
| | — |
| | 27,849 |
|
| Credit contracts | | — |
| | 3 |
| | — |
| | 3 |
|
| Equity contracts | | — |
| | 1,593 |
| | 392 |
| | 1,985 |
|
| Commodity contracts | | — |
| | 22,651 |
| | — |
| | 22,651 |
|
| Gross derivative assets | | $ | — |
| | $ | 242,484 |
| | $ | 392 |
| | $ | 242,876 |
|
Netting adjustments (2) | | $ | — |
| | $ | (44,203 | ) | | $ | — |
| | $ | (44,203 | ) |
| Net derivative assets | | $ | — |
| | $ | 198,281 |
| | $ | 392 |
| | $ | 198,673 |
|
| | | | | | | | | |
| Derivative liabilities: | | | | | | | | |
| Interest rate contracts | | $ | — |
| | $ | 124,371 |
| | $ | — |
| | $ | 124,371 |
|
| Foreign exchange contracts | | — |
| | 22,528 |
| | — |
| | 22,528 |
|
| Credit contracts | | — |
| | 118 |
| | — |
| | 118 |
|
| Commodity contracts | | — |
| | 25,906 |
| | — |
| | 25,906 |
|
| Gross derivative liabilities | | $ | — |
| | $ | 172,923 |
| | $ | — |
| | $ | 172,923 |
|
Netting adjustments (2) | | $ | — |
| | $ | (74,494 | ) | | $ | — |
| | $ | (74,494 | ) |
| Net derivative liabilities | | $ | — |
| | $ | 98,429 |
| | $ | — |
| | $ | 98,429 |
|
| |
|
| | | | | | | | | | | | | | | | |
| |
| ($ in thousands) | | Assets and Liabilities Measured at Fair Value on a Recurring Basis
as of March 31, 2020 |
| | Quoted Prices in
Active Markets
for Identical
Assets
(Level 1) | | Significant
Other
Observable
Inputs
(Level 2) | | Significant
Unobservable
Inputs
(Level 3) | | Total
Fair Value |
| AFS debt securities: | | | | | | | | |
| U.S. Treasury securities | | $ | 51,428 |
| | $ | — |
| | $ | — |
| | $ | 51,428 |
|
| U.S. government agency and U.S. government- sponsored enterprise debt securities | | — |
| | 518,408 |
| | — |
| | 518,408 |
|
| U.S. government agency and U.S. government- sponsored enterprise mortgage-backed securities: | | | | | | | | |
| Commercial mortgage-backed securities | | — |
| | 697,948 |
| | — |
| | 697,948 |
|
| Residential mortgage-backed securities | | — |
| | 1,352,367 |
| | — |
| | 1,352,367 |
|
| Municipal securities | | — |
| | 309,626 |
| | — |
| | 309,626 |
|
| Non-agency mortgage-backed securities: | | | | | | | | |
| Commercial mortgage-backed securities | | — |
| | 87,114 |
| | — |
| | 87,114 |
|
| Residential mortgage-backed securities | | — |
| | 62,134 |
| | — |
| | 62,134 |
|
| Corporate debt securities | | — |
| | 10,963 |
| | — |
| | 10,963 |
|
| Foreign bonds | | — |
| | 284,521 |
| | — |
| | 284,521 |
|
| Asset-backed securities | | — |
| | 61,556 |
| | — |
| | 61,556 |
|
| Collateralized loan obligations (“CLOs”) | | — |
| | 259,878 |
| | — |
| | 259,878 |
|
| Total AFS debt securities | | $ | 51,428 |
| | $ | 3,644,515 |
| | $ | — |
| | $ | 3,695,943 |
|
| | | | | | | | | |
| Investments in tax credit and other investments: | | | | | | | | |
Equity securities (1) | | $ | 22,195 |
| | $ | 8,135 |
| | $ | — |
| | $ | 30,330 |
|
| Total investments in tax credit and other investments | | $ | 22,195 |
| | $ | 8,135 |
| | $ | — |
| | $ | 30,330 |
|
| | | | | | | | | |
| Derivative assets: | | | | | | | | |
| Interest rate contracts | | $ | — |
| | $ | 605,122 |
| | $ | — |
| | $ | 605,122 |
|
| Foreign exchange contracts | | — |
| | 64,383 |
| | — |
| | 64,383 |
|
| Credit contracts | | — |
| | 8 |
| | — |
| | 8 |
|
| Equity contracts | | — |
| | 415 |
| | 713 |
| | 1,128 |
|
| Commodity contracts | | — |
| | 163,563 |
| | — |
| | 163,563 |
|
| Gross derivative assets | | $ | — |
| | $ | 833,491 |
| | $ | 713 |
| | $ | 834,204 |
|
Netting adjustments (2) | | $ | — |
| | $ | (178,774 | ) | | $ | — |
| | $ | (178,774 | ) |
| Net derivative assets | | $ | — |
| | $ | 654,717 |
| | $ | 713 |
| | $ | 655,430 |
|
| | | | | | | | | |
| Derivative liabilities: | | | | | | | | |
| Interest rate contracts | | $ | — |
| | $ | 403,351 |
| | $ | — |
| | $ | 403,351 |
|
| Foreign exchange contracts | | — |
| | 55,658 |
| | — |
| | 55,658 |
|
| Credit contracts | | — |
| | 218 |
| | — |
| | 218 |
|
| Commodity contracts | | — |
| | 199,288 |
| | — |
| | 199,288 |
|
| Gross derivative liabilities | | $ | — |
| | $ | 658,515 |
| | $ | — |
| | $ | 658,515 |
|
Netting adjustments (2) | | $ | — |
| | $ | (243,101 | ) | | $ | — |
| | $ | (243,101 | ) |
| Net derivative liabilities | | $ | — |
| | $ | 415,414 |
| | $ | — |
| | $ | 415,414 |
|
| |
| |
| (1) | Equity securities were comprisedconsist of mutual funds with readily determinable fair values. |
| |
| (2) | Represents balance sheet netting of derivative assets and liabilities and related cash collateral under master netting agreements or similar agreements. See Note 76 — Derivativesto the Consolidated Financial Statements in this Form 10-Q for additional information. |
| | | | ($ in thousands) | | Assets and Liabilities Measured at Fair Value on a Recurring Basis
as of December 31, 2018 | | Assets and Liabilities Measured at Fair Value on a Recurring Basis
as of December 31, 2019 |
| | Quoted Prices in
Active Markets
for Identical
Assets
(Level 1) | | Significant
Other
Observable
Inputs
(Level 2) | | Significant Unobservable Inputs (Level 3) | | Total Fair Value | | Quoted Prices in Active Markets for Identical Assets (Level 1) | | Significant Other Observable Inputs (Level 2) | | Significant Unobservable Inputs (Level 3) | | Total Fair Value |
| Available-for-sale investment securities: | | | | | | | | | |
| AFS debt securities: | | | | | | | | | |
| U.S. Treasury securities | | $ | 564,815 |
| | $ | — |
| | $ | — |
| | $ | 564,815 |
| | $ | 176,422 |
| | $ | — |
| | $ | — |
| | $ | 176,422 |
|
| U.S. government agency and U.S. government sponsored enterprise debt securities | | — |
| | 217,173 |
| | — |
| | 217,173 |
| |
| U.S. government agency and U.S. government sponsored enterprise mortgage-backed securities: | | | | | | | | | |
| U.S. government agency and U.S. government- sponsored enterprise debt securities | | | — |
| | 581,245 |
| | — |
| | 581,245 |
|
| U.S. government agency and U.S. government- sponsored enterprise mortgage-backed securities: | | | | | | | | |
|
|
| Commercial mortgage-backed securities | | — |
| | 408,603 |
| | — |
| | 408,603 |
| | — |
| | 603,471 |
| | — |
| | 603,471 |
|
| Residential mortgage-backed securities | | — |
| | 946,693 |
| | — |
| | 946,693 |
| | — |
| | 1,003,897 |
| | — |
| | 1,003,897 |
|
| Municipal securities | | — |
| | 82,020 |
| | — |
| | 82,020 |
| | — |
| | 102,302 |
| | — |
| | 102,302 |
|
| Non-agency mortgage-backed securities: | | | | | | | | | | | | | | | | |
| Commercial mortgage-backed securities | | — |
| | 26,052 |
| | — |
| | 26,052 |
| | — |
| | 88,550 |
| | — |
| | 88,550 |
|
| Residential mortgage-backed securities | | — |
| | 9,931 |
| | — |
| | 9,931 |
| | — |
| | 46,548 |
| | — |
| | 46,548 |
|
| Corporate debt securities | | — |
| | 10,869 |
| | — |
| | 10,869 |
| | — |
| | 11,149 |
| | — |
| | 11,149 |
|
| Foreign bonds | | — |
| | 463,048 |
| | — |
| | 463,048 |
| | — |
| | 354,172 |
| | — |
| | 354,172 |
|
| Asset-backed securities | | — |
| | 12,643 |
| | — |
| | 12,643 |
| | — |
| | 64,752 |
| | — |
| | 64,752 |
|
| Total available-for-sale investment securities | | $ | 564,815 |
| | $ | 2,177,032 |
| | $ | — |
| | $ | 2,741,847 |
| |
| CLOs | | | — |
| | 284,706 |
| | — |
| | 284,706 |
|
| Total AFS debt securities | | | $ | 176,422 |
| | $ | 3,140,792 |
| | $ | — |
| | $ | 3,317,214 |
|
| | | | | | | | | | | | | | | | | |
| Investment in tax credit and other investments: | | | | | | | | | |
| Investments in tax credit and other investments: | | | | | | | | | |
Equity securities (1) | | $ | 20,678 |
| | $ | 10,531 |
| | $ | — |
| | $ | 31,209 |
| | $ | 21,746 |
| | $ | 9,927 |
| | $ | — |
| | $ | 31,673 |
|
| Total investments in tax credit and other investments | | $ | 20,678 |
| | $ | 10,531 |
| | $ | — |
| | $ | 31,209 |
| | $ | 21,746 |
| | $ | 9,927 |
| | $ | — |
| | $ | 31,673 |
|
| | | | | | | | | | | | | | | | | |
| Derivative assets: | | | | | | | | | | | | | | | | |
| Interest rate contracts | | $ | — |
| | $ | 69,818 |
| | $ | — |
| | $ | 69,818 |
| | $ | — |
| | $ | 192,883 |
| | $ | — |
| | $ | 192,883 |
|
| Foreign exchange contracts | | — |
| | 21,624 |
| | — |
| | 21,624 |
| | — |
| | 54,637 |
| | — |
| | 54,637 |
|
| Credit contracts | | — |
| | 1 |
| | — |
| | 1 |
| | — |
| | 2 |
| | — |
| | 2 |
|
| Equity contracts | | — |
| | 1,278 |
| | 673 |
| | 1,951 |
| | — |
| | 993 |
| | 421 |
| | 1,414 |
|
| Commodity contracts | | — |
| | 14,422 |
| | — |
| | 14,422 |
| | — |
| | 81,380 |
| | — |
| | 81,380 |
|
| Gross derivative assets | | $ | — |
| | $ | 107,143 |
| | $ | 673 |
| | $ | 107,816 |
| | $ | — |
| | $ | 329,895 |
| | $ | 421 |
| | $ | 330,316 |
|
Netting adjustments (2) | | $ | — |
| | $ | (45,146 | ) | | $ | — |
| | $ | (45,146 | ) | | $ | — |
| | $ | (125,319 | ) | | $ | — |
| | $ | (125,319 | ) |
| Net derivative assets | | $ | — |
| | $ | 61,997 |
| | $ | 673 |
| | $ | 62,670 |
| | $ | — |
| | $ | 204,576 |
| | $ | 421 |
| | $ | 204,997 |
|
| | | | | | | | | | | | | | | | | |
| Derivative liabilities: | | | | | | | | | | | | | | | | |
| Interest rate contracts | | $ | — |
| | $ | 75,133 |
| | $ | — |
| | $ | 75,133 |
| | $ | — |
| | $ | 127,317 |
| | $ | — |
| | $ | 127,317 |
|
| Foreign exchange contracts | | — |
| | 19,940 |
| | — |
| | 19,940 |
| | — |
| | 48,610 |
| | — |
| | 48,610 |
|
| Credit contracts | | — |
| | 164 |
| | — |
| | 164 |
| | — |
| | 84 |
| | — |
| | 84 |
|
| Commodity contracts | | — |
| | 23,068 |
| | — |
| | 23,068 |
| | — |
| | 80,517 |
| | — |
| | 80,517 |
|
| Gross derivative liabilities | | $ | — |
| | $ | 118,305 |
| | $ | — |
| | $ | 118,305 |
| | $ | — |
| | $ | 256,528 |
| | $ | — |
| | $ | 256,528 |
|
Netting adjustments (2) | | $ | — |
| | $ | (38,402 | ) | | $ | — |
| | $ | (38,402 | ) | | $ | — |
| | $ | (159,799 | ) | | $ | — |
| | $ | (159,799 | ) |
| Net derivative liabilities | | $ | — |
| | $ | 79,903 |
| | $ | — |
| | $ | 79,903 |
| | $ | — |
| | $ | 96,729 |
| | $ | — |
| | $ | 96,729 |
|
|
| |
| (1) | Equity securities were comprisedconsist of mutual funds with readily determinable fair values. |
| |
| (2) | Represents balance sheet netting of derivative assets and liabilities and related cash collateral under master netting agreements or similar agreements. See Note 76 — Derivatives to the Consolidated Financial Statements in this Form 10-Q for additional information. |
At each reporting period, all assetsFor the three months ended March 31, 2020 and liabilities for which the2019, Level 3 fair value measurement is based on significant unobservable inputs are classified as Level 3. As of June 30, 2019 and December 31, 2018, the only assetsmeasurements that were measured on a recurring basis that were classified as Level 3 were equityconsist of warrants issued by private companies. The following table presentsprovides a reconciliation of the beginning and ending balances of these equity warrants for the three and six months ended June 30, 2019March 31, 2020 and 2018:2019:
| | | | ($ in thousands) | | Three Months Ended June 30, | | Six Months Ended June 30, | | Three Months Ended March 31, |
| | 2019 | | 2018 | | 2019 | | 2018 | | 2020 | | 2019 |
| Equity warrants | | | | | | | | | |
| Equity Contracts | | | | | |
| Beginning balance | | $ | 442 |
| | $ | 931 |
| | $ | 673 |
| | $ | 679 |
| | $ | 421 |
| | $ | 673 |
|
Total gains (losses) included in earnings (1) | | 769 |
| | (76 | ) | | 538 |
| | 168 |
| | 292 |
| | (231 | ) |
| Issuances | | 28 |
| | 26 |
| | 28 |
| | 34 |
| |
| Settlements | | (847 | ) | | (233 | ) | | (847 | ) | | (233 | ) | |
| Ending balance | | $ | 392 |
|
| $ | 648 |
|
| $ | 392 |
| | $ | 648 |
|
| $ | 713 |
| | $ | 442 |
|
|
| |
| (1) | Includes unrealized gains (losses) gains of $(4)$292 thousand and $(13)$(43) thousand for the three months ended June 30,March 31, 2020 and 2019, and 2018, respectively, and $(235) thousand and $231 thousand for the six months ended June 30, 2019 and 2018, respectively. The realized/unrealized gains (losses) of equity warrants are included in Lending fees on the Consolidated Statement of Income. |
The following table presents quantitative information about the significant unobservable inputs used in the valuation of assets measured on a recurring basis classified as Level 3 fair value measurements as of June 30, 2019.March 31, 2020 and December 31, 2019, respectively. The significant unobservable inputs presented in the table below are those that the Company considers significant to the fair value of the Level 3 assets. The Company considers unobservable inputs to be significant if, by their exclusion, the fair value of the Level 3 assets would be impacted by a predetermined percentage change.
| | | | ($ in thousands) | | Fair Value Measurements (Level 3) | | Valuation Technique | | Unobservable Inputs | | Range of Inputs | | Weighted- Average (1) | | Fair Value Measurements (Level 3) | | Valuation Technique | | Unobservable Inputs | | Range of Inputs | | Weighted- Average (1) |
| March 31, 2020 | | | | |
| Derivative assets: | | | | | | |
| Equity warrants | | $ | 392 |
| | Black-Scholes option pricing model | | Equity volatility | | 43% — 51% | | 49% | |
| Equity contracts | | | $ | 713 |
| | Black-Scholes option pricing model | | Equity volatility | | 72% — 86% | | 82% |
| | | | | | Liquidity discount | | 47% | | 47% |
| December 31, 2019 | | | | |
| Derivative assets: | | | | |
| Equity contracts | | | $ | 421 |
| | Black-Scholes option pricing model | | Equity volatility | | 39% — 44% | | 42% |
| | | | | Liquidity discount | | 47% | | 47% | | | | Liquidity discount | | 47% | | 47% |
|
| |
| (1) | Weighted-average is calculated based on fair value of equity warrants as of June 30,March 31, 2020 and December 31, 2019. |
Assets and Liabilities Measured at Fair Value on a Nonrecurring Basis
From time to time, the Company may be required to measure certain assets at fair value on a nonrecurring basis in accordance with GAAP. The adjustments to fair value generally require the assets to be recorded at the lower of cost or fair value, or assessed for impairment.
Assets measured at fair value on a nonrecurring basis include certain non-PCI loans, investments in qualified affordable housing partnerships, tax credit and other investments, OREO, and loans held-for-sale. Nonrecurring fair value adjustments result from impairment on certain non-PCI loans and investments in qualified affordable housing partnerships, tax credit and other investments, write-downs of OREO, or from the application of lower of cost or fair value on loans held-for-sale.
Non-PCI Impaired Loans — The Company typically adjusts the carrying amount of impaired loans when there is evidence of probable loss and when the expected fair value of the loan is less than its carrying amount. Impaired loans with specific reserves are classified as Level 3 assets. The following two methods are used to derive the fair value of impaired loans:
Discounted cash flows valuation techniques that consist of developing an expected stream of cash flows over the life of the loans and then valuing the loans at the present value by discounting the expected cash flows at a designated discount rate.
A specific reserve is established for an impaired loan based on the fair value of the underlying collateral, which may take the form of real estate, inventory, equipment, contracts or guarantees. The fair value of the underlying collateral is generally based on third-party appraisals, or an internal evaluationvaluation if a third-party appraisal is not required by regulations, which utilize one or more valuation techniques such as income, market and/or cost approaches.
Investments in Qualified Affordable Housing Partnerships, Tax Credit and Other Investments, Net — As part of the Company’s monitoring process, the Company conducts ongoing due diligence on the Company’s investments in its qualified affordable housing partnerships, tax credit and other investments after the initial investment date and prior to the being placed in service date. After these investments are either acquired or placed into service, periodic monitoring is performed, which includes the quarterly review of the financial statements of the tax credit investment entity and the annual review of the financial statements of the guarantor (if any), as well as the review of the annual tax returns of the tax credit investment entity; and comparison of the actual cash distributions received against the financial projections prepared at the time when the investment was made. The Company assesses its tax credit investments for possible other-than-temporary impairment (“OTTI”)OTTI on an annual basis or when events or circumstances suggest that the carrying amount of the tax credit investments may not be realizable. These circumstances can include, but are not limited to the following factors:
The current fair value of the tax credit investment based upon the expected future cash flows is less than the carrying amount;
Change in the economic, market or technological environment that could adversely affect the investee’s operations; and
Other factors that raise doubt about the investee’s ability to continue as a going concern, such as negative cash flows from operations and the continuing prospects of the underlying operations of the investment.
All available evidence is considered in assessing whether a decline in value is other-than-temporary. Generally, none of the aforementioned factors are individually conclusive and the relative importance placed on individual facts may vary depending on the situation. In accordance with ASC 323-10-35-32, an impairment charge would only be recognized in earnings for a decline in value that is determined to be other-than-temporary.
Other Real Estate Owned — The Company’s OREO represents properties acquired through foreclosure, or through full or partial satisfaction of loans held-for-investment. These OREO properties are recorded at estimated fair value less the costs to sell at the time of foreclosure or at the lower of cost or estimated fair value less the costs to sell subsequent to acquisition. On a monthly basis, the current fair market value of each OREO property is reviewed to ensure that the current carrying value is appropriate. OREO properties are classified as Level 3.
Other nonperforming assets—Other nonperforming assets are recorded at fair value upon transfers from loans to foreclosed assets. Subsequently, foreclosed assets are recorded at the lower of carrying value or fair value. Fair value is based on independent market prices, appraised values of the collateral or management’s estimates of the foreclosed asset. The Company records an impairment when the foreclosed asset’s fair value declines below its carrying value. Other nonperforming assets are classified as Level 3.
The following tables present the carrying amounts of assets included on the Consolidated Balance Sheet that were still held and had fair value changes measured on a nonrecurring basis as of June 30, 2019March 31, 2020 and December 31, 2018:2019:
|
| | | | | | | | | | | | | | | | |
| |
| ($ in thousands) | | Assets Measured at Fair Value on a Nonrecurring Basis
as of June 30, 2019 |
| | Quoted Prices in
Active Markets
for Identical
Assets
(Level 1) | | Significant
Other
Observable
Inputs
(Level 2) | | Significant Unobservable Inputs (Level 3) | | Fair Value
Measurements |
| Non-PCI impaired loans: | | | | | | | | |
| Commercial: | | | | | | | | |
| Commercial and industrial (“C&I”) | | $ | — |
| | $ | — |
| | $ | 38,412 |
| | $ | 38,412 |
|
| Commercial real estate (“CRE”) | | — |
| | — |
| | 774 |
| | 774 |
|
| Total non-PCI impaired loans | | $ | — |
| | $ | — |
| | $ | 39,186 |
| | $ | 39,186 |
|
| OREO | | $ | — |
| | $ | — |
| | $ | 130 |
| | $ | 130 |
|
| |
|
| | | | | | | | | | | | | | | | |
| |
| ($ in thousands) | | Assets Measured at Fair Value on a Nonrecurring Basis
as of March 31, 2020 |
| | Quoted Prices in
Active Markets
for Identical
Assets
(Level 1) | | Significant
Other
Observable
Inputs
(Level 2) | | Significant Unobservable Inputs (Level 3) | | Fair Value
Measurements |
Impaired loans (1): | | | | | | | | |
| Commercial: | | | | | | | | |
| C&I | | $ | — |
| | $ | — |
| | $ | 28,877 |
| | $ | 28,877 |
|
| CRE: | | | | | | | | |
| CRE | | — |
| | — |
| | 735 |
| | 735 |
|
| Total commercial | | — |
| | — |
| | 29,612 |
| | 29,612 |
|
| Consumer: | | | | | | | | |
| Residential mortgage: | | | | | | | | |
| HELOCs | | — |
| | — |
| | 1,798 |
| | 1,798 |
|
| Other consumer | | — |
| | — |
| | 2,491 |
| | 2,491 |
|
| Total consumer | | — |
| | — |
| | 4,289 |
| | 4,289 |
|
| Total impaired loans | | $ | — |
| | $ | — |
| | $ | 33,901 |
| | $ | 33,901 |
|
| Investments in tax credit and other investments, net | | $ | — |
| | $ | — |
| | $ | 3,076 |
| | $ | 3,076 |
|
| Other nonperforming assets | | $ | — |
| | $ | — |
| | $ | 867 |
| | $ | 867 |
|
| |
|
| | | | | | | | | | | | | | | | |
| |
| ($ in thousands) | | Assets Measured at Fair Value on a Nonrecurring Basis
as of December 31, 2019 |
| | Quoted Prices in
Active Markets
for Identical
Assets
(Level 1) | | Significant
Other
Observable
Inputs
(Level 2) | | Significant
Unobservable
Inputs
(Level 3) | | Fair Value
Measurements |
| Non-PCI impaired loans: | | | | | | | | |
| Commercial: | | | | | | | | |
| C&I | | $ | — |
| | $ | — |
| | $ | 47,554 |
| | $ | 47,554 |
|
| CRE: | | | | | | | | |
| CRE | | — |
| | — |
| | 753 |
| | 753 |
|
| Total commercial | | — |
| | — |
| | 48,307 |
| | 48,307 |
|
| Consumer: | | | | | | | | |
| Residential mortgage: | | | | | | | | |
| HELOCs | | — |
| | — |
| | 1,372 |
| | 1,372 |
|
| Total consumer | | — |
| | — |
| | 1,372 |
| | 1,372 |
|
| Total non-PCI impaired loans | | $ | — |
| | $ | — |
| | $ | 49,679 |
| | $ | 49,679 |
|
OREO (2) | | $ | — |
| | $ | — |
| | $ | 125 |
| | $ | 125 |
|
| Investments in tax credit and other investments, net | | $ | — |
| | $ | — |
| | $ | 3,076 |
| | $ | 3,076 |
|
| |
| |
| (1) | The Company adopted ASU 2016-13 using the prospective transition approach for PCD loans that were previously accounted for as PCI loans. Total impaired loans as of March 31, 2020 considers PCD loans, if impaired, whereas the impaired loans as of December 31, 2019 includes only non-PCI loans. |
| |
| (2) | Amounts are included in Other assets on the Consolidated Balance Sheet and represent the carrying value of OREO properties that were written down subsequent to their initial classification as OREO. |
|
| | | | | | | | | | | | | | | | |
| |
| | | Assets Measured at Fair Value on a Nonrecurring Basis
as of December 31, 2018 |
| ($ in thousands) | | Quoted Prices in
Active Markets
for Identical
Assets
(Level 1) | | Significant
Other
Observable
Inputs
(Level 2) | | Significant Unobservable Inputs (Level 3) | | Fair Value
Measurements |
| Non-PCI impaired loans: | | | | | | | | |
| Commercial: | | | | | | | | |
| C&I | | $ | — |
| | $ | — |
| | $ | 26,873 |
| | $ | 26,873 |
|
| CRE | | — |
| | — |
| | 3,434 |
| | 3,434 |
|
| Consumer: | | | | | | | | |
| Single-family residential | | — |
| | — |
| | 2,551 |
| | 2,551 |
|
| Total non-PCI impaired loans | | $ | — |
| | $ | — |
| | $ | 32,858 |
| | $ | 32,858 |
|
| |
The following table presents the increase (decrease) in fair value of assets for which a fair value adjustment has been included on the Consolidated Statement of Incomerecognized for the three and six months ended June 30,March 31, 2020 and 2019, and 2018:related to assets that were still held as of those dates:
| | | | ($ in thousands) | | Three Months Ended June 30, | | Six Months Ended June 30, | | Three Months Ended March 31, |
| | 2019 | | 2018 | | 2019 | | 2018 | | 2020 | | 2019 |
| Non-PCI impaired loans: | | | | | | | | | |
| Impaired loans: | | | Total Impaired Loans (1) | | Non-PCI Impaired Loans |
| Commercial: | | | | | | | | | | | | |
| C&I | | $ | (24,001 | ) | | $ | 4,544 |
| | $ | (25,823 | ) | | $ | 595 |
| | $ | (21,501 | ) | | $ | (2,734 | ) |
| CRE: | | | | | |
| CRE | | 2 |
| | 66 |
| | 4 |
| | (23 | ) | | (5 | ) | | 2 |
|
| Total commercial | | | (21,506 | ) | | (2,732 | ) |
| Consumer: | | | | | | | | | | | | |
| Single-family residential | | — |
| | — |
| | — |
| | 15 |
| |
| Home equity lines of credit (“HELOCs”) | | — |
| | (73 | ) | | — |
| | (73 | ) | |
| Total non-PCI impaired loans | | $ | (23,999 | ) | | $ | 4,537 |
| | $ | (25,819 | ) | | $ | 514 |
| |
| OREO | | $ | (3 | ) | | $ | — |
| | $ | (3 | ) | | $ | — |
| |
| Residential mortgage: | | | | | |
| HELOCs | | | (193 | ) | | (78 | ) |
| Other consumer | | | 2,491 |
| | — |
|
| Total consumer | | | 2,298 |
| | (78 | ) |
| Total impaired loans | | | $ | (19,208 | ) | | $ | (2,810 | ) |
| Investments in tax credit and other investments, net | | $ | (2,892 | ) | | $ | — |
| | $ | (9,870 | ) | | $ | — |
| | $ | 150 |
| | $ | (6,978 | ) |
| Other nonperforming assets | | | $ | (300 | ) | | $ | — |
|
|
| |
| (1) | The Company adopted ASU 2016-13 using the prospective transition approach for PCD loans that were previously accounted for as PCI loans. Total impaired loans during the three months ended March 31, 2020 considers PCD loans, if impaired, whereas impaired loans during the three months ended March 31, 2019 includes only non-PCI loans. |
The following table presents the quantitative information about the significant unobservable inputs used in the valuation of assetsLevel 3 fair value measurements that are measured on a nonrecurring basis classified as Level 3 as of June 30, 2019March 31, 2020 and December 31, 2018:2019:
| | | | ($ in thousands) | | Fair Value
Measurements
(Level 3) | | Valuation
Technique(s) | | Unobservable Input(s) | | Range of Input(s) | | Weighted- Average (1) | | Fair Value
Measurements
(Level 3) | | Valuation
Technique(s) | | Unobservable Input(s) | | Range of Input(s) | | Weighted- Average (1) |
| June 30, 2019 | | | | |
| March 31, 2020 | | | | |
Impaired loans (1) | | | $ | 25,140 |
| | Discounted cash flows | | Discount | | 4% — 15% | | 12% |
| | | | $ | 5,712 |
| | Fair value of collateral | | Discount | | 8% — 9% | | 9% |
| | | | $ | 2,491 |
| | Fair value of collateral | | Contract value | | NM | | NM |
| | | | $ | 558 |
| | Fair value of property | | Selling cost | | 8% | | 8% |
| Other nonperforming assets | | | $ | 867 |
| | Fair value of collateral | | Contract value | | NM | | NM |
| Investments in tax credit and other investments, net | | | $ | 3,076 |
| | Individual analysis of each investment | | Expected future tax benefits and distributions | | NM | | NM |
| December 31, 2019 | | | | |
| Non-PCI impaired loans | | $ | 9,595 |
| | Discounted cash flows | | Discount | | 4% — 14% | | 9% | | $ | 27,841 |
| | Discounted cash flows | | Discount | | 4% — 15% | | 14% |
| | | $ | 26,798 |
| | Fair value of collateral | | Discount | | 20% — 55% | | 37% | | $ | 1,014 |
| | Fair value of collateral | | Discount | | 8% — 20% | | 19% |
| | | $ | 2,793 |
| | Fair value of collateral | | Contract value | | NM | | NM | | $ | 20,824 |
| | Fair value of collateral | | Contract value | | NM | | NM |
| OREO | | $ | 130 |
| | Fair value of property | | Selling cost | | 8% | | 8% | | $ | 125 |
| | Fair value of property | | Selling cost | | 8% | | 8% |
| Investments in tax credit and other investments, net | | $ | — |
| | Individual analysis of each investment | | Expected future tax benefits and distributions | | NM | | NM | | $ | 3,076 |
| | Individual analysis of each investment | | Expected future tax benefits and distributions | | NM | | NM |
| December 31, 2018 | | | | |
| Non-PCI impaired loans | | $ | 16,921 |
| | Discounted cash flows | | Discount | | 4% — 7% | | 6% | |
| | | $ | 1,687 |
| | Fair value of property | | Selling cost | | 8% | | 8% | |
| | | $ | 2,751 |
| | Fair value of collateral | | Discount | | 15% — 50% | | 21% | |
| | | $ | 11,499 |
| | Fair value of collateral | | Contract value | | NM | | NM | |
| | |
NM — Not meaningful.
| |
| (1) | Presented on a total impaired loan basis due to the adoption of ASU 2016-13 PCD loans (formerly, PCI loans) are assessed for impairment in the same manner as non-PCD loans. |
| |
| (2) | Weighted-average is based on the relative fair value of the respective assets as of June 30, 2019March 31, 2020 and December 31, 2018.2019. |
Disclosures about Fair Value of Financial Instruments
The following tables present the fair value estimates for financial instruments as of June 30, 2019March 31, 2020 and December 31, 2018,2019, excluding financial instruments recorded at fair value on a recurring basis as they are included in the tables presented elsewhere in this Note. The carrying amounts in the following tables are recorded on the Consolidated Balance Sheet under the indicated captions, except for accrued interest receivable and mortgage servicing rights that are included in Other assets, and accrued interest payable that is included in Accrued expenses and other liabilities. These financial assets and liabilities are measured at amortized cost basis on the Company’s Consolidated Balance Sheet.
| | | | ($ in thousands) | | June 30, 2019 | | March 31, 2020 |
| | Carrying Amount | | Level 1 | | Level 2 | | Level 3 | | Estimated Fair Value | | Carrying Amount | | Level 1 | | Level 2 | | Level 3 | | Estimated Fair Value |
| Financial assets: | | | | | | | | | | | | | | | | | | | | |
| Cash and cash equivalents | | $ | 3,621,614 |
| | $ | 3,621,614 |
| | $ | — |
| | $ | — |
| | $ | 3,621,614 |
| | $ | 3,080,042 |
| | $ | 3,080,042 |
| | $ | — |
| | $ | — |
| | $ | 3,080,042 |
|
| Interest-bearing deposits with banks | | $ | 150,273 |
| | $ | — |
| | $ | 150,273 |
| | $ | — |
| | $ | 150,273 |
| | $ | 293,509 |
| | $ | — |
| | $ | 293,509 |
| | $ | — |
| | $ | 293,509 |
|
Resale agreements (1) | | $ | 1,010,000 |
| | $ | — |
| | $ | 1,009,457 |
| | $ | — |
| | $ | 1,009,457 |
| | $ | 860,000 |
| | $ | — |
| | $ | 867,872 |
| | $ | — |
| | $ | 867,872 |
|
| Restricted equity securities, at cost | | $ | 78,093 |
| | $ | — |
| | $ | 78,093 |
| | $ | — |
| | $ | 78,093 |
| | $ | 78,745 |
| | $ | — |
| | $ | 78,745 |
| | $ | — |
| | $ | 78,745 |
|
| Loans held-for-sale | | $ | 3,879 |
| | $ | — |
| | $ | 3,879 |
| | $ | — |
| | $ | 3,879 |
| | $ | 1,594 |
| | $ | — |
| | $ | 1,594 |
| | $ | — |
| | $ | 1,594 |
|
| Loans held-for-investment, net | | $ | 33,399,752 |
| | $ | — |
| | $ | — |
| | $ | 33,605,951 |
| | $ | 33,605,951 |
| | $ | 35,336,390 |
| | $ | — |
| | $ | — |
| | $ | 35,736,331 |
| | $ | 35,736,331 |
|
| Mortgage servicing rights | | $ | 6,749 |
| | $ | — |
| | $ | — |
| | $ | 9,379 |
| | $ | 9,379 |
| | $ | 5,711 |
| | $ | — |
| | $ | — |
| | $ | 7,926 |
| | $ | 7,926 |
|
| Accrued interest receivable | | $ | 151,700 |
| | $ | — |
| | $ | 151,700 |
| | $ | — |
| | $ | 151,700 |
| | $ | 148,294 |
| | $ | — |
| | $ | 148,294 |
| | $ | — |
| | $ | 148,294 |
|
| Financial liabilities: | | | | | | | | | | | | | | | | | | | | |
| Demand, checking, savings and money market deposits | | $ | 25,880,826 |
| | $ | — |
| | $ | 25,880,826 |
| | $ | — |
| | $ | 25,880,826 |
| | $ | 28,720,425 |
| | $ | — |
| | $ | 28,720,425 |
| | $ | — |
| | $ | 28,720,425 |
|
| Time deposits | | $ | 10,596,716 |
| | $ | — |
| | $ | 10,626,897 |
| | $ | — |
| | $ | 10,626,897 |
| | $ | 9,966,533 |
| | $ | — |
| | $ | 9,992,060 |
| | $ | — |
| | $ | 9,992,060 |
|
| Short-term borrowings | | $ | 19,972 |
| | $ | — |
| | $ | 19,972 |
| | $ | — |
| | $ | 19,972 |
| | $ | 66,924 |
| | $ | — |
| | $ | 66,924 |
| | $ | — |
| | $ | 66,924 |
|
| FHLB advances | | $ | 745,074 |
| | $ | — |
| | $ | 754,240 |
| | $ | — |
| | $ | 754,240 |
| | $ | 646,336 |
| | $ | — |
| | $ | 657,859 |
| | $ | — |
| | $ | 657,859 |
|
Repurchase agreements (1) | | $ | 50,000 |
| | $ | — |
| | $ | 109,525 |
| | $ | — |
| | $ | 109,525 |
| | $ | 450,000 |
| | $ | — |
| | $ | 470,230 |
| | $ | — |
| | $ | 470,230 |
|
| Long-term debt | | $ | 146,966 |
| | $ | — |
| | $ | 152,478 |
| | $ | — |
| | $ | 152,478 |
| | $ | 147,169 |
| | $ | — |
| | $ | 152,942 |
| | $ | — |
| | $ | 152,942 |
|
| Accrued interest payable | | $ | 27,684 |
| | $ | — |
| | $ | 27,684 |
| | $ | — |
| | $ | 27,684 |
| | $ | 25,209 |
| | $ | — |
| | $ | 25,209 |
| | $ | — |
| | $ | 25,209 |
|
|
| | | | ($ in thousands) | | December 31, 2018 | | December 31, 2019 |
| | Carrying
Amount | | Level 1 | | Level 2 | | Level 3 | | Estimated
Fair Value | | Carrying
Amount | | Level 1 | | Level 2 | | Level 3 | | Estimated
Fair Value |
| Financial assets: | | | | | | | | | | | | | | | | | | | | |
| Cash and cash equivalents | | $ | 3,001,377 |
| | $ | 3,001,377 |
| | $ | — |
| | $ | — |
| | $ | 3,001,377 |
| | $ | 3,261,149 |
| | $ | 3,261,149 |
| | $ | — |
| | $ | — |
| | $ | 3,261,149 |
|
| Interest-bearing deposits with banks | | $ | 371,000 |
| | $ | — |
| | $ | 371,000 |
| | $ | — |
| | $ | 371,000 |
| | $ | 196,161 |
| | $ | — |
| | $ | 196,161 |
| | $ | — |
| | $ | 196,161 |
|
Resale agreements (1) | | $ | 1,035,000 |
| | $ | — |
| | $ | 1,016,724 |
| | $ | — |
| | $ | 1,016,724 |
| | $ | 860,000 |
| | $ | — |
| | $ | 856,025 |
| | $ | — |
| | $ | 856,025 |
|
| Restricted equity securities, at cost | | $ | 74,069 |
| | $ | — |
| | $ | 74,069 |
| | $ | — |
| | $ | 74,069 |
| | $ | 78,580 |
| | $ | — |
| | $ | 78,580 |
| | $ | — |
| | $ | 78,580 |
|
| Loans held-for-sale | | $ | 275 |
| | $ | — |
| | $ | 275 |
| | $ | — |
| | $ | 275 |
| | $ | 434 |
| | $ | — |
| | $ | 434 |
| | $ | — |
| | $ | 434 |
|
| Loans held-for-investment, net | | $ | 32,073,867 |
| | $ | — |
| | $ | — |
| | $ | 32,273,157 |
| | $ | 32,273,157 |
| | $ | 34,420,252 |
| | $ | — |
| | $ | — |
| | $ | 35,021,300 |
| | $ | 35,021,300 |
|
| Mortgage servicing rights | | $ | 7,836 |
| | $ | — |
| | $ | — |
| | $ | 11,427 |
| | $ | 11,427 |
| | $ | 6,068 |
| | $ | — |
| | $ | — |
| | $ | 8,199 |
| | $ | 8,199 |
|
| Accrued interest receivable | | $ | 146,262 |
| | $ | — |
| | $ | 146,262 |
| | $ | — |
| | $ | 146,262 |
| | $ | 144,599 |
| | $ | — |
| | $ | 144,599 |
| | $ | — |
| | $ | 144,599 |
|
| Financial liabilities: | | | | | | | | | | | | | | | | | | | | |
| Demand, checking, savings and money market deposits | | $ | 26,370,562 |
| | $ | — |
| | $ | 26,370,562 |
| | $ | — |
| | $ | 26,370,562 |
| | $ | 27,109,951 |
| | $ | — |
| | $ | 27,109,951 |
| | $ | — |
| | $ | 27,109,951 |
|
| Time deposits | | $ | 9,069,066 |
| | $ | — |
| | $ | 9,084,597 |
| | $ | — |
| | $ | 9,084,597 |
| | $ | 10,214,308 |
| | $ | — |
| | $ | 10,208,895 |
| | $ | — |
| | $ | 10,208,895 |
|
| Short-term borrowings | | $ | 57,638 |
| | $ | — |
| | $ | 57,638 |
| | $ | — |
| | $ | 57,638 |
| | $ | 28,669 |
| | $ | — |
| | $ | 28,669 |
| | $ | — |
| | $ | 28,669 |
|
| FHLB advances | | $ | 326,172 |
| | $ | — |
| | $ | 334,793 |
| | $ | — |
| | $ | 334,793 |
| | $ | 745,915 |
| | $ | — |
| | $ | 755,371 |
| | $ | — |
| | $ | 755,371 |
|
Repurchase agreements (1) | | $ | 50,000 |
| | $ | — |
| | $ | 87,668 |
| | $ | — |
| | $ | 87,668 |
| | $ | 200,000 |
| | $ | — |
| | $ | 232,597 |
| | $ | — |
| | $ | 232,597 |
|
| Long-term debt | | $ | 146,835 |
| | $ | — |
| | $ | 152,556 |
| | $ | — |
| | $ | 152,556 |
| | $ | 147,101 |
| | $ | — |
| | $ | 152,641 |
| | $ | — |
| | $ | 152,641 |
|
| Accrued interest payable | | $ | 22,893 |
| | $ | — |
| | $ | 22,893 |
| | $ | — |
| | $ | 22,893 |
| | $ | 27,246 |
| | $ | — |
| | $ | 27,246 |
| | $ | — |
| | $ | 27,246 |
|
|
| |
| (1) | Resale and repurchase agreements are reported net pursuant to ASC 210-20-45-11, Balance Sheet Offsetting: Repurchase and Reverse Repurchase Agreements. AsOut of both June 30, 2019gross repurchase agreements of $450.0 million, $0.0 million and $250.0 million as of March 31, 2020 and December 31, 2018, $400.0 million out of $450.0 million of gross repurchase agreements2019, respectively, were eligible for netting against gross resale agreements.agreements |
Note 54 — Securities Purchased under Resale Agreements and Sold under Repurchase Agreements
Resale Agreements
Resale agreements are recorded as receivables for the cash paid based on the values at which the securities are acquired. The market values of the underlying securities collateralizing the related receivables of the resale agreements, including accrued interest, are monitored. Additional collateral may be requested by the Company from the counterparties or excess collateral may be returned by the Company to the counterparties when deemed appropriate. Gross resale agreements were $1.41 billion$860.0 million and $1.44$1.11 billion as of June 30, 2019March 31, 2020 and December 31, 2018,2019, respectively. The weighted-average yields were 2.70%2.54% and 2.63%2.80% for the three months ended June 30,March 31, 2020 and 2019, and 2018, respectively, and 2.75% and 2.57% for the six months ended June 30,2019 and 2018, respectively.
Repurchase Agreements
Long-term repurchase agreements are accounted for as collateralized financing transactions and recorded as liabilities based on the values at which the securities are sold. As of June 30, 2019,March 31, 2020, the collateral for the repurchase agreements was comprised of U.S. Treasury securities and U.S. government agency and U.S. government sponsoredgovernment-sponsored enterprise mortgage-backed securities. The Company may have to provide additional collateral to the counterparties, or the counterparties may return excess collateral to the Company, for the repurchase agreements when deemed appropriate. Gross repurchase agreements were $450.0 million as of both June 30, 2019March 31, 2020 and December 31, 2018.2019. The weighted-average interest rates were 4.93%4.10% and 4.48%5.01% for the three months ended June 30,March 31, 2020 and 2019, and 2018, respectively, and 4.97% and 4.21% for the six months ended June 30,2019 and2018, respectively.
The following table presents the gross As of March 31, 2020, $150.0 million of repurchase agreements as of June 30, 2019 that will mature in the next five years2022 and thereafter:
|
| | | | |
| | | |
| ($ in thousands) | | Repurchase Agreements |
| Remainder of 2019 | | $ | — |
|
| 2020 | | — |
|
| 2021 | | — |
|
| 2022 | | 150,000 |
|
| 2023 | | 300,000 |
|
| Thereafter | | — |
|
| Total | | $ | 450,000 |
|
| | | |
Balance Sheet Offsetting
The Company’s resale and repurchase agreements are transacted under legally enforceable master repurchase agreements that provide the Company, in the event of default by the counterparty, the right to liquidate securities held and to offset receivables and payables with the same counterparty. The Company nets resale and repurchase transactions with the same counterparty on the Consolidated Balance Sheet when it has a legally enforceable master netting agreement and the transactions are eligible for netting under ASC 210-20-45-11, Balance Sheet Offsetting: Repurchase and Reverse Repurchase Agreements. Collateral received includes securities that are not recognized on the Consolidated Balance Sheet. Collateral pledged consists of securities that are not netted on the Consolidated Balance Sheet against the related collateralized liability. Collateral received or pledged in resale and repurchase agreements with other financial institutions may also be sold or re-pledged by the secured party, butand is usually delivered to and held by the third-party trustees. The collateral amounts received/pledged are limited for presentation purposes to the related recognized asset/liability balance for each counterparty, and accordingly, do not include excess collateral received/pledged.
The following tables present the resale and repurchase agreements included on the Consolidated Balance Sheet as of June 30, 2019March 31, 2020 and December 31, 2018:2019:
| | | | ($ in thousands) | | June 30, 2019 | | March 31, 2020 |
| Assets | | Gross Amounts
of Recognized
Assets | | Gross Amounts
Offset on the
Consolidated
Balance Sheet | | Net Amounts of
Assets Presented
on the Consolidated Balance Sheet | | Gross Amounts Not Offset on the
Consolidated Balance Sheet | | Net Amount | | Gross Amounts
of Recognized
Assets | | Gross Amounts
Offset on the
Consolidated
Balance Sheet | | Net Amounts of
Assets Presented
on the Consolidated Balance Sheet | | Gross Amounts Not Offset on the
Consolidated Balance Sheet | | Net Amount |
| | | Collateral Received | | | | Collateral Received | |
| Resale agreements | | $ | 1,410,000 |
| | $ | (400,000 | ) | | $ | 1,010,000 |
| | $ | (1,010,000 | ) | (1) | $ | — |
| | $ | 860,000 |
| | $ | — |
| | $ | 860,000 |
| | $ | (859,842 | ) | (1) | $ | 158 |
|
| | | | | | | | | | | | | | | | | | | | | |
| Liabilities | | Gross Amounts
of Recognized
Liabilities | | Gross Amounts
Offset on the
Consolidated
Balance Sheet | | Net Amounts of
Liabilities
Presented on the Consolidated Balance Sheet | | Gross Amounts Not Offset on the
Consolidated Balance Sheet | | Net Amount | | Gross Amounts
of Recognized
Liabilities | | Gross Amounts
Offset on the
Consolidated
Balance Sheet | | Net Amounts of
Liabilities
Presented on the Consolidated Balance Sheet | | Gross Amounts Not Offset on the
Consolidated Balance Sheet | | Net Amount |
| | | Collateral Pledged | | | | Collateral Pledged | |
| Repurchase agreements | | $ | 450,000 |
| | $ | (400,000 | ) | | $ | 50,000 |
| | $ | (50,000 | ) | (2) | $ | — |
| | $ | 450,000 |
| | $ | — |
| | $ | 450,000 |
| | $ | (441,246 | ) | (2) | $ | 8,754 |
|
|
| | | | ($ in thousands) | | December 31, 2018 | | December 31, 2019 |
| Assets | | Gross Amounts
of Recognized
Assets | | Gross Amounts
Offset on the
Consolidated
Balance Sheet | | Net Amounts of
Assets Presented
on the Consolidated Balance Sheet | | Gross Amounts Not Offset on the
Consolidated Balance Sheet | | Net Amount | | Gross Amounts
of Recognized
Assets | | Gross Amounts
Offset on the
Consolidated
Balance Sheet | | Net Amounts of
Assets Presented
on the Consolidated Balance Sheet | | Gross Amounts Not Offset on the
Consolidated Balance Sheet | | Net Amount |
| | | Collateral Received | | | | Collateral Received | |
| Resale agreements | | $ | 1,435,000 |
| | $ | (400,000 | ) | | $ | 1,035,000 |
| | $ | (1,025,066 | ) | (1) | $ | 9,934 |
| | $ | 1,110,000 |
| | $ | (250,000 | ) | | $ | 860,000 |
| | $ | (856,058 | ) | (1) | $ | 3,942 |
|
| | | | | | | | | | | | | | | | | | | | | |
| Liabilities | | Gross Amounts
of Recognized
Liabilities | | Gross Amounts
Offset on the
Consolidated
Balance Sheet | | Net Amounts of
Liabilities
Presented
on the Consolidated Balance Sheet | | Gross Amounts Not Offset on the
Consolidated Balance Sheet | | Net Amount | | Gross Amounts
of Recognized
Liabilities | | Gross Amounts
Offset on the
Consolidated
Balance Sheet | | Net Amounts of
Liabilities
Presented
on the Consolidated Balance Sheet | | Gross Amounts Not Offset on the
Consolidated Balance Sheet | | Net Amount |
| | | Collateral Pledged | | | | Collateral Pledged | |
| Repurchase agreements | | $ | 450,000 |
| | $ | (400,000 | ) | | $ | 50,000 |
| | $ | (50,000 | ) | (2) | $ | — |
| | $ | 450,000 |
| | $ | (250,000 | ) | | $ | 200,000 |
| | $ | (200,000 | ) | (2) | $ | — |
|
|
| |
| (1) | Represents the fair value of securities the Company has received under resale agreements, limited for table presentation purposes to the amount of the recognized asset due from each counterparty. The application of collateral cannot reduce the net position below zero. Therefore, excess collateral, if any, is not reflected above. |
| |
| (2) | Represents the fair value of securities the Company has pledged under repurchase agreements, limited for table presentation purposes to the amount of the recognized liability due to each counterparty. The application of collateral cannot reduce the net position below zero. Therefore, excess collateral, if any, is not reflected above. |
In addition to the amounts included in the tables above, the Company also has balance sheet netting related to derivatives. Refer to Note 76 — Derivatives to the Consolidated Financial Statements in this Form 10-Q for additional information.
Note 65 — Securities
The following tables present the amortized cost, gross unrealized gains and losses, and fair value by major categories of available-for-sale investmentAFS debt securities as of June 30, 2019March 31, 2020 and December 31, 2018:2019:
| | | | ($ in thousands) | | June 30, 2019 | | March 31, 2020 |
| | Amortized
Cost | | Gross
Unrealized
Gains | | Gross
Unrealized
Losses | | Fair
Value | | Amortized
Cost (1) | | Gross
Unrealized
Gains | | Gross
Unrealized
Losses | | Fair
Value |
| Available-for-sale investment securities: | | | | | | | | | |
| AFS debt securities: | | | | | | | | | |
| U.S. Treasury securities | | $ | 329,209 |
| | $ | — |
| | $ | (2,674 | ) | | $ | 326,535 |
| | $ | 50,606 |
| | $ | 822 |
| | $ | — |
| | $ | 51,428 |
|
| U.S. government agency and U.S. government sponsored enterprise debt securities | | 239,732 |
| | 2,252 |
| | (17 | ) | | 241,967 |
| |
| U.S. government agency and U.S. government sponsored enterprise mortgage-backed securities: | | | | | | | | | |
| U.S. government agency and U.S. government-sponsored enterprise debt securities | | | 511,176 |
| | 7,232 |
| | — |
| | 518,408 |
|
| U.S. government agency and U.S. government-sponsored enterprise mortgage-backed securities: | | | | | | | | | |
| Commercial mortgage-backed securities | | 471,189 |
| | 7,956 |
| | (4,313 | ) | | 474,832 |
| | 677,644 |
| | 24,472 |
| | (4,168 | ) | | 697,948 |
|
| Residential mortgage-backed securities | | 836,757 |
| | 8,222 |
| | (1,405 | ) | | 843,574 |
| | 1,316,009 |
| | 38,770 |
| | (2,412 | ) | | 1,352,367 |
|
| Municipal securities | | 86,776 |
| | 791 |
| | (38 | ) | | 87,529 |
| | 300,551 |
| | 10,147 |
| | (1,072 | ) | | 309,626 |
|
| Non-agency mortgage-backed securities: | | | | | | | | | | | | | | | | |
| Commercial mortgage-backed securities | | 68,675 |
| | 1,878 |
| | (4 | ) | | 70,549 |
| | 85,843 |
| | 2,008 |
| | (737 | ) | | 87,114 |
|
| Residential mortgage-backed securities | | 24,534 |
| | 19 |
| | (14 | ) | | 24,539 |
| | 64,112 |
| | 156 |
| | (2,134 | ) | | 62,134 |
|
| Corporate debt securities | | 11,250 |
| | — |
| | (94 | ) | | 11,156 |
| | 11,250 |
| | 1 |
| | (288 | ) | | 10,963 |
|
| Foreign bonds | | 489,392 |
| | 111 |
| | (5,087 | ) | | 484,416 |
| | 283,822 |
| | 749 |
| | (50 | ) | | 284,521 |
|
| Asset-backed securities | | 27,991 |
| | — |
| | (175 | ) | | 27,816 |
| | 65,400 |
| | — |
| | (3,844 | ) | | 61,556 |
|
| Total available-for-sale investment securities | | $ | 2,585,505 |
| | $ | 21,229 |
| | $ | (13,821 | ) | | $ | 2,592,913 |
| |
| CLOs | | | 294,000 |
| | — |
| | (34,122 | ) | | 259,878 |
|
| Total AFS debt securities | | | $ | 3,660,413 |
| | $ | 84,357 |
| | $ | (48,827 | ) | | $ | 3,695,943 |
|
|
| | | | ($ in thousands) | | December 31, 2018 | | December 31, 2019 |
| | Amortized
Cost | | Gross
Unrealized
Gains | | Gross
Unrealized
Losses | | Fair
Value | | Amortized
Cost | | Gross
Unrealized
Gains | | Gross
Unrealized
Losses | | Fair
Value |
| Available-for-sale investment securities: | | | | | | | | | |
| AFS debt securities: | | | | | | | | | |
| U.S. Treasury securities | | $ | 577,561 |
| | $ | 153 |
| | $ | (12,899 | ) | | $ | 564,815 |
| | $ | 177,215 |
| | $ | — |
| | $ | (793 | ) | | $ | 176,422 |
|
| U.S. government agency and U.S. government sponsored enterprise debt securities | | 219,485 |
| | 382 |
| | (2,694 | ) | | 217,173 |
| |
| U.S. government agency and U.S. government sponsored enterprise mortgage-backed securities: | | | | | | | |
|
| |
| U.S. government agency and U.S. government-sponsored enterprise debt securities | | | 584,275 |
| | 1,377 |
| | (4,407 | ) | | 581,245 |
|
| U.S. government agency and U.S. government-sponsored enterprise mortgage-backed securities: | | | | | | | | |
|
|
| Commercial mortgage-backed securities | | 420,486 |
| | 811 |
| | (12,694 | ) | | 408,603 |
| | 599,814 |
| | 8,551 |
| | (4,894 | ) | | 603,471 |
|
| Residential mortgage-backed securities | | 957,219 |
| | 4,026 |
| | (14,552 | ) | | 946,693 |
| | 998,447 |
| | 6,927 |
| | (1,477 | ) | | 1,003,897 |
|
| Municipal securities | | 82,965 |
| | 87 |
| | (1,032 | ) | | 82,020 |
| | 101,621 |
| | 790 |
| | (109 | ) | | 102,302 |
|
| Non-agency mortgage-backed securities: | | | | | | | |
|
| | | | | | | |
|
|
| Commercial mortgage-backed securities | | 25,826 |
| | 226 |
| | — |
| | 26,052 |
| | 86,609 |
| | 1,947 |
| | (6 | ) | | 88,550 |
|
| Residential mortgage-backed securities | | 10,109 |
| | 7 |
| | (185 | ) | | 9,931 |
| | 46,830 |
| | 3 |
| | (285 | ) | | 46,548 |
|
| Corporate debt securities | | 11,250 |
| | — |
| | (381 | ) | | 10,869 |
| | 11,250 |
| | 12 |
| | (113 | ) | | 11,149 |
|
| Foreign bonds | | 489,378 |
| | — |
| | (26,330 | ) | | 463,048 |
| | 354,481 |
| | 198 |
| | (507 | ) | | 354,172 |
|
| Asset-backed securities | | 12,621 |
| | 22 |
| | — |
| | 12,643 |
| | 66,106 |
| | — |
| | (1,354 | ) | | 64,752 |
|
| Total available-for-sale investment securities | | $ | 2,806,900 |
| | $ | 5,714 |
| | $ | (70,767 | ) | | $ | 2,741,847 |
| |
| CLOs | | | 294,000 |
| | — |
| | (9,294 | ) | | 284,706 |
|
| Total AFS debt securities | | | $ | 3,320,648 |
| | $ | 19,805 |
| | $ | (23,239 | ) | | $ | 3,317,214 |
|
| | | | | | | | | | |
As of March 31, 2020, the amortized cost of AFS debt securities excludes accrued interest receivable of $14.4 million which is included in Other assets on the Consolidated Balance Sheet. For our accounting policy related to AFS debt securities’ accrued interest receivable, see Note 2 — Summary of Significant Accounting Policies to the Consolidated Financial Statements in this Form 10-Q.
Unrealized Losses
The following tables present the fair value and the associated gross unrealized losses of the Company’s available-for-sale investmentAFS debt securities, aggregated by investment category and the length of time that the securities have been in a continuous unrealized loss position as of June 30, 2019March 31, 2020 and December 31, 2018:2019.
| | | | ($ in thousands) | | June 30, 2019 | | March 31, 2020 |
| | Less Than 12 Months | | 12 Months or More | | Total | | Less Than 12 Months | | 12 Months or More | | Total |
| | Fair Value | | Gross Unrealized Losses | | Fair Value | | Gross Unrealized Losses | | Fair Value | | Gross Unrealized Losses | | Fair Value | | Gross Unrealized Losses | | Fair Value | | Gross Unrealized Losses | | Fair Value | | Gross Unrealized Losses |
| Available-for-sale investment securities: | | | | | | | | | | | | | |
| U.S. Treasury securities | | $ | — |
| | $ | — |
| | $ | 326,535 |
| | $ | (2,674 | ) | | $ | 326,535 |
| | $ | (2,674 | ) | |
| U.S. government agency and U.S. government sponsored enterprise debt securities | | 22,442 |
| | (17 | ) | | — |
| | — |
| | 22,442 |
| | (17 | ) | |
| U.S. government agency and U.S. government sponsored enterprise mortgage-backed securities: | | | | | | | | | | | | | |
| AFS debt securities: | | | | | | | | | | | | | |
| U.S. government agency and U.S. government-sponsored enterprise mortgage-backed securities: | | | | | | | | | | | | | |
| Commercial mortgage-backed securities | | 10,210 |
| | (81 | ) | | 208,330 |
| | (4,232 | ) | | 218,540 |
| | (4,313 | ) | | $ | 116,225 |
| | $ | (2,277 | ) | | $ | 19,252 |
| | $ | (1,891 | ) | | $ | 135,477 |
| | $ | (4,168 | ) |
| Residential mortgage-backed securities | | 11,679 |
| | (123 | ) | | 145,595 |
| | (1,282 | ) | | 157,274 |
| | (1,405 | ) | | 192,572 |
| | (2,408 | ) | | 193 |
| | (4 | ) | | 192,765 |
| | (2,412 | ) |
| Municipal securities | | 4,890 |
| | (10 | ) | | 9,950 |
| | (28 | ) | | 14,840 |
| | (38 | ) | | 18,705 |
| | (1,072 | ) | | — |
| | — |
| | 18,705 |
| | (1,072 | ) |
| Non-agency mortgage-backed securities: | | | | | | | | | | | | | | | | | | | | | | | | |
| Commercial mortgage-backed securities | | 7,916 |
| | (4 | ) | | — |
| | — |
| | 7,916 |
| | (4 | ) | | 31,087 |
| | (737 | ) | | — |
| | — |
| | 31,087 |
| | (737 | ) |
| Residential mortgage-backed securities | | — |
| | — |
| | 3,917 |
| | (14 | ) | | 3,917 |
| | (14 | ) | | 47,044 |
| | (2,134 | ) | | — |
| | — |
| | 47,044 |
| | (2,134 | ) |
| Corporate debt securities | | 1,244 |
| | (6 | ) | | 9,912 |
| | (88 | ) | | 11,156 |
| | (94 | ) | | — |
| | — |
| | 9,713 |
| | (288 | ) | | 9,713 |
| | (288 | ) |
| Foreign bonds | | 14,349 |
| | (94 | ) | | 369,956 |
| | (4,993 | ) | | 384,305 |
| | (5,087 | ) | | 49,950 |
| | (50 | ) | | — |
| | — |
| | 49,950 |
| | (50 | ) |
| Asset-backed securities | | 27,816 |
| | (175 | ) | | — |
| | — |
| | 27,816 |
| | (175 | ) | | 50,097 |
| | (2,657 | ) | | 11,459 |
| | (1,187 | ) | | 61,556 |
| | (3,844 | ) |
| Total available-for-sale investment securities | | $ | 100,546 |
| | $ | (510 | ) | | $ | 1,074,195 |
| | $ | (13,311 | ) | | $ | 1,174,741 |
| | $ | (13,821 | ) | |
| CLOs | | | 259,878 |
| | (34,122 | ) | | — |
| | — |
| | 259,878 |
| | (34,122 | ) |
| Total AFS debt securities | | | $ | 765,558 |
| | $ | (45,457 | ) | | $ | 40,617 |
| | $ | (3,370 | ) | | $ | 806,175 |
| | $ | (48,827 | ) |
|
| | | | ($ in thousands) | | December 31, 2018 | | December 31, 2019 |
| | Less Than 12 Months | | 12 Months or More | | Total | | Less Than 12 Months | | 12 Months or More | | Total |
| | Fair Value | | Gross Unrealized Losses | | Fair Value | | Gross Unrealized Losses | | Fair Value | | Gross Unrealized Losses | | Fair Value | | Gross Unrealized Losses | | Fair Value | | Gross Unrealized Losses | | Fair Value | | Gross Unrealized Losses |
| Available-for-sale investment securities: | | | | | | | | | | | | | |
| AFS debt securities: | | | | | | | | | | | | | |
| U.S. Treasury securities | | $ | — |
| | $ | — |
| | $ | 516,520 |
| | $ | (12,899 | ) | | $ | 516,520 |
| | $ | (12,899 | ) | | $ | — |
| | $ | — |
| | $ | 176,422 |
| | $ | (793 | ) | | $ | 176,422 |
| | $ | (793 | ) |
| U.S. government agency and U.S. government sponsored enterprise debt securities | | 22,755 |
| | (238 | ) | | 159,814 |
| | (2,456 | ) | | 182,569 |
| | (2,694 | ) | |
| U.S. government agency and U.S. government sponsored enterprise mortgage-backed securities: | | | | | | | | | | | | | |
| U.S. government agency and U.S. government-sponsored enterprise debt securities | | | 310,349 |
| | (4,407 | ) | | — |
| | — |
| | 310,349 |
| | (4,407 | ) |
| U.S. government agency and U.S. government-sponsored enterprise mortgage-backed securities: | | | | | | | | | | | | | |
| Commercial mortgage-backed securities | | 26,886 |
| | (245 | ) | | 274,666 |
| | (12,449 | ) | | 301,552 |
| | (12,694 | ) | | 204,675 |
| | (2,346 | ) | | 108,314 |
| | (2,548 | ) | | 312,989 |
| | (4,894 | ) |
| Residential mortgage-backed securities | | 75,675 |
| | (491 | ) | | 653,660 |
| | (14,061 | ) | | 729,335 |
| | (14,552 | ) | | 325,354 |
| | (1,234 | ) | | 34,337 |
| | (243 | ) | | 359,691 |
| | (1,477 | ) |
| Municipal securities | | 9,458 |
| | (104 | ) | | 30,295 |
| | (928 | ) | | 39,753 |
| | (1,032 | ) | | 31,130 |
| | (109 | ) | | — |
| | — |
| | 31,130 |
| | (109 | ) |
| Non-agency mortgage-backed securities: | | | | | | | | | | | | | | | | | | | | | | | | |
| Commercial mortgage-backed securities | | | 7,914 |
| | (6 | ) | | — |
| | — |
| | 7,914 |
| | (6 | ) |
| Residential mortgage-backed securities | | 3,067 |
| | (19 | ) | | 3,949 |
| | (166 | ) | | 7,016 |
| | (185 | ) | | 42,894 |
| | (285 | ) | | — |
| | — |
| | 42,894 |
| | (285 | ) |
| Corporate debt securities | | 10,869 |
| | (381 | ) | | — |
| | — |
| | 10,869 |
| | (381 | ) | | — |
| | — |
| | 9,888 |
| | (113 | ) | | 9,888 |
| | (113 | ) |
| Foreign bonds | | 14,418 |
| | (40 | ) | | 448,630 |
| | (26,290 | ) | | 463,048 |
| | (26,330 | ) | | 129,074 |
| | (407 | ) | | 9,900 |
| | (100 | ) | | 138,974 |
| | (507 | ) |
| Total available-for-sale investment securities | | $ | 163,128 |
| | $ | (1,518 | ) | | $ | 2,087,534 |
| | $ | (69,249 | ) | | $ | 2,250,662 |
| | $ | (70,767 | ) | |
| Asset-backed securities | | | 52,565 |
| | (902 | ) | | 12,187 |
| | (452 | ) | | 64,752 |
| | (1,354 | ) |
CLOs
| | | 284,706 |
| | (9,294 | ) | | — |
| | — |
| | 284,706 |
| | (9,294 | ) |
| Total AFS debt securities | | | $ | 1,388,661 |
| | $ | (18,990 | ) | | $ | 351,048 |
| | $ | (4,249 | ) | | $ | 1,739,709 |
| | $ | (23,239 | ) |
|
Other-Than-Temporary ImpairmentAllowance for Credit Losses
For eachEach reporting period, the Company assesses individual securitieseach AFS debt security that areis in an unrealized loss position for OTTI.to determine whether the decline in fair value below the amortized cost basis resulted from a credit loss or other factors. For a discussion of the factors and criteria the Company uses in analyzing securities for OTTI,impairment related to credit losses, see Note 12 — Summary of Significant Accounting Policies — Allowance for Credit Losses on Available-For-Sale Debt Securitiesto the Consolidated Financial Statements ofin this Form 10-Q. Prior to January 1, 2020, the Company’s 2018 Form 10-K.Company assessed individual securities that were in an unrealized loss position for OTTI.
The gross unrealized losses across all major security types presented in the above tables were primarily attributable to the movement in the yield curve in additionmovements and widened spreads arising from the negative outlook and uncertainty as a result of the COVID-19 pandemic. The Company believes that the credit support levels of the Company’s AFS debt securities are strong and, based on current assessments and macroeconomic forecasts, expects that full contractual cash flows will be received even if the credit performance deteriorates under the impact of the COVID-19 pandemic.
As of March 31, 2020, the Company has the intent to widened liquidityhold the AFS debt securities with unrealized losses through the anticipated recovery period and credit spreads.it is more-likely-than-not that the Company will not have to sell these securities before recovery of their amortized cost. The issuers of these securities have not, to the Company’s knowledge, established any cause for default on these securities. These securities have fluctuated in value since their purchase dates because of changes in market interest rates. The Company believes that the gross unrealized losses presented in the previous tables are temporary and no credit losses are expected. As a result, the Company expects to recover the entire amortized cost basis of these securities. The Company hasAccordingly, 0 allowance for credit losses as of March 31, 2020, nor provision for credit losses for the intent to hold these securities throughthree months ended March 31, 2020 were recorded. In comparison, 0 OTTI credit loss was recognized for the anticipated recovery period and it is not more-likely-than-not that the Company will have to sell these securities before recovery of their amortized cost. three months ended March 31, 2019.
As of June 30, 2019,March 31, 2020, the Company had 76 available-for-sale investment56 AFS debt securities in a gross unrealized loss position with no0 credit impairment, primarily consisting of 403 CLOs, 32 U.S. government agency and U.S. government sponsoredgovernment-sponsored enterprise mortgage-backed securities, 11 foreign bonds, and 12 U.S. Treasury4 asset-backed securities. In comparison, as of December 31, 2018,2019, the Company had 184 available-for-sale investment101 AFS debt securities in a gross unrealized loss position with no0 credit impairment, primarily consisting of 1083 CLOs, 57 U.S. government agency and U.S. government sponsoredgovernment-sponsored enterprise mortgage-backed securities, 16 foreign bonds, and 1914 U.S. Treasurygovernment agency and U.S. government-sponsored enterprise debt securities. There were no OTTI credit losses recognized in earnings for each of the three and six months ended June 30, 2019 and 2018.
Realized Gains and Losses
The following table presents the proceeds, gross realized gains and tax expense related to the sales of available-for-sale investmentAFS debt securities for the three and six months ended June 30, 2019March 31, 2020 and 2018:2019:
| | | | ($ in thousands) | | Three Months Ended June 30, | | Six Months Ended June 30, | | Three Months Ended March 31, |
| | 2019 | | 2018 | | 2019 | | 2018 | | 2020 | | 2019 |
| Proceeds from sales | | $ | 223,763 |
| | $ | 42,085 |
| | $ | 375,102 |
| | $ | 256,875 |
| | $ | 306,463 |
| | $ | 151,339 |
|
| Gross realized gains | | $ | 1,447 |
| | $ | 210 |
| | $ | 3,008 |
| | $ | 2,339 |
| | $ | 1,529 |
| | $ | 1,561 |
|
| Related tax expense | | $ | 428 |
| | $ | 62 |
| | $ | 889 |
| | $ | 690 |
| | $ | 452 |
| | $ | 461 |
|
|
Contractual Maturities of InvestmentAvailable-for-Sale Debt Securities
The following table presents the contractual maturities of available-for-sale investmentAFS debt securities as of June 30, 2019:March 31, 2020:
| | | | ($ in thousands) | | Amortized Cost | | Fair Value | | Amortized Cost | | Fair Value |
| Due within one year | | $ | 586,072 |
| | $ | 581,305 |
| | $ | 588,392 |
| | $ | 590,461 |
|
| Due after one year through five years | | 432,912 |
| | 430,486 |
| | 314,312 |
| | 319,938 |
|
| Due after five years through ten years | | 193,117 |
| | 196,457 |
| | 240,566 |
| | 252,057 |
|
| Due after ten years | | 1,373,404 |
| | 1,384,665 |
| | 2,517,143 |
| | 2,533,487 |
|
| Total available-for-sale investment securities | | $ | 2,585,505 |
| | $ | 2,592,913 |
| |
| Total AFS debt securities | | | $ | 3,660,413 |
| | $ | 3,695,943 |
|
|
Actual maturities of mortgage-backed securities can differ from contractual maturities as the borrowers have the right to prepay obligations. In addition, factors such as prepayments and interest rates may affect the yields on the carrying values of mortgage-backed securities.
As of June 30, 2019March 31, 2020 and December 31, 2018, available-for-sale investment2019, AFS debt securities with fair value of $493.7$742.4 million and $435.8$479.4 million, respectively, were pledged to secure public deposits, interest rate contracts, repurchase agreements and for other purposes required or permitted by law.
Restricted Equity Securities
Restricted equity securities include the Federal Reserve Bank of San Francisco (“FRB”) and the FHLB stock. Restricted equity securities are carried at cost as these securities do not have a readily determinable fair value. The following table presents the restricted equity securities on the Consolidated Balance Sheet as of June 30, 2019March 31, 2020 and December 31, 2018:2019:
| | | | ($ in thousands) | | June 30, 2019 | | December 31, 2018 | | March 31, 2020 | | December 31, 2019 |
| FRB stock | | $ | 57,843 |
| | $ | 56,819 |
| |
| Federal Reserve Bank of San Francisco (“FRB”) stock | | | $ | 58,563 |
| | $ | 58,330 |
|
| FHLB stock | | 20,250 |
| | 17,250 |
| | 20,182 |
| | 20,250 |
|
| Total restricted equity securities | | $ | 78,093 |
| | $ | 74,069 |
| | $ | 78,745 |
| | $ | 78,580 |
|
|
Note 76 — Derivatives
The Company uses derivatives to manage exposure to market risk, primarily interest rate risk and foreign currency risk, and to assist customers with their risk management objectives. The Company’s goal is to manage interest rate sensitivity and volatility so that movements in interest rates are not significant to earnings or capital. The Company also uses foreign exchange contracts to manage the foreign exchange rate risk associated with certain foreign currency-denominated assets and liabilities, as well as the Company’s investment in its China subsidiary, East West Bank (China) Limited. The Company recognizes all derivatives on the Consolidated Balance Sheet at fair value. While the Company designates certain derivatives as hedging instruments in a qualifying hedge accounting relationship, other derivatives consist of economic hedges. For additional information on the Company’s derivatives and hedging activities, see Note 1 — Summary of Significant Accounting Policies — Significant Accounting Policies — Derivatives Derivatives to the Consolidated Financial Statements of the Company’s 20182019 Form 10-K.
The following table presents the total notional amounts and gross fair values of the Company’s derivatives, as well as the balance sheet netting adjustments on an aggregate basis as of June 30, 2019March 31, 2020 and December 31, 2018.2019. The derivative assets and liabilities are presented on a gross basis prior to the application of bilateral collateral and master netting agreements, but after the variation margin payments with central clearing organizations have been applied as settlement, as applicable. Total derivative assets and liabilities are adjusted to take into consideration the effects of legally enforceable master netting agreements and cash collateral received or paid as of June 30, 2019March 31, 2020 and December 31, 2018.2019. The resulting net derivative asset and liability fair values are included in Other assets and Accrued expenses and other liabilities, respectively, on the Consolidated Balance Sheet.
| | | | ($ in thousands) | | June 30, 2019 | | December 31, 2018 | | March 31, 2020 | | December 31, 2019 |
| �� | Notional Amount | | Fair Value | | Notional Amount | | Fair Value | | Notional Amount | | Fair Value | | Notional Amount | | Fair Value |
| | | Derivative Assets | | Derivative Liabilities | | Derivative Assets | | Derivative Liabilities | | | Derivative Assets | | Derivative Liabilities | | Derivative Assets | | Derivative Liabilities |
| Derivatives designated as hedging instruments: | | | | | | | | | | | | | | | | | | | | | | | | |
| Fair value hedges: | | | | | | | | | | | | | | | | | | | | | | | | |
| Interest rate contracts | | $ | 31,026 |
| | $ | — |
| | $ | 3,019 |
| | $ | 35,811 |
| | $ | — |
| | $ | 5,866 |
| | $ | 31,026 |
| | $ | — |
| | $ | 1,144 |
| | $ | 31,026 |
| | $ | — |
| | $ | 3,198 |
|
| Net investment hedges: | | | | | | | | | | | | | | | | | | | | | | | | |
| Foreign exchange contracts | | 160,007 |
| | 52 |
| | — |
| | 90,245 |
| | — |
| | 611 |
| | 155,255 |
| | 73 |
| | 31 |
| | 86,167 |
| | — |
| | 1,586 |
|
| Total derivatives designated as hedging instruments | | $ | 191,033 |
| | $ | 52 |
| | $ | 3,019 |
| | $ | 126,056 |
| | $ | — |
| | $ | 6,477 |
| | $ | 186,281 |
| | $ | 73 |
| | $ | 1,175 |
| | $ | 117,193 |
| | $ | — |
| | $ | 4,784 |
|
| | | | | | | | | | | | | | | | | | | | | | | | | |
| Derivatives not designated as hedging instruments: | | | | | | | | | | | | | | | | | | | | | | | | |
| Interest rate contracts | | $ | 13,469,821 |
| | $ | 190,388 |
| | $ | 121,352 |
| | $ | 11,695,499 |
| | $ | 69,818 |
| | $ | 69,267 |
| | $ | 16,657,306 |
| | $ | 605,122 |
| | $ | 402,207 |
| | $ | 15,489,692 |
| | $ | 192,883 |
| | $ | 124,119 |
|
| Foreign exchange contracts | | 3,425,107 |
| | 27,797 |
| | 22,528 |
| | 3,407,522 |
| | 21,624 |
| | 19,329 |
| | 4,958,834 |
| | 64,310 |
| | 55,627 |
| | 4,839,661 |
| | 54,637 |
| | 47,024 |
|
| Credit contracts | | 91,856 |
| | 3 |
| | 118 |
| | 119,320 |
| | 1 |
| | 164 |
| | 210,357 |
| | 8 |
| | 218 |
| | 210,678 |
| | 2 |
| | 84 |
|
| Equity contracts | | — |
| (1) | 1,985 |
| | — |
| | — |
| (1) | 1,951 |
| | — |
| | — |
| (1) | 1,128 |
| | — |
| | — |
| (1) | 1,414 |
| | — |
|
| Commodity contracts | | — |
| (2) | 22,651 |
| | 25,906 |
| | — |
| (2) | 14,422 |
| | 23,068 |
| | — |
| (2) | 163,563 |
| | 199,288 |
| | — |
| (2) | 81,380 |
| | 80,517 |
|
| Total derivatives not designated as hedging instruments | | $ | 16,986,784 |
| | $ | 242,824 |
| | $ | 169,904 |
| | $ | 15,222,341 |
| | $ | 107,816 |
| | $ | 111,828 |
| | $ | 21,826,497 |
| | $ | 834,131 |
| | $ | 657,340 |
| | $ | 20,540,031 |
| | $ | 330,316 |
| | $ | 251,744 |
|
| Gross derivative assets/liabilities | | | | $ | 242,876 |
| | $ | 172,923 |
| | | | $ | 107,816 |
| | $ | 118,305 |
| | | | $ | 834,204 |
| | $ | 658,515 |
| | | | $ | 330,316 |
| | $ | 256,528 |
|
| Less: Master netting agreements | | | | (40,372 | ) | | (40,372 | ) | | | | (31,569 | ) | | (31,569 | ) | | | | (158,674 | ) | | (158,674 | ) | | | | (121,561 | ) | | (121,561 | ) |
| Less: Cash collateral received/paid | | | | (3,831 | ) | | (34,122 | ) | | | | (13,577 | ) | | (6,833 | ) | | | | (20,100 | ) | | (84,427 | ) | | | | (3,758 | ) | | (38,238 | ) |
| Net derivative assets/liabilities | | | | $ | 198,673 |
| | $ | 98,429 |
| | | | $ | 62,670 |
| | $ | 79,903 |
| | | | $ | 655,430 |
| | $ | 415,414 |
| | | | $ | 204,997 |
| | $ | 96,729 |
|
|
| |
| (1) | The Company held equity contracts in three2 public companies and 1718 private companies as of June 30, 2019.March 31, 2020. In comparison, the Company held equity contracts in four3 public companies and 18 private companies as of December 31, 2018.2019. |
| |
| (2) | The notional amount of the Company’s commodity contracts entered with its customers totaled 5,6466,738 thousand barrels of crude oil and 30,77561,296 thousand units of natural gas, measured in million British thermal units (“MMBTUs”) as of June 30, 2019.March 31, 2020. In comparison, the notional amount of the Company’s commodity contracts entered with its customers totaled 2,5077,811 thousand barrels of crude oil and 14,72263,773 thousand MMBTUs of natural gas as of December 31, 2018.2019. The Company simultaneously entered into the same notional amounts ofoffsetting commodity contracts with mirrored terms with third-party financial institutions. |
Derivatives Designated as Hedging Instruments
Fair Value Hedges — The Company is exposed to changes in the fair value of certain certificates of deposit due to changes in the benchmark interest rates. The Company entersentered into interest rate swaps, which arewere designated as fair value hedges. The interest rate swaps involve the exchange of variable rate payments over the life of the agreements without the exchange of the underlying notional amounts.
The following table presents the net gains (losses) recognized on the Consolidated Statement of Income related to the derivatives designated as fair value hedges for the three and six months ended June 30, 2019March 31, 2020 and 2018:2019:
| | | | ($ in thousands) | | Three Months Ended June 30, | | Six Months Ended June 30, | | Three Months Ended March 31, |
| | 2019 | | 2018 | | 2019 | | 2018 | | 2020 | | 2019 |
| Gains (losses) recorded in interest expense: | | | | | | | | | | | | |
| Recognized on interest rate swaps | | $ | 1,634 |
| | $ | (396 | ) | | $ | 2,854 |
| | $ | (1,848 | ) | | $ | 2,045 |
| | $ | 1,220 |
|
| Recognized on certificates of deposit | | $ | (1,434 | ) | | $ | 440 |
| | $ | (2,695 | ) | | $ | 1,719 |
| | $ | (1,362 | ) | | $ | (1,261 | ) |
|
The following table presents the carrying amount and associated cumulative basis adjustment related to the application of fair value hedge accounting that wasis included in the carrying amount of the hedged certificates of deposit as of June 30, 2019March 31, 2020 and December 31, 2018:2019:
| | | | ($ in thousands) | | Carrying Value (1) | | Cumulative Fair Value Adjustment (2) | | Carrying Value (1) | | Cumulative Fair Value Adjustment (2) |
| | June 30, 2019 | | December 31, 2018 | | June 30, 2019 | | December 31, 2018 | | March 31, 2020 | | December 31, 2019 | | March 31, 2020 | | December 31, 2019 |
| Certificates of deposit | | $ | (29,238 | ) | | $ | (26,877 | ) | | $ | 1,446 |
| | $ | 4,141 |
| | $ | (30,441 | ) | | $ | (29,080 | ) | | $ | 243 |
| | $ | 1,604 |
|
|
| |
| (1) | Represents the full carrying amount of the hedged certificates of deposit. |
| |
| (2) | For liabilities, (increase) decrease to carrying value. |
Net Investment Hedges — ASC 830-20, Foreign Currency Matters — Foreign Currency Transactions, and ASC 815, Derivatives and Hedging, allow hedging of the foreign currency risk of a net investment in a foreign operation. The Company enters into foreign currency forward contracts to hedge a portion of its investment in East West Bank (China) Limited, a non-USD functional currency subsidiary in China. The hedging instruments designated as net investment hedges, involve hedging the risk of changes in the USD equivalent value of a designated monetary amount of the Company’s net investment in East West Bank (China) Limited, against the risk of adverse changes in the foreign currency exchange rate of the Chinese Renminbi.Renminbi (“RMB”). The Company may de-designatededesignate the net investment hedges when the Company expects the hedge will cease to be highly effective. During the second quarter of 2019, the Company increased the notional amount of the new foreign currency forward contracts that were designated as net investment hedges to better mitigate its Chinese Renminbi exposure in its investment in East West Bank (China) Limited. The notional and fair value amounts of the net investment hedges, made up of foreign exchange forwards,forward contracts, were $160.0$112.9 million and a $52$73 thousand asset, and $42.3 million and $31 thousand liability, respectively, as of June 30, 2019.March 31, 2020. In comparison, the notional and fair value amounts of the net investment hedges, made up of foreign exchange swaps,forward contracts, were $90.2$86.2 million and a $611 thousand$1.6 million liability, respectively, as of December 31, 2018.2019.
The following table presents the (losses) gains recognized in AOCIrecorded on net investment hedges for the three and six months ended June 30, 2019March 31, 2020 and 2018:2019:
| | | | ($ in thousands) | | Three Months Ended June 30, | | Six Months Ended June 30, | | Three Months Ended March 31, |
| | 2019 | | 2018 | | 2019 | | 2018 | | 2020 | | 2019 |
(Losses) gains recognized in AOCI | | $ | (598 | ) | | $ | 4,938 |
| | $ | (2,603 | ) | | $ | 3,785 |
| |
| Gains recognized in AOCI | | | $ | 1,004 |
| | $ | 2,005 |
|
|
Derivatives Not Designated as Hedging Instruments
Interest Rate Contracts — The Company enters into interest rate contracts, which include interest rate swaps and options with its customers to allow customers to hedge against the risk of rising interest rates on their variable rate loans. To economically hedge against the interest rate risks in the products offered to its customers, the Company enters into mirrored offsetting interest rate contracts with third-party financial institutions, including central clearing organizations. Beginning in January 2018, the London Clearing House (“LCH”) amended its rulebook to legally characterize variation margin payments made to and received from LCH as settlements of derivatives, and not as collateral against derivatives. Included in the total notional amount of $6.74$8.34 billion of interest rates contracts entered into with financial counterparties as of June 30, 2019,March 31, 2020, was a notional amount of $2.08$2.68 billion of interest rate swaps that cleared through LCH. Applying variation margin payments as settlement to LCH cleared derivative transactions resulted in a reduction in derivative liability fair values of $213.9 million, as of March 31, 2020. In comparison, included in the total notional amount of $5.85$7.75 billion of interest rates contracts entered into with financial counterparties as of December 31, 2018,2019, was a notional amount of $1.66$2.53 billion of interest rate swaps that cleared through LCH. Applying variation margin payments as settlement to LCH cleared derivative transactions resulted in a reduction in derivative asset fair valuevalues of $1.5$2.9 million and liability fair valuevalues of $73.5 million, as of June 30, 2019. In comparison, applying variation margin payments as settlement to LCH cleared derivative transactions resulted in a reduction in derivative asset fair value of $16.4 million and liability fair value of $16.0$75.1 million as of December 31, 2018.2019.
The following tables present the notional amounts and the gross fair values of interest rate derivative contracts outstanding as of June 30, 2019March 31, 2020 and December 31, 2018:2019:
| | | | ($ in thousands) | | June 30, 2019 | | March 31, 2020 |
| | Customer Counterparty | | ($ in thousands) | | Financial Counterparty | | Customer Counterparty | | ($ in thousands) | | Financial Counterparty |
| | Notional Amount | | Fair Value | | Notional Amount | | Fair Value | | Notional Amount | | Fair Value | | Notional Amount | | Fair Value |
| | | Assets | | Liabilities | | Assets | ($ in thousands) | Assets | | Liabilities | | | Assets | | Liabilities | | Assets | ($ in thousands) | Assets | | Liabilities |
| Written options | | $ | 975,369 |
| | $ | — |
| | $ | 62 |
| | Purchased options | | $ | 975,369 |
| | 64 |
| | $ | — |
| | $ | 897,893 |
| | $ | — |
| | $ | 179 |
| | Purchased options | | $ | 897,893 |
| | 180 |
| | $ | — |
|
| Sold collars and corridors | | 549,305 |
| | 3,277 |
| | 15 |
| | Collars and corridors | | 549,305 |
| | 15 |
| | 3,326 |
| | 518,307 |
| | 10,125 |
| | 2 |
| | Collars and corridors | | 518,307 |
| | 2 |
| | 10,215 |
|
| Swaps | | 5,207,158 |
| | 183,626 |
| | 4,795 |
| | Swaps | | 5,213,315 |
| | 3,406 |
| | 113,154 |
| | 6,900,299 |
| | 593,753 |
| | — |
| | Swaps | | 6,924,607 |
| | 1,062 |
| | 391,811 |
|
| Total | | $ | 6,731,832 |
| | $ | 186,903 |
| | $ | 4,872 |
| | Total | | $ | 6,737,989 |
| | $ | 3,485 |
| | $ | 116,480 |
| | $ | 8,316,499 |
| | $ | 603,878 |
| | $ | 181 |
| | Total | | $ | 8,340,807 |
| | $ | 1,244 |
| | $ | 402,026 |
|
|
| | | | ($ in thousands) | | December 31, 2018 | | December 31, 2019 |
| | Customer Counterparty | | ($ in thousands) | | Financial Counterparty | | Customer Counterparty | | ($ in thousands) | | Financial Counterparty |
| | Notional Amount | | Fair Value | | Notional Amount | | Fair Value | | Notional Amount | | Fair Value | | Notional Amount | | Fair Value |
| | | Assets | | Liabilities | | Assets | ($ in thousands) | Assets | | Liabilities | | | Assets | | Liabilities | | Assets | ($ in thousands) | Assets | | Liabilities |
| Written options | | $ | 931,601 |
| | $ | — |
| | $ | 492 |
| | Purchased options | | $ | 931,601 |
| | 503 |
| | $ | — |
| | $ | 1,003,558 |
| | $ | — |
| | $ | 66 |
| | Purchased options | | $ | 1,003,558 |
| | 67 |
| | $ | — |
|
| Sold collars and corridors | | 429,879 |
| | 1,121 |
| | 305 |
| | Collars and corridors | | 429,879 |
| | 308 |
| | 1,140 |
| | 490,852 |
| | 1,971 |
| | 16 |
| | Collars and corridors | | 490,852 |
| | 17 |
| | 1,996 |
|
| Swaps | | 4,482,881 |
| | 41,457 |
| | 41,545 |
| | Swaps | | 4,489,658 |
| | 26,429 |
| | 25,785 |
| | 6,247,667 |
| | 187,294 |
| | 6,237 |
| | Swaps | | 6,253,205 |
| | 3,534 |
| | 115,804 |
|
| Total | | $ | 5,844,361 |
| | $ | 42,578 |
| | $ | 42,342 |
| | Total | | $ | 5,851,138 |
| | $ | 27,240 |
| | $ | 26,925 |
| | $ | 7,742,077 |
| | $ | 189,265 |
| | $ | 6,319 |
| | Total | | $ | 7,747,615 |
| | $ | 3,618 |
| | $ | 117,800 |
|
|
Foreign Exchange Contracts — The Company enters into foreign exchange contracts with its customers, consisting of forwards, spot, swap and option contracts to accommodate the business needs of its customers. For a portion of the foreign exchange contracts entered into with its customers, the Company entersmanaged its foreign exchange exposure by entering into offsetting foreign exchange contracts with third-party financial institutions and/or entering into bilateral collateral and master netting agreements with customer counterparties to manage its credit exposure. The Company also utilizes foreign exchange contracts, which are not designated as hedging instruments to mitigate the economic effect of currency fluctuations on certain foreign currency-denominated on-balance sheet assets and liabilities, primarily for foreign currency-denominated deposits offered to its customers. A majority of the foreign exchange contracts havehad original maturities of one year or less as of June 30, 2019March 31, 2020 and December 31, 2018.2019.
The following tables present the notional amounts and the gross fair values of foreign exchange derivative contracts outstanding as of June 30, 2019March 31, 2020 and December 31, 2018:2019:
| | | | ($ in thousands) | | June 30, 2019 | | March 31, 2020 |
| | Customer Counterparty | | ($ in thousands) | | Financial Counterparty | | Customer Counterparty | | ($ in thousands) | | Financial Counterparty |
| | Notional Amount | | Fair Value | | Notional
Amount | | Fair Value | | Notional Amount | | Fair Value | | Notional
Amount | | Fair Value |
| | | Assets | | Liabilities | | Assets | ($ in thousands) | Assets | | Liabilities | | | Assets | | Liabilities | | Assets | ($ in thousands) | Assets | | Liabilities |
| Forwards and spot | | $ | 2,036,792 |
| | $ | 18,941 |
| | $ | 16,358 |
| | Forwards and spot | | $ | 246,962 |
| | 2,671 |
| | $ | 454 |
| | $ | 3,658,965 |
| | $ | 50,674 |
| | $ | 38,564 |
| | Forwards and spot | | $ | 176,903 |
| | 4,049 |
| | $ | 7,721 |
|
| Swaps | | 17,348 |
| | 374 |
| | 101 |
| | Swaps | | 768,763 |
| | 4,676 |
| | 4,480 |
| | 9,007 |
| | 4 |
| | 95 |
| | Swaps | | 773,059 |
| | 7,569 |
| | 7,256 |
|
| Written options | | 88,758 |
| | 422 |
| | — |
| | Purchased options | | 88,758 |
| | — |
| | 422 |
| | 86,810 |
| | 217 |
| | — |
| | Purchased options | | 86,810 |
| | — |
| | 217 |
|
| Collars | | 88,863 |
| | 288 |
| | 425 |
| | Collars | | 88,863 |
| | 425 |
| | 288 |
| | 2,205 |
| | 27 |
| | — |
| | Collars | | 165,075 |
| | 1,770 |
| | 1,774 |
|
| Total | | $ | 2,231,761 |
| | $ | 20,025 |
| | $ | 16,884 |
| | Total | | $ | 1,193,346 |
| | $ | 7,772 |
| | $ | 5,644 |
| | $ | 3,756,987 |
| | $ | 50,922 |
| | $ | 38,659 |
| | Total | | $ | 1,201,847 |
| | $ | 13,388 |
| | $ | 16,968 |
|
|
| | | | ($ in thousands) | | December 31, 2018 | | December 31, 2019 |
| | Customer Counterparty | | ($ in thousands) | | Financial Counterparty | | Customer Counterparty | | ($ in thousands) | | Financial Counterparty |
| | Notional Amount | | Fair Value | | Notional
Amount | | Fair Value | | Notional Amount | | Fair Value | | Notional
Amount | | Fair Value |
| | | Assets | | Liabilities | | Assets | ($ in thousands) | Assets | | Liabilities | | | Assets | | Liabilities | | Assets | ($ in thousands) | Assets | | Liabilities |
| Forwards and spot | | $ | 2,023,425 |
| | $ | 11,719 |
| | $ | 13,079 |
| | Forwards and spot | | $ | 506,342 |
| | 3,407 |
| | $ | 2,285 |
| | $ | 3,581,036 |
| | $ | 45,911 |
| | $ | 40,591 |
| | Forwards and spot | | $ | 207,492 |
| | 1,400 |
| | $ | 507 |
|
| Swaps | | 21,108 |
| | 348 |
| | 243 |
| | Swaps | | 687,845 |
| | 5,764 |
| | 3,336 |
| | 6,889 |
| | 16 |
| | 84 |
| | Swaps | | 702,391 |
| | 6,156 |
| | 4,712 |
|
| Written options | | 537 |
| | 16 |
| | — |
| | Purchased options | | 537 |
| | — |
| | 16 |
| | 87,036 |
| | 127 |
| | — |
| | Purchased options | | 87,036 |
| | — |
| | 127 |
|
| Collars | | 83,864 |
| | — |
| | 370 |
| | Collars | | 83,864 |
| | 370 |
| | — |
| | 2,244 |
| | — |
| | 14 |
| | Collars | | 165,537 |
| | 1,027 |
| | 989 |
|
| Total | | $ | 2,128,934 |
| | $ | 12,083 |
| | $ | 13,692 |
| | Total | | $ | 1,278,588 |
| | $ | 9,541 |
| | $ | 5,637 |
| | $ | 3,677,205 |
| | $ | 46,054 |
| | $ | 40,689 |
| | Total | | $ | 1,162,456 |
| | $ | 8,583 |
| | $ | 6,335 |
|
|
Credit Contracts — The Company may periodically enter into RPA contracts to manage itsthe credit exposure on interest rate contracts associated with syndicated loans. The Company may enter into protection sold or protection purchased RPAs with institutional counterparties. Under the RPA, the Company will receive or make a payment if a borrower defaults on the related interest rate contract. The Company manages its credit risk on RPAs by monitoring the creditworthiness of the borrowers and institutional counterparties, which is based on the Company’s normal credit review process. The referenced entities of the RPAs were investment grade as of both June 30, 2019March 31, 2020 and December 31, 2018.2019. The notional amount of the RPAs reflects the Company’s pro-rata share of the derivative instrument. The following table presents the notional amounts and the gross fair values of RPAs sold and purchased outstanding as of June 30, 2019March 31, 2020 and December 31, 2018:2019:
| | | | ($ in thousands) | | June 30, 2019 | | December 31, 2018 | | March 31, 2020 | | December 31, 2019 |
| | Notional Amount | | Fair Value | | Notional Amount | | Fair Value | | Notional Amount | | Fair Value | | Notional Amount | | Fair Value |
| | | Assets | | Liabilities | | Assets | | Liabilities | | | Assets | | Liabilities | | Assets | | Liabilities |
| RPAs - protection sold | | $ | 81,142 |
| | $ | — |
| | $ | 118 |
| | $ | 108,606 |
| | $ | — |
| | $ | 164 |
| | $ | 199,643 |
| | $ | — |
| | $ | 218 |
| | $ | 199,964 |
| | $ | — |
| | $ | 84 |
|
| RPAs - protection purchased | | 10,714 |
| | 3 |
| | — |
| | 10,714 |
| | 1 |
| | — |
| | 10,714 |
| | 8 |
| | — |
| | 10,714 |
| | 2 |
| | — |
|
| Total RPAs | | $ | 91,856 |
| | $ | 3 |
| | $ | 118 |
| | $ | 119,320 |
| | $ | 1 |
| | $ | 164 |
| | $ | 210,357 |
| | $ | 8 |
| | $ | 218 |
| | $ | 210,678 |
| | $ | 2 |
| | $ | 84 |
|
|
Assuming all underlying borrowers referenced in the interest rate contracts defaulted as of June 30, 2019March 31, 2020 and December 31, 2018,2019, the exposure from the RPAs with protections sold would be $26$688 thousand and $125 thousand, respectively. As of June 30, 2019March 31, 2020 and December 31, 2018,2019, the weighted-average remaining maturities of the outstanding RPAs were 4.61.9 years and 6.62.2 years, respectively.
Equity Contracts — As part of the Company’s loan origination process, from time to time, the Company obtained equityobtains warrants to purchase preferred andand/or common stock of technology and life sciences companies. Equity warrantscompanies it provides loans to. Warrants grant the Company the right to buy a certain class of the underlying company’s equity at a certain price before expiration. The Company held warrants in three2 public companies and 1718 private companies as of June 30, 2019,March 31, 2020, and held warrants in four3 public companies and 18 private companies as of December 31, 2018.2019. The total fair value of the warrants held in both public and private companies was a $2.0$1.1 million assetand $1.4 million in assets as of each June 30, 2019March 31, 2020 and December 31, 2018.2019, respectively.
Commodity Contracts — In 2018, theThe Company enteredenters into energy commodity contracts in the form of swaps and options with its commercial loan customers to allow them to hedge against the risk of fluctuation in energy commodity prices. To economically hedge against the risk of fluctuation in commodity prices in the products offered to its customers, the Company enteredenters into offsetting commodity contracts with third-party financial institutions to manage the exposure with its customers. Beginning in January 2017, the Chicago Mercantile Exchange (“CME”) amended its rulebook to legally characterize variation margin payments made to and received from CME as settlements of derivatives and not as collateral against derivatives. TheAs of March 31, 2020, the notional quantities that cleared through CME totaled 1,6971,582 thousand barrels ofcrude oil and 5,1505,290 thousand MMBTUs natural gas. Applying variation margin payments as settlement to CME-cleared derivative transactions resulted in reductions in gross derivative asset fair value of $39.6 million and liability fair value of $203 thousand, respectively, as of March 31, 2020, for a net asset fair value of $2.4 million. In comparison, the notional quantities that cleared through CME totaled 1,752 thousand barrels crude oil and 6,075 thousand MMBTUs natural gas as of June 30,December 31, 2019. Applying variation margin payments as settlement to CME-cleared derivative transactions resulted in a reduction in gross derivative asset fair value of $6.2$2.9 million and liability fair value of $13 thousand as of June 30, 2019, for a net liability fair value of $1.7 million. In comparison, the notional quantities that cleared through CME totaled 778 thousand barrels of oil and 6,290 thousand MMBTUs of natural gas$1.5 million, respectively, as of December 31, 2018. Applying variation margin payments as settlement to CME-cleared derivative transactions resulted in a reduction in gross derivative asset fair value of $10.4 million and liability fair value of $582 thousand as of December 31, 2018,2019, for a net asset fair value of $622$986 thousand.
The following tables present the notional amounts and fair values of the commodity derivative positions outstanding as of June 30, 2019March 31, 2020 and December 31, 2018:2019:
|
| | | | | | | | | | | | | | | | | | | | | | | | | | | | |
| |
($ and units in thousands) | | June 30, 2019 |
| | Customer Counterparty | | ($ and units in thousands) | | Financial Counterparty |
| | Notional | | Fair Value | | | Notional | | Fair Value |
| | Unit | | Amount | | Assets | | Liabilities | | | Unit | | Amount | | Assets | | Liabilities |
| Crude oil: | | | | | | | | | | Crude oil: | | | | | | | | |
| Written options | | Barrels | | 134 |
| | $ | 231 |
| | $ | 286 |
| | Purchased options | | Barrels | | 134 |
| | $ | 189 |
| | $ | 222 |
|
| Collars | | Barrels | | 2,082 |
| | 752 |
| | 1,506 |
| | Collars | | Barrels | | 2,697 |
| | 1,752 |
| | 1,069 |
|
| Swaps | | Barrels | | 3,430 |
| | 1,985 |
| | 10,167 |
| | Swaps | | Barrels | | 3,551 |
| | 7,622 |
| | 2,180 |
|
| Total | | | | 5,646 |
| | $ | 2,968 |
| | $ | 11,959 |
| | Total | | | | 6,382 |
| | $ | 9,563 |
| | $ | 3,471 |
|
| | | | | | | | | | | | | | | | | | | |
| Natural gas: | | | | | | | | | | Natural gas: | | | | | | | | |
| Collars | | MMBTUs | | 6,385 |
| | $ | 9 |
| | $ | 431 |
| | Collars | | MMBTUs | | 6,315 |
| | $ | 372 |
| | $ | 9 |
|
| Swaps | | MMBTUs | | 24,390 |
| | 3,027 |
| | 6,412 |
| | Swaps | | MMBTUs | | 26,807 |
| | 6,712 |
| | 3,624 |
|
| Total | | | | 30,775 |
| | $ | 3,036 |
| | $ | 6,843 |
| | Total | | | | 33,122 |
| | $ | 7,084 |
| | $ | 3,633 |
|
| Total | | | |
| | $ | 6,004 |
| | $ | 18,802 |
| | Total | | | |
| | $ | 16,647 |
| | $ | 7,104 |
|
| |
|
| | | | | | | | | | | | | | | | | | | | | | | | | | | | |
| |
($ and units in thousands) | | March 31, 2020 |
| | Customer Counterparty | | ($ and units in thousands) | | Financial Counterparty |
| | Notional Unit | | Fair Value | | | Notional Unit | | Fair Value |
| | | Assets | | Liabilities | | | | Assets | | Liabilities |
| Crude oil: | | | | | | | | | | Crude oil: | | | | | | | | |
| Written options | | 24 |
| | Barrels | | $ | — |
| | $ | 681 |
| | Purchased options | | 24 |
| | Barrels | | $ | 681 |
| | $ | — |
|
| Collars | | 2,522 |
| | Barrels | | 13 |
| | 46,210 |
| | Collars | | 2,859 |
| | Barrels | | 49,546 |
| | 3,732 |
|
| Swaps | | 4,192 |
| | Barrels | | 789 |
| | 87,097 |
| | Swaps | | 4,294 |
| | Barrels | | 54,366 |
| | 2,408 |
|
| Total | | 6,738 |
| |
| | $ | 802 |
| | $ | 133,988 |
| | Total | | 7,177 |
| |
| | $ | 104,593 |
| | $ | 6,140 |
|
| | | | | | | | | | | | | | | | | | | |
| Natural gas: | | | | | | | | | | Natural gas: | | | | | | | | |
| Written options | | 420 |
| | MMBTUs | | $ | — |
| | $ | 43 |
| | Purchased Options | | 410 |
| | MMBTUs | | $ | 22 |
| | $ | — |
|
| Collars | | 14,201 |
| | MMBTUs | | 541 |
| | 1,364 |
| | Collars | | 14,291 |
| | MMBTUs | | 996 |
| | 403 |
|
| Swaps | | 46,675 |
| | MMBTUs | | 25,791 |
| | 31,732 |
| | Swaps | | 46,500 |
| | MMBTUs | | 30,818 |
| | 25,618 |
|
| Total | | 61,296 |
| |
| | $ | 26,332 |
| | $ | 33,139 |
| | Total | | 61,201 |
| |
| | $ | 31,836 |
| | $ | 26,021 |
|
| Total | | | |
| | $ | 27,134 |
| | $ | 167,127 |
| | Total | | | |
| | $ | 136,429 |
| | $ | 32,161 |
|
| |
|
| | | | | | | | | | | | | | | | | | | | | | | | | | | | |
| |
($ and units
in thousands) | | December 31, 2019 |
| | Customer Counterparty | | ($ and units
in thousands) | | Financial Counterparty |
| | Notional Unit | | Fair Value | | | Notional Unit | | Fair Value |
| | | Assets | | Liabilities | | | | Assets | | Liabilities |
| Crude oil: | | | | | | | | | | Crude oil: | | | | | | | | |
| Written options | | 36 |
| | Barrels | �� | $ | — |
| | $ | 30 |
| | Purchased options | | 36 |
| | Barrels | | $ | 29 |
| | $ | — |
|
| Collars | | 3,174 |
| | Barrels | | 2,673 |
| | 538 |
| | Collars | | 3,630 |
| | Barrels | | 677 |
| | 2,815 |
|
| Swaps | | 4,601 |
| | Barrels | | 6,949 |
| | 5,531 |
| | Swaps | | 4,721 |
| | Barrels | | 4,516 |
| | 5,215 |
|
| Total | | 7,811 |
| |
| | $ | 9,622 |
| | $ | 6,099 |
| | Total | | 8,387 |
| |
| | $ | 5,222 |
| | $ | 8,030 |
|
| | | | | | | | | | | | | | | | | | | |
| Natural gas: | | | | | | | | | | Natural gas: | | | | | | | | |
| Written options | | 540 |
| | MMBTUs | | $ | — |
| | $ | 22 |
| | Purchased options | | 530 |
| | MMBTUs | | $ | 21 |
| | $ | — |
|
| Collars | | 14,277 |
| | MMBTUs | | 186 |
| | 522 |
| | Collars | | 14,517 |
| | MMBTUs | | 471 |
| | 150 |
|
| Swaps | | 48,956 |
| | MMBTUs | | 30,257 |
| | 35,497 |
| | Swaps | | 48,779 |
| | MMBTUs | | 35,601 |
| | 30,197 |
|
| Total | | 63,773 |
| |
| | $ | 30,443 |
| | $ | 36,041 |
| | Total | | 63,826 |
| |
| | $ | 36,093 |
| | $ | 30,347 |
|
| Total | | | | | | $ | 40,065 |
| | $ | 42,140 |
| | Total | | | | | | $ | 41,315 |
| | $ | 38,377 |
|
| |
|
| | | | | | | | | | | | | | | | | | | | | | | | | | | | |
| |
($ and units
in thousands) | | December 31, 2018 |
| | Customer Counterparty | | ($ and units
in thousands) | | Financial Counterparty |
| | Notional | | Fair Value | | | Notional | | Fair Value |
| | Unit | | Amount | | Assets | | Liabilities | | | Unit | | Amount | | Assets | | Liabilities |
| Crude oil: | | | | | | | | | | Crude oil: | | | | | | | | |
| Written options | | Barrels | | 524 |
| | $ | — |
| | $ | 2,628 |
| | Purchased options | | Barrels | | 524 |
| | $ | 2,251 |
| | $ | — |
|
| Collars | | Barrels | | 872 |
| | — |
| | 3,772 |
| | Collars | | Barrels | | 872 |
| | 3,225 |
| | — |
|
| Swaps | | Barrels | | 1,111 |
| | — |
| | 14,278 |
| | Swaps | | Barrels | | 1,111 |
| | 5,799 |
| | — |
|
| Total | | | | 2,507 |
| | $ | — |
| | $ | 20,678 |
| | Total | | | | 2,507 |
| | $ | 11,275 |
| | $ | — |
|
| | | | | | | | | | | | | | | | | | | |
| Natural gas: | | | | | | | | | | Natural gas: | | | | | | | | |
| Collars | | MMBTUs | | 3,063 |
| | $ | 78 |
| | $ | 152 |
| | Collars | | MMBTUs | | 3,063 |
| | $ | 151 |
| | $ | 64 |
|
| Swaps | | MMBTUs | | 11,659 |
| | 1,049 |
| | 1,857 |
| | Swaps | | MMBTUs | | 11,659 |
| | 1,869 |
| | 317 |
|
| Total | | | | 14,722 |
| | $ | 1,127 |
| | $ | 2,009 |
| | Total | | | | 14,722 |
| | $ | 2,020 |
| | $ | 381 |
|
| Total | | | | | | $ | 1,127 |
| | $ | 22,687 |
| | Total | | | | | | $ | 13,295 |
| | $ | 381 |
|
| |
The following table presents the net (losses) gains recognized on the Company’s Consolidated Statement of Income related to derivatives not designated as hedging instruments for the three and six months ended June 30, 2019March 31, 2020 and 2018:2019:
| | | | ($ in thousands) | | Classification on Consolidated Statement of Income | | Three Months Ended June 30, | | Six Months Ended June 30, | | Classification on Consolidated Statement of Income | | Three Months Ended March 31, |
| | | 2019 | | 2018 | | 2019 | | 2018 | | | 2020 | | 2019 |
| Derivatives not designated as hedging instruments: | | | | | | | | | | | | |
| Interest rate contracts | | Interest rate contracts and other derivative income | | $ | (1,359 | ) | | $ | 88 |
| | $ | (3,138 | ) | | $ | 1,194 |
| | Interest rate contracts and other derivative income | | $ | (7,011 | ) | | $ | (1,779 | ) |
| Foreign exchange contracts | | Foreign exchange income | | 3,495 |
| | 2,646 |
| | 9,821 |
| | 6,503 |
| | Foreign exchange income | | 2,861 |
| | 6,326 |
|
| Credit contracts | | Interest rate contracts and other derivative income | | (36 | ) | | (56 | ) | | 47 |
| | (69 | ) | | Interest rate contracts and other derivative income | | (23 | ) | | 83 |
|
| Equity contracts | | Lending fees | | 917 |
| | 598 |
| | 1,167 |
| | 439 |
| | Lending fees | | 309 |
| | 250 |
|
| Commodity contracts | | Interest rate contracts and other derivative income | | (22 | ) | | 40 |
| | (18 | ) | | 40 |
| | Interest rate contracts and other derivative income | | 24 |
| | 4 |
|
| Net gains | | $ | 2,995 |
| | $ | 3,316 |
| | $ | 7,879 |
| | $ | 8,107 |
| |
| Net (losses) gains | | | $ | (3,840 | ) | | $ | 4,884 |
|
|
Credit-Risk-RelatedCredit Risk-Related Contingent Features — Certain over-the-counter derivative contracts of the Company contain early termination provisions that may require the Company to settle any outstanding balances upon the occurrence of a specified credit-risk-relatedcredit risk-related event. These events, which are defined by the existing derivative contracts, primarily relate to a downgrade in the credit rating of East West Bank to below investment grade. As of June 30, 2019,March 31, 2020, the netaggregate fair value amounts of all derivative instruments with such credit-risk-relatedcredit risk-related contingent features wasthat are in a $52.9 million net liability position comprising $1.0totaled $139.1 million, in which $138.9 million in cash and securities collateral were posted to cover this position. As of December 31, 2019, the aggregate fair value amounts of all derivative instruments with credit risk-related contingent features that are in a net liability position totaled $56.4 million, which includes $14.4 million in derivative assets and $53.9$70.8 million in derivative liabilities; the associatedliabilities. We posted $56.4 million in cash and securities collateral was $52.7 million. Asto cover these positions as of December 31, 2018, the net fair value of all derivative instruments with such credit-risk-related contingent features was a $11.4 million net liability position, comprising $2.8 million in derivative assets and $14.2 million in derivative liabilities; the associated posted collateral was $9.4 million.2019. In the event that the credit rating of East West Bank had been downgraded to below investment grade, additional minimal additional collateral would have been required to be posted as of both June 30, 2019March 31, 2020, and December 31, 2018.2019.
Offsetting of Derivatives
The following tables present the gross derivative fair values, the balance sheet netting adjustments and the resulting net fair values recorded on the Consolidated Balance Sheet,consolidated balance sheet, as well as the cash and non-cash collateral associated with master netting arrangements. The gross amounts of derivative assets and liabilities are presented after the application of variation margin payments as settlements with centrally cleared organizations, where applicable. The collateral amounts in the following tables are limited to the outstanding balances of the related asset or liability, after the application of netting; therefore instances of overcollateralization are not shown:
|
| | | | | | | | | | | | | | | | | | | | | | | | |
| |
| ($ in thousands) | | June 30, 2019 |
| | | Gross
Amounts
Recognized (1) | | Gross Amounts Offset
on the
Consolidated Balance Sheet | | Net Amounts
Presented
on the
Consolidated
Balance Sheet | | Gross Amounts Not Offset
on the
Consolidated Balance Sheet | | Net Amount |
| | | Master Netting Arrangements | | Cash Collateral Received (3) | | | Security Collateral
Received (5) | |
| Derivative Assets | | $ | 242,876 |
| | $ | (40,372 | ) | | $ | (3,831 | ) | | $ | 198,673 |
| | $ | — |
| | $ | 198,673 |
|
| | | | | | | | | | | | | |
| | | Gross Amounts Recognized (2) | | Gross Amounts Offset
on the
Consolidated Balance Sheet | | Net Amounts
Presented
on the
Consolidated
Balance Sheet | | Gross Amounts Not Offset
on the
Consolidated Balance Sheet | | Net Amount |
| | | Master Netting Arrangements | | Cash Collateral Pledged (4) | | | Security Collateral
Pledged (5) | |
| Derivative Liabilities | | $ | 172,923 |
| | $ | (40,372 | ) | | $ | (34,122 | ) | | $ | 98,429 |
| | $ | (76,434 | ) | | $ | 21,995 |
|
| |
|
| | | | | | | | | | | | | | | | | | | | | | | | |
| |
| ($ in thousands) | | As of March 31, 2020 |
| | | Gross
Amounts
Recognized (1) | | Gross Amounts Offset
on the
Consolidated Balance Sheet | | Net Amounts
Presented
on the
Consolidated
Balance Sheet | | Gross Amounts Not Offset
on the
Consolidated Balance Sheet | | Net Amount |
| | | Master Netting Arrangements | | Cash Collateral Received (3) | | | Security Collateral
Received (5) | |
| Derivative assets | | $ | 834,204 |
| | $ | (158,674 | ) | | $ | (20,100 | ) | | $ | 655,430 |
| | $ | (29,103 | ) | | $ | 626,327 |
|
| | | Gross Amounts Recognized (2) | | Gross Amounts Offset
on the
Consolidated Balance Sheet | | Net Amounts
Presented
on the
Consolidated
Balance Sheet | | Gross Amounts Not Offset
on the
Consolidated Balance Sheet | | Net Amount |
| | | Master Netting Arrangements | | Cash Collateral Pledged (4) | | | Security Collateral
Pledged (5) | |
| Derivative liabilities | | $ | 658,515 |
| | $ | (158,674 | ) | | $ | (84,427 | ) | | $ | 415,414 |
| | $ | (232,940 | ) | | $ | 182,474 |
|
| |
|
| | | | | | | | | | | | | | | | | | | | | | | | |
| |
| ($ in thousands) | | December 31, 2018 |
| | | Gross
Amounts
Recognized (1) | | Gross Amounts Offset
on the
Consolidated Balance Sheet | | Net Amounts
Presented
on the
Consolidated
Balance Sheet | | Gross Amounts Not Offset
on the
Consolidated Balance Sheet | | Net Amount |
| | | Master Netting Arrangements | | Cash Collateral Received (3) | | | Security Collateral
Received (5) | |
| Derivative Assets | | $ | 107,816 |
| | $ | (31,569 | ) | | $ | (13,577 | ) | | $ | 62,670 |
| | $ | (13,975 | ) | | $ | 48,695 |
|
| | | | | | | | | | | | | |
| | | Gross Amounts Recognized (2) | | Gross Amounts Offset
on the
Consolidated Balance Sheet | | Net Amounts
Presented
on the
Consolidated
Balance Sheet | | Gross Amounts Not Offset
on the
Consolidated Balance Sheet | | Net Amount |
| | | Master Netting Arrangements | | Cash Collateral Pledged (4) | | | Security Collateral
Pledged (5) | |
| Derivative Liabilities | | $ | 118,305 |
| | $ | (31,569 | ) | | $ | (6,833 | ) | | $ | 79,903 |
| | $ | (11,231 | ) | | $ | 68,672 |
|
| |
|
| | | | | | | | | | | | | | | | | | | | | | | | |
| |
| ($ in thousands) | | As of December 31, 2019 |
| | | Gross
Amounts
Recognized (1) | | Gross Amounts Offset
on the
Consolidated Balance Sheet | | Net Amounts
Presented
on the
Consolidated
Balance Sheet | | Gross Amounts Not Offset
on the
Consolidated Balance Sheet | | Net Amount |
| | | Master Netting Arrangements | | Cash Collateral Received (3) | | | Security Collateral
Received (5) | |
| Derivative assets | | $ | 330,316 |
| | $ | (121,561 | ) | | $ | (3,758 | ) | | $ | 204,997 |
| | $ | — |
| | $ | 204,997 |
|
| | | Gross Amounts Recognized (2) | | Gross Amounts Offset
on the
Consolidated Balance Sheet | | Net Amounts
Presented
on the
Consolidated
Balance Sheet | | Gross Amounts Not Offset
on the
Consolidated Balance Sheet | | Net Amount |
| | | Master Netting Arrangements | | Cash Collateral Pledged (4) | | | Security Collateral
Pledged (5) | |
| Derivative liabilities | | $ | 256,528 |
| | $ | (121,561 | ) | | $ | (38,238 | ) | | $ | 96,729 |
| | $ | (79,619 | ) | | $ | 17,110 |
|
| |
| |
| (1) | Gross amounts recognized for derivative assets include amounts with counterparties subject to enforceable master netting arrangements or similar agreements of $240.8$831.9 million and $105.9$328.7 million, respectively, as of June 30, 2019March 31, 2020 and December 31, 2018,2019, and amounts with counterparties not subject to enforceable master netting arrangements or similar agreements of $2.1$2.3 million and $2.0$1.6 million, respectively, as of June 30, 2019March 31, 2020 and December 31, 2018. 2019. |
| |
| (2) | Gross amounts recognized for derivative liabilities include amounts with counterparties subject to enforceable master netting arrangements or similar agreements of $172.9$657.6 million and $118.2$256.5 million, respectively, as of June 30, 2019March 31, 2020 and December 31, 2018,2019, and amounts with counterparties not subject to enforceable master netting arrangements or similar agreements of $17$931 thousand and $102$20 thousand, respectively, as of June 30, 2019March 31, 2020 and December 31, 2018.2019. |
| |
| (3) | Gross cash collateral received under master netting arrangements or similar agreements were $4.6$20.1 million and $15.8$3.8 million, respectively, as of June 30, 2019March 31, 2020 and December 31, 2018.2019. Of the gross cash collateral received, $3.8$20.1 million and $13.6$3.8 million were used to offset against derivative assets, respectively, as of June 30, 2019March 31, 2020 and December 31, 2018.2019. |
| |
| (4) | Gross cash collateral pledged under master netting arrangements or similar agreements were $36.4$89.8 million and $8.4$43.0 million, respectively, as of June 30, 2019March 31, 2020 and December 31, 2018.2019. Of the gross cash collateral pledged, $34.1$84.4 million and $6.8$38.2 million were used to offset against derivative liabilities, respectively, as of June 30, 2019March 31, 2020 and December 31, 2018.2019. |
| |
| (5) | Represents the fair value of security collateral received and pledged limited to derivative assets and liabilities that are subject to enforceable master netting arrangements or similar agreements. GAAP does not permit the netting of non-cash collateral on the Consolidated Balance Sheetconsolidated balance sheet but requires disclosure of such amounts. |
In addition to the amounts included in the tables above, the Company also has balance sheet netting related to the resale and repurchase agreements. Refer to Note 54 — Securities Purchased under Resale Agreements and Sold under Repurchase Agreements to the Consolidated Financial Statements in this Form 10-Q for additional information. Refer to Note 43 — Fair Value Measurement and Fair Value of Financial Instruments to the Consolidated Financial Statements in this Form 10-Q for fair value measurement disclosures on derivatives.
Note 87 — Loans Receivable and Allowance for Credit Losses
On January 1, 2020, the Company adopted ASU 2016-13 using the modified retrospective method through a cumulative-effect adjustment to retained earnings. Balance sheet information and results for reporting periods beginning with January 1, 2020 are presented under ASC 326, while prior period comparisons continue to be presented under legacy GAAP. ASU 2016-13 also introduces the concept of PCD financial assets, which replaces PCI assets. The Company’s held-for-investment loan portfolio includescomprises both originated and purchased loans. OriginatedThe Company adopted ASU 2016-13 using the prospective transition approach for PCD assets that were previously classified as PCI. Prior to January 1, 2020, originated loans and purchased loans with no evidence of credit deterioration at their acquisition date arewere referred to collectively as non-PCI loans.loans; while PCI loans arewere loans acquired with evidence of credit deterioration since their originationacquisition date, and for which it iswas probable at the acquisition date that the Company would be unable to collect all contractually required payments. PCI loans are accounted for under ASC Subtopic 310-30, Loans and Debt Securities Acquired with Deteriorated Credit Quality. The Company has elected to account for PCI loans on a pool level basis under ASC 310-30 at the time of acquisition.
The following table presents the composition of the Company’s non-PCI and PCI loans held-for-investment as of June 30, 2019March 31, 2020 and December 31, 2018:2019:
| | | | ($ in thousands) | | June 30, 2019 | | December 31, 2018 | | March 31, 2020 | | December 31, 2019 |
| | Non-PCI Loans (1) | | PCI Loans (2) | | Total (1)(2) | | Non-PCI Loans (1) | | PCI Loans (2) | | Total (1)(2) | | Amortized Cost (1) | | Non-PCI Loans (1) | | PCI Loans | | Total (1) |
| Commercial: | | | | | | | | | | | | | | | | | | | | |
| C&I | | $ | 12,401,090 |
| | $ | 1,877 |
| | $ | 12,402,967 |
| | $ | 12,054,818 |
| | $ | 2,152 |
| | $ | 12,056,970 |
| | $ | 12,590,764 |
| | $ | 12,149,121 |
| | $ | 1,810 |
| | $ | 12,150,931 |
|
| CRE: | | | | | | | | | |
| CRE | | 9,722,582 |
| | 145,851 |
| | 9,868,433 |
| | 9,284,583 |
| | 165,252 |
| | 9,449,835 |
| | 10,682,242 |
| | 10,165,247 |
| | 113,201 |
| | 10,278,448 |
|
| Multifamily residential | | 2,347,751 |
| | 24,594 |
| | 2,372,345 |
| | 2,246,506 |
| | 34,526 |
| | 2,281,032 |
| | 2,902,601 |
| | 2,834,212 |
| | 22,162 |
| | 2,856,374 |
|
| Construction and land | | 674,757 |
| | 41 |
| | 674,798 |
| | 538,752 |
| | 42 |
| | 538,794 |
| | 606,209 |
| | 628,459 |
| | 40 |
| | 628,499 |
|
| Total CRE | | | 14,191,052 |
| | 13,627,918 |
| | 135,403 |
| | 13,763,321 |
|
| Total commercial | | 25,146,180 |
| | 172,363 |
| | 25,318,543 |
| | 24,124,659 |
| | 201,972 |
| | 24,326,631 |
| | 26,781,816 |
| | 25,777,039 |
| | 137,213 |
| | 25,914,252 |
|
| Consumer: | | | | | | | | | | | | | | | | | | | | |
| Residential mortgage: | | | | | | | | | |
| Single-family residential | | 6,403,628 |
| | 91,254 |
| | 6,494,882 |
| | 5,939,258 |
| | 97,196 |
| | 6,036,454 |
| | 7,403,723 |
| | 7,028,979 |
| | 79,611 |
| | 7,108,590 |
|
| HELOCs | | 1,567,900 |
| | 7,250 |
| | 1,575,150 |
| | 1,681,979 |
| | 8,855 |
| | 1,690,834 |
| | 1,452,862 |
| | 1,466,736 |
| | 6,047 |
| | 1,472,783 |
|
| Total residential mortgage | | | 8,856,585 |
| | 8,495,715 |
| | 85,658 |
| | 8,581,373 |
|
| Other consumer | | 341,802 |
| | — |
| | 341,802 |
| | 331,270 |
| | — |
| | 331,270 |
| | 254,992 |
| | 282,914 |
| | — |
| | 282,914 |
|
| Total consumer | | 8,313,330 |
| | 98,504 |
| | 8,411,834 |
| | 7,952,507 |
| | 106,051 |
| | 8,058,558 |
| | 9,111,577 |
| | 8,778,629 |
| | 85,658 |
| | 8,864,287 |
|
| Total loans held-for-investment | | $ | 33,459,510 |
| | $ | 270,867 |
| | $ | 33,730,377 |
| | $ | 32,077,166 |
| | $ | 308,023 |
| | $ | 32,385,189 |
| | $ | 35,893,393 |
| | $ | 34,555,668 |
| | $ | 222,871 |
| | $ | 34,778,539 |
|
| Allowance for loan losses | | (330,620 | ) | | (5 | ) | | (330,625 | ) | | (311,300 | ) | | (22 | ) | | (311,322 | ) | | (557,003 | ) | | (358,287 | ) | | — |
| | (358,287 | ) |
| Loans held-for-investment, net | | $ | 33,128,890 |
| | $ | 270,862 |
| | $ | 33,399,752 |
| | $ | 31,765,866 |
| | $ | 308,001 |
| | $ | 32,073,867 |
| | $ | 35,336,390 |
| | $ | 34,197,381 |
| | $ | 222,871 |
| | $ | 34,420,252 |
|
|
| |
| (1) | Includes net deferred loan fees, unearned fees, unamortized premiums and unaccreted discounts of $(43.8)$(50.3) million and $(48.9)$(43.2) million as of June 30, 2019March 31, 2020 and December 31, 2018, respectively. |
| |
(2) | Includes ASC 310-30 discount of $18.9 million and $22.2 million as of June 30, 2019, and December 31, 2018, respectively. |
The commercial portfolio includes C&I, CRE, multifamily residential, and construction and land loans. The consumer portfolio includes single-family residential, HELOC and other consumer loans.
The C&I loan portfolio which is comprised of commercial businessincludes loans and trade finance loans, provides financing tofor businesses in a wide spectrum of industries.industries and includes asset-based lending, equipment financing and leasing, project-based finance, revolving lines of credit, Small Business Administration lending, structured finance, term loans and trade finance. The CRE loan portfolio consists of income producing real estate loans that are either owner occupied or non-owner occupied; non-owner occupied whereproperties are defined as those for which 50% or more of the loan debt service for the loan is primarily provided by unaffiliated rental income from a third party. The multifamily residential loan portfolio is largely comprisedconsists of loans secured by smaller multifamilyresidential properties ranging from five to 15 units in the Bank’s primary lending areas.with 5 or more units. Construction and land loans mainly provide construction financing for multifamily residential, hotels, offices, industrial and industrial projects.retail projects, and financing for the purchase of land.
In theThe consumer portfolio the Company offersincludes single-family residential loans and HELOCs originated by the Company through a variety of mortgage loan programs. A substantial number of these loans are originated through a reduced documentation loan program, in which a substantiallarge down payment is required, resulting in a low loan-to-value (“LTV”) ratio at origination, typically 60% or less. The Company is in a first lien position for many of thesevirtually all reduced documentation single-family residential loans and for most of the HELOCs. These loans have historically experienced low delinquency and defaultloss rates. Other consumer loans are mainly comprised ofconsumer insurance premium financing loans.financing.
Loans held-for-investments’ accrued interest receivable was $117.6 million and $121.8 million as of March 31, 2020 and December 31, 2019, respectively. Approximately $366 thousand of interest income related to nonaccrual loans was reversed during the three months ended March 31, 2020 and there was 0 interest income recognized on nonaccrual loans for the three months ended March 31, 2020. For our accounting policy related to held-for-investment loans’ accrued interest receivable, see Note 2 — Summary of Significant Accounting Policies to the Consolidated Financial Statements in this Form 10-Q.
As of June 30, 2019March 31, 2020 and December 31, 2018,2019, loans of $21.06$23.11 billion and $20.59$22.43 billion, respectively, were pledged to secure borrowings and provide additional borrowing capacity from the FRB and the FHLB.
Credit Quality Indicators
All loans are subject to the Company’s internal and external credit review and monitoring. For the commercial portfolio, loans are risk rated based on an analysis of the current state of the borrower’s credit quality. The analysis of credit quality includes a review of all repayment sources, the borrower’s current payment performance or delinquency, currentrepayment sources, financial and liquidity status,factors, including industry and all other relevant information.geographic considerations. For the majority of the consumer portfolio, payment performance or delinquency is the driving indicator for the risk ratings. Risk
For the Company’s internal credit risk ratings, are the overall credit quality indicator for the Company and the credit quality indicatoreach individual loan is utilized for estimating the appropriate allowance for loan losses. Thegiven a risk rating system classifiesof 1 through 10. Loans risk rated 1 through 5 are assigned an internal risk rating of “Pass”, with loans within the following categories:risk rated 1 being fully secured by cash or U.S. government securities. Pass Watch, Special Mention, Substandard, Doubtful and Loss. The risk ratings reflect the relative strength of the repayment sources.
Pass and Watch loans are loans that have sufficient sources of repayment in order to repay the loan in full, in accordance with all terms and conditions. Special Mention loans are loans thatLoans assigned a risk rating of 6 have potential weaknesses that warrant closer attention by management. Special Mention ismanagement; these are assigned an internal risk rating of “Special Mention”. Loans assigned a transitory grade. If the potential weaknesses are resolved, a loan is upgraded to a Passrisk rating of 7 or Watch grade. If negative trends in the borrower’s financial status or other information indicate that the sources of repayment may become inadequate, a loan is downgraded to a Substandard grade. Substandard loans8 have well-defined weaknesses that may jeopardize the full and timely repayment of the loan. Substandard loans have the distinct possibilityloan; these are assigned an internal risk rating of loss, if the deficiencies are not corrected. When management has assessed that there is potential for loss, but“Substandard”. Loans assigned a distinct possibilityrisk rating of loss is not yet recognizable, the loan remains classified as Substandard grade. Doubtful loans are loans that9 have insufficient sources of repayment and a high probability of loss. Loss loansloss; these are loans thatassigned an internal risk rating of “Doubtful”. Loans assigned a risk rating of 10 are uncollectibleuncollectable and of such little value that they are no longer considered bankable assets. Theseassets; these are assigned an internal risk rating of “Loss”. The loans’ internal risk ratings are reviewed routinely and adjusted based on changes in the borrowers’ financial status and the loans’ collectability. These risk ratings were updated as of March 31, 2020.
The following table summarizes the Company’s loans held-for-investment as of March 31, 2020, presented by loan portfolio segments, internal risk ratings and vintage year. The vintage year is the year of origination, renewal or major modification.
|
| | | | | | | | | | | | | | | | | | | | | | | | | | | | | | | | | | | | |
| |
| ($ in thousands) | | March 31, 2020 |
| | Term Loans | | Revolving Loans Amortized Cost Basis | | Revolving Loans Converted to Term Loans Amortized Cost Basis | | Total |
| | Amortized Cost Basis by Origination Year | | | |
| | 2020 | | 2019 | | 2018 | | 2017 | | 2016 | | Prior | | | |
| Commercial: | | | | | | | | | | | | | | | | | | |
| C&I: | | | | | | | | | | | | | | | | | |
|
|
| Pass | | $ | 884,043 |
| | $ | 2,320,726 |
| | $ | 830,428 |
| | $ | 381,798 |
| | $ | 94,032 |
| | $ | 411,215 |
| | $ | 6,945,982 |
| | $ | 10,081 |
| | $ | 11,878,305 |
|
| Special mention | | 21,388 |
| | 98,629 |
| | 16,948 |
| | 27,701 |
| | 1,064 |
| | 10,600 |
| | 218,835 |
| | — |
| | 395,165 |
|
| Substandard | | 4,324 |
| | 65,448 |
| | 27,200 |
| | 40,985 |
| | 13,431 |
| | 2,196 |
| | 147,012 |
| | — |
| | 300,596 |
|
| Doubtful | | — |
| | 15,654 |
| | — |
| | — |
| | 1,044 |
| | — |
| | — |
| | — |
| | 16,698 |
|
| Total C&I | | 909,755 |
| | 2,500,457 |
| | 874,576 |
| | 450,484 |
| | 109,571 |
| | 424,011 |
| | 7,311,829 |
| | 10,081 |
| | 12,590,764 |
|
| CRE: | | | | | | | | | | | | | | | | | |
|
|
| Pass | | 1,023,184 |
| | 2,994,402 |
| | 2,319,358 |
| | 1,317,389 |
| | 739,774 |
| | 1,926,748 |
| | 157,889 |
| | 10,775 |
| | 10,489,519 |
|
| Special mention | | 3,636 |
| | 66,004 |
| | 15,438 |
| | 19,896 |
| | 674 |
| | 10,518 |
| | — |
| | — |
| | 116,166 |
|
| Substandard | | 5,540 |
| | 29,695 |
| | 2,415 |
| | 18,900 |
| | 520 |
| | 19,487 |
| | — |
| | — |
| | 76,557 |
|
| Total CRE | | 1,032,360 |
| | 3,090,101 |
| | 2,337,211 |
| | 1,356,185 |
| | 740,968 |
| | 1,956,753 |
| | 157,889 |
| | 10,775 |
| | 10,682,242 |
|
| Multifamily residential: | | | | | | | | | | | | | | | | | |
|
|
| Pass | | 293,032 |
| | 1,091,261 |
| | 489,564 |
| | 408,783 |
| | 212,174 |
| | 372,554 |
| | 5,386 |
| | — |
| | 2,872,754 |
|
| Special mention | | — |
| | 21,164 |
| | 1,893 |
| | — |
| | — |
| | 521 |
| | — |
| | — |
| | 23,578 |
|
| Substandard | | — |
| | — |
| | 285 |
| | — |
| | — |
| | 5,984 |
| | — |
| | — |
| | 6,269 |
|
| Total multifamily residential | | 293,032 |
| | 1,112,425 |
| | 491,742 |
| | 408,783 |
| | 212,174 |
| | 379,059 |
| | 5,386 |
| | — |
| | 2,902,601 |
|
| Construction and land: | | | | | | | | | | | | | | | | | |
|
|
| Pass | | 67,143 |
| | 316,396 |
| | 159,847 |
| | 15,630 |
| | 21,048 |
| | 1,183 |
| | — |
| | — |
| | 581,247 |
|
| Substandard | | 1,608 |
| | 3,662 |
| | — |
| | — |
| | — |
| | 19,692 |
| | — |
| | — |
| | 24,962 |
|
| Total construction and land | | 68,751 |
| | 320,058 |
| | 159,847 |
| | 15,630 |
| | 21,048 |
| | 20,875 |
| | — |
| | — |
| | 606,209 |
|
| Total CRE | | 1,394,143 |
| | 4,522,584 |
| | 2,988,800 |
| | 1,780,598 |
| | 974,190 |
| | 2,356,687 |
| | 163,275 |
| | 10,775 |
| | 14,191,052 |
|
| Total commercial | | 2,303,898 |
| | 7,023,041 |
| | 3,863,376 |
| | 2,231,082 |
| | 1,083,761 |
| | 2,780,698 |
| | 7,475,104 |
| | 20,856 |
|
| 26,781,816 |
|
| Consumer: | | | | | | | | | | | | | | | | | | |
| Single-family residential: | | | | | | | | | | | | | | | | | | |
| Pass | | 612,040 |
| | 2,043,504 |
| | 1,775,928 |
| | 1,218,685 |
| | 624,427 |
| | 1,099,351 |
| | — |
| | — |
| | 7,373,935 |
|
| Special mention | | — |
| | 238 |
| | 1,639 |
| | 1,253 |
| | 2,811 |
| | 6,796 |
| | — |
| | — |
| | 12,737 |
|
| Substandard | | — |
| | 839 |
| | 1,733 |
| | 3,180 |
| | 1,158 |
| | 10,141 |
| | — |
| | — |
| | 17,051 |
|
| Total single-family residential mortgage | | 612,040 |
| | 2,044,581 |
| | 1,779,300 |
| | 1,223,118 |
| | 628,396 |
| | 1,116,288 |
| | — |
| | — |
| | 7,403,723 |
|
| HELOCs: | | | | | | | | | | | | | | | | | | |
| Pass | | — |
| | — |
| | 3,182 |
| | 5,980 |
| | 6,525 |
| | 19,809 |
| | 1,260,844 |
| | 142,090 |
| | 1,438,430 |
|
| Special mention | | — |
| | — |
| | 700 |
| | — |
| | 165 |
| | 1,945 |
| | 571 |
| | 605 |
| | 3,986 |
|
| Substandard | | — |
| | 150 |
| | 289 |
| | 2,611 |
| | 1,145 |
| | 4,789 |
| | — |
| | 1,462 |
| | 10,446 |
|
| Total HELOCs | | — |
| | 150 |
| | 4,171 |
| | 8,591 |
| | 7,835 |
| | 26,543 |
| | 1,261,415 |
| | 144,157 |
| | 1,452,862 |
|
| Total residential mortgage | | 612,040 |
| | 2,044,731 |
| | 1,783,471 |
| | 1,231,709 |
| | 636,231 |
| | 1,142,831 |
| | 1,261,415 |
| | 144,157 |
| | 8,856,585 |
|
| Other consumer: | | | | | | | | | | | | | | | | | | |
| Pass | | 3,951 |
| | 4,440 |
| | 2,637 |
| | 1,885 |
| | 18 |
| | 198,988 |
| | 40,556 |
| | — |
| | 252,475 |
|
| Special mention | | 11 |
| | — |
| | — |
| | — |
| | — |
| | — |
| | — |
| | — |
| | 11 |
|
| Substandard | | — |
| | — |
| | — |
| | 2,491 |
| | — |
| | 3 |
| | 12 |
| | — |
| | 2,506 |
|
| Total other consumer | | 3,962 |
| | 4,440 |
| | 2,637 |
| | 4,376 |
| | 18 |
| | 198,991 |
| | 40,568 |
| | — |
| | 254,992 |
|
| Total consumer | | 616,002 |
| | 2,049,171 |
| | 1,786,108 |
| | 1,236,085 |
| | 636,249 |
| | 1,341,822 |
| | 1,301,983 |
| | 144,157 |
| | 9,111,577 |
|
| Total | | $ | 2,919,900 |
| | $ | 9,072,212 |
| | $ | 5,649,484 |
| | $ | 3,467,167 |
| | $ | 1,720,010 |
| | $ | 4,122,520 |
| | $ | 8,777,087 |
| | $ | 165,013 |
| | $ | 35,893,393 |
|
| |
Revolving loans that are converted to term loans presented in the table above are excluded from the term loans by vintage year columns. During the three months ended March 31, 2020, $31.3 million of HELOCs converted to term loans and there were 0 conversions for C&I or CRE loans.
The following tables present the credit risk ratings for non-PCI loans by portfolio segment as of June 30, 2019 and December 31, 2018:
|
| | | | | | | | | | | | | | | | | | | | |
| |
| ($ in thousands) | | June 30, 2019 |
| | Pass/Watch | | Special Mention | | Substandard | | Doubtful | | Total Non-PCI Loans |
| Commercial: | | | | | | | | | | |
| C&I | | $ | 11,789,639 |
| | $ | 368,328 |
| | $ | 231,235 |
| | $ | 11,888 |
| | $ | 12,401,090 |
|
| CRE | | 9,531,912 |
| | 100,410 |
| | 90,260 |
| | — |
| | 9,722,582 |
|
| Multifamily residential | | 2,318,019 |
| | 20,380 |
| | 9,352 |
| | — |
| | 2,347,751 |
|
| Construction and land | | 620,665 |
| | 20,463 |
| | 33,629 |
| | — |
| | 674,757 |
|
| Total commercial | | 24,260,235 |
| | 509,581 |
| | 364,476 |
| | 11,888 |
| | 25,146,180 |
|
| Consumer: | | | | | | | | | | |
| Single-family residential | | 6,385,059 |
| | 1,471 |
| | 17,098 |
| | — |
| | 6,403,628 |
|
| HELOCs | | 1,550,377 |
| | 3,707 |
| | 13,816 |
| | — |
| | 1,567,900 |
|
| Other consumer | | 325,289 |
| | 14,009 |
| | 2,504 |
| | — |
| | 341,802 |
|
| Total consumer | | 8,260,725 |
| | 19,187 |
| | 33,418 |
| | — |
| | 8,313,330 |
|
| Total | | $ | 32,520,960 |
| | $ | 528,768 |
| | $ | 397,894 |
| | $ | 11,888 |
| | $ | 33,459,510 |
|
| |
|
| | | | | | | | | | | | | | | | | | | | |
| |
| ($ in thousands) | | December 31, 2018 |
| | Pass/Watch | | Special Mention | | Substandard | | Doubtful | | Total Non-PCI Loans |
| Commercial: | | | | | | | | | | |
| C&I | | $ | 11,644,470 |
| | $ | 260,089 |
| | $ | 139,844 |
| | $ | 10,415 |
| | $ | 12,054,818 |
|
| CRE | | 9,144,646 |
| | 49,705 |
| | 90,232 |
| | — |
| | 9,284,583 |
|
| Multifamily residential | | 2,215,573 |
| | 20,551 |
| | 10,382 |
| | — |
| | 2,246,506 |
|
| Construction and land | | 485,217 |
| | 19,838 |
| | 33,697 |
| | — |
| | 538,752 |
|
| Total commercial | | 23,489,906 |
| | 350,183 |
| | 274,155 |
| | 10,415 |
| | 24,124,659 |
|
| Consumer: | | | | | | | | | | |
| Single-family residential | | 5,925,584 |
| | 6,376 |
| | 7,298 |
| | — |
| | 5,939,258 |
|
| HELOCs | | 1,669,300 |
| | 1,576 |
| | 11,103 |
| | — |
| | 1,681,979 |
|
| Other consumer | | 328,767 |
| | 1 |
| | 2,502 |
| | — |
| | 331,270 |
|
| Total consumer | | 7,923,651 |
| | 7,953 |
| | 20,903 |
| | — |
| | 7,952,507 |
|
| Total | | $ | 31,413,557 |
| | $ | 358,136 |
| | $ | 295,058 |
| | $ | 10,415 |
| | $ | 32,077,166 |
|
| |
The following tables present the credit risk ratings for PCI loans by portfolio segmentsegments as of June 30, 2019 and December 31, 2018:2019:
| | | | ($ in thousands) | | June 30, 2019 | | December 31, 2019 |
| | Pass/Watch | | Special Mention | | Substandard | | Doubtful | | Total PCI Loans | | Pass | | Special Mention | | Substandard | | Doubtful | | Total Non-PCI Loans |
| Commercial: | | | | | | | | | | | | | | | | | | | | |
| C&I | | $ | 1,877 |
| | $ | — |
| | $ | — |
| | $ | — |
| | $ | 1,877 |
| | $ | 11,423,094 |
| | $ | 406,543 |
| | $ | 302,509 |
| | $ | 16,975 |
| | $ | 12,149,121 |
|
| CRE: | | | | | | | | | | | |
| CRE | | 127,083 |
| | 6 |
| | 18,762 |
| | — |
| | 145,851 |
| | 10,003,749 |
| | 83,683 |
| | 77,815 |
| | — |
| | 10,165,247 |
|
| Multifamily residential | | 23,856 |
| | — |
| | 738 |
| | — |
| | 24,594 |
| | 2,806,475 |
| | 20,406 |
| | 7,331 |
| | — |
| | 2,834,212 |
|
| Construction and land | | 41 |
| | — |
| | — |
| | — |
| | 41 |
| | 603,447 |
| | — |
| | 25,012 |
| | — |
| | 628,459 |
|
| Total CRE | | | 13,413,671 |
| | 104,089 |
| | 110,158 |
| | — |
| | 13,627,918 |
|
| Total commercial | | 152,857 |
| | 6 |
| | 19,500 |
| | — |
| | 172,363 |
| | 24,836,765 |
| | 510,632 |
| | 412,667 |
| | 16,975 |
| | 25,777,039 |
|
| Consumer: | | | | | | | | | | | | | | | | | | | | |
| Residential mortgage: | | | | | | | | | | |
|
|
| Single-family residential | | 89,623 |
| | 764 |
| | 867 |
| | — |
| | 91,254 |
| | 7,012,522 |
| | 2,278 |
| | 14,179 |
| | — |
| | 7,028,979 |
|
| HELOCs | | 6,868 |
| | — |
| | 382 |
| | — |
| | 7,250 |
| | 1,453,207 |
| | 2,787 |
| | 10,742 |
| | — |
| | 1,466,736 |
|
| Total residential mortgage | | | 8,465,729 |
| | 5,065 |
| | 24,921 |
| | — |
| | 8,495,715 |
|
| Other consumer | | | 280,392 |
| | 5 |
| | 2,517 |
| | — |
| | 282,914 |
|
| Total consumer | | 96,491 |
| | 764 |
| | 1,249 |
| | — |
| | 98,504 |
| | 8,746,121 |
| | 5,070 |
| | 27,438 |
| | — |
| | 8,778,629 |
|
Total (1) | | $ | 249,348 |
| | $ | 770 |
| | $ | 20,749 |
| | $ | — |
| | $ | 270,867 |
| |
| Total | | | $ | 33,582,886 |
| | $ | 515,702 |
| | $ | 440,105 |
| | $ | 16,975 |
| | $ | 34,555,668 |
|
|
| | | | ($ in thousands) | | December 31, 2018 | | December 31, 2019 |
| | Pass/Watch | | Special Mention | | Substandard | | Doubtful | | Total PCI Loans | | Pass | | Special Mention | | Substandard | | Doubtful | | Total PCI Loans |
| Commercial: | | | | | | | | | | | | | | | | | | | | |
| C&I | | $ | 1,996 |
| | $ | — |
| | $ | 156 |
| | $ | — |
| | $ | 2,152 |
| | $ | 1,810 |
| | $ | — |
| | $ | — |
| | $ | — |
| | $ | 1,810 |
|
| CRE: | | | | | | | | | | | |
| CRE | | 146,057 |
| | — |
| | 19,195 |
| | — |
| | 165,252 |
| | 102,257 |
| | — |
| | 10,944 |
| | — |
| | 113,201 |
|
| Multifamily residential | | 33,003 |
| | — |
| | 1,523 |
| | — |
| | 34,526 |
| | 22,162 |
| | — |
| | — |
| | — |
| | 22,162 |
|
| Construction and land | | 42 |
| | — |
| | — |
| | — |
| | 42 |
| | 40 |
| | — |
| | — |
| | — |
| | 40 |
|
| Total CRE | | | 124,459 |
| | — |
| | 10,944 |
| | — |
| | 135,403 |
|
| Total commercial | | 181,098 |
| | — |
| | 20,874 |
| | — |
| | 201,972 |
| | 126,269 |
| | — |
| | 10,944 |
| | — |
| | 137,213 |
|
| Consumer: | | | | | | | | | | | | | | | | | | | | |
| Residential mortgage: | | | | | | | | | | | |
| Single-family residential | | 95,789 |
| | 1,021 |
| | 386 |
| | — |
| | 97,196 |
| | 79,517 |
| | — |
| | 94 |
| | — |
| | 79,611 |
|
| HELOCs | | 8,314 |
| | 256 |
| | 285 |
| | — |
| | 8,855 |
| | 5,849 |
| | — |
| | 198 |
| | — |
| | 6,047 |
|
| Total residential mortgage | | | 85,366 |
| | — |
| | 292 |
| | — |
| | 85,658 |
|
| Total consumer | | 104,103 |
| | 1,277 |
| | 671 |
| | — |
| | 106,051 |
| | 85,366 |
| | — |
| | 292 |
| | — |
| | 85,658 |
|
Total (1) | | $ | 285,201 |
| | $ | 1,277 |
| | $ | 21,545 |
| | $ | — |
| | $ | 308,023 |
| | $ | 211,635 |
| | $ | — |
| | $ | 11,236 |
| | $ | — |
| | $ | 222,871 |
|
|
| |
| (1) | Loans net of ASC 310-30310-10 discount. |
Nonaccrual and Past Due Loans
Non-PCI loansLoans that are 90 or more days past due are generally placed on nonaccrual status, unless the loan is well-collateralized or guaranteed by government agencies, and in the process of collection. Non-PCI loansLoans that are less than 90 days past due but have identified deficiencies, such as when the full collection of principal or interest becomes uncertain, are also placed on nonaccrual status. The following tables presenttable presents the aging analysis of total loans held-for-investment as of March 31, 2020:
|
| | | | | | | | | | | | | | | | | | | | | | | | | | | | | | | | |
| |
| ($ in thousands) | | March 31, 2020 |
| | Accruing
Loans
30-59 Days
Past Due | | Accruing
Loans
60-89 Days
Past Due | | Total
Accruing
Past Due
Loans | | Nonaccrual
Loans Less
Than 90
Days
Past Due | | Nonaccrual
Loans
90 or More
Days
Past Due | | Total
Nonaccrual
Loans | | Current
Accruing
Loans | | Total
Loans |
| Commercial: | | | | | | | | | | | | | | | | |
| C&I | | $ | 15,168 |
| | $ | 3,217 |
| | $ | 18,385 |
| | $ | 59,110 |
| | $ | 29,969 |
| | $ | 89,079 |
| | $ | 12,483,300 |
| | $ | 12,590,764 |
|
| CRE: | | | | | | | | | | | | | | | | |
| CRE | | 6,050 |
| | 936 |
| | 6,986 |
| | 474 |
| | 5,824 |
| | 6,298 |
| | 10,668,958 |
| | 10,682,242 |
|
| Multifamily residential | | 510 |
| | 366 |
| | 876 |
| | 518 |
| | 285 |
| | 803 |
| | 2,900,922 |
| | 2,902,601 |
|
| Construction and land | | — |
| | — |
| | — |
| | — |
| | — |
| | — |
| | 606,209 |
| | 606,209 |
|
| Total CRE | | 6,560 |
| | 1,302 |
| | 7,862 |
| | 992 |
| | 6,109 |
| | 7,101 |
| | 14,176,089 |
| | 14,191,052 |
|
| Total commercial | | 21,728 |
| | 4,519 |
| | 26,247 |
| | 60,102 |
| | 36,078 |
| | 96,180 |
| | 26,659,389 |
| | 26,781,816 |
|
| Consumer: | | | | | | | | | | | | | | | | |
| Residential mortgage: | | | | | | | | | | | | | | | | |
| Single-family residential | | 45,926 |
| | 12,737 |
| | 58,663 |
| | 1,312 |
| | 16,224 |
| | 17,536 |
| | 7,327,524 |
| | 7,403,723 |
|
| HELOCs | | 10,654 |
| | 3,980 |
| | 14,634 |
| | 444 |
| | 10,002 |
| | 10,446 |
| | 1,427,782 |
| | 1,452,862 |
|
| Total residential mortgage | | 56,580 |
| | 16,717 |
| | 73,297 |
| | 1,756 |
| | 26,226 |
| | 27,982 |
| | 8,755,306 |
| | 8,856,585 |
|
| Other consumer | | 34 |
| | 29 |
| | 63 |
| | — |
| | 2,506 |
| | 2,506 |
| | 252,423 |
| | 254,992 |
|
| Total consumer | | 56,614 |
| | 16,746 |
| | 73,360 |
| | 1,756 |
| | 28,732 |
| | 30,488 |
| | 9,007,729 |
| | 9,111,577 |
|
| Total | | $ | 78,342 |
| | $ | 21,265 |
| | $ | 99,607 |
| | $ | 61,858 |
| | $ | 64,810 |
| | $ | 126,668 |
| | $ | 35,667,118 |
| | $ | 35,893,393 |
|
| |
The following table presents amortized cost of loans on nonaccrual status for which there was no related allowance for loan losses as of March 31, 2020:
|
| | | | |
| |
| ($ in thousands) | | March 31, 2020 |
| Commercial: | | |
| C&I | | $ | 64,431 |
|
| CRE: | | |
| CRE | | 5,253 |
|
| Total CRE | | 5,253 |
|
| Total commercial | | 69,684 |
|
| Consumer: | | |
| Residential mortgage: | | |
| Single-family residential | | 8,718 |
|
| HELOCs | | 6,511 |
|
| Total residential mortgage | | 15,229 |
|
| Other consumer | | 2,491 |
|
| Total consumer | | 17,720 |
|
| Total nonaccrual loans with no related allowance for loan losses | | $ | 87,404 |
|
| | | |
The following table presents the aging analysis of non-PCI loans as of June 30, 2019 and December 31, 2018:2019:
|
| | | | | | | | | | | | | | | | | | | | | | | | | | | | | | | | |
| |
| ($ in thousands) | | December 31, 2019 |
| | Accruing Loans 30-59 Days Past Due | | Accruing Loans 60-89 Days Past Due | | Total Accruing Past Due Loans | | Nonaccrual Loans Less Than 90 Days Past Due | | Nonaccrual Loans 90 or More Days Past Due | | Total Nonaccrual Loans | | Current Accruing Loans | | Total
Non-PCI
Loans |
| Commercial: | | | | | | | | | | | | | | | | |
| C&I | | $ | 31,121 |
| | $ | 17,034 |
| | $ | 48,155 |
| | $ | 31,084 |
| | $ | 43,751 |
| | $ | 74,835 |
| | $ | 12,026,131 |
| | $ | 12,149,121 |
|
| CRE: | | | | | | | | | | | | | | | | |
| CRE | | 22,830 |
| | 1,977 |
| | 24,807 |
| | 540 |
| | 15,901 |
| | 16,441 |
| | 10,123,999 |
| | 10,165,247 |
|
| Multifamily residential | | 198 |
| | 531 |
| | 729 |
| | 534 |
| | 285 |
| | 819 |
| | 2,832,664 |
| | 2,834,212 |
|
| Construction and land | | — |
| | — |
| | — |
| | — |
| | — |
| | — |
| | 628,459 |
| | 628,459 |
|
| Total CRE | | 23,028 |
| | 2,508 |
| | 25,536 |
| | 1,074 |
| | 16,186 |
| | 17,260 |
| | 13,585,122 |
| | 13,627,918 |
|
| Total commercial | | 54,149 |
| | 19,542 |
| | 73,691 |
| | 32,158 |
| | 59,937 |
| | 92,095 |
| | 25,611,253 |
| | 25,777,039 |
|
| Consumer: | | | | | | | | | | | | | | | | |
| Residential mortgage: | | | | | | | | | | | | | | | | |
| Single-family residential | | 15,443 |
| | 5,074 |
| | 20,517 |
| | 1,964 |
| | 12,901 |
| | 14,865 |
| | 6,993,597 |
| | 7,028,979 |
|
| HELOCs | | 4,273 |
| | 2,791 |
| | 7,064 |
| | 1,448 |
| | 9,294 |
| | 10,742 |
| | 1,448,930 |
| | 1,466,736 |
|
| Total residential mortgage | | 19,716 |
| | 7,865 |
| | 27,581 |
| | 3,412 |
| | 22,195 |
| | 25,607 |
| | 8,442,527 |
| | 8,495,715 |
|
| Other consumer | | 6 |
| | 5 |
| | 11 |
| | — |
| | 2,517 |
| | 2,517 |
| | 280,386 |
| | 282,914 |
|
| Total consumer | | 19,722 |
| | 7,870 |
| | 27,592 |
| | 3,412 |
| | 24,712 |
| | 28,124 |
| | 8,722,913 |
| | 8,778,629 |
|
| Total | | $ | 73,871 |
| | $ | 27,412 |
| | $ | 101,283 |
| | $ | 35,570 |
| | $ | 84,649 |
| | $ | 120,219 |
| | $ | 34,334,166 |
| | $ | 34,555,668 |
|
| |
|
| | | | | | | | | | | | | | | | | | | | | | | | | | | | | | | | |
| |
| ($ in thousands) | | June 30, 2019 |
| | Accruing Loans 30-59 Days Past Due | | Accruing Loans 60-89 Days Past Due | | Total Accruing Past Due Loans | | Nonaccrual Loans Less Than 90 Days Past Due | | Nonaccrual Loans 90 or More Days Past Due | | Total Nonaccrual Loans | | Current Accruing Loans | | Total Non-PCI Loans |
| Commercial: | | | | | | | | | | | | | | | | |
| C&I | | $ | 11,878 |
| | $ | 6,176 |
| | $ | 18,054 |
| | $ | 36,208 |
| | $ | 36,942 |
| | $ | 73,150 |
| | $ | 12,309,886 |
| | $ | 12,401,090 |
|
| CRE | | 11,099 |
| | 70 |
| | 11,169 |
| | 3,038 |
| | 17,876 |
| | 20,914 |
| | 9,690,499 |
| | 9,722,582 |
|
| Multifamily residential | | 386 |
| | — |
| | 386 |
| | 1,013 |
| | 14 |
| | 1,027 |
| | 2,346,338 |
| | 2,347,751 |
|
| Construction and land | | — |
| | — |
| | — |
| | — |
| | — |
| | — |
| | 674,757 |
| | 674,757 |
|
| Total commercial | | 23,363 |
| | 6,246 |
| | 29,609 |
| | 40,259 |
| | 54,832 |
| | 95,091 |
| | 25,021,480 |
| | 25,146,180 |
|
| Consumer: | | | | | | | | | | | | | | | | |
| Single-family residential | | 18,052 |
| | 2,397 |
| | 20,449 |
| | 712 |
| | 12,363 |
| | 13,075 |
| | 6,370,104 |
| | 6,403,628 |
|
| HELOCs | | 6,116 |
| | 4,968 |
| | 11,084 |
| | 57 |
| | 7,287 |
| | 7,344 |
| | 1,549,472 |
| | 1,567,900 |
|
| Other consumer | | 4 |
| | 14 |
| | 18 |
| | — |
| | 2,504 |
| | 2,504 |
| | 339,280 |
| | 341,802 |
|
| Total consumer | | 24,172 |
| | 7,379 |
| | 31,551 |
| | 769 |
| | 22,154 |
| | 22,923 |
| | 8,258,856 |
| | 8,313,330 |
|
| Total | | $ | 47,535 |
| | $ | 13,625 |
| | $ | 61,160 |
| | $ | 41,028 |
| | $ | 76,986 |
| | $ | 118,014 |
| | $ | 33,280,336 |
| | $ | 33,459,510 |
|
| |
|
| | | | | | | | | | | | | | | | | | | | | | | | | | | | | | | | |
| |
| ($ in thousands) | | December 31, 2018 |
| | Accruing Loans 30-59 Days Past Due | | Accruing Loans 60-89 Days Past Due | | Total Accruing Past Due Loans | | Nonaccrual Loans Less Than 90 Days Past Due | | Nonaccrual Loans 90 or More Days Past Due | | Total Nonaccrual Loans | | Current Accruing Loans | | Total
Non-PCI
Loans |
| Commercial: | | | | | | | | | | | | | | | | |
| C&I | | $ | 21,032 |
| | $ | 19,170 |
| | $ | 40,202 |
| | $ | 17,097 |
| | $ | 26,743 |
| | $ | 43,840 |
| | $ | 11,970,776 |
| | $ | 12,054,818 |
|
| CRE | | 7,740 |
| | — |
| | 7,740 |
| | 3,704 |
| | 20,514 |
| | 24,218 |
| | 9,252,625 |
| | 9,284,583 |
|
| Multifamily residential | | 4,174 |
| | — |
| | 4,174 |
| | 1,067 |
| | 193 |
| | 1,260 |
| | 2,241,072 |
| | 2,246,506 |
|
| Construction and land | | 207 |
| | — |
| | 207 |
| | — |
| | — |
| | — |
| | 538,545 |
| | 538,752 |
|
| Total commercial | | 33,153 |
| | 19,170 |
| | 52,323 |
| | 21,868 |
| | 47,450 |
| | 69,318 |
| | 24,003,018 |
| | 24,124,659 |
|
| Consumer: | | | | | | | | | | | | | | | | |
| Single-family residential | | 14,645 |
| | 7,850 |
| | 22,495 |
| | 509 |
| | 4,750 |
| | 5,259 |
| | 5,911,504 |
| | 5,939,258 |
|
| HELOCs | | 2,573 |
| | 1,816 |
| | 4,389 |
| | 1,423 |
| | 7,191 |
| | 8,614 |
| | 1,668,976 |
| | 1,681,979 |
|
| Other consumer | | 11 |
| | 12 |
| | 23 |
| | — |
| | 2,502 |
| | 2,502 |
| | 328,745 |
| | 331,270 |
|
| Total consumer | | 17,229 |
| | 9,678 |
| | 26,907 |
| | 1,932 |
| | 14,443 |
| | 16,375 |
| | 7,909,225 |
| | 7,952,507 |
|
| Total | | $ | 50,382 |
| | $ | 28,848 |
| | $ | 79,230 |
| | $ | 23,800 |
| | $ | 61,893 |
| | $ | 85,693 |
| | $ | 31,912,243 |
| | $ | 32,077,166 |
|
| |
For information on the policy for recording payments received and resuming accrual of interest on non-PCI loans that are placed on nonaccrual status, see Note 1 — Summary of Significant Accounting Policies— Loans Held-for-Investment to the Consolidated Financial Statements of the Company’s 2018 Form 10-K.
PCI loans are excluded from the above aging analysis tablestable as of December 31, 2019, as the Company has elected to account for these loans on a pool level basis under ASC 310-30 at the time of acquisition. Refer to the discussion on PCI loans within this Note for additional details on interest income recognition. As of June 30, 2019 and December 31, 2018,2019, PCI loans on nonaccrual status totaled $3.5 million and $4.0 million, respectively.
$297 thousand.
Loans in Process of ForeclosureForeclosed Assets
The Company had $24.3 million in foreclosed assets as of March 31, 2020 compared to $1.3 million as of December 31, 2019. The Company commences the foreclosure process on consumer mortgage loans when a borrower becomes 120 days delinquent in accordance with the Consumer Finance Protection Bureau guidelines. AsThe carrying value of June 30, 2019 and December 31, 2018, consumer mortgage loans of $5.8 million and $3.0 million, respectively, were secured by residential real estate properties,loans for which formal foreclosure proceedings were in process in accordance with local requirementswas $8.1 million and $7.2 million as of the applicable jurisdictions. As of both June 30, 2019March 31, 2020 and December 31, 2018, no foreclosed residential2019, respectively. The foreclosure proceedings for these consumer real estate property was includedloans were initiated prior to the Coronavirus Aid, Relief, and Economic Security Act (“CARES Act”) passed by Congress in total net OREO of $130 thousand and $133 thousand, respectively.March 2020. In connection with our actions to support our customers during the COVID-19 pandemic, we have suspended certain mortgage foreclosure activities.
Troubled Debt Restructurings
Potential troubledTroubled debt restructurings (“TDRs”) are individually evaluated and the type of restructuring is selected based on the loan type and the circumstances of the borrower’s financial difficulty. A TDR is a modification of the terms of a loan when the Company, for economic or legal reasons related to the borrower’s financial difficulties, grants a concession to the borrower that it would not have otherwise considered. The Company has implemented various consumer and commercial loan modification programs to provide its borrowers relief from the economic impacts of COVID-19. In accordance with the CARES Act, the Company has elected to not apply TDR classification to any COVID-19 related loan modifications. On April 7, 2020, the federal banking regulators issued the “Interagency Statement on Loan Modifications and Reporting for Financial Institutions Working with Customers Affected by the Coronavirus (Revised)” (the Interagency Statement). The Interagency Statement provides additional TDR relief as it clarifies that it is not necessary to consider the impact of the COVID-19 pandemic on the financial condition of a borrower in connection with a short-term (e.g., six months) COVID-19 related loan modification provided that the borrower is current at the date the modification program is implemented. For COVID-19 related loan modifications in the form of payment deferrals, the delinquency status will not advance and loans that were accruing at the time that the relief is provided will generally not be placed on nonaccrual status during the deferral period. Interest income will continue to be recognized over the contractual life of the loan.
The following tables presenttable presents the additions to non-PCI TDRs for the three and six months ended June 30, 2019March 31, 2020 and 2018:2019:
|
| | | | | | | | | | | | | | | | | | | | | | | | | | | | |
| |
| ($ in thousands) | | Loans Modified as TDRs During the Three Months Ended June 30, |
| | 2019 | | 2018 |
| | Number
of
Loans | | Pre- Modification
Outstanding
Recorded
Investment | | Post- Modification
Outstanding
Recorded
Investment (1) | | Financial
Impact (2) | | Number
of
Loans | | Pre- Modification
Outstanding
Recorded
Investment | | Post- Modification
Outstanding
Recorded
Investment (1) | | Financial
Impact (2) |
| Commercial: | | | | | | | | | | | | | | | | |
| C&I | | 6 | | $ | 48,099 |
| | $ | 48,054 |
| | $ | 5,869 |
| | — | | $ | — |
| | $ | — |
| | $ | — |
|
| CRE | | — | | $ | — |
| | $ | — |
| | $ | — |
| | 1 | | $ | 750 |
| | $ | 837 |
| | $ | — |
|
| Consumer: | | | | | | | | | | | | | | | | |
| Single-family residential | | 1 | | $ | 220 |
| | $ | 219 |
| | $ | — |
| | 2 | | $ | 405 |
| | $ | 404 |
| | $ | (26 | ) |
| HELOCs | | — | | $ | — |
| | $ | — |
| | $ | — |
| | 2 | | $ | 1,546 |
| | $ | 1,536 |
| | $ | — |
|
| |
|
| | | | | | | | | | | | | | | | | | | | | | | | | | | | |
| |
| ($ in thousands) | | Loans Modified as TDRs During the Six Months Ended June 30, |
| | 2019 | | 2018 |
| | Number
of
Loans | | Pre- Modification
Outstanding
Recorded
Investment | | Post- Modification
Outstanding
Recorded
Investment (1) | | Financial
Impact (2) | | Number
of
Loans | | Pre- Modification
Outstanding
Recorded
Investment | | Post- Modification
Outstanding
Recorded
Investment (1) | | Financial
Impact (2) |
| Commercial: | | | | | | | | | | | | | | | | |
| C&I | | 9 | | $ | 77,250 |
| | $ | 77,486 |
| | $ | 5,929 |
| | — | | $ | — |
| | $ | — |
| | $ | — |
|
| CRE | | — | | $ | — |
| | $ | — |
| | $ | — |
| | 1 | | $ | 750 |
| | $ | 837 |
| | $ | — |
|
| Consumer: | | | | | | | | | | | | | | | | |
| Single-family residential | | 1 | | $ | 220 |
| | $ | 219 |
| | $ | — |
| | 2 | | $ | 405 |
| | $ | 404 |
| | $ | (26 | ) |
| HELOCs | | — | | $ | — |
| | $ | — |
| | $ | — |
| | 2 | | $ | 1,546 |
| | $ | 1,536 |
| | $ | — |
|
| |
|
| | | | | | | | | | | | | | | | | | | | | | | | | | | | |
| |
| ($ in thousands) | | Loans Modified as TDRs During the Three Months Ended March 31, |
| | 2020 | | 2019 |
| | Number
of
Loans | | Pre- Modification
Outstanding
Recorded
Investment | | Post- Modification
Outstanding
Recorded
Investment (1) | | Financial
Impact (2) | | Number
of
Loans | | Pre- Modification
Outstanding
Recorded
Investment | | Post- Modification
Outstanding
Recorded
Investment (1) | | Financial
Impact (2) |
| Commercial: | | | | | | | | | | | | | | | | |
| C&I | | 3 | | $ | 16,604 |
| | $ | 15,735 |
| | $ | 98 |
| | 3 | | $ | 29,152 |
| | $ | 29,176 |
| | $ | 60 |
|
| Total | | 3 | | $ | 16,604 |
| | $ | 15,735 |
| | $ | 98 |
| | 3 | | $ | 29,152 |
| | $ | 29,176 |
| | $ | 60 |
|
| |
| |
| (1) | Includes subsequent payments after modification and reflects the balance as of June 30, 2019March 31, 2020 and 2018.2019. |
| |
| (2) | The financial impact includes increases in charge-offs and specific reserves recorded atsince the modification date. |
The following tables presenttable presents the non-PCI TDR post-modification outstanding balances for the three and six months ended June 30,March 31, 2020 and 2019 and 2018 by modification type:
|
| | | | | | | | | | | | | | | | | | | | | | | | | | | | | | | | |
| |
| ($ in thousands) | | Modification Type During the Three Months Ended June 30, |
| | 2019 | | 2018 |
| | Principal (1) | | Interest
Rate
Reduction | | Other (2) | | Total | | Principal (1) | | Interest
Rate
Reduction | | Other | | Total |
| Commercial: | | | | | | | | | | | | | | | | |
| C&I | | $ | 9,909 |
| | $ | — |
| | $ | 38,145 |
| | $ | 48,054 |
| | $ | — |
| | $ | — |
| | $ | — |
| | $ | — |
|
| CRE | | — |
| | — |
| | — |
| | — |
| | — |
| | 837 |
| | — |
| | 837 |
|
| Total commercial | | 9,909 |
| | — |
| | 38,145 |
| | 48,054 |
|
| — |
| | 837 |
| | — |
| | 837 |
|
| Consumer: | | | | | | | | | | | | | | | | |
| Single-family residential | | — |
| | — |
| | 219 |
| | 219 |
| | 65 |
| | — |
| | 339 |
| | 404 |
|
| HELOCs | | — |
| | — |
| | — |
| | — |
| | 1,464 |
| | — |
| | 72 |
| | 1,536 |
|
| Total consumer | | — |
| | — |
| | 219 |
| | 219 |
| | 1,529 |
| | — |
| | 411 |
| | 1,940 |
|
| Total | | $ | 9,909 |
| | $ | — |
| | $ | 38,364 |
| | $ | 48,273 |
| | $ | 1,529 |
| | $ | 837 |
| | $ | 411 |
| | $ | 2,777 |
|
| |
|
| | | | | | | | | | | | | | | | | | | | | | | | | | | | | | | | |
| |
| ($ in thousands) | | Modification Type During the Six Months Ended June 30, |
| | 2019 | | 2018 |
| | Principal (1) | | Interest
Rate
Reduction | | Other (2) | | Total | | Principal (1) | | Interest
Rate
Reduction | | Other | | Total |
| Commercial: | | | | | | | | | | | | | | | | |
| C&I | | $ | 39,341 |
| | $ | — |
| | $ | 38,145 |
| | $ | 77,486 |
| | $ | — |
| | $ | — |
| | $ | — |
| | $ | — |
|
| CRE | | — |
| | — |
| | — |
| | — |
| | — |
| | 837 |
| | — |
| | 837 |
|
| Total commercial | | 39,341 |
| | — |
| | 38,145 |
| | 77,486 |
| | — |
| | 837 |
| | — |
| | 837 |
|
| Consumer: | | | | | | | | | | | | | | | | |
| Single-family residential | | — |
| | — |
| | 219 |
| | 219 |
| | 65 |
| | — |
| | 339 |
| | 404 |
|
| HELOCs | | — |
| | — |
| | — |
| | — |
| | 1,464 |
| | — |
| | 72 |
| | 1,536 |
|
| Total consumer | | — |
| | — |
| | 219 |
| | 219 |
| | 1,529 |
| | — |
| | 411 |
| | 1,940 |
|
| Total | | $ | 39,341 |
| | $ | — |
| | $ | 38,364 |
| | $ | 77,705 |
| | $ | 1,529 |
| | $ | 837 |
| | $ | 411 |
| | $ | 2,777 |
|
| | | | | | | | | | | | | | | | | |
|
| | | | | | | | | | | | | | | | | | | | | | | | |
| |
| ($ in thousands) | | Modification Type During the Three Months Ended March 31, |
| | 2020 | | 2019 |
| | Principal (1) | | Principal and Interest (2) | | Total | | Principal (1) | | Principal and Interest (2) | | Total |
| Commercial: | | | | | | | | | | | | |
| C&I | | $ | 4,564 |
| | $ | 11,171 |
| | $ | 15,735 |
| | $ | 29,176 |
| | $ | — |
| | $ | 29,176 |
|
| Total | | $ | 4,564 |
| | $ | 11,171 |
| | $ | 15,735 |
| | $ | 29,176 |
| | $ | — |
| | $ | 29,176 |
|
| |
| |
| (1) | Includes forbearance payments, term extensions and principal deferments that modify the terms of the loan from principal and interest payments to interest payments only. |
| |
| (2) | Includes funding to secure additional collateralprincipal and provides liquidity to collateral-dependent C&I loans.interest deferments or reductions. |
Subsequent to restructuring, if a TDR that becomes delinquent, generally beyond 90 days past due, it is considered to be in default. Because TDRs are individually evaluated for impairment under the specific reserve methodology, subsequentimpairment. Subsequent defaults do not generally have a significant additional impact on the allowance for loan losses. During the three months ended March 31, 2020, there were 0 TDRs that experienced payment defaults after modifications within the previous 12 months. The following tables presenttable presents information on loans for which a subsequent payment default occurred during the three months ended March 31, 2019, which had been modified as TDRsTDR within the previous 12 months which have subsequently defaulted during the three and six months ended June 30, 2019 and 2018,of its default, and were still in default at the respective period end:as of March 31, 2019:
|
| | | | | | | |
| |
| ($ in thousands) | | Loans Modified as TDRs that Subsequently Defaulted During the Three Months Ended March 31, 2019 |
| | Number of
Loans | | Recorded
Investment |
| Commercial: | | | | |
| C&I | | 3 |
| | $ | 4,618 |
|
| Total | | 3 |
| | $ | 4,618 |
|
| |
|
| | | | | | | | | | | | | | |
| |
| ($ in thousands) | | Loans Modified as TDRs that Subsequently Defaulted During the Three Months Ended June 30, |
| | 2019 | | 2018 |
| | Number of
Loans | | Recorded
Investment | | Number of
Loans | | Recorded
Investment |
| Commercial: | | | | | | | | |
| C&I | | 1 |
| | $ | 1,484 |
| | — |
| | $ | — |
|
| |
|
| | | | | | | | | | | | | | |
| |
| ($ in thousands) | | Loans Modified as TDRs that Subsequently Defaulted During the Six Months Ended June 30, |
| | 2019 | | 2018 |
| | Number of
Loans | | Recorded
Investment | | Number of
Loans | | Recorded
Investment |
| Commercial: | | | | | | | | |
| C&I | | 1 |
| | $ | 1,484 |
| | — |
| | $ | — |
|
| |
The amount of additional funds committed to lend to borrowers whose terms have been modified as TDRs was $3.9$2.3 million and $3.9$2.2 million as of June 30, 2019March 31, 2020 and December 31, 2018,2019, respectively.
Impaired Loans
The following tables presenttable presents information onabout non-PCI impaired loans as of June 30, 2019 and December 31, 2018:
2019: |
| | | | | | | | | | | | | | | | | | | | |
| |
| ($ in thousands) | | June 30, 2019 |
| | Unpaid Principal Balance | | Recorded Investment With No Allowance | | Recorded Investment With Allowance | | Total Recorded Investment | | Related Allowance |
| Commercial: | | | | | | | | | | |
| C&I | | $ | 163,004 |
| | $ | 105,843 |
| | $ | 37,277 |
| | $ | 143,120 |
| | $ | 14,137 |
|
| CRE | | 33,071 |
| | 25,351 |
| | 1,594 |
| | 26,945 |
| | 134 |
|
| Multifamily residential | | 5,761 |
| | 2,402 |
| | 2,851 |
| | 5,253 |
| | 64 |
|
| Total commercial | | 201,836 |
| | 133,596 |
| | 41,722 |
| | 175,318 |
| | 14,335 |
|
| Consumer: | | | | | | | | | | |
| Single-family residential | | 22,234 |
| | 3,940 |
| | 16,950 |
| | 20,890 |
| | 48 |
|
| HELOCs | | 9,972 |
| | 4,775 |
| | 5,158 |
| | 9,933 |
| | 5 |
|
| Other consumer | | 2,504 |
| | — |
| | 2,504 |
| | 2,504 |
| | 2,500 |
|
| Total consumer | | 34,710 |
| | 8,715 |
| | 24,612 |
| | 33,327 |
| | 2,553 |
|
| Total non-PCI impaired loans | | $ | 236,546 |
| | $ | 142,311 |
| | $ | 66,334 |
| | $ | 208,645 |
| | $ | 16,888 |
|
| |
| | | | ($ in thousands) | | December 31, 2018 | | December 31, 2019 |
| | Unpaid Principal Balance | | Recorded Investment With No Allowance | | Recorded Investment With Allowance | | Total Recorded Investment | | Related Allowance | | Unpaid Principal Balance | | Recorded Investment With No Allowance | | Recorded Investment With Allowance | | Total Recorded Investment | | Related Allowance |
| Commercial: | | | | | | | | | | | | | | | | | | | | |
| C&I | | $ | 82,963 |
| | $ | 48,479 |
| | $ | 8,609 |
| | $ | 57,088 |
| | $ | 1,219 |
| | $ | 174,656 |
| | $ | 73,956 |
| | $ | 40,086 |
| | $ | 114,042 |
| | $ | 2,881 |
|
| CRE: | | | | | | | | | | | |
| CRE | | 36,426 |
| | 28,285 |
| | 2,067 |
| | 30,352 |
| | 208 |
| | 27,601 |
| | 20,098 |
| | 1,520 |
| | 21,618 |
| | 97 |
|
| Multifamily residential | | 6,031 |
| | 2,949 |
| | 2,611 |
| | 5,560 |
| | 75 |
| | 4,965 |
| | 1,371 |
| | 3,093 |
| | 4,464 |
| | 55 |
|
| Construction and land | | | 19,696 |
| | 19,691 |
| | — |
| | 19,691 |
| | — |
|
| Total CRE | | | 52,262 |
| | 41,160 |
| | 4,613 |
| | 45,773 |
| | 152 |
|
| Total commercial | | 125,420 |
| | 79,713 |
| | 13,287 |
| | 93,000 |
| | 1,502 |
| | 226,918 |
| | 115,116 |
| | 44,699 |
| | 159,815 |
| | 3,033 |
|
| Consumer: | | | | | | | | | | | | | | | | | | | | |
| Residential mortgage: | | | | | | | | | | | |
| Single-family residential | | 14,670 |
| | 2,552 |
| | 10,908 |
| | 13,460 |
| | 34 |
| | 23,626 |
| | 8,507 |
| | 13,704 |
| | 22,211 |
| | 35 |
|
| HELOCs | | 10,035 |
| | 5,547 |
| | 4,409 |
| | 9,956 |
| | 5 |
| | 13,711 |
| | 6,125 |
| | 7,449 |
| | 13,574 |
| | 8 |
|
| Total residential mortgage | | | 37,337 |
| | 14,632 |
| | 21,153 |
| | 35,785 |
| | 43 |
|
| Other consumer | | 2,502 |
| | — |
| | 2,502 |
| | 2,502 |
| | 2,491 |
| | 2,517 |
| | — |
| | 2,517 |
| | 2,517 |
| | 2,517 |
|
| Total consumer | | 27,207 |
| | 8,099 |
| | 17,819 |
| | 25,918 |
| | 2,530 |
| | 39,854 |
| | 14,632 |
| | 23,670 |
| | 38,302 |
| | 2,560 |
|
| Total non-PCI impaired loans | | $ | 152,627 |
| | $ | 87,812 |
| | $ | 31,106 |
| | $ | 118,918 |
| | $ | 4,032 |
| | $ | 266,772 |
| | $ | 129,748 |
| | $ | 68,369 |
| | $ | 198,117 |
| | $ | 5,593 |
|
|
The following table presents the average recorded investment and interest income recognized on non-PCI impaired loans for the three and six months ended June 30, 2019 and 2018:March 31, 2019:
| | | | ($ in thousands) | | Three Months Ended June 30, | | Six Months Ended June 30, | | Three Months Ended March 31, 2019 |
| | 2019 | | 2018 | | 2019 | | 2018 | | Average
Recorded
Investment | | Recognized Interest Income (1) |
| | Average
Recorded
Investment | | Recognized Interest Income (1) | | Average
Recorded
Investment | | Recognized Interest Income (1) | | Average Recorded Investment | | Recognized Interest Income (1) | | Average
Recorded
Investment | | Recognized Interest Income (1) | |
| Commercial: | | | | | | | | | | | | | | | | | | | | |
| C&I | | $ | 182,689 |
| | $ | 1,081 |
| | $ | 103,767 |
| | $ | 95 |
| | $ | 189,553 |
| | $ | 1,816 |
| | $ | 112,193 |
| | $ | 357 |
| | $ | 93,391 |
| | $ | 735 |
|
| CRE: | | | | | |
| CRE | | 29,241 |
| | 135 |
| | 34,547 |
| | 116 |
| | 31,456 |
| | 249 |
| | 35,602 |
| | 259 |
| | 30,827 |
| | 114 |
|
| Multifamily residential | | 5,852 |
| | 61 |
| | 9,358 |
| | 52 |
| | 5,883 |
| | 121 |
| | 11,141 |
| | 134 |
| | 5,721 |
| | 61 |
|
| Construction and land | | — |
| | — |
| | 3,973 |
| | — |
| | — |
| | — |
| | 3,973 |
| | — |
| |
| Total CRE | | | 36,548 |
| | 175 |
|
| Total commercial | | 217,782 |
| | 1,277 |
| | 151,645 |
| | 263 |
| | 226,892 |
| | 2,186 |
| | 162,909 |
| | 750 |
| | 129,939 |
| | 910 |
|
| Consumer: | | | | | | | | | | | | | | | | | | | | |
| Residential mortgage: | | | | | |
| Single-family residential | | 23,247 |
| | 129 |
| | 18,852 |
| | 115 |
| | 24,865 |
| | 258 |
| | 19,331 |
| | 228 |
| | 15,898 |
| | 128 |
|
| HELOCs | | 13,564 |
| | 38 |
| | 9,496 |
| | 18 |
| | 15,321 |
| | 56 |
| | 10,897 |
| | 33 |
| | 10,811 |
| | 18 |
|
| Total residential mortgage | | | 26,709 |
| | 146 |
|
| Other consumer | | 2,515 |
| | — |
| | 2,491 |
| | — |
| | 2,526 |
| | — |
| | 2,491 |
| | — |
| | 2,504 |
| | — |
|
| Total consumer | | 39,326 |
| | 167 |
| | 30,839 |
| | 133 |
| | 42,712 |
| | 314 |
| | 32,719 |
| | 261 |
| | 29,213 |
| | 146 |
|
| Total non-PCI impaired loans | | $ | 257,108 |
| | $ | 1,444 |
| | $ | 182,484 |
| | $ | 396 |
| | $ | 269,604 |
| | $ | 2,500 |
| | $ | 195,628 |
| | $ | 1,011 |
| | $ | 159,152 |
| | $ | 1,056 |
|
|
| |
| (1) | Includes interest income recognized on accruing non-PCI TDRs. Interest payments received on nonaccrual non-PCI loans are reflected as a reduction to principal, not as interest income. |
Allowance for Credit Losses
The allowance for credit losses includes the allowance for loan losses and the allowance for unfunded credit commitments. The Company’s Allowance for Credit Losses Committee reviews and approves the allowance for credit losses on a quarterly basis.
Allowance for Collectively Evaluated Loans
For loans collectively assessed, the Company’s methodology to determine the appropriate allowance for loan losses is based on quantitative credit models, supplemented by qualitative adjustments. The Company utilize a lifetime loss rate model for the C&I portfolio; probability of default (“PD”) and loss given default (“LGD”) models for all commercial and consumer real estate loan portfolios, and a loss rate approach for other consumer loans.
Factors incorporated into the qualitative adjustments are designed to capture economic, portfolio, operational and segmentation risks not captured by the quantitative credit models. These factors include, but are not limited to, current and forecast economic or market conditions; risks stemming from borrowers’ exposure to or dependence on the U.S. consumer market; industry specific risks inherent in the Company’s loan portfolio, such as oil price fluctuations or falling oil consumption; profiles of various loan segments; portfolio concentrations by loan type, industry, and geography; loan growth trends; internal credit risk ratings; historical loss experience; current delinquency and problem loan trends, and collateral values. The evaluation is inherently subjective, as it requires numerous estimates and judgments that are susceptible to revision as more information becomes available. To the extent actual results differ from estimates or management’s judgment, the allowance for loan losses may be greater or less than future charge-offs.
For the three months ended March 31, 2020, there were no changes to the reasonable and supportable forecast period, and reversion to historical loss experience method. The forecasts of macroeconomic variables were updated to include the impact of the COVID-19 pandemic, oil price declines and other assumptions. The Company uses a third-party economic forecast to estimate the expected credit losses in its quantitative credit models. The forecast uses three economic scenarios including a base forecast representing management's view of the most likely outcome and equally-probable downside and upside scenarios reflecting possible worsening and improving economic conditions, respectively. The economic outlook deteriorated towards the end of the quarter ended March 31, 2020, reflecting the effects of the ongoing COVID-19 pandemic. To reflect the sudden sharp recession caused by the COVID-19 global pandemic, U.S. monetary and fiscal responses to the outbreak, oil price declines and other assumptions, the forecast utilized to estimate expected credit losses was updated in late March 2020. Unemployment rate, which is a key macroeconomic variable for the quantitative models, is projected to significantly spike in the second quarter of 2020 and begin a slower recovery but remain at an elevated level during the second half of 2020. The allowance for credit losses at March 31, 2020 also included qualitative adjustments for certain industry sectors, such as the oil and gas loan portfolio that the Company views as higher risk, where quantitative models may not have captured the additional exposure related to such industry sectors.
Allowance for Loan Losses for the Commercial Loan Portfolio— The Company’s C&I lifetime loss rate model estimates credit losses by estimating a loss rate expected over the life of a loan. This loss rate is applied to the amortized cost basis, excluding accrued interest receivables, to determine expected credit losses. This model incorporates portfolio prepayment rate and utilization rates assumptions; loan-specific risk characteristics such as internal credit risk rating, industry segment, time-to-maturity, size and credit spread at origination, and the economic and market conditions. Each of these components, along with economic forecast information through the reasonable and supportable period, are embedded in the forecasted lifetime loss rate. The lifetime loss rate model’s reasonable and supportable period spans eight quarters, thereafter immediately reverting to the historical average loss rate, expressed implicitly through the loan-level lifetime loss rate.
The Company’s CRE PD/LGD models estimate the probability that a loan will default and, in the event of default, estimate the expected credit losses upon default. The product of the PD and LGD determines the Company’s current expected credit losses. In addition to the Company’s macroeconomic outlook, these models also incorporate prepayment estimates, historical loss rates, loan duration and amortization terms, interest rates, property type, and the geographic locations of the properties collateralizing the loans. The PD/LGD model assumptions and variable inputs span the entire contractual life of the loans, adjusted for expected prepayments. After a reasonable and supportable period, the forecast of future economic conditions reverts to long-run historical economic trends. The loan-specific variables apply over the lifetime of a loan.
In order to estimate the life of a loan under both models, the contractual term of the loan is adjusted for estimated prepayments, which are based on historical prepayment experience.
The Company’s macroeconomic outlook is a key driver in the commercial loan portfolio. The Company uses numerous key macroeconomic variables within its forecasts, including unemployment, real GDP and U.S. Treasury rates. The macroeconomic outlook also considers national and regional personal income, sales, employment and financial indicators that impact discrete commercial loan industry segments. The Company utilizes a probability-weighted three-scenario forecast approach to estimate the allowance for credit losses.
To the extent that information relevant to the collectability of a loan is available and not already captured by the quantitative models, the Company utilizes qualitative factors to adjust the estimate. These factors include, but are not limited to, operational risks resulting from the quality of the Company’s internal loan ratings; portfolio risks such as higher than normal growth trends, delinquencies and levels of classified loans; industry-specific risks inherent in the Company’s portfolio, and other risks borne out of geopolitical, environmental, or natural disaster events specific to the Company’s portfolio, which are not otherwise captured by the quantitative models.
Allowance for Loan Losses for the Consumer Loan Portfolio — For single-family residential and HELOC loans, PG/LGD model assumptions and variable inputs span the entire contractual life of the loans, adjusted for expected prepayments. After a reasonable and supportable period, the forecast of future economic conditions reverts to long- run historical economic trends. The loan-specific variables apply over the lifetime of a loan. In addition to the consideration of the Company’s macroeconomic outlook, the PD/LGD model also incorporates prepayment estimates, historical loss rates, and loan-specific risk characteristics such as the borrower’s FICO score, loan term, interest rates, property purpose and value, and the geographic locations of the properties collateralizing the loans.
For other consumer loans, the Company uses a loss rate approach. In order to estimate the life of a loan, the contractual term of the loan is adjusted for estimated prepayments, which are based on historical prepayment experience.
The Company’s macroeconomic outlook is a key driver in the residential mortgage portfolio. The Company uses several macroeconomic variables, including unemployment rate and home price index, for its residential mortgage portfolio at the national, state and Metropolitan Statistical Area level. The macroeconomic outlook takes into account national and regional personal income, employment and financial indicators impacting the residential loans industry. For other consumer loans, the Company qualitatively adjusts the expected credit loss using real GDP, unemployment, U.S. Treasury Spread and the S&P 500 index. The Company utilizes a probability-weighted three-scenario forecast approach to estimate the allowance for credit losses.
Individually Assessed Loans—When a loan no longer shares similar risk characteristics with other loans, such as in the case for certain nonaccrual or TDR loans, the Company estimates the allowance for loan losses on an individual loan basis. The allowance for loan losses for individually evaluated loans is measured as the difference between the recorded value of the loans and their fair value. For loans evaluated individually, the Company uses one of three different asset valuation measurement methods: (1) the present value of expected future cash flows; (2) the fair value of collateral less costs to sell; (3) the loan's observable market price. If an individually evaluated loan is determined to be collateral dependent, the Company applies the fair value of the collateral less costs to sell method. If an individually evaluated loan is determined to not be collateral dependent, the Company uses the present value of future cash flows or the observable market value of the loan.
Collateral-Dependent Loans — When a loan is collateral dependent, the allowance is measured on an individual loan basis and is limited to the difference between the recorded value and fair value of the collateral less cost of disposal or sale. As of March 31, 2020, collateral dependent commercial and consumer loans totaled $34.6 million and $17.8 million, respectively. The Company's commercial collateral-dependent loans were secured by real estate or business properties. The Company's consumer collateral dependent loans were all residential mortgage loans, secured by the underlying real estate. As of March 31, 2020, the collateral value of the properties securing each of these collateral dependent loans, net of selling costs, exceeded the amortized cost of the individual loans, except for one C&I loan, against which there was a recorded allowance of $416 thousand. For the three months ended March 31, 2020, there was no significant deterioration or changes in the collaterals securing these loans.
The following table presents a summary of activities in the allowance for loan losses by portfolio segment for the three and six months ended June 30, 2019 and 2018:March 31, 2020:
|
| | | | | | | | | | | | | | | | |
| |
| ($ in thousands) | | Three Months Ended June 30, | | Six Months Ended June 30, |
| | 2019 | | 2018 | | 2019 | | 2018 |
| Non-PCI Loans | | | | | | | | |
| Allowance for non-PCI loans, beginning of period | | $ | 317,880 |
| | $ | 297,607 |
| | $ | 311,300 |
| | $ | 287,070 |
|
| Provision for loan losses on non-PCI loans | | 20,740 |
| | 15,139 |
| | 41,388 |
| | 35,072 |
|
| Gross charge-offs: | | | | | | | | |
| Commercial: | | | | | | | | |
| C&I | | (11,745 | ) | | (13,534 | ) | | (28,989 | ) | | (31,979 | ) |
| Consumer: | | | | | | | | |
| Single-family residential | | — |
| | — |
| | — |
| | (1 | ) |
| Other consumer | | (14 | ) | | (162 | ) | | (28 | ) | | (179 | ) |
| Total gross charge-offs | | (11,759 | ) | | (13,696 | ) | | (29,017 | ) | | (32,159 | ) |
| Gross recoveries: | | | | | | | | |
| Commercial: | | | | | | | | |
| C&I | | 1,713 |
| | 1,151 |
| | 3,964 |
| | 8,430 |
|
| CRE | | 1,837 |
| | 2 |
| | 2,059 |
| | 429 |
|
| Multifamily residential | | 53 |
| | 1,061 |
| | 334 |
| | 1,394 |
|
| Construction and land | | 439 |
| | 258 |
| | 502 |
| | 693 |
|
| Consumer: | | | | | | | | |
| Single-family residential | | 72 |
| | 629 |
| | 74 |
| | 813 |
|
| HELOCs | | — |
| | — |
| | 2 |
| | — |
|
| Other consumer | | 7 |
| | — |
| | 7 |
| | 1 |
|
| Total gross recoveries | | 4,121 |
| | 3,101 |
| | 6,942 |
| | 11,760 |
|
| Net charge-offs | | (7,638 | ) | | (10,595 | ) | | (22,075 | ) | | (20,399 | ) |
| Foreign currency translation adjustments | | (362 | ) | | (640 | ) | | 7 |
| | (232 | ) |
| Allowance for non-PCI loans, end of period | | 330,620 |
| | 301,511 |
| | 330,620 |
| | 301,511 |
|
| PCI Loans | | | | | | | | |
| Allowance for PCI loans, beginning of period | | 14 |
| | 47 |
| | 22 |
| | 58 |
|
| Reversal of loan losses on PCI loans | | (9 | ) | | (8 | ) | | (17 | ) | | (19 | ) |
| Allowance for PCI loans, end of period | | 5 |
| | 39 |
| | 5 |
| | 39 |
|
| Allowance for loan losses | | $ | 330,625 |
| | $ | 301,550 |
| | $ | 330,625 |
| | $ | 301,550 |
|
| |
For further information on accounting policies and the methodologies used to estimate the allowance for credit losses and loan charge-offs, see Note 1 — Summary of Significant Accounting Policies — Allowance for Credit Losses to the Consolidated Financial Statements of the Company’s 2018 Form 10-K. |
| | | | | | | | | | | | | | | | | | | | | | | | | | | | | | | | |
| |
| ($ in thousands) | | March 31, 2020 |
| | Commercial | | Consumer | | Total |
| | C&I | | CRE | | Residential Mortgage | | Other Consumer | |
| | | CRE | | Multi-Family Residential | | Construction and Land | | Single- Family Residential | | HELOCs | | |
| Allowance for loan losses, December 31, 2019 | | $ | 238,376 |
| | $ | 40,509 |
| | $ | 22,826 |
| | $ | 19,404 |
| | $ | 28,527 |
| | $ | 5,265 |
| | $ | 3,380 |
| | $ | 358,287 |
|
| Impact of ASU 2016-13 adoption | | 74,237 |
| | 72,169 |
| | (8,112 | ) | | (9,889 | ) | | (3,670 | ) | | (1,798 | ) | | 2,221 |
| | 125,158 |
|
| Allowance for loan losses, January 1, 2020 | | 312,613 |
| | 112,678 |
| | 14,714 |
| | 9,515 |
| | 24,857 |
| | 3,467 |
| | 5,601 |
| | 483,445 |
|
| Provision for (reversal of ) credit losses | | 60,618 |
| | 11,435 |
| | 1,281 |
| | 1,482 |
| | 1,700 |
| | 412 |
| | (2,272 | ) | | 74,656 |
|
| Gross charge-offs | | (11,977 | ) | | (954 | ) | | — |
| | — |
| | — |
| | — |
| | (26 | ) | | (12,957 | ) |
| Gross recoveries | | 1,575 |
| | 9,660 |
| | 535 |
| | 21 |
| | 265 |
| | 2 |
| | 1 |
| | 12,059 |
|
| Total net charge-offs | | (10,402 | ) | | 8,706 |
| | 535 |
| | 21 |
| | 265 |
| | 2 |
| | (25 | ) | | (898 | ) |
| Foreign currency translation adjustments | | (200 | ) | | — |
| | — |
| | — |
| | — |
| | — |
| | — |
| | (200 | ) |
| Allowance for loan losses, March 31, 2020 | | $ | 362,629 |
| | $ | 132,819 |
| | $ | 16,530 |
| | $ | 11,018 |
| | $ | 26,822 |
| | $ | 3,881 |
| | $ | 3,304 |
| | $ | 557,003 |
|
| |
The following table presents a summary of activities in the allowance for unfunded credit reservescommitments for the three and six months ended June 30, 2019 and 2018:March 31, 2020:
|
| | | | | | | | | | | | | | | | |
| |
| ($ in thousands) | | Three Months Ended June 30, | | Six Months Ended June 30, |
| | 2019 | | 2018 | | 2019 | | 2018 |
| Allowance for unfunded credit reserves, beginning of period | | $ | 14,505 |
| | $ | 13,614 |
| | $ | 12,566 |
| | $ | 13,318 |
|
| (Reversal of) provision for unfunded credit reserves | | (1,486 | ) | | 405 |
| | 453 |
| | 701 |
|
| Allowance for unfunded credit reserves, end of period | | $ | 13,019 |
| | $ | 14,019 |
| | $ | 13,019 |
| | $ | 14,019 |
|
| |
|
| | | | |
| |
| ($ in thousands) | | Three Months Ended
March 31, 2020 |
| Unfunded credit facilities | | |
| Allowance for unfunded credit commitments, December 31, 2019 | | $ | 11,158 |
|
| Impact of ASU 2016-13 adoption | | 10,457 |
|
| Allowance for unfunded credit commitments, January 1, 2020 | | 21,615 |
|
| Reversal of credit losses | | (786 | ) |
| Allowance for unfunded credit commitments, March 31, 2020 | | $ | 20,829 |
|
| Total provision for credit losses | | $ | 73,870 |
|
| |
The following table presents a summary of activities in the allowance for loan losses by portfolio segments and the allowance for unfunded credit commitments for the three months ended March 31, 2019:
|
| | | | |
| |
| ($ in thousands) | | Three Months Ended
March 31, 2019 |
| Allowance for non-PCI loans, beginning of period | | $ | 311,300 |
|
| Provision for loan losses on non-PCI loans | (a) | 20,648 |
|
| Gross charge-offs: | | |
| Commercial: | | |
| C&I | | (17,244 | ) |
| Consumer: | | |
| Other consumer | | (14 | ) |
| Total gross charge-offs | | (17,258 | ) |
| Gross recoveries: | | |
| Commercial: | | |
| C&I | | 2,251 |
|
| CRE: | | |
| CRE | | 222 |
|
| Multifamily residential | | 281 |
|
| Construction and land | | 63 |
|
| Total CRE | | 566 |
|
| Consumer: | | |
| Residential mortgage: | | |
| Single-family residential | | 2 |
|
| HELOCs | | 2 |
|
| Total residential mortgage | | 4 |
|
| Total gross recoveries | | 2,821 |
|
| Net charge-offs | | (14,437 | ) |
| Foreign currency translation adjustments | | 369 |
|
| Allowance for non-PCI loans, end of period | | 317,880 |
|
| PCI Loans | | |
| Allowance for PCI loans, beginning of period | | 22 |
|
| Reversal of loan losses on PCI loans | (b) | (8 | ) |
| Allowance for PCI loans, end of period | | 14 |
|
| Allowance for loan losses | | $ | 317,894 |
|
| Unfunded credit facilities | | |
| Allowance for unfunded credit commitments, beginning of period | | $ | 12,566 |
|
| Provision for unfunded credit commitments | (c) | 1,939 |
|
| Allowance for unfunded credit commitments, ending of period | | $ | 14,505 |
|
| Total provision for credit losses | (a)+(b)+(c) | $ | 22,579 |
|
| |
As of March 31, 2020, the allowance for loan losses amounted to $557.0 million or 1.55% of loans held-for-investment, compared with $358.3 million or 1.03% of loans held-for-investment as of December 31, 2019, and $317.9 million or 0.97% of loans held-for-investment as of March 31, 2019. The quarter-over-quarter and year-over-year increase in allowance for loan losses was largely due to the adoption of ASU 2016-13, which increased the allowance for loan losses by $125.2 million; deteriorating macroeconomic conditions and outlook as a result of the COVID-19 pandemic, which drove a $73.9 million provision for credit losses for the three months ended March 31, 2020 and loan growth. First quarter 2020 gross charge-offs of $13.0 million were primarily from C&I loans, and were almost entirely offset by recoveries, primarily from CRE loans, resulting in net charge-offs of $898 thousand or annualized 0.01% of average loans held-for-investment. The C&I gross charge-offs for the three months ended March 31, 2020 totaled $12.0 million and were primarily from the oil and gas loan portfolio.
The allowance for unfunded credit reservescommitments is maintained at a level, that management believes to be sufficient to absorb estimated probableexpected credit losses related to unfunded credit facilities. The allowance for unfunded credit reserves is included in Accrued expenses and other liabilities on the Consolidated Balance Sheet. See Note 1210 — Commitments and Contingencies to the Consolidated Financial Statements in this Form 10-Q for additional information related to unfunded credit reserves.commitments.
The following tables presenttable presents the Company’s allowance for loan losses and recorded investments by portfolio segmentloan type and impairment methodology as of June 30, 2019 and December 31, 2018:2019:
|
| | | | | | | | | | | | | | | | | | | | | | | | | | | | | | | | |
| |
| ($ in thousands) | | June 30, 2019 |
| | Commercial | | Consumer | | Total |
| | C&I | | CRE | | Multifamily Residential | | Construction and Land | | Single- Family Residential | | HELOCs | | Other Consumer | |
| Allowance for loan losses | | | | | | | | | | | | | | | | |
| Individually evaluated for impairment | | $ | 14,137 |
| | $ | 134 |
| | $ | 64 |
| | $ | — |
| | $ | 48 |
| | $ | 5 |
| | $ | 2,500 |
| | $ | 16,888 |
|
| Collectively evaluated for impairment | | 191,366 |
| | 40,378 |
| | 18,510 |
| | 22,961 |
| | 32,715 |
| | 6,172 |
| | 1,630 |
| | 313,732 |
|
| Acquired with deteriorated credit quality | | — |
| | 5 |
| | — |
| | — |
| | — |
| | — |
| | — |
| | 5 |
|
| Total | | $ | 205,503 |
| | $ | 40,517 |
| | $ | 18,574 |
| | $ | 22,961 |
| | $ | 32,763 |
| | $ | 6,177 |
| | $ | 4,130 |
| | $ | 330,625 |
|
| | | | | | | | | | | | | | | | | |
| Recorded investment in loans | | | | | | | | | | | | | | | | |
| Individually evaluated for impairment | | $ | 143,120 |
| | $ | 26,945 |
| | $ | 5,253 |
| | $ | — |
| | $ | 20,890 |
| | $ | 9,933 |
| | $ | 2,504 |
| | $ | 208,645 |
|
| Collectively evaluated for impairment | | 12,257,970 |
| | 9,695,637 |
| | 2,342,498 |
| | 674,757 |
| | 6,382,738 |
| | 1,557,967 |
| | 339,298 |
| | 33,250,865 |
|
Acquired with deteriorated credit quality (1) | | 1,877 |
| | 145,851 |
| | 24,594 |
| | 41 |
| | 91,254 |
| | 7,250 |
| | — |
| | 270,867 |
|
Total (1) | | $ | 12,402,967 |
| | $ | 9,868,433 |
| | $ | 2,372,345 |
| | $ | 674,798 |
| | $ | 6,494,882 |
| | $ | 1,575,150 |
| | $ | 341,802 |
| | $ | 33,730,377 |
|
| |
| | | | ($ in thousands) | | | December 31, 2019 |
| | December 31, 2018 | | Commercial | | Consumer | | Total |
| | Commercial | | Consumer | | Total | | C&I | | CRE | | Residential Mortgage | | Other Consumer | |
| | C&I | | CRE | | Multifamily Residential | | Construction and Land | | Single- Family Residential | | HELOCs | | Other Consumer | | | | CRE | | Multifamily Residential | | Construction and Land | | Single- Family Residential | | HELOCs | |
| Allowance for loan losses | | | | | | | | | | | | | | | | | | | | | | | | | | | | | | | | |
| Individually evaluated for impairment | | $ | 1,219 |
| | $ | 208 |
| | $ | 75 |
| | $ | — |
| | $ | 34 |
| | $ | 5 |
| | $ | 2,491 |
| | $ | 4,032 |
| | $ | 2,881 |
| | $ | 97 |
| | $ | 55 |
| | $ | — |
| | $ | 35 |
| | $ | 8 |
| | $ | 2,517 |
| | $ | 5,593 |
|
| Collectively evaluated for impairment | | 190,121 |
| | 38,823 |
| | 19,208 |
| | 20,282 |
| | 31,306 |
| | 5,769 |
| | 1,759 |
| | 307,268 |
| | 235,495 |
| | 40,412 |
| | 22,771 |
| | 19,404 |
| | 28,492 |
| | 5,257 |
| | 863 |
| | 352,694 |
|
| Acquired with deteriorated credit quality | | — |
| | 22 |
| | — |
| | — |
| | — |
| | — |
| | — |
| | 22 |
| | — |
| | — |
| | — |
| | — |
| | — |
| | — |
| | — |
| | — |
|
| Total | | $ | 191,340 |
| | $ | 39,053 |
| | $ | 19,283 |
| | $ | 20,282 |
| | $ | 31,340 |
| | $ | 5,774 |
| | $ | 4,250 |
| | $ | 311,322 |
| | $ | 238,376 |
| | $ | 40,509 |
| | $ | 22,826 |
| | $ | 19,404 |
| | $ | 28,527 |
| | $ | 5,265 |
| | $ | 3,380 |
| | $ | 358,287 |
|
| | | | | | | | | | | | | | | | | | |
| Recorded investment in loans | | | | | | | | | | | | | | | | | | | | | | | | | | | | | | | | |
| Individually evaluated for impairment | | $ | 57,088 |
| | $ | 30,352 |
| | $ | 5,560 |
| | $ | — |
| | $ | 13,460 |
| | $ | 9,956 |
| | $ | 2,502 |
| | $ | 118,918 |
| | $ | 114,042 |
| | $ | 21,618 |
| | $ | 4,464 |
| | $ | 19,691 |
| | $ | 22,211 |
| | $ | 13,574 |
| | $ | 2,517 |
| | $ | 198,117 |
|
| Collectively evaluated for impairment | | 11,997,730 |
| | 9,254,231 |
| | 2,240,946 |
| | 538,752 |
| | 5,925,798 |
| | 1,672,023 |
| | 328,768 |
| | 31,958,248 |
| | 12,035,079 |
| | 10,143,629 |
| | 2,829,748 |
| | 608,768 |
| | 7,006,768 |
| | 1,453,162 |
| | 280,397 |
| | 34,357,551 |
|
Acquired with deteriorated credit quality (1) | | 2,152 |
| | 165,252 |
| | 34,526 |
| | 42 |
| | 97,196 |
| | 8,855 |
| | — |
| | 308,023 |
| | 1,810 |
| | 113,201 |
| | 22,162 |
| | 40 |
| | 79,611 |
| | 6,047 |
| | — |
| | 222,871 |
|
Total (1) | | $ | 12,056,970 |
| | $ | 9,449,835 |
| | $ | 2,281,032 |
| | $ | 538,794 |
| | $ | 6,036,454 |
| | $ | 1,690,834 |
| | $ | 331,270 |
| | $ | 32,385,189 |
| | $ | 12,150,931 |
| | $ | 10,278,448 |
| | $ | 2,856,374 |
| | $ | 628,499 |
| | $ | 7,108,590 |
| | $ | 1,472,783 |
| | $ | 282,914 |
| | $ | 34,778,539 |
|
|
| |
| (1) | Loans net of ASC 310-30310-10 discount. |
Purchased Credit-ImpairedCredit-Deteriorated Loans
AtOn January 1, 2020, the date of acquisition, PCI loans are pooled and accounted for at fair value, which represents the discounted valueamortized cost basis of the expected cash flowsPCD loans was adjusted to reflect the $1.2 million of allowance for loan losses. For the loan portfolio. A pool is accounted for as a single asset with a single interest rate, cumulative loss rate and cash flows expectation. The cash flows expected overthree months ended March 31, 2020, the lifeCompany did not acquire any PCD loans. For information on PCD loans, see Note 2 — Summary of Significant Accounting Policies to the pools are estimated by an internal cash flows model that projects cash flows and calculates the carrying values of the pools, book yields, effective interest income and impairment, if any, based on pool level events. Assumptions as to cumulative loss rates, loss curves and prepayment speeds are utilized to calculate the expected cash flows. The amount of expected cash flows over the initial investmentConsolidated Financial Statements in the loan represents the “accretable yield,” which is recognized as interest income on a level yield basis over the life of the loan. Projected loss rates and prepayment speeds affect the estimated life of PCI loans, which may change the amount of interest income, and possibly principal, expected to be collected. The excess of total contractual cash flows over the cash flows expected to be collected at acquisition, considering the impact of prepayments, is referred to as the “nonaccretable difference.”this Form 10-Q.
The following table presents the changes in accretable yield foron PCI loans for the three and six months ended June 30, 2019 and 2018:March 31, 2019:
| | | | ($ in thousands) | | Three Months Ended June 30, | | Six Months Ended June 30, | |
| | 2019 | | 2018 | | 2019 | | 2018 | | Three Months Ended
March 31, 2019 |
| Accretable yield for PCI loans, beginning of period | | $ | 68,861 |
| | $ | 95,864 |
| | $ | 74,870 |
| | $ | 101,977 |
| | $ | 74,870 |
|
| Accretion | | (5,806 | ) | | (11,084 | ) | | (12,007 | ) | | (20,218 | ) | | (6,201 | ) |
| Changes in expected cash flows | | 998 |
| | 272 |
| | 1,190 |
| | 3,293 |
| | 192 |
|
| Accretable yield for PCI loans, end of period | | $ | 64,053 |
| | $ | 85,052 |
| | $ | 64,053 |
| | $ | 85,052 |
| | $ | 68,861 |
|
|
Loans Held-for-Sale
At the time of commitment to originate or purchase a loan, the loan is determined to be held for investment if it is the Company’s intent to hold the loan to maturity or for the “foreseeable future,” subject to periodic reviews under the Company’s evaluation processes, including asset/liability and credit risk management. When the Company subsequently changes its intent to hold certain loans, the loans are transferred from held-for-investment to held-for-sale at the lower of cost or fair value. As of June 30,March 31, 2020 and December 31, 2019, loans held-for-sale of $3.9$1.6 million were comprised of C&I loans. In comparison, as of December 31, 2018, loans held-for-sale of $275and $434 thousand, respectively, consisted of single-family residential loans. Refer to Note 1 — Summary of Significant Accounting Policies— Significant Accounting Policies — Loans Held-for-Sale to the Consolidated Financial Statements of the Company’s 2019 Form 10-K for additional details related to the Company’s loans held-for-sale.
Loan Purchases, Transfers and Sales
The Company purchases and sells loans in the secondary market in the ordinary course of business. From time to time, purchased loans may be transferred from held-for-investment to held-for-sale, and write-downs to allowance for loan losses are recorded, when appropriate. The following tables presentprovide information about loanthe carrying value of loans purchased for the held-for-investment portfolio, reclassification of loans sold and loans transferred from held-for-investment to held-for-sale and salesat lower of cost or fair value during the three and six months ended June 30, 2019March 31, 2020 and 2018:2019:
|
| | | | | | | | | | | | | | | | | | | | | | | | |
| |
| ($ in thousands) | | Three Months Ended June 30, 2019 |
| | Commercial | | Consumer | | Total |
| | C&I | | CRE | | Multifamily
Residential | | Construction
and Land | | Single-Family
Residential | |
Loans transferred from held-for-investment to held-for-sale (1) | | $ | 79,593 |
| | $ | — |
| | $ | — |
| | $ | 1,573 |
| | $ | — |
| | $ | 81,166 |
|
Sales (2)(3)(4) | | $ | 76,031 |
| | $ | — |
| | $ | — |
| | $ | 1,573 |
| | $ | 1,172 |
| | $ | 78,776 |
|
Purchases (5) | | $ | 159,100 |
| | $ | — |
| | $ | 1,734 |
| | $ | — |
| | $ | 17,637 |
| | $ | 178,471 |
|
| |
|
| | | | | | | | | | | | | | | | | | | | |
| |
| ($ in thousands) | | Three Months Ended March 31, 2020 |
| | Commercial | | Consumer | | Total |
| | C&I | | CRE | | Residential Mortgage | |
| | | CRE | | Multifamily
Residential | | Single-Family
Residential | |
Loans transferred from held-for-investment to held-for-sale (1) | | $ | 102,973 |
| | $ | 7,250 |
| | $ | — |
| | $ | — |
| | $ | 110,223 |
|
Sales (2)(3)(4) | | $ | 102,973 |
| | $ | 7,250 |
| | $ | — |
| | $ | 4,642 |
| | $ | 114,865 |
|
Purchases (5) | | $ | 130,583 |
| | $ | — |
| | $ | 1,513 |
| | $ | 1,084 |
| | $ | 133,180 |
|
| |
|
| | | | | | | | | | | | | | | | | | | | | | | | |
| |
| ($ in thousands) | | Three Months Ended June 30, 2018 |
| | Commercial | | Consumer | | Total |
| | C&I | | CRE | | Multifamily
Residential | | Construction
and Land | | Single-Family
Residential | |
Loans transferred from held-for-investment to held-for-sale (1) | | $ | 99,449 |
| | $ | 30,415 |
| | $ | — |
| | $ | — |
| | $ | — |
| | $ | 129,864 |
|
Sales (2)(3)(4) | | $ | 140,326 |
| | $ | 30,415 |
| | $ | — |
| | $ | — |
| | $ | 8,175 |
| | $ | 178,916 |
|
Purchases (5) | | $ | 285,615 |
| | $ | — |
| | $ | 3,249 |
| | $ | — |
| | $ | 20,912 |
| | $ | 309,776 |
|
| |
|
| | | | | | | | | | | | | | | | | | | | | | | | |
| |
| ($ in thousands) | | Six Months Ended June 30, 2019 |
| | Commercial | | Consumer | | Total |
| | C&I | | CRE | | Multifamily
Residential | | Construction
and Land | | Single-Family
Residential | |
Loans transferred from held-for-investment to held-for-sale (1) | | $ | 155,166 |
| | $ | 16,655 |
| | $ | — |
| | $ | 1,573 |
| | $ | — |
| | $ | 173,394 |
|
Sales (2)(3)(4) | | $ | 151,677 |
| | $ | 16,655 |
| | $ | — |
| | $ | 1,573 |
| | $ | 3,614 |
| | $ | 173,519 |
|
Purchases (5) | | $ | 266,294 |
| | $ | — |
| | $ | 5,952 |
| | $ | — |
| | $ | 54,039 |
| | $ | 326,285 |
|
| |
| | | | ($ in thousands) | | | Three Months Ended March 31, 2019 |
| | Six Months Ended June 30, 2018 | | Commercial | | Consumer | | Total |
| | Commercial | | Consumer | Total | | C&I | | CRE | | Residential Mortgage | |
| | C&I | | CRE | | Multifamily
Residential | | Construction
and Land | | Single-Family
Residential | | | | CRE | | Multifamily
Residential | | Single-Family
Residential | |
Loans transferred from held-for-investment to held-for-sale (1) | | $ | 245,840 |
| | $ | 39,791 |
| | $ | — |
| | $ | — |
| | $ | — |
| | $ | 285,631 |
| | $ | 75,573 |
| | $ | 16,655 |
| | $ | — |
| | $ | — |
| | $ | 92,228 |
|
Sales (2)(3)(4) | | $ | 242,691 |
| | $ | 39,791 |
| | $ | — |
| | $ | — |
| | $ | 10,721 |
| | $ | 293,203 |
| | $ | 75,646 |
| | $ | 16,655 |
| | $ | — |
| | $ | 2,442 |
| | $ | 94,743 |
|
Purchases (5) | | $ | 350,362 |
| | $ | — |
| | $ | 3,435 |
| | $ | — |
| | $ | 36,025 |
| | $ | 389,822 |
| | $ | 107,194 |
| | $ | — |
| | $ | 4,218 |
| | $ | 36,402 |
| | $ | 147,814 |
|
|
| |
| (1) | The Company recorded $317 thousand and $390 thousand in0 write-downs to the allowance for loan losses related to loans transferred from held-for-investment to held-for-sale and subsequently sold duringfor the three and six months ended June 30, 2019, respectively,March 31, 2020 and $13.3 million and $13.4 million during$73 thousand for the same periodsperiod in 2018, respectively.2019. |
| |
| (2) | Includes originated loans sold of $55.7$114.9 million and $132.2$76.5 million for the three and six months ended June 30,March 31, 2020 and 2019, respectively, and $103.5 million and $193.2 million during the same periods in 2018, respectively. Originated loans sold during each of the three and six months ended June 30,March 31, 2020 and 2019 were primarily C&I loans. In comparison, originated loans sold during the same periods in 2018 were primarily C&I and CRE loans. |
| |
| (3) | Includes NaN and $18.2 million of purchased loans sold in the secondary market of $23.1 million and $41.3 million for the three and six months ended June 30,March 31, 2020 and 2019, respectively, and $75.4 million and $100.0 million during the same periods in 2018, respectively. |
| |
| (4) | Net gains on sales of loans excluding the lower of cost or fair value adjustments, were $15$950 thousand and $930$915 thousand for the three and six months ended June 30,March 31, 2020 and 2019, respectively, and $2.3 million and $3.9 million during the same periods in 2018, respectively. No lower of cost or fair value adjustments were recorded for each of the three and six months ended June 30, 2019 and 2018. |
| |
| (5) | C&I loan purchases for each of the three and six months ended June 30,March 31, 2020 and 2019 and 2018 were mainly comprised primarily of syndicated C&I syndicatedterm loans. |
Note 98 — Investments in Qualified Affordable Housing Partnerships, Tax Credit and Other Investments, Net and Variable Interest Entities
The Community Reinvestment Act (“CRA”) encourages banks to meet the credit needs of their communities for housing and other purposes, particularly in low-and moderate- incomelow-or moderate-income neighborhoods. The Company invests in certain affordable housing projects in the form of ownership interests in limited partnerships or limited liability companies that qualify for CRA and tax credits. These entities are formed to develop and operate apartment complexes designed as high-quality affordable housing for lower income tenants throughout the U.S. To fully utilize the available tax credits, each of these entities must meet the regulatory affordable housing requirements for a minimum 15-year compliance period to fully utilize the tax credits.period. In addition to affordable housing projects, the Company also invests in New Market Tax Credit projects that qualify for CRA credits, as well as eligible projects that qualify for renewable energy and historic tax credits. Investments in renewable energy tax credits help promote the development of renewable energy sources, and the investments in historic tax credits promote the rehabilitation of historic buildings and economic revitalization of the surrounding areas.
Investments in Qualified Affordable Housing Partnerships, Net
The Company records its investments in qualified affordable housing partnerships, net, using the proportional amortization method. Under the proportional amortization method, the Company amortizes the initial cost of the investment in proportion to the tax credits and other tax benefits received, and recognizes the amortization in Income tax expense on the Consolidated Statement of Income.
The following table presents the Company’s investments in qualified affordable housing partnerships, net, and related unfunded commitments as of June 30, 2019March 31, 2020 and December 31, 2018:2019:
| | | | ($ in thousands) | | June 30, 2019 | | December 31, 2018 | | March 31, 2020 | | December 31, 2019 |
| Investments in qualified affordable housing partnerships, net | | $ | 198,466 |
| | $ | 184,873 |
| | $ | 198,653 |
| | $ | 207,037 |
|
| Accrued expenses and other liabilities — Unfunded commitments | | $ | 83,785 |
| | $ | 80,764 |
| | $ | 77,487 |
| | $ | 80,294 |
|
|
The following table presents additional information related to the Company’s investments in qualified affordable housing partnerships, net, for the three and six months ended June 30, 2019March 31, 2020 and 2018:2019:
| | | | ($ in thousands) | | Three Months Ended June 30, | | Six Months Ended June 30, | | Three Months Ended March 31, |
| | 2019 | | 2018 | | 2019 | | 2018 | | 2020 | | 2019 |
| Tax credits and other tax benefits recognized | | $ | 11,506 |
| | $ | 8,940 |
| | $ | 23,332 |
| | $ | 18,095 |
| | $ | 11,031 |
| | $ | 11,826 |
|
| Amortization expense included in income tax expense | | $ | 9,657 |
| | $ | 6,700 |
| | $ | 18,554 |
| | $ | 13,773 |
| | $ | 8,384 |
| | $ | 8,897 |
|
|
Investments in Tax Credit and Other Investments, Net
Depending on the ownership percentage and the influence the Company has on the investments in tax credit and other investments, net, the Company applies the equity or cost method of accounting, or the measurement alternative as elected under ASU 2016-01 for equity investments without readily determinable fair value.
The following table presents the Company’s investments in tax credit and other investments, net, and related unfunded commitments as of June 30, 2019March 31, 2020 and December 31, 2018:2019:
| | | | ($ in thousands) | | June 30, 2019 | | December 31, 2018 | | March 31, 2020 | | December 31, 2019 |
| Investments in tax credit and other investments, net | | $ | 210,387 |
| | $ | 231,635 |
| | $ | 268,330 |
| | $ | 254,140 |
|
| Accrued expenses and other liabilities — Unfunded commitments | | $ | 73,369 |
| | $ | 80,228 |
| | $ | 121,604 |
| | $ | 113,515 |
|
|
Amortization of tax credit and other investments was $16.7$17.3 million and $41.6$24.9 million respectively, for the three and six months ended June 30,March 31, 2020 and 2019, as compared to $20.5 million and $37.9 million, respectively, for the same periods in 2018.respectively.
Included in Investments in tax credit and other investments, net, on the Consolidated Balance Sheet were equity securities with readily determinable fair values of $31.4$30.3 million and $31.2$31.7 million, as of June 30, 2019March 31, 2020 and December 31, 2018,2019, respectively. These equity securities are CRA investments and were measured at fair value with changes in fair value recorded in net income. The Company recorded unrealized gains on these equity securities of $375$38 thousand and $767$392 thousand during the three and six months ended June 30,March 31, 2020 and 2019, respectively, and unrealized losses of $159 thousand and $613 thousand, respectively, for the same periods in 2018.respectively.
The Company has equity securities without readily determinable fair values at carrying value totaling $19.1 million as of both March 31, 2020 and December 31, 2019, which are measured under the measurement alternative and the related adjustments from observable price changes. For the three months ended March 31, 2020 and 2019, there were 0 adjustments to these securities.
The Company invested in four solar energy tax credit funds inFor the years 2014, 2015, 2017 and 2018 as a limited member. These tax credit funds engaged in the acquisition and leasing of mobile solar generators through DC Solar entities. The Company’s investments in the DC Solar tax credit funds qualified for federal energy tax credit under Section 48 of the Internal Revenue Code of 1986, as amended. The Company also received a “should” level legal opinion from an external law firm supporting the legal structure of the investments for tax credit purposes. These investments were recorded in Investments in tax credit and other investments, net on the Consolidated Balance Sheet and were accounted for under the equity method of accounting. For reasons that were not known or knowable to the Company, DC Solar had its assets frozen in December 2018. DC Solar filed for bankruptcy protection in February 2019. In February 2019, an affidavit from a Federal Bureau of Investigation special agent stated that DC Solar was operating a fraudulent “Ponzi-like scheme” and that the majority of the mobile solar generators sold to investors and managed by DC Solar, as well as the majority of the related lease revenues claimed to have been received by DC Solar may not have existed.
Tax credit investments are evaluated for possible OTTI on an annual basis or when events or changes in circumstances suggest that the carrying amount of the tax credit investments may not be realizable. Refer to Note 4 — Fair Value Measurement and Fair Value of Financial Instruments to the Consolidated Financial Statements in this Form 10-Q for a discussion on the Company’s impairment evaluation and monitoring process of tax credit investments. Investments in tax credit and other investments, net related to DC Solar tax credit investments was $7.0 million out of the $231.6 million as Decemberthree months ended March 31, 2018. During the first quarter of 2019, the Company fully wrote off its tax credit investments related to DC Solar and recorded a $7.0 million OTTI charge within Amortization of tax credit and other investments on the Consolidated Statement of Income. The Company concluded that there would be no material future cash flows related to these investments, in part because of the fact that DC Solar has ceased operations and its bankruptcy case had been converted from Chapter 11 to Chapter 7 on March 22, 2019. There are no balances recorded in Accrued expenses and other liabilities — Unfunded commitments related to DC Solar as of June 30, 2019 and December 31, 2018. Refer to Note 14 — Income Taxes to the Consolidated Financial Statements in this Form 10-Q for a further discussion related to the impacts on the Company’s income tax expense related to the DC solar tax credit investments.
During the second quarter of 2019,2020, the Company recorded an additional OTTI chargeimpairment recovery of $2.9 million$150 thousand related to a1 historic tax credit and a CRA investmentrecorded 0 OTTI charge within Amortization of tax credit and other investments on the Consolidated Statement of Income. TotalIn comparison, the Company recorded an OTTI charge was $2.9of $7.0 million related to DC Solar and $9.9 million0 impairment recovery for the three and six months ended June 30, 2019, respectively. There was no OTTI charge recorded for the three and six months ended June 30, 2018.March 31, 2019.
Variable Interest Entities
The Company invests in unconsolidated limited partnerships and similar entities that construct, own and operate affordable housing, historic rehabilitation projects, wind and solar projects, of which the majority of such investments are variable interest entitiesVariable Interest Entities (“VIEs”). As a limited partner in these partnerships, these investments are designed to generate a return primarily through the realization of federal tax credits and tax benefits. An unrelated third party is typically the general partner or managing member who has control over the significant activities of such investments. While the Company’s interest in some of the investments may exceed 50% of the outstanding equity interests, the Company does not consolidate these structures due to the general partner or managing partner’smember’s ability to manage the entity, which is indicative of power inover them. The Company’s maximum exposure to loss in connection with these partnerships consistsconsist of the unamortized investment balance and any tax credits claimed that may become subject to recapture.
Special purpose entities formed in connection with securitization transactions are generally considered VIEs. The Company is the servicer of the multifamily residential loans it has securitized in the first quarter of 2016. The Company does not consolidate the multifamily securitization entity because it does not have power and does not have a variable interest that could potentially be significant to the VIE.A CLO is a VIE that purchases a pool of assets consisting primarily of non-investment grade corporate loans and issues multiple tranches of notes to investors to fund the asset purchases and pay upfront expenses associated with forming the CLO. The Company serves as the collateral manager of a CLO that closed in the fourth quarter of 2019 and retained substantially all of the investment grade rated securities issued by the CLO. In accordance with GAAP, the Company does not consolidate the CLO as it does not hold interests that could potentially be significant to the CLO. The Company’s maximum exposure to loss from the CLO is equal to the carrying amount of the retained securities of $259.9 million and $284.7 million as of March 31, 2020 and December 31, 2019, respectively.
Note 109 — Goodwill and Other Intangible Assets
Goodwill
Total goodwill was $465.7 million and $465.5 million as of June 30, 2019both March 31, 2020 and December 31, 2018, respectively.2019. Goodwill represents the excess of the purchase price over the fair value of net assets acquired in an acquisition. The Company assesses goodwill for impairment at the reporting unit level, (atequivalent to the same level as the Company’s business segment)segments. This assessment is performed on an annual basis as of December 31 of each year, or more frequently if events or circumstances, such as adverse changes in the economic or business environment, indicate there may be impairment. The Company organizes its operation into three3 reporting segments: (1) Consumer and Business Banking; (2) Commercial Banking; and (3) Other. For information on how the reporting units are identified and the components are aggregated, see Note 1815 — Business Segments to the Consolidated Financial Statements in this Form 10-Q.
There were no changeswas 0 change in the carrying amount of goodwill during the three months ended June 30, 2019 and 2018.March 31, 2020. The following tables presenttable presents changes in the carrying amount of goodwill by reporting unit during the sixthree months ended June 30, 2019 and 2018:March 31, 2019:
|
| | | | | | | | | | | | |
| |
| ($ in thousands) | | Consumer
and
Business Banking | | Commercial
Banking | | Total |
| Beginning balance, January 1, 2018 | | $ | 357,207 |
| | $ | 112,226 |
| | $ | 469,433 |
|
| Disposition of the DCB branches | | (3,886 | ) | | — |
| | (3,886 | ) |
| Ending balance, June 30, 2018 | | $ | 353,321 |
| | $ | 112,226 |
| | $ | 465,547 |
|
| |
| | | | ($ in thousands) | | Consumer and Business Banking | | Commercial Banking | | Total | | Consumer
and
Business Banking | | Commercial
Banking | | Total |
| Beginning balance, January 1, 2019 | | $ | 353,321 |
| | $ | 112,226 |
| | $ | 465,547 |
| | $ | 353,321 |
| | $ | 112,226 |
| | $ | 465,547 |
|
| Acquisition of Enstream Capital Markets, LLC | | — |
| | 150 |
| | 150 |
| | — |
| | 150 |
| | 150 |
|
| Ending balance, June 30, 2019 | | $ | 353,321 |
| | $ | 112,376 |
| | $ | 465,697 |
| |
| Ending balance, March 31, 2019 | | | $ | 353,321 |
| | $ | 112,376 |
| | $ | 465,697 |
|
|
Impairment Analysis
The Company performed its annual impairment analysis as of December 31, 2018,2019, and concluded that there was no0 goodwill impairment as the fair value of all reporting units exceeded the carrying amount of their respective reporting unit. There were no triggering events duringThe COVID-19 outbreak and public health response to contain it have resulted in economic and market deteriorations. Given this economic and market deterioration, as of March 31, 2020, we further evaluated our goodwill to assess if the fair value of all reporting units exceed the carrying amount of the respective reporting units. The Company performed its goodwill impairment test as of March 31, 2020 and concluded that there was 0 goodwill impairment for the three and six months ended June 30, 2019, and therefore, no additional goodwill impairment analysis was performed. No assurance can be given that goodwill will not be written down in future periods.March 31, 2020. Refer to Note 9 — Goodwill and Other Intangible Assets to the Consolidated Financial Statements of the Company’s 20182019 Form 10-K for additional details related to the Company’s annual goodwill impairment analysis.
Core Deposit Intangibles
Core deposit intangibles represent the intangible value of depositor relationships resulting from deposit liabilities assumed in various acquisitions and are included in Other assets on the Consolidated Balance Sheet. These intangibles are tested for impairment on an annual basis, or more frequently as events occur or current circumstances and conditions warrant. There were no0 impairment write-downs on the core deposit intangibles for each of the three and six months ended June 30, 2019March 31, 2020 and 2018. Core deposit intangibles associated with the sale of the Bank’s DCB branches, which had with a net carrying amount of $1.0 million were written off in the first quarter of 2018.2019.
The following table presents the gross carrying amount of core deposit intangible assets and accumulated amortization as of June 30, 2019March 31, 2020 and December 31, 2018:2019:
| | | | ($ in thousands) | | June 30, 2019 | | December 31, 2018 | | March 31, 2020 | | December 31, 2019 |
Gross balance (1) | | $ | 86,099 |
| | $ | 86,099 |
| | $ | 86,099 |
| | $ | 86,099 |
|
Accumulated amortization (1) | | (73,896 | ) | | (71,570 | ) | | (77,041 | ) | | (76,088 | ) |
Net carrying balance (1) | | $ | 12,203 |
| | $ | 14,529 |
| | $ | 9,058 |
| | $ | 10,011 |
|
|
| |
| (1) | Excludes fully amortized core deposit intangible assets. |
Amortization Expense
The Company amortizes the core deposit intangibles based on the projected useful lives of the related deposits. The amortization expense related to the core deposit intangible assets was $1.1 million$953 thousand and $1.4$1.2 million for the three months ended June 30,March 31, 2020 and 2019, and 2018, respectively, and $2.3 million and $2.9 million for the six months ended June 30, 2019 and 2018, respectively.
respectively.
The following table presents the estimated future amortization expense of core deposit intangibles as of June 30, 2019:March 31, 2020:
|
| | | | |
| |
| ($ in thousands) | | Amount |
| Remainder of 2019 | | $ | 2,192 |
|
| 2020 | | 3,634 |
|
| 2021 | | 2,749 |
|
| 2022 | | 1,865 |
|
| 2023 | | 1,199 |
|
| Thereafter | | 564 |
|
| Total | | $ | 12,203 |
|
| |
Note 11 — Leases
On January 1, 2019, the Company adopted ASU 2016-02, Leases (Topic 842) and subsequent related ASUs using the alternative transition method with a cumulative-effect adjustment to retained earnings without revising comparable prior periods’ financial information. As both a lessee and lessor, the Company elected the package of practical expedients available for leases that commenced before the adoption date. As such, the Company need not reassess: (1) whether any expired or existing contracts are or contain leases; (2) the lease classification for any expired or existing leases; and (3) the initial direct costs for any expired or existing leases, such as costs that would qualify for capitalization. The Company also elected the hindsight practical expedient to determine the lease term and to assess impairment on the Company’s right-of-use assets, and the practical expedient to not separate lease and non-lease components, consistently across all leases.
Lessee Arrangements
The Company determines if an arrangement is a lease or contains a lease at inception. As of June 30, 2019, the Company was obligated under a number of non-cancellable leases, predominantly operating leases for certain retail banking branches and office spaces in the U.S. and Greater China. These operating leases expire in the years ranging from 2019 to 2030, exclusive of renewal and termination options. Some of these leases include options to extend the leases for up to 15 years, while certain leases include lessee termination options. The Company's measurement of the operating lease liability and right-of-use asset does not include payments associated with the options to extend or terminate the lease since it is not reasonably certain that the Company will exercise the options. A portion of the operating leases includes variable lease payments, primarily based on the usage of the asset or the consumer price index ("CPI") as specified in the lease agreements. The Company does not remeasure lease liabilities as a result of changes to variable lease payments. The Company also has equipment and air rights finance leases which expire in the years ranging from 2021 to 2047.
The right-of-use assets and lease liabilities are recognized based on the present value of the future minimum lease payments over the lease term at commencement date. As most of the Company’s leases do not provide an implicit rate, the Company’s incremental borrowing rate based on the information available at the later of the adoption date or the lease commencement date is used to determine the present value of future payments. This approximates a collateralized borrowing rate over a similar term for an amount equal to the lease payments in a similar economic environment.
The following table presents the lease related assets and liabilities recorded on the Consolidated Balance Sheet as of June 30, 2019:
|
| | | | | | |
| |
| ($ in thousands) | | Classification on the Consolidated Balance Sheet | | June 30, 2019 |
| Assets: | | | | |
| Operating lease assets | | Operating lease right-of use assets | | $ | 109,032 |
|
| Finance lease assets | | Premises and equipment | | 8,144 |
|
| Total lease assets | | | | $ | 117,176 |
|
| Liabilities: | | | | |
| Operating lease liabilities | | Operating lease liabilities | | $ | 117,448 |
|
| Finance lease liabilities | | Long-term debt and finance lease liabilities | | 5,540 |
|
| Total lease liabilities | | | | $ | 122,988 |
|
| |
The following table presents the components of lease expense for operating and finance leases during the three and six months ended June 30, 2019:
|
| | | | | | | | |
| |
| ($ in thousands) | | Three Months Ended
June 30, 2019 | | Six Months Ended
June 30, 2019 |
| Operating lease cost | | $ | 8,770 |
| | $ | 17,750 |
|
| Finance lease cost: | | | | |
| Amortization of right-of-use assets | | 280 |
| | 482 |
|
| Interest on lease liabilities | | 41 |
| | 87 |
|
| Variable lease cost | | 32 |
| | 62 |
|
| Sublease income | | (49 | ) | | (81 | ) |
| Net lease cost | | $ | 9,074 |
| | $ | 18,300 |
|
| |
The following table presents the supplemental cash flow information related to leases during the three and six months ended June 30, 2019:
|
| | | | | | | | |
| |
| ($ in thousands) | | Three Months Ended
June 30, 2019 | | Six Months Ended
June 30, 2019 |
| Cash paid for amounts included in the measurement of lease liabilities: | | | | |
| Operating cash flows from operating leases | �� | $ | 8,806 |
| | $ | 17,981 |
|
| Operating cash flows from finance leases | | $ | 41 |
| | $ | 87 |
|
| Financing cash flows from finance leases | | $ | 218 |
| | $ | 435 |
|
| Right-of-use assets obtained in exchange for new lease liabilities: | | | | |
| Operating leases | | $ | 11,489 |
| | $ | 15,167 |
|
| Financing leases | | $ | 226 |
| | $ | 226 |
|
| |
The following table presents the weighted average remaining lease terms and discount rates related to leases as of June 30, 2019:
|
| | | |
|
| | June 30, 2019 |
Weighted-average remaining lease term (in years): | | |
Operating leases | | 4.7 |
|
Finance leases | | 15.9 |
|
Weighted-average discount rate: | | |
Operating leases | | 3.19 | % |
Finance leases | | 2.99 | % |
|
The following table presents a maturity analysis of the Company’s operating and finance lease liabilities as of June 30, 2019:
|
| | | | | | | | |
| |
| ($ in thousands) | | Operating Leases | | Finance Leases |
| Remainder of 2019 | | $ | 17,575 |
| | $ | 519 |
|
| 2020 | | 32,208 |
| | 1,035 |
|
| 2021 | | 27,642 |
| | 1,030 |
|
| 2022 | | 17,843 |
| | 690 |
|
| 2023 | | 10,807 |
| | 402 |
|
| Thereafter | | 20,614 |
| | 3,462 |
|
| Total minimum lease payments | | $ | 126,689 |
| | $ | 7,138 |
|
| Less: imputed interest | | (9,241 | ) | | (1,598 | ) |
| Present value of lease liabilities | | $ | 117,448 |
| | $ | 5,540 |
|
| |
Lessor Arrangements
The Company finances equipment under direct financing and sales-type leases to its commercial customers. As of June 30, 2019, the total net investment in direct financing and sales-type leases was $153.3 million with expiration in the years ranging from 2019 to 2027, exclusive of renewal options. Some of the leases include options to extend the leases for up to one year and some include early buyout options. As the Company is not reasonably certain at lease commencement that the purchase options will be exercised by the lessees, the lease terms exclude the purchase option.
The unguaranteed residual value is recorded at the present value of the amount the Company expects to derive from the underlying asset following the end of the lease term, which is not guaranteed by the lessee or any third party, discounted using the rate implicit in the lease. In certain cases, the Company obtains residual value insurance from third parties and/or guarantees from the lessee to manage the risk associated with the residual value of the leased assets. The carrying amount of guaranteed residual value, which was included in Loans held-for-investment on the Consolidated Balance Sheet, was $31.5 million as of June 30, 2019.
The following table presents the components of the net investment in direct financing and sales-type leases as of June 30, 2019:
|
| | | | |
| |
| ($ in thousands) | | June 30, 2019 |
| Lease receivables | | $ | 138,752 |
|
| Unguaranteed residual assets | | 14,580 |
|
| Net investment in direct financing and sales-type leases | | $ | 153,332 |
|
| |
The lease income for direct financing leases was $1.5 million and $3.0 million for three and six months ended June 30, 2019, respectively.
The following table presents future minimum lease payments that are expected to be received under the direct financing and sales-type leases as of June 30, 2019:
| | | | ($ in thousands) | | Direct Financing and Sales-Type Leases | | Amount |
| Remainder of 2019 | | $ | 14,038 |
| |
| 2020 | | 27,566 |
| |
| Remainder of 2020 | | | $ | 2,681 |
|
| 2021 | | 25,584 |
| | 2,749 |
|
| 2022 | | 18,190 |
| | 1,865 |
|
| 2023 | | 11,995 |
| | 1,199 |
|
| 2024 | | | 553 |
|
| Thereafter | | 20,342 |
| | 11 |
|
| Total minimum lease payments | | $ | 117,715 |
| |
| Less: imputed interest | | (11,917 | ) | |
| Present value of lease receivables | | $ | 105,798 |
| |
| Total | | | $ | 9,058 |
|
|
Note 1210 — Commitments and Contingencies
Commitments to ExtentExtend Credit — In the normal course of business, the Company provides customers loan commitments on predetermined terms. These outstanding commitments to extend credit are not reflected in the accompanying Consolidated Financial Statements. While the Company does not anticipate losses as a result of these transactions, commitments to extend credit are included in determining the appropriate level of the allowance for unfunded credit commitments, and outstanding commercial and standby letters of creditSBLCs. (“SBLCs”).
The following table presents the Company’s credit-related commitments as of June 30, 2019March 31, 2020 and December 31, 2018:2019:
| | | | ($ in thousands) | | June 30, 2019 | | December 31, 2018 | | March 31, 2020 | | December 31, 2019 |
| Loan commitments | | $ | 5,391,182 |
| | $ | 5,147,821 |
| | $ | 4,914,602 |
| | $ | 5,330,211 |
|
| Commercial letters of credit and SBLCs | | $ | 1,830,902 |
| | $ | 1,796,647 |
| | $ | 1,863,072 |
| | $ | 1,860,414 |
|
|
Loan commitments are agreements to lend to customers provided that there are no violations of any conditions established in the agreement. Commitments generally have fixed expiration dates or other termination clauses and may require maintenance of compensatory balances. Since many of the commitments are expected to expire without being drawn upon, the total commitment amounts do not necessarily represent future funding requirements.
Commercial letters of credit are issued to facilitate domestic and foreign trade transactions, while SBLCs are generally contingent upon the failure of the customers to perform according to the terms of the underlying contract with the third party. As a result, the total contractual amounts do not necessarily represent future funding requirements. The Company’s historical experience is that SBLCs typically expire without being funded. Additionally, in many cases, the Company holds collateral in various forms against these SBLCs. As part of its risk management activities, the Company monitors the creditworthiness of customers in conjunction with its SBLC exposure. Customers are obligated to reimburse the Company for any payment made on the customers’ behalf. If the customers fail to pay, the Company would, as applicable, liquidate the collateral and/or offset accounts. As of June 30, 2019,March 31, 2020, total letters of credit of $1.83$1.86 billion consisted of SBLCs in the amount of $1.77$1.81 billion and commercial letters of credit in the amount of $62.0$56.0 million.
The Company applies the same credit underwriting criteria to extend loans, commitments and conditional obligations to customers. Each customer’s creditworthiness is evaluated on a case-by-case basis. Collateral and financial guarantees may be obtained based on management’s assessment of a customer’s credit. Collateral may include cash, accounts receivable, inventory, property, plant and equipment, and income-producing commercial property.
Estimated exposure to loss from these commitments is included in the allowance for unfunded credit reserves,commitments and amounted to $12.9$20.8 million as of June 30, 2019March 31, 2020 and $12.4$11.1 million as of December 31, 2018. These amounts are included in Accrued expenses and other liabilities on the Consolidated Balance Sheet.2019.
Guarantees — The Company sells or securitizes single-family and multifamily residential loans with recourse in the ordinary course of business. The recourse component inof the loans sold or securitized with recourse is considered a guarantee. As the guarantor, the Company is obligated to repurchase up to the recourse component of the loans if the loans default. The following table presents the types of guarantees the Company had outstanding as of June 30, 2019March 31, 2020 and December 31, 2018:2019:
| | | | ($ in thousands) | | Maximum Potential
Future Payments | | Carrying Value | | Maximum Potential
Future Payments | | Carrying Value |
| | June 30, 2019 | | December 31, 2018 | | June 30, 2019 | | December 31, 2018 | | March 31, 2020 | | December 31, 2019 | | March 31, 2020 | | December 31, 2019 |
| Single-family residential loans sold or securitized with recourse | | $ | 14,771 |
| | $ | 16,700 |
| | $ | 14,771 |
| | $ | 16,700 |
| | $ | 11,857 |
| | $ | 12,578 |
| | $ | 11,857 |
| | $ | 12,578 |
|
| Multifamily residential loans sold or securitized with recourse | | 16,468 |
| | 17,058 |
| | 54,757 |
| | 69,974 |
| | 15,885 |
| | 15,892 |
| | 34,771 |
| | 40,708 |
|
| Total | | $ | 31,239 |
| | $ | 33,758 |
| | $ | 69,528 |
| | $ | 86,674 |
| | $ | 27,742 |
| | $ | 28,470 |
| | $ | 46,628 |
| | $ | 53,286 |
|
|
The Company’s recourse reserve related to these guarantees is included in the allowance for unfunded credit reservescommitments and totaled $88$65 thousand and $123$76 thousand as of June 30, 2019March 31, 2020 and December 31, 2018,2019, respectively. The allowance for unfunded credit reservescommitments is included in Accrued expenses and other liabilities on the Consolidated Balance Sheet. The Company continues to experience minimal losses from the single-family and multifamily residential loan portfolios sold or securitized with recourse.
Litigation — The Company is a party to various legal actions arising in the course of its business. In accordance with ASC 450, Contingencies, the Company accrues reserves for outstanding lawsuits, claims and proceedings when a loss contingency is probable and can be reasonably estimated. The Company estimates the amount of loss contingencies using current available information from legal proceedings, advice from legal counsel and available insurance coverage. Due to the inherent subjectivity of the assessments and unpredictability of the outcomes of the legal proceedings, any amounts accrued or included in this aggregate amount may not represent the ultimate loss to the Company from the legal proceedings in question. Thus, the Company’s exposure and ultimate losses may be higher, and possibly significantly more than the amounts accrued.
Other Commitments — The Company has commitments to invest in qualified affordable housing partnerships, tax credit and other investments as discussed in Note 98 — Investments in Qualified Affordable Housing Partnerships, Tax Credit and Other Investments, Net and Variable Interest Entities to the Consolidated Financial Statements in this Form 10-Q. As of June 30, 2019March 31, 2020 and December 31, 2018,2019, these commitments were $157.2$199.1 million and $161.0$193.8 million, respectively. These commitments are included in Accrued expenses and other liabilities on the Consolidated Balance Sheet.
Note 1311 — Revenue from Contracts with Customers
The following tables present revenue from contracts with customers within the scope of ASC 606, Revenue from Contracts with Customers, and other noninterest income, segregated by operating segments for the three and six months ended June 30, 2019March 31, 2020 and 2018:2019:
| | | | ($ in thousands) | | Three Months Ended June 30, 2019 | | Three Months Ended March 31, 2020 |
| | Consumer
and
Business
Banking | | Commercial
Banking | | Other | | Total | | Consumer
and
Business
Banking | | Commercial
Banking | | Other | | Total |
| Noninterest income: | | | | | | | | | | | | | | | | |
| Revenue from contracts with customers: | | | | | | | | | | | | | | | | |
| Deposit account fees: | | | | | | | | | | | | | | | | |
| Deposit service charges and related fee income | | $ | 5,397 |
| | $ | 3,299 |
| | $ | 10 |
| | $ | 8,706 |
| | $ | 5,544 |
| | $ | 3,799 |
| | $ | 6 |
| | $ | 9,349 |
|
| Card income | | 928 |
| | 154 |
| | — |
| | 1,082 |
| | 898 |
| | 200 |
| | — |
| | 1,098 |
|
| Wealth management fees | | 3,565 |
| | 235 |
| | — |
| | 3,800 |
| | 5,017 |
| | 340 |
| | — |
| | 5,357 |
|
| Total revenue from contracts with customers | | $ | 9,890 |
| | $ | 3,688 |
| | $ | 10 |
| | $ | 13,588 |
| | $ | 11,459 |
| | $ | 4,339 |
| | $ | 6 |
| | $ | 15,804 |
|
Other sources of noninterest income (1) | | 4,613 |
| | 29,968 |
| | 4,590 |
| | 39,171 |
| | 4,943 |
| | 28,117 |
| | 5,185 |
| | 38,245 |
|
| Total noninterest income | | $ | 14,503 |
| | $ | 33,656 |
| | $ | 4,600 |
| | $ | 52,759 |
| | $ | 16,402 |
| | $ | 32,456 |
| | $ | 5,191 |
| | $ | 54,049 |
|
|
|
| | | | | | | | | | | | | | | | |
| |
| ($ in thousands) | | Three Months Ended June 30, 2018 |
| | Consumer
and
Business
Banking | | Commercial
Banking | | Other | | Total |
| Noninterest income: | | | | | | | | |
| Revenue from contracts with customers: | | | | | | | | |
| Deposit account fees: | | | | | | | | |
| Deposit service charges and related fee income | | $ | 5,738 |
| | $ | 3,000 |
| | $ | 248 |
| | $ | 8,986 |
|
| Card income | | 933 |
| | 221 |
| | — |
| | 1,154 |
|
| Wealth management fees | | 4,501 |
| | — |
| | — |
| | 4,501 |
|
| Total revenue from contracts with customers | | $ | 11,172 |
| | $ | 3,221 |
| | $ | 248 |
| | $ | 14,641 |
|
Other sources of noninterest income (1) | | 3,413 |
| | 27,523 |
| | 2,691 |
| | 33,627 |
|
| Total noninterest income | | $ | 14,585 |
| | $ | 30,744 |
| | $ | 2,939 |
| | $ | 48,268 |
|
| |
|
| | | | | | | | | | | | | | | | |
| |
| ($ in thousands) | | Six Months Ended June 30, 2019 |
| | Consumer
and
Business
Banking | | Commercial
Banking | | Other | | Total |
| Noninterest income: | | | | | | | | |
| Revenue from contracts with customers: | | | | | | | | |
| Deposit account fees: | | | | | | | | |
| Deposit service charges and related fee income | | $ | 10,630 |
| | $ | 6,573 |
| | $ | 26 |
| | $ | 17,229 |
|
| Card income | | 1,861 |
| | 339 |
| | — |
| | 2,200 |
|
| Wealth management fees | | 7,271 |
| | 341 |
| | — |
| | 7,612 |
|
| Total revenue from contracts with customers | | $ | 19,762 |
| | $ | 7,253 |
| | $ | 26 |
| | $ | 27,041 |
|
Other sources of noninterest income (1) | | 8,513 |
| | 50,947 |
| | 8,389 |
| | 67,849 |
|
| Total noninterest income | | $ | 28,275 |
| | $ | 58,200 |
| | $ | 8,415 |
| | $ | 94,890 |
|
| |
| | | | ($ in thousands) | | Six Months Ended June 30, 2018 | | Three Months Ended March 31, 2019 |
| | Consumer
and
Business
Banking | | Commercial
Banking | | Other | | Total | | Consumer
and
Business
Banking | | Commercial
Banking | | Other | | Total |
| Noninterest income: | | | | | | | | | | | | | | | | |
| Revenue from contracts with customers: | | | | | | | | | | | | | | | | |
| Deposit account fees: | | | | | | | | | | | | | | | | |
| Deposit service charges and related fee income | | $ | 11,752 |
| | $ | 6,014 |
| | $ | 406 |
| | $ | 18,172 |
| | $ | 5,233 |
| | $ | 3,274 |
| | $ | 16 |
| | $ | 8,523 |
|
| Card income | | 2,003 |
| | 395 |
| | — |
| | 2,398 |
| | 760 |
| | 185 |
| | — |
| | 945 |
|
| Wealth management fees | | 7,297 |
| | 157 |
| | — |
| | 7,454 |
| | 3,706 |
| | 106 |
| | — |
| | 3,812 |
|
| Total revenue from contracts with customers | | $ | 21,052 |
| | $ | 6,566 |
| | $ | 406 |
| | $ | 28,024 |
| | $ | 9,699 |
| | $ | 3,565 |
| | $ | 16 |
| | $ | 13,280 |
|
Other sources of noninterest income (1) | | 37,981 |
| | 51,616 |
| | 5,091 |
| | 94,688 |
| | 4,073 |
| | 20,979 |
| | 3,799 |
| | 28,851 |
|
| Total noninterest income | | $ | 59,033 |
| | $ | 58,182 |
| | $ | 5,497 |
| | $ | 122,712 |
| | $ | 13,772 |
| | $ | 24,544 |
| | $ | 3,815 |
| | $ | 42,131 |
|
|
| |
| (1) | Primarily represents revenue from contracts with customers that are out of the scope of ASC 606, Revenue from Contracts with Customers. |
Generally, the Company recognizes revenue from contracts with customers when it satisfies its performance obligations. The Company’s performance obligations are typically satisfied as services are rendered. The Company generally records contract liabilities, or deferred revenue, when payments from customers are received or due in advance of providing services. The Company records contract assets when services are provided to customers before payment is received or before payment is due. Since the Company receives payments for its services during the period or at the time services are provided, there were no0 contract assetassets or receivable balancescontract liabilities as of both June 30, 2019March 31, 2020 and December 31, 2018.2019.
The major revenue streams by fee type that are within the scope of ASC 606 presented in the above tables are described in additional detail below:
Deposit Account Fees — Deposit Service Charges and Related Fee Income
The Company offers a range of deposit products to individuals and businesses, which includeincludes savings, money market, checking and time deposit accounts. The deposit account services include ongoing account maintenance, as well as certain optional services such as automated teller machine usage, wire transfer services or check orders. In addition, treasury management and business account analysis services are offered to commercial deposit customers. The monthly account fees may vary with the amount of average monthly deposit balances maintained, or the Company may charge a fixed monthly account maintenance fee if certain average balances are not maintained. In addition, each time a deposit customer selects an optional service, the Company may earn transactional fees, generally recognized by the Company at the point in time when the transaction occurs. For business analysis accounts, commercial deposit customers receive an earnings credit based on their account balance, which can be used to offset the cost of banking and treasury management services. Business analysis accounts that are assessed fees in excess of earnings credits received are typically charged at the end of each month, after all transactions are known and the credits are calculated.
Deposit Account Fees — Card Income
Card income is comprised of merchant referral fees and interchange income. For merchant referral fees, the Company provides marketing and referral services to acquiring banks for merchant card processing services and earns variable referral fees based on transaction activities. The Company satisfies its performance obligation over time as the Company identifies, solicits, and refers business customers who are provided such services. The Company receives monthly fees net of consideration it pays to the acquiring bank performing the merchant card processing services. The Company recognizes revenue on a monthly basis when the uncertainty associated with the variable referral fees is resolved after the Company receives monthly statements from the acquiring bank. For interchange income, the Company, as a card issuer, has a stand ready performance obligation to authorize, clear, and settle card transactions. The Company earns, or pays, interchange fees, which are percentage-based on each transaction, and based on rates published by the corresponding payment network for transactions processed using their network. The Company measures its progress toward the satisfaction of its performance obligation over time, as services are rendered, and the Company provides continuous access to this service and settles transactions as its customer or the payment network requires. Interchange income is presented net of direct costs paid to the customer and entities in their distribution chain, which are transaction-based expenses such as rewards program expenses and certain network costs. Revenue is recognized when the net profit is determined by the payment networks at the end of each day.
Wealth Management Fees
The Company employs financial consultants to provideprovides investment planning services for customers including wealth management services, asset allocation strategies, portfolio analysis and monitoring, investment strategies, and risk management strategies. The fees the Company earns are variable and are generally received monthly. The Company recognizes revenue for the services performed at quarter-end based on actual transaction details received from the broker-dealer the Company engages.
Practical Expedients and Exemptions
The Company applies the practical expedient in ASC 606-10-50-14 and does not disclose the value of unsatisfied performance obligations. This is becauseobligations as the Company’s contracts with customers generally have a term that is less than one year, are open-ended with a cancellation period that is less than one year, or allow the Company to recognize revenue in the amount to which the Company has the right to invoice.
In addition, given the short-term nature of the contracts, the Company also applies the practical expedient in ASC 606-10-32-18 and does not adjust the consideration from customers for the effects of a significant financing component, if at contract inception, the period between when the entity transfers the goods or services and when the customer pays for that good or service is one year or less.
Note 14 — Income Taxes
The following table presents the income tax expense and the effective tax rate for the three and six months ended June 30, 2019 and 2018:
|
| | | | | | | | | | | | | | | | | | | | | | |
| |
| ($ in thousands) | | Three Months Ended June 30, | | Six Months Ended June 30, |
| | 2019 | | 2018 | | % Change | | 2019 | | 2018 | | % Change |
| Income before income taxes | | $ | 223,177 |
| | $ | 196,992 |
| | 13 | % | | $ | 418,268 |
| | $ | 408,776 |
| | 2 | % |
| Income tax expense | | $ | 72,797 |
| | $ | 24,643 |
| | 195 | % | | $ | 103,864 |
| | $ | 49,395 |
| | 110 | % |
| Effective tax rate | | 32.6 | % | | 12.5 | % | | 20 | % | | 24.8 | % | | 12.1 | % | | 13 | % |
| |
The effective tax rates were 32.6% and 24.8% for the three and six months ended June 30, 2019, respectively, compared to 12.5% and 12.1% for the same periods in 2018. The year-over-year increases in the effective tax rate were primarily due to the $30.1 million of additional income tax expense recorded in the second quarter of 2019 to reverse certain previously claimed tax credits related to the Company’s investment in DC Solar. In addition, a year-over-year decrease in tax credits recognized from investments in renewable energy and historic rehabilitation tax credit projects contributed to the higher effective tax rates during three and six months ended June 30, 2019.
Investors in DC Solar funds, including the Company, received tax credits for making these renewable energy investments. The Company had claimed tax credits of approximately $53.9 million in the Consolidated Financial Statements between 2014 and 2018, reduced by a deferred tax liability of $5.7 million related to the 50% tax basis reduction, for a net impact to the Consolidated Financial Statements of $48.2 million. During the three months ended June 30, 2019, the Company reversed $33.6 million out of the $53.9 million previously claimed tax credits, and $3.5 million out of the $5.7 million deferred tax liability, resulting in $30.1 million of additional income tax expense.
ASC 740-10-25-6 states in part, that an entity shall initially recognize the financial statement effects of a tax position when it is more-likely-than-not, based on the technical merits, that the position will be sustained upon examination. The term “more-likely-than-not” means a likelihood of more than 50 percent; the terms “examined” and “upon examination” also include resolution of the related appeals or litigation processes, if any. The level of evidence that is necessary and appropriate to support the technical merits of a tax position is subject to judgment and depends on available information as of the balance sheet date. Under ASC 740, Income Taxes, an entity should not consider new information that is received after the balance sheet date, when evaluating an uncertain tax position as of the balance sheet date. Based on the available information known as of December 31, 2018 and March 31, 2019, the Company reassessed the technical merits of the position taken and concluded, based on initial and ongoing due diligence performed by the Company, it believed that the DC Solar related tax credits the Company had previously claimed continued to meet the more-likely-than-not criterion for recognition as of those dates.
During the first quarter of 2019, the Company, in coordination with other fund investors, engaged an unaffiliated third party inventory firm to report on the actual number of mobile solar generators in existence. As of June 30, 2019, based on the latest inventory report, none of the mobile service generators that had been purchased by the Company’s 2017 and 2018 tax credit funds were found. On the other hand, a vast majority of the Company’s mobile solar generators purchased by the Company’s 2014 and 2015 tax credit funds were found. Therefore, as of June 30, 2019, based on this inventory information, as well as management’s best judgments regarding the future settlement of the related tax positions with the Internal Revenue Service, the Company concluded that a portion of the previously claimed tax credits would be recaptured. Accordingly, the Company recorded $30.1 million of income tax expense during the three months ended June 30, 2019.
The Company continues to conduct an ongoing investigation to gather information related to this matter, including tracking asset seizures of DC Solar and ongoing federal investigations. There can be no assurance that the Company will not recognize additional income tax expense as new information becomes available, or due to changes in tax laws, case law and regulations; or that the Company will not ultimately need to reverse the remaining tax credits previously claimed. For further discussion related to the Company’s investment in DC Solar and the Company’s impairment evaluation and monitoring process in tax credit investments, refer to Note 9 — Investments in Qualified Affordable Housing Partnerships, Tax Credit and Other Investments, Net and Variable Interest Entities and Note 4 — Fair Value Measurement and Fair Value of Financial Instruments to the Consolidated Financial Statements in this Form 10-Q, respectively.
Note 1512 — Stock Compensation Plans
Pursuant to the Company’s 2016 Stock Incentive Plan, as amended, the Company may issue stocks, stock options, restricted stock, restricted stock units (“RSUs”), stock options, stock purchase warrants, stock appreciation rights, phantom stock and dividend equivalents to eligible employees, non-employee directors, consultants, and other service providers of the Company and its subsidiaries. There were no0 outstanding stock awards other than RSUs as of both June 30, 2019March 31, 2020 and December 31, 2018.2019.
The following table presents a summary of the total share-based compensation costsexpense and the related net tax (deficiencies) benefits associated with the Company’s various employee share-based compensation plans for the three and six months ended June 30, 2019March 31, 2020 and 2018:2019:
| | | | ($ in thousands) | | Three Months Ended June 30, | | Six Months Ended June 30, | | Three Months Ended March 31, |
| | 2019 | | 2018 | | 2019 | | 2018 | | 2020 | | 2019 |
| Stock compensation costs | | $ | 8,081 |
| | $ | 7,057 |
| | $ | 15,525 |
| | $ | 13,215 |
| | $ | 7,209 |
| | $ | 7,444 |
|
| Related net tax benefits for stock compensation plans | | $ | 1 |
| | $ | 97 |
| | $ | 4,708 |
| | $ | 4,875 |
| |
| Related net tax (deficiencies) benefits for stock compensation plans | | | $ | (1,566 | ) | | $ | 4,707 |
|
|
RSUsRestricted Stock Units — RSUs are granted under the Company’s long-term incentive plan at no cost to the recipient. RSUs vest ratably over three years or cliff vest after three or five years of continued employment from the date of the grant. RSUsgrant and are authorized to settle predominantly in shares of the Company’s common stock. Certain RSUs will be settled in cash, which subjects these RSUs to variable accounting whereby the compensation cost is adjusted to fair value based on changes in the Company’s stock price up to the settlement date.cash. RSUs entitle the recipient to receive cash dividend equivalents to any dividends paid on the underlying common stock during the period the RSUs are outstanding. RSUThe dividends are accrued during the vesting period and are paid at the time of vesting. While a portion of RSUs are time-vesting awards, others vest subject to the attainment of specified performance goals referred to as “Performance-based“performance-based RSUs.” AllSubstantially all RSUs are subject to forfeiture until vested.vested unless otherwise specified in the employment terms.
Performance-based RSUs are granted at the target amount of awards. Based on the Company’s attainment of specified performance goals and consideration of market conditions, the number of shares that vest can be adjusted to a minimum of zero0 and to a maximum of 200% of the target. The amount of performance-based RSUs that are eligible to vest is determined at the end of each performance period and is then added together to determineas the total number of performance shares that are eligible to vest. Performance-based RSUs cliff vest three years from the date of each grant.
Compensation costs for the time-based awards that will be settled in shares of the Company’s common stock are based on the quoted market price of the Company’s common stock at the grant date. Compensation costs for certain time-based awards that will be settled in cash are adjusted to fair value based on changes in the share price of the Company’s common stock up to the settlement date. Compensation costs associated with performance-based RSUs are based on grant date fair value which considers both market and performance conditions, and is subject to subsequent adjustments based on the changes in the Company’s projected outcome of the performance criteria. Compensation costs of both time-based awards and performance-based awards are estimated based on awards ultimately expected to vest and recognized on a straight-line basis from the grant date until the vesting date of each grant.
The following table presents a summary of the activities and pricing information for the Company’s time-based and performance-based RSUs that will be settled in shares for the sixthree months ended June 30, 2019.March 31, 2020. The number of outstanding performance-based RSUs stated below assumes the associated performance targets will be met at the target level:
| | | | | | Six Months Ended June 30, 2019 | | Time-Based RSUs | | Performance-Based RSUs |
| | Time-Based RSUs | | Performance-Based RSUs | | Shares | | Weighted-Average Grant Date Fair Value | | Shares | | Weighted-Average Grant Date Fair Value |
| | Shares | | Weighted-Average Grant Date Fair Value | | Shares | | Weighted-Average Grant Date Fair Value | |
| Outstanding, at beginning of period | | 1,121,391 |
| | $ | 51.22 |
| | 411,290 |
| | $ | 49.93 |
| |
| Outstanding, January 1, 2020 | | | 1,139,868 |
| | $ | 57.78 |
| | 386,483 |
| | $ | 60.13 |
|
| Granted | | 490,809 |
| | 52.60 |
| | 134,600 |
| | 54.64 |
| | 606,327 |
| | 41.76 |
| | 165,084 |
| | 39.79 |
|
| Vested | | (355,029 | ) | | 31.58 |
| | (159,407 | ) | | 29.18 |
| | (250,160 | ) | | 54.47 |
| | (131,597 | ) | | 56.59 |
|
| Forfeited | | (39,930 | ) | | 56.90 |
| | — |
| | — |
| | (22,182 | ) | | 52.82 |
| | — |
| | — |
|
| Outstanding, at end of period | | 1,217,241 |
| | $ | 57.32 |
| | 386,483 |
| | $ | 60.13 |
| |
| Outstanding, March 31, 2020 | | | 1,473,853 |
| | $ | 51.83 |
| | 419,970 |
| | $ | 53.24 |
|
|
The following table presents a summary of the activities for the Company’s time-based RSUs that will be settled in cash for the sixthree months ended June 30, 2019:March 31, 2020:
|
| | | |
| |
| | | Six Months Ended
June 30, 2019 |
| Shares |
Outstanding, at beginning of periodJanuary 1, 2020 | | —11,638 |
|
| Granted | | 12,1455,639 |
|
| Vested | | —(600 |
|
| Forfeited | | — |
|
Outstanding, at end of periodMarch 31, 2020 | | 12,14516,677 |
|
| |
As of June 30, 2019,March 31, 2020, there were $31.7$35.3 million and $19.3$19.7 million of total unrecognized compensation costs related to unvested time-based and performance-based RSUs, respectively. These costs are expected to be recognized over a weighted-average period of 2.082.18 years and 2.172.23 years, respectively.
Note 1613 — Stockholders’ Equity and Earnings Per Share
Warrant — The Company acquired MetroCorp Bancshares, Inc., on January 17, 2014. Prior to the acquisition, MetroCorp Bancshares, Inc. had outstanding warrants to purchase 771,429 shares of its common stock. Upon the acquisition, the rights of the warrant holders were converted into the rights to acquire 230,282 shares of East West’s common stock until January 16, 2019. All warrants were exercised on January 7, 2019.
Earnings Per Share— Basic EPS is computed by dividing net income available to common stockholders by the weighted-average number of common shares outstanding during each period. Diluted EPS is computed by dividing net income available to common stockholders by the weighted-average number of common shares outstanding during each period, plus any incremental dilutive common share equivalents calculated for warrants and RSUs outstanding using the treasury stock method.
The following table presents the basic and diluted EPS calculations for the three and six months ended June 30,March 31, 2020 and 2019. For more information on the calculation of EPS, see Note 1 — Summary of Significant Accounting Policies— Significant Accounting Policies —Earnings Per Share to the Consolidated Financial Statements of the Company’s 2019 and 2018:Form 10-K.
|
| | | | | | | | |
| |
| ($ and shares in thousands, except per share data) | | Three Months Ended March 31, |
| | 2020 | | 2019 |
| Basic: | | | | |
| Net income | | $ | 144,824 |
| | $ | 164,024 |
|
| Basic weighted-average number of shares outstanding | | 144,814 |
| | 145,256 |
|
| Basic EPS | | $ | 1.00 |
| | $ | 1.13 |
|
| Diluted: | | | | |
| Net income | | $ | 144,824 |
| | $ | 164,024 |
|
Basic weighted-average number of shares outstanding (1) | | 144,814 |
| | 145,256 |
|
Diluted potential common shares (2) | | 471 |
| | 665 |
|
Diluted weighted-average number of shares outstanding (1)(2) | | 145,285 |
| | 145,921 |
|
| Diluted EPS | | $ | 1.00 |
| | $ | 1.12 |
|
| |
|
| | | | | | | | | | | | | | | | |
| |
| ($ and shares in thousands, except per share data) | | Three Months Ended June 30, | | Six Months Ended June 30, |
| | 2019 | | 2018 | | 2019 | | 2018 |
| Basic: | | | | | | | | |
| Net income | | $ | 150,380 |
| | $ | 172,349 |
| | $ | 314,404 |
| | $ | 359,381 |
|
| | | | | | | | | |
| Basic weighted-average number of shares outstanding | | 145,546 |
| | 144,899 |
| | 145,402 |
| | 144,782 |
|
| Basic EPS | | $ | 1.03 |
| | $ | 1.19 |
| | $ | 2.16 |
| | $ | 2.48 |
|
| | | | | | | | | |
| Diluted: | | | | | | | | |
| Net income | | $ | 150,380 |
| | $ | 172,349 |
| | $ | 314,404 |
| | $ | 359,381 |
|
| | | | | | | | | |
| Basic weighted-average number of shares outstanding | | 145,546 |
| | 144,899 |
| | 145,402 |
| | 144,782 |
|
Diluted potential common shares (1) | | 506 |
| | 1,192 |
| | 614 |
| | 1,264 |
|
Diluted weighted-average number of shares outstanding (1) | | 146,052 |
| | 146,091 |
| | 146,016 |
| | 146,046 |
|
| Diluted EPS | | $ | 1.03 |
| | $ | 1.18 |
| | $ | 2.15 |
| | $ | 2.46 |
|
| |
| |
| (1) | The Company acquired MetroCorp Bancshares, Inc. (“MetroCorp”) on January 17, 2014. Prior to the acquisition, MetroCorp had outstanding warrants to purchase 771,429 shares of its common stock. Upon the acquisition, the rights of the warrant holders were converted into the rights to acquire 230,282 shares of East West’s common stock until January 16, 2019. All warrants were exercised on January 7, 2019. |
| |
| (2) | Includes dilutive shares from RSUs for the three and six months ended June 30, 2019,March 31, 2020 and from RSUs and warrants for the three and six months ended June 30, 2018.2019. |
For the three and six months ended June 30,March 31, 2020 and 2019, 584328 thousand and 239263 thousand weighted-average shares of anti-dilutive RSUs, respectively, were excluded from the diluted EPS computation. In comparison, 4,012 and 3,807 weighted-average shares
Stock Repurchase Program — On March 3, 2020, the Company’s Board of anti-dilutive RSUs, respectively, were excluded fromDirectors authorized a stock repurchase program to buy back up to $500.0 million of the diluted EPS computation forCompany’s common stock. During the three and six months ended June 30, 2018.March 31, 2020, the Company repurchased 4,471,682 shares at an average price of $32.64 per share and a total cost of $146.0 million. The Company did not repurchase any shares during the three months ended March 31, 2019.
Note 1714 — Accumulated Other Comprehensive Income (Loss)
The following tables presenttable presents the changes in the components of AOCI balances for the three and six months ended June 30, 2019March 31, 2020 and 2018:2019:
|
| | | | | | | | | | | | |
| |
| ($ in thousands) | | Available-
for-Sale
Investment
Securities | | Foreign
Currency
Translation
Adjustments, Net of Hedges (1) | | Total |
| BALANCE, APRIL 1, 2018 | | $ | (55,981 | ) | | $ | 177 |
| | $ | (55,804 | ) |
| Net unrealized (losses) arising during the period | | (8,693 | ) | | (6,822 | ) | | (15,515 | ) |
| Amounts reclassified from AOCI | | (148 | ) | | — |
| | (148 | ) |
| Changes, net of tax | | (8,841 | ) | | (6,822 | ) | | (15,663 | ) |
| BALANCE, JUNE 30, 2018 | | $ | (64,822 | ) | | $ | (6,645 | ) | | $ | (71,467 | ) |
| BALANCE, APRIL 1, 2019 | | $ | (23,810 | ) | | $ | (9,173 | ) | | $ | (32,983 | ) |
| Net unrealized gains (losses) arising during the period | | 30,046 |
| | (6,016 | ) | | 24,030 |
|
| Amounts reclassified from AOCI | | (1,019 | ) | | — |
| | (1,019 | ) |
| Changes, net of tax | | 29,027 |
| | (6,016 | ) | | 23,011 |
|
| BALANCE, JUNE 30, 2019 | | $ | 5,217 |
| | $ | (15,189 | ) | | $ | (9,972 | ) |
| |
|
| | | | | | | | | | | | |
| |
| ($ in thousands) | | Available-
for-Sale
Investment
Securities | | Foreign
Currency
Translation
Adjustments, Net of Hedges (1) | | Total |
| BALANCE, JANUARY 1, 2018 | | $ | (30,898 | ) | | $ | (6,621 | ) | | $ | (37,519 | ) |
Cumulative effect of change in accounting principle related to marketable equity securities (2) | | 385 |
| | — |
| | 385 |
|
Reclassification of tax effects in AOCI resulting from the new federal corporate income tax rate (3) | | (6,656 | ) | | — |
| | (6,656 | ) |
| BALANCE, JANUARY 1, 2018, ADJUSTED | | (37,169 | ) | | (6,621 | ) | | (43,790 | ) |
| Net unrealized (losses) arising during the period | | (26,004 | ) | | (24 | ) | | (26,028 | ) |
| Amounts reclassified from AOCI | | (1,649 | ) | | — |
| | (1,649 | ) |
| Changes, net of tax | | (27,653 | ) | | (24 | ) | | (27,677 | ) |
| BALANCE, JUNE 30, 2018 | | $ | (64,822 | ) | | $ | (6,645 | ) | | $ | (71,467 | ) |
| BALANCE, JANUARY 1, 2019 | | $ | (45,821 | ) | | $ | (12,353 | ) | | $ | (58,174 | ) |
| Net unrealized gains (losses) arising during the period | | 53,157 |
| | (2,836 | ) | | 50,321 |
|
| Amounts reclassified from AOCI | | (2,119 | ) | | — |
| | (2,119 | ) |
| Changes, net of tax | | 51,038 |
| | (2,836 | ) | | 48,202 |
|
| BALANCE, JUNE 30, 2019 | | $ | 5,217 |
| | $ | (15,189 | ) | | $ | (9,972 | ) |
| |
|
| | | | | | | | | | | | |
| |
| ($ in thousands) | | Available-
for-Sale
Debt
Securities | | Foreign
Currency
Translation
Adjustments (1) | | Total |
| Balance, January 1, 2019 | | $ | (45,821 | ) | | $ | (12,353 | ) | | $ | (58,174 | ) |
| Net unrealized gains arising during the period | | 23,111 |
| | 3,180 |
| | 26,291 |
|
| Amounts reclassified from AOCI | | (1,100 | ) | | — |
| | (1,100 | ) |
| Changes, net of tax | | 22,011 |
| | 3,180 |
| | 25,191 |
|
| Balance, March 31, 2019 | | $ | (23,810 | ) | | $ | (9,173 | ) | | $ | (32,983 | ) |
| Balance, January 1, 2020 | | $ | (2,419 | ) | | $ | (15,989 | ) | | $ | (18,408 | ) |
| Net unrealized gains (losses) arising during the period | | 28,530 |
| | (2,164 | ) | | 26,366 |
|
| Amounts reclassified from AOCI | | (1,077 | ) | | — |
| | (1,077 | ) |
| Changes, net of tax | | 27,453 |
| | (2,164 | ) | | 25,289 |
|
| Balance, March 31, 2020 | | $ | 25,034 |
| | $ | (18,153 | ) | | $ | 6,881 |
|
| |
| |
| (1) | Represents foreign currency translation adjustments related to the Company’s net investment in non-U.S. operations, including related hedges. The functional currency and reporting currency of the Company’s foreign subsidiary was Chinese RenminbiRMB and USD, respectively. |
| |
(2) | Represents the impact of the adoption in the first quarter of 2018 of ASU 2016-01, Financial Instruments — Overall (Subtopic 825-10): Recognition and Measurement of Financial Assets and Financial Liabilities.
|
| |
(3) | Represents amounts reclassified from AOCI to retained earnings due to the early adoption of ASU 2018-02, Income Statement — Reporting Comprehensive Income (Topic 220): Reclassification of Certain Tax Effects from Accumulated Other Comprehensive Income in the first quarter of 2018.
|
The following tables presenttable presents the components of other comprehensive income (loss), reclassifications to net income and the related tax effects for the three and six months ended June 30, 2019March 31, 2020 and 2018:2019:
|
| | | | | | | | | | | | | | | | | | | | | | | | |
| |
| ($ in thousands) | | Three Months Ended June 30, |
| | 2019 | | 2018 |
| | Before-Tax | | Tax Effect | | Net-of-Tax | | Before-Tax | | Tax Effect | | Net-of-Tax |
| Available-for-sale investment securities: | | | | | | | | | | | | |
| Net unrealized gains (losses) arising during the period | | $ | 44,531 |
| | $ | (14,485 | ) | | $ | 30,046 |
| | $ | (12,342 | ) | | $ | 3,649 |
| | $ | (8,693 | ) |
Net realized gains reclassified into net income (1) | | (1,447 | ) | | 428 |
| | (1,019 | ) | | (210 | ) | | 62 |
| | (148 | ) |
| Net change | | 43,084 |
| | (14,057 | ) | | 29,027 |
| | (12,552 | ) | | 3,711 |
| | (8,841 | ) |
| Foreign currency translation adjustments, net of hedges: | | | | | | | | | | | | |
Net unrealized (losses) arising during the period (2) | | (2,989 | ) | | (3,027 | ) | | (6,016 | ) | | (6,822 | ) | | — |
| | (6,822 | ) |
| Net change | | (2,989 | ) | | (3,027 | ) | | (6,016 | ) | | (6,822 | ) | | — |
| | (6,822 | ) |
| Other comprehensive income (loss) | | $ | 40,095 |
| | $ | (17,084 | ) | | $ | 23,011 |
| | $ | (19,374 | ) | | $ | 3,711 |
| | $ | (15,663 | ) |
| |
| | | | ($ in thousands) | | Six Months Ended June 30, | | Three Months Ended March 31, |
| | 2019 | | 2018 | | 2020 | | 2019 |
| | Before-Tax | | Tax Effect | | Net-of-Tax | | Before-Tax | | Tax Effect | | Net-of-Tax | | Before-Tax | | Tax Effect | | Net-of-Tax | | Before-Tax | | Tax Effect | | Net-of-Tax |
| Available-for-sale investment securities: | | | | | | | | | | | | | |
| Net unrealized gains (losses) arising during the period | | $ | 75,469 |
| | $ | (22,312 | ) | | $ | 53,157 |
| | $ | (36,919 | ) | | $ | 10,915 |
| | $ | (26,004 | ) | |
| AFS debt securities: | | | | | | | | | | | | | |
| Net unrealized gains arising during the period | | | $ | 40,493 |
| | $ | (11,963 | ) | | $ | 28,530 |
| | $ | 30,938 |
| | $ | (7,827 | ) | | $ | 23,111 |
|
Net realized gains reclassified into net income (1) | | (3,008 | ) | | 889 |
| | (2,119 | ) | | (2,339 | ) | | 690 |
| | (1,649 | ) | | (1,529 | ) | | 452 |
| | (1,077 | ) | | (1,561 | ) | | 461 |
| | (1,100 | ) |
| Net change | | 72,461 |
| | (21,423 | ) | | 51,038 |
| | (39,258 | ) | | 11,605 |
| | (27,653 | ) | | 38,964 |
| | (11,511 | ) | | 27,453 |
| | 29,377 |
| | (7,366 | ) | | 22,011 |
|
| Foreign currency translation adjustments, net of hedges: | | | | | | | | | | | | | | | | | | | | | | | | |
Net unrealized (losses) arising during the period (2) | | 191 |
| | (3,027 | ) | | (2,836 | ) | | (24 | ) | | — |
| | (24 | ) | |
| Net unrealized (losses) gains arising during the period | | | (1,766 | ) | | (398 | ) | | (2,164 | ) | | 3,180 |
| | — |
| | 3,180 |
|
| Net change | | 191 |
| | (3,027 | ) | | (2,836 | ) | | (24 | ) | | — |
| | (24 | ) | | (1,766 | ) | | (398 | ) | | (2,164 | ) | | 3,180 |
| | — |
| | 3,180 |
|
| Other comprehensive income (loss) | | $ | 72,652 |
| | $ | (24,450 | ) | | $ | 48,202 |
| | $ | (39,282 | ) | | $ | 11,605 |
| | $ | (27,677 | ) | | $ | 37,198 |
| | $ | (11,909 | ) | | $ | 25,289 |
| | $ | 32,557 |
| | $ | (7,366 | ) | | $ | 25,191 |
|
|
| |
| (1) | For the three and six months ended June 30,March 31, 2020 and 2019, and 2018, pre-tax amounts were reported in Net gains on sales of available-for-sale investmentAFS debt securities on the Consolidated Statement of Income. |
| |
(2) | The tax effects on foreign currency translation adjustments represent the cumulative net deferred tax liabilities since inception on net investment hedges that were recorded during the second quarter of 2019. |
Note 1815 — Business Segments
The Company organizes its operations into three3 reportable operating segments: (1) Consumer and Business Banking; (2) Commercial Banking; and (3) Other. These segments are defined by the type of customers served, and the related products and services provided, andprovided. The segments reflect how financial information is currently evaluated by management. Operating segment results are based on the Company’s internal management reporting process, which reflects assignments and allocations of certain balance sheet and income statement items. Because of the interrelationships among the segments, theThe information presented is not indicative of how the segments would perform if they operated as independent entities.entities due to the interrelationships among the segments.
The Consumer and Business Banking segment primarily provides financial products and services to consumer and commercial customers through the Company’s domestic branch network. This segment offers consumer and commercial deposits, mortgage and home equity loans, and other products and services. The Consumer and Business Banking segmentIt also originates commercial loans for small and medium-sized enterprises through the Company’s branch network. Other products and services provided by the Consumer and Business Bankingthis segment include wealth management, treasury management and foreign exchange services.
The Commercial Banking segment primarily generates commercial loans and deposits. Commercial loan products include commercial business loans and lines of credit, trade finance loans and letters of credit, CRE loans, construction lending,and land loans, affordable housing loans and letters of credit, asset-based lending, and equipment financing. Commercial deposit products and other financial services include treasury management, foreign exchange services, and interest rate and commodity hedging risk management.
hedging.
The remaining centralized functions, including the corporate treasury activities of the Company and eliminations of inter-segment amounts, have been aggregated and included in the Other segment, which provides broad administrative support to the two2 core segments, namely the Consumer and Business Banking and the Commercial Banking segments.
The Company utilizes an internal reporting process to measure the performance of the three3 operating segments within the Company. The internal reporting process derives operating segment results by utilizing allocation methodologies for revenue and expenses. Net interest income of each segment represents the difference between actual interest earned on assets and interest incurred on liabilities of the segment, adjusted for funding charges or credits through the Company’s internal funds transfer pricing (“FTP”) process. The process charges a cost to fund loans (“FTP charges for loans”) and allocates credits for funds provided from deposits (“FTP credits for deposits”) using internal funds transfer pricing rates, which are based on market interest rates and other factors. The internal funds transfer pricing rates, which are applied to both FTP charges for loans and FTP credits for deposits, increase as the market interest rates increase, and vice versa. The treasury function within the Other segment is responsible for liquidity and interest rate management of the Company. Therefore, the net spread between the total internal funds transfer pricing charges and credits is recorded as part of net interest income in the Other segment.
The Company’s internal funds transfer pricing process is managed by the treasury function within the Other segment. The process is formulated with the goal of encouraging loan and deposit growth that is consistent with the Company’s overall profitability objectives, as well as to provide a reasonable and consistent basis for the measurement of its business segments’ net interest margins and profitability. The Company’s internal funds transfer pricing assumptions and methodologies are reviewed at least annually to ensure that the process is reflective of current market conditions. Noninterest income and noninterest expense directly attributable to a business segment are assigned to the related businessthat segment. Indirect costs, including technology-related costs and corporate overhead, are allocated based on a segment’s estimated usage using factors including but not limited to, full-time equivalent employees, net interest margin,income, and loan and deposit volume. Charge-offs are allocated to the respective segment directly associated with the loans that are charged off, and the remaining provision for credit losses is allocated to each segment based on loan volume. The Company’s internal reporting process utilizes a full-allocation methodology. Under this methodology, corporate expenses and indirect expenses incurred by the Other segment are allocated to the Consumer and Business Banking and the Commercial Banking segments, except certain corporate treasury-related expenses and insignificant unallocated expenses.
The corporate treasury function within the Other segment is responsible for liquidity and interest rate management of the Company. The Company’s internal FTP process is also managed by the corporate treasury function within the Other segment. The process is formulated with the goal of encouraging loan and deposit growth that is consistent with the Company’s overall profitability objectives, as well as to provide a reasonable and consistent basis for the measurement of its business segments’ net interest margins and profitability. The FTP process charges a cost to fund loans (“FTP charges for loans”) and allocates credits for funds provided from deposits (“FTP credits for deposits”) using internal FTP rates. FTP charges for loans are determined based on a matched cost of funds, which is tied to the pricing and term characteristic of the loans. FTP credits for deposits are based on matched funding credit rates, which are tied to the implied or stated maturity of the deposits. FTP credits for deposits reflect the long-term value generated by the deposits. The net spread between the total internal FTP charges and credits is recorded as part of net interest income in the Other segment. The FTP process transfers the corporate interest rate risk exposure to the treasury function within the Other segment, where such exposures are centrally managed.
The Company’s internal FTP assumptions and methodologies are reviewed at least annually to ensure that the process is reflective of current market conditions. During the firstthird quarter of 2019, the Company enhanced its segment cost allocationFTP methodology related to stock compensation expensedeposits by setting a minimum floor rate for the FTP credits paid for deposits in consideration of the flattened and bonus accrual. Effective first quarter of 2019, stock compensation expense is allocatedinverted yield curve. This methodology has been retrospectively applied to all three segments, whereas it was previously recorded in the Other segment as a corporate expense. In addition, bonus expense is now allocated at a more granular level at the segment level. For comparability, segment informationfinancial results for the three and six months ended June 30, 2018 has been restated to conform to the current presentation.March 31, 2019.
The following tables present the operating results and other key financial measures for the individual operating segments as of and for the three and six months ended June 30, 2019March 31, 2020 and 2018:2019:
| | | | ($ in thousands) | | Consumer
and
Business
Banking | | Commercial Banking | | Other | | Total | | Consumer
and
Business
Banking | | Commercial
Banking | | Other | | Total |
| Three Months Ended June 30, 2019 | | | | | | | | | |
| Three months ended March 31, 2020 | | | | | | | | | |
| Net interest income before provision for credit losses | | $ | 151,352 |
| | $ | 151,222 |
| | $ | 64,752 |
| | $ | 367,326 |
| | $ | 152,591 |
| | $ | 183,501 |
| | $ | 26,615 |
| | $ | 362,707 |
|
| Provision for credit losses | | $ | 1,616 |
| | $ | 17,629 |
| | $ | — |
| | $ | 19,245 |
| | 7,788 |
| | 66,082 |
| | — |
| | 73,870 |
|
| Noninterest income | | $ | 14,503 |
| | $ | 33,656 |
| | $ | 4,600 |
| | $ | 52,759 |
| | 16,402 |
| | 32,456 |
| | 5,191 |
| | 54,049 |
|
| Noninterest expense | | $ | 83,656 |
| | $ | 67,303 |
| | $ | 26,704 |
| | $ | 177,663 |
| | 86,964 |
| | 70,126 |
| | 21,786 |
| | 178,876 |
|
| Segment income before income taxes | | $ | 80,583 |
| | $ | 99,946 |
| | $ | 42,648 |
| | $ | 223,177 |
| | 74,241 |
| | 79,749 |
| | 10,020 |
| | 164,010 |
|
| Segment net income | | $ | 57,612 |
| | $ | 71,565 |
| | $ | 21,203 |
| | $ | 150,380 |
| | $ | 53,195 |
| | $ | 57,131 |
| | $ | 34,498 |
| | $ | 144,824 |
|
| As of June 30, 2019 | | | | | | | |
|
| |
| As of March 31, 2020 | | | | | | | | | |
| Segment assets | | $ | 11,013,898 |
| | $ | 25,001,894 |
| | $ | 6,876,566 |
| | $ | 42,892,358 |
| | $ | 11,894,691 |
| | $ | 26,412,726 |
| | $ | 7,641,128 |
| | $ | 45,948,545 |
|
|
|
| | | | | | | | | | | | | | | | |
| |
| ($ in thousands) | | Consumer
and
Business
Banking | | Commercial
Banking | | Other | | Total |
| Three Months Ended June 30, 2018 | | | | | | | | |
| Net interest income before provision for credit losses | | $ | 180,348 |
| | $ | 153,878 |
| | $ | 7,453 |
| | $ | 341,679 |
|
| Provision for credit losses | | $ | 3,414 |
| | $ | 12,122 |
| | $ | — |
| | $ | 15,536 |
|
| Noninterest income | | $ | 14,585 |
| | $ | 30,744 |
| | $ | 2,939 |
| | $ | 48,268 |
|
| Noninterest expense | | $ | 84,459 |
| | $ | 60,573 |
| | $ | 32,387 |
| | $ | 177,419 |
|
| Segment income (loss) before income taxes | | $ | 107,060 |
| | $ | 111,927 |
| | $ | (21,995 | ) | | $ | 196,992 |
|
| Segment net income | | $ | 76,710 |
| | $ | 80,425 |
| | $ | 15,214 |
| | $ | 172,349 |
|
| As of June 30, 2018 | | | | | | | |
|
|
| Segment assets | | $ | 9,816,103 |
| | $ | 22,199,992 |
| | $ | 6,027,101 |
| | $ | 38,043,196 |
|
| |
|
| | | | | | | | | | | | | | | | |
| |
| ($ in thousands) | | Consumer
and
Business
Banking | | Commercial
Banking | | Other | | Total |
| Six Months Ended June 30, 2019 | | | | | | | | |
| Net interest income before provision for credit losses | | $ | 317,540 |
| | $ | 298,462 |
| | $ | 113,785 |
| | $ | 729,787 |
|
| Provision for credit losses | | $ | 4,629 |
| | $ | 37,195 |
| | $ | — |
| | $ | 41,824 |
|
| Noninterest income | | $ | 28,275 |
| | $ | 58,200 |
| | $ | 8,415 |
| | $ | 94,890 |
|
| Noninterest expense | | $ | 171,562 |
| | $ | 137,847 |
| | $ | 55,176 |
| | $ | 364,585 |
|
| Segment income before income taxes | | $ | 169,624 |
| | $ | 181,620 |
| | $ | 67,024 |
| | $ | 418,268 |
|
| Segment net income | | $ | 121,267 |
| | $ | 130,064 |
| | $ | 63,073 |
| | $ | 314,404 |
|
| As of June 30, 2019 | | | | | | | | |
| Segment assets | | $ | 11,013,898 |
| | $ | 25,001,894 |
| | $ | 6,876,566 |
| | $ | 42,892,358 |
|
| |
| | | | ($ in thousands) | | Consumer
and
Business
Banking | | Commercial
Banking | | Other | | Total | | Consumer
and
Business
Banking | | Commercial
Banking | | Other | | Total |
| Six Months Ended June 30, 2018 | | | | | | | | | |
| Three months ended March 31, 2019 | | | | | | | | | |
| Net interest income before provision for credit losses | | $ | 356,296 |
| | $ | 298,358 |
| | $ | 13,718 |
| | $ | 668,372 |
| | $ | 185,059 |
| | $ | 152,708 |
| | $ | 24,694 |
| | $ | 362,461 |
|
| Provision for credit losses | | $ | 6,507 |
| | $ | 29,247 |
| | $ | — |
| | $ | 35,754 |
| | 3,013 |
| | 19,566 |
| | — |
| | 22,579 |
|
| Noninterest income | | $ | 59,033 |
| | $ | 58,182 |
| | $ | 5,497 |
| | $ | 122,712 |
| | 13,772 |
| | 24,544 |
| | 3,815 |
| | 42,131 |
|
| Noninterest expense | | $ | 171,776 |
| | $ | 121,875 |
| | $ | 52,903 |
| | $ | 346,554 |
| | 87,906 |
| | 70,544 |
| | 28,472 |
| | 186,922 |
|
| Segment income (loss) before income taxes | | $ | 237,046 |
| | $ | 205,418 |
| | $ | (33,688 | ) | | $ | 408,776 |
| |
| Segment income before income taxes | | | 107,912 |
| | 87,142 |
| | 37 |
| | 195,091 |
|
| Segment net income | | $ | 169,844 |
| | $ | 147,454 |
| | $ | 42,083 |
| | $ | 359,381 |
| | $ | 77,146 |
| | $ | 62,334 |
| | $ | 24,544 |
| | $ | 164,024 |
|
| As of June 30, 2018 | | | | | | | | | |
| As of March 31, 2019 | | | | | | | | | |
| Segment assets | | $ | 9,816,103 |
| | $ | 22,199,992 |
| | $ | 6,027,101 |
| | $ | 38,043,196 |
| | $ | 10,902,961 |
| | $ | 23,964,592 |
| | $ | 7,223,880 |
| | $ | 42,091,433 |
|
|
Note 1916 — Subsequent Events
On July 18, 2019,April 16, 2020, the Company’s Board of Directors declared thirdsecond quarter 20192020 cash dividends for the Company’s common stock. The common stock cash dividend of $0.275 per share is payable on AugustMay 15, 20192020 to stockholders of record as of August 1, 2019.May 4, 2020.
ITEM 2. MANAGEMENT’S DISCUSSION AND ANALYSIS OF FINANCIAL CONDITION AND RESULTS OF OPERATIONS
Overview
The following discussion provides information about the results of operations, financial condition, liquidity and capital resources of East West Bancorp, Inc. (referred to herein on an unconsolidated basis as “East West” and on a consolidated basis as the “Company”, “EWBC” or “we”), and its subsidiaries, including its subsidiary bank, East West Bank and its subsidiaries (referred to herein as “East West Bank” or the “Bank”). This information is intended to facilitate the understanding and assessment of significant changes and trends related to the Company’s results of operations and financial condition. This discussion and analysis should be read in conjunction with the Consolidated Financial Statements and the accompanying notes presented elsewhere in this report, and the Company’s annual report on Form 10-K for the year ended December 31, 2018,2019, filed with the United States (“U.S.”) Securities and Exchange Commission (“SEC”) on February 27, 20192020 (the “Company’s 20182019 Form 10-K”).
Company Overview
East West is a bank holding company incorporated in Delaware on August 26, 1998 and is registered under the Bank Holding Company Act of 1956, as amended. The Company commenced business on December 30, 1998 when, pursuant to a reorganization, it acquired all of the voting stock of the Bank, which became its principal asset. The Bank is an independent commercial bank headquartered in California that has a strong focus on the financial service needs of the Chinese-American community. Through over 130125 locations in the United States (“U.S.”) and Greater China, the Company provides a full range of consumer and commercial products and services through three business segments: Consumer and Business Banking, Commercial Banking, with the remaining operations included in Other. The Company’s principal activity is lending to and accepting deposits from businesses and individuals. The primary source of revenue is net interest income, which is principally derived from the difference between interest earned on loans and investmentdebt securities and interest paid on deposits and other funding sources. As of June 30, 2019,March 31, 2020, the Company had $42.89$45.95 billion in assets and approximately 3,300 full-time equivalent employees. For additional information on products and services provided by the Bank, see Item 1. Business — Banking Services of the Company’s 20182019 Form 10-K.
Corporate Strategy
We are committed to enhancing long-term stockholdershareholder value by executing on the fundamentals of growing loans, deposits and revenue, improving profitability, and investing for the future while managing risk, expenses and capital. Our business model is built on customer loyalty and engagement, understanding of our customers’ financial goals, and meeting our customers’ financial needs through our diverse products and services. The Company’s approach is concentrated on seeking out and deepening client relationships that meet our risk/return measures. This focus guides our decision-making across every aspect of our operations: the products we develop, the expertise we cultivate and the infrastructure we build to help our customers conduct business. We expect our relationship-focused business model to continue to generate organic growth and to expand our targeted customer bases. On an ongoing basis, we invest in technology related to critical business infrastructure and streamlining core processes, in the context of maintaining appropriate expense management. Our risk management activities are focused on ensuring that the Company identifies and manages risks to maintain safety and soundness while maximizing profitability.
Impact of COVID-19
In December 2019, COVID-19 was reported in China, and rapidly spread to other countries, including the U.S. In March 2020, the World Health Organization (“WHO”) characterized COVID-19 as a global pandemic and recommended containment and mitigation measures. On January 31, 2020, the U.S. declared a national public health emergency, and the President announced a National Emergency on March 13, 2020. Many states and municipalities have declared emergencies as well. The COVID-19 outbreak and public health response to contain it have resulted in economic and financial market deterioration as of March 31, 2020, which did not exist at the beginning of the quarter. The recession resulting from government-mandated closures of certain businesses, and “stay-at-home” orders has significantly impacted business investment and consumer spending, and heightened volatility in the global financial markets. These conditions caused by the COVID-19 pandemic have created financial difficulties for many of the Company’s customers and as a result, some borrowers may not be able to satisfy their obligations. Because many of the Company’s loans are secured by real estate, a potential decline in real estate markets could negatively impact the Company’s business, financial condition and the credit quality of the Company’s loan portfolio, potentially increasing the level of loan charge-offs and the provision for credit losses. In the first quarter of 2020, the impact of COVID-19 pandemic was not yet evident in the Company’s balance sheet growth trends or in most of our asset quality metrics. However, the broad-based response to combat COVID-19 pandemic and resulting economic impact had a material impact on the Company’s first quarter 2020 provision for credit losses.
63
The Coronavirus Aid, Relief, and Economic Security Act (“CARES Act”) was enacted on March 27, 2020. As part of the CARES Act passed by Congress, various initiatives to protect individuals, businesses and local economies, such as the SBA Paycheck Protection Program (“PPP”) were established. The Company participates in the SBA PPP, and intends to participate in additional new government-sponsored programs, as they are enacted. Through May 6, 2020, we funded over $1.84 billion of SBA-approved PPP loans to over 6,700 customers. In addition, to provide relief to customers during these turbulent times, we are providing payment accommodations for certain small-to medium-sized business, nonprofit organization and consumer customers impacted by COVID-19, and pausing action on collections and foreclosures on certain residential mortgage loans. Although we are uncertain of the full magnitude and duration of the business and economic impact from the unprecedented public health efforts to contain and combat the spread of COVID-19, we could experience material declines in revenues, profitability and/or cash flows in one or more periods in 2020, compared to the corresponding prior-year periods and compared to our expectations at the beginning of the 2020 fiscal year. Further discussion of the potential impacts on our business from the COVID-19 pandemic is provided below under Part II, Item 1A - Risk Factors.
Accounting Standards Update 2016-13 Adoption
On January 1, 2020, the Company adopted Accounting Standards Update (“ASU”) 2016-13, Financial Instruments — Credit Losses, often referred to as the current expected credit loss ("CECL") model, which establishes a single allowance framework for all financial assets carried at amortized cost, and for certain off-balance sheet exposures. Replacing the prior incurred loss model, this framework requires that management estimate credit losses over the full remaining expected life of a loan, and consider expected future changes in macroeconomic conditions. The adoption of CECL increased the allowance for loan losses by $125.2 million, and the allowance for unfunded credit commitments by $10.5 million. As a result, the Company recorded an after-tax decrease to retained earnings of $98.0 million on January 1, 2020.
Selected Financial Data
| | | | | | | | | |
| ($ and shares in thousands, except per share, ratio and headcount data) | | Three Months Ended | | Six Months Ended | | Three Months Ended |
| | June 30,
2019 | | March 31,
2019 | | June 30,
2018 | | June 30,
2019 | | June 30,
2018 | | March 31,
2020 | | December 31,
2019 | | March 31,
2019 |
| Summary of operations: | | | | | | | | | | | | | | | | |
| Interest and dividend income | | $ | 474,844 |
| | $ | 463,311 |
| | $ | 400,311 |
| | $ | 938,155 |
| | $ | 772,184 |
| | $ | 449,190 |
| | $ | 467,233 |
| | $ | 463,311 |
|
| Interest expense | | 107,518 |
| | 100,850 |
| | 58,632 |
| | 208,368 |
| | 103,812 |
| | 86,483 |
| | 99,014 |
| | 100,850 |
|
| Net interest income before provision for credit losses | | 367,326 |
| | 362,461 |
| | 341,679 |
| | 729,787 |
| | 668,372 |
| | 362,707 |
| | 368,219 |
| | 362,461 |
|
| Provision for credit losses | | 19,245 |
| | 22,579 |
| | 15,536 |
| | 41,824 |
| | 35,754 |
| | 73,870 |
| | 18,577 |
| | 22,579 |
|
| Net interest income after provision for credit losses | | 348,081 |
| | 339,882 |
| | 326,143 |
| | 687,963 |
| | 632,618 |
| | 288,837 |
| | 349,642 |
| | 339,882 |
|
Noninterest income (1) | | 52,759 |
| | 42,131 |
| | 48,268 |
| | 94,890 |
| | 122,712 |
| | 54,049 |
| | 63,013 |
| | 42,131 |
|
| Noninterest expense | | 177,663 |
| | 186,922 |
| | 177,419 |
| | 364,585 |
| | 346,554 |
| | 178,876 |
| | 193,373 |
| | 186,922 |
|
| Income before income taxes | | 223,177 |
| | 195,091 |
| | 196,992 |
| | 418,268 |
| | 408,776 |
| | 164,010 |
| | 219,282 |
| | 195,091 |
|
Income tax expense (2) | | 72,797 |
| | 31,067 |
| | 24,643 |
| | 103,864 |
| | 49,395 |
| | 19,186 |
| | 31,067 |
| | 31,067 |
|
| Net income | | $ | 150,380 |
| | $ | 164,024 |
| | $ | 172,349 |
| | $ | 314,404 |
| | $ | 359,381 |
| | $ | 144,824 |
| | $ | 188,215 |
| | $ | 164,024 |
|
| Per common share: | | | | | | | | | | | | | | | | |
| Basic earnings | | $ | 1.03 |
| | $ | 1.13 |
| | $ | 1.19 |
| | $ | 2.16 |
| | $ | 2.48 |
| | $ | 1.00 |
| | $ | 1.29 |
| | $ | 1.13 |
|
| Diluted earnings | | $ | 1.03 |
| | $ | 1.12 |
| | $ | 1.18 |
| | $ | 2.15 |
| | $ | 2.46 |
| | $ | 1.00 |
| | $ | 1.29 |
| | $ | 1.12 |
|
| Dividends declared | | $ | 0.275 |
| | $ | 0.230 |
| | $ | 0.200 |
| | $ | 0.505 |
| | $ | 0.400 |
| | $ | 0.28 |
| | $ | 0.28 |
| | $ | 0.23 |
|
| Book value | | $ | 32.53 |
| | $ | 31.56 |
| | $ | 28.39 |
| | $ | 32.53 |
| | $ | 28.39 |
| | $ | 34.67 |
| | $ | 34.46 |
| | $ | 31.56 |
|
Non-United States generally accepted accounting principles (“GAAP”) tangible common equity per share (3) | | $ | 29.20 |
| | $ | 28.21 |
| | $ | 25.01 |
| | $ | 29.20 |
| | $ | 25.01 |
| |
Non-U.S. generally accepted accounting principles (“GAAP”) tangible common equity per share (1) | | | $ | 31.27 |
| | $ | 31.15 |
| | $ | 28.21 |
|
| Weighted-average number of shares outstanding: | | | | | | | | | | | | | | | | |
| Basic | | 145,546 |
| | 145,256 |
| | 144,899 |
| | 145,402 |
| | 144,782 |
| | 144,814 |
| | 145,624 |
| | 145,256 |
|
| Diluted | | 146,052 |
| | 145,921 |
| | 146,091 |
| | 146,016 |
| | 146,046 |
| | 145,285 |
| | 146,318 |
| | 145,921 |
|
| Common shares outstanding at period-end | | 145,547 |
| | 145,501 |
| | 144,905 |
| | 145,547 |
| | 144,905 |
| | 141,435 |
| | 145,625 |
| | 145,501 |
|
| At period end: | | | | | | | | | | | | | | | | |
Total assets (4) | | $ | 42,892,358 |
| | $ | 42,091,433 |
| | $ | 38,043,196 |
| | $ | 42,892,358 |
| | $ | 38,043,196 |
| | $ | 45,948,545 |
| | $ | 44,196,096 |
| | $ | 42,091,433 |
|
Total loans (4) | | $ | 33,734,256 |
| | $ | 32,863,286 |
| | $ | 30,245,037 |
| | $ | 33,734,256 |
| | $ | 30,245,037 |
| | $ | 35,894,987 |
| | $ | 34,778,973 |
| | $ | 32,863,286 |
|
| Available-for-sale investment securities | | $ | 2,592,913 |
| | $ | 2,640,158 |
| | $ | 2,707,444 |
| | $ | 2,592,913 |
| | $ | 2,707,444 |
| |
| Available-for-sale (“AFS”) debt securities | | | $ | 3,695,943 |
| | $ | 3,317,214 |
| | $ | 2,640,158 |
|
| Total deposits | | $ | 36,477,542 |
| | $ | 36,273,972 |
| | $ | 32,776,132 |
| | $ | 36,477,542 |
| | $ | 32,776,132 |
| | $ | 38,686,958 |
| | $ | 37,324,259 |
| | $ | 36,273,972 |
|
| Long-term debt and finance lease liabilities | | $ | 152,506 |
| | $ | 152,433 |
| | $ | 161,704 |
| | $ | 152,506 |
| | $ | 161,704 |
| | $ | 152,162 |
| | $ | 152,270 |
| | $ | 152,433 |
|
| Federal Home Loan Bank (“FHLB”) advances | | $ | 745,074 |
| | $ | 344,657 |
| | $ | 325,020 |
| | $ | 745,074 |
| | $ | 325,020 |
| | $ | 646,336 |
| | $ | 745,915 |
| | $ | 344,657 |
|
Stockholders’ equity | | $ | 4,734,593 |
| | $ | 4,591,930 |
| | $ | 4,114,284 |
| | $ | 4,734,593 |
| | $ | 4,114,284 |
| | $ | 4,902,985 |
| | $ | 5,017,617 |
| | $ | 4,591,930 |
|
Non-GAAP tangible common equity (3)(1) | | $ | 4,249,944 |
| | $ | 4,105,124 |
| | $ | 3,623,708 |
| | $ | 4,249,944 |
| | $ | 3,623,708 |
| | $ | 4,422,519 |
| | $ | 4,535,841 |
| | $ | 4,105,124 |
|
| Head count (full-time equivalent) | | 3,261 |
| | 3,241 |
| | 2,863 |
| | 3,261 |
| | 2,863 |
| | 3,285 |
| | 3,294 |
| | 3,241 |
|
| Performance metrics: | | | | | | | | | | | | | | | | |
| Return on average assets (“ROA”) | | 1.45 | % | | 1.63 | % | | 1.84 | % | | 1.54 | % | | 1.93 | % | | 1.30 | % | | 1.68 | % | | 1.63 | % |
| Return on average equity (“ROE”) | | 12.88 | % | | 14.66 | % | | 17.02 | % | | 13.75 | % | | 18.15 | % | | 11.60 | % | | 15.00 | % | | 14.66 | % |
| Net interest margin | | 3.73 | % | | 3.79 | % | | 3.83 | % | | 3.76 | % | | 3.78 | % | | 3.44 | % | | 3.47 | % | | 3.79 | % |
Efficiency ratio (5)(3) | | 42.29 | % | | 46.20 | % | | 45.50 | % | | 44.21 | % | | 43.81 | % | | 42.92 | % | | 44.84 | % | | 46.20 | % |
Non-GAAP efficiency ratio (3)(1) | | 38.03 | % | | 39.75 | % | | 39.89 | % | | 38.88 | % | | 40.26 | % | | 38.54 | % | | 38.33 | % | | 39.75 | % |
| Credit quality metrics: | | | | | | | | | | | | | | | | |
| Allowance for loan losses | | $ | 330,625 |
| | $ | 317,894 |
| | $ | 301,550 |
| | $ | 330,625 |
| | $ | 301,550 |
| | $ | 557,003 |
| | $ | 358,287 |
| | $ | 317,894 |
|
Allowance for loan losses to loans held-for-investment (4) | | 0.98 | % | | 0.97 | % | | 1.00 | % | | 0.98 | % | | 1.00 | % | | 1.55 | % | | 1.03 | % | | 0.97 | % |
Non-purchased credit-impaired (“PCI”) nonperforming assets to total assets (4) | | 0.28 | % | | 0.33 | % | | 0.27 | % | | 0.28 | % | | 0.27 | % | |
| Nonperforming assets to total assets | | | 0.33 | % | | 0.27 | % | | 0.33 | % |
| Annualized net charge-offs to average loans held-for-investment | | 0.09 | % | | 0.18 | % | | 0.14 | % | | 0.14 | % | | 0.14 | % | | 0.01 | % | | 0.10 | % | | 0.18 | % |
| Selected metrics: | | | | | | | | | | | | | | | | |
| Total average equity to total average assets | | 11.28 | % | | 11.14 | % | | 10.81 | % | | 11.21 | % | | 10.65 | % | | 11.22 | % | | 11.19 | % | | 11.14 | % |
| Common dividend payout ratio | | 26.95 | % | | 20.59 | % | | 17.02 | % | | 23.63 | % | | 16.30 | % | | 27.95 | % | | 21.52 | % | | 20.59 | % |
Loan-to-deposit ratio (4) | | 92.48 | % | | 90.60 | % | | 92.28 | % | | 92.48 | % | | 92.28 | % | | 92.78 | % | | 93.18 | % | | 90.60 | % |
| Capital ratios of EWBC: | | | | | | | | | | | |
| EWBC Capital ratios: | | | | | | | |
| Common Equity Tier 1 (“CET1”) capital | | | 12.4 | % | | 12.9 | % | | 12.4 | % |
| Tier 1 capital | | | 12.4 | % | | 12.9 | % | | 12.4 | % |
| Total capital | | 13.9 | % | | 13.9 | % | | 13.7 | % | | 13.9 | % | | 13.7 | % | | 13.9 | % | | 14.4 | % | | 13.9 | % |
| Tier 1 capital | | 12.5 | % | | 12.4 | % | | 12.2 | % | | 12.5 | % | | 12.2 | % | |
| Common Equity Tier 1 (“CET1”) capital | | 12.5 | % | | 12.4 | % | | 12.2 | % | | 12.5 | % | | 12.2 | % | |
| Tier 1 leverage capital | | 10.4 | % | | 10.2 | % | | 10.0 | % | | 10.4 | % | | 10.0 | % | | 10.2 | % | | 10.3 | % | | 10.2 | % |
| | | | | | | |
| |
| (1) | Includes $31.5 million of pretax gain recognized from the sale of the Desert Community Bank (“DCB”) branches during the first half of 2018. |
| |
(2) | Includes $30.1 million of additional tax expense to reverse certain previously claimed tax credits related to the DC Solar tax credit investments (“DC Solar”) during the second quarter of 2019. |
| |
(3) | Tangible common equity, tangible common equity per share and adjusted efficiency ratio are non-GAAP financial measures. For a discussion of these measures, refer to Item 2. Management’s Discussion and Analysis of Financial Condition and Results of Operations (“MD&A”) — Supplemental Information — Explanation of GAAP and Non-GAAP Financial Measures in this Form 10-Q. |
| |
(4)(2) | Total assets and loans held-for-investment include PCI loansOn January 1, 2020, the Company adopted ASU 2016-13, Financial Instruments — Credit Losses (Topic 326): Measurement of $270.9 million, $290.3 million and $383.7Credit Losses on Financial Instruments using the modified retrospective approach. The Company recorded an after-tax decrease to opening retained earnings of $98.0 million as of June 30, 2019, March 31, 2019 and June 30, 2018, respectively.January 1, 2020. |
| |
(5)(3) | The efficiency ratio is noninterest expense divided by total revenue (net interest income before provision for credit losses and noninterest income). |
Financial Highlights
Noteworthy items about the Company’s performance for the secondfirst quarter and first half of 20192020 included:
| |
| • | Earnings: SecondFirst quarter 2019of2020 net income was $150.4$144.8 million or $1.03$1.00 in diluted earnings per share (“EPS”), compared with secondfirst quarter 2018of 2019 net income of $172.3$164.0 million or $1.18 in diluted EPS aof $1.12. The $19.2 million or 12% decrease of 13%. This decreasein net income was primarily due to an increase in income tax expense. Duringhigher provision for credit losses resulting from the second quarternewly adopted CECL methodology and the deteriorating macroeconomic conditions and outlook as a result of 2019, the Company recorded $30.1 million of additional income tax expense to reverse certain previously claimed tax credits related to DC Solar. Second quarter 2019 pre-tax income was $223.2 million and increased by 13% compared to the same period a year ago. Net income for the first half of 2019 was $314.4 million or $2.15 in diluted EPS, compared with net income of $359.4 million or $2.46 in diluted EPS for the first half of 2018, a decrease of 13%. This decrease reflected the additional income tax expense in the second quarter of 2019. Pre-tax income of $418.3 million for the first half of 2019 increased by 2% compared to the same period a year ago.COVID-19 pandemic. |
| |
| • | Adjusted Earnings: AdjustingThere were no adjustments for non-recurring items non-GAAP secondduring the first quarter 2019of 2020 that affected non-GAAP net income was $180.5 million or $1.24 in non-GAAPand diluted EPS, an increase of 5% from $172.3 million or $1.18 for the second quarter of 2018. Non-GAAP net income for the first half of 2019 was $349.4 million or $2.39 in non-GAAP diluted EPS, compared with $337.2 million or $2.31 for the first half of 2018, an increase of 4%. During the second quarter of 2019, the Company recorded $30.1 million in additional income tax expense to reverse certain previously claimed tax credits related to DC Solar.EPS. During the first quarter of 2019, the Company recorded a $7.0 million pre-tax or $4.9 million after-tax, impairment charge related to DC Solar equivalent to $4.9 million after taxand affiliates (“DC Solar”). (Refer to Item 2. MD&A — Results of Operations — Income Taxes in this Form 10-Q for a discussion related to the Company’s investment in DC Solar). DuringSolar and see reconciliations of non-GAAP measures presented under Item 2. MD&A — Supplemental Information — Explanation of GAAP and Non-GAAP Financial Measures in this Form 10-Q.) First quarter 2019 non-GAAP net income was $168.9 million and non-GAAP diluted EPS was $1.16. |
| |
| • | Revenue: Revenue, or the sum of net interest income before provision for credit losses and noninterest income, was $416.8 million for the first quarter of 2018,2020, compared with $404.6 million for the Company recognizedfirst quarter of 2019, an increase of $12.2 million or 3%. This increase was primarily due to increased noninterest income. |
| |
| • | Net Interest Income and Net Interest Margin: Firstquarter of 2020 net interest income was $362.7 million, compared with first quarter of 2019 net interest income of $362.5 million. First quarter of 2020 net interest margin was 3.44%, a $31.5 million pre-tax gain35 basis point decrease from 3.79% for the salefirst quarter of its DCB branches, equivalent2019. The decrease in the net interest margin reflected materially lower interest rates year-over-year, including a cumulative 225 basis points of cuts to $22.2 million after tax.the fed funds target rate in the second half of 2019 and in the first quarter of 2020. |
| |
| • | Operating Efficiency: Efficiency ratio, calculated as noninterest expense divided by revenue, was 42.92% and 46.20% for the first quarters of 2020 and 2019, respectively. Adjusting for amortization of tax credit and other investments, and core deposit intangibles, non-GAAP efficiency ratio for the first quarter of 2020 was 38.54%, a 121 basis point improvement from 39.75% for the first quarter of 2019. (See reconciliations of non-GAAP measures presented below under Item 2. MD&A — Supplemental Information — Explanation of GAAP and Non-GAAP Financial Measures in this Form 10-Q.) |
| |
| • | Revenue:Tax: Revenue, or the sum of net interest income before provision for credit losses and noninterest income,Income tax expense was $420.1$19.2 million in the second quarter of 2019, compared with $389.9 million in the second quarter of 2018, an increase of 8%. This increase was primarily due to an increase in net interest income. Revenue for the first half of 2019 was $824.7 million, compared with $791.1 million for the first half of 2018, an increase of 4%. This increase was primarily due to an increase in net interest income, partially offset by a decrease in noninterest income. Noninterest income in the first half of 2018 included a $31.5 million pre-tax gain from the sale of DCB branches.
|
| |
• | Net Interest Income and Net Interest Margin: Second quarter 2019 net interest income was $367.3 million, compared with second quarter 2018 of $341.7 million, an increase of 8%. Second quarter 2019 net interest margin was 3.73%, a decrease of 10 basis points from 3.83% for the second quarter of 2018. Net interest income for the first half of 2019 was $729.8 million, compared to $668.4 million for the first half of 2018, an increase of 9%. Net interest margin was 3.76% for the first half of 2019, a decrease of two basis points from 3.78% for the first half of 2018.
|
| |
• | Operating Efficiency: Efficiency ratio, calculated as noninterest expense divided by the sum of net interest income before provision for credit losses and noninterest income, was 42.29% for the second quarter of 2019, compared to 45.50% for the second quarter of 2018. The efficiency ratio was 44.21% for the first half of 2019, compared to 43.81% for the first half of 2018. Adjusting for non-recurring items, amortization of tax credit and other investments, and the amortization of core deposit intangibles, the non-GAAP efficiency ratio for the second quarter 2019 was 38.03%, a 186 basis point improvement from 39.89% for the second quarter of 2018. For the first half of 2019, the non-GAAP efficiency ratio was 38.88%, a 138 basis point improvement from 40.26% for the first half of 2018. (See reconciliations of non-GAAP measures presented below under Item 2. MD&A — Supplemental Information — Explanation of GAAP and Non-GAAP Financial Measures in this Form 10-Q.)
|
| |
• | Tax: Theeffective tax rate was 32.6% and 12.5% for the second quarter of 2019 and 2018, respectively, and 24.8% and 12.1%11.7% for the first halfquarter of 20192020, compared with an income tax expense of $31.1 million and 2018, respectively. The higheran effective tax rates duringrate of 15.9% for the second quarter and first half of 2019 were primarily due to the $30.1 million reversal of certain previously claimed tax credits related to DC Solar in the second quarter of 2019.
|
| |
| • | Profitability: SecondFirst quarter of 2020 ROA was 1.30% and first quarter of 2019 ROA was 1.45%, compared to second1.63%. First quarter 2018 ROA of 1.84%. ROA2020 ROE was 1.54% for the11.60% and first halfquarter of 2019, compared to 1.93% for the first half of 2018. Second quarter 2019 ROE was 12.88%, compared to second quarter 2018 ROE of 17.02%14.66%. ROE was 13.75% for the first half of 2019, compared to 18.15% for the first half of 2018. Adjusting for non-recurring items, non-GAAP ROA was 1.74% for the second quarter of 2019, compared to 1.84% for the second quarter of 2018. Forwhich occurred only in the first halfquarter of 2019, non-GAAP ROA was 1.71%, compared to 1.81%and non-GAAP ROE for the first half of 2018. Non-GAAP ROE was 15.45% for the second quarter of 2019 compared to 17.02% for the second quarter of 2018. For the first half of 2019, non-GAAP ROE was 15.28%were 1.68% and 15.10%, compared to 17.03% for the first half of 2018.respectively. (See reconciliations of non-GAAP measures presented below under Item 2. MD&A — Supplemental Information — Explanation of GAAP and Non-GAAP Financial Measures in this Form 10-Q.) |
| |
| • | Loans: Total loans were $33.73$35.89 billion as of June 30, 2019,March 31, 2020, an increase of $1.35$1.12 billion or 4%3% from $32.39$34.78 billion as of December 31, 2018.2019. Growth was well-diversified across single-family residential, commercial real estate (“CRE”), and commercial and industrial (“C&I”), total commercial real estate (“CRE”) and residential mortgage loans. |
| |
| • | Deposits: Total deposits were $36.48$38.69 billion as of June 30, 2019,March 31, 2020, an increase of $1.04$1.36 billion or 3%4% from $35.44$37.32 billion as of December 31, 2018. Growth in time and interest-bearing checking deposits2019. This increase was partially offsetprimarily driven by a declinegrowth in noninterest-bearing demand deposits and money market deposits.accounts. |
| |
| • | Asset Quality Metrics: The allowance for loan losses was $330.6$557.0 million or 0.98%1.55% of loans held-for-investment, as of June 30, 2019,March 31, 2020, compared to $311.3with $358.3 million or 0.96%1.03% of loans held-for-investment, as of December 31, 2018. Non-PCI nonperforming assets were $119.3 million or 0.28%2019. The increase in the allowance for loan losses was due to the adoption of total assetsASU 2016-13, which increased the allowance for loan losses by $125.2 million; deteriorating macroeconomic conditions and outlook as a result of June 30, 2019, an increase from $93.0 million or 0.23% of total assets as of December 31, 2018. Second quarter 2019 net charge-offs were $7.6 million or annualized 0.09% of average loans held-for-investment, a decrease from $10.6 million or annualized 0.14% of average loans held-for-investment for the second quarter of 2018. For the first half of 2019, net charge-offs were $22.1 million or annualized 0.14% of average loans held-for-investment, compared to $20.4 million or annualized 0.14% of average loans held-for-investment for the first half of 2018. |
COVID-19 pandemic, and loan growth. Nonperforming assets were $150.9 million or 0.33% of total assets, as of March 31, 2020, an increase from $121.5 million, or 0.27% of total assets, as of December 31, 2019. First quarter 2020 net charge-offs were $898 thousand, or annualized 0.01% of average loans held-for-investment, compared with $14.4 million, or annualized 0.18% of average loans held-for-investment, for the first quarter of 2019.
| |
| • | Capital Levels: Our capital levels were strong in 2019. Allare strong. As of March 31, 2020, all of the Company’s and the Bank’s regulatory capital ratios were well above required well-capitalized levels.the regulatory requirements to be considered well-capitalized. See Item 2. MD&A — Balance Sheet Analysis — Regulatory Capital and Ratios in this Form 10-Q for more information regarding capital. During the three months ended March 31, 2020, the Company repurchased 4,471,682 shares at an average price of $32.64 per share and a total cost of $146.0 million. The Company did not repurchase any shares during the three months ended March 31, 2019. |
| |
| • | Cash Dividend Increase:Dividend: The quarterly cash common stock dividend for the secondfirst quarter of 20192020 was $0.275 per share, an increase of $0.075$0.045 or 38%, compared to $0.2020% from $0.23 per share for the secondfirst quarter of 2018.2019. The Company returned $40.5 million and $74.3 million in cash dividends to stockholders during the secondfirst quarter and the first half of 2019, respectively,2020, compared to $29.3 million and $58.6with $33.8 million during the same periodsperiod in 2018.2019. |
Results of Operations
Net Interest Income
The Company’s primary source of revenue is net interest income, which is the difference between interest income earned on interest-earning assets andless interest expense paid on interest-bearing liabilities. Net interest margin is the ratio of net interest income to average interest-earning assets. Net interest income and net interest margin are impacted by several factors, including changes in average balances and composition of interest-earning assets and funding sources, market interest rate fluctuations and the slope of the yield curve, repricing characteristics and maturity of interest-earning assets and interest-bearing liabilities, volume of noninterest-bearing sources of funds, and asset quality.
Second
First quarter 2019of 2020 net interest income was $367.3$362.7 million, an increase of $25.6 million$246 thousand or 8%0.07%, compared to $341.7 million for the second quarter of 2018. For the first half of 2019, net interest income was $729.8 million, an increase of $61.4 million or 9%, compared to $668.4with $362.5 million for the first halfquarter of 2018. Net2019. This slight increase in net interest income growth was primarily driven byreflected loan growth and a decrease in the expansionaverage cost of loan yields, partiallyfunds, which was nearly offset by a higher costthe year-over-year decline in interest-earning asset yields. First quarter of funds. Second quarter 20192020 net interest margin was 3.73%3.44%, a 1035 basis point decrease from 3.83% for the second quarter of 2018. For the first half of 2019, net interest margin was 3.76%, a two basis point decrease from 3.78%3.79% for the first halfquarter of 2018.
2019.
The average loan yield for the secondfirst quarter of 20192020 was 5.28%4.71%, a 3359 basis point increasedecrease from 4.95% for the second quarter of 2018. For the first half of 2019, the average loan yield was 5.29%, a 47 basis point increase from 4.82%5.30% for the first halfquarter of 2018. The increases in2019. This decrease, compared with the average loan yield forsame period a year ago, reflected the second quarter and first half of 2019 reflect the upwarddownward repricing of the Company’s loan portfolio in response to risingmaterially lower interest rates. Approximately 70% and 75%As of March 31, 2020, approximately 69% of total loans were comprised of variable-rate loans andor hybrid loans that were in thetheir adjustable rate period asperiod. First quarter of June 30, 2019 and 2018, respectively. Second quarter 20192020 average loans were $32.98$35.15 billion, an increase of $3.33$2.74 billion or 11%8% from $29.65 billion for the second quarter of 2018. For the first half of 2019, average loans were $32.70 billion, an increase of $3.27 billion or 11% from $29.43$32.41 billion for the first halfquarter of 2018.2019. Average loan growth was broad-based across all commercial loan categories and single-family residential C&I and CRE loans.
SecondFirst quarter 2019of 2020 average interest-earning assets were $39.46$42.36 billion, an increase of $3.69$3.62 billion or 10%9% from $35.77$38.75 billion for the secondfirst quarter of 2018.2019. This was primarily due to increases of $3.33$2.74 billion in average loans and $535.9$632.4 million in average interest-bearing cash and deposits with banks, partially offset by a decrease of $183.6 million in average available-for-sale investment securities. For the first half of 2019, average interest-earning assets were $39.11 billion, an increase of $3.46 billion or 10% from $35.64 billion for first half of 2018. This was primarily due to increases of $3.27 billion in average loans and $396.2 million in average interest-bearing cash and deposits with banks, partially offset by a decrease of $197.8 million in average available-for-sale investmentAFS debt securities.
Deposits are an important source of funds and impact both net interest income and net interest margin. Average noninterest-bearing demand deposits provide us with zero-cost funding and totaled $10.24 billion for the second quarter of 2019, compared to $10.98 billion for the second quarter of 2018, a decrease of 7%. Average noninterest-bearing demand deposits were $10.16$11.12 billion for the first halfquarter of 2019,2020, compared to $11.14with $10.07 billion for the first half of 2018, a decrease of 9%. Average noninterest-bearing demand deposits made up 29% and 34% of average total deposits for both the second quarter and first half of 2019 and 2018, respectively. Average interest-bearing deposits of $25.09 billion for the second quarter of 2019 increased by $3.70 billion or 17%, from $21.39 billion for the second quarter of 2018. Average interest-bearing deposits of $24.97 billion for the first half of 2019 increased by $3.77 billion or 18%, from $21.20 billion for the first half of 2018.
The cost of funds was 1.19% for the second quarter of 2019, an increase of 48 basis points from 0.71%$1.05 billion or 10%. Average noninterest-bearing demand deposits comprised 30% and 29% of average total deposits for the secondfirst quarters of 2020 and 2019, respectively. Average interest-bearing deposits of $26.36 billion for the first quarter of 2018. For2020 increased by $1.50 billion or 6% from $24.85 billion for the first halfquarter of 2019, the2019.
The average cost of funds was 1.17%, an increase0.90% for the first quarter of 532020, a decrease of 25 basis points from 0.64%1.15% for the first halfquarter of 2018.2019. The increasedecrease in the average cost of funds was duereflects the cumulative 225 basis points of cuts to a lower share of noninterest-bearing deposits, as well as an increasethe target fed funds rate in the second half of 2019 and in the first quarter of 2020. The average cost of interest-bearing deposits.deposits was 0.82% for the first quarter of 2020, a decrease of 25 basis points from 1.07% for the first quarter of 2019. The average cost of interest-bearing deposits increased 61decreased 33 basis points to 1.57% for the second quarter of 2019, up from 0.96% for the second quarter of 2018. For the first half of 2019, the cost of interest-bearing deposits increased 67 basis points to 1.53%, up from 0.86%1.17% for the first halfquarter of 2018.2020, from 1.50% for the first quarter of 2019. Other sources of funding includeincluded in the calculation of the average cost of funds consist of FHLB advances, long-term debt and securities sold under repurchase agreements (“repurchase agreements”). and long-term debt.
The Company utilizes various tools to manage interest rate risk. Refer to Item 2. MD&A — Asset Liability and Market Risk Management — Interest RateMarket Risk Management in this Form 10-Q.
The following table presents the interest spread, net interest margin, average balances, interest income and expense, and the average yield/rate by asset and liability component for the second quarterfirst quarters of 20192020 and 2018:2019:
| | | | ($ in thousands) | | Three Months Ended June 30, | | Three Months Ended March 31, |
| | 2019 | | 2018 | | 2020 | | 2019 |
| | Average Balance | | Interest | | Average Yield/ Rate (1) | | Average
Balance | | Interest | | Average Yield/ Rate (1) | | Average Balance | | Interest | | Average Yield/ Rate (1) | | Average
Balance | | Interest | | Average Yield/ Rate (1) |
| ASSETS | | | | | | | | | | | | | | | | | | | | | | | | |
| Interest-earning assets: | | | | | | | | | | | | | | | | | | | | | | | | |
| Interest-bearing cash and deposits with banks | | $ | 2,852,060 |
| | $ | 16,861 |
| | 2.37 | % | | $ | 2,316,194 |
| | $ | 11,715 |
| | 2.03 | % | | $ | 2,973,006 |
| | $ | 11,168 |
| | 1.51 | % | | $ | 2,578,686 |
| | $ | 15,470 |
| | 2.43 | % |
Securities purchased under resale agreements (“Resale agreements”) (2) | | 999,835 |
| | 7,343 |
| | 2.95 | % | | 996,154 |
| | 7,182 |
| | 2.89 | % | | 882,142 |
| | 5,565 |
| | 2.54 | % | | 1,035,000 |
| | 7,846 |
| | 3.07 | % |
Available-for-sale investment securities (3)(4) | | 2,551,383 |
| | 15,685 |
| | 2.47 | % | | 2,735,023 |
| | 15,059 |
| | 2.21 | % | |
AFS debt securities (3)(4) | | | 3,274,740 |
| | 20,142 |
| | 2.47 | % | | 2,642,299 |
| | 15,748 |
| | 2.42 | % |
Loans (5)(6) | | 32,981,374 |
| | 434,450 |
| | 5.28 | % | | 29,646,766 |
| | 365,555 |
| | 4.95 | % | | 35,153,968 |
| | 411,869 |
| | 4.71 | % | | 32,414,785 |
| | 423,534 |
| | 5.30 | % |
| Restricted equity securities | | 76,449 |
| | 505 |
| | 2.65 | % | | 73,671 |
| | 800 |
| | 4.36 | % | | 78,675 |
| | 446 |
| | 2.28 | % | | 74,234 |
| | 713 |
| | 3.90 | % |
| Total interest-earning assets | | $ | 39,461,101 |
| | $ | 474,844 |
| | 4.83 | % | | $ | 35,767,808 |
| | $ | 400,311 |
| | 4.49 | % | | $ | 42,362,531 |
| | $ | 449,190 |
| | 4.26 | % | | $ | 38,745,004 |
| | $ | 463,311 |
| | 4.85 | % |
| Noninterest-earning assets: | | | | | | | | | | | | | | | | | | | | | | | | |
| Cash and due from banks | | 439,449 |
| | | | | | 432,401 |
| | | | | | 510,512 |
| | | | | | 468,159 |
| | | | |
| Allowance for loan losses | | (321,335 | ) | | | | | | (292,645 | ) | | | | | | (492,297 | ) | | | | | | (314,446 | ) | | | | |
| Other assets | | 1,966,226 |
| | | | | | 1,661,331 |
| | | | | | 2,374,763 |
| | | | | | 1,839,687 |
| | | | |
| Total assets | | $ | 41,545,441 |
| | | | | | $ | 37,568,895 |
| | | | | | $ | 44,755,509 |
| | | | | | $ | 40,738,404 |
| | | | |
| LIABILITIES AND STOCKHOLDERS’ EQUITY | LIABILITIES AND STOCKHOLDERS’ EQUITY | | | | | | | | | | | | | | | | | | | | |
| Interest-bearing liabilities: | Interest-bearing liabilities: | | | | | | | | | | | | | | | | | | | | | | |
| Checking deposits | | $ | 5,221,110 |
| | $ | 15,836 |
| | 1.22 | % | | $ | 4,387,479 |
| | $ | 8,416 |
| | 0.77 | % | | $ | 5,001,672 |
| | $ | 10,246 |
| | 0.82 | % | | $ | 5,270,855 |
| | $ | 14,255 |
| | 1.10 | % |
| Money market deposits | | 7,856,055 |
| | 28,681 |
| | 1.46 | % | | 7,880,601 |
| | 18,805 |
| | 0.96 | % | | 9,013,381 |
| | 22,248 |
| | 0.99 | % | | 8,080,848 |
| | 30,234 |
| | 1.52 | % |
| Savings deposits | | 2,106,626 |
| | 2,477 |
| | 0.47 | % | | 2,214,793 |
| | 2,035 |
| | 0.37 | % | | 2,076,270 |
| | 1,817 |
| | 0.35 | % | | 2,091,406 |
| | 2,227 |
| | 0.43 | % |
| Time deposits | | 9,904,726 |
| | 50,970 |
| | 2.06 | % | | 6,907,174 |
| | 22,009 |
| | 1.28 | % | | 10,264,007 |
| | 42,092 |
| | 1.65 | % | | 9,408,897 |
| | 45,289 |
| | 1.95 | % |
| Federal funds purchased and other short-term borrowings | | 35,575 |
| | 361 |
| | 4.07 | % | | 11,695 |
| | 124 |
| | 4.25 | % | | 59,978 |
| | 556 |
| | 3.73 | % | | 60,442 |
| | 616 |
| | 4.13 | % |
| FHLB advances | | 533,841 |
| | 4,011 |
| | 3.01 | % | | 324,665 |
| | 2,552 |
| | 3.15 | % | | 693,357 |
| | 4,166 |
| | 2.42 | % | | 338,027 |
| | 2,979 |
| | 3.57 | % |
Repurchase agreements (2) | | 50,000 |
| | 3,469 |
| | 27.83 | % | | 50,000 |
| | 3,042 |
| | 24.40 | % | | 332,417 |
| | 3,991 |
| | 4.83 | % | | 50,000 |
| | 3,492 |
| | 28.32 | % |
| Long-term debt and finance lease liabilities | | 152,608 |
| | 1,713 |
| | 4.50 | % | | 161,727 |
| | 1,649 |
| | 4.09 | % | | 152,259 |
| | 1,367 |
| | 3.61 | % | | 152,360 |
| | 1,758 |
| | 4.68 | % |
| Total interest-bearing liabilities | | $ | 25,860,541 |
| | $ | 107,518 |
| | 1.67 | % | | $ | 21,938,134 |
| | $ | 58,632 |
| | 1.07 | % | | $ | 27,593,341 |
| | $ | 86,483 |
| | 1.26 | % | | $ | 25,452,835 |
| | $ | 100,850 |
| | 1.61 | % |
| Noninterest-bearing liabilities and stockholders’ equity: | Noninterest-bearing liabilities and stockholders’ equity: | | | | | | | | | | | | | | | | | | | | | | |
| Demand deposits | | 10,237,868 |
| | | | | | 10,984,950 |
| | | | | | 11,117,710 |
| | | | | | 10,071,370 |
| | | | |
| Accrued expenses and other liabilities | | 762,684 |
| | | | | | 583,500 |
| | | | | | 1,022,453 |
| | | | | | 676,898 |
| | | | |
| Stockholders’ equity | | 4,684,348 |
| | | | | | 4,062,311 |
| | | | | | 5,022,005 |
| | | | | | 4,537,301 |
| | | | |
| Total liabilities and stockholders’ equity | | $ | 41,545,441 |
| | | | | | $ | 37,568,895 |
| | | | | | $ | 44,755,509 |
| | | | | | $ | 40,738,404 |
| | | | |
| Interest rate spread | | | | | | 3.16 | % | | | | | | 3.42 | % | | | | | | 3.00 | % | | | | | | 3.24 | % |
| Net interest income and net interest margin | | | | $ | 367,326 |
| | 3.73 | % | | | | $ | 341,679 |
| | 3.83 | % | | | | $ | 362,707 |
| | 3.44 | % | | | | $ | 362,461 |
| | 3.79 | % |
|
| |
| (2) | Average balances of resale and repurchase agreements have been reported net, pursuant to Accounting Standards Codification (“ASC”) 210-20-45-11, Balance Sheet Offsetting: Repurchase and Reverse Repurchase Agreements. The weighted-average yields of gross resale agreements were 2.70%2.54% and 2.63%2.80% for the second quarterfirst quarters of 20192020 and 2018,2019, respectively. The weighted-average interest rates of gross repurchase agreements were 4.93%4.10% and 4.48%5.01% for the second quarterfirst quarters of 20192020 and 2018,2019, respectively. |
| |
| (3) | Yields on tax-exempt securities are not presented on a tax-equivalent basis. |
| |
| (4) | Includes the amortization of premiums on investmentdebt securities of $2.9$3.3 million and $3.3$3.0 million for the second quarterfirst quarters of 20192020 and 2018,2019, respectively. |
| |
| (5) | Average balances include nonperforming loans and loans held-for-sale. |
| |
| (6) | IncludesLoans include the accretion of net deferred loan fees, unearned fees and ASC 310-30 discounts, and amortization of premiums, which totaled $8.8 million and $11.2$8.0 million for the second quarter of 2019 and 2018, respectively. |
The following table presents the interest spread, net interest margin, average balances, interest income and expense, and the average yield/rate by asset and liability component for the first half of 2019 and 2018:
|
| | | | | | | | | | | | | | | | | | | | | | |
| |
| ($ in thousands) | | Six Months Ended June 30, |
| | 2019 | | 2018 |
| | Average Balance | | Interest | | Average Yield/ Rate (1) | | Average
Balance | | Interest | | Average Yield/ Rate (1) |
| ASSETS | | | | | | | | | | | | |
| Interest-earning assets: | | | | | | | | | | | | |
| Interest-bearing cash and deposits with banks | | $ | 2,716,128 |
| | $ | 32,331 |
| | 2.40 | % | | $ | 2,319,962 |
| | $ | 22,660 |
| | 1.97 | % |
Resale agreements (2) | | 1,017,320 |
| | 15,189 |
| | 3.01 | % | | 1,022,928 |
| | 14,116 |
| | 2.78 | % |
Available-for-sale investment securities (3)(4) | | 2,596,590 |
| | 31,433 |
| | 2.44 | % | | 2,794,350 |
| | 30,515 |
| | 2.20 | % |
Loans (5)(6) | | 32,699,644 |
| | 857,984 |
| | 5.29 | % | | 29,430,537 |
| | 703,459 |
| | 4.82 | % |
| Restricted equity securities | | 75,348 |
| | 1,218 |
| | 3.26 | % | | 73,661 |
| | 1,434 |
| | 3.93 | % |
| Total interest-earning assets | | $ | 39,105,030 |
| | $ | 938,155 |
| | 4.84 | % | | $ | 35,641,438 |
| | $ | 772,184 |
| | 4.37 | % |
| Noninterest-earning assets: | | | | | | | | | | | | |
| Cash and due from banks | | 453,725 |
| | | | | | 437,848 |
| | | | |
| Allowance for loan losses | | (317,909 | ) | | | | | | (289,259 | ) | | | | |
| Other assets | | 1,903,306 |
| | | | | | 1,685,488 |
| | | | |
| Total assets | | $ | 41,144,152 |
| | | | | | $ | 37,475,515 |
| | | | |
| LIABILITIES AND STOCKHOLDERS’ EQUITY | | | | | | | | |
| Interest-bearing liabilities: | | | | | | | | | | |
| Checking deposits | | $ | 5,245,845 |
| | $ | 30,091 |
| | 1.16 | % | | $ | 4,473,111 |
| | $ | 15,143 |
| | 0.68 | % |
| Money market deposits | | 7,967,831 |
| | 58,915 |
| | 1.49 | % | | 8,075,796 |
| | 34,645 |
| | 0.87 | % |
| Savings deposits | | 2,099,058 |
| | 4,704 |
| | 0.45 | % | | 2,332,966 |
| | 4,056 |
| | 0.35 | % |
| Time deposits | | 9,658,181 |
| | 96,259 |
| | 2.01 | % | | 6,315,194 |
| | 36,557 |
| | 1.17 | % |
| Federal funds purchased and other short-term borrowings | | 47,939 |
| | 977 |
| | 4.11 | % | | 6,314 |
| | 131 |
| | 4.18 | % |
| FHLB advances | | 436,475 |
| | 6,990 |
| | 3.23 | % | | 329,367 |
| | 4,812 |
| | 2.95 | % |
Repurchase agreements (2) | | 50,000 |
| | 6,961 |
| | 28.07 | % | | 50,000 |
| | 5,348 |
| | 21.57 | % |
| Long-term debt and finance lease liabilities | | 152,485 |
| | 3,471 |
| | 4.59 | % | | 164,179 |
| | 3,120 |
| | 3.83 | % |
| Total interest-bearing liabilities | | $ | 25,657,814 |
| | $ | 208,368 |
| | 1.64 | % | | $ | 21,746,927 |
| | $ | 103,812 |
| | 0.96 | % |
| Noninterest-bearing liabilities and stockholders’ equity: | | | | | | | | | | |
| Demand deposits | | 10,155,079 |
| | | | | | 11,136,389 |
| | | | |
| Accrued expenses and other liabilities | | 720,028 |
| | | | | | 599,195 |
| | | | |
| Stockholders’ equity | | 4,611,231 |
| | | | | | 3,993,004 |
| | | | |
| Total liabilities and stockholders’ equity | | $ | 41,144,152 |
| | | | | | $ | 37,475,515 |
| | | | |
| Interest rate spread | | | | | | 3.20 | % | | | | | | 3.41 | % |
| Net interest income and net interest margin | | | | $ | 729,787 |
| | 3.76 | % | | | | $ | 668,372 |
| | 3.78 | % |
| |
| |
(2) | Average balances of resale and repurchase agreements have been reported net, pursuant to ASC 210-20-45-11, Balance Sheet Offsetting: Repurchase and Reverse Repurchase Agreements. The weighted-average yields of gross resale agreements were 2.75% and 2.57% forboth the first halfquarters of 20192020 and 2018, respectively. The weighted-average interest rates of gross repurchase agreements were 4.97% and 4.21% for the first half of 2019 and 2018, respectively.
|
| |
(3) | Yields on tax-exempt securities are not presented on a tax-equivalent basis. |
| |
(4) | Includes the amortization of premiums on investment securities of $6.0 million and $8.2 million for the first half of 2019 and 2018, respectively. |
| |
(5) | Average balances include nonperforming loans and loans held-for-sale. |
| |
(6) | Includes the accretion of net deferred loan fees, unearned fees and ASC 310-30 discounts, and amortization of premiums, which totaled $16.8 million and $19.4 million for the first half of 2019 and 2018, respectively.2019. |
The following table summarizes the extent to which changes in (1) interest rates; and (2) average interest-earning assets and average interest-bearing liabilities affected the Company’s net interest income for the periods presented. The total change for each category of interest-earning assets and interest-bearing liabilities is segmented into changes attributable to variations in volume and interest rate.rates. Changes that are not solely due to either volume or rate are allocated proportionally based on the absolute value of the change related to average volume and average rate. Nonaccrual loans are included in average loans to compute the table below:
| | | | ($ in thousands) | | Three Months Ended June 30, | | Six Months Ended June 30, | | Three Months Ended March 31, |
| | 2019 vs. 2018 | | 2019 vs. 2018 | | 2020 vs. 2019 |
| | Total Change | | Changes Due to | | Total Change | | Changes Due to | | Total Change | | Changes Due to |
| | | Volume | | Yield/Rate | | Volume | | Yield/Rate | | | Volume | | Yield/Rate |
| Interest-earning assets: | | | | | | | | | | | | | | | | | | |
| Interest-bearing cash and deposits with banks | | $ | 5,146 |
| | $ | 2,975 |
| | $ | 2,171 |
| | $ | 9,671 |
| | $ | 4,241 |
| | $ | 5,430 |
| | $ | (4,302 | ) | | $ | 2,163 |
| | $ | (6,465 | ) |
| Resale agreements | | 161 |
| | 27 |
| | 134 |
| | 1,073 |
| | (78 | ) | | 1,151 |
| | (2,281 | ) | | (1,045 | ) | | (1,236 | ) |
| Available-for-sale investment securities | | 626 |
| | (1,054 | ) | | 1,680 |
| | 918 |
| | (2,252 | ) | | 3,170 |
| |
| AFS debt securities | | | 4,394 |
| | 4,002 |
| | 392 |
|
Loans | | 68,895 |
| | 42,864 |
| | 26,031 |
| | 154,525 |
| | 82,202 |
| | 72,323 |
| | (11,665 | ) | | 35,890 |
| | (47,555 | ) |
| Restricted equity securities | | (295 | ) | | 29 |
| | (324 | ) | | (216 | ) | | 32 |
| | (248 | ) | | (267 | ) | | 42 |
| | (309 | ) |
| Total interest and dividend income | | $ | 74,533 |
| | $ | 44,841 |
| | $ | 29,692 |
| | $ | 165,971 |
| | $ | 84,145 |
| | $ | 81,826 |
| | $ | (14,121 | ) | | $ | 41,052 |
| | $ | (55,173 | ) |
| Interest-bearing liabilities: | | | | | | | | | | | | | | | | | | |
| Checking deposits | | $ | 7,420 |
| | $ | 1,828 |
| | $ | 5,592 |
| | $ | 14,948 |
| | $ | 2,978 |
| | $ | 11,970 |
| | $ | (4,009 | ) | | $ | (683 | ) | | $ | (3,326 | ) |
| Money market deposits | | 9,876 |
| | (59 | ) | | 9,935 |
| | 24,270 |
| | (469 | ) | | 24,739 |
| | (7,986 | ) | | 3,277 |
| | (11,263 | ) |
| Savings deposits | | 442 |
| | (104 | ) | | 546 |
| | 648 |
| | (437 | ) | | 1,085 |
| | (410 | ) | | (15 | ) | | (395 | ) |
| Time deposits | | 28,961 |
| | 11,982 |
| | 16,979 |
| | 59,702 |
| | 25,261 |
| | 34,441 |
| | (3,197 | ) | | 4,052 |
| | (7,249 | ) |
| Federal funds purchased and other short-term borrowings | | 237 |
| | 243 |
| | (6 | ) | | 846 |
| | 848 |
| | (2 | ) | | (60 | ) | | (4 | ) | | (56 | ) |
| FHLB advances | | 1,459 |
| | 1,576 |
| | (117 | ) | | 2,178 |
| | 1,681 |
| | 497 |
| | 1,187 |
| | 2,395 |
| | (1,208 | ) |
| Repurchase agreements | | 427 |
| | — |
| | 427 |
| | 1,613 |
| | — |
| | 1,613 |
| | 499 |
| | 5,529 |
| | (5,030 | ) |
| Long-term debt and finance lease liabilities | | 64 |
| | (96 | ) | | 160 |
| | 351 |
| | (234 | ) | | 585 |
| |
| Long-term debt | | | (391 | ) | | (1 | ) | | (390 | ) |
| Total interest expense | | $ | 48,886 |
| | $ | 15,370 |
| | $ | 33,516 |
| | $ | 104,556 |
| | $ | 29,628 |
| | $ | 74,928 |
| | $ | (14,367 | ) | | $ | 14,550 |
| | $ | (28,917 | ) |
| Change in net interest income | | $ | 25,647 |
| | $ | 29,471 |
| | $ | (3,824 | ) | | $ | 61,415 |
| | $ | 54,517 |
| | $ | 6,898 |
| | $ | 246 |
| | $ | 26,502 |
| | $ | (26,256 | ) |
|
(1) Includes nonaccrual loans.
Noninterest Income
The following table presents the components of noninterest income for the second quarterfirst quarters of 2020 and first half of 2019 and 2018:2019:
|
| | | | | | | | | | | | | | | | | | | | | | |
| |
| ($ in thousands) | | Three Months Ended June 30, | | Six Months Ended June 30, |
| | 2019 | | 2018 | | % Change | | 2019 | | 2018 | | % Change |
| Lending fees | | $ | 16,242 |
| | $ | 14,692 |
| | 11 | % | | $ | 31,038 |
| | $ | 28,705 |
| | 8 | % |
| Deposit account fees | | 9,788 |
| | 10,140 |
| | (3 | )% | | 19,429 |
| | 20,570 |
| | (6 | )% |
| Foreign exchange income | | 7,286 |
| | 6,822 |
| | 7 | % | | 12,301 |
| | 7,992 |
| | 54 | % |
| Wealth management fees | | 3,800 |
| | 4,501 |
| | (16 | )% | | 7,612 |
| | 7,454 |
| | 2 | % |
| Interest rate contracts and other derivative income | | 10,398 |
| | 6,570 |
| | 58 | % | | 13,614 |
| | 13,260 |
| | 3 | % |
| Net gains on sales of loans | | 15 |
| | 2,354 |
| | (99 | )% | | 930 |
| | 3,936 |
| | (76 | )% |
| Net gains on sales of available-for-sale investment securities | | 1,447 |
| | 210 |
| | NM |
| | 3,008 |
| | 2,339 |
| | 29 | % |
| Net gain on sale of business | | — |
| | — |
| | — |
| | — |
| | 31,470 |
| | (100 | )% |
| Other income | | 3,783 |
| | 2,979 |
| | 27 | % | | 6,958 |
| | 6,986 |
| | 0 | % |
| Total noninterest income | | $ | 52,759 |
| | $ | 48,268 |
| | 9 | % | | $ | 94,890 |
| | $ | 122,712 |
| | (23 | )% |
| |
NM — Not meaningful.
|
| | | | | | | | | | | |
| |
| ($ in thousands) | | Three Months Ended March 31, |
| | 2020 | | 2019 | | % Change |
| Lending fees | | $ | 15,773 |
| | $ | 14,969 |
| | 5 | % |
| Deposit account fees | | 10,447 |
| | 9,468 |
| | 10 | % |
| Foreign exchange income | | 7,819 |
| | 5,015 |
| | 56 | % |
| Wealth management fees | | 5,357 |
| | 3,812 |
| | 41 | % |
| Interest rate contracts and other derivative income | | 7,073 |
| | 3,216 |
| | 120 | % |
| Net gains on sales of loans | | 950 |
| | 915 |
| | 4 | % |
| Net gains on sales of AFS debt securities | | 1,529 |
| | 1,561 |
| | (2 | %) |
| Other investment income | | 1,921 |
| | 1,202 |
| | 60 | % |
| Other income | | 3,180 |
| | 1,973 |
| | 61 | % |
| Total noninterest income | | $ | 54,049 |
| | $ | 42,131 |
| | 28 | % |
| |
Noninterest income comprised 13% and 12%10% of total revenue for the second quarterfirst quarters of 2020 and the first half of 2019, respectively, compared to 12% and 16% for the second quarter and the first half of 2018, respectively. SecondFirst quarter of 20192020 noninterest income was $52.8$54.0 million, an increase of $4.5$11.9 million or 9%28%, compared to $48.3with $42.1 million for the second quarter of 2018.same period in 2019. This increase was primarily due to increases in interest rate contracts and other derivative income, as well as in lending fees, partially offset by a decrease in net gains on sales of loans. First half of 2019 noninterest income was $94.9 million, a decrease of $27.8 million or 23%, compared to $122.7 million for the first half of 2018. This decrease was primarily due to decreases in net gain on sale of business and net gains on sales of loans, partially offset by increases in foreign exchange income, wealth management fees, and in lending fees.other income. The following discussion provides the composition of the major changes in noninterest income.
Lending fees increased by $1.6 million or 11% to $16.2 million for the second quarter of 2019, and increased by $2.3 million or 8% to $31.0 million for the first half of 2019. Growth was broad-based, reflecting increases in letter of credit issuance fees, including credit enhancement fees and ancillary loan fees.
Foreign exchange income increased by $464 thousand$2.8 million or 7%56% from the first quarter of 2019 to $7.3$7.8 million for the secondfirst quarter of 2019, and increased by $4.3 million or 54% to $12.3 million forthe first half of 2019.2020. The increase forwas primarily driven by the second quarter of 2019 primarily reflected an increased volume of foreign exchange transactions, partially offset byfavorable revaluation changes on certain foreign currency-denominated balance sheet items. The increase for the first half of 2019 primarily reflected increased volume of foreign exchange transactions and favorable revaluations of certain foreign currency-denominated balance sheet items.items, partially offset by losses on foreign exchange transactions.
Wealth management fees increased by $1.5 million or 41% from the first quarter of 2019 to $5.4 million for the first quarter of 2020. The increase was driven by higher customer activity.
Interest rate contracts and other derivative income increased by $3.8$3.9 million or 58%120% to $10.4 million forthe second quarter of 2019, and increased by $354 thousand or 3% to $13.6$7.1 million for the first halfquarter of 2019. These increases2020. This increase reflected strong customer demand for interest rate swaps in response to interest rate volatility, partially offset by a negative credit valuation adjustment related to interest rate derivative contracts, reflecting the inverted yield curve.year-over-year decline in long-term interest rates.
Net gains on sales of loans decreasedOther income increased by $2.3$1.2 million or 99% to $15 thousand for61% from the secondfirst quarter of 2019 and decreased by $3.0to $3.2 million or 76% to $930 thousand for the first halfquarter of 2019.2020. The higher net gains on sales of loans during the second quarter and first half of 2018 were due to higher volume of Small Business Administration loans sold in 2018.
Net gain on sale of business in the first half of 2018 reflected the $31.5 million pre-taxincrease was driven by a gain recognized fromon the salecash surrender value of the Bank’s eight DCB branches as discussed in Note 3 — Dispositions to the Consolidated Financial Statements in this Form 10-Q.bank owned life insurance policies.
Noninterest Expense
The following table presents the components of noninterest expense for the second quarterfirst quarters of 2020 and first half of 2019 and 2018:2019:
| | | | ($ in thousands) | | Three Months Ended June 30, | | Six Months Ended June 30, | | Three Months Ended March 31, |
| | 2019 | | 2018 | | % Change | | 2019 | | 2018 | | % Change | | 2020 | | 2019 | | % Change |
| Compensation and employee benefits | | $ | 100,531 |
| | $ | 93,865 |
| | 7 | % | | $ | 202,830 |
| | $ | 189,099 |
| | 7 | % | | $ | 101,960 |
| | $ | 102,299 |
| | — | % |
| Occupancy and equipment expense | | 17,362 |
| | 16,707 |
| | 4 | % | | 34,680 |
| | 33,587 |
| | 3 | % | | 17,076 |
| | 17,318 |
| | (1 | %) |
| Deposit insurance premiums and regulatory assessments | | 2,919 |
| | 5,832 |
| | (50 | )% | | 6,007 |
| | 12,105 |
| | (50 | )% | | 3,427 |
| | 3,088 |
| | 11 | % |
| Legal expense | | 2,355 |
| | 2,837 |
| | (17 | )% | | 4,580 |
| | 5,092 |
| | (10 | )% | | 3,197 |
| | 2,225 |
| | 44 | % |
| Data processing | | 3,460 |
| | 3,327 |
| | 4 | % | | 6,617 |
| | 6,728 |
| | (2 | )% | | 3,826 |
| | 3,157 |
| | 21 | % |
| Consulting expense | | 2,069 |
| | 5,120 |
| | (60 | )% | | 4,128 |
| | 7,472 |
| | (45 | )% | | 1,217 |
| | 2,059 |
| | (41 | )% |
| Deposit related expense | | 3,338 |
| | 2,922 |
| | 14 | % | | 6,842 |
| | 5,601 |
| | 22 | % | | 3,563 |
| | 3,504 |
| | 2 | % |
| Computer software expense | | 6,211 |
| | 5,549 |
| | 12 | % | | 12,289 |
| | 10,603 |
| | 16 | % | | 6,166 |
| | 6,078 |
| | 1 | % |
| Other operating expense | | 22,679 |
| | 20,779 |
| | 9 | % | | 44,968 |
| | 38,386 |
| | 17 | % | | 21,119 |
| | 22,289 |
| | (5 | )% |
| Amortization of tax credit and other investments | | 16,739 |
| | 20,481 |
| | (18 | )% | | 41,644 |
| | 37,881 |
| | 10 | % | | 17,325 |
| | 24,905 |
| | (30 | )% |
| Total noninterest expense | | $ | 177,663 |
| | $ | 177,419 |
| | 0 | % | | $ | 364,585 |
| | $ | 346,554 |
| | 5 | % | | $ | 178,876 |
| | $ | 186,922 |
| | (4 | )% |
|
SecondFirst quarter 20192020 noninterest expense was $177.7$178.9 million, an increasea decrease of $244 thousand,$8.0 million or 4%, compared to $177.4with $186.9 million for the second quarter of 2018. The increasessame period in compensation and employee benefits and other operating expense were almost fully offset by decreases in amortization of tax credits and other investments, consulting expense, and deposit insurance premiums and regulatory assessments. For the first half of 2019, noninterest expense was $364.6 million, an increase of $18.0 million or 5%, compared to $346.6 million for the first half of 2018.2019. This increasedecrease was primarily attributabledue to increasesdecreases in compensation and employee benefits, other operating expense and amortization of tax credit and other investments, partially offset by decreases in deposit insurance premiums and regulatory assessments and consultingother operating expense.
Compensation and employee benefits increased by $6.7 million or 7% to $100.5 million for the second quarter of 2019, and increased by $13.7 million or 7% to $202.8 million for the first half of 2019. These increases were primarily attributable to staffing growth to support the Company’s growing business and annual employee merit increases.
Deposit insurance premiums and regulatory assessments decreased by $2.9 million or 50% to $2.9 million for the second quarter of 2019, and decreased by $6.1 million or 50% to $6.0 million for the first half of 2019. These decreases were primarily due to lower Federal Deposit Insurance Corporation (“FDIC”) assessment rates. Effective October 1, 2018, the FDIC removed the temporary surcharge applied on the larger banks’ assessment base, given that the Deposit Insurance Fund Reserve Ratio exceeded its statutory minimum requirement of 1.35%.
Consulting expense decreased by $3.1 million or 60% to $2.1 million for the second quarter of 2019, and decreased by $3.3 million or 45% to $4.1 million for the first half of 2019. These decreases were primarily due to a reduction in consulting expense related to digital banking, loan-related operations and compliance projects.
Other operating expense primarily consists of loan related expenses, marketing, telecommunications and postage, travel, charitable contributions, loan-related expenses and other miscellaneous expense categories. Other operating expense increased by $1.9The $1.2 million or 9%5% decrease to $22.7$21.1 million for the secondfirst quarter of 2019,2020, was primarily due to increasesdecreases in loan-related, marketing, other miscellaneous and corporate eventtravel expenses, partially offset by decreasesan increase in recruitment and travelloan related expenses. For the first half of 2019, other operating expense increased by $6.6 million or 17% to $45.0 million, primarily due to increases in marketing and loan-related expenses, as well as lower gains on sale of, other real estate owned (“OREO”), partially offset by a decrease in recruitment expense.
Amortization of tax credit and other investments decreased by $3.7$7.6 million or 18%30% to $16.7$17.3 million for the secondfirst quarter of 2020, compared with the first quarter of 2019. In the first quarter of 2019, compared to the second quarter of 2018. This decrease was primarily due to a decrease inCompany fully wrote off the tax credit investments placed in service during this period, partially offset by $2.9 million in other-than-temporary impairment (“OTTI”) charges related to DC Solar and recorded a historic tax credit investment and a Community Reinvestment Act (“CRA”) investment. For the first half of 2019, amortization$7.0 million impairment charge, which was included in Amortization of tax credit and other investments increased by $3.8 million or 10% to $41.6 million, compared toinvestments. There was no such impairment in the first half of 2018. This increase was due to the $7.0 full write-off of the DC Solar tax credit investments, as well as the $2.9 million OTTI charges related to a historic tax credit investment and a CRA investment, partially offset by a decrease in tax credit investments placed in service during thiscurrent period.
Income Taxes
| |
| | ($ in thousands) |
| Three Months Ended June 30, | | Six Months Ended June 30, |
| Three Months Ended March 31, |
| 2019 | | 2018 | | % Change | | 2019 | | 2018 | | % Change |
| 2020 | | 2019 | | % Change |
| Income before income taxes |
| $ | 223,177 |
|
| $ | 196,992 |
|
| 13 | % |
| $ | 418,268 |
|
| $ | 408,776 |
|
| 2 | % |
| $ | 164,010 |
|
| $ | 195,091 |
|
| (16 | )% |
| Income tax expense |
| $ | 72,797 |
|
| $ | 24,643 |
|
| 195 | % |
| $ | 103,864 |
|
| $ | 49,395 |
|
| 110 | % |
| $ | 19,186 |
|
| $ | 31,067 |
|
| (38 | %) |
| Effective tax rate |
| 32.6 | % |
| 12.5 | % |
| 20 | % |
| 24.8 | % |
| 12.1 | % |
| 13 | % |
| 11.7 | % |
| 15.9 | % |
|
|
|
|
The effectiveincome tax rates were 32.6%expense was $19.2 million and 24.8% for the second quarter and first half of 2019, respectively, compared to 12.5% and 12.1% for the same periods in 2018. The year-over-year increases in the effective tax rate were primarily due towas 11.7% in the $30.1 millionfirst quarter of additional2020, compared with an income tax expense recorded inof $31.1 million and an effective tax rate of 15.9% for the secondfirst quarter of 2019 to reverse certain previously claimed tax credits related to the Company’s investment in DC Solar. Excluding this $30.1 million of additional income tax expense, non-GAAP effective tax rates for the second quarter and first half of 2019 were 19.1% and 12.5%, respectively. (See reconciliations of non-GAAP measures presented under Item 2. MD&A — Supplemental Information — Explanation of GAAP and Non-GAAP Financial Measures in this Form 10-Q.) In addition, a2019. A year-over-year decreaseincrease in tax credits recognized from investments in renewable energy and historic rehabilitationsolar tax credit projects, and a decrease in income before income taxes contributed to the higherlower effective tax rates inrate during the second quarter and first half of 2019.three months ended March 31, 2020.
Impact of Investment in DC Solar Tax Credit Funds
The Company invested in four solar energy tax credit funds in the years 2014, 2015, 2017 and 2018 as a limited member. These tax credit funds engaged in the acquisition and leasing of mobile solar generators through DC Solar entities. The Company’s investmentsInvestors in the DC Solar funds, including the Company, received tax credit funds qualifiedcredits for federalmaking renewable energy investments. Between 2014 and 2018, the Company had claimed energy tax credit under Section 48credits of approximately $53.9 million, partially reduced by a deferred tax liability of $5.7 million related to the Internal Revenue Code50% tax basis reduction, for a net impact of 1986, as amended. The Company also received a “should” level legal opinion from an external law firm supporting the legal structure of the investments for tax credit purposes. These investments were recorded in Investments in tax credit and other investments, net on$48.2 million to the Consolidated Balance Sheet and were accounted for under the equity method of accounting. For reasons that were not known or knowable to the Company, DC Solar had its assets frozen in December 2018. DC Solar filed for bankruptcy protection in February 2019. In February 2019, an affidavit from a Federal Bureau of Investigation special agent stated that DC Solar was operating a fraudulent “Ponzi-like scheme” and that the majority of the mobile solar generators sold to investors and managed by DC Solar, as well as the majority of the related lease revenues claimed to have been received by DC Solar may not have existed.
Financial Statements. During the first quarter of 2019, the Company fully wrote off its tax credit investments related to DC Solar and recorded a $7.0 million OTTIother-than-temporary impairment (“OTTI”) charge within Amortization of tax credit and other investments on the Consolidated Statement of Income. The Company concluded at that time that there would be no material future cash flows related to these investments, in part because of the fact that DC Solar has ceased operations and its bankruptcy case had been converted from Chapter 11 to Chapter 7 on March 22, 2019. More discussion regarding the Company’s impairment evaluation and monitoring process of tax credit investments is provided in Note 4 — Fair Value Measurement and Fair Value of Financial Instruments to the Consolidated Financial Statements in this Form 10-Q.
Investors in DC Solar funds, including the Company, received tax credits for making these renewable energy investments. The Company had claimed tax credits of approximately $53.9 million in the Consolidated Financial Statements between 2014 and 2018, reduced by a deferred tax liability of $5.7 million related to the 50% tax basis reduction, for a net impact to the Consolidated Financial Statements of $48.2 million. During the second quarter of 2019, the Company concluded that a portion of the previously claimed tax credits would be recaptured, and reversed $33.6 million out of the $53.9 million previously claimed tax credits, and $3.5 million out of the $5.7 million deferred tax liability, resulting in $30.1 million of additional income tax expense.
ASC 740-10-25-6 states in part, that an entity shall initially recognize the financial statement effects of a tax position when it is more-likely-than-not, based on the technical merits, that the position will be sustained upon examination. The term “more-likely-than-not” means a likelihood of more than 50 percent; the terms “examined” and “upon examination” also include resolution of the related appeals or litigation processes, if any. The level of evidence that is necessary and appropriate to support the technical merits of a tax position is subject to judgment and depends on available information as of the balance sheet date. Under ASC 740, Income Taxes, an entity should not consider new information that is received after the balance sheet date, when evaluating an uncertain tax position as of the balance sheet date. Based on the available information known as of December 31, 2018 and March 31, 2019, the Company reassessed the technical merits of the position taken and concluded, based on initial and ongoing due diligence performed by the Company, it believed that the DC Solar related tax credits the Company had previously claimed continued to meet the more-likely-than-not criterion for recognition as of those dates.
During the first quarter of 2019, the Company, in coordination with other fund investors, engaged an unaffiliated third party inventory firm to report on the actual number of mobile solar generators in existence. As of June 30, 2019, based on the latest inventory report, none of the mobile service generators that had been purchased by the Company’s 2017 and 2018 tax credit funds were found. On the other hand, a vast majority of the Company’s mobile solar generators purchased by the Company’s 2014 and 2015 tax credit funds were found. Therefore, as of June 30, 2019, based on this inventory information, as well as management’s best judgments regarding the future settlement of the related tax positions with the Internal Revenue Service, the Company concluded that a portion of the previously claimed tax credits would be recaptured. Accordingly, the Company recorded $30.1 million in income tax expense in the second quarter of 2019.
The Company continues to conduct an ongoing investigation to gather For additional information related to this matter, including tracking asset seizures of DC Solarsolar, refer to Note 8 — Investments in Qualified Affordable Housing Partnerships, Tax Credit and ongoing federal investigations. There can be no assurance thatOther Investments, Net and Variable Interest Entities and Note 14 — Income Taxes to the Company will not recognize additional income tax expense as new information becomes available, or due to changes in tax laws, case law and regulations; or that the Company will not ultimately need to reverse the remaining tax credits previously claimed. For additional information on the risks surrounding the Company’s investments in tax-advantaged projects, see Item 1A. Risk Factors Consolidated Financial Statements in the Company’s 20182019 Form 10-K.
Tax Impact of CARES Act
On March 27, 2020, the President signed the CARES Act, a $2.2 trillion economic stimulus bill to help individuals and businesses that have been negatively impacted by the COVID-19 outbreak. Among other provisions, the CARES Act allows net operating losses, which were modified with the Tax Cuts and Jobs Act of 2017, to be carried back five years. It also modifies the useful lives of qualified leasehold improvements, relaxing the excess loss limitations on pass-through and increasing the interest expense limitation. The Company does not expect the CARES Act to have a material tax impact on the Company’s Consolidated Financial Statements.
Operating Segment Results
The Company organizes its operations into three reportable operating segments: (1) Consumer and Business Banking; (2) Commercial Banking; and (3) Other. These segments are defined by the type of customers served and the related products and services provided. The segments reflect how financial information is currently evaluated by management. For additional description of the Company’s internal management reporting process, including the segment cost allocation methodology, see Note 15 — Business Segments to the Consolidated Financial Statements in this Form 10-Q.
Net interest income before provision for credit losses of each segment represents the difference between actual interest income earned on loans and interest expense paid on customer deposits of the segment, adjusted for funding charges for loans or funding credits for deposits through the Company’s internal funds transfer pricing (“FTP”) process.During the third quarter of 2019, the Company enhanced its FTP methodology related to deposits by setting a minimum floor rate for the FTP credits for deposits in consideration of the flattened and inverted yield curve. This methodology has been retrospectively applied to the segment financial results for the first quarter of 2019.
The following tables present the selected segment information for the first quarters of 2020 and 2019:
|
| | | | | | | | | | | | | | | | |
| |
| ($ in thousands) | | Three Months Ended March 31, 2020 |
| | Consumer and Business Banking | | Commercial Banking | | Other | | Total |
| Net interest income before provision for credit losses | | $ | 152,591 |
| | $ | 183,501 |
| | $ | 26,615 |
| | $ | 362,707 |
|
| Provision for credit losses | | 7,788 |
| | 66,082 |
| | — |
| | 73,870 |
|
| Noninterest income | | 16,402 |
| | 32,456 |
| | 5,191 |
| | 54,049 |
|
| Noninterest expense | | 86,964 |
| | 70,126 |
| | 21,786 |
| | 178,876 |
|
| Segment income before income taxes | | 74,241 |
| | 79,749 |
| | 10,020 |
| | 164,010 |
|
| Segment net income | | $ | 53,195 |
| | $ | 57,131 |
| | $ | 34,498 |
| | $ | 144,824 |
|
| Average loans | | $ | 11,269,489 |
| | $ | 23,884,479 |
| | $ | — |
| | $ | 35,153,968 |
|
| Average deposits | | $ | 25,593,064 |
| | $ | 9,175,430 |
| | $ | 2,704,546 |
| | $ | 37,473,040 |
|
| |
|
| | | | | | | | | | | | | | | | |
| |
| ($ in thousands) | | Three Months Ended March 31, 2019 |
| | Consumer and Business Banking | | Commercial Banking | | Other | | Total |
| Net interest income before provision for credit losses | | $ | 185,059 |
| | $ | 152,708 |
| | $ | 24,694 |
| | $ | 362,461 |
|
| Provision for credit losses | | 3,013 |
| | 19,566 |
| | — |
| | 22,579 |
|
| Noninterest income | | 13,772 |
| | 24,544 |
| | 3,815 |
| | 42,131 |
|
| Noninterest expense | | 87,906 |
| | 70,544 |
| | 28,472 |
| | 186,922 |
|
| Segment income before income taxes | | 107,912 |
| | 87,142 |
| | 37 |
| | 195,091 |
|
| Segment net income | | $ | 77,146 |
| | $ | 62,334 |
| | $ | 24,544 |
| | $ | 164,024 |
|
| Average loans | | $ | 10,351,770 |
| | $ | 22,063,015 |
| | $ | — |
| | $ | 32,414,785 |
|
| Average deposits | | $ | 25,048,532 |
| | $ | 8,020,698 |
| | $ | 1,854,146 |
| | $ | 34,923,376 |
|
| |
Consumer and Business Banking
The Consumer and Business Banking segment primarily provides financial products and services to consumer and commercial customers through the Company’s domestic branch network. This segment offers consumer and commercial deposits, mortgage and home equity loans, and other products and services. The Consumer and Business Banking segmentIt also originates commercial loans for small and medium-sized enterprises through the Company’s branch network. Other products and services provided by the Consumer and Business Bankingthis segment include wealth management, treasury management and foreign exchange services.
First quarter of 2020 net interest income before provision for credit losses for this segment was $152.6 million, a decrease of $32.5 million or 18%, compared with $185.1 million for the same period in 2019. Year-over-year, interest income earned on loans increased by 1%, driven by average loan growth that was nearly entirely offset by a decrease in average loan yields; interest expense paid on deposits decreased by 19%, driven by a decline in the average cost of deposits; FTP funding charges assessed for loans decreased, reflecting a decline in the loans FTP rate, and FTP credits received for deposits also decreased, reflecting a decline in the deposits FTP rate. Combined, these factors drove the 18% year-over-year decrease in segment net interest income before provision for credit losses, with the largest driver of the negative variance being lower FTP credits received for deposits.
Average loans for this segment were $11.27 billion, an increase of $917.7 million or 9% from $10.35 billion for the same period in 2019, primarily driven by an increase in single-family residential loans. Average deposits for this segment were $25.59 billion, essentially flat compared with average deposits of $25.05 billion for the same period in 2019.
Commercial Banking
The Commercial Banking segment primarily generates commercial loans and deposits. Commercial loan products include commercial business loans and lines of credit, trade finance loans and letters of credit, CRE loans, construction and land lending, affordable housing loans and letters of credit, asset-based lending, and equipment financing. Commercial deposit products and other financial services include treasury management, foreign exchange services, and interest rate and commodity hedging risk management.hedging.
The remaining centralizedCommercial Banking segment reported segment net income of $57.1 million for the first quarter of 2020, compared with $62.3 million for the same period in 2019. The $5.2 million or 8% decrease in segment net income reflected an increase in provision for credit losses, partially offset by increases in net interest income before provision for credit losses and noninterest income. First quarter 2020 provision for credit losses was $66.1 million, an increase of $46.5 million or 238%, compared with $19.6 million for the same period in 2019. This increase was primarily due to the deterioration in macroeconomic conditions and outlook as a result of the COVID-19 pandemic during the first quarter of 2020.
Net interest income before provision for credit losses for this segment was $183.5 million, an increase of $30.8 million or 20% compared with $152.7 million for the same period in 2019. Year-over-year, interest income earned on loans decreased by 5%, driven by a decrease in average loan yields, which more than offset income growth from average loan growth; interest expense paid on deposits decreased by 14%, driven by a decline in the average cost of deposits; FTP funding charges assessed for loans decreased, reflecting a decline in the loans FTP rate, and FTP credits received for deposits also decreased, reflecting a decline in the deposits FTP rate. Combined, these factors drove the 20% year-over-year increase in segment net interest income before provision for credit losses, with the largest driver of the positive variance being lower FTP funding charges assessed for loans.
Average loans for this segment were $23.88 billion, an increase of $1.82 billion or 8% from $22.06 billion for the same period in 2019, primarily driven by growth in CRE loans. Average deposits for this segment were $9.18 billion, an increase of $1.16 billion or 14% from $8.02 billion for the same period in 2019, primarily driven by growth in time deposits and noninterest-bearing demand deposits.
First quarter 2020 noninterest income was $32.5 million, an increase of $8.0 million or 32%, compared with $24.5 million for the same period in 2019. This increase was mainly attributable to increases in interest rate contracts and other derivative income and foreign exchange income. The increase in interest rate contracts and other derivative income was driven by strong customer demand for interest rate swaps in response to manage risk associated with increased interest rate volatility, partially offset by a negative credit valuation adjustment of related derivative products. The increase in foreign exchange income was primarily driven by favorable revaluation of certain foreign currency-denominated balance sheet items and an increased volume of foreign exchange transactions.
Other
Centralized functions, including the corporate treasury activities of the Company and eliminations of inter-segment amounts, have been aggregated and included in the Other segment, which provides broad administrative support to the two core segments, namely the Consumer and Business Banking and the Commercial Banking segments.
The Company utilizes an internal reporting process to measure the performanceOther segment reported segment income before income taxes of the three operating segments within the Company. The internal reporting process derives operating$10.0 million and segment results by utilizing allocation methodologies for revenue and expenses. Net interestnet income of each segment represents$34.5 million for the difference between actual interest earned on assets and interest incurred on liabilitiesfirst quarter of the segment, adjusted for funding charges or credits through the Company’s internal funds transfer pricing (“FTP”) process.2020, reflecting an income tax benefit of $24.5 million. The process charges a cost to fund loans (“FTP charges for loans”) and allocates credits for funds provided from deposits (“FTP credits for deposits”) using internal funds transfer pricing rates, which are based on market interest rates and other factors. The internal funds transfer pricing rates, which are applied to both FTP charges for loans and FTP credit for deposits, increase as the market interest rates increase, and vice versa. The treasury function within the Other segment is responsiblereported segment income before income taxes of $37 thousand and segment net income of $24.5 million for the liquidity and interest rate management of the Company. Therefore, the net spread between the total internal funds transfer pricing charges and credits is recorded as part of net interest income in the Other segment.
The Company’s internal funds transfer pricing process is managed by the treasury function within the Other segment. The process is formulated with the goal of encouraging loan and deposit growth that is consistent with the Company’s overall profitability objectives, as well as providing a reasonable and consistent basis for the measurement of its business segments’ net interest margins and profitability. The Company’s internal funds transfer pricing assumptions and methodologies are reviewed at least annually to ensure that the process is reflective of current market conditions. Noninterest income and noninterest expense directly attributable to a segment are assigned to the related business segment. Indirect costs, including technology-related costs and corporate overhead, are allocated based on a segment’s estimated usage using factors, including but not limited to, full-time equivalent employees, net interest margin, and loan and deposit volume. Charge-offs are allocated to the respective segment directly associated with the loans that are charged off, and the remaining provision for credit losses is allocated to each segment based on loan volume. The Company’s internal reporting process utilizes a full-allocation methodology. Under this methodology, corporate expenses and indirect expenses incurred by the Other segment are allocated to the Consumer and Business Banking and the Commercial Banking segments, except certain treasury-related expenses and insignificant unallocated expenses.
During the first quarter of 2019, the Company enhanced its segment cost allocation methodology related to stock compensation expense and bonus accrual. Effective first quarterreflecting an income tax benefit of 2019, stock compensation expense is allocated to all three segments, whereas it was previously recorded in the Other segment as a corporate expense. In addition, bonus expense is now allocated at a more granular level at the segment level. For comparability, segment information for the second quarter and first half of 2018 has been restated to conform to the current presentation.
$24.5 million. The following tables present the selected segment information for the second quarter and first half of 2019 and 2018:
|
| | | | | | | | | | | | | | | | |
| |
| ($ in thousands) | | Three Months Ended June 30, 2019 |
| | Consumer and Business Banking | | Commercial Banking | | Other | | Total |
| Net interest income before provision for credit losses | | $ | 151,352 |
| | $ | 151,222 |
| | $ | 64,752 |
| | $ | 367,326 |
|
| Provision for credit losses | | $ | 1,616 |
| | $ | 17,629 |
| | $ | — |
| | $ | 19,245 |
|
| Noninterest income | | $ | 14,503 |
| | $ | 33,656 |
| | $ | 4,600 |
| | $ | 52,759 |
|
| Noninterest expense | | $ | 83,656 |
| | $ | 67,303 |
| | $ | 26,704 |
| | $ | 177,663 |
|
| Segment income before income taxes | | $ | 80,583 |
| | $ | 99,946 |
| | $ | 42,648 |
| | $ | 223,177 |
|
| Segment net income | | $ | 57,612 |
| | $ | 71,565 |
| | $ | 21,203 |
| | $ | 150,380 |
|
| | | |
|
| | | | | | | | | | | | | | | | |
| |
| ($ in thousands) | | Three Months Ended June 30, 2018 |
| | Consumer and Business Banking | | Commercial Banking | | Other | | Total |
| Net interest income before provision for credit losses | | $ | 180,348 |
| | $ | 153,878 |
| | $ | 7,453 |
| | $ | 341,679 |
|
| Provision for credit losses | | $ | 3,414 |
| | $ | 12,122 |
| | $ | — |
| | $ | 15,536 |
|
| Noninterest income | | $ | 14,585 |
| | $ | 30,744 |
| | $ | 2,939 |
| | $ | 48,268 |
|
| Noninterest expense | | $ | 84,459 |
| | $ | 60,573 |
| | $ | 32,387 |
| | $ | 177,419 |
|
| Segment income (loss) before income taxes | | $ | 107,060 |
| | $ | 111,927 |
| | $ | (21,995 | ) | | $ | 196,992 |
|
| Segment net income | | $ | 76,710 |
| | $ | 80,425 |
| | $ | 15,214 |
| | $ | 172,349 |
|
| |
|
| | | | | | | | | | | | | | | | |
| |
| ($ in thousands) | | Six Months Ended June 30, 2019 |
| | Consumer and Business Banking | | Commercial Banking | | Other | | Total |
| Net interest income before provision for credit losses | | $ | 317,540 |
| | $ | 298,462 |
| | $ | 113,785 |
| | $ | 729,787 |
|
| Provision for credit losses | | $ | 4,629 |
| | $ | 37,195 |
| | $ | — |
| | $ | 41,824 |
|
| Noninterest income | | $ | 28,275 |
| | $ | 58,200 |
| | $ | 8,415 |
| | $ | 94,890 |
|
| Noninterest expense | | $ | 171,562 |
| | $ | 137,847 |
| | $ | 55,176 |
| | $ | 364,585 |
|
| Segment income before income taxes | | $ | 169,624 |
| | $ | 181,620 |
| | $ | 67,024 |
| | $ | 418,268 |
|
| Segment net income | | $ | 121,267 |
| | $ | 130,064 |
| | $ | 63,073 |
| | $ | 314,404 |
|
| | | |
|
| | | | | | | | | | | | | | | | |
| |
| ($ in thousands) | | Six Months Ended June 30, 2018 |
| | Consumer and Business Banking | | Commercial Banking | | Other | | Total |
| Net interest income before provision for credit losses | | $ | 356,296 |
| | $ | 298,358 |
| | $ | 13,718 |
| | $ | 668,372 |
|
| Provision for credit losses | | $ | 6,507 |
| | $ | 29,247 |
| | $ | — |
| | $ | 35,754 |
|
| Noninterest income | | $ | 59,033 |
| | $ | 58,182 |
| | $ | 5,497 |
| | $ | 122,712 |
|
| Noninterest expense | | $ | 171,776 |
| | $ | 121,875 |
| | $ | 52,903 |
| | $ | 346,554 |
|
| Segment income (loss) before income taxes | | $ | 237,046 |
| | $ | 205,418 |
| | $ | (33,688 | ) | | $ | 408,776 |
|
| Segment net income | | $ | 169,844 |
| | $ | 147,454 |
| | $ | 42,083 |
| | $ | 359,381 |
|
| |
Consumer and Business Banking
The Consumer and Business Banking segment reported segment net income of $57.6 million for the second quarter of 2019, compared to $76.7 million for the same period in 2018. The $19.1 million or 25% decreaseincrease in segment net income before income taxes was primarily driven by a decrease in net interest income, partially offset by a corresponding decrease in income taxnoninterest expense. SecondFirst quarter 2019 net interest income for this segmentof 2020 noninterest expense was $151.4$21.8 million, a decrease of $29.0$6.7 million or 16%23%, compared to $180.3 million for the second quarter of 2018, reflecting higher interest expense paid on customer deposits. The year-over-year decrease in income tax expense reflected the decrease in segment pre-tax income.
The Consumer and Business Banking segment reported segment net income of $121.3 million for the first half of 2019, compared to $169.8with $28.5 million for the same period in 2018. The $48.6 million or 29% decrease in segment net income was primarily driven by decreases in net interest income and noninterest income, partially offset by a corresponding decrease in income tax expense. Net interest income for this segment was $317.5 million for the first half of 2019, a decrease of $38.8 million or 11% from $356.3 million for the first half in 2018, reflecting higher interest expense paid on customer deposits. Noninterest income for this segment was $28.3 million for the first half of 2019, a decrease of $30.8 million or 52% compared to $59.0 million for the first half of 2018. Noninterest income for the first half of 2018 included a non-recurring pre-tax gain of $31.5 million from the sale of the Bank’s eight DCB branches, recognized in the first quarter of 2018. The year-over-year decrease in income tax expense reflected the decrease in segment pre-tax income.
Commercial Banking
The Commercial Banking segment reported segment net income of $71.6 million for the second quarter of 2019, compared to $80.4 million for the same period in 2018. The $8.9 million or 11% decrease in segment net income was primarily driven by increases in noninterest expense and the provision for credit losses, partially offset by a corresponding decrease in income tax expense. Second quarter 2019 noninterest expense for this segment was $67.3 million, an increase of $6.7 million or 11% from $60.6 million for the second quarter of 2018, primarily due to an increase in compensation and employee benefits. Second quarter 2019 provision for credit losses for this segment was $17.6 million, an increase of $5.5 million or 45% from $12.1 million for the second quarter of 2018. The year-over-year decrease in income tax expense reflected the decrease in segment pre-tax income.
The Commercial Banking segment reported segment net income of $130.1 million for the first half of 2019, compared to $147.5 million for the same period in 2018. The $17.4 million or 12% decrease in segment net income was primarily driven by increases in noninterest expense and the provision for credit losses, partially offset by a corresponding decrease in income tax expense. Noninterest expense for this segment was $137.8 million for the first half of 2019, an increase of $16.0 million or 13% from $121.9 million for the first half of 2018, primarily due to an increase in compensation and employee benefits. Provision for credit losses for this segment was $37.2 million for the first half of 2019, an increase of $7.9 million or 27% compared to $29.2 million for the first half of 2018.2019. The decrease in income tax expense reflected the decrease in segment pre-tax income.
Other
The Other segment reported pre-tax income of $42.6 million and segment net income of $21.2 million for the second quarter of 2019, reflecting an income tax expense of $21.4 million. The Other segment reported a pre-tax loss of $22.0 million and net income of $15.2 million for the second quarter of 2018, reflecting an income tax benefit of $37.2 million. The increase in pre-tax income was primarily driven by an increase in net interest income and a decrease in noninterest expense. Net interest income attributable to the Other segment increased by $57.3 million or 769% to $64.8 million for the second quarter of 2019, up from $7.5 million for the second quarter of 2018. This increase in net interest income reflects the increase in the net spread between the total internal FTP charges for loans and total internal FTP credits for deposits, which widened due to the inverted yield curve. Second quarter 2019 noninterest expense for this segment was $26.7 million, a decrease of $5.7 million or 18% compared to $32.4 million for the second quarter of 2018, primarily due to a decrease in the amortization of tax credit and other investments, which is assigned to the Other segment in its entirety. The decrease in the amortization of tax credit and other investments was primarily due to decreases in investments in renewable energy and historic rehabilitation tax credit projects placed in service, partially offsetelevated by a $2.9nonrecurring pre-tax impairment charge of $7.0 million OTTI charge related to a historic tax credit and a CRA investment.DC Solar during the first quarter of 2019.
The Other segment reported pre-tax income of $67.0 million and net income of $63.1 million for the first half of 2019, reflecting an income tax expense of $4.0 million. The Other segment reported pre-tax loss of $33.7 million and net income of $42.1 million for the first half of 2018, reflecting an income tax benefit of $75.8 million. The increase in pre-tax income was primarily driven by an increase in net interest income. Net interest income attributable to the Other segment increased by $100.1 million or 729% to $113.8 million for the first half of 2019, up from $13.7 million for the same period in 2018. This increase in net interest income reflects the increase in the net spread between the total internal FTP charges for loans and total internal FTP credits for deposits, which widened due to the inverted yield curve.
The income tax expense or benefit in the Other segment consists of the remaining unallocated income tax expense or benefit after allocating income tax expense to the other two core segments. Income tax expense is allocated to the Consumer and Business Banking and the Commercial Banking segments by applying segment effectivestatutory income tax rates to the segment pre-tax income. The year-over-year increases in the Other segment income tax expense for the second quarter and first half of 2019 was driven by the same reasons for the increase in the Company’s effective tax rate. For additional information, refer to Item 2. MD&A — Results of Operations — Income Taxes in this Form 10-Q.before income taxes.
Balance Sheet Analysis
The following table presents a discussion of the significant changes between June 30, 2019March 31, 2020 and December 31, 2018:2019:
Selected Consolidated Balance Sheet Data
|
| | | | | | | | | | | | | | | |
| |
| ($ in thousands) | | June 30, 2019 | | December 31, 2018 | | Change |
| | | | $ | | % |
| | | (Unaudited) | | | | | | |
| ASSETS | | | | | | | | |
| Cash and cash equivalents | | $ | 3,621,614 |
| | $ | 3,001,377 |
| | $ | 620,237 |
| | 21 | % |
| Interest-bearing deposits with banks | | 150,273 |
| | 371,000 |
| | (220,727 | ) | | (59 | )% |
| Resale agreements | | 1,010,000 |
| | 1,035,000 |
| | (25,000 | ) | | (2 | )% |
| Available-for-sale investment securities, at fair value | | 2,592,913 |
| | 2,741,847 |
| | (148,934 | ) | | (5 | )% |
| Restricted equity securities, at cost | | 78,093 |
| | 74,069 |
| | 4,024 |
| | 5 | % |
| Loans held-for-sale | | 3,879 |
| | 275 |
| | 3,604 |
| | NM |
|
| Loans held-for-investment (net of allowance for loan losses of $330,625 in 2019 and $311,322 in 2018) | | 33,399,752 |
| | 32,073,867 |
| | 1,325,885 |
| | 4 | % |
| Investments in qualified affordable housing partnerships, net | | 198,466 |
| | 184,873 |
| | 13,593 |
| | 7 | % |
| Investments in tax credit and other investments, net | | 210,387 |
| | 231,635 |
| | (21,248 | ) | | (9 | )% |
| Premises and equipment | | 121,498 |
| | 119,180 |
| | 2,318 |
| | 2 | % |
| Goodwill | | 465,697 |
| | 465,547 |
| | 150 |
| | 0 | % |
| Operating lease right-of-use assets | | 109,032 |
| | — |
| | 109,032 |
| | 100 | % |
| Other assets | | 930,754 |
| | 743,686 |
| | 187,068 |
| | 25 | % |
| TOTAL | | $ | 42,892,358 |
| | $ | 41,042,356 |
| | $ | 1,850,002 |
| | 5 | % |
| LIABILITIES | | | | | | | | |
| Noninterest-bearing | | $ | 10,599,088 |
| | $ | 11,377,009 |
| | $ | (777,921 | ) | | (7 | )% |
| Interest-bearing | | 25,878,454 |
| | 24,062,619 |
| | 1,815,835 |
| | 8 | % |
| Total deposits | | 36,477,542 |
| | 35,439,628 |
| | 1,037,914 |
| | 3 | % |
| Short-term borrowings | | 19,972 |
| | 57,638 |
| | (37,666 | ) | | (65 | )% |
| FHLB advances | | 745,074 |
| | 326,172 |
| | 418,902 |
| | 128 | % |
| Repurchase agreements | | 50,000 |
| | 50,000 |
| | — |
| | — | % |
| Long-term debt and finance lease liabilities | | 152,506 |
| | 146,835 |
| | 5,671 |
| | 4 | % |
| Operating lease liabilities | | 117,448 |
| | — |
| | 117,448 |
| | 100 | % |
| Accrued expenses and other liabilities | | 595,223 |
| | 598,109 |
| | (2,886 | ) | | (0 | )% |
| Total liabilities | | 38,157,765 |
| | 36,618,382 |
| | 1,539,383 |
| | 4 | % |
| STOCKHOLDERS’ EQUITY | | 4,734,593 |
| | 4,423,974 |
| | 310,619 |
| | 7 | % |
| TOTAL | | $ | 42,892,358 |
| | $ | 41,042,356 |
| | $ | 1,850,002 |
| | 5 | % |
| |
NM — Not meaningful. |
| | | | | | | | | | | | | | | |
| |
| ($ in thousands) | | March 31, 2020 | | December 31, 2019 | | Change |
| | | | $ | | % |
| | | (Unaudited) | | | | | | |
| ASSETS | | | | | | | | |
| Cash and cash equivalents | | $ | 3,080,042 |
| | $ | 3,261,149 |
| | $ | (181,107 | ) | | (6 | )% |
| Interest-bearing deposits with banks | | 293,509 |
| | 196,161 |
| | 97,348 |
| | 50 | % |
| Resale agreements | | 860,000 |
| | 860,000 |
| | — |
| | — | % |
| AFS debt securities, at fair value (amortized cost of $3,660,413 in 2020) | | 3,695,943 |
| | 3,317,214 |
| | 378,729 |
| | 11 | % |
| Restricted equity securities, at cost | | 78,745 |
| | 78,580 |
| | 165 |
| | 0 | % |
| Loans held-for-sale | | 1,594 |
| | 434 |
| | 1,160 |
| | 267 | % |
| Loans held-for-investment (net of allowance for loan losses of $557,003 in 2020 and $358,287 in 2019) | | 35,336,390 |
| | 34,420,252 |
| | 916,138 |
| | 3 | % |
| Investments in qualified affordable housing partnerships, net | | 198,653 |
| | 207,037 |
| | (8,384 | ) | | (4 | )% |
| Investments in tax credit and other investments, net | | 268,330 |
| | 254,140 |
| | 14,190 |
| | 6 | % |
| Premises and equipment | | 115,393 |
| | 118,364 |
| | (2,971 | ) | | (3 | )% |
| Goodwill | | 465,697 |
| | 465,697 |
| | — |
| | — | % |
| Operating lease right-of-use assets | | 101,381 |
| | 99,973 |
| | 1,408 |
| | 1 | % |
| Other assets | | 1,452,868 |
| | 917,095 |
| | 535,773 |
| | 58 | % |
| TOTAL | | $ | 45,948,545 |
| | $ | 44,196,096 |
| | $ | 1,752,449 |
| | 4 | % |
| LIABILITIES | | | | | | | | |
| Noninterest-bearing | | $ | 11,833,397 |
| | $ | 11,080,036 |
| | $ | 753,361 |
| | 7 | % |
| Interest-bearing | | 26,853,561 |
| | 26,244,223 |
| | 609,338 |
| | 2 | % |
| Total deposits | | 38,686,958 |
| | 37,324,259 |
| | 1,362,699 |
| | 4 | % |
| Short-term borrowings | | 66,924 |
| | 28,669 |
| | 38,255 |
| | 133 | % |
| FHLB advances | | 646,336 |
| | 745,915 |
| | (99,579 | ) | | (13 | )% |
| Repurchase agreements | | 450,000 |
| | 200,000 |
| | 250,000 |
| | 125 | % |
| Long-term debt and finance lease liabilities | | 152,162 |
| | 152,270 |
| | (108 | ) | | (0)% |
|
| Operating lease liabilities | | 109,356 |
| | 108,083 |
| | 1,273 |
| | 1 | % |
| Accrued expenses and other liabilities | | 933,824 |
| | 619,283 |
| | 314,541 |
| | 51 | % |
| Total liabilities | | 41,045,560 |
| | 39,178,479 |
| | 1,867,081 |
| | 5 | % |
| STOCKHOLDERS’ EQUITY | | 4,902,985 |
| | 5,017,617 |
| | (114,632 | ) | | (2 | )% |
| TOTAL | | $ | 45,948,545 |
| | $ | 44,196,096 |
| | $ | 1,752,449 |
| | 4 | % |
| |
As of June 30, 2019,March 31, 2020, total assets were $42.89$45.95 billion, an increase of $1.85$1.75 billion or 5%4% from December 31, 2018,2019, primarily due to well-diversified loan portfolio growth and an increase in cash and cash equivalents.AFS debt securities. The loan portfolio growth was driven by strong increases in C&I, CRE, as well as single-family residential CRE, and C&I loans. Total assets increase was also partially due to the Company’s adoption of ASU 2016-02, Leases (Topic 842), in which $109.0 million in operating lease right-of-use assets was recorded on the Consolidated Balance Sheet as of June 30, 2019. These increases were partially offset by decreases in interest-bearing deposits with banks and available-for-sale investment securities.
As of June 30, 2019,March 31, 2020, total liabilities were $38.16$41.05 billion, an increase of $1.54$1.87 billion or 4%5% from December 31, 2018,2019, primarily due to a $1.04 billionan increase in deposits, and $418.9 million increase in FHLB advances. The increase in depositswhich was largely driven by increases in time and interest-bearing checking deposits, partially offset by a decline in noninterest-bearing demand deposits. In addition, $117.4 million in operating lease liabilities were recorded as a result of the Company’s adoption of ASU 2016-02, Leases (Topic 842).and money market accounts.
As of June 30, 2019,March 31, 2020, total stockholders’ equity was $4.73$4.90 billion, an increasea decrease of $310.6$114.6 million or 7%2% from December 31, 2018.2019. This increasedecrease was primarily driven by stock repurchase transactions and a cumulative-effect adjustment to retained earnings due to an increasethe adoption of $314.4 million in net income,ASU 2016-13, partially offset by $74.3 millionfirst quarter of cash dividends declared on common stock.2020 net income.
Debt Securities
The Company maintains an investmenta debt securities portfolio that consists of high quality and liquid securities with relatively short durations to minimize overall interest rate and liquidity risks. The Company’s available-for-sale investmentAFS debt securities provide:
interest income for earnings and yield enhancement;
availability for funding needs that arisearising during the normal course of business;
the ability to execute interest rate risk management strategies in response to changes in economic or market conditions, which could influence loan origination, prepayment speeds, or deposit balances and mix;conditions; and
collateral to support pledging agreements as required and/or to enhance the Company’s borrowing capacity.
Available-for-Sale InvestmentDebt Securities
As of June 30, 2019March 31, 2020 and December 31, 2018,2019, the Company’s available-for-sale investmentAFS debt securities portfolio was primarily composedconsisted of mortgage-backed securities and debt securities issued by U.S. government agency and U.S. government sponsored enterprise mortgage-backed securities,government-sponsored enterprises, foreign bonds, collateralized loan obligations (“CLOs”), and U.S. Treasury securities and foreign bonds. Investmentsecurities. Debt securities classified as available-for-saleAFS are carried at their fair value with the corresponding changes in fair value recorded in Accumulated other comprehensive loss, net of tax, as a component of Stockholders’ equity on the Consolidated Balance Sheet.
The following table presents the amortized cost and fair value of AFS debt securities by major categories of available-for-sale investment securities as of June 30, 2019March 31, 2020 and December 31, 2018:2019:
| | | | ($ in thousands) | | June 30, 2019 | | December 31, 2018 | | March 31, 2020 | | December 31, 2019 |
| | Amortized Cost | | Fair Value | | Amortized Cost | | Fair Value | | Amortized Cost | | Fair Value | | Amortized Cost | | Fair Value |
| Available-for-sale investment securities: | | | | | | | | | |
| AFS debt securities: | | | | | | | | | |
| U.S. Treasury securities | | $ | 329,209 |
| | $ | 326,535 |
| | $ | 577,561 |
| | $ | 564,815 |
| | $ | 50,606 |
| | $ | 51,428 |
| | $ | 177,215 |
| | $ | 176,422 |
|
| U.S. government agency and U.S. government sponsored enterprise debt securities | | 239,732 |
| | 241,967 |
| | 219,485 |
| | 217,173 |
| |
| U.S. government agency and U.S. government sponsored enterprise mortgage-backed securities | | 1,307,946 |
| | 1,318,406 |
| | 1,377,705 |
| | 1,355,296 |
| |
| U.S. government agency and U.S. government-sponsored enterprise debt securities | | | 511,176 |
| | 518,408 |
| | 584,275 |
| | 581,245 |
|
| U.S. government agency and U.S. government-sponsored enterprise mortgage-backed securities | | | 1,993,653 |
| | 2,050,315 |
| | 1,598,261 |
| | 1,607,368 |
|
| Municipal securities | | 86,776 |
| | 87,529 |
| | 82,965 |
| | 82,020 |
| | 300,551 |
| | 309,626 |
| | 101,621 |
| | 102,302 |
|
| Non-agency mortgage-backed securities | | 93,209 |
| | 95,088 |
| | 35,935 |
| | 35,983 |
| | 149,955 |
| | 149,248 |
| | 133,439 |
| | 135,098 |
|
| Corporate debt securities | | 11,250 |
| | 11,156 |
| | 11,250 |
| | 10,869 |
| | 11,250 |
| | 10,963 |
| | 11,250 |
| | 11,149 |
|
Foreign bonds | | 489,392 |
| | 484,416 |
| | 489,378 |
| | 463,048 |
| | 283,822 |
| | 284,521 |
| | 354,481 |
| | 354,172 |
|
| Asset-backed securities | | 27,991 |
| | 27,816 |
| | 12,621 |
| | 12,643 |
| | 65,400 |
| | 61,556 |
| | 66,106 |
| | 64,752 |
|
| Total available-for-sale investment securities | | $ | 2,585,505 |
| | $ | 2,592,913 |
| | $ | 2,806,900 |
| | $ | 2,741,847 |
| |
| CLOs | | | 294,000 |
| | 259,878 |
| | 294,000 |
| | 284,706 |
|
| Total AFS debt securities | | | $ | 3,660,413 |
| | $ | 3,695,943 |
| | $ | 3,320,648 |
| | $ | 3,317,214 |
|
|
(1) There were no securities of a single non-governmental agency issuer that exceeded 10% of stockholder’s equity as of both March 31, 2020 and December 31, 2019.
The fair value of available-for-sale investmentAFS debt securities totaled $2.59$3.70 billion as of June 30, 2019,March 31, 2020, compared to $2.74with $3.32 billion as of December 31, 2018.2019. The $148.9$378.7 million or 5% decrease11% increase was primarily attributable to the purchases of U.S. government agency and U.S. government-sponsored enterprise mortgage-backed securities, and municipal securities; partially offset by the sales, repayments, and maturities of U.S. Treasury securities, and U.S. government agency and U.S. government sponsored enterprise mortgage-backed securities, partially offset by purchases of U.S. government agency and U.S. government sponsoredgovernment-sponsored enterprise mortgage-backed securities, U.S. government agency and U.S. government sponsoredgovernment-sponsored enterprise debt securities, foreign bonds, and non-agency mortgage-backU.S treasury securities.
The Company’s investmentdebt securities portfolio had an effective duration of 2.92.7 years as of June 30, 2019 compared to 4.1March 31, 2020, which shortened from 3.1 years as of December 31, 2018,2019, primarily due to the decline in interest rates. In addition, the spread between central government-guaranteed securities and private issuers widened, as relatively higher risk premiums were paid for securities issued by private entities. As of June 30, 2019March 31, 2020 and December 31, 2018, 98%2019, 96% and 99%97%, respectively, of the carrying value of the investmentCompany’s debt securities portfolio was rated “AA-” or “Aa3” or higher by nationally recognized statisticalcredit rating organizations.agencies. Credit ratings of BBB- or higher by Standard and Poor’s (“S&P”) and Fitch Ratings (“Fitch”), or Baa3 or higher by Moody’s Investors Service (“Moody’s”), are considered investment grade.
As
The Company’s AFS debt securities are carried at fair value with noncredit-related unrealized gains and losses, net of June 30, 2019,tax, reported in Other comprehensive income (loss) on the Company’sConsolidated Statement of Comprehensive Income. If a credit loss exists, the Company records impairment related to credit losses through allowance for credit losses with a corresponding Provision for credit losses on the Consolidated Statement of Income. Pre-tax net unrealized gains on available-for-sale investmentAFS debt securities were $7.4$35.5 million as of March 31, 2020, which increasedimproved from net unrealized losses of $65.1$3.4 million as of December 31, 2018,2019. This change was primarily due to the decrease in interest rates. rates during the period, partially offset by increased spreads.
Gross unrealized losses on available-for-sale investmentAFS debt securities totaled $13.8$48.8 million as of June 30, 2019,March 31, 2020, compared to $70.8with $23.2 million as of December 31, 2018.2019. Of the securities with gross unrealized losses, approximately 99% and 100%substantially all were rated investment grade as of June 30, 2019both March 31, 2020 and December 31, 2018, respectively,2019, as classified primarily based upon the lowest of the credit ratings issued by S&P, Moody’s, or Fitch. The Company believes that the gross unrealized losses were due to non-credit related factors and the gross unrealized losses acrossall major security types were primarily attributable to widened spreads arising from the negative outlook and uncertainty as a result of the COVID-19 pandemic, and yield curve movement. The Company believes that the credit support levels of the AFS debt securities are strong and, based on current assessments and macroeconomic forecasts, expects that full contractual cash flows will be received, even if the credit performance deteriorates from the impact of the COVID-19 pandemic. The debt securities issued by the U.S. Treasury and U.S. government agencies are backed by the full faith and credit of the U.S. government, and the U.S. government-sponsored debt securities have the implicit guarantee of the U.S. government. Further, the Company’s portfolio of debt securities issued by supranational organizations are AAA-rated and have strong financial profiles. Based on current assessments and economic outcome expectations, the Company believes that the private entity issuers of CLOs, corporate bonds and asset-backed securities continue to have strong credit profiles or have issued securities with strong credit profiles, and that the securities issued by municipalities continue to have strong credit profiles.
As of June 30, 2019,March 31, 2020, the Company had no intention to sell securities with unrealized losses and believed it is more-likely-than-not that it would not be required to sell such securities before recovery of their amortized cost.
The Company assesses individual securities for OTTIcredit losses for each reporting period. There were no credit losses recognized in earnings for the first quarter of 2020, and no OTTI credit losses recognized in earnings for the secondfirst quarter as well as the first half of both 2019 and 2018.2019. For additional information on ourof the Company’s accounting policies, valuation and composition, see Note 1— Summary of Significant Accounting Policies in the Company’s 2018 Form 10-K, Note 43 — Fair Value Measurement and Fair Value of Financial Instruments and Note 65 — Securities to the Consolidated Financial Statements in this Form 10-Q, respectively.10-Q.
The following table presents the weighted-average yields and contractual maturity distribution, excluding periodic principal payments, of the Company’s investmentdebt securities as of June 30, 2019March 31, 2020 and December 31, 2018.2019. Actual maturities of the investmentmortgage-backed securities can differ from contractual maturities dueas the borrowers have the right to prepaymentsprepay obligations with or embedded call options.without prepayment penalties. In addition, factors such as prepayments and interest rate changesrates may affect the yields on the carrying valuevalues of the investmentmortgage-backed securities.
| | | | ($ in thousands) | | June 30, 2019 | | December 31, 2018 | | March 31, 2020 | | December 31, 2019 |
| | Amortized
Cost | | Fair Value | | Yield (1) | | Amortized
Cost | | Fair Value | | Yield (1) | | Amortized
Cost | | Fair Value | | Yield (1) | | Amortized
Cost | | Fair Value | | Yield (1) |
| Available-for-sale investment securities: | | | | | | | | | | | | | |
| AFS debt securities: | | | | | | | | | | | | | |
| U.S. Treasury securities: | | | | | | | | | | | | | | | | | | | | | | | | |
| Maturing in one year or less | | $ | — |
| | $ | — |
| | — | % | | $ | 50,134 |
| | $ | 49,773 |
| | 1.08 | % | |
| Maturing after one year through five years | | 329,209 |
| | 326,535 |
| | 1.39 | % | | 527,427 |
| | 515,042 |
| | 1.69 | % | | $ | 50,606 |
| | $ | 51,428 |
| | 1.26 | % | | $ | 177,215 |
| | $ | 176,422 |
| | 1.33 | % |
| Total | | 329,209 |
| | 326,535 |
| | 1.39 | % | | 577,561 |
| | 564,815 |
| | 1.64 | % | |
| U.S. government agency and U.S. government sponsored enterprise debt securities: | | | | | | | | | | | | | |
| U.S. government agency and U.S. government- sponsored enterprise debt securities: | | | | | | | | | | | | | |
| Maturing in one year or less | | 72,573 |
| | 72,597 |
| | 3.10 | % | | 26,955 |
| | 26,909 |
| | 3.51 | % | | 288,314 |
| | 289,634 |
| | 2.86 | % | | 328,628 |
| | 326,341 |
| | 2.62 | % |
| Maturing after one year through five years | | 11,537 |
| | 11,600 |
| | 2.38 | % | | 10,181 |
| | 10,037 |
| | 2.18 | % | | 161,997 |
| | 165,790 |
| | 2.69 | % | | 158,490 |
| | 156,431 |
| | 2.69 | % |
| Maturing after five years through ten years | | 100,231 |
| | 100,927 |
| | 2.21 | % | | 114,771 |
| | 113,812 |
| | 2.30 | % | | 27,469 |
| | 28,310 |
| | 2.51 | % | | 44,908 |
| | 45,189 |
| | 2.38 | % |
| Maturing after ten years | | 55,391 |
| | 56,843 |
| | 2.77 | % | | 67,578 |
| | 66,415 |
| | 2.79 | % | | 33,396 |
| | 34,674 |
| | 2.87 | % | | 52,249 |
| | 53,284 |
| | 2.78 | % |
| Total | | 239,732 |
| | 241,967 |
| | 2.61 | % | | 219,485 |
| | 217,173 |
| | 2.59 | % | | 511,176 |
| | 518,408 |
| | 2.79 | % | | 584,275 |
| | 581,245 |
| | 2.63 | % |
| U.S. government agency and U.S. government sponsored enterprise mortgage-backed securities: | | | | | | | | | | | | | |
| U.S. government agency and U.S. government- sponsored enterprise mortgage-backed securities: | | | | | | | | | | | | | |
| Maturing in one year or less | | 2,617 |
| | 2,608 |
| | 1.64 | % | | 2,633 |
| | 2,600 |
| | 1.62 | % | | 67 |
| | 67 |
| | 2.65 | % | | 112 |
| | 113 |
| | 2.72 | % |
| Maturing after one year through five years | | 29,257 |
| | 29,404 |
| | 2.20 | % | | 30,808 |
| | 30,487 |
| | 2.11 | % | | 21,784 |
| | 22,664 |
| | 2.57 | % | | 23,144 |
| | 23,289 |
| | 2.29 | % |
| Maturing after five years through ten years | | 80,636 |
| | 82,858 |
| | 2.70 | % | | 96,822 |
| | 95,365 |
| | 2.68 | % | | 100,151 |
| | 104,356 |
| | 2.70 | % | | 85,970 |
| | 88,261 |
| | 2.72 | % |
| Maturing after ten years | | 1,195,436 |
| | 1,203,536 |
| | 2.69 | % | | 1,247,442 |
| | 1,226,844 |
| | 2.74 | % | | 1,871,651 |
| | 1,923,228 |
| | 2.57 | % | | 1,489,035 |
| | 1,495,705 |
| | 2.66 | % |
| Total | | 1,307,946 |
| | 1,318,406 |
| | 2.68 | % | | 1,377,705 |
| | 1,355,296 |
| | 2.72 | % | | 1,993,653 |
| | 2,050,315 |
| | 2.58 | % | | 1,598,261 |
| | 1,607,368 |
| | 2.66 | % |
Municipal securities (2): | | | | | | | | | | | | | | | | | | | | | | | | |
| Maturing in one year or less | | 30,240 |
| | 30,353 |
| | 3.01 | % | | 29,167 |
| | 28,974 |
| | 2.60 | % | | 61,375 |
| | 61,670 |
| | 2.74 | % | | 37,136 |
| | 37,291 |
| | 2.67 | % |
| Maturing after one year through five years | | 34,989 |
| | 35,206 |
| | 2.32 | % | | 48,398 |
| | 47,681 |
| | 2.39 | % | | 15,569 |
| | 15,803 |
| | 2.50 | % | | 18,699 |
| | 18,948 |
| | 2.52 | % |
| Maturing after five years through ten years | | 12,250 |
| | 12,672 |
| | 3.15 | % | | 500 |
| | 476 |
| | 2.38 | % | | 112,946 |
| | 119,391 |
| | 2.87 | % | | 12,151 |
| | 12,451 |
| | 3.15 | % |
| Maturing after ten years | | 9,297 |
| | 9,298 |
| | 4.26 | % | | 4,900 |
| | 4,889 |
| | 5.03 | % | | 110,661 |
| | 112,762 |
| | 3.44 | % | | 33,635 |
| | 33,612 |
| | 2.63 | % |
| Total | | 86,776 |
| | 87,529 |
| | 2.89 | % | | 82,965 |
| | 82,020 |
| | 2.62 | % | | 300,551 |
| | 309,626 |
| | 3.04 | % | | 101,621 |
| | 102,302 |
| | 2.69 | % |
| Non-agency mortgage-backed securities: | | | | | | | | | | | | | | | | | | | | | | | | |
| Maturing in one year or less | | | 7,920 |
| | 7,859 |
| | 2.82 | % | | — |
| | — |
| | — | % |
| Maturing after one year through five years | | 7,920 |
| | 7,916 |
| | 4.08 | % | | — |
| | — |
| | — | % | | — |
| | — |
| | — | % | | 7,920 |
| | 7,914 |
| | 3.78 | % |
| Maturing after ten years | | 85,289 |
| | 87,172 |
| | 3.37 | % | | 35,935 |
| | 35,983 |
| | 3.67 | % | | 142,035 |
| | 141,389 |
| | 3.13 | % | | 125,519 |
| | 127,184 |
| | 3.21 | % |
| Total | | 93,209 |
| | 95,088 |
| | 3.43 | % | | 35,935 |
| | 35,983 |
| | 3.67 | % | | 149,955 |
| | 149,248 |
| | 3.11 | % | | 133,439 |
| | 135,098 |
| | 3.24 | % |
| Corporate debt securities: | | | | | | | | | | | | | | | | | | | | | | | | |
| Maturing in one year or less | | 1,250 |
| | 1,244 |
| | 5.69 | % | | 1,250 |
| | 1,231 |
| | 5.50 | % | | 1,250 |
| | 1,250 |
| | 5.01 | % | | 1,250 |
| | 1,262 |
| | 5.20 | % |
| Maturing after one year through five years | | 10,000 |
| | 9,912 |
| | 4.00 | % | | 10,000 |
| | 9,638 |
| | 4.00 | % | | 10,000 |
| | 9,713 |
| | 4.00 | % | | 10,000 |
| | 9,887 |
| | 4.00 | % |
| Total | | 11,250 |
| | 11,156 |
| | 4.19 | % | | 11,250 |
| | 10,869 |
| | 4.17 | % | | 11,250 |
| | 10,963 |
| | 4.11 | % | | 11,250 |
| | 11,149 |
| | 4.13 | % |
| Foreign bonds: | | | | | | | | | | | | | | | | | | | | | | | | |
| Maturing in one year or less | | 479,392 |
| | 474,503 |
| | 2.25 | % | | 439,378 |
| | 414,065 |
| | 2.19 | % | | 229,466 |
| | 229,981 |
| | 2.04 | % | | 354,481 |
| | 354,172 |
| | 2.22 | % |
| Maturing after one year through five years | | 10,000 |
| | 9,913 |
| | 4.02 | % | | 50,000 |
| | 48,983 |
| | 3.12 | % | | 54,356 |
| | 54,540 |
| | 2.29 | % | | — |
| | — |
| | — | % |
| Total | | 489,392 |
| | 484,416 |
| | 2.29 | % | | 489,378 |
| | 463,048 |
| | 2.28 | % | | 283,822 |
| | 284,521 |
| | 2.08 | % | | 354,481 |
| | 354,172 |
| | 2.22 | % |
| Asset-backed securities: | | | | | | | | | | | | | | | | | | | | | | | | |
| Maturing after ten years | | 27,991 |
| | 27,816 |
| | 2.81 | % | | 12,621 |
| | 12,643 |
| | 3.22 | % | | 65,400 |
| | 61,556 |
| | 2.16 | % | | 66,106 |
| | 64,752 |
| | 2.65 | % |
| Total available-for-sale investment securities | | $ | 2,585,505 |
| | $ | 2,592,913 |
| | 2.48 | % | | $ | 2,806,900 |
| | $ | 2,741,847 |
| | 2.43 | % | |
| CLOs: | | | | | | | | | | | | | |
| Maturing after ten years | | | 294,000 |
| | 259,878 |
| | 3.07 | % | | 294,000 |
| | 284,706 |
| | 3.08 | % |
| Total AFS debt securities | | | $ | 3,660,413 |
| | $ | 3,695,943 |
| | 2.65 | % | | $ | 3,320,648 |
| | $ | 3,317,214 |
| | 2.60 | % |
| | | | | | | | | | | | | | | | | | | | | | | | | |
| Total: | | | | | | | | | | | | | |
| Total aggregated by maturities: | | | | | | | | | | | | | |
| Maturing in one year or less | | $ | 586,072 |
| | $ | 581,305 |
| | 2.40 | % | | $ | 549,517 |
| | $ | 523,552 |
| | 2.18 | % | | $ | 588,392 |
| | $ | 590,461 |
| | 2.53 | % | | $ | 721,607 |
| | $ | 719,179 |
| | 2.43 | % |
| Maturing after one year through five years | | 432,912 |
| | 430,486 |
| | 1.72 | % | | 676,814 |
| | 661,868 |
| | 1.91 | % | | 314,312 |
| | 319,938 |
| | 2.42 | % | | 395,468 |
| | 392,891 |
| | 2.11 | % |
| Maturing after five years through ten years | | 193,117 |
| | 196,457 |
| | 2.47 | % | | 212,093 |
| | 209,653 |
| | 2.47 | % | | 240,566 |
| | 252,057 |
| | 2.76 | % | | 143,029 |
| | 145,901 |
| | 2.65 | % |
| Maturing after ten years | | 1,373,404 |
| | 1,384,665 |
| | 2.75 | % | | 1,368,476 |
| | 1,346,774 |
| | 2.78 | % | | 2,517,143 |
| | 2,533,487 |
| | 2.69 | % | | 2,060,544 |
| | 2,059,243 |
| | 2.76 | % |
| Total available-for-sale investment securities | | $ | 2,585,505 |
| | $ | 2,592,913 |
| | 2.48 | % | | $ | 2,806,900 |
| | $ | 2,741,847 |
| | 2.43 | % | |
| Total AFS debt securities | | | $ | 3,660,413 |
| | $ | 3,695,943 |
| | 2.65 | % | | $ | 3,320,648 |
| | $ | 3,317,214 |
| | 2.60 | % |
|
| |
| (1) | Weighted-average yields are computed based on amortized cost balances. |
| |
| (2) | Yields on tax-exempt securities are not presented on a tax-equivalent basis. |
Total Loan Portfolio
Loan Portfolio
The Company offers a broad range of financial products designed to meet the credit needs of its borrowers. The Company’s loan portfolio segments include commercial loans, comprisingwhich consist of C&I, CRE, multifamily residential, and construction and land loans,loans; and consumer loans, comprisingwhich consist of single-family residential, home equity lines of credit (“HELOCs”) and other consumer loans. Total net loans, including loans held-for-sale, were $33.40$35.34 billion as of June 30, 2019,March 31, 2020, an increase of $1.33 billion$917.3 million or 4%,3% from $32.07$34.42 billion as of December 31, 2018.2019. This was primarily driven by increases of $458.2$439.8 million or 8%4% in single-family residentialC&I loans, $418.6$403.8 million or 4% in CRE loans and $349.9$296.3 million or 3%4% in C&Isingle-family residential loans. The composition of the loan portfolio was stable as of June 30, 2019 comparedMarch 31, 2020 was similar to the composition as of December 31, 2018.2019.
The following table presents the composition of the Company’s total loan portfolio by segmentloan type as of June 30, 2019March 31, 2020 and December 31, 2018:2019:
| | | | ($ in thousands) | | June 30, 2019 | | December 31, 2018 | | March 31, 2020 | | December 31, 2019 |
| | Amount (1) | | % | | Amount (1) | | % | | Amount (1) | | % | | Amount (1) | | % |
| Commercial: | | | | | | | | | | | | | | | | |
| C&I | | $ | 12,402,967 |
| | 37 | % | | $ | 12,056,970 |
| | 37 | % | | $ | 12,590,764 |
| | 35 | % | | $ | 12,150,931 |
| | 35 | % |
| CRE: | | | | |
|
| | | | |
| CRE | | 9,868,433 |
| | 29 | % | | 9,449,835 |
| | 29 | % | | 10,682,242 |
| | 30 | % | | 10,278,448 |
| | 30 | % |
| Multifamily residential | | 2,372,345 |
| | 7 | % | | 2,281,032 |
| | 7 | % | | 2,902,601 |
| | 8 | % | | 2,856,374 |
| | 8 | % |
| Construction and land | | 674,798 |
| | 2 | % | | 538,794 |
| | 2 | % | | 606,209 |
| | 2 | % | | 628,499 |
| | 2 | % |
| Total CRE | | | 14,191,052 |
| | 40 | % | | 13,763,321 |
| | 40 | % |
| Total commercial | | 25,318,543 |
| | 75 | % | | 24,326,631 |
| | 75 | % | | 26,781,816 |
| | 75 | % | | 25,914,252 |
| | 75 | % |
| Consumer: | | | | | | | | | | | | | | | | |
| Residential mortgage: | | | | | | | | | |
| Single-family residential | | 6,494,882 |
| | 19 | % | | 6,036,454 |
| | 19 | % | | 7,403,723 |
| | 20 | % | | 7,108,590 |
| | 20 | % |
| HELOCs | | 1,575,150 |
| | 5 | % | | 1,690,834 |
| | 5 | % | | 1,452,862 |
| | 4 | % | | 1,472,783 |
| | 4 | % |
| Total residential mortgage | | | 8,856,585 |
| | 24 | % | | 8,581,373 |
| | 24 | % |
| Other consumer | | 341,802 |
| | 1 | % | | 331,270 |
| | 1 | % | | 254,992 |
| | 1 | % | | 282,914 |
| | 1 | % |
| Total consumer | | 8,411,834 |
| | 25 | % | | 8,058,558 |
| | 25 | % | — |
| 9,111,577 |
| | 25 | % | | 8,864,287 |
| | 25 | % |
Total loans held-for-investment (2) | | $ | 33,730,377 |
| | 100 | % | | $ | 32,385,189 |
| | 100 | % | |
| Total loans held-for-investment | | | $ | 35,893,393 |
| | 100 | % | | $ | 34,778,539 |
| | 100 | % |
| Allowance for loan losses | | (330,625 | ) | | | | (311,322 | ) | | | | (557,003 | ) | | | | (358,287 | ) | | |
| Loans held-for-sale | | 3,879 |
| | | | 275 |
| | | |
Loans held-for-sale (2) | | | 1,594 |
| | | | 434 |
| | |
| Total loans, net | | $ | 33,403,631 |
| | | | $ | 32,074,142 |
| | | | $ | 35,337,984 |
| | | | $ | 34,420,686 |
| | |
|
| |
| (1) | IncludesOn January 1, 2020, the Company adopted ASU 2016-13. Total loans include net deferred loan fees, unearned fees, unamortized premiums and unaccreted discounts of $(43.8)$(50.3) million and $(48.9)$(43.2) million as of June 30, 2019March 31, 2020 and December 31, 2018,2019, respectively. |
| |
| (2) | Includes ASC 310-30 discountConsists of $18.9 million and $22.2 millionsingle-family residential loans as of June 30, 2019both March 31, 2020 and December 31, 2018, respectively.2019. |
Commercial
The Company’s commercial loan portfolio, consisted ofwhich comprised 75% of the total loans as of both June 30, 2019March 31, 2020 and December 31, 2018, and2019, is discussed below.as follows.
Commercial — Commercial and Industrial Loans. C&I loans which totaled $12.40$12.59 billion and $12.06$12.15 billion as of June 30, 2019March 31, 2020 and December 31, 2018,2019, respectively, and accounted for 37%35% of total loans as of both dates. The majority of the C&I loans have variable interest rates. The C&I loan portfolio was well-diversified by industry, with concentrationsincludes loans and financing for businesses in the private equity, wholesalea wide spectrum of industries, and includes asset-based lending, equipment financing and leasing, project-based finance, revolving lines of credit, SBA lending, structured finance, term loans and trade manufacturing, energy and entertainment. The Company’s wholesale trade exposure largely consists of U.S. domiciled companies, many of which are based in California, that import goods from Greater China for U.S. consumer consumption.finance. The Company also had a portfolio of broadly syndicated C&I termloans, comprised primarily of Term B loans, which totaled $930.2$962.1 million and $778.7$894.6 million as of June 30, 2019March 31, 2020 and December 31, 2018,2019, respectively.
The C&I portfolio is well-diversified by industry. The Company monitors the concentrations within the C&I loan portfolio by customer exposure and industry classifications,classification, setting diversification targets and limits for specialized portfoliosunderwriting portfolios. The Company’s exposure to C&I borrowers that are potentially more impacted by the economic disruption stemming from COVID-19 pandemic include those in the travel and diversification targets.leisure, hospitality, restaurant and restaurant supply industries. These exposures are included in the Other C&I category in the graphs below. Combined, these industries represented 4% of total C&I loans as of both March 31, 2020 and December 31, 2019. There were no industry concentrations exceeding 10% of total loans as of both March 31, 2020 and December 31, 2019.
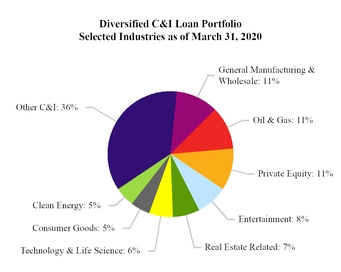

Oil & gas loans comprised 11% of C&I loans and 4% of total loans as of both March 31, 2020 and December 31, 2019. As of March 31, 2020, oil & gas total loans outstanding were $1.37 billion and total exposure, including unfunded commitments, amounted to $1.77 billion. Based on total exposure, 64% of the oil & gas portfolio was reserve-based lending to upstream (exploration and production) companies, 27% was to midstream and downstream companies, and 9% was to companies in oilfield services and other. The oil & gas lending portfolio is geographically diversified. The production mix of upstream borrowers was approximately 61% oil, 29% gas and 10% natural gas liquids in 2019. The majority of the C&Iupstream borrowers had commodity hedges in place for 2020 to hedge against the fluctuation in oil and gas prices. The COVID-19 pandemic, as well as the high volatility and downward pressure on oil and gas prices, has impacted the credit risk of the oil & gas industry sector. Accordingly, the Company increased its allowance for loan loss coverage against the oil & gas portfolio to 8% as of March 31, 2020, up from 5% as of December 31, 2019.
Commercial — Total Commercial Real Estate Portfolio. The totalCRE loan portfolio, which consists of income-producing CRE, multifamily residential, and construction and land loans, totaled $14.19 billion and $13.76 billion as of March 31, 2020 and December 31, 2019, respectively, accounting for 40% of total loans as of both dates.
As of March 31, 2020, the average loan size of total CRE loans was $2.3 million and the weighted-average loan-to-value (“LTV”) ratio was 51%. As of December 31, 2019, the average loan size of total CRE loans was $2.1 million and the weighted-average LTV ratio was 50%. The consistency of the Company’s low LTV underwriting standards have variable interest rates.resulted in historically lower levels of credit losses in the income-producing CRE and multifamily residential loans.
The Company’s total CRE portfolio is broadly diversified by property type, which serves to mitigate some of the geographical concentration in California. The following table summarizes the Company’s total CRE loan portfolio by property type as of March 31, 2020 and December 31, 2019: |
| | | | | | | | | | | | | | |
| |
| ($ in thousands) | | March 31, 2020 | | December 31, 2019 |
| | Amount | | % | | Amount | | % |
| Property types: | | | | | | | | |
| Retail | | $ | 3,398,714 |
| | 24 | % | | $ | 3,300,106 |
| | 24 | % |
| Multifamily | | 2,902,601 |
| | 20 | % | | 2,856,374 |
| | 21 | % |
| Offices | | 2,496,013 |
| | 18 | % | | 2,375,087 |
| | 17 | % |
| Industrial | | 2,240,375 |
| | 16 | % | | 2,163,769 |
| | 16 | % |
| Hospitality | | 1,970,060 |
| | 14 | % | | 1,865,031 |
| | 14 | % |
| Construction and land | | 606,209 |
| | 4 | % | | 628,499 |
| | 4 | % |
| Other | | 577,080 |
| | 4 | % | | 574,455 |
| | 4 | % |
| Total CRE loans | | $ | 14,191,052 |
| | 100 | % | | $ | 13,763,321 |
| | 100 | % |
| |
The weighted average LTV ratio of retail CRE loan was 49% as of March 31, 2020, and the average loan size was $2.1 million. A high percentage of the retail CRE loans have personal guarantees from individuals with substantial net worth. Restaurants are a subset of retail CRE portfolio, and totaled $206.8 million or 6% of retail CRE as of March 31, 2020. The weighted average LTV ratio of restaurant loans was 53% and the average loan size was less than $1.0 million as of March 31, 2020. The weighted average LTV ratio of hospitality CRE loans was 49% as of March 31, 2020, and the average loan size was $8.3 million.
The following tables provide a summary of the Company’s CRE, multifamily residential, and construction and land loans by geography as of March 31, 2020 and December 31, 2019:
|
| | | | | | | | | | | | | | | | | | | | | | | | | | | | |
| |
| ($ in thousands) | | March 31, 2020 |
| | CRE | | % | | Multifamily
Residential | | % | | Construction
and Land | | % | | Total CRE | | % |
| Geographic markets: | | | | | | | | | | | | | | | | |
| Southern California | | $ | 5,676,895 |
| | | | $ | 1,755,651 |
| | | | $ | 269,590 |
| | | | $ | 7,702,136 |
| | |
| Northern California | | 2,476,697 |
| | | | 629,468 |
| | | | 179,652 |
| | | | 3,285,817 |
| | |
| California | | 8,153,592 |
| | 76 | % | | 2,385,119 |
| | 82 | % | | 449,242 |
| | 74 | % | | 10,987,953 |
| | 77 | % |
| New York | | 689,547 |
| | 6 | % | | 123,989 |
| | 4 | % | | 84,042 |
| | 14 | % | | 897,578 |
| | 6 | % |
| Texas | | 662,119 |
| | 6 | % | | 129,458 |
| | 5 | % | | 8,525 |
| | 1 | % | | 800,102 |
| | 6 | % |
| Washington | | 308,878 |
| | 3 | % | | 65,521 |
| | 2 | % | | 31,332 |
| | 5 | % | | 405,731 |
| | 3 | % |
| Arizona | | 162,359 |
| | 2 | % | | 11,946 |
| | 0 | % | | — |
| | — | % | | 174,305 |
| | 1 | % |
| Nevada | | 103,696 |
| | 1 | % | | 138,766 |
| | 5 | % | | 39 |
| | 0 | % | | 242,501 |
| | 2 | % |
| Other markets | | 602,051 |
| | 6 | % | | 47,802 |
| | 2 | % | | 33,029 |
| | 6 | % | | 682,882 |
| | 5 | % |
| Total loans | | $ | 10,682,242 |
| | 100 | % | | $ | 2,902,601 |
| | 100 | % | | $ | 606,209 |
| | 100 | % | | $ | 14,191,052 |
| | 100 | % |
| |
|
| | | | | | | | | | | | | | | | | | | | | | | | | | | | |
| |
| ($ in thousands) | | December 31, 2019 |
| | CRE | | % | | Multifamily
Residential | | % | | Construction
and Land | | % | | Total CRE | | % |
| Geographic markets: | | | | | | | | | | | | | | | | |
| Southern California | | $ | 5,446,786 |
| | | | $ | 1,728,086 |
| | | | $ | 247,170 |
| | | | $ | 7,422,042 |
| | |
| Northern California | | 2,359,808 |
| | | | 603,135 |
| | | | 203,706 |
| | | | 3,166,649 |
| | |
| California | | 7,806,594 |
| | 76 | % | | 2,331,221 |
| | 82 | % | | 450,876 |
| | 72 | % | | 10,588,691 |
| | 77 | % |
| New York | | 701,902 |
| | 7 | % | | 116,923 |
| | 4 | % | | 79,962 |
| | 13 | % | | 898,787 |
| | 7 | % |
| Texas | | 628,576 |
| | 6 | % | | 124,646 |
| | 4 | % | | 8,604 |
| | 1 | % | | 761,826 |
| | 6 | % |
| Washington | | 306,247 |
| | 3 | % | | 55,913 |
| | 2 | % | | 37,552 |
| | 6 | % | | 399,712 |
| | 3 | % |
| Arizona | | 149,151 |
| | 1 | % | | 37,208 |
| | 1 | % | | 6,951 |
| | 1 | % | | 193,310 |
| | 1 | % |
| Nevada | | 102,891 |
| | 1 | % | | 138,577 |
| | 5 | % | | 40 |
| | 0 | % | | 241,508 |
| | 2 | % |
| Other markets | | 583,087 |
| | 6 | % | | 51,886 |
| | 2 | % | | 44,514 |
| | 7 | % | | 679,487 |
| | 4 | % |
Total loans (1) | | $ | 10,278,448 |
| | 100 | % | | $ | 2,856,374 |
| | 100 | % | | $ | 628,499 |
| | 100 | % | | $ | 13,763,321 |
| | 100 | % |
| |
Changes in California’s economy and real estate values could have a significant impact on the collectability of these loans and the required level of allowance for loan losses. A high percentage of the Company’s commercial real estate borrowers have provided substantial equity into their CRE loans and/or provided the Company with personal guarantees.
Commercial — Commercial Real Estate Loans. Income-producing CRE loans which totaled $9.87$10.68 billion and $9.45$10.28 billion as of June 30, 2019March 31, 2020 and December 31, 2018,2019, respectively, and accounted for 29%30% of total loans as of both dates. The Company focuses on providing financing to experienced real estate investors and developers who have moderate levels of leverage, many of whom are long-time customers.customers of the Bank. Loans are underwritten with highconservative standards for cash flows, debt service coverage and loan-to-value. LTV.
As of both June 30, 2019March 31, 2020 and December 31, 2018,2019, 19% and 20%, respectively, of the totalincome-producing CRE loans were owner occupied properties; the remainder were non-owner occupied properties where 50% or more of the debt service for the loan is primarily provided by unaffiliated rental income from a third party. TheInterest rates on CRE loan portfolio’s interest ratesloans may be fixed, variable or hybrid.
The following tables summarizedistribution of the Company’s CRE multifamily residential, and construction and land loans by geographic market as of June 30, 2019 and December 31, 2018:
|
| | | | | | | | | | | | | | | | | | | | | | | | | | | | |
| |
| ($ in thousands) | | June 30, 2019 |
| | CRE | | % | | Multifamily
Residential | | % | | Construction
and Land | | % | | Total | | % |
| Geographic markets: | | | | | | | | | | | | | | | | |
| Southern California | | $ | 5,321,180 |
| | | | $ | 1,411,172 |
| | | | $ | 257,576 |
| | | | $ | 6,989,928 |
| |
|
|
| Northern California | | 2,342,765 |
| | | | 577,440 |
| | | | 137,700 |
| | | | 3,057,905 |
| |
|
|
| California | | 7,663,945 |
| | 78 | % | | 1,988,612 |
| | 84 | % | | 395,276 |
| | 59 | % | | 10,047,833 |
| | 78 | % |
| New York | | 669,462 |
| | 7 | % | | 97,231 |
| | 4 | % | | 87,456 |
| | 13 | % | | 854,149 |
| | 7 | % |
| Texas | | 531,176 |
| | 5 | % | | 117,233 |
| | 5 | % | | 9,633 |
| | 1 | % | | 658,042 |
| | 5 | % |
| Washington | | 296,420 |
| | 3 | % | | 57,781 |
| | 2 | % | | 42,829 |
| | 6 | % | | 397,030 |
| | 3 | % |
| Arizona | | 129,054 |
| | 1 | % | | 25,982 |
| | 1 | % | | 21,681 |
| | 3 | % | | 176,717 |
| | 1 | % |
| Nevada | | 96,799 |
| | 1 | % | | 35,454 |
| | 1 | % | | 78,262 |
| | 12 | % | | 210,515 |
| | 2 | % |
| Other markets | | 481,577 |
| | 5 | % | | 50,052 |
| | 3 | % | | 39,661 |
| | 6 | % | | 571,290 |
| | 4 | % |
Total loans (1) | | $ | 9,868,433 |
| | 100 | % | | $ | 2,372,345 |
| | 100 | % | | $ | 674,798 |
| | 100 | % | | $ | 12,915,576 |
| | 100 | % |
| | | | | |
|
| | | | | | | | | | | | | | | | | | | | | | | | | | | | |
| |
| ($ in thousands) | | December 31, 2018 |
| | CRE | | % | | Multifamily
Residential | | % | | Construction
and Land | | % | | Total | | % |
| Geographic markets: | | | | | | | | | | | | | | | | |
| Southern California | | $ | 5,228,305 |
| | | | $ | 1,390,546 |
| | | | $ | 215,370 |
| | | | $ | 6,834,221 |
| |
|
|
| Northern California | | 2,168,055 |
| | | | 545,300 |
| | | | 133,828 |
| | | | 2,847,183 |
| |
|
|
| California | | 7,396,360 |
| | 79 | % | | 1,935,846 |
| | 85 | % | | 349,198 |
| | 65 | % | | 9,681,404 |
| | 79 | % |
| New York | | 659,026 |
| | 7 | % | | 103,324 |
| | 5 | % | | 46,702 |
| | 9 | % | | 809,052 |
| | 7 | % |
| Texas | | 509,375 |
| | 5 | % | | 71,683 |
| | 3 | % | | 12,055 |
| | 2 | % | | 593,113 |
| | 5 | % |
| Washington | | 290,141 |
| | 3 | % | | 56,675 |
| | 2 | % | | 29,079 |
| | 5 | % | | 375,895 |
| | 3 | % |
| Arizona | | 108,102 |
| | 1 | % | | 24,808 |
| | 1 | % | | 24,890 |
| | 5 | % | | 157,800 |
| | 1 | % |
| Nevada | | 94,924 |
| | 1 | % | | 44,052 |
| | 2 | % | | 47,897 |
| | 9 | % | | 186,873 |
| | 2 | % |
| Other markets | | 391,907 |
| | 4 | % | | 44,644 |
| | 2 | % | | 28,973 |
| | 5 | % | | 465,524 |
| | 3 | % |
Total loans (1) | | $ | 9,449,835 |
| | 100 | % | | $ | 2,281,032 |
| | 100 | % | | $ | 538,794 |
| | 100 | % | | $ | 12,269,661 |
| | 100 | % |
| | | | | |
| |
(1) | Loans net of ASC 310-30 discount. |
As illustrated by the tables above, due toloan portfolio reflects the Company’s geographical footprint, the Company’s CRE loanwith a primary concentration is primarily in California which was 78% and 79%accounting for 76% of the CRE loan portfolio as of June 30, 2019both March 31, 2020 and December 31, 2018, respectively. Accordingly, changes in the California economy and real estate values could have a significant impact on the collectability of these loans and the required level of allowance for loan losses.
2019
The Company’s CRE portfolio is broadly diversified by property type, which serves to mitigate some of the geographical concentration in California. The following table summarizes the Company’s CRE loan portfolio by property type as of June 30, 2019 and December 31, 2018:
|
| | | | | | | | | | | | | | |
| |
| ($ in thousands) | | June 30, 2019 | | December 31, 2018 |
| | Amount | | % | | Amount | | % |
| Property types: | | | | | | | | |
| Retail | | $ | 3,263,625 |
| | 34 | % | | $ | 3,171,374 |
| | 33 | % |
| Offices | | 2,297,308 |
| | 23 | % | | 2,160,382 |
| | 23 | % |
| Industrial | | 1,977,510 |
| | 20 | % | | 1,883,444 |
| | 20 | % |
| Hotel/Motel | | 1,690,339 |
| | 17 | % | | 1,619,905 |
| | 17 | % |
| Other | | 639,651 |
| | 6 | % | | 614,730 |
| | 7 | % |
Total CRE loans (1) | | $ | 9,868,433 |
| | 100 | % | | $ | 9,449,835 |
| | 100 | % |
| |
| |
(1) | Loans net of ASC 310-30 discount. |
Commercial — Multifamily Residential Loans. Multifamily residential loans which totaled $2.37$2.90 billion and $2.28$2.86 billion as of June 30, 2019March 31, 2020 and December 31, 2018,2019, respectively, and accounted for 7%8% of total loans as of both dates. The multifamily residential loan portfolio is largely comprised of loans secured by smaller multifamilyresidential properties ranging fromwith five to 15 units, located in the Company’s primary lending areas.or more units. As of June 30, 2019both March 31, 2020 and December 31, 2018, 84% and 85%, respectively,2019, 82% of the Company’s multifamily residential loans were concentrated in California. The Company offers a variety of first-lienfirst lien mortgages, including fixed- and variable-rate loans, as well as hybrid loans with interest rates that adjust annually after an initial fixed rate period of three to seven years.
Commercial — Construction and Land Loans. Construction and land loans which totaled $674.8$606.2 million and $538.8$628.5 million as of June 30, 2019March 31, 2020 and December 31, 2018,2019, respectively, and accounted for 2% of total loans as of both dates. Included in the portfolio were construction loans of $593.1$544.1 million, and $477.2with additional unfunded commitments of $326.4 million as of June 30, 2019March 31, 2020, and construction loans of $558.2 million with additional unfunded commitments of $351.4 million as of December 31, 2018, respectively.2019. The unfunded commitments related toconstruction loans provide financing for multifamily residential, hotels, offices, industrial and retail structures. Based on total commitment, the construction and land loans totaled $415.5 million and $525.1 million, respectively,had a weighted average LTV of 54% as of June 30, 2019 and DecemberMarch 31, 2018. The construction portfolio consists of construction financing for hotels, offices, and industrial structures.2020. Similar to CRE and multifamily residential loans, the Company has a geographic concentration of construction and land loans in California.
Consumer
The following tables summarize the Company’s single-family residential and HELOCHELOCs loan portfolios by geographic marketgeography as of June 30, 2019March 31, 2020 and December 31, 2018:2019:
|
| | | | | | | | | | | | | | | | | | | | | |
| |
| ($ in thousands) | | June 30, 2019 |
| | Single- Family Residential | | % | | HELOCs | | % | | Total | | % |
| Geographic markets: | | | | | | | | | | | | |
| Southern California | | $ | 2,919,487 |
| | | | $ | 767,607 |
| | | | $ | 3,687,094 |
| | |
| Northern California | | 990,348 |
| | | | 321,626 |
| | | | 1,311,974 |
| | |
| California | | 3,909,835 |
| | 60 | % | | 1,089,233 |
| | 69 | % | | 4,999,068 |
| | 62 | % |
| New York | | 1,349,806 |
| | 21 | % | | 268,921 |
| | 17 | % | | 1,618,727 |
| | 20 | % |
| Washington | | 596,634 |
| | 9 | % | | 143,973 |
| | 9 | % | | 740,607 |
| | 9 | % |
| Massachusetts | | 216,296 |
| | 3 | % | | 34,259 |
| | 2 | % | | 250,555 |
| | 3 | % |
| Texas | | 183,470 |
| | 3 | % | | — |
| | — | % | | 183,470 |
| | 2 | % |
| Other markets | | 238,841 |
| | 4 | % | | 38,764 |
| | 3 | % | | 277,605 |
| | 4 | % |
Total (1) | | $ | 6,494,882 |
| | 100 | % | | $ | 1,575,150 |
| | 100 | % | | $ | 8,070,032 |
| | 100 | % |
| |
|
| | | | | | | | | | | | | | | | | | | | | |
| |
| ($ in thousands) | | March 31, 2020 |
| | Single- Family Residential | | % | | HELOCs | | % | | Total Residential Mortgage | | % |
| Geographic markets: | | | | | | | | | | | | |
| Southern California | | $ | 3,168,482 |
| | | | $ | 699,131 |
| | | | $ | 3,867,613 |
| | |
| Northern California | | 1,058,009 |
| | | | 312,227 |
| | | | 1,370,236 |
| | |
| California | | 4,226,491 |
| | 57 | % | | 1,011,358 |
| | 69 | % | | 5,237,849 |
| | 59 | % |
| New York | | 1,838,248 |
| | 25 | % | | 240,583 |
| | 17 | % | | 2,078,831 |
| | 23 | % |
| Washington | | 623,223 |
| | 8 | % | | 132,146 |
| | 9 | % | | 755,369 |
| | 9 | % |
| Massachusetts | | 237,897 |
| | 3 | % | | 30,848 |
| | 2 | % | | 268,745 |
| | 3 | % |
| Texas | | 189,498 |
| | 3 | % | | — |
| | — | % | | 189,498 |
| | 2 | % |
| Other markets | | 288,366 |
| | 4 | % | | 37,927 |
| | 3 | % | | 326,293 |
| | 4 | % |
| Total | | $ | 7,403,723 |
| | 100 | % | | $ | 1,452,862 |
| | 100 | % | | $ | 8,856,585 |
| | 100 | % |
| Lien priority: | | | | | | | | | | | | |
| First mortgage | | $ | 7,403,722 |
| | 100 | % | | $ | 1,216,294 |
| | 84 | % | | $ | 8,620,016 |
| | 97 | % |
| Junior lien mortgage | | 1 |
| | 0 | % | | 236,568 |
| | 16 | % | | 236,569 |
| | 3 | % |
| Total | | $ | 7,403,723 |
| | 100 | % | | $ | 1,452,862 |
| | 100 | % | | $ | 8,856,585 |
| | 100 | % |
| |
| | | | ($ in thousands) | | December 31, 2018 | | December 31, 2019 |
| | Single-
Family
Residential | | % | | HELOCs | | % | | Total | | % | | Single-
Family
Residential | | % | | HELOCs | | % | | Total Residential Mortgage | | % |
| Geographic markets: | | | | | | | | | | | | | | | | | | | | | | | | |
| Southern California | | $ | 2,768,725 |
| | | | $ | 839,790 |
| | | | $ | 3,608,515 |
| | | | $ | 3,081,368 |
| | | | $ | 702,915 |
| | | | $ | 3,784,283 |
| | |
| Northern California | | 954,835 |
| | | | 350,008 |
| | | | 1,304,843 |
| | | | 1,038,945 |
| | | | 309,883 |
| | | | 1,348,828 |
| | |
| California | | 3,723,560 |
| | 62 | % | | 1,189,798 |
| | 70 | % | | 4,913,358 |
| | 64 | % | | 4,120,313 |
| | 58 | % | | 1,012,798 |
| | 69 | % | | 5,133,111 |
| | 60 | % |
| New York | | 1,165,135 |
| | 19 | % | | 279,792 |
| | 17 | % | | 1,444,927 |
| | 19 | % | | 1,657,732 |
| | 23 | % | | 257,344 |
| | 17 | % | | 1,915,076 |
| | 22 | % |
| Washington | | 572,017 |
| | 9 | % | | 149,579 |
| | 9 | % | | 721,596 |
| | 9 | % | | 630,307 |
| | 9 | % | | 133,625 |
| | 9 | % | | 763,932 |
| | 9 | % |
| Massachusetts | | 206,920 |
| | 3 | % | | 32,333 |
| | 2 | % | | 239,253 |
| | 3 | % | | 235,393 |
| | 3 | % | | 31,310 |
| | 2 | % | | 266,703 |
| | 3 | % |
| Texas | | 165,873 |
| | 3 | % | | — |
| | — | % | | 165,873 |
| | 2 | % | | 188,838 |
| | 3 | % | | — |
| | — | % | | 188,838 |
| | 2 | % |
| Other markets | | 202,949 |
| | 4 | % | | 39,332 |
| | 2 | % | | 242,281 |
| | 3 | % | | 276,007 |
| | 4 | % | | 37,706 |
| | 3 | % | | 313,713 |
| | 4 | % |
Total (1) | | $ | 6,036,454 |
| | 100 | % | | $ | 1,690,834 |
| | 100 | % | | $ | 7,727,288 |
| | 100 | % | | $ | 7,108,590 |
| | 100 | % | | $ | 1,472,783 |
| | 100 | % | | $ | 8,581,373 |
| | 100 | % |
| Lien priority: | | | | | | | | | | | | | |
| First mortgage | | | $ | 7,108,588 |
| | 100 | % | | $ | 1,238,186 |
| | 84 | % | | $ | 8,346,774 |
| | 97 | % |
| Junior lien mortgage | | | 2 |
| | 0 | % | | 234,597 |
| | 16 | % | | 234,599 |
| | 3 | % |
Total (1) | | | $ | 7,108,590 |
| | 100 | % | | $ | 1,472,783 |
| | 100 | % | | $ | 8,581,373 |
| | 100 | % |
|
| |
| (1) | Loans net of ASC 310-30 discount. |
Consumer — Single-Family Residential Loans. Single-family residential loans which totaled $6.49$7.40 billion and $6.04$7.11 billion as of June 30, 2019March 31, 2020 and December 31, 2018,2019, respectively, and accounted for 19%20% of total loans as of both dates. AsThe Company was in a first lien position for virtually all single-family residential loans as of June 30, 2019both March 31, 2020 and December 31, 2018,2019. Many of these loans are reduced documentation loans where a substantial down payment is required, resulting in a low LTV ratio at origination, typically 60% or less. These loans have historically experienced low delinquency and 62%loss rates. As of March 31, 2020 and December 31, 2019, 57% and 58% of the Company’s single-family residential loans, respectively, were concentrated in California. The Company offers a variety of first lien mortgage loan programs, including fixed- and variable-rate loans, as well as hybrid loans with interest rates that adjust annually after an initial fixed rate period.
Consumer — Home Equity Lines of Credit. HELOCs totaled $1.45 billion and $1.47 billion as of March 31, 2020 and December 31, 2019, respectively, and accounted for 4% of total loans as of both dates. The Company was in a first lien position for 84% of total HELOCs as of both March 31, 2020 and December 31, 2019. Many of the loans within this portfolio are reduced documentation loans, where a substantial down payment is required, resulting in a low loan-to-valueLTV ratio at origination, typically 60% or less. The Company is in a first-lien position for many of these reduced documentation single-family residential loans. These loans have historically experienced low delinquency and defaultloss rates. The Company offers a varietyAs of first lien mortgage loan programs, including fixed- and variable-interest rate loans, as well as hybrid loans with interest rates that adjust annually after an initial fixed rate period.
Consumer — Home Equity Lines of Credit. HELOCs, which totaled $1.58 billion and $1.69 billion as of June 30, 2019both March 31, 2020 and December 31, 2018, respectively, accounted for 5% of total loans as of both dates. As of June 30, 2019, and December 31, 2018, 69% and 70% of the Company’s HELOCs respectively, were concentrated in California. Many of the loans within this portfolio are reduced documentation loans, where a substantial down payment is required, resulting in a low loan-to-value ratio at origination, typically 60% or less. The Company is in a first-lien position for many of these reduced documentation HELOCs. These loans have historically experienced low delinquency and default rates. The HELOC portfolio is comprised largely of variable-rate loans.
All commercial and consumer loans originated are subject to the Company’s underwriting guidelines and loan origination standards. Management believes that the Company’s underwriting criteria and procedures adequately consider the unique risks associated with these products. The Company conducts a variety of quality control procedures and periodic audits, including the review of lending and legal requirements, to ensure that the Company is in compliance with these requirements.
Purchased Credit-ImpairedCredit-Deteriorated Loans
Loans acquired with evidence ofThe Company adopted ASU 2016-13 using the prospective transition approach for purchased credit deterioration since their origination(“PCD”) loans that were previously classified as purchased credit impaired (“PCI”) and where it is probable thataccounted for under ASC 310-30. On January 1, 2020, the Company will not collect all contractually required principal and interest payments are PCI loans. PCI loans are recorded at fair value asamortized cost basis of the datePCD loans was adjusted to reflect the $1.2 million addition of acquisition. The carrying value of PCI loans totaled $270.9 million and $308.0 million as of June 30, 2019 and December 31, 2018, respectively. PCI loans are considered to be accruing due to the existence of the accretable yield, which represents the cash expected to be collected in excess of their carrying value, and which is not based on consideration given to contractual interest payments. The accretable yield was $64.1 million and $74.9 million as of June 30, 2019 and December 31, 2018, respectively. A nonaccretable difference is established for PCI loans to absorb losses expected on the contractual amounts of these loans, in excess of the fair value recorded as of the date of acquisition. Loss amounts absorbed by the nonaccretable difference do not affect the Consolidated Statement of Income or the allowance for creditloan losses. The Company did not acquire any PCD loans during the first quarter of 2020. For additional details regarding PCIPCD loans, see Note 82 — Summary of Significant Accounting Policies and Note 7 — Loans Receivable and Allowance for Credit Losses to the Consolidated Financial Statements in this Form 10-Q. Prior to the adoption of ASU 2016-13, the carrying value of PCI loans totaled $222.9 million as of December 31, 2019.
Loans Held-for-Sale
As of June 30,March 31, 2020 and December 31, 2019, loans held-for-sale of $3.9totaled $1.6 million consisted of C&I loans. In comparison, as of December 31, 2018, loans held-for-sale of $275and $434 thousand, respectively, and consisted of single-family residential loans. At the time of commitment to originate or purchase a loan, a loan is determined to be held-for-investment if it is the Company’s intent to hold the loan to maturity or for the “foreseeable future,” subject to periodic reviews under the Company’s evaluation processes, including asset/liabilityliquidity and credit risk management. If the Company subsequently changes its intent to hold certain loans, those loans are transferred from held-for-investment to held-for-sale at the lower of cost or fair value.
Loan Purchases, Transfers and Sales
During the second quarter and first half of 2019,All loans originated by the Company purchased loans held-for-investment of $178.5 millionare underwritten pursuant to the Company’s policies and $326.3 million, respectively, compared to $309.8 million and $389.8 million, respectively, duringprocedures. Although the same periods in 2018. The purchased loans held-for-investment for each of the second quarter and first half 2019 and 2018 were primarily comprised of broadly syndicated C&I loans.
When purchased orCompany’s primary focus is on directly originated loans, are transferred from held-for-investment to held-for-sale, corresponding write-downs to the allowance for loan losses are recorded, as appropriate. Loans transferred from held-for-investment to held-for-sale were $81.2 million and $129.9 million during the second quarter of 2019 and 2018, respectively, and $173.4 million and $285.6 million during the first half of 2019 and 2018, respectively. The transferred loans were primarily C&I loans for all periods. Related to these loan transfers,in certain circumstances the Company recorded $317 thousand and $390 thousand in write-downs to the allowance for loan losses during the second quarter and first half of 2019, respectively, and $13.3 million and $13.4 million, respectively, during the same periods in 2018.
During the second quarter and first half of 2019, the Company sold $55.7 million and $132.2 million of originated loans, respectively, resulting in net gains of $15 thousand and $930 thousand, respectively. C&I loans made up $53.0 million and $110.4 million of the originated loans sold in the second quarter and first half of 2019, respectively. In comparison, during the same periods in 2018, the Company sold $103.5 million and $193.2 million in originated loans, respectively, resulting in net gains of $2.3 million and $3.9 million, respectively. Originated loans sold during the second quarter of 2018 were primarily $64.8 million of C&Ialso purchases loans and $30.4 million of CRE loans. Originatedparticipates in loans sold during the first half of 2018 were primarily $142.6 million of C&Iwith other banks. The Company also participates out interests in commercial loans and $39.8 million of CRE loans.
From time to time, the Company purchasesother financial institutions and sells loans in the secondary market. During the second quarternormal course of business.
The following tables provide information on loan purchases, transfers and first half of 2019, the Company sold purchased loans of $23.1 million and $41.3 million, respectively, in the secondary market resulting in minimal net gains on sale of loans. In comparison,sales during the same periods in 2018, the Company sold purchased loansfirst quarters of $75.4 million2020 and $100.0 million, respectively, in the secondary market, recording net gains on sale of $59 thousand and $32 thousand, respectively.2019:
The Company records valuation adjustments in Net gains on sales of loans on the Consolidated Statement of Income to carry the loans held-for-sale portfolio at the lower of cost or fair value. No lower of cost or fair value adjustments were recorded for each of the second quarter and first half of 2019 and 2018. |
| | | | | | | | | | | | | | | | | | | | |
| |
| ($ in thousands) | | Three Months Ended March 31, 2020 |
| | Commercial | | Consumer | Total |
| | C&I | | CRE | | Residential Mortgage |
| | | CRE | | Multifamily Residential | | Single-Family
Residential | |
| Loans purchased | | $ | 130,583 |
| | $ | — |
| | $ | 1,513 |
| | $ | 1,084 |
| | $ | 133,180 |
|
| Loans transferred from held-for-investment to held-for-sale | | $ | 102,973 |
| | $ | 7,250 |
| | $ | — |
| | $ | — |
| | $ | 110,223 |
|
| Loans sold: | | | | | | | | | | |
| Originated loans: | | | | | | | | | | |
| Amount | | $ | 102,973 |
| | $ | 7,250 |
| | $ | — |
| | $ | 4,642 |
| | $ | 114,865 |
|
| Net gains | | $ | 235 |
| | $ | 665 |
| | $ | — |
| | $ | 50 |
| | $ | 950 |
|
| |
Non-PCI Nonperforming Assets
Non-PCI nonperforming assets are comprised of nonaccrual loans, OREO, and other nonperforming assets. OREO and other nonperforming assets are repossessed assets and properties acquired through foreclosure, or through full or partial satisfaction of loans held-for-investment. Generally, loans are placed on nonaccrual status when they become 90 days past due or when the full collection of principal or interest becomes uncertain regardless of the length of past due status. Collectability is generally assessed based on economic and business conditions, the borrower’s financial conditions and the adequacy of collateral, if any. The following table presents information regarding non-PCI nonperforming assets as of June 30, 2019 and December 31, 2018:
|
| | | | | | | | |
| |
| ($ in thousands) | | June 30, 2019 | | December 31, 2018 |
| Nonaccrual loans: | | | | |
| Commercial: | | | | |
| C&I | | $ | 73,150 |
| | $ | 43,840 |
|
| CRE | | 20,914 |
| | 24,218 |
|
| Multifamily residential | | 1,027 |
| | 1,260 |
|
| Consumer: | | | | |
| Single-family residential | | 13,075 |
| | 5,259 |
|
| HELOCs | | 7,344 |
| | 8,614 |
|
| Other consumer | | 2,504 |
| | 2,502 |
|
| Total nonaccrual loans | | 118,014 |
| | 85,693 |
|
| OREO, net | | 130 |
| | 133 |
|
| Other nonperforming assets | | 1,167 |
| | 7,167 |
|
| Total nonperforming assets | | $ | 119,311 |
| | $ | 92,993 |
|
Non-PCI nonperforming assets to total assets (1) | | 0.28 | % | | 0.23 | % |
Non-PCI nonaccrual loans to loans held-for-investment (1) | | 0.35 | % | | 0.26 | % |
| Allowance for loan losses to non-PCI nonaccrual loans | | 280.16 | % | | 363.30 | % |
| |
|
| | | | | | | | | | | | | | | | | | | | |
| |
| ($ in thousands) | | Three Months Ended March 31, 2019 |
| | Commercial | | Consumer | Total |
| | C&I | | CRE | | Residential Mortgage |
| | | CRE | | Multifamily Residential | | Single-Family
Residential | |
| Loans purchased | | $ | 107,194 |
| | $ | — |
| | $ | 4,218 |
| | $ | 36,402 |
| | $ | 147,814 |
|
| Loans transferred from held-for-investment to held-for-sale | | $ | 75,573 |
| | $ | 16,655 |
| | $ | — |
| | $ | — |
| | $ | 92,228 |
|
| Write-downs to allowance for loan losses | | $ | (73 | ) | | $ | — |
| | $ | — |
| | $ | — |
| | $ | (73 | ) |
| Loans sold: | | | | | | | | | | |
| Originated loans: | | | | | | | | | | |
| Amount | | $ | 57,409 |
| | $ | 16,655 |
| | $ | — |
| | $ | 2,442 |
| | $ | 76,506 |
|
| Net gains | | $ | 131 |
| | $ | 753 |
| | $ | — |
| | $ | 31 |
| | $ | 915 |
|
| Purchased loans: | | | | | | | | | | |
| Amount | | $ | 18,237 |
| | $ | — |
| | $ | — |
| | $ | — |
| | $ | 18,237 |
|
| |
| |
| (1) | Total assets andNet gains on sales of purchased loans held-for-investment include PCI loansin the first quarter of $270.9 million and $308.0 million as of June 30, 2019 and December 31, 2018, respectively.were insignificant. |
Period-over-period changes to nonaccrual loans represent loans that are placed on nonaccrual status in accordance with the Company’s accounting policy, offset by reductions for loans that are paid down, charged off, sold, foreclosed, or no longer classified as nonaccrual as a result of continued performance and improvement in the borrowers’ financial condition and loan repayments. Nonaccrual loans increased by $32.3 million or 38% to $118.0 million as of June 30, 2019 from $85.7 million as of December 31, 2018. Nonaccrual loans as a percentage of loans held-for-investment increased from 0.26% as of December 31, 2018 to 0.35% as of June 30, 2019. C&I nonaccrual loans were 62% and 51% of total nonaccrual loans as of June 30, 2019 and December 31, 2018, respectively. Credit risks related to the C&I nonaccrual loans were partially mitigated by the collateral in place. As of June 30, 2019, $41.0 million or 35% of non-PCI nonaccrual loans were less than 90 days delinquent. In comparison, $23.8 million or 28% of non-PCI nonaccrual loans were less than 90 days delinquent as of December 31, 2018.
For additional details regarding the Company’s non-PCI nonaccrual loan policy, see Note 1 — Summary of Significant Accounting Policies— Loans Held-for-Investment to the Consolidated Financial Statements of the Company’s 2018 Form 10-K.
A loan is classified as a troubled debt restructuring (“TDR”) when the Company, for economic or legal reasons related to the borrower’s financial difficulties, grants a concession to the borrower that the Company would not otherwise consider. Loans with contractual terms that have been modified as a TDR and are current at the time of restructuring may remain on accrual status if there is demonstrated performance prior to the restructuring and payment in full under the restructured terms is expected. Otherwise, TDRs are placed on nonaccrual status and are reported as nonperforming, until the borrower demonstrates a sustained period of performance, generally six months, and the ability to repay the loan according to the contractual terms. If accruing TDRs cease to perform in accordance with their modified contractual terms, the loans are placed on nonaccrual status and reported as nonperforming TDRs.
The following table presents the performing and nonperforming TDRs by loan segments as of June 30, 2019 and December 31, 2018:
|
| | | | | | | | | | | | | | | | |
| |
| ($ in thousands) | | June 30, 2019 | | December 31, 2018 |
| | Performing TDRs | | Nonperforming TDRs | | Performing TDRs | | Nonperforming TDRs |
| Commercial: | | | | | | | | |
| C&I | | $ | 69,970 |
| | $ | 22,036 |
| | $ | 13,248 |
| | $ | 10,715 |
|
| CRE | | 6,031 |
| | 14,356 |
| | 6,134 |
| | 17,272 |
|
| Multifamily residential | | 4,226 |
| | 244 |
| | 4,300 |
| | 260 |
|
| Consumer: | | | | | | | | |
| Single-family residential | | 7,815 |
| | 537 |
| | 8,201 |
| | 325 |
|
| HELOCs | | 2,589 |
| | 474 |
| | 1,342 |
| | 1,743 |
|
| Total TDRs | | $ | 90,631 |
| | $ | 37,647 |
| | $ | 33,225 |
| | $ | 30,315 |
|
| |
Performing TDRs increased by $57.4 million or 173% from $33.2 million as of December 31, 2018 to $90.6 million as of June 30, 2019. The increase reflects additional new performing C&I loans that were designated as TDRs and the transfer of a HELOC loan from nonperforming status. Nonperforming TDRs increased by $7.3 million or 24% from $30.3 million as of December 31, 2018 to $37.6 million as of June 30, 2019. This increase reflects one new nonperforming C&I loan that was designated as TDR, partially offset by paydowns and payoffs of several nonperforming C&I and CRE loans, and the transfer of a HELOC loan to performing status.
The Company’s impaired loans are predominantly made up of non-PCI loans held-for-investment on nonaccrual status and any non-PCI loans modified as a TDR, on either accrual or nonaccrual status. See Note 1 — Summary of Significant Accounting Policies — Troubled Debt Restructurings and Impaired Loans to the Consolidated Financial Statements of the Company’s 2018 Form 10-K for additional information regarding the Company’s TDR and impaired loan policies. As of June 30, 2019, the allowance for loan losses included $16.9 million for impaired loans with a total recorded investment balance of $66.3 million. In comparison, the allowance for loan losses included $4.0 million for impaired loans with a total recorded investment balance of $31.1 million as of December 31, 2018.
The following table presents the recorded investment balances for non-PCI impaired loans as of June 30, 2019 and December 31, 2018:
|
| | | | | | | | | | | | | | |
| |
| ($ in thousands) | | June 30, 2019 | | December 31, 2018 |
| | Amount | | % | | Amount | | % |
| Commercial: | | | | | | | | |
| C&I | | $ | 143,120 |
| | 69 | % | | $ | 57,088 |
| | 48 | % |
| CRE | | 26,945 |
| | 13 | % | | 30,352 |
| | 26 | % |
| Multifamily residential | | 5,253 |
| | 3 | % | | 5,560 |
| | 5 | % |
| Total commercial | | 175,318 |
| | 85 | % | | 93,000 |
| | 79 | % |
| Consumer: | | | | | | | | |
| Single-family residential | | 20,890 |
| | 9 | % | | 13,460 |
| | 11 | % |
| HELOCs | | 9,933 |
| | 5 | % | | 9,956 |
| | 8 | % |
| Other consumer | | 2,504 |
| | 1 | % | | 2,502 |
| | 2 | % |
| Total consumer | | 33,327 |
| | 15 | % | | 25,918 |
| | 21 | % |
| Total non-PCI impaired loans | | $ | 208,645 |
| | 100 | % | | $ | 118,918 |
| | 100 | % |
| |
Allowance for Credit Losses
Allowance for credit losses consists of allowance for loan losses and allowance for unfunded credit reserves. Allowance for loan losses is comprised of reserves for two components, performing loans with unidentified incurred losses, and nonperforming loans and TDRs (collectively, impaired loans), and excludes loans held-for-sale. The allowance for loan losses is calculated after analyzing internal historical loan loss experience, internal loan risk ratings, economic conditions, bank risks, portfolio risks and any other pertinent information. Unfunded credit reserves include reserves provided for unfunded lending commitments, standby letters of credit (“SBLCs”), and recourse obligations for loans sold. The allowance for credit losses is increased by the provision for credit losses which is charged against the current period’s results of operations, and is increased or decreased by the amount of net recoveries or charge-offs, respectively, during the period. The allowance for unfunded credit reserves is included in Accrued expenses and other liabilities on the Consolidated Balance Sheet. Net adjustments to the allowance for unfunded credit reserves are included in Provision for credit losses on the Consolidated Statement of Income.
The Company is committed to maintaining the allowance for credit losses at a level that is commensurate with the estimated inherent losses in the loan portfolio, including unfunded credit reserves. In addition to regular quarterly reviews of the adequacy of the allowance for credit losses, the Company performs ongoing assessments of the risks inherent in the loan portfolio. While the Company believes that the allowance for loan losses is appropriate as of June 30, 2019, future allowance levels may increase or decrease based on a variety of factors, including but not limited to, loan growth, portfolio performance and general economic conditions. The calculation of the allowance for credit losses involves subjective and complex judgments. For additional details about the Company’s allowance for credit losses, including the methodologies used, see Note 8 — Loans Receivable and Allowance for Credit Losses to the Consolidated Financial Statements in this Form 10-Q and Item 7. MD&A — Critical Accounting Policies and Estimates and Note 1 — Summary of Significant Accounting Policies — Allowance for Credit Losses to the Consolidated Financial Statements of the Company’s 2018 Form 10-K.
The following table presents a summary of activities in the allowance for credit losses for the second quarter and first half of 2019 and 2018:
|
| | | | | | | | | | | | | | | | |
| |
| ($ in thousands) | | Three Months Ended June 30, | | Six Months Ended June 30, |
| | 2019 | | 2018 | | 2019 | | 2018 |
| Allowance for loan losses, beginning of period | | $ | 317,894 |
| | $ | 297,654 |
| | $ | 311,322 |
| | $ | 287,128 |
|
| Provision for loan losses | | 20,731 |
| | 15,131 |
| | 41,371 |
| | 35,053 |
|
| Gross charge-offs: | | | | | | | | |
| Commercial: | | | | | | | | |
| C&I | | (11,745 | ) | | (13,534 | ) | | (28,989 | ) | | (31,979 | ) |
| Consumer: | | | | | | | | |
| Single-family residential | | — |
| | — |
| | — |
| | (1 | ) |
| Other consumer | | (14 | ) | | (162 | ) | | (28 | ) | | (179 | ) |
| Total gross charge-offs | | (11,759 | ) | | (13,696 | ) | | (29,017 | ) | | (32,159 | ) |
| Gross recoveries: | | | | | | | | |
| Commercial: | | | | | | | | |
| C&I | | 1,713 |
| | 1,151 |
| | 3,964 |
| | 8,430 |
|
| CRE | | 1,837 |
| | 2 |
| | 2,059 |
| | 429 |
|
| Multifamily residential | | 53 |
| | 1,061 |
| | 334 |
| | 1,394 |
|
| Construction and land | | 439 |
| | 258 |
| | 502 |
| | 693 |
|
| Consumer: | | | | | | | | |
| Single-family residential | | 72 |
| | 629 |
| | 74 |
| | 813 |
|
| HELOCs | | — |
| | — |
| | 2 |
| | — |
|
| Other consumer | | 7 |
| | — |
| | 7 |
| | 1 |
|
| Total gross recoveries | | 4,121 |
| | 3,101 |
| | 6,942 |
| | 11,760 |
|
| Net charge-offs | | (7,638 | ) | | (10,595 | ) | | (22,075 | ) | | (20,399 | ) |
| Foreign currency translation adjustments | | (362 | ) | | (640 | ) | | 7 |
| | (232 | ) |
| Allowance for loan losses, end of period | | 330,625 |
| | 301,550 |
| | 330,625 |
| | 301,550 |
|
| | | | | | | | | |
| Allowance for unfunded credit reserves, beginning of period | | 14,505 |
| | 13,614 |
| | 12,566 |
| | 13,318 |
|
| (Reversal of) provision for unfunded credit reserves | | (1,486 | ) | | 405 |
| | 453 |
| | 701 |
|
| Allowance for unfunded credit reserves, end of period | | 13,019 |
| | 14,019 |
| | 13,019 |
| | 14,019 |
|
| Allowance for credit losses | | $ | 343,644 |
| | $ | 315,569 |
| | $ | 343,644 |
| | $ | 315,569 |
|
| | | | | | | | | |
| Average loans held-for-investment | | $ | 32,981,161 |
| | $ | 29,642,358 |
| | $ | 32,699,380 |
| | $ | 29,393,996 |
|
| Loans held-for-investment | | $ | 33,730,377 |
| | $ | 30,230,379 |
| | $ | 33,730,377 |
| | $ | 30,230,379 |
|
| Allowance for loan losses to loans held-for-investment | | 0.98 | % | | 1.00 | % | | 0.98 | % | | 1.00 | % |
| Annualized net charge-offs to average loans held-for-investment | | 0.09 | % | | 0.14 | % | | 0.14 | % | | 0.14 | % |
| |
As of June 30, 2019, the allowance for loan losses amounted to $330.6 million or 0.98% of loans held-for-investment. This compares to $311.3 million or 0.96% of loans held-for-investment as of December 31, 2018 and $301.6 million or 1.00% of loans held-for-investment as of June 30, 2018, respectively. The increase in allowance for loan losses was largely due to loan portfolio growth.
The provision for credit losses includes the provision for loan losses and unfunded credit reserves. A provision for credit losses is charged to income to bring the allowance for credit losses to a level deemed appropriate by the Company based on its calculation methodology. The provision for credit losses was $19.2 million for the second quarter of 2019, compared to $15.5 million for the second quarter of 2018. For the first half of 2019, the provision for credit losses was $41.8 million, compared to $35.8 million for the first half of 2018. The increases in the provision for credit losses for both the second quarter and first half of 2019, compared to the same periods in 2018, reflected loan portfolio growth and an increase in the specific valuation allowance. The increase in the specific valuation allowance was attributable to newly impaired C&I loans during the second quarter of 2019.
The Company believes that the allowance for credit losses as of June 30, 2019 and December 31, 2018 was appropriate to cover credit losses inherent in the loan portfolio, including unfunded credit commitments.
The following table presents the Company’s allocation of the allowance for loan losses by segment and the ratio of each loan segment to total loans held-for-investment as of June 30, 2019 and December 31, 2018:
|
| | | | | | | | | | | | | | |
| |
| ($ in thousands) | | June 30, 2019 | | December 31, 2018 |
| | Allowance Allocation | | % of Total Loans | | Allowance Allocation | | % of Total Loans |
| Commercial: | | | | | | | | |
| C&I | | $ | 205,503 |
| | 37 | % | | $ | 191,340 |
| | 37 | % |
| CRE | | 40,517 |
| | 29 | % | | 39,053 |
| | 29 | % |
| Multifamily residential | | 18,574 |
| | 7 | % | | 19,283 |
| | 7 | % |
| Construction and land | | 22,961 |
| | 2 | % | | 20,282 |
| | 2 | % |
| Consumer: | | | | | | | | |
| Single-family residential | | 32,763 |
| | 19 | % | | 31,340 |
| | 19 | % |
| HELOCs | | 6,177 |
| | 5 | % | | 5,774 |
| | 5 | % |
| Other consumer | | 4,130 |
| | 1 | % | | 4,250 |
| | 1 | % |
| Total | | $ | 330,625 |
| | 100 | % | | $ | 311,322 |
| | 100 | % |
| | | | | | | | | |
The Company maintains an allowance for loan losses for both non-PCI and PCI loans. An allowance for loan losses for PCI loans is based on the Company’s estimates of cash flows expected to be collected from PCI loans. PCI loan losses are estimated collectively for groups of loans with similar characteristics. As of June 30, 2019, the Company established an allowance for loan losses of $5 thousand for $270.9 million of PCI loans. In comparison, the Company established an allowance for loan losses of $22 thousand for $308.0 million of PCI loans as of December 31, 2018. The allowance balances for PCI loans were attributed to CRE loans as of both dates.
Deposits and Other Sources of Funds
The Company offers a wide variety of deposit products to both consumer and commercial customers. Deposits are the Company’s primary source of funding, the cost of which has a significant impact on the Company’s net interest income and net interest margin. Additional funding is provided by short and long-term borrowings, and long-term debt. See Item 2— MD&A — Risk Management — Liquidity Risk Management in this Form 10-Q for a discussion of the Company’s liquidity management. The following table presentssummarizes the deposit balancesCompany’s sources of funds as of June 30, 2019March 31, 2020 and December 31, 2018:2019:
| | | | ($ in thousands) | | June 30, 2019 | | December 31, 2018 | | Change | | March 31, 2020 | | December 31, 2019 | | Change |
| | Amount | | % of Total Deposits | | Amount | | % of Total
Deposits | | $ | | % | | Amount | | % | | Amount | | % | | $ | | % |
| Core deposits: | | | | | | | | | | | | | |
| Deposits | | | | | | | | | | | | | |
| Noninterest-bearing demand | | $ | 10,599,088 |
| | 29 | % | | $ | 11,377,009 |
| | 32 | % | | $ | (777,921 | ) | | (7 | )% | | $ | 11,833,397 |
| | 30 | % | | $ | 11,080,036 |
| | 30 | % | | $ | 753,361 |
| | 7 | % |
| Interest-bearing checking | | 5,083,675 |
| | 14 | % | | 4,584,447 |
| | 13 | % | | 499,228 |
| | 11 | % | | 5,467,508 |
| | 14 | % | | 5,200,755 |
| | 14 | % | | 266,753 |
| | 5 | % |
| Money market | | 8,009,325 |
| | 22 | % | | 8,262,677 |
| | 23 | % | | (253,352 | ) | | (3 | %) | | 9,302,246 |
| | 24 | % | | 8,711,964 |
| | 23 | % | | 590,282 |
| | 7 | % |
| Savings | | 2,188,738 |
| | 6 | % | | 2,146,429 |
| | 6 | % | | 42,309 |
| | 2 | % | | 2,117,274 |
| | 6 | % | | 2,117,196 |
| | 6 | % | | 78 |
| | 0 | % |
| Total core deposits | | 25,880,826 |
| | 71 | % | | 26,370,562 |
| | 74 | % | | (489,736 | ) | | (2 | %) | |
| Time deposits | | 10,596,716 |
| | 29 | % | | 9,069,066 |
| | 26 | % | | 1,527,650 |
| | 17 | % | | 9,966,533 |
| | 26 | % | | 10,214,308 |
| | 27 | % | | (247,775 | ) | | (2 | )% |
| Total deposits | | $ | 36,477,542 |
| | 100 | % | | $ | 35,439,628 |
| | 100 | % | | $ | 1,037,914 |
| | 3 | % | | $ | 38,686,958 |
| | 100 | % | | $ | 37,324,259 |
| | 100 | % | | $ | 1,362,699 |
| | 4 | % |
| Other Funds | | | | | | | | | | | | | |
| Short-term borrowings | | | $ | 66,924 |
| | | | $ | 28,669 |
| | | | $ | 38,255 |
| | 133 | % |
| FHLB advances | | | 646,336 |
| | | | 745,915 |
| | | | (99,579 | ) | | (13 | )% |
| Repurchase agreements | | | 450,000 |
| | | | 200,000 |
| | | | 250,000 |
| | 125 | % |
| Long-term debt | | | 147,169 |
| | | | 147,101 |
| | | | 68 |
| | 0 | % |
| Total other funds | | | $ | 1,310,429 |
| | | | $ | 1,121,685 |
| | | | $ | 188,744 |
| | 17 | % |
| Total sources of funds | | | $ | 39,997,387 |
| | | | $ | 38,445,944 |
| | | | $ | 1,551,443 |
| | 4 | % |
| | | | | | | | | |
Deposits
The Company offers a wide variety of deposit products to both consumer and commercial customers. The Company’s deposit strategy is to grow and retain relationship-based deposits, which provides a stable and low-cost source of funding and liquidity to the Company.
Total deposits were $36.48$38.69 billion as of June 30, 2019,March 31, 2020, an increase of $1.04$1.36 billion or 3%4% from $35.44$37.32 billion as of December 31, 2018. Year-to-date2019.This growth was primarily due to a $1.53 billion$753.4 million or 17%7% increase in time deposits,noninterest-bearing demand and a $590.3 million or 7% increase in money market, partially offset by a $489.7$247.8 million or 2% decrease in coretime deposits. CoreNoninterest-bearing demand deposits comprised 71% and 74%30% of total deposits as of June 30, 2019both March 31, 2020 and December 31, 2018, respectively. Noninterest-bearing demand deposits comprised 29% and 32% of total deposits as of June 30, 2019 and December 31, 2018, respectively. The Company’s loan-to-deposit ratio was 92% and 91% as of June 30, 2019 and December 31, 2018, respectively.2019. Additional information regarding the impact of deposits on net interest income and a comparison of average deposit balances and rates are provided in Item 2. MD&A — Results of Operations — Net Interest Income in this Form 10-Q.
Borrowings
The Company’s other sources of funding consist of short-term borrowings, FHLB advances, repurchase agreements and long-term debt.
The Company utilizes short-term and long-term borrowings to manage its liquidity position. Borrowings include short-term borrowings, long-term FHLB advances and repurchase agreements.
As of June 30, 2019, the Company had $20.0$66.9 million of short-term borrowing outstanding.borrowings outstanding as of March 31, 2020, compared with $28.7 million as of December 31, 2019. This funding was entered into by the Company’s subsidiary, East West Bank (China) Limited, with aand will mature in 2020 and the first quarter of 2021. As of March 31, 2020, short-term borrowings had fixed interest rate of 3.70% and a maturity date in the fourth quarter of 2019. In comparison, the Company had $57.6 million in short-term borrowings outstanding as of December 31, 2018.rates ranging from 3.65% to 3.73%.
FHLB advances were $745.1$646.3 million as of June 30, 2019, an increaseMarch 31, 2020, a decrease of $418.9$99.6 million or 128%13% from $326.2$745.9 million as of December 31, 2018.2019. As of June 30, 2019,March 31, 2020, FHLB advances had fixed and floating interest rates ranging from 1.98%1.18% to 2.95%2.34% with remaining maturities between seven months1.1 years and 3.42.6 years.
Gross repurchase agreements totaled $450.0 million as of both June 30, 2019March 31, 2020 and December 31, 2018.2019. Resale and repurchase agreements are reported net, pursuant to ASC 210-20-45-11, Balance Sheet Offsetting: Repurchase and Reverse Repurchase Agreements. NetAs of March 31, 2020, the Company did not have gross resale agreements that were eligible for netting pursuant to ASC 210-20-45-11. In comparison, net repurchase agreements totaled $50.0$200.0 million as of both June 30, 2019 and December 31, 2018,2019, after netting $400.0$250.0 million of gross repurchase agreements against gross resale agreements, which were eligible for netting pursuant to ASC 210-20-45-11.agreements. As of June 30, 2019,March 31, 2020, gross repurchase agreements had interest rates ranging from 4.70%3.23% to 4.85%4.06%, original terms between 8.54.0 years and 10.09.0 years and remaining maturities between 3.32.6 years and 4.23.4 years.
Repurchase agreements are accounted for as collateralized financing transactions and recorded as liabilities based on the values at which the securities are sold. As of June 30, 2019,March 31, 2020, the collateral for the repurchase agreements was comprised of U.S. Treasury securities and U.S. government agency and U.S. government sponsoredgovernment-sponsored enterprise mortgage-backed securities. To ensure the market value of the underlying collateral remains sufficient, the Company monitors the fair value of collateral pledged relative to the principal amounts borrowed under repurchase agreements. The Company manages liquidity risks related to the repurchase agreements by sourcing fundingfunds from a diverse group of counterparties and entering into repurchase agreements with longer durations, when appropriate. For additional details, see Note 54 — Securities Purchased under Resale Agreements and Sold under Repurchase Agreements to the Consolidated Financial Statements in this Form 10-Q.
Long-Term Debt
The Company uses long-term debt to provide funding forto acquire interest-earning assets, as well as to enhance liquidity and regulatory capital. Long-term debt totaled $147.0$147.2 million and $146.8$147.1 million as of June 30, 2019March 31, 2020 and December 31, 2018,2019, respectively. Long-term debt is comprised of junior subordinated debt, which qualifies as Tier 2 capital for regulatory purposes. The junior subordinated debt was issued in connection with the Company’s various pooled trust preferred securities offerings. Itofferings and includes the value of the common stock issued by six wholly-owned subsidiaries of the Company in conjunction with these offerings. The junior subordinated debt had a weighted-average interest rate of 4.21%3.13% and 3.49%4.30% for the first halfquarters of 2020 and 2019, and 2018, respectively. As of June 30, 2019, the junior subordinated debt hadrespectively, with remaining maturities ranging between 15.414.7 years and 18.2 years.17.5 years as of March 31, 2020.
Foreign Outstandings
The Company’s overseas offices, which include the branch in Hong Kong and the subsidiary bank in China, are subject to the general risks inherent in conducting business in foreign countries, such as regulations, or economic and economicpolitical uncertainties. In addition, the Company’s financial assets held in the Hong Kong branch and the subsidiary bank in China may be affected by fluctuations in currency exchange rates or other factors. The Company’s country risk exposure is largely concentrated in China and Hong Kong. The following table presents the major financial assets held in the Company’s overseas offices as of June 30, 2019March 31, 2020 and December 31, 2018:2019:
| | | | ($ in thousands) | | June 30, 2019 | | December 31, 2018 | | March 31, 2020 | | December 31, 2019 |
| | Amount | | % of Total Consolidated Assets | | Amount | | % of Total Consolidated Assets | | Amount | | % of Total Consolidated Assets | | Amount | | % of Total Consolidated Assets |
| Hong Kong Branch: | | | | | | | | | |
| Hong Kong branch: | | | | | | | | | |
| Cash and cash equivalents | | $ | 414,959 |
| | 1 | % | | $ | 360,786 |
| | 1 | % | | $ | 294,054 |
| | 1 | % | | $ | 511,639 |
| | 1 | % |
Available-for-sale investment securities (1) | | $ | 204,428 |
| | 0 | % | | $ | 221,932 |
| | 1 | % | |
AFS debt securities (1) | | | $ | 204,942 |
| | 0 | % | | $ | 204,948 |
| | 0 | % |
Loans held-for-investment (3)(2) | | $ | 672,644 |
| | 2 | % | | $ | 653,860 |
| | 2 | % | | $ | 542,697 |
| | 1 | % | | $ | 573,305 |
| | 1 | % |
| Total assets | | $ | 1,316,073 |
| | 3 | % | | $ | 1,244,532 |
| | 3 | % | | $ | 1,132,054 |
| | 2 | % | | $ | 1,361,652 |
| | 3 | % |
| Subsidiary Bank in China: | | | | | | | | | |
| Subsidiary bank in China: | | | | | | | | | |
| Cash and cash equivalents | | $ | 778,168 |
| | 2 | % | | $ | 695,527 |
| | 2 | % | | $ | 544,860 |
| | 1 | % | | $ | 548,930 |
| | 1 | % |
| Interest-bearing deposits with banks | | $ | 150,273 |
| | 0 | % | | $ | 221,000 |
| | 1 | % | | $ | 219,517 |
| | 0 | % | | $ | 142,587 |
| | 0 | % |
Loans held-for-investment (3)(2) | | $ | 823,127 |
| | 2 | % | | $ | 777,412 |
| | 2 | % | | $ | 745,553 |
| | 2 | % | | $ | 819,110 |
| | 2 | % |
| Total assets | | $ | 1,757,060 |
| | 4 | % | | $ | 1,700,287 |
| | 4 | % | | $ | 1,562,179 |
| | 3 | % | | $ | 1,520,627 |
| | 3 | % |
|
| |
(1) | Primarily comprised of foreign bonds and U.S. Treasury securities as of both June 30, 2019 and December 31, 2018. |
| |
(2) | Includes ASC 310-30 discount of $62 thousand and $103 thousand as of June 30, 2019 and December 31, 2018, respectively. |
| |
(3) | Primarily comprised of C&I loans as of both June 30, 2019 and December 31, 2018. |
(1)Comprised of foreign bonds as of March 31, 2020 and comprised of foreign bonds and U.S. Treasury securities as of December 31, 2019.
(2)Primarily comprised of C&I loans as of both March 31, 2020 and December 31, 2019.
The following table presents the total revenue generated by the Company’s overseas offices for the second quarterfirst quarters of 2020 and first half of 2019 and 2018:2019:
| | | | ($ in thousands) | | Three Months Ended June 30, | | Six Months Ended June 30, | | Three Months Ended March 31, |
| | 2019 | | 2018 | | 2019 | | 2018 | | 2020 | | 2019 |
| | Amount | | % of Total Consolidated
Revenue | | Amount | | % of Total Consolidated
Revenue | | Amount | | % of Total
Consolidated
Revenue | | Amount | | % of Total
Consolidated
Revenue | | Amount | | % of Total Consolidated
Revenue | | Amount | | % of Total Consolidated
Revenue |
| Hong Kong Branch: | | | | | | | | | | | | | | | | | |
| Hong Kong branch: | | | | | | | | | |
| Total revenue | | $ | 8,851 |
| | 2 | % | | $ | 7,910 |
| | 2 | % | | $ | 17,748 |
| | 2 | % | | $ | 14,858 |
| | 2 | % | | $ | 6,929 |
| | 2 | % | | $ | 8,897 |
| | 2 | % |
| Subsidiary Bank in China: | | | | | | | | | | | | | | | | | |
| Subsidiary bank in China: | | | | | | | | | |
| Total revenue | | $ | 9,107 |
| | 2 | % | | $ | 10,514 |
| | 3 | % | | $ | 16,191 |
| | 2 | % | | $ | 16,502 |
| | 2 | % | | $ | 7,179 |
| | 2 | % | | $ | 7,084 |
| | 2 | % |
|
Capital
The Company maintains an adequatea strong capital base to support its anticipated asset growth, operating needs and credit risks, and to ensure that the Company and the Bank are in compliance with all regulatory capital guidelines. The Company engages in regular capital planning processes on at least an annual basis to optimize the use of available capital and to appropriately plan for future capital needs, allocating capital to existing and future business activities. Furthermore, the Company conducts capital stress tests as part of its capital planning process. The stress tests enable the Company to assess the impact of adverse changes in the economy and interest rates on its capital base.
In March 2020, the Company authorized the repurchase of up to $500.0 million of the Company’s common stock. This $500.0 million repurchase authorization is inclusive of the Company’s $100.0 million stock repurchase authorization previously outstanding. The Company determines the timing and amount of repurchases, based on its assessment of various factors, including prevailing market conditions, alternate uses of capital, liquidity and the economic environment. The Company repurchased 4,471,682 shares at a total cost of $146.0 million during the first quarter of 2020. The Company's total remaining available share repurchase authorization as of March 31, 2020 was $354.0 million.
The Company’s stockholders’ equity was $4.73$4.90 billion as of June 30, 2019, an increase of $310.6March 31, 2020, a $114.6 million or 7%,2% decrease from $4.42$5.02 billion as of December 31, 2018.2019. The decrease in the Company’s primary sourcestockholders’ equity was primarily due to share repurchase activity of capital is$146.0 million; a decrease in opening retained earnings of $98.0 million as a result of the retentionadoption of its operating earnings. Retained earnings was $3.41 billion asASU 2016-13, and cash dividends declared of June 30, 2019, an increase$40.5 million during the first quarter of $254.8 million or 8%, from $3.16 billion as of December 31, 2018. The increase primarily reflects2020, offset by first quarter 2020 net income of $314.4 million, offset by $74.3 million of cash dividends declared during the first half of 2019. In addition, the beginning balance of retained earnings as of January 1, 2019 increased by $14.7 million because the Company recognized a cumulative adjustment related to the deferred gains on the sale and leaseback transactions which had occurred prior to the date of adoption of ASU 2016-02, Leases (Topic 842).$144.8 million. For other factors that contributed to the changes in stockholders’ equity, refer to Item 1. Consolidated Financial Statements — Consolidated Statement of Changes in Stockholders’ Equity in this Form 10-Q.
Book value was $32.53$34.67 per common share as of June 30, 2019,March 31, 2020, compared to $30.52with $34.46 per common share as of December 31, 2018.2019. The Company madepaid a quarterly cash dividend payments of $0.23$0.275 and $0.275$0.230 per common share for the first quarters of 2020 and second quarter of 2019, respectively, and made the quarterly cash dividend payments of $0.20 per common share for the first and second quarter of 2018.respectively. In July 2019,April 2020, the Company’s Board of Directors declared thirdsecond quarter 20192020 cash dividends for the Company’s common stock in the amount of $0.275 per common share. The dividend will be paid on AugustMay 15, 20192020 to stockholders of record as of August 1, 2019. The Company’s dividend policy reflects the Company’s anticipated earnings, dividend payout ratio, capital objectives, and alternate capital deployment opportunities.May 4, 2020.
Regulatory Capital and Ratios
The federal banking agencies have risk-based capital adequacy guidelines intended to ensure that banking organizations maintain capital that is commensurate with the degree of risk associated with a banking organization’s operations. In 2013, the Federal Reserve Board, FDIC and Office of the Comptroller of the Currency issued the final Basel III Capital Rules. See Item 1. Business — Supervision and Regulation — Capital Requirements of the Company’s 20182019 Form 10-K for additional details.
The Company adopted ASU 2016-13 on January 1, 2020. The Company has elected the phase-in option provided by regulatory guidance, which delays the estimated impact of CECL on regulatory capital for two years and phases the impact over three years beginning in 2022. As a result, the March 31, 2020 ratios exclude the impact of the increased allowance for credit losses. The following table presents the Company’s and the Bank’s capital ratios as of March 31, 2020 and December 31, 2019 under the Basel III Capital Rules, require that banking organizations maintain a minimum CET1and those required by regulatory agencies for capital ratio of 4.5%, a minimum Tier 1 capital ratio of 6.0%adequacy and a minimum total capital ratio of 8.0% to be considered adequately capitalized. In addition, the rules require banking organizations to maintain a capital conservation buffer of 2.5% above the capital minimums in order to avoid limitations on capital distributions (including common stock dividends and share repurchases) and certain discretionary incentive compensation payments. The capital conservation buffer has been fully phased-in over four years beginning in 2016. As of January 1, 2019, banking organizations are required to maintain a minimum CET1 capital ratio of 7.0%, a minimum Tier 1 capital ratio of 8.5% and a minimum total capital ratio of 10.5% in a fully phased-in basis.well-capitalized classification purposes:
|
| | | | | | | | | | | | | | | | | | | | | |
| |
| | | Basel III Capital Rules |
| | March 31, 2020 | | December 31, 2019 | | Minimum Regulatory Requirements | | Fully
Phased-in
Minimum
Regulatory
Requirements (2) | | Well- Capitalized Requirements |
| | Company | | East
West
Bank | | Company | | East
West
Bank | | | |
| Risk-Based Capital Ratios: | | | | | | | | | | | | | | |
| CET1 capital | | 12.4 | % | | 12.3 | % | | 12.9 | % | | 12.9 | % | | 4.5 | % | | 7.0 | % | | 6.5 | % |
| Tier 1 capital | | 12.4 | % | | 12.3 | % | | 12.9 | % | | 12.9 | % | | 6.0 | % | | 8.5 | % | | 8.0 | % |
| Total capital | | 13.9 | % | | 13.4 | % | | 14.4 | % | | 13.9 | % | | 8.0 | % | | 10.5 | % | | 10.0 | % |
Tier 1 leverage (1) | | 10.2 | % | | 10.1 | % | | 10.3 | % | | 10.3 | % | | 4.0 | % | | 4.0 | % | | 5.0 | % |
| |
| |
| (1) | The Tier 1 leverage well-capitalized requirement applies to the Bank only because there is no Tier 1 leverage ratio component in the definition of a well-capitalized bank-holding company. |
| |
| (2) | As of January 1, 2019, the 2.5% capital conservation buffer above the minimum capital ratios is required in order to avoid limitations on distributions, including dividend payments and certain discretionary bonus payments to executive officers. |
The Company is committed to maintaining strong capital at a level sufficientlevels to assure the Company’s investors, customers and regulators that the Company and the Bank are financially sound. As of June 30, 2019March 31, 2020 and December 31, 2018,2019, both the Company and the Bank were considered “well-capitalized,” and have metcontinued to exceed all “well-capitalized” capital requirements on aand the fully phased-in basisrequired minimum capital requirements under the Basel III Capital Rules. The following table presents the Company’s and the Bank’s capital ratios as of June 30, 2019 and December 31, 2018 under the Basel III Capital Rules, and those required by regulatory agencies for capital adequacy and well-capitalized classification purposes:
|
| | | | | | | | | | | | | | | | | | | | | |
| |
| | | Basel III Capital Rules |
| | June 30, 2019 | | December 31, 2018 | | Minimum Regulatory Requirements | | Well- Capitalized Requirements | | Fully Phased-in Minimum Regulatory Requirements |
| | Company | | East
West
Bank | | Company | | East
West
Bank | | | |
| CET1 risk-based capital | | 12.5 | % | | 12.4 | % | | 12.2 | % | | 12.1 | % | | 4.5 | % | | 6.5 | % | | 7.0 | % |
| Tier 1 risk-based capital | | 12.5 | % | | 12.4 | % | | 12.2 | % | | 12.1 | % | | 6.0 | % | | 8.0 | % | | 8.5 | % |
| Total risk-based capital | | 13.9 | % | | 13.4 | % | | 13.7 | % | | 13.1 | % | | 8.0 | % | | 10.0 | % | | 10.5 | % |
Tier 1 leverage capital (1) | | 10.4 | % | | 10.3 | % | | 9.9 | % | | 9.8 | % | | 4.0 | % | | 5.0 | % | | 4.0 | % |
| |
| |
(1) | The Tier 1 leverage capital well-capitalized requirement applies to the Bank only since there is no Tier 1 leverage ratio component in the definition of a well-capitalized bank-holding company. |
During the first half of 2019, the Company’s CET1 and Tier 1 risk-based capital ratios increased by 25 basis points, the total risk-based capital ratio increased by 24 basis points, and the Tier 1 leverage capital ratio increased by 47 basis points. Tier 1 risk-based capital of $4.25Total risk-weighted assets were $36.55 billion as of June 30, 2019 increased by $287.5 millionMarch 31, 2020, an increase of $1.41 billion or 7%,4% from $3.97$35.14 billion as of December 31, 2018. Total risk-based capital of $4.75 billion as of June 30, 2019 increased by $307.2 million or 7%, from $4.44 billion as of December 31, 2018.2019. The Company’sincrease in the risk-weighted assets were $34.15 billion as of June 30, 2019,was primarily due to loan growth and an increase of $1.66 billion or 5% from $32.50 billion as of December 31, 2018.in derivative fair values.
Other Matters
LIBOR Transition
On July 27, 2017, the United Kingdom’s Financial Conduct Authority, (“FCA”), which regulates the London Interbank Offered Rate (“LIBOR”), announced that it will no longer persuade or require banks to submit rates for the calculation of LIBOR after 2021. Given LIBOR’s extensive use across financial markets, the transition away from LIBOR presents various risks and challenges to financial markets and institutions, including to the Company. The Company’s commercial and consumer businesses issue, trade, and hold various products that are currently indexed to LIBOR. As of June 30, 2019, the Company had approximately $7.34 billion of loans and $4.39 billion in notional value of derivatives indexed to LIBOR that mature after 2021. In addition, aA portion of the Company’s investmentloans, derivatives, debt securities, resale agreements, FHLB advances, and deposits, and all theas well as junior subordinated debt and repurchase agreements are indexed to LIBOR and mature after 2021. The volume of the Company’s products that are indexed to LIBOR is significant, and if not sufficiently planned for, the discontinuation of LIBOR could result in financial, operational, legal, reputational or compliance risks.
The Alternative Reference Rates Committee (“ARRC”) has proposed the Secured Overnight Financing Rate (“SOFR”) as its preferred alternative rate for LIBOR. In early 2019, the ARRC released final recommended fallback contract language for new issuances of LIBOR indexed bilateral business loans, syndicated loans, floating ratefloating-rate notes and securitizations. The International Swaps and Derivatives Association, Inc. (“ISDA”) is expected to providein the process of developing detailed guidance on fallback contract language.
The Company has been closely monitoring the impact of COVID-19 and any potential delay in the cessation of LIBOR. Although the Financial Conduct Authority has expressed that it is assessing the potential impacts of COVID-19 on transition timelines, the target date currently remains unchanged.
Due to the uncertainty surrounding the future of LIBOR, the transition is anticipated to span several reporting periods through the end of 2021.2021, unless there is a delay in the cessation of LIBOR due to impacts of COVID-19. Certain actions already taken by the Company related to the transition of LIBOR include (1) establishing a cross-functional team to identify, assess and monitor risks associated with the transition of LIBOR and other benchmark rates, (2) developing an inventory of LIBOR indexed products, and (3) implementing more robust fallback contract language for new loans, which identifies LIBOR cessation trigger events, provides for an alternative index and permits an adjustment to the margin as applicable. As a result, theThe Company continues to monitor this activity and evaluate the related risks. The Company’s cross-functional team also manages communication of the Company’s transition plans with both internal and external stakeholders and ensures that the Company appropriately updates its business processes, analytical tools, information systems and contract language to minimize disruption during and after the LIBOR transition. For additional information related to the potential impact surrounding the transition from LIBOR on the Company’s business, see Item 1A. Risk Factors in the Company’s 20182019 Form 10-K.
Off-Balance Sheet Arrangements
In the course of the Company’s business, the Company may enter into or be a party to transactions that are not recorded on the Consolidated Balance Sheet and are considered to be off-balance sheet arrangements. Off-balance sheet arrangements are any contractual arrangements to which a nonconsolidated entity is a party and under which the Company has: (1) any obligation under a guarantee contract; (2) a retained or contingent interest in assets transferred to an unconsolidated entity or similar arrangement that serves as credit, liquidity or market risk support to that entity for such assets; (3) any obligation under certain derivative instruments; or (4) any obligation under a material variable interest held by the Company in a nonconsolidated entity that provides financing, liquidity, market risk or credit risk support to the Company, or engages in leasing, hedging or research and development services with the Company.
Commitments to extend creditExtend Credit
As a financial service provider, the Company routinely enters into commitments to extend credit such as loan commitments, commercial letters of credit for foreign and domestic trade, SBLCsstandby letters of credit (“SBLCs”) and financial guarantees to meet the financing needs of our customers. Many of these commitments to extend credit may expire without being drawn upon. The credit policies used in underwriting loans to customers are also used to extend these commitments. Under some of these contractual agreements, the Company may also have liabilities contingent upon the occurrence of certain events. The Company’s liquidity sources have been, and are expected to be, sufficient to meet the cash requirements of its lending activities. Information about the Company’s loan commitments, commercial letters of credit and SBLCs is provided in Note 1210 — Commitments and Contingencies to the Consolidated Financial Statements in this Form 10-Q.
Guarantees
In the ordinary course of business, the Company enters into various guarantee agreements in which the Company sells or securitizes loans with recourse. Under these guarantee arrangements, the Company is contingently obligated to repurchase the recourse component of the loans when the loans default. Additional information regarding guarantees is provided in Note 1210 — Commitments and Contingencies to the Consolidated Financial Statements in this Form 10-Q.
A discussion of significant contractual arrangements under which the Company may be held contingently liable is included in Note 1210 — Commitments and Contingencies to the Consolidated Financial Statements in this Form 10-Q. In addition, the Company has commitments and obligations under post-retirement benefit plans as described in Note 1617 — Employee Benefit Plans to the Consolidated Financial Statements of the Company’s 20182019 Form 10-K, and has contractual obligations for future payments on debts, borrowings and lease obligations as detailed in Item 7. MD&A — Off-Balance Sheet Arrangements and Contractual Obligations of the Company’s 20182019 Form 10-K.
Risk Management
Overview
In the course of conducting its businesses, the Company is exposed to a variety of risks, some of which are inherent to the financial services industry and others of which are more specific to the Company’s businesses. The Company operates under a Board approved enterprise risk management (“ERM”) framework, which outlines its company-wide approach to risk management and oversight and describes the structures and practices employed to manage the current and emerging risks inherent to the Company. The Company’s ERM program incorporates risk management throughout the organization in identifying, managing, monitoring, and reporting risks. It identifies the Company’s major risk categories as capital risk, strategic risk, credit risk, liquidity risk, market risk, operational risk, reputational risk, and legal and compliance risk.
The Board of Directors monitors the ERM program to ensure independent review and oversight of the Company’s risk appetite and control environment. The Risk Oversight Committee provides focused oversight of the Company’s identified enterprise risk categories on behalf of the full Board of Directors. Under the direction of the Risk Oversight Committee, management committees apply targeted strategies to reduce the risks to which the Company’s operations are exposed.
The Company’s ERM program is executed along the three lines of defense model, which provides for a consistent and standardized risk management control environment across the enterprise. The first line of defense is comprised of production, operational, and support units. The second line of defense is comprised of various risk management and control functions charged with monitoring and managing specific major risk categories and/or risk subcategories. The third line of defense is comprised of the Internal Audit function and Independent Asset LiabilityReview. Internal Audit provides assurance and Marketevaluates the effectiveness of risk management, control, and governance processes as established by the Company. Internal Audit has organizational independence and objectivity, reporting directly to the Board’s Audit Committee. Further discussion and analyses of each major risk area are included in the following sub-sections of Risk Management.
Credit Risk Management
Credit risk is the risk that a borrower or counterparty will fail to perform according to terms and conditions of a loan or investment and expose the Company to loss. Credit risk exists with many of our assets and exposures such as loans and certain derivatives. The majority of our credit risk is associated with lending activities.
The Risk Oversight Committee has primary oversight responsibility of identifying enterprise risk categories including credit risk. The Risk Oversight Committee monitors management’s assessment of asset quality and credit risk trends, credit quality administration and underwriting standards, portfolio credit risk management and processes to enable management to control credit risk including diversification and liquidity. At the management level, the Credit Risk Management Committee has primary oversight responsibility for credit risk. The Senior Credit Supervision function manages credit policy and provides the resources to manage the line of business transactional credit risk, assuring that all exposure is risk rated according to the requirements of the credit risk rating policy. The Senior Credit Supervision function reports on the overall credit risk portfolio to senior management and the Risk Oversight Committee. The Independent Asset Review function supports a strong credit risk management culture by providing independent and objective assessments of the quality of underwriting and documentation, reporting directly to the Board’s Risk Oversight Committee. A key to our credit risk management is adherence to a well-controlled underwriting process.
A meaningful way to assess overall credit quality performance of our held-for-investment portfolio is through an analysis of specific performance ratios. This approach forms the basis of the discussion in the sections immediately following: Non-performing Assets, Troubled Debt Restructurings (“TDRs”), and Allowance for Credit Losses.
Nonperforming Assets
Nonperforming assets are comprised of nonaccrual loans, other real estate owned (“OREO”), and other nonperforming assets. OREO and other nonperforming assets are repossessed assets and properties acquired through foreclosure, or through full or partial satisfaction of loans held-for-investment. Loans are generally placed on nonaccrual status when they become 90 days past due or when the full collection of principal or interest becomes uncertain regardless of the length of past due status. Collectability is generally assessed based on economic and business conditions, the borrower’s financial condition and the adequacy of collateral, if any. For additional details regarding the Company’s nonaccrual loan policy, see Note 1 — Summary of Significant Accounting Policies — Loans Held-for-Investment to the Consolidated Financial Statements of the Company’s 2019 Form 10-K.
The following table presents information regarding nonperforming assets as of March 31, 2020 and December 31, 2019:
|
| | | | | | | | |
| |
| ($ in thousands) | | March 31, 2020 | | December 31, 2019 |
| | Nonaccrual Loans | | Non-PCI Nonaccrual Loans |
| Commercial: | | | | |
| C&I | | $ | 89,079 |
| | $ | 74,835 |
|
| CRE: | | | | |
| CRE | | 6,298 |
| | 16,441 |
|
| Multifamily residential | | 803 |
| | 819 |
|
| Total CRE | | 7,101 |
| | 17,260 |
|
| Consumer: | | | | |
| Residential mortgage: | | | | |
| Single-family residential | | 17,536 |
| | 14,865 |
|
| HELOCs | | 10,446 |
| | 10,742 |
|
| Total residential mortgage | | 27,982 |
| | 25,607 |
|
| Other consumer | | 2,506 |
| | 2,517 |
|
| Total nonaccrual loans | | 126,668 |
| | 120,219 |
|
| | | | | |
| OREO, net | | 19,504 |
| | 125 |
|
| Other nonperforming assets | | 4,758 |
| | 1,167 |
|
| Total nonperforming assets | | $ | 150,930 |
| | $ | 121,511 |
|
Nonperforming assets to total assets | | 0.33 | % | | 0.27 | % |
| Nonaccrual loans to loans held-for-investment | | 0.35 | % | | 0.35 | % |
| Allowance for loan losses to nonaccrual loans | | 439.73 | % | | 298.03 | % |
| Annualized quarterly net charge-offs to average loans held-for-investment | | 0.01 | % | | 0.10 | % |
| TDR included in nonperforming loans | | $ | 34,364 |
| | $ | 54,566 |
|
| |
Period-over-period changes to nonaccrual loans represent loans that are placed on nonaccrual status in accordance with the Company’s accounting policy, offset by reductions for loan repayments and for loans that are paid down, charged off, sold, foreclosed, or no longer classified as nonaccrual as a result of continued performance and improvement in the borrowers’ financial condition. Nonaccrual loans were $126.7 million as of March 31, 2020, an increase of $6.4 million or 5% from $120.2 million as of December 31, 2019. This increase is primarily due to new additions from C&I and residential mortgage loans, partially offset by charge-offs and loans returned to accrual status, paid down or paid off. Nonaccrual loans as a percentage of loans held-for-investment were 0.35% as of both March 31, 2020 and December 31, 2019. C&I nonaccrual loans were 70% and 62% of total nonaccrual loans as of March 31, 2020 and December 31, 2019, respectively. Credit risk related to the C&I nonaccrual loans were partially mitigated by the collateral in place. As of March 31, 2020, $61.9 million, or 49%, of the $126.7 million nonaccrual loans were less than 90 days delinquent. In comparison, $35.6 million or 30%, of the $120.2 million nonaccrual loans were less than 90 days delinquent as of December 31, 2019.
OREO was $19.5 million as of March 31, 2020, a quarter-over-quarter increase of $19.4 million because the Company took possession of a retail CRE property located in Southern California.
The following table presents the accruing loans past due by portfolio segments as of March 31, 2020 and December 31, 2019:
|
| | | | | | | | | | | | | | | | | | | | | |
| |
| ($ in thousands) | | Total Accruing Past Due Loans (1) | | Change | | Percentage of Total Loans Outstanding |
| | March 31, 2020 | | December 31, 2019 | | | March 31, 2020 | | December 31, 2019 |
| Commercial: | | | | | | | | | | | | |
| C&I | | $ | 18,385 |
| | $ | 48,155 |
| | $ | (29,770 | ) | | (62 | )% | | 0.15 | % | | 0.40 | % |
| CRE: | | | | | | | | | | | | |
| CRE | | 6,986 |
| | 24,807 |
| | (17,821 | ) | | (72 | )% | | 0.07 | % | | 0.24 | % |
| Multifamily residential | | 876 |
| | 729 |
| | 147 |
| | 20 | % | | 0.03 | % | | 0.03 | % |
| Total CRE | | 7,862 |
| | 25,536 |
| | (17,674 | ) | | (69 | )% | | 0.06 | % | | 0.19 | % |
| Total commercial | | 26,247 |
| | 73,691 |
| | (47,444 | ) | | (64 | )% | | 0.10 | % | | 0.29 | % |
| Consumer: | | | | | | | | | | | | |
| Residential mortgage: | | | | | | | | | | | | |
| Single-family residential | | 58,663 |
| | 20,517 |
| | 38,146 |
| | 186 | % | | 0.79 | % | | 0.29 | % |
| HELOCs | | 14,634 |
| | 7,064 |
| | 7,570 |
| | 107 | % | | 1.01 | % | | 0.48 | % |
| Total residential mortgage | | 73,297 |
| | 27,581 |
| | 45,716 |
| | 166 | % | | 0.83 | % | | 0.32 | % |
| Other consumer | | 63 |
| | 11 |
| | 52 |
| | 473 | % | | 0.02 | % | | 0.00 | % |
| Total consumer | | 73,360 |
| | 27,592 |
| | 45,768 |
| | 166 | % | | 0.81 | % | | 0.31 | % |
| Total | | $ | 99,607 |
| | $ | 101,283 |
| | $ | (1,676 | ) | | (2 | )% | | 0.28 | % | | 0.29 | % |
| |
| |
| (1) | There were no accruing loans past due 90 days or more as of both March 31, 2020 and December 31, 2019. |
Troubled Debt Restructurings
TDRs are loans, for which contractual terms have been modified by the Company for economic or legal reasons related to a borrower’s financial difficulties, and for which a concession to the borrower was granted that the Company would not otherwise consider. Our loan modifications are handled on a case-by-case basis and are negotiated to achieve mutually agreeable terms that maximize loan collectibility and meet the borrower’s financial needs. The Company has implemented various consumer and commercial loan modification programs to provide its borrowers relief from the economic impacts of COVID-19. In accordance with the CARES Act, the Company has elected to not apply TDR classification to any COVID-19 related loan modifications. On April 7, 2020, the federal banking regulators issued the “Interagency Statement on Loan Modifications and Reporting for Financial Institutions Working with Customer Affected by the Coronovirus (Revised)” (the Interagency Statement). The Interagency Statement provides additional TDR relief as it clarifies that it is not necessary to consider the impact of the COVID-19 pandemic on the financial condition of a borrower in connection with a short-term (e.g., six months) COVID-19 related loan modification provided that the borrower is current at the date the modification program is implemented. For COVID-19 related loan modifications in the form of payment deferrals, the delinquency status will not advance and loans that were accruing at the time that the relief is provided will generally not be placed on nonaccrual status during the deferral period. Interest income will continue to be recognized over the contractual life of the loan.
The following table presents the performing and nonperforming TDRs by portfolio segments as of March 31, 2020 and December 31, 2019:
|
| | | | | | | | | | | | | | | | |
| |
| ($ in thousands) | | March 31, 2020 | | December 31, 2019 |
| | Performing TDRs | | Nonperforming TDRs | | Performing TDRs | | Nonperforming TDRs |
| Commercial: | | | | | | | | |
| C&I | | $ | 30,186 |
| | $ | 31,956 |
| | $ | 39,208 |
| | $ | 41,014 |
|
| CRE: | | | | | | | | |
| CRE | | 5,133 |
| | 385 |
| | 5,177 |
| | 11,503 |
|
| Multifamily residential | | 3,320 |
| | 222 |
| | 3,644 |
| | 229 |
|
| Construction and land | | 19,691 |
| | — |
| | 19,691 |
| | — |
|
| Total CRE | | 28,144 |
| | 607 |
| | 28,512 |
| | 11,732 |
|
| Consumer: | | | | | | | | |
| Residential mortgage: | | | | | | | | |
| Single-family residential | | 6,764 |
| | 1,085 |
| | 7,346 |
| | 1,098 |
|
| HELOCs | | 2,814 |
| | 716 |
| | 2,832 |
| | 722 |
|
| Total residential mortgage | | 9,578 |
| | 1,801 |
| | 10,178 |
| | 1,820 |
|
| Total TDRs | | $ | 67,908 |
| | $ | 34,364 |
| | $ | 77,898 |
| | $ | 54,566 |
|
| |
Performing TDRs were $67.9 million as of March 31, 2020, a decrease of $10.0 million or 13% from $77.9 million as of December 31, 2019. This decrease reflects performing C&I loans no longer classified as TDR, loan pay-offs and loan paydowns, offset by three C&I loans that were newly designated as TDR. Nonperforming TDRs were $34.4 million as of March 31, 2020, a decrease of $20.2 million, or 37% from $54.6 million as of December 31, 2019. This decrease primarily reflects one CRE loan transferred to OREO.
Allowance for Credit Losses
The allowance for credit losses includes the allowance for loan losses and the allowance for unfunded credit commitments.
Allowance for Loan Losses — The allowance for loan losses is a valuation account that is deducted from, or added to, the amortized cost basis to present the net amount expected to be collected on the loans. Loans are charged off against the allowance when management believes the uncollectability of a loan balance is confirmed. Expected recoveries do not exceed the aggregate of amounts previously charged-off and expected to be charged-off.
Management estimates the allowance balance using relevant available information, from internal and external sources, relating to past events, current conditions, and reasonable and supportable forecasts. Historical loan loss experience provides the basis for the estimation of expected credit losses. Adjustments to historical loan loss information are made for differences in current loan-specific risk characteristics such as differences in underwriting standards, portfolio mix, delinquency level as well as for changes in environmental conditions.
Allowance for loan losses is measured on a collective basis when similar risk characteristics exist. Loans that do not share risk characteristics are evaluated on an individual basis. Loans evaluated individually are not included in the collective evaluation. When management determines that foreclosure is probable or when the borrower is experiencing financial difficulty and repayment is expected to be provided substantially through the operation or sale of the collateral, expected credit losses are based on the fair value of the collateral, adjusted for selling cost as appropriate.
Allowance for Unfunded Credit Commitments— The Company estimates expected credit losses over the contractual period in which the Company is exposed to credit risk via a contractual obligation to extend credit, unless that obligation is unconditionally cancellable by the Company. The allowance for unfunded credit commitments is adjusted through Provision for credit losses. The estimate includes consideration of the likelihood that funding will occur and an estimate of expected credit losses on commitments expected to be funded over its estimated life. The allowance for unfunded credit commitments include reserves provided for unfunded lending commitments, SBLCs, and recourse obligations for loans sold.
The allowance for loan losses is reported separately on the Consolidated Balance Sheet, whereas the allowance for unfunded credit commitments is included in Accrued expenses and other liabilities on the Consolidated Balance Sheet. The Provision for credit losses is reported on the Consolidated Statement of Income.
The Company is committed to maintaining the allowance for credit losses at a level that is commensurate with the estimated inherent losses in the loan portfolio, including unfunded credit facilities. In addition to regular quarterly reviews of the adequacy of the allowance for credit losses, the Company performs ongoing assessments of the risks inherent in the loan portfolio. While the Company believes that the allowance for credit losses was appropriate as of March 31, 2020, future allowance levels may increase or decrease based on a variety of factors, including but not limited to, accounting standard and regulatory changes, loan growth, portfolio performance and general economic conditions. The Company adopted ASU2016-13 on January 1, 2020. For additional information, see Note 2 —Current Accounting Developments and Summary of Significant Accounting Policies —New Accounting Pronouncements Adopted. The calculation of the allowance for credit losses involves subjective and complex judgments. For additional details about the Company’s allowance for credit losses, including the methodologies used, see Note 7 — Loans Receivable and Allowance for Credit Losses to the Consolidated Financial Statements and Item 7. MD&A — Critical Accounting Policies and Estimates in this Form 10-Q.
The following table presents a summary of activities in the allowance for loan losses for loans by portfolio segments for the first quarter of 2020:
|
| | | | | | | | | | | | | | | | | | | | | | | | | | | | | | | | |
| |
| ($ in thousands) | | March 31, 2020 |
| | Commercial | | Consumer | | Total |
| | C&I | | CRE | | Residential Mortgage | | Other Consumer | |
| | | CRE | | Multi-Family Residential | | Construction and Land | | Single- Family Residential | | HELOCs | | |
| Allowance for loan losses, December 31, 2019 | | $ | 238,376 |
| | $ | 40,509 |
| | $ | 22,826 |
| | $ | 19,404 |
| | $ | 28,527 |
| | $ | 5,265 |
| | $ | 3,380 |
| | $ | 358,287 |
|
| Impact of ASU 2016-13 adoption | | 74,237 |
| | 72,169 |
| | (8,112 | ) | | (9,889 | ) | | (3,670 | ) | | (1,798 | ) | | 2,221 |
| | 125,158 |
|
| Allowance for loan losses, January 1, 2020 | | 312,613 |
| | 112,678 |
| | 14,714 |
| | 9,515 |
| | 24,857 |
| | 3,467 |
| | 5,601 |
| | 483,445 |
|
| Provision for (reversal of ) credit losses | | 60,618 |
| | 11,435 |
| | 1,281 |
| | 1,482 |
| | 1,700 |
| | 412 |
| | (2,272 | ) | | 74,656 |
|
| Gross charge-offs | | (11,977 | ) | | (954 | ) | | — |
| | — |
| | — |
| | — |
| | (26 | ) | | (12,957 | ) |
| Gross recoveries | | 1,575 |
| | 9,660 |
| | 535 |
| | 21 |
| | 265 |
| | 2 |
| | 1 |
| | 12,059 |
|
| Total net charge-offs | | (10,402 | ) | | 8,706 |
| | 535 |
| | 21 |
| | 265 |
| | 2 |
| | (25 | ) | | (898 | ) |
| Foreign currency translation adjustments | | (200 | ) | | — |
| | — |
| | — |
| | — |
| | — |
| | — |
| | (200 | ) |
| Allowance for loan losses, March 31, 2020 | | $ | 362,629 |
| | $ | 132,819 |
| | $ | 16,530 |
| | $ | 11,018 |
| | $ | 26,822 |
| | $ | 3,881 |
| | $ | 3,304 |
| | $ | 557,003 |
|
| |
The following table presents a summary of activities in the allowance for unfunded credit commitments for the first quarter of 2020:
|
| | | | |
| |
| ($ in thousands) | | Three Months Ended
March 31, 2020 |
| Unfunded credit facilities | | |
| Allowance for unfunded credit commitments, December 31, 2019 | | $ | 11,158 |
|
| Impact of ASU 2016-13 adoption | | 10,457 |
|
| Allowance for unfunded credit commitments, January 1, 2020 | | 21,615 |
|
| Reversal of credit losses | | (786 | ) |
| Allowance for unfunded credit commitments, March 31, 2020 | | $ | 20,829 |
|
| | | |
| Total provision for credit losses | | $ | 73,870 |
|
| |
The following table presents a summary of activities in the allowance for loan losses and the allowance for unfunded credit commitments for the first quarter of 2019:
|
| | | | |
| |
| ($ in thousands) | | Three Months Ended
March 31, 2019 |
| Allowance for loan losses, beginning of period | | $ | 311,322 |
|
| Provision for loan losses | (a) | 20,640 |
|
| Gross charge-offs: | | |
| Commercial: | | |
| C&I | | (17,244 | ) |
| Consumer: | | |
| Other consumer | | (14 | ) |
| Total gross charge-offs | | (17,258 | ) |
| Gross recoveries: | | |
| Commercial: | | |
| C&I | | 2,251 |
|
| CRE: | | |
| CRE | | 222 |
|
| Multifamily residential | | 281 |
|
| Construction and land | | 63 |
|
| Total CRE | | 566 |
|
| Consumer: | | |
| Residential mortgage: | | |
| Single-family residential | | 2 |
|
| HELOCs | | 2 |
|
| Total residential mortgage | | 4 |
|
| Total gross recoveries | | 2,821 |
|
| Net charge-offs | | (14,437 | ) |
| Foreign currency translation adjustments | | 369 |
|
| Allowance for loan losses, end of period | | $ | 317,894 |
|
| | | |
| Unfunded credit facilities | | |
| Allowance for unfunded credit commitments, beginning of period | | $ | 12,566 |
|
| Provision for credit losses | (b) | 1,939 |
|
| Allowance for unfunded credit commitments, end of period | | $ | 14,505 |
|
| | | |
| Total provision for credit losses | (a) + (b) | $ | 22,579 |
|
| |
The following table presents the Company’s credit quality ratios for the first quarters of 2020 and 2019:
|
| | | | | | | | |
| |
| ($ in thousands) | | Three Months Ended March 31, |
| | 2020 | | 2019 |
| Average loans held-for-investment | | $ | 35,153,522 |
| | $ | 32,414,467 |
|
| Loans held-for-investment | | $ | 35,893,393 |
| | $ | 32,863,286 |
|
| Allowance for loan losses on loans to loans held-for-investment | | 1.55 | % | | 0.97 | % |
| Annualized net charge-offs to average loans held-for-investment | | 0.01 | % | | 0.18 | % |
| |
As of March 31, 2020, the allowance for loan losses amounted to $557.0 million or 1.55% of loans held-for-investment, compared with $358.3 million or 1.03% and $317.9 million or 0.97% of loans held-for-investment as of December 31, 2019 and March 31, 2019, respectively. The increase in allowance for loan losses was largely due to a combination of factors: the adoption of ASU 2016-13 which increased allowance for loan losses by $125.2 million, a deterioration in the forecasted macroeconomic variables related to the impact of COVID-19 pandemic and loan growth that resulted in a $73.9 million increase in provision for credit losses. Gross charge-offs of $13.0 million were primarily from C&I loans, which were almost entirely offset by recoveries, primarily from CRE loans. C&I charge-offs in the first quarter of 2020 of $12.0 million, primarily resulted from our oil and gas loan portfolio.
The allowance for unfunded credit commitments was $20.8 million as of March 31, 2020 and $11.2 million as of December 31, 2019. The allowance for unfunded credit commitments as of March 31, 2020 included a cumulative-effect adjustment due to the adoption of ASU 2016-13. The Company believes that the allowance for credit losses as of March 31, 2020 and December 31, 2019 was adequate.
The following table presents the Company’s allocation of the allowance for loan losses by portfolio segment and the ratio of each loan type to total loans held-for-investment as of March 31, 2020 and December 31, 2019:
|
| | | | | | | | | | | | | | | | | | | | |
| |
| ($ in thousands) | | March 31, 2020 | | December 31, 2019 |
| | Allowance Allocation | | % of Allowance to Total Allowance | | Loans as % of Total Loans | | Allowance Allocation | | % of Allowance to Total Allowance | | Loans as % of Total Loans |
| Commercial: | | | | | | | | | | | | |
| C&I | | $ | 362,629 |
| | 65 | % | | 35 | % | | $ | 238,376 |
| | 67 | % | | 35 | % |
| CRE: | | | | | | | | | | | | |
| CRE | | 132,819 |
| | 24 | % | | 30 | % | | 40,509 |
| | 11 | % | | 30 | % |
| Multifamily residential | | 16,530 |
| | 3 | % | | 8 | % | | 22,826 |
| | 6 | % | | 8 | % |
| Construction and land | | 11,018 |
| | 2 | % | | 2 | % | | 19,404 |
| | 5 | % | | 2 | % |
| Total CRE | | 160,367 |
| | 29 | % | | 40 | % | | 82,739 |
| | 22 | % | | 40 | % |
| Consumer: | | | | | | | | | | | | |
Residential mortgage:
| | | | | | | | | | | | |
| Single-family residential | | 26,822 |
| | 4 | % | | 20 | % | | 28,527 |
| | 8 | % | | 20 | % |
| HELOCs | | 3,881 |
| | 1 | % | | 4 | % | | 5,265 |
| | 2 | % | | 4 | % |
| Total residential mortgage | | 30,703 |
| | 5 | % | | 24 | % | | 33,792 |
| | 10 | % | | 24 | % |
| Other consumer | | 3,304 |
| | 1 | % | | 1 | % | | 3,380 |
| | 1 | % | | 1 | % |
| Total | | $ | 557,003 |
| | 100 | % | | 100 | % | | $ | 358,287 |
| | 100 | % | | 100 | % |
| |
The allowance for loan losses increased $198.7 million or 55% from December 31, 2019, primarily driven by ASU 2016-13 adoption impact of $74.2 million in C&I and $72.2 million in CRE loans, as well as first quarter 2020 provision for C&I credit losses of $60.6 million mainly due to the significant deterioration in the economic outlook from the COVID-19 pandemic.
Upon adoption of ASU 2016-13, allowance for loan losses for PCD loans is determined using the same methodology as other loans held-for-investment. As of December 31, 2019, the Company had no allowance for loan losses against $222.9 million of PCI loans.
Liquidity Risk Management
Liquidity
Liquidity is a financial institution’s capacity to meet its deposit and other counterparties’ obligations as they come due, or to obtain adequate funding at a reasonable cost to meet those obligations. The objective of liquidity management is to manage the potential mismatch of asset and liability cash flows. Maintaining an adequate level of liquidity depends on the institution’s ability to efficiently meet both expected and unexpected cash flows, and collateral needs without adversely affecting daily operations or the financial condition of the institution. To achieve this objective, the Company analyzes its liquidity risk, maintains readily available liquid assets and utilizes diverse funding sources including its stable core deposit base.
The Board of Directors’ Risk Oversight Committee has primary oversight responsibility. At the management level, the Company’s Asset/Liability Committee (“ALCO”) sets the liquidity guidelines that govern the day-to-day active management of the Company’s liquidity position. The ALCO regularly monitors the Company’s liquidity status and related management processes, and provides regular reports to the Board of Directors.
Liquidity Risk — Liquidity Sources. The Company’s primary source of funding is from deposits generated by its banking business, which is relatively stable and low-cost. Total deposits amounted to $38.69 billion as of March 31, 2020, compared with $37.32 billion as of December 31, 2019. The Company’s loan-to-deposit ratio was 93% as of both March 31, 2020 and December 31, 2019. In addition, the Company maintainshas access to various sources of wholesale funding, as well as borrowing capacity at the FHLB and Federal Reserve Bank of San Francisco (“FRB”) to sustain an adequate liquid asset portfolio, meet daily cash demands and allow management flexibility to execute its liquidity business strategy. Economic conditions and the stability of capital markets impact the Company’s access to and the cost of wholesale financing. The Company’s access to capital markets is also affected by the ratings received from various credit rating agencies. See Item 2— MD&A — Balance Sheet Analysis — Deposits and Other Sources of Funds in this Form 10-Q for further detail related to the form ofCompany’s funding sources.
The Company’s liquid assets include cash and cash equivalents, interest-bearing deposits with banks, short-term resale agreements and unpledged investmentAFS debt securities. These assets, which includesThe following table presents the Company’s reserve requirement of $698.5 million, totaled $6.22 billion and accounted for 15% of totalliquid assets as of June 30, 2019. In comparison, theseMarch 31, 2020 and December 31, 2019:
|
| | | | | | | | | | | | | | | | | | | | | | | | |
| |
| ($ in thousands) | | March 31, 2020 | | December 31, 2019 |
| | Encumbered | | Unencumbered | | Total | | Encumbered | | Unencumbered | | Total |
| Cash and cash equivalents | | $ | — |
| | $ | 3,080,042 |
| | $ | 3,080,042 |
| | $ | — |
| | $ | 3,261,149 |
| | $ | 3,261,149 |
|
| Interest-bearing deposits with banks | | — |
| | 293,509 |
| | 293,509 |
| | — |
| | 196,161 |
| | 196,161 |
|
| Short-term resale agreements | | — |
| | 400,000 |
| | 400,000 |
| | — |
| | 400,000 |
| | 400,000 |
|
| AFS debt securities | | 742,410 |
| | 2,953,533 |
| | 3,695,943 |
| | 479,432 |
| | 2,837,782 |
| | 3,317,214 |
|
| Total | | $ | 742,410 |
| | $ | 6,727,084 |
| | $ | 7,469,494 |
| | $ | 479,432 |
| | $ | 6,695,092 |
| | $ | 7,174,524 |
|
| |
Unencumbered liquid assets which includes the Company’s reserve requirement of $707.3 million,totaled $6.05$6.73 billion and accounted for 15% of total assets$6.70 billion as of March 31, 2020 and December 31, 2018. Investment2019, respectively. AFS debt securities included as part of liquidity sources are primarily comprised of mortgage-backed securities and debt securities issued by U.S. government agency and U.S. government sponsoredgovernment-sponsored enterprises, municipal securities, and foreign bonds and U.S. Treasury securities.bonds. The Company believes these available-for-sale investmentAFS debt securities provide quick sources of liquidity through sales or pledging to obtain financing, regardless of market conditions. Total deposits amounted to $36.48 billion as of June 30, 2019, compared to $35.44 billion as of December 31, 2018, of which core deposits comprised 71% and 74% of total deposits as of June 30, 2019 and December 31, 2018, respectively.conditions, through sale or pledging.
As a means of augmenting the Company’s liquidity, the Company maintains available borrowing capacity under secured borrowing lines with the FHLB and Federal Reserve Bank of San Francisco (“FRB”),FRB, unsecured federal funds lines of credit with various correspondent banks, and several master repurchase agreements with major brokerage companies. The Company’s available borrowing capacity with the FHLB and FRB was $5.98$6.68 billion and $2.83$2.91 billion, respectively, as of June 30, 2019.March 31, 2020. Unencumbered loans and/or securities were pledged to the FHLB and FRB discount window as collateral. Eligibility of collateral is defined in guidelines from the FHLB and FRB and is subject to change at their discretion. The Bank’s unsecured federal funds lines of credit, with correspondent banks, subject to availability, totaled $625.0$875.0 million with correspondent banks as of June 30, 2019. TheMarch 31, 2020. Estimated borrowing capacity from unpledged AFS debt securities totaled $2.51 billion as of March 31, 2020. In sum, the Company had available borrowing capacity of $13.0 billion as of March 31, 2020, and the Company believes that its liquidity sources are sufficient to meet all reasonably foreseeable short-term needs over the next 12 months.
The Company’s long-term funding source comes predominantly from core deposits. In addition, the Company may use long-term borrowings, repurchase agreements and unsecured debt issuance to sustain an adequate liquid asset portfolio, meet daily cash demands and allow management flexibility to execute business strategy. Economic conditions and the stability of capital markets impact the Company’s access to and the cost of wholesale financing. The Company’s access to capital markets is also affected by the ratings received from various credit rating agencies.
As of June 30, 2019, the Company is not aware of any trends, events or uncertainties that will or are reasonably likely to have a material effect on its liquidity position. Furthermore, the Company is not aware of any material commitmentsLiquidity Risk — Liquidity for capital expenditures in the foreseeable future.
East West. East West’s primary source of liquidity has historically been dependent on the payment ofis from cash dividends by its subsidiary, East West Bank. The Bank which areis subject to applicable statutes, regulationsvarious statutory and special approvalregulatory restrictions on its ability to pay dividends as discussed in Item 1. Business — Supervision and Regulation — Dividends and Other Transfers of Funds of the Company’s 20182019 Form 10-K. During the first halfquarters of 20192020 and 2018,2019, the Bank paid total dividends of $90.0$211.0 million and $70.0$40.0 million to East West, respectively.
Liquidity Risk — Liquidity Stress Testing.Liquidity stress testing is performed at the Company level, as well as at the foreign subsidiary and foreign branch levels. Stress testing and scenario analysis are intended to quantify the potential impact of a liquidity event on the financial and liquidity position of the entity. These scenarios include assumptions about significant changes in key funding sources, market triggers and potential uses of funding and economic conditions in certain countries. In addition, Company specific events are incorporated into the stress testing. Liquidity stress tests are conducted to ascertain potential mismatches between liquidity sources and uses over a variety of time horizons, both immediate and longer term, and over a variety of stressed conditions. Given the range of potential stresses, the Company maintains a series of contingency funding plans on a consolidated basis and for individual entities.
In response to recent developments relating to COVID-19, the Company is closely monitoring the impact of the pandemic on its business. The uncertainty surrounding COVID-19 and in the financial service industry in general could potentially impact the liquidity of the Company. The strained economic, capital, credit and/or financial market conditions may expose the Company to liquidity risk. As of March 31, 2020, the Company was not aware of any material commitments for capital expenditures in the foreseeable future and believes it has adequate liquidity resources to conduct operations and meet other needs in the ordinary course of business. Given the uncertainty and the rapidly changing market and economic conditions related to the COVID-19 pandemic, the Company will continue to actively evaluate the nature and extent of the impact of the COVID-19 pandemic on its business and financial position.
Consolidated Cash Flows Analysis
The following table presents a summary of the Company’s Consolidated Statement of Cash Flows for the first half of 2019periods indicated, which may be helpful to highlight business strategies and 2018.macro trends. In addition to this cash flow analysis, the discussion related to liquidity inItem 2.7. MD&A — Asset Liability and Market Risk Management — Liquidity Risk Management — Liquiditymay provide a more useful context in evaluating the Company’s liquidity position and related activity.
| | | | ($ in thousands) | | Six Months Ended June 30, | | Three Months Ended March 31, |
| | 2019 | | 2018 | | 2020 | | 2019 |
| Net cash provided by operating activities | | $ | 290,001 |
| | $ | 434,867 |
| | $ | 91,703 |
| | $ | 139,241 |
|
| Net cash used in investing activities | | (997,151 | ) | | (1,475,563 | ) | | (1,405,330 | ) | | (118,681 | ) |
| Net cash provided by financing activities | | 1,327,884 |
| | 1,172,615 |
| | 1,119,028 |
| | 749,370 |
|
| Effect of exchange rate changes on cash and cash equivalents | | (497 | ) | | (9,040 | ) | | 13,492 |
| | 14,018 |
|
| Net increase in cash and cash equivalents | | 620,237 |
| | 122,879 |
| |
| Net (decrease) increase in cash and cash equivalents | | | (181,107 | ) | | 783,948 |
|
| Cash and cash equivalents, beginning of period | | 3,001,377 |
| | 2,174,592 |
| | 3,261,149 |
| | 3,001,377 |
|
| Cash and cash equivalents, end of period | | $ | 3,621,614 |
| | $ | 2,297,471 |
| | $ | 3,080,042 |
| | $ | 3,785,325 |
|
| | | | | | | | | |
Operating activitiesActivities — Net cash provided by operating activities was $290.0$91.7 million and $434.9$139.2 million for the first halfquarters of 20192020 and 2018,2019, respectively. During the first halfquarters of 20192020 and 2018,2019, net cash provided by operating activities mainly reflected inflows of $314.4$144.8 million and $359.4$164.0 million from net income, respectively. During the first halfquarter of 2019,2020, net operating cash inflows also benefited from $105.3 million of non-cash adjustments of $113.6 million to reconcile net income to net operating cash, as well as $304.7 million of net changes in accrued expenses and other liabilities, partially offset by $150.2$462.8 million of net changes in accrued interest receivable and other assets. The $150.2 million of net changesIn comparison, during the same period in accrued interest receivable and other assets between June 30, 2019, and December 31, 2018 was primarily due to changes in derivative asset fair values. During the first half of 2018, net operating cash inflows benefited from $62.2 million of non-cash adjustments of $62.8 million to reconcile net income to net operating cash, as well as fromwhich was offset by $60.8 million of net changes in accrued expenses and other liabilities, of $44.0 million, partially offset by $32.2and $27.6 million of net changes in accrued interest receivable and other assets.
Investing activitiesActivities — Net cash used in investing activities was $997.2$1.41 billion and $118.7 million and $1.48 billion for the first halfquarters of 2020 and 2019, and 2018, respectively.During the first halfquarter of 2020, net cash used in investing activities primarily reflected cash outflows of $1.14 billion from loans held-for-investment, $372.0 million from AFS debt securities, $115.4 million from interest-bearing deposits with banks, and $27.6 million from net funding of investments in qualified affordable housing partnerships, tax credit and other investments. The cash outflows from loans held-for-investment were primarily due to C&I, CRE and single-family residential loan growth during the first quarter of 2020. These cash outflows used in investing activities were partially offset by cash inflows of $250.0 million from resale agreements. During the same period in 2019, net cash used in investing activities primarily reflected cash outflows of a $1.35 billion$465.0 million from theloans held-for-investment and $33.3 million from net increasefunding of investments in loans held-for-investment,qualified affordable housing partnerships, tax credit and other investments, partially offset by a $222.4$245.4 million decreaseincrease in interest-bearing deposits with banks and a $175.7 million net decrease in available-for-sale investment securities. During the first half of 2018, net cash used in investing activities primarily reflected outflowinflows from AFS debt securities of $1.26 billion from the net increase in loans held-for-investment, and a $503.7 million cash outflow related to the sale of the Bank’s eight DCB branches. These outflows were partially offset by a $232.8 million net decrease in available-for-sale investment securities and a $75.0 million decrease in resale agreements.$137.2 million.
Financing activitiesActivities — Net cash provided by financing activities was $1.33$1.12 billion and $1.17 billion$749.4 million for the first halfquarters of 20192020 and 2018,2019, respectively. During the first halfquarters of 2020, net cash provided by financing activities primarily reflected net increases of $1.37 billion in deposits and $40.0 million in short-term borrowings, partially offset by $146.0 million in shares repurchased, $100.0 million repayment of FHLB advances, and $41.4 million in cash dividends. During the same period in 2019, net cash provided by financing activities primarily reflected a $1.04 billion net increase of $800.1 million in deposits, and a $418.0 million net increase in FHLB advances, partially offset by $34.9 million in cash dividends of $74.9 milliondividends.
Market Risk Management
Market risk is the risk that the Company’s financial condition may change resulting from adverse movements in market rates or prices including interest rates, foreign exchange rates, interest rate contracts, investment securities prices, and a $38.1 million decreaserelated risk resulting from mismatches in short-term borrowings. Duringrate sensitive assets and liabilities.
The Board’s Risk Oversight Committee has primary oversight responsibility. At the first half of 2018, net cash provided by financing activities primarily reflected a $1.20 billion net increasemanagement level, the ALCO establishes and monitors compliance with the policies and risk limits pertaining to market risk management activities. Corporate Treasury supports the ALCO in depositsmeasuring, monitoring and a $59.9 million increase in short-term borrowings, partially offset by cash dividends of $59.2 million.managing interest rate risk as well as all other market risks.
Interest Rate Risk Management
Interest rate risk results primarily from the Company’s traditional banking activities of gathering deposits and extending loans, and is the primary market risk for the Company. Economic and financial conditions, movements in interest rates, and consumer preferences impact the level of noninterest-bearing funding sources at the Company, and affect the difference between the interest the Company earns on interest-earning assets and pays on interest-bearing liabilities. In addition, changes in interest rates can influence the rate of principal prepayments on loans and the speed of deposit withdrawals. Due to the pricing term mismatches and the embedded options inherent in certain products, changes in market interest rates not only affect expected near-term earnings, but also the economic value of these interest-earning assets and interest-bearing liabilities. Other market risks include foreign currency exchange risk and equity price risk. These risks are not considered significant to the Company and no separate quantitative information concerning these risks is presented herein.
With oversight by the Company’s Board of Directors, the ALCO coordinates the overall management of the Company’s interest rate risk. The ALCO meets regularly and is responsible for reviewing the Company’s open market positions and establishing policies to monitor and limit exposure to market risk. Management of interest rate risk is carried out primarily through strategies involving the Company’s investment securities portfolio, loan portfolio, available funding channels and capital market activities. In addition, the Company’s policies permit the use of derivative instruments to assist in managing interest rate risk. Refer to Item 2. MD&A — Asset Liability and Market Risks Management — Derivatives in this Form 10-Q for additional information.
The interest rate risk exposure is measured and monitored through various risk management tools, which include a simulation model that performs interest rate sensitivity analyses under multiple interest rate scenarios. The model incorporates the Company’s cash instruments, loans, investmentdebt securities, resale agreements, deposits, borrowings and repurchase agreements, as well as financial instruments from the Company’s foreign operations. The Company incorporates both a static balance sheet and a forward growth balance sheet in order to perform these analyses. The simulated interest rate scenarios include a non-parallel shift in the yield curve (“rate shock”) and a gradual non-parallel shift in the yield curve (“rate ramp”). In addition, the Company also performs simulations using alternative interest rate scenarios, including various permutations of the yield curve flattening, steepening or inverting. Results of these various simulations are used to formulate and gauge strategies to achieve a desired risk profile within the Company’s capital and liquidity guidelines.
The net interest income simulation model is based on the actual maturity and re-pricing characteristics of the Company’s interest-rate sensitive assets, liabilities and related derivative contracts. It also incorporates various assumptions, which management believes to be reasonable but may have a significant impact on results. These assumptions include, but are not limited to, the timing and magnitude of changes in interest rates, the yield curve evolution and shape, the correlation between various interest rate indices, financial instrument future repricing characteristics and spread relative to benchmark rates, and the effect of interest rate floors and caps. The modeled results are highly sensitive to deposit decay and deposit beta assumptions, derived from a regression analysis of the Company’s historical deposit data. Deposit beta commonly refers to the correlation of the change in interest rates paid on deposits to changes in benchmark market interest rates. The model is also sensitive to the loan and investment prepayment assumptions, based on an independent model and the Company’s historical prepayment data, which consider anticipated prepayments under different interest rate environments.
Simulation results are highly dependent on input assumptions. To the extent actual behavior is different from the assumptions in the models, there could be a material change in interest rate sensitivity. The assumptions applied in the model are documented and supported for reasonableness, and periodically back-tested to assess their effectiveness. The Company makes appropriate calibrations to the model as needed, continually refining the model, methodology and results. Changes to key model assumptions are reviewed by the ALCO. Scenario results do not reflect strategies that management could employ to limit the impact of changing interest rate expectations.
Twelve-Month Net Interest Income Simulation
Net Interest Income simulation is a modeling technique that looks at interest rate risk through earnings. It projects the changes in interest rate sensitive asset and liability cash flows, expressed in terms of Net Interest Income,net interest income, over a specified time horizon for defined interest rates scenarios. Net Interest Incomeinterest income simulations generate insight into the impact of changes in market rates changes on earnings and guide risk management decisions. The Company assesses interest rate risk by comparing net interest income using different interest rate scenarios.
The following table presents the Company’s net interest income sensitivity as of June 30, 2019March 31, 2020 and December 31, 2018,2019 related to an instantaneous and sustained non-parallel shift in market interest rates of 100 and 200 basis points in both directions:
| | | Change in Interest Rates
(Basis Points) | | Net Interest Income Volatility (1) | | Net Interest Income Volatility (1) |
| | June 30, 2019 | | December 31, 2018 | | March 31, 2020 | | December 31, 2019 |
| +200 | | 14.8 | % | | 16.6 | % | | 12.8 | % | | 13.2 | % |
| +100 | | 7.2 | % | | 8.4 | % | | 5.7 | % | | 6.7 | % |
| -100 | | (8.2 | )% | | (8.3 | )% | | (0.4 | )% | | (5.5 | )% |
| -200 | | (15.9 | )% | | (16.7 | )% | | (0.7 | )% | | (8.7 | )% |
|
| |
| (1) | The percentage change represents net interest income over 12 months in a stable interest rate environment versus net interest income in the various rate scenarios. |
The Company’s estimated twelve-month net interest income sensitivity as of June 30, 2019March 31, 2020 was lower when compared towith the sensitivity as of December 31, 2018,2019, for both the upward 100 and upward 200 basis point rate scenarios. This reflects a greater rate of upward repricing in the Company’s deposit portfolio, offsettingwhich offsets simulated increases in interest income from higher interest rates.rates on assets. The reduction in simulated increases in interest income is also impacted by the increase in the population of floating rate loans that are currently at their floors, which has increased under the current low interest rate environment. In both of the simulated downward interest rate scenarios, sensitivity is primarily decreased mainly due to the impactas a result of the changes150 basis point reduction in the yield curve between June 30, 2019federal funds target rate range to 0.00% and December 31, 2018.0.25% during March 2020.
The Company’s net interest income profile as of June 30, 2019March 31, 2020 reflects an asset sensitive position. Net interest income would be expected to increase if interest rates rise and to decrease if interest rates decline.decline, albeit the federal funds rate is floored at the target range between 0.00% and 0.25%. The Company is naturally asset sensitive due to the large share of variable rate loans in its loan portfolio, which are primarily linked to Prime and LIBOR indices. The Company’s interest income is vulnerable to changes in short-term interest rates. The Company’s deposit portfolio is primarily comprised of non-maturity deposits, which are not directly tied to short-term interest rate indices, but are, nevertheless, sensitive to changes in short-term interest rates.
The federal funds target rate was between 2.25%0.00% and 2.50%0.25% as of both June 30, 2019March 31, 2020 and between 1.50% and 1.75% as of December 31, 2018.2019. In its statement released on June 19, 2019,March 3, 2020, the Federal Open Market Committee (“FOMC”) decided to maintainlower the target range for the federal funds rate at 2.25% to 2.50%,a range of between 1.00% to 1.25% and, in lighton March 15, 2020, further announced its decision to lower the target range to 0.00% and 0.25%. The Fed deemed that the effects of increased uncertainties in globalthe COVID-19 pandemic will weigh on economic and financial developments and muted inflation pressures, the FOMC will act as appropriate to sustain expansion. The market perceived the statement as laying the foundation for interest rate cutsactivity in the near-term.near term and pose risks to the economic outlook.
While an instantaneous and sustained non-parallel shift in market interest rates was used in the simulation model described in the preceding paragraphs, the Company believes that any shift in interest rates would likely be more gradual and would therefore have a more modest impact. The rate ramp table below shows the net income volatility under a gradual non-parallel shift upward and downward of the yield curve in even quarterly increments over the first twelve months, followed by rates held constant thereafter:
| | | Change in Interest Rates
(Basis Points) | | Net Interest Income Volatility (1) | | Net Interest Income Volatility (1) |
| | June 30, 2019 | | December 31, 2018 | | March 31, 2020 | | December 31, 2019 |
| +200 Rate Ramp | | 8.1 | % | | 6.3 | % | | 5.0 | % | | 6.0 | % |
| +100 Rate Ramp | | 4.0 | % | | 3.0 | % | | 2.2 | % | | 3.0 | % |
| -100 Rate Ramp | | (4.2 | )% | | (3.0 | )% | | (0.3 | )% | | (2.6 | )% |
| -200 Rate Ramp | | (9.2 | )% | | (6.3 | )% | | (0.4 | )% | | (5.1 | )% |
|
| |
| (1) | The percentage change represents net interest income under a gradual non-parallel shift in even quarterly increments over 12 months. |
The Company believes that the rate ramp table, shown above, when evaluated together with the results of the rate shock simulation, presents a better indication of the potential impact to the Company’s twelve-month net interest income in a rising and falling rate scenario. Between June 30, 2019March 31, 2020 and December 31, 2018,2019, the Company’s modeled sensitivity increasedslightly decreased under a ramp simulation. This reflects model refinements to better incorporate the current, inverted yield curve in the analysis, as well as the gradual spreading of interest rate changes over 12 months, rather than at the end of each quarters.
Economic Value of Equity at Risk
Economic value of equity (“EVE”) is a cash flow calculation that takes the present value of all asset cash flows and subtracts the present value of all liability cash flows. This calculation is used for asset/liability management and measures changes in the economic value of the bank. The fair market values of a bank's assets and liabilities are directly linked to interest rates. In some ways, the economic value approach provides a broader scope than the net income volatility approach since it captures all anticipated cash flows.
EVE simulation reflects the effect of interest rate shifts on the value of the Company and is used to assess the degree of interest rate risk exposure. In contrast to the earnings perspective, the economic perspective identifies risk arising from repricing or maturity gaps for the life of the balance sheet. Changes in economic value indicate anticipated changes in the value of the bank’s future cash flows. Thus, the economic perspective can provide a leading indicator of the bank’s future earnings and capital values. The economic valuation method also reflects those sensitivities across the full maturity spectrum of the bank’s assets and liabilities.
The following table presents the Company’s EVE sensitivity as of June 30, 2019March 31, 2020 and December 31, 20182019 related to an instantaneous and sustained non-parallel shift in market interest rates of 100 and 200 basis points in both directions:
| | | | | | | | | | | |
Change in Interest Rates
(Basis Points) | | EVE Volatility (1) | | EVE Volatility (1) |
| | June 30, 2019 | | December 31, 2018 | | March 31, 2020 | | December 31, 2019 |
| +200 | | 15.5 | % | | 6.3 | % | | 11.2 | % | | 7.0 | % |
| +100 | | 7.2 | % | | 1.2 | % | | 6.5 | % | | 3.6 | % |
| -100 | | (3.1 | )% | | (3.1 | )% | | (0.9 | )% | | (1.4 | )% |
| -200 | | (13.1 | )% | | (11.9 | )% | | (5.8 | )% | | (3.5 | )% |
| | | | | | | | | |
| |
| (1) | The percentage change represents net portfolio value of the Company in a stable interest rate environment versus net portfolio value in the various rate scenarios. |
The Company’s EVE sensitivity for both of the upward and downward interest rate scenarios increased as of June 30, 2019March 31, 2020. The sensitivity for the downward 100 basis points scenario decreased while the sensitivity for the downward 200 basis points scenario increased or remained flat fromas of March 31, 2020, as compared with the results as of December 31, 2018.2019. The increaseschanges in EVE sensitivity during this period were primarily due to changesthe reduced base EVE and the change in thelevel and shape of the yield curve being inverted.curve.
The Company’s EVE profile as of June 30, 2019March 31, 2020 reflects an asset sensitive EVE position. The Company is naturally asset sensitive due to the large share of variable rate loans in its loan portfolio, which are primarily linked to Prime and LIBOR indices. The Company’s interest income is vulnerable to changes in short-term interest rates. The Company’s deposit portfolio is primarily funded by non-maturity deposits, which are not directly tied to short-term interest rate indices, but are, nevertheless, sensitive to changes in short-term interest rates. Given the uncertainty of the magnitude, timing and direction of future interest rate movements, and the shape of the yield curve, actual results may vary from those predicted by the Company’s model.
Derivatives
It is the Company’s policy not to speculate on the future direction of interest rates, foreign currency exchange rates and commodity prices. However, the Company will, from time to time, enter into derivative transactions in order to reduce its exposure to market risks, primarily interest rate risk and foreign currency risk. The Company believes that these derivative transactions, when properly structured and managed, may provide a hedge against inherent risk in certain assets and liabilities and against risk in specific transactions. Hedging transactions may be implemented using a variety of derivative instruments such as swaps, caps, floors, forwards and options. Prior to entering into any hedging activities, the Company analyzes the costs and benefits of the hedge in comparison to alternative strategies. In addition, the Company enters into derivative transactions in order to assist customers with their risk management objectives, primarily to manage exposures to fluctuations in interest rates, foreign currencies and commodity prices. To economically hedge against the derivative contracts entered into with the Company’s customers, the Company enters into mirrored derivative contracts with third-party financial institutions. The exposures from derivative transactions are collateralized by cash and/or eligible securities based on limits as set forth in the respective agreements entered between the Company and the financial institutions.
The Company is subject to credit risk associated with the counterparties to the derivative contracts. This counterparty credit risk is a multidimensional form of risk, affected by both the exposure to a counterparty and the credit quality of the counterparty, both of which are sensitive to market-induced changes. The Company’s Credit Risk Management Committee provides oversight of credit risks and the Company has guidelines in place to manage counterparty concentration, tenor limits and collateral. The Company manages the credit risk of its derivative positions by diversifying its positions among various counterparties, by entering into legally enforceable master netting arrangements and requiring collateral arrangements, where possible. The Company may also transfer counterparty credit risk related to interest rate swaps to institutional third parties through the use of credit risk participation agreements (“RPAs”). Certain derivative contracts are required to be centrally cleared through clearinghouses to further mitigate counterparty credit risk. The Company incorporates credit value adjustments and other market standard methodologies to appropriately reflect both its own nonperformance risk and the respective counterparty’s nonperformance risk in the fair value measurements of its derivatives.
Fair Value Hedges — As of June 30, 2019,March 31, 2020, the Company had two cancellable interest rate swap contracts with original terms of 20 years. These swap contracts involve the exchange of variable rate payments over the life of the agreements without the exchange of the underlying notional amounts. The changes in fair value of the hedged brokered certificates of deposit are expected to be effectively offset by the changes in fair value of the swaps throughout the terms of these contracts.
Net Investment Hedges — ASC 830-20, Foreign Currency Matters — Foreign Currency Transactions and ASC 815, Derivatives and Hedging, allow hedging of the foreign currency risk of a net investment in a foreign operation. The Company entered into foreign currency forward contracts to hedge its investment in East West Bank (China) Limited, a non-U.S. dollar (“USD”) functional currency subsidiary in China. The hedging instruments designated as net investment hedges, involve hedging the risk of changes in the USD equivalent value of a designated monetary amount of the Company’s net investment in East West Bank (China) Limited, against the risk of adverse changes in the foreign currency exchange rate of the Chinese Renminbi.Renminbi (“RMB”). As of June 30, 2019,March 31, 2020, the outstanding foreign currency forwards effectively hedged approximately 90%92% of the Chinese RenminbiRMB exposure in East West Bank (China) Limited. The fluctuation in foreign currency translation of the hedged exposure is expected to be offset by changes in the fair value of the forwards.
Interest Rate Contracts — The Company offers various interest rate derivative contracts to its customers. When derivative transactions are executed with its customers, the derivative contracts are offset by paired trades with third-party financial institutions including with central clearing organizations. Certain derivative contracts entered with central clearing organizations are settled-to-market daily to the extent the central clearing organizations’ rulebooks legally characterize the variation margin as settlement. Derivative contracts allow borrowers to lock in attractive intermediate and long-term fixed rate financing while not increasing the interest rate risk to the Company. These transactions are not linked to specific Company assets or liabilities on the Consolidated Balance Sheet or to forecasted transactions in a hedging relationship and, therefore, are economic hedges. The contracts are marked to marketmarked-to-market at each reporting period. The changes in fair values of the derivative contracts traded with third-party financial institutions are expected to be largely comparable to the changes in fair values of the derivative transactions executed with customers throughout the terms of these contracts, except for the credit valuation adjustment component. The Company records credit valuation adjustments on derivatives to properly reflect the variances of credit worthiness between the Company and the counterparties, considering the effects of enforceable master netting agreements and collateral arrangements.
Foreign Exchange Contracts — The Company enters into foreign exchange contracts with its customers, consisting of forward, spot, swap and option contracts to accommodate the business needs of its customers. For a portion of the foreign exchange contracts entered into with its customers, the Company enteredmanaged its foreign exchange exposure by entering into offsetting foreign exchange contracts with third-party financial institutions and/or entering into bilateral collateral and master netting agreements with customer counterparties to manage its credit exposure. The changes in the fair values entered with third-party financial institutions are expected to be largely comparable to the changes in fair values of the foreign exchange transactions executed with the customers throughout the terms of these contracts. The Company also utilizes foreign exchange contracts that are not designated as hedging instruments to mitigate the economic effect of fluctuations in certain foreign currency on-balance sheet assets and liabilities, primarily foreign currency denominated deposits offered to its customers. The Company’s policies permit taking proprietary currency positions within approved limits, in compliance with the proprietary trading exemption provided under Section 619 of the Dodd-Frank Wall Street Reform and Consumer Protection Act (the “Dodd-Frank Act”). The Company does not speculate in the foreign exchange markets, and actively manages its foreign exchange exposures within prescribed risk limits and defined controls.
Credit Contracts — The Company may periodically enter into RPAs to manage the credit exposure on interest rate contracts associated with its syndicated loans. The Company may enter into protection sold or protection purchased RPAs with institutional counterparties. Under the RPA, the Company will receive or make a payment if a borrower defaults on the related interest rate contract. The Company manages its credit risk on the RPAs by monitoring the credit worthiness of the borrowers, which is based on the Company’s normal credit review process.
Equity Contracts — TheAs part of the loan origination process, from time to time, the Company obtained warrants to purchase preferred andand/or common stock of technology and life sciences companies as part of the loan origination process.it provides loans to. The warrants included on the Consolidated Financial Statements were from public and private companies.
Commodity Contracts — The Company entered into energy commodity contracts with its customers to allow them to hedge against the risk of fluctuation in energy commodity prices. To economically hedge against the risk of fluctuation in commodity prices in the products offered to its customers, the Company enters into offsetting commodity contracts with third-party financial institutions including with central clearing organizations. Certain derivative contracts entered with central clearing organizations are settled to market daily to the extent the central clearing organizations’ rulebooks legally characterize the variation margin as settlement. The changes in fair values of the energy commodity contracts traded with third-party financial institutions are expected to be largely comparable to the changes in fair values of the energy commodity transactions executed with customers throughout the terms of these contracts.
Additional information on the Company’s derivatives is presented in Note 1 — Summary of Significant Accounting Policies — Derivatives to the Consolidated Financial Statements of the Company’s 20182019 Form 10-K, Note 43 — Fair Value Measurement and Fair Value of Financial Instruments and Note 76 — Derivatives to the Consolidated Financial Statements of this report.Form 10-Q.
Impact of Inflation
The consolidated financial statements and related financial data presented in this report have been prepared according to GAAP, which require the measurement of financial and operating results in terms of historical dollars without considering the change in the relative purchasing power of money over time due to inflation. The primary impact of inflation on our operations is reflected in increased operating costs and the effect that general inflation may have on both short-term and long-term interest rates. Since almost all the assets and liabilities of a financial institution are monetary in nature, interest rates generally have a more significant impact on a financial institution's performance than do general levels of inflation. Although inflation expectations do affect interest rates, interest rates do not necessarily move in the same direction or to the same extent as the prices of goods and services.
Critical Accounting Policies and Estimates
The Company’s significant accounting policies and use of estimates (see(for significant accounting policies and use of estimates of allowance for credit losses, see Note 2 — Current Accounting Developments and Summary of Significant Accounting Policies in this Form 10-Q and for all other significant accounting policies and use of estimates, see Note 1 — Summary of Significant Accounting Policies and Item 7. MD&A — Critical Accounting Policies and Estimates of the Company’s 20182019 Form 10-K) are fundamental to understanding its results of operations and financial condition. Some accounting policies, by their nature, are inherently subject to estimation methods,techniques, valuation assumptions and mayother subjective assessments. In addition, some significant accounting policies require significant judgment in applying complex accounting principles to individual transactions.transactions to determine the most appropriate treatment. The Company has procedures and processes in place to facilitate making these judgments.
Certain accounting policies are considered to have a critical effect on the Company’s Consolidated Financial Statements in the Company’s judgment. Critical accounting policies are defined as those that require the most complex or subjective judgments and are reflective of significant uncertainties, and whose actual results could differ from the Company’s estimates. Future changes in the key variables could change future valuations and impact the results of operations. In each area, the Company has identified the most important variables in the estimation process. The Company has used the best information available to make the estimations necessary for the related assets and liabilities. The following accounting policies are critical to the Company’s Consolidated Financial Statements as they require management to make subjective and complex judgments about matters that are inherently uncertain where actual results could differ materially from the Company’s estimates:
fair value of financial instruments;
allowance for credit losses;
goodwill impairment; and
income taxes.
Recently Issued Accounting Standards
For detailed discussion and disclosure on new accounting pronouncements adopted and recent accounting pronouncements issued, see Note 2 — Current Accounting Developments and Summary of Significant Accounting Policies to the Consolidated Financial Statements in this Form 10-Q.
Supplemental Information — Explanation of GAAP and Non-GAAP Financial Measures
To supplement the Company’s unaudited interim Consolidated Financial Statements presented in accordance with GAAP, the Company uses certain non-GAAP measures of financial performance. Non-GAAP financial measures are not in accordance with, or an alternative to GAAP. Generally, a non-GAAP financial measure is a numerical measure of a company’s performance that either excludes or includes amounts that are not normally excluded or included in the most directly comparable measure calculated and presented in accordance with GAAP. A non-GAAP financial measure may also be a financial metric that is not required by GAAP or other applicable requirement. The Company believes these non-GAAP financial measures, when taken together with the corresponding GAAP financial measures, provide meaningful supplemental information regarding its performance, and allow comparability to prior periods. These non-GAAP financial measures may be different from non-GAAP financial measures used by other companies, limiting their usefulness for comparison purposes.
During the first quarter of 2019, the Company recorded a $7.0 million pre-tax impairment charge related to DC Solar. During the second quarter of 2019, the Company reversed $30.1 million of certain previously claimed tax credits related to DC Solar. During the first quarter of 2018, the Company sold its eight DCB branches and recognized a pre-tax gain on sale of $31.5 million. Management believes that excluding the nonrecurring after-tax impact of the impairment charge related to DC Solar, the reversal of certain previously claimed tax credits related to DC Solar and the after-tax impact of the gain on the sale of the Bank’s DCB branches from net income, diluted EPS, ROA, ROE and effective tax rate, will provide clarity to financial statement users regarding the ongoing performance of the Company and allows comparability to prior periods.
Non-GAAP efficiency ratio represents non-GAAP noninterest expense divided by non-GAAP revenue. Non-GAAP revenue represents the aggregate of net interest income and non-GAAP noninterest income, where non-GAAP noninterest income excludes the gain on the sale of the DCB branches that were sold in the first quarter of 2018. Non-GAAP noninterest expense excludes the amortization of tax credit and other investments and the amortization of core deposit intangibles. Non-GAAP tangible common equity represents stockholders’ equity, which has been reduced by goodwill and other intangible assets.
The following tables present the reconciliations of GAAP to non-GAAP financial measures for the periods presented:
| | | | ($ and shares in thousands, except per share data) | ($ and shares in thousands, except per share data) | | | Three Months Ended June 30, | | Six Months Ended June 30, | ($ and shares in thousands, except per share data) | | | Three Months Ended March 31, |
| | 2019 | | 2018 | | 2019 | | 2018 | | 2020 | | 2019 |
| Net income | | (a) | | $ | 150,380 |
| | $ | 172,349 |
| | $ | 314,404 |
| | $ | 359,381 |
| | (a) | | $ | 144,824 |
| | $ | 164,024 |
|
Add: Impairment charge related to DC Solar (1) | | — |
| | — |
| | 6,978 |
| | — |
| | — |
| | 6,978 |
|
| Less: Gain on sale of business | | — |
| | — |
| | — |
| | (31,470 | ) | |
Tax effect of adjustments (2) | | — |
| | — |
| | (2,063 | ) | | 9,303 |
| | — |
| | (2,063 | ) |
| Add: Reversal of certain previously claimed tax credits related to DC Solar | | 30,104 |
| | — |
| | 30,104 |
| | — |
| |
| Non-GAAP net income | | (b) | | $ | 180,484 |
| | $ | 172,349 |
| | $ | 349,423 |
| | $ | 337,214 |
| | (b) | | $ | 144,824 |
| | $ | 168,939 |
|
| | | | | | | | | | | | | |
| Diluted weighted-average number of shares outstanding | | 146,052 |
| | 146,091 |
| | 146,016 |
| | 146,046 |
| | 145,285 |
| | 145,921 |
|
| | | | | | | | | | | | | |
| Diluted EPS | | $ | 1.03 |
| | $ | 1.18 |
| | $ | 2.15 |
| | $ | 2.46 |
| | $ | 1.00 |
| | $ | 1.12 |
|
| Diluted EPS impact of impairment charge related to DC Solar, net of tax | | — |
| | — |
| | 0.03 |
| | — |
| | — |
| | 0.04 |
|
| Diluted EPS impact of gain on sale of business, net of tax | | — |
| | — |
| | — |
| | (0.15 | ) | |
| Diluted EPS impact of reversal of certain previously claimed tax credits related to DC Solar | | 0.21 |
| | — |
| | 0.21 |
| | — |
| |
| Non-GAAP diluted EPS | | $ | 1.24 |
| | $ | 1.18 |
| | $ | 2.39 |
| | $ | 2.31 |
| | $ | 1.00 |
| | $ | 1.16 |
|
| | | | | | | | | | | | | |
| Average total assets | | (c) | | $ | 41,545,441 |
| | $ | 37,568,895 |
| | $ | 41,144,152 |
| | $ | 37,475,515 |
| | (c) | | $ | 44,755,509 |
| | $ | 40,738,404 |
|
| Average stockholders’ equity | | (d) | | $ | 4,684,348 |
| | $ | 4,062,311 |
| | $ | 4,611,231 |
| | $ | 3,993,004 |
| | (d) | | $ | 5,022,005 |
| | $ | 4,537,301 |
|
ROA (3) | | (a)/(c) | | 1.45 | % | | 1.84 | % | | 1.54 | % | | 1.93 | % | | (a)/(c) | | 1.30 | % | | 1.63 | % |
Non-GAAP ROA (3) | | (b)/(c) | | 1.74 | % | | 1.84 | % | | 1.71 | % | | 1.81 | % | | (b)/(c) | | 1.30 | % | | 1.68 | % |
ROE (3) | | (a)/(d) | | 12.88 | % | | 17.02 | % | | 13.75 | % | | 18.15 | % | | (a)/(d) | | 11.60 | % | | 14.66 | % |
Non-GAAP ROE (3) | | (b)/(d) | | 15.45 | % | | 17.02 | % | | 15.28 | % | | 17.03 | % | | (b)/(d) | | 11.60 | % | | 15.10 | % |
|
| |
| (1) | Included in Amortization of tax credit and other investments on the Consolidated Statement of Income. |
| |
| (2) | Applied statutory raterates of 28.35% for the first quarter of 2020 and 29.56%. for the first quarter of 2019. |
|
| | | | | | | | | | | | | | | | | | |
| |
| ($ in thousands) | | | Three Months Ended June 30, | | Six Months Ended June 30, |
| | 2019 | | 2018 | | 2019 | | 2018 |
| Income tax expense | | (a) | | $ | 72,797 |
| | $ | 24,643 |
| | $ | 103,864 |
| | $ | 49,395 |
|
| Less: Reversal of certain previously claimed tax credits related to DC Solar | | (b) | | (30,104 | ) | | — |
| | (30,104 | ) | | — |
|
| Non-GAAP income tax expense | | (c) | | $ | 42,693 |
| | $ | 24,643 |
| | $ | 73,760 |
| | $ | 49,395 |
|
| | | | | | | | | | | |
| Income before income taxes | | (d) | | 223,177 |
| | 196,992 |
| | 418,268 |
| | 408,776 |
|
| | | | | | | | | | | |
| Effective tax rate | | (a)/(d) | | 32.6 | % | | 12.5 | % | | 24.8 | % | | 12.1 | % |
| Less: Reversal of certain previously claimed tax credits related to DC Solar | | (b)/(d) | | (13.5 | )% | | — | % | | (7.2 | )% | | — | % |
| Non-GAAP effective tax rate | | (c)/(d) | | 19.1 | % | | 12.5 | % | | 17.6 | % | | 12.1 | % |
| |
|
| | | | | | | | | | |
| |
| ($ in thousands) | | | Three Months Ended March 31, |
| | 2020 | | 2019 |
| Net interest income before provision for credit losses | | (a) | | $ | 362,707 |
| | $ | 362,461 |
|
| Total noninterest income | | | | 54,049 |
| | 42,131 |
|
| Total revenue | | (b) | | $ | 416,756 |
| | $ | 404,592 |
|
| | | | | | | |
| Total noninterest expense | | (c) | | $ | 178,876 |
| | $ | 186,922 |
|
| Less: Amortization of tax credit and other investments | | | | (17,325 | ) | | (24,905 | ) |
| Amortization of core deposit intangibles | | | | (953 | ) | | (1,174 | ) |
| Non-GAAP noninterest expense | | (d) | | $ | 160,598 |
| | $ | 160,843 |
|
| | | | | | | |
| Efficiency ratio | | (c)/(b) | | 42.92 | % | | 46.20 | % |
| Non-GAAP efficiency ratio | | (d)/(b) | | 38.54 | % | | 39.75 | % |
| |
|
| | | | | | | | | | | | | | | | | | |
| |
| ($ in thousands) | | | Three Months Ended June 30, | | Six Months Ended June 30, |
| | 2019 | | 2018 | | 2019 | | 2018 |
| Net interest income before provision for credit losses | | (a) | | $ | 367,326 |
| | $ | 341,679 |
| | $ | 729,787 |
| | $ | 668,372 |
|
| Total noninterest income | | | | 52,759 |
| | 48,268 |
| | 94,890 |
| | 122,712 |
|
| Total revenue | | (b) | | $ | 420,085 |
| | $ | 389,947 |
| | $ | 824,677 |
| | $ | 791,084 |
|
| Noninterest income | | | | 52,759 |
| | 48,268 |
| | 94,890 |
| | 122,712 |
|
| Less: Gain on sale of business | | | | — |
| | — |
| | — |
| | (31,470 | ) |
| Non-GAAP noninterest income | | (c) | | $ | 52,759 |
| | $ | 48,268 |
| | $ | 94,890 |
| | $ | 91,242 |
|
| Non-GAAP revenue | | (a)+(c)=(d) | | $ | 420,085 |
| | $ | 389,947 |
| | $ | 824,677 |
| | $ | 759,614 |
|
| | | | | | | | | | | |
| Total noninterest expense | | (e) | | $ | 177,663 |
| | $ | 177,419 |
| | $ | 364,585 |
| | $ | 346,554 |
|
| Less: Amortization of tax credit and other investments | | | | (16,739 | ) | | (20,481 | ) | | (41,644 | ) | | (37,881 | ) |
| Amortization of core deposit intangibles | | | | (1,152 | ) | | (1,373 | ) | | (2,326 | ) | | (2,858 | ) |
| Non-GAAP noninterest expense | | (f) | | $ | 159,772 |
| | $ | 155,565 |
| | $ | 320,615 |
| | $ | 305,815 |
|
| | | | | | | | | | | |
| Efficiency ratio | | (e)/(b) | | 42.29 | % | | 45.50 | % | | 44.21 | % | | 43.81 | % |
| Non-GAAP efficiency ratio | | (f)/(d) | | 38.03 | % | | 39.89 | % | | 38.88 | % | | 40.26 | % |
| |
| | | | ($ in thousands) | | June 30,
2019 | | March 31,
2019 | | June 30,
2018 | |
($ and shares in thousands, except per share data) | |
($ and shares in thousands, except per share data) | | March 31,
2020 | | December 31,
2019 | | March��31,
2019 |
| Stockholders’ equity | | (a) | | $ | 4,734,593 |
| | $ | 4,591,930 |
| | $ | 4,114,284 |
| | (a) | | $ | 4,902,985 |
| | $ | 5,017,617 |
| | $ | 4,591,930 |
|
| Less: Goodwill | | (465,697 | ) | | (465,697 | ) | | (465,547 | ) | | (465,697 | ) | | (465,697 | ) | | (465,697 | ) |
Other intangible assets (1) | | (18,952 | ) | | (21,109 | ) | | (25,029 | ) | | (14,769 | ) | | (16,079 | ) | | (21,109 | ) |
| Non-GAAP tangible common equity | | (b) | | $ | 4,249,944 |
| | $ | 4,105,124 |
| | $ | 3,623,708 |
| | (b) | | $ | 4,422,519 |
| | $ | 4,535,841 |
| | $ | 4,105,124 |
|
| | | | | | | | | | | | | |
| Number of common shares at period-end | | (c) | | 145,547 |
| | 145,501 |
| | 144,905 |
| | (c) | | 141,435 |
| | 145,625 |
| | 145,501 |
|
| Non-GAAP tangible common equity per share | | (b)/(c) | | $ | 29.20 |
| | $ | 28.21 |
| | $ | 25.01 |
| | (b)/(c) | | $ | 31.27 |
| | $ | 31.15 |
| | $ | 28.21 |
|
|
| |
| (1) | Includes core deposit intangibles and mortgage servicing assets. |
Forward-Looking Statements
Certain matters discussed in this Quarterly Report on Form 10-Q containcontains certain forward-looking information about us that is intended to be covered by the safe harbor for “forward-looking statements” provided by the Private Securities Litigation Reform Act of 1995. Forward-looking statements are statements that are not historical facts. These statements relate to the Company’s financial condition, results of operations, plans, objectives, future performance or business. They usually can be identified by the use of forward-looking language, such as “likely result in,” “expects,” “anticipates,” “estimates,” “forecasts,” “projects,” “intends to,” “assumes,” or may include other similar words or phrases, such as “believes,” “plans,” “trend,” “objective,” “continues,” “remains,” or similar expressions, or future or conditional verbs, such as “will,” “would,” “should,” “could,” “may,” “might,” “can,” or similar verbs, and the negative thereof. You should not place undue reliance on these statements, as they are subject to risks and uncertainties, including, but not limited to, those described in the documents incorporated by reference. When considering these forward-looking statements, you should keep in mind these risks and uncertainties, as well as any cautionary statements the Company may make. Moreover, you should treat these statements as speaking only as of the date they are made and based only on information then actually known to the Company.
There are a number of important factors that could cause future results to differ materially from historical performance and these forward-looking statements. Factors that might cause such differences, some of which are beyond the Company’s control, include, but are not limited to:to
the impact of disease pandemics, such as the outbreak and worldwide spread of COVID-19, on the Company, its operations and its customers and employees; and the measures that international, federal, state and local governments, agencies, law enforcement and/or health authorities implement to address it, which may precipitate or exacerbate one or more of the below-mentioned and/or other risks, and significantly disrupt or prevent the Company from operating its business in the ordinary course for an extended period;
changes in the U.S. economy, including an economic slowdowns or recession, inflation, deflation, employment levels, rate of growth and general business conditions;
fluctuations in the Company’s stock price;
government intervention in the financial system, including changes in government interest rate policies;
changes in income tax laws and regulations;
the changes and effects thereof in trade, monetary and fiscal policies and laws, including the ongoing trade dispute between the U.S. and the People’s Republic of China;
the Company’s ability to compete effectively against other financial institutions in its banking markets;
success and timing of the Company’s business strategies;
the Company’s ability to retain key officers and employees;
impact on the Company’s funding costs, net interest income and net interest margin due tofrom changes in key variable market interest rates, competition, regulatory requirements and the Company’s product mix;
changes in the Company’s costs of operation, compliance and expansion;
the Company’s ability to adopt and successfully integrate new technologies into its business in a strategic manner;
impact of benchmark interest rate reform in the U.S. that resulted in the SOFR selected as the preferred alternative reference rate to the LIBOR;
impact of failure in, or breach of, the Company’s operational or security systems or infrastructure, or those of third parties with whom the Company does business, including as a result of cyber attacks; and other similar matters which could result in, among other things, confidential and/or proprietary information being disclosed or misused;
adequacy of the Company’s risk management framework, disclosure controls and procedures and internal control over financial reporting;
future credit quality and performance, including the Company’s expectations regarding future credit losses and allowance levels;
impact of adverse changes to the Company’s credit ratings from major credit rating agencies;
impact of adverse judgments or settlements in litigation;
changes in the commercial and consumer real estate markets;
changes in consumer spending and savings habits;
changes inimpact on the U.S. economy, including inflation, deflation, employment levels, rate of growth and general business conditions;
government intervention in the financial system, including changes in government interest rate policies;
impact of benchmark interest rate reform in the U.S. that resulted in the SOFR selected as the preferred alternative reference rateCompany’s international operations due to LIBOR;
impact of political developments, disease pandemics, wars or other hostilities that may disrupt or increase volatility in securities or otherwise affect economic conditions;
changes in laws or the regulatory environment including regulatory reform initiatives and policies of the U.S. Department of Treasury, the Board of Governors of the Federal Reserve Board System, the FDIC,Federal Deposit Insurance Corporation, the Office of the Comptroller of the Currency, the U.S. Securities and Exchange Commission (“SEC”),SEC, the Consumer Financial Protection Bureau and the California Department of Business Oversight - Division of Financial Institutions;
impact of the Dodd-Frank Act on the Company’s business, business practices, cost of operations and executive compensation;
heightened regulatory and governmental oversight and scrutiny of the Company’s business practices, including dealings with consumers;
impact of reputational risk from negative publicity, fines and penalties and other negative consequences from regulatory violations and legal actions and from the Company’s interactions with business partners, counterparties, service providers and other third parties;
impact of regulatory enforcement actions;
changes in accounting standards as may be required by the Financial Accounting Standards Board or other regulatory agencies and their impact on critical accounting policies and assumptions;
changes in income tax laws and regulations;
impact of other potential federal tax changes and spending cuts;
the Company’s capital requirements and its ability to generate capital internally or raise capital on favorable terms;
impact on the Company’s liquidity due to changes in the Company’s ability to receive dividends from its subsidiaries;
any future strategic acquisitions or divestitures;
continuing consolidation in the financial services industry;
changes in the equity and debt securities markets;
fluctuations in the Company’s stock price;
fluctuations in foreign currency exchange rates;
a recurrence of significant turbulence or disruption in the capital or financial markets, which could result in, among other things, a reduction in the availability of funding or increases in funding costs, a reduction in investor demand for mortgage loans and declines in asset values and/or recognition of OTTI on securities held in the Company’s available-for-sale investmentAFS debt securities portfolio; and
impact of natural or man-made disasters or calamities, such as wildfires, or conflicts or other events that may directly or indirectly result in a negative impact on the Company’s financial performance.
For a more detailed discussion of some of the factors that might cause such differences, see the Company’s annual report on2019 Form 10-K, for the year ended December 31, 2018, filed with the SEC on February 27, 2019, under the heading Item 1A. Risk Factors and the information set forth under Item 1A. Risk Factors in this Form 10-Q. The Company does not undertake, and specifically disclaims any obligation to update or revise any forward-looking statements to reflect the occurrence of events or circumstances after the date of such statements except as required by law.
ITEM 3. QUANTITATIVE AND QUALITATIVE DISCLOSURES ABOUT MARKET RISK
For quantitative and qualitative disclosures regarding market risk in the Company’s portfolio, see Item 1. Consolidated Financial Statements — Note 76 — Derivatives and Item 2. MD&A — Asset Liability andRisk Management — Market Risk Management in Part I of this Form 10-Q.
ITEM 4. CONTROLS AND PROCEDURES
Disclosure Controls and Procedures
As of June 30, 2019,March 31, 2020, pursuant to Rule 13a-15(b) of the Securities Exchange Act of 1934, as amended (the “Exchange Act”), the Company conducted an evaluation, under the supervision and with the participation of the Company’s management, including the Chief Executive Officer and Chief Financial Officer, of the effectiveness of the design and operation of the Company’s disclosure controls and procedures (as defined in Rule 13a-15(e) of the Exchange Act). Based upon that evaluation, the Company’s Chief Executive Officer and Chief Financial Officer concluded that the Company’s disclosure controls and procedures were effective as of June 30, 2019.March 31, 2020.
The Company’s disclosure controls and procedures are designed to ensure that information required to be disclosed by the Company in the reports that the Company files or submits under the Exchange Act is recorded, processed, summarized, and reported within the time periods specified in the rules and forms of the SEC. The Company’s disclosure controls and procedures include, without limitation, controls and procedures designed to ensure that information required to be disclosed by the Company in the reports that the Company files under the Exchange Act is accumulated and communicated to the Company’s management, including the Chief Executive Officer and Chief Financial Officer, as appropriate, to allow timely decisions regarding required disclosure.
Change in Internal Control over Financial Reporting
There hashave been no changechanges in the Company’s internal control over financial reporting (as defined in Rule 13a-15(f) of the Exchange Act) during the quarter ended June 30, 2019,March 31, 2020, that hashave materially affected or isare reasonably likely to materially affect the Company’s internal control over financial reporting.
PART II — OTHER INFORMATION
ITEM 1. LEGAL PROCEEDINGS
See Item 1. Consolidated Financial Statements — Note 1210 — Commitments and Contingencies — Litigation in Part I of this report, incorporated herein by reference.
ITEM 1A. RISK FACTORS
The Company’s 20182019 Form 10-K contains disclosure regarding the risks and uncertainties related to the Company’s business under the heading Item 1A. Risk Factors. There has been no material changechanges to the Company’s risk factors as presented in the Company’s 20182019 Form 10-K.10-K, other than the risk factors set forth below:
The effects of the COVID-19 disease pandemic will impact the Company’s businesses, results of operations and financial condition, and the extent and duration of these impacts remain uncertain. In December 2019, COVID-19 was reported in China, which rapidly spread to other countries, including the U.S. In March 2020, the WHO characterized COVID-19 as a global pandemic and recommended containment and mitigation measures. On January 31, 2020, the U.S. declared a national public health emergency, and the President announced a National Emergency on March 13, 2020. Many states and municipalities have declared emergencies as well. Along with these declarations, there have been extraordinary and wide-ranging actions undertaken by international, federal, state and local public health and governmental authorities to contain the outbreak and spread of COVID-19 across the world and in the U.S., including quarantines, “stay-at-home” orders and similar mandates for individuals to substantially restrict daily activities and for many businesses to curtail or cease normal operations. A significant outbreak of epidemic, pandemic, or contagious diseases in the human population could result in a widespread health crisis that could adversely affect the broader economies, financial markets and overall demand environment for the Company’s businesses.
East West Bank is considered an essential business in the seven states where we have branches. As part of the CARES Act passed by Congress in March 2020, various initiatives to protect individuals, businesses and local economies, such as the SBA PPP were established. The Company participates in the SBA PPP, and intends to participate in additional new government-sponsored programs, as they are enacted. In addition, to provide relief to customers during these turbulent times, we are providing payment accommodations for certain small-to medium-sized business, nonprofit organization and consumer customers impacted by COVID-19, and pausing action on collections and foreclosures on certain residential mortgage loans. These initiatives and accommodations made to our customers are expected to negatively impact our revenue and results of operations in the near term and, if not effective in mitigating the effect of COVID-19 on our customers, may adversely affect our business and results of operations more substantially over a longer period of time.
Further, in order to facilitate our business and in response to enhanced safety measures, the Company has consolidated certain branch locations in the U.S., resulting in temporary closure of certain branches, adjusted branch hours and implemented certain employee travel restrictions. In addition, we have implemented business continuity plans, which include shifting a majority of our corporate and division office functions to work remotely, alternating workplace arrangements such as split work sites and rotating shifts for certain employees to suit the changing business requirements. To date, the business continuity plans work as designed and support our ongoing normal course of business. However, our ability to provide services has been, and may continue to be, to some extent, negatively impacted by interruptions due to illnesses of our employees, or the safety measures implemented to prevent illnesses of our employees, including the potential closure of particular branches and certain employees working remotely.
We may face increased cybersecurity risks due to the shifting of a majority of our corporate and division office functions to operating remotely in regions impacted by stay-at-home orders. Increased levels of remote access may create additional opportunities for cybercriminals to attempt to exploit vulnerabilities, and our employees may be more susceptible to phishing and social engineering attempts due to increased stress caused by the crisis and from balancing family and work responsibilities at home. In addition, our technological resources may be strained due to the number of remote users.
The conditions caused by the COVID-19 pandemic could continue to adversely affect the ability of the Company’s borrowers to satisfy their obligations, and because many of the Company’s loans are secured by real estate, a potential decline in real estate markets could further impact the Company’s business and financial condition and the credit quality of the Company’s loan portfolio, hence potentially increasing our level of charge-offs and provision for credit losses. Further, the disruptions related to COVID-19 may decrease our borrowers’ confidence or with respect to purchasing real estate or homes and adversely affect the demand for the Company’s loans and other products and services, the valuation of our loans, securities and derivatives portfolios, the carrying value of our deferred tax assets, our capital levels and liquidity, and our results of operations.
In addition, recent developments and reports relating to COVID-19 have coincided with heightened volatility in financial markets in the U.S. and worldwide. Our businesses and results of operations are affected by the financial markets and general economic conditions primarily in the U.S. and Greater China. The Company executes transactions with various counterparties in the financial industry, including brokers and dealers, commercial banks and investment banks. Defaults by financial services institutions and uncertainty in the financial services industry in general could lead to market-wide liquidity problems and may expose the Company to credit risk in the event of default of its counterparties or clients. This pandemic, and any further measures undertaken by governmental authorities to address it, could significantly disrupt or prevent us from operating our business in the ordinary course for an extended period, and thereby, and/or along with any associated economic and/or social instability or distress, have a material adverse impact on our results of operations and financial condition. Additionally, the earnings impacts from recent and future emergency interest rate cuts could further compress interest margins, which could potentially have an adverse effect on our results of operations and financial condition.
The extent to which the COVID-19 pandemic and any resultant economic downturn impacts our business, operations, and financial results is uncertain and will depend on numerous evolving factors that are outside our control and we may not be able to accurately predict, including the duration and scope of the pandemic and the governmental, business and individual actions taken in response to the pandemic and the impact of those actions on global economic activity.
PriceDeclines in Oil & Gas Sector May Adversely Affect Our Business. The fluctuations in the oil and gas markets have generally been dependent upon the prevailing view of future gas and oil prices, which are influenced by numerous supply and demand factors, including availability and cost of capital, global and domestic economic conditions, environmental regulations, policies of Organization of Petroleum Exporting Countries and Russia, geopolitics, U.S. consumer demand and consumption, transportation industry activity, and other factors. The COVID-19 pandemic, along with recent actions by Saudi Arabia and Russia, have led to a significant decline in oil and gas prices. In consideration of any further price declines in this sector, we have increased our allowance for loan loss against the oil & gas loan portfolio. However, continuous volatility and downward pressure on oil and gas prices in the global market could lead to increased credit losses, which could adversely affect our financial results. For a description of our oil and gas loan exposure, refer to Part 1. Item 2. MD&A — Balance Sheet Analysis — Loan Portfolio — Commercial — Commercial and Industrial Loans in this Form 10-Q.
ITEM 2. UNREGISTERED SALES OF EQUITY SECURITIES AND USE OF PROCEEDS
There were no unregistered sales of equity securities or repurchase activities duringfor the three months ended June 30, 2019.March 31, 2020. The following table summarizes common stock repurchased by the Company under the Company’s common stock repurchase program for the three months ended March 31, 2020:
|
| | | | | | | | | | | | | | |
| | | | | | | | | |
| Period | | Total Number of Shares Repurchased (1) | | Average Price Paid per Share of Common Stock | | Total Number of Shares of Common Stock Purchased as Part of Publicly Announced Plans or Programs | | Approximate Dollar Value of Shares that May Yet Be Purchased Under the Plans or Programs ($ in millions) (2) |
| January 1, 2020 - January 31, 2020 | | — |
| | $ | — |
| | — |
| | $ | 500.0 |
|
| February 1, 2020 - February 29, 2020 | | — |
| | — |
| | — |
| | 500.0 |
|
| March 1, 2020 - March 31, 2020 | | 4,471,682 |
| | 32.64 |
| | 4,471,682 |
| | 354.0 |
|
| Total | | 4,471,682 |
| | $ | 32.64 |
| | 4,471,682 |
| | $ | 354.0 |
|
| | | | | | | | | |
| |
| (1) | Excludes activity of common stock pursuant to various stock compensation plans and agreements totaling $7.6 million. |
| |
| (2) | On March 3, 2020, the Company’s Board of Directors authorized the repurchase of up to $500.0 million of the Company’s common stock. This $500.0 million repurchase authorization is inclusive of the Company’s $100.0 million stock repurchase authorization previously outstanding. The share repurchase authorization has no expiration date. |
ITEM 6. EXHIBITS
The following exhibit index lists Exhibits filed, or in the case of Exhibits 32.1 and 32.2 furnished, with this report:
|
| | |
| Exhibit No. | | Exhibit Description |
| | |
| 10.1 | | |
| | |
| 10.2 | | |
| | | |
| 31.1 | | |
| | | |
| 31.2 | | |
| | | |
| 32.1 | | |
| | | |
| 32.2 | | |
| | | |
| 101.INS | | The instance document does not appear in the interactive data file because its XBRL tags are embedded within the inline XBRL document. |
| | | |
| 101.SCH | | Inline XBRL Taxonomy Extension Schema Document. Filed herewith. |
| | | |
| 101.CAL | | Inline XBRL Taxonomy Extension Calculation Linkbase Document. Filed herewith. |
| | | |
| 101.DEF | | Inline XBRL Taxonomy Extension Definition Linkbase Document. Filed herewith. |
| | | |
| 101.LAB | | Inline XBRL Taxonomy Extension Label Linkbase Document. Filed herewith. |
| | | |
| 101.PRE | | Inline XBRL Taxonomy Extension Presentation Linkbase Document. Filed herewith. |
| | | |
| 104 | | Cover Page Interactive Data (formatted as Inline XBRL)XBRL and contained in Exhibit 101 filed herewith). Filed herewith. |
| | | |
All other material referenced in this report which is required to be filed as an exhibit hereto has previously been submitted.* Denotes management contract or compensatory plan or arrangement.
GLOSSARY OF ACRONYMS
|
| | | |
| AFS | Available-for-sale | LTV | Loan-to-value |
| ALCO | Asset/Liability Committee |
AOCI | Accumulated other comprehensive income (loss) |
ASC | Accounting Standards Codification |
ASU | Accounting Standards Update |
C&I | Commercial and industrial |
CECL | Current expected credit loss |
CET1 | Common Equity Tier 1 |
CME | Chicago Mercantile Exchange |
CRA | Community Reinvestment Act |
CRE | Commercial real estate |
DCB | Desert Community Bank |
EPS | Earnings per share |
EVE | Economic value of equity |
EWIS | East West Insurance Services, Inc. |
FASB | Financial Accounting Standards Board |
FDIC | Federal Deposit Insurance Corporation |
FHLB | Federal Home Loan Bank |
FITCH | Fitch Ratings |
FRB | Federal Reserve Bank of San Francisco |
FTP | Funds transfer pricing |
GAAP | United States generally accepted accounting principles |
HELOC | Home equity line of credit |
LCH | London Clearing House |
LIBOR | London Interbank Offered Rate |
| MD&A | Management’s Discussion and Analysis of Financial Condition and Results of Operations |
| AOCI | Accumulated other comprehensive income (loss) | MMBTU | Million British thermal unit |
MOODY’SARRC | Alternative Reference Rates Committee | Moody's | Moody’s Investors Service |
| ASC | Accounting Standards Codification | NAV | Net asset valueAsset Value |
OISASU | Overnight Index SwapAccounting Standards Update |
| OREO | Other real estate owned |
| C&I | Commercial and industrial | OTTI | Other-than-temporary impairment |
| CARES Act | The Coronavirus Aid, Relief, and Economic Security Act | PCD | Purchased financial assets with credit deterioration |
| CECL | Current expected credit loss | PCI | Purchased credit-impairedcredit impaired |
| CET1 | Common Equity Tier 1 | PD | Probability of default |
| CLO | Collateralized loan obligation | PPP | Paycheck Protection Program |
| CME | Chicago Mercantile Exchange | RMB | Chinese Renminbi |
| CRA | Community Reinvestment Act | ROA | Return on average assets |
| CRE | Commercial real estate | ROE | Return on average equity |
| EPS | Earnings per share | RPA | Credit risk participation agreement |
| ERM | Enterprise Risk Management | RSU | Restricted stock unit |
| EVE | Economic value of equity | S&P | Standard and Poor’s& Poor's |
| FHLB | Federal Home Loan Bank | SBLC | Standby letter of credit |
| Fitch | Fitch Ratings | SEC | U.S. Securities and Exchange Commission |
| FRB | Federal Reserve Bank of San Francisco | SOFR | Secured Overnight Financing Rate |
| FTP | Funds transfer pricing | TDR | Troubled debt restructuring |
| GAAP | Generally accepted accounting principles | U.S. | United States |
| HELOC | Home equity lines of credit | USD | U.S. dollar |
| LCH | London Clearing House | VIE | Variable interest entity |
| LGD | Loss given default | WHO | World Health Organization |
| LIBOR | London Interbank Offered Rate | | |
SIGNATURE
Pursuant to the requirements of the Securities Exchange Act of 1934, the registrant has duly caused this report to be signed on its behalf by the undersigned, thereunto duly authorized.
|
| | | | |
Dated: August 7, 2019 | May 8, 2020 | |
| | | |
| | | EAST WEST BANCORP, INC. (Registrant) |
| | | |
| | | By | /s/ IRENE H. OH | |
| | | | Irene H. Oh |
| | | | Executive Vice President and Chief Financial Officer |