0001069157us-gaap:FinancingReceivables60To89DaysPastDueMemberus-gaap:ConsumerPortfolioSegmentMember2021-12-31ExtendedMaturityAndInterestRateReductionMember2023-01-012023-06-30
UNITED STATES
SECURITIES AND EXCHANGE COMMISSION
Washington, D.C. 20549
FORM 10-Q
☒ QUARTERLY REPORT PURSUANT TO SECTION 13 OR 15(d) OF
THE SECURITIES EXCHANGE ACT OF 1934
For the quarterly period ended SeptemberJune 30, 20222023
or
☐ TRANSITION REPORT PURSUANT TO SECTION 13 OR 15(d) OF
THE SECURITIES EXCHANGE ACT OF 1934
For the transition period from to
Commission file number 000-24939
EAST WEST BANCORP, INC.
(Exact name of registrant as specified in its charter)
Delaware
(State or other jurisdiction of incorporation or organization)
95-4703316
(I.R.S. Employer Identification No.)
135 North Los Robles Ave., 7th Floor, Pasadena, California 91101
(Address of principal executive offices) (Zip Code)
Registrant’s telephone number, including area code:
(626) 768-6000
Securities registered pursuant to Section 12(b) of the Act:
| | | | | | | | | | | | | | | | | | | |
| Title of each class | | Trading
Symbol(s) | | Name of each exchange
on which registered | |
| Common Stock, par value $0.001 per share | | EWBC | | The Nasdaq Global Select Market | |
Indicate by check mark whether the registrant (1) has filed all reports required to be filed by Section 13 or 15(d) of the Securities Exchange Act of 1934 during the preceding 12 months (or for such shorter period that the registrant was required to file such reports), and (2) has been subject to such filing requirements for the past 90 days.
Yes ☒ No ☐
Indicate by check mark whether the registrant has submitted electronically every Interactive Data File required to be submitted pursuant to Rule 405 of Regulation S-T (§232.405 of this chapter) during the preceding 12 months (or for such shorter period that the registrant was required to submit such files).
Yes ☒ No ☐
Indicate by check mark whether the registrant is a large accelerated filer, an accelerated filer, a non-accelerated filer, a smaller reporting company, or an emerging growth company. See the definitions of “large accelerated filer,” “accelerated filer,” “smaller reporting company,” and “emerging growth company” in Rule 12b-2 of the Exchange Act.
| | | | | | | | | | | | | | |
| Large accelerated filer | ☒ | | Accelerated filer | ☐ |
| Non-accelerated filer | ☐ | | Smaller reporting company | ☐ |
| | Emerging growth company | ☐ |
If an emerging growth company, indicate by check mark if the registrant has elected not to use the extended transition period for complying with any new or revised financial accounting standards provided pursuant to Section 13(a) of the Exchange Act. ☐
Indicate by check mark whether the registrant is a shell company (as defined in Rule 12b-2 of the Exchange Act).
Yes ☐ No ☒
Number of shares outstanding of the issuer’s common stock on the latest practicable date: 140,946,569141,483,668 shares as of OctoberJuly 31, 20222023.
TABLE OF CONTENTS
Forward-Looking Statements
Certain matters discussed in this Quarterly Report on Form 10-Q (this “Form 10-Q”) contain forward-looking statements that are intended to be covered by the safe harbor provisions for such statements provided by the Private Securities Litigation Reform Act of 1995. In addition, East West Bancorp, Inc. (referred to herein on an unconsolidated basis as “East West” and on a consolidated basis as the “Company,” “we” or “EWBC”) may make forward-looking statements in other documents that it files with, or furnishes to, the United States (“U.S.”) Securities and Exchange Commission (“SEC”) and management may make forward-looking statements to analysts, investors, media members and others. Forward-looking statements are those that do not relate to historical facts, and that are based on current assumptions, beliefs, estimates, expectations and projections, many of which, by their nature, are inherently uncertain and beyond the Company’s control. Forward-looking statements may relate to various matters, including the Company’s financial condition, results of operations, plans, objectives, future performance, business or industry, and usually can be identified by the use of forward-looking words, such as “anticipates,” “assumes,” “believes,” “can,” “continues,” “could,” “estimates,” “expects,” “forecasts,” “goal,” “intends,” “likely,” “may,” “might,” “objective,” “plans,” “potential,” “projects,” “remains,” “should,” “target,” “trend,” “will,” “would,” or similar expressions or variations thereof, and the negative thereof, but these terms are not the exclusive means of identifying such statements. You should not place undue reliance on forward-looking statements, as they are subject to risks and uncertainties, including, but not limited to, those described below. When considering these forward-looking statements, you should keep in mind these risks and uncertainties, as well as any cautionary statements the Company may make.
There are various important factors that could cause future results to differ materially from historical performance and any forward-looking statements. Factors that might cause such differences, include, but are not limited to:
•changes in the global economy, including an economic slowdown, capital or financial market disruption, supply chain disruption, level of inflation, interest rate environment, housing prices, employment levels, rate of growth and general business conditions, which could result in, among other things, reduced demand for loans, reduced availability of funding or increased funding costs, declines in asset values and/or recognition of allowance for credit losses;
•changes in local, regional and global business, economic and political conditions and geopolitical events, such as Russia’s invasion of Ukraine;
•the soundness of other financial institutions and the impacts related to or resulting from recent bank failures and other economic and industry volatility, including potential increased regulatory requirements, Federal Deposit Insurance Corporation (“FDIC”) insurance premiums, losses in the value of our investment portfolio, deposit withdrawals, or other adverse consequences of negative market perceptions of the banking industry or the Company;
•changes in laws or the regulatory environment, including regulatory reform initiatives and policies of the U.S. Department of the Treasury, the Board of Governors of the Federal Reserve System (“Federal Reserve”), the FDIC, the SEC, the Consumer Financial Protection Bureau (“CFPB”), the California Department of Financial Protection and Innovation — Division of Financial Institutions, the National Administration of Financial Regulation, the Hong Kong Monetary Authority, the Hong Kong Securities and Futures Commission, and the Monetary Authority of Singapore;
•changes and effects thereof in trade, monetary and fiscal policies and laws, including the ongoing trade, economic and political disputes between the U.S. and the People’s Republic of China and the monetary policies of the Federal Reserve;
•changes in the commercial and consumer real estate markets;
•changes in consumer or commercial spending, savings and borrowing habits, and patterns and behaviors;
•the impact from potential changes to income tax laws and regulations, federal spending and economic stimulus programs;
•the impact of any future U.S. federal government shutdown and uncertainty regarding the U.S. federal government’s debt limit and credit rating;
•the Company’s ability to compete effectively against financial institutions and other entities, including as a result of emerging technologies;
•the success and timing of the Company’s business strategies;
•the Company’s ability to retain key officers and employees;
•the impact on the Company’s funding costs, net interest income and net interest margin from changes in key variable market interest rates, competition, regulatory requirements and the Company’s product mix;
•changes in the Company’s costs of operation, compliance and expansion;
•the Company’s ability to adopt and successfully integrate new technologies into its business in a strategic manner;
•the impact of communications or technology disruption, failure in, or breach of, the Company’s operational or security systems or infrastructure, or those of third party vendors with which the Company does business, including as a result of cyber-attacks; and other similar matters which could result in, among other things, confidential and/or proprietary information being disclosed or misused, and materially impact the Company’s ability to provide services to its clients;
•the adequacy of the Company’s risk management framework, disclosure controls and procedures and internal control over financial reporting;
•future credit quality and performance, including the Company’s expectations regarding future credit losses and allowance levels;
•the impact of adverse changes to the Company’s credit ratings from major credit rating agencies;
•the impact of adverse judgments or settlements in litigation;
•the impact of political developments, pandemics, wars, civil unrest, terrorism or other hostilities that may disrupt or increase volatility in securities or otherwise affect business and economic conditions on the Company and its customers;
•heightened regulatory and governmental oversight and scrutiny of the Company’s business practices, including dealings with consumers;
•the impact of reputational risk from negative publicity, fines, penalties and other negative consequences from regulatory violations, legal actions and the Company’s interactions with business partners, counterparties, service providers and other third parties;
•the impact of regulatory investigations and enforcement actions;
•changes in accounting standards as may be required by the Financial Accounting Standards Board (“FASB”) or other regulatory agencies and their impact on the Company’s critical accounting policies and assumptions;
•the Company’s capital requirements and its ability to generate capital internally or raise capital on favorable terms;
•the impact on the Company’s liquidity due to changes in the Company’s ability to receive dividends from its subsidiaries;
•any strategic acquisitions or divestitures;
•changes in the equity and debt securities markets;
•fluctuations in the Company’s stock price;
•fluctuations in foreign currency exchange rates;
•the impact of increased focus on social, environmental and sustainability matters, which may affect the operations of the Company and its customers and the economy more broadly; and
•the impact of climate change, natural or man-made disasters or calamities, such as wildfires, droughts, hurricanes, flooding and earthquakes or other events that may directly or indirectly result in a negative impact on the financial performance of the Company and its customers.
For a more detailed discussion of some of the factors that might cause such differences, see the Company’s Annual Report on Form 10-K for the year ended December 31, 2022, filed with the SEC on February 27, 2023 (the “Company’s 2022 Form 10-K”) under the heading Item 1A. Risk Factors, and Item 1A. Risk Factors of this Form 10-Q. You should treat forward-looking statements as speaking only as of the date they are made and based only on information then actually known to the Company. The Company does not undertake, and specifically disclaims, any obligation to update or revise any forward-looking statements to reflect the occurrence of events or circumstances after the date of such statements except as required by law.
PART I — FINANCIAL INFORMATION
ITEM 1. CONSOLIDATED FINANCIAL STATEMENTS
EAST WEST BANCORP, INC. AND SUBSIDIARIES
CONSOLIDATED BALANCE SHEET
($ in thousands, except shares)
(Unaudited)
| | | | September 30,
2022 | | December 31,
2021 | | June 30,
2023 | | December 31,
2022 |
| | (Unaudited) | | | |
| ASSETS | ASSETS | | ASSETS | | | | |
| Cash and due from banks | Cash and due from banks | | $ | 554,260 | | | $ | 527,317 | | Cash and due from banks | | $ | 614,053 | | | $ | 534,980 | |
| Interest-bearing cash with banks | Interest-bearing cash with banks | | 1,609,093 | | | 3,385,618 | | Interest-bearing cash with banks | | 5,763,834 | | | 2,946,804 | |
| Cash and cash equivalents | Cash and cash equivalents | | 2,163,353 | | | 3,912,935 | | Cash and cash equivalents | | 6,377,887 | | | 3,481,784 | |
| Interest-bearing deposits with banks | Interest-bearing deposits with banks | | 630,543 | | | 736,492 | | Interest-bearing deposits with banks | | 17,169 | | | 139,021 | |
| Assets purchased under resale agreements (“resale agreements”) | Assets purchased under resale agreements (“resale agreements”) | | 892,986 | | | 2,353,503 | | Assets purchased under resale agreements (“resale agreements”) | | 635,000 | | | 792,192 | |
| Securities: | Securities: | | Securities: | |
| Available-for-sale (“AFS”) debt securities, at fair value (amortized cost of $6,771,354 and $10,087,179) | | 5,906,090 | | | 9,965,353 | | |
| Held-to-maturity (“HTM”) debt securities, at amortized cost (fair value of $2,459,135) | | 3,012,667 | | | — | | |
| Available-for-sale (“AFS”) debt securities, at fair value (amortized cost of $6,820,569 and $6,879,225) | | Available-for-sale (“AFS”) debt securities, at fair value (amortized cost of $6,820,569 and $6,879,225) | | 5,987,258 | | | 6,034,993 | |
| Held-to-maturity (“HTM”) debt securities, at amortized cost (fair value of $2,440,484 and $2,455,171) | | Held-to-maturity (“HTM”) debt securities, at amortized cost (fair value of $2,440,484 and $2,455,171) | | 2,975,933 | | | 3,001,868 | |
| | Loans held-for-sale | Loans held-for-sale | | 14,500 | | | 635 | | Loans held-for-sale | | 2,830 | | | 25,644 | |
| Loans held-for-investment (net of allowance for loan losses of $582,517 and $541,579) | | 46,859,738 | | | 41,152,202 | | |
| Loans held-for-investment (net of allowance for loan losses of $635,400 and $595,645) | | Loans held-for-investment (net of allowance for loan losses of $635,400 and $595,645) | | 49,192,964 | | | 47,606,785 | |
| Investments in qualified affordable housing partnerships, tax credit and other investments, net | Investments in qualified affordable housing partnerships, tax credit and other investments, net | | 725,254 | | | 628,263 | | Investments in qualified affordable housing partnerships, tax credit and other investments, net | | 815,471 | | | 763,256 | |
| | Premises and equipment (net of accumulated depreciation of $146,073 and $139,358) | | 91,587 | | | 97,302 | | |
| Premises and equipment (net of accumulated depreciation of $153,079 and $148,126) | | Premises and equipment (net of accumulated depreciation of $153,079 and $148,126) | | 88,966 | | | 89,191 | |
| Goodwill | Goodwill | | 465,697 | | | 465,697 | | Goodwill | | 465,697 | | | 465,697 | |
| Operating lease right-of-use assets | Operating lease right-of-use assets | | 105,411 | | | 98,632 | | Operating lease right-of-use assets | | 100,500 | | | 103,681 | |
| Other assets | Other assets | | 1,708,235 | | | 1,459,687 | | Other assets | | 1,873,006 | | | 1,608,038 | |
| TOTAL | TOTAL | | $ | 62,576,061 | | | $ | 60,870,701 | | TOTAL | | $ | 68,532,681 | | | $ | 64,112,150 | |
| LIABILITIES | LIABILITIES | | | | | LIABILITIES | | | | |
| Deposits: | Deposits: | | Deposits: | |
| Noninterest-bearing | Noninterest-bearing | | $ | 21,645,394 | | | $ | 22,845,464 | | Noninterest-bearing | | $ | 16,741,099 | | | $ | 21,051,090 | |
| Interest-bearing | Interest-bearing | | 32,211,968 | | | 30,505,068 | | Interest-bearing | | 38,917,687 | | | 34,916,759 | |
| Total deposits | Total deposits | | 53,857,362 | | | 53,350,532 | | Total deposits | | 55,658,786 | | | 55,967,849 | |
| Short-term borrowings | | Short-term borrowings | | 4,500,000 | | | — | |
| | Federal funds purchased | | 200,000 | | | — | | |
| Federal Home Loan Bank (“FHLB”) advances | | 324,920 | | | 249,331 | | |
| | Assets sold under repurchase agreements (“repurchase agreements”) | Assets sold under repurchase agreements (“repurchase agreements”) | | 611,785 | | | 300,000 | | Assets sold under repurchase agreements (“repurchase agreements”) | | — | | | 300,000 | |
| Long-term debt and finance lease liabilities | Long-term debt and finance lease liabilities | | 152,610 | | | 151,997 | | Long-term debt and finance lease liabilities | | 152,951 | | | 152,400 | |
| Operating lease liabilities | Operating lease liabilities | | 113,477 | | | 105,534 | | Operating lease liabilities | | 110,383 | | | 111,931 | |
| Accrued expenses and other liabilities | Accrued expenses and other liabilities | | 1,655,239 | | | 876,089 | | Accrued expenses and other liabilities | | 1,648,864 | | | 1,595,358 | |
| Total liabilities | Total liabilities | | 56,915,393 | | | 55,033,483 | | Total liabilities | | 62,070,984 | | | 58,127,538 | |
| COMMITMENTS AND CONTINGENCIES (Note 10) | | | | | |
| COMMITMENTS AND CONTINGENCIES (Note 11) | | COMMITMENTS AND CONTINGENCIES (Note 11) | | | | |
| STOCKHOLDERS’ EQUITY | STOCKHOLDERS’ EQUITY | | STOCKHOLDERS’ EQUITY | |
| Common stock, $0.001 par value, 200,000,000 shares authorized; 168,427,227 and 167,790,645 shares issued | | 168 | | | 168 | | |
| Common stock, $0.001 par value, 200,000,000 shares authorized; 169,310,864 and 168,459,045 shares issued | | Common stock, $0.001 par value, 200,000,000 shares authorized; 169,310,864 and 168,459,045 shares issued | | 169 | | | 168 | |
| Additional paid-in capital | Additional paid-in capital | | 1,926,393 | | | 1,893,557 | | Additional paid-in capital | | 1,959,615 | | | 1,936,389 | |
| Retained earnings | Retained earnings | | 5,302,897 | | | 4,683,659 | | Retained earnings | | 6,075,735 | | | 5,582,546 | |
| Treasury stock, at cost 27,509,715 and 25,882,691 shares | | (768,758) | | | (649,785) | | |
| Treasury stock, at cost 27,827,196 and 27,511,199 shares | | Treasury stock, at cost 27,827,196 and 27,511,199 shares | | (791,890) | | | (768,862) | |
| Accumulated other comprehensive loss (“AOCI”), net of tax | Accumulated other comprehensive loss (“AOCI”), net of tax | | (800,032) | | | (90,381) | | Accumulated other comprehensive loss (“AOCI”), net of tax | | (781,932) | | | (765,629) | |
| Total stockholders’ equity | Total stockholders’ equity | | 5,660,668 | | | 5,837,218 | | Total stockholders’ equity | | 6,461,697 | | | 5,984,612 | |
| TOTAL | TOTAL | | $ | 62,576,061 | | | $ | 60,870,701 | | TOTAL | | $ | 68,532,681 | | | $ | 64,112,150 | |
|
See accompanying Notes to Consolidated Financial Statements.
35
EAST WEST BANCORP, INC. AND SUBSIDIARIES
CONSOLIDATED STATEMENT OF INCOME
($ and shares in thousands, except per share data)
(Unaudited)
| | | | | | | | | | | | | | | | | | | | | | | | | | | | | | | | |
|
| | Three Months Ended
September 30, | | Nine Months Ended
September 30, | | | | |
| | 2022 | | 2021 | | 2022 | | 2021 | | | | | | |
| INTEREST AND DIVIDEND INCOME | | | | | | | | | | | | | | |
| Loans receivable, including fees | | $ | 560,452 | | | $ | 363,503 | | | $ | 1,376,978 | | | $ | 1,057,964 | | | | | | | |
| Debt securities | | 51,092 | | | 37,826 | | | 139,935 | | | 101,616 | | | | | | | |
| | | | | | | | | | | | | | |
| Resale agreements | | 6,769 | | | 8,957 | | | 23,705 | | | 23,077 | | | | | | | |
| Restricted equity securities | | 843 | | | 500 | | | 2,274 | | | 1,588 | | | | | | | |
| Interest-bearing cash and deposits with banks | | 9,080 | | | 4,521 | | | 17,127 | | | 11,781 | | | | | | | |
| Total interest and dividend income | | 628,236 | | | 415,307 | | | 1,560,019 | | | 1,196,026 | | | | | | | |
| INTEREST EXPENSE | | | | | | | | | | | | | | |
| Deposits | | 68,894 | | | 15,970 | | | 104,371 | | | 55,790 | | | | | | | |
| Federal funds purchased and other short-term borrowings | | 1,177 | | | — | | | 1,427 | | | 42 | | | | | | | |
| FHLB advances | | 392 | | | 857 | | | 1,529 | | | 6,025 | | | | | | | |
| Repurchase agreements | | 4,421 | | | 2,012 | | | 8,855 | | | 5,981 | | | | | | | |
| Long-term debt and finance lease liabilities | | 1,543 | | | 762 | | | 3,463 | | | 2,314 | | | | | | | |
| Total interest expense | | 76,427 | | | 19,601 | | | 119,645 | | | 70,152 | | | | | | | |
| Net interest income before provision for (reversal of) credit losses | | 551,809 | | | 395,706 | | | 1,440,374 | | | 1,125,874 | | | | | | | |
| Provision for (reversal of) credit losses | | 27,000 | | | (10,000) | | | 48,500 | | | (25,000) | | | | | | | |
| Net interest income after provision for (reversal of) credit losses | | 524,809 | | | 405,706 | | | 1,391,874 | | | 1,150,874 | | | | | | | |
| NONINTEREST INCOME | | | | | | | | | | | | | | |
| Lending fees | | 20,289 | | | 17,516 | | | 59,869 | | | 56,965 | | | | | | | |
| Deposit account fees | | 23,636 | | | 18,508 | | | 66,323 | | | 51,233 | | | | | | | |
| Interest rate contracts and other derivative income | | 8,761 | | | 7,156 | | | 29,695 | | | 20,981 | | | | | | | |
| Foreign exchange income | | 10,083 | | | 13,101 | | | 34,143 | | | 35,634 | | | | | | | |
| Wealth management fees | | 8,903 | | | 5,598 | | | 21,494 | | | 20,460 | | | | | | | |
| Net gains on sales of loans | | 2,129 | | | 3,329 | | | 5,968 | | | 6,601 | | | | | | | |
| Gains on sales of AFS debt securities | | — | | | 354 | | | 1,306 | | | 1,178 | | | | | | | |
| | | | | | | | | | | | | | |
| | | | | | | | | | | | | | |
| Other investment (loss) income | | (580) | | | 5,349 | | | 5,910 | | | 13,870 | | | | | | | |
| Other income | | 2,331 | | | 2,198 | | | 9,031 | | | 7,484 | | | | | | | |
| Total noninterest income | | 75,552 | | | 73,109 | | | 233,739 | | | 214,406 | | | | | | | |
| NONINTEREST EXPENSE | | | | | | | | | | | | | | |
| Compensation and employee benefits | | 127,580 | | | 105,751 | | | 357,213 | | | 318,985 | | | | | | | |
| Occupancy and equipment expense | | 15,920 | | | 15,851 | | | 46,853 | | | 47,150 | | | | | | | |
| Deposit insurance premiums and regulatory assessments | | 4,875 | | | 4,641 | | | 14,519 | | | 12,791 | | | | | | | |
| Deposit account expense | | 6,707 | | | 4,136 | | | 17,071 | | | 11,845 | | | | | | | |
| Data processing | | 3,725 | | | 3,575 | | | 10,876 | | | 12,088 | | | | | | | |
| Computer software expense | | 6,889 | | | 8,426 | | | 20,755 | | | 23,106 | | | | | | | |
| Consulting expense | | 1,620 | | | 1,635 | | | 5,474 | | | 4,978 | | | | | | | |
| Legal expense | | 689 | | | 2,363 | | | 2,454 | | | 5,840 | | | | | | | |
| Other operating expense | | 28,094 | | | 20,998 | | | 78,315 | | | 58,544 | | | | | | | |
| Amortization of tax credit and other investments | | 19,874 | | | 38,008 | | | 48,753 | | | 90,657 | | | | | | | |
| | | | | | | | | | | | | | |
| Total noninterest expense | | 215,973 | | | 205,384 | | | 602,283 | | | 585,984 | | | | | | | |
| INCOME BEFORE INCOME TAXES | | 384,388 | | | 273,431 | | | 1,023,330 | | | 779,296 | | | | | | | |
| INCOME TAX EXPENSE | | 89,049 | | | 47,982 | | | 232,010 | | | 124,111 | | | | | | | |
| NET INCOME | | $ | 295,339 | | | $ | 225,449 | | | $ | 791,320 | | | $ | 655,185 | | | | | | | |
| EARNINGS PER SHARE (“EPS”) | | | | | | | | | | | | | | |
| BASIC | | $ | 2.10 | | | $ | 1.59 | | | $ | 5.59 | | | $ | 4.62 | | | | | | | |
| DILUTED | | $ | 2.08 | | | $ | 1.57 | | | $ | 5.55 | | | $ | 4.58 | | | | | | | |
| WEIGHTED-AVERAGE NUMBER OF SHARES OUTSTANDING | | | | | | | | | | | | | | |
| BASIC | | 140,917 | | | 141,880 | | | 141,453 | | | 141,799 | | | | | | | |
| DILUTED | | 142,011 | | | 143,143 | | | 142,601 | | | 143,051 | | | | | | | |
|
See accompanying Notes to Consolidated Financial Statements.
4
EAST WEST BANCORP, INC. AND SUBSIDIARIES
CONSOLIDATED STATEMENT OF COMPREHENSIVE INCOME
($ in thousands)
(Unaudited)
| | | | | | | | | | | | | | | | | | | | | | | | | | | | | | | | |
|
| | Three Months Ended
September 30, | | Nine Months Ended
September 30, | | | | |
| | 2022 | | 2021 | | 2022 | | 2021 | | | | | | |
| Net income | | $ | 295,339 | | | $ | 225,449 | | | $ | 791,320 | | | $ | 655,185 | | | | | | | |
| Other comprehensive loss, net of tax: | | | | | | | | | | | | | | |
| Net changes in unrealized losses on AFS debt securities | | (161,445) | | | (41,178) | | | (523,593) | | | (101,577) | | | | | | | |
| Net changes in unrealized gains (losses) on securities transferred from AFS to HTM | | 3,256 | | | — | | | (103,674) | | | — | | | | | | | |
| Net changes in unrealized (losses) gains on cash flow hedges | | (33,269) | | | 51 | | | (64,372) | | | 551 | | | | | | | |
| Foreign currency translation adjustments | | (7,926) | | | (1,752) | | | (18,012) | | | (867) | | | | | | | |
| Other comprehensive loss | | (199,384) | | | (42,879) | | | (709,651) | | | (101,893) | | | | | | | |
| COMPREHENSIVE INCOME | | $ | 95,955 | | | $ | 182,570 | | | $ | 81,669 | | | $ | 553,292 | | | | | | | |
|
See accompanying Notes to Consolidated Financial Statements.
5
EAST WEST BANCORP, INC. AND SUBSIDIARIES
CONSOLIDATED STATEMENT OF CHANGES IN STOCKHOLDERS’ EQUITY
($ in thousands, except shares)
(Unaudited)
| | | | | | | | | | | | | | | | | | | | | | | | | | | | | | | | | | | | | | |
|
| | Common Stock and
Additional Paid-in Capital | | Retained Earnings | | Treasury Stock | | AOCI,
Net of Tax | | Total
Stockholders’ Equity |
| | Shares | | Amount | | | | |
| BALANCE, JULY 1, 2021 | | 141,877,505 | | | $ | 1,876,247 | | | $ | 4,335,327 | | | $ | (649,337) | | | $ | (14,689) | | | $ | 5,547,548 | |
| Net income | | — | | | — | | | 225,449 | | | — | | | — | | | 225,449 | |
| Other comprehensive loss | | — | | | — | | | — | | | — | | | (42,879) | | | (42,879) | |
| Issuance of common stock pursuant to various stock compensation plans and agreements | | 9,643 | | | 7,792 | | | — | | | — | | | — | | | 7,792 | |
| Repurchase of common stock pursuant to various stock compensation plans and agreements | | (3,417) | | | — | | | — | | | (254) | | | — | | | (254) | |
| Cash dividends on common stock ($0.33 per share) | | — | | | — | | | (47,455) | | | — | | | — | | | (47,455) | |
| BALANCE, SEPTEMBER 30, 2021 | | 141,883,731 | | | $ | 1,884,039 | | | $ | 4,513,321 | | | $ | (649,591) | | | $ | (57,568) | | | $ | 5,690,201 | |
| BALANCE, JULY 1, 2022 | | 140,917,389 | | | $ | 1,914,232 | | | $ | 5,064,650 | | | $ | (768,752) | | | $ | (600,648) | | | $ | 5,609,482 | |
| Net income | | — | | | — | | | 295,339 | | | — | | | — | | | 295,339 | |
| Other comprehensive loss | | — | | | — | | | — | | | — | | | (199,384) | | | (199,384) | |
| Issuance of common stock pursuant to various stock compensation plans and agreements | | 206 | | | 12,329 | | | — | | | — | | | — | | | 12,329 | |
| Repurchase of common stock pursuant to various stock compensation plans and agreements | | (83) | | | — | | | — | | | (6) | | | — | | | (6) | |
| | | | | | | | | | | | |
| Cash dividends on common stock ($0.40 per share) | | — | | | — | | | (57,092) | | | — | | | — | | | (57,092) | |
| BALANCE, SEPTEMBER 30, 2022 | | 140,917,512 | | | $ | 1,926,561 | | | $ | 5,302,897 | | | $ | (768,758) | | | $ | (800,032) | | | $ | 5,660,668 | |
| | | | | | | | | | | | |
| | | | | | | | | | | | | | | | | | | | | | | | | | | | | | | | | | | | | | |
|
| | Common Stock and
Additional Paid-in Capital | | Retained Earnings | | Treasury Stock | | AOCI,
Net of Tax | | Total
Stockholders’ Equity |
| | Shares | | Amount | | | | |
| BALANCE, JANUARY 1, 2021 | | 141,565,229 | | | $ | 1,858,519 | | | $ | 4,000,414 | | | $ | (634,083) | | | $ | 44,325 | | | $ | 5,269,175 | |
| | | | | | | | | | | | |
| Net income | | — | | | — | | | 655,185 | | | — | | | — | | | 655,185 | |
| Other comprehensive loss | | — | | | — | | | — | | | — | | | (101,893) | | | (101,893) | |
| | | | | | | | | | | | |
| | | | | | | | | | | | |
| | | | | | | | | | | | |
| Issuance of common stock pursuant to various stock compensation plans and agreements | | 523,449 | | | 25,520 | | | — | | | — | | | — | | | 25,520 | |
| Repurchase of common stock pursuant to various stock compensation plans and agreements | | (204,947) | | | — | | | — | | | (15,508) | | | — | | | (15,508) | |
| | | | | | | | | | | | |
| Cash dividends on common stock ($0.99 per share) | | — | | | — | | | (142,278) | | | — | | | — | | | (142,278) | |
| BALANCE, SEPTEMBER 30, 2021 | | 141,883,731 | | | $ | 1,884,039 | | | $ | 4,513,321 | | | $ | (649,591) | | | $ | (57,568) | | | $ | 5,690,201 | |
| BALANCE, JANUARY 1, 2022 | | 141,907,954 | | | $ | 1,893,725 | | | $ | 4,683,659 | | | $ | (649,785) | | | $ | (90,381) | | | $ | 5,837,218 | |
| | | | | | | | | | | | |
| Net income | | — | | | — | | | 791,320 | | | — | | | — | | | 791,320 | |
| Other comprehensive loss | | — | | | — | | | — | | | — | | | (709,651) | | | (709,651) | |
| | | | | | | | | | | | |
| | | | | | | | | | | | |
| | | | | | | | | | | | |
| Issuance of common stock pursuant to various stock compensation plans and agreements | | 640,053 | | | 32,836 | | | — | | | — | | | — | | | 32,836 | |
| Repurchase of common stock pursuant to various stock compensation plans and agreements | | (244,978) | | | — | | | — | | | (18,983) | | | — | | | (18,983) | |
| | | | | | | | | | | | |
| Repurchase of common stock pursuant to the Stock Repurchase Plan | | (1,385,517) | | | — | | | — | | | (99,990) | | | — | | | (99,990) | |
| Cash dividends on common stock ($1.20 per share) | | — | | | — | | | (172,082) | | | — | | | — | | | (172,082) | |
| BALANCE, SEPTEMBER 30, 2022 | | 140,917,512 | | | $ | 1,926,561 | | | $ | 5,302,897 | | | $ | (768,758) | | | $ | (800,032) | | | $ | 5,660,668 | |
| | | | | | | | | | | | |
| | | | | | | | | | | | | | | | | | | | | | | | | | | | | | |
|
| | Three Months Ended June 30, | | Six Months Ended June 30, | | |
| | 2023 | | 2022 | | 2023 | | 2022 | | | | |
| INTEREST AND DIVIDEND INCOME | | | | | | | | | | | | |
| Loans receivable, including fees | | $ | 771,264 | | | $ | 439,416 | | | $ | 1,499,650 | | | $ | 816,526 | | | | | |
| Debt securities | | 68,970 | | | 46,176 | | | 134,901 | | | 88,843 | | | | | |
| | | | | | | | | | | | |
| Resale agreements | | 3,969 | | | 8,553 | | | 8,472 | | | 16,936 | | | | | |
| Restricted equity securities | | 936 | | | 822 | | | 1,975 | | | 1,431 | | | | | |
| Interest-bearing cash and deposits with banks | | 60,995 | | | 4,787 | | | 96,642 | | | 8,047 | | | | | |
| Total interest and dividend income | | 906,134 | | | 499,754 | | | 1,741,640 | | | 931,783 | | | | | |
| INTEREST EXPENSE | | | | | | | | | | | | |
| Deposits | | 287,477 | | | 22,488 | | | 504,271 | | | 35,477 | | | | | |
| Federal funds purchased and other short-term borrowings | | 49,032 | | | 241 | | | 57,857 | | | 250 | | | | | |
| Federal Home Loan Bank (“FHLB”) advances | | — | | | 559 | | | 6,430 | | | 1,137 | | | | | |
| Repurchase agreements | | 211 | | | 2,418 | | | 1,263 | | | 4,434 | | | | | |
| Long-term debt and finance lease liabilities | | 2,668 | | | 1,096 | | | 5,212 | | | 1,920 | | | | | |
| Total interest expense | | 339,388 | | | 26,802 | | | 575,033 | | | 43,218 | | | | | |
| Net interest income before provision for credit losses | | 566,746 | | | 472,952 | | | 1,166,607 | | | 888,565 | | | | | |
| Provision for credit losses | | 26,000 | | | 13,500 | | | 46,000 | | | 21,500 | | | | | |
| Net interest income after provision for credit losses | | 540,746 | | | 459,452 | | | 1,120,607 | | | 867,065 | | | | | |
| NONINTEREST INCOME | | | | | | | | | | | | |
| Lending fees | | 20,901 | | | 20,142 | | | 41,487 | | | 39,580 | | | | | |
| Deposit account fees | | 22,285 | | | 22,372 | | | 43,988 | | | 42,687 | | | | | |
| Interest rate contracts and other derivative income | | 7,373 | | | 9,801 | | | 9,937 | | | 20,934 | | | | | |
| Foreign exchange income | | 13,251 | | | 11,361 | | | 25,911 | | | 24,060 | | | | | |
| Wealth management fees | | 6,889 | | | 6,539 | | | 13,193 | | | 12,591 | | | | | |
| Net (losses) gains on sales of loans | | (7) | | | 917 | | | (29) | | | 3,839 | | | | | |
| Net gains (losses) on AFS debt securities | | — | | | 28 | | | (10,000) | | | 1,306 | | | | | |
| | | | | | | | | | | | |
| | | | | | | | | | | | |
| | | | | | | | | | | | |
| Other investment income | | 4,003 | | | 4,863 | | | 5,924 | | | 6,490 | | | | | |
| Other income | | 3,936 | | | 2,421 | | | 8,198 | | | 6,700 | | | | | |
| Total noninterest income | | 78,631 | | | 78,444 | | | 138,609 | | | 158,187 | | | | | |
| NONINTEREST EXPENSE | | | | | | | | | | | | |
| Compensation and employee benefits | | 124,937 | | | 113,364 | | | 254,591 | | | 229,633 | | | | | |
| Occupancy and equipment expense | | 16,088 | | | 15,469 | | | 31,675 | | | 30,933 | | | | | |
| Deposit insurance premiums and regulatory assessments | | 8,262 | | | 4,927 | | | 16,172 | | | 9,644 | | | | | |
| Deposit account expense | | 10,559 | | | 5,671 | | | 20,168 | | | 10,364 | | | | | |
| Data processing | | 3,213 | | | 3,486 | | | 6,560 | | | 7,151 | | | | | |
| Computer software expense | | 7,479 | | | 6,572 | | | 14,839 | | | 13,866 | | | | | |
| | | | | | | | | | | | |
| | | | | | | | | | | | |
| Other operating expense | | 35,337 | | | 32,392 | | | 70,207 | | | 55,840 | | | | | |
| Amortization of tax credit and other investments | | 55,914 | | | 14,979 | | | 66,024 | | | 28,879 | | | | | |
| | | | | | | | | | | | |
| Total noninterest expense | | 261,789 | | | 196,860 | | | 480,236 | | | 386,310 | | | | | |
| INCOME BEFORE INCOME TAXES | | 357,588 | | | 341,036 | | | 778,980 | | | 638,942 | | | | | |
| INCOME TAX EXPENSE | | 45,557 | | | 82,707 | | | 144,510 | | | 142,961 | | | | | |
| NET INCOME | | $ | 312,031 | | | $ | 258,329 | | | $ | 634,470 | | | $ | 495,981 | | | | | |
| EARNINGS PER SHARE (“EPS”) | | | | | | | | | | | | |
| BASIC | | $ | 2.21 | | | $ | 1.83 | | | $ | 4.49 | | | $ | 3.50 | | | | | |
| DILUTED | | $ | 2.20 | | | $ | 1.81 | | | $ | 4.47 | | | $ | 3.47 | | | | | |
| WEIGHTED-AVERAGE NUMBER OF SHARES OUTSTANDING | | | | | | | | | | | | |
| BASIC | | 141,468 | | | 141,429 | | | 141,291 | | | 141,725 | | | | | |
| DILUTED | | 141,876 | | | 142,372 | | | 141,910 | | | 142,838 | | | | | |
|
See accompanying Notes to Consolidated Financial Statements.
6
EAST WEST BANCORP, INC. AND SUBSIDIARIES
CONSOLIDATED STATEMENT OF CASH FLOWSCOMPREHENSIVE INCOME (LOSS)
($ in thousands)
(Unaudited)
| | | | | | | | | | | | | | | | |
|
| | Nine Months Ended September 30, | | |
| | 2022 | | 2021 | | |
| CASH FLOWS FROM OPERATING ACTIVITIES | | | | | | |
| Net income | | $ | 791,320 | | | $ | 655,185 | | | |
| Adjustments to reconcile net income to net cash provided by operating activities: | | | | | | |
| Depreciation and amortization | | 81,980 | | | 116,371 | | | |
| Amortization of premiums and accretion of discount, net | | 26,336 | | | 17,392 | | | |
| Stock compensation costs | | 29,338 | | | 24,047 | | | |
| Deferred income tax (benefit) expense | | (6,107) | | | 787 | | | |
| Provision for (reversal of) credit losses | | 48,500 | | | (25,000) | | | |
| Net gains on sales of loans | | (5,968) | | | (6,601) | | | |
| Gains on sales of AFS debt securities | | (1,306) | | | (1,178) | | | |
| | | | | | |
| | | | | | |
| | | | | | |
| | | | | | |
| Loans held-for-sale: | | | | | | |
| Originations and purchases | | (447) | | | (9,323) | | | |
| Proceeds from sales and paydowns/payoffs of loans originally classified as held-for-sale | | 461 | | | 11,337 | | | |
| | | | | | |
| | | | | | |
| Proceeds from distributions received from equity method investees | | 5,642 | | | 7,624 | | | |
| Net change in accrued interest receivable and other assets | | 56,958 | | | (78,649) | | | |
| Net change in accrued expenses and other liabilities | | 584,655 | | | 30,179 | | | |
| Other operating activities, net | | 5,057 | | | 3,660 | | | |
| Total adjustments | | 825,099 | | | 90,646 | | | |
| Net cash provided by operating activities | | 1,616,419 | | | 745,831 | | | |
| CASH FLOWS FROM INVESTING ACTIVITIES | | | | | | |
| Net change in: | | | | | | |
| Investments in qualified affordable housing partnerships, tax credit and other investments | | (91,710) | | | (141,882) | | | |
| Interest-bearing deposits with banks | | 105,479 | | | 4,576 | | | |
| Resale agreements: | | | | | | |
| Proceeds from paydowns and maturities | | 1,719,076 | | | 698,274 | | | |
| Purchases | | (258,559) | | | (1,834,416) | | | |
| AFS debt securities: | | | | | | |
| Proceeds from sales | | 129,181 | | | 236,967 | | | |
| Proceeds from repayments, maturities and redemptions | | 711,950 | | | 1,346,839 | | | |
| Purchases | | (769,007) | | | (5,884,389) | | | |
| HTM debt securities: | | | | | | |
| Proceeds from repayments, maturities and redemptions | | 60,140 | | | — | | | |
| Purchases | | (50,000) | | | — | | | |
| Loans held-for-investment: | | | | | | |
| Proceeds from sales of loans originally classified as held-for-investment | | 453,315 | | | 416,426 | | | |
| Purchases | | (599,660) | | | (746,395) | | | |
| Other changes in loans held-for-investment, net | | (5,675,012) | | | (1,798,011) | | | |
| | | | | | |
| | | | | | |
| | | | | | |
| | | | | | |
| | | | | | |
| Proceeds from sales of OREO | | — | | | 28,560 | | | |
| Purchase of bank-owned life insurance | | — | | | (150,000) | | | |
| Proceeds from distributions received from equity method investees | | 13,557 | | | 5,626 | | | |
| | | | | | |
| Other investing activities, net | | 920 | | | (61) | | | |
| Net cash used in investing activities | | (4,250,330) | | | (7,817,886) | | | |
| | | | | | |
| | | | | | |
| | | | | | |
| | | | | | |
| | | | | | |
| | | | | | |
| | | | | | |
| | | | | | |
| | | | | | |
| | | | | | |
| | | | | | |
| | | | | | |
| | | | | | |
| | | | | | |
| | | | | | |
| | | | | | |
| | | | | | |
| | | | | | |
| | | | | | |
| | | | | | |
| | | | | | |
| | | | | | |
| | | | | | |
| | | | | | |
| | | | | | |
| | | | | | | | | | | | | | | | | | | | | | | | | | | | | | | | | | | | |
|
| | Three Months Ended June 30, | | Six Months Ended June 30, | | | | | | |
| | 2023 | | 2022 | | 2023 | | 2022 | | | | | | | | | | |
| Net income | | $ | 312,031 | | | $ | 258,329 | | | $ | 634,470 | | | $ | 495,981 | | | | | | | | | | | |
| Other comprehensive loss, net of tax: | | | | | | | | | | | | | | | | | | |
| Net changes in unrealized (losses) gains on AFS debt securities | | (43,618) | | | (192,878) | | | 7,701 | | | (362,148) | | | | | | | | | | | |
| Reclassification of unrealized losses on debt securities transferred from AFS to HTM | | — | | | — | | | — | | | (112,991) | | | | | | | | | | | |
| Amortization of unrealized losses on debt securities transferred from AFS to HTM | | 2,816 | | | 3,750 | | | 5,578 | | | 6,061 | | | | | | | | | | | |
| Net changes in unrealized losses on cash flow hedges | | (53,887) | | | (6,380) | | | (25,274) | | | (31,103) | | | | | | | | | | | |
| Foreign currency translation adjustments | | (7,249) | | | (10,215) | | | (4,308) | | | (10,086) | | | | | | | | | | | |
| Other comprehensive loss | | (101,938) | | | (205,723) | | | (16,303) | | | (510,267) | | | | | | | | | | | |
| COMPREHENSIVE INCOME (LOSS) | | $ | 210,093 | | | $ | 52,606 | | | $ | 618,167 | | | $ | (14,286) | | | | | | | | | | | |
|
See accompanying Notes to Consolidated Financial Statements.
7
EAST WEST BANCORP, INC. AND SUBSIDIARIES
CONSOLIDATED STATEMENT OF CHANGES IN STOCKHOLDERS’ EQUITY
($ in thousands, except shares and per share data)
(Unaudited)
| | | | | | | | | | | | | | | | | | | | | | | | | | | | | | | | | | | | | | |
|
| | Common Stock and Additional Paid-in Capital | | Retained Earnings | | Treasury Stock | | AOCI, Net of Tax | | Total Stockholders’ Equity |
| | Shares | | Amount | | | | |
| BALANCE, APRIL 1, 2022 | | 142,256,520 | | | $ | 1,903,042 | | | $ | 4,863,721 | | | $ | (668,382) | | | $ | (394,925) | | | $ | 5,703,456 | |
| Net income | | — | | | — | | | 258,329 | | | — | | | — | | | 258,329 | |
| Other comprehensive loss | | — | | | — | | | — | | | — | | | (205,723) | | | (205,723) | |
| Issuance of common stock pursuant to various stock compensation plans and agreements | | 51,733 | | | 11,190 | | | — | | | — | | | — | | | 11,190 | |
| Repurchase of common stock pursuant to various stock compensation plans and agreements | | (5,347) | | | — | | | — | | | (380) | | | — | | | (380) | |
| Repurchase of common stock pursuant to the Stock Repurchase Program | | (1,385,517) | | | — | | | — | | | (99,990) | | | — | | | (99,990) | |
| Cash dividends on common stock ($0.40 per share) | | — | | | — | | | (57,400) | | | — | | | — | | | (57,400) | |
| BALANCE, JUNE 30, 2022 | | 140,917,389 | | | $ | 1,914,232 | | | $ | 5,064,650 | | | $ | (768,752) | | | $ | (600,648) | | | $ | 5,609,482 | |
| BALANCE, APRIL 1, 2023 | | 141,395,800 | | | $ | 1,947,687 | | | $ | 5,832,291 | | | $ | (790,653) | | | $ | (679,994) | | | $ | 6,309,331 | |
| | | | | | | | | | | | |
| Net income | | — | | | — | | | 312,031 | | | — | | | — | | | 312,031 | |
| Other comprehensive loss | | — | | | — | | | — | | | — | | | (101,938) | | | (101,938) | |
| Issuance of common stock pursuant to various stock compensation plans and agreements | | 111,097 | | | 12,097 | | | — | | | — | | | — | | | 12,097 | |
| Repurchase of common stock pursuant to various stock compensation plans and agreements | | (23,229) | | | — | | | — | | | (1,237) | | | — | | | (1,237) | |
| | | | | | | | | | | | |
| Cash dividends on common stock ($0.48 per share) | | — | | | — | | | (68,587) | | | — | | | — | | | (68,587) | |
| BALANCE, JUNE 30, 2023 | | 141,483,668 | | | $ | 1,959,784 | | | $ | 6,075,735 | | | $ | (791,890) | | | $ | (781,932) | | | $ | 6,461,697 | |
| | | | | | | | | | | | |
| | | | | | | | | | | | | | | | | | | | | | | | | | | | | | | | | | | | | | |
|
| | Common Stock and Additional Paid-in Capital | | Retained Earnings | | Treasury Stock | | AOCI,
Net of Tax | | Total
Stockholders’ Equity |
| | Shares | | Amount | | | | |
| BALANCE, JANUARY 1, 2022 | | 141,907,954 | | | $ | 1,893,725 | | | $ | 4,683,659 | | | $ | (649,785) | | | $ | (90,381) | | | $ | 5,837,218 | |
| | | | | | | | | | | | |
| Net income | | — | | | — | | | 495,981 | | | — | | | — | | | 495,981 | |
| Other comprehensive loss | | — | | | — | | | — | | | | | (510,267) | | | (510,267) | |
| | | | | | | | | | | | |
| | | | | | | | | | | | |
| | | | | | | | | | | | |
| Issuance of common stock pursuant to various stock compensation plans and agreements | | 639,847 | | | 20,507 | | | — | | | — | | | — | | | 20,507 | |
| Repurchase of common stock pursuant to various stock compensation plans and agreements | | (244,895) | | | — | | | — | | | (18,977) | | | — | | | (18,977) | |
| Repurchase of common stock pursuant to the Stock Repurchase Program | | (1,385,517) | | | — | | | — | | | (99,990) | | | — | | | (99,990) | |
| Cash dividends on common stock ($0.80 per share) | | — | | | — | | | (114,990) | | | — | | | — | | | (114,990) | |
| BALANCE, JUNE 30, 2022 | | 140,917,389 | | | $ | 1,914,232 | | | $ | 5,064,650 | | | $ | (768,752) | | | $ | (600,648) | | | $ | 5,609,482 | |
| BALANCE, JANUARY 1, 2023 | | 140,947,846 | | | $ | 1,936,557 | | | $ | 5,582,546 | | | $ | (768,862) | | | $ | (765,629) | | | $ | 5,984,612 | |
| | | | | | | | | | | | |
Cumulative-effect of a change in accounting principle (1) | | — | | | — | | | (4,262) | | | — | | | — | | | (4,262) | |
| Net income | | — | | | — | | | 634,470 | | | — | | | — | | | 634,470 | |
| Other comprehensive loss | | — | | | — | | | — | | | — | | | (16,303) | | | (16,303) | |
| | | | | | | | | | | | |
| | | | | | | | | | | | |
| | | | | | | | | | | | |
| Issuance of common stock pursuant to various stock compensation plans and agreements | | 851,819 | | | 23,227 | | | — | | | — | | | — | | | 23,227 | |
| Repurchase of common stock pursuant to various stock compensation plans and agreements | | (315,997) | | | — | | | — | | | (23,028) | | | — | | | (23,028) | |
| | | | | | | | | | | | |
| | | | | | | | | | | | |
| Cash dividends on common stock ($0.96 per share) | | — | | | — | | | (137,019) | | | — | | | — | | | (137,019) | |
| BALANCE, JUNE 30, 2023 | | 141,483,668 | | | $ | 1,959,784 | | | $ | 6,075,735 | | | $ | (791,890) | | | $ | (781,932) | | | $ | 6,461,697 | |
| | | | | | | | | | | | |
(1)Represents the change in the Company’s allowance for loan losses as a result of the adoption of Accounting Standards Update (“ASU”) 2022-02, Financial Instruments - Credit Losses (Topic 326): Troubled Debt Restructurings and the Vintage Disclosures on January 1, 2023. Refer to Note 2 — Current Accounting Developments and Summary of Significant Accounting Policies in this Form 10-Q for additional information.
See accompanying Notes to Consolidated Financial Statements.
8
EAST WEST BANCORP, INC. AND SUBSIDIARIES
CONSOLIDATED STATEMENT OF CASH FLOWS
($ in thousands)
(Unaudited)
| | | | | | | | | | | | | | | | |
|
| | Six Months Ended June 30, | | |
| | 2023 | | 2022 | | |
| CASH FLOWS FROM OPERATING ACTIVITIES | | | | | | |
| Net income | | $ | 634,470 | | | $ | 495,981 | | | |
| Adjustments to reconcile net income to net cash provided by operating activities: | | | | | | |
| Depreciation and amortization | | 106,579 | | | 48,911 | | | |
| Amortization of premiums and accretion of discount, net | | (10,489) | | | 21,519 | | | |
| Stock compensation costs | | 20,439 | | | 17,009 | | | |
| Deferred income tax expense (benefit) | | 1,098 | | | (7,554) | | | |
| Provision for credit losses | | 46,000 | | | 21,500 | | | |
| Net losses (gains) on sales of loans | | 29 | | | (3,839) | | | |
| Net losses (gains) on AFS debt securities | | 10,000 | | | (1,306) | | | |
| | | | | | |
| | | | | | |
| | | | | | |
| | | | | | |
| Loans held-for-sale: | | | | | | |
| Originations and purchases | | — | | | (447) | | | |
| Proceeds from sales and paydowns/payoffs of loans originally classified as held-for-sale | | — | | | 461 | | | |
| | | | | | |
| | | | | | |
| Proceeds from distributions received from equity method investees | | 2,696 | | | 4,412 | | | |
| Net change in accrued interest receivable and other assets | | (273,537) | | | (128,071) | | | |
| Net change in accrued expenses and other liabilities | | (55,634) | | | 457,296 | | | |
| Other operating activities, net | | (283) | | | 3,182 | | | |
| Total adjustments | | (153,102) | | | 433,073 | | | |
| Net cash provided by operating activities | | 481,368 | | | 929,054 | | | |
| CASH FLOWS FROM INVESTING ACTIVITIES | | | | | | |
| Net change in: | | | | | | |
| Investments in qualified affordable housing partnerships, tax credit and other investments | | (69,946) | | | (49,545) | | | |
| Interest-bearing deposits with banks | | 121,774 | | | 23,442 | | | |
| Resale agreements: | | | | | | |
| Proceeds from paydowns and maturities | | 169,917 | | | 1,162,172 | | | |
| Purchases | | (12,725) | | | (231,463) | | | |
| AFS debt securities: | | | | | | |
| Proceeds from sales | | — | | | 129,181 | | | |
| Proceeds from repayments, maturities and redemptions | | 623,108 | | | 613,244 | | | |
| Purchases | | (594,214) | | | (767,015) | | | |
| HTM debt securities: | | | | | | |
| Proceeds from repayments, maturities and redemptions | | 33,882 | | | 40,072 | | | |
| Purchases | | — | | | (50,000) | | | |
| Loans held-for-investment: | | | | | | |
| Proceeds from sales of loans originally classified as held-for-investment | | 302,811 | | | 325,813 | | | |
| Purchases | | (272,637) | | | (541,997) | | | |
| Other changes in loans held-for-investment, net | | (1,649,160) | | | (4,639,384) | | | |
| | | | | | |
| | | | | | |
| | | | | | |
| | | | | | |
| | | | | | |
| | | | | | |
| | | | | | |
| Proceeds from distributions received from equity method investees | | 13,113 | | | 8,717 | | | |
| | | | | | |
| Other investing activities, net | | (6,170) | | | 1,354 | | | |
| Net cash used in investing activities | | (1,340,247) | | | (3,975,409) | | | |
| | | | | | |
| | | | | | |
| | | | | | |
| | | | | | |
| | | | | | |
| | | | | | |
| | | | | | |
| | | | | | |
| | | | | | |
| | | | | | |
| | | | | | |
| | | | | | |
| | | | | | |
| | | | | | |
| | | | | | |
| | | | | | |
| | | | | | |
| | | | | | |
| | | | | | |
| | | | | | |
| | | | | | |
| | | | | | |
| | | | | | |
| | | | | | |
| | | | | | |
See accompanying Notes to Consolidated Financial Statements.
9
EAST WEST BANCORP, INC. AND SUBSIDIARIES
CONSOLIDATED STATEMENT OF CASH FLOWS
($ in thousands)
(Unaudited)
(Continued)
| | | | Nine Months Ended September 30, | | | Six Months Ended June 30, | |
| | 2022 | | 2021 | | | 2023 | | 2022 | |
| | CASH FLOWS FROM FINANCING ACTIVITIES | CASH FLOWS FROM FINANCING ACTIVITIES | | | | | | CASH FLOWS FROM FINANCING ACTIVITIES | | | | | |
| Net change in deposits | Net change in deposits | | 623,025 | | | 8,486,734 | | | Net change in deposits | | (262,287) | | | 1,046,046 | | |
| Net change in federal funds purchased and short-term borrowings | | 200,006 | | | (21,143) | | | |
| Net change in short-term borrowings | | Net change in short-term borrowings | | 4,500,017 | | | (49) | | |
| | FHLB advances: | FHLB advances: | | | FHLB advances: | | |
| Proceeds | Proceeds | | 4,600,200 | | | — | | | Proceeds | | 6,000,000 | | | 3,950,000 | | |
| Repayment | Repayment | | (4,525,200) | | | (405,000) | | | Repayment | | (6,000,000) | | | (4,025,000) | | |
| Repurchase agreements: | Repurchase agreements: | | | Repurchase agreements: | | |
| Proceeds from repurchase agreements | Proceeds from repurchase agreements | | 311,785 | | | — | | | Proceeds from repurchase agreements | | — | | | 311,785 | | |
| | Repayment of repurchase agreements | | Repayment of repurchase agreements | | (300,000) | | | — | | |
| Repurchase agreements’ extinguishment cost | | Repurchase agreements’ extinguishment cost | | (3,872) | | | — | | |
| Long-term debt and lease liabilities: | Long-term debt and lease liabilities: | | | Long-term debt and lease liabilities: | | |
| | Repayment of long-term debt and lease liabilities | Repayment of long-term debt and lease liabilities | | (710) | | | (909) | | | Repayment of long-term debt and lease liabilities | | (421) | | | (457) | | |
| Common stock: | Common stock: | | | Common stock: | | |
| Repurchase of common stocks pursuant to the Stock Repurchase Program | Repurchase of common stocks pursuant to the Stock Repurchase Program | | (99,990) | | | — | | | Repurchase of common stocks pursuant to the Stock Repurchase Program | | — | | | (99,990) | | |
| Proceeds from issuance pursuant to various stock compensation plans and agreements | Proceeds from issuance pursuant to various stock compensation plans and agreements | | 1,444 | | | 1,180 | | | Proceeds from issuance pursuant to various stock compensation plans and agreements | | — | | | 1,444 | | |
| Stocks tendered for payment of withholding taxes | | (18,983) | | | (15,508) | | | |
| Stock tendered for payment of withholding taxes | | Stock tendered for payment of withholding taxes | | (23,028) | | | (18,977) | | |
| Cash dividends paid | Cash dividends paid | | (171,991) | | | (141,911) | | | Cash dividends paid | | (138,914) | | | (115,623) | | |
| Net cash provided by financing activities | Net cash provided by financing activities | | 919,586 | | | 7,903,443 | | | Net cash provided by financing activities | | 3,771,495 | | | 1,049,179 | | |
| Effect of exchange rate changes on cash and cash equivalents | Effect of exchange rate changes on cash and cash equivalents | | (35,257) | | | 3,542 | | | Effect of exchange rate changes on cash and cash equivalents | | (16,513) | | | (13,706) | | |
| NET (DECREASE) INCREASE IN CASH AND CASH EQUIVALENTS | | (1,749,582) | | | 834,930 | | | |
| NET INCREASE (DECREASE) IN CASH AND CASH EQUIVALENTS | | NET INCREASE (DECREASE) IN CASH AND CASH EQUIVALENTS | | 2,896,103 | | | (2,010,882) | | |
| CASH AND CASH EQUIVALENTS, BEGINNING OF PERIOD | CASH AND CASH EQUIVALENTS, BEGINNING OF PERIOD | | 3,912,935 | | | 4,017,971 | | | CASH AND CASH EQUIVALENTS, BEGINNING OF PERIOD | | 3,481,784 | | | 3,912,935 | | |
| CASH AND CASH EQUIVALENTS, END OF PERIOD | CASH AND CASH EQUIVALENTS, END OF PERIOD | | $ | 2,163,353 | | | $ | 4,852,901 | | | CASH AND CASH EQUIVALENTS, END OF PERIOD | | $ | 6,377,887 | | | $ | 1,902,053 | | |
| | SUPPLEMENTAL CASH FLOW INFORMATION | SUPPLEMENTAL CASH FLOW INFORMATION | | | SUPPLEMENTAL CASH FLOW INFORMATION | | |
| Cash paid during the period for: | Cash paid during the period for: | | | Cash paid during the period for: | | |
| Interest | Interest | | $ | 107,146 | | | $ | 70,833 | | | Interest | | $ | 504,774 | | | $ | 45,057 | | |
| Income taxes, net | Income taxes, net | | $ | 233,082 | | | $ | 137,452 | | | Income taxes, net | | $ | 255,432 | | | $ | 188,510 | | |
| Noncash investing and financing activities: | Noncash investing and financing activities: | | | | | | Noncash investing and financing activities: | | | | | |
| | Securities transferred from AFS to HTM debt securities | Securities transferred from AFS to HTM debt securities | | $ | 3,010,003 | | | $ | — | | | Securities transferred from AFS to HTM debt securities | | $ | — | | | $ | 3,010,003 | | |
| Loans transferred from held-for-investment to held-for-sale | Loans transferred from held-for-investment to held-for-sale | | $ | 463,769 | | | $ | 411,416 | | | Loans transferred from held-for-investment to held-for-sale | | $ | 280,026 | | | $ | 351,406 | | |
| Loans transferred from held-for-sale to held-for-investment | | Loans transferred from held-for-sale to held-for-investment | | $ | — | | | $ | 631 | | |
| | Loans transferred to other real estate owned (“OREO”) and other foreclosed assets | | $ | — | | | $ | 49,122 | | | |
|
See accompanying Notes to Consolidated Financial Statements.
810
EAST WEST BANCORP, INC. AND SUBSIDIARIES
NOTES TO CONSOLIDATED FINANCIAL STATEMENTS
(Unaudited)
Note 1 — Basis of Presentation
East West Bancorp, Inc. (referred to herein on an unconsolidated basis as “East West” and on a consolidated basis as the “Company”) is a registered bank holding company that offers a full range of banking services to individuals and businesses through its subsidiary bank, East West Bank and its subsidiaries (“East West Bank” or the “Bank”). The unaudited interim Consolidated Financial Statements in this Quarterly Report on Form 10-Q (“this Form 10-Q”) include the accounts of East West, East West Bank and East West’s subsidiaries. Intercompany transactions and accounts have been eliminated in consolidation. As of SeptemberJune 30, 2022,2023, East West also has six wholly-owned subsidiaries that are statutory business trusts (the “Trusts”). In accordance with Financial Accounting Standards BoardFASB Accounting Standards Codification (“ASC”) Topic 810, Consolidation, the Trusts are not included on the Consolidated Financial Statements.
The unaudited interim Consolidated Financial Statements are presented in accordance with United States (“U.S.”) Generally Accepted Accounting Principles (“GAAP”), applicable guidelines prescribed by regulatory authorities and general practices in the banking industry. While the unaudited interim Consolidated Financial Statements reflect all adjustments that, in the opinion of management, are necessary for fair presentation, they primarily serve to update the most recently filed annual report on Form 10-K, and may not include all the information and notes necessary to constitute a complete set of financial statements. Accordingly, they should be read in conjunction with the audited Consolidated Financial Statements and notes thereto included in the Company’s Annual Report on2022 Form 10-K for the year ended December 31, 2021, filed with the U.S. Securities and Exchange Commission on February 28, 2022 (the “Company’s 2021 Form 10-K”). In addition, certain items on the Consolidated Financial Statements and notes for the prior periods have been reclassified to conform to the current period presentation.10-K.
The preparation of the Consolidated Financial Statements in conformity with U.S. GAAP requires management to make estimates and assumptions that affect the reported amounts of assets and liabilities as of the date of the Consolidated Financial Statements, income and expenses during the reporting periods, and the related disclosures. Although our current estimates contemplate current conditions and how we expect them to change in the future, it is reasonably possible that actual results could be materially different from those estimates. Hence, the current period’s results of operations are not necessarily indicative of results that may be expected for any future interim period or for the year as a whole. Events subsequent to the Consolidated Balance Sheet date have been evaluated through the date the Consolidated Financial Statements are issued for inclusion in the accompanying Consolidated Financial Statements.
Risk and Uncertainties
The failures of Silicon Valley Bank, Signature Bank and First Republic Bank earlier in the year have resulted in significant disruption in the financial services industry, which has adversely impacted the volatility and market prices of the securities of financial institutions. In addition, these bank failures have caused concern and uncertainty regarding the liquidity of the banking sector as a whole and resulted in some regional bank customers choosing to maintain deposits with larger financial institutions. Further, competition for deposits has increased in recent periods, and the cost of funding has similarly increased, putting pressure on our net interest margin. These events have adversely impacted, and could continue to adversely affect, our business, results of operations, and financial condition, as well as the market price and volatility of our common stock.
Note 2 — Current Accounting Developments and Summary of Significant Accounting Policies
Accounting Pronouncements Adopted in 2023
| | | | | | | | | | | |
| Standard | Required Date of Adoption | Description | Effect on Financial Statements |
ASU 2022-02, Financial Instruments —Credit Losses (Topic 326): Troubled Debt Restructurings and the Vintage Disclosures | January 1, 2023
Early adoption is permitted | ASU 2022-02 eliminates the •accounting guidance for troubled debt restructurings (“TDR”), and requires the Company to apply the loan refinancing and restructuring guidance to determine whether a modification made to a loan results in a new loan or a continuation of an existing loan; and •requirement to use a discounted cash flow method to measure receivables.
The guidance also requires •enhanced disclosures for certain loan refinancings and restructurings by creditors when the borrower is experiencing financial difficulty; and •vintage disclosures of current period gross charge-offs (on a current year-to-date basis) by year of loan origination for financing receivables and net investments in leases within the scope of ASC 326-20: Financial Instruments — Credit Losses — Measured at Amortized Cost. | The Company adopted ASU 2022-02 on January 1, 2023 on a prospective basis, except for the guidance related to the elimination of TDR recognition and measurement, which was adopted on a modified retrospective approach.
This adoption increased the allowance for loan losses on TDRs as of December 31, 2022 by $6.0 million and decreased opening retained earnings on January 1, 2023 by $4.3 million after-tax. Disclosures as of June 30, 2023 are presented in accordance with this guidance while prior year amounts are reported in accordance with previously applicable GAAP. |
| | | |
Recent Accounting Pronouncements Yet to be Adopted
| | | | | | | | | | | |
| Standard | Required Date of Adoption | Description | Effect on Financial Statements |
| Standards Not Yet Adopted |
Accounting Standards Update (“ASU”) 2022-02,ASU 2023-01, Financial Instruments - Credit LossesLeases (Topic 842): (Topic 326): Troubled Debt Restructurings and the Vintage Disclosures
| January 1, 20232024
Early adoption is permitted | ASU 2022-02 eliminates2023-01 amends the troubled debt restructuring (“TDRs”) accounting model for creditors and insteadleasehold improvements for leases between entities under common control arrangements. The guidance requires leasehold improvements associated with leases between companies under common control to applybe amortized by a lessee over the loan refinancing and restructuring guidanceeconomic life of the leasehold improvements, regardless of the lease term or, until the lessee ceases to determine whether a modification made to a borrower results in a new loan or a continuation of an existing loan. In addition, companies are no longer required to use a discounted cash flow method to measure the allowance for credit losses for certain TDRs and instead allows forcontrol the use of the underlying asset through a lease, at which time the remaining value of the leasehold improvement would be accounted for as a transfer between companies under common control through an expected loss approach for all loans. The guidance also introduces new disclosure requirements relatedadjustment to restructuring of financing receivables made to borrowers experiencing financial difficulty, and amends vintage disclosures to require current-period gross write-off by year of origination. equity.
The amendments in this guidance shouldmay be applied retrospectively to the beginning of the period in which the entity first applied Topic 842 or prospectively (1) to all new leasehold improvements recognized on a prospective basis except foror after the date the entity first applies the amendments, relatedor (2) to recognitionall new and measurement of TDRs, where a modified retrospective transition method is optional. existing leasehold improvements recognized on or after the date the entity first applies the amendments. | The Company does not expect the adoption of this guidance to have a material impact on the Company’s Consolidated Financial Statements. The Company expects to adopt ASU 2022-022023-01 on January 1, 2023.
|
ASU 2022-03,2023-02, Fair Value MeasurementInvestments — Equity Method and Joint Ventures (Topic 820)(Topic 323): Fair Value Measurement of Equity Securities Subject to Contractual Sale RestrictionsAccounting for Investments in Tax Credit Structures Using the Proportional Amortization Method | January 1, 2024 | ASU 2022-03 clarifies that a contractual restriction on the sale of an equity security is not considered part of the unit of account of the equity security and, therefore, is not considered in measuring fair value. This ASU also requires the following disclosures for equity securities that are subject to contractual restrictions: the fair value of equity securities subject to contractual sale restrictions; nature and remaining duration of the restrictions; and circumstances that could cause a lapse in the restrictions.
Early adoption is permitted | ASU 2023-02 expands the scope of the proportional amortization method to equity tax credit investment programs if certain conditions are met. Previously, the proportional amortization method could only be used for investments in low-income housing tax credit structures. Under this guidance, companies are able to elect, on a tax credit program-by-tax credit program basis, to apply the proportional amortization method to all equity investments meeting the criteria in ASC 323-740-25-1.
The amendments in this guidance shouldmust be applied on a prospective basis with any adjustments from the adoption of the amendment recognized in earnings and disclosed on the date of adoption.modified retrospective or a retrospective basis. | The Company does not expectis currently evaluating the adoptionimpact of this guidance to have an impact on the Company’s Consolidated Financial Statements. The Company expects to adopt ASU 2022-03 on January 1, 2024. |
| | | |
| | | |
Significant Accounting Policies Update
DuringLoan Modifications — Certain loans are modified in the first quarternormal course of 2022,business for competitive reasons or in conjunction with the Company’s loss mitigation activities. Upon the adoption of ASU 2022-02, the Company transferred $3.01 billionapplies the general loan modification guidance provided in fair value of debt securities from AFSASC 310-20 to HTM.
Transfer between Categories of Debt Securities— Upon transfer ofall loan modifications, including modifications made to borrowers experiencing financial difficulty. Under the general loan modification guidance, a debt security frommodification is treated as a new loan only if the AFS to HTM category,following two conditions are met: (1) the security’s new amortized cost is reset to fair value, reduced by any previous write-offs but excluding any allowance for credit losses. Unrealized gains or losses at the date of transfer of these securities continue to be reported in AOCI and are amortized into interest income over the remaining lifeterms of the securitiesnew loan are at least as effective yield adjustments, in a manner consistentfavorable to the Company as the terms for comparable loans to other customers with similar collection risks; and (2) modifications to the amortization or accretionterms of the original purchase premiumloan are more than minor. If either condition is not met, the modification is accounted for as a continuation of the existing loan with any effect of the modification treated as a prospective adjustment to the loan’s effective interest rate. A modification made to borrowers experiencing financial difficulty may vary by program and by borrower-specific characteristics, and may include rate reductions, principal forgiveness, term extensions, and payment delays, and is intended to minimize the Company’s economic loss and to avoid foreclosure or discount onrepossession of collateral. The Company applies the associated security.same credit loss methodology it uses for similar loans that were not modified. For transfers of securities from the AFSCompany’s accounting policy related to HTM category, anythe loan modifications’ allowance for creditloan losses, that was previously recorded under the AFS model is reversedsee Note 7 — Loans Receivable and an allowance for credit losses is subsequently recorded under the HTM debt security model. The reversal and re-establishment of the allowance for credit losses are recorded in the provision for credit losses.
Held-to-Maturity Debt Securities— Debt securities that the Company has the intent and ability to hold until maturity are classified as HTM and are carried at amortized cost, net of allowance for credit losses. The criteria used to place HTM debt securities on nonaccrual are largely similar to those described for loans. The amortized cost of the Company’s HTM debt securities excludes accrued interest, which is included in Other assets on the Consolidated Balance Sheet. The Company has made an accounting policy election not to recognize an allowance for credit losses for accrued interest receivables on HTM debt securities, as the Company reverses any accrued interest against interest income if a debt security is placed on nonaccrual status. Any cash collected on nonaccrual HTM securities is applied to reduce the security’s amortized cost basis and not as interest income. Generally, the Company returns an HTM security to accrual status when all delinquent interest and principal become current under the contractual terms of the security, and the collectability of remaining principal and interest is no longer doubtful.
Allowance for Credit Losses on Held-to-Maturity Debt Securities— Allowance for Credit Losses —For each major HTM debt security type,to the allowance for credit losses is estimated collectively for groups of securities with similar risk characteristics. For securities that do not share similar risk characteristics, the losses are estimated individually. The Company applies a zero credit loss assumption to certain HTM debt securities, including debt securities that are either guaranteed or issued by the U.S. government or government-sponsored enterprises, are highly rated by nationally recognized statistical rating organizations (“NRSROs”), and have a long history of no credit losses. Any expected credit loss is recorded through the allowance for credit losses on HTM debt securities and deducted from the amortized cost basis of the security, reflecting the net amount the Company expects to collect.Consolidated Financial Statements in this Form 10-Q.
Note 3 — Fair Value Measurement and Fair Value of Financial Instruments
Fair Value Determination
Fair value is defined as the price that would be received to sell an asset or the price that would be paid to transfer a liability in an orderly transaction between market participants at the measurement date. In determining the fair value of financial instruments,Under applicable accounting standards, the Company uses various methods including market and income approaches. Based on these approaches, the Company utilizes certain assumptions that market participants would use in pricing an asset ormeasures a liability. These inputs can be readily observable, market corroborated or generally unobservable. The Company utilizes valuation techniques that maximize the useportion of observable inputs and minimize the use of unobservable inputs. The fair value hierarchy described below is based on the quality and reliability of the information used to determine fair value. The fair value hierarchy gives the highest priority to quoted prices available in active markets and the lowest priority to prices derived from data lacking transparency. The fair value of the Company’sits assets and liabilities is classified and disclosed in one of the following three categories:
•Level 1 — Valuation is based on quoted prices for identical instruments traded in active markets.
•Level 2 — Valuation is based on quoted prices for similar instruments traded in active markets; quoted prices for identical or similar instruments traded in markets that are not active; and model-derived valuations whose inputs are observable and can be corroborated by market data.
•Level 3 — Valuation is based on significant unobservable inputs for determining theat fair value of assets or liabilities.value. These significant unobservable inputs reflect assumptions that market participants may use in pricing the assets or liabilities.
The classification of assets and liabilities within the hierarchy is based on whether inputs to the valuation methodology used are observable or unobservable, and the significance of those inputs in the fair value measurement. The Company’s assets and liabilities are classified in their entiretypredominantly recorded at fair value on a recurring basis. From time to time, certain assets and liabilities are measured at fair value on a nonrecurring basis; that is, they are subject to fair value adjustments only as required through the application of an accounting method such as lower of cost or fair value or write-down of individual assets. The Company categorizes its assets and liabilities into three levels based on the lowest level of input that is significant to theirestablished fair value measurements.hierarchy and conducts a review of fair value hierarchy classifications on a quarterly basis. For more information regarding the fair value hierarchy and how the Company measures fair value, see Note 1 — Summary of Significant Accounting Policies — Significant Accounting Policies — Fair Value to the Consolidated Financial Statements in the Company’s 2022 Form 10-K for additional information.
Assets and Liabilities Measured at Fair Value on a Recurring Basis
The following section describes the valuation methodologies used by the Company to measure financial assets and liabilities on a recurring basis, as well as the general classification of these instruments pursuant towithin the fair value hierarchy.
Available-for-Sale Debt Securities — The fair value of AFS debt securities is generally determined by independent external pricing service providers who have experience in valuing these securities or by taking the average quoted market prices obtained from independent external brokers. The valuations provided by the third-party pricing service providers are based on observable market inputs, which include benchmark yields, reported trades, issuer spreads, benchmark securities, bids, offers, prepayment expectations and reference data obtained from market research publications. Inputs used by the third-party pricing service providers in valuing collateralized mortgage obligations and other securitization structures also include new issuenewly issued data, monthly payment information, whole loan collateral performance, tranche evaluation and “To Be Announced” prices. In valuing securities issued by state and political subdivisions, inputs used by third-party pricing service providers also include material event notices.
On a monthly basis, the Company validates the valuations provided by third-party pricing service providers to ensure that the fair value determination is consistent with the applicable accounting guidance and the financial instruments are properly classified in the fair value hierarchy. To perform this validation, the Company evaluates the fair values of securities by comparing the fair values provided by the third-party pricing service providers to prices from other available independent sources for the same securities. When significant variances in prices are identified, the Company further compares inputs used by different sources to ascertain the reliability of these sources. On a quarterly basis, the Company reviews the valuation inputs and methodology for each security category furnished by third-party pricing service providers.
When available,a quoted price in an active market exists for the Company uses quoted market pricesidentical security, this price is used to determine the fair value ofand the AFS debt securities that aresecurity is classified as Level 1. Level 1 AFS debt securities consist of U.S. Treasury securities. When pricing is unavailable from third-party pricing service providers for certain securities, the Company requests market quotes from various independent external brokers and utilizes the average quoted market prices. In addition, the Company obtains market quotes from other official published sources. As these valuations are based on observable inputs in the current marketplace, they are classified as Level 2. The Company periodically communicates with the independent external brokers to validate their pricing methodology. Information such as pricing sources, pricing assumptions, data inputs and valuation techniques are reviewed periodically.
Equity Securities — Equity securities consisted of mutual funds as of both SeptemberJune 30, 20222023 and December 31, 2021.2022. The Company invested in these mutual funds for Community Reinvestment Act (“CRA”) purposes. The Company uses net asset value (“NAV”) information to determine the fair value of these equity securities. When NAV is available periodically and the equity securities can be put back to the transfer agents at the publicly available NAV, the fair value of the equity securities is classified as Level 1. When NAV is available periodically, but the equity securities may not be readily marketable at its periodic NAV in the secondary market, the fair value of these equity securities is classified as Level 2.
Interest Rate Contracts — The Company enters intoInterest rate contracts consist of interest rate swapswaps and option contracts that are not designated as hedging instruments with its borrowers to lock in attractive intermediate and long-term interest rates, resulting in the customer obtaining a synthetic fixed-rate loan. To economically hedge against the interest rate risks in the products offered to its customers, the Company enters into mirrored offsetting interest rate contracts with third-party financial institutions. The Company also enters into interest rate swap or interest rate collar contracts with institutional counterparties to hedge against certain variable interest rate borrowings and variable interest rate loans. These interest rate contracts with institutional counterparties are designated as cash flow hedges.options. The fair value of the interest rate swaps is determined using the market standard methodology of netting the discounted future fixed cash payments (or receipts) and the discounted expected variable cash receipts (or payments). The fair value of the interest rate options, which consist of floors and caps, is determined using the market standard methodology of discounting the future expected cash receipts that would occur if variable interest rates fall below (rise above) the strike rate of the floors (caps). In addition, to comply with the provisions of ASC 820, Fair Value Measurement, the Company incorporates credit valuation adjustments to appropriately reflect both its own and the respective counterparty’s nonperformance risk in the fair value measurements of its derivatives. The credit valuation adjustments associated with the Company’s derivatives utilize model-derived credit spreads, which are Level 3 inputs. Considering the observable nature of all other significant inputs utilized, the Company classifies these derivative instruments as Level 2.
Foreign Exchange Contracts — The Company enters into foreign exchange contracts to accommodate the business needs of its customers. For a majority of the foreign exchange contracts entered with its customers, the Company entered into offsetting foreign exchange contracts with third-party financial institutions to manage its exposure. The Company also utilizes foreign exchange contracts that are not designated as hedging instruments to mitigate the economic effect of fluctuations in certain foreign currency on-balance sheet assets and liabilities, primarily foreign currency denominated deposits that it offers to its customers. The fair value of foreign exchange contracts is determined at each reporting period based on changes in the foreign exchange rates. These are over-the-counter contracts where quoted market prices are not readily available. Valuation is measured using conventional valuation methodologies with observable market data. Due to the short-term nature of the majority of these contracts, the counterparties’ credit risks are considered nominal and result in no adjustments to the valuation of the foreign exchange contracts. Due to the observable nature of the inputs used in deriving the fair value of these contracts, the valuation of foreign exchange contracts is classified as Level 2. As of Septemberboth June 30, 20222023 and December 31, 2021,2022, the Bank held foreign currency non-deliverable forward contracts to hedge its net investment in its China subsidiary, East West Bank (China) Limited, a non-U.S. dollar (“USD”) functional currency subsidiary in China. These foreign currency non-deliverable forward contracts were designated as net investment hedges. The fair value of foreign currency non-deliverable forward contracts is determined by comparing the contracted foreign exchange rate to the current market foreign exchange rate. Key inputs of the current market exchange rate include spot rates and forward rates of the contractual currencies. Foreign exchange forward curves are used to determine which forward rate pertains to a specific maturity. Due to the observable nature of the inputs used in deriving the estimated fair value, these instruments are classified as Level 2.
Credit Contracts — TheCredit contracts utilized by the Company may periodically enter intoare comprised of credit risk participation agreements (“RPAs”) to manageentered into by the credit exposure on interest rate contracts associated with the syndicated loans. The Company may enter into protection sold or protection purchased RPAs with institutional counterparties. The fair value of the RPAs is calculated by determining the total expected asset or liability exposure of the derivatives to the borrowers and applying the borrowers’ credit spread to that exposure. Total expected exposure incorporates both the current and potential future exposure of the derivatives, derived from using observable inputs, such as yield curves and volatilities. SinceDue to the majorityobservable nature of theall other significant inputs used toin deriving the estimated fair value, the RPAs are observable, RPAscredit contracts are classified as Level 2.
Equity Contracts — As partEquity contracts consisted of the loan origination process, the Company may obtain warrants to purchase preferred and/common or commonpreferred stock of the borrowers, which are mainly in the technologypublic and life sciences sectors. Asprivate companies as of Septemberboth June 30, 20222023 and December 31, 2021, the warrants included on the Consolidated Financial Statements were from both public and private companies.2022. The Company values these warrants based on the Black-Scholes option pricing model. For warrants from public companies, the model uses the underlying stock price, stated strike price, warrant expiration date, risk-free interest rate based on a duration-matched U.S. Treasury rate, and market-observable company-specific optionequity volatility as inputs to value the warrants. Due to the observable nature of the inputs used in deriving the estimated fair value, warrants from public companies are classified as Level 2. For warrants from private companies, the model uses inputs such as the offering price observed in the most recent round of funding, stated strike price, warrant expiration date, risk-free interest rate based on duration-matched U.S. Treasury rate and option volatility. The Company applies proxy volatilities based on the industry sectors of the private companies. The model values are then adjusted for a general lack of liquidity due to the private nature of the underlying companies. Since both option volatility and liquidity discount assumptions are subject to management’s judgment, measurement uncertainty is inherent in the valuation of private company warrants. Due to the unobservable nature of the option volatility and liquidity discount assumptions used in deriving the estimated fair value, warrants from private companies are classified as Level 3. On a quarterly basis, the changes in the fair value of warrants from private companies are reviewed for reasonableness, and a measurement of uncertainty analysis on the option volatility and liquidity discount assumptions is performed.
Commodity Contracts — The Company enters into energy commodityCommodity contracts consistingconsist of swaps and options with its oil and gas loan customers, which allow them to hedge against the risk of fluctuation in energyreferencing commodity prices.products. The fair value of the commodity option contracts is determined using the Black-Scholes model and assumptions that include expectations of future commodity price and volatility. The future commodity contract price is derived from observable inputs such as the market price of the commodity. Commodity swaps are structured as an exchange of fixed cash flows for floating cash flows. The fair value of the commodity swaps is determined using the market standard methodology of netting the discounted future fixed cash payments (or receipts) and the discounted expected variable cash receipts (or payments) based on the market prices of the commodity. The fixed cash flows are predetermined based on the known volumes and fixed price as specified in the swap agreement. The floating cash flows are correlated with the change of forward commodity prices, which is derived from market corroborated futures settlement prices. As a result, the Company classifies these derivative instruments as Level 2 due to the observable nature of the significant inputs utilized.
The following tables present financial assets and liabilities that are measured at fair value on a recurring basis as of SeptemberJune 30, 20222023 and December 31, 2021:2022:
| | | ($ in thousands) | | Assets and Liabilities Measured at Fair Value on a Recurring Basis
as of September 30, 2022 | |
| | Assets and Liabilities Measured at Fair Value on a Recurring Basis
as of June 30, 2023 |
| ($ in thousands) | ($ in thousands) | | Quoted Prices in
Active Markets
for Identical
Assets
(Level 1) | | Significant
Other
Observable
Inputs
(Level 2) | | Significant
Unobservable
Inputs
(Level 3) | | Total
Fair Value | ($ in thousands) | | Quoted Prices in
Active Markets
for Identical
Assets
(Level 1) | | Significant
Other
Observable
Inputs
(Level 2) | | Significant
Unobservable
Inputs
(Level 3) | | Total
Fair Value |
| | | | | | | | AFS debt securities: | | | | | | | | |
| U.S. Treasury securities | U.S. Treasury securities | | $ | 600,677 | | | $ | — | | | $ | — | | | $ | 600,677 | | U.S. Treasury securities | | $ | 711,706 | | | $ | — | | | $ | — | | | $ | 711,706 | |
| U.S. government agency and U.S. government-sponsored enterprise debt securities | U.S. government agency and U.S. government-sponsored enterprise debt securities | | — | | | 260,424 | | | — | | | 260,424 | | U.S. government agency and U.S. government-sponsored enterprise debt securities | | — | | | 460,084 | | | — | | | 460,084 | |
| U.S. government agency and U.S. government-sponsored enterprise mortgage-backed securities: | U.S. government agency and U.S. government-sponsored enterprise mortgage-backed securities: | | U.S. government agency and U.S. government-sponsored enterprise mortgage-backed securities: | |
| Commercial mortgage-backed securities | Commercial mortgage-backed securities | | — | | | 521,885 | | | — | | | 521,885 | | Commercial mortgage-backed securities | | — | | | 478,777 | | | — | | | 478,777 | |
| Residential mortgage-backed securities | Residential mortgage-backed securities | | — | | | 1,793,429 | | | — | | | 1,793,429 | | Residential mortgage-backed securities | | — | | | 1,721,237 | | | — | | | 1,721,237 | |
| Municipal securities | Municipal securities | | — | | | 249,502 | | | — | | | 249,502 | | Municipal securities | | — | | | 263,873 | | | — | | | 263,873 | |
| Non-agency mortgage-backed securities: | Non-agency mortgage-backed securities: | | Non-agency mortgage-backed securities: | |
| Commercial mortgage-backed securities | Commercial mortgage-backed securities | | — | | | 397,975 | | | — | | | 397,975 | | Commercial mortgage-backed securities | | — | | | 384,051 | | | — | | | 384,051 | |
| Residential mortgage-backed securities | Residential mortgage-backed securities | | — | | | 671,538 | | | — | | | 671,538 | | Residential mortgage-backed securities | | — | | | 608,574 | | | — | | | 608,574 | |
| Corporate debt securities | Corporate debt securities | | — | | | 529,565 | | | — | | | 529,565 | | Corporate debt securities | | — | | | 485,750 | | | — | | | 485,750 | |
| Foreign government bonds | Foreign government bonds | | — | | | 225,810 | | | — | | | 225,810 | | Foreign government bonds | | — | | | 224,766 | | | — | | | 224,766 | |
| Asset-backed securities | Asset-backed securities | | — | | | 64,870 | | | — | | | 64,870 | | Asset-backed securities | | — | | | 44,875 | | | — | | | 44,875 | |
| Collateralized loan obligations (“CLOs”) | Collateralized loan obligations (“CLOs”) | | — | | | 590,415 | | | — | | | 590,415 | | Collateralized loan obligations (“CLOs”) | | — | | | 603,565 | | | — | | | 603,565 | |
| Total AFS debt securities | Total AFS debt securities | | $ | 600,677 | | | $ | 5,305,413 | | | $ | — | | | $ | 5,906,090 | | Total AFS debt securities | | $ | 711,706 | | | $ | 5,275,552 | | | $ | — | | | $ | 5,987,258 | |
| | Investments in tax credit and other investments: | | |
| Investments in qualified affordable housing partnerships, tax credit and other investments, net: | | Investments in qualified affordable housing partnerships, tax credit and other investments, net: | |
| Equity securities | Equity securities | | $ | 19,637 | | | $ | 4,200 | | | $ | — | | | $ | 23,837 | | Equity securities | | $ | 19,991 | | | $ | 4,168 | | | $ | — | | | $ | 24,159 | |
| Total investments in tax credit and other investments | | $ | 19,637 | | | $ | 4,200 | | | $ | — | | | $ | 23,837 | | |
| Total investments in qualified affordable housing partnerships, tax credit and other investments, net | | Total investments in qualified affordable housing partnerships, tax credit and other investments, net | | $ | 19,991 | | | $ | 4,168 | | | $ | — | | | $ | 24,159 | |
| | Derivative assets: | Derivative assets: | | Derivative assets: | |
| Interest rate contracts | Interest rate contracts | | $ | — | | | $ | 430,038 | | | $ | — | | | $ | 430,038 | | Interest rate contracts | | $ | — | | | $ | 530,235 | | | $ | — | | | $ | 530,235 | |
| Foreign exchange contracts | Foreign exchange contracts | | — | | | 81,874 | | | — | | | 81,874 | | Foreign exchange contracts | | — | | | 95,582 | | | — | | | 95,582 | |
| | Equity contracts | Equity contracts | | — | | | 1 | | | 345 | | | 346 | | Equity contracts | | — | | | — | | | 263 | | | 263 | |
| Commodity contracts | Commodity contracts | | — | | | 369,146 | | | — | | | 369,146 | | Commodity contracts | | — | | | 139,081 | | | — | | | 139,081 | |
| Gross derivative assets | Gross derivative assets | | $ | — | | | $ | 881,059 | | | $ | 345 | | | $ | 881,404 | | Gross derivative assets | | $ | — | | | $ | 764,898 | | | $ | 263 | | | $ | 765,161 | |
Netting adjustments (1) | Netting adjustments (1) | | $ | — | | | $ | (605,957) | | | $ | — | | | $ | (605,957) | | Netting adjustments (1) | | $ | — | | | $ | (472,428) | | | $ | — | | | $ | (472,428) | |
| Net derivative assets | Net derivative assets | | $ | — | | | $ | 275,102 | | | $ | 345 | | | $ | 275,447 | | Net derivative assets | | $ | — | | | $ | 292,470 | | | $ | 263 | | | $ | 292,733 | |
| | Derivative liabilities: | Derivative liabilities: | | Derivative liabilities: | |
| Interest rate contracts | Interest rate contracts | | $ | — | | | $ | 615,327 | | | $ | — | | | $ | 615,327 | | Interest rate contracts | | $ | — | | | $ | 591,447 | | | $ | — | | | $ | 591,447 | |
| Foreign exchange contracts | Foreign exchange contracts | | — | | | 64,049 | | | — | | | 64,049 | | Foreign exchange contracts | | — | | | 72,342 | | | — | | | 72,342 | |
| Credit contracts | Credit contracts | | — | | | 27 | | | — | | | 27 | | Credit contracts | | — | | | 16 | | | — | | | 16 | |
| Commodity contracts | Commodity contracts | | — | | | 350,198 | | | — | | | 350,198 | | Commodity contracts | | — | | | 147,920 | | | — | | | 147,920 | |
| Gross derivative liabilities | Gross derivative liabilities | | $ | — | | | $ | 1,029,601 | | | $ | — | | | $ | 1,029,601 | | Gross derivative liabilities | | $ | — | | | $ | 811,725 | | | $ | — | | | $ | 811,725 | |
Netting adjustments (1) | Netting adjustments (1) | | $ | — | | | $ | (239,206) | | | $ | — | | | $ | (239,206) | | Netting adjustments (1) | | $ | — | | | $ | (208,183) | | | $ | — | | | $ | (208,183) | |
| Net derivative liabilities | Net derivative liabilities | | $ | — | | | $ | 790,395 | | | $ | — | | | $ | 790,395 | | Net derivative liabilities | | $ | — | | | $ | 603,542 | | | $ | — | | | $ | 603,542 | |
|
| | | ($ in thousands) | | Assets and Liabilities Measured at Fair Value on a Recurring Basis
as of December 31, 2021 | |
| | Assets and Liabilities Measured at Fair Value on a Recurring Basis
as of December 31, 2022 |
| ($ in thousands) | ($ in thousands) | | Quoted Prices in
Active Markets
for Identical
Assets
(Level 1) | | Significant
Other
Observable
Inputs
(Level 2) | | Significant
Unobservable
Inputs
(Level 3) | | Total
Fair Value | ($ in thousands) | | Quoted Prices in
Active Markets
for Identical
Assets
(Level 1) | | Significant
Other
Observable
Inputs
(Level 2) | | Significant
Unobservable
Inputs
(Level 3) | | Total
Fair Value |
| | | | | | | | AFS debt securities: | | | | | | | | |
| U.S. Treasury securities | U.S. Treasury securities | | $ | 1,032,681 | | | $ | — | | | $ | — | | | $ | 1,032,681 | | U.S. Treasury securities | | $ | 606,203 | | | $ | — | | | $ | — | | | $ | 606,203 | |
| U.S. government agency and U.S. government-sponsored enterprise debt securities | U.S. government agency and U.S. government-sponsored enterprise debt securities | | — | | | 1,301,971 | | | — | | | 1,301,971 | | U.S. government agency and U.S. government-sponsored enterprise debt securities | | — | | | 461,607 | | | — | | | 461,607 | |
| U.S. government agency and U.S. government-sponsored enterprise mortgage-backed securities: | U.S. government agency and U.S. government-sponsored enterprise mortgage-backed securities: | | U.S. government agency and U.S. government-sponsored enterprise mortgage-backed securities: | |
| Commercial mortgage-backed securities | Commercial mortgage-backed securities | | — | | | 1,228,980 | | | — | | | 1,228,980 | | Commercial mortgage-backed securities | | — | | | 500,269 | | | — | | | 500,269 | |
| Residential mortgage-backed securities | Residential mortgage-backed securities | | — | | | 2,928,283 | | | — | | | 2,928,283 | | Residential mortgage-backed securities | | — | | | 1,762,195 | | | — | | | 1,762,195 | |
| Municipal securities | Municipal securities | | — | | | 523,158 | | | — | | | 523,158 | | Municipal securities | | — | | | 257,099 | | | — | | | 257,099 | |
| Non-agency mortgage-backed securities: | Non-agency mortgage-backed securities: | | Non-agency mortgage-backed securities: | |
| Commercial mortgage-backed securities | Commercial mortgage-backed securities | | — | | | 496,443 | | | — | | | 496,443 | | Commercial mortgage-backed securities | | — | | | 398,329 | | | — | | | 398,329 | |
| Residential mortgage-backed securities | Residential mortgage-backed securities | | — | | | 881,931 | | | — | | | 881,931 | | Residential mortgage-backed securities | | — | | | 649,224 | | | — | | | 649,224 | |
| Corporate debt securities | Corporate debt securities | | — | | | 649,665 | | | — | | | 649,665 | | Corporate debt securities | | — | | | 526,274 | | | — | | | 526,274 | |
| Foreign government bonds | Foreign government bonds | | — | | | 257,733 | | | — | | | 257,733 | | Foreign government bonds | | — | | | 227,053 | | | — | | | 227,053 | |
| Asset-backed securities | Asset-backed securities | | — | | | 74,558 | | | — | | | 74,558 | | Asset-backed securities | | — | | | 49,076 | | | — | | | 49,076 | |
| CLOs | CLOs | | — | | | 589,950 | | | — | | | 589,950 | | CLOs | | — | | | 597,664 | | | — | | | 597,664 | |
| Total AFS debt securities | Total AFS debt securities | | $ | 1,032,681 | | | $ | 8,932,672 | | | $ | — | | | $ | 9,965,353 | | Total AFS debt securities | | $ | 606,203 | | | $ | 5,428,790 | | | $ | — | | | $ | 6,034,993 | |
| | Investments in tax credit and other investments: | | |
| Investments in qualified affordable housing partnerships, tax credit and other investments, net: | | Investments in qualified affordable housing partnerships, tax credit and other investments, net: | |
| Equity securities | Equity securities | | $ | 22,130 | | | $ | 4,474 | | | $ | — | | | $ | 26,604 | | Equity securities | | $ | 19,777 | | | $ | 4,177 | | | $ | — | | | $ | 23,954 | |
| Total investments in tax credit and other investments | | $ | 22,130 | | | $ | 4,474 | | | $ | — | | | $ | 26,604 | | |
| Total investments in qualified affordable housing partnerships, tax credit and other investments, net | | Total investments in qualified affordable housing partnerships, tax credit and other investments, net | | $ | 19,777 | | | $ | 4,177 | | | $ | — | | | $ | 23,954 | |
| | Derivative assets: | Derivative assets: | | Derivative assets: | |
| Interest rate contracts | Interest rate contracts | | $ | — | | | $ | 240,222 | | | $ | — | | | $ | 240,222 | | Interest rate contracts | | $ | — | | | $ | 440,283 | | | $ | — | | | $ | 440,283 | |
| Foreign exchange contracts | Foreign exchange contracts | | — | | | 21,033 | | | — | | | 21,033 | | Foreign exchange contracts | | — | | | 53,109 | | | — | | | 53,109 | |
| | Equity contracts | Equity contracts | | — | | | 5 | | | 215 | | | 220 | | Equity contracts | | — | | | — | | | 323 | | | 323 | |
| Commodity contracts | Commodity contracts | | — | | | 222,709 | | | — | | | 222,709 | | Commodity contracts | | — | | | 261,613 | | | — | | | 261,613 | |
| Gross derivative assets | Gross derivative assets | | $ | — | | | $ | 483,969 | | | $ | 215 | | | $ | 484,184 | | Gross derivative assets | | $ | — | | | $ | 755,005 | | | $ | 323 | | | $ | 755,328 | |
Netting adjustments (1) | Netting adjustments (1) | | $ | — | | | $ | (100,953) | | | $ | — | | | $ | (100,953) | | Netting adjustments (1) | | $ | — | | | $ | (614,783) | | | $ | — | | | $ | (614,783) | |
| Net derivative assets | Net derivative assets | | $ | — | | | $ | 383,016 | | | $ | 215 | | | $ | 383,231 | | Net derivative assets | | $ | — | | | $ | 140,222 | | | $ | 323 | | | $ | 140,545 | |
| | Derivative liabilities: | Derivative liabilities: | | Derivative liabilities: | |
| Interest rate contracts | Interest rate contracts | | $ | — | | | $ | 179,962 | | | $ | — | | | $ | 179,962 | | Interest rate contracts | | $ | — | | | $ | 584,516 | | | $ | — | | | $ | 584,516 | |
| Foreign exchange contracts | Foreign exchange contracts | | — | | | 15,501 | | | — | | | 15,501 | | Foreign exchange contracts | | — | | | 44,117 | | | — | | | 44,117 | |
| Credit contracts | Credit contracts | | — | | | 141 | | | — | | | 141 | | Credit contracts | | — | | | 23 | | | — | | | 23 | |
| Commodity contracts | Commodity contracts | | — | | | 194,567 | | | — | | | 194,567 | | Commodity contracts | | — | | | 258,608 | | | — | | | 258,608 | |
| Gross derivative liabilities | Gross derivative liabilities | | $ | — | | | $ | 390,171 | | | $ | — | | | $ | 390,171 | | Gross derivative liabilities | | $ | — | | | $ | 887,264 | | | $ | — | | | $ | 887,264 | |
Netting adjustments (1) | Netting adjustments (1) | | $ | — | | | $ | (232,727) | | | $ | — | | | $ | (232,727) | | Netting adjustments (1) | | $ | — | | | $ | (242,745) | | | $ | — | | | $ | (242,745) | |
| Net derivative liabilities | Net derivative liabilities | | $ | — | | | $ | 157,444 | | | $ | — | | | $ | 157,444 | | Net derivative liabilities | | $ | — | | | $ | 644,519 | | | $ | — | | | $ | 644,519 | |
|
(1)Represents balance sheet netting of derivative assets and liabilities and related cash collateral under master netting agreements or similar agreements. See Note 6 — Derivatives to the Consolidated Financial Statements in this Form 10-Q for additional information.
For the three and ninesix months ended SeptemberJune 30, 20222023 and 2021,2022, Level 3 fair value measurements that were measured on a recurring basis consisted of equity contracts issued by private companies. The following table provides a reconciliation of the beginning and ending balances of these equity contracts for the three and ninesix months ended SeptemberJune 30, 20222023 and 2021:2022:
| | | ($ in thousands) | | Three Months Ended September 30, | | Nine Months Ended September 30, | |
| | Three Months Ended June 30, | | Six Months Ended June 30, | |
| ($ in thousands) | ($ in thousands) | | 2022 | | 2021 | | 2022 | | 2021 | ($ in thousands) | | 2023 | | 2022 | | 2023 | | 2022 | |
| | | | | | | | Equity contracts | | | | | | | | | |
| Beginning balance | Beginning balance | | $ | 357 | | | $ | 223 | | | $ | 215 | | | $ | 273 | | Beginning balance | | $ | 277 | | | $ | 309 | | | $ | 323 | | | $ | 215 | | |
| Total (losses) gains included in earnings (1) | Total (losses) gains included in earnings (1) | | (12) | | | (9) | | | 39 | | | 37 | | Total (losses) gains included in earnings (1) | | (14) | | | 48 | | | (60) | | | 51 | | |
| | Issuances | Issuances | | — | | | 12 | | | 91 | | | 12 | | Issuances | | — | | | — | | | — | | | 91 | | |
| | Settlements | | — | | | — | | | — | | | (96) | | |
| Transfers out of Level 3 (2) | | — | | | (6) | | | — | | | (6) | | |
| | Ending balance | Ending balance | | $ | 345 | | | $ | 220 | | | $ | 345 | | | $ | 220 | | Ending balance | | $ | 263 | | | $ | 357 | | | $ | 263 | | | $ | 357 | | |
|
(1)Includes unrealized (losses) gains of $(12) thousand and $(9) thousand for the three months ended September 30, 2022 and 2021, respectively, and $39 thousand and $(38) thousand for the nine months ended September 30, 2022 and 2021, respectively. The realized/unrealized gains (losses) of equity contracts are recorded in Lending fees on the Consolidated Statement of Income.
(2)During the three and nine months ended September 30, 2021, the Company transferred $6 thousand of equity contracts measured on a recurring basis out of Level 3 into Level 2 after the corresponding issuer of the equity contracts, which was previously a private company completed its initial public offering and became a public company.
The following table presents quantitative information about the significant unobservable inputs used in the valuation of Level 3 fair value measurements as of SeptemberJune 30, 20222023 and December 31, 2021.2022. The significant unobservable inputs presented in the table below are those that the Company considers significant to the fair value of the Level 3 assets. The Company considers unobservable inputs to be significant if, by their exclusion, the fair value of the Level 3 assets would be impacted by a predetermined percentage change.
| | | ($ in thousands) | ($ in thousands) | | Fair Value
Measurements
(Level 3) | | Valuation
Technique | | Unobservable
Inputs | | Range of Inputs | | Weighted- Average of Inputs (1) | ($ in thousands) | | Fair Value Measurements (Level 3) | | Valuation Technique | | Unobservable Inputs | | Range of Inputs | | Weighted-Average of Inputs (1) |
| September 30, 2022 | | | | | | | | | | | |
| June 30, 2023 | | June 30, 2023 | | | | | | | | | | |
| Derivative assets: | Derivative assets: | | Derivative assets: | |
| Equity contracts | Equity contracts | | $ | 345 | | | Black-Scholes option pricing model | | Equity volatility | | 49% — 70% | | 59% | Equity contracts | | $ | 263 | | | Black-Scholes option pricing model | | Equity volatility | | 41% — 50% | | 44% |
| | Liquidity discount | | 47% | | 47% | | Liquidity discount | | 47% | | 47% |
| December 31, 2021 | | |
| December 31, 2022 | | December 31, 2022 | |
| Derivative assets: | Derivative assets: | | Derivative assets: | |
| Equity contracts | Equity contracts | | $ | 215 | | | Black-Scholes option pricing model | | Equity volatility | | 44% — 54% | | 49% | Equity contracts | | $ | 323 | | | Black-Scholes option pricing model | | Equity volatility | | 42% — 60% | | 54% |
| | Liquidity discount | | 47% | | 47% | | Liquidity discount | | 47% | | 47% |
|
(1)Weighted-average of inputs is calculated based on the fair value of equity contracts as of Septemberboth June 30, 20222023 and December 31, 2021.2022.
Assets and Liabilities Measured at Fair Value on a Nonrecurring Basis
Assets measured at fair value on a nonrecurring basis include certain individually evaluated loans held-for-investment, investments in qualified affordable housing partnerships, tax credit and other investments, OREO,other real estate owned (“OREO”), loans held-for-sale, and other nonperforming assets. Nonrecurring fair value adjustments result from the impairment on certain individually evaluated loans held-for-investment and investments in qualified affordable housing partnerships, tax credit and other investments, from write-downs of OREO and other nonperforming assets, or from the application of lower of cost or fair value on loans held-for-sale.
Individually Evaluated Loans Held-for-Investment — Individually evaluated loans held-for-investment are classified as Level 3 assets. The following two methods are used to derive the fair value of individually evaluated loans held-for-investment:
•Discounted cash flow valuation techniques that consist of developing an expected stream of cash flows over the life of the loans, and then calculating the present value of the loans by discounting the expected cash flows at a designated discount rate.
•When the repayment of an individually evaluated loan is dependent on the sale of the collateral, the fair value of the loan is determined based on the fair value of the underlying collateral, which may take the form of real estate, inventory, equipment, contracts or guarantees. The fair value of the underlying collateral is generally based on third-party appraisals, or an internal valuation if a third-party appraisal is not required by regulations, or is unavailable. An internal valuation utilizes one or more valuation techniques such as the income, market and/or cost approaches.
Investments in Qualified Affordable Housing Partnerships, Tax Credit and Other Investments, Net — The Company conducts due diligence on its investments in qualified affordable housing partnerships, tax credit and other investments prior to the initial investment date and through the placed-in-service date. After these investments are either acquired or placed into service, the Company continues its periodic monitoring process to ensure book values are realizable and that there is no significant tax credit recapture risk. This monitoring process includes reviewing the investment entity’s quarterly review of the financial statements theand annual review of tax returns, of the investment entity, the annual review of the financial statements of the guarantor (if any) and a comparison of the actual performance of the investment against the financial projections prepared at the time when the investment was made. The Company assesses its tax credit and other investments for possible other-than-temporary impairment (“OTTI”) on an annual basis or when events or circumstances suggest that the carrying amount of the investments may not be realizable. These circumstances can include, but are not limited to the following factors:
•expected future cash flows that are less than the carrying amount of the investment;
•changes in the economic, market or technological environment that could adversely affect the investee’s operations;
•the potential for tax credit recapture; and
•other factors that raise doubt about the investee’s ability to continue as a going concern, such as negative cash flows from operations and the continuing prospects of the underlying operations of the investment.
All available information is considered in assessing whether a decline in value is other-than-temporary. Generally, none of the aforementioned factors are individually conclusive and the relative importance placed on individual facts may vary depending on the situation. In accordance with ASC 323-10-35-32, Investments — Equity Method and Joint Ventures, an impairment charge would only be recognized in earnings for a decline in value that is determined to be other-than-temporary.
Other Real Estate Owned — The Company’s OREO represents properties acquired through foreclosure, or through full or partial satisfaction of loans held-for-investment. These OREO properties are recorded at estimated fair value less the costs to sell at the time of foreclosure andor at the lower of cost or estimated fair value less the costs to sell subsequent to acquisition. On a monthly basis, the current fair market value of each OREO property is reviewed to ensure that the current carrying value is appropriate. OREO properties are classified as Level 3.
Loans Held-for-Sale — Loans held-for-investment subsequently transferred to held-for-sale are recorded at the lower of cost or fair value upon transfer. Loans held-for-sale may be measured at fair value on a nonrecurring basis when fair value is less than cost. Fair value is generally determined based on available market data for similar loans and therefore, are classified as Level 2.
Other Nonperforming Assets — Other nonperforming assets are recorded at fair value upon transfer from loans to foreclosed assets. Subsequently, foreclosed assets are recorded at the lower of carrying value or fair value. Fair value is based on independent market prices, appraised values of the collateral or management’s estimated recovery of the foreclosed asset. The Company records an impairment when the foreclosed asset’s fair value declines below its carrying value. The fair value measurement of other nonperforming assets is classified within one of the three levels in a valuation hierarchy based upon the observability of inputs to the valuation as of the measurement date.
The following tables present the carrying amounts of assets that were still held and had fair value adjustments measured on a nonrecurring basis as of SeptemberJune 30, 20222023 and December 31, 2021:2022:
| | | ($ in thousands) | | Assets Measured at Fair Value on a Nonrecurring Basis
as of September 30, 2022 | |
| | Assets Measured at Fair Value on a Nonrecurring Basis
as of June 30, 2023 |
| ($ in thousands) | ($ in thousands) | | Quoted Prices in
Active Markets
for Identical
Assets
(Level 1) | | Significant
Other
Observable
Inputs
(Level 2) | | Significant
Unobservable
Inputs
(Level 3) | | Fair Value
Measurements | ($ in thousands) | | Quoted Prices in
Active Markets
for Identical
Assets
(Level 1) | | Significant
Other
Observable
Inputs
(Level 2) | | Significant
Unobservable
Inputs
(Level 3) | | Fair Value
Measurements |
| | | | | | | | Loans held-for-investment: | | | | | | | | |
| Commercial: | Commercial: | | Commercial: | |
| Commercial and industrial (“C&I”) | Commercial and industrial (“C&I”) | | $ | — | | | $ | — | | | $ | 57,696 | | | $ | 57,696 | | Commercial and industrial (“C&I”) | | $ | — | | | $ | — | | | $ | 31,323 | | | $ | 31,323 | |
| Commercial real estate (“CRE”): | Commercial real estate (“CRE”): | | Commercial real estate (“CRE”): | |
| CRE | CRE | | — | | | — | | | 30,359 | | | 30,359 | | CRE | | — | | | — | | | 4,398 | | | 4,398 | |
| Multifamily residential | | — | | | — | | | 1,008 | | | 1,008 | | |
| | | Total commercial | Total commercial | | — | | | — | | | 89,063 | | | 89,063 | | Total commercial | | — | | | — | | | 35,721 | | | 35,721 | |
| Consumer: | | | | | | | | | |
| Residential mortgage: | | |
| | Home equity lines of credit (“HELOCs”) | | — | | | — | | | 1,235 | | | 1,235 | | |
| | Total consumer | | — | | | — | | | 1,235 | | | 1,235 | | |
| Total loans held-for-investment | | $ | — | | | $ | — | | | $ | 90,298 | | | $ | 90,298 | | |
| | Total loans held-for-investment | | Total loans held-for-investment | | $ | — | | | $ | — | | | $ | 35,721 | | | $ | 35,721 | |
| | | Investments in qualified affordable housing partnerships, tax credit and other investments, net | | Investments in qualified affordable housing partnerships, tax credit and other investments, net | | $ | — | | | $ | — | | | $ | 868 | | | $ | 868 | |
| |
| | | ($ in thousands) | | Assets Measured at Fair Value on a Nonrecurring Basis
as of December 31, 2021 | |
| | Assets Measured at Fair Value on a Nonrecurring Basis
as of December 31, 2022 |
| ($ in thousands) | ($ in thousands) | | Quoted Prices in
Active Markets
for Identical
Assets
(Level 1) | | Significant
Other
Observable
Inputs
(Level 2) | | Significant
Unobservable
Inputs
(Level 3) | | Fair Value
Measurements | ($ in thousands) | | Quoted Prices in
Active Markets
for Identical
Assets
(Level 1) | | Significant
Other
Observable
Inputs
(Level 2) | | Significant
Unobservable
Inputs
(Level 3) | | Fair Value
Measurements |
| | | | | | | | Loans held-for-investment: | | | | | | | | |
| Commercial: | Commercial: | | Commercial: | |
| C&I | C&I | | $ | — | | | $ | — | | | $ | 102,349 | | | $ | 102,349 | | C&I | | $ | — | | | $ | — | | | $ | 40,011 | | | $ | 40,011 | |
| CRE: | CRE: | | CRE: | |
| CRE | CRE | | — | | | — | | | 21,891 | | | 21,891 | | CRE | | — | | | — | | | 31,380 | | | 31,380 | |
| | Total commercial | Total commercial | | — | | | — | | | 124,240 | | | 124,240 | | Total commercial | | — | | | — | | | 71,391 | | | 71,391 | |
| Consumer: | Consumer: | | | | | | | | | Consumer: | | | | | | | | |
| Residential mortgage: | Residential mortgage: | | Residential mortgage: | |
| | HELOCs | | — | | | — | | | 2,744 | | | 2,744 | | |
| Home equity lines of credit (“HELOCs”) | | Home equity lines of credit (“HELOCs”) | | — | | | — | | | 1,223 | | | 1,223 | |
| | Total consumer | Total consumer | | — | | | — | | | 2,744 | | | 2,744 | | Total consumer | | — | | | — | | | 1,223 | | | 1,223 | |
| Total loans held-for-investment | Total loans held-for-investment | | $ | — | | | $ | — | | | $ | 126,984 | | | $ | 126,984 | | Total loans held-for-investment | | $ | — | | | $ | — | | | $ | 72,614 | | | $ | 72,614 | |
| | Other nonperforming assets | | $ | 391 | | | $ | — | | | $ | — | | | $ | 391 | | |
| | |
The following table presents the increase (decrease) in the fair value of certain assets held at the end of the respective reporting periods, for which a nonrecurring fair value adjustment was recognized for the three and ninesix months ended SeptemberJune 30, 20222023 and 2021:2022:
| | | ($ in thousands) | | Three Months Ended September 30, | | Nine Months Ended September 30, | |
| | Three Months Ended June 30, | | Six Months Ended June 30, | |
| ($ in thousands) | ($ in thousands) | | 2022 | | 2021 | | 2022 | | 2021 | ($ in thousands) | | 2023 | | 2022 | | 2023 | | 2022 | |
| | | | | | | | Loans held-for-investment: | | | | | | | | | |
| Commercial: | Commercial: | | Commercial: | | |
| C&I | C&I | | $ | (15,265) | | | $ | (4,977) | | | $ | (30,011) | | | $ | (13,590) | | C&I | | $ | (10,419) | | | $ | (6,054) | | | $ | (11,674) | | | $ | (14,740) | | |
| CRE: | CRE: | | CRE: | | |
| CRE | CRE | | (118) | | | (106) | | | 2,212 | | | (7,186) | | CRE | | (2,252) | | | (533) | | | (2,252) | | | 2,330 | | |
| Multifamily residential | Multifamily residential | | (5,931) | | | 16 | | | (5,939) | | | — | | Multifamily residential | | — | | | (8) | | | — | | | (8) | | |
| | Total commercial | Total commercial | | (21,314) | | | (5,067) | | | (33,738) | | | (20,776) | | Total commercial | | (12,671) | | | (6,595) | | | (13,926) | | | (12,418) | | |
| Consumer: | Consumer: | | | | | | | | | Consumer: | | | | | | | | | |
| Residential mortgage: | Residential mortgage: | | Residential mortgage: | | |
| | HELOCs | HELOCs | | 81 | | | 3 | | | 166 | | | (6) | | HELOCs | | — | | | 82 | | | — | | | 85 | | |
| | Other consumer | | — | | | — | | | — | | | (2,491) | | |
| | Total consumer | Total consumer | | 81 | | | 3 | | | 166 | | | (2,497) | | Total consumer | | — | | | 82 | | | — | | | 85 | | |
| Total loans held-for-investment | Total loans held-for-investment | | $ | (21,233) | | | $ | (5,064) | | | $ | (33,572) | | | $ | (23,273) | | Total loans held-for-investment | | $ | (12,671) | | | $ | (6,513) | | | $ | (13,926) | | | $ | (12,333) | | |
| | Investments in tax credit and other investments, net | | $ | — | | | $ | — | | | $ | — | | | $ | 877 | | |
| Investments in qualified affordable housing partnerships, tax credit and other investments, net | | Investments in qualified affordable housing partnerships, tax credit and other investments, net | | $ | (961) | | | $ | — | | | $ | (787) | | | $ | — | | |
| | | Other nonperforming assets | Other nonperforming assets | | $ | — | | | $ | (43) | | | $ | (6,861) | | | $ | (3,933) | | Other nonperforming assets | | $ | — | | | $ | (6,861) | | | $ | — | | | $ | (6,861) | | |
|
The following table presents the quantitative information about the significant unobservable inputs used in the valuation of Level 3 fair value measurements that are measured on a nonrecurring basis as of SeptemberJune 30, 20222023 and December 31, 2021:2022:
| | | ($ in thousands) | ($ in thousands) | | Fair Value
Measurements
(Level 3) | | Valuation
Techniques | | Unobservable
Inputs | | Range of
Inputs | | Weighted- Average of Inputs (1) | ($ in thousands) | | Fair Value Measurements (Level 3) | | Valuation Techniques | | Unobservable Inputs | | Range of Inputs | | Weighted-Average of Inputs (1) |
| September 30, 2022 | | | | | | | | | | | |
| June 30, 2023 | | June 30, 2023 | | | | | | | | | | |
| Loans held-for-investment | Loans held-for-investment | | $ | 40,559 | | | Discounted cash flows | | Discount | | 4% — 6% | | 4% | Loans held-for-investment | | $ | 4,989 | | | Discounted cash flows | | Discount | | 15% | | 15% |
| | $ | 18,372 | | | Fair value of collateral | | Discount | | 40% — 94% | | 52% | | $ | 17,501 | | | Fair value of collateral | | Discount | | 15% — 81% | | 43% |
| | | $ | 6,134 | | | Fair value of collateral | | Contract value | | NM | | NM |
| | $ | 31,367 | | | Fair value of property | | Selling cost | | 8% | | 8% | | $ | 7,097 | | | Fair value of property | | Selling cost | | 8% | | 8% |
| | Investments in qualified affordable housing partnerships, tax credit and other investments, net | | Investments in qualified affordable housing partnerships, tax credit and other investments, net | | $ | 868 | | | Individual analysis of each investment | | Expected future tax benefits and distributions | | NM | | NM |
| | | December 31, 2021 | | |
| December 31, 2022 | | December 31, 2022 | |
| Loans held-for-investment | Loans held-for-investment | | $ | 64,919 | | | Discounted cash flows | | Discount | | 4% — 15% | | 7% | Loans held-for-investment | | $ | 23,322 | | | Discounted cash flows | | Discount | | 4% — 6% | | 4% |
| | | $ | 38,537 | | | Fair value of collateral | | Discount | | 15% — 75% | | 41% | | $ | 17,912 | | | Fair value of collateral | | Discount | | 15% — 75% | | 37% |
| | | $ | 23,528 | | | Fair value of property | | Selling cost | | 8% | | 8% | | $ | 31,380 | | | Fair value of property | | Selling cost | | 8% | | 8% |
| |
NM — Not meaningful.
(1)Weighted-average of inputs is based on the relative fair value of the respective assets as of SeptemberJune 30, 20222023 and December 31, 2021.2022.
Disclosures about the Fair Value of Financial Instruments
The following tables present the fair value estimates for financial instruments as of SeptemberJune 30, 20222023 and December 31, 2021,2022, excluding financial instruments recorded at fair value on a recurring basis as they are included in the tables presented elsewhere in this Note. The carrying amounts in the following tables are recorded on the Consolidated Balance Sheet under the indicated captions, except for accrued interest receivable, restricted equity securities, at cost, and mortgage servicing rights that are included in Other assets, and accrued interest payable which is included in Accrued expenses and other liabilities. These financial assets and liabilitiesinstruments are measured on an amortized cost basis on the Company’s Consolidated Balance Sheet.
| | | ($ in thousands) | | September 30, 2022 | |
| | June 30, 2023 |
| ($ in thousands) | ($ in thousands) | | Carrying
Amount | | Level 1 | | Level 2 | | Level 3 | | Estimated
Fair Value | ($ in thousands) | | Carrying Amount | | Level 1 | | Level 2 | | Level 3 | | Estimated Fair Value |
| | | | | | | | | | Financial assets: | | | | | | | | | | |
| Cash and cash equivalents | Cash and cash equivalents | | $ | 2,163,353 | | | $ | 2,163,353 | | | $ | — | | | $ | — | | | $ | 2,163,353 | | Cash and cash equivalents | | $ | 6,377,887 | | | $ | 6,377,887 | | | $ | — | | | $ | — | | | $ | 6,377,887 | |
| Interest-bearing deposits with banks | Interest-bearing deposits with banks | | $ | 630,543 | | | $ | — | | | $ | 630,543 | | | $ | — | | | $ | 630,543 | | Interest-bearing deposits with banks | | $ | 17,169 | | | $ | — | | | $ | 17,169 | | | $ | — | | | $ | 17,169 | |
| Resale agreements | Resale agreements | | $ | 892,986 | | | $ | — | | | $ | 790,239 | | | $ | — | | | $ | 790,239 | | Resale agreements | | $ | 635,000 | | | $ | — | | | $ | 541,441 | | | $ | — | | | $ | 541,441 | |
| HTM debt securities | HTM debt securities | | $ | 3,012,667 | | | $ | 466,085 | | | $ | 1,993,050 | | | $ | — | | | $ | 2,459,135 | | HTM debt securities | | $ | 2,975,933 | | | $ | 474,137 | | | $ | 1,966,347 | | | $ | — | | | $ | 2,440,484 | |
| Restricted equity securities, at cost | Restricted equity securities, at cost | | $ | 78,254 | | | $ | — | | | $ | 78,254 | | | $ | — | | | $ | 78,254 | | Restricted equity securities, at cost | | $ | 79,206 | | | $ | — | | | $ | 79,206 | | | $ | — | | | $ | 79,206 | |
| Loans held-for-sale | Loans held-for-sale | | $ | 14,500 | | | $ | — | | | $ | 14,500 | | | $ | — | | | $ | 14,500 | | Loans held-for-sale | | $ | 2,830 | | | $ | — | | | $ | 2,830 | | | $ | — | | | $ | 2,830 | |
| Loans held-for-investment, net | Loans held-for-investment, net | | $ | 46,859,738 | | | $ | — | | | $ | — | | | $ | 46,147,082 | | | $ | 46,147,082 | | Loans held-for-investment, net | | $ | 49,192,964 | | | $ | — | | | $ | — | | | $ | 48,197,217 | | | $ | 48,197,217 | |
| Mortgage servicing rights | Mortgage servicing rights | | $ | 6,523 | | | $ | — | | | $ | — | | | $ | 10,532 | | | $ | 10,532 | | Mortgage servicing rights | | $ | 5,537 | | | $ | — | | | $ | — | | | $ | 10,078 | | | $ | 10,078 | |
| Accrued interest receivable | Accrued interest receivable | | $ | 208,520 | | | $ | — | | | $ | 208,520 | | | $ | — | | | $ | 208,520 | | Accrued interest receivable | | $ | 288,526 | | | $ | — | | | $ | 288,526 | | | $ | — | | | $ | 288,526 | |
| Financial liabilities: | Financial liabilities: | | Financial liabilities: | |
| Demand, checking, savings and money market deposits | Demand, checking, savings and money market deposits | | $ | 43,498,799 | | | $ | — | | | $ | 43,498,799 | | | $ | — | | | $ | 43,498,799 | | Demand, checking, savings and money market deposits | | $ | 38,679,009 | | | $ | — | | | $ | 38,679,009 | | | $ | — | | | $ | 38,679,009 | |
| Time deposits | Time deposits | | $ | 10,358,563 | | | $ | — | | | $ | 10,256,100 | | | $ | — | | | $ | 10,256,100 | | Time deposits | | $ | 16,979,777 | | | $ | — | | | $ | 16,866,296 | | | $ | — | | | $ | 16,866,296 | |
| Short-term borrowings | | Short-term borrowings | | $ | 4,500,000 | | | $ | — | | | $ | 4,500,000 | | | $ | — | | | $ | 4,500,000 | |
| | Federal funds purchased | | $ | 200,000 | | | $ | — | | | $ | 200,000 | | | $ | — | | | $ | 200,000 | | |
| FHLB advances | | $ | 324,920 | | | $ | — | | | $ | 325,000 | | | $ | — | | | $ | 325,000 | | |
| Repurchase agreements | | $ | 611,785 | | | $ | — | | | $ | 617,513 | | | $ | — | | | $ | 617,513 | | |
| | Long-term debt | Long-term debt | | $ | 147,875 | | | $ | — | | | $ | 140,902 | | | $ | — | | | $ | 140,902 | | Long-term debt | | $ | 148,097 | | | $ | — | | | $ | 141,990 | | | $ | — | | | $ | 141,990 | |
| Accrued interest payable | Accrued interest payable | | $ | 23,934 | | | $ | — | | | $ | 23,934 | | | $ | — | | | $ | 23,934 | | Accrued interest payable | | $ | 107,457 | | | $ | — | | | $ | 107,457 | | | $ | — | | | $ | 107,457 | |
|
| | | ($ in thousands) | | December 31, 2021 | |
| | December 31, 2022 |
| ($ in thousands) | ($ in thousands) | | Carrying
Amount | | Level 1 | | Level 2 | | Level 3 | | Estimated
Fair Value | ($ in thousands) | | Carrying Amount | | Level 1 | | Level 2 | | Level 3 | | Estimated Fair Value |
| | | | | | | | | | Financial assets: | | | | | | | | | | |
| Cash and cash equivalents | Cash and cash equivalents | | $ | 3,912,935 | | | $ | 3,912,935 | | | $ | — | | | $ | — | | | $ | 3,912,935 | | Cash and cash equivalents | | $ | 3,481,784 | | | $ | 3,481,784 | | | $ | — | | | $ | — | | | $ | 3,481,784 | |
| Interest-bearing deposits with banks | Interest-bearing deposits with banks | | $ | 736,492 | | | $ | — | | | $ | 736,492 | | | $ | — | | | $ | 736,492 | | Interest-bearing deposits with banks | | $ | 139,021 | | | $ | — | | | $ | 139,021 | | | $ | — | | | $ | 139,021 | |
| Resale agreements | Resale agreements | | $ | 2,353,503 | | | $ | — | | | $ | 2,335,901 | | | $ | — | | | $ | 2,335,901 | | Resale agreements | | $ | 792,192 | | | $ | — | | | $ | 693,656 | | | $ | — | | | $ | 693,656 | |
| | HTM debt securities | | HTM debt securities | | $ | 3,001,868 | | | $ | 471,469 | | | $ | 1,983,702 | | | $ | — | | | $ | 2,455,171 | |
| Restricted equity securities, at cost | Restricted equity securities, at cost | | $ | 77,434 | | | $ | — | | | $ | 77,434 | | | $ | — | | | $ | 77,434 | | Restricted equity securities, at cost | | $ | 78,624 | | | $ | — | | | $ | 78,624 | | | $ | — | | | $ | 78,624 | |
| Loans held-for-sale | Loans held-for-sale | | $ | 635 | | | $ | — | | | $ | 635 | | | $ | — | | | $ | 635 | | Loans held-for-sale | | $ | 25,644 | | | $ | — | | | $ | 25,644 | | | $ | — | | | $ | 25,644 | |
| Loans held-for-investment, net | Loans held-for-investment, net | | $ | 41,152,202 | | | $ | — | | | $ | — | | | $ | 41,199,599 | | | $ | 41,199,599 | | Loans held-for-investment, net | | $ | 47,606,785 | | | $ | — | | | $ | — | | | $ | 46,670,690 | | | $ | 46,670,690 | |
| | Mortgage servicing rights | Mortgage servicing rights | | $ | 5,706 | | | $ | — | | | $ | — | | | $ | 9,104 | | | $ | 9,104 | | Mortgage servicing rights | | $ | 6,235 | | | $ | — | | | $ | — | | | $ | 10,917 | | | $ | 10,917 | |
| Accrued interest receivable | Accrued interest receivable | | $ | 159,833 | | | $ | — | | | $ | 159,833 | | | $ | — | | | $ | 159,833 | | Accrued interest receivable | | $ | 263,430 | | | $ | — | | | $ | 263,430 | | | $ | — | | | $ | 263,430 | |
| Financial liabilities: | Financial liabilities: | | Financial liabilities: | |
| | Demand, checking, savings and money market deposits | Demand, checking, savings and money market deposits | | $ | 45,388,550 | | | $ | — | | | $ | 45,388,550 | | | $ | — | | | $ | 45,388,550 | | Demand, checking, savings and money market deposits | | $ | 42,637,316 | | | $ | — | | | $ | 42,637,316 | | | $ | — | | | $ | 42,637,316 | |
| Time deposits | Time deposits | | $ | 7,961,982 | | | $ | — | | | $ | 7,966,116 | | | $ | — | | | $ | 7,966,116 | | Time deposits | | $ | 13,330,533 | | | $ | — | | | $ | 13,228,777 | | | $ | — | | | $ | 13,228,777 | |
| | FHLB advances | | $ | 249,331 | | | $ | — | | | $ | 250,372 | | | $ | — | | | $ | 250,372 | | |
| | Repurchase agreements | Repurchase agreements | | $ | 300,000 | | | $ | — | | | $ | 310,525 | | | $ | — | | | $ | 310,525 | | Repurchase agreements | | $ | 300,000 | | | $ | — | | | $ | 304,097 | | | $ | — | | | $ | 304,097 | |
| Long-term debt | Long-term debt | | $ | 147,658 | | | $ | — | | | $ | 151,020 | | | $ | — | | | $ | 151,020 | | Long-term debt | | $ | 147,950 | | | $ | — | | | $ | 143,483 | | | $ | — | | | $ | 143,483 | |
| Accrued interest payable | Accrued interest payable | | $ | 11,435 | | | $ | — | | | $ | 11,435 | | | $ | — | | | $ | 11,435 | | Accrued interest payable | | $ | 37,198 | | | $ | — | | | $ | 37,198 | | | $ | — | | | $ | 37,198 | |
|
Note 4 — Assets Purchased under Resale Agreements and Sold under Repurchase Agreements
Assets Purchased under Resale Agreements
With resale agreements, the Company is exposed to credit risk for both the counterparties and the underlying collateral. The Company manages credit exposure from certain transactions by entering into master netting agreements and collateral arrangements with the counterparties. The relevant agreements allow for thean efficient closeout of the transaction, liquidation and set-off of collateral against the net amount owed by the counterparty following a default. It is also the Company’s policy to take possession, where possible, of the assets underlying resale agreements. As a result of the Company’s credit risk mitigation practices with respect to resale agreements as described above, the Company did not hold any reserves for credit impairment with respect to these agreements as of both SeptemberJune 30, 20222023 and December 31, 2021.2022.
Securities Purchased under Resale Agreements — Total securities purchased under resale agreements were $885.0$635.0 million as of SeptemberJune 30, 2022,2023, and $1.33 billion$760.0 million as of December 31, 2021.2022. The weighted-average yields were 2.41%2.42% and 1.50%1.96% for the three months ended SeptemberJune 30, 20222023 and 2021,2022, respectively; and 1.96%2.46% and 1.53%1.79% for the ninesix months ended SeptemberJune 30, 20222023 and 2021,2022, respectively.
Loans Purchased under Resale Agreements — Total loansLoans purchased under resale agreements were $8.032.2 million as of September 30, 2022, and $1.02 billion as of December 31, 2021.2022. During the first six months of 2023, all the loans purchased under resale agreements matured and the Company had no loans purchased under resale agreements as of June 30, 2023. The weighted-average yields were 3.87%7.75% and 1.48%2.47% for the three months ended SeptemberJune 30, 20222023 and 2021,2022, respectively; and 2.10%7.27% and 1.57%1.91% for the ninesix months ended SeptemberJune 30, 20222023 and 2021,2022, respectively.
Assets Sold under Repurchase Agreements —As of September 30, 2022, securities sold under repurchase agreements consisted of U.S. government agency and U.S. government-sponsored enterprise mortgage-backed securities, and U.S. Treasury securities. Gross repurchase agreements were $611.8 million as of September 30, 2022, and $300.0 million as of December 31, 2021.2022. The Company recorded $3.9 million of charges related to the extinguishment of $300.0 million of repurchase agreements during the first quarter of 2023. In comparison, no extinguishment charges were recorded for the three and six months ended June 30, 2022. The weighted-average interest rates were 2.81%5.43% and 2.57%2.70% for the three months ended SeptemberJune 30, 20222023 and 2021,2022, respectively; and 2.73%4.18% and 2.62%2.66% for the ninesix months ended SeptemberJune 30, 2023 and 2022, and 2021, respectively. AsThese weighted-average interest rates also reflect the impact of September 30, 2022, $311.8 million and $300.0 million of the securities sold undershort-term repurchase agreements will mature in 2022entered and 2023, respectively.repaid during the periods presented.
Balance Sheet Offsetting
The Company’s resale and repurchase agreements are transacted under legally enforceable master repurchase agreements that, in the event of default by the counterparty, provide the Company the right to liquidate securities held and to offset receivables and payables with the same counterparty. The Company nets resale and repurchase transactions with the same counterparty on the Consolidated Balance Sheet when it has a legally enforceable master netting agreement and the transactions are eligible for netting under ASC 210-20-45-11, Balance Sheet Offsetting Repurchase and Reverse Repurchase Agreements. Collateral received includes securities and loans that are not recognized on the Consolidated Balance Sheet. Collateral pledged consists of securities that are not netted on the Consolidated Balance Sheet against the related collateralized liability. Securities received or pledged as collateral in resale and repurchase agreements with other financial institutions may also be sold or re-pledged by the secured party, and are usually delivered to and held by the third-party trustees.
The following tables present the resale and repurchase agreements included on the Consolidated Balance Sheet as of SeptemberJune 30, 20222023 and December 31, 2021:2022:
| | | ($ in thousands) | ($ in thousands) | | September 30, 2022 | ($ in thousands) | | June 30, 2023 |
| | Assets | | Gross
Amounts
of Recognized
Assets | | Gross Amounts
Offset on the
Consolidated
Balance Sheet | | Net Amounts of
Assets Presented
on the Consolidated
Balance Sheet | | Gross Amounts Not Offset on the
Consolidated Balance Sheet | | Net
Amount | |
| | | | Gross
Amounts
of Recognized
Assets | | Gross Amounts
Offset on the
Consolidated
Balance Sheet | | Net Amounts of
Assets Presented
on the Consolidated
Balance Sheet | | Gross Amounts Not Offset on the
Consolidated Balance Sheet | | Net
Amount |
| | Assets | Assets | | Gross
Amounts
of Recognized
Assets | | Gross Amounts
Offset on the
Consolidated
Balance Sheet | | Net Amounts of
Assets Presented
on the Consolidated
Balance Sheet | | Collateral Received | | Net
Amount | Assets | | Collateral Received | |
| $ | (810,574) | | (1) | Resale agreements | | $ | 635,000 | | | $ | — | | | $ | 635,000 | | | $ | (550,872) | | (1) | $ | 84,128 | |
| | Liabilities | | Gross
Amounts
of Recognized
Liabilities | | Gross Amounts
Offset on the
Consolidated
Balance Sheet | | Net Amounts of
Liabilities Presented
on the Consolidated
Balance Sheet | | Gross Amounts Not Offset on the
Consolidated Balance Sheet | | Net
Amount | |
| | | Gross
Amounts
of Recognized
Liabilities | | Gross Amounts
Offset on the
Consolidated
Balance Sheet | | Net Amounts of
Liabilities Presented
on the Consolidated
Balance Sheet | | Gross Amounts Not Offset on the
Consolidated Balance Sheet | | Net
Amount |
| | Liabilities | Liabilities | | Gross
Amounts
of Recognized
Liabilities | | Gross Amounts
Offset on the
Consolidated
Balance Sheet | | Net Amounts of
Liabilities Presented
on the Consolidated
Balance Sheet | | Collateral Pledged | | Net
Amount | Liabilities | | Collateral Pledged | |
| $ | (606,766) | | (2) | Repurchase agreements | | $ | — | | | $ | — | | | $ | — | | | $ | — | | | $ | — | |
|
| | | ($ in thousands) | ($ in thousands) | | December 31, 2021 | ($ in thousands) | | December 31, 2022 |
| | | | Gross
Amounts
of Recognized
Assets | | Gross Amounts
Offset on the
Consolidated
Balance Sheet | | Net Amounts of
Assets Presented
on the Consolidated
Balance Sheet | | Gross Amounts Not Offset on the
Consolidated Balance Sheet | | | | Gross
Amounts
of Recognized
Assets | | Gross Amounts
Offset on the
Consolidated
Balance Sheet | | Net Amounts of
Assets Presented
on the Consolidated
Balance Sheet | | Gross Amounts Not Offset on the
Consolidated Balance Sheet | |
| Assets | Assets | | Net
Amount | Assets | | Net
Amount |
| Gross
Amounts
of Recognized
Assets | Gross Amounts
Offset on the
Consolidated
Balance Sheet | Net Amounts of
Assets Presented
on the Consolidated
Balance Sheet | Collateral Received | | | Gross
Amounts
of Recognized
Assets | Gross Amounts
Offset on the
Consolidated
Balance Sheet | Net Amounts of
Assets Presented
on the Consolidated
Balance Sheet | Collateral Received | |
| Resale agreements | Resale agreements | | $ | 2,353,503 | | $ | — | | $ | 2,353,503 | | $ | (2,327,687) | | (1) | $ | 25,816 | | Resale agreements | | $ | 792,192 | | $ | — | | $ | 792,192 | | $ | (701,790) | | (1) | $ | 90,402 | |
| | Liabilities | Liabilities | | Gross
Amounts
of Recognized
Liabilities | | Gross Amounts
Offset on the
Consolidated
Balance Sheet | | Net Amounts of
Liabilities Presented
on the Consolidated
Balance Sheet | | Gross Amounts Not Offset on the
Consolidated Balance Sheet | | Liabilities | | Gross
Amounts
of Recognized
Liabilities | | Gross Amounts
Offset on the
Consolidated
Balance Sheet | | Net Amounts of
Liabilities Presented
on the Consolidated
Balance Sheet | | Gross Amounts Not Offset on the
Consolidated Balance Sheet | |
| Net
Amount | | Net
Amount |
| Collateral Pledged | | | Collateral Pledged | |
| Repurchase agreements | Repurchase agreements | | $ | 300,000 | | | $ | — | | | $ | 300,000 | | | $ | (300,000) | | (2) | $ | — | | Repurchase agreements | | $ | 300,000 | | | $ | — | | | $ | 300,000 | | | $ | (300,000) | | (2) | $ | — | |
|
(1)Represents the fair value of assets the Company has received under resale agreements, limited for table presentation purposes to the amount of the recognized asset due from each counterparty. The application of collateral cannot reduce the net position below zero. Therefore, excess collateral, if any, is not reflected above.
(2)Represents the fair value of assets the Company has pledged under repurchase agreements, limited for table presentation purposes to the amount of the recognized liability due to each counterparty. The application of collateral cannot reduce the net position below zero. Therefore, excess collateral, if any, is not reflected above.
In addition to the amounts included in the tables above, the Company also has balance sheet netting related to derivatives. Refer to Note 6 — Derivatives to the Consolidated Financial Statements in this Form 10-Q for additional information.
Note 5 — Securities
The following tables present the amortized cost, gross unrealized gains and losses and fair value by major categories of AFS and HTM debt securities as of SeptemberJune 30, 20222023 and December 31, 2021:2022:
| | | ($ in thousands) | | September 30, 2022 | |
| | June 30, 2023 |
| ($ in thousands) | ($ in thousands) | | Amortized
Cost | | | Gross
Unrealized
Gains | | Gross
Unrealized
Losses | | Fair
Value | ($ in thousands) | | Amortized Cost | | | Gross Unrealized Gains | | Gross Unrealized Losses | | Fair Value |
| | | | | | | | | AFS debt securities: | | | | | | | | | |
| U.S. Treasury securities | U.S. Treasury securities | | $ | 676,312 | | | | $ | — | | | $ | (75,635) | | | $ | 600,677 | | U.S. Treasury securities | | $ | 779,973 | | | | $ | 15 | | | $ | (68,282) | | | $ | 711,706 | |
| U.S. government agency and U.S. government-sponsored enterprise debt securities | U.S. government agency and U.S. government-sponsored enterprise debt securities | | 319,070 | | | | — | | | (58,646) | | | 260,424 | | U.S. government agency and U.S. government-sponsored enterprise debt securities | | 514,594 | | | | — | | | (54,510) | | | 460,084 | |
| U.S. government agency and U.S. government-sponsored enterprise mortgage-backed securities: | U.S. government agency and U.S. government-sponsored enterprise mortgage-backed securities: | | | | U.S. government agency and U.S. government-sponsored enterprise mortgage-backed securities: | | | |
| Commercial mortgage-backed securities | Commercial mortgage-backed securities | | 595,342 | | | | — | | | (73,457) | | | 521,885 | | Commercial mortgage-backed securities | | 552,859 | | | | — | | | (74,082) | | | 478,777 | |
| Residential mortgage-backed securities | Residential mortgage-backed securities | | 2,043,791 | | | | 58 | | | (250,420) | | | 1,793,429 | | Residential mortgage-backed securities | | 1,966,906 | | | | 15 | | | (245,684) | | | 1,721,237 | |
| Municipal securities | Municipal securities | | 307,084 | | | | — | | | (57,582) | | | 249,502 | | Municipal securities | | 304,204 | | | | 28 | | | (40,359) | | | 263,873 | |
| Non-agency mortgage-backed securities: | Non-agency mortgage-backed securities: | | | | Non-agency mortgage-backed securities: | | | |
| Commercial mortgage-backed securities | Commercial mortgage-backed securities | | 448,790 | | | | 173 | | | (50,988) | | | 397,975 | | Commercial mortgage-backed securities | | 432,782 | | | | 2 | | | (48,733) | | | 384,051 | |
| Residential mortgage-backed securities | Residential mortgage-backed securities | | 784,700 | | | | — | | | (113,162) | | | 671,538 | | Residential mortgage-backed securities | | 715,775 | | | | — | | | (107,201) | | | 608,574 | |
| Corporate debt securities | Corporate debt securities | | 673,502 | | | | — | | | (143,937) | | | 529,565 | | Corporate debt securities | | 653,502 | | | | — | | | (167,752) | | | 485,750 | |
| Foreign government bonds | Foreign government bonds | | 238,720 | | | | 528 | | | (13,438) | | | 225,810 | | Foreign government bonds | | 236,392 | | | | 152 | | | (11,778) | | | 224,766 | |
| Asset-backed securities | Asset-backed securities | | 66,793 | | | | — | | | (1,923) | | | 64,870 | | Asset-backed securities | | 46,332 | | | | — | | | (1,457) | | | 44,875 | |
| CLOs | CLOs | | 617,250 | | | | — | | | (26,835) | | | 590,415 | | CLOs | | 617,250 | | | | — | | | (13,685) | | | 603,565 | |
| Total AFS debt securities | Total AFS debt securities | | 6,771,354 | | | | 759 | | | (866,023) | | | 5,906,090 | | Total AFS debt securities | | 6,820,569 | | | | 212 | | | (833,523) | | | 5,987,258 | |
| HTM debt securities: | HTM debt securities: | | | | | | | | | | HTM debt securities: | | | | | | | | | |
| U.S. Treasury securities | U.S. Treasury securities | | 522,713 | | | | — | | | (56,628) | | | 466,085 | | U.S. Treasury securities | | 526,794 | | | | — | | | (52,657) | | | 474,137 | |
| U.S. government agency and U.S. government-sponsored enterprise debt securities | U.S. government agency and U.S. government-sponsored enterprise debt securities | | 998,233 | | | | — | | | (215,616) | | | 782,617 | | U.S. government agency and U.S. government-sponsored enterprise debt securities | | 1,000,415 | | | | — | | | (202,544) | | | 797,871 | |
| U.S. government agency and U.S. government-sponsored enterprise mortgage-backed securities: | U.S. government agency and U.S. government-sponsored enterprise mortgage-backed securities: | | | | U.S. government agency and U.S. government-sponsored enterprise mortgage-backed securities: | | | |
| Commercial mortgage-backed securities | Commercial mortgage-backed securities | | 509,139 | | | | — | | | (92,507) | | | 416,632 | | Commercial mortgage-backed securities | | 496,852 | | | | — | | | (93,114) | | | 403,738 | |
| Residential mortgage-backed securities | Residential mortgage-backed securities | | 792,685 | | | | — | | | (142,978) | | | 649,707 | | Residential mortgage-backed securities | | 762,573 | | | | — | | | (147,285) | | | 615,288 | |
| Municipal securities | Municipal securities | | 189,897 | | | | — | | | (45,803) | | | 144,094 | | Municipal securities | | 189,299 | | | | — | | | (39,849) | | | 149,450 | |
| Total HTM debt securities | Total HTM debt securities | | 3,012,667 | | | | — | | | (553,532) | | | 2,459,135 | | Total HTM debt securities | | 2,975,933 | | | | — | | | (535,449) | | | 2,440,484 | |
| Total debt securities | Total debt securities | | $ | 9,784,021 | | | | $ | 759 | | | $ | (1,419,555) | | | $ | 8,365,225 | | Total debt securities | | $ | 9,796,502 | | | | $ | 212 | | | $ | (1,368,972) | | | $ | 8,427,742 | |
|
| | | | | | | | | | | | | | | | | | | | | | | | | | | | |
|
| ($ in thousands) | | December 31, 2021 |
| Amortized
Cost | | | | Gross
Unrealized
Gains | | Gross
Unrealized
Losses | | Fair
Value |
| AFS debt securities: | | | | | | | | | | |
| U.S. Treasury securities | | $ | 1,049,238 | | | | | $ | 130 | | | $ | (16,687) | | | $ | 1,032,681 | |
| U.S. government agency and U.S. government-sponsored enterprise debt securities | | 1,333,984 | | | | | 2,697 | | | (34,710) | | | 1,301,971 | |
| U.S. government agency and U.S. government-sponsored enterprise mortgage-backed securities: | | | | | | | | | | |
| Commercial mortgage-backed securities | | 1,242,043 | | | | | 15,791 | | | (28,854) | | | 1,228,980 | |
| Residential mortgage-backed securities | | 2,968,789 | | | | | 8,629 | | | (49,135) | | | 2,928,283 | |
| Municipal securities | | 519,381 | | | | | 10,065 | | | (6,288) | | | 523,158 | |
| Non-agency mortgage-backed securities: | | | | | | | | | | |
| Commercial mortgage-backed securities | | 498,920 | | | | | 3,000 | | | (5,477) | | | 496,443 | |
| Residential mortgage-backed securities | | 889,937 | | | | | 971 | | | (8,977) | | | 881,931 | |
| Corporate debt securities | | 657,516 | | | | | 8,738 | | | (16,589) | | | 649,665 | |
| Foreign government bonds | | 260,447 | | | | | 767 | | | (3,481) | | | 257,733 | |
| Asset-backed securities | | 74,674 | | | | | 185 | | | (301) | | | 74,558 | |
| CLOs | | 592,250 | | | | | 52 | | | (2,352) | | | 589,950 | |
| Total AFS debt securities | | $ | 10,087,179 | | | | | $ | 51,025 | | | $ | (172,851) | | | $ | 9,965,353 | |
|
During the first quarter of 2022, the Company transferred $3.01 billion in fair value of debt securities from AFS to HTM. At the time of the transfer, $113.0 million of unrealized losses, net of tax, was retained in AOCI. | | | | | | | | | | | | | | | | | | | | | | | | | | | | |
|
| | December 31, 2022 |
| ($ in thousands) | | Amortized Cost | | | | Gross Unrealized Gains | | Gross Unrealized Losses | | Fair Value |
| AFS debt securities: | | | | | | | | | | |
| U.S. Treasury securities | | $ | 676,306 | | | | | $ | — | | | $ | (70,103) | | | $ | 606,203 | |
| U.S. government agency and U.S. government-sponsored enterprise debt securities | | 517,806 | | | | | 67 | | | (56,266) | | | 461,607 | |
| U.S. government agency and U.S. government-sponsored enterprise mortgage-backed securities: | | | | | | | | | | |
| Commercial mortgage-backed securities | | 577,392 | | | | | — | | | (77,123) | | | 500,269 | |
| Residential mortgage-backed securities | | 2,011,054 | | | | | 41 | | | (248,900) | | | 1,762,195 | |
| Municipal securities | | 303,884 | | | | | 3 | | | (46,788) | | | 257,099 | |
| Non-agency mortgage-backed securities: | | | | | | | | | | |
| Commercial mortgage-backed securities | | 447,512 | | | | | 213 | | | (49,396) | | | 398,329 | |
| Residential mortgage-backed securities | | 762,202 | | | | | — | | | (112,978) | | | 649,224 | |
| Corporate debt securities | | 673,502 | | | | | — | | | (147,228) | | | 526,274 | |
| Foreign government bonds | | 241,165 | | | | | 174 | | | (14,286) | | | 227,053 | |
| Asset-backed securities | | 51,152 | | | | | — | | | (2,076) | | | 49,076 | |
| CLOs | | 617,250 | | | | | — | | | (19,586) | | | 597,664 | |
| Total AFS debt securities | | 6,879,225 | | | | | 498 | | | (844,730) | | | 6,034,993 | |
| HTM debt securities: | | | | | | | | | | |
| U.S. Treasury securities | | 524,081 | | | | | — | | | (52,612) | | | 471,469 | |
| U.S. government agency and U.S. government-sponsored enterprise debt securities | | 998,972 | | | | | — | | | (209,560) | | | 789,412 | |
| U.S. government agency and U.S. government-sponsored enterprise mortgage-backed securities: | | | | | | | | | | |
| Commercial mortgage-backed securities | | 506,965 | | | | | — | | | (98,566) | | | 408,399 | |
| Residential mortgage-backed securities | | 782,141 | | | | | — | | | (148,230) | | | 633,911 | |
| Municipal securities | | 189,709 | | | | | — | | | (37,729) | | | 151,980 | |
| Total HTM debt securities | | 3,001,868 | | | | | — | | | (546,697) | | | 2,455,171 | |
| Total debt securities | | $ | 9,881,093 | | | | | $ | 498 | | | $ | (1,391,427) | | | $ | 8,490,164 | |
| | | | | | | | | | |
| | | | | | | | | | |
As of SeptemberJune 30, 20222023 and December 31, 2021,2022, the amortized cost of debt securities excluded accrued interest receivables of $33.8$41.0 million and $33.1$41.8 million, respectively, which are included in Other assets on the Consolidated Balance Sheet. For the Company’s accounting policy related to debt securities’ accrued interest receivable, see Note 1 — Summary of Significant Accounting Policies — Significant Accounting Policies — Allowance for Credit Losses on Available-for-Sale Debt Securitiesand Allowance for Credit Losses on Held-to-Maturity Debt Securities to the Consolidated Financial Statements in the Company’s 20212022 Form 10-K and Note 2 — Current Accounting Developments and Summary of Significant Accounting Policies to the Consolidated Financial Statements in this Form 10-Q.10-K.
Unrealized Losses of Available-for-Sale Debt Securities
The following tables present the fair value and the associated gross unrealized losses of the Company’s AFS debt securities, aggregated by investment category and the length of time that the securities have been in a continuous unrealized loss position as of SeptemberJune 30, 20222023 and December 31, 2021.2022.
| | | ($ in thousands) | | September 30, 2022 | |
| Less Than 12 Months | | 12 Months or More | | Total | |
| | June 30, 2023 |
| | | Less Than 12 Months | | 12 Months or More | | Total |
| ($ in thousands) | ($ in thousands) | | Fair
Value | | Gross
Unrealized
Losses | | Fair
Value | | Gross
Unrealized
Losses | | Fair
Value | | Gross
Unrealized
Losses | ($ in thousands) | | Fair Value | | Gross Unrealized Losses | | Fair Value | | Gross Unrealized Losses | | Fair Value | | Gross Unrealized Losses |
| | | | | | | | | | | | AFS debt securities: | | | | | | | | | | | | |
| $ | 263,772 | | | $ | (25,232) | | | $ | 336,905 | | | $ | (50,403) | | | $ | 600,677 | | | $ | (75,635) | | U.S. Treasury securities | | $ | — | | | $ | — | | | $ | 608,012 | | | $ | (68,282) | | | $ | 608,012 | | | $ | (68,282) | |
| U.S. government agency and U.S. government sponsored enterprise debt securities | U.S. government agency and U.S. government sponsored enterprise debt securities | | 88,168 | | | (16,401) | | | 172,256 | | | (42,245) | | | 260,424 | | | (58,646) | | U.S. government agency and U.S. government sponsored enterprise debt securities | | 206,807 | | | (1,696) | | | 253,277 | | | (52,814) | | | 460,084 | | | (54,510) | |
| U.S. government agency and U.S. government-sponsored enterprise mortgage-backed securities: | U.S. government agency and U.S. government-sponsored enterprise mortgage-backed securities: | | U.S. government agency and U.S. government-sponsored enterprise mortgage-backed securities: | |
| Commercial mortgage-backed securities | Commercial mortgage-backed securities | | 334,460 | | | (39,330) | | | 187,425 | | | (34,127) | | | 521,885 | | | (73,457) | | Commercial mortgage-backed securities | | 20,690 | | | (1,580) | | | 458,087 | | | (72,502) | | | 478,777 | | | (74,082) | |
| Residential mortgage-backed securities | Residential mortgage-backed securities | | 700,318 | | | (72,088) | | | 1,085,253 | | | (178,332) | | | 1,785,571 | | | (250,420) | | Residential mortgage-backed securities | | 26,838 | | | (1,074) | | | 1,692,202 | | | (244,610) | | | 1,719,040 | | | (245,684) | |
| Municipal securities | Municipal securities | | 203,157 | | | (46,271) | | | 46,345 | | | (11,311) | | | 249,502 | | | (57,582) | | Municipal securities | | 7,651 | | | (111) | | | 254,201 | | | (40,248) | | | 261,852 | | | (40,359) | |
| Non-agency mortgage-backed securities: | Non-agency mortgage-backed securities: | | Non-agency mortgage-backed securities: | |
| Commercial mortgage-backed securities | Commercial mortgage-backed securities | | 170,101 | | | (8,351) | | | 218,124 | | | (42,637) | | | 388,225 | | | (50,988) | | Commercial mortgage-backed securities | | — | | | — | | | 381,043 | | | (48,733) | | | 381,043 | | | (48,733) | |
| Residential mortgage-backed securities | Residential mortgage-backed securities | | 188,584 | | | (23,168) | | | 482,954 | | | (89,994) | | | 671,538 | | | (113,162) | | Residential mortgage-backed securities | | — | | | — | | | 608,574 | | | (107,201) | | | 608,574 | | | (107,201) | |
| Corporate debt securities | Corporate debt securities | | 247,533 | | | (24,969) | | | 282,032 | | | (118,968) | | | 529,565 | | | (143,937) | | Corporate debt securities | | 29,702 | | | (4,299) | | | 456,048 | | | (163,453) | | | 485,750 | | | (167,752) | |
| Foreign government bonds | Foreign government bonds | | 68,733 | | | (336) | | | 36,899 | | | (13,102) | | | 105,632 | | | (13,438) | | Foreign government bonds | | 68,206 | | | (516) | | | 38,738 | | | (11,262) | | | 106,944 | | | (11,778) | |
| Asset-backed securities | Asset-backed securities | | 54,811 | | | (1,579) | | | 10,059 | | | (344) | | | 64,870 | | | (1,923) | | Asset-backed securities | | — | | | — | | | 44,875 | | | (1,457) | | | 44,875 | | | (1,457) | |
| CLOs | CLOs | | 190,370 | | | (8,730) | | | 400,045 | | | (18,105) | | | 590,415 | | | (26,835) | | CLOs | | — | | | — | | | 603,565 | | | (13,685) | | | 603,565 | | | (13,685) | |
| Total AFS debt securities | Total AFS debt securities | | $ | 2,510,007 | | | $ | (266,455) | | | $ | 3,258,297 | | | $ | (599,568) | | | $ | 5,768,304 | | | $ | (866,023) | | Total AFS debt securities | | $ | 359,894 | | | $ | (9,276) | | | $ | 5,398,622 | | | $ | (824,247) | | | $ | 5,758,516 | | | $ | (833,523) | |
|
| | | ($ in thousands) | | December 31, 2021 | |
| Less Than 12 Months | | 12 Months or More | | Total | |
| | December 31, 2022 |
| | | Less Than 12 Months | | 12 Months or More | | Total |
| ($ in thousands) | ($ in thousands) | | Fair
Value | | Gross
Unrealized
Losses | | Fair
Value | | Gross
Unrealized
Losses | | Fair
Value | | Gross
Unrealized
Losses | ($ in thousands) | | Fair Value | | Gross Unrealized Losses | | Fair Value | | Gross Unrealized Losses | | Fair Value | | Gross Unrealized Losses |
| | | | | | | | | | | | AFS debt securities: | | | | | | | | | | | | |
| $ | 935,776 | | | $ | (14,689) | | | $ | 47,881 | | | $ | (1,998) | | | $ | 983,657 | | | $ | (16,687) | | U.S. Treasury securities | | $ | 131,843 | | | $ | (8,761) | | | $ | 474,360 | | | $ | (61,342) | | | $ | 606,203 | | | $ | (70,103) | |
| U.S. government agency and U.S. government-sponsored enterprise debt securities | U.S. government agency and U.S. government-sponsored enterprise debt securities | | 773,647 | | | (18,000) | | | 402,907 | | | (16,710) | | | 1,176,554 | | | (34,710) | | U.S. government agency and U.S. government-sponsored enterprise debt securities | | 97,403 | | | (6,902) | | | 214,136 | | | (49,364) | | | 311,539 | | | (56,266) | |
| U.S. government agency and U.S. government-sponsored enterprise mortgage-backed securities: | U.S. government agency and U.S. government-sponsored enterprise mortgage-backed securities: | | U.S. government agency and U.S. government-sponsored enterprise mortgage-backed securities: | |
| Commercial mortgage-backed securities | Commercial mortgage-backed securities | | 440,734 | | | (13,589) | | | 257,745 | | | (15,265) | | | 698,479 | | | (28,854) | | Commercial mortgage-backed securities | | 252,144 | | | (30,029) | | | 248,125 | | | (47,094) | | | 500,269 | | | (77,123) | |
| Residential mortgage-backed securities | Residential mortgage-backed securities | | 2,138,542 | | | (37,691) | | | 330,522 | | | (11,444) | | | 2,469,064 | | | (49,135) | | Residential mortgage-backed securities | | 307,536 | | | (20,346) | | | 1,448,658 | | | (228,554) | | | 1,756,194 | | | (248,900) | |
| Municipal securities | Municipal securities | | 177,065 | | | (5,682) | | | 17,003 | | | (606) | | | 194,068 | | | (6,288) | | Municipal securities | | 95,655 | | | (10,194) | | | 159,439 | | | (36,594) | | | 255,094 | | | (46,788) | |
| Non-agency mortgage-backed securities: | Non-agency mortgage-backed securities: | | Non-agency mortgage-backed securities: | |
| Commercial mortgage-backed securities | Commercial mortgage-backed securities | | 301,925 | | | (4,158) | | | 40,013 | | | (1,319) | | | 341,938 | | | (5,477) | | Commercial mortgage-backed securities | | 106,184 | | | (3,309) | | | 282,301 | | | (46,087) | | | 388,485 | | | (49,396) | |
| Residential mortgage-backed securities | Residential mortgage-backed securities | | 707,792 | | | (8,966) | | | 6,431 | | | (11) | | | 714,223 | | | (8,977) | | Residential mortgage-backed securities | | 22,715 | | | (1,546) | | | 626,509 | | | (111,432) | | | 649,224 | | | (112,978) | |
| Corporate debt securities | Corporate debt securities | | 183,916 | | | (3,084) | | | 251,494 | | | (13,505) | | | 435,410 | | | (16,589) | | Corporate debt securities | | 173,595 | | | (17,907) | | | 352,679 | | | (129,321) | | | 526,274 | | | (147,228) | |
| Foreign government bonds | Foreign government bonds | | 27,097 | | | (5) | | | 133,279 | | | (3,476) | | | 160,376 | | | (3,481) | | Foreign government bonds | | 107,576 | | | (429) | | | 36,143 | | | (13,857) | | | 143,719 | | | (14,286) | |
| Asset-backed securities | Asset-backed securities | | 24,885 | | | (301) | | | — | | | — | | | 24,885 | | | (301) | | Asset-backed securities | | 12,450 | | | (524) | | | 36,626 | | | (1,552) | | | 49,076 | | | (2,076) | |
| CLOs | CLOs | | 221,586 | | | (64) | | | 291,712 | | | (2,288) | | | 513,298 | | | (2,352) | | CLOs | | 144,365 | | | (4,735) | | | 453,299 | | | (14,851) | | | 597,664 | | | (19,586) | |
| Total AFS debt securities | Total AFS debt securities | | $ | 5,932,965 | | | $ | (106,229) | | | $ | 1,778,987 | | | $ | (66,622) | | | $ | 7,711,952 | | | $ | (172,851) | | Total AFS debt securities | | $ | 1,451,466 | | | $ | (104,682) | | | $ | 4,332,275 | | | $ | (740,048) | | | $ | 5,783,741 | | | $ | (844,730) | |
|
As of SeptemberJune 30, 2022,2023, the Company had a total of 557564 AFS debt securities in a gross unrealized loss position with no credit impairment, primarily consisting of 269 U.S. government agency and U.S. government-sponsored enterprise mortgage-backed securities, 66 corporate debt securities, 99 non-agency mortgage-backed securities, and 15 U.S. Treasury securities. In comparison, as of December 31, 2022, the Company had 559 AFS debt securities in a gross unrealized loss position with no credit impairment, primarily consisting of 262263 U.S. government agency and U.S. government-sponsored enterprise mortgage-backed securities, 100 non-agency mortgage-backed securities, and 68 corporate debt securities. In comparison, as of December 31, 2021, the Company had a total of 431 AFS debt securities, in a gross unrealized loss position with no credit impairment, consisting primarily of 180 U.S. government agency and U.S. government-sponsored enterprise mortgage-backed securities, 50 U.S. government agency and U.S. government-sponsored agency debt securities, 2115 U.S. Treasury securities, and 30 corporate debt securities.
Allowance for Credit Losses on Available-for-Sale Debt Securities
Each reporting period, theThe Company assessesevaluates each AFS debt security that is in an unrealized loss position to determine whetherwhere the decline in fair value declines below the amortized cost basis resulted from a credit loss or other factors.cost. For a discussion of the factors and criteria the Company uses in analyzing securities for impairment related to credit losses, see Note 1 — Summary of Significant Accounting Policies — Significant Accounting Policies — Allowance for Credit Losses on Available-for-Sale Debt Securities to the Consolidated Financial Statements in the Company’s 20212022 Form 10-K.
The gross unrealized losses presented in the preceding tables were primarily attributable to interest rate movement and the widening of liquidity and/or credit spreads. U.S. Treasury, U.S. government agency, U.S. government-sponsored agency, and U.S. government-sponsored enterprise debt and mortgage-backed securities are issued, guaranteed, or otherwise supported by the U.S. government and have a zero credit loss assumption. The otherremaining securities that were in an unrealized loss position as of SeptemberJune 30, 20222023 were mainly comprised of the following:
•Non-agency mortgage-backed securities —— The market value decline as of SeptemberJune 30, 2022,2023, was primarily due to interest rate movement and spread widening. Since these securities are rated investment grade by NRSROs,nationally recognized statistical rating organizations (“NRSROs”), or have high priority in the cash flow waterfall within the securitization structure, and the contractual payments have historically been on time, the Company believes the risk of credit losses on these securities is low.
•Corporate debt securities — The market value decline as of SeptemberJune 30, 20222023 was primarily due to interest rate movement and spread widening. SinceA portion of the corporate debt securities is comprised of subordinated debt securities issued by U.S. banks. Despite the reduction of the market value of these securities after the banking sector disruption in the first half of 2023, these securities are nearly all rated investment grade by NRSROs or if not, the issuer is aissued by well-capitalized financial institutioninstitutions with strong profitability, and theprofitability. The contractual payments from these bondscorporate debt securities have been and are expected to be received on time,time. The Company will continue to monitor the Company believes thatmarket developments in the riskbanking sector and the credit performance of credit losses on these securities is low.securities.
As of Septemberboth June 30, 20222023 and December 31, 2021,2022, the Company had the intentintended to hold the AFS debt securities with unrealized losses through the anticipated recovery period and it was more-likely-than-not that the Company willwould not have to sell these securities before the recovery of their amortized cost. The issuers of these securities have not, to the Company’s knowledge, established any cause for default on these securities. As a result, the Company expects to recover the entire amortized cost basis of these securities. Accordingly, there was no allowance for credit losses provided against these securities as of Septemberboth June 30, 20222023 and December 31, 2021 provided against these securities.2022. In addition, there was no provision for credit losses recognized for the three and ninesix months ended SeptemberJune 30, 20222023 and 2021. If a credit loss had been identified, the Company would record an impairment through the allowance for credit losses with a corresponding Provision for credit losses on the Consolidated Statement of Income.2022.
Allowance for Credit Losses on Held-to-Maturity Debt Securities
The Company separately evaluates its HTM debt securities for any credit losses using an expected loss model, similar to the methodology used for loans. Any expectedFor additional information on the Company’s credit loss is recorded through the allowancemethodology, refer to Note 1 — Summary of Significant Accounting Policies — Significant Accounting Policies — Allowance for credit losses and is deducted from the amortized cost basis. The net amount the Company expectsCredit Losses on Held-to-Maturity Debt Securities to collect is reflected on the Consolidated Balance Sheet.Financial Statements in the Company’s 2022 Form 10-K.
The Company monitors the credit quality of the HTM debt securities using external credit ratings. As of SeptemberJune 30, 2022,2023, all HTM securities were rated investment grade by NRSROs and issued, guaranteed, or supported by U.S. government entities and agencies. Accordingly, the Company applied a zero credit loss assumption and no allowance for credit losses was recorded as of SeptemberJune 30, 2023 and December 31, 2022. Overall, the Company believes that the credit support levels of the debt securities are strong, and based on current assessments and macroeconomic forecasts, expects that full contractual cash flows will be received.For more information on the Company’s credit loss methodology, refer to Note 2 — Current Accounting Developments and Summary of Significant Accounting Policies to the Consolidated Financial Statements in this Form 10-Q.
Realized Gains and Losses
The following table presents the gross realized gains and tax expense related tofrom the sales and impairment write-off of AFS debt securities and the related tax expense (benefit) included in earnings for the three and ninesix months ended SeptemberJune 30, 20222023 and 2021:2022:
| | | | | | | | | | | | | | | | | | | | | | | | | | | | | | |
|
| ($ in thousands) | | Three Months Ended September 30, | | Nine Months Ended September 30, | | |
| 2022 | | 2021 | | 2022 | | 2021 | | | | |
| | | | | | | | | | | | |
| Gross realized gains | | $ | — | | | $ | 354 | | | $ | 1,306 | | | $ | 1,178 | | | | | |
| Related tax expense | | $ | — | | | $ | 104 | | | $ | 386 | | | $ | 348 | | | | | |
|
| | | | | | | | | | | | | | | | | | | | | | | | | | | | | | |
|
| | Three Months Ended June 30, | | Six Months Ended June 30, | | |
| ($ in thousands) | | 2023 | | 2022 | | 2023 | | 2022 | | | | |
| | | | | | | | | | | | |
| Gross realized gains from sales | | $ | — | | | $ | 28 | | | $ | — | | | $ | 1,306 | | | | | |
Impairment write-off (1) | | $ | — | | | $ | — | | | $ | 10,000 | | | $ | — | | | | | |
| Related tax expense (benefit) | | $ | — | | | $ | 8 | | | $ | (2,956) | | | $ | 386 | | | | | |
|
(1)During the first quarter of 2023, the Company fully wrote down a subordinated debt security and recorded the impairment loss as a component of noninterest income in the Company’s Consolidated Statement of Income.
Interest Income
The following table presents the composition of interest income on debt securities for the three and ninesix months ended SeptemberJune 30, 20222023 and 2021:2022:
| | | ($ in thousands) | | Three Months Ended September 30, | | Nine Months Ended September 30, | | |
| | Three Months Ended June 30, | | Six Months Ended June 30, | |
| ($ in thousands) | ($ in thousands) | | 2022 | | 2021 | | 2022 | | 2021 | | ($ in thousands) | | 2023 | | 2022 | | 2023 | | 2022 | |
| | Taxable interest | Taxable interest | | $ | 46,172 | | | $ | 34,755 | | | $ | 125,626 | | | $ | 92,909 | | | Taxable interest | | $ | 64,139 | | | $ | 41,250 | | | $ | 125,188 | | | $ | 79,454 | | |
| Nontaxable interest | Nontaxable interest | | 4,920 | | | 3,071 | | | 14,309 | | | 8,707 | | | Nontaxable interest | | 4,831 | | | 4,926 | | | 9,713 | | | 9,389 | | |
| Total interest income on debt securities | Total interest income on debt securities | | $ | 51,092 | | | $ | 37,826 | | | $ | 139,935 | | | $ | 101,616 | | | Total interest income on debt securities | | $ | 68,970 | | | $ | 46,176 | | | $ | 134,901 | | | $ | 88,843 | | |
|
Contractual Maturities of Available-for-Sale and Held-to-Maturity Debt Securities
The following tables present the contractual maturities, amortized cost, fair value and weighted averageweighted-average yields of AFS and HTM debt securities as of SeptemberJune 30, 2022.2023. Expected maturities will differ from contractual maturities on certain securities as the issuers and borrowers of the underlying collateral may have the right to call or prepay obligations with or without prepayment penalties.
| | | ($ in thousands) | ($ in thousands) | | Within One Year | | After One Year through Five Years | | After Five Years through Ten Years | | After Ten Years | | Total | ($ in thousands) | | Within One Year | | After One Year through Five Years | | After Five Years through Ten Years | | After Ten Years | | Total |
| AFS debt securities: | AFS debt securities: | | | | | | | | | | | AFS debt securities: | | | | | | | | | | |
| U.S. Treasury securities | U.S. Treasury securities | | U.S. Treasury securities | |
| Amortized cost | Amortized cost | | $ | — | | | $ | 576,605 | | | $ | 99,707 | | | $ | — | | | $ | 676,312 | | Amortized cost | | $ | 103,679 | | | $ | 676,294 | | | $ | — | | | $ | — | | | $ | 779,973 | |
| Fair value | Fair value | | — | | | 516,595 | | | 84,082 | | | — | | | 600,677 | | Fair value | | 103,694 | | | 608,012 | | | — | | | — | | | 711,706 | |
Weighted-average yield (1) | Weighted-average yield (1) | | — | % | | 1.28 | % | | 0.74 | % | | — | % | | 1.20 | % | Weighted-average yield (1) | | 4.82 | % | | 1.20 | % | | — | % | | — | % | | 1.68 | % |
| U.S. government agency and U.S. government-sponsored enterprise debt securities | U.S. government agency and U.S. government-sponsored enterprise debt securities | | U.S. government agency and U.S. government-sponsored enterprise debt securities | |
| Amortized cost | Amortized cost | | — | | | 24,775 | | | 125,000 | | | 169,295 | | | 319,070 | | Amortized cost | | 150,000 | | | 98,133 | | | 100,000 | | | 166,461 | | | 514,594 | |
| Fair value | Fair value | | — | | | 22,787 | | | 102,540 | | | 135,097 | | | 260,424 | | Fair value | | 149,305 | | | 93,146 | | | 82,433 | | | 135,200 | | | 460,084 | |
Weighted-average yield (1) | Weighted-average yield (1) | | — | % | | 1.47 | % | | 1.16 | % | | 2.10 | % | | 1.69 | % | Weighted-average yield (1) | | 4.98 | % | | 3.07 | % | | 1.26 | % | | 2.09 | % | | 2.96 | % |
| U.S. government agency and U.S. government-sponsored enterprise mortgage-backed securities | U.S. government agency and U.S. government-sponsored enterprise mortgage-backed securities | | U.S. government agency and U.S. government-sponsored enterprise mortgage-backed securities | |
| Amortized cost | Amortized cost | | — | | | 24,417 | | | 173,899 | | | 2,440,817 | | | 2,639,133 | | Amortized cost | | — | | | 38,030 | | | 151,754 | | | 2,329,981 | | | 2,519,765 | |
| Fair value | Fair value | | — | | | 23,529 | | | 157,827 | | | 2,133,958 | | | 2,315,314 | | Fair value | | — | | | 35,886 | | | 137,852 | | | 2,026,276 | | | 2,200,014 | |
Weighted-average yield (1) | | — | % | | 3.26 | % | | 2.71 | % | | 2.70 | % | | 2.71 | % | |
Weighted-average yield (1) (2) | | Weighted-average yield (1) (2) | | — | % | | 3.20 | % | | 2.71 | % | | 3.48 | % | | 3.43 | % |
| Municipal securities | Municipal securities | | Municipal securities | |
| Amortized cost | Amortized cost | | 1,511 | | | 38,079 | | | 6,855 | | | 260,639 | | | 307,084 | | Amortized cost | | 2,301 | | | 37,167 | | | 10,777 | | | 253,959 | | | 304,204 | |
| Fair value | Fair value | | 1,510 | | | 35,025 | | | 5,753 | | | 207,214 | | | 249,502 | | Fair value | | 2,288 | | | 34,380 | | | 9,454 | | | 217,751 | | | 263,873 | |
Weighted-average yield (1) (2) | Weighted-average yield (1) (2) | | 3.13 | % | | 2.44 | % | | 1.85 | % | | 2.24 | % | | 2.26 | % | Weighted-average yield (1) (2) | | 2.21 | % | | 2.46 | % | | 2.73 | % | | 2.24 | % | | 2.28 | % |
| Non-agency mortgage-backed securities | Non-agency mortgage-backed securities | | Non-agency mortgage-backed securities | |
| Amortized cost | Amortized cost | | 28,574 | | | 187,564 | | | 25,832 | | | 991,520 | | | 1,233,490 | | Amortized cost | | 102,877 | | | 105,584 | | | 12,946 | | | 927,150 | | | 1,148,557 | |
| Fair value | Fair value | | 28,195 | | | 179,900 | | | 24,897 | | | 836,521 | | | 1,069,513 | | Fair value | | 101,397 | | | 101,371 | | | 12,525 | | | 777,332 | | | 992,625 | |
Weighted-average yield (1) | Weighted-average yield (1) | | 4.84 | % | | 3.87 | % | | 0.84 | % | | 2.37 | % | | 2.62 | % | Weighted-average yield (1) | | 6.86 | % | | 4.18 | % | | 0.80 | % | | 2.57 | % | | 3.08 | % |
| Corporate debt securities | Corporate debt securities | | Corporate debt securities | |
| Amortized cost | Amortized cost | | 10,000 | | | — | | | 334,502 | | | 329,000 | | | 673,502 | | Amortized cost | | — | | | — | | | 349,502 | | | 304,000 | | | 653,502 | |
| Fair value | Fair value | | 9,857 | | | — | | | 296,184 | | | 223,524 | | | 529,565 | | Fair value | | — | | | — | | | 279,402 | | | 206,348 | | | 485,750 | |
Weighted average yield (1) | | 3.95 | % | | — | % | | 3.59 | % | | 1.98 | % | | 2.81 | % | |
Weighted-average yield (1) | | Weighted-average yield (1) | | — | % | | — | % | | 3.48 | % | | 1.97 | % | | 2.78 | % |
| Foreign government bonds | Foreign government bonds | | Foreign government bonds | |
| Amortized cost | Amortized cost | | 138,720 | | | — | | | 50,000 | | | 50,000 | | | 238,720 | | Amortized cost | | 74,140 | | | 62,252 | | | 50,000 | | | 50,000 | | | 236,392 | |
| Fair value | Fair value | | 139,060 | | | — | | | 49,851 | | | 36,899 | | | 225,810 | | Fair value | | 74,116 | | | 62,364 | | | 49,548 | | | 38,738 | | | 224,766 | |
Weighted-average yield (1) | Weighted-average yield (1) | | 2.15 | % | | — | % | | 2.66 | % | | 1.50 | % | | 2.12 | % | Weighted-average yield (1) | | 3.02 | % | | 2.33 | % | | 5.46 | % | | 1.50 | % | | 3.03 | % |
| Asset-backed securities | Asset-backed securities | | Asset-backed securities | |
| Amortized cost | Amortized cost | | — | | | — | | | — | | | 66,793 | | | 66,793 | | Amortized cost | | — | | | — | | | — | | | 46,332 | | | 46,332 | |
| Fair value | Fair value | | — | | | — | | | — | | | 64,870 | | | 64,870 | | Fair value | | — | | | — | | | — | | | 44,875 | | | 44,875 | |
Weighted-average yield (1) | Weighted-average yield (1) | | — | % | | — | % | | — | % | | 4.15 | % | | 4.15 | % | Weighted-average yield (1) | | — | % | | — | % | | — | % | | 5.75 | % | | 5.75 | % |
| CLOs | CLOs | | CLOs | |
| Amortized cost | Amortized cost | | — | | | — | | | 25,000 | | | 592,250 | | | 617,250 | | Amortized cost | | — | | | — | | | 319,000 | | | 298,250 | | | 617,250 | |
| Fair value | Fair value | | — | | | — | | | 24,168 | | | 566,247 | | | 590,415 | | Fair value | | — | | | — | | | 311,589 | | | 291,976 | | | 603,565 | |
Weighted average yield (1) | | — | % | | — | % | | 3.66 | % | | 3.86 | % | | 3.85 | % | |
Weighted-average yield (1) | | Weighted-average yield (1) | | — | % | | — | % | | 6.38 | % | | 6.43 | % | | 6.40 | % |
| Total AFS debt securities | Total AFS debt securities | | Total AFS debt securities | |
| Amortized cost | Amortized cost | | $ | 178,805 | | | $ | 851,440 | | | $ | 840,795 | | | $ | 4,900,314 | | | $ | 6,771,354 | | Amortized cost | | $ | 432,997 | | | $ | 1,017,460 | | | $ | 993,979 | | | $ | 4,376,133 | | | $ | 6,820,569 | |
| Fair value | Fair value | | $ | 178,622 | | | $ | 777,836 | | | $ | 745,302 | | | $ | 4,204,330 | | | $ | 5,906,090 | | Fair value | | $ | 430,800 | | | $ | 935,159 | | | $ | 882,803 | | | $ | 3,738,496 | | | $ | 5,987,258 | |
Weighted-average yield (1) | Weighted-average yield (1) | | 2.69 | % | | 1.96 | % | | 2.56 | % | | 2.69 | % | | 2.58 | % | Weighted-average yield (1) | | 5.04 | % | | 1.88 | % | | 4.12 | % | | 3.26 | % | | 3.29 | % |
|
| | | ($ in thousands) | ($ in thousands) | | Within One Year | | After One Year through Five Years | | After Five Years through Ten Years | | After Ten Years | | Total | ($ in thousands) | | Within One Year | | After One Year through Five Years | | After Five Years through Ten Years | | After Ten Years | | Total |
| HTM debt securities: | HTM debt securities: | | | | | | | | | | | HTM debt securities: | | | | | | | | | | |
| U.S. Treasury securities | U.S. Treasury securities | | U.S. Treasury securities | |
| Amortized cost | Amortized cost | | $ | — | | $ | 285,325 | | $ | 237,388 | | $ | — | | $ | 522,713 | Amortized cost | | $ | — | | $ | 526,794 | | $ | — | | $ | — | | $ | 526,794 |
| Fair value | Fair value | | — | | 255,365 | | 210,720 | | — | | 466,085 | Fair value | | — | | 474,137 | | — | | — | | 474,137 |
Weighted-average yield (1) | Weighted-average yield (1) | | — | % | | 0.96 | % | | 1.14 | % | | — | % | | 1.05 | % | Weighted-average yield (1) | | — | % | | 1.05 | % | | — | % | | — | % | | 1.05 | % |
| U.S. government agency and U.S. government-sponsored enterprise debt securities | U.S. government agency and U.S. government-sponsored enterprise debt securities | | U.S. government agency and U.S. government-sponsored enterprise debt securities | |
| Amortized cost | Amortized cost | | — | | — | | 255,708 | | 742,525 | | 998,233 | Amortized cost | | — | | — | | 280,571 | | 719,844 | | 1,000,415 |
| Fair value | Fair value | | — | | — | | 215,684 | | 566,933 | | 782,617 | Fair value | | — | | — | | 237,713 | | 560,158 | | 797,871 |
Weighted-average yield (1) | Weighted-average yield (1) | | — | % | | — | % | | 1.94 | % | | 1.88 | % | | 1.90 | % | Weighted-average yield (1) | | — | % | | — | % | | 1.92 | % | | 1.89 | % | | 1.90 | % |
| U.S. government agency and U.S. government-sponsored enterprise mortgage-backed securities | U.S. government agency and U.S. government-sponsored enterprise mortgage-backed securities | | U.S. government agency and U.S. government-sponsored enterprise mortgage-backed securities | |
| Amortized cost | Amortized cost | | — | | — | | 96,433 | | 1,205,391 | | 1,301,824 | Amortized cost | | — | | — | | 95,527 | | 1,163,898 | | 1,259,425 |
| Fair value | Fair value | | — | | — | | 81,526 | | 984,813 | | 1,066,339 | Fair value | | — | | — | | 80,230 | | 938,796 | | 1,019,026 |
Weighted-average yield (1) | | — | % | | — | % | | 1.56 | % | | 1.63 | % | | 1.63 | % | |
Weighted-average yield (1) (2) | | Weighted-average yield (1) (2) | | — | % | | — | % | | 1.56 | % | | 1.68 | % | | 1.67 | % |
| Municipal securities | Municipal securities | | Municipal securities | |
| Amortized cost | Amortized cost | | — | | — | | — | | 189,897 | | 189,897 | Amortized cost | | — | | — | | — | | 189,299 | | 189,299 |
| Fair value | Fair value | | — | | — | | — | | 144,094 | | 144,094 | Fair value | | — | | — | | — | | 149,450 | | 149,450 |
Weighted-average yield (1) (2) | Weighted-average yield (1) (2) | | — | % | | — | % | | — | % | | 1.97 | % | | 1.97 | % | Weighted-average yield (1) (2) | | — | % | | — | % | | — | % | | 1.98 | % | | 1.98 | % |
| Total HTM debt securities | Total HTM debt securities | | Total HTM debt securities | |
| Amortized cost | Amortized cost | | $ | — | | $ | 285,325 | | $ | 589,529 | | $ | 2,137,813 | | $ | 3,012,667 | Amortized cost | | $ | — | | $ | 526,794 | | $ | 376,098 | | $ | 2,073,041 | | $ | 2,975,933 |
| Fair value | Fair value | | $ | — | | $ | 255,365 | | $ | 507,930 | | $ | 1,695,840 | | $ | 2,459,135 | Fair value | | $ | — | | $ | 474,137 | | $ | 317,943 | | $ | 1,648,404 | | $ | 2,440,484 |
Weighted-average yield (1) | Weighted-average yield (1) | | — | % | | 0.96 | % | | 1.55 | % | | 1.75 | % | | 1.64 | % | Weighted-average yield (1) | | — | % | | 1.05 | % | | 1.83 | % | | 1.78 | % | | 1.66 | % |
|
(1)Weighted-average yields are computed based on amortized cost balances.
(2)Yields on tax-exempt securities are not presented on a tax-equivalent basis.
As of SeptemberJune 30, 20222023 and December 31, 2021,2022, AFS and HTM debt securities with carrying values of $1.22$7.21 billion and $803.9$794.2 million, respectively, were pledged to secure borrowings, public deposits, repurchase agreements and for other purposes required or permitted by law.
Restricted Equity Securities
The following table presents the restricted equity securities included in Other assets on the Consolidated Balance Sheet as of SeptemberJune 30, 20222023 and December 31, 2021:2022:
| | | ($ in thousands) | ($ in thousands) | | September 30, 2022 | | December 31, 2021 | ($ in thousands) | | June 30, 2023 | | December 31, 2022 |
| Federal Reserve Bank of San Francisco (“FRBSF”) stock | Federal Reserve Bank of San Francisco (“FRBSF”) stock | | $ | 61,004 | | | $ | 60,184 | | Federal Reserve Bank of San Francisco (“FRBSF”) stock | | $ | 61,956 | | | $ | 61,374 | |
| FHLB stock | FHLB stock | | 17,250 | | | 17,250 | | FHLB stock | | 17,250 | | | 17,250 | |
| Total restricted equity securities | Total restricted equity securities | | $ | 78,254 | | | $ | 77,434 | | Total restricted equity securities | | $ | 79,206 | | | $ | 78,624 | |
|
Note 6 — Derivatives
The Company uses derivativesderivative instruments to manage exposure to market risk, primarily interest rate orand foreign currency risk,risks, as well as to assist customers with their risk management objectives. The Company’s goal is to manage interest rate sensitivity and volatility to mitigate the effect of interest ratesrate changes on earnings or capital. The Company also uses foreign exchange contracts to manage the foreign exchange rate risk associated with certain foreign currency-denominated assets and liabilities, as well as the Bank’s investment in East West Bank (China) Limited. The Company recognizes all derivatives on the Consolidated Balance Sheet at fair value. While the Company designates certain derivatives as hedging instruments in a qualifying hedge accounting relationship, other derivatives serve as economic hedges. For additional information on the Company’s derivatives and hedging activities, see Note 1 — Summary of Significant Accounting Policies — Significant Accounting Policies — Derivatives to the Consolidated Financial Statements of the Company’s 20212022 Form 10-K.
The following table presents the notional amounts and gross fair values of the Company’s derivatives as well as the balance sheet netting adjustments on an aggregate basis as of SeptemberJune 30, 20222023 and December 31, 2021.2022. Certain derivative contracts are cleared though central clearing organizations where variation margin is applied daily as settlement to the fair values of the contracts. The derivative asset and liability fair values are presented on a gross basis prior to the application of bilateral collateral and master netting agreements, but after the application of variation margin payments as settlements withsettlement to fair values of contracts cleared through central clearing organizations. Applying variation margin payments as settlement to the fair values of derivative contracts cleared through the London Clearing House (“LCH”) and the Chicago Mercantile Exchange (“CME”) resulted in reductions in the derivative asset and liability fair values by $24.6 million and $63.5 million, respectively, as of June 30, 2023. In comparison, applying variation margin payments as settlement to LCH- and CME-cleared derivative transactions resulted in reductions in the derivative asset and liability fair values by $167.2 million and $81.3 million, respectively, as of December 31, 2022. Total derivative asset and liability fair values are adjusted to take into considerationreflect the effects of legally enforceable master netting agreements and cash collateral received or paid as of September 30, 2022 and December 31, 2021.paid. The resulting net derivative asset and liability fair values are included in Other assets and Accrued expenses and other liabilities, respectively, on the Consolidated Balance Sheet.
| | | ($ in thousands) | | September 30, 2022 | | December 31, 2021 | |
| Notional
Amount | | Fair Value | | Notional
Amount | | Fair Value | |
| | June 30, 2023 | | December 31, 2022 |
| | | | Fair Value | | | Fair Value |
| ($ in thousands) | ($ in thousands) | | Notional
Amount | | Derivative
Assets | | Derivative
Liabilities | | Notional
Amount | | Derivative
Assets | | Derivative
Liabilities | ($ in thousands) | | Notional Amount | | Derivative Assets | | Derivative Liabilities | | Notional Amount | | Derivative Assets | | Derivative Liabilities |
| | | | | | | | Derivatives designated as hedging instruments: | | | | | | | | | | | | |
| | | Cash flow hedges: | Cash flow hedges: | | Cash flow hedges: | |
| Interest rate contracts | Interest rate contracts | | $ | 2,525,000 | | | $ | 533 | | | $ | 24,679 | | | $ | 275,000 | | | $ | — | | | $ | 57 | | Interest rate contracts | | $ | 5,250,000 | | | $ | 2,430 | | | $ | 51,862 | | | $ | 3,450,000 | | | $ | 13,455 | | | $ | 19,687 | |
| Net investment hedges: | Net investment hedges: | | Net investment hedges: | |
| Foreign exchange contracts | Foreign exchange contracts | | 84,832 | | | 7,107 | | | — | | | 86,531 | | | — | | | 225 | | Foreign exchange contracts | | 81,480 | | | 3,646 | | | — | | | 84,832 | | | 5,590 | | | — | |
| Total derivatives designated as hedging instruments | Total derivatives designated as hedging instruments | | $ | 2,609,832 | | | $ | 7,640 | | | $ | 24,679 | | | $ | 361,531 | | | $ | — | | | $ | 282 | | Total derivatives designated as hedging instruments | | $ | 5,331,480 | | | $ | 6,076 | | | $ | 51,862 | | | $ | 3,534,832 | | | $ | 19,045 | | | $ | 19,687 | |
| Derivatives not designated as hedging instruments: | Derivatives not designated as hedging instruments: | | | | | | | | | | | | | Derivatives not designated as hedging instruments: | | | | | | | | | | | | |
| Interest rate contracts | Interest rate contracts | | $ | 17,261,862 | | | $ | 429,505 | | | $ | 590,648 | | | $ | 17,575,420 | | | $ | 240,222 | | | $ | 179,905 | | Interest rate contracts | | $ | 17,885,894 | | | $ | 527,805 | | | $ | 539,585 | | | $ | 16,932,414 | | | $ | 426,828 | | | $ | 564,829 | |
Commodity contracts (1) | | Commodity contracts (1) | | — | | | 139,081 | | | 147,920 | | | — | | | 261,613 | | | 258,608 | |
| Foreign exchange contracts | Foreign exchange contracts | | 2,762,150 | | | 74,767 | | | 64,049 | | | 1,874,681 | | | 21,033 | | | 15,276 | | Foreign exchange contracts | | 4,724,615 | | | 91,936 | | | 72,342 | | | 2,982,891 | | | 47,519 | | | 44,117 | |
| Credit contracts | | 141,549 | | | — | | | 27 | | | 72,560 | | | — | | | 141 | | |
| Equity contracts | | — | | (1) | 346 | | | — | | | — | | (1) | 220 | | | — | | |
| Commodity contracts | | — | | (2) | 369,146 | | | 350,198 | | | — | | (2) | 222,709 | | | 194,567 | | |
Credit contracts (2) | | Credit contracts (2) | | 109,370 | | | — | | | 16 | | | 140,950 | | | — | | | 23 | |
Equity contracts (3) | | Equity contracts (3) | | — | | | 263 | | | — | | | — | | | 323 | | | — | |
| Total derivatives not designated as hedging instruments | Total derivatives not designated as hedging instruments | | $ | 20,165,561 | | | $ | 873,764 | | | $ | 1,004,922 | | | $ | 19,522,661 | | | $ | 484,184 | | | $ | 389,889 | | Total derivatives not designated as hedging instruments | | $ | 22,719,879 | | | $ | 759,085 | | | $ | 759,863 | | | $ | 20,056,255 | | | $ | 736,283 | | | $ | 867,577 | |
| Gross derivative assets/liabilities | Gross derivative assets/liabilities | | | | $ | 881,404 | | | $ | 1,029,601 | | | | | $ | 484,184 | | | $ | 390,171 | | Gross derivative assets/liabilities | | | | $ | 765,161 | | | $ | 811,725 | | | | | $ | 755,328 | | | $ | 887,264 | |
| Less: Master netting agreements | Less: Master netting agreements | | (238,606) | | | (238,606) | | | (58,679) | | | (58,679) | | Less: Master netting agreements | | (208,183) | | | (208,183) | | | (242,745) | | | (242,745) | |
| Less: Cash collateral received/paid | | (367,351) | | | (600) | | | (42,274) | | | (174,048) | | |
| Less: Cash collateral received | | Less: Cash collateral received | | (264,245) | | | — | | | (372,038) | | | — | |
| Net derivative assets/liabilities | Net derivative assets/liabilities | | $ | 275,447 | | | $ | 790,395 | | | $ | 383,231 | | | $ | 157,444 | | Net derivative assets/liabilities | | $ | 292,733 | | | $ | 603,542 | | | $ | 140,545 | | | $ | 644,519 | |
|
(1)The Company held equity contracts in one public company and 13 private companies as of September 30, 2022. In comparison, the Company held equity contracts in one public company and 12 private companies as of December 31, 2021.
(2)The notional amount of the Company’s commodity contracts entered with its customers totaled 8,19916,446 thousand barrels of crude oil and 113,574306,161 thousand units of natural gas, measured in million British thermal units (“MMBTUs”) as of SeptemberJune 30, 2022.2023. In comparison, the notional amount of the Company’s commodity contracts entered with its customers totaled 7,51912,005 thousand barrels of crude oil and 83,274247,704 thousand MMBTUs of natural gas as of December 31, 2021. 2022.
(2)The notional amount for credit contracts reflects the Company’s pro-rata share of the derivative instruments in RPAs.
(3)The Company simultaneously entered intoheld equity contracts in one public company and 10 private companies as of June 30, 2023. In comparison, the offsetting commodityCompany held equity contracts with mirrored terms with third-party financial institutions.in one public company and 13 private companies as of December 31, 2022.
In anticipation of LIBOR’s cessation date on June 30, 2023, certain LIBOR-indexed interest-rate swap contracts with LCH were subject to a conversion process, where the original LIBOR swap contract was exchanged for a SOFR forward-starting swap contract, along with one or more overlap swap contracts replicating the final LIBOR cash flows of the original LIBOR swap contract. The swap contracts exchanged were substantially economically equivalent. The SOFR replacement and overlap LIBOR swaps are considered separate contracts, and the overlay LIBOR swaps will result in a gross-up of the notional amounts presented, until these swaps mature upon settlement of the final LIBOR payment. The interest rate contracts included as cash flow and economic hedges reflect notional gross-ups of $1.00 billion and $161.9 million. These overlay LIBOR swaps are expected to mature in the third quarter of 2023.
Derivatives Designated as Hedging Instruments
Cash Flow Hedges — The Company hedgesuses interest rate swaps to hedge the variability of forecasted cash flowsin interest received on certain floating-rate commercial loans, or paid on certain floating-rate borrowings due to changes in contractually specified interest rates associated with floating-rate assets/liabilities and other forecasted transactions.rates. As of SeptemberJune 30, 2022, $2.25 billion and $275.0 million2023, interest rate contracts in notional amounts of interest rate contracts$5.25 billion were designated as cash flow hedges to modifyconvert certain variable-rate loans from floating-rate payments to fixed-rate payments. Gains and losses on the interest rate characteristics of certain commercial loans and borrowings, respectively, from variable to fixed. This will reduce the impact of changes in future cash flows due to changes in market interest rates.Changes in the fair values of cash flow hedgeshedging derivative instruments are recognized in AOCI and reclassified to earnings in the same period when the hedged cash flows impact earnings.earnings and within the same income statement line item as the hedged cash flows. Considering the interest rates, yield curve and notional amountsamount as of SeptemberJune 30, 2022,2023, the Company expects to reclassify an estimated $26.5$65.5 million of after-tax net losses related toon derivative instruments designated as cash flow hedges from AOCI into earnings during the next 12 months.
The following table presents the pre-tax changes in AOCI from cash flow hedges for the three and ninesix months ended SeptemberJune 30, 20222023 and 2021.2022. The after-tax impact of cash flow hedges on AOCI is discussedshown in Note 1314 — Accumulated Other Comprehensive Income (Loss) to the Consolidated Financial Statements in this Form-10-Q.
| | | | | Three Months Ended June 30, | | Six Months Ended June 30, |
| ($ in thousands) | ($ in thousands) | | Three Months Ended September 30, | | Nine Months Ended September 30, | | ($ in thousands) | | 2023 | | 2022 | | 2023 | | 2022 |
| 2022 | | 2021 | | 2022 | | 2021 | | |
| (Losses) gains recognized in AOCI: | | | | | | | | | | |
| Losses recognized in AOCI: | | Losses recognized in AOCI: | | | | | | | | |
| Interest rate contracts | Interest rate contracts | | $ | (48,325) | | | $ | (170) | | | $ | (88,771) | | | $ | 150 | | | Interest rate contracts | | $ | (96,457) | | | $ | (7,837) | | | $ | (66,614) | | | $ | (40,446) | |
| | (Losses) gains reclassified from AOCI into earnings: | | | |
| Gains (losses) reclassified from AOCI into earnings: | | Gains (losses) reclassified from AOCI into earnings: | |
| Interest expense (for cash flow hedges on borrowings) | Interest expense (for cash flow hedges on borrowings) | | $ | 1,251 | | | $ | (241) | | | $ | 1,385 | | | $ | (619) | | | Interest expense (for cash flow hedges on borrowings) | | — | | | 308 | | | 696 | | | 135 | |
| Interest and dividend income (for cash flow hedges on loans) | Interest and dividend income (for cash flow hedges on loans) | | (2,870) | | | — | | | 216 | | | — | | | Interest and dividend income (for cash flow hedges on loans) | | (20,252) | | | 812 | | | (33,206) | | | 3,085 | |
| Noninterest income | | Noninterest income | | — | | | — | | | 1,614 | | (1) | — | |
| Total | Total | | $ | (1,619) | | | $ | (241) | | | $ | 1,601 | | | $ | (619) | | | Total | | $ | (20,252) | | | $ | 1,120 | | | $ | (30,896) | | | $ | 3,220 | |
|
(1)Represents the amounts in AOCI reclassified into earnings as a result that the forecasted cash flows were no longer probable to occur.
Net Investment Hedges — ASC 830-20, Foreign Currency Matters — Foreign Currency Transactions and ASC 815, Derivatives and Hedging, allows hedging of the foreign currency risk of a net investment in a foreign operation. The Company enters into foreign currency forward contracts to hedge a portion of the Bank’s investment in East West Bank (China) Limited, a non-USD functional currency subsidiary in China. The hedging instruments designated as net investment hedges involve hedging the risk of changes in the USD equivalent value of a designated monetary amount of the Bank’s net investment in East West Bank (China) Limited,were used to hedge against the risk of adverse changes in the foreign currency exchange rate of the Chinese Renminbi (“RMB”). The Company may de-designate the net investment hedges when the Company expects the hedge will cease to be highly effective.
The following table presents the after-taxpre-tax gains (losses) recognized in AOCI on net investment hedges for the three and ninesix months ended SeptemberJune 30, 20222023 and 2021:2022:
| | | | | Three Months Ended June 30, | | Six Months Ended June 30, |
| ($ in thousands) | ($ in thousands) | | Three Months Ended September 30, | | Nine Months Ended September 30, | | ($ in thousands) | | 2023 | | 2022 | | 2023 | | 2022 |
| 2022 | | 2021 | | 2022 | | 2021 | | |
| Gains (losses) recognized in AOCI | | $ | 3,093 | | | $ | (318) | | | $ | 4,293 | | | $ | (1,860) | | | |
| Gains recognized in AOCI | | Gains recognized in AOCI | | $ | 3,899 | | | $ | 3,255 | | | $ | 2,823 | | | $ | 1,684 | |
| |
Derivatives Not Designated as Hedging Instruments
Interest Rate ContractsCustomer-Related Positions and other Economic Hedge Derivatives — The Company enters into interest rate, contracts, which include interest rate swapscommodity, and options withforeign exchange derivatives at the request of its customers to allow the customers to hedge against the risk of rising interest rates on their variable-rate loans. To economically hedge against the interest rate risks in the products offered to its customers, the Company enters into mirrored offsetting interest rate contracts with third-party financial institutions, including central clearing organizations.
The following tables present the notional amounts and the gross fair values of interest rate derivative contracts outstanding as of September 30, 2022 and December 31, 2021:
| | | | | | | | | | | | | | | | | | | | | | | | | | | | | | | | | | | | | | | | | | | | |
|
| ($ in thousands) | | September 30, 2022 |
| Customer Counterparty | | ($ in thousands) | | Financial Counterparty |
| Notional
Amount | | Fair Value | | | Notional
Amount | | Fair Value |
| | Assets | | Liabilities | | | | Assets | | Liabilities |
| Purchased options | | $ | — | | | $ | — | | | $ | — | | | Purchased options | | $ | 1,581,174 | | | $ | 33,745 | | | $ | — | |
| Written options | | 1,548,884 | | | — | | | 32,253 | | | Written options | | 32,290 | | | — | | | 1,346 | |
| Sold collars and corridors | | 221,287 | | | — | | | 8,661 | | | Collars and corridors | | 221,287 | | | 8,706 | | | — | |
| Swaps | | 6,814,564 | | | 159 | | | 547,728 | | | Swaps | | 6,842,376 | | | 386,895 | | | 660 | |
| Total | | $ | 8,584,735 | | | $ | 159 | | | $ | 588,642 | | | Total | | $ | 8,677,127 | | | $ | 429,346 | | | $ | 2,006 | |
|
| | | | | | | | | | | | | | | | | | | | | | | | | | | | | | | | | | | | | | | | | | | | |
|
| ($ in thousands) | | December 31, 2021 |
| Customer Counterparty | | ($ in thousands) | | Financial Counterparty |
| Notional
Amount | | Fair Value | | | Notional
Amount | | Fair Value |
| | Assets | | Liabilities | | | | Assets | | Liabilities |
| Written options | | $ | 1,118,074 | | | $ | — | | | $ | 2,148 | | | Purchased options | | $ | 1,118,074 | | | $ | 2,159 | | | $ | — | |
| Sold collars and corridors | | 194,181 | | | 1,272 | | | 642 | | | Collars and corridors | | 194,181 | | | 646 | | | 1,275 | |
| Swaps | | 7,460,836 | | | 211,727 | | | 39,650 | | | Swaps | | 7,490,074 | | | 24,418 | | | 136,190 | |
| Total | | $ | 8,773,091 | | | $ | 212,999 | | | $ | 42,440 | | | Total | | $ | 8,802,329 | | | $ | 27,223 | | | $ | 137,465 | |
|
Included in the total notional amount of $8.68 billion of interest rate contracts entered into with financial counterparties as of September 30, 2022, was a notional amount of $2.10 billion of interest rate swaps that cleared through London Clearing House (“LCH”). Applying variation margin payments as settlement to LCH-cleared derivative transactions resulted in a reduction in the derivative asset of $178.4 million and a reduction in the derivative liability of a nominal amount as of September 30, 2022. In comparison, included in the total notional amount of $8.80 billion of interest rate contracts entered into with financial counterparties as of December 31, 2021, was a notional amount of $2.79 billion of interest rate swaps that cleared through LCH. Applying variation margin payments as settlement to LCH cleared derivative transactions resulted in a reduction in the derivative asset of $18.1 million and a reduction in the derivative liability of $79.9 million as of December 31, 2021.
Foreign Exchange Contracts — The Company enters into foreign exchange contracts with its customers, consisting of forward, spot, swap and option contracts to accommodate the business needs of its customers. The Companygenerally enters into offsetting foreign exchangederivative contracts with third-party financial institutions to manage its foreign exchange exposure with its customers, or enters into bilateral collateral and master netting agreements with certain customer counterparties to manage its credit exposure.mitigate the inherent market risk. The Company also utilizes foreign exchange contracts which are not designated as hedging instruments, to mitigate the economic effect of currency fluctuations on certain foreign currency-denominated on-balance sheet assets and liabilities, primarily foreign currency-denominatedcurrency denominated deposits offeredthat it offers to its customers. A majority of the foreign exchange contracts had original maturities of one year or less as of both SeptemberJune 30, 20222023 and December 31, 2021.2022.
The following tables presenttable presents the notional amounts and the gross fair values of the interest rate and foreign exchange derivative contracts outstandingderivatives entered into for customer-related positions and with third-party financial institutions, labeled as “other economic hedges”, as of SeptemberJune 30, 20222023 and December 31, 2021:2022:
| | | | | | | | | | | | | | | | | | | | | | | | | | | | | | | | | | | | | | | | | | | | |
|
| ($ in thousands) | | September 30, 2022 |
| Customer Counterparty | | ($ in thousands) | | Financial Counterparty |
| Notional
Amount | | Fair Value | | | Notional
Amount | | Fair Value |
| | Assets | | Liabilities | | | | Assets | | Liabilities |
| Forwards and spots | | $ | 1,048,541 | | | $ | 24,645 | | | $ | 39,173 | | | Forwards and spots | | $ | 220,663 | | | $ | 4,260 | | | $ | 2,408 | |
| Swaps | | 127,381 | | | 897 | | | 2,606 | | | Swaps | | 1,257,039 | | | 42,100 | | | 16,997 | |
| Purchased options | | 49,000 | | | 2,533 | | | — | | | Written options | | 49,000 | | | — | | | 2,533 | |
| Collars | | 5,263 | | | — | | | 332 | | | Collars | | 5,263 | | | 332 | | | — | |
| Total | | $ | 1,230,185 | | | $ | 28,075 | | | $ | 42,111 | | | Total | | $ | 1,531,965 | | | $ | 46,692 | | | $ | 21,938 | |
|
| | | | | | | | | | | | | | | | | | | | | | | | | | | | | | | | | | | | | | | | | June 30, 2023 | | December 31, 2022 | |
| | | | Fair Value | | | Fair Value | |
| ($ in thousands) | ($ in thousands) | | December 31, 2021 | ($ in thousands) | | Notional Amount | | Assets | | Liabilities | | Notional Amount | | Assets | | Liabilities | |
| Customer Counterparty | | ($ in thousands) | | Financial Counterparty | |
| Notional
Amount | | Fair Value | | Notional
Amount | | Fair Value | |
| Assets | | Liabilities | | ($ in thousands) | | Assets | | Liabilities | |
| Forwards and spots | | $ | 900,290 | | | $ | 13,688 | | | $ | 9,446 | | | Forwards and spots | $ | 267,689 | | | $ | 1,564 | | | $ | 2,695 | | |
| Customer-related positions: | | Customer-related positions: | | | | | | | | | | | | | |
| Interest rate contracts: | | Interest rate contracts: | | |
| Swaps | Swaps | | 66,474 | | | 1,034 | | | 17 | | | Swaps | | 599,654 | | | 4,745 | | | 3,116 | | Swaps | | $ | 6,900,309 | | | $ | 2,117 | | | $ | 503,261 | | | $ | 6,656,491 | | | $ | 1,438 | | | $ | 521,719 | | |
| Purchase options | | 20,287 | | | 2 | | | — | | | Written options | | 20,287 | | | — | | | 2 | | |
| | Written options | | Written options | | 1,621,207 | | | — | | | 24,166 | | | 1,548,158 | | | — | | | 30,904 | | |
| Collars and corridors | | Collars and corridors | | 296,585 | | | 12 | | | 8,743 | | | 215,773 | | | — | | | 8,924 | | |
| Subtotal | | Subtotal | | 8,818,101 | | | 2,129 | | | 536,170 | | | 8,420,422 | | | 1,438 | | | 561,547 | | |
| Foreign exchange contracts: | | Foreign exchange contracts: | | |
| Forwards and spot | | Forwards and spot | | 1,410,862 | | | 23,596 | | | 31,829 | | | 993,588 | | | 17,009 | | | 18,090 | | |
| Swaps | | Swaps | | 888,018 | | | 17,862 | | | 4,767 | | | 623,143 | | | 6,629 | | | 12,178 | | |
| Other | | Other | | 129,000 | | | 5,939 | | | — | | | 121,631 | | | 2,070 | | | 245 | | |
| Subtotal | | Subtotal | | 2,427,880 | | | 47,397 | | | 36,596 | | | 1,738,362 | | | 25,708 | | | 30,513 | | |
| Total | | Total | | $ | 11,245,981 | | | $ | 49,526 | | | $ | 572,766 | | | $ | 10,158,784 | | | $ | 27,146 | | | $ | 592,060 | | |
| Other economic hedges: | | Other economic hedges: | | | | | | | | | | | | | |
| Interest rate contracts: | | Interest rate contracts: | | |
| Swaps | | Swaps | | $ | 7,088,622 | | | $ | 491,972 | | | $ | 2,707 | | | $ | 6,683,828 | | | $ | 384,201 | | | $ | 2,047 | | |
| Purchased options | | Purchased options | | 1,651,896 | | | 24,927 | | | — | | | 1,580,275 | | | 32,233 | | | — | | |
| Written options | | Written options | | 30,690 | | | — | | | 696 | | | 32,117 | | | — | | | 1,235 | | |
| Collars and corridors | | Collars and corridors | | 296,585 | | | 8,777 | | | 12 | | | 215,772 | | | 8,956 | | | — | | |
| Subtotal | | Subtotal | | 9,067,793 | | | 525,676 | | | 3,415 | | | 8,511,992 | | | 425,390 | | | 3,282 | | |
| Foreign exchange contracts: | | Foreign exchange contracts: | | |
| Forwards and spot | | Forwards and spot | | 24,935 | | | 88 | | | 155 | | | 77,998 | | | 3,050 | | | 87 | | |
| Swaps | | Swaps | | 2,142,800 | | | 44,451 | | | 29,652 | | | 1,044,900 | | | 18,516 | | | 11,447 | | |
| Other | | Other | | 129,000 | | | — | | | 5,939 | | | 121,631 | | | 245 | | | 2,070 | | |
| Subtotal | | Subtotal | | 2,296,735 | | | 44,539 | | | 35,746 | | | 1,244,529 | | | 21,811 | | | 13,604 | | |
| Total | Total | | $ | 987,051 | | | $ | 14,724 | | | $ | 9,463 | | | Total | | $ | 887,630 | | | $ | 6,309 | | | $ | 5,813 | | Total | | $ | 11,364,528 | | | $ | 570,215 | | | $ | 39,161 | | | $ | 9,756,521 | | | $ | 447,201 | | | $ | 16,886 | | |
|
The Company enters into energy commodity contracts with its customers in the oil and gas sector, which allow them to hedge against the risk of fluctuation in energy commodity prices. Offsetting contracts entered with third-party financial institutions, labeled below as “other economic hedges” are used to manage the Company’s exposure on its customer-related positions. The following table presents the notional amounts in units and the gross fair values of the commodity derivatives issued for customer-related positions and other economic hedges as of June 30, 2023 and December 31, 2022:
| | | | | | | | | | | | | | | | | | | | | | | | | | | | | | | | | | | | | | | | | | | | | | | | | | | | | | |
| | | | |
| | June 30, 2023 | | December 31, 2022 | | | | |
| | | | | | Fair Value | | | | | | Fair Value | | | | |
| ($ and unit in thousands) | | Notional Units | | Assets | | Liabilities | | Notional Units | | Assets | | Liabilities | | | | |
| Customer-related positions: | | | | | | | | | | | | | | | | | | | | |
| Commodity contracts: | | | | | | | | | | | | | | | | | | | | |
| Crude oil: | | | | | | | | | | | | | | | | | | | | |
| Swaps | | 2,717 | | | Barrels | | $ | 9,106 | | | $ | 14,142 | | | 2,465 | | | Barrels | | $ | 39,955 | | | $ | 6,178 | | | | | |
| Collars | | 5,474 | | | Barrels | | 1,824 | | | 7,375 | | | 3,011 | | | Barrels | | 16,038 | | | 2,630 | | | | | |
| Written options | | — | | | Barrels | | — | | | — | | | — | | | Barrels | | 558 | | | — | | | | | |
| Subtotal | | 8,191 | | | Barrels | | 10,930 | | | 21,517 | | | 5,476 | | | Barrels | | 56,551 | | | 8,808 | | | | | |
| Natural gas: | | | | | | | | | | | | | | | | | | | | |
| Swaps | | 115,608 | | | MMBTUs | | 39,171 | | | 59,359 | | | 92,590 | | | MMBTUs | | 112,314 | | | 73,208 | | | | | |
| Collars | | 36,161 | | | MMBTUs | | 524 | | | 17,545 | | | 32,072 | | | MMBTUs | | 2,217 | | | 18,317 | | | | | |
| Written options | | 1,559 | | | MMBTUs | | — | | | 179 | | | — | | | MMBTUs | | — | | | — | | | | | |
| Subtotal | | 153,328 | | | MMBTUs | | 39,695 | | | 77,083 | | | 124,662 | | | MMBTUs | | 114,531 | | | 91,525 | | | | | |
| Total | | | | | | $ | 50,625 | | | $ | 98,600 | | | | | | | $ | 171,082 | | | $ | 100,333 | | | | | |
| Other economic hedges: | | | | | | | | | | | | | | | | | | | | |
| Commodity contracts: | | | | | | | | | | | | | | | | | | | | |
| Crude oil: | | | | | | | | | | | | | | | | | | | | |
| Swaps | | 2,781 | | | Barrels | | $ | 14,787 | | | $ | 8,770 | | | 2,587 | | | Barrels | | $ | 6,935 | | | $ | 36,060 | | | | | |
| Collars | | 5,474 | | | Barrels | | 6,580 | | | 1,700 | | | 3,942 | | | Barrels | | 1,378 | | | 12,856 | | | | | |
| Purchased options | | — | | | Barrels | | — | | | — | | | — | | | Barrels | | — | | | 516 | | | | | |
| Subtotal | | 8,255 | | | Barrels | | 21,367 | | | 10,470 | | | 6,529 | | | Barrels | | 8,313 | | | 49,432 | | | | | |
| Natural gas: | | | | | | | | | | | | | | | | | | | | |
| Swaps | | 115,453 | | | MMBTUs | | 50,828 | | | 38,326 | | | 91,900 | | | MMBTUs | | 69,767 | | | 106,883 | | | | | |
| Collars | | 35,821 | | | MMBTUs | | 16,082 | | | 524 | | | 31,142 | | | MMBTUs | | 12,451 | | | 1,960 | | | | | |
| Purchased options | | 1,559 | | | MMBTUs | | 179 | | | — | | | — | | | MMBTUs | | — | | | — | | | | | |
| Subtotal | | 152,833 | | | MMBTUs | | 67,089 | | | 38,850 | | | 123,042 | | | MMBTUs | | 82,218 | | | 108,843 | | | | | |
| Total | | | | | | $ | 88,456 | | | $ | 49,320 | | | | | | | $ | 90,531 | | | $ | 158,275 | | | | | |
| | | | |
Credit Contracts — The Company periodically enters into credit RPAs with institutional counterparties to manage the credit exposure of the interest rate contracts associated with syndication loans. The Company may enter into protection sold or protection purchased RPAs. A purchaser of credit protection that enters into an interest rate contract withUnder the borrower, may in turn enter into an RPA with a seller of protection, under which the seller of protection receives a fee to acceptRPAs, a portion of the credit risk.exposure is transferred from one party (the purchaser of credit protection) to another party (the seller of credit protection). The seller of credit protection is required to make payments to the purchaser of credit protection if the underlying borrower defaults on the related interest rate contract. The Company may enter into protection sold or protection purchased RPAs.Credit risk on RPAs is managed by monitoring the credit worthiness of the borrowers and the institutional counterparties, which is a part of the Company’s normal credit review and monitoring process. The majority of theAll referenced entities of the protection sold RPAs were investment grade and the weighted-average remaining maturity was 2.5 years and 2.4 years, as of both SeptemberJune 30, 20222023 and December 31, 2021.2022, respectively. Assuming that the underlying borrowers referenced in the interest rate contracts defaulted, the Company would not have any current exposure in the protection sold RPAs there would be no maximum exposure as of Septemberboth June 30, 2022 and $3.2 million of maximum exposure as of December 31, 2021. The weighted-average remaining maturities of the outstanding protection sold RPAs were 2.7 years and 3.2 years as of September 30, 20222023 and December 31, 2021, respectively.
2022. The notional amount of theCompany did not have any outstanding protection purchased RPAs reflects the Company’s pro-rata share of the derivative instrument. The following table presents the notional amounts and the gross fair values of RPAs sold outstanding as of Septemberboth June 30, 20222023 and December 31, 2021:
| | | | | | | | | | | | | | | | | | | | | | | | | | | | | | | | | | | | | | |
|
| ($ in thousands) | | September 30, 2022 | | December 31, 2021 |
| Notional
Amount | | Fair Value | | Notional
Amount | | Fair Value |
| | Assets | | Liabilities | | | Assets | | Liabilities |
RPAs — protection sold | | $ | 141,549 | | | $ | — | | | $ | 27 | | | $ | 72,560 | | | $ | — | | | $ | 141 | |
| | | | | | | | | | | | |
| | | | | | | | | | | | |
|
Equity Contracts — From time to time, asAs part of the Company’s loan origination process, the Company obtainsmay obtain warrants to purchase preferred and/or common stock of the borrowers’ companies, which are mainly in the technology and life science companies to which it provides loans.sciences sectors. Warrants grant the Company the right to buy a certain class of the underlying company’s equity at a certain price before expiration. The Company held warrants in one public company and 13 private companies as of September 30, 2022, and held warrants in one public company and 12 private companies as of December 31, 2021. The total fair value of the warrants held was $346 thousand and $220 thousand as of September 30, 2022 and December 31, 2021, respectively.
Commodity Contracts — The Company enters into energy commodity contracts in the form of swaps and options with its commercial loan customers, to allow them to hedge against the risk of energy commodity price fluctuation. To economically hedge against the risk and exposure of commodity price fluctuation in the products offered to its commercial loan customers, the Company enters into offsetting commodity contracts with third-party financial institutions, including central clearing organizations.
The following tables present the notional amounts and fair values of the commodity derivative positions outstanding as of September 30, 2022 and December 31, 2021:
| | | | | | | | | | | | | | | | | | | | | | | | | | | | | | | | | | | | | | | | | | | | | | | | | | | | | | | | |
|
| ($ and units in thousands) | | September 30, 2022 |
| Customer Counterparty | | ($ and units in thousands) | | Financial Counterparty |
| Notional
Unit | | Fair Value | | | Notional
Unit | | Fair Value |
| | Assets | | Liabilities | | | | Assets | | Liabilities |
| Crude oil: | | | | | | | | | | Crude oil: | | | | | | | | |
| Written options | | 841 | | | Barrels | | $ | 1,593 | | | $ | — | | | Purchased options | | 841 | | | Barrels | | $ | — | | | $ | 1,451 | |
| Collars | | 2,898 | | | Barrels | | 22,072 | | | 7,148 | | | Collars | | 2,903 | | | Barrels | | 2,179 | | | 20,503 | |
| Swaps | | 4,460 | | | Barrels | | 54,906 | | | 22,314 | | | Swaps | | 3,425 | | | Barrels | | 15,052 | | | 41,978 | |
| Total | | 8,199 | | | | | $ | 78,571 | | | $ | 29,462 | | | Total | | 7,169 | | | | | $ | 17,231 | | | $ | 63,932 | |
| | | | | | | | | | | | | | | | | | |
| Natural gas: | | | | | | | | | | Natural gas: | | | | | | | | |
| | | | | | | | | | | | | | | | | | |
| Collars | | 26,363 | | | MMBTUs | | $ | 28,318 | | | $ | 3,684 | | | Collars | | 26,839 | | | MMBTUs | | $ | 2,320 | | | $ | 24,916 | |
| Swaps | | 87,211 | | | MMBTUs | | 216,050 | | | 73,012 | | | Swaps | | 70,817 | | | MMBTUs | | 26,656 | | | 155,192 | |
| Total | | 113,574 | | | | | $ | 244,368 | | | $ | 76,696 | | | Total | | 97,656 | | | | | $ | 28,976 | | | $ | 180,108 | |
| | | | | | | | | | | | | | | | | | |
| Total | | | | | | $ | 322,939 | | | $ | 106,158 | | | Total | | | | | | $ | 46,207 | | | $ | 244,040 | |
|
| | | | | | | | | | | | | | | | | | | | | | | | | | | | | | | | | | | | | | | | | | | | | | | | | | | | | | | | |
|
| ($ and units in thousands) | | December 31, 2021 |
| Customer Counterparty | | ($ and units in thousands) | | Financial Counterparty |
| Notional
Unit | | Fair Value | | | Notional
Unit | | Fair Value |
| | Assets | | Liabilities | | | | Assets | | Liabilities |
| Crude oil: | | | | | | | | | | Crude oil: | | | | | | | | |
| Written options | | — | | | Barrels | | $ | 87 | | | $ | — | | | Purchased options | | — | | | Barrels | | $ | — | | | $ | 81 | |
| Collars | | 2,837 | | | Barrels | | 33,826 | | | 106 | | | Collars | | 2,888 | | | Barrels | | — | | | 33,399 | |
| Swaps | | 4,682 | | | Barrels | | 71,242 | | | 60 | | | Swaps | | 7,517 | | | Barrels | | 27,524 | | | 82,723 | |
| Total | | 7,519 | | | | | $ | 105,155 | | | $ | 166 | | | Total | | 10,405 | | | | | $ | 27,524 | | | $ | 116,203 | |
| | | | | | | | | | | | | | | | | | |
| Natural gas: | | | | | | | | | | Natural gas: | | | | | | | | |
| | | | | | | | | | | | | | | | | | |
| Collars | | 24,315 | | | MMBTUs | | $ | 10,903 | | | $ | 458 | | | Collars | | 25,929 | | | MMBTUs | | $ | 1,136 | | | $ | 10,936 | |
| Swaps | | 58,959 | | | MMBTUs | | 49,188 | | | 3,775 | | | Swaps | | 109,567 | | | MMBTUs | | 28,803 | | | 63,029 | |
| Total | | 83,274 | | | | | $ | 60,091 | | | $ | 4,233 | | | Total | | 135,496 | | | | | $ | 29,939 | | | $ | 73,965 | |
| | | | | | | | | | | | | | | | | | |
| Total | | | | | | $ | 165,246 | | | $ | 4,399 | | | Total | | | | | | $ | 57,463 | | | $ | 190,168 | |
|
As of September 30, 2022, the notional amounts that cleared through the Chicago Mercantile Exchange (“CME”) totaled 773 thousand barrels of crude oil and 5,530 thousand MMBTUs of natural gas. Applying the variation margin payments as settlement to the CME-cleared derivative transactions resulted in a reduction to the gross derivative asset fair value of $6.7 million and a reduction to the liability fair value of $21.4 million as of September 30, 2022. In comparison, the notional amounts that cleared through CME totaled 1,036 thousand barrels of crude oil and 11,490 thousand MMBTUs of natural gas as of December 31, 2021. Applying the variation margin payments as settlement to the CME-cleared derivative transactions resulted in a reduction to the gross derivative asset fair value of $2.2 million and a reduction to the liability fair value of $25.8 million as of December 31, 2021.
The following table presents the net gains (losses) recognized on the Company’s Consolidated Statement of Income related to derivatives not designated as hedging instruments for the three and ninesix months ended SeptemberJune 30, 20222023 and 2021:2022:
| | | ($ in thousands) | | Classification on
Consolidated
Statement of Income | | Three Months Ended September 30, | | Nine Months Ended September 30, | |
| | Classification on
Consolidated
Statement of Income | | Three Months Ended June 30, | | Six Months Ended June 30, |
| ($ in thousands) | ($ in thousands) | | Classification on
Consolidated
Statement of Income | | 2022 | | 2021 | | 2022 | | 2021 | ($ in thousands) | | 2023 | | 2022 | | 2023 | | 2022 |
| | | | | | | | Derivatives not designated as hedging instruments: | | | | | | | | | | |
| Interest rate contracts | Interest rate contracts | | Interest rate contracts and other derivative income | | $ | 4,870 | | | $ | 2,467 | | | $ | 18,439 | | | $ | 11,030 | | Interest rate contracts | | Interest rate contracts and other derivative income | | $ | 1,222 | | | $ | 5,984 | | | $ | (1,261) | | | $ | 13,569 | |
| Foreign exchange contracts | Foreign exchange contracts | | Foreign exchange income | | 3,831 | | | 11,820 | | | 6,596 | | | 34,035 | | Foreign exchange contracts | | Foreign exchange income | | 19,898 | | | (4,557) | | | 30,340 | | | 2,765 | |
| Credit contracts | Credit contracts | | Interest rate contracts and other derivative income (loss) | | 50 | | | (20) | | | 114 | | | 175 | | Credit contracts | | Interest rate contracts and other derivative income | | 12 | | | (9) | | | 7 | | | 65 | |
| Equity contracts | Equity contracts | | Lending fees | | (13) | | | 3 | | | 175 | | | 388 | | Equity contracts | | Lending fees | | (14) | | | 93 | | | (60) | | | 187 | |
| Commodity contracts | Commodity contracts | | Interest rate contracts and other derivative income (loss) | | (156) | | | 32 | | | 139 | | | 13 | | Commodity contracts | | Interest rate contracts and other derivative income | | 160 | | | 344 | | | 166 | | | 295 | |
| Net gains | Net gains | | $ | 8,582 | | | $ | 14,302 | | | $ | 25,463 | | | $ | 45,641 | | Net gains | | $ | 21,278 | | | $ | 1,855 | | | $ | 29,192 | | | $ | 16,881 | |
|
Credit Risk-RelatedCredit-Risk-Related Contingent Features — TheCertain of the Company’s over-the-counter derivative contracts may contain early termination provisions that require the Company to settle any outstanding balances upon the occurrence of a specified credit risk-relatedcredit-risk-related event. Such an event primarily relates to a downgrade inof the credit rating of East West Bank to below investment grade. As of SeptemberJune 30, 2022,2023, the aggregate fair value amounts of all derivative instruments with credit risk-relatedcredit-risk-related contingent features that were in a net liability position totaled $9.8 million, in which $8.4 million of$13 thousand, and no collateral was posted to cover these positions. In comparison, as of December 31, 2021,2022, the aggregate fair value amounts of all derivative instruments with credit risk-relatedcredit-risk-related contingent features that were in a net liability position totaled $66.8$2.6 million, inof which $66.6$1.1 million of collateral was posted to cover these positions. In the event thatIf the credit rating of East West Bank had been downgraded to below investment grade, minimal additional collateralthe Company would have been required to be postedpost minimal additional collateral as of Septemberboth June 30, 20222023 and December 31, 2021.2022.
Offsetting of Derivatives
The following tables present the gross derivative asset and liability fair values, the balance sheet netting adjustments and the resulting net fair values recorded on the consolidated balance sheet,Consolidated Balance Sheet, as well as the cash and noncash collateral associated with master netting arrangements. The gross amounts of derivative assetassets and liability fair valuesliabilities are presented after the application of variation margin payments as settlements withto the fair values of contracts cleared through central counterparties,clearing organizations, where applicable. The collateral amounts in the following tables are limited to the outstanding balances of the related asset or liability, after the application of netting; therefore,liability. Therefore, instances of overcollateralizationover-collateralization are not shown:
| | | ($ in thousands) | ($ in thousands) | | As of September 30, 2022 | ($ in thousands) | | As of June 30, 2023 |
| | | | Gross Amounts Recognized (1) | | Gross Amounts Offset on the
Consolidated Balance Sheet | | Net Amounts
Presented
on the
Consolidated
Balance Sheet | | Gross Amounts Not Offset on the
Consolidated Balance Sheet | | Net Amount | | | Gross Amounts Recognized (1) | | Gross Amounts Offset on the
Consolidated Balance Sheet | | Net Amounts
Presented
on the
Consolidated
Balance Sheet | | Gross Amounts Not Offset on the
Consolidated Balance Sheet | | Net Amount |
| Master Netting Arrangements | | Cash Collateral Received (3) | | Security Collateral Received (5) | | | Master Netting Arrangements | | Cash Collateral Received (3) | | Security Collateral Received (5) | |
| Derivative assets | Derivative assets | | $ | 881,404 | | | $ | (238,606) | | | $ | (367,351) | | | $ | 275,447 | | | $ | (64,703) | | | $ | 210,744 | | Derivative assets | | $ | 765,161 | | | $ | (208,183) | | | $ | (264,245) | | | $ | 292,733 | | | $ | (258,757) | | | $ | 33,976 | |
| | | Gross Amounts Recognized (2) | | Gross Amounts Offset on the
Consolidated Balance Sheet | | Net Amounts
Presented
on the
Consolidated
Balance Sheet | | Gross Amounts Not Offset on the
Consolidated Balance Sheet | | Net Amount | | | | | | | | | | | | |
| Master Netting Arrangements | | Cash Collateral Pledged (4) | | Security Collateral Pledged (5) | | | Gross Amounts Recognized (2) | | Gross Amounts Offset on the
Consolidated Balance Sheet | | Net Amounts
Presented
on the
Consolidated
Balance Sheet | | Gross Amounts Not Offset on the
Consolidated Balance Sheet | | Net Amount |
| | | Master Netting Arrangements | | Cash Collateral Pledged (4) | | Security Collateral Pledged (5) | |
| Derivative liabilities | Derivative liabilities | | $ | 1,029,601 | | | $ | (238,606) | | | $ | (600) | | | $ | 790,395 | | | $ | (151,535) | | | $ | 638,860 | | Derivative liabilities | | $ | 811,725 | | | $ | (208,183) | | | $ | — | | | $ | 603,542 | | | $ | — | | | $ | 603,542 | |
|
| | | | | | | | | | | | | | | | | | | | | | | | | | | | | | | | | | | | | | |
|
| ($ in thousands) | | As of December 31, 2021 |
| | | | | | | | | | |
| | Gross Amounts Recognized (1) | | Gross Amounts Offset on the
Consolidated Balance Sheet | | Net Amounts
Presented
on the
Consolidated
Balance Sheet | | Gross Amounts Not Offset on the
Consolidated Balance Sheet | | Net
Amount |
| | Master Netting Arrangements | | Cash Collateral Received (3) | | | Security Collateral Received (5) | |
| Derivative assets | | $ | 484,184 | | | $ | (58,679) | | | $ | (42,274) | | | $ | 383,231 | | | $ | — | | | $ | 383,231 | |
| | Gross Amounts Recognized (2) | | Gross Amounts Offset on the Consolidated Balance Sheet | | Net Amounts
Presented
on the
Consolidated
Balance Sheet | | Gross Amounts Not Offset on the
Consolidated Balance Sheet | | Net
Amount |
| | Master Netting Arrangements | | Cash Collateral Pledged (4) | | | Security Collateral Pledged (5) | |
| Derivative liabilities | | $ | 390,171 | | | $ | (58,679) | | | $ | (174,048) | | | $ | 157,444 | | | $ | (106,598) | | | $ | 50,846 | |
|
| | | | | | | | | | | | | | | | | | | | | | | | | | | | | | | | | | | | | | |
|
| ($ in thousands) | | As of December 31, 2022 |
| | | | | | | | | | |
| | Gross Amounts Recognized (1) | | Gross Amounts Offset on the
Consolidated Balance Sheet | | Net Amounts
Presented
on the
Consolidated
Balance Sheet | | Gross Amounts Not Offset on the
Consolidated Balance Sheet | | Net Amount |
| | | Master Netting Arrangements | | Cash Collateral Received (3) | | | Security Collateral Received (5) | |
| Derivative assets | | $ | 755,328 | | | $ | (242,745) | | | $ | (372,038) | | | $ | 140,545 | | | $ | (60,567) | | | $ | 79,978 | |
| | | | | | | | | | | | |
| | Gross Amounts Recognized (2) | | Gross Amounts Offset on the Consolidated Balance Sheet | | Net Amounts
Presented
on the
Consolidated
Balance Sheet | | Gross Amounts Not Offset on the
Consolidated Balance Sheet | | Net Amount |
| | | Master Netting Arrangements | | Cash Collateral Pledged (4) | | | Security Collateral Pledged (5) | |
| Derivative liabilities | | $ | 887,264 | | | $ | (242,745) | | | $ | — | | | $ | 644,519 | | | $ | (38,438) | | | $ | 606,081 | |
|
(1)Includes $4.6$287 thousand and $2.1 million and $587 thousand of gross fair value assets with counterparties that were not subject to enforceable master netting arrangements or similar agreements as of SeptemberJune 30, 20222023 and December 31, 2021,2022, respectively.
(2)Includes $1.8 million$12 thousand and $666$566 thousand of gross fair value liabilities with counterparties that were not subject to enforceable master netting arrangements or similar agreements as of SeptemberJune 30, 20222023 and December 31, 2021,2022, respectively.
(3)Gross cash collateral received under master netting arrangements or similar agreements was $369.7$275.7 million and $47.0$384.9 million as of SeptemberJune 30, 20222023 and December 31, 2021,2022, respectively. Of the gross cash collateral received, $367.4$264.2 million and $42.3$372.0 million were used to offset against derivative asset fair valuesassets as of SeptemberJune 30, 20222023 and December 31, 2021,2022, respectively.
(4)Gross cash collateral pledged under master netting arrangements or similar agreements was $600zero and $490 thousand as of which $600 thousandJune 30, 2023 and December 31, 2022, respectively. No cash collateral was used to offset against derivative liability fair valueliabilities as of Septemberboth June 30, 2022. In comparison, gross cash collateral pledged under master netting arrangements or similar agreements was $176.5 million, of which $174.0 million were used to offset against derivative liability fair value as of2023 and December 31, 2021.2022.
(5)Represents the fair value of security collateral received andor pledged limited to derivative asset and liability fair valuesassets or liabilities that are subject to enforceable master netting arrangements or similar agreements. U.S. GAAP does not permit the netting of noncash collateral on the consolidated balance sheetConsolidated Balance Sheet but requires the disclosure of such amounts.
In addition to the amounts included in the tables above, the Company also has balance sheet netting related to resale and repurchase agreements. Refer to Note 4 — Assets Purchased under Resale Agreements and Sold under Repurchase Agreements to the Consolidated Financial Statements in this Form 10-Q for additional information. Refer to Note 3 — Fair Value Measurement and Fair Value of Financial Instruments to the Consolidated Financial Statements in this Form 10-Q for fair value measurement disclosures on derivatives.
Note 7 — Loans Receivable and Allowance for Credit Losses
The following table presents the composition of the Company’s loans held-for-investment outstanding as of SeptemberJune 30, 20222023 and December 31, 2021:2022:
| | | ($ in thousands) | ($ in thousands) | | September 30, 2022 | | December 31, 2021 | ($ in thousands) | | June 30, 2023 | | December 31, 2022 |
| Commercial: | Commercial: | | | | | Commercial: | | | | |
C&I (1) | C&I (1) | | $ | 15,625,072 | | | $ | 14,150,608 | | C&I (1) | | $ | 15,670,084 | | | $ | 15,711,095 | |
| CRE: | CRE: | | CRE: | |
| CRE | CRE | | 13,573,157 | | | 12,155,047 | | CRE | | 14,373,385 | | | 13,857,870 | |
| Multifamily residential | Multifamily residential | | 4,559,302 | | | 3,675,605 | | Multifamily residential | | 4,764,180 | | | 4,573,068 | |
| Construction and land | Construction and land | | 556,894 | | | 346,486 | | Construction and land | | 781,068 | | | 638,420 | |
| Total CRE | Total CRE | | 18,689,353 | | | 16,177,138 | | Total CRE | | 19,918,633 | | | 19,069,358 | |
| Total commercial | Total commercial | | 34,314,425 | | | 30,327,746 | | Total commercial | | 35,588,717 | | | 34,780,453 | |
| Consumer: | Consumer: | | | | | Consumer: | | | | |
| Residential mortgage: | Residential mortgage: | | Residential mortgage: | |
| Single-family residential | Single-family residential | | 10,855,345 | | | 9,093,702 | | Single-family residential | | 12,308,613 | | | 11,223,027 | |
| HELOCs | HELOCs | | 2,184,924 | | | 2,144,821 | | HELOCs | | 1,862,928 | | | 2,122,655 | |
| Total residential mortgage | Total residential mortgage | | 13,040,269 | | | 11,238,523 | | Total residential mortgage | | 14,171,541 | | | 13,345,682 | |
| Other consumer | Other consumer | | 87,561 | | | 127,512 | | Other consumer | | 68,106 | | | 76,295 | |
| Total consumer | Total consumer | | 13,127,830 | | | 11,366,035 | | Total consumer | | 14,239,647 | | | 13,421,977 | |
Total loans held-for-investment (2)(1) | Total loans held-for-investment (2)(1) | | $ | 47,442,255 | | | $ | 41,693,781 | | Total loans held-for-investment (2)(1) | | $ | 49,828,364 | | | $ | 48,202,430 | |
| Allowance for loan losses | Allowance for loan losses | | (582,517) | | | (541,579) | | Allowance for loan losses | | (635,400) | | | (595,645) | |
Loans held-for-investment, net (2)(1) | Loans held-for-investment, net (2)(1) | | $ | 46,859,738 | | | $ | 41,152,202 | | Loans held-for-investment, net (2)(1) | | $ | 49,192,964 | | | $ | 47,606,785 | |
|
(1)Includes Paycheck Protection Program loans$74.0 million and $70.4 million comprising unamortized deferred and unearned fees, net of $110.9 million and $534.2 million premiums as of SeptemberJune 30, 20222023 and December 31, 2021, respectively.
(2)Includes $(60.3) million and $(50.7) million of net deferred loan fees and net unamortized premiums as of September 30, 2022, and December 31, 2021, respectively.
Loans held-for-investment accruedAccrued interest receivable on loans held-for-investment was $165.5$229.7 million and $107.4$208.4 million as of SeptemberJune 30, 20222023 and December 31, 2021,2022, respectively, and was included in Other assets on the Consolidated Balance Sheet. The interest income reversed was insignificant for both the three and ninesix months ended SeptemberJune 30, 20222023 and 2021.2022. For the Company’s accounting policy on accrued interest receivable related to loans held-for-investment, see Note 1 — Summary of Significant Accounting Policies — Significant Accounting Policies — Loans Held-for-Investment to the Consolidated Financial Statements of the Company’s 20212022 Form 10-K. The Company also has loans held-for-sale. For the Company’s accounting policy on loans held-for-sale, refer to Note 1 — Summary of Significant Accounting Policies— Significant Accounting Policies — Loans Held-for-Sale to the Consolidated Financial Statements in the Company’s 2022 Form 10-K.
The Company’s FRBSF and FHLB borrowings are primarily secured by loans held-for-investment. Loans held-for-investment totaling $25.0134.19 billion and $27.67$28.30 billion, respectively, were pledged to secure borrowings and provide additional borrowing capacity as of SeptemberJune 30, 20222023 and December 31, 2021.2022.
Credit Quality Indicators
All loans are subject to the Company’s credit review and monitoring process. For the commercial loan portfolio, loans are risk rated based on an analysis of the borrower’s current payment performance or delinquency, repayment sources, financial and liquidity factors, including industry and geographic considerations. For the consumer loan portfolio, payment performance or delinquency is typically the driving indicator for risk ratings.
The Company utilizes internal credit risk ratings to assign each individual loan a risk rating of 1 through 10:
•Pass — loans risk rated 1 through 5 are assigned an internal risk rating category of “Pass.” Loans risk rated 1 are typically loans fully secured by cash. Pass loans have sufficient sources of repayment to repay the loan in full, in accordance with all terms and conditions.
•Special mention — loans assigned a risk rating of 6 have potential weaknesses that warrant closer attention by management; these are assigned an internal risk rating category of “Special Mention.”
•Substandard — loans assigned a risk rating of 7 or 8 have well-defined weaknesses that may jeopardize the full and timely repayment of the loan; these are assigned an internal risk rating category of “Substandard.”
•Doubtful — loans assigned a risk rating of 9 have insufficient sources of repayment and a high probability of loss; these are assigned an internal risk rating category of “Doubtful.”
•Loss — loans assigned a risk rating of 10 are uncollectible and of such little value that they are no longer considered bankable assets; these are assigned an internal risk rating category of “Loss.”
Loan exposures categorized as criticized consist of special mention, substandard, doubtful and loss categories. The Company reviews the internal risk ratings of its loan portfolio on a regular basis, and adjusts the ratings based on changes in the borrowers’ financial status and the collectability of the loans.
The following tables summarize the Company’s loans held-for-investment and current year-to-date gross write-offs by loan portfolio segments, internal risk ratings and vintage year as of September 30, 2022 and December 31, 2021.the periods presented. The vintage year is the year of loan origination, renewal or major modification. Revolving loans that are converted to term loans presented in the tables below are excluded from term loans by vintage year columns.
| | | ($ in thousands) | | September 30, 2022 | |
| Term Loans by Origination Year | | Revolving Loans | | Revolving Loans Converted to Term Loans (1) | | Total | |
| | Revolving Loans | Revolving Loans Converted to Term Loans (1) | Total | |
| | June 30, 2023 | |
| | | | Term Loans by Origination Year | | |
| | ($ in thousands) | ($ in thousands) | | 2022 | | 2021 | | 2020 | | 2019 | | 2018 | | Prior | | Revolving Loans | | Revolving Loans Converted to Term Loans (1) | | Total | ($ in thousands) | | 2023 | | 2022 | | 2021 | | 2020 | | 2019 | | Prior | | Revolving Loans | | Revolving Loans Converted to Term Loans (1) | | Total | |
| | | | | | | | | | | | | Commercial: | | | | | | | | | | | | | | | | | | | |
| C&I: | | |
| $ | 2,620,973 | | | $ | 2,422,523 | | | $ | 683,312 | | | $ | 414,503 | | | $ | 158,867 | | | $ | 118,118 | | | Pass | | $ | 1,427,799 | | | $ | 2,285,112 | | | $ | 1,610,248 | | | $ | 415,562 | | | $ | 267,164 | | | $ | 217,673 | | | $ | 9,016,889 | | | $ | 20,345 | | | $ | 15,260,792 | | |
| 38,538 | | | 51,206 | | | 62,356 | | | 45,068 | | | 21,776 | | | 17,115 | | | Criticized (accrual) | | 18,452 | | | 93,118 | | | 81,361 | | | 26,033 | | | 26,027 | | | 22,837 | | | 79,585 | | | — | | | 347,413 | | |
| 16,039 | | | 3,250 | | | 11,174 | | | — | | | 5,622 | | | 11,903 | | | — | | | — | | | 47,988 | | Criticized (nonaccrual) | | 2,657 | | | 22,800 | | | 1,773 | | | 8,987 | | | 7,798 | | | 12,697 | | | 5,167 | | | — | | | 61,879 | | |
| | Total C&I | Total C&I | | 2,675,550 | | | 2,476,979 | | | 756,842 | | | 459,571 | | | 186,265 | | | 147,136 | | | 8,894,397 | | | 28,332 | | | 15,625,072 | | Total C&I | | 1,448,908 | | | 2,401,030 | | | 1,693,382 | | | 450,582 | | | 300,989 | | | 253,207 | | | 9,101,641 | | | 20,345 | | | 15,670,084 | | |
| YTD gross write-offs (3) | | YTD gross write-offs (3) | | 185 | | | 1,996 | | | 95 | | | 15 | | | 4,930 | | | 1,683 | | | — | | | — | | | 8,904 | | |
| | CRE: | CRE: | | | | | | | | | | | | | | | | | | | CRE: | | |
| | Pass | Pass | | 3,431,039 | | | 2,447,553 | | | 1,640,819 | | | 1,856,673 | | | 1,505,134 | | | 2,098,417 | | | 149,902 | | | 14,425 | | | 13,143,962 | | Pass | | 1,358,049 | | | 4,119,439 | | | 2,323,453 | | | 1,481,659 | | | 1,689,335 | | | 2,936,955 | | | 111,043 | | | 53,747 | | | 14,073,680 | | |
| Criticized (accrual) | Criticized (accrual) | | 1,324 | | | 111,024 | | | 124,132 | | | 38,478 | | | 91,981 | | | 33,005 | | | 1,455 | | | 16,761 | | | 418,160 | | Criticized (accrual) | | 36,966 | | | 2,757 | | | 23,746 | | | 68,936 | | | 37,981 | | | 111,969 | | | 1,455 | | | — | | | 283,810 | | |
| Criticized (nonaccrual) | Criticized (nonaccrual) | | — | | | 4,126 | | | — | | | — | | | — | | | 6,909 | | | — | | | — | | | 11,035 | | Criticized (nonaccrual) | | — | | | 171 | | | 15,099 | | | — | | | 460 | | | 165 | | | — | | | — | | | 15,895 | | |
| | Subtotal CRE | Subtotal CRE | | 3,432,363 | | | 2,562,703 | | | 1,764,951 | | | 1,895,151 | | | 1,597,115 | | | 2,138,331 | | | 151,357 | | | 31,186 | | | 13,573,157 | | Subtotal CRE | | 1,395,015 | | | 4,122,367 | | | 2,362,298 | | | 1,550,595 | | | 1,727,776 | | | 3,049,089 | | | 112,498 | | | 53,747 | | | 14,373,385 | | |
| | YTD gross write-offs | | YTD gross write-offs | | — | | | — | | | 2,253 | | | — | | | — | | | 119 | | | — | | | — | | | 2,372 | | |
| | Multifamily residential: | Multifamily residential: | | | | | | | | | | | | | | | | | | | Multifamily residential: | | |
| Pass | Pass | | 1,365,406 | | | 933,013 | | | 659,063 | | | 555,270 | | | 364,552 | | | 635,396 | | | 10,417 | | | — | | | 4,523,117 | | Pass | | 289,218 | | | 1,497,280 | | | 875,986 | | | 625,489 | | | 507,401 | | | 926,253 | | | 9,425 | | | 1,295 | | | 4,732,347 | | |
| Criticized (accrual) | Criticized (accrual) | | — | | | — | | | — | | | 711 | | | — | | | 35,300 | | | — | | | — | | | 36,011 | | Criticized (accrual) | | — | | | — | | | — | | | — | | | 700 | | | 26,430 | | | — | | | — | | | 27,130 | | |
| Criticized (nonaccrual) | Criticized (nonaccrual) | | — | | | — | | | — | | | — | | | — | | | 174 | | | — | | | — | | | 174 | | Criticized (nonaccrual) | | — | | | — | | | — | | | — | | | — | | | 4,703 | | | — | | | — | | | 4,703 | | |
| | Subtotal multifamily residential | Subtotal multifamily residential | | 1,365,406 | | | 933,013 | | | 659,063 | | | 555,981 | | | 364,552 | | | 670,870 | | | 10,417 | | | — | | | 4,559,302 | | Subtotal multifamily residential | | 289,218 | | | 1,497,280 | | | 875,986 | | | 625,489 | | | 508,101 | | | 957,386 | | | 9,425 | | | 1,295 | | | 4,764,180 | | |
| | | Construction and land: | Construction and land: | | | | | | | | | | | | | | | | | | | Construction and land: | | |
| Pass | Pass | | 151,429 | | | 254,059 | | | 61,231 | | | 60,919 | | | 2,784 | | | 233 | | | — | | | — | | | 530,655 | | Pass | | 85,733 | | | 355,949 | | | 259,113 | | | 34,103 | | | 816 | | | 2,986 | | | 14,952 | | | — | | | 753,652 | | |
| Criticized (accrual) | Criticized (accrual) | | — | | | — | | | 4,477 | | | — | | | 21,762 | | | — | | | — | | | — | | | 26,239 | | Criticized (accrual) | | 5,865 | | | — | | | — | | | — | | | — | | | 21,551 | | | — | | | — | | | 27,416 | | |
| Criticized (nonaccrual) | | — | | | — | | | — | | | — | | | — | | | — | | | — | | | — | | | — | | |
| | Subtotal construction and land | Subtotal construction and land | | 151,429 | | | 254,059 | | | 65,708 | | | 60,919 | | | 24,546 | | | 233 | | | — | | | — | | | 556,894 | | Subtotal construction and land | | 91,598 | | | 355,949 | | | 259,113 | | | 34,103 | | | 816 | | | 24,537 | | | 14,952 | | | — | | | 781,068 | | |
| Total CRE | | 4,949,198 | | | 3,749,775 | | | 2,489,722 | | | 2,512,051 | | | 1,986,213 | | | 2,809,434 | | | 161,774 | | | 31,186 | | | 18,689,353 | | |
| Total commercial | | 7,624,748 | | | 6,226,754 | | | 3,246,564 | | | 2,971,622 | | | 2,172,478 | | | 2,956,570 | | | 9,056,171 | | | 59,518 | | | 34,314,425 | | |
| Consumer: | | | | | | | | | | | | | | | | | | | |
| Residential mortgage: | | |
| Single-family residential: | | |
Pass (2) | | 2,989,092 | | | 2,487,082 | | | 1,824,666 | | | 1,134,087 | | | 841,743 | | | 1,559,127 | | | — | | | — | | | 10,835,797 | | |
| Criticized (accrual) | | 142 | | | 1,568 | | | 394 | | | 1,784 | | | 2,888 | | | 1,247 | | | — | | | — | | | 8,023 | | |
Criticized (nonaccrual) (2) | | — | | | — | | | 203 | | | 2,327 | | | 3,639 | | | 5,356 | | | — | | | — | | | 11,525 | | |
| Subtotal single-family residential mortgage | | 2,989,234 | | | 2,488,650 | | | 1,825,263 | | | 1,138,198 | | | 848,270 | | | 1,565,730 | | | — | | | — | | | 10,855,345 | | |
| HELOCs: | | | | | | | | | | | | | | | | | | | |
| Pass | | — | | | 1,735 | | | 2,278 | | | 1,778 | | | 748 | | | 9,683 | | | 2,012,190 | | | 144,021 | | | 2,172,433 | | |
| Criticized (accrual) | | — | | | — | | | — | | | — | | | — | | | 774 | | | 230 | | | 919 | | | 1,923 | | |
| Criticized (nonaccrual) | | — | | | — | | | 2,910 | | | — | | | 1,017 | | | 3,011 | | | 300 | | | 3,330 | | | 10,568 | | |
| Subtotal HELOCs | | — | | | 1,735 | | | 5,188 | | | 1,778 | | | 1,765 | | | 13,468 | | | 2,012,720 | | | 148,270 | | | 2,184,924 | | |
| Total residential mortgage | | 2,989,234 | | | 2,490,385 | | | 1,830,451 | | | 1,139,976 | | | 850,035 | | | 1,579,198 | | | 2,012,720 | | | 148,270 | | | 13,040,269 | | |
| Other consumer: | | | | | | | | | | | | | | | | | | | |
| Pass | | 15,613 | | | 57 | | | 5,259 | | | — | | | — | | | 15,170 | | | 51,425 | | | — | | | 87,524 | | |
| Criticized (accrual) | | — | | | — | | | — | | | — | | | — | | | — | | | — | | | — | | | — | | |
| Criticized (nonaccrual) | | — | | | — | | | — | | | — | | | — | | | — | | | 37 | | | — | | | 37 | | |
| Total other consumer | | 15,613 | | | 57 | | | 5,259 | | | — | | | — | | | 15,170 | | | 51,462 | | | — | | | 87,561 | | |
| Total consumer | | 3,004,847 | | | 2,490,442 | | | 1,835,710 | | | 1,139,976 | | | 850,035 | | | 1,594,368 | | | 2,064,182 | | | 148,270 | | | 13,127,830 | | |
| Total by Risk Rating: | | | | | | | | | | | | | | | | | | | |
| Pass | | 10,573,552 | | | 8,546,022 | | | 4,876,628 | | | 4,023,230 | | | 2,873,828 | | | 4,436,144 | | | 11,020,867 | | | 186,778 | | | 46,537,049 | | |
| Criticized (accrual) | | 40,004 | | | 163,798 | | | 191,359 | | | 86,041 | | | 138,407 | | | 87,441 | | | 99,149 | | | 17,680 | | | 823,879 | | |
| Criticized (nonaccrual) | | 16,039 | | | 7,376 | | | 14,287 | | | 2,327 | | | 10,278 | | | 27,353 | | | 337 | | | 3,330 | | | 81,327 | | |
| | Total | | $ | 10,629,595 | | | $ | 8,717,196 | | | $ | 5,082,274 | | | $ | 4,111,598 | | | $ | 3,022,513 | | | $ | 4,550,938 | | | $ | 11,120,353 | | | $ | 207,788 | | | $ | 47,442,255 | | |
| Total CRE | | Total CRE | | 1,775,831 | | | 5,975,596 | | | 3,497,397 | | | 2,210,187 | | | 2,236,693 | | | 4,031,012 | | | 136,875 | | | 55,042 | | | 19,918,633 | | |
| YTD gross write-offs | | YTD gross write-offs | | — | | | — | | | 2,253 | | | — | | | — | | | 119 | | | — | | | — | | | 2,372 | | |
| | Total commercial | | Total commercial | | $ | 3,224,739 | | | $ | 8,376,626 | | | $ | 5,190,779 | | | $ | 2,660,769 | | | $ | 2,537,682 | | | $ | 4,284,219 | | | $ | 9,238,516 | | | $ | 75,387 | | | $ | 35,588,717 | | |
| YTD total commercial gross write-offs (3) | | YTD total commercial gross write-offs (3) | | $ | 185 | | | $ | 1,996 | | | $ | 2,348 | | | $ | 15 | | | $ | 4,930 | | | $ | 1,802 | | | $ | — | | | $ | — | | | $ | 11,276 | | |
| | |
| | | | June 30, 2023 | |
| | | | | Term Loans by Origination Year | | |
| ($ in thousands) | ($ in thousands) | | December 31, 2021 | ($ in thousands) | | 2023 | | 2022 | | 2021 | | 2020 | | 2019 | | Prior | | Revolving Loans | | Revolving Loans Converted to Term Loans (1) | | Total | |
| Term Loans by Origination Year | | Revolving Loans | | Revolving Loans Converted to Term Loans (1) | | Total | |
| | Revolving Loans | Revolving Loans Converted to Term Loans (1) | Total | |
| 2021 | | 2020 | | 2017 | | Prior | | |
| Commercial: | | | | | | | | | | | | | | | |
| C&I: | | |
| Pass | | $ | 3,911,722 | | | $ | 1,133,085 | | | $ | 132,392 | | | $ | 225,326 | | | $ | 7,383,485 | | | $ | 28,842 | | | $ | 13,631,054 | | |
| Criticized (accrual) | | 85,036 | | | 117,357 | | | 72,277 | | | 51,553 | | | 15,136 | | | 4,005 | | | 115,167 | | | — | | | 460,531 | | |
| Criticized (nonaccrual) | | 29,456 | | | 2,792 | | | 513 | | | 517 | | | 9,301 | | | 16,444 | | | — | | | — | | | 59,023 | | |
| | Total C&I | | 4,026,214 | | | 1,253,234 | | | 701,797 | | | 239,265 | | | 156,829 | | | 245,775 | | | 7,498,652 | | | 28,842 | | | 14,150,608 | | |
| | CRE: | | | | | | | | | | | | | | | | | | | |
| Pass | | 2,792,193 | | | 2,090,503 | | | 2,230,520 | | | 1,863,481 | | | 1,120,682 | | | 1,727,862 | | | 128,668 | | | 6,389 | | | 11,960,298 | | |
| Criticized (accrual) | | 71,055 | | | 3,200 | | | 9,176 | | | 21,077 | | | 24,851 | | | 55,892 | | | — | | | — | | | 185,251 | | |
| Criticized (nonaccrual) | | 4,350 | | | — | | | — | | | — | | | 4,752 | | | 396 | | | — | | | — | | | 9,498 | | |
| | Subtotal CRE | | 2,867,598 | | | 2,093,703 | | | 2,239,696 | | | 1,884,558 | | | 1,150,285 | | | 1,784,150 | | | 128,668 | | | 6,389 | | | 12,155,047 | | |
| Multifamily residential: | | | | | | | | | | | | | | | | | | | |
| Pass | | 1,026,295 | | | 726,772 | | | 688,453 | | | 419,319 | | | 308,087 | | | 424,947 | | | 20,524 | | | — | | | 3,614,397 | | |
| Criticized (accrual) | | — | | | — | | | 721 | | | 22,344 | | | 7,033 | | | 30,666 | | | — | | | — | | | 60,764 | | |
| Criticized (nonaccrual) | | — | | | — | | | — | | | — | | | — | | | 444 | | | — | | | — | | | 444 | | |
| | Subtotal multifamily residential | | 1,026,295 | | | 726,772 | | | 689,174 | | | 441,663 | | | 315,120 | | | 456,057 | | | 20,524 | | | — | | | 3,675,605 | | |
| Construction and land: | | | | | | | | | | | | | | | | | | | |
| Pass | | 122,983 | | | 103,743 | | | 90,544 | | | 3,412 | | | — | | | 391 | | | — | | | — | | | 321,073 | | |
| Criticized (accrual) | | 3,355 | | | — | | | — | | | 22,058 | | | — | | | — | | | — | | | — | | | 25,413 | | |
| Criticized (nonaccrual) | | — | | | — | | | — | | | — | | | — | | | — | | | — | | | — | | | — | | |
| Subtotal construction and land | | 126,338 | | | 103,743 | | | 90,544 | | | 25,470 | | | — | | | 391 | | | — | | | — | | | 346,486 | | |
| Total CRE | | 4,020,231 | | | 2,924,218 | | | 3,019,414 | | | 2,351,691 | | | 1,465,405 | | | 2,240,598 | | | 149,192 | | | 6,389 | | | 16,177,138 | | |
| Total commercial | | 8,046,445 | | | 4,177,452 | | | 3,721,211 | | | 2,590,956 | | | 1,622,234 | | | 2,486,373 | | | 7,647,844 | | | 35,231 | | | 30,327,746 | | |
| Consumer: | Consumer: | | | | | | | | | | | | | | | | | | | Consumer: | | | | | | | | | | | | | | | | | | | |
| Residential mortgage: | Residential mortgage: | | Residential mortgage: | | |
| Single-family residential: | Single-family residential: | | Single-family residential: | | |
Pass (2) | Pass (2) | | 2,616,958 | | | 2,108,370 | | | 1,375,929 | | | 1,079,030 | | | 763,351 | | | 1,127,516 | | | — | | | — | | | 9,071,154 | | Pass (2) | | $ | 1,585,454 | | | $ | 3,445,517 | | | $ | 2,369,777 | | | $ | 1,680,587 | | | $ | 1,044,089 | | | $ | 2,152,061 | | | $ | — | | | $ | — | | | $ | 12,277,485 | | |
| Criticized (accrual) | Criticized (accrual) | | — | | | — | | | 458 | | | 2,813 | | | 1,899 | | | 3,212 | | | — | | | — | | | 8,382 | | Criticized (accrual) | | 547 | | | 574 | | | 934 | | | 1,708 | | | 471 | | | 5,647 | | | — | | | — | | | 9,881 | | |
Criticized (nonaccrual) (2) | Criticized (nonaccrual) (2) | | — | | | — | | | 1,751 | | | 3,889 | | | 4,295 | | | 4,231 | | | — | | | — | | | 14,166 | | Criticized (nonaccrual) (2) | | 1,470 | | | 138 | | | 1,103 | | | 2,432 | | | 3,581 | | | 12,523 | | | — | | | — | | | 21,247 | | |
| Subtotal single-family residential mortgage | Subtotal single-family residential mortgage | | 2,616,958 | | | 2,108,370 | | | 1,378,138 | | | 1,085,732 | | | 769,545 | | | 1,134,959 | | | — | | | — | | | 9,093,702 | | Subtotal single-family residential mortgage | | 1,587,471 | | | 3,446,229 | | | 2,371,814 | | | 1,684,727 | | | 1,048,141 | | | 2,170,231 | | | — | | | — | | | 12,308,613 | | |
| | | HELOCs: | HELOCs: | | | | | | | | | | | | | | | | | | | HELOCs: | | |
| Pass | Pass | | 648 | | | 3,277 | | | 4,644 | | | 1,347 | | | 3,268 | | | 11,215 | | | 1,913,478 | | | 197,414 | | | 2,135,291 | | Pass | | 978 | | | 751 | | | 1,793 | | | 6,004 | | | 2,033 | | | 12,007 | | | 1,711,411 | | | 115,557 | | | 1,850,534 | | |
| Criticized (accrual) | Criticized (accrual) | | — | | | — | | | — | | | — | | | — | | | 371 | | | 7 | | | 708 | | | 1,086 | | Criticized (accrual) | | — | | | 801 | | | 208 | | | — | | | — | | | — | | | 232 | | | 102 | | | 1,343 | | |
| Criticized (nonaccrual) | Criticized (nonaccrual) | | — | | | — | | | 52 | | | 188 | | | 3,543 | | | 973 | | | — | | | 3,688 | | | 8,444 | | Criticized (nonaccrual) | | — | | | — | | | 223 | | | 835 | | | — | | | 5,022 | | | 704 | | | 4,267 | | | 11,051 | | |
| Subtotal HELOCs | Subtotal HELOCs | | 648 | | | 3,277 | | | 4,696 | | | 1,535 | | | 6,811 | | | 12,559 | | | 1,913,485 | | | 201,810 | | | 2,144,821 | | Subtotal HELOCs | | 978 | | | 1,552 | | | 2,224 | | | 6,839 | | | 2,033 | | | 17,029 | | | 1,712,347 | | | 119,926 | | | 1,862,928 | | |
| Subtotal residential mortgage | | 2,617,606 | | | 2,111,647 | | | 1,382,834 | | | 1,087,267 | | | 776,356 | | | 1,147,518 | | | 1,913,485 | | | 201,810 | | | 11,238,523 | | |
YTD gross write-offs (3) | | YTD gross write-offs (3) | | — | | | — | | | — | | | — | | | — | | | — | | | — | | | 6 | | | 6 | | |
| | Total residential mortgage | | Total residential mortgage | | 1,588,449 | | | 3,447,781 | | | 2,374,038 | | | 1,691,566 | | | 1,050,174 | | | 2,187,260 | | | 1,712,347 | | | 119,926 | | | 14,171,541 | | |
YTD gross write-offs (3) | | YTD gross write-offs (3) | | — | | | — | | | — | | | — | | | — | | | — | | | — | | | 6 | | | 6 | | |
| | Other consumer: | Other consumer: | | | | | | | | | | | | | | | | | | | Other consumer: | | |
| Pass | Pass | | 16,831 | | | 5,258 | | | — | | | — | | | 1,741 | | | 52,147 | | | 51,481 | | | — | | | 127,458 | | Pass | | 885 | | | 16,824 | | | 136 | | | 5,356 | | | — | | | 11,810 | | | 33,071 | | | — | | | 68,082 | | |
| Criticized (accrual) | | 2 | | | — | | | — | | | — | | | — | | | — | | | — | | | — | | | 2 | | |
| | Criticized (nonaccrual) | Criticized (nonaccrual) | | — | | | — | | | — | | | — | | | — | | | — | | | 52 | | | — | | | 52 | | Criticized (nonaccrual) | | — | | | — | | | — | | | — | | | — | | | — | | | 24 | | | — | | | 24 | | |
| Total other consumer | Total other consumer | | 16,833 | | | 5,258 | | | — | | | — | | | 1,741 | | | 52,147 | | | 51,533 | | | — | | | 127,512 | | Total other consumer | | 885 | | | 16,824 | | | 136 | | | 5,356 | | | — | | | 11,810 | | | 33,095 | | | — | | | 68,106 | | |
| YTD gross write-offs | | YTD gross write-offs | | — | | | — | | | — | | | — | | | — | | | — | | | 88 | | | — | | | 88 | | |
| | Total consumer | Total consumer | | 2,634,439 | | | 2,116,905 | | | 1,382,834 | | | 1,087,267 | | | 778,097 | | | 1,199,665 | | | 1,965,018 | | | 201,810 | | | 11,366,035 | | Total consumer | | $ | 1,589,334 | | | $ | 3,464,605 | | | $ | 2,374,174 | | | $ | 1,696,922 | | | $ | 1,050,174 | | | $ | 2,199,070 | | | $ | 1,745,442 | | | $ | 119,926 | | | $ | 14,239,647 | | |
| Total by Risk Rating: | | | | | | | | | | | | | | | | | | | |
YTD total consumer gross write-offs (3) | | YTD total consumer gross write-offs (3) | | $ | — | | | $ | — | | | $ | — | | | $ | — | | | $ | — | | | $ | — | | | $ | 88 | | | $ | 6 | | | $ | 94 | | |
| | Total loans held-for-investment: | | Total loans held-for-investment: | | |
| Pass | Pass | | 10,487,630 | | | 6,171,008 | | | 5,019,097 | | | 3,553,784 | | | 2,329,521 | | | 3,569,404 | | | 9,497,636 | | | 232,645 | | | 40,860,725 | | Pass | | $ | 4,748,116 | | | $ | 11,720,872 | | | $ | 7,440,506 | | | $ | 4,248,760 | | | $ | 3,510,838 | | | $ | 6,259,745 | | | $ | 10,896,791 | | | $ | 190,944 | | | $ | 49,016,572 | | |
| Criticized (accrual) | Criticized (accrual) | | 159,448 | | | 120,557 | | | 82,632 | | | 119,845 | | | 48,919 | | | 94,146 | | | 115,174 | | | 708 | | | 741,429 | | Criticized (accrual) | | 61,830 | | | 97,250 | | | 106,249 | | | 96,677 | | | 65,179 | | | 188,434 | | | 81,272 | | | 102 | | | 696,993 | | |
| Criticized (nonaccrual) | Criticized (nonaccrual) | | 33,806 | | | 2,792 | | | 2,316 | | | 4,594 | | | 21,891 | | | 22,488 | | | 52 | | | 3,688 | | | 91,627 | | Criticized (nonaccrual) | | 4,127 | | | 23,109 | | | 18,198 | | | 12,254 | | | 11,839 | | | 35,110 | | | 5,895 | | | 4,267 | | | 114,799 | | |
| | Total | Total | | $ | 10,680,884 | | | $ | 6,294,357 | | | $ | 5,104,045 | | | $ | 3,678,223 | | | $ | 2,400,331 | | | $ | 3,686,038 | | | $ | 9,612,862 | | | $ | 237,041 | | | $ | 41,693,781 | | Total | | $ | 4,814,073 | | | $ | 11,841,231 | | | $ | 7,564,953 | | | $ | 4,357,691 | | | $ | 3,587,856 | | | $ | 6,483,289 | | | $ | 10,983,958 | | | $ | 195,313 | | | $ | 49,828,364 | | |
YTD total loans held-for-investment gross write-offs (3) | | YTD total loans held-for-investment gross write-offs (3) | | $ | 185 | | | $ | 1,996 | | | $ | 2,348 | | | $ | 15 | | | $ | 4,930 | | | $ | 1,802 | | | $ | 88 | | | $ | 6 | | | $ | 11,370 | | |
|
| | | | | | | | | | | | | | | | | | | | | | | | | | | | | | | | | | | | | | | | | | | | | | | | | | | | | | | | |
|
| | December 31, 2022 |
| | | | | | | | | | | | | | | | | | |
| | | | | | | | | | | | | | | | | | |
| | Term Loans by Origination Year | | | | | | |
| | | | | | | | |
| ($ in thousands) | | 2022 | | 2021 | | 2020 | | 2019 | | 2018 | | Prior | | Revolving Loans | | Revolving Loans Converted to Term Loans (1) | | Total |
| Commercial: | | | | | | | | | | | | | | | | | | |
| C&I: | | | | | | | | | | | | | | | | | | |
| Pass | | $ | 2,831,834 | | | $ | 2,053,215 | | | $ | 623,026 | | | $ | 392,013 | | | $ | 143,970 | | | $ | 97,605 | | | $ | 9,177,401 | | | $ | 20,548 | | | $ | 15,339,612 | |
| Criticized (accrual) | | 72,210 | | | 34,296 | | | 48,761 | | | 34,221 | | | 20,646 | | | 12,933 | | | 97,988 | | | — | | | 321,055 | |
| Criticized (nonaccrual) | | 18,722 | | | 4,797 | | | 10,733 | | | 243 | | | 5,618 | | | 10,315 | | | — | | | — | | | 50,428 | |
| | | | | | | | | | | | | | | | | | |
| | | | | | | | | | | | | | | | | | |
| Total C&I | | 2,922,766 | | | 2,092,308 | | | 682,520 | | | 426,477 | | | 170,234 | | | 120,853 | | | 9,275,389 | | | 20,548 | | | 15,711,095 | |
| | | | | | | | | | | | | | | | | | |
| CRE: | | | | | | | | | | | | | | | | | | |
| Pass | | 4,178,780 | | | 2,404,634 | | | 1,505,150 | | | 1,771,679 | | | 1,471,710 | | | 1,909,925 | | | 165,653 | | | 22,009 | | | 13,429,540 | |
| Criticized (accrual) | | 3,518 | | | 60,573 | | | 159,424 | | | 40,095 | | | 91,132 | | | 32,173 | | | 1,455 | | | 16,716 | | | 405,086 | |
| Criticized (nonaccrual) | | — | | | 19,044 | | | — | | | — | | | — | | | 4,200 | | | — | | | — | | | 23,244 | |
| | | | | | | | | | | | | | | | | | |
| | | | | | | | | | | | | | | | | | |
| Subtotal CRE | | 4,182,298 | | | 2,484,251 | | | 1,664,574 | | | 1,811,774 | | | 1,562,842 | | | 1,946,298 | | | 167,108 | | | 38,725 | | | 13,857,870 | |
| Multifamily residential: | | | | | | | | | | | | | | | | | | |
| Pass | | 1,500,289 | | | 892,598 | | | 641,677 | | | 519,614 | | | 350,044 | | | 625,293 | | | 11,325 | | | — | | | 4,540,840 | |
| Criticized (accrual) | | — | | | — | | | — | | | 707 | | | 4,276 | | | 27,076 | | | — | | | — | | | 32,059 | |
| Criticized (nonaccrual) | | — | | | — | | | — | | | — | | | — | | | 169 | | | — | | | — | | | 169 | |
| | | | | | | | | | | | | | | | | | |
| | | | | | | | | | | | | | | | | | |
| Subtotal multifamily residential | | 1,500,289 | | | 892,598 | | | 641,677 | | | 520,321 | | | 354,320 | | | 652,538 | | | 11,325 | | | — | | | 4,573,068 | |
| Construction and land: | | | | | | | | | | | | | | | | | | |
| Pass | | 288,394 | | | 276,839 | | | 31,804 | | | 3,104 | | | 2,805 | | | 231 | | | 9,073 | | | — | | | 612,250 | |
| Criticized (accrual) | | 4,504 | | | — | | | — | | | — | | | 21,666 | | | — | | | — | | | — | | | 26,170 | |
| | | | | | | | | | | | | | | | | | |
| Subtotal construction and land | | 292,898 | | | 276,839 | | | 31,804 | | | 3,104 | | | 24,471 | | | 231 | | | 9,073 | | | — | | | 638,420 | |
| Total CRE | | 5,975,485 | | | 3,653,688 | | | 2,338,055 | | | 2,335,199 | | | 1,941,633 | | | 2,599,067 | | | 187,506 | | | 38,725 | | | 19,069,358 | |
| Total commercial | | $ | 8,898,251 | | | $ | 5,745,996 | | | $ | 3,020,575 | | | $ | 2,761,676 | | | $ | 2,111,867 | | | $ | 2,719,920 | | | $ | 9,462,895 | | | $ | 59,273 | | | $ | 34,780,453 | |
| Consumer: | | | | | | | | | | | | | | | | | | |
| Residential mortgage: | | | | | | | | | | | | | | | | | | |
| Single-family residential: | | | | | | | | | | | | | | | | | | |
Pass (2) | | $ | 3,548,894 | | | $ | 2,453,717 | | | $ | 1,775,696 | | | $ | 1,101,965 | | | $ | 817,164 | | | $ | 1,500,359 | | | $ | — | | | $ | — | | | $ | 11,197,795 | |
| Criticized (accrual) | | — | | | 1,275 | | | 785 | | | 1,463 | | | 4,352 | | | 3,935 | | | — | | | — | | | 11,810 | |
Criticized (nonaccrual) (2) | | 141 | | | — | | | 204 | | | 3,202 | | | 1,721 | | | 8,154 | | | — | | | — | | | 13,422 | |
| Subtotal single-family residential mortgage | | 3,549,035 | | | 2,454,992 | | | 1,776,685 | | | 1,106,630 | | | 823,237 | | | 1,512,448 | | | — | | | — | | | 11,223,027 | |
| HELOCs: | | | | | | | | | | | | | | | | | | |
| Pass | | 520 | | | 3,583 | | | 7,336 | | | 3,203 | | | 525 | | | 8,960 | | | 1,958,692 | | | 127,401 | | | 2,110,220 | |
| Criticized (accrual) | | — | | | 6 | | | — | | | — | | | — | | | — | | | 4 | | | 1,079 | | | 1,089 | |
| Criticized (nonaccrual) | | — | | | — | | | 483 | | | 231 | | | 1,017 | | | 4,844 | | | 1,001 | | | 3,770 | | | 11,346 | |
| Subtotal HELOCs | | 520 | | | 3,589 | | | 7,819 | | | 3,434 | | | 1,542 | | | 13,804 | | | 1,959,697 | | | 132,250 | | | 2,122,655 | |
| Total residential mortgage | | 3,549,555 | | | 2,458,581 | | | 1,784,504 | | | 1,110,064 | | | 824,779 | | | 1,526,252 | | | 1,959,697 | | | 132,250 | | | 13,345,682 | |
| Other consumer: | | | | | | | | | | | | | | | | | | |
| Pass | | 17,088 | | | 137 | | | 5,356 | | | — | | | — | | | 15,808 | | | 37,804 | | | — | | | 76,193 | |
| Criticized (accrual) | | 3 | | | — | | | — | | | — | | | — | | | — | | | — | | | — | | | 3 | |
| Criticized (nonaccrual) | | — | | | — | | | — | | | — | | | — | | | — | | | 99 | | | — | | | 99 | |
| Total other consumer | | 17,091 | | | 137 | | | 5,356 | | | — | | | — | | | 15,808 | | | 37,903 | | | — | | | 76,295 | |
| Total consumer | | $ | 3,566,646 | | | $ | 2,458,718 | | | $ | 1,789,860 | | | $ | 1,110,064 | | | $ | 824,779 | | | $ | 1,542,060 | | | $ | 1,997,600 | | | $ | 132,250 | | | $ | 13,421,977 | |
| Total by Risk Rating: | | | | | | | | | | | | | | | | | | |
| Pass | | $ | 12,365,799 | | | $ | 8,084,723 | | | $ | 4,590,045 | | | $ | 3,791,578 | | | $ | 2,786,218 | | | $ | 4,158,181 | | | $ | 11,359,948 | | | $ | 169,958 | | | $ | 47,306,450 | |
| Criticized (accrual) | | 80,235 | | | 96,150 | | | 208,970 | | | 76,486 | | | 142,072 | | | 76,117 | | | 99,447 | | | 17,795 | | | 797,272 | |
| Criticized (nonaccrual) | | 18,863 | | | 23,841 | | | 11,420 | | | 3,676 | | | 8,356 | | | 27,682 | | | 1,100 | | | 3,770 | | | 98,708 | |
| | | | | | | | | | | | | | | | | | |
| | | | | | | | | | | | | | | | | | |
| | | | | | | | | | | | | | | | | | |
| Total | | $ | 12,464,897 | | | $ | 8,204,714 | | | $ | 4,810,435 | | | $ | 3,871,740 | | | $ | 2,936,646 | | | $ | 4,261,980 | | | $ | 11,460,495 | | | $ | 191,523 | | | $ | 48,202,430 | |
|
(1)$01.4 million and $26.4$13.5 million of total commercial loans, primarily comprised of CRE revolving loans converted to term loans during the three and ninesix months ended SeptemberJune 30, 2022,2023, respectively. In comparison, $1.5 million and $6.5$26.4 million of total commercial loans, primarily comprised of CRE revolving loans converted to term loans during both the three and ninesix months ended September 30, 2021, respectively. $375 thousand of total consumer loans, comprised of HELOCs, were converted to term loans during the three and nine months ended SeptemberJune 30, 2022. In comparison, $4.1$9.7 million and $62.7$14.5 million of total consumer loans, comprised of HELOCs were converted to term loans during three and six months ended June 30, 2023, respectively. In comparison, there were no consumer loans converted to term loans during the three and ninesix months ended SeptemberJune 30, 2021, respectively.2022.
(2)As of SeptemberJune 30, 20222023 and December 31, 2021, $1.2 million2022, $734 thousand and $1.6 million,$818 thousand, respectively, of nonaccrual loans whose payments are guaranteed by the Federal Housing Administration were classified with a “Pass” rating.
(3)Excludes gross write-offs associated with loans the Company sold or settled.
Nonaccrual and Past Due Loans
Loans that are 90 or more days past due are generally placed on nonaccrual status unless the loan is well-collateralized and in the process of collection. Loans that are less than 90 days past due but have identified deficiencies, such as when the full collection of principal or interest becomes uncertain, are also placed on nonaccrual status. The following tables present the aging analysis of total loans held-for-investment as of SeptemberJune 30, 20222023 and December 31, 2021:2022:
| | | ($ in thousands) | | September 30, 2022 | |
| | June 30, 2023 |
| ($ in thousands) | ($ in thousands) | | Current
Accruing
Loans | | Accruing
Loans
30-59 Days
Past Due | | Accruing
Loans
60-89 Days
Past Due | | | Total
Accruing
Past Due
Loans | | | Total
Nonaccrual
Loans | | Total
Loans | ($ in thousands) | | Current
Accruing
Loans | | Accruing
Loans
30-59 Days
Past Due | | Accruing
Loans
60-89 Days
Past Due | | | Total
Accruing
Past Due
Loans | | | Total
Nonaccrual
Loans | | Total
Loans |
| | | | | | | | | | | | | | Commercial: | | | | | | | | | | | | | | |
| C&I | C&I | | $ | 15,556,124 | | | $ | 20,877 | | | $ | 83 | | | | $ | 20,960 | | | | $ | 47,988 | | | $ | 15,625,072 | | C&I | | $ | 15,602,567 | | | $ | 3,247 | | | $ | 2,391 | | | | $ | 5,638 | | | | $ | 61,879 | | | $ | 15,670,084 | |
| CRE: | CRE: | | | | | | CRE: | | | | | |
| CRE | CRE | | 13,561,499 | | | 489 | | | 134 | | | | 623 | | | | 11,035 | | | 13,573,157 | | CRE | | 14,342,301 | | | 15,189 | | | — | | | | 15,189 | | | | 15,895 | | | 14,373,385 | |
| Multifamily residential | Multifamily residential | | 4,558,333 | | | 795 | | | — | | | | 795 | | | | 174 | | | 4,559,302 | | Multifamily residential | | 4,758,515 | | | 962 | | | — | | | | 962 | | | | 4,703 | | | 4,764,180 | |
| Construction and land | Construction and land | | 556,894 | | | — | | | — | | | | — | | | | — | | | 556,894 | | Construction and land | | 759,516 | | | 21,552 | | | — | | | | 21,552 | | | | — | | | 781,068 | |
| Total CRE | Total CRE | | 18,676,726 | | | 1,284 | | | 134 | | | | 1,418 | | | | 11,209 | | | 18,689,353 | | Total CRE | | 19,860,332 | | | 37,703 | | | — | | | | 37,703 | | | | 20,598 | | | 19,918,633 | |
| Total commercial | Total commercial | | 34,232,850 | | | 22,161 | | | 217 | | | | 22,378 | | | | 59,197 | | | 34,314,425 | | Total commercial | | 35,462,899 | | | 40,950 | | | 2,391 | | | | 43,341 | | | | 82,477 | | | 35,588,717 | |
| Consumer: | Consumer: | | | | | | | | | | | | | | | Consumer: | | | | | | | | | | | | | | |
| Residential mortgage: | Residential mortgage: | | | | | | Residential mortgage: | | | | | |
| Single-family residential | Single-family residential | | 10,820,365 | | | 13,914 | | | 8,325 | | | | 22,239 | | | | 12,741 | | | 10,855,345 | | Single-family residential | | 12,254,680 | | | 21,752 | | | 10,200 | | | | 31,952 | | | | 21,981 | | | 12,308,613 | |
| HELOCs | HELOCs | | 2,169,440 | | | 2,992 | | | 1,924 | | | | 4,916 | | | | 10,568 | | | 2,184,924 | | HELOCs | | 1,840,064 | | | 10,471 | | | 1,342 | | | | 11,813 | | | | 11,051 | | | 1,862,928 | |
| Total residential mortgage | Total residential mortgage | | 12,989,805 | | | 16,906 | | | 10,249 | | | | 27,155 | | | | 23,309 | | | 13,040,269 | | Total residential mortgage | | 14,094,744 | | | 32,223 | | | 11,542 | | | | 43,765 | | | | 33,032 | | | 14,171,541 | |
| Other consumer | Other consumer | | 87,444 | | | 43 | | | 37 | | | | 80 | | | | 37 | | | 87,561 | | Other consumer | | 67,099 | | | 142 | | | 841 | | | | 983 | | | | 24 | | | 68,106 | |
| Total consumer | Total consumer | | 13,077,249 | | | 16,949 | | | 10,286 | | | | 27,235 | | | | 23,346 | | | 13,127,830 | | Total consumer | | 14,161,843 | | | 32,365 | | | 12,383 | | | | 44,748 | | | | 33,056 | | | 14,239,647 | |
| Total | Total | | $ | 47,310,099 | | | $ | 39,110 | | | $ | 10,503 | | | | $ | 49,613 | | | | $ | 82,543 | | | $ | 47,442,255 | | Total | | $ | 49,624,742 | | | $ | 73,315 | | | $ | 14,774 | | | | $ | 88,089 | | | | $ | 115,533 | | | $ | 49,828,364 | |
|
| | | ($ in thousands) | | December 31, 2021 | |
| | December 31, 2022 |
| ($ in thousands) | ($ in thousands) | | Current
Accruing
Loans | | Accruing
Loans
30-59 Days
Past Due | | Accruing
Loans
60-89 Days
Past Due | | | Total
Accruing
Past Due
Loans | | | Total
Nonaccrual
Loans | | Total
Loans | ($ in thousands) | | Current
Accruing
Loans | | Accruing
Loans
30-59 Days
Past Due | | Accruing
Loans
60-89 Days
Past Due | | | Total
Accruing
Past Due
Loans | | | Total
Nonaccrual
Loans | | Total
Loans |
| | | | | | | | | | | | | | Commercial: | | | | | | | | | | | | | | |
| C&I | C&I | | $ | 14,080,516 | | | $ | 6,983 | | | $ | 4,086 | | | | $ | 11,069 | | | | $ | 59,023 | | | $ | 14,150,608 | | C&I | | $ | 15,651,312 | | | $ | 6,482 | | | $ | 2,873 | | | | $ | 9,355 | | | | $ | 50,428 | | | $ | 15,711,095 | |
| CRE: | CRE: | | | | | | CRE: | | | | | |
| CRE | CRE | | 12,141,827 | | | 3,722 | | | — | | | | 3,722 | | | | 9,498 | | | 12,155,047 | | CRE | | 13,820,441 | | | 14,185 | | | — | | | | 14,185 | | | | 23,244 | | | 13,857,870 | |
| Multifamily residential | Multifamily residential | | 3,669,819 | | | 5,320 | | | 22 | | | | 5,342 | | | | 444 | | | 3,675,605 | | Multifamily residential | | 4,571,899 | | | 678 | | | 322 | | | | 1,000 | | | | 169 | | | 4,573,068 | |
| Construction and land | Construction and land | | 346,486 | | | — | | | — | | | | — | | | | — | | | 346,486 | | Construction and land | | 638,420 | | | — | | | — | | | | — | | | | — | | | 638,420 | |
| Total CRE | Total CRE | | 16,158,132 | | | 9,042 | | | 22 | | | | 9,064 | | | | 9,942 | | | 16,177,138 | | Total CRE | | 19,030,760 | | | 14,863 | | | 322 | | | | 15,185 | | | | 23,413 | | | 19,069,358 | |
| Total commercial | Total commercial | | 30,238,648 | | | 16,025 | | | 4,108 | | | | 20,133 | | | | 68,965 | | | 30,327,746 | | Total commercial | | 34,682,072 | | | 21,345 | | | 3,195 | | | | 24,540 | | | | 73,841 | | | 34,780,453 | |
| Consumer: | Consumer: | | | | | | | | | | | | | | | Consumer: | | | | | | | | | | | | | | |
| Residential mortgage: | Residential mortgage: | | | | | | Residential mortgage: | | | | | |
| Single-family residential | Single-family residential | | 9,059,222 | | | 10,191 | | | 8,569 | | | | 18,760 | | | | 15,720 | | | 9,093,702 | | Single-family residential | | 11,183,134 | | | 13,523 | | | 12,130 | | | | 25,653 | | | | 14,240 | | | 11,223,027 | |
| HELOCs | HELOCs | | 2,130,523 | | | 4,776 | | | 1,078 | | | | 5,854 | | | | 8,444 | | | 2,144,821 | | HELOCs | | 2,102,523 | | | 7,700 | | | 1,086 | | | | 8,786 | | | | 11,346 | | | 2,122,655 | |
| Total residential mortgage | Total residential mortgage | | 11,189,745 | | | 14,967 | | | 9,647 | | | | 24,614 | | | | 24,164 | | | 11,238,523 | | Total residential mortgage | | 13,285,657 | | | 21,223 | | | 13,216 | | | | 34,439 | | | | 25,586 | | | 13,345,682 | |
| Other consumer | Other consumer | | 127,352 | | | 99 | | | 9 | | | | 108 | | | | 52 | | | 127,512 | | Other consumer | | 73,004 | | | 109 | | | 3,083 | | | | 3,192 | | | | 99 | | | 76,295 | |
| Total consumer | Total consumer | | 11,317,097 | | | 15,066 | | | 9,656 | | | | 24,722 | | | | 24,216 | | | 11,366,035 | | Total consumer | | 13,358,661 | | | 21,332 | | | 16,299 | | | | 37,631 | | | | 25,685 | | | 13,421,977 | |
| Total | Total | | $ | 41,555,745 | | | $ | 31,091 | | | $ | 13,764 | | | | $ | 44,855 | | | | $ | 93,181 | | | $ | 41,693,781 | | Total | | $ | 48,040,733 | | | $ | 42,677 | | | $ | 19,494 | | | | $ | 62,171 | | | | $ | 99,526 | | | $ | 48,202,430 | |
|
The following table presents the amortized cost of loans on nonaccrual status for which there was no related allowance for loan losses as of both SeptemberJune 30, 20222023 and December 31, 2021.2022. Nonaccrual loans may not have an allowance for credit losses if the loan balances are well-secured by the collateral value and there is no loss expectation.
| | | ($ in thousands) | ($ in thousands) | | | September 30, 2022 | | | December 31, 2021 | ($ in thousands) | | | June 30, 2023 | | | December 31, 2022 |
| | Commercial: | Commercial: | | | | | | Commercial: | | | | | | |
| C&I | C&I | | | $ | 4,368 | | | | $ | 22,967 | | C&I | | | $ | 27,690 | | | | $ | 11,398 | |
| | CRE | CRE | | | 10,725 | | | | 9,102 | | CRE | | | 15,100 | | | | 22,944 | |
| | Multifamily residential | | Multifamily residential | | | 4,235 | | | | — | |
| | Total commercial | Total commercial | | | 15,093 | | | | 32,069 | | Total commercial | | | 47,025 | | | | 34,342 | |
| Consumer: | Consumer: | | | | | | | Consumer: | | | | | | |
| | Single-family residential | Single-family residential | | | 2,909 | | | | 5,785 | | Single-family residential | | | 6,077 | | | | 2,998 | |
| HELOCs | HELOCs | | | 7,609 | | | | 5,033 | | HELOCs | | | 5,076 | | | | 7,245 | |
| | Total consumer | Total consumer | | | 10,518 | | | | 10,818 | | Total consumer | | | 11,153 | | | | 10,243 | |
| Total nonaccrual loans with no related allowance for loan losses | Total nonaccrual loans with no related allowance for loan losses | | | $ | 25,611 | | | | $ | 42,887 | | Total nonaccrual loans with no related allowance for loan losses | | | $ | 58,178 | | | | $ | 44,585 | |
|
Foreclosed Assets
The Company acquires assets from borrowers through loan restructurings, workouts, and foreclosures. Assets acquired may include real properties (e.g., residential real estate, land, and buildings) and commercial and personal properties. The Company recognizes foreclosed assets upon receiving assets in satisfaction of a loan (e.g., taking legal title or physical possession).
Foreclosed assets, consisting of OREO and other nonperforming assets, are included in Other assets on the Consolidated Balance Sheet. The Company had no foreclosed assets as of SeptemberJune 30, 2022,2023, compared with $10.3 million$270 thousand as of December 31, 2021.2022. The Company commences the foreclosure process on consumer mortgage loans after a borrower becomes more than 120 days delinquent in accordance with the Consumer Financial Protection BureauCFPB guidelines. The carrying value of consumer real estate loans that were in an active or suspended foreclosure process was $7.6$7.1 million and $7.3$7.5 million as of SeptemberJune 30, 20222023 and December 31, 2021,2022, respectively.
Troubled Debt RestructuringsLoan Modifications to Borrowers Experiencing Financial Difficulty
TDRs are individually evaluated, and the type of restructuring is selected based on the loan type and the circumstances of the borrower’s financial difficulties. A TDR is a modification of the terms of a loan whenEffective January 1, 2023, the Company adopted ASU 2022-02, which in part eliminated the accounting for economic or legal reasons relatedTDR and enhanced disclosures requirements for loan modifications to the borrower’sborrowers experiencing financial difficulties, grants a concession to the borrower that it would not have otherwise considered. The COVID-related modifications that occurred between March 1, 2020 and January 1, 2022, were generally not classified as TDRs due to the relief under the Coronavirus Aid, Relief, and Economic Security Act, as amended by the Consolidated Appropriations Act, 2021, and the Interagency Statement on Loan Modifications and Reporting for Financial Institutions Working with Customers Affected by the Coronavirus (Revised), and therefore are not included in the discussion below.difficulty. See Note 12 — Current Accounting Developments and Summary of Significant Accounting Policies — Significant Accounting Policies Update — Troubled Debt RestructuringsLoan Modifications to the Consolidated Financial Statements in the Company’s 2021this Form 10-K10-Q for additional information. As part of the Company’s loss mitigation efforts, the Company may agree to modify the contractual terms of a loan to assist borrowers experiencing financial difficulty. The Company negotiates loan modifications on a case-by-case basis to achieve mutually agreeable terms that maximize loan collectability and meet the borrower’s financial needs. The Company considers various factors to identify borrowers experiencing financial difficulty. The primary factor for consumer borrowers is delinquency status. For commercial loan borrowers, these factors include credit risk ratings, the probability of loan risk rating downgrades, and overall risk profile changes. The modification may include, but is not limited to, payment deferrals, interest rate reductions, term extensions, principal forgiveness, or a combination of such modifications. Commercial loan borrowers that require immaterial modifications such as insignificant interest rate changes, short-term extensions (90 days or less) from the original maturity date, or temporary waivers or extensions of financial covenants which would not constitute material credit actions are generally not considered to be experiencing financial difficulty and are not included in the disclosure. Insignificant payment deferrals (three months or less in the last 12 months) are also not included in the disclosure.
The following tables present the amortized cost of loans that were modified during the three and six months ended June 30, 2023 by loan class and modification type:
| | | | | | | | | | | | | | | | | | | | | | | | | | | | | | | | | | | | | | | | | | | | | | | | | | |
|
| | Three Months Ended June 30, 2023 |
| | Modification Type | | | | | | |
| ($ in thousands) | | Term Extension | | Payment Delay | | Combo- Term Extension/ Payment Delay | | Combo- Rate Reduction/ Term Extension | | Combo- Principal Forgiveness Rate Reduction/ Term Extension | | Total | | Modification as a % of Loan Class | | | | | | |
| Commercial: | | | | | | | | | | | | | | | | | | | | |
| C&I | | $ | 13,475 | | | $ | 12,788 | | | $ | — | | | $ | — | | | $ | 298 | | | $ | 26,561 | | | 0.17 | % | | | | | | |
| CRE: | | | | | | | | | | | | | | | | | | | | |
| CRE | | — | | | — | | | — | | | 32,791 | | | — | | | 32,791 | | | 0.16 | % | | | | | | |
| | | | | | | | | | | | | | | | | | | | |
| | | | | | | | | | | | | | | | | | | | |
| | | | | | | | | | | | | | | | | | | | |
| Total commercial | | 13,475 | | | 12,788 | | | — | | | 32,791 | | | 298 | | | 59,352 | | | | | | | | | |
| Consumer: | | | | | | | | | | | | | | | | | | | | |
| Residential mortgage: | | | | | | | | | | | | | | | | | | | | |
| Single-family residential: | | — | | | 5,085 | | | 551 | | | — | | | — | | | 5,636 | | | 0.05 | % | | | | | | |
| HELOCs | | — | | | 978 | | | — | | | — | | | — | | | 978 | | | 0.05 | % | | | | | | |
| | | | | | | | | | | | | | | | | | | | |
| | | | | | | | | | | | | | | | | | | | |
| | | | | | | | | | | | | | | | | | | | |
| | | | | | | | | | | | | | | | | | | | |
| Total consumer | | — | | | 6,063 | | | 551 | | | — | | | — | | | 6,614 | | | | | | | | | |
| Total | | $ | 13,475 | | | $ | 18,851 | | | $ | 551 | | | $ | 32,791 | | | $ | 298 | | | $ | 65,966 | | | | | | | | | |
|
| | | | | | | | | | | | | | | | | | | | | | | | | | | | | | | | | | | | | | | | | | | | | | | | |
|
| | Six Months Ended June 30, 2023 |
| | Modification Type | | | | |
| ($ in thousands) | | Term Extension | | Payment Delay | | Combo- Term Extension/ Payment Delay | | Combo- Rate Reduction/ Term Extension | | Combo- Principal Forgiveness Rate Reduction/ Term Extension | | Total | | Modification as a % of Loan Class | | | | |
| Commercial: | | | | | | | | | | | | | | | | | | |
| C&I | | $ | 33,098 | | | $ | 26,799 | | | $ | — | | | $ | — | | | $ | 298 | | | $ | 60,195 | | | 0.38 | % | | | | |
| CRE: | | | | | | | | | | | | | | | | | | |
| CRE | | 526 | | | — | | | — | | | 32,791 | | | — | | | 33,317 | | | 0.17 | % | | | | |
| | | | | | | | | | | | | | | | | | |
| | | | | | | | | | | | | | | | | | |
| | | | | | | | | | | | | | | | | | |
| Total commercial | | 33,624 | | | 26,799 | | | — | | | 32,791 | | | 298 | | | 93,512 | | | | | | | |
| Consumer: | | | | | | | | | | | | | | | | | | |
| Residential mortgage: | | | | | | | | | | | | | | | | | | |
| Single-family residential: | | — | | | 5,085 | | | 551 | | | — | | | — | | | 5,636 | | | 0.05 | % | | | | |
| HELOCs | | — | | | 978 | | | 726 | | | — | | | — | | | 1,704 | | | 0.09 | % | | | | |
| | | | | | | | | | | | | | | | | | |
| | | | | | | | | | | | | | | | | | |
| | | | | | | | | | | | | | | | | | |
| | | | | | | | | | | | | | | | | | |
| Total consumer | | — | | | 6,063 | | | 1,277 | | | — | | | — | | | 7,340 | | | | | | | |
| Total | | $ | 33,624 | | | $ | 32,862 | | | $ | 1,277 | | | $ | 32,791 | | | $ | 298 | | | $ | 100,852 | | | | | | | |
|
The following tables present the financial effects of the loan modifications for the three and six months ended June 30, 2023 by loan class and modification type:
| | | | | | | | | | | | | | | | | | | | | | | | | | |
|
| | Financial Effects of Loan Modifications |
| | Three Months Ended June 30, 2023 |
| | |
| ($ in thousands) | | Principal Forgiveness | | Weighted-Average Interest Rate Reduction | | Weighted-Average Term Extension
(in years) | | Weighted-Average Payment Delay
(in years) |
| Commercial: | | | | | | | | |
| C&I | | $ | 345 | | (1) | 8.50 | % | (1) | 1.71 | | 0.63 |
| | | | | | | | |
| CRE | | — | | | 3.00 | % | | 2.50 | | — | |
| | | | | | | | |
| | | | | | | | |
| | | | | | | | |
| | | | | | | | |
| Consumer: | | | | | | | | |
| | | | | | | | |
| Single-family residential | | — | | | — | | | 9.70 | | 0.89 |
| HELOCs | | — | | | — | | | — | | | 0.64 |
| | | | | | | | |
| | | | | | | | |
| | | | | | | | |
| | | | | | | | |
| | | | | | | | |
| Total | | $ | 345 | | | | | | | |
|
| | | | | | | | | | | | | | | | | | | | | | | | | | | | | | | | | | | | | | | | | | | | | | |
| | | | | | | | | | | | | | | | | | | | |
| | | | | | | | | | | | Financial Effects of Loan Modifications | | | | | | | | | | |
| | | | | | Six months ended June 30, 2023 | | | | | | | | | | |
| | | | | | | | | | | | | | | | |
| | | | | | | | | | ($ in thousands) | | Principal Forgiveness | | Weighted-Average Interest Rate Reduction | | Weighted-Average Term Extension
(in years) | | Weighted-Average Payment Delay
(in years) | | | | | | | | | | |
| | | | | | | | | | Commercial: | | | | | | | | | | | | | | | | | | |
| | | | | | | | | | C&I | | $ | 345 | | (1) | 8.50 | % | (1) | 1.47 | | 0.82 | | | | | | | | | | |
| | | | | | | | | | | | | | | | | | | | | | | | | | | | |
| | | | | | | | | | CRE | | — | | | 3.00 | % | | 2.49 | | — | | | | | | | | | | | |
| | | | | | | | | | | | | | | | | | | | | | | | | | | | |
| | | | | | | | | | | | | | | | | | | | | | | | | | | | |
| | | | | | | | | | | | | | | | | | | | | | | | | | | | |
| | | | | | | | | | | | | | | | | | | | | | | | | | | | |
| | | | | | | | | | Consumer: | | | | | | | | | | | | | | | | | | |
| | | | | | | | | | | | | | | | | | | | | | | | | | | | |
| | | | | | | | | | Single-family residential | | — | | | — | | | 9.70 | | 0.89 | | | | | | | | | | |
| | | | | | | | | | HELOCs | | — | | | — | | | 14.75 | | 0.51 | | | | | | | | | | |
| | | | | | | | | | | | | | | | | | | | | | | | | | | | |
| | | | | | | | | | | | | | | | | | | | | | | | | | | | |
| | | | | | | | | | | | | | | | | | | | | | | | | | | | |
| | | | | | | | | | | | | | | | | | | | | | | | | | | | |
| | | | | | | | | | | | | | | | | | | | | | | | | | | | |
| | | | | | | | | | Total | | $ | 345 | | | | | | | | | | | | | | | | | |
| | | | | | | | | | | | | | | | | | | | |
(1)Comprised of a C&I loan modified during the three and six months ended June 30, 2023 where the interest is waived in addition to principal forgiveness.
A modified loan may become delinquent and may result in a payment default (generally 90 days past due) subsequent to modification. There were no loans that received modifications which subsequently defaulted during the three and six months ended June 30, 2023.
The Company closely monitors the performance of modified loans to borrowers experiencing financial difficulty to understand the effectiveness of its modification efforts. The following table presents the performance of loans that were modified as of June 30, 2023 since the adoption of ASU 2022-02 on January 1, 2023.
| | | | | | | | | | | | | | | | | | | | | | | | | | | | | | | | | | | | | | |
|
| | | | Payment Performance as of June 30, 2023 |
| ($ in thousands) | | | | | | | | | | | | | | Current | | 30 - 89 Days Past Due | | 90+ Days Past Due | | Total |
| Commercial: | | | | | | | | | | | | | | | | | | | | |
| C&I | | | | | | | | | | | | | | $ | 48,206 | | | $ | 7,000 | | | $ | 4,989 | | | $ | 60,195 | |
| CRE: | | | | | | | | | | | | | | | | | | | | |
| CRE | | | | | | | | | | | | | | 33,317 | | | — | | | — | | | 33,317 | |
| | | | | | | | | | | | | | | | | | | | |
| | | | | | | | | | | | | | | | | | | | |
| | | | | | | | | | | | | | | | | | | | |
| Total commercial | | | | | | | | | | | | | | 81,523 | | | 7,000 | | | 4,989 | | | 93,512 | |
| Consumer: | | | | | | | | | | | | | | | | | | | | |
| Residential mortgage: | | | | | | | | | | | | | | | | | | | | |
| Single-family residential | | | | | | | | | | | | | | 5,045 | | | 591 | | | — | | | 5,636 | |
| HELOCs | | | | | | | | | | | | | | 1,704 | | | — | | | — | | | 1,704 | |
| | | | | | | | | | | | | | | | | | | | |
| | | | | | | | | | | | | | | | | | | | |
| Total consumer | | | | | | | | | | | | | | 6,749 | | | 591 | | | — | | | 7,340 | |
| Total | | | | | | | | | | | | | | $ | 88,272 | | | $ | 7,591 | | | $ | 4,989 | | | $ | 100,852 | |
| | | | | | | | | | | | | | | | | | | | |
As of June 30, 2023, commitments to lend additional funds to borrowers whose loans were modified were $15.1 million.
Troubled Debt Restructurings Prior to the Adoption of ASU 2022-02
Prior to the adoption of ASU 2022-02, the Company accounted for a modification to the contractual terms of a loan that resulted in granting a concession to a borrower experiencing financial difficulties as a TDR. ASU 2022-02 eliminated TDR accounting prospectively for all restructurings occurring on or after January 1, 2023.
The following table presents the additions to TDRs for the three and ninesix months ended SeptemberJune 30, 2022 and 2021:2022:
| | | | | | | | | | | | | | | | | | | | | | | | | | | | | | | | | | | | | | | | | | | | | | | | | | |
|
| ($ in thousands) | | Loans Modified as TDRs During the Three Months Ended September 30, |
| 2022 | | 2021 |
| Number
of
Loans | | Pre-
Modification
Outstanding
Recorded
Investment | | Post- Modification Outstanding Recorded Investment (1) | | Financial Impact (2) | | Number
of
Loans | | Pre-
Modification
Outstanding
Recorded
Investment | | Post- Modification Outstanding Recorded Investment (1) | | Financial Impact (2) |
| Commercial: | | | | | | | | | | | | | | | | |
| C&I | | 1 | | $ | 499 | | | $ | 496 | | | $ | 98 | | | 7 | | $ | 26,248 | | | $ | 27,111 | | | $ | 5,688 | |
| CRE: | | | | | | | | | | | | | | | | |
| | | | | | | | | | | | | | | | |
| Multifamily residential | | — | | — | | | — | | | — | | | 1 | | 1,101 | | | 1,118 | | | — | |
| | | | | | | | | | | | | | | | |
| Total CRE | | — | | — | | | — | | | — | | | 1 | | 1,101 | | | 1,118 | | | — | |
| Total commercial | | 1 | | 499 | | | 496 | | | 98 | | | 8 | | 27,349 | | | 28,229 | | | 5,688 | |
| Consumer: | | | | | | | | | | | | | | | | |
| Residential mortgage: | | | | | | | | | | | | | | | | |
| | | | | | | | | | | | | | | | |
| HELOCs | | 1 | | 62 | | | 69 | | | 2 | | | — | | — | | | — | | | — | |
| Total residential mortgage | | 1 | | 62 | | | 69 | | | 2 | | | — | | — | | | — | | | — | |
| | | | | | | | | | | | | | | | |
| Total consumer | | 1 | | 62 | | | 69 | | | 2 | | | — | | — | | | — | | | — | |
| Total | | 2 | | $ | 561 | | | $ | 565 | | | $ | 100 | | | 8 | | $ | 27,349 | | | $ | 28,229 | | | $ | 5,688 | |
|
| | | | | | | | | | | | | | | | | | | | | | | | | | | | | | | | | | | | | | | | | | | | | | | | | | |
|
| ($ in thousands) | | Loans Modified as TDRs During the Nine Months Ended September 30, |
| 2022 | | 2021 |
| Number
of
Loans | | Pre-
Modification
Outstanding
Recorded
Investment | | Post- Modification Outstanding Recorded Investment (1) | | Financial Impact (2) | | Number
of
Loans | | Pre-
Modification
Outstanding
Recorded
Investment | | Post- Modification Outstanding Recorded Investment (1) | | Financial Impact (2) |
| Commercial: | | | | | | | | | | | | | | | | |
| C&I | | 4 | | $ | 30,633 | | | $ | 17,802 | | | $ | 16,729 | | | 11 | | $ | 46,144 | | | $ | 45,954 | | | $ | 7,662 | |
| CRE: | | | | | | | | | | | | | | | | |
| | | | | | | | | | | | | | | | |
| Multifamily residential | | — | | — | | | — | | | — | | | 1 | | 1,101 | | | 1,118 | | | — | |
| | | | | | | | | | | | | | | | |
| Total CRE | | — | | — | | | — | | | — | | | 1 | | 1,101 | | | 1,118 | | | — | |
| Total commercial | | 4 | | 30,633 | | | 17,802 | | | 16,729 | | | 12 | | 47,245 | | | 47,072 | | | 7,662 | |
| Consumer: | | | | | | | | | | | | | | | | |
| Residential mortgage: | | | | | | | | | | | | | | | | |
| | | | | | | | | | | | | | | | |
| HELOCs | | 1 | | 62 | | | 69 | | | 2 | | | — | | — | | | — | | | — | |
| Total residential mortgage | | 1 | | 62 | | | 69 | | | 2 | | | — | | — | | | — | | | — | |
| | | | | | | | | | | | | | | | |
| Total consumer | | 1 | | 62 | | | 69 | | | 2 | | | — | | — | | | — | | | — | |
| Total | | 5 | | $ | 30,695 | | | $ | 17,871 | | | $ | 16,731 | | | 12 | | $ | 47,245 | | | $ | 47,072 | | | $ | 7,662 | |
|
| | | | | | | | | | | | | | | | | | | | | | | | | | | | | | | | | | | | | | | | | | | | | | | | | | |
|
| | Loans Modified as TDRs |
| | Three Months Ended June 30, 2022 | | Six Months Ended June 30, 2022 |
| ($ in thousands) | | Number of Loans | | Pre-Modification Outstanding Recorded Investment | | Post-Modification Outstanding Recorded Investment (1) | | Financial Impact (2) | | Number of Loans | | Pre-Modification Outstanding Recorded Investment | | Post-Modification Outstanding Recorded Investment (1) | | Financial Impact (2) |
| Commercial: | | | | | | | | | | | | | | | | |
| C&I | | 2 | | | $ | 12,955 | | | $ | 12,245 | | | $ | 2,111 | | | 3 | | | $ | 30,134 | | | $ | 21,428 | | | $ | 10,157 | |
| | | | | | | | | | | | | | | | |
| | | | | | | | | | | | | | | | |
| | | | | | | | | | | | | | | | |
| | | | | | | | | | | | | | | | |
| | | | | | | | | | | | | | | | |
| | | | | | | | | | | | | | | | |
| | | | | | | | | | | | | | | | |
| | | | | | | | | | | | | | | | |
| | | | | | | | | | | | | | | | |
| | | | | | | | | | | | | | | | |
| | | | | | | | | | | | | | | | |
| | | | | | | | | | | | | | | | |
| Total | | 2 | | | $ | 12,955 | | | $ | 12,245 | | | $ | 2,111 | | | 3 | | | $ | 30,134 | | | $ | 21,428 | | | $ | 10,157 | |
| | | | | | | | | | | | | | | | |
(1)Includes subsequent payments after modification and reflects the balance as of SeptemberJune 30, 2022 and 2021.2022.
(2)Includes charge-offs and specific reserves recorded since the modification date.
The following tables presenttable presents the TDR post-modification outstanding balances by the primary modification type for the three and ninesix months ended SeptemberJune 30, 2022 and 2021:2022:
| | | | | | | | | | | | | | | | | | | | | | | | | | | | | | | | | | | | | | | | | | | | | | | | | | | | | | | | | | | | |
|
| ($ in thousands) | | Modification Type During the Three Months Ended September 30, |
| 2022 | | 2021 |
| Principal (1) | | | | | | Interest Rate Reduction | | Other | | | | Total | | Principal (1) | | | | | | Interest Rate Reduction | | Other | | Total |
| Commercial: | | | | | | | | | | | | | | | | | | | | | | | | | | |
| C&I | | $ | 496 | | | | | | | $ | — | | | $ | — | | | | | $ | 496 | | | $ | 27,111 | | | | | | | $ | — | | | $ | — | | | $ | 27,111 | |
| CRE: | | | | | | | | | | | | | | | | | | | | | | | | | | |
| | | | | | | | | | | | | | | | | | | | | | | | | | |
| Multifamily residential | | — | | | | | | | — | | | — | | | | | — | | | 1,118 | | | | | | | — | | | — | | | 1,118 | |
| | | | | | | | | | | | | | | | | | | | | | | | | | |
| Total CRE | | — | | | | | | | | | — | | | | | — | | | 1,118 | | | | | | | — | | | — | | | 1,118 | |
| Total commercial | | 496 | | | | | | | — | | | — | | | | | 496 | | | 28,229 | | | | | | | — | | | — | | | 28,229 | |
| Consumer: | | | | | | | | | | | | | | | | | | | | | | | | | | |
| Residential mortgage: | | | | | | | | | | | | | | | | | | | | | | | | | | |
| | | | | | | | | | | | | | | | | | | | | | | | | | |
| HELOCs | | 69 | | | | | | | — | | | — | | | | | 69 | | | — | | | | | | | — | | | — | | | — | |
| Total residential mortgage | | 69 | | | | | | | — | | | — | | | | | 69 | | | — | | | | | | | — | | | — | | | — | |
| | | | | | | | | | | | | | | | | | | | | | | | | | |
| Total consumer | | 69 | | | | | | | — | | | — | | | | | 69 | | | — | | | | | | | — | | | — | | | — | |
| Total | | $ | 565 | | | | | | | $ | — | | | $ | — | | | | | $ | 565 | | | $ | 28,229 | | | | | | | $ | — | | | $ | — | | | $ | 28,229 | |
|
| | | | | | | | | | | | | | | | | | | | | | | | | | | | | | | | | | | | | | | | | | | | | | | | | | | | | | | | | | | | |
|
| ($ in thousands) | | Modification Type During the Nine Months Ended September 30, |
| 2022 | | 2021 |
| Principal (1) | | | | | | | | Interest Rate Reduction | | Other (2) | | Total | | Principal (1) | | | | | | Interest Rate Reduction | | Other | | Total |
| Commercial: | | | | | | | | | | | | | | | | | | | | | | | | | | |
| C&I | | $ | 9,609 | | | | | | | | | $ | — | | | $ | 8,193 | | | $ | 17,802 | | | $ | 28,780 | | | | | | | $ | 17,174 | | | $ | — | | | $ | 45,954 | |
| CRE: | | | | | | | | | | | | | | | | | | | | | | | | | | |
| | | | | | | | | | | | | | | | | | | | | | | | | | |
| Multifamily residential | | — | | | | | | | | | — | | | — | | | — | | | 1,118 | | | | | | | — | | | — | | | 1,118 | |
| | | | | | | | | | | | | | | | | | | | | | | | | | |
| Total CRE | | — | | | | | | | | | — | | | — | | | — | | | 1,118 | | | | | | | — | | | — | | | 1,118 | |
| Total commercial | | 9,609 | | | | | | | | | — | | | 8,193 | | | 17,802 | | | 29,898 | | | | | | | 17,174 | | | — | | | 47,072 | |
| Consumer: | | | | | | | | | | | | | | | | | | | | | | | | | | |
| Residential mortgage: | | | | | | | | | | | | | | | | | | | | | | | | | | |
| | | | | | | | | | | | | | | | | | | | | | | | | | |
| HELOCs | | 69 | | | | | | | | | — | | | — | | | 69 | | | — | | | | | | | — | | | — | | | — | |
| Total residential mortgage | | 69 | | | | | | | | | — | | | — | | | 69 | | | — | | | | | | | — | | | — | | | — | |
| | | | | | | | | | | | | | | | | | | | | | | | | | |
| Total consumer | | 69 | | | | | | | | | — | | | — | | | 69 | | | — | | | | | | | — | | | — | | | — | |
| Total | | $ | 9,678 | | | | | | | | | $ | — | | | $ | 8,193 | | | $ | 17,871 | | | $ | 29,898 | | | | | | | $ | 17,174 | | | $ | — | | | $ | 47,072 | |
|
| | | | | | | | | | | | | | | | | | | | | | | | | | | | | | | | | | | | | | | | | | | | | | | | | | | | | | |
|
| | Modification Type |
| | Three Months Ended June 30, 2022 | | Six Months Ended June 30, 2022 |
| ($ in thousands) | | Principal | | | | | | | | | | Other (1) | | Total | | Principal (2) | | | | | | | | | | Other (1) | | Total |
| Commercial: | | | | | | | | | | | | | | | | | | | | | | | | | | | | |
| C&I | | $ | — | | | | | | | | | | | $ | 12,245 | | | $ | 12,245 | | | $ | 9,183 | | | | | | | | | | | $ | 12,245 | | | $ | 21,428 | |
| | | | | | | | | | | | | | | | | | | | | | | | | | | | |
| | | | | | | | | | | | | | | | | | | | | | | | | | | | |
| | | | | | | | | | | | | | | | | | | | | | | | | | | | |
| | | | | | | | | | | | | | | | | | | | | | | | | | | | |
| | | | | | | | | | | | | | | | | | | | | | | | | | | | |
| | | | | | | | | | | | | | | | | | | | | | | | | | | | |
| | | | | | | | | | | | | | | | | | | | | | | | | | | | |
| | | | | | | | | | | | | | | | | | | | | | | | | | | | |
| | | | | | | | | | | | | | | | | | | | | | | | | | | | |
| | | | | | | | | | | | | | | | | | | | | | | | | | | | |
| | | | | | | | | | | | | | | | | | | | | | | | | | | | |
| | | | | | | | | | | | | | | | | | | | | | | | | | | | |
| | | | | | | | | | | | | | | | | | | | | | | | | | | | |
| Total | | $ | — | | | | | | | | | | | $ | 12,245 | | | $ | 12,245 | | | $ | 9,183 | | | | | | | | | | | $ | 12,245 | | | $ | 21,428 | |
| | | | | | | | | | | | | | | | | | | | | | | | | | | | |
(1)Includes forbearance payments, term extensions andincrease in new commitment.
(2)Includes principal deferments that modify the terms of the loan from principal and interest payments to interest payments only.
(2)Includes increase in new commitment.
After a loan is modified as a TDR, the Company continues to monitor its performance under its most recent restructured terms. A TDR may become delinquent and result in payment default (generally 90 days past due) subsequent to restructuring. The following table presents information on loans that entered into default during the three and ninesix months ended SeptemberJune 30, 2022 and 2021, that were modified as TDRs during the 12 months preceding payment default:
| | | | | | | | | | | | | | | | | | | | | | | | | | | | | | | | | | | | | | | | | | | | | | Loan Modified as TDRs that Subsequently Defaulted |
| | | Three Months Ended June 30, 2022 | | Six Months Ended June 30, 2022 |
| ($ in thousands) | ($ in thousands) | | Loans Modified as TDRs that Subsequently Defaulted | ($ in thousands) | | Number of Loans | | Recorded Investment | | Number of Loans | | Recorded Investment |
| Three Months Ended September 30, | | Nine Months Ended September 30, | |
| 2022 | | 2021 | | 2022 | | 2021 | |
| Number of
Loans | | Recorded
Investment | | Number of
Loans | | Recorded
Investment | | Number of
Loans | | Recorded
Investment | | Number of
Loans | | Recorded
Investment | |
| Commercial: | Commercial: | | | | | | | | | | | | | | | | | Commercial: | | | | | | | | |
| C&I | C&I | | — | | | $ | — | | | — | | | $ | — | | | 2 | | | $ | 13,901 | | | 1 | | | $ | 11,431 | | C&I | | 1 | | | $ | 1,055 | | | 2 | | | $ | 4,305 | |
| CRE: | | |
| | Multifamily residential | | — | | | — | | | — | | | — | | | 1 | | | 1,008 | | | — | | | — | | |
| | Total CRE | | — | | | — | | | — | | | — | | | 1 | | | 1,008 | | | — | | | — | | |
| Total commercial | | — | | | — | | | — | | | — | | | 3 | | | 14,909 | | | 1 | | | 11,431 | | |
| | | Total | Total | | — | | | $ | — | | | — | | | $ | — | | | 3 | | | $ | 14,909 | | | 1 | | | $ | 11,431 | | Total | | 1 | | | $ | 1,055 | | | 2 | | | $ | 4,305 | |
|
As of September 30, 2022 and December 31, 2021,2022, the remaining lending commitments to lend to borrowers whose terms of their outstanding owed balances were modified as TDRs were $6.4 million and $5.0 million, respectively.was $16.2 million.
Allowance for Credit Losses
The Company has an allowancea current expected credit losses framework under ASU 2016-13 for all financial assets measured at amortized cost and certain off-balance sheet credit exposures. The Company’s allowance for credit losses, which includes both the allowance for loan losses and the allowance for unfunded credit commitments, is calculated with the objective of maintaining a reserve sufficient to absorb losses inherent in our credit portfolios. The measurement of the allowance for credit losses is based on management’s best estimate of lifetime expected credit losses, and periodic evaluation of the loan portfolio, lending-related commitments, and other relevant factors.
The allowance for credit losses is deducted from the amortized cost basis of a financial asset or a group of financial assets so that the balance sheet reflects the net amount the Company expects to collect. Amortized cost is the principal balance outstanding, net of purchase premiums and discounts, deferred fees and costs, and escrow advances. Subsequent changes in expected credit losses are recognized in net income as a provision for, or a reversal of, credit loss expense.
The allowance for credit losses estimation involves procedures to consider the unique risk characteristics of the portfolio segments. The majority of the Company’s credit exposures that share risk characteristics with other similar exposures are collectively evaluated. The collectively evaluated loans include performing loans and unfunded credit commitments. If an exposure does not share risk characteristics with other exposures, the Company generally estimates expected credit losses on an individual basis. These individually assessed loans include TDR and nonaccrual loans.
Allowance for Collectively Evaluated Loans
The allowance for collectively evaluated loans consists of a quantitative component that assesses the different risk factors considered in our models and a qualitative component that considers risk factors external to the models. Each of these components are described below.
Quantitative Component — The Company applies quantitative methods to estimate loan losses by considering a variety of factors such as historical loss experience, the current credit quality of the portfolio, and an economic outlook over the life of the loan. The Company incorporates forward-looking information using macroeconomic scenarios, which include variables that are considered key drivers of increases and decreases in credit losses. The Company utilizes a probability-weighted, multiple-scenario forecast approach. These scenarios may consist of a base forecast representing management's view of the most likely outcome, combined with downside or upside scenarios reflecting possible worsening or improving economic conditions. The quantitative models incorporate a probability-weighted calculation of these macroeconomic scenarios over a reasonable and supportable forecast period. If the life of loans extends beyond the reasonable and supportable forecast period, the Company will consider historical experience or long-run macroeconomic trends over the remaining lives of the loans to estimate the allowance for loan losses.
There were no changes to the overall model methodology. For the three and nine months ended September 30, 2022, there were no changes tomethodology or the reasonable and supportable forecast period and reversion to the historical loss experience method.method for the three and six months ended June 30, 2023 and 2022.
The following table provides key credit risk characteristics and macroeconomic variables that the Company uses to estimate the expected credit losses by portfolio segment:
| | | | | | | | | | | | | | |
| | | | |
| Portfolio Segment | | Risk Characteristics | | Macroeconomic Variables |
| C&I | | Age, size and spread at origination, and risk rating | | Volatility Index and BBB yield to 10-year U.S. Treasury spread |
| CRE, Multifamily residential, and Construction and land | | Delinquency status, maturity date, collateral value, property type, and geographic location | | Unemployment rate, Gross Domestic Product (“GDP”), and U.S. Treasury rates |
| Single-family residential and HELOCs | | FICO score, delinquency status, maturity date, collateral value, and geographic location | | Unemployment rate, GDP, and home price index |
| Other consumer | | Historical loss experienceLoss rate approach | | Immaterial (1) |
| | | | |
(1)Macroeconomic variables are included in the qualitative estimate.
Allowance for Loan Losses for the Commercial Loan Portfolio
The Company’s C&I lifetime loss rate model estimates credit losses by estimating athe loss rate expected over the life of a loan. This loss rate is applied to the amortized cost basis, excluding accrued interest receivable, to determine expected credit losses. The lifetime loss rate model’s reasonable and supportable period spans 11 quarters, thereafter, immediately reverting to the historical average loss rate, expressed through the loan-level lifetime loss rate.
To generate estimates of expected loss at the loan level for CRE, multifamily residential, and construction and land loans, projected probabilities of default (“PDs”) and loss given defaults (“LGDs”) are applied to the estimated exposure at default, considering the term and payment structure of the loan. The forecast of future economic conditions returns to long-run historical economic trends within the reasonable and supportable period.
In order to estimate the life of a loan under both models, the contractual term of the loan is adjusted for estimated prepayments based on historical prepayment experience.
Allowance for Loan Losses for the Consumer Loan Portfolio
For single-family residential and HELOC loans, projected PDs and LGDs are applied to the estimated exposure at default, considering the term and payment structure of the loan, to generate estimates of expected loss at the loan level. The forecast of future economic conditions returns to long-run historical economic trends after the reasonable and supportable period. To estimate the life of a loan for the single-family residential and HELOC loan portfolios, the contractual term of the loan is adjusted for estimated prepayments based on historical prepayment experience. For other consumer loans, the Company uses a loss rate approach.
Qualitative Component — The Company also considers the following qualitative factors in the determination of the collectively evaluated allowance if these factors have not already been captured by the quantitative model. Such qualitative factors may include, but are not limited to:
— loan growth trends;
— the volume and severity of past due financial assets, and the volume and severity of adversely classified financial assets;
— the Company’s lending policies and procedures, including changes in lending strategies, underwriting standards, collection, write-off, and recovery practices;
— knowledge of a borrower’s operations;
— the quality of the Company’s credit review system;
— the experience, ability and depth of the Company’s management and associates;
— the effect of other external factors such as the regulatory and legal environments, or changes in technology;
— actual and expected changes in international, national, regional, and local economic and business conditions in which the Company operates; and
— risk factors in certain industry sectors not captured by the quantitative models.
The magnitude of the impact of these factors on the Company’s qualitative assessment of the allowance for credit losses changes from period to period according to changes made by management in its assessment of these factors. The extent to which these factors change may be dependent on whether they are already reflected in quantitative loss estimates during the current period and the extent to which changes in these factors diverge from period to period.
While the Company’s allowance methodologies strive to reflect all relevant credit risk factors, there continues to be uncertainty associated with, but not limited to, potential imprecision in the estimation process due to the inherent time lag of obtaining information and normal variations between expected and actual outcomes. The Company may hold additional qualitative reserves that are designed to provide coverage for losses attributable to such risk.
Allowance for Individually Evaluated Loans
When a loan no longer shares similar risk characteristics with other loans, such as in the case of certain nonaccrual or TDR loans, the Company estimates the allowance for loan losses on an individual loan basis. The allowance for loan losses for individually evaluated loans is measured as the difference between the recorded value of the loans and their fair value. For loans evaluated individually, the Company uses one of three different asset valuation measurement methods: (1) the fair value of collateral less costs to sell; (2) the present value of expected future cash flows; andor (3) the loan's observable market price. If an individually evaluated loan is determined to be collateral dependent, the Company applies the fair value of the collateral less costs to sell method. If an individually evaluated loan is determined not to be collateral dependent, the Company uses the present value of future cash flows or the observable market value of the loan.
•Collateral-Dependent Loans — The allowance of a collateral-dependent loan is limited to the difference between the recorded value and fair value of the collateral less cost of disposal or sale. As of SeptemberJune 30, 2022,2023, collateral-dependent commercial and consumer loans totaled $36.4$22.0 million and $13.6$11.2 million, respectively. In comparison, collateral-dependent commercial and consumer loans totaled $37.0$47.4 million and $14.0$13.4 million, respectively, as of December 31, 2021.2022. The collateral-dependent loans decreased from December 31, 2022, predominantly driven by the adoption of ASU 2022-02 related to the elimination of TDR guidance. The Company's collateral-dependent loans were secured by real estate. As of both SeptemberJune 30, 20222023 and December 31, 2021,2022, the collateral value of the properties securing the collateral-dependent loans, net of selling costs, exceeded the recorded value of the loans.
The following tables summarize the activitiesactivity in the allowance for loan losses by portfolio segments for the three and ninesix months ended SeptemberJune 30, 20222023 and 2021:2022:
| | | | | Three Months Ended June 30, 2023 |
| | | | | | | | | | | | | | | | | | | | | | | | | | | | | | | | | | | | | | | | | | | | | Commercial | | Consumer | |
| | | | CRE | | Residential Mortgage | | |
| ($ in thousands) | ($ in thousands) | | Three Months Ended September 30, 2022 | ($ in thousands) | | C&I | | CRE | | Multifamily Residential | | Construction and Land | | Single-Family Residential | | HELOCs | | Other Consumer | | Total |
| Commercial | | Consumer | | Total | |
| C&I | | CRE | | Residential Mortgage | | Other
Consumer | | |
| CRE | | Multifamily
Residential | | Construction
and Land | | Single-
Family
Residential | | HELOCs | | |
| Allowance for loan losses, beginning of period | Allowance for loan losses, beginning of period | | $ | 363,282 | | | $ | 140,245 | | | $ | 26,552 | | | $ | 6,682 | | | $ | 21,840 | | | $ | 3,220 | | | $ | 1,449 | | | $ | 563,270 | | Allowance for loan losses, beginning of period | | $ | 376,325 | | | $ | 155,067 | | | $ | 24,526 | | | $ | 9,322 | | | $ | 48,007 | | | $ | 4,971 | | | $ | 1,675 | | | $ | 619,893 | |
| Provision for credit losses on loans | (a) | 9,575 | | | 5,299 | | | 5,047 | | | 817 | | | 6,182 | | | 99 | | | 255 | | | 27,274 | | |
| Provision for (reversal of) credit losses on loans | | Provision for (reversal of) credit losses on loans | (a) | 5,259 | | | 15,685 | | | (1,604) | | | 1,995 | | | 3,501 | | | (444) | | | (367) | | | 24,025 | |
| Gross charge-offs | Gross charge-offs | | (6,894) | | | (288) | | | (5,938) | | | — | | | (775) | | | — | | | (10) | | | (13,905) | | Gross charge-offs | | (7,335) | | | (2,366) | | | — | | | — | | | — | | | (6) | | | (48) | | | (9,755) | |
| Gross recoveries | Gross recoveries | | 7,172 | | | 45 | | | 19 | | | 7 | | | 16 | | | 5 | | | — | | | 7,264 | | Gross recoveries | | 2,065 | | | 119 | | | 16 | | | 8 | | | 5 | | | 5 | | | — | | | 2,218 | |
| Total net recoveries (charge-offs) | | 278 | | | (243) | | | (5,919) | | | 7 | | | (759) | | | 5 | | | (10) | | | (6,641) | | |
| Total net (charge-offs) recoveries | | Total net (charge-offs) recoveries | | (5,270) | | | (2,247) | | | 16 | | | 8 | | | 5 | | | (1) | | | (48) | | | (7,537) | |
| Foreign currency translation adjustment | Foreign currency translation adjustment | | (1,386) | | | — | | | — | | | — | | | — | | | — | | | — | | | (1,386) | | Foreign currency translation adjustment | | (981) | | | — | | | — | | | — | | | — | | | — | | | — | | | (981) | |
| Allowance for loan losses, end of period | Allowance for loan losses, end of period | | $ | 371,749 | | | $ | 145,301 | | | $ | 25,680 | | | $ | 7,506 | | | $ | 27,263 | | | $ | 3,324 | | | $ | 1,694 | | | $ | 582,517 | | Allowance for loan losses, end of period | | $ | 375,333 | | | $ | 168,505 | | | $ | 22,938 | | | $ | 11,325 | | | $ | 51,513 | | | $ | 4,526 | | | $ | 1,260 | | | $ | 635,400 | |
| |
| | | | | | | | | | | | | | | | | | | | | | | | | | | | | | | | | | | | | | | | | | | | | | | | | | |
|
| ($ in thousands) | | Three Months Ended September 30, 2021 |
| Commercial | | Consumer | | Total |
| C&I | | CRE | | Residential Mortgage | | Other
Consumer | |
| | CRE | | Multifamily
Residential | | Construction
and Land | | Single-
Family
Residential | | HELOCs | | |
| Allowance for loan losses, beginning of period | | $ | 362,528 | | | $ | 161,962 | | | $ | 21,925 | | | $ | 15,643 | | | $ | 16,530 | | | $ | 2,938 | | | $ | 4,198 | | | $ | 585,724 | |
| | | | | | | | | | | | | | | | |
| (Reversal of) provision for credit losses on loans | (a) | (23,364) | | | 2,129 | | | (2,660) | | | 9,058 | | | 2,537 | | | 435 | | | 130 | | | (11,735) | |
| | | | | | | | | | | | | | | | |
| Gross charge-offs | | (1,154) | | | (14,229) | | | — | | | (2,674) | | | (912) | | | — | | | (10) | | | (18,979) | |
| Gross recoveries | | 4,203 | | | 187 | | | 652 | | | 267 | | | 137 | | | 19 | | | — | | | 5,465 | |
| Total net recoveries (charge-offs) | | 3,049 | | | (14,042) | | | 652 | | | (2,407) | | | (775) | | | 19 | | | (10) | | | (13,514) | |
| Foreign currency translation adjustment | | (71) | | | — | | | — | | | — | | | — | | | — | | | — | | | (71) | |
| Allowance for loan losses, end of period | | $ | 342,142 | | | $ | 150,049 | | | $ | 19,917 | | | $ | 22,294 | | | $ | 18,292 | | | $ | 3,392 | | | $ | 4,318 | | | $ | 560,404 | |
| | | | | | | | | | | | | | | | |
| | | | | | | | | | | | | | | | |
| | | | | | | | | | | | | | | | |
| | | | | | | | | | | | | | | | |
| | | | | | | | | | | | | | | | |
| | | | | | | | | | | | | | | | |
| | | | | | | | | | | | | | | | |
| | | ($ in thousands) | | Nine Months Ended September 30, 2022 | |
| Commercial | | Consumer | | Total | |
| C&I | | CRE | | Residential Mortgage | | Other
Consumer | | |
| | Three Months Ended June 30, 2022 |
| | | Commercial | | Consumer | |
| | | | CRE | | Residential Mortgage | | |
| ($ in thousands) | ($ in thousands) | | C&I | | CRE | | Multifamily
Residential | | Construction
and Land | | Single-
Family
Residential | | HELOCs | | Other
Consumer | | Total | ($ in thousands) | | C&I | | CRE | | Multifamily Residential | | Construction and Land | | Single-Family Residential | | HELOCs | | Other Consumer | | Total |
| $ | 150,940 | | | $ | 14,400 | | | $ | 15,468 | | | $ | 17,160 | | | $ | 3,435 | | | Allowance for loan losses, beginning of period | | $ | 339,446 | | | $ | 147,104 | | | $ | 24,176 | | | $ | 11,016 | | | $ | 18,210 | | | $ | 3,748 | | | $ | 1,985 | | | $ | 545,685 | |
| (a) | 37,867 | | | (5,013) | | | 16,680 | | | (8,027) | | | 10,569 | | | 59 | | | (140) | | | Provision for (reversal of) credit losses on loans | (a) | 19,030 | | | (6,819) | | | 1,976 | | | (4,338) | | | 3,461 | | | (339) | | | (502) | | | 12,469 | |
| (18,322) | | | (1,357) | | | (5,947) | | | — | | | (775) | | | (193) | | | (90) | | | (26,684) | | Gross charge-offs | | (240) | | | (671) | | | (8) | | | — | | | — | | | (193) | | | (34) | | | (1,146) | |
| Gross recoveries | Gross recoveries | | 16,688 | | | 731 | | | 547 | | | 65 | | | 309 | | | 23 | | | — | | | 18,363 | | Gross recoveries | | 6,514 | | | 631 | | | 408 | | | 4 | | | 169 | | | 4 | | | — | | | 7,730 | |
| Total net (charge-offs) recoveries | | (1,634) | | | (626) | | | (5,400) | | | 65 | | | (466) | | | (170) | | | (90) | | | (8,321) | | |
Total net recoveries (charge-offs) | | Total net recoveries (charge-offs) | | 6,274 | | | (40) | | | 400 | | | 4 | | | 169 | | | (189) | | | (34) | | | 6,584 | |
| Foreign currency translation adjustment | Foreign currency translation adjustment | | (2,736) | | | — | | | — | | | — | | | — | | | — | | | — | | | (2,736) | | Foreign currency translation adjustment | | (1,468) | | | — | | | — | | | — | | | — | | | — | | | — | | | (1,468) | |
| Allowance for loan losses, end of period | Allowance for loan losses, end of period | | $ | 371,749 | | | $ | 145,301 | | | $ | 25,680 | | | $ | 7,506 | | | $ | 27,263 | | | $ | 3,324 | | | $ | 1,694 | | | $ | 582,517 | | Allowance for loan losses, end of period | | $ | 363,282 | | | $ | 140,245 | | | $ | 26,552 | | | $ | 6,682 | | | $ | 21,840 | | | $ | 3,220 | | | $ | 1,449 | | | $ | 563,270 | |
| | |
| | | | | Six Months Ended June 30, 2023 |
| | | | | | | | | | | | | | | | | | | | | | | | | | | | | | | | | | | | | | | | | | | | | Commercial | | Consumer | |
| | | | CRE | | Residential Mortgage | | |
| ($ in thousands) | ($ in thousands) | | Nine Months Ended September 30, 2021 | ($ in thousands) | | C&I | | CRE | | Multifamily Residential | | Construction and Land | | Single-Family Residential | | HELOCs | | Other Consumer | | Total |
| Commercial | | Consumer | | Total | |
| C&I | | CRE | | Residential Mortgage | | Other
Consumer | | |
| CRE | | Multifamily
Residential | | Construction
and Land | | Single-
Family
Residential | | HELOCs | | |
| Allowance for loan losses, December 31, 2022 | | Allowance for loan losses, December 31, 2022 | | $ | 371,700 | | | $ | 149,864 | | | $ | 23,373 | | | $ | 9,109 | | | $ | 35,564 | | | $ | 4,475 | | | $ | 1,560 | | | $ | 595,645 | |
| Impact of ASU 2022-02 adoption | | Impact of ASU 2022-02 adoption | | 5,683 | | | 337 | | | 6 | | | — | | | 1 | | | 1 | | | — | | | 6,028 | |
| Allowance for loan losses, beginning of period | Allowance for loan losses, beginning of period | | $ | 398,040 | | | $ | 163,791 | | | $ | 27,573 | | | $ | 10,239 | | | $ | 15,520 | | | $ | 2,690 | | | $ | 2,130 | | | $ | 619,983 | | Allowance for loan losses, beginning of period | | 377,383 | | | 150,201 | | | 23,379 | | | 9,109 | | | 35,565 | | | 4,476 | | | 1,560 | | | 601,673 | |
| (Reversal of) provision for credit losses on loans | (a) | (42,127) | | | 11,227 | | | (9,436) | | | 14,407 | | | 3,522 | | | 707 | | | 2,226 | | | (19,474) | | |
| Provision for (reversal of) credit losses on loans | | Provision for (reversal of) credit losses on loans | (a) | 4,581 | | | 20,361 | | | (469) | | | 2,205 | | | 15,943 | | | 136 | | | (212) | | | 42,545 | |
| Gross charge-offs | Gross charge-offs | | (20,162) | | | (25,558) | | | (130) | | | (2,954) | | | (1,046) | | | (45) | | | (43) | | | (49,938) | | Gross charge-offs | | (9,235) | | | (2,372) | | | — | | | — | | | — | | | (97) | | | (88) | | | (11,792) | |
| Gross recoveries | Gross recoveries | | 6,301 | | | 589 | | | 1,910 | | | 602 | | | 296 | | | 40 | | | 5 | | | 9,743 | | Gross recoveries | | 3,276 | | | 315 | | | 28 | | | 11 | | | 5 | | | 11 | | | — | | | 3,646 | |
| Total net (charge-offs) recoveries | Total net (charge-offs) recoveries | | (13,861) | | | (24,969) | | | 1,780 | | | (2,352) | | | (750) | | | (5) | | | (38) | | | (40,195) | | Total net (charge-offs) recoveries | | (5,959) | | | (2,057) | | | 28 | | | 11 | | | 5 | | | (86) | | | (88) | | | (8,146) | |
| Foreign currency translation adjustment | Foreign currency translation adjustment | | 90 | | | — | | | — | | | — | | | — | | | — | | | — | | | 90 | | Foreign currency translation adjustment | | (672) | | | — | | | — | | | — | | | — | | | — | | | — | | | (672) | |
| Allowance for loan losses, end of period | Allowance for loan losses, end of period | | $ | 342,142 | | | $ | 150,049 | | | $ | 19,917 | | | $ | 22,294 | | | $ | 18,292 | | | $ | 3,392 | | | $ | 4,318 | | | $ | 560,404 | | Allowance for loan losses, end of period | | $ | 375,333 | | | $ | 168,505 | | | $ | 22,938 | | | $ | 11,325 | | | $ | 51,513 | | | $ | 4,526 | | | $ | 1,260 | | | $ | 635,400 | |
| |
| | | | | | | | | | | | | | | | | | | | | | | | | | | | | | | | | | | | | | | | | | | | | | | | | | |
|
| | Six Months Ended June 30, 2022 |
| | Commercial | | Consumer | | |
| | | | CRE | | Residential Mortgage | | | | |
| ($ in thousands) | | C&I | | CRE | | Multifamily Residential | | Construction and Land | | Single-Family Residential | | HELOCs | | Other Consumer | | Total |
| Allowance for loan losses, beginning of period | | $ | 338,252 | | | $ | 150,940 | | | $ | 14,400 | | | $ | 15,468 | | | $ | 17,160 | | | $ | 3,435 | | | $ | 1,924 | | | $ | 541,579 | |
| Provision for (reversal of) credit losses on loans | (a) | 28,292 | | | (10,312) | | | 11,633 | | | (8,844) | | | 4,387 | | | (40) | | | (395) | | | 24,721 | |
| Gross charge-offs | | (11,428) | | | (1,069) | | | (9) | | | — | | | — | | | (193) | | | (80) | | | (12,779) | |
| Gross recoveries | | 9,516 | | | 686 | | | 528 | | | 58 | | | 293 | | | 18 | | | — | | | 11,099 | |
| Total net (charge-offs) recoveries | | (1,912) | | | (383) | | | 519 | | | 58 | | | 293 | | | (175) | | | (80) | | | (1,680) | |
| Foreign currency translation adjustment | | (1,350) | | | — | | | — | | | — | | | — | | | — | | | — | | | (1,350) | |
| Allowance for loan losses, end of period | | $ | 363,282 | | | $ | 140,245 | | | $ | 26,552 | | | $ | 6,682 | | | $ | 21,840 | | | $ | 3,220 | | | $ | 1,449 | | | $ | 563,270 | |
| | | | | | | | | | | | | | | | |
| | | | | | | | | | | | | | | | |
| | | | | | | | | | | | | | | | |
| | | | | | | | | | | | | | | | |
| | | | | | | | | | | | | | | | |
| | | | | | | | | | | | | | | | |
| | | | | | | | | | | | | | | | |
In addition to the allowance for loan losses, the Company maintains an allowance for unfunded credit commitments. The Company has three general areas for which it provides the allowance for unfunded credit commitments: (1) recourse obligations for loans sold, (2) letters of credit, and (3) unfunded lending commitments. The allowance for unfunded credit commitments is maintained at a level that management believes to be sufficient to absorb estimated expected credit losses related to unfunded credit facilities. See Note 1011 — Commitments and Contingencies to the Consolidated Financial Statements in this Form 10-Q for additional information related to unfunded credit commitments. The following table summarizes the activities in the allowance for unfunded credit commitments for the three and ninesix months ended SeptemberJune 30, 2022 2023 and 2021:2022:
| | | ($ in thousands) | | Three Months Ended September 30, | | Nine Months Ended September 30, | | |
| | Three Months Ended June 30, | | Six Months Ended June 30, | |
| ($ in thousands) | ($ in thousands) | | 2022 | | 2021 | | 2022 | | 2021 | | ($ in thousands) | | 2023 | | 2022 | | 2023 | | 2022 | |
| | | | | | | | | Unfunded credit facilities | | | | | | | | | |
| Allowance for unfunded credit commitments, beginning of period | Allowance for unfunded credit commitments, beginning of period | | $ | 24,304 | | | $ | 26,300 | | | $ | 27,514 | | | $ | 33,577 | | | Allowance for unfunded credit commitments, beginning of period | | $ | 27,741 | | | $ | 23,262 | | | $ | 26,264 | | | $ | 27,514 | | |
| | (Reversal of) provision for credit losses on unfunded credit commitments | (b) | (274) | | | 1,735 | | | (3,495) | | | (5,526) | | | |
| Provision for (reversal of) credit losses on unfunded credit commitments | | Provision for (reversal of) credit losses on unfunded credit commitments | (b) | 1,975 | | | 1,031 | | | 3,455 | | | (3,221) | | |
| Foreign currency translation adjustment | Foreign currency translation adjustment | | 11 | | | 1 | | | 22 | | | (15) | | | Foreign currency translation adjustment | | 12 | | | 11 | | | 9 | | | 11 | | |
| Allowance for unfunded credit commitments, end of period | Allowance for unfunded credit commitments, end of period | | 24,041 | | | 28,036 | | | 24,041 | | | 28,036 | | | Allowance for unfunded credit commitments, end of period | | $ | 29,728 | | | $ | 24,304 | | | $ | 29,728 | | | $ | 24,304 | | |
| | Provision for (reversal of) credit losses | (a) + (b) | $ | 27,000 | | | $ | (10,000) | | | $ | 48,500 | | | $ | (25,000) | | | |
| Provision for credit losses | | Provision for credit losses | (a) + (b) | $ | 26,000 | | | $ | 13,500 | | | $ | 46,000 | | | $ | 21,500 | | |
|
The allowance for credit losses was $606.6$665.1 million as of SeptemberJune 30, 2022,2023, an increase of $37.5$43.2 million, compared with $569.1$621.9 million as of December 31, 2021.2022. The increase in the allowance for credit losses was primarily driven by the current economic outlook whichas well as loan growth. The current economic outlook reflected ongoing concerns with inflation, global supply chain disruptions and risinghigh interest rates, as well as loan growth.rates.
Loans Held-for-SaleThe Company considers multiple economic scenarios to develop the estimate of the allowance for loan losses. The scenarios may consist of a baseline forecast representing management's view of the most likely outcome, and downside or upside scenarios that reflect possible worsening or improving economic conditions, respectively. As of June 30, 2023, the Company did not assign a weighting to its upside scenario. Instead, it assigned a slightly higher weighting to its downside scenario, while maintaining the same weighting to its baseline scenario, compared with the weightings assigned as of December 31, 2022. Management remains cautious regarding the economic outlook given the persistently high level of inflation, high interest rates, the recent strain to the financial system, and continued concerns on global oil prices and supply-chain issues. The U.S. baseline GDP growth forecast for the second half of 2023 has been lowered compared with the December 2022 forecast. The GDP growth forecast for the full year 2024, was lowered to 1.4% from the previous 2.0% forecasted as of December 31, 2022, reflecting an expected GDP slow-down as interest-sensitive spending weakens amid elevated interest rate environment. Average unemployment rates in the U.S. are expected to remain stable at 3.6% for the second half of 2023. However, job market softening is expected in 2024 and 2025. Compared with the baseline scenario, the downside scenario assumes that the combination of increasing supply shortages, political tensions between China and Taiwan, recent bank failures, still-elevated inflation, and the Federal Reserve’s decision to keep the federal funds rate elevated will lead to a recession in the third quarter of 2023.
Loans held-for-sale consisted of a $14.5 million multifamily residential loan and $635 thousand in single-family residential loans as of September 30, 2022 and December 31, 2021, respectively. Refer to Note 1 — Summary of Significant Accounting Policies— Significant Accounting Policies — Loans Held-for-Sale to the Consolidated Financial Statements in the Company’s 2021 Form 10-K for additional details.
Loan Transfers, Sales and Purchases
The Company’s primary business focus is on directly originated loans. The Company also purchases loans and participates in loansloan financing with other banks. In the normal course of doing business, the Company also provides other financial institutions with the ability to participate in commercial loans that it originates, by selling loans to such institutions. Purchased loans may be transferred from held-for-investment to held-for-sale, and write-downs to allowance for loan losses are recorded, when appropriate. The following tables provide information on the carrying value of loans transferred, loans sold and purchased for the held-for-investment portfolio, during the three and ninesix months ended SeptemberJune 30, 20222023 and 2021:2022:
| | | | | Three Months Ended June 30, 2023 |
| | | | | | | | | | | | | | | | | | | | | | | | | | | | | | | | Commercial | | Consumer | | | |
| | | | | | | | Residential Mortgage | | | |
| ($ in thousands) | ($ in thousands) | | Three Months Ended September 30, 2022 | ($ in thousands) | | C&I | | CRE | | | Construction and Land | | Single-Family Residential | | | Total |
| Commercial | | Consumer | | | Total | |
| C&I | | CRE | | | Residential Mortgage | | | |
| CRE | | Multifamily
Residential | | | Single-Family
Residential | | | Total | | |
Loans transferred from held-for-investment to held-for-sale (1) | Loans transferred from held-for-investment to held-for-sale (1) | | $ | 59,069 | | | $ | 33,616 | | | $ | 14,500 | | | | $ | 5,178 | | | | $ | 112,363 | | Loans transferred from held-for-investment to held-for-sale (1) | | $ | 111,396 | | | $ | — | | | | $ | 8,154 | | | $ | — | | | | $ | 119,550 | |
| Sales (2)(3) | | Sales (2)(3) | | $ | 115,735 | | | $ | — | | | | $ | 8,154 | | | $ | — | | | | $ | 123,889 | |
Purchases (4) | | Purchases (4) | | $ | 38,279 | | | $ | — | | | | $ | — | | | $ | 79,137 | | | | $ | 117,416 | |
| Sales (2)(3)(4) | | $ | 87,597 | | | $ | 33,616 | | | $ | — | | | | $ | 5,952 | | | | $ | 127,165 | | |
Purchases (5) | | $ | 56,507 | | | $ | — | | | $ | — | | | | $ | 1,155 | | | | $ | 57,662 | | |
|
| | | | | | | | | | | | | | | | | | | | | | | | | | | | | | | | | | | | | | |
|
| ($ in thousands) | | Three Months Ended September 30, 2021 |
| Commercial | | Consumer | | | | | | Total |
| C&I | | CRE | | | | Residential Mortgage | | | | | |
| | CRE | | | | Construction
and Land | | Single-Family
Residential | | | | |
Loans transferred from held-for-investment to held-for-sale (1) | | $ | 117,196 | | | $ | 24,120 | | | | | $ | 17,226 | | | $ | 5,238 | | | | | | | $ | 163,780 | |
| | | | | | | | | | | | | | | | |
Sales (2)(3)(4) | | $ | 118,851 | | | $ | 24,120 | | | | | $ | 19,900 | | | $ | 6,959 | | | | | | | $ | 169,830 | |
Purchases (5) | | $ | 65,354 | | | $ | — | | | | | $ | — | | | $ | 137,937 | | | | | | | $ | 203,291 | |
|
| | | | | Three Months Ended June 30, 2022 |
| | | | | | | | | | | | | | | | | | | | | | | | | | | | | | | Commercial | | | Consumer | | | |
| | | | | | Residential Mortgage | | | |
| ($ in thousands) | ($ in thousands) | | Nine Months Ended September 30, 2022 | ($ in thousands) | | C&I | | CRE | | | | Single-Family Residential | | | Total |
| Commercial | | | Consumer | | | Total | |
| C&I | | CRE | | | Residential Mortgage | | | |
| CRE | | Multifamily
Residential | | | Single-Family
Residential | | | |
Loans transferred from held-for-investment to held-for-sale (1) | Loans transferred from held-for-investment to held-for-sale (1) | | $ | 378,841 | | | $ | 65,250 | | | $ | 14,500 | | | | $ | 5,178 | | | | $ | 463,769 | | Loans transferred from held-for-investment to held-for-sale (1) | | $ | 208,335 | | | $ | 9,854 | | | | | $ | — | | | | $ | 218,189 | |
| Loans transferred from held-for-sale to held-for-investment | Loans transferred from held-for-sale to held-for-investment | | $ | — | | | $ | — | | | $ | — | | | | $ | 631 | | | | $ | 631 | | Loans transferred from held-for-sale to held-for-investment | | $ | — | | | $ | — | | | | | $ | 631 | | | | $ | 631 | |
Sales (2)(3) | | Sales (2)(3) | | $ | 180,029 | | | $ | 9,854 | | | | | $ | — | | | | $ | 189,883 | |
Purchases (4) | | Purchases (4) | | $ | 194,066 | | | $ | — | | | | | $ | 122,723 | | | | $ | 316,789 | |
| Sales (2)(3)(4) | | $ | 375,100 | | | $ | 65,250 | | | $ | — | | | | $ | 6,403 | | | | $ | 446,753 | | |
Purchases (5) | | $ | 361,169 | | | $ | — | | | $ | — | | | | $ | 238,253 | | | | $ | 599,422 | | |
|
| | | ($ in thousands) | | Nine Months Ended September 30, 2021 | |
| Commercial | | Consumer | | | Total | |
| C&I | | CRE | | Residential Mortgage | | | |
| | Six Months Ended June 30, 2023 |
| | | Commercial | | Consumer | | | |
| | | | | Residential Mortgage | | | |
| ($ in thousands) | ($ in thousands) | | C&I | | CRE | | Multifamily
Residential | | Construction
and Land | | Single-Family
Residential | | | Total | ($ in thousands) | | C&I | | CRE | | | Construction and Land | | Single-Family Residential | | | Total |
| $ | 61,171 | | | $ | — | | | $ | 17,226 | | | $ | 5,238 | | | | Loans transferred from held-for-investment to held-for-sale (1) | | $ | 268,272 | | | $ | 3,600 | | | | $ | 8,154 | | | $ | — | | | | $ | 280,026 | |
| | $ | 329,233 | | | $ | 61,171 | | | $ | — | | | $ | 19,900 | | | $ | 17,123 | | | | $ | 427,427 | | Sales (4)(3) | | $ | 291,667 | | | $ | 3,600 | | | | $ | 8,154 | | | $ | — | | | | $ | 303,421 | |
Purchases (5)(4) | Purchases (5)(4) | | $ | 310,447 | | | $ | — | | | $ | 370 | | | $ | — | | | $ | 434,900 | | | | $ | 745,717 | | Purchases (5)(4) | | $ | 60,962 | | | $ | — | | | | $ | — | | | $ | 211,136 | | | | $ | 272,098 | |
|
| | | | | | | | | | | | | | | | | | | | | | | | | | | | | | | | | | |
|
| | Six Months Ended June 30, 2022 |
| | Commercial | | Consumer | | | | | | |
| | | | | | Residential Mortgage | | | | | | |
| ($ in thousands) | | C&I | | CRE | | | | | | Single-Family Residential | | | | | | Total |
Loans transferred from held-for-investment to held-for-sale (1) | | $ | 319,772 | | | $ | 31,634 | | | | | | | $ | — | | | | | | | $ | 351,406 | |
| Loans transferred from held-for-sale to held-for-investment | | $ | — | | | $ | — | | | | | | | $ | 631 | | | | | | | $ | 631 | |
Sales (2)(3) | | $ | 287,503 | | | $ | 31,634 | | | | | | | $ | 451 | | | | | | | $ | 319,588 | |
Purchases (4) | | $ | 304,662 | | | $ | — | | | | | | | $ | 237,098 | | | | | | | $ | 541,760 | |
|
(1)Includes write-downs of $8.7 million$308 thousand and $8.9 million$581 thousand to the allowance for loan losses related to loans transferred from held-for-investment to held-for-sale for the three and ninesix months ended SeptemberJune 30, 2022,2023, respectively, and $3.6 million$158 thousand and $4.9 million$217 thousand for the three and ninesix months ended SeptemberJune 30, 2021,2022, respectively.
(2)Includes originated loans sold of $86.2$92.2 million and $253.9$203.2 million for the three and ninesix months ended SeptemberJune 30, 2022,2023, respectively, and $143.3$55.4 million and $341.9$167.7 million for the three and ninesix months ended SeptemberJune 30, 2021,2022, respectively. Originated loans sold consisted primarily of C&I and CRE loans for each of the three and ninesix months ended SeptemberJune 30, 20222023 and 2021.2022.
(3)Includes $40.9$31.7 million and $192.9$100.3 million of purchased loans sold in the secondary market for the three and ninesix months ended SeptemberJune 30, 2022,2023, respectively, and $26.5$134.5 million and $85.5$151.9 million for the three and ninesix months ended SeptemberJune 30, 2021,2022, respectively.
(4)Net gains on sales of loans were $2.1 million and $6.0 million for the three and nine months ended September 30, 2022, respectively, and $3.3 million and $6.6 million for the three and nine months ended September 30, 2021, respectively.
(5)C&I loan purchases were comprised primarily of syndicated C&I term loans.
Note 8 — Investments in Qualified Affordable Housing Partnerships, Tax Credit and Other Investments, Net and Variable Interest Entities
The CRA encourages banks to meet the credit needs of their communities, particularly low- and moderate-income individuals and neighborhoods. The Company invests in certain affordable housing projects in the form of ownership interests in limited partnerships or limited liability companies that qualify for CRA consideration and tax credits. These entities are formed to develop and operate apartment complexes designed as high-quality affordable housing for lower income tenants throughout the U.S. To fully utilize the available tax credits, each of these entities must meet the regulatory affordable housing requirements for a 15-year minimum 15-year compliance period. In addition to affordable housing projects, the Company invests in small business investment companies and new market tax credit projects that qualify for CRA consideration, as well as eligible projects that qualify for renewable energy and historic tax credits. Investments in renewable energy tax credits help promote the development of renewable energy sources, and investments in historic tax credits promote the rehabilitation of historic buildings and economic revitalization of the surrounding areas.
For the Company’s accounting policies on tax credit investments, see
— Summary of Significant Accounting Policies — Significant Accounting Policies — Securitiesand Investments in Qualified Affordable Housing Partnerships, Net
The Company records its investments in qualified affordable housing partnerships, net, using the proportional amortization method if certain criteria are met. Under the proportional amortization method, the Company amortizes the initial cost of the investment in proportion to the tax credits and other tax benefits received and recognizes the amortization in Income tax expense on the Consolidated Statement of Income.
Investments in Tax Credit and Other Investments, Net
to the Consolidated Financial Statements in the Company’s 2022 Form 10-K for additional details. For investments in tax credit and other investments, the Company applies the equity or fair value method of accounting dependinga discussion on the Company’s ownership percentage. For equity investments without readily determinable fair values, the Company elected the measurement alternative under ASU 2016-01 valuing them at cost less impairment adjusted for observable price changes. Tax creditevaluation and other investments are evaluated for possible OTTI on an annual basis or when events or changes in circumstances suggest that the carrying amountmonitoring process of the tax credit investments, may not be realizable. OTTI charges and impairment recoveries are recorded within Amortization of tax credit and other investments on the Consolidated Statement of Income. Referrefer to Note 3 — Fair Value Measurement and Fair Value of Financial Instruments — Investments in Qualified Affordable Housing Partnerships, Tax Credit and Other Investments, Net to the Consolidated Financial Statements in this Form 10-Q for a discussion on the Company’s impairment evaluation and monitoring process of tax credit investments.10-Q.
The following table presents investments and unfunded commitments of the Company’s qualified affordable housing partnerships, tax credit, and other investments as of SeptemberJune 30, 20222023 and December 31, 2021:2022:
| | | | September 30, 2022 | | December 31, 2021 | | June 30, 2023 | | December 31, 2022 |
| ($ in thousands) | ($ in thousands) | | Assets | | Liabilities - Unfunded Commitments (1) | | Assets | | Liabilities - Unfunded Commitments (1) | ($ in thousands) | | Assets | | Liabilities - Unfunded Commitments (1) | | Assets | | Liabilities - Unfunded Commitments (1) |
| | Investments in qualified affordable housing partnerships, net | Investments in qualified affordable housing partnerships, net | | $ | 400,871 | | | $ | 254,700 | | | $ | 289,741 | | | $ | 146,152 | | Investments in qualified affordable housing partnerships, net | | $ | 422,331 | | | $ | 255,066 | | | $ | 413,253 | | | $ | 266,654 | |
| Investments in tax credit and other investments, net | Investments in tax credit and other investments, net | | 324,383 | | | 153,840 | | | 338,522 | | | 163,464 | | Investments in tax credit and other investments, net | | 393,140 | | | 278,915 | | | 350,003 | | | 185,797 | |
| Total | Total | | $ | 725,254 | | | $ | 408,540 | | | $ | 628,263 | | | $ | 309,616 | | Total | | $ | 815,471 | | | $ | 533,981 | | | $ | 763,256 | | | $ | 452,451 | |
|
(1)Included in Accrued expenses and other liabilities on the Consolidated Balance Sheet.
Investments in tax credit and other investments, net presented in the table above include equity securities that are mutual funds with readily determinable fair values of $23.8$24.2 million and $26.6$24.0 million as of SeptemberJune 30, 20222023 and December 31, 2021,2022, respectively. The Company invests in these mutual funds for CRA purposes. These equity securities were measured at fair value with changes in fair value recorded in Other investment income on the Consolidated Statement of Income. Equity securities with readily determinable fair values were included in Investments in qualified affordable housing partnerships, tax credit and other investments, net on the Consolidated Balance Sheet.
The Company also held equity securities without readily determinable fair values totaling $34.6$37.0 million and $33.1$36.5 million as of SeptemberJune 30, 20222023 and December 31, 2021, respectively, which were measured using the measurement alternative of cost less impairment and adjusted for observable price changes. For the three and nine months ended September 30, 2022, and 2021, there were no adjustments made to these securities. Equity securities without readily determinable fair values were included in Investments in qualified affordable housing partnerships, tax credit and other investments, net and Other assets on the Consolidated Balance Sheet.respectively.
The following table presents additional information related to the investments in qualified affordable housing partnerships, tax credit and other investments for the three and ninesix months ended SeptemberJune 30, 20222023 and 2021:2022:
| | | | | Three Months Ended June 30, | | Six Months Ended June 30, | |
| ($ in thousands) | ($ in thousands) | | Three Months Ended September 30, | | Nine Months Ended September 30, | | ($ in thousands) | | 2023 | | 2022 | | 2023 | | 2022 | |
| 2022 | | 2021 | | 2022 | | 2021 | | |
| Investments in qualified housing partnerships, net | | | | | | | | | | |
| Investments in qualified housing partnerships, net: | | Investments in qualified housing partnerships, net: | | | | | | | | | |
| Tax credits and other tax benefits recognized | Tax credits and other tax benefits recognized | | $ | 13,180 | | | $ | 11,361 | | | $ | 38,764 | | | $ | 34,083 | | | Tax credits and other tax benefits recognized | | $ | 15,304 | | | $ | 12,754 | | | $ | 31,398 | | | $ | 25,584 | | |
| Amortization expense included in income tax expense | Amortization expense included in income tax expense | | $ | 10,431 | | | $ | 9,147 | | | $ | 30,498 | | | $ | 25,595 | | | Amortization expense included in income tax expense | | $ | 10,506 | | | $ | 10,042 | | | $ | 23,172 | | | $ | 20,067 | | |
| Investments in tax credit and other investments, net | | | |
| Investments in tax credit and other investments, net: | | Investments in tax credit and other investments, net: | | |
Amortization of tax credit and other investments | Amortization of tax credit and other investments | | $ | 19,874 | | | $ | 38,008 | | | $ | 48,753 | | | $ | 90,657 | | | Amortization of tax credit and other investments | | $ | 55,914 | | | $ | 14,979 | | | $ | 66,024 | | | $ | 28,879 | | |
| Unrealized losses on equity securities with readily determinable values | Unrealized losses on equity securities with readily determinable values | | $ | (1,014) | | | $ | (88) | | | $ | (2,958) | | | $ | (515) | | | Unrealized losses on equity securities with readily determinable values | | $ | (369) | | | $ | (783) | | | $ | (8) | | | $ | (1,944) | | |
Impairment recoveries (1) | | $ | — | | | $ | — | | | $ | — | | | $ | 1,250 | | | |
| |
(1)ForIncludes net impairment recoveries of $1.4 million and $1.6 million for the ninethree and six months ended SeptemberJune 30, 2021,2023, respectively, primarily related to historic tax credits. In comparison, there were no impairment recoveries were related to one historic tax credit and two energy tax credits.or losses for three or six months ended June 30, 2022.
Variable Interest Entities
The majority of both the investments in affordable housing partnerships and tax credit and other investments discussed above are variable interest entities (“VIEs”) where the Company is a limited partner in these partnerships, and an unrelated third party is typically the general partner or managing member who has control over the significant activities of these investments. While the Company’s interest in some of the investments may exceed 50% of the outstanding equity interests, the Company does not consolidate these structuresinvestments due to the general partner’s or managing member’s ability to manage the entity, which is indicative of the general partner’s or managing member’s power over the entity. The Company’s maximum exposure to loss in connection with these partnerships consists of the unamortized investment balance and any tax credits claimed that may become subject to recapture.
Special purpose entities formed in connection with securitization transactions are generally considered VIEs. A CLO is a VIE that purchases a pool of assets consisting primarily of non-investment grade corporate loans, and issues multiple tranches of notes to investors to fund the asset purchases and pay upfront expenses associated with forming the CLO. The Company served as the collateral manager of a CLO that closed in 2019 and subsequently reassigned its portfolio manager responsibilities in 2020. The Company retained the top three investment grade-rated tranches issued by the CLO, for which the total carrying amount was $281.2 million and $291.7 million as of September 30, 2022 and December 31, 2021, respectively.
Note 9 — Goodwill
Total goodwill was $465.7 million as of both SeptemberJune 30, 20222023 and December 31, 2021.2022. The Company’s goodwill impairment test is performed annually, as of December 31, or more frequently ifas events occur or circumstances change that would more-likely-than-not reduce the fair value of a reporting unit below its carrying value. Based on the Company’s annual goodwill impairment testingtest as of December 31, 2021,2022, there was no impairment. Additional information pertaining to the Company’s accounting policy for goodwill is summarized in Note 1 — Summary of Significant Accounting Policies — Significant Accounting Policies — Goodwill and Other Intangible Assets to the Consolidated Financial Statements in the Company’s 20212022 Form 10-K. Given the recent volatility in the banking industry, the Company performed an analysis of goodwill during the second quarter of 2023 that consisted of a qualitative assessment to determine if it is more likely than not that the carrying values of each reporting unit exceeded their estimated fair values. The results of this analysis indicated that no impairment of goodwill existed as of June 30, 2023.
Note 10 — Short-Term Borrowings and Long-Term Debt
Short-Term Borrowings — Bank Term Funding Program
As of SeptemberJune 30, 2023, the Company’s short-term borrowings consisted of funds from the Bank Term Funding Program (“BTFP”). In March 2023, the Federal Reserve announced the creation of the BTFP, which was designed to provide additional liquidity to U.S. depository institutions. The advances will be limited to the par value of eligible collateral pledged by the borrower, for a term of up to one year. U.S. federally insured depository institutions can request advances under the BTFP until at least March 11, 2024.
The following table presents details of the Company’s short-term borrowings as of June 30, 2023. The Company pledged eligible U.S. government agency and U.S. government-sponsored enterprise debt and mortgage-backed securities, and U.S. Treasury securities as collateral for the borrowings under the BTFP. As of June 30, 2023, the carrying amount of the Company’s pledged securities to the BTFP totaled $4.46 billion with a remaining borrowing capacity of $299.4 million. In comparison, there were no short-term borrowings as of December 31, 2022.
| | | | | | | | | | | | | | | | | | | | | | | | |
|
| | | | | | | | June 30, 2023 | | |
| ($ in thousands) | | | | Interest Rate | | Maturity Date | | Amount | | |
| | | | | | | | | | |
| | | | | | | | | | |
| | | | | | | | | | |
| Short-term borrowings | | | | 4.37% | | 3/19/2024 | | $ | 4,500,000 | | | |
| | | | | | | | | | |
| | | | | | | | | | |
| | | | | | | | | | |
|
Long-Term Debt — Junior Subordinated Debt
Long-term debt totaled $148.1 million as of June 30, 2023 and $148.0 million as of December 31, 2022. The interest rates on the junior subordinated debt were based on London Interbank Offered Rate plus the applicable stated margin through June 30, 2023. The junior subordinated debt will be based on the Secured Overnight Financing Rate at the next scheduled repricing date, subsequent to June 30, 2023. The junior subordinated debt had coupon interest rates ranging from 6.90% to 7.45% as of June 30, 2023 and 6.12% to 6.67% as of December 31, 2022. The junior subordinated debt had remaining maturities ranging between 11.4 years and 14.2 years as of June 30, 2023. For additional information on the junior subordinated debt, refer to Note 10— Federal Home Loan Bank Advances and Long-Term Debt to the Consolidated Financial Statements in the Company’s 2022 the Company reviewed recent market movements, as well as its business performance and market capitalization, and concluded that goodwill was not impaired.Form 10-K.
Note 1011 — Commitments and Contingencies
Commitments to Extend Credit — In the normal course of doing business, the Company provides loan commitments to customers on predetermined terms. These outstanding commitments to extend credit are not reflected in the accompanying Consolidated Financial Statements. While the Company does not anticipate losses from these transactions, commitments to extend credit are included in determining the appropriate level of allowance for unfunded credit commitments, and outstanding commercial letters of credit and standby letters of credit (“SBLCs”).
The following table presents the Company’s credit-related commitments as of SeptemberJune 30, 20222023 and December 31, 2021:2022:
| | | | September 30, 2022 | | December 31, 2021 | | June 30, 2023 | | December 31, 2022 |
| ($ in thousands) | ($ in thousands) | | Expire in One Year or Less | | Expire After One Year Through Three Years | | Expire After Three Years Through Five Years | | Expire After Five Years | | Total | | Total | ($ in thousands) | | Expire in One Year or Less | | Expire After One Year
Through Three Years | | Expire After Three Years
Through Five Years | | Expire After Five Years | | Total | | Total |
| Loan commitments | Loan commitments | | $ | 2,961,900 | | | $ | 2,103,347 | | | $ | 1,130,044 | | | $ | 1,614,124 | | | $ | 7,809,415 | | | $ | 6,911,398 | | Loan commitments | | $ | 4,583,179 | | | $ | 3,734,399 | | | $ | 993,345 | | | $ | 125,704 | | | $ | 9,436,627 | | | $ | 8,211,571 | |
| Commercial letters of credit and SBLCs | Commercial letters of credit and SBLCs | | 689,949 | | | 438,336 | | | 55,015 | | | 1,085,513 | | | 2,268,813 | | | 2,221,699 | | Commercial letters of credit and SBLCs | | 717,105 | | | 513,359 | | | 90,696 | | | 1,094,248 | | | 2,415,408 | | | 2,291,966 | |
| Total | Total | | $ | 3,651,849 | | | $ | 2,541,683 | | | $ | 1,185,059 | | | $ | 2,699,637 | | | $ | 10,078,228 | | | $ | 9,133,097 | | Total | | $ | 5,300,284 | | | $ | 4,247,758 | | | $ | 1,084,041 | | | $ | 1,219,952 | | | $ | 11,852,035 | | | $ | 10,503,537 | |
| | |
Loan commitments are agreements to lend to customers provided there are no violations of any conditions established in the agreement. Commitments generally have fixed expiration dates or other termination clauses and may require maintenance of compensatory balances.commitment fees. Since many of the commitments are expected to expire without being drawn upon, the total commitment amounts do not necessarily represent future funding requirements.
Commercial letters of credit are issued to facilitate domestic and foreign trade transactions, while SBLCs are generally contingent upon the failure of the customers to perform according to the terms of the underlying contract with the third party. As a result, the total contractual amounts do not necessarily represent future funding requirements. The Company’s historical experience is that SBLCs typically expire without being funded. Additionally, in many cases, the Company holds collateral in various forms against these SBLCs. As part of its risk management activities, the Company monitors the creditworthiness of customers in conjunction with its SBLC exposure. Customers are obligated to reimburse the Company for any payment made on the customers’ behalf. If the customers fail to pay, the Company would, as applicable, liquidate the collateral and/or offset existing accounts. As of SeptemberJune 30, 2022,2023, total letters of credit of $2.27$2.42 billion consisted of SBLCs of $2.23$2.38 billion and commercial letters of credit of $39.4$33.5 million. AsIn comparison, as of December 31, 2021,2022, total letters of credit of $2.22$2.29 billion consisted of SBLCs of $2.14$2.27 billion and commercial letters of credit of $78.9$21.6 million. As of both SeptemberJune 30, 20222023 and December 31, 2021,2022, substantially all SBLCs were ratedgraded as “Pass” byutilizing the Bank’s internal credit risk rating system.
The Company applies the same credit underwriting criteria to extend loans, commitments, and conditional obligations to customers. Each customer’s creditworthiness is evaluated on a case-by-case basis. Collateral and financial guarantees may be obtained based on management’s assessment of a customer’s credit risk. Collateral may include cash, accounts receivable, inventory, personal property, plant and equipment, and real estate property.
Estimated exposure to loss from these commitments is included in the allowance for unfunded credit commitments and amounted to $24.0$29.7 million and $27.5$26.2 million as of SeptemberJune 30, 20222023 and December 31, 2021,2022, respectively.
Guarantees — From time to time, the Company sells or securitizes single-family and multifamily residential loans with recourse in the ordinary course of business. The Company is obligated to repurchase up to the recourse component of the loans if the loans default. The following table presents the carrying amounts of loans sold or securitized with recourse and the maximum potential future payments as of SeptemberJune 30, 20222023 and December 31, 2021:2022:
| | | ($ in thousands) | | Maximum Potential Future Payments | | Carrying Value | |
| September 30,
2022 | | December 31,
2021 | | September 30,
2022 | | December 31,
2021 | |
| | Maximum Potential Future Payments | | Carrying Value |
| | | June 30,
2023 | | December 31,
2022 | | June 30,
2023 | | December 31,
2022 |
| ($ in thousands) | ($ in thousands) | | Expire in One Year or Less | | | Expire
After
One Year
Through
Three
Years | | Expire
After
Three
Years
Through
Five
Years | | Expire After Five Years | | Total | | Total | | Total | | Total | ($ in thousands) | | Expire in One Year or Less | | | Expire After One Year
Through Three Years | | Expire After Three Years
Through Five Years | | Expire After Five Years | | Total | | Total | | Total | | Total |
| $ | 25 | | | | $ | 126 | | | $ | 31 | | | $ | 6,752 | | | $ | 6,934 | | | $ | 7,926 | | | $ | 6,934 | | | $ | 7,926 | | Single-family residential loans sold or securitized with recourse | | $ | 35 | | | | $ | 39 | | | $ | 30 | | | $ | 6,258 | | | $ | 6,362 | | | $ | 6,781 | | | $ | 6,362 | | | $ | 6,781 | |
| — | | | | — | | | — | | | 14,996 | | | 14,996 | | | 14,996 | | | 21,624 | | | 23,169 | | Multifamily residential loans sold or securitized with recourse | | — | | | | — | | | — | | | 14,996 | | | 14,996 | | | 14,996 | | | 20,726 | | | 21,320 | |
| Total | Total | | $ | 25 | | | | $ | 126 | | | $ | 31 | | | $ | 21,748 | | | $ | 21,930 | | | $ | 22,922 | | | $ | 28,558 | | | $ | 31,095 | | Total | | $ | 35 | | | | $ | 39 | | | $ | 30 | | | $ | 21,254 | | | $ | 21,358 | | | $ | 21,777 | | | $ | 27,088 | | | $ | 28,101 | |
| | |
The Company’s recourse reserve related to these guarantees is included in the allowance for unfunded credit commitments and totaled $36 thousand and $29$37 thousand as of SeptemberJune 30, 20222023 and December 31, 2021,2022, respectively. The allowance for unfunded credit commitments is included in Accrued expenses and other liabilities on the Consolidated Balance Sheet. The Company continues to experience minimal losses from the single-family and multifamily residential loan portfolios sold or securitized with recourse.
Litigation — The Company is a party to various legal actions arising in the ordinary course of its business. In accordance with ASC 450, Contingencies, the Company accrues reserves for outstanding lawsuits, claims and proceedings when a loss contingency is probable and can be reasonably estimated. The Company estimates the amount of loss contingencies using current available information from legal proceedings, advice from legal counsel and available insurance coverage. Due to the inherent subjectivity of the assessments and unpredictability of the outcomes of the legal proceedings, any amounts accrued or included in this aggregate amount may not represent the ultimate loss to the Company from the legal proceedings in question. Thus, the Company’s exposure and ultimate losses may be higher, and possibly significantly more, than the amounts accrued.
Other Commitments —
The Company has commitments
While it is impossible to invest in qualified affordable housing partnerships, tax credit and other investments as discussed in Note 8 — Investments in Qualified Affordable Housing Partnerships, Tax Credit and Other Investments, Net and Variable Interest Entitiesascertain the ultimate resolution or range of financial liability, based on information known to the Consolidated Financial StatementsCompany, as of June 30, 2023, the Company does not believe there is any pending legal proceeding to which the Company is a party that, individually or in this Form 10-Q. As of September 30, 2022 and December 31, 2021, these commitments were $408.5 million and $309.6 million, respectively. These commitments are included in Accrued expenses and other liabilitiesthe aggregate, would reasonably be expected to have a material adverse effect on the Consolidated Balance Sheet.Company’s financial condition. In light of the inherent uncertainty in legal proceedings, however, there can be no assurance that the ultimate resolution will not exceed established reserves and it is possible that the outcome of a particular matter, or a combination of matters, may be material to the Company’s financial condition for a particular period, depending upon the size of the loss and the Company’s income for that particular period.
Note 1112 — Stock Compensation Plans
Pursuant to the Company’s 2021 Stock Incentive Plan, as amended, the Company may issue stocks,stock, stock options, restricted stock, restricted stock units (“RSUs”) including performance-based RSUs, stock purchase warrants, stock appreciation rights, phantom stock and dividend equivalents to eligible employees, non-employee directors, consultants, and other service providers of the Company and its subsidiaries. The Company has granted RSUs as its primary incentive awards. There were no outstanding awards other than RSUs as of both SeptemberJune 30, 20222023 and December 31, 2021.2022.
The following table presents a summary of the total share-based compensation expense and the related net tax benefits associated with the Company’s various employee share-based compensation plans for the three and ninesix months ended SeptemberJune 30, 20222023 and 2021:2022:
| | | ($ in thousands) | | Three Months Ended September 30, | | Nine Months Ended September 30, | |
| | Three Months Ended June 30, | | | Six Months Ended June 30, |
| ($ in thousands) | ($ in thousands) | | 2022 | | 2021 | | 2022 | | 2021 | ($ in thousands) | | 2023 | | 2022 | | | 2023 | | 2022 |
| $ | 12,329 | | | $ | 8,022 | | | $ | 29,338 | | | $ | 24,047 | | Stock compensation costs | | $ | 9,364 | | | $ | 8,576 | | | | $ | 20,439 | | | $ | 17,009 | |
| Related net tax benefits for stock compensation plans | Related net tax benefits for stock compensation plans | | $ | 1 | | | $ | 42 | | | $ | 5,269 | | | $ | 1,699 | | Related net tax benefits for stock compensation plans | | $ | 525 | | | $ | 109 | | | | $ | 8,815 | | | $ | 5,268 | |
|
Restricted Stock Units — RSUs are granted under the Company’s long-term incentive plan at no cost to the recipient. RSUs generally cliff vest after three years of continued employment from the date of the grant, and are authorized to settle predominantly in shares of the Company’s common stock. Certain RSUs are settled in cash. Dividends are accrued during the vesting period and paid at the time of vesting. While a portion of RSUs are time-based vesting awards, others vest subject to the attainment of specified performance goals, referred to as “performance-based RSUs.” Performance-based RSUs are granted annually upon approval by the Company’s Compensation Committee based on the performance in the year prior to the grant date of the award. The number of awards that vest can range from zero percent to a maximum of 200% of the granted number of awards based on the Company’s achievement of specified performance criteria over a performance period of three years.
Compensation costs are calculated using the quoted market price of the Company’s common stock at the grant date. Compensation costs for certain time-based awards that will be settled in cash are adjusted to fair value based For information on changes in the share price of the Company’s common stock up to the settlement date. For performance-based RSUs, the compensation costs are based on grant date fair value which considers both performance and market conditions, and is subject to subsequent adjustments based on the Company’s outcome in meeting the performance criteria at the end of the performance period. Compensation costs of both time and performance-based awards are estimated based on awards ultimately expected to vest, and are recognized net of estimated forfeitures on a straight-line basis from the grant date until the vesting date of each grant. For accounting on stock-based compensation plans, see Note 1 — Summary of Significant Accounting Policies — Significant Accounting Policies — Stock-Based Compensation to the Consolidated Financial Statements of the Company’s 20212022 Form 10-K for additional information.10-K.
During the nine months ended September 30, 2022, the Company modified 31,523 time-based RSUs held by 119 foreign employees from vesting in cash to vesting in shares without changing any of the other terms. There was no incremental compensation expense recognized as a result of the modification for the three and nine months ended September 30, 2022.
The following table presents a summary of the activities for the Company’s time-based and performance-based RSUs that will be settled in shares for the ninesix months ended SeptemberJune 30, 2022.2023. The number of performance-based RSUs stated below reflects the number of awards granted on the grant date.
| | | | | | | | | | | | | | | | | | | | | | | | | | | | | | | | | | |
|
| | | | |
| | | | | | | | | | |
| | | | | | Time-Based RSUs | | Performance-Based RSUs |
| | | | | | | | | Shares | | Weighted-
Average
Grant Date
Fair Value | | Shares | | Weighted-
Average
Grant Date
Fair Value |
| Outstanding, January 1, 2022 | | | | | | | | | | 1,329,946 | | | $ | 52.65 | | | 369,731 | | | $ | 54.28 | |
| Modified from cash-settled RSUs | | | | | | | | | | 31,523 | | | 77.28 | | | — | | | — | |
| Granted | | | | | | | | | | 430,815 | | | 78.42 | | | 91,874 | | | 77.91 | |
| Vested | | | | | | | | | | (371,032) | | | 53.12 | | | (125,213) | | | 54.64 | |
| Forfeited | | | | | | | | | | (106,562) | | | 61.76 | | | — | | | — | |
| Outstanding, September 30, 2022 | | | | | | | | | | 1,314,690 | | | $ | 60.81 | | | 336,392 | | | $ | 60.60 | |
|
The following table presents a summary of the activities for the Company’s time-based RSUs that are cash-settled for the nine months ended September 30, 2022. During the nine months ended September 30, 2022, the amount of cash paid to settle the RSUs that vested was $318 thousand.
| | | | | | | | | | |
|
| | | | |
| | | | Shares |
Outstanding, January 1, 2022 | | | | 32,647 | |
Modified to share-settled RSUs | | | | (31,523) | |
Granted | | | | 2,668 | |
Vested | | | | (3,471) | |
Forfeited | | | | (321) | |
Outstanding, September 30, 2022 | | | | — | |
|
| | | | | | | | | | | | | | | | | | | | | | | | | | | | | | | | | | |
|
| | | | |
| | | | | | | | | | |
| | | | | | Time-Based RSUs | | Performance-Based RSUs |
| | | | | | | | | | Shares | | Weighted-Average Grant Date Fair Value | | Shares | | Weighted-Average Grant Date Fair Value |
| Outstanding, January 1, 2023 | | | | | | | | | | 1,296,866 | | | $ | 60.77 | | | 332,510 | | | $ | 60.40 | |
| | | | | | | | | | | | | | | | |
| Granted | | | | | | | | | | 483,906 | | | 74.32 | | | 96,271 | | | 57.50 | |
| Vested | | | | | | | | | | (518,628) | | | 40.56 | | | (152,558) | | | 39.39 | |
| Forfeited | | | | | | | | | | (33,925) | | | 73.98 | | | — | | | — | |
| Outstanding, June 30, 2023 | | | | | | | | | | 1,228,219 | | | $ | 74.28 | | | 276,223 | | | $ | 70.99 | |
|
As of SeptemberJune 30, 2022,2023, there were $28.5$36.7 million and $17.0 million of total unrecognized compensation costs related to unvested time-based and performance-based RSUs respectively. Both of these costs are expected to be recognized over a weighted-average period of 1.922.1 years, and 1.93 years, respectively.$21.0 million of unrecognized compensation costs related to unvested performance-based RSUs expected to be recognized over a weighted-average period of 2.1 years.
Note 1213 — Stockholders’ Equity and Earnings Per Share
The following table presents the basic and diluted EPS calculations for the three and ninesix months ended SeptemberJune 30, 20222023 and 2021.2022. For more information on the calculation of EPS, see Note 1 — Summary of Significant Accounting Policies — Significant Accounting Policies — Earnings Per Share to the Consolidated Financial Statements of the Company’s 20212022 Form 10-K.
| | | ($ and shares in thousands, except per share data) | ($ and shares in thousands, except per share data) | | Three Months Ended September 30, | | Nine Months Ended September 30, | | ($ and shares in thousands, except per share data) | | Three Months Ended June 30, | | Six Months Ended June 30, | |
| 2022 | | 2021 | | 2022 | | 2021 | | ($ and shares in thousands, except per share data) | | 2023 | | 2022 | | 2023 | | 2022 | |
| Basic: | Basic: | | | | | | | | | | | | | | | | | | |
| Net income | Net income | | $ | 295,339 | | | $ | 225,449 | | | $ | 791,320 | | | $ | 655,185 | | | Net income | | $ | 312,031 | | | $ | 258,329 | | | $ | 634,470 | | | $ | 495,981 | | |
| Weighted-average number of shares outstanding | Weighted-average number of shares outstanding | | 140,917 | | | 141,880 | | | 141,453 | | | 141,799 | | | Weighted-average number of shares outstanding | | 141,468 | | | 141,429 | | | 141,291 | | | 141,725 | | |
| Basic EPS | Basic EPS | | $ | 2.10 | | | $ | 1.59 | | | $ | 5.59 | | | $ | 4.62 | | | Basic EPS | | $ | 2.21 | | | $ | 1.83 | | | $ | 4.49 | | | $ | 3.50 | | |
| Diluted: | Diluted: | | | | | | | | | | Diluted: | | | | | | | | | |
| Net income | Net income | | $ | 295,339 | | | $ | 225,449 | | | $ | 791,320 | | | $ | 655,185 | | | Net income | | $ | 312,031 | | | $ | 258,329 | | | $ | 634,470 | | | $ | 495,981 | | |
| Weighted-average number of shares outstanding | Weighted-average number of shares outstanding | | 140,917 | | | 141,880 | | | 141,453 | | | 141,799 | | | Weighted-average number of shares outstanding | | 141,468 | | | 141,429 | | | 141,291 | | | 141,725 | | |
| Add: Dilutive impact of unvested RSUs | Add: Dilutive impact of unvested RSUs | | 1,094 | | | 1,263 | | | 1,148 | | | 1,252 | | | Add: Dilutive impact of unvested RSUs | | 408 | | | 943 | | | 619 | | | 1,113 | | |
| Diluted weighted-average number of shares outstanding | Diluted weighted-average number of shares outstanding | | 142,011 | | | 143,143 | | | 142,601 | | | 143,051 | | | Diluted weighted-average number of shares outstanding | | 141,876 | | | 142,372 | | | 141,910 | | | 142,838 | | |
| Diluted EPS | Diluted EPS | | $ | 2.08 | | | $ | 1.57 | | | $ | 5.55 | | | $ | 4.58 | | | Diluted EPS | | $ | 2.20 | | | $ | 1.81 | | | $ | 4.47 | | | $ | 3.47 | | |
|
For the three and ninesix months ended SeptemberJune 30, 2022,2023, approximately 61690 thousand and 58439 thousand weighted-average shares of anti-dilutive RSUs, respectively, were excluded from the diluted EPS computations. In comparison, two381 thousand and six70 thousand weighted-average shares of anti-dilutive RSUs were excluded from the diluted EPS computations for the three and ninesix months ended SeptemberJune 30, 2021,2022, respectively.
Stock Repurchase Program — In 2020, the Company’s Board of Directors authorized a stock repurchase program to buy back up to $500.0 million of the Company’s common stock. For the three months ended September 30, 2022, there were no share repurchases. For the nine months ended September 30, 2022, the Company repurchased 1,385,517 shares at an average price of $72.17 per share at a total cost of $100.0 million. The Company did not repurchase any shares during the three and nine months ended September 30, 2021.
Note 1314 — Accumulated Other Comprehensive Income (Loss)
The following tables present the changes in the components of AOCI balances for the three and ninesix months ended SeptemberJune 30, 20222023 and 2021:2022:
| | | ($ in thousands) | ($ in thousands) | |
Debt
Securities | | Cash
Flow
Hedges | | Foreign Currency Translation Adjustments (1) | | Total | ($ in thousands) | | Debt Securities (1) | | Cash Flow Hedges | | Foreign Currency Translation Adjustments (2) | | Total |
| Balance, July 1, 2021 | | $ | (8,152) | | | $ | (730) | | | $ | (5,807) | | | $ | (14,689) | | |
| Balance, April 1, 2022 | | Balance, April 1, 2022 | | $ | (365,653) | | | $ | (24,466) | | | $ | (4,806) | | | $ | (394,925) | |
| Net unrealized losses arising during the period | Net unrealized losses arising during the period | | (40,928) | | | (121) | | | (1,752) | | | (42,801) | | Net unrealized losses arising during the period | | (192,858) | | | (5,582) | | | (10,215) | | | (208,655) | |
| Amounts reclassified from AOCI | Amounts reclassified from AOCI | | (250) | | | 172 | | | — | | | (78) | | Amounts reclassified from AOCI | | 3,730 | | | (798) | | | — | | | 2,932 | |
| Changes, net of tax | Changes, net of tax | | (41,178) | | | 51 | | | (1,752) | | | (42,879) | | Changes, net of tax | | (189,128) | | | (6,380) | | | (10,215) | | | (205,723) | |
| Balance, September 30, 2021 | | $ | (49,330) | | | $ | (679) | | | $ | (7,559) | | | $ | (57,568) | | |
| Balance, June 30, 2022 | | Balance, June 30, 2022 | | $ | (554,781) | | | $ | (30,846) | | | $ | (15,021) | | | $ | (600,648) | |
| | Balance, July 1, 2022 | | $ | (554,781) | | | $ | (30,846) | | | $ | (15,021) | | | $ | (600,648) | | |
| Balance, April 1, 2023 | | Balance, April 1, 2023 | | $ | (640,734) | | | $ | (20,918) | | | $ | (18,342) | | | $ | (679,994) | |
| Net unrealized losses arising during the period | Net unrealized losses arising during the period | | (161,445) | | | (34,423) | | | (7,926) | | | (203,794) | | Net unrealized losses arising during the period | | (43,618) | | | (68,207) | | | (7,249) | | | (119,074) | |
| Amounts reclassified from AOCI | Amounts reclassified from AOCI | | 3,256 | | | 1,154 | | | — | | | 4,410 | | Amounts reclassified from AOCI | | 2,816 | | | 14,320 | | | — | | | 17,136 | |
| Changes, net of tax | Changes, net of tax | | (158,189) | | | (33,269) | | | (7,926) | | | (199,384) | | Changes, net of tax | | (40,802) | | | (53,887) | | | (7,249) | | | (101,938) | |
| Balance, September 30, 2022 | | $ | (712,970) | | (2) | $ | (64,115) | | | $ | (22,947) | | | $ | (800,032) | | |
| Balance, June 30, 2023 | | Balance, June 30, 2023 | | $ | (681,536) | |
| $ | (74,805) | | | $ | (25,591) | | | $ | (781,932) | |
|
| | | | | | | | | | | | | | | | | | | | | | | | | | |
|
| ($ in thousands) | |
Debt
Securities | | Cash
Flow
Hedges | | Foreign Currency Translation Adjustments (1) | | Total |
| Balance, January 1, 2021 | | $ | 52,247 | | | $ | (1,230) | | | $ | (6,692) | | | $ | 44,325 | |
| Net unrealized (losses) gains arising during the period | | (100,747) | | | 108 | | | (867) | | | (101,506) | |
| Amounts reclassified from AOCI | | (830) | | | 443 | | | — | | | (387) | |
| Changes, net of tax | | (101,577) | | | 551 | | | (867) | | | (101,893) | |
| Balance, September 30, 2021 | | $ | (49,330) | | | $ | (679) | | | $ | (7,559) | | | $ | (57,568) | |
| | | | | | | | |
| Balance, January 1, 2022 | | $ | (85,703) | | | $ | 257 | | | $ | (4,935) | | | $ | (90,381) | |
| Net unrealized losses arising during the period | | (635,664) | | | (63,232) | | | (18,012) | | | (716,908) | |
| Amounts reclassified from AOCI | | 8,397 | | | (1,140) | | | — | | | 7,257 | |
| Changes, net of tax | | (627,267) | | | (64,372) | | | (18,012) | | | (709,651) | |
| Balance, September 30, 2022 | | $ | (712,970) | | (2) | $ | (64,115) | | | $ | (22,947) | | | $ | (800,032) | |
|
| | | | | | | | | | | | | | | | | | | | | | | | | | |
|
| ($ in thousands) | | Debt Securities (1) | | Cash Flow Hedges | | Foreign Currency Translation Adjustments (2) | | Total |
| Balance, January 1, 2022 | | $ | (85,703) | | | $ | 257 | | | $ | (4,935) | | | $ | (90,381) | |
| Net unrealized losses arising during the period | | (474,219) | | | (28,809) | | | (10,086) | | | (513,114) | |
| Amounts reclassified from AOCI | | 5,141 | | | (2,294) | | | — | | | 2,847 | |
| Changes, net of tax | | (469,078) | | | (31,103) | | | (10,086) | | | (510,267) | |
| Balance, June 30, 2022 | | $ | (554,781) | | | $ | (30,846) | | | $ | (15,021) | | | $ | (600,648) | |
| | | | | | | | |
| Balance, January 1, 2023 | | $ | (694,815) | | | $ | (49,531) | | | $ | (21,283) | | | $ | (765,629) | |
| Net unrealized gains (losses) arising during the period | | 657 | | | (47,121) | | | (4,308) | | | (50,772) | |
| Amounts reclassified from AOCI | | 12,622 | | | 21,847 | | | — | | | 34,469 | |
| Changes, net of tax | | 13,279 | | | (25,274) | | | (4,308) | | | (16,303) | |
| Balance, June 30, 2023 | | $ | (681,536) | |
| $ | (74,805) | | | $ | (25,591) | | | $ | (781,932) | |
|
(1)Includes after-tax unamortized losses related to AFS debt securities that were transferred to HTM in 2022.
(2)Represents foreign currency translation adjustments related to the Company’s net investment in non-U.S. operations, including related hedges. The functional currency and reporting currency of the Company’s foreign subsidiary is RMB and USD, respectively.
(2)Includes after-tax unamortized losses of $113.0 million related to AFS debt securities that were transferred to HTM. For further information, refer to Note 5 — Securities to the Consolidated Financial Statements in this Form 10-Q.
The following tables present the components of other comprehensive income (loss), reclassifications to net income and the related tax effects for the three and ninesix months ended SeptemberJune 30, 20222023 and 2021:2022:
| | | | | | | | | | | | | | | | | | | | | | | | | | | | | | | | | | | | Three Months Ended June 30, |
| | | 2023 | | 2022 |
| ($ in thousands) | ($ in thousands) | | Three Months Ended September 30, | ($ in thousands) | | Before-Tax | | Tax Effect | | Net-of-Tax | | Before-Tax | | Tax Effect | | Net-of-Tax |
| 2022 | | 2021 | |
| Before-Tax | | Tax Effect | | Net-of-Tax | | Before-Tax | | Tax Effect | | Net-of-Tax | |
| Debt securities: | Debt securities: | | | | | | | | | | | | | Debt securities: | | | | | | | | | | | | |
| Net unrealized losses arising during the period | | $ | (229,246) | | | $ | 67,801 | | | $ | (161,445) | | | $ | (58,138) | | | $ | 17,210 | | | $ | (40,928) | | |
| Net unrealized losses on AFS debt securities arising during the period | | Net unrealized losses on AFS debt securities arising during the period | | $ | (61,939) | | | $ | 18,321 | | | $ | (43,618) | | | $ | (273,840) | | | $ | 80,982 | | | $ | (192,858) | |
| Reclassification adjustments: | Reclassification adjustments: | | Reclassification adjustments: | |
Net realized gains reclassified into net income (1) | | — | | | — | | | — | | | (354) | | | 104 | | | (250) | | |
Amortization of unrealized losses on transferred securities (2) | | 4,623 | | | (1,367) | | | 3,256 | | | — | | | — | | | — | | |
Net realized gains on AFS debt securities reclassified into net income (1) | | Net realized gains on AFS debt securities reclassified into net income (1) | | — | | | — | | | — | | | (28) | | | 8 | | | (20) | |
Amortization of unrealized losses on transferred debt securities (2) | | Amortization of unrealized losses on transferred debt securities (2) | | 3,998 | | | (1,182) | | | 2,816 | | | 5,324 | | | (1,574) | | | 3,750 | |
| Net change | Net change | | (224,623) | | | 66,434 | | | (158,189) | | | (58,492) | | | 17,314 | | | (41,178) | | Net change | | (57,941) | | | 17,139 | | | (40,802) | | | (268,544) | | | 79,416 | | | (189,128) | |
| Cash flow hedges: | Cash flow hedges: | | | | | | | | | | | | | Cash flow hedges: | | | | | | | | | | | | |
| Net unrealized losses arising during the period | Net unrealized losses arising during the period | | (48,325) | | | 13,902 | | | (34,423) | | | (170) | | | 49 | | | (121) | | Net unrealized losses arising during the period | | (96,457) | | | 28,250 | | | (68,207) | | | (7,837) | | | 2,255 | | | (5,582) | |
Net realized losses reclassified into net income (3) | | 1,619 | | | (465) | | | 1,154 | | | 241 | | | (69) | | | 172 | | |
Net realized losses (gains) reclassified into net income (3) | | Net realized losses (gains) reclassified into net income (3) | | 20,252 | | | (5,932) | | | 14,320 | | | (1,120) | | | 322 | | | (798) | |
| Net change | Net change | | (46,706) | | | 13,437 | | | (33,269) | | | 71 | | | (20) | | | 51 | | Net change | | (76,205) | | | 22,318 | | | (53,887) | | | (8,957) | | | 2,577 | | | (6,380) | |
| Foreign currency translation adjustments, net of hedges: | Foreign currency translation adjustments, net of hedges: | | | | | | | | | | | | | Foreign currency translation adjustments, net of hedges: | | | | | | | | | | | | |
| Net unrealized losses arising during the period | Net unrealized losses arising during the period | | (6,676) | | | (1,250) | | | (7,926) | | | (1,878) | | | 126 | | | (1,752) | | Net unrealized losses arising during the period | | (6,107) | | | (1,142) | | | (7,249) | | | (9,278) | | | (937) | | | (10,215) | |
| Net change | Net change | | (6,676) | | | (1,250) | | | (7,926) | | | (1,878) | | | 126 | | | (1,752) | | Net change | | (6,107) | | | (1,142) | | | (7,249) | | | (9,278) | | | (937) | | | (10,215) | |
| Other comprehensive loss | Other comprehensive loss | | $ | (278,005) | | | $ | 78,621 | | | $ | (199,384) | | | $ | (60,299) | | | $ | 17,420 | | | $ | (42,879) | | Other comprehensive loss | | $ | (140,253) | | | $ | 38,315 | | | $ | (101,938) | | | $ | (286,779) | | | $ | 81,056 | | | $ | (205,723) | |
|
| | | | | | | | | | | | | | | | | | | | | | | | | | | | | | | | | | | | | | |
|
| ($ in thousands) | | Nine Months Ended September 30, |
| 2022 | | 2021 |
| Before-Tax | | Tax Effect | | Net-of-Tax | | Before-Tax | | Tax Effect | | Net-of-Tax |
| Debt securities: | | | | | | | | | | | | |
| Net unrealized losses arising during the period | | $ | (902,548) | | | $ | 266,884 | | | $ | (635,664) | | | $ | (143,131) | | | $ | 42,384 | | | $ | (100,747) | |
| Reclassification adjustments: | | | | | | | | | | | | |
Net realized gains reclassified into net income (1) | | (1,306) | | | 386 | | | (920) | | | (1,178) | | | 348 | | | (830) | |
Amortization of unrealized losses on transferred securities (2) | | 13,228 | | | (3,911) | | | 9,317 | | | — | | | — | | | — | |
| Net change | | (890,626) | | | 263,359 | | | (627,267) | | | (144,309) | | | 42,732 | | | (101,577) | |
| Cash flow hedges: | | | | | | | | | | | | |
| Net unrealized (losses) gains arising during the period | | (88,771) | | | 25,539 | | | (63,232) | | | 150 | | | (42) | | | 108 | |
Net realized (gains) losses reclassified into net income (3) | | (1,601) | | | 461 | | | (1,140) | | | 619 | | | (176) | | | 443 | |
| Net change | | (90,372) | | | 26,000 | | | (64,372) | | | 769 | | | (218) | | | 551 | |
| Foreign currency translation adjustments, net of hedges: | | | | | | | | | | | | |
| Net unrealized losses arising during the period | | (16,276) | | | (1,736) | | | (18,012) | | | (1,603) | | | 736 | | | (867) | |
| Net change | | (16,276) | | | (1,736) | | | (18,012) | | | (1,603) | | | 736 | | | (867) | |
| Other comprehensive loss | | $ | (997,274) | | | $ | 287,623 | | | $ | (709,651) | | | $ | (145,143) | | | $ | 43,250 | | | $ | (101,893) | |
|
| | | | | | | | | | | | | | | | | | | | | | | | | | | | | | | | | | | | | | |
|
| | Six Months Ended June 30, |
| | 2023 | | 2022 |
| ($ in thousands) | | Before-Tax | | Tax Effect | | Net-of-Tax | | Before-Tax | | Tax Effect | | Net-of-Tax |
| Debt securities: | | | | | | | | | | | | |
| Net unrealized gains (losses) on AFS debt securities arising during the period | | $ | 921 | | | $ | (264) | | | $ | 657 | | | $ | (512,886) | | | $ | 151,658 | | | $ | (361,228) | |
| Unrealized losses on debt securities transferred from AFS to HTM | | — | | | — | | | — | | | (160,416) | | | 47,425 | | | (112,991) | |
| Reclassification adjustments: | | | | | | | | | | | | |
Net realized losses (gains) on AFS debt securities reclassified into net income (1) | | 10,000 | | (4) | (2,956) | | | 7,044 | | | (1,306) | | | 386 | | | (920) | |
Amortization of unrealized losses on transferred debt securities (2) | | 7,919 | | | (2,341) | | | 5,578 | | | 8,605 | | | (2,544) | | | 6,061 | |
| Net change | | 18,840 | | | (5,561) | | | 13,279 | | | (666,003) | | | 196,925 | | | (469,078) | |
| Cash flow hedges: | | | | | | | | | | | | |
| Net unrealized losses arising during the period | | (66,614) | | | 19,493 | | | (47,121) | | | (40,446) | | | 11,637 | | | (28,809) | |
Net realized losses (gains) reclassified into net income (3) | | 30,896 | | | (9,049) | | | 21,847 | | | (3,220) | | | 926 | | | (2,294) | |
| Net change | | (35,718) | | | 10,444 | | | (25,274) | | | (43,666) | | | 12,563 | | | (31,103) | |
| Foreign currency translation adjustments, net of hedges: | | | | | | | | | | | | |
| Net unrealized losses arising during the period | | (3,481) | | | (827) | | | (4,308) | | | (9,600) | | | (486) | | | (10,086) | |
| Net change | | (3,481) | | | (827) | | | (4,308) | | | (9,600) | | | (486) | | | (10,086) | |
| Other comprehensive loss | | $ | (20,359) | | | $ | 4,056 | | | $ | (16,303) | | | $ | (719,269) | | | $ | 209,002 | | | $ | (510,267) | |
|
(1)Pre-tax amounts were reported in GainsNet gains (losses) on sales of AFS debt securities on the Consolidated Statement of Income.
(2)Represents unrealized losses amortized over the remaining lives of securities that were transferred from the AFS to HTM portfolio.portfolio in 2022.
(3)Pre-tax amounts related to cash flow hedges on CREvariable rate loans and long-term borrowings, where applicable, were reported in Interest and dividend income and in Interest expense, respectively, on the Consolidated Statement of Income.
Note 1415 — Business Segments
The Company organizes its operations into three reportable operating segments: (1) Consumer and Business Banking; (2) Commercial Banking; and (3) Other. These segments are defined by the type of customers served and the related products and services provided. The segments reflect how financial information is currently evaluated by management. Operating segment results are based on the Company’s internal management reporting process, which reflects assignments and allocations of certain balance sheet and income statement items. The information presented is not indicative of how the segments would perform if they operated as independent entities due to the interrelationships among the segments.entities.
The Consumer and Business Banking segment primarily provides financial products and services to consumer and commercial customers through the Company’s domestic branch network and digital banking platform. This segment offers consumer and commercial deposits, mortgage and home equity loans, and other products and services. It also originates commercial loans for small- and medium-sized enterprises through the Company’s branch network. Other products and services provided by this segment include wealth management, treasury management, interest rate risk hedging and foreign exchange services.
The Commercial Banking segment primarily generates commercial loan and deposit products. Commercial loan products include CRE lending, construction finance,financing, commercial business lending, working capital lines of credit, trade finance, letters of credit, commercial business lending, affordable housing lending, asset-based lending, asset-backed finance, project finance and equipment financing. Commercial deposit products and other financial services include treasury management, foreign exchange services and interest rate and commodity risk hedging.
The remaining centralized functions, including the corporate treasury activities of the Company and eliminations of inter-segment amounts, have been aggregated and included in the Other segment, which provides broad administrative support to the two core segments, namely the Consumer and Business Banking and the Commercial Banking segments.
The Company utilizes an internal reporting process to measure the performance of the three operating segments within the Company. The internal reporting process derives operating segment results by utilizing allocation methodologies for revenues and expenses. Net interest income of each segment represents the difference between actual interest earned on assets and interest incurred on liabilities of the segment, adjusted for funding charges or credits through the Company’s internal funds transfer pricing (“FTP”) process. Noninterest income and noninterest expense directly attributable to a business segment are assigned to that segment. Indirect costs, including technology-related costs and corporate overhead, are allocated based on a segment’s estimated usage using factors including but not limited to, full-time equivalent employees, net interest income, and loan and deposit volume. Charge-offs are recorded to the segment directly associated with the respective loans charged off, and provision for credit losses is recorded to the segments based on the related loans for which allowances are evaluated. The Company’s internal reporting process utilizes a full-allocation methodology. Under this methodology, corporate and indirect expenses incurred by the Other segment are allocated to the Consumer and Business Banking and the Commercial Banking segments, except certain corporate treasury-related expenses and insignificant unallocated expenses.
The corporate treasury function within the Other segment is responsible for the Company’s liquidity and interest rate management. The Company’smanagement and the internal FTP process is also managed by the corporate treasury function within the Other segment.process. The FTP process is formulated with the goal of encouraging loan and deposit growth that is consistent with the Company’s overall profitability objectives, as well as to provide a reasonable and consistent basis for the measurement of its business segments’ net interest margins and profitability. The FTP process charges a cost to fund loans (“FTP charges for loans”) and allocates credits for funds provided from deposits (“FTP credits for deposits”) using internal FTP rates. FTP charges for loans are determined based on a matched cost of funds, which is tied to the pricing and term characteristics of the loans. FTP credits for deposits are based on matched funding credit rates, which are tied to the implied or stated maturity of the deposits. FTP credits for deposits reflect the long-term value generated by the deposits. The net spread between the total internal FTP charges and credits is recorded as part of net interest income in the Other segment. The FTP process transfers the corporate interest rate risk exposure to the treasury function within the Other segment, where such exposures are centrally managed. The Company’s internal FTP assumptions and methodologies are reviewed at least annually to ensure that the process is reflective of current market conditions.
The following tables present the operating results and other key financial measures for the individual operating segments as of and for the three and ninesix months ended SeptemberJune 30, 20222023 and 2021:2022:
| | | ($ in thousands) | ($ in thousands) | | Consumer and
Business
Banking | | Commercial
Banking | | Other | | Total | ($ in thousands) | | Consumer and Business Banking | | Commercial Banking | | Other | | Total |
| Three Months Ended September 30, 2022 | | | | | | | | | |
| Three Months Ended June 30, 2023 | | Three Months Ended June 30, 2023 | | | | | | | | |
| | Net interest income before provision for credit losses | | $ | 326,411 | | | $ | 222,996 | | | $ | 2,402 | | | $ | 551,809 | | |
| Net interest income (loss) before provision for credit losses | | Net interest income (loss) before provision for credit losses | | $ | 307,522 | | | $ | 263,040 | | | $ | (3,816) | | | $ | 566,746 | |
| Provision for credit losses | Provision for credit losses | | 8,974 | | | 18,026 | | | — | | | 27,000 | | Provision for credit losses | | 5,524 | | | 20,476 | | | — | | | 26,000 | |
| Noninterest income (loss) | | 30,819 | | | 48,641 | | | (3,908) | | | 75,552 | | |
| Noninterest income | | Noninterest income | | 27,120 | | | 42,538 | | | 8,973 | | | 78,631 | |
| Noninterest expense | Noninterest expense | | 104,005 | | | 81,386 | | | 30,582 | | | 215,973 | | Noninterest expense | | 107,027 | | | 88,333 | | | 66,429 | | | 261,789 | |
| Segment income (loss) before income taxes | Segment income (loss) before income taxes | | 244,251 | | | 172,225 | | | (32,088) | | | 384,388 | | Segment income (loss) before income taxes | | 222,091 | | | 196,769 | | | (61,272) | | | 357,588 | |
| | Segment net income (loss) | | $ | 173,982 | | | $ | 122,869 | | | $ | (1,512) | | | $ | 295,339 | | |
| As of September 30, 2022 | | | | | | | | | |
| Segment net income | | Segment net income | | $ | 156,853 | | | $ | 139,030 | | | $ | 16,148 | | | $ | 312,031 | |
| As of June 30, 2023 | | As of June 30, 2023 | | | | | | | | |
| | Segment assets | Segment assets | | $ | 17,002,000 | | | $ | 32,836,381 | | | $ | 12,737,680 | | | $ | 62,576,061 | | Segment assets | | $ | 18,411,209 | | | $ | 33,754,957 | | | $ | 16,366,515 | | | $ | 68,532,681 | |
|
| | | | | | | | | | | | | | | | | | | | | | | | | | |
|
| ($ in thousands) | | Consumer and
Business
Banking | | Commercial
Banking | | Other | | Total |
| Three Months Ended September 30, 2021 | | | | | | | | |
| | | | | | | | |
| | | | | | | | |
| | | | | | | | |
| | | | | | | | |
| | | | | | | | |
| | | | | | | | |
| Net interest income before provision for (reversal of) credit losses | | $ | 176,678 | | | $ | 189,791 | | | $ | 29,237 | | | $ | 395,706 | |
| Provision for (reversal of) credit losses | | 1,293 | | | (11,293) | | | — | | | (10,000) | |
Noninterest income (1) | | 22,099 | | | 43,272 | | | 7,738 | | | 73,109 | |
| Noninterest expense | | 90,575 | | | 66,731 | | | 48,078 | | | 205,384 | |
Segment income (loss) before income taxes (1) | | 106,909 | | | 177,625 | | | (11,103) | | | 273,431 | |
| | | | | | | | |
Segment net income (1) | | $ | 76,577 | | | $ | 126,984 | | | $ | 21,888 | | | $ | 225,449 | |
| As of September 30, 2021 | | | | | | | | |
| | | | | | | | |
| Segment assets | | $ | 14,687,023 | | | $ | 27,861,690 | | | $ | 18,410,397 | | | $ | 60,959,110 | |
|
| | | ($ in thousands) | ($ in thousands) | | Consumer and
Business
Banking | | Commercial
Banking | | Other | | Total | ($ in thousands) | | Consumer and Business Banking | | Commercial Banking | | Other | | Total |
| Nine Months Ended September 30, 2022 | | | | | | | | | |
| Three Months Ended June 30, 2022 | | Three Months Ended June 30, 2022 | | | | | | | | |
| | Net interest income (loss) before provision for credit losses | Net interest income (loss) before provision for credit losses | | $ | 823,998 | | | $ | 662,037 | | | $ | (45,661) | | | $ | 1,440,374 | | Net interest income (loss) before provision for credit losses | | $ | 284,373 | | | $ | 230,964 | | | $ | (42,385) | | | $ | 472,952 | |
| Provision for credit losses | Provision for credit losses | | 14,976 | | | 33,524 | | | — | | | 48,500 | | Provision for credit losses | | 2,898 | | | 10,602 | | | — | | | 13,500 | |
| Noninterest income | Noninterest income | | 84,402 | | | 145,750 | | | 3,587 | | | 233,739 | | Noninterest income | | 28,384 | | | 48,032 | | | 2,028 | | | 78,444 | |
| Noninterest expense | Noninterest expense | | 294,395 | | | 235,804 | | | 72,084 | | | 602,283 | | Noninterest expense | | 94,295 | | | 81,023 | | | 21,542 | | | 196,860 | |
| Segment income (loss) before income taxes | Segment income (loss) before income taxes | | 599,029 | | | 538,459 | | | (114,158) | | | 1,023,330 | | Segment income (loss) before income taxes | | 215,564 | | | 187,371 | | | (61,899) | | | 341,036 | |
| | Segment net income (loss) | Segment net income (loss) | | $ | 426,695 | | | $ | 384,237 | | | $ | (19,612) | | | $ | 791,320 | | Segment net income (loss) | | $ | 153,549 | | | $ | 133,861 | | | $ | (29,081) | | | $ | 258,329 | |
| As of September 30, 2022 | | | | | | | | | |
| As of June 30, 2022 | | As of June 30, 2022 | | | | | | | | |
| | Segment assets | Segment assets | | $ | 17,002,000 | | | $ | 32,836,381 | | | $ | 12,737,680 | | | $ | 62,576,061 | | Segment assets | | $ | 16,472,373 | | | $ | 32,256,044 | | | $ | 13,665,866 | | | $ | 62,394,283 | |
|
| | ($ in thousands) | ($ in thousands) | | Consumer and
Business
Banking | | Commercial
Banking | | Other | | Total | ($ in thousands) | | Consumer and Business Banking | | Commercial Banking | | Other | | Total |
| Nine Months Ended September 30, 2021 | | | | | | | | | |
| Six Months Ended June 30, 2023 | | Six Months Ended June 30, 2023 | | | | | | | | |
| | Net interest income before reversal of credit losses | | $ | 500,352 | | | $ | 559,579 | | | $ | 65,943 | | | $ | 1,125,874 | | |
| Reversal of credit losses | | (598) | | | (24,402) | | | — | | | (25,000) | | |
Noninterest income (1) | | 69,873 | | | 123,342 | | | 21,191 | | | 214,406 | | |
| Net interest income before provision for credit losses | | Net interest income before provision for credit losses | | $ | 611,764 | | | $ | 499,763 | | | $ | 55,080 | | | $ | 1,166,607 | |
| Provision for credit losses | | Provision for credit losses | | 20,536 | | | 25,464 | | | — | | | 46,000 | |
| Noninterest income (loss) | | Noninterest income (loss) | | 53,122 | | | 86,137 | | | (650) | | | 138,609 | |
| Noninterest expense | Noninterest expense | | 267,511 | | | 204,042 | | | 114,431 | | | 585,984 | | Noninterest expense | | 220,850 | | | 175,581 | | | 83,805 | | | 480,236 | |
Segment income (loss) before income taxes (1) | Segment income (loss) before income taxes (1) | | 303,312 | | | 503,281 | | | (27,297) | | | 779,296 | | Segment income (loss) before income taxes (1) | | 423,500 | | | 384,855 | | | (29,375) | | | 778,980 | |
| Segment net income (1) | Segment net income (1) | | $ | 217,257 | | | $ | 360,275 | | | $ | 77,653 | | | $ | 655,185 | | Segment net income (1) | | $ | 299,100 | | | $ | 273,487 | | | $ | 61,883 | | | $ | 634,470 | |
| As of September 30, 2021 | | | | | | | | | |
| As of June 30, 2023 | | As of June 30, 2023 | | | | | | | | |
| | Segment assets | Segment assets | | $ | 14,687,023 | | | $ | 27,861,690 | | | $ | 18,410,397 | | | $ | 60,959,110 | | Segment assets | | $ | 18,411,209 | | | $ | 33,754,957 | | | $ | 16,366,515 | | | $ | 68,532,681 | |
|
(1)During the fourth quarter of 2021, the Company enhanced its segment allocation methodology related to the fair values of interest rate and commodity derivative contracts, which are included in noninterest income. These fair values, which were previously allocated to the “Commercial Banking” segment prior to the fourth quarter of 2021, have since been reclassified between “Consumer and Business Banking” and “Commercial Banking”. Balances for the third quarter and nine months of 2021 have been reclassified to reflect these allocation changes for comparability. | | | | | | | | | | | | | | | | | | | | | | | | | | |
| ($ in thousands) | | Consumer and Business Banking | | Commercial Banking | | Other | | Total |
| Six Months Ended June 30, 2022 | | | | | | | | |
| | | | | | | | |
| | | | | | | | |
| | | | | | | | |
| | | | | | | | |
| | | | | | | | |
| | | | | | | | |
| Net interest income (loss) before provision for credit losses | | $ | 497,587 | | | $ | 439,041 | | | $ | (48,063) | | | $ | 888,565 | |
| Provision for credit losses | | 6,002 | | | 15,498 | | | — | | | 21,500 | |
| Noninterest income | | 53,583 | | | 97,109 | | | 7,495 | | | 158,187 | |
| Noninterest expense | | 190,390 | | | 154,418 | | | 41,502 | | | 386,310 | |
| Segment income (loss) before income taxes | | 354,778 | | | 366,234 | | | (82,070) | | | 638,942 | |
| | | | | | | | |
| Segment net income (loss) | | $ | 252,713 | | | $ | 261,368 | | | $ | (18,100) | | | $ | 495,981 | |
| As of June 30, 2022 | | | | | | | | |
| | | | | | | | |
| Segment assets | | $ | 16,472,373 | | | $ | 32,256,044 | | | $ | 13,665,866 | | | $ | 62,394,283 | |
|
ITEM 2. MANAGEMENT’S DISCUSSION AND ANALYSIS OF FINANCIAL CONDITION AND RESULTS OF OPERATIONS
Forward-Looking Statements
Certain matters discussed in this Quarterly Report on Form 10-Q (this “Form 10-Q”) contain forward-looking statements that are intended to be covered by the safe harbor for such statements provided by the Private Securities Litigation Reform Act of 1995. In addition, East West Bancorp, Inc. (referred to herein on an unconsolidated basis as “East West” and on a consolidated basis as the “Company,” “we” or “EWBC”) may make forward-looking statements in other documents that it files with, or furnishes to, the United States (“U.S.”) Securities and Exchange Commission (“SEC”) and management may make forward-looking statements to analysts, investors, media members and others. Forward-looking statements are those that do not relate to historical facts, and that are based on current expectations, estimates and projections about the Company’s industry, management’s beliefs and certain assumptions made by management, many of which, by their nature, are inherently uncertain and beyond the Company’s control. These statements may relate to the Company’s financial condition, results of operations, plans, objectives, future performance and/or business and usually can be identified by the use of forward-looking language, such as “anticipates,” “assumes,” “believes,” “can,” “continues,” “could,” “estimates,” “expects,” “forecasts,” “goal,” “intends,” “likely,” “may,” “might,” “objective,” “plans,” “potential,” “projects,” “remains,” “should,” “target,” “trend,” “will,” “would,” or similar expressions, and the negative thereof. You should not place undue reliance on these statements, as they are subject to risks and uncertainties, including, but not limited to, those described below. When considering these forward-looking statements, you should keep in mind these risks and uncertainties, as well as any cautionary statements the Company may make. Moreover, you should treat these statements as speaking only as of the date they are made and based only on information then actually known to the Company.
There are a number of important factors that could cause future results to differ materially from historical performance and any forward-looking statements. Factors that might cause such differences, include, but are not limited to:
•changes in the global economy, including an economic slowdown, market or supply chain disruption, level of inflation, interest rate environment, housing prices, employment levels, rate of growth and general business conditions;
•the impact of any future federal government shutdown and uncertainty regarding the federal government’s debt limit;
•changes in local, regional and global business, economic and political conditions and geopolitical events;
•the economic, financial, reputational and other impacts of the ongoing Coronavirus Disease 2019 (“COVID-19”) pandemic, including variants thereof, and any other pandemic, epidemic or health-related crisis, as well as a deterioration of asset quality and an increase in credit losses due to the COVID-19 pandemic;
•changes in laws or the regulatory environment, including regulatory reform initiatives and policies of the U.S. Department of the Treasury, the Board of Governors of the Federal Reserve System (“Federal Reserve”), the Federal Deposit Insurance Corporation (“FDIC”), the Office of the Comptroller of the Currency, the SEC, the Consumer Financial Protection Bureau, and the California Department of Financial Protection and Innovation - Division of Financial Institutions;
•changes and effects thereof in trade, monetary and fiscal policies and laws, including the ongoing economic and political disputes between the U.S. and the People’s Republic of China and the monetary policies of the Federal Reserve;
•changes in the commercial and consumer real estate markets;
•changes in consumer or commercial spending, savings and borrowing habits, and patterns and behaviors;
•fluctuations in the Company’s stock price;
•the impact from potential changes to income tax laws and regulations, federal spending and economic stimulus programs;
•the Company’s ability to compete effectively against financial institutions in its banking markets and other entities, including as a result of emerging technologies;
•the soundness of other financial institutions;
•the success and timing of the Company’s business strategies;
•the Company’s ability to retain key officers and employees;
•impact on the Company’s funding costs, net interest income and net interest margin from changes in key variable market interest rates, competition, regulatory requirements and the Company’s product mix;
•changes in the Company’s costs of operation, compliance and expansion;
•the Company’s ability to adopt and successfully integrate new technologies into its business in a strategic manner;
•the impact of the benchmark interest rate reform in the U.S. including the transition away from the U.S. dollar (“USD”) London Interbank Offered Rate (“LIBOR”) to alternative reference rates;
•the impact of communications or technology disruption, failure in, or breach of, the Company’s operational or security systems or infrastructure, or those of third party vendors with which the Company does business, including as a result of cyber-attacks; and other similar matters which could result in, among other things, confidential and/or proprietary information being disclosed or misused, and materially impact the Company’s ability to provide services to its clients;
•the adequacy of the Company’s risk management framework, disclosure controls and procedures and internal control over financial reporting;
•future credit quality and performance, including the Company’s expectations regarding future credit losses and allowance levels;
•the impact of adverse changes to the Company’s credit ratings from major credit rating agencies;
•impact of adverse judgments or settlements in litigation;
•the impact on the Company’s operations due to political developments, pandemics, wars, civil unrest, terrorism or other hostilities that may disrupt or increase volatility in securities or otherwise affect business and economic conditions;
•heightened regulatory and governmental oversight and scrutiny of the Company’s business practices, including dealings with consumers;
•the impact of reputational risk from negative publicity, fines, penalties and other negative consequences from regulatory violations, legal actions and the Company’s interactions with business partners, counterparties, service providers and other third parties;
•the impact of regulatory investigations and enforcement actions;
•changes in accounting standards as may be required by the Financial Accounting Standards Board or other regulatory agencies and their impact on critical accounting policies and assumptions;
•the Company’s capital requirements and its ability to generate capital internally or raise capital on favorable terms;
•the impact on the Company’s liquidity due to changes in the Company’s ability to receive dividends from its subsidiaries;
•any future strategic acquisitions or divestitures;
•changes in the equity and debt securities markets;
•fluctuations in foreign currency exchange rates;
•the impact of increased focus on social, environmental and sustainability matters, which may affect the Company’s operations as well as those of its customers and the economy more broadly;
•significant turbulence or disruption in the capital or financial markets, which could result in, among other things, reduced investor demand for loans, a reduction in the availability of funding or increases in funding costs, declines in asset values and/or recognition of allowance for credit losses on securities held in the Company’s debt securities and equity securities portfolio; and
•the impact of climate change, natural or man-made disasters or calamities, such as wildfires, droughts and earthquakes, all of which are particularly common in California, or other events that may directly or indirectly result in a negative impact on the Company’s financial performance.
For a more detailed discussion of some of the factors that might cause such differences, see the Company’s Annual Report on Form 10-K for the year ended December 31, 2021, filed with the SEC on February 28, 2022 (the “Company’s 2021 Form 10-K”) under the heading Item 1A. Risk Factors and the information set forth under Item 1A. Risk Factors in this Form 10-Q. The Company does not undertake, and specifically disclaims any obligation to update or revise any forward-looking statements to reflect the occurrence of events or circumstances after the date of such statements except as required by law.
Overview
The following discussion provides information about the results of operations, financial condition, liquidity and capital resources of East West Bancorp, Inc. (referred to herein on an unconsolidated basis as “East West” and on a consolidated basis as the Company“Company,” “we” or “EWBC”) and its subsidiaries, including its subsidiary bank, East West Bank and its subsidiaries (referred to herein as “East West Bank” or the “Bank”). This information is intended to facilitate the understanding and assessment of significant changes and trends related to the Company’s results of operations and financial condition. This discussion and analysis should be read in conjunction with the Consolidated Financial Statements and the accompanying notes presented elsewhere in this report, and the Company’s 2021Annual Report on Form 10-K.10-K for the year ended December 31, 2022, filed with the United States (“U.S.”) Securities and Exchange Commission (“SEC”) on February 27, 2023 (the “Company’s 2022 Form 10-K”).
Organization and Strategy
East West is a bank holding company incorporated in Delaware on August 26, 1998 and is registered under the Bank Holding Company Act of 1956, as amended. The Company commenced business on December 30, 1998 when, pursuant to a reorganization, it acquired all of the voting stock of the Bank, which became its principal asset. The Bank is an independent commercial bank headquartered in California that focuses on the financial service needs of individuals and businesses that operate in both the Asian-American community.U.S. and Asia. Through over 120 locations in the U.S. and China,Asia, the Company provides a full range of consumer and commercial products and services through the following three business segments: (1) Consumer and Business Banking and (2) Commercial Banking, with the remaining operations recorded in (3) Other. The Company’s principal activity is lending to and accepting deposits from businesses and individuals. We are committed to enhancing long-term stockholder value by growing loans, deposits and revenue, improving profitability, and investing for the future while managing risks, expenses and capital. Our business model is built on promoting customer loyalty and engagement, understanding our customers’ financial goals, and meeting theirour customers’ financial needs through our diverse products and services. We expect our relationship-focused business model to continue to generategenerating organic growth from existing customers and to expand our targeted customer bases. As of SeptemberJune 30, 2022,2023, the Company had $62.58$68.53 billion in assets and approximately 3,200 full-time equivalent employees. For additional information on our strategy, and the products and services provided by the Bank, see Item 1. Business — Strategy and Banking Services in the Company’s 20212022 Form 10-K.
Current Developments
Economic Developments
Heightened inflationary pressures caused by rising oilRecent external data indicate that the pace of inflation has moderated in recent months and other commodity pricesthe volatility in the banking industry earlier in the year appears to have abated. However, inflation remains above the Board of Governors of the Federal Reserve System’s (“Federal Reserve”) 2% target and further interest rate hikes are anticipated later this year. The higher interest rate environment continues to negatively impact the market value of bank-held securities. Additionally, the commercial real estate market is under pressure due to Russia’s invasion of Ukraine,tighter credit conditions and global supply chain disruptions related todecreased demand. These factors have adversely affected economic activity and the COVID-19 pandemic continue to weigh on the economy. Concernsbanking sector. Despite these concerns, fears of a potential recession in 2023 have increased asdiminished slightly due to the federal government continues to hike interest rates to slow down inflation. Although U.S.continuing strength in the job market. The Company is actively monitoring changes in economic and industry conditions have continued to recover from the COVID-19 pandemic, the ongoing effects of its impactand their impacts on the macroeconomic environment may persist for some time. The Company continues to closely monitor the economy and its effects on itsCompany’s business, customers, employees, communities and markets.
Further discussion of the potential impacts on the Company’s business due to interest rate hikes have been provided in Item 1A. — Risk Factors — Risks Related to Financial Matters in the Company’s 20212022 Form 10-K.
LIBOR Transition
LIBOR is a widely referenced benchmark rate that is intended to reflect the rate at which banks can borrow wholesale funds from other banks on an unsecured and short-term basis. In March 2021, the United Kingdom’s Financial Conduct Authority and Intercontinental Exchange Benchmark Administration announced that the one-week and two-month USD LIBOR settings and non-USD LIBOR settings would cease to be published after December 31, 2021. The publication of the overnight, one-, three-, six- and 12-month USD LIBOR settings has been extended through June 30, 2023, which will provide additional time to wind down or renegotiate existing contracts that reference these LIBOR settings.
In March 2022, President Biden signed into law the Adjustable Interest Rate (LIBOR) Act (the “LIBOR Act”). The LIBOR Act provides a clear and uniform federal solution to transition legacy LIBOR-based contracts that either contain insufficient contractual fallback provisions addressing the LIBOR cessation and its transition to a benchmark selected by the Federal Reserve or lack contractual fallback provisions entirely. The LIBOR Act also establishes a safe harbor for lenders, shielding lenders from potential litigation resulting from their choice of a replacement rate, under certain situations including the use of a Federal Reserve-selected replacement rate based on the Secured Overnight Financing Rate (“SOFR”). The Federal Reserve published its proposed rulemaking that implements the LIBOR Act in the Federal Register in July 2022, which establishes benchmark replacement recommendations for various product types.
The Company holds a significant volume of LIBOR-based products, including loans, derivatives, debt securities, assets purchased under resale agreements (“resale agreements”), junior subordinated debt, and assets sold under repurchase agreements (“repurchase agreements”) that are indexed to LIBOR tenors that will cease to be published after June 30, 2023. The Company has a cross-functional team to manage the communication of the Company’s transition plans with both internal and external stakeholders. The team helps to ensure that the Company appropriately updates its business processes, analytical tools, information systems and contract language to minimize disruption during and after the LIBOR transition. The Company has invested in updates to business and legal processes, models, analytical tools, and information and operational systems to facilitate the transition of legacy LIBOR products and offer products under alternative rates.Phase Out
The London Interbank Offered Rate (“LIBOR”), a benchmark rate that was widely referenced in the past, ceased publication on July 1, 2023. In preparation for this phase out, beginning January 1, 2022, the Company startedceased offering new loans or loan renewals based on LIBOR, and began offering loans based on alternative reference rates including SOFR(“ARRs”) such as Term Secured Overnight Financing Rate (“SOFR”) and the Bloomberg Short-Term Bank Yield Index during the fourth quarterIndex. The Company’s LIBOR exposures were predominantly comprised of 2021, and ceased offering new LIBORcommercial loans and LIBOR loan renewals beginning January 1, 2022. The Company continuesderivative contracts, which have been remediated (i.e., amended to engage with customersreference an ARR either on or before June 30, 2023 or at the instrument’s next reset date after June 30, 2023), or already contained appropriate fallback provisions to proactively modify LIBOR-based product contracts and transition to a benchmark replacement prioran ARR. As of July 3, 2023, the remaining small portion of the Company’s LIBOR-based assets and liabilities have all been amended to June 30, 2023. The Company will leverage relevant contractual and statutory solutions, if necessary, includinguse the LIBORAdjustable Interest Rate (LIBOR) Act and other relevant legislation to transition any residual LIBOR-based product exposures maturing after June 2023 to appropriate benchmark replacements. The Company’s LIBOR transition is anticipated to continue through June 30, 2023.and regulation.
The Company will continue to monitor potential risks and impacts associated with the transition.
For additional information related to the potential impact surrounding the transition from LIBOR on the Company’s business, see Item item 1A. Risk Factors — Risks Related to Financial Matters in the Company’s 20212022 Form 10-K. For additional background information on the LIBOR transition, see Item 7. Management’s Discussion and Analysis of Financial Condition and Results of Operations (“MD&A”) — Overview in the Company’s 2022 Form 10-K.
Deposit Insurance Assessment RatesPotential Regulatory Reforms in Response to Recent Bank Failures
In October 2022,Following the bank failures of March 2023, Congress and federal regulatory agencies are considering potential changes to the laws and regulations that apply to banks. On April 28, 2023, the Federal Reserve and the Federal Deposit Insurance Corporation (the “FDIC”) issued reports on the failures of Silicon Valley Bank and Signature Bank, respectively, identifying potential causes that the federal banking agencies may seek to address through changes to their supervisory and regulatory policies. On July 27, 2023, the Federal Reserve, FDIC, adoptedand Office of the Comptroller of the Currency jointly issued a final rulenotice of proposed rulemaking that would revise the capital framework applicable to increasebanking organizations with $100 billion or more in total consolidated assets or with significant trading activity and, if finalized, would likely result in meaningfully increased capital requirements for those organizations. By imposing additional costs on banking organizations with $100 billion or more in total consolidated assets, the initial base deposit insurance assessment rate schedules uniformlyproposal could reduce the benefits of growth beyond that size for insured depository institutionsa banking organization that has less than $100 billion in total consolidated assets. The extent of any further actions to be taken by two basis points (“bps”), beginningthese agencies or Congress in response to the bank failures, and potential causes highlighted in the first quarterly assessment periodFederal Reserve and FDIC reports, and the impact of 2023. The increaseany such actions on institutions with less than $100 billion in total consolidated assets, such as the assessment rate schedules is intended to: (1) increase the likelihood that the reserve ratio of the Deposit Insurance Fund (“DIF”) will reach at least 1.35 percent by the statutory deadline of September 30, 2028; (2) reduce the FDIC’s need to consider a potentially pro-cyclical assessment rate increase, and (3) support growth in the DIF in progressing towards the FDIC’s long-term goal of a 2 percent Designated Reserve Ratio. The new assessment rate schedules will remain in effect unless and until the reserve ratio meets or exceeds 2 percent. As a result of the adoption of the assessment rate schedules, the FDIC insurance costs of the Bank will likely increase but not have a material impact on its consolidated financial statements.Company, remains unclear.
Community Reinvestment ActFDIC Special Assessment and Uninsured Deposits
On May 5, 2022,11, 2023, the federal banking agencies issuedFDIC published a proposed rule that would substantially revise how they evaluateimpose a special deposit insurance assessment on banks in order to recover losses that the FDIC's Deposit Insurance Fund (“DIF”) has incurred in the receiverships of failed institutions. The proposed rule would impose the special assessment for eight quarterly assessment periods beginning with the first quarter of 2024 assessment period, subject to adjustments if the total amount collected is insufficient to cover the DIF’s costs. Each quarterly special assessment would be equal to 3.13 basis points (0.0313%) of a bank’s estimated uninsured deposits that exceeded $5 billion as of December 31, 2022.
On July 24, 2023, the FDIC issued Financial Institution Letter (“FIL”) 37-2023 — Estimated Uninsured Deposits Reporting Expectations, which clarifies the reporting of an insured depository institution’s record of satisfyingestimated uninsured deposits in the credit needs of its entire communities, including low- and moderate-income individuals and neighborhoods, underCall Report Schedule RC-O, Memorandum item 2 (“RC-OM item 2”). This FIL specifies that uninsured deposits reported in RC-OM item 2 should include the Community Reinvestment Act (“CRA”). We are evaluating the potential impactdeposit balances in excess of the proposed ruleFDIC limit that have been collateralized by pledged assets, and include all deposits of subsidiaries. The Company will evaluate previously filed call reports based on the Bank.
Inflation Reduction Act
On August 16, 2022, the U.S. federal government enacted the Inflation Reduction Act of 2022. The bill contains numerous tax provisions, including a 15 percent corporate minimum tax. At this point, the legislation is not expected to have a material impact on the Company’s consolidated financial statements.
Financial Review
| | | | | | | Three Months Ended June 30, | | Six Months Ended June 30, | |
| ($ and shares in thousands, except per share, and ratio data) | ($ and shares in thousands, except per share, and ratio data) | | Three Months Ended September 30, | | Nine Months Ended September 30, | | ($ and shares in thousands, except per share, and ratio data) | | 2023 | | | 2022 | | 2023 | | 2022 | |
| 2022 | | | 2021 | | 2022 | | 2021 | | |
| Summary of operations: | Summary of operations: | | | | | | | | | | | Summary of operations: | | | | | | | | | | |
| Net interest income before provision for (reversal of) credit losses | | $ | 551,809 | | | | $ | 395,706 | | | $ | 1,440,374 | | | $ | 1,125,874 | | | |
| Net interest income before provision for credit losses | | Net interest income before provision for credit losses | | $ | 566,746 | | | | $ | 472,952 | | | $ | 1,166,607 | | | $ | 888,565 | | |
| Noninterest income | Noninterest income | | 75,552 | | | | 73,109 | | | 233,739 | | | 214,406 | | | Noninterest income | | 78,631 | | | | 78,444 | | | 138,609 | | | 158,187 | | |
| Total revenue | Total revenue | | 627,361 | | | | 468,815 | | | 1,674,113 | | | 1,340,280 | | | Total revenue | | 645,377 | | | | 551,396 | | | 1,305,216 | | | 1,046,752 | | |
| Provision for (reversal of) credit losses | | 27,000 | | | | (10,000) | | | 48,500 | | | (25,000) | | | |
| Provision for credit losses | | Provision for credit losses | | 26,000 | | | | 13,500 | | | 46,000 | | | 21,500 | | |
| | Noninterest expense | Noninterest expense | | 215,973 | | | | 205,384 | | | 602,283 | | | 585,984 | | | Noninterest expense | | 261,789 | | | | 196,860 | | | 480,236 | | | 386,310 | | |
| Income before income taxes | Income before income taxes | | 384,388 | | | | 273,431 | | | 1,023,330 | | | 779,296 | | | Income before income taxes | | 357,588 | | | | 341,036 | | | 778,980 | | | 638,942 | | |
| Income tax expense | Income tax expense | | 89,049 | | | | 47,982 | | | 232,010 | | | 124,111 | | | Income tax expense | | 45,557 | | | | 82,707 | | | 144,510 | | | 142,961 | | |
| | Net income | Net income | | $ | 295,339 | | | | $ | 225,449 | | | $ | 791,320 | | | $ | 655,185 | | | Net income | | $ | 312,031 | | | | $ | 258,329 | | | $ | 634,470 | | | $ | 495,981 | | |
| | Per common share: | | | | | | | | | | | |
| Per share: | | Per share: | | | | | | | | | | |
| Basic earnings | Basic earnings | | $ | 2.10 | | | | $ | 1.59 | | | $ | 5.59 | | | $ | 4.62 | | | Basic earnings | | $ | 2.21 | | | | $ | 1.83 | | | $ | 4.49 | | | $ | 3.50 | | |
| Diluted earnings | Diluted earnings | | $ | 2.08 | | | | $ | 1.57 | | | $ | 5.55 | | | $ | 4.58 | | | Diluted earnings | | $ | 2.20 | | | | $ | 1.81 | | | $ | 4.47 | | | $ | 3.47 | | |
| Dividends declared | Dividends declared | | $ | 0.40 | | | | $ | 0.33 | | | $ | 1.20 | | | $ | 0.99 | | | Dividends declared | | $ | 0.48 | | | | $ | 0.40 | | | $ | 0.96 | | | $ | 0.80 | | |
| | Weighted-average number of shares outstanding: | Weighted-average number of shares outstanding: | | | | | Weighted-average number of shares outstanding: | | | | |
| Basic | Basic | | 140,917 | | | | 141,880 | | | 141,453 | | | 141,799 | | | Basic | | 141,468 | | | | 141,429 | | | 141,291 | | | 141,725 | | |
| Diluted | Diluted | | 142,011 | | | | 143,143 | | | 142,601 | | | 143,051 | | | Diluted | | 141,876 | | | | 142,372 | | | 141,910 | | | 142,838 | | |
| | Performance metrics: | Performance metrics: | | | | | Performance metrics: | | | | |
| Return on average assets (“ROA”) | Return on average assets (“ROA”) | | 1.86 | % | | | 1.46 | % | | 1.70 | % | | 1.50 | % | | Return on average assets (“ROA”) | | 1.85 | % | | | 1.66 | % | | 1.93 | % | | 1.61 | % | |
| Return on average equity (“ROE”) | | 20.30 | % | | | 15.75 | % | | 18.35 | % | | 15.98 | % | | |
Tangible return on average tangible equity (1) | | 22.16 | % | | | 17.25 | % | | 20.04 | % | | 17.56 | % | | |
| Return on average common equity (“ROE”) | | Return on average common equity (“ROE”) | | 19.43 | % | | | 18.23 | % | | 20.27 | % | | 17.36 | % | |
Return on average tangible common equity (“TCE”) (1) | | Return on average tangible common equity (“TCE”) (1) | | 21.01 | % | | | 19.94 | % | | 21.95 | % | | 18.96 | % | |
| | Common dividend payout ratio | Common dividend payout ratio | | 19.33 | % | | | 21.05 | % | | 21.75 | % | | 21.72 | % | | Common dividend payout ratio | | 21.98 | % | | | 22.22 | % | | 21.60 | % | | 23.18 | % | |
| Net interest margin | Net interest margin | | 3.68 | % | | | 2.70 | % | | 3.27 | % | | 2.72 | % | | Net interest margin | | 3.55 | % | | | 3.23 | % | | 3.75 | % | | 3.05 | % | |
Efficiency ratio (2) | Efficiency ratio (2) | | 34.43 | % | | | 43.81 | % | | 35.98 | % | | 43.72 | % | | Efficiency ratio (2) | | 40.56 | % | | | 35.70 | % | | 36.79 | % | | 36.91 | % | |
Adjusted efficiency ratio (1) | Adjusted efficiency ratio (1) | | 31.18 | % | | | 35.55 | % | | 32.98 | % | | 36.80 | % | | Adjusted efficiency ratio (1) | | 31.83 | % | | | 32.90 | % | | 31.13 | % | | 34.05 | % | |
| |
| | At period end: | At period end: | | September 30, 2022 | | December 31, 2021 | At period end: | | June 30, 2023 | | December 31, 2022 |
| Total assets | Total assets | | $ | 62,576,061 | | | $ | 60,870,701 | | Total assets | | $ | 68,532,681 | | | $ | 64,112,150 | |
| Total loans | Total loans | | $ | 47,456,755 | | | $ | 41,694,416 | | Total loans | | $ | 49,831,194 | | | $ | 48,228,074 | |
| Total deposits | Total deposits | | $ | 53,857,362 | | | $ | 53,350,532 | | Total deposits | | $ | 55,658,786 | | | $ | 55,967,849 | |
| Common shares outstanding at period-end | Common shares outstanding at period-end | | 140,918 | | | 141,908 | | Common shares outstanding at period-end | | 141,484 | | | 140,948 | |
| Book value per common share | | $ | 40.17 | | | $ | 41.13 | | |
Tangible equity per common share (1) | | $ | 36.80 | | | $ | 37.79 | | |
| Book value per share | | Book value per share | | $ | 45.67 | | | $ | 42.46 | |
Tangible book value per share (1) | | Tangible book value per share (1) | | $ | 42.33 | | | $ | 39.10 | |
|
(1)For additional information regarding the reconciliation of these non-U.S. Generally Accepted Accounting Principles (“GAAP”) financial measures, refer to Item 2. Management’s Discussion and Analysis of Financial Condition and Results of Operation (“MD&A”)&A — Reconciliation of GAAP to Non-GAAP Financial Measures in this Quarterly Report on Form 10-Q.10-Q (this “Form 10-Q”).
(2)Efficiency ratio is calculated as noninterest expense divided by total revenue.
The Company’s thirdsecond quarter 2023 net income was $312.0 million, an increase of $53.7 million or 21%, compared with second quarter 2022 net income of $258.3 million. The increase was $295.3 million, an increase of $69.9 million or 31%, compared with third quarter 2021primarily due to higher net interest income of $225.4 million.and lower income tax expense, partially offset by higher noninterest expense and provision for credit losses. Net income for the first nine monthshalf of 20222023 was $791.3$634.5 million, an increase of $136.1$138.5 million or 21%,28% compared with the first nine monthshalf of 20212022 net income of $655.2$496.0 million. The year-over-year increases in both periods wereincrease was primarily due to higher net interest income, partially offset by higher income taxnoninterest expense and provision for credit losses.losses, and a decrease in noninterest income. Noteworthy items about the Company’s thirdsecond quarter and first nine monthshalf of 20222023 performance included:
•Net interest income growth and net interest margin expansion.expansion. ThirdSecond quarter 20222023 net interest income before provision for (reversal of) credit losses was $551.8$566.7 million, an increase of $156.1$93.8 million or 39%20% from the thirdsecond quarter of 2021. Third2022. Second quarter 20222023 net interest margin of 3.68%3.55% expanded 98 bpsby 32 basis points (“bps”) year-over-year. For the first nine monthshalf of 2022,2023, net interest income before provision for (reversal of) credit losses was $1.44$1.17 billion, an increase of $314.5$278.0 million or 28%31% year-over-year. The net interest margin for the first nine monthshalf of 20222023 was 3.27%3.75%, up 5570 bps year-over-year.
•Improved efficiency.Expanding profitability. Efficiency ratiosSecond quarter 2023 ROA, ROE and the return on average TCE of 34.43%1.85%, 19.43% and 35.98%21.01%, respectively, all expanded year-over-year by 19 bps, 120 bps and 107 bps, respectively. Likewise, for the third quarterfirst half of 2023, ROA, ROE and first nine monthsthe return on average TCE of 2022,1.93%, 20.27% and 21.95%, respectively, both improved year-over-year. The adjusted efficiency ratios of 31.18%all expanded year-over-year by 32 bps, 291 bps and 32.98% for the third quarter and first nine months of 2022, respectively, both improved year-over-year.299 bps, respectively. Return on average TCE is a non-GAAP financial measure. For additional details, see the reconciliation of non-GAAP financial measures presented under Item 2. MD&A — Reconciliation of GAAP to Non-GAAP Financial Measures in this Form 10-Q.
•Expanding profitability.Asset growth. Third quarterTotal assets reached $68.53 billion, an increase of $4.42 billion or 7% from December 31, 2022, ROA, ROEprimarily driven by a $2.90 billion or 83% increase in cash and cash equivalents and a $1.60 billion or 3% increase in total loans. The increase in cash and cash equivalents was primarily funded with borrowings from the tangible return on average tangibleBank Term Funding Program (“BTFP”).
•Loan growth. Total loans were $49.83 billion as of June 30, 2023, an increase of $1.60 billion or 3% from $48.23 billion as of December 31, 2022. This was primarily driven by growth in the commercial real estate (“CRE”) and residential mortgage loan segments.
•Strong capital levels. Stockholders’ equity was $6.46 billion or $45.67 per share as of 1.86%, 20.30% and 22.16%, respectively, all expanded compared with third quarter 2021. Likewise, for the first nine monthsJune 30, 2023, both up 8% from $5.98 billion or $42.46 per share as of 2022, ROA, ROE and the tangible return on average tangible equityDecember 31, 2022. Tangible book value per share of 1.70%, 18.35% and 20.04%, respectively, all expanded year-over-year.$42.33 as of June 30, 2023, increased $3.23 or 8% from $39.10 as of December 31, 2022. Tangible book value per share is a non-GAAP financial measure. For additional details, see the reconciliation of non-GAAP financial measures presented under Item 2. MD&A —- Reconciliation of GAAP to Non-GAAPnon-GAAP Financial Measures in this Form 10-Q.
•Total assets reached $62.58 billion, growing by $1.71 billion or 3% from December 31, 2021, primarily driven by loan growth.
•Total loans were $47.46 billion as of September 30, 2022, an increase of $5.76 billion or 14% from $41.69 billion as of December 31, 2021. This was primarily driven by well-diversified growth across the commercial real estate (“CRE”), residential mortgage, and commercial and industrial (“C&I”) loan segments.
•Total deposits were $53.86 billion as of September 30, 2022, an increase of $506.8 million or 1% from $53.35 billion as of December 31, 2021. Growth was primarily driven by increased time deposits, partially offset by decreases in noninterest-bearing demand and money market accounts.
Results of Operations
Net Interest Income
The Company’s primary source of revenue is net interest income, which is the interest income earned on interest-earning assets less interest expense paid on interest-bearing liabilities. Net interest margin is the ratio of net interest income to average interest-earning assets. Net interest income and net interest margin are impacted by several factors, including changes in average balances and the composition of interest-earning assets and funding sources, market interest rate fluctuations and the slope of the yield curve, repricing characteristics and maturity of interest-earning assets and interest-bearing liabilities, the volume of noninterest-bearing sources of funds, and asset quality.
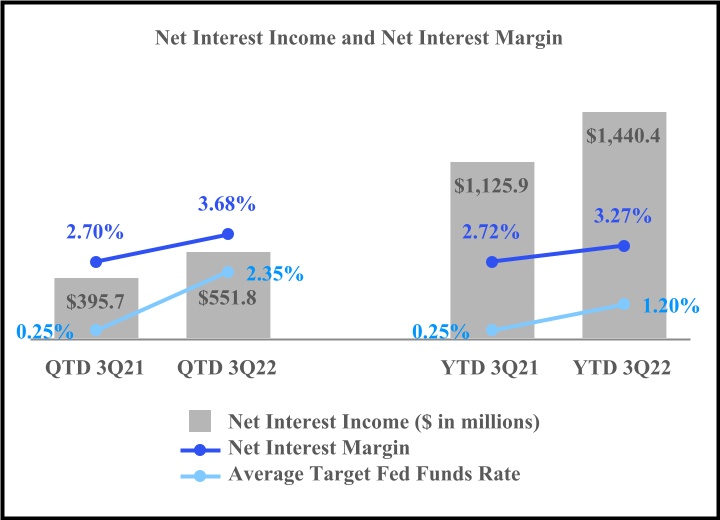

Third quarter 2022 net interest income before provision for credit losses was $551.8 million, an increase of $156.1 million or 39%, compared with $395.7 million for the third quarter 2021. For the first nine months of 2022, net interest income was $1.44 billion, an increase of $314.5 million or 28%, compared with $1.13 billion for the first nine months of 2021. Third quarter 2022 net interest margin was 3.68%, an increase of 98 bps from 2.70% for the third quarter of 2021. The year-over-year changesincreases in net interest income and net interest margin in the second quarter and the first half of 2023 compared with the same prior year periods primarily reflected higher loaninterest-earning asset yields and strong loan growth, andpartially offset by a higher debt securities yields. For the first nine monthsaverage cost of 2022, net interest margin was 3.27%, an increase of 55 bps from 2.72% for the first nine months of 2021. The year-over-year changes in net interest income and net interest margin primarily reflected higher loan yields, strong loan growth and higher debt securities volume and yields.deposits. The changes in yieldsyield and ratesrate reflected rising benchmark interest rates.
Average interest-earning assets were $59.48$64.06 billion for the thirdsecond quarter of 2022,2023, an increase of $1.24$5.39 billion or 2%9% from $58.24$58.67 billion for the thirdsecond quarter of 2021.2022. For the first nine monthshalf of 2022,2023, the average interest-earning assets were $58.95$62.78 billion, an increase of $3.60$4.10 billion or 7% from $55.35$58.68 billion for the first nine monthshalf of 2021.2022. The increases in average interest-earning assets in both periods primarily reflected loan growth, in loans and debt securities, partially offset by a decrease inhigher interest-bearing cash and deposits with banks.banks, partially offset by decreases in assets purchased under resale agreements (“resale agreements”).
The yield on average interest-earning assets for the thirdsecond quarter of 20222023 was 4.19%5.67%, an increase of 136225 bps from 2.83%3.42% for the thirdsecond quarter of 2021.2022. The yield on average interest-earning assets for the first nine monthshalf of 20222023 was 3.54%5.59%, an increase of 65239 bps from 2.89%3.20% for the first nine monthshalf of 2021.2022. The year-over-year changesincreases in the yield on average interest-bearinginterest-earning assets primarily resulted from rising benchmark interest rates and a changed earning asset mix in favor of higher-yielding assets.rates.
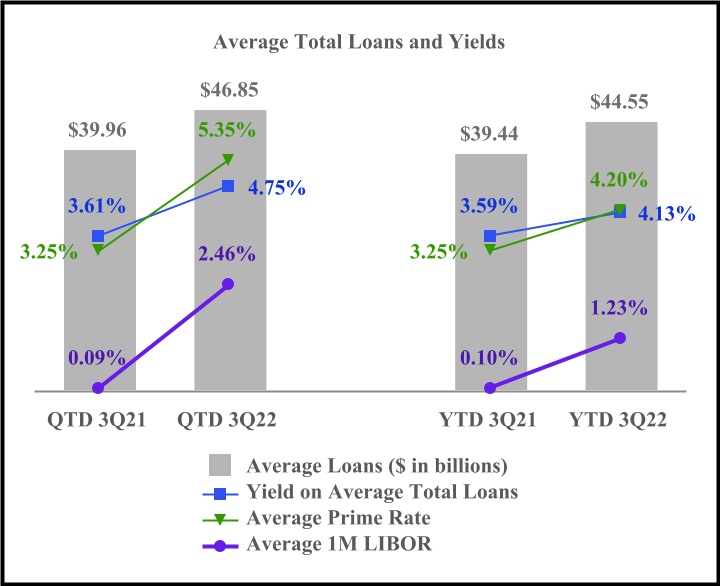

The average loan yield for the thirdsecond quarter of 20222023 was 4.75%6.33%, an increase of 114238 bps from 3.61%3.95% for the thirdsecond quarter of 2021.2022. The average loan yield for the first nine monthshalf of 2022 was 4.13%6.24%, an increase of 54244 bps from 3.59%3.80% for the first nine monthshalf of 2021.2022. The year-over-year changes in the average loan yield reflectreflected the loan portfolio’s sensitivity to rising benchmark interest rates. Approximately 62%61% and 65%63% of loans held-for-investment were variable-rate or hybrid loans in their adjustable-rate period as of SeptemberJune 30, 20222023 and 2021,2022, respectively.
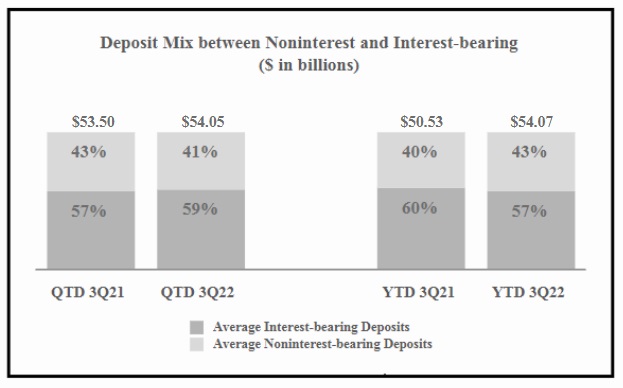

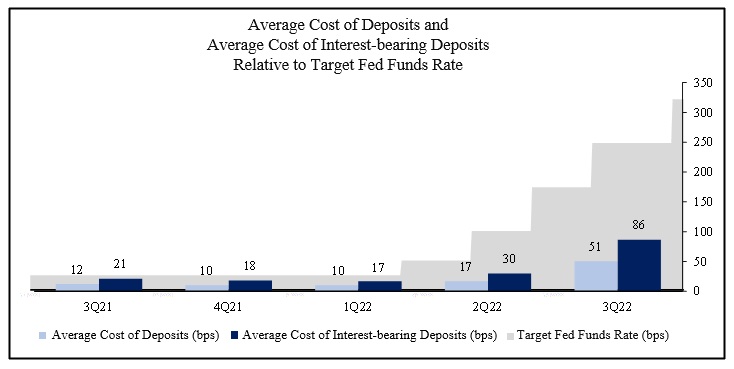

Deposits are an important source of funds and impact both net interest income and net interest margin. Average deposits were $54.05$54.28 billion for the thirdsecond quarter of 2022,2023, which increased $155.0 million from $54.13 billion for the second quarter of 2022. For the first half of 2023, average deposits were $54.62 billion, an increase of $554.9$539.7 million or 1% from $53.50 billion for the third quarter of 2021. For the first nine months of 2022, average deposits were $54.07 billion, an increase of $3.54 billion or 7% from $50.53$54.08 billion for the first nine monthshalf of 2021.2022. Average noninterest-bearing deposits were $22.42$16.93 billion for the thirdsecond quarter of 2022,2023, a decrease of $745.7 million$6.96 billion or 3%29% from $23.17$23.89 billion for the thirdsecond quarter of 2021.2022. For the first nine monthshalf of 2022,2023, average noninterest-bearing deposits were $23.24$18.31 billion, an increasea decrease of $2.90$5.35 billion or 14%23% from $20.35$23.66 billion for the first nine monthshalf of 2021.2022. Average noninterest-bearing deposits made up 41%31% and 43%44% of average deposits for the thirdsecond quarters of 20222023 and 2021,2022, respectively, and 43%34% and 40%44% for the first nine monthshalves of 20222023 and 2021,2022, respectively.
The average cost of deposits was 0.51%2.12% for the thirdsecond quarter of 2022,2023, a 39195 bps increase from 0.12%0.17% for the thirdsecond quarter of 2021.2022. The average cost of interest-bearing deposits was 0.86%3.09% for the thirdsecond quarter of 2022,2023, a 65279 bps increase from 0.21%0.30% for the thirdsecond quarter of 2021.2022. The average cost of deposits was 0.26%1.86% for the first nine monthshalf of 2022, an2023, a 173 bps increase of 11 bps from 0.15%0.13% for the first nine monthshalf of 2021.2022. The average cost of interest-bearing deposits was 0.45%2.80% for the first nine monthshalf of 2022,2023, a 20256 bps increase from 0.25%0.24% for the first nine monthshalf of 2021.2022. The year-over-year increases primarily reflected higher rates paid on time deposits, money market accounts and time deposits.checking deposits in response to the rising interest rate environment.
The average cost of funds calculation includes deposits, short-term borrowings, Federal Home Loan Bank (“FHLB”) advances, assets sold under repurchase agreements (“repurchase agreements”), and long-term debt and short-term borrowings.debt. For the thirdsecond quarter of 2022,2023, the average cost of funds was 0.55%2.31%, a 41211 bps increase from 0.14%0.20% for the thirdsecond quarter of 2021.2022. For the first nine monthshalf of 2022,2023, the average cost of funds was 0.29%2.01%, an 11a 185 bps increase from 0.18%0.16% for the first nine monthshalf of 2021.2022. The year-over-year changesincreases in the average cost of fundsboth periods were mainly driven by the changes in theincreased cost of deposits discussed above.
The Company utilizes various tools to manage interest rate risk. Refer to the Interest Rate Risk Management section of Item 2. MD&A — Risk Management — Market Risk Management in this Form 10-Q.
The following table presents the interest spread, net interest margin, average balances, interest income and expense, and the average yield/rate by asset and liability component for the third quarters of 2022 and 2021:
| | | | | | | | | | | | | | | | | | | | | | | | | | | | | | | | | | | | | | |
|
| ($ in thousands) | | Three Months Ended September 30, |
| 2022 | | 2021 |
| Average
Balance | | Interest | | Average Yield/ Rate (1) | | Average
Balance | | Interest | | Average Yield/ Rate (1) |
| ASSETS | | | | | | | | | | | | |
| Interest-earning assets: | | | | | | | | | | | | |
| Interest-bearing cash and deposits with banks | | $ | 2,287,010 | | | $ | 9,080 | | | 1.58 | % | | $ | 7,036,823 | | | $ | 4,521 | | | 0.25 | % |
| Resale agreements | | 1,037,292 | | | 6,769 | | | 2.59 | % | | 2,382,741 | | | 8,957 | | | 1.49 | % |
Available-for-sale (“AFS”) debt securities (2)(3) | | 6,204,729 | | | 38,383 | | | 2.45 | % | | 8,782,682 | | | 37,826 | | | 1.71 | % |
Held-to-maturity (“HTM”) debt securities (2)(4) | | 3,017,063 | | | 12,709 | | | 1.67 | % | | — | | | — | | | — | % |
Loans (5)(6) | | 46,854,541 | | | 560,452 | | | 4.75 | % | | 39,960,151 | | | 363,503 | | | 3.61 | % |
| | | | | | | | | | | | |
| | | | | | | | | | | | |
| | | | | | | | | | | | |
| | | | | | | | | | | | |
| | | | | | | | | | | | |
| | | | | | | | | | | | |
| | | | | | | | | | | | |
| Restricted equity securities | | 78,054 | | | 843 | | | 4.28 | % | | 77,083 | | | 500 | | | 2.57 | % |
| Total interest-earning assets | | $ | 59,478,689 | | | $ | 628,236 | | | 4.19 | % | | $ | 58,239,480 | | | $ | 415,307 | | | 2.83 | % |
| Noninterest-earning assets: | | | | | | | | | | | | |
| Cash and due from banks | | 615,836 | | | | | | | 627,640 | | | | | |
| Allowance for loan losses | | (566,369) | | | | | | | (584,827) | | | | | |
| Other assets | | 3,551,288 | | | | | | | 3,077,240 | | | | | |
| Total assets | | $ | 63,079,444 | | | | | | | $ | 61,359,533 | | | | | |
| LIABILITIES AND STOCKHOLDERS’ EQUITY | | | | | | | | | | | | |
| Interest-bearing liabilities: | | | | | | | | | | | | |
| Checking deposits | | $ | 6,879,632 | | | $ | 8,493 | | | 0.49 | % | | $ | 6,646,515 | | | $ | 3,186 | | | 0.19 | % |
| Money market deposits | | 12,351,571 | | | 33,101 | | | 1.06 | % | | 12,604,827 | | | 3,446 | | | 0.11 | % |
| Savings deposits | | 2,961,634 | | | 2,268 | | | 0.30 | % | | 2,792,702 | | | 1,943 | | | 0.28 | % |
| Time deposits | | 9,435,063 | | | 25,032 | | | 1.05 | % | | 8,283,265 | | | 7,395 | | | 0.35 | % |
| Federal funds purchased and other short-term borrowings | | 211,794 | | | 1,177 | | | 2.20 | % | | 620 | | | — | | | — | % |
| FHLB advances | | 86,243 | | | 392 | | | 1.80 | % | | 248,614 | | | 857 | | | 1.37 | % |
| Repurchase agreements | | 624,821 | | | 4,421 | | | 2.81 | % | | 310,997 | | | 2,012 | | | 2.57 | % |
| Long-term debt and finance lease liabilities | | 152,565 | | | 1,543 | | | 4.01 | % | | 151,870 | | | 762 | | | 1.99 | % |
| Total interest-bearing liabilities | | $ | 32,703,323 | | | $ | 76,427 | | | 0.93 | % | | $ | 31,039,410 | | | $ | 19,601 | | | 0.25 | % |
| Noninterest-bearing liabilities and stockholders’ equity: | | | | | | | | | | | | |
| Demand deposits | | 22,423,633 | | | | | | | 23,169,323 | | | | | |
| Accrued expenses and other liabilities | | 2,179,850 | | | | | | | 1,470,494 | | | | | |
| Stockholders’ equity | | 5,772,638 | | | | | | | 5,680,306 | | | | | |
| Total liabilities and stockholders’ equity | | $ | 63,079,444 | | | | | | | $ | 61,359,533 | | | | | |
| Interest rate spread | | | | | | 3.26 | % | | | | | | 2.58 | % |
| Net interest income and net interest margin | | | | $ | 551,809 | | | 3.68 | % | | | | $ | 395,706 | | | 2.70 | % |
|
(1)Annualized.
(2)Yields on tax-exempt securities are not presented on a tax-equivalent basis.
(3)Includes the amortization of premiums on AFS debt securities of $16.5 million and $22.6 million for the third quarters of 2022 and 2021, respectively.
(4)Includes the amortization of premiums on HTM debt securities of $189 thousand for the third quarter of 2022.
(5)Average balances include nonperforming loans and loans held-for-sale.
(6)Loans include the accretion of net deferred loan fees and amortization of net premiums, which totaled $12.5 million and $17.0 million for the third quarters of 2022 and 2021, respectively.
The following table presents the interest spread, net interest margin, average balances, interest income and expense, and the average yield/rate by asset and liability component for the first nine monthssecond quarters of 20222023 and 2021:2022:
| | | ($ in thousands) | | Nine Months Ended September 30, | |
| 2022 | | 2021 | |
| | Three Months Ended June 30, |
| | | 2023 | | 2022 |
| ($ in thousands) | ($ in thousands) | | Average
Balance | | Interest | | Average Yield/ Rate (1) | | Average
Balance | | Interest | | Average Yield/ Rate (1) | ($ in thousands) | | Average Balance | | Interest | | Average Yield/ Rate (1) | | Average Balance | | Interest | | Average Yield/ Rate (1) |
| | | | | | | | | | | | ASSETS | | | | | | | | | | | | |
| Interest-earning assets: | |
| Interest-bearing cash and deposits with banks | Interest-bearing cash and deposits with banks | | $ | 3,175,596 | | | $ | 17,127 | | | 0.72 | % | | $ | 6,078,982 | | | $ | 11,781 | | | 0.26 | % | Interest-bearing cash and deposits with banks | | $ | 5,247,755 | | | $ | 60,995 | | | 4.66 | % | | $ | 2,797,711 | | | $ | 4,787 | | | 0.69 | % |
| Resale agreements | Resale agreements | | 1,588,452 | | | 23,705 | | | 2.00 | % | | 1,994,776 | | | 23,077 | | | 1.55 | % | Resale agreements | | 641,939 | | | 3,969 | | | 2.48 | % | | 1,641,723 | | | 8,553 | | | 2.09 | % |
AFS debt securities (2)(3) | | 6,886,268 | | | 106,290 | | | 2.06 | % | | 7,755,029 | | | 101,616 | | | 1.75 | % | |
HTM debt securities (2)(4) | | 2,672,797 | | | 33,645 | | | 1.68 | % | | — | | | — | | | — | % | |
Available-for-sale (“AFS”) debt securities (2)(3) | | Available-for-sale (“AFS”) debt securities (2)(3) | | 6,257,397 | | | 56,292 | | | 3.61 | % | | 6,503,677 | | | 33,438 | | | 2.06 | % |
Held-to-maturity (“HTM”) debt securities (2) | | Held-to-maturity (“HTM”) debt securities (2) | | 2,983,780 | | | 12,678 | | | 1.70 | % | | 3,021,239 | | | 12,738 | | | 1.69 | % |
Loans (6)(5) | Loans (6)(5) | | 44,548,520 | | | 1,376,978 | | | 4.13 | % | | 39,441,751 | | | 1,057,964 | | | 3.59 | % | Loans (6)(5) | | 48,851,720 | | | 771,264 | | | 6.33 | % | | 44,626,488 | | | 439,416 | | | 3.95 | % |
| | Restricted equity securities | Restricted equity securities | | 77,824 | | | 2,274 | | | 3.91 | % | | 80,107 | | | 1,588 | | | 2.65 | % | Restricted equity securities | | 78,978 | | | 936 | | | 4.75 | % | | 77,839 | | | 822 | | | 4.24 | % |
| Total interest-earning assets | Total interest-earning assets | | $ | 58,949,457 | | | $ | 1,560,019 | | | 3.54 | % | | $ | 55,350,645 | | | $ | 1,196,026 | | | 2.89 | % | Total interest-earning assets | | $ | 64,061,569 | | | $ | 906,134 | | | 5.67 | % | | $ | 58,668,677 | | | $ | 499,754 | | | 3.42 | % |
| Noninterest-earning assets: | Noninterest-earning assets: | | | | | | | | | | | | | Noninterest-earning assets: | | | | | | | | | | | | |
| Cash and due from banks | Cash and due from banks | | 656,772 | | | 602,830 | | | Cash and due from banks | | 569,227 | | | 712,884 | | |
| Allowance for loan losses | Allowance for loan losses | | (551,818) | | | (603,523) | | | Allowance for loan losses | | (619,868) | | | (545,489) | | |
| Other assets | Other assets | | 3,307,207 | | | 2,913,050 | | | Other assets | | 3,486,439 | | | 3,396,769 | | |
| Total assets | Total assets | | $ | 62,361,618 | | | $ | 58,263,002 | | | Total assets | | $ | 67,497,367 | | | $ | 62,232,841 | | |
| LIABILITIES AND STOCKHOLDERS’ EQUITY | LIABILITIES AND STOCKHOLDERS’ EQUITY | | | | | | LIABILITIES AND STOCKHOLDERS’ EQUITY | | | | | |
| Interest-bearing liabilities: | Interest-bearing liabilities: | | Interest-bearing liabilities: | |
| Checking deposits | Checking deposits | | $ | 6,747,711 | | | $ | 13,073 | | | 0.26 | % | | $ | 6,571,231 | | | $ | 11,177 | | | 0.23 | % | Checking deposits | | $ | 8,434,655 | | | $ | 49,571 | | | 2.36 | % | | $ | 6,712,890 | | | $ | 3,178 | | | 0.19 | % |
| Money market deposits | Money market deposits | | 12,526,222 | | | 45,196 | | | 0.48 | % | | 12,262,173 | | | 11,869 | | | 0.13 | % | Money market deposits | | 10,433,839 | | | 86,419 | | | 3.32 | % | | 12,319,930 | | | 8,892 | | | 0.29 | % |
| Savings deposits | Savings deposits | | 2,954,098 | | | 5,836 | | | 0.26 | % | | 2,715,114 | | | 5,762 | | | 0.28 | % | Savings deposits | | 2,200,124 | | | 3,963 | | | 0.72 | % | | 2,970,007 | | | 1,864 | | | 0.25 | % |
| Time deposits | Time deposits | | 8,596,728 | | | 40,266 | | | 0.63 | % | | 8,635,250 | | | 26,982 | | | 0.42 | % | Time deposits | | 16,289,320 | | | 147,524 | | | 3.63 | % | | 8,239,571 | | | 8,554 | | | 0.42 | % |
| Federal funds purchased and other short-term borrowings | Federal funds purchased and other short-term borrowings | | 93,370 | | | 1,427 | | | 2.04 | % | | 1,871 | | | 42 | | | 3.00 | % | Federal funds purchased and other short-term borrowings | | 4,500,566 | | | 49,032 | | | 4.37 | % | | 64,145 | | | 241 | | | 1.51 | % |
| FHLB advances | FHLB advances | | 128,137 | | | 1,529 | | | 1.60 | % | | 457,273 | | | 6,025 | | | 1.76 | % | FHLB advances | | 1 | | | — | | | — | % | | 138,960 | | | 559 | | | 1.61 | % |
| Repurchase agreements | Repurchase agreements | | 433,340 | | | 8,855 | | | 2.73 | % | | 304,745 | | | 5,981 | | | 2.62 | % | Repurchase agreements | | 15,579 | | | 211 | | | 5.43 | % | | 359,778 | | | 2,418 | | | 2.70 | % |
| Long-term debt and finance lease liabilities | Long-term debt and finance lease liabilities | | 152,259 | | | 3,463 | | | 3.04 | % | | 152,018 | | | 2,314 | | | 2.04 | % | Long-term debt and finance lease liabilities | | 152,760 | | | 2,668 | | | 7.01 | % | | 152,194 | | | 1,096 | | | 2.89 | % |
| Total interest-bearing liabilities | Total interest-bearing liabilities | | $ | 31,631,865 | | | $ | 119,645 | | | 0.51 | % | | $ | 31,099,675 | | | $ | 70,152 | | | 0.30 | % | Total interest-bearing liabilities | | $ | 42,026,844 | | | $ | 339,388 | | | 3.24 | % | | $ | 30,957,475 | | | $ | 26,802 | | | 0.35 | % |
| Noninterest-bearing liabilities and stockholders’ equity: | Noninterest-bearing liabilities and stockholders’ equity: | | | | | | | | | | | | | Noninterest-bearing liabilities and stockholders’ equity: | | | | | | | | | | | | |
| Demand deposits | Demand deposits | | 23,244,247 | | | 20,345,370 | | | Demand deposits | | 16,926,937 | | | 23,887,452 | | |
| Accrued expenses and other liabilities | Accrued expenses and other liabilities | | 1,719,869 | | | 1,335,252 | | | Accrued expenses and other liabilities | | 2,102,590 | | | 1,705,487 | | |
| Stockholders’ equity | Stockholders’ equity | | 5,765,637 | | | 5,482,705 | | | Stockholders’ equity | | 6,440,996 | | | 5,682,427 | | |
| Total liabilities and stockholders’ equity | Total liabilities and stockholders’ equity | | $ | 62,361,618 | | | $ | 58,263,002 | | | Total liabilities and stockholders’ equity | | $ | 67,497,367 | | | $ | 62,232,841 | | |
| Interest rate spread | Interest rate spread | | | | 3.03 | % | | | | 2.59 | % | Interest rate spread | | | | 2.43 | % | | | | 3.07 | % |
| Net interest income and net interest margin | Net interest income and net interest margin | | $ | 1,440,374 | | | 3.27 | % | | $ | 1,125,874 | | | 2.72 | % | Net interest income and net interest margin | | $ | 566,746 | | | 3.55 | % | | $ | 472,952 | | | 3.23 | % |
|
(1)Annualized.
(2)Yields on tax-exempt securities are not presented on a tax-equivalent basis.
(3)Includes the amortization of net premiums on AFS debt securities of $60.3$7.3 million and $62.7$20.3 million for the first nine monthssecond quarters of 20222023 and 2021,2022, respectively.
(4)Includes the amortization of premiums on HTM debt securities of $423 thousand for the first nine months of 2022.
(5)Average balances include nonperforming loans and loans held-for-sale.
(6)(5)Loans include the accretion of net deferred loan fees and amortization of net premiums, which totaled $36.3$13.3 million and $46.8$11.4 million for the first nine monthssecond quarters of 20222023 and 2021,2022, respectively.
The following table presents the interest spread, net interest margin, average balances, interest income and expense, and the average yield/rate by asset and liability component for the first halves of 2023 and 2022:
| | | | | | | | | | | | | | | | | | | | | | | | | | | | | | | | | | | | | | |
|
| | Six Months Ended June 30, |
| | 2023 | | 2022 |
| ($ in thousands) | | Average Balance | | Interest | | Average Yield/ Rate (1) | | Average Balance | | Interest | | Average Yield/ Rate (1) |
| ASSETS | | | | | | | | | | | | |
| Interest-earning assets: | | | | | | | | | | | | |
| Interest-bearing cash and deposits with banks | | $ | 4,353,658 | | | $ | 96,642 | | | 4.48 | % | | $ | 3,627,253 | | | $ | 8,047 | | | 0.45 | % |
| Resale agreements | | 665,229 | | | 8,472 | | | 2.57 | % | | 1,868,600 | | | 16,936 | | | 1.83 | % |
AFS debt securities (2)(3) | | 6,183,522 | | | 109,489 | | | 3.57 | % | | 7,232,686 | | | 67,907 | | | 1.89 | % |
HTM debt securities (2) | | 2,989,695 | | | 25,412 | | | 1.71 | % | | 2,497,811 | | | 20,936 | | | 1.69 | % |
Loans (4)(5) | | 48,502,717 | | | 1,499,650 | | | 6.24 | % | | 43,376,398 | | | 816,526 | | | 3.80 | % |
| | | | | | | | | | | | |
| | | | | | | | | | | | |
| | | | | | | | | | | | |
| | | | | | | | | | | | |
| | | | | | | | | | | | |
| | | | | | | | | | | | |
| | | | | | | | | | | | |
| Restricted equity securities | | 84,852 | | | 1,975 | | | 4.69 | % | | 77,708 | | | 1,431 | | | 3.71 | % |
| Total interest-earning assets | | $ | 62,779,673 | | | $ | 1,741,640 | | | 5.59 | % | | $ | 58,680,456 | | | $ | 931,783 | | | 3.20 | % |
| Noninterest-earning assets: | | | | | | | | | | | | |
| Cash and due from banks | | 595,022 | | | | | | | 677,579 | | | | | |
| Allowance for loan losses | | (611,358) | | | | | | | (544,423) | | | | | |
| Other assets | | 3,548,733 | | | | | | | 3,183,144 | | | | | |
| Total assets | | $ | 66,312,070 | | | | | | | $ | 61,996,756 | | | | | |
| LIABILITIES AND STOCKHOLDERS’ EQUITY | | | | | | | | | | | | |
| Interest-bearing liabilities: | | | | | | | | | | | | |
| Checking deposits | | $ | 7,469,621 | | | $ | 72,745 | | | 1.96 | % | | $ | 6,680,657 | | | $ | 4,580 | | | 0.14 | % |
| Money market deposits | | 10,844,992 | | | 162,521 | | | 3.02 | % | | 12,614,994 | | | 12,095 | | | 0.19 | % |
| Savings deposits | | 2,317,702 | | | 7,632 | | | 0.66 | % | | 2,950,268 | | | 3,568 | | | 0.24 | % |
| Time deposits | | 15,674,457 | | | 261,373 | | | 3.36 | % | | 8,170,613 | | | 15,234 | | | 0.38 | % |
| Federal funds purchased and other short-term borrowings | | 2,666,249 | | | 57,857 | | | 4.38 | % | | 33,177 | | | 250 | | | 1.52 | % |
| FHLB advances | | 248,619 | | | 6,430 | | | 5.22 | % | | 149,431 | | | 1,137 | | | 1.53 | % |
| Repurchase agreements | | 60,931 | | | 1,263 | | | 4.18 | % | | 336,013 | | | 4,434 | | | 2.66 | % |
| Long-term debt and finance lease liabilities | | 152,591 | | | 5,212 | | | 6.89 | % | | 152,103 | | | 1,920 | | | 2.55 | % |
| Total interest-bearing liabilities | | $ | 39,435,162 | | | $ | 575,033 | | | 2.94 | % | | $ | 31,087,256 | | | $ | 43,218 | | | 0.28 | % |
| Noninterest-bearing liabilities and stockholders’ equity: | | | | | | | | | | | | |
| Demand deposits | | 18,310,770 | | | | | | | 23,661,355 | | | | | |
| Accrued expenses and other liabilities | | 2,253,266 | | | | | | | 1,486,067 | | | | | |
| Stockholders’ equity | | 6,312,872 | | | | | | | 5,762,078 | | | | | |
| Total liabilities and stockholders’ equity | | $ | 66,312,070 | | | | | | | $ | 61,996,756 | | | | | |
| Interest rate spread | | | | | | 2.65 | % | | | | | | 2.92 | % |
| Net interest income and net interest margin | | | | $ | 1,166,607 | | | 3.75 | % | | | | $ | 888,565 | | | 3.05 | % |
|
(1)Annualized.
(2)Yields on tax-exempt securities are not presented on a tax-equivalent basis.
(3)Includes the amortization of net premiums on AFS debt securities of $16.4 million and $43.8 million for the first halves of 2023 and 2022, respectively.
(4)Average balances include nonperforming loans and loans held-for-sale.
(5)Include the accretion of net deferred loan fees and amortization of net premiums, which totaled $27.0 million and $23.8 million for the first halves of 2023 and 2022, respectively.
The following table summarizes the extent to which changes in (1) interest rates, and (2) volume of average interest-earning assets and average interest-bearing liabilities affected the Company’s net interest income for the periods presented. The total change for each category of interest-earning assets and interest-bearing liabilities is segmented into changes attributable to variations in volume and yield/rate. Changes that are not solely due to either volume or yield/rate are allocated proportionally based on the absolute value of the change related to average volume and average yield/rate.
| | | ($ in thousands) | ($ in thousands) | | Three Months Ended September 30, | | Nine Months Ended September 30, | | ($ in thousands) | | Three Months Ended June 30, | | Six Months Ended June 30, | |
| 2022 vs. 2021 | | 2022 vs. 2021 | | ($ in thousands) | | 2023 vs. 2022 | | 2023 vs. 2022 | |
| Total
Change | | Changes Due to | | Total
Change | | Changes Due to | | | Total
Change | | Changes Due to | | Total
Change | | Changes Due to | |
| Volume | | Yield/Rate | | Volume | | Yield/Rate | | | Total
Change | | Volume | | | Total
Change | | Volume | | Yield/Rate | |
| Interest-earning assets: | Interest-earning assets: | | | | | | | | | | | | | | | | | | | | | | | | |
| Interest-bearing cash and deposits with banks | Interest-bearing cash and deposits with banks | | $ | 4,559 | | | $ | (4,874) | | | $ | 9,433 | | | $ | 5,346 | | | $ | (7,746) | | | $ | 13,092 | | | Interest-bearing cash and deposits with banks | | $ | 56,208 | | | $ | 7,381 | | | $ | 48,827 | | | $ | 88,595 | | | $ | 1,927 | | | $ | 86,668 | | |
| Resale agreements | Resale agreements | | (2,188) | | | (6,674) | | | 4,486 | | | 628 | | | (5,263) | | | 5,891 | | | Resale agreements | | (4,584) | | | (5,953) | | | 1,369 | | | (8,464) | | | (13,619) | | | 5,155 | | |
| AFS debt securities | AFS debt securities | | 557 | | | (13,051) | | | 13,608 | | | 4,674 | | | (12,166) | | | 16,840 | | | AFS debt securities | | 22,854 | | | (1,312) | | | 24,166 | | | 41,582 | | | (11,078) | | | 52,660 | | |
| HTM debt securities | HTM debt securities | | 12,709 | | | 12,709 | | | — | | | 33,645 | | | 33,645 | | | — | | | HTM debt securities | | (60) | | | (158) | | | 98 | | | 4,476 | | | 4,177 | | | 299 | | |
| Loans | Loans | | 196,949 | | | 69,707 | | | 127,242 | | | 319,014 | | | 146,568 | | | 172,446 | | | Loans | | 331,848 | | | 45,009 | | | 286,839 | | | 683,124 | | | 106,131 | | | 576,993 | | |
| Restricted equity securities | Restricted equity securities | | 343 | | | 6 | | | 337 | | | 686 | | | (46) | | | 732 | | | Restricted equity securities | | 114 | | | 12 | | | 102 | | | 544 | | | 141 | | | 403 | | |
| Total interest and dividend income | Total interest and dividend income | | $ | 212,929 | | | $ | 57,823 | | | $ | 155,106 | | | $ | 363,993 | | | $ | 154,992 | | | $ | 209,001 | | | Total interest and dividend income | | $ | 406,380 | | | $ | 44,979 | | | $ | 361,401 | | | $ | 809,857 | | | $ | 87,679 | | | $ | 722,178 | | |
| Interest-bearing liabilities: | Interest-bearing liabilities: | | | | | | | | | | | | | | Interest-bearing liabilities: | | | | | | | | | | | | | |
| Checking deposits | Checking deposits | | $ | 5,307 | | | $ | 116 | | | $ | 5,191 | | | $ | 1,896 | | | $ | 307 | | | $ | 1,589 | | | Checking deposits | | $ | 46,393 | | | $ | 1,020 | | | $ | 45,373 | | | $ | 68,165 | | | $ | 604 | | | $ | 67,561 | | |
| Money market deposits | Money market deposits | | 29,655 | | | (71) | | | 29,726 | | | 33,327 | | | 261 | | | 33,066 | | | Money market deposits | | 77,527 | | | (1,567) | | | 79,094 | | | 150,426 | | | (1,933) | | | 152,359 | | |
| Savings deposits | Savings deposits | | 325 | | | 122 | | | 203 | | | 74 | | | 488 | | | (414) | | | Savings deposits | | 2,099 | | | (593) | | | 2,692 | | | 4,064 | | | (911) | | | 4,975 | | |
| Time deposits | Time deposits | | 17,637 | | | 1,162 | | | 16,475 | | | 13,284 | | | (121) | | | 13,405 | | | Time deposits | | 138,970 | | | 15,605 | | | 123,365 | | | 246,139 | | | 25,508 | | | 220,631 | | |
| Federal funds purchased and other short-term borrowings | Federal funds purchased and other short-term borrowings | | 1,177 | | | — | | | 1,177 | | | 1,385 | | | 1,403 | | | (18) | | | Federal funds purchased and other short-term borrowings | | 48,791 | | | 47,487 | | | 1,304 | | | 57,607 | | | 56,274 | | | 1,333 | | |
| FHLB advances | FHLB advances | | (465) | | | (680) | | | 215 | | | (4,496) | | | (3,975) | | | (521) | | | FHLB advances | | (559) | | | (279) | | | (280) | | | 5,293 | | | 1,147 | | | 4,146 | | |
| Repurchase agreements | Repurchase agreements | | 2,409 | | | 2,204 | | | 205 | | | 2,874 | | | 2,619 | | | 255 | | | Repurchase agreements | | (2,207) | | | (3,453) | | | 1,246 | | | (3,171) | | | (4,851) | | | 1,680 | | |
| Long-term debt and finance lease liabilities | Long-term debt and finance lease liabilities | | 781 | | | 4 | | | 777 | | | 1,149 | | | 4 | | | 1,145 | | | Long-term debt and finance lease liabilities | | 1,572 | | | 4 | | | 1,568 | | | 3,292 | | | 6 | | | 3,286 | | |
| Total interest expense | Total interest expense | | $ | 56,826 | | | $ | 2,857 | | | $ | 53,969 | | | $ | 49,493 | | | $ | 986 | | | $ | 48,507 | | | Total interest expense | | $ | 312,586 | | | $ | 58,224 | | | $ | 254,362 | | | $ | 531,815 | | | $ | 75,844 | | | $ | 455,971 | | |
| Change in net interest income | Change in net interest income | | $ | 156,103 | | | $ | 54,966 | | | $ | 101,137 | | | $ | 314,500 | | | $ | 154,006 | | | $ | 160,494 | | | Change in net interest income | | $ | 93,794 | | | $ | (13,245) | | | $ | 107,039 | | | $ | 278,042 | | | $ | 11,835 | | | $ | 266,207 | | |
|
Noninterest Income
The following table presents the components of noninterest income for the thirdsecond quarters and first nine monthshalves of 20222023 and 2021:2022:
| | | ($ in thousands) | | Three Months Ended September 30, | | Nine Months Ended September 30, | | |
| | | Three Months Ended June 30, | | Six Months Ended June 30, | |
| | ($ in thousands) | ($ in thousands) | | 2022 | | 2021 | | % Change | | 2022 | | 2021 | | % Change | | ($ in thousands) | | 2023 | | 2022 | | | % Change | | 2023 | | 2022 | | % Change | |
| $ | 20,289 | | | $ | 17,516 | | | 16% | | $ | 59,869 | | | $ | 56,965 | | | 5% | | Lending fees | | $ | 20,901 | | | $ | 20,142 | | | | 4% | | $ | 41,487 | | | $ | 39,580 | | | 5% | |
| 23,636 | | | 18,508 | | | 28% | | 66,323 | | | 51,233 | | | 29% | | Deposit account fees | | 22,285 | | | 22,372 | | | | (0)% | | 43,988 | | | 42,687 | | | 3% | |
| Interest rate contracts and other derivative income | Interest rate contracts and other derivative income | | 8,761 | | | 7,156 | | | 22% | | 29,695 | | | 20,981 | | | 42% | | Interest rate contracts and other derivative income | | 7,373 | | | 9,801 | | | | (25)% | | 9,937 | | | 20,934 | | | (53)% | |
| Foreign exchange income | Foreign exchange income | | 10,083 | | | 13,101 | | | (23)% | | 34,143 | | | 35,634 | | | (4)% | | Foreign exchange income | | 13,251 | | | 11,361 | | | | 17% | | 25,911 | | | 24,060 | | | 8% | |
| Wealth management fees | Wealth management fees | | 8,903 | | | 5,598 | | | 59% | | 21,494 | | | 20,460 | | | 5% | | Wealth management fees | | 6,889 | | | 6,539 | | | | 5% | | 13,193 | | | 12,591 | | | 5% | |
| Net gains on sales of loans | | 2,129 | | | 3,329 | | | (36)% | | 5,968 | | | 6,601 | | | (10)% | | |
| Gains on sales of AFS debt securities | | — | | | 354 | | | (100)% | | 1,306 | | | 1,178 | | | 11% | | |
| Net (losses) gains on sales of loans | | Net (losses) gains on sales of loans | | (7) | | | 917 | | | | NM | | (29) | | | 3,839 | | | NM | |
| Net realized gains (losses) on AFS debt securities | | Net realized gains (losses) on AFS debt securities | | — | | | 28 | | | | NM | | (10,000) | | | 1,306 | | | NM | |
| | Other investment (loss) income | | (580) | | | 5,349 | | | (111)% | | 5,910 | | | 13,870 | | | (57)% | | |
| Other investment income | | Other investment income | | 4,003 | | | 4,863 | | | | (18)% | | 5,924 | | | 6,490 | | | (9)% | |
| Other income | Other income | | 2,331 | | | 2,198 | | | 6% | | 9,031 | | | 7,484 | | | 21% | | Other income | | 3,936 | | | 2,421 | | | | 63% | | 8,198 | | | 6,700 | | | 22% | |
| Total noninterest income | Total noninterest income | | $ | 75,552 | | | $ | 73,109 | | | 3% | | $ | 233,739 | | | $ | 214,406 | | | 9% | | Total noninterest income | | $ | 78,631 | | | $ | 78,444 | | | | 0% | | $ | 138,609 | | | $ | 158,187 | | | (12)% | |
|
NM — Not meaningful.
Noninterest income comprised 12% and 14%11% of total revenue for the thirdsecond quarter and the first nine monthshalf of 2022,2023, respectively, compared with 16%14% and 15% for both the thirdsecond quarter and the first nine monthshalf of 2021,2022, respectively. ThirdSecond quarter 20222023 noninterest income was $75.6$78.6 million, an increase of $2.4 million or 3%, compared with $73.1$78.4 million for the same period in 2021. This increase was primarily due to increases in deposit account fees, wealth management fees and lending fees, partially offset by other investment loss and a decrease in foreign exchange income.2022. Noninterest income for the first nine monthshalf of 20222023 was $233.7$138.6 million, an increasea decrease of $19.3$19.6 million or 9%12%, compared with $214.4$158.2 million for the same period in 2021.2022. This increasedecrease was primarily due to increasesnet realized losses on AFS debt securities and a decrease in deposit account fees, interest rate contracts and other derivative income; and lending fees, partially offset by lower other investment income.
Lending fees were $20.3 million for the third quarter of 2022, an increase of $2.8 million or 16% compared with $17.5 million for the same period in 2021. This was primarily due to increased syndication, unused commitment and other loan fees. Forincome during the first nine monthshalf of 2022, lending fees were $59.9 million, an increase of $2.9 million or 5%, compared with $57.0 million for the same period in 2021. This was primarily due to increased unused commitment and other loan fees, partially offset by a decrease in syndication fees.
Deposit account fees were $23.6 million for the third quarter of 2022, an increase of $5.1 million or 28%, compared with $18.5 million for the same period in 2021. For the first nine months of 2022, deposit account fees were $66.3 million, an increase of $15.1 million or 29%, compared with $51.2 million for the same period in 2021. These increases were primarily driven by growth in treasury management fees from commercial deposits.2023.
Interest rate contracts and other derivative income was $8.8$7.4 million for the thirdsecond quarter of 2022, an increase2023, a decrease of $1.6$2.4 million or 22%25%, compared with $7.2$9.8 million for the same period in 2021.2022. For the first nine monthshalf of 2022,2023, interest rate contracts and other derivative income was $29.7$9.9 million, an increasea decrease of $8.7$11.0 million or 42%53%, compared with $21.0$20.9 million for the same period in 2021. These increases2022. The decreases were primarily due to higherless favorable credit valuation adjustments, partially offset by an increase in transaction volume during the thirdsecond quarter and first nine monthshalf of 2022, compared with the same periods in 2021.2023.
Foreign exchange income was $10.1Net realized losses on AFS debt securities of $10.0 million for the thirdfirst half of 2023 were due to the write-off of an impaired subordinated debt security during the first quarter of 2022, a decrease of $3.0 million or 23%, compared with $13.12023. In comparison, net realized gains on AFS debt securities were $917 thousand and $1.3 million for the same period in 2021. For the first nine months of 2022, foreign exchange income was $34.1 million, a decrease of $1.5 million or 4%, compared with $35.6 million for the first nine months of 2021. The decreases for the thirdsecond quarter and first nine monthshalf of 2022, compared with the prior year periods, primarily reflected increased losses on foreign exchange trades, partially offset by the favorable valuation of certain foreign currency denominated balance sheet items.respectively.
Wealth management fees were $8.9 million for the third quarter of 2022, an increase of $3.3 million or 59%, compared with $5.6 million for the same period in 2021. For the first nine months of 2022, wealth management fees were $21.5 million, an increase of $1.0 million or 5%, compared with $20.5 million for the first nine months of 2021. These increases were primarily due to a higher volume of customer activity.
Other investment loss was $580 thousand for the third quarter of 2022, compared with income of $5.3 million for the same period in 2021. For the first nine months of 2022, other investment income was $5.9 million, a decrease of $8.0 million or 57% from $13.9 million for the first nine months of 2021. These decreases primarily reflected unfavorable equity valuation adjustments in the Company’s CRA investments in 2022, compared with the same year-ago periods.
Noninterest Expense
The following table presents the components of noninterest expense for the thirdsecond quarters and first nine monthshalves of 20222023 and 2021:2022:
| | | ($ in thousands) | | Three Months Ended September 30, | | Nine Months Ended September 30, | | |
| | Three Months Ended June 30, | | Six Months Ended June 30, | |
| | ($ in thousands) | ($ in thousands) | | 2022 | | 2021 | | % | | 2022 | | 2021 | | % | | ($ in thousands) | | 2023 | | 2022 | | | % Change | | 2023 | | 2022 | | % Change | |
| $ | 127,580 | | | $ | 105,751 | | | 21 | % | | $ | 357,213 | | | $ | 318,985 | | | 12 | % | | Compensation and employee benefits | | $ | 124,937 | | | $ | 113,364 | | | | 10 | % | | $ | 254,591 | | | $ | 229,633 | | | 11 | % | |
| Occupancy and equipment expense | Occupancy and equipment expense | | 15,920 | | | 15,851 | | | 0 | % | | 46,853 | | | 47,150 | | | (1) | % | | Occupancy and equipment expense | | 16,088 | | | 15,469 | | | | 4 | % | | 31,675 | | | 30,933 | | | 2 | % | |
| Deposit insurance premiums and regulatory assessments | Deposit insurance premiums and regulatory assessments | | 4,875 | | | 4,641 | | | 5 | % | | 14,519 | | | 12,791 | | | 14 | % | | Deposit insurance premiums and regulatory assessments | | 8,262 | | | 4,927 | | | | 68 | % | | 16,172 | | | 9,644 | | | 68 | % | |
| Deposit account expense | Deposit account expense | | 6,707 | | | 4,136 | | | 62 | % | | 17,071 | | | 11,845 | | | 44 | % | | Deposit account expense | | 10,559 | | | 5,671 | | | | 86 | % | | 20,168 | | | 10,364 | | | 95 | % | |
| Data processing | Data processing | | 3,725 | | | 3,575 | | | 4 | % | | 10,876 | | | 12,088 | | | (10) | % | | Data processing | | 3,213 | | | 3,486 | | | | (8) | % | | 6,560 | | | 7,151 | | | (8) | % | |
| Computer software expense | Computer software expense | | 6,889 | | | 8,426 | | | (18) | % | | 20,755 | | | 23,106 | | | (10) | % | | Computer software expense | | 7,479 | | | 6,572 | | | | 14 | % | | 14,839 | | | 13,866 | | | 7 | % | |
| Consulting expense | | 1,620 | | | 1,635 | | | (1) | % | | 5,474 | | | 4,978 | | | 10 | % | | |
| Legal expense | | 689 | | | 2,363 | | | (71) | % | | 2,454 | | | 5,840 | | | (58) | % | | |
| | Other operating expense | Other operating expense | | 28,094 | | | 20,998 | | | 34 | % | | 78,315 | | | 58,544 | | | 34 | % | | Other operating expense | | 35,337 | | | 32,392 | | | | 9 | % | | 70,207 | | | 55,840 | | | 26 | % | |
| Amortization of tax credit and other investments | Amortization of tax credit and other investments | | 19,874 | | | 38,008 | | | (48) | % | | 48,753 | | | 90,657 | | | (46) | % | | Amortization of tax credit and other investments | | 55,914 | | | 14,979 | | | | 273 | % | | 66,024 | | | 28,879 | | | 129 | % | |
| | Total noninterest expense | Total noninterest expense | | $ | 215,973 | | | $ | 205,384 | | | 5 | % | | $ | 602,283 | | | $ | 585,984 | | | 3 | % | | Total noninterest expense | | $ | 261,789 | | | $ | 196,860 | | | | 33 | % | | $ | 480,236 | | | $ | 386,310 | | | 24 | % | |
|
ThirdSecond quarter 20222023 noninterest expense was $216.0$261.8 million, an increase of $10.6$64.9 million or 5%33%, compared with $205.4$196.9 million for the same period in 2021. First nine months2022. For the first half of 20222023, noninterest expense was $602.3$480.2 million, an increase of $16.3$93.9 million or 3%24%, compared with $586.0$386.3 million for the same period in 2021. These2022. The increases in both the second quarter and the first half of 2023, were primarily due to higher compensation and employee benefits and other operating expense, partially offset by a decrease in the amortization of tax credit and other investments.investments, compensation and employee benefits, other operating expense, deposit account expense and deposit insurance premiums and regulatory assessments.
Compensation and employee benefits were $127.6$124.9 million for the thirdsecond quarter of 2022,2023, an increase of $21.8$11.6 million or 21%10%, compared with $105.8$113.4 million for the same period in 2021.2022. For the first nine monthshalf of 2022,2023, compensation and employee benefits were $357.2$254.6 million, an increase of $38.2$25.0 million or 12%11%, compared with $319.0$229.6 million for the same period in 2021.first half of 2022. These increases were primarily due to headcountstaffing growth and the year-over-year change in deferred loan costs.
Other operating expense was $28.1Deposit insurance premiums and regulatory assessments were $8.3 million for the thirdsecond quarter of 2022,2023, an increase of $7.1$3.3 million or 34%68%, compared with $21.0$4.9 million for the same period in 2021, primarily due to a reduction in foreclosure related gains and interest expense paid on cash collateral.2022. For the first nine monthshalf of 2022, other operating expense was $78.32023, deposit insurance premiums and regulatory assessments were $16.2 million, an increase of $19.8$6.5 million or 34%68%, compared with $58.5$9.6 million for the same period in 2021,2022. These increases were primarily due to increased charitable contributions,a two bps increase in the base deposit insurance assessment rate under the FDIC’s Amended Restoration Plan.
Deposit account expense was $10.6 million for the second quarter of 2023, an increase of $4.9 million or 86%, compared with $5.7 million for the same period in 2022. For the first half of 2023, deposit account expense was $20.2 million, an increase of $9.8 million or 95%, compared with $10.4 million for the same period in 2022. These increases were primarily due to an increase in deposit referral fees which were driven by higher interest rates.
Other operating expense was $35.3 million for the second quarter of 2023, an increase of $2.9 million or 9%, compared with $32.4 million for the same period in 2022. For the first half of 2023, other operating expense was $70.2 million, an increase of $14.4 million or 26%, compared with $55.8 million for the same period in 2022. These increases were primarily due to higher interest expense on cash collateral and corporate expenses, partially offset by a reduction in foreclosure expenses, miscellaneous operational losses and travel-related expenses.
Amortization of tax credit and other investments was $19.9$55.9 million for the thirdsecond quarter of 2022, a decrease2023, an increase of $18.1$40.9 million or 48%273%, compared with $38.0$15.0 million for the same period in 2021.2022. For the first nine monthshalf of 2022,2023, amortization of tax credit and other investments was $48.8$66.0 million, a decreasean increase of $41.9$37.1 million or 46%129%, compared with $90.7$28.9 million for the same period in 2021.2022. The year-over-year change reflectschanges were largely due to the mix of tax credits being recognized, which have differing amortization periods, as well as the impacttiming of investments that close in a given period.closed.
Income Taxes
| | | ($ in thousands) | | Three Months Ended September 30, | | Nine Months Ended September 30, | | |
| | Three Months Ended June 30, | | | Six Months Ended June 30, |
| ($ in thousands) | ($ in thousands) | | 2022 | | 2021 | | % Change | | 2022 | | 2021 | | % Change | | ($ in thousands) | | 2023 | | 2022 | | % Change | | | 2023 | | 2022 | | % Change |
| $ | 384,388 | | | $ | 273,431 | | | 41 | % | | $ | 1,023,330 | | | $ | 779,296 | | | 31 | % | | Income before income taxes | | $ | 357,588 | | | $ | 341,036 | | | 5 | % | | | $ | 778,980 | | | $ | 638,942 | | | 22 | % |
| Income tax expense | Income tax expense | | $ | 89,049 | | | $ | 47,982 | | | 86 | % | | $ | 232,010 | | | $ | 124,111 | | | 87 | % | | Income tax expense | | $ | 45,557 | | | $ | 82,707 | | | (45) | % | | | $ | 144,510 | | | $ | 142,961 | | | 1 | % |
| Effective tax rate | Effective tax rate | | 23.2 | % | | 17.5 | % | | 22.7 | % | | 15.9 | % | | | Effective tax rate | | 12.7 | % | | 24.3 | % | | | 18.6 | % | | 22.4 | % | |
|
ThirdSecond quarter 20222023 income tax expense was $89.0$45.6 million and the effective tax rate was 23.2%12.7%, compared with thirdsecond quarter 20212022 income tax expense of $48.0$82.7 million and an effective tax rate of 17.5%24.3%. For the first nine monthshalf of 2022,2023, income tax expense was $232.0$144.5 million and the effective tax rate was 22.7%18.6%, compared with income tax expense of $124.1$143.0 million and an effective tax rate of 15.9%22.4% for the same period in 2021.2022. The year-over-year increasesdecrease in the income tax expense andfor the second quarter 2023 compared with the year-ago period was primarily due to renewable energy tax credit investments that closed during the quarter. The increase in income tax expense for the first half of 2023 compared with the first half of 2022 was primarily due to a higher level of pretax income in the first half of 2023. The year-over-year decreases in the effective tax rate reflected a higher levelwere primarily due to the aforementioned tax credit investments that closed during the second quarter of income before income taxes and a decrease in tax credits recognized in 2022.2023.
Operating Segment Results
The Company organizes its operations into three reportable operating segments: (1) Consumer and Business Banking; (2) Commercial Banking; and (3) Other. These segments are defined by the type of customers served and the related products and services provided. The segments reflect how financial information is currently evaluated by management. For additionala description of the Company’s internal management reporting process, including the segment cost allocation methodology, see Note 1415 — Business Segments to the Consolidated Financial Statements in this Form 10-Q.
Segment net interest income represents the difference between actual interest earned on assets and interest incurred on liabilities of the segment, adjusted for funding charges or credits through the Company’s internal funds transfer pricing (“FTP”) process.
The following tables present the results by operating segment for the periods indicated:
| | | | | | | | | | | | | | | | | | | | | | | | | | | | | | | | | | | | Three Months Ended June 30, |
| | | Consumer and Business Banking | | Commercial Banking | | Other |
| ($ in thousands) | ($ in thousands) | | Three Months Ended September 30, | ($ in thousands) | | 2023 | | 2022 | | 2023 | | 2022 | | 2023 | | 2022 |
| Consumer and Business Banking | | Commercial
Banking | | Other | |
| 2022 | | 2021 | | 2022 | | 2021 | | 2022 | | 2021 | |
Total revenue (loss) (1) | Total revenue (loss) (1) | | $ | 357,230 | | | $ | 198,777 | | | $ | 271,637 | | | $ | 233,063 | | | $ | (1,506) | | | $ | 36,975 | | Total revenue (loss) (1) | | $ | 334,642 | | | $ | 312,757 | | | $ | 305,578 | | | $ | 278,996 | | | $ | 5,157 | | | $ | (40,357) | |
| Provision for (reversal of) credit losses | | 8,974 | | | 1,293 | | | 18,026 | | | (11,293) | | | — | | | — | | |
| Provision for credit losses | | Provision for credit losses | | 5,524 | | | 2,898 | | | 20,476 | | | 10,602 | | | — | | | — | |
| | Noninterest expense | Noninterest expense | | 104,005 | | | 90,575 | | | 81,386 | | | 66,731 | | | 30,582 | | | 48,078 | | Noninterest expense | | 107,027 | | | 94,295 | | | 88,333 | | | 81,023 | | | 66,429 | | | 21,542 | |
Segment income (loss) before income taxes (1) | Segment income (loss) before income taxes (1) | | 244,251 | | | 106,909 | | | 172,225 | | | 177,625 | | | (32,088) | | | (11,103) | | Segment income (loss) before income taxes (1) | | 222,091 | | | 215,564 | | | 196,769 | | | 187,371 | | | (61,272) | | | (61,899) | |
| Segment net income (loss) (1) | Segment net income (loss) (1) | | $ | 173,982 | | | $ | 76,577 | | | $ | 122,869 | | | $ | 126,984 | | | $ | (1,512) | | | $ | 21,888 | | Segment net income (loss) (1) | | $ | 156,853 | | | $ | 153,549 | | | $ | 139,030 | | | $ | 133,861 | | | $ | 16,148 | | | $ | (29,081) | |
|
| | | | | | | | | | | | | | | | | | | | | | | | | | | | | | | | | | | | | | | | | |
| | | |
| ($ in thousands) | | Nine Months Ended September 30, | | | |
| Consumer and Business Banking | | Commercial
Banking | | Other | | | |
| 2022 | | 2021 | | 2022 | | 2021 | | 2022 | | 2021 | | | |
Total revenue (loss) (1) | | $ | 908,400 | | | $ | 570,225 | | | $ | 807,787 | | | $ | 682,921 | | | $ | (42,074) | | | $ | 87,134 | | | | |
| Provision for (reversal of) credit losses | | 14,976 | | | (598) | | | 33,524 | | | (24,402) | | | — | | | — | | | | |
| | | | | | | | | | | | | | | |
| | | | | | | | | | | | | | | |
| | | | | | | | | | | | | | | |
| | | | | | | | | | | | | | | |
| | | | | | | | | | | | | | | |
| | | | | | | | | | | | | | | |
| | | | | | | | | | | | | | | |
| | | | | | | | | | | | | | | |
| | | | | | | | | | | | | | | |
| | | | | | | | | | | | | | | |
| | | | | | | | | | | | | | | |
| | | | | | | | | | | | | | | |
| | | | | | | | | | | | | | | |
| | | | | | | | | | | | | | | |
| | | | | | | | | | | | | | | |
| | | | | | | | | | | | | | | |
| | | | | | | | | | | | | | | |
| | | | | | | | | | | | | | | |
| | | | | | | | | | | | | | | |
| | | | | | | | | | | | | | | |
| | | | | | | | | | | | | | | |
| | | | | | | | | | | | | | | |
| | | | | | | | | | | | | | | |
| Noninterest expense | | 294,395 | | | 267,511 | | | 235,804 | | | 204,042 | | | 72,084 | | | 114,431 | | | | |
Segment income (loss) before income taxes (1) | | 599,029 | | | 303,312 | | | 538,459 | | | 503,281 | | | (114,158) | | | (27,297) | | | | |
| | | | | | | | | | | | | | | |
Segment net income (loss) (1) | | $ | 426,695 | | | $ | 217,257 | | | $ | 384,237 | | | $ | 360,275 | | | $ | (19,612) | | | $ | 77,653 | | | | |
| | | |
(1)During the fourth quarter of 2021, the Company enhanced its segment allocation methodology related to the fair values of interest rate and commodity derivative contracts, which are included in noninterest income. These fair values, which were previously allocated to the “Commercial Banking” segment prior to the fourth quarter of 2021, have since been reclassified between “Consumer and Business Banking” and “Commercial Banking.” Balances for the third quarter and nine months of 2021 have been reclassified to reflect these allocation changes for comparability. | | | | | | | | | | | | | | | | | | | | | | | | | | | | | | | | | | | | | | | | | |
| | | |
| ($ in thousands) | | Six Months Ended June 30, | | | |
| Consumer and Business Banking | | Commercial Banking | | Other | | | |
| 2023 | | 2022 | | 2023 | | 2022 | | 2023 | | 2022 | | | |
| Total revenue (loss) | | $ | 664,886 | | | $ | 551,170 | | | $ | 585,900 | | | $ | 536,150 | | | $ | 54,430 | | | $ | (40,568) | | | | |
| Provision for credit losses | | 20,536 | | | 6,002 | | | 25,464 | | | 15,498 | | | — | | | — | | | | |
| | | | | | | | | | | | | | | |
| | | | | | | | | | | | | | | |
| | | | | | | | | | | | | | | |
| | | | | | | | | | | | | | | |
| | | | | | | | | | | | | | | |
| | | | | | | | | | | | | | | |
| | | | | | | | | | | | | | | |
| | | | | | | | | | | | | | | |
| | | | | | | | | | | | | | | |
| | | | | | | | | | | | | | | |
| | | | | | | | | | | | | | | |
| | | | | | | | | | | | | | | |
| | | | | | | | | | | | | | | |
| | | | | | | | | | | | | | | |
| | | | | | | | | | | | | | | |
| | | | | | | | | | | | | | | |
| | | | | | | | | | | | | | | |
| | | | | | | | | | | | | | | |
| | | | | | | | | | | | | | | |
| | | | | | | | | | | | | | | |
| | | | | | | | | | | | | | | |
| | | | | | | | | | | | | | | |
| | | | | | | | | | | | | | | |
| Noninterest expense | | 220,850 | | | 190,390 | | | 175,581 | | | 154,418 | | | 83,805 | | | 41,502 | | | | |
| Segment income (loss) before income taxes | | 423,500 | | | 354,778 | | | 384,855 | | | 366,234 | | | (29,375) | | | (82,070) | | | | |
| | | | | | | | | | | | | | | |
| Segment net income (loss) | | $ | 299,100 | | | $ | 252,713 | | | $ | 273,487 | | | $ | 261,368 | | | $ | 61,883 | | | $ | (18,100) | | | | |
| | | |
Consumer and Business Banking
The Consumer and Business Banking segment primarily provides financial products and services to consumer and commercial customers through the Company’s domestic branch network.network and digital banking platform. This segment offers consumer and commercial deposits, mortgage and home equity loans, and other products and services. It also originates commercial loans for small- and medium-sized enterprises.enterprises through the Company’s branch network. Other products and services provided by this segment include wealth management, treasury management, interest rate risk hedging and foreign exchange services.
The following tables present additional financial information for the Consumer and Business Banking segment for the periods indicated:
| | | | | | | | | | | | | | | | | | | | | | | | | | |
|
| ($ in thousands) | | Three Months Ended September 30, |
| | | | | Change from 2021 |
| 2022 | | 2021 | | $ | | % |
| Net interest income before provision for credit losses | | $ | 326,411 | | | $ | 176,678 | | | $ | 149,733 | | | 85 | % |
Noninterest income (1) | | 30,819 | | | 22,099 | | | 8,720 | | | 39 | % |
Total revenue (1) | | 357,230 | | | 198,777 | | | 158,453 | | | 80 | % |
| Provision for credit losses | | 8,974 | | | 1,293 | | | 7,681 | | | 594 | % |
| Noninterest expense | | 104,005 | | | 90,575 | | | 13,430 | | | 15 | % |
Segment income before income taxes (1) | | 244,251 | | | 106,909 | | | 137,342 | | | 128 | % |
| Income tax expense | | 70,269 | | | 30,332 | | | 39,937 | | | 132 | % |
Segment net income (1) | | $ | 173,982 | | | $ | 76,577 | | | $ | 97,405 | | | 127 | % |
| Average loans | | $ | 16,405,433 | | | $ | 14,186,630 | | | $ | 2,218,803 | | | 16 | % |
| Average deposits | | $ | 33,271,717 | | | $ | 32,516,678 | | | $ | 755,039 | | | 2 | % |
|
| | | | | | | | | | | | | | | | | | | | | | | | | | |
|
| ($ in thousands) | | Nine Months Ended September 30, |
| | | | | Change from 2021 |
| 2022 | | 2021 | | $ | | % |
| Net interest income before provision for (reversal of) credit losses | | $ | 823,998 | | | $ | 500,352 | | | $ | 323,646 | | | 65 | % |
Noninterest income (1) | | 84,402 | | | 69,873 | | | 14,529 | | | 21 | % |
Total revenue (1) | | 908,400 | | | 570,225 | | | 338,175 | | | 59 | % |
| Provision for (reversal of) credit losses | | 14,976 | | | (598) | | | 15,574 | | | 2604 | % |
| Noninterest expense | | 294,395 | | | 267,511 | | | 26,884 | | | 10 | % |
Segment income before income taxes (1) | | 599,029 | | | 303,312 | | | 295,717 | | | 97 | % |
| Income tax expense | | 172,334 | | | 86,055 | | | 86,279 | | | 100 | % |
Segment net income (1) | | $ | 426,695 | | | $ | 217,257 | | | $ | 209,438 | | | 96 | % |
| Average loans | | $ | 15,448,874 | | | $ | 13,787,675 | | | $ | 1,661,199 | | | 12 | % |
| Average deposits | | $ | 33,272,271 | | | $ | 31,304,335 | | | $ | 1,967,936 | | | 6 | % |
|
| | | | | | | | | | | | | | | | | | | | | | | | | | |
|
| | Three Months Ended June 30, |
| | | | | | Change from 2022 |
| ($ in thousands) | | 2023 | | 2022 | | $ | | % |
| Net interest income before provision for credit losses | | $ | 307,522 | | | $ | 284,373 | | | $ | 23,149 | | | 8 | % |
| Noninterest income | | 27,120 | | | 28,384 | | | (1,264) | | | (4) | % |
| Total revenue | | 334,642 | | | 312,757 | | | 21,885 | | | 7 | % |
| Provision for credit losses | | 5,524 | | | 2,898 | | | 2,626 | | | 91 | % |
| Noninterest expense | | 107,027 | | | 94,295 | | | 12,732 | | | 14 | % |
| Segment income before income taxes | | 222,091 | | | 215,564 | | | 6,527 | | | 3 | % |
| Income tax expense | | 65,238 | | | 62,015 | | | 3,223 | | | 5 | % |
| Segment net income | | $ | 156,853 | | | $ | 153,549 | | | $ | 3,304 | | | 2 | % |
| Average loans | | $ | 17,622,260 | | | $ | 15,314,974 | | | $ | 2,307,286 | | | 15 | % |
| Average deposits | | $ | 33,265,827 | | | $ | 33,429,541 | | | $ | (163,714) | | | (0) % |
|
(1)During the fourth quarter of 2021, the Company enhanced its segment allocation methodology related to the fair values of interest rate and commodity derivative contracts, which are included in noninterest income. These fair values, which were previously allocated to the “Commercial Banking” segment prior to the fourth quarter of 2021, have since been reclassified between “Consumer and Business Banking” and “Commercial Banking.” Balances for the third quarter and nine months of 2021 have been reclassified to reflect these allocation changes for comparability. | | | | | | | | | | | | | | | | | | | | | | | | | | |
|
| ($ in thousands) | | Six Months Ended June 30, |
| | | | | Change from 2022 |
| 2023 | | 2022 | | $ | | % |
| Net interest income before provision for credit losses | | $ | 611,764 | | | $ | 497,587 | | | $ | 114,177 | | | 23 | % |
| Noninterest income | | 53,122 | | | 53,583 | | | (461) | | | (1) | % |
| Total revenue | | 664,886 | | | 551,170 | | | 113,716 | | | 21 | % |
| Provision for credit losses | | 20,536 | | | 6,002 | | | 14,534 | | | 242 | % |
| Noninterest expense | | 220,850 | | | 190,390 | | | 30,460 | | | 16 | % |
| Segment income before income taxes | | 423,500 | | | 354,778 | | | 68,722 | | | 19 | % |
| Income tax expense | | 124,400 | | | 102,065 | | | 22,335 | | | 22 | % |
| Segment net income | | $ | 299,100 | | | $ | 252,713 | | | $ | 46,387 | | | 18 | % |
| Average loans | | $ | 17,368,001 | | | $ | 14,962,667 | | | $ | 2,405,334 | | | 16 | % |
| Average deposits | | $ | 33,555,330 | | | $ | 33,272,553 | | | $ | 282,777 | | | 1 | % |
|
Consumer and Business Banking segment net income increased $97.4$3.3 million or 127%2% year-over-year to $174.0$156.9 million for the thirdsecond quarter of 2022,2023, and $209.4$46.4 million or 96%18% year-over-year to $426.7$299.1 million for the first nine monthshalf of 2022.2023. The increases in both periods reflected revenue growth,were primarily driven by an increase in net interest income, partially offset by higher noninterest expense, income tax, expense and noninterest expense.provision for credit losses. Net interest income before provision for credit losses increased $149.7$23.1 million or 85%8% year-over-year to $326.4$307.5 million for the thirdsecond quarter of 2022,2023, and $323.6$114.2 million or 65%23% year-over-year to $824.0$611.8 million for the first nine monthshalf of 2022.2023. The increases in both periods were primarily driven by higher deposit fund transfer pricingFTP credits due to noninterest-bearing deposit growth, and higher loan interest income, primarily from growththe year-over-year increase in residential mortgage loans. Noninterest expensemarket rates. Provision for credit losses increased $13.4$2.6 million or 15%91% year-over-year to $104.0$5.5 million for the thirdsecond quarter of 2022,2023, and $26.9$14.5 million or 10%242% year-over-year to $294.4$20.5 million for the first nine monthshalf of 2022.2023. These increases in both periods were primarily due to the current economic outlook as well as residential mortgage loan growth. Noninterest expense increased $12.7 million or 14% year-over-year to $107.0 million for the second quarter of 2023, and $30.5 million or 16% year-over-year to $220.9 million for the first half of 2023. The increases in both periods primarily reflected higher compensation and employee benefits expense.expense and allocated corporate overhead expenses.
Commercial Banking
The Commercial Banking segment primarily generates commercial loan and deposit products. Commercial loan products include CRE lending, construction finance, commercial business lending, working capital lines of credit, trade finance, letters of credit, commercial business lending, affordable housing lending, asset-based lending, asset-backed finance, project finance and equipment financing. Commercial deposit products and other financial services include treasury management, foreign exchange services, and interest rate and commodity risk hedging.
The following tables present additional financial information for the Commercial Banking segment for the periods indicated:
| | | | | | | | | | | | | | | | | | | | | | | | | | Three Months Ended June 30, |
| | | | Change from 2022 |
| ($ in thousands) | ($ in thousands) | | Three Months Ended September 30, | ($ in thousands) | | 2023 | | 2022 | | $ | | % |
| | Change from 2021 | |
| 2022 | | 2021 | | $ | | % | |
| Net interest income before provision for (reversal of) credit losses | | $ | 222,996 | | | $ | 189,791 | | | $ | 33,205 | | | 17 | % | |
| Net interest income before provision for credit losses | | Net interest income before provision for credit losses | | $ | 263,040 | | | $ | 230,964 | | | $ | 32,076 | | | 14 | % |
Noninterest income (1) | Noninterest income (1) | | 48,641 | | | 43,272 | | | 5,369 | | | 12 | % | Noninterest income (1) | | 42,538 | | | 48,032 | | | (5,494) | | | (11) | % |
Total revenue (1) | Total revenue (1) | | 271,637 | | | 233,063 | | | 38,574 | | | 17 | % | Total revenue (1) | | 305,578 | | | 278,996 | | | 26,582 | | | 10 | % |
| Provision for (reversal of) credit losses | | 18,026 | | | (11,293) | | | 29,319 | | | 260 | % | |
| Provision for credit losses | | Provision for credit losses | | 20,476 | | | 10,602 | | | 9,874 | | | 93 | % |
| Noninterest expense | Noninterest expense | | 81,386 | | | 66,731 | | | 14,655 | | | 22 | % | Noninterest expense | | 88,333 | | | 81,023 | | | 7,310 | | | 9 | % |
Segment income before income taxes (1) | Segment income before income taxes (1) | | 172,225 | | | 177,625 | | | (5,400) | | | (3) | % | Segment income before income taxes (1) | | 196,769 | | | 187,371 | | | 9,398 | | | 5 | % |
| Income tax expense | Income tax expense | | 49,356 | | | 50,641 | | | (1,285) | | | (3) | % | Income tax expense | | 57,739 | | | 53,510 | | | 4,229 | | | 8 | % |
Segment net income (1) | | $ | 122,869 | | | $ | 126,984 | | | $ | (4,115) | | | (3) | % | |
| Segment net income | | Segment net income | | $ | 139,030 | | | $ | 133,861 | | | $ | 5,169 | | | 4 | % |
| Average loans | Average loans | | $ | 30,449,108 | | | $ | 25,773,521 | | | $ | 4,675,587 | | | 18 | % | Average loans | | $ | 31,229,460 | | | $ | 29,311,514 | | | $ | 1,917,946 | | | 7 | % |
| Average deposits | Average deposits | | $ | 16,627,353 | | | $ | 18,275,884 | | | $ | (1,648,531) | | | (9) | % | Average deposits | | $ | 16,788,456 | | | $ | 17,539,067 | | | $ | (750,611) | | | (4) | % |
|
| | | | | | | | | | | | | | | | | | | | | | | | | | |
|
| ($ in thousands) | | Nine Months Ended September 30, |
| | | | | Change from 2021 |
| 2022 | | 2021 | | $ | | % |
| Net interest income before provision for (reversal of) credit losses | | $ | 662,037 | | | $ | 559,579 | | | $ | 102,458 | | | 18 | % |
Noninterest income (1) | | 145,750 | | | 123,342 | | | 22,408 | | | 18 | % |
Total revenue (1) | | 807,787 | | | 682,921 | | | 124,866 | | | 18 | % |
| Provision for (reversal of) credit losses | | 33,524 | | | (24,402) | | | 57,926 | | | 237 | % |
| Noninterest expense | | 235,804 | | | 204,042 | | | 31,762 | | | 16 | % |
Segment income before income taxes (1) | | 538,459 | | | 503,281 | | | 35,178 | | | 7 | % |
| Income tax expense | | 154,222 | | | 143,006 | | | 11,216 | | | 8 | % |
Segment net income (1) | | $ | 384,237 | | | $ | 360,275 | | | $ | 23,962 | | | 7 | % |
| Average loans | | $ | 29,099,646 | | | $ | 25,654,076 | | | $ | 3,445,570 | | | 13 | % |
| Average deposits | | $ | 17,296,919 | | | $ | 16,611,906 | | | $ | 685,013 | | | 4 | % |
|
(1)During the fourth quarter of 2021, the Company enhanced its segment allocation methodology related to the fair values of interest rate and commodity derivative contracts, which are included in noninterest income. These fair values, which were previously allocated to the “Commercial Banking” segment prior to the fourth quarter 2021, have since been reclassified between “Consumer and Business Banking” and “Commercial Banking.” Balances for the third quarter and nine months of 2021 have been reclassified to reflect these allocation changes for comparability. | | | | | | | | | | | | | | | | | | | | | | | | | | |
|
| ($ in thousands) | | Six Months Ended June 30, |
| | | | | Change from 2022 |
| 2023 | | 2022 | | $ | | % |
| Net interest income before provision for credit losses | | $ | 499,763 | | | $ | 439,041 | | | $ | 60,722 | | | 14 | % |
| Noninterest income | | 86,137 | | | 97,109 | | | (10,972) | | | (11) | % |
| Total revenue | | 585,900 | | | 536,150 | | | 49,750 | | | 9 | % |
| Provision for credit losses | | 25,464 | | | 15,498 | | | 9,966 | | | 64 | % |
| Noninterest expense | | 175,581 | | | 154,418 | | | 21,163 | | | 14 | % |
| Segment income before income taxes | | 384,855 | | | 366,234 | | | 18,621 | | | 5 | % |
| Income tax expense | | 111,368 | | | 104,866 | | | 6,502 | | | 6 | % |
| Segment net income | | $ | 273,487 | | | $ | 261,368 | | | $ | 12,119 | | | 5 | % |
| Average loans | | $ | 31,134,716 | | | $ | 28,413,731 | | | $ | 2,720,985 | | | 10 | % |
| Average deposits | | $ | 17,034,343 | | | $ | 17,637,251 | | | $ | (602,908) | | | (3) | % |
|
Commercial Banking segment net income decreased $4.1increased $5.2 million or 3%,4% year-over-year to $122.9$139.0 million for the thirdsecond quarter of 2022, due2023, and $12.1 million or 5% year-over-year to $273.5 million for the first half of 2023. The increases in provision for credit losses and noninterest expense, partially offset by revenue growth. For the first nine months of 2022, this segment’sboth periods reflected a growth in net interest income, increased $24.0 million or 7% year-over-year to $384.2 million. This increase reflected revenue growth, partially offset by higher provision for credit losses and noninterest expense.expense and lower noninterest income. Net interest income before provision for credit losses increased $33.2$32.1 million or 17%14% year-over-year to $223.0$263.0 million for the thirdsecond quarter of 2022,2023, and $102.5$60.7 million or 18%14% year-over-year to $662.0$499.8 million for the first nine monthshalf of 2022.2023. The increases in both periods were primarily due to higher loan interest income from commercial loan growth.growth and higher deposit FTP credits due to the year-over-year increase in market rates. Noninterest income decreased $5.5 million or 11% year-over-year to $42.5 million for the second quarter of 2023, mainly due to a decrease in foreign exchange income. Noninterest income decreased $11.0 million or 11% year-over-year to $86.1 million for the first half of 2023, mainly due to a decrease in interest rate contracts and other derivative income. Provision for credit losses increased $29.3$9.9 million or 260%93% year-over-year to $18.0$20.5 million for the thirdsecond quarter of 2022,2023, and $57.9$10.0 million or 237%64% year-over-year to $33.5$25.5 million for the first nine monthshalf of 2022,2023, primarily driven by the current macroeconomiceconomic outlook andas well as commercial loan growth. Noninterest expense increased $14.7$7.3 million or 22%9% year-over-year to $81.4$88.3 million for the thirdsecond quarter of 2022,2023, and $21.2 million or 14% year-over-year to $175.6 million for the first half of 2023, primarily due to higher compensation and employee benefits, deposit account expense and higherallocated corporate overhead allocations. For the first nine months of 2022, this segment’s noninterest expense increased $31.8 million or 16% year-over-year to $235.8 million, driven by increases in compensation and employee benefits, corporate overhead allocations and other operating expenses.
Other
Centralized functions, including the corporate treasury activities of the Company and eliminations of inter-segment amounts, have been aggregated and included in the Other segment, which provides broad administrative support to the two core segments, namely the Consumer and Business Banking and the Commercial Banking segments.
The following tables present additional financial information for the Other segment for the periods indicated:
| | | | | | | | | | | | | | | | | | | | | | | | | | Three Months Ended June 30, |
| | | | Change from 2022 |
| ($ in thousands) | ($ in thousands) | | Three Months Ended September 30, | ($ in thousands) | | 2023 | | 2022 | | $ | | % |
| | Change from 2021 | |
| 2022 | | 2021 | | $ | | % | |
| Net interest income before provision for credit losses | | $ | 2,402 | | | $ | 29,237 | | | $ | (26,835) | | | (92) | % | |
| Noninterest (loss) income | | (3,908) | | | 7,738 | | | (11,646) | | | (151) | % | |
| Total (loss) revenue | | (1,506) | | | 36,975 | | | (38,481) | | | (104) | % | |
| Net interest loss before provision for credit losses | | Net interest loss before provision for credit losses | | $ | (3,816) | | | $ | (42,385) | | | $ | 38,569 | | | 91 | % |
| Noninterest income | | Noninterest income | | 8,973 | | | 2,028 | | | 6,945 | | | 342 | % |
| Total revenue (loss) | | Total revenue (loss) | | 5,157 | | | (40,357) | | | 45,514 | | | 113 | % |
| | Noninterest expense | Noninterest expense | | 30,582 | | | 48,078 | | | (17,496) | | | (36) | % | Noninterest expense | | 66,429 | | | 21,542 | | | 44,887 | | | 208 | % |
| Segment loss before income taxes | Segment loss before income taxes | | (32,088) | | | (11,103) | | | (20,985) | | | 189 | % | Segment loss before income taxes | | (61,272) | | | (61,899) | | | 627 | | | 1 | % |
| Income tax benefit | Income tax benefit | | (30,576) | | | (32,991) | | | 2,415 | | | (7) | % | Income tax benefit | | (77,420) | | | (32,818) | | | (44,602) | | | 136 | % |
| Segment net (loss) income | | $ | (1,512) | | | $ | 21,888 | | | $ | (23,400) | | | (107) | % | |
| Segment net income (loss) | | Segment net income (loss) | | $ | 16,148 | | | $ | (29,081) | | | $ | 45,229 | | | 156 | % |
| | Average deposits | Average deposits | | $ | 4,152,463 | | | $ | 2,704,070 | | | $ | 1,448,393 | | | 54 | % | Average deposits | | $ | 4,230,592 | | | $ | 3,161,242 | | | $ | 1,069,350 | | | 34 | % |
|
| | | ($ in thousands) | ($ in thousands) | | Nine Months Ended September 30, | ($ in thousands) | | Six Months Ended June 30, |
| | Change from 2021 | | | Change from 2022 |
| 2022 | | 2021 | | $ | | % | | 2023 | | 2022 | | $ | | % |
| Net interest (loss) income before provision for credit losses | | $ | (45,661) | | | $ | 65,943 | | | $ | (111,604) | | | (169) | % | |
| Noninterest income | | 3,587 | | | 21,191 | | | (17,604) | | | (83) | % | |
| Total (loss) revenue | | (42,074) | | | 87,134 | | | (129,208) | | | (148) | % | |
| Net interest income (loss) before provision for credit losses | | Net interest income (loss) before provision for credit losses | | $ | 55,080 | | | $ | (48,063) | | | $ | 103,143 | | | 215 | % |
| Noninterest (loss) income | | Noninterest (loss) income | | (650) | | | 7,495 | | | (8,145) | | | (109) | % |
| Total revenue (loss) | | Total revenue (loss) | | 54,430 | | | (40,568) | | | 94,998 | | | 234 | % |
| | Noninterest expense | Noninterest expense | | 72,084 | | | 114,431 | | | (42,347) | | | (37) | % | Noninterest expense | | 83,805 | | | 41,502 | | | 42,303 | | | 102 | % |
| Segment loss before income taxes | Segment loss before income taxes | | (114,158) | | | (27,297) | | | (86,861) | | | 318 | % | Segment loss before income taxes | | (29,375) | | | (82,070) | | | 52,695 | | | 64 | % |
| Income tax benefit | Income tax benefit | | (94,546) | | | (104,950) | | | 10,404 | | | (10) | % | Income tax benefit | | (91,258) | | | (63,970) | | | (27,288) | | | 43 | % |
| Segment net (loss) income | | $ | (19,612) | | | $ | 77,653 | | | $ | (97,265) | | | (125) | % | |
| Segment net income (loss) | | Segment net income (loss) | | $ | 61,883 | | | $ | (18,100) | | | $ | 79,983 | | | 442 | % |
| | Average deposits | Average deposits | | $ | 3,499,816 | | | $ | 2,612,897 | | | $ | 886,919 | | | 34 | % | Average deposits | | $ | 4,027,869 | | | $ | 3,168,083 | | | $ | 859,786 | | | 27 | % |
|
The Other segment reported segment loss before income taxes of $32.1$61.3 million and segment net lossincome of $1.5$16.1 million, for the third quarter of 2022, reflecting an income tax benefit of $30.6 million.$77.4 million, for the second quarter of 2023. The decrease in segment loss before income taxes was primarily due to lower net interest loss and higher noninterest income, partially offset by higher noninterest expense. For the first nine monthshalf of 2022,2023, the Other segment reported segment loss before income taxes of $114.2$29.4 million and segment net lossincome of $19.6$61.9 million, reflecting an income tax benefit of $94.5$91.3 million. The increasesdecrease in segment lossesloss before income taxes for both periods werewas primarily driven by lower revenue,higher net interest income, partially offset by decreasesan increase in noninterest expense. The $26.8$38.6 million decrease in net interest loss before provision for credit losses for the second quarter of 2023 and $111.6$103.1 million decreasesincrease in net interest income before provision for credit losses for the third quarter and first nine monthshalf of 2022, respectively, compared to the same prior year periods,2023 were primarily driven by lower FTP spread income absorbed by the Other segment, partially offset by an increase in interest income from investments due to a higher yield on interest-bearing cash and deposits with banks and debt securities for the third quarter of 2022, and a higher volume of debt securities for the first nine months of 2022.securities. Noninterest expense decreased $17.5 million year-over-year to $30.6income increased $6.9 million for the thirdsecond quarter of 2022,2023, mainly due to an increase in foreign exchange income, and $42.3 million year-over-year to $72.1decreased $8.1 million for the first nine monthshalf of 2022,2023, primarily due to lowera write-off of an impaired subordinated debt security in the first quarter of 2023. Noninterest expense increased $44.9 million for the second quarter of 2023, and $42.3 million for the first half of 2023, primarily due to higher amortization of tax credits and other investments.investments as a result of tax credit investments closed in the second quarter of 2023. This also contributed to higher income tax benefit in both the second quarter and first half of 2023.
The income tax expense or benefit in the Other segment consists of the remaining unallocated income tax expense or benefit after allocating income tax expense to the two core segments.segments, and reflects the impact of tax credit investment activity. Income tax expense is allocated to the Consumer and Business Banking and the Commercial Banking segments by applying statutory income tax rates to the segment income before income taxes.
Balance Sheet Analysis
Debt Securities
The Company maintains a portfolio of high quality and liquid debt securities with a moderate duration profile. It closely manages the overall portfolio credit, interest rate and liquidity risks. The Company’s debt securities provide:
•interest income for earnings and yield enhancement;
•funding availability for funding needs arising during the normal course of business;
•the ability to execute interest rate risk management strategies in response to changes in economic or market conditions; and
•collateral to support pledging agreements as required and/or to enhance the Company’s borrowing capacity.
While the Company intendsdoes not intend to holdsell its debt securities, indefinitely, it may sell AFS securities in response to changes in the balance sheet and related interest rate risk to meet liquidity, regulatory and strategic requirements.
The following table presents the distribution of the Company’s AFS and HTM debt securities portfolio as of SeptemberJune 30, 20222023 and December 31, 2021,2022, and by credit ratings as of SeptemberJune 30, 2022:2023:
| | | ($ in thousands) | | September 30, 2022 | | December 31, 2021 | | | Ratings as of September 30, 2022 (1) | | |
| | June 30, 2023 | | December 31, 2022 | | | Ratings as of June 30, 2023 (1) | |
| ($ in thousands) | ($ in thousands) | | Amortized
Cost | | Fair
Value | | | % of Fair Value | | Amortized
Cost | | Fair
Value | | | % of Fair Value | | | AAA/AA | | A | | BBB | | BB and Lower | | No Rating (2) | | ($ in thousands) | | Amortized Cost | | Fair Value | | | % of Fair Value | | Amortized Cost | | Fair Value | | | % of Fair Value | | | AAA/AA | | A | | BBB | | BB and Lower | | No Rating (2) | |
| | | | | | | | | | | | | | | | | | | | | | | | | | AFS debt securities: | | | | | | | | | | | | | | | | | | | | | | | | | | |
| U.S. Treasury securities | U.S. Treasury securities | | $ | 676,312 | | | $ | 600,677 | | | | 10 | % | | $ | 1,049,238 | | | $ | 1,032,681 | | | | 10 | % | | | 100 | % | | — | % | | — | % | | — | % | | — | % | | U.S. Treasury securities | | $ | 779,973 | | | $ | 711,706 | | | | 12 | % | | $ | 676,306 | | | $ | 606,203 | | | | 10 | % | | | 100 | % | | — | % | | — | % | | — | % | | — | % | |
| U.S. government agency and U.S. government-sponsored enterprise debt securities | U.S. government agency and U.S. government-sponsored enterprise debt securities | | 319,070 | | | 260,424 | | | | 5 | % | | 1,333,984 | | | 1,301,971 | | | | 13 | % | | | 100 | % | | — | % | | — | % | | — | % | | — | % | | U.S. government agency and U.S. government-sponsored enterprise debt securities | | 514,594 | | | 460,084 | | | | 8 | % | | 517,806 | | | 461,607 | | | | 8 | % | | | 100 | % | | — | % | | — | % | | — | % | | — | % | |
| U.S. government agency and U.S. government-sponsored enterprise mortgage-backed securities | U.S. government agency and U.S. government-sponsored enterprise mortgage-backed securities | | 2,639,133 | | | 2,315,314 | | | | 39 | % | | 4,210,832 | | | 4,157,263 | | | | 42 | % | | | 100 | % | | — | % | | — | % | | — | % | | — | % | | U.S. government agency and U.S. government-sponsored enterprise mortgage-backed securities | | 2,519,765 | | | 2,200,014 | | | | 37 | % | | 2,588,446 | | | 2,262,464 | | | | 37 | % | | | 100 | % | | — | % | | — | % | | — | % | | — | % | |
| Municipal securities | Municipal securities | | 307,084 | | | 249,502 | | | | 4 | % | | 519,381 | | | 523,158 | | | | 5 | % | | | 91 | % | | 5 | % | | — | % | | — | % | | 4 | % | | Municipal securities | | 304,204 | | | 263,873 | | | | 4 | % | | 303,884 | | | 257,099 | | | | 4 | % | | | 97 | % | | — | % | | — | % | | — | % | | 3 | % | |
| Non-agency mortgage-backed securities | Non-agency mortgage-backed securities | | 1,233,490 | | | 1,069,513 | | | | 18 | % | | 1,388,857 | | | 1,378,374 | | | | 14 | % | | | 82 | % | | — | % | | — | % | | — | % | | 18 | % | | Non-agency mortgage-backed securities | | 1,148,557 | | | 992,625 | | | | 17 | % | | 1,209,714 | | | 1,047,553 | | | | 17 | % | | | 81 | % | | — | % | | — | % | | — | % | | 19 | % | |
| Corporate debt securities | Corporate debt securities | | 673,502 | | | 529,565 | | | | 9 | % | | 657,516 | | | 649,665 | | | | 6 | % | | | — | % | | 31 | % | | 67 | % | | 2 | % | | — | % | | Corporate debt securities | | 653,502 | | | 485,750 | | | | 7 | % | | 673,502 | | | 526,274 | | | | 9 | % | | | — | % | | 32 | % | | 65 | % | | 3 | % | | — | % | |
| Foreign government bonds | Foreign government bonds | | 238,720 | | | 225,810 | | | | 4 | % | | 260,447 | | | 257,733 | | | | 3 | % | | | 47 | % | | 53 | % | | — | % | | — | % | | — | % | | Foreign government bonds | | 236,392 | | | 224,766 | | | | 4 | % | | 241,165 | | | 227,053 | | | | 4 | % | | | 48 | % | | 52 | % | | — | % | | — | % | | — | % | |
| Asset-backed securities | Asset-backed securities | | 66,793 | | | 64,870 | | | | 1 | % | | 74,674 | | | 74,558 | | | | 1 | % | | | 100 | % | | — | % | | — | % | | — | % | | — | % | | Asset-backed securities | | 46,332 | | | 44,875 | | | | 1 | % | | 51,152 | | | 49,076 | | | | 1 | % | | | 100 | % | | — | % | | — | % | | — | % | | — | % | |
| Collateralized loan obligations (“CLOs”) | | 617,250 | | | 590,415 | | | | 10 | % | | 592,250 | | | 589,950 | | | | 6 | % | | | 96 | % | | 4 | % | | — | % | | — | % | | — | % | | |
| Collateralized loan obligations | | Collateralized loan obligations | | 617,250 | | | 603,565 | | | | 10 | % | | 617,250 | | | 597,664 | | | | 10 | % | | | 96 | % | | 4 | % | | — | % | | — | % | | — | % | |
| Total AFS debt securities | Total AFS debt securities | | $ | 6,771,354 | | | $ | 5,906,090 | | | | 100 | % | | $ | 10,087,179 | | | $ | 9,965,353 | | | | 100 | % | | | 85 | % | | 5 | % | | 6 | % | | 0 | % | | 4 | % | | Total AFS debt securities | | $ | 6,820,569 | | | $ | 5,987,258 | | | | 100 | % | | $ | 6,879,225 | | | $ | 6,034,993 | | | | 100 | % | | | 86 | % | | 5 | % | | 5 | % | | — | % | | 4 | % | |
| | HTM debt securities: | HTM debt securities: | | | | | | | | | | | | | | | | | | | | | | | | | | | HTM debt securities: | | | | | | | | | | | | | | | | | |
| U.S. Treasury securities | U.S. Treasury securities | | $ | 522,713 | | | $ | 466,085 | | | | 19 | % | | $ | — | | | $ | — | | | | — | % | | | 100 | % | | — | % | | — | % | | — | % | | — | % | | U.S. Treasury securities | | $ | 526,794 | | | $ | 474,137 | | | | 19 | % | | $ | 524,081 | | | $ | 471,469 | | | | 19 | % | | | 100 | % | | — | % | | — | % | | — | % | | — | % | |
| U.S. government agency and U.S. government-sponsored enterprise debt securities | U.S. government agency and U.S. government-sponsored enterprise debt securities | | 998,233 | | | 782,617 | | | | 32 | % | | — | | | — | | | | — | % | | | 100 | % | | — | % | | — | % | | — | % | | — | % | | U.S. government agency and U.S. government-sponsored enterprise debt securities | | 1,000,415 | | | 797,871 | | | | 33 | % | | 998,972 | | | 789,412 | | | | 32 | % | | | 100 | % | | — | % | | — | % | | — | % | | — | % | |
| U.S. government agency and U.S. government-sponsored enterprise mortgage-backed securities | U.S. government agency and U.S. government-sponsored enterprise mortgage-backed securities | | 1,301,824 | | | 1,066,339 | | | | 43 | % | | — | | | — | | | | — | % | | | 100 | % | | — | % | | — | % | | — | % | | — | % | | U.S. government agency and U.S. government-sponsored enterprise mortgage-backed securities | | 1,259,425 | | | 1,019,026 | | | | 42 | % | | 1,289,106 | | | 1,042,310 | | | | 43 | % | | | 100 | % | | — | % | | — | % | | — | % | | — | % | |
| Municipal securities | Municipal securities | | 189,897 | | | 144,094 | | | | 6 | % | | — | | | — | | | | — | % | | | 100 | % | | — | % | | — | % | | — | % | | — | % | | Municipal securities | | 189,299 | | | 149,450 | | | | 6 | % | | 189,709 | | | 151,980 | | | | 6 | % | | | 100 | % | | — | % | | — | % | | — | % | | — | % | |
| Total HTM debt securities | Total HTM debt securities | | $ | 3,012,667 | | | $ | 2,459,135 | | | | 100 | % | | $ | — | | | $ | — | | | | — | % | | | 100 | % | | — | % | | — | % | | — | % | | — | % | | Total HTM debt securities | | $ | 2,975,933 | | | $ | 2,440,484 | | | | 100 | % | | $ | 3,001,868 | | | $ | 2,455,171 | | | | 100 | % | | | 100 | % | | — | % | | — | % | | — | % | | — | % | |
| Total debt securities | Total debt securities | | $ | 9,784,021 | | | $ | 8,365,225 | | | | | | $ | 10,087,179 | | | $ | 9,965,353 | | | | | | | | | | | | | | | | | Total debt securities | | $ | 9,796,502 | | | $ | 8,427,742 | | | | | | $ | 9,881,093 | | | $ | 8,490,164 | | | | | | | |
|
(1)Credit ratings express opinions about the credit quality of a debt security. The Company determines the credit rating of a security according to the lowest credit rating made available by nationally recognized statistical rating organizations (“NRSROs”). Debt securities rated investment grade, which are those with ratings similar to BBB- or above (as defined by NRSROs), are generally considered by the rating agencies and market participants to be low credit risk. Ratings percentages are allocated based on fair value.
(2)For debt securities not rated by NRSROs, the Company uses other factors which include but are not limited to the priority in collections within the securitization structure, and whether the contractual payments have historically been on time.
TheAs of June 30, 2023, the Company’s AFS and HTM debt securities portfolios had an effective duration defined(defined as the sensitivity of the value of the portfolio to interest rate changes,changes) of 5.3 as of September 30, 2022. This increased from 5.03.9 and 7.7, respectively, compared with 4.1 and 8.0, respectively, as of December 31, 2021, primarily2022. The modest decreases in both the AFS and HTM effective durations were due to both the upshifting and steepeningreduction in variation of optionality under the yield curve.current interest rate environment.
Available-for-Sale Debt Securities
The fair value of the AFS debt securities portfolio totaled $5.91$5.99 billion as of SeptemberJune 30, 2022,2023, a decrease of $4.06 billion$47.7 million or 41%1% from $9.97$6.03 billion as of December 31, 2021.2022. The decrease was primarily due to the Company’s transfermaturities and paydowns, partially offset by purchases of $3.01 billion of AFS securities to HTM securities during the first quarter of 2022 and a decline in the portfolio valuation within the rising interest rate environment. For further discussion regarding the transfer, refer to the Held-to-Maturity Debt Securities section below.U.S. Treasury securities. The Company’s AFS debt securities are carried at fair value with noncredit-related unrealized gains and losses, net of tax, reported in Other comprehensive income (loss) income on the Consolidated Statement of Comprehensive Income. Pre-tax net unrealized losses on AFS debt securities were $865.3$833.3 million as of SeptemberJune 30, 2022,2023, compared with $121.8$844.2 million as of December 31, 2021.2022.
As of SeptemberJune 30, 2023 and December 31, 2022, 96% and 97%, respectively, of the carrying value of the AFS debt securities portfolio was rated investment grade by NRSROs, compared with 98% as of December 31, 2021.NRSROs. Of the AFS debt securities with gross unrealized losses, substantially all were rated investment grade as of Septemberboth June 30, 20222023 and December 31, 2021.2022. There was no allowance for credit losses as of September 30, 2022 and December 31, 2021, provided against the AFS debt securities.securities as of each of June 30, 2023 and December 31, 2022. Additionally, there were no credit losses recognized in earnings for both the thirdsecond quarters and first nine monthshalves of 20222023 and 2021. For additional discussion on the allowance for credit losses, see Note 5 — Securities — Allowance for Credit Losses on Available-for-Sale Debt Securities to the Consolidated Financial Statements in this Form 10-Q.2022.
Held-to-Maturity Debt Securities
During the first quarter of 2022, the Company transferred $3.01 billion in aggregate fair value of U.S. Treasury, government agency and government-sponsored enterprise debt and mortgage-back securities, and municipal securities from AFS to HTM. In comparison, there were no HTM debt securities as of December 31, 2021. The Company’s HTM debt securities are carried at amortized cost. The unrealized gains or losses at the date of transfer of these securities continue to be reported in Accumulated other comprehensive income (loss) (“AOCI”), net of tax on the Consolidated Balance Sheet and are amortized over the remaining life of the securities.
All HTM debt securities were issued, guaranteed, or supported by the U.S. government or government-sponsored enterprises. Accordingly, the Company applied a zero credit loss assumption for these securities and no allowance for credit loss was recorded as of Septemberboth June 30, 2023 and December 31, 2022. For additional discussion on the allowance for credit losses, see Note 5 — Securities — Allowance for Credit Losses on Held-to-Maturity Debt Securities to the Consolidated Financial Statements in this Form 10-Q.
For additional information on AFS and HTM securities, see Note 1 — Summary of Significant Accounting Policies to the Consolidated Financial Statements in the Company’s 20212022 Form 10-K andNote 2— Current Accounting Developments and Summary of Significant Accounting Policies, Note 3 — Fair Value Measurement and Fair Value of Financial Instruments and Note 5 — Securities to the Consolidated Financial Statements in this Form 10-Q.
Loan Portfolio
The Company offers a broad range of financial products designed to meet the credit needs of its borrowers. The Company’s loan portfolio segments include commercial loans, which consist of commercial and industrial (“C&I,&I”), CRE, multifamily residential, and construction and land loans, andas well as consumer loans, which consist of single-family residential, home equity lines of credit (“HELOCs”), and other consumer loans. Total net loans were $46.87Loans held-for-investment totaled $49.83 billion as of SeptemberJune 30, 2022,2023, an increase of $5.72$1.63 billion or 14%3% from $41.15$48.20 billion as of December 31, 2021.2022. This increasegrowth was primarily driven by well-diversified growth throughout our major loan categories including increases of $2.53 billion$849.3 million or 16%4% in total CRE loans $1.80 billionand $825.9 million or 16%6% in total residential mortgage loans, and $1.47 billion or 10% in C&I loans. The composition of the loan portfolio as of SeptemberJune 30, 20222023 was similar to the composition as of December 31, 2021.2022.
The following table presents the composition of the Company’s total loan portfolio by loan type as of SeptemberJune 30, 20222023 and December 31, 2021:2022:
| | | ($ in thousands) | | September 30, 2022 | | December 31, 2021 | | |
| | June 30, 2023 | | December 31, 2022 | |
| ($ in thousands) | ($ in thousands) | | Amount | | % | | Amount | | % | | ($ in thousands) | | Amount | | % | | Amount | | % | |
| | | | | | | | | Commercial: | | | | | | | | | |
C&I (1) | C&I (1) | | $ | 15,625,072 | | | 33 | % | | $ | 14,150,608 | | | 34 | % | | C&I (1) | | $ | 15,670,084 | | | 31 | % | | $ | 15,711,095 | | | 33 | % | |
| CRE: | CRE: | | | CRE: | | |
| CRE | CRE | | 13,573,157 | | | 28 | % | | 12,155,047 | | | 29 | % | | CRE | | 14,373,385 | | | 29 | % | | 13,857,870 | | | 29 | % | |
| Multifamily residential | Multifamily residential | | 4,559,302 | | | 10 | % | | 3,675,605 | | | 9 | % | | Multifamily residential | | 4,764,180 | | | 9 | % | | 4,573,068 | | | 9 | % | |
| Construction and land | Construction and land | | 556,894 | | | 1 | % | | 346,486 | | | 1 | % | | Construction and land | | 781,068 | | | 2 | % | | 638,420 | | | 1 | % | |
| Total CRE | Total CRE | | 18,689,353 | | | 39 | % | | 16,177,138 | | | 39 | % | | Total CRE | | 19,918,633 | | | 40 | % | | 19,069,358 | | | 39 | % | |
| Total commercial | Total commercial | | 34,314,425 | | | 72 | % | | 30,327,746 | | | 73 | % | | Total commercial | | 35,588,717 | | | 71 | % | | 34,780,453 | | | 72 | % | |
| Consumer: | Consumer: | | | | | | | | | | Consumer: | | | | | | | | | |
| Residential mortgage: | Residential mortgage: | | | Residential mortgage: | | |
| Single-family residential | Single-family residential | | 10,855,345 | | | 23 | % | | 9,093,702 | | | 22 | % | | Single-family residential | | 12,308,613 | | | 25 | % | | 11,223,027 | | | 23 | % | |
| HELOCs | HELOCs | | 2,184,924 | | | 5 | % | | 2,144,821 | | | 5 | % | | HELOCs | | 1,862,928 | | | 4 | % | | 2,122,655 | | | 5 | % | |
| Total residential mortgage | Total residential mortgage | | 13,040,269 | | | 28 | % | | 11,238,523 | | | 27 | % | | Total residential mortgage | | 14,171,541 | | | 29 | % | | 13,345,682 | | | 28 | % | |
| Other consumer | Other consumer | | 87,561 | | | 0 | % | | 127,512 | | | 0 | % | | Other consumer | | 68,106 | | | 0 | % | | 76,295 | | | 0 | % | |
| Total consumer | Total consumer | | 13,127,830 | | | 28 | % | | 11,366,035 | | | 27 | % | | Total consumer | | 14,239,647 | | | 29 | % | | 13,421,977 | | | 28 | % | |
Total loans held-for-investment (2)(1) | Total loans held-for-investment (2)(1) | | 47,442,255 | | | 100 | % | | 41,693,781 | | | 100 | % | | Total loans held-for-investment (2)(1) | | 49,828,364 | | | 100 | % | | 48,202,430 | | | 100 | % | |
| Allowance for loan losses | Allowance for loan losses | | (582,517) | | | | | (541,579) | | | | | Allowance for loan losses | | (635,400) | | | | | (595,645) | | | | |
Loans held-for-sale (3)(2) | Loans held-for-sale (3)(2) | | 14,500 | | | 635 | | | | Loans held-for-sale (3)(2) | | 2,830 | | | 25,644 | | | |
| Total loans, net | Total loans, net | | $ | 46,874,238 | | | $ | 41,152,837 | | | | Total loans, net | | $ | 49,195,794 | | | $ | 47,632,429 | | | |
|
(1)Includes $110.9$74.0 million and $534.2$70.4 million comprising unamortized deferred and unearned fees, net of Paycheck Protection Program (“PPP”) loanspremiums as of SeptemberJune 30, 20222023 and December 31, 2021,2022, respectively.
(2)Includes $(60.3) million and $(50.7) millionConsists of net deferred loan fees and net unamortized premiumsC&I loans as of Septemberboth June 30, 20222023 and December 31, 2021, respectively.
(3)Consists of a multi-family residential loan as of September 30, 2022 and single-family residential loans as of December 31, 2021.2022.
Commercial
The commercial loan portfolio comprised 72% and 73%71% of total loans as of SeptemberJune 30, 2022 and2023, compared with 72% as of December 31, 2021, respectively.2022. The Company actively monitors the commercial lending portfolio for elevated levels of credit risk and reviews credit exposures for sensitivity to changing economic conditions.
Commercial — Commercial and Industrial Loans. Total C&I loan commitments (loans outstanding plus unfunded credit commitments, excluding issued letters of credit) were $22.21$23.91 billion as of SeptemberJune 30, 2022,2023, an increase of $1.92$1.13 billion or 9%5% from $20.29$22.78 billion as of December 31, 2021.2022. Total C&I loans were $15.63$15.67 billion as of SeptemberJune 30, 2023, a decrease of $41.0 million or 0.3% from $15.71 billion as of December 31, 2022, an increasewith a utilization rate of $1.47 billion or 10% from $14.15 billion.66% as of June 30, 2023, compared with 69% as of December 31, 2022. Total C&I loans made up 33%31% and 34%33% of total loans held-for-investment as of SeptemberJune 30, 20222023 and December 31, 2021,2022, respectively. The C&I loan portfolio includes loans and financing for businesses inacross a wide spectrum of industries, comprisedindustries. The Company offers a variety of C&I products, including commercial business lending, working capital lines of credit, trade finance, letters of credit, affordable housing lending, asset-based lending, asset-backed finance, project finance and equipment financing. The C&I loan portfolio also includes PPP loans. Additionally, the Company has a portfolio of broadly syndicated C&I loans, which represent revolving or term loan facilities that are marketed and sold primarily to institutional investors. This portfolio totaled $948.2$788.6 million and $939.4$855.9 million as of SeptemberJune 30, 20222023 and December 31, 2021,2022, respectively. The majority of the C&I loans had variable interest rates as of both SeptemberJune 30, 20222023 and December 31, 2021.2022.
The C&I portfolio is well-diversified by industry. The Company monitors concentrations within the C&I loan portfolio by industry and customer exposure, and industry classification, setting diversification targets andhas exposure limits by industry orand loan product. The following charts illustratetable presents the industry mix within ourthe Company’s C&I loan portfolio as of SeptemberJune 30, 20222023 and December 31, 2021.2022.
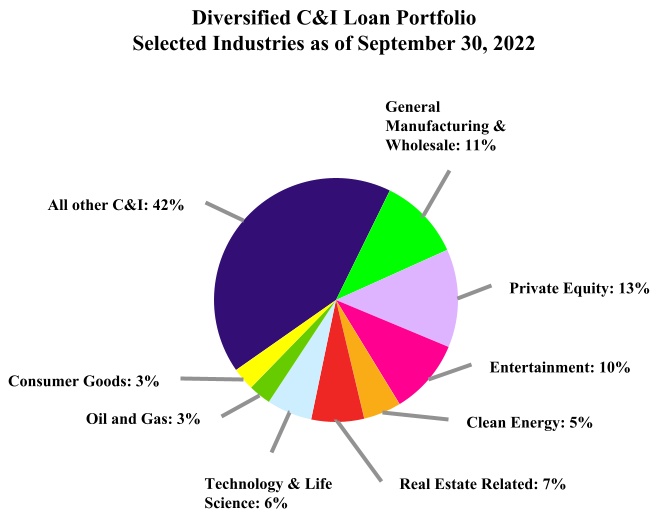
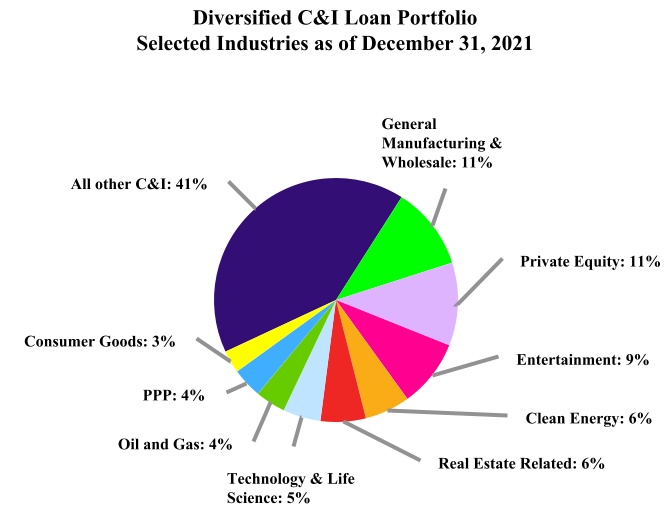
| | | | | | | | | | | | | | | | | | | | | | | | | | | | | | | | |
| | | | | | | | | | |
| | June 30, 2023 | | | | December 31, 2022 |
| ($ in thousands) | | Amount | | % | | ($ in thousands) | | Amount | | % |
| Industry: | | | | | | Industry: | | | | |
| Private equity | | $ | 2,450,919 | | | 16 | % | | Private equity | | $ | 2,238,723 | | | 14 | % |
| Media & entertainment | | 1,848,479 | | | 12 | % | | Media & entertainment | | 1,841,719 | | | 12 | % |
| Real estate investment & management | | 1,331,558 | | | 8 | % | | Real estate investment & management | | 1,272,169 | | | 8 | % |
| General manufacturing & wholesale | | 993,604 | | | 6 | % | | General manufacturing & wholesale | | 1,091,933 | | | 7 | % |
| Infrastructure & clean energy | | 873,828 | | | 6 | % | | Infrastructure & clean energy | | 820,095 | | | 5 | % |
| Tech & telecom | | 614,839 | | | 4 | % | | Food production & distribution | | 738,636 | | | 5 | % |
| Hospitality & leisure | | 594,313 | | | 4 | % | | Tech & telecom | | 618,719 | | | 4 | % |
| Food production & distribution | | 594,213 | | | 4 | % | | Hospitality & leisure | | 562,234 | | | 4 | % |
| Oil & gas | | 534,951 | | | 3 | % | | Oil & gas | | 519,784 | | | 3 | % |
| Healthcare services | | 423,734 | | | 3 | % | | Consumer goods | | 425,214 | | | 3 | % |
| All other C&I | | 5,409,646 | | | 34 | % | | All other C&I | | 5,581,869 | | | 35 | % |
| Total C&I | | $ | 15,670,084 | | | 100 | % | | Total C&I | | $ | 15,711,095 | | | 100 | % |
| | | | | | | | | | |
Commercial — Total Commercial Real Estate Loans. Total CRE loans outstanding were $18.69totaled $19.92 billion as of SeptemberJune 30, 2022,2023, which grew by $2.51 billion$849.3 million or 16%4% from $16.18$19.07 billion as of December 31, 2021,2022, and accounted for 39%40% of total loans held-for-investment as of both SeptemberJune 30, 2022 and2023, compared with 39% as of December 31, 2021.2022. The total CRE loan portfolio consists of CRE, multifamily residential, and construction and land loans.loans, and affordable housing lending. The year-to-date growthincrease in total CRE loans was primarily driven by multifamily and industrialwell-diversified growth across our major property types.
types, partially offset by a decrease in office CRE loans. The Company’s totalunderwriting parameters for CRE portfolio is diversified byloans are established in compliance with supervisory guidance, including: property type, with an average CRE loan size of $2.7 milliongeography and $2.5 million as of September 30, 2022 and December 31, 2021, respectively. The following table summarizes the Company’s total CRE loans by property type as of September 30, 2022 and December 31, 2021:
| | | | | | | | | | | | | | | | | | | | | | | | | | |
|
| ($ in thousands) | | September 30, 2022 | | December 31, 2021 |
| Amount | | % | | Amount | | % |
| Property types: | | | | | | | | |
Retail (1) | | $ | 3,991,541 | | | 21 | % | | $ | 3,685,900 | | | 23 | % |
| Multifamily | | 4,559,302 | | | 24 | % | | 3,675,605 | | | 23 | % |
Office (1) | | 2,943,391 | | | 16 | % | | 2,804,006 | | | 17 | % |
Industrial (1) | | 3,474,909 | | | 19 | % | | 2,807,325 | | | 18 | % |
Hospitality (1) | | 2,099,226 | | | 11 | % | | 1,993,995 | | | 12 | % |
| Construction and land | | 556,894 | | | 3 | % | | 346,486 | | | 2 | % |
Other (1) | | 1,064,090 | | | 6 | % | | 863,821 | | | 5 | % |
| Total CRE loans | | $ | 18,689,353 | | | 100 | % | | $ | 16,177,138 | | | 100 | % |
|
(1)Included in CRE loan category.
The weighted-average loan-to-value (“LTV”) ratio of the total CRE portfolio was 51% as of both September 30, 2022 and December 31, 2021. The low weighted-average LTV ratio was consistent across CRE property types. Approximately 87% and 89% of total CRE loans had an LTV ratio of 65% or lower as of September 30, 2022 and December 31, 2021, respectively.. The consistency of the Company’s low LTV underwriting standards has historically resulted in lower credit losses for CRE and multifamily residential loans.losses.
The Company’s total CRE loan portfolio is well-diversified by property type with an average CRE loan size of $2.9 million as of June 30, 2023, compared with $2.8 million as of December 31, 2022. The following table summarizes the Company’s total CRE loans by property type as of June 30, 2023 and December 31, 2022:
| | | | | | | | | | | | | | | | | | | | | | | | | | |
|
| | June 30, 2023 | | December 31, 2022 |
| ($ in thousands) | | Amount | | % | | Amount | | % |
| Property types: | | | | | | | | |
| Multifamily | | $ | 4,764,180 | | | 24 | % | | $ | 4,573,067 | | | 24 | % |
Retail (1) | | 4,203,130 | | | 21 | % | | 4,075,769 | | | 22 | % |
Industrial (1) | | 3,798,162 | | | 19 | % | | 3,617,086 | | | 19 | % |
Office (1) | | 2,353,550 | | | 12 | % | | 2,522,554 | | | 13 | % |
Hotel (1) | | 2,249,020 | | | 11 | % | | 2,085,910 | | | 11 | % |
Healthcare (1) | | 843,825 | | | 4 | % | | 796,577 | | | 4 | % |
| Construction and land | | 781,068 | | | 4 | % | | 638,420 | | | 3 | % |
Other (1) | | 925,698 | | | 5 | % | | 759,975 | | | 4 | % |
| Total CRE loans | | $ | 19,918,633 | | | 100 | % | | $ | 19,069,358 | | | 100 | % |
|
(1)Included in CRE loans, which is a subset of Total CRE loans.
The weighted-average LTV ratio of the total CRE loan portfolio was 51% as of both June 30, 2023 and December 31, 2022. Weighted average LTV is based on the most recent LTV, which is based on the latest available appraisal and current loan commitment. Approximately 90% of total CRE loans had an LTV ratio of 65% or lower as of both June 30, 2023 and December 31, 2022.
The following tables provide a summary of the Company’s CRE, multifamily residential, and construction and land loans by geography as of SeptemberJune 30, 20222023 and December 31, 2021.2022. The distribution of the total CRE loan portfolio reflects the Company’s geographicgeographical branch footprint, which is primarily concentrated in California:
| | | ($ in thousands) | | September 30, 2022 | |
| | June 30, 2023 |
| ($ in thousands) | ($ in thousands) | | CRE | | % | | Multifamily
Residential | | % | | Construction
and Land | | % | | Total CRE | | % | ($ in thousands) | | CRE | | % | | Multifamily Residential | | % | | Construction and Land | | % | | Total CRE | | % |
| | | | | | | | | | | | | | | | Geographic markets: | | | | | | | | | | | | | | | | |
| Southern California | Southern California | | $ | 7,022,529 | | | $ | 2,257,999 | | | $ | 203,939 | | | $ | 9,484,467 | | | Southern California | | $ | 7,372,267 | | | 51 | % | | $ | 2,290,962 | | | 48 | % | | $ | 280,881 | | | 36 | % | | $ | 9,944,110 | | | 50 | % |
| Northern California | Northern California | | 2,802,337 | | | 871,497 | | | 209,083 | | | 3,882,917 | | | Northern California | | 2,712,476 | | | 19 | % | | 933,360 | | | 20 | % | | 266,151 | | | 34 | % | | 3,911,987 | | | 20 | % |
| California | California | | 9,824,866 | | | 72 | % | | 3,129,496 | | | 69 | % | | 413,022 | | | 74 | % | | 13,367,384 | | | 72 | % | California | | 10,084,743 | | | 70 | % | | 3,224,322 | | | 68 | % | | 547,032 | | | 70 | % | | 13,856,097 | | | 70 | % |
| Texas | Texas | | 1,140,975 | | | 8 | % | | 412,316 | | | 9 | % | | 3,037 | | | 1 | % | | 1,556,328 | | | 8 | % | Texas | | 1,158,735 | | | 8 | % | | 443,373 | | | 9 | % | | 16,693 | | | 2 | % | | 1,618,801 | | | 8 | % |
| New York | New York | | 684,810 | | | 5 | % | | 214,032 | | | 5 | % | | 82,135 | | | 15 | % | | 980,977 | | | 5 | % | New York | | 702,765 | | | 5 | % | | 224,769 | | | 5 | % | | 87,468 | | | 11 | % | | 1,015,002 | | | 5 | % |
| Washington | Washington | | 467,321 | | | 4 | % | | 170,864 | | | 4 | % | | 13,132 | | | 2 | % | | 651,317 | | | 3 | % | Washington | | 467,229 | | | 3 | % | | 170,163 | | | 4 | % | | 18,188 | | | 2 | % | | 655,580 | | | 3 | % |
| Arizona | | Arizona | | 345,760 | | | 2 | % | | 107,549 | | | 2 | % | | 18,705 | | | 3 | % | | 472,014 | | | 2 | % |
| Nevada | Nevada | | 160,055 | | | 1 | % | | 110,203 | | | 2 | % | | 23,693 | | | 4 | % | | 293,951 | | | 2 | % | Nevada | | 205,742 | | | 2 | % | | 108,331 | | | 2 | % | | 29,516 | | | 4 | % | | 343,589 | | | 2 | % |
| Arizona | | 226,931 | | | 2 | % | | 99,367 | | | 2 | % | | 407 | | | 0 | % | | 326,705 | | | 2 | % | |
| Other markets | Other markets | | 1,068,199 | | | 8 | % | | 423,024 | | | 9 | % | | 21,468 | | | 4 | % | | 1,512,691 | | | 8 | % | Other markets | | 1,408,411 | | | 10 | % | | 485,673 | | | 10 | % | | 63,466 | | | 8 | % | | 1,957,550 | | | 10 | % |
| Total loans | Total loans | | $ | 13,573,157 | | | 100 | % | | $ | 4,559,302 | | | 100 | % | | $ | 556,894 | | | 100 | % | | $ | 18,689,353 | | | 100 | % | Total loans | | $ | 14,373,385 | | | 100 | % | | $ | 4,764,180 | | | 100 | % | | $ | 781,068 | | | 100 | % | | $ | 19,918,633 | | | 100 | % |
|
| | | | | | | | | | | | | | | | | | | | | | | | | | | | | | | | | | | | | | | | | | | | | | | | | | |
|
| ($ in thousands) | | December 31, 2021 |
| CRE | | % | | Multifamily
Residential | | % | | Construction
and Land | | % | | Total CRE | | % |
| Geographic markets: | | | | | | | | | | | | | | | | |
| Southern California | | $ | 6,406,609 | | | | | $ | 2,030,938 | | | | | $ | 138,953 | | | | | $ | 8,576,500 | | | |
| Northern California | | 2,622,398 | | | | | 748,631 | | | | | 109,483 | | | | | 3,480,512 | | | |
| California | | 9,029,007 | | | 75 | % | | 2,779,569 | | | 77 | % | | 248,436 | | | 70 | % | | 12,057,012 | | | 75 | % |
| Texas | | 1,005,455 | | | 8 | % | | 308,652 | | | 8 | % | | 1,896 | | | 1 | % | | 1,316,003 | | | 8 | % |
| New York | | 630,442 | | | 5 | % | | 157,099 | | | 4 | % | | 78,368 | | | 23 | % | | 865,909 | | | 5 | % |
| Washington | | 408,913 | | | 3 | % | | 116,047 | | | 3 | % | | 9,865 | | | 3 | % | | 534,825 | | | 3 | % |
| Nevada | | 128,395 | | | 1 | % | | 115,163 | | | 3 | % | | 5,775 | | | 2 | % | | 249,333 | | | 2 | % |
| Arizona | | 122,164 | | | 1 | % | | 49,836 | | | 1 | % | | — | | | — | % | | 172,000 | | | 1 | % |
| Other markets | | 830,671 | | | 7 | % | | 149,239 | | | 4 | % | | 2,146 | | | 1 | % | | 982,056 | | | 6 | % |
| Total loans | | $ | 12,155,047 | | | 100 | % | | $ | 3,675,605 | | | 100 | % | | $ | 346,486 | | | 100 | % | | $ | 16,177,138 | | | 100 | % |
|
| | | | | | | | | | | | | | | | | | | | | | | | | | | | | | | | | | | | | | | | | | | | | | | | | | |
|
| | December 31, 2022 |
| ($ in thousands) | | CRE | | % | | Multifamily Residential | | % | | Construction and Land | | % | | Total CRE | | % |
| Geographic markets: | | | | | | | | | | | | | | | | |
| Southern California | | $ | 7,233,902 | | | 52 | % | | $ | 2,215,632 | | | 48 | % | | $ | 222,425 | | | 35 | % | | $ | 9,671,959 | | | 51 | % |
| Northern California | | 2,798,840 | | | 20 | % | | 890,002 | | | 20 | % | | 235,732 | | | 37 | % | | 3,924,574 | | | 20 | % |
| California | | 10,032,742 | | | 72 | % | | 3,105,634 | | | 68 | % | | 458,157 | | | 72 | % | | 13,596,533 | | | 71 | % |
| Texas | | 1,150,401 | | | 8 | % | | 410,872 | | | 9 | % | | 2,153 | | | 0 | % | | 1,563,426 | | | 8 | % |
| New York | | 682,096 | | | 5 | % | | 221,253 | | | 5 | % | | 99,595 | | | 16 | % | | 1,002,944 | | | 5 | % |
| Washington | | 449,423 | | | 3 | % | | 173,611 | | | 4 | % | | 15,557 | | | 2 | % | | 638,591 | | | 3 | % |
| Arizona | | 291,114 | | | 2 | % | | 95,460 | | | 2 | % | | 297 | | | 0 | % | | 386,871 | | | 2 | % |
| Nevada | | 159,092 | | | 1 | % | | 108,060 | | | 2 | % | | 30,673 | | | 5 | % | | 297,825 | | | 2 | % |
| Other markets | | 1,093,002 | | | 9 | % | | 458,178 | | | 10 | % | | 31,988 | | | 5 | % | | 1,583,168 | | | 9 | % |
| Total loans | | $ | 13,857,870 | | | 100 | % | | $ | 4,573,068 | | | 100 | % | | $ | 638,420 | | | 100 | % | | $ | 19,069,358 | | | 100 | % |
|
Because 72%As 70% and 75%71% of total CRE loans were concentrated in California as of SeptemberJune 30, 20222023 and December 31, 2021,2022, respectively, changes in California’s economy and real estate values could have a significant impact on the collectability of these loans and the required level of allowance for loan losses. For additional information related to the higher degree of risk from a downturn in the California real estate market,markets, see Item 1A. Risk Factors — Risks Related to Geopolitical Uncertainties to the Company’s 20212022 Form 10-K.
Commercial — Commercial Real Estate Loans. The Company focuses on providing financing to experienced real estate investors and developers who have moderate levels of leverage, many of whom are long-time customers of the Bank. CRE loans totaled $13.57$14.37 billion as of SeptemberJune 30, 2022,2023, compared with $12.16$13.86 billion as of December 31, 2021. CRE loans made up 28%2022, and accounted for 29% of total loans held-for-investment as of September 30, 2022 and December 31, 2021, respectively.both dates. Interest rates on CRE loans may be fixed, variable or hybrid. As of SeptemberJune 30, 2022, 66%2023, 63% of our CRE portfolio was variable rate, of which 48%49% had customer-level interest rate derivative contracts in place. These are hedging contracts offered by the Company to help our customers manage their interest rate risk while the Bank's own exposure remained variable rate.In comparison, as of December 31, 2022, 65% of our CRE portfolio was variable rate, of which 47% had customer-level interest rate derivative contracts in place. Loans are underwritten with conservative standards for cash flows, debt service coverage and LTV.
Owner-occupied properties comprised 20% of the CRE loans as of both June 30, 2023 and December 31, 2022. The remainder were non-owner-occupied properties, where 50% or more of the debt service for the loan is typically provided by rental income from an unaffiliated third party.
Commercial —Multifamily Residential Loans. The multifamily residential loan portfolio is largely comprised of loans secured by residential properties with five or more units. Multifamily residential loans totaled $4.76 billion as of June 30, 2023, compared with $4.57 billion as of December 31, 2022, and accounted for 9% of total loans held-for-investment as of both dates. The Company offers a variety of first lien mortgages, including fixed- and variable-rate loans, as well as hybrid loans with interest rates that adjust annually after an initial fixed rate period of three to ten years. As of June 30, 2023, 56% of our multifamily residential loan portfolio was variable rate, of which 37% had customer-level interest rate derivative contracts in place. These are hedging contracts offered by the Company to help our customers manage their interest rate risk while the Bank's own exposure remained variable rate. In comparison, as of December 31, 2021, 75%2022, 57% of our CREmultifamily residential loan portfolio was variable rate, of which 52% had customer-level interest rate derivative contracts in place. Loans are underwritten with conservative standards for cash flows, debt service coverage and LTV.
Owner-occupied properties comprised 19% and 20% of the CRE loans as of September 30, 2022 and December 31, 2021, respectively. The remainder were non-owner-occupied properties, where 50% or more of the debt service for the loan is typically provided by rental income from an unaffiliated third party.
Commercial —Multifamily Residential Loans. The multifamily residential loan portfolio is largely comprised of loans secured by residential properties with five or more units. Multifamily residential loans totaled $4.56 billion as of September 30, 2022, compared with $3.68 billion as of December 31, 2021, and accounted for 10% and 9% of total loans held-for-investment as of September 30, 2022 and December 31, 2021, respectively. The Company offers a variety of first lien mortgages, including fixed- and variable-rate loans, as well as hybrid loans with interest rates that adjust annually after an initial fixed rate period of three to ten years. As of September 30, 2022, 56% of our multifamily residential portfolio was variable rate, of which 35% had customer-level interest rate derivative contracts in place. These are hedging contracts offered by the Company to help our customers manage their interest rate risk while the Bank's own exposure remained variable rate. In comparison, as of December 31, 2021, 66% of our multifamily residential portfolio was variable rate, of which 39%34% had customer-level interest rate derivative contracts in place.
Commercial — Construction and Land Loans. Construction and land loans provide financing for a portfolio of projects diversified by real estate property type. Construction and land loans totaled $556.9$781.1 million as of SeptemberJune 30, 2022,2023, compared with $346.5$638.4 million as of December 31, 2021,2022, and accounted for 2% and 1% of total loans held-for-investment as of both dates.June 30, 2023 and December 31, 2022, respectively. Construction loan exposure was made up of $452.2$652.5 million in loans outstanding, plus $613.8$753.5 million in unfunded commitments as of SeptemberJune 30, 2022,2023, compared with $297.9$536.8 million in loans outstanding, plus $361.2$611.4 million in unfunded commitments as of December 31, 2021.2022. Land loans totaled $104.7$128.6 million as of SeptemberJune 30, 2022,2023, compared with $48.6$101.7 million as of December 31, 2021.2022.
Consumer
Residential mortgage loans are primarily originated through the Bank’s branch network. The following tables summarize the Company’s single-family residential and HELOC loan portfolios by geography as of SeptemberJune 30, 20222023 and December 31, 2021:2022. The average total residential loan size was $435 thousand and $434 thousand as of June 30, 2023 and December 31, 2022, respectively:
| | | ($ in thousands) | | September 30, 2022 | |
| | June 30, 2023 |
| ($ in thousands) | ($ in thousands) | | Single-Family
Residential | | % | | HELOCs | | % | | Total Residential
Mortgage | | % | ($ in thousands) | | Single-Family Residential | | % | | HELOCs | | % | | Total Residential Mortgage | | % |
| | | | | | | | | | | | Geographic markets: | | | | | | | | | | | | |
| Southern California | Southern California | | $ | 4,021,598 | | | $ | 974,763 | | | $ | 4,996,361 | | | Southern California | | $ | 4,530,084 | | | 37 | % | | $ | 857,601 | | | 46 | % | | $ | 5,387,685 | | | 38 | % |
| Northern California | Northern California | | 1,252,150 | | | 512,356 | | | 1,764,506 | | | Northern California | | 1,477,224 | | | 12 | % | | 411,340 | | | 22 | % | | 1,888,564 | | | 13 | % |
| California | California | | 5,273,748 | | | 48 | % | | 1,487,119 | | | 68 | % | | 6,760,867 | | | 52 | % | California | | 6,007,308 | | | 49 | % | | 1,268,941 | | | 68 | % | | 7,276,249 | | | 51 | % |
| New York | New York | | 3,849,305 | | | 35 | % | | 295,946 | | | 14 | % | | 4,145,251 | | | 32 | % | New York | | 4,175,125 | | | 34 | % | | 256,468 | | | 14 | % | | 4,431,593 | | | 31 | % |
| Washington | Washington | | 621,347 | | | 6 | % | | 247,570 | | | 11 | % | | 868,917 | | | 7 | % | Washington | | 676,043 | | | 5 | % | | 205,021 | | | 11 | % | | 881,064 | | | 6 | % |
| Massachusetts | Massachusetts | | 291,154 | | | 3 | % | | 90,052 | | | 4 | % | | 381,206 | | | 3 | % | Massachusetts | | 340,553 | | | 3 | % | | 78,281 | | | 4 | % | | 418,834 | | | 3 | % |
| Georgia | Georgia | | 282,611 | | | 3 | % | | 24,212 | | | 1 | % | | 306,823 | | | 2 | % | Georgia | | 371,723 | | | 3 | % | | 18,692 | | | 1 | % | | 390,415 | | | 3 | % |
| Texas | Texas | | 300,007 | | | 3 | % | | — | | | — | % | | 300,007 | | | 2 | % | Texas | | 383,937 | | | 3 | % | | — | | | — | % | | 383,937 | | | 3 | % |
| Nevada | | Nevada | | 337,639 | | | 3 | % | | 34,029 | | | 2 | % | | 371,668 | | | 3 | % |
| Other markets | Other markets | | 237,173 | | | 2 | % | | 40,025 | | | 2 | % | | 277,198 | | | 2 | % | Other markets | | 16,285 | | | 0 | % | | 1,496 | | | 0 | % | | 17,781 | | | 0 | % |
| Total | Total | | $ | 10,855,345 | | | 100 | % | | $ | 2,184,924 | | | 100 | % | | $ | 13,040,269 | | | 100 | % | Total | | $ | 12,308,613 | | | 100 | % | | $ | 1,862,928 | | | 100 | % | | $ | 14,171,541 | | | 100 | % |
| Lien priority: | Lien priority: | | | | | | | | | | | | | Lien priority: | | | | | | | | | | | | |
| First mortgage | First mortgage | | $ | 10,855,345 | | | 100 | % | | $ | 1,855,057 | | | 85 | % | | $ | 12,710,402 | | | 97 | % | First mortgage | | $ | 12,308,613 | | | 100 | % | | $ | 1,497,050 | | | 80 | % | | $ | 13,805,663 | | | 97 | % |
| Junior lien mortgage | Junior lien mortgage | | — | | | — | % | | 329,867 | | | 15 | % | | 329,867 | | | 3 | % | Junior lien mortgage | | — | | | — | % | | 365,878 | | | 20 | % | | 365,878 | | | 3 | % |
| Total | Total | | $ | 10,855,345 | | | 100 | % | | $ | 2,184,924 | | | 100 | % | | $ | 13,040,269 | | | 100 | % | Total | | $ | 12,308,613 | | | 100 | % | | $ | 1,862,928 | | | 100 | % | | $ | 14,171,541 | | | 100 | % |
|
| | | | | | | | | | | | | | | | | | | | | | | | | | | | | | | | | | | | | | |
|
| | December 31, 2022 |
| ($ in thousands) | | Single-Family Residential | | % | | HELOCs | | % | | Total Residential Mortgage | | % |
| Geographic markets: | | | | | | | | | | | | |
| Southern California | | $ | 4,142,623 | | | 37 | % | | $ | 959,632 | | | 45 | % | | $ | 5,102,255 | | | 38 | % |
| Northern California | | 1,294,721 | | | 11 | % | | 492,921 | | | 23 | % | | 1,787,642 | | | 14 | % |
| California | | 5,437,344 | | | 48 | % | | 1,452,553 | | | 68 | % | | 6,889,897 | | | 52 | % |
| New York | | 3,964,779 | | | 35 | % | | 286,285 | | | 14 | % | | 4,251,064 | | | 32 | % |
| Washington | | 632,892 | | | 6 | % | | 236,434 | | | 11 | % | | 869,326 | | | 7 | % |
| Massachusetts | | 299,051 | | | 3 | % | | 85,590 | | | 4 | % | | 384,641 | | | 3 | % |
| Georgia | | 303,615 | | | 3 | % | | 21,493 | | | 1 | % | | 325,108 | | | 2 | % |
| Texas | | 316,771 | | | 3 | % | | — | | | — | % | | 316,771 | | | 2 | % |
| Nevada | | 253,702 | | | 2 | % | | 40,300 | | | 2 | % | | 294,002 | | | 2 | % |
| Other markets | | 14,873 | | | 0 | % | | — | | | — | % | | 14,873 | | | 0 | % |
| Total | | $ | 11,223,027 | | | 100 | % | | $ | 2,122,655 | | | 100 | % | | $ | 13,345,682 | | | 100 | % |
| Lien priority: | | | | | | | | | | | | |
| First mortgage | | $ | 11,223,027 | | | 100 | % | | $ | 1,770,741 | | | 83 | % | | $ | 12,993,768 | | | 97 | % |
| Junior lien mortgage | | — | | | — | % | | 351,914 | | | 17 | % | | 351,914 | | | 3 | % |
| Total | | $ | 11,223,027 | | | 100 | % | | $ | 2,122,655 | | | 100 | % | | $ | 13,345,682 | | | 100 | % |
|
| | | | | | | | | | | | | | | | | | | | | | | | | | | | | | | | | | | | | | |
|
| ($ in thousands) | | December 31, 2021 |
| Single-Family
Residential | | % | | HELOCs | | % | | Total Residential
Mortgage | | % |
| Geographic markets: | | | | | | | | | | | | |
| Southern California | | $ | 3,520,010 | | | | | $ | 971,731 | | | | | $ | 4,491,741 | | | |
| Northern California | | 1,024,564 | | | | | 506,310 | | | | | 1,530,874 | | | |
| California | | 4,544,574 | | | 49 | % | | 1,478,041 | | | 68 | % | | 6,022,615 | | | 54 | % |
| New York | | 3,102,129 | | | 34 | % | | 292,540 | | | 14 | % | | 3,394,669 | | | 30 | % |
| Washington | | 526,721 | | | 6 | % | | 230,294 | | | 11 | % | | 757,015 | | | 7 | % |
| Massachusetts | | 258,372 | | | 3 | % | | 75,815 | | | 4 | % | | 334,187 | | | 3 | % |
| Georgia | | 279,328 | | | 3 | % | | 25,208 | | | 1 | % | | 304,536 | | | 3 | % |
| Texas | | 230,402 | | | 3 | % | | — | | | — | % | | 230,402 | | | 2 | % |
| Other markets | | 152,176 | | | 2 | % | | 42,923 | | | 2 | % | | 195,099 | | | 1 | % |
| Total | | $ | 9,093,702 | | | 100 | % | | $ | 2,144,821 | | | 100 | % | | $ | 11,238,523 | | | 100 | % |
| Lien priority: | | | | | | | | | | | | |
| First mortgage | | $ | 9,093,702 | | | 100 | % | | $ | 1,872,440 | | | 87 | % | | $ | 10,966,142 | | | 98 | % |
| Junior lien mortgage | | — | | | — | % | | 272,381 | | | 13 | % | | 272,381 | | | 2 | % |
| Total | | $ | 9,093,702 | | | 100 | % | | $ | 2,144,821 | | | 100 | % | | $ | 11,238,523 | | | 100 | % |
|
Consumer — Single-Family Residential Mortgages.Loans. Single-family residential loans totaled $10.86$12.31 billion or 25% of total loans held-for-investment as of June 30, 2023, compared with $11.22 billion or 23% of total loans held-for-investment as of September 30, 2022, compared with $9.09December 31, 2022. Single-family residential loans increased $1.09 billion or 22% of total loans held-for-investment as of10% from December 31, 2021. Year-to-date, single-family residential mortgages increased $1.76 billion or 19%,2022, primarily driven by netorganic growth in mortgages and residential properties in California and New York. The Company was in a first lien position for all of its single-family residential loans as of both SeptemberJune 30, 20222023 and December 31, 2021.2022. Many of these loans are reduced documentation loans, for which a substantial down payment is required, resulting in a low LTV ratio at origination, typically 65% or less. The weighted-average LTV ratio was 53% as of both dates. These loans have historically experienced low delinquency and loss rates. The Company offers a variety of single-family residential first lien mortgage loan programs, including fixed- and variable-rate loans, as well as hybrid loans with interest rates that adjust on a regular basis, typically each year,annually, after an initial fixed rate period.
Consumer — Home Equity Lines of Credit. Total HELOC commitments were $3.27$5.39 billion as of SeptemberJune 30, 2022, which grew by $775.22023, a decrease of $108.0 million or 31%2% from $2.49$5.50 billion, with a utilization rate of 35% as of June 30, 2023, compared with 39% as of December 31, 2021. Unfunded2022. A majority of unfunded HELOC commitments are unconditionally cancellable. HELOCs outstanding totaled $2.18$1.86 billion or 4% of total loans held-for-investment as of SeptemberJune 30, 2022,2023, compared with $2.14$2.12 billion as of December 31, 2021, and accounted foror 5% of total loans held-for-investment as of both dates. Year-to-date,December 31, 2022. HELOCs increased $40.1outstanding decreased $259.7 million or 2%, primarily driven by growth in Washington, Massachusetts, and California.12% from December 31, 2022. The Company was in a first lien position for 85%80% and 87%83% of total outstanding HELOCs as of SeptemberJune 30, 20222023 and December 31, 2021,2022, respectively. The weighted-average LTV ratio was 48% on HELOC commitments as of June 30, 2023, compared with 49% as of December 31, 2022. Weighted-average LTV ratio represents the loan’s balance divided by the estimated current property value. For junior lien home equity loans, combined LTV ratios are used for junior lien home equity products. Many of these loans are reduced documentation loans, for which a substantial down payment is required, resulting in a low LTV ratio at origination, typically 65% or less. TheseAs a result, these loans have historically experienced low delinquency and loss rates. Substantially all of the Company’s HELOCs were variable-rate loans as of both SeptemberJune 30, 20222023 and December 31, 2021.2022.
All originated commercial and consumer loans are subject to the Company’s conservative underwriting guidelines and loan origination standards. Management believes that the Company’s underwriting criteria and procedures adequately consider the unique risks associated with these products. The Company conducts a variety of quality control procedures and periodic audits, including the review of lending and legal requirements, to ensure that the Company is in compliance with these requirements.
Foreign Outstandings
The Company’s overseas offices, which include the branch in Hong Kong and the subsidiary bank in China, are subject to the general risks inherent in conducting business in foreign countries, such as regulatory, economic and political uncertainties. As such, the Company’s international operation risk exposure is largely concentrated in China and Hong Kong. In addition, the Company’s financial assets held in the Hong Kong branch and the subsidiary bank in China may be affected by fluctuations in currency exchange rates or other factors. The following table presents the major financial assets held in the Company’s overseas offices as of SeptemberJune 30, 20222023 and December 31, 2021:2022:
| | | ($ in thousands) | | September 30, 2022 | | December 31, 2021 | |
| | June 30, 2023 | | December 31, 2022 |
| ($ in thousands) | ($ in thousands) | | Amount | | % of Total
Consolidated
Assets | | Amount | | % of Total
Consolidated
Assets | ($ in thousands) | | Amount | | % of Total Consolidated Assets | | Amount | | % of Total Consolidated Assets |
| | | | | | | | Hong Kong branch: | | | | | | | | |
| Cash and cash equivalents | Cash and cash equivalents | | $ | 871,196 | | | 1 | % | | $ | 831,283 | | | 1 | % | Cash and cash equivalents | | $ | 594,333 | | | 1 | % | | $ | 911,784 | | | 1 | % |
| Interest-bearing deposits with banks | Interest-bearing deposits with banks | | $ | 72,245 | | | 0 | % | | $ | — | | | — | % | Interest-bearing deposits with banks | | $ | — | | | — | % | | $ | 28,772 | | | 0 | % |
AFS debt securities (1) | AFS debt securities (1) | | $ | 280,817 | | | 0 | % | | $ | 242,926 | | | 0 | % | AFS debt securities (1) | | $ | 388,170 | | | 1 | % | | $ | 281,804 | | | 0 | % |
Loans held-for-investment (2) | Loans held-for-investment (2) | | $ | 907,153 | | | 1 | % | | $ | 849,573 | | | 1 | % | Loans held-for-investment (2) | | $ | 890,249 | | | 1 | % | | $ | 968,450 | | | 2 | % |
| Total assets | Total assets | | $ | 2,152,110 | | | 3 | % | | $ | 1,933,164 | | | 3 | % | Total assets | | $ | 1,887,598 | | | 3 | % | | $ | 2,212,606 | | | 3 | % |
| Subsidiary bank in China: | Subsidiary bank in China: | | Subsidiary bank in China: | |
| Cash and cash equivalents | Cash and cash equivalents | | $ | 539,133 | | | 1 | % | | $ | 543,134 | | | 1 | % | Cash and cash equivalents | | $ | 677,828 | | | 1 | % | | $ | 556,656 | | | 1 | % |
| Interest-bearing deposits with banks | | $ | 13,049 | | | 0 | % | | $ | 51,243 | | | 0 | % | |
| AFS debt securities (3) | AFS debt securities (3) | | $ | 120,178 | | | 0 | % | | $ | 141,404 | | | 0 | % | AFS debt securities (3) | | $ | 117,821 | | | 0 | % | | $ | 122,053 | | | 0 | % |
Loans held-for-investment (2) | Loans held-for-investment (2) | | $ | 1,192,883 | | | 2 | % | | $ | 984,591 | | | 2 | % | Loans held-for-investment (2) | | $ | 1,216,970 | | | 2 | % | | $ | 1,170,437 | | | 2 | % |
| Total assets | Total assets | | $ | 1,850,531 | | | 3 | % | | $ | 1,709,640 | | | 3 | % | Total assets | | $ | 2,006,969 | | | 3 | % | | $ | 1,836,811 | | | 3 | % |
|
(1)Comprised of U.S. Treasury securities and foreign government bonds as of both SeptemberJune 30, 20222023 and December 31, 2021.2022.
(2)Primarily comprised of C&I loans as of both SeptemberJune 30, 20222023 and December 31, 2021.2022.
(3)Comprised of foreign government bonds as of both SeptemberJune 30, 20222023 and December 31, 2021.2022.
The following table presents the total revenue generated by the Company’s overseas offices for the third quartersecond quarters and first nine monthshalves of 20222023 and 2021:2022:
| | | ($ in thousands) | ($ in thousands) | | Three Months Ended September 30, | | Nine Months Ended September 30, | ($ in thousands) | | Three Months Ended June 30, | | Six Months Ended June 30, |
| 2022 | | 2021 | | 2022 | | 2021 | | 2023 | | 2022 | | 2023 | | 2022 |
| Amount | | % of Total
Consolidated
Revenue | | Amount | | % of Total
Consolidated
Revenue | | Amount | | % of Total
Consolidated
Revenue | | Amount | | % of Total
Consolidated
Revenue | | Amount | | % of Total
Consolidated
Revenue | | Amount | | % of Total
Consolidated
Revenue | | Amount | | % of Total
Consolidated
Revenue | | Amount | | % of Total
Consolidated
Revenue |
| Hong Kong Branch: | Hong Kong Branch: | | | | | | | | | | | | | | | | | Hong Kong Branch: | | | | | | | | | | | | | | | | |
| Total revenue | Total revenue | | $ | 14,296 | | | 2 | % | | $ | 5,912 | | | 1 | % | | $ | 32,405 | | | 2 | % | | $ | 18,252 | | | 1 | % | Total revenue | | $ | 12,255 | | | 2 | % | | $ | 10,768 | | | 2 | % | | $ | 27,573 | | | 2 | % | | $ | 18,109 | | | 2 | % |
| Subsidiary Bank in China: | Subsidiary Bank in China: | | | Subsidiary Bank in China: | | |
| Total revenue | Total revenue | | $ | 11,616 | | | 2 | % | | $ | 7,592 | | | 2 | % | | $ | 30,652 | | | 2 | % | | $ | 20,271 | | | 2 | % | Total revenue | | $ | 11,425 | | | 2 | % | | $ | 11,236 | | | 2 | % | | $ | 19,310 | | | 1 | % | | $ | 19,036 | | | 2 | % |
|
Capital
The Company maintains a strong capital base to support its anticipated asset growth, operating needs, and credit risks, and to ensure that the Company and the Bank are in compliance with all regulatory capital guidelines. The Company engages in regular capital planning processes on at least an annual basis to optimize the use of available capital and to appropriately plan for future capital needs, allocating capital to existing and future business activities. Furthermore, the Company conducts capital stress tests as part of its capital planning process. The stress tests enable the Company to assess the impact of adverse changes in the economy and interest rates on its capital base.
On March 3, 2020, the Company’s Board of Directors authorized the repurchase of $500.0 million of the Company’s common stock, of which $254.0 million remains available. During the second quarter of 2022, the Company repurchased $100.0 million of common stock or 1,385,517 shares, at an average price of $72.17 per share. The Company did not repurchase shares during the third quarter of 2022. For additional information about the share repurchases, see Part II, Item 2.— Unregistered Sales of Equity Securities and Use of Proceeds in this Form 10-Q.
The Company’s stockholders’ equity was $5.66$6.46 billion as of SeptemberJune 30, 2022, a decrease2023, an increase of $176.6$477.1 million or 3%8% from $5.84$5.98 billion as of December 31, 2021.2022. The year-to-date decreaseincrease in the Company’s stockholders’ equity was primarily due to a negative change in AOCI$634.5 million of $709.7 million, $172.1 million in common dividends declared, and $100.0 million in common stock repurchases,net income, partially offset by $791.3$137.0 million in net income. The negative change in AOCI was primarily due to increased unrealized losses in AFS debt securities.of common dividends declared. For other factors that contributed to the changes in stockholders’ equity, refer to Item 1. Consolidated Financial Statements — Consolidated Statement of Changes in Stockholders’ Equity in this Form 10-Q.
Book value per share was $40.17 per common share$45.67 as of SeptemberJune 30, 2022, a decrease2023, an increase of 2%8% from $41.13$42.46 per common share as of December 31, 2021,2022, primarily as a result of the factors described above. Tangible equitybook value per common share was $36.80$42.33 as of SeptemberJune 30, 2022,2023, compared with $37.79$39.10 as of December 31, 2021.2022. For additional details, see the reconciliation of non-GAAP measures presented under Item 2. MD&A — Reconciliation of GAAP to Non-GAAP Financial Measures in this Form 10-Q.
The Company paid a quarterly common stock cash dividend of $0.48 and $0.40 and $0.33 per common share during the thirdsecond quarters of 20222023 and 2021,2022, respectively. In October 2022,July 2023, the Company’s Board of Directors declared fourththird quarter 20222023 cash dividend of $0.40$0.48 per common share. The dividend is payable on NovemberAugust 15, 2022,2023, to stockholders of record as of NovemberAugust 1, 2022.2023.
Deposits and Other Sources of Funding
Deposits are the Company’s primary source of funding, the cost of which has a significant impact on the Company’s net interest income and net interest margin. Additional funding is provided by short- and long-term borrowings, and long-term debt. See Item 2. MD&A — Risk Management — Liquidity Risk Management — Liquidity in this Form 10-Q for a discussion of the Company’s liquidity management. The following table summarizes the Company’s sources of fundsfunding as of SeptemberJune 30, 20222023 and December 31, 2021:2022:
| | | ($ in thousands) | | September 30, 2022 | | December 31, 2021 | | Change | |
| | June 30, 2023 | | December 31, 2022 | | Change |
| ($ in thousands) | ($ in thousands) | | Amount | | % | | Amount | | % | | $ | | % | ($ in thousands) | | Amount | | % | | Amount | | % | | $ | | % |
| | | | | | | | | | | | Deposits: | | | | | | | | | | | | |
| | Noninterest-bearing demand | Noninterest-bearing demand | | $ | 21,645,394 | | | 40 | % | | $ | 22,845,464 | | | 43 | % | | $ | (1,200,070) | | | (5) | % | Noninterest-bearing demand | | $ | 16,741,099 | | | 30 | % | | $ | 21,051,090 | | | 38 | % | | $ | (4,309,991) | | | (20) | % |
| Interest-bearing checking | Interest-bearing checking | | 6,822,343 | | | 13 | % | | 6,524,721 | | | 12 | % | | 297,622 | | | 5 | % | Interest-bearing checking | | 8,348,587 | | | 15 | % | | 6,672,165 | | | 12 | % | | 1,676,422 | | | 25 | % |
| Money market | Money market | | 12,113,292 | | | 23 | % | | 13,130,300 | | | 25 | % | | (1,017,008) | | | (8) | % | Money market | | 11,486,473 | | | 21 | % | | 12,265,024 | | | 22 | % | | (778,551) | | | (6) | % |
| Savings | Savings | | 2,917,770 | | | 5 | % | | 2,888,065 | | | 5 | % | | 29,705 | | | 1 | % | Savings | | 2,102,850 | | | 4 | % | | 2,649,037 | | | 4 | % | | (546,187) | | | (21) | % |
| | Time deposits | Time deposits | | 10,358,563 | | | 19 | % | | 7,961,982 | | | 15 | % | | 2,396,581 | | | 30 | % | Time deposits | | 16,979,777 | | | 30 | % | | 13,330,533 | | | 24 | % | | 3,649,244 | | | 27 | % |
| Total deposits | Total deposits | | $ | 53,857,362 | | | 100 | % | | $ | 53,350,532 | | | 100 | % | | $ | 506,830 | | | 1 | % | Total deposits | | $ | 55,658,786 | | | 100 | % | | $ | 55,967,849 | | | 100 | % | | $ | (309,063) | | | (1) | % |
| | Other Funds: | Other Funds: | | | | | | | | | | | | Other Funds: | | | | | | | | | | | |
| Short-term borrowings | | Short-term borrowings | | $ | 4,500,000 | | | 97 | % | | $ | — | | | — | % | | $ | 4,500,000 | | | 100 | % |
| | Federal funds purchased | | $ | 200,000 | | | $ | — | | | $ | 200,000 | | | 100 | % | |
| FHLB advances | | 324,920 | | | 249,331 | | | 75,589 | | | 30 | % | |
| | Repurchase agreements | Repurchase agreements | | 611,785 | | | 300,000 | | | 311,785 | | | 104 | % | Repurchase agreements | | — | | | — | % | | 300,000 | | | 67 | % | | (300,000) | | | (100) | % |
| Long-term debt | Long-term debt | | 147,875 | | | 147,658 | | | 217 | | | 0 | % | Long-term debt | | 148,097 | | | 3 | % | | 147,950 | | | 33 | % | | 147 | | | 0 | % |
| Total other funds | Total other funds | | $ | 1,284,580 | | | $ | 696,989 | | | $ | 587,591 | | | 84 | % | Total other funds | | $ | 4,648,097 | | | 100 | % | | $ | 447,950 | | | 100 | % | | $ | 4,200,147 | | | NM |
| Total sources of funds | Total sources of funds | | $ | 55,141,942 | | | $ | 54,047,521 | | | $ | 1,094,421 | | | 2 | % | Total sources of funds | | $ | 60,306,883 | | | | | $ | 56,415,799 | | | | | $ | 3,891,084 | | | 7 | % |
|
NM — Not meaningful.
Deposits
The Company offers a wide variety of deposit products to consumer and commercial customers. To provide a stable and low-cost source of funding and liquidity, the Company’s strategy is to grow and retain relationship-based deposits. Total deposits were $53.86$55.66 billion as of SeptemberJune 30, 2022, an increase2023, a decrease of $506.8$309.1 million or 1% from $53.35$55.97 billion as of December 31, 2021.2022. The increasedecrease in deposits was primarily due to a decrease in noninterest-bearing demand accounts, which was partially offset by increases in time deposits and interest-bearing checking. The growth in time deposits partially offset by decreasesand interest-bearing checking reflected customers seeking higher yields in noninterest-bearing demand and money market deposits. This move from noninterest-bearing and lower paying non-maturity deposits to time deposits was largely driven by continued increases in benchmark rates.a rising interest rate environment. Noninterest-bearing demand deposits comprised 40%30% and 43%38% of total deposits as of SeptemberJune 30, 20222023 and December 31, 2021,2022, respectively.
Uninsured deposits represent the portion of deposit accounts in U.S. offices that exceed the FDIC insurance limit. The Company calculates its uninsured deposits based on the methodologies and assumptions used for regulatory reporting. Total uninsured deposit balances reported on Schedule RC-OM item 2 of the Bank’s Call report were $25.74 billion and $31.04 billion as of June 30, 2023 and December 31, 2022, respectively.
The following table summarizes the Company’s uninsured deposits information as of June 30, 2023 and December 31, 2022, after certain adjustments:
| | | | | | | | | | | | | | | | | |
| | | | | |
| ($ in thousands) | | | June 30, 2023 | | December 31, 2022 |
| Uninsured deposits, per regulatory reporting requirements | | | $ | 25,738,814 | | | $ | 31,036,311 | |
| Less: Collateralized deposits | | | (3,866,970) | | | (3,776,344) | |
| Affiliate deposits | | | (400,340) | | | (351,181) | |
| Uninsured deposits, excluding collateralized and affiliate deposits | (a) | | $ | 21,471,504 | | | $ | 26,908,786 | |
| | | | | |
| Total domestic deposits | (b) | | $ | 53,153,055 | | | $ | 53,225,764 | |
| Uninsured deposits, excluding collateralized and affiliate deposits ratio | (a) / (b) | | 40 | % | | 51 | % |
| | | | | |
Our deposit base is seasoned, stable and well-diversified. We offer our customers an insured cash sweep (“ICS”) product that allows customers to insure deposits above FDIC insurance limits. During the first half of 2023, we have seen an increase in the demand for the ICS product by our customers. The Company’s domestic uninsured deposits, excluding collateralized and affiliate deposits ratio improved to 40% as of June 30, 2023, compared with 51% as of December 31, 2022. Management believes that presenting uninsured deposits excluding collateralized and affiliate deposits provides a more accurate view of the deposits at risk, given that the collateralized deposits are secured, and the affiliate deposits are not customer-facing and eliminate in consolidation.
Additional information regarding the impact of deposits on net interest income, with a comparison of average deposit balances and rates, is provided in Item 2. MD&A — Results of Operations — Net Interest Income in this Form 10-Q. See also the discussion of the impact of deposits on liquidity at Item 2. MD&A — Liquidity Risk Management — Liquidity in this Form 10-Q.
Other Sources of Funding
The Company had an$4.50 billion of short-term borrowings outstanding overnight federal funds purchase of $200.0 million, with a fixed interest rate of 3.11% as of SeptemberJune 30, 2022.2023, consisting of funds borrowed from the BTFP in March 2023. These borrowings were more cost effective than other borrowing sources and have a positive carry as cash placed at the Federal Reserve Bank. There waswere no short-term borrowings outstanding overnight federal funds purchase as of December 31, 2021.
2022. Refer to
As of September 30, 2022,—Short-Term Borrowings and Long-Term Debt to the Company had FHLB advances of $324.9 million, compared with advances totaling $249.3 million as of December 31, 2021. As of September 30, 2022,Consolidated Financial Statements in this Form 10-Q for additional information on the FHLB advances were comprised of an overnight advance of $250.0 million with a fixed interest rate of 3.22%BTFP and a term advance of $74.9 million with a floating interest rate of 3.25% that matures in November 2022.
Gross repurchase agreements totaled $611.8 million and $300.0 million as of September 30, 2022 and December 31, 2021, respectively. Resale and repurchase agreements are reported net, pursuant to Accounting Standards Codification (“ASC”) 210-20-45-11, Balance Sheet Offsetting: Repurchase and Reverse Repurchase Agreements. As of both September 30, 2022 and December 31, 2021, the Company did not have any gross resale agreements that were eligible for netting pursuant to ASC 210-20-45-11. The weighted-average interest rates were 2.81% and 2.57% for the third quarters of 2022 and 2021, respectively; and 2.73% and 2.62% for the first nine months of 2022 and 2021, respectively. As of September 30, 2022, gross repurchase agreements had original terms between six months and nine years and remaining maturities between three months and 11 months.Company’s related borrowings.
Repurchase agreements are accounted forwere $300.0 million as collateralized financing transactions and recorded as liabilities based onof December 31, 2022. During the values at which the assets are sold. Asfirst half of September 30, 2022, the collateral for the repurchase agreements was comprised of U.S. government agency and U.S. government-sponsored enterprise mortgage-backed securities, and U.S. Treasury securities. To ensure the market value of the underlying collateral remains sufficient,2023, the Company monitors the fair valuerecorded $3.9 million of collateral pledged relative to the principal amounts borrowed under repurchase agreements. The Company manages liquidity riskscharges related to the extinguishment of the $300.0 million of repurchase agreements by sourcing funds from a diverse group of counterparties, and entering into repurchase agreements with longer durations, when appropriate.agreements. For additional details, see Note 4 — Assets Purchased under Resale Agreements and Sold under Repurchase Agreements to the Consolidated Financial Statements in this Form 10-Q.
The Company uses long-term debt to provide funding to acquire interest-earning assets, and to enhance liquidity and regulatory capital adequacy. Long-term debt totaled $147.9 million and $147.7 million as of September 30, 2022 and December 31, 2021, respectively. Long-term debt consists of junior subordinated debt, which qualifies as Tier 2 capital for regulatory capital purposes. TheRefer to Note 10—Short-Term Borrowings and Long-Term Debt to the Consolidated Financial Statements in this Form 10-Q for additional information on the junior subordinated debt was issued in connection with the Company’s various pooled trust preferred securities offerings, as well as with common stock issued by the six wholly-owned subsidiaries of the Company in conjunction with these offerings. The junior subordinated debt had weighted-average interest rates of 2.86% and 1.74% for the first nine months of 2022 and 2021, respectively, with remaining maturities ranging between 12.2 years and 15.0 years as of September 30, 2022.debt.
Regulatory Capital and Ratios
The federal banking agencies have risk-based capital adequacy requirements intended to ensure that banking organizations maintain capital that is commensurate with the degree of risk associated with their operations. The Company and the Bank are each subject to these regulatory capital adequacy requirements. See Item 1. Business — Supervision and Regulation — Regulatory Capital Requirements and Regulatory Capital-Related Development in the Company’s 20212022 Form 10-K for additional details.
The Company adopted Accounting Standards Update (“ASU”) 2016-13 on January 1, 2020, which requires the measurement of the allowance for credit losses to be based on management’s best estimate of lifetime expected credit losses inherent in the Company’s relevant financial assets. The Company has elected the phase-in option provided by a final rule that delays an estimate of the current expected credit losses methodology (“CECL”) effect on regulatory capital for two years and phases in the impact over three years. The rule permits certain banking organizations to exclude from regulatory capital the initial adoption impact of CECL, plus 25% of the cumulative changes in the allowance for credit losses under CECL for each period until December 31, 2021, followed by a three-year phase-out period in which the aggregate benefit is reduced by 25% in 2022, 50% in 2023 and 75% in 2024. Accordingly, theour capital ratios as of SeptemberJune 30, 2022 delayed 75%2023 reflect a delay of 50% of the estimated impact of CECL on regulatory capital through the year 2021.
The following table presents the Company’s and the Bank’s capital ratios as of SeptemberJune 30, 20222023 and December 31, 2021,2022 under the Basel III Capital Rules, and those required by regulatory agencies for capital adequacy and well-capitalized classification purposes:
| | | | | Basel III Capital Rules | | | Basel III Capital Rules | |
| September 30, 2022 | | December 31, 2021 | | Minimum
Regulatory
Requirements | | Minimum
Regulatory
Requirements including Capital Conservation Buffer | | Well-
Capitalized
Requirements | | | June 30, 2023 | | December 31, 2022 | | |
| Company | |
Bank | | Company | |
Bank | | | | Company | | Bank | | Company | | Bank | | Minimum Regulatory Requirements | | Minimum Regulatory Requirements including Capital Conservation Buffer | | Well-Capitalized Requirements | |
| Risk-based capital ratios: | Risk-based capital ratios: | | | | | | | | | | | | | | | | Risk-based capital ratios: | | | | | | | | | | | | | | | |
Common Equity Tier 1 capital | Common Equity Tier 1 capital | | 12.3 | % | | 12.1 | % | | 12.8 | % | | 12.3 | % | | 4.5 | % | | 7.0 | % | | 6.5 | % | | Common Equity Tier 1 capital | | 13.2 | % | | 12.9 | % | | 12.7 | % | | 12.5 | % | | 4.5 | % | | 7.0 | % | | 6.5 | % | |
Tier 1 capital (1) | Tier 1 capital (1) | | 12.3 | % | | 12.1 | % | | 12.8 | % | | 12.3 | % | | 6.0 | % | | 8.5 | % | | 8.0 | % | | Tier 1 capital (1) | | 13.2 | % | | 12.9 | % | | 12.7 | % | | 12.5 | % | | 6.0 | % | | 8.5 | % | | 8.0 | % | |
| Total capital | Total capital | | 13.6 | % | | 13.1 | % | | 14.1 | % | | 13.2 | % | | 8.0 | % | | 10.5 | % | | 10.0 | % | | Total capital | | 14.6 | % | | 14.1 | % | | 14.0 | % | | 13.5 | % | | 8.0 | % | | 10.5 | % | | 10.0 | % | |
Tier 1 leverage (1) | Tier 1 leverage (1) | | 9.6 | % | | 9.4 | % | | 9.0 | % | | 8.6 | % | | 4.0 | % | | 4.0 | % | | 5.0 | % | | Tier 1 leverage (1) | | 10.0 | % | | 9.9 | % | | 9.8 | % | | 9.7 | % | | 4.0 | % | | 4.0 | % | | 5.0 | % | |
|
(1)The Common Equity Tier 1 capital and Tier 1 leverage well-capitalized requirement appliesrequirements apply only to the Bank since there is no Common Equity Tier 1 capital component or Tier 1 leverage ratio component in the definition of a well-capitalized bank holding company. The minimumwell-capitalized Tier 1 risk-based capital ratio requirementrequirements for the Company to be considered well-capitalized isand the Bank are 6.0%. and 8.0%, respectively.
The Company is committed to maintaining strong capital levels to assure its investors, customers and regulators that the Company and the Bank are financially sound. As of both SeptemberJune 30, 20222023 and December 31, 2021,2022, the Company and the Bank continued to exceed all “well-capitalized” capital requirements and the required minimum capital requirements under the Basel III Capital Rules. Total risk-weighted assets were $49.27$51.70 billion as of SeptemberJune 30, 2022,2023, an increase of $5.68$1.66 billion or 13% from $43.59$50.04 billion as of December 31, 2021.2022. The increase in the risk-weighted assets was primarily due to residential mortgage and CRE loan growth.
Risk Management
Overview
In the normal course of conducting its business, the Company is exposed to a variety of risks, some of which are inherent to the financial services industry and others of which are more specific to the Company’s businesses.business. The Company operates under a Board-approved enterprise risk management (“ERM”) framework, which outlines the company-wide approach to risk management and oversight, and describes the structures and practices employed to manage the current and emerging risks inherent to the Company. The Company’s ERM program incorporates risk management throughout the organization in identifying, managing, monitoring, and reporting risks. It identifies the Company’s major risk categories asas: credit, risk, liquidity, risk, capital, risk, market, risk, operational, risk, compliance, legal, strategic, technology and regulatory risks, legal risks, strategic risks, and reputational risks.reputational.
The Risk Oversight Committee of the Board of Directors monitors the ERM program through establishedidentified risk categories and provides oversight of the Company’s risk appetite and control environment. The Risk Oversight Committee provides focused oversight of the Company’s identified enterprise risk categories on behalf of the full Board of Directors. Under the direction of the Risk Oversight Committee, management committees apply targeted strategies to manage and reduce the risks to which the Company’s operations are exposed.
The Company’s ERM program is executed along the three lines of defense model, which provides for a consistent and standardized risk management control environment across the enterprise. The first line of defense is comprised of production, operational and support units. The second line of defense is comprised of various risk management and control functions charged with monitoring and managing specific major risk categories and/or risk subcategories. The third line of defense is comprised of the Internal Audit function and Independent Asset Review (“IAR”). Internal Audit and IAR providesprovide assurance and evaluatesevaluate the effectiveness of risk management, control and governance processes as established by the Company. Reporting directly to the Board’s Audit Committee, Internal Audit maintains organizational independence and objectivity. Further discussion and analysis of thecertain primary risk areas are detailed in the following subsections of Risk Management.
Credit Risk Management
Credit risk is the risk that a borrower or a counterparty will fail to perform according to the terms and conditions of a loan or investment and expose the Company to loss. Credit risk exists with many of the Company’s assets and exposures such as loans, debt securities and certain derivatives. The majority of the Company’s credit risk is associated with lending activities.
The Risk Oversight Committee has primary oversight responsibility for identified enterprise risk categories including credit risk. The Risk Oversight Committee monitors management’s assessment of asset quality, credit risk trends, credit quality administration, underwriting standards, and portfolio credit risk management strategies and processes, such as diversification and concentration limits, all of which enable management to control credit risk. At the management level, the Credit Risk Management Committee has primary oversight responsibility for credit risk. The Senior Credit Supervision function manages credit policy for the line of business transactional credit risk, assuring that all exposure is risk-rated according to the requirements of the credit risk rating policy. The Senior Credit Supervision function evaluates and reports the overall credit risk exposure to senior management and the Risk Oversight Committee. Reporting directly to the Board’s Risk Oversight Committee, the Independent Asset ReviewIAR function provides additional support to the Company’s strong credit risk management culture by providing an independent and objective assessment of underwriting and documentation quality. A key focus of our credit risk management is adherence to a well-controlled underwriting and audit monitoring process.
The Company assesses the overall credit quality performance of the loans held-for-investment portfolio through an integrated analysis of specific performance ratios. This approach forms the basis of the discussion in the sections immediately following: Credit Quality, Nonperforming Assets Troubled Debt Restructurings (“TDR”) and Allowance for Credit Losses.
Credit Quality
The Company utilizes a credit risk rating system to assist in monitoring credit quality. Loans are evaluated using the Company’s internal credit risk rating of 1 through 10. For more information on the Company’s credit quality indicators and internal credit risk ratings, refer to Note 7 — Loans Receivable and Allowance for Credit Losses to the Consolidated Financial Statements in this Form 10-Q.
The following table presents the Company’s criticized loans as of SeptemberJune 30, 20222023 and December 31, 2021:2022:
| | | ($ in thousands) | | Change | |
| | Change |
| ($ in thousands) | ($ in thousands) | | September 30, 2022 | | December 31, 2021 | | $ | | % | ($ in thousands) | | June 30, 2023 | | December 31, 2022 | | $ | | % |
| | | | | | | | Criticized loans: | | | | | | | | |
| | Special mention loans | Special mention loans | | $ | 470,964 | | | $ | 384,694 | | | $ | 86,270 | | | 22 | % | Special mention loans | | $ | 330,741 | | | $ | 468,471 | | | $ | (137,730) | | | (29) | % |
Classified loans | Classified loans | | 434,242 | | | 448,362 | | | (14,120) | | | (3) | % | Classified loans | | 481,051 | | | 427,509 | | | 53,542 | | | 13 | % |
Total criticized loans (1) | Total criticized loans (1) | | $ | 905,206 | | | $ | 833,056 | | | $ | 72,150 | | | 9 | % | Total criticized loans (1) | | $ | 811,792 | | | $ | 895,980 | | (2) | $ | (84,188) | | | (9) | % |
| | Special mention loans to loans held-for-investment | Special mention loans to loans held-for-investment | | 0.99 | % | | 0.92 | % | | Special mention loans to loans held-for-investment | | 0.66 | % | | 0.97 | % | |
| Classified loans to loans held-for-investment | Classified loans to loans held-for-investment | | 0.92 | % | | 1.08 | % | | Classified loans to loans held-for-investment | | 0.97 | % | | 0.89 | % | |
| Criticized loans to loans held-for-investment | Criticized loans to loans held-for-investment | | 1.91 | % | | 2.00 | % | | Criticized loans to loans held-for-investment | | 1.63 | % | | 1.86 | % | |
|
(1)Consists of substandard, doubtful and loss categories.
(2)Excludes loans held-for-sale.
Nonperforming Assets
Nonperforming assets are comprised of nonaccrual loans, other real estate owned (“OREO”) and other nonperforming assets. Other nonperforming assets and OREO are repossessed assets and properties, respectively, acquired through foreclosure, or through full or partial satisfaction of loans held-for-investment. Nonperforming assets were $97.0$115.5 million or 0.17% of total assets as of June 30, 2023, an increase of $15.7 million or 16%, compared with $99.8 million or 0.16% of total assets as of September 30, 2022, a decrease of $6.4 million or 6%, compared with $103.5 million or 0.17% of total assets as of December 31, 2021.2022.
The following table presents nonperforming assets information as of SeptemberJune 30, 20222023 and December 31, 2021:2022:
| | | ($ in thousands) | | Change | |
| | Change |
| ($ in thousands) | ($ in thousands) | | September 30, 2022 | | December 31, 2021 | | $ | | % | ($ in thousands) | | June 30, 2023 | | December 31, 2022 | | $ | | % |
| | | | | | | | Commercial: | | | | | | | | |
| C&I | C&I | | $ | 47,988 | | | $ | 59,023 | | | $ | (11,035) | | | (19) | % | C&I | | $ | 61,879 | | | $ | 50,428 | | | $ | 11,451 | | | 23 | % |
| CRE: | CRE: | | CRE: | |
| CRE | CRE | | 11,035 | | | 9,498 | | | 1,537 | | | 16 | % | CRE | | 15,895 | | | 23,244 | | | (7,349) | | | (32) | % |
| Multifamily residential | Multifamily residential | | 174 | | | 444 | | | (270) | | | (61) | % | Multifamily residential | | 4,703 | | | 169 | | | 4,534 | | | NM |
| | Total CRE | Total CRE | | 11,209 | | | 9,942 | | | 1,267 | | | 13 | % | Total CRE | | 20,598 | | | 23,413 | | | (2,815) | | | (12) | % |
| Consumer: | Consumer: | | Consumer: | |
| Residential mortgage: | Residential mortgage: | | Residential mortgage: | |
| Single-family residential | Single-family residential | | 12,741 | | | 15,720 | | | (2,979) | | | (19) | % | Single-family residential | | 21,981 | | | 14,240 | | | 7,741 | | | 54 | % |
| HELOCs | HELOCs | | 10,568 | | | 8,444 | | | 2,124 | | | 25 | % | HELOCs | | 11,051 | | | 11,346 | | | (295) | | | (3) | % |
| Total residential mortgage | Total residential mortgage | | 23,309 | | | 24,164 | | | (855) | | | (4) | % | Total residential mortgage | | 33,032 | | | 25,586 | | | 7,446 | | | 29 | % |
| Other consumer | Other consumer | | 37 | | | 52 | | | (15) | | | (29) | % | Other consumer | | 24 | | | 99 | | | (75) | | | (76) | % |
| Total nonaccrual loans | Total nonaccrual loans | | 82,543 | | | 93,181 | | | (10,638) | | | (11) | % | Total nonaccrual loans | | 115,533 | | | 99,526 | | | 16,007 | | | 16 | % |
| OREO, net | OREO, net | | — | | | 363 | | | (363) | | | (100) | % | OREO, net | | — | | | 270 | | | (270) | | | (100) | % |
| Other nonperforming assets | | — | | | 9,938 | | | (9,938) | | | (100) | % | |
| Nonperforming loans HFS | | 14,500 | | | — | | | 14,500 | | | 100 | % | |
| | Total nonperforming assets | Total nonperforming assets | | $ | 97,043 | | | $ | 103,482 | | | $ | (6,439) | | | (6) | % | Total nonperforming assets | | $ | 115,533 | | | $ | 99,796 | | | $ | 15,737 | | | 16 | % |
Nonperforming assets to total assets | Nonperforming assets to total assets | | 0.16 | % | | 0.17 | % | | | | Nonperforming assets to total assets | | 0.17 | % | | 0.16 | % | | | |
| Nonaccrual loans to loans held-for-investment | Nonaccrual loans to loans held-for-investment | | 0.17 | % | | 0.22 | % | | Nonaccrual loans to loans held-for-investment | | 0.23 | % | | 0.21 | % | |
| Allowance for loan losses to nonaccrual loans | Allowance for loan losses to nonaccrual loans | | 705.71 | % | | 581.21 | % | | Allowance for loan losses to nonaccrual loans | | 549.97 | % | | 598.48 | % | |
| | TDRs included in nonperforming loans | | $ | 32,688 | | | $ | 30,383 | | | |
| |
NM — Not meaningful.
Loans are generally placed on nonaccrual status when they become 90 days past due or when the full collection of principal or interest becomes uncertain regardless of the length of past due status. Collectability is generally assessed based on economic and business conditions, the borrower’s financial condition, and the adequacy of collateral, if any. For additional details regarding the Company’s nonaccrual loan policy, see Note 1 — Summary of Significant Accounting Policies — Significant Accounting Policies — Loans Held-for-Investment to the Consolidated Financial Statements in the Company’s 20212022 Form 10-K.
Nonaccrual loans were $82.5$115.5 million as of SeptemberJune 30, 2022, a decrease2023, an increase of $10.6$16.0 million or 11%16% from $93.2$99.5 million as of December 31, 2021.2022. This decreaseincrease was predominantly the result ofdue to an increase in commercial nonaccrual loans, partially offset by charge-offs and paydowns of commercial loans. As of SeptemberJune 30, 2022, $54.42023, $68.1 million or 66%59% of nonaccrual loans were less than 90 days delinquent. In comparison, $54.2$68.3 million or 58%,69% of nonaccrual loans were less than 90 days delinquent as of December 31, 2021.2022.
The following table presents the accruing loans past due by portfolio segment as of SeptemberJune 30, 20222023 and December 31, 2021:2022:
| | | ($ in thousands) | | | Total Accruing Past Due Loans (1) | | Change | | Percentage of
Total Loans Outstanding | |
| | | Total Accruing Past Due Loans (1) | | Change | | Percentage of Total Loans Outstanding |
| ($ in thousands) | ($ in thousands) | | | September 30,
2022 | | December 31,
2021 | | $ | | % | | September 30,
2022 | | December 31,
2021 | ($ in thousands) | | | June 30,
2023 | | December 31,
2022 | | $ | | % | | June 30,
2023 | | December 31,
2022 |
| | | | | | | | | | | | | Commercial: | | | | | | | | | | | | | |
| C&I | C&I | | | $ | 20,960 | | | $ | 11,069 | | | $ | 9,891 | | | 89 | % | | 0.13 | % | | 0.08 | % | C&I | | | $ | 5,638 | | | $ | 9,355 | | | $ | (3,717) | | | (40) | % | | 0.04 | % | | 0.06 | % |
| CRE: | CRE: | | | | CRE: | | | |
| CRE | CRE | | | 623 | | | 3,722 | | | (3,099) | | | (83) | % | | 0.00 | % | | 0.03 | % | CRE | | | 15,189 | | | 14,185 | | | 1,004 | | | 7 | % | | 0.11 | % | | 0.10 | % |
| Multifamily residential | Multifamily residential | | | 795 | | | 5,342 | | | (4,547) | | | (85) | % | | 0.02 | % | | 0.15 | % | Multifamily residential | | | 962 | | | 1,000 | | | (38) | | | (4) | % | | 0.02 | % | | 0.02 | % |
| | Construction and land | | Construction and land | | | 21,552 | | | — | | | 21,552 | | | 100 | % | | 2.76 | % | | — | % |
| Total CRE | Total CRE | | | 1,418 | | | 9,064 | | | (7,646) | | | (84) | % | | 0.01 | % | | 0.06 | % | Total CRE | | | 37,703 | | | 15,185 | | | 22,518 | | | 148 | % | | 0.19 | % | | 0.08 | % |
| Total commercial | Total commercial | | | 22,378 | | | 20,133 | | | 2,245 | | | 11 | % | | 0.07 | % | | 0.07 | % | Total commercial | | | 43,341 | | | 24,540 | | | 18,801 | | | 77 | % | | 0.12 | % | | 0.07 | % |
| Consumer: | Consumer: | | | | | | | | | Consumer: | | | | | | | | |
| Residential mortgage: | Residential mortgage: | | | | Residential mortgage: | | | |
| Single-family residential | Single-family residential | | | 22,239 | | | 18,760 | | | 3,479 | | | 19 | % | | 0.20 | % | | 0.21 | % | Single-family residential | | | 31,952 | | | 25,653 | | | 6,299 | | | 25 | % | | 0.26 | % | | 0.23 | % |
| HELOCs | HELOCs | | | 4,916 | | | 5,854 | | | (938) | | | (16) | % | | 0.22 | % | | 0.27 | % | HELOCs | | | 11,813 | | | 8,786 | | | 3,027 | | | 34 | % | | 0.63 | % | | 0.41 | % |
| Total residential mortgage | Total residential mortgage | | | 27,155 | | | 24,614 | | | 2,541 | | | 10 | % | | 0.21 | % | | 0.22 | % | Total residential mortgage | | | 43,765 | | | 34,439 | | | 9,326 | | | 27 | % | | 0.31 | % | | 0.26 | % |
| Other consumer | Other consumer | | | 80 | | | 108 | | | (28) | | | (26) | % | | 0.09 | % | | 0.08 | % | Other consumer | | | 983 | | | 3,192 | | | (2,209) | | | (69) | % | | 1.44 | % | | 4.18 | % |
| Total consumer | Total consumer | | | 27,235 | | | 24,722 | | | 2,513 | | | 10 | % | | 0.21 | % | | 0.22 | % | Total consumer | | | 44,748 | | | 37,631 | | | 7,117 | | | 19 | % | | 0.31 | % | | 0.28 | % |
| Total | Total | | | $ | 49,613 | | | $ | 44,855 | | | $ | 4,758 | | | 11 | % | | 0.10 | % | | 0.11 | % | Total | | | $ | 88,089 | | | $ | 62,171 | | | $ | 25,918 | | | 42 | % | | 0.18 | % | | 0.13 | % |
|
(1)There were no accruing loans past due 90 days or more as of both SeptemberJune 30, 20222023 and December 31, 2021.
Troubled Debt Restructurings
TDRs are loans for which contractual terms have been modified by the Company for economic or legal reasons related to a borrower’s financial difficulties, and for which a concession to the borrower was granted that the Company would not otherwise consider. The Company’s loan modifications are handled on a case-by-case basis and are negotiated to achieve mutually agreeable terms that maximize loan collectability and meet the borrower’s financial needs. The following table presents the performing and nonperforming TDRs by portfolio segment as of September 30, 2022 and December 31, 2021. The allowance for loan losses for TDRs was $16.9 million as of September 30, 2022 and $4.8 million as of December 31, 2021.
| | | | | | | | | | | | | | | | | | | | | | | | | | | | | | | | | | | | | | | | | | | | |
|
| ($ in thousands) | | September 30, 2022 | | December 31, 2021 | | | | | | |
| Performing
TDRs | | Nonperforming
TDRs | | Total | | Performing
TDRs | | Nonperforming
TDRs | | Total | | | | | | |
| Commercial: | | | | | | | | | | | | | | | | | | |
| C&I | | $ | 58,273 | | | $ | 32,121 | | | $ | 90,394 | | | $ | 77,256 | | | $ | 28,239 | | | $ | 105,495 | | | | | | | |
| CRE: | | | | | | | | | | | | | | | | | | |
| CRE | | 22,768 | | | — | | | 22,768 | | | 23,379 | | | — | | | 23,379 | | | | | | | |
| Multifamily residential | | 3,876 | | | 174 | | | 4,050 | | | 4,042 | | | 197 | | | 4,239 | | | | | | | |
| | | | | | | | | | | | | | | | | | |
| Total CRE | | 26,644 | | | 174 | | | 26,818 | | | 27,421 | | | 197 | | | 27,618 | | | | | | | |
| Consumer: | | | | | | | | | | | | | | | | | | |
| Residential mortgage: | | | | | | | | | | | | | | | | | | |
| Single-family residential | | 4,786 | | | 68 | | | 4,854 | | | 6,585 | | | 1,102 | | | 7,687 | | | | | | | |
| HELOCs | | 2,244 | | | 325 | | | 2,569 | | | 2,553 | | | 845 | | | 3,398 | | | | | | | |
| Total residential mortgage | | 7,030 | | | 393 | | | 7,423 | | | 9,138 | | | 1,947 | | | 11,085 | | | | | | | |
| | | | | | | | | | | | | | | | | | |
| Total TDRs | | $ | 91,947 | | | $ | 32,688 | | | $ | 124,635 | | | $ | 113,815 | | | $ | 30,383 | | | $ | 144,198 | | | | | | | |
| | | | | | |
Performing TDRs were $91.9 million as of September 30, 2022, a decrease of $21.9 million or 19% from $113.8 million as of December 31, 2021. This decrease primarily reflected the payoffs and paydowns of performing C&I and single-family residential TDR loans. Approximately 94% of the performing TDRs were current as of both September 30, 2022 and December 31, 2021, respectively. Nonperforming TDRs were $32.7 million as of September 30, 2022, an increase of $2.3 million or 8% from $30.4 million as of December 31, 2021. This increase primarily reflected newly designated nonperforming C&I TDR loans, partially offset by payoffs and paydowns of C&I and single-family residential nonperforming TDR loans.
Existing TDRs that were subsequently modified in response to the COVID-19 pandemic continue to be classified as TDRs. Customers who require further assistance upon exiting from the COVID-19 deferral programs may receive further modifications which may be classified as TDRs. As of September 30, 2022, there were no TDRs that were provided modifications related to the COVID-19 pandemic, and the amount of TDRs that were provided modification related to the COVID-19 pandemic were insignificant as of December 31, 2021.
Loan Modifications Due to COVID-19 Pandemic
The Company has granted a range of commercial and consumer loan accommodations, predominantly in the form of payment deferrals, to provide relief to borrowers experiencing financial hardship due to the COVID-19 pandemic. For COVID-19 related loan modifications, which occurred between March 1, 2020 through January 1, 2022, that have met the loan modification criteria under Section 4013 of the CARES Act, as amended by the Consolidated Appropriations Act, 2021, or under the Interagency Statement on Loan Modifications and Reporting for Financial Institutions Working with Customers Affected by the Coronavirus (Revised), the Company elected to temporarily suspend TDR accounting under ASC Subtopic 310-40, Receivables — Troubled Debt Restructurings by Creditors. As of September 30, 2022, COVID-19 loans under payment deferral and forbearance programs totaled $42.4 million, or 0.1% of total loans, compared with $363.1 million, or 0.9% of total loans as of December 31, 2021. Loans that have exited the modification program were substantially all current as of September 30, 2022.
Allowance for Credit Losses
ASU 2016-13, Credit Losses (Topic 326): Measurement of Credit Losses on Financial Instruments requires the measurement of the allowance for credit losses to be based on management’s best estimate of lifetime expected credit losses inherent in the Company’s relevant financial assets. The allowance for credit losses estimate uses various models and estimation techniques based on historical loss experience, current borrower characteristics, current conditions, reasonable and supportable forecasts, and other relevant factors.
In addition to the allowance for loan losses, the Company maintains an allowance for unfunded credit commitments. The Company has three general areas for which it provides the allowance for unfunded credit commitments: (1) recourse obligations for loans sold, (2) letters of credit, and (3) unfunded lending commitments. The Company’s methodology for determining the allowance calculation for unfunded lending commitments uses the lifetime loss rates of the on-balance sheet commitment. Recourse obligations for loans sold and letters of credit use the weighted loss rates for the applicable segment of the individual credit.
In the case of loans and securities, allowance for credit losses are contra-asset valuation accounts that are deducted from the amortized cost basis of these assets to present the net amount expected to be collected. In the case of unfunded credit commitments, the allowance for credit losses is a liability account that is reported as a component of Accrued expenses and other liabilities in our Consolidated Balance Sheet.
The Company is committed to maintaining the allowance for credit losses at a level that is commensurate with thesufficient to provide appropriate reserves to absorb estimated inherentfuture credit losses in the loan portfolio, including unfunded credit facilities. While the Company believes that the allowance for credit losses as of September 30, 2022 was appropriate to absorb losses inherent in the loan portfolio and in unfunded credit commitments basedaccordance with GAAP. For additional information on the information available, future allowance levels may increase or decrease based on a variety of factors, including but not limited to, accounting standard and regulatory changes, loan growth, portfolio performance and general economic conditions. This evaluation is inherently subjective as it requires numerous estimates and judgements. For a description of the policies, methodologies and judgments used to determine the allowance for credit losses, see Item 7. MD&A — Critical Accounting Estimates and Item 8. Financial Statements — Note 1 — Summary of Significant Accounting Policies to the Consolidated Financial Statements in the Company’s 20212022 Form 10-K, and Note 7—Loans Receivable and Allowance for Credit Losses to the Consolidated Financial Statements in this Form 10-Q.
The following table presents an allocation of the allowance for loan losses by loan portfolio segments and unfunded credit commitments as of SeptemberJune 30, 20222023 and December 31, 2021:2022:
| | | ($ in thousands) | | September 30, 2022 | | December 31, 2021 | |
| | June 30, 2023 | | December 31, 2022 | |
| ($ in thousands) | ($ in thousands) | | Allowance
Allocation | | % of Loan Type to Total Loans | | Allowance
Allocation | | % of Loan Type to Total Loans | ($ in thousands) | | Allowance Allocation | | % of Loan Type to Total Loans | | Allowance Allocation | | % of Loan Type to Total Loans | |
| | | | | | | | Allowance for loan losses | | | | | | | | | |
| Commercial: | Commercial: | | Commercial: | | |
| C&I | C&I | | $ | 371,749 | | | 33 | % | | $ | 338,252 | | | 34 | % | C&I | | $ | 375,333 | | | 31 | % | | $ | 371,700 | | | 33 | % | |
| CRE: | CRE: | | CRE: | | |
| CRE | CRE | | 145,301 | | | 29 | % | | 150,940 | | | 29 | % | CRE | | 168,505 | | | 29 | % | | 149,864 | | | 29 | % | |
| Multifamily residential | Multifamily residential | | 25,680 | | | 10 | % | | 14,400 | | | 9 | % | Multifamily residential | | 22,938 | | | 9 | % | | 23,373 | | | 10 | % | |
| Construction and land | Construction and land | | 7,506 | | | 1 | % | | 15,468 | | | 1 | % | Construction and land | | 11,325 | | | 2 | % | | 9,109 | | | 1 | % | |
| Total CRE | Total CRE | | 178,487 | | | 40 | % | | 180,808 | | | 39 | % | Total CRE | | 202,768 | | | 40 | % | | 182,346 | | | 40 | % | |
| Total commercial | Total commercial | | 550,236 | | | 73 | % | | 519,060 | | | 73 | % | Total commercial | | 578,101 | | | 71 | % | | 554,046 | | | 73 | % | |
| Consumer: | Consumer: | | | | | | | | | Consumer: | | | | | | | | | |
| Residential mortgage: | Residential mortgage: | | Residential mortgage: | | |
| Single-family residential | Single-family residential | | 27,263 | | | 23 | % | | 17,160 | | | 22 | % | Single-family residential | | 51,513 | | | 25 | % | | 35,564 | | | 23 | % | |
| HELOCs | HELOCs | | 3,324 | | | 4 | % | | 3,435 | | | 5 | % | HELOCs | | 4,526 | | | 4 | % | | 4,475 | | | 4 | % | |
| Total residential mortgage | Total residential mortgage | | 30,587 | | | 27 | % | | 20,595 | | | 27 | % | Total residential mortgage | | 56,039 | | | 29 | % | | 40,039 | | | 27 | % | |
| Other consumer | Other consumer | | 1,694 | | | 0 | % | | 1,924 | | | 0 | % | Other consumer | | 1,260 | | | 0 | % | | 1,560 | | | 0 | % | |
| Total consumer | Total consumer | | 32,281 | | | 27 | % | | 22,519 | | | 27 | % | Total consumer | | 57,299 | | | 29 | % | | 41,599 | | | 27 | % | |
| Total allowance for loan losses | Total allowance for loan losses | | $ | 582,517 | | | 100 | % | | $ | 541,579 | | | 100 | % | Total allowance for loan losses | | $ | 635,400 | | | 100 | % | | $ | 595,645 | | | 100 | % | |
| Allowance for unfunded credit commitments | Allowance for unfunded credit commitments | | $ | 24,041 | | | | | $ | 27,514 | | | | Allowance for unfunded credit commitments | | $ | 29,728 | | | | | $ | 26,264 | | | | |
| Total allowance for credit losses | Total allowance for credit losses | | $ | 606,558 | | | $ | 569,093 | | | Total allowance for credit losses | | $ | 665,128 | | | $ | 621,909 | | | |
| | Loans held-for-investment | Loans held-for-investment | | $ | 47,442,255 | | | $ | 41,693,781 | | | Loans held-for-investment | | $ | 49,828,364 | | | $ | 48,202,430 | | | |
| Allowance for loan losses to loans held-for-investment | Allowance for loan losses to loans held-for-investment | | 1.23 | % | | 1.30 | % | | Allowance for loan losses to loans held-for-investment | | 1.28 | % | | 1.24 | % | | |
| | | Three Months Ended September 30, | | Nine Months Ended September 30, | | Three Months Ended June 30, | | Six Months Ended June 30, | |
| | 2022 | | 2021 | | 2022 | | 2021 | | 2023 | | 2022 | | 2023 | | 2022 | |
| Average loans held-for-investment | Average loans held-for-investment | | $ | 46,845,030 | | | $ | 39,959,972 | | | $ | 44,544,863 | | | $ | 39,441,410 | | Average loans held-for-investment | | $ | 48,849,453 | | | $ | 44,625,760 | | | $ | 48,498,735 | | | $ | 43,375,718 | | |
| | Annualized net charge-offs (recoveries) to average loans held-for-investment | | Annualized net charge-offs (recoveries) to average loans held-for-investment | | 0.06 | % | | (0.06) | % | | 0.03 | % | | 0.01 | % | |
| | Annualized net charge-offs to average loans held-for-investment | | 0.06 | % | | 0.13 | % | | 0.02 | % | | 0.14 | % | |
| |
The allowance for loan losses was $582.5 million asSecond quarter of September 30, 2022, an increase of $40.9 million from $541.6 million as of December 31, 2021, primarily reflecting of our current macroeconomic outlook and loan growth. Third quarter 20222023 net charge-offs were $6.6$7.5 million, or annualized 0.06% of average loans held-for-investment, compared with net charge-offsrecoveries of $13.5$6.6 million, or annualized 0.13%0.06% of average loans held-for-investment for the thirdsecond quarter of 2021. The decrease in net charge-offs for the third quarter2022. First half of 2022 compared with the same period in 2021 was primarily due to a decrease in CRE charge-offs, partially offset by increases in multifamily residential and C&I charge-offs. In the first nine months of 2022,2023 net charge-offs were $8.3$8.1 million or annualized 0.02%0.03% of average loans held-for investment,held-for-investment, compared with $40.2$1.7 million or annualized 0.14%0.01% of average loans held-for-investment for the first nine monthshalf of 2021.2022. The decreaseincrease in net charge-offs forin the second quarter of 2023 was primarily driven by higher losses in our C&I portfolio. The increase in net charge-offs in the first nine monthshalf of 2022, compared with the same period2023 was primarily driven by lower recoveries in 2021, was mainly due to a decrease in CRE charge-offs and an increase inour C&I recoveries.
The Company considers multiple economic scenarios to develop the estimate of the allowance for loan losses. The scenarios may consist of a baseline forecast representing management's view of the most likely outcome, and downside or upside scenarios reflecting possible worsening or improving economic conditions. As of September 30, 2022, the Company assigned a lower weighting to its downside scenario and higher weightings to the baseline and upside scenarios, compared with the weightings assigned as of December 31, 2021. The current forecast as of September 30, 2022 incorporates an updated impact of high inflation, lower than previously expected annual Gross Domestic Product (“GDP”) growth, rising interest rates, and continued global oil and supply chain issues caused by the Russian invasion of Ukraine. Macroeconomic assumptions underlying the baseline forecast include annual GDP growth of 1.6% and 1.4% for 2022 and 2023, respectively, and the unemployment rate to average 3.7% and 3.9% for 2022 and 2023, respectively. The downside scenario assumed annual GDP growth of 1.5% in 2022 dropping to a 2.0% decline for 2023, and the unemployment rate to rise from a 4.2% average for 2022 to a 7.3% average for 2023. The upside scenario assumed annual GDP growth of 1.9% and 4.1% for 2022 and 2023, respectively, and the unemployment rate to improve from an average of 3.6% for 2022 to 3.3% for 2023.
As of September 30, 2022 and December 31, 2021, PPP loans outstanding were $110.9 million and $534.2 million, respectively. Because these loans are fully guaranteed by the Small Business Administration, there was no allowance for loan losses established for these loans as of September 30, 2022 and December 31, 2021.portfolio.
The allowance for unfunded credit commitments was $24.0 million as of September 30, 2022, compared with $27.5 million as of December 31, 2021.
Liquidity Risk Management
Liquidity
Liquidity is a financial institution’s capacityrisk arises from the Company’s inability to meet its customer deposit withdrawals and obligations to other counterparties as they come due, or to obtain adequate funding at a reasonable cost to meet those obligations. Liquidity risk also considers the stability of deposits. The objective of liquidity management is to manage the potential mismatch of asset and liability cash flows. Maintaining an adequate level of liquidity depends on the institution’s ability to efficiently meet both expected and unexpected cash flows,flow and collateral needs without adversely affecting daily operations or the financial condition of the institution. To achieve this objective, the Company analyzes its liquidity risk, maintains readily available liquid assets, and utilizes diverse funding sources including its stable core deposit base.
The Board of Directors’ Risk Oversight Committee has primary oversight responsibility over liquidity risk management. At the management level, the Company’s Asset/Liability Committee (“ALCO”) establishes the liquidity guidelines that govern the day-to-day active management of the Company’s liquidity position by requiring sufficient asset-based liquidity to cover potential funding requirements and avoid over-dependence on volatile, less reliable funding markets. These guidelines are established and monitored for both the Bank and East West on a stand-alone basis to ensure that the Company can serve as a source of strength for its subsidiaries. The ALCO regularly monitors the Company’s liquidity status and related management processes, providingand provides regular reports to the Board of Directors. The Company’s liquidity management practices have been effective under normal operating and stressed market conditions.
Liquidity Risk — Liquidity Sources. The Company’s primary source of funding is from deposits generated by its banking business, which arewe believe is a relatively stable and low-cost. Totallow-cost source of funding. Our loans are funded by deposits, which amounted to $53.86$55.66 billion as of SeptemberJune 30, 2022,2023, compared with $53.35$55.97 billion as of December 31, 2021.2022. The Company’s loan-to-deposit ratio was 88%90% as of SeptemberJune 30, 2022,2023, compared with 78%86% as of December 31, 2021.2022.
In addition to deposits, the Company has access to various sources of wholesale financing, including borrowing capacity with the FHLB and Federal Reserve Bank of San Francisco (“FRBSF”), such as under the BTFP, unsecured federal funds lines of credit with various correspondent banks, and several master repurchase agreements with major brokerage companies to sustain an adequate liquid asset portfolio, meet daily cash demands and allow management flexibility to execute its business strategy. EconomicHowever, general financial market and economic conditions and the stability of capital marketscould impact the Company’sour access to and the cost of wholesale financing. Theexternal funding. Additionally, the Company’s access to capital markets is also affected by the ratings received from various credit rating agencies. As of September 30, 2022, the Company had available borrowing capacity of $20.51 billion. The available borrowing capacity included $10.88 billion with the FHLB, $2.17 billion with the FRBSF, unsecured federal funds lines of credit with correspondent banks of $936.0 million, and borrowing capacity from unpledged debt securities of $6.52 billion.
Unencumbered loans and/or debt securities were pledged to the FHLB, and the FRBSF discount window, and the FRBSF BTFP as collateral. The Company has established operational procedures to enable borrowing against these assets, including regular monitoring of the total pool of loans and debt securities eligible as collateral. Eligibility of collateral is defined in guidelines from the FHLB and FRBSF and is subject to change at their discretion. The Company believes that its liquidity sources are sufficient to meet all reasonably foreseeable short-term needs. See Item 2 — MD&A — Balance Sheet Analysis — Deposits and Other Sources of Funding in this Form 10-Q for further detaildetails related to the Company’s funding sources. The Company believes its cash and cash equivalents and available borrowing capacity described below provide sufficient liquidity above its expected cash needs.
The Company maintains a certain levelits source of liquid assetsliquidity in the form of cash and cash equivalents interest-bearing depositsand borrowing capacity with banks, short-term resale agreementsits eligible loans and unencumbered high-quality and liquid AFS debt securities.securities as collateral. The following table presents the Company’s liquid assetstotal cash and cash equivalents and borrowing capacity as of SeptemberJune 30, 20222023 and December 31, 2021:2022:
| | | | | | | | | | | | | | | | | | | | | | | | | | | | | | | | | | | | | | |
|
| ($ in thousands) | | September 30, 2022 | | December 31, 2021 |
| Encumbered | | Unencumbered | | Total | | Encumbered | | Unencumbered | | Total |
| Cash and cash equivalents | | $ | — | | | $ | 2,163,353 | | | $ | 2,163,353 | | | $ | — | | | $ | 3,912,935 | | | $ | 3,912,935 | |
| Interest-bearing deposits with banks | | — | | | 630,543 | | | 630,543 | | | — | | | 736,492 | | | 736,492 | |
| Resale agreements due to mature in one year | | — | | | 407,986 | | | 407,986 | | | — | | | 1,818,503 | | | 1,818,503 | |
| AFS debt securities: | | | | | | | | | | | | |
| U.S. Treasury, and U.S. government agency and U.S. government-sponsored enterprise debt securities | | 273,735 | | | 587,366 | | | 861,101 | | | 384,895 | | | 1,949,757 | | | 2,334,652 | |
| U.S. government agency and U.S. government-sponsored enterprise mortgage-backed securities | | 189,722 | | | 2,125,592 | | | 2,315,314 | | | 418,761 | | | 3,738,502 | | | 4,157,263 | |
| Foreign government bonds | | — | | | 225,810 | | | 225,810 | | | — | | | 257,733 | | | 257,733 | |
| Municipal securities | | — | | | 249,502 | | | 249,502 | | | — | | | 523,158 | | | 523,158 | |
| Non-agency mortgage-backed securities, asset-backed securities and CLOs | | 181 | | | 1,724,617 | | | 1,724,798 | | | 240 | | | 2,042,642 | | | 2,042,882 | |
| Corporate debt securities | | — | | | 529,565 | | | 529,565 | | | — | | | 649,665 | | | 649,665 | |
| Total | | $ | 463,638 | | | $ | 8,644,334 | | | $ | 9,107,972 | | | $ | 803,896 | | | $ | 15,629,387 | | | $ | 16,433,283 | |
|
| | | | | | | | | | | | | | | | | | | | | | | | | | |
| | | | |
| | | | | | Change |
| ($ in thousands) | | June 30, 2023 | | December 31, 2022 | | $ | | % |
| Cash and cash equivalents | | $ | 6,377,887 | | | $ | 3,481,784 | | | $ | 2,896,103 | | | 83 | % |
| Interest-bearing deposits with banks | | 17,169 | | | 139,021 | | | (121,852) | | | (88) | % |
| | | | | | | | |
| Borrowing capacity: | | | | | | | | |
| FHLB | | 12,846,387 | | | 12,773,996 | | | 72,391 | | | 1 | % |
| FRBSF | | 8,370,223 | | | 2,049,048 | | | 6,321,175 | | | 308 | % |
| Unpledged available securities | | 1,611,319 | | | 6,939,591 | | | (5,328,272) | | | (77) | % |
| Federal funds facility | | 941,000 | | | 1,136,000 | | | (195,000) | | | (17) | % |
| | | | | | | | |
| | | | | | | | |
| | | | | | | | |
| | | | | | | | |
| | | | | | | | |
| | | | | | | | |
| | | | | | | | |
| | | | | | | | |
| | | | | | | | |
| | | | | | | | |
| | | | | | | | |
| Total | | $ | 30,163,985 | | | $ | 26,519,440 | | | $ | 3,644,545 | | | 14 | % |
| | | | |
Unencumbered liquid assetsThe Company’s total cash and cash equivalents and borrowing capacity totaled $8.64$30.16 billion as of SeptemberJune 30, 2022,2023, compared with $15.63$26.52 billion as of December 31, 2021. AFS debt securities, included as part of liquidity sources, consist of high quality and liquid securities with moderate durations to minimize overall interest rate and liquidity risks.2022. The Company believes these AFS debt securities provide quick sources of liquidity to obtain financing, regardless of market conditions, through sale or pledging. The decrease in liquid assetsincrease was primarily related to an increase in collateral available at the transfer of $3.01 billion of debt securities from AFS to HTM during the first quarter of 2022, a decreaseFRBSF and an increase in cash and cash equivalents, drivenwhich was funded by loan funding activities, a decreaseborrowings from the BTFP in resale agreements primarily due to repayments, and a decrease in fair valuethe first quarter of AFS debt securities primarily due to interest rate increases.
Management believes that2023. The BTFP was secured by pledged securities. The BTFP borrowings reflected the Company’s excess cash, unencumbered AFS debt securities, borrowing capacityconservative liquidity management practices and accesswere a cautionary measure in response to sufficient sources of capital are adequate to meet its short- and long-term liquidity needsthe volatility in the foreseeable future. In addition,banking industry earlier in the Company may use debt and equity issuances when costs are deemed attractive, should longer term needs arise.year.
Liquidity Risk — Cash Requirements. In the ordinary course of the Company’s business, the Company enters into contractual obligations that require future cash payments, including funding for customer deposit withdrawals, repayments for short- and long-term borrowings, leases obligations and other cash commitments. For additional information on these obligations, see Note 9 — Deposits to the Consolidated Financial Statements in the Company’s 2022 Form 10-K, and Note 4 — Assets Purchased under Resale Agreements and Sold under Repurchase Agreements, Note 8 — Investments in Qualified Affordable Housing Partnerships, Tax Credit and Other Investments, Net and Variable Interest Entities and Note 10— Short-Term Borrowings and Long-Term Debt to the Consolidated Financial Statements in this Form 10-Q.
The Company also has off-balance sheet arrangements which represent transactions that are not recorded on the Consolidated Balance Sheet. The Company’s off-balance sheet arrangements include (1) commitments to extend credit, such as loan commitments, commercial letters of credit for foreign and domestic trade, standby letters of credit (“SBLCs”), and financial guarantees, to meet the financing needs of its customers, (2) future interest obligations related to customer deposits and the Company’s borrowings, and (3) transactions with unconsolidated entities that provide financing, liquidity, market risk or credit risk support to the Company, or engage in leasing, hedging or research and development services with the Company. SinceBecause many of these commitments are expected to expire without being drawn upon, the total commitment amounts do not necessarily represent future funding requirements. The Company does not expect the total commitment amounts as of June 30, 2023 to have a material current or future impact on the Company’s financial conditions or results of operations. Information about the Company’s loan commitments, commercial letters of credit and SBLCs is provided in Note 1011 — Commitments and Contingencies to the Consolidated Financial Statements in this Form 10-Q. The Company’s liquidity sources have been, and are expected to be, sufficient to meet all such cash requirements.
The Consolidated Statement of Cash Flows summarizes the Company’s sources and uses of cash by type of activitiesactivity for the first ninesix months of 2022ended June 30, 2023 and 2021.2022. Excess cash generated by operating and investing activities may be used to repay outstanding debt or invest in liquid assets.
Liquidity Risk — Liquidity for East West. In addition to bank level liquidity management, the Company manages liquidity at the parent company level for various operating needs including payment of dividends, repurchases of common stock, principal and interest payments on its borrowings, acquisitions and additional investments in its subsidiaries. East West’s primary source of liquidity is from cash dividends distributed by its subsidiary, East West Bank. The Bank is subject to various statutory and regulatory restrictions on its ability to pay dividends as discussed in Item 1. Business — Supervision and Regulation — Dividends and Other Transfers of Funds ofin the Company’s 20212022 Form 10-K. East West held $226.5$253.9 million and $345.0$228.5 million in cash and cash equivalents as of SeptemberJune 30, 20222023 and December 31, 2021,2022, respectively. Management believes that East West has sufficient cash and cash equivalents to meet the projected cash obligations for the currentcoming year.
Liquidity Risk — Liquidity Stress Testing. The Company utilizes liquidity stress analysis to determine the appropriate amounts of liquidity to maintain at the Company, foreign subsidiary and foreign branch levels needed to meet contractual and contingent cash outflows under a range of scenarios. Scenario analyses include assumptions about significant changes in key funding sources, market triggers, potential uses of funding and economic conditions in certain countries. In addition, Company specificCompany-specific events are incorporated into the stress testing. For example, based on the Company’s analysis of the banking industry disruption in the first half of 2023, deposit runoffs were assumed to be more front-loaded to trigger earlier remediation actions. Liquidity stress tests are conducted to ascertain potential mismatches between liquidity sources and uses over a variety of time horizons, both immediate and longer term, and over a variety of stressed conditions. Given the range of potential stresses, the Company maintains contingency funding plans on a consolidated basis and for individual entities.
As of SeptemberJune 30, 2022,2023, the Company was not aware of any material commitments for capital expenditures in the foreseeable future and believes it has adequate liquidity resources to conduct operations and meet other needs in the ordinary course of business.business, and is not aware of any events that are reasonably likely to have a material adverse effect on its liquidity, capital resources or operations. Given the uncertaintyuncertain and the rapidly changing market and economic conditions, the Company will continue to actively evaluate the impact on its business and financial position. For more informationdetails on how economic conditions may impact our liquidity, see Item 1A. Risk Factors ofin the Company’s 20212022 Form 10-K.
Market Risk Management
Market risk isrefers to the risk that the Company’s financial condition may change resulting fromof potential loss due to adverse movements in market rates or prices,risk factors, including interest rates, foreign exchange rates, commodity prices, and credit spreads. The Company is primarily exposed to interest rate contracts prices, investment securities prices, credit spreads,risk through its core business activities of extending loans and relatedacquiring deposits. There have been no significant changes in our risk due to mismatchesmanagement practices as described in rate sensitive assets and liabilities. In the event of market stress, the risk could have a material impact onItem 7. MD&A — Market Risk Management in the Company’s results of operations and financial condition.
The Board’s Risk Oversight Committee has primary oversight responsibility over market risk management. At the management level, the ALCO establishes and monitors compliance with the policies and risk limits pertaining to market risk management activities. Corporate Treasury supports the ALCO in measuring, monitoring, and managing interest rate risk as well as all other market risks.
Interest Rate Risk Management
Interest rate risk results primarily fromis the Company’s traditional banking activities of gathering deposits and extending loans, which are the primary areas ofrisk that market risk for the Company. Economic and financial conditions, movements in interest rates, and consumer preferences impact the level of noninterest-bearing funding sources at the Company, as well as affect the difference between the interest the Company earns on interest-earning assets and pays on interest-bearing liabilities. In addition, changesfluctuations in interest rates can influencehave a negative impact on the Company’s earnings and capital stemming from mismatches in the Company’s asset and liability cash flows primarily arising from customer-related activities such as lending and deposit-taking. The Company is subject to interest rate of principal prepayments on loansrisk because:
•Assets and liabilities may mature or reprice at different times. If assets reprice faster than liabilities and interest rates are generally rising, earnings will initially increase;
•Assets and liabilities may reprice at the speed of deposit withdrawals. Due to the pricing term mismatchessame time but by different amounts;
•Short- and the embedded options inherent in certain products, changes inlong-term market interest rates may change by different amounts. For example, the shape of the yield curve may affect not only the expected near-term earnings, but alsoyield of new loans and funding costs differently;
•The remaining maturity of various assets or liabilities may shorten or lengthen as interest rates change. For example, if long-term mortgage interest rates increase sharply, mortgage-related products may pay down at a slower rate than anticipated, which could impact portfolio income and valuation; or
•Interest rates may have a direct or indirect effect on loan demand, collateral values, mortgage origination volume, and the economicfair value of these interest-earning assets and interest-bearing liabilities. Other market risks include foreign currency exchange risk and equity price risk. These risks are not considered significant to the Company and no separate quantitative information concerning these risks is presented herein.other financial instruments.
Under the oversight of the Company’s Board of Directors, theThe ALCO coordinates the overall management of the Company’s interest rate risk. The ALCOrisk, meets regularly and is responsible for reviewingto review the Company’s open market positions and establishingestablishes policies to monitor and limit exposuresexposure to market risk. Management of interestInterest rate risk management is carried out primarily through strategies involving the Company’s loan portfolio, debt securities portfolio, loan portfolio, available funding channels and capital market activities. In addition, the Company’s policies permit the use of derivative instruments to assist in managing interest rate risk.
The interestInterest rate risk exposure is measured and monitored through various risk management tools, which include a simulation model that performs interest rate sensitivity analyses under variousmultiple interest rate scenarios.scenarios against a baseline. The simulation model incorporates the Company’s cash instruments, loans, debt securities, resale agreements, deposits, borrowingsmarket’s forward rate expectations and repurchase agreements, as well as financial instruments from the Company’s foreign operations. The Company uses both a static balance sheetearning assets and a forward growth balance sheet to perform the interest rate sensitivity analyses. The simulated interest rate scenarios include an instantaneous non-parallel shift in the yield curve and a gradual non-parallel shift in the yield curve (“rate ramp”) over a static balance sheet. In addition, the Company also performs simulations using other alternative interest rate scenarios, including various permutations of the yield curve flattening, steepening or inverting. Results of these various simulations are used to formulate and gauge strategies to achieve a desired risk profile within the Company’s capital and liquidity guidelines.
liabilities. The net interest income simulation model is based on the actual maturity and repricing characteristics of the Company’s interest-rateinterest rate sensitive assets, liabilities, and related derivative contracts. It also incorporates various assumptions, which management believes to be reasonable but may have a significant impact on the results. These assumptions include, but are not limited to, the timing and magnitude of changes in interest rates, the yield curve evolution and shape, the correlation between various interest rate indices, financial instruments’ future repricing characteristics and spread relative to benchmark rates, and the effect of interest rate floors and caps. The modeled results are highly sensitive to deposit decay and deposit beta assumptions, which are derived from a regression analysis of the Company’s historical deposit data. The Company used full- through-the-economic-cycle betas with each incremental rate increase in the rate ramp scenarios, and did not assume lags in repricing. Deposit beta commonly refers to the correlation of the changes in interest rates paid on deposits to changes in the benchmark interest rates. The model is also sensitive to the loan and investment prepayment assumptions that are based on an independent model and the Company’s historical prepayment data, which consider anticipated prepayments under different interest rate environments.
Simulation results are highly dependent on input assumptions. To the extent the actual behavior is different from the assumptions used in the models, there could be material changes in interest rate sensitivity results. The assumptions applied in the model are documented, supported, and periodically back-tested to assess the reasonableness and effectiveness. The Company makes appropriate calibrationsFor a more detailed discussion of the Company’s interest income simulation model, refer to Item 7. MD&A — Market Risk Management in the model as needed and continually validates the model, methodology and results. Changes to key model assumptions are reviewed by the ALCO. Scenario results do not reflect strategies that the management could employ to limit the impact of changing interest rate expectations.Company’s 2022 Form 10-K.
In March 2022, theThe Federal Reserve raisedcontinued its aggressive response to inflation by incrementally raising the target range for the fed funds rate to 0.25% to 0.50% to address concerns about inflation, which reflected supply and demand imbalances due toduring the pandemic, higher energy prices, and broader price pressures. Thefirst half of 2023. On July 26, 2023 the Federal Reserve has continued its aggressive approach in responding to inflation and raised the target rate range for the fed funds rate to 3.75%5.25% to 4.00% on November 2, 2022. The market estimates that interest rates are likely to continue to rise, potentially reaching 4.25% to 4.5% by the end of 2022.5.50%.
Twelve-Month Net Interest Income Simulation
Net interest income simulation modeling measures interest rate risk through earnings volatility. The simulation projects the cash flow changes in interest rate sensitive assets and liabilities, expressed in terms of net interest income, over a specified time horizon for defined interest rate scenarios. Net interest income simulations provide insight into the impact of market ratesrate changes on earnings, which help guide risk management decisions. The Company assesses interest rate risk by comparing the changes of net interest income in different interest rate scenarios.
The following table presents the Company’s net interest income sensitivity related to an instantaneous and sustained non-parallel shift in market interest rates by 100 and 200 bps as of SeptemberJune 30, 20222023 and December 31, 2021,2022, based on a static balance sheet as of the date of the analysis.
| | | | | | | | | | | | | | | | | | |
|
Change in Interest Rates
(in bps) | | Net Interest Income Volatility (1) | | |
| September 30, 2022 | | December 31, 2021 | | | | |
| +200 | | 11.7 | % | | 19.5 | % | | | | |
| +100 | | 6.0 | % | | 9.4 | % | | | | |
| -100 | | (5.2) | % | | NM | | | | |
| -200 | | (10.2) | % | | NM | | | | |
|
NM — Not meaningful. | | | | | | | | | | | | | | | | | | |
|
| | Net Interest Income Volatility (1) | | |
| Change in Interest Rates (in bps) | | June 30, 2023 | | December 31, 2022 | | | | |
| +200 | | 3.9 | % | | 11.6 | % | | | | |
| +100 | | 2.3 | % | | 5.9 | % | | | | |
| -100 | | (3.0) | % | | (5.3) | % | | | | |
| -200 | | (6.3) | % | | (8.6) | % | | | | |
|
(1)The percentage change represents net interest income change over 12 montha 12-month period in a stable interest rate environment versus in the various interest rate scenarios.
The composition of the Company’s loan portfolio creates sensitivity to interest rate movements due to the fastera mismatch of repricing ofbehavior between the floating-rate loan portfolio than theand deposit products. Growth and/or contraction in the Company’s loans, other earning assets, deposits, and borrowings may lead to changes in the sensitivity to interest rate movements. Year-to-date decreases in cash and cash equivalents, resale agreements, and short-term investments, together with growth in fixed-rate loans, as well as the interest rate hedging activities and changes in the funding mix have decreased the Company’s asset sensitivity. In the table above, net interest income volatility is expressed in relation to the base-case net interest income which increased between Septemberdecreased as of June 30, 20222023. This decrease reflected updates to the deposit repricing assumptions and December 31, 2021, duedeposit product mix. Noninterest-bearing deposit account balances are assumed to balance sheet growthbe sensitive to interest rate levels and an expanded base-case net interest margin.migrate to interest-bearing deposit accounts.
While an instantaneous and sustained non-parallel shift in market interest rates was used in the simulation model described in the preceding paragraph, theThe Company also models scenarios based on gradual shifts in interest rates and assesses the corresponding impacts. These interest rate scenarios provide additional information to estimate the Company’s underlying interest rate risk. The rate ramp table below shows the net interest income volatility under a gradual non-parallel shift of the yield curve, in even monthly increments over the first 12 months, followed by rates held constant thereafter based on a staticflat balance sheet as of the date of the analysis. Actual results will vary based on the timing and pace of interest rate changes, as well as changes in the balance sheet.
| | | | | | | | | | | | | | |
|
Change in Interest Rates
(in bps) | | Net Interest Income Volatility |
| September 30, 2022 | | December 31, 2021 |
| +200 Rate Ramp | | 5.2 | % | | 9.2 | % |
| +100 Rate Ramp | | 2.6 | % | | 4.1 | % |
| -100 Rate Ramp | | (2.2) | % | | NM |
| -200 Rate Ramp | | (4.9) | % | | NM |
|
NM — Not meaningful. | | | | | | | | | | | | | | |
|
| | Net Interest Income Volatility |
| Change in Interest Rates (in bps) | | June 30, 2023 | | December 31, 2022 |
| +200 Rate Ramp | | 1.7 | % | | 6.3 | % |
| +100 Rate Ramp | | 0.9 | % | | 3.4 | % |
| -100 Rate Ramp | | (1.1) | % | | (2.4) | % |
| -200 Rate Ramp | | (2.3) | % | | (4.9) | % |
|
As of SeptemberJune 30, 2022,2023, the Company’s net interest income profile reflects an asset sensitive position.position, where assets reprice more than liabilities. Net interest income is expected to increase when interest rates rise as the Company has a large sharepopulation of variable rate loans, in its loan portfolio, primarily linkedtied to Prime or LIBORand Term SOFR indices. The Company’s interest income is sensitive to changes in short-term interest rates. As of June 30, 2023, the Company designated interest rate contracts with a notional amount of $5.25 billion as cash flow hedges, which reduced net interest income volatility by approximately 1.6% of the base net interest income for every 100 bps change in interest rate. The Company’s deposit portfolio is primarily composed of non-maturity deposits, which are not directly tied to short-term interest rate indices, but are, nevertheless, sensitive to changes in short-term interest rates. The modeled results are highly sensitive to reinvestment yielddeposit durations, beta, deposit mix and deposit beta assumptions.other behavioral assumptions, which were derived using a combination of quantitative and qualitative approaches. Actual results may deviate from the model results in terms of net interest income growth during a period of rising interest rates will also reflectdue to earning asset growth variation and deposit mix changes based on customer preferences relative to the interest rate environment. During a period of declining interest rates, balance sheet growth could offset headwinds to net interest income from yield compression.
Economic Value of Equity at Risk
Economic value of equity (“EVE”) is a cash flow calculation that takes the present value of all asset cash flows and subtracts the present value of all liability cash flows. This calculation is used for asset/liability management and measures changes in the economic value of the bank.
The economic value approach provides a comparatively broader scope than the net interest income volatility approach since it captures all anticipatedrepresents the discounted present value of cash flows.
The EVE simulation reflectsflows over the sensitivityexpected life of the instruments. Due to this longer horizon, EVE is useful to interest rate changes across the full maturity spectrum of the Company’s assets and liabilities. It identifiesidentify risks arising from repricing, prepayment and maturity gaps between assets and liabilities on the balance sheet, as well as from off-balance sheet derivative exposures that are off-balance sheet. The simulation providesexposure, over their lifetime. This long-term economic perspective into the Bank’sCompany’s interest rate risk profile which allows the BankCompany to manageidentify anticipated negative effects of interest rate fluctuations.However, the difference in time horizons can cause the EVE analysis to diverge from the shorter term net interest income analysis presented above. Given the uncertainty of the magnitude, timing and direction of future interest rate movements, the shape of the yield curve, and potential changes to the balance sheet, actual results may vary from those predicted by the Company’s model.
The following table presents the Company’s EVE sensitivity related to an instantaneous and sustained non-parallel shift in market interest rates by 100 and 200 bps as of SeptemberJune 30, 20222023 and December 31, 2021:2022:
| | | | | | | | | | | | | | |
| | | | |
Change in Interest Rates
(in bps) | | EVE Volatility (1) |
| September 30, 2022 | | December 31, 2021 |
| +200 | | 1.0 | % | | 7.1 | % |
| +100 | | 1.0 | % | | 3.5 | % |
| -100 | | 0.0 % | | NM |
| -200 | | (0.3) | % | | NM |
| | | | |
NM — Not meaningful. | | | | | | | | | | | | | | |
| | | | |
| | EVE Volatility (1) |
| Change in Interest Rates (in bps) | | June 30, 2023 | | December 31, 2022 |
| +200 | | (8.1) | % | | (6.0) | % |
| +100 | | (3.5) | % | | (2.9) | % |
| -100 | | 1.5 | % | | 1.1 | % |
| -200 | | 3.0 | % | | 2.3 | % |
| | | | |
(1)The percentage change represents net portfolio value change of the Company in a stable interest rate environment versus in the various interest rate scenarios.
TheAs of June 30, 2023, the Company’s EVE sensitivity for the upwardis expected to decrease when interest rate scenarios decreased as of September 30, 2022, compared with the results as of December 31, 2021.rates rise. The changeschange in EVE sensitivity werewas primarily due to fasterupdated deposit decay and higher deposit betamodeling assumptions, used inwhich decreased the model, changes in the level and shapeduration of the yield curve, and lower cash balances as of September 30, 2022.
The Company’s EVE profile as of September 30, 2022 reflects an asset sensitive EVE position under the higher interest rate scenarios. Given the uncertainty of the magnitude, timing and direction of future interest rate movements, as well as the shape of the yield curve, actual results may vary from those predicted by the Company’s model.non-maturity deposit portfolio.
Derivatives
It is the Company’s policy not to speculate on the future direction of interest rates, foreign currency exchange rates and energy commodity prices. However, the Company periodically enters into derivative transactions in order to reducemanage its exposure to market risks,risk, primarily interest rate risk and foreign currency risk. The Company believes that these derivative transactions, when properly structured and managed, providesprovide a hedge against inherent risk in certain assets and liabilities or against risk in specific transactions. Hedging transactions may be implemented using a variety of derivative instruments such as swaps, forwards, options, and collars. The Company uses interest rate swaps to hedge the variability in interest received on certain floating-rate commercial loans and interest paid on certain floating-rate borrowings. Foreign exchange derivatives are used in net investment hedging strategies to mitigate the risk of changes in the U.S. dollar equivalent value of a designated monetary amount of the Company’s net investment in East West Bank (China) Limited. Prior to entering into any hedgingaccounting hedge activities, the Company analyzes the costs and benefits of the hedge in comparison to alternative strategies. The Company also repositions its hedging derivatives portfolio based on the current assessment of economic and financial conditions, including the interest rate and foreign currency environments, balance sheet composition and trends, and the relative mix of its cash and derivative positions.
In addition, the Company enters into derivative transactions in order to accommodate its customers with their business needs or to assist customers with their risk management objectives, such as managing exposure to fluctuations in interest rates, foreign currencies and energy commodity prices. To economically hedge against the derivative contracts entered into with the Company’s customers, the Company enters into mirroredoffsetting derivative contracts with third-party financial institutions.institutions, some of which are cleared through central clearing organizations. The exposures from derivative transactions are collateralized by cash and/or eligible securities based on limits as set forth in the respective agreements entered between the Company and counterparty financial institutions. The changes in fair values of the derivative contracts traded with third-party financial institutions are expected to be largely comparable to the changes in fair values of the derivative transactions executed with customers throughout the terms of these contracts, except for the credit valuation adjustment component in the contracts and the spread variances between the customer derivatives and the offsetting financial counterparty positions. The Company also utilizes foreign exchange contracts that are not designated as hedging instruments to mitigate the economic effect of fluctuations in certain foreign currency on-balance sheet assets and liabilities, primarily foreign currency denominated deposits offered to its customers.
The Company is subject to credit risk associated with the counterparties to the derivative contracts. This counterparty credit risk is a multi-dimensional form of risk, affected by both the exposure and credit quality of the counterparty, both of which are sensitive to market-induced changes. The Company’s Credit Risk Management Committee provides oversight of credit risksrisk and the Company has guidelines in place to manage counterparty concentration, tenor limits, and collateral. The Company manages the credit risk of its derivative exposurespositions by diversifying its positions among various counterparties, by entering into legally enforceable master netting arrangements,agreements, and by requiring collateral arrangements, where possible. The Company may also transfer counterparty credit risk related to interest rate swaps to third-party financial institutionsinstitutional third-parties through the use of credit risk participation agreements. Certain derivative contracts are required to be centrally cleared through central clearinghouses, whichto further mitigatesmitigate counterparty credit risk. Therisk, where variation margin is applied daily as settlement to the fair value of the derivative contracts. In addition, the Company incorporates credit value adjustments and other market standard methodologies to appropriately reflect its own nonperformance riskthe counterparty’s and the respective counterparty’sCompany’s own nonperformance risk in the fair value measurementsmeasurement of its derivatives. As of June 30, 2023, the Company anticipates performance by its counterparties and has not incurred any related credit losses.
The following table summarizes certain information abouton derivative financial instruments designated as accounting hedges and utilized by the Company in its management of interest rate risk and foreign currency risk as of SeptemberJune 30, 20222023 and December 31, 2021:2022:
| | | | | | | | | | | | | | | | | | | | | | | | | | |
|
| | September 30, 2022 | | December 31, 2021 |
| ($ in thousands) | | Interest Rate Contracts | | Foreign Exchange Contracts | | Interest Rate Contracts | | Foreign Exchange Contracts |
| Derivatives designated as hedging instruments: | | Cash Flow
Hedges | | Net Investment Hedges | | Cash Flow
Hedges | | Net Investment Hedges |
| Notional amounts | | $ | 2,525,000 | | | $ | 84,832 | | | $ | 275,000 | | | $ | 86,531 | |
| Fair value: | | | | | | | | |
| Recognized as an asset | | 533 | | | 7,107 | | | — | | | — | |
| Recognized as a liability | | 24,679 | | | — | | | 57 | | | 225 | |
| Net fair value | | $ | (24,146) | | | $ | 7,107 | | | $ | (57) | | | $ | (225) | |
| Weighted-average interest rates: | | | | | | | | |
| Variable-rate borrowings — Pay fixed (receive floating) | | 0.483%
(3-month USD-LIBOR) | | NA | | 0.483%
(3-month USD-LIBOR) | | NA |
| Variable-rate loans — Receive fixed (pay floating) | | 1.09%
(1-month USD-LIBOR) | | NA | | NA | | NA |
| Variable-rate loans — Receive fixed (pay floating) | | 6.475%
(USD-PRIME) | | NA | | NA | | NA |
| Variable-rate loans — Sell cap-buy floor (floating rate ) | | 4.575%-1.500%
(1-month USD-SOFR) | | NA | | NA | | NA |
| Weighted-average remaining term to maturity (in months): | | 39.6 | | | 5.7 | | | 13.9 | | | 2.7 | |
| Derivatives not designated as hedging instruments: | | Interest Rate Contracts | | Foreign Exchange Contracts | | Interest Rate Contracts | | Foreign Exchange Contracts |
| Notional amounts | | $ | 17,261,862 | | | $ | 2,762,150 | | | $ | 17,575,420 | | | $ | 1,874,681 | |
| Fair value: | | | | | | | | |
| Recognized as an asset | | 429,505 | | 74,767 | | 240,222 | | 21,033 |
| Recognized as a liability | | 590,648 | | 64,049 | | 179,905 | | 15,276 |
| Net fair value | | $ | (161,143) | | | $ | 10,718 | | | $ | 60,317 | | | $ | 5,757 | |
|
| | | | | | | | | | | | | | | | | | | | | | | | | | |
|
| | June 30, 2023 | | December 31, 2022 |
| ($ in thousands) | | Interest Rate Contracts Hedging Loans (1) | | Interest Rate Contracts Hedging Borrowings (2) | | Interest Rate Contracts Hedging Loans (1) | | Interest Rate Contracts Hedging Borrowings (2) |
| Cash flow hedges | | | | | | | | |
| Notional amount | | $ | 5,000,000 | | (3) | $ | — | | | $ | 3,000,000 | | (3) | $ | 200,000 | |
| Weighted average: | | | | | | | | |
| Receive rate | | 4.95 | % | | NA | | 4.91 | % | | 3.83 | % |
| Pay rate | | 7.10 | % | | NA | | 6.23 | % | | 0.48 | % |
| Remaining term (in months) | | 41.9 | | | NA | | 46.6 | | | 3.2 | |
| | | | | | | | |
| | | | | | | | |
| ($ in thousands) | | Foreign Exchange Contracts | | Foreign Exchange Contracts |
| Net investment hedges | | | | | | | | |
| Notional amount | | $ | 81,480 | | | | $ | 84,832 | | |
Hedged percentage (4) | | 43 | % | | | | 44 | % | | |
| Remaining term (in months) | | 8.7 | | | | | 2.6 | | | |
|
NA — Not applicable.
Derivatives Designated as Hedging Instruments (2)— Represents receive-floating/pay-fixed interest rate swaps. Floating rate received was based on three-month LIBOR. The hedge was terminated during the first quarter of 2023.
(3)Interest rate collars in notional amount of $250.0 million designated to hedge loans were not included as of both June 30, 2023 and December 31, 2022.
(4)Represents percentage between the notional of outstanding foreign exchange derivative contracts are utilized in the Company’s asset and liability management activities and serve as an efficient tool to manage the Company’s interest rate risk and foreign exchange risk. The Company uses interest rate derivatives to hedge the risk of variable cash flows in its variable interest rate borrowings, which includes repurchase agreements and FHLB advances, as well as a portion of its variable interest rate CRE loans. The Company also uses foreign exchange derivatives to hedge the risk of changes in the USD equivalent value of a designated monetary amount of the Company’s net investment in East West Bank (China) Limited. For both the cash flow and the net investment hedges, the changes in the fair value of the hedging instruments are recognized in AOCI, net of tax, on the Consolidated Balance Sheet.
The fluctuation in foreign currency translation of the hedged exposure is expected to be offset by changes in the fair value of the forward contracts. As of September 30, 2022, the outstanding foreign currency forwards effectively hedged approximately 44% of the net Chinese RenminbiRMB exposure from East West Bank (China) Limited.
Changes to the composition of the Company’s derivatives designated as hedging instruments during the first nine months of 2022 reflect actions taken for interest rate risk and foreign exchange rate risk management. The Company repositions its hedging derivatives portfolio based on the current assessment of economic and financial conditions, including the interest rate and foreign currency environments, balance sheet composition and trends, and the relative mix of its cash and derivative positions.
Derivatives Not Designated as Hedging Instruments — The Company enters into interest rate, foreign exchange and energy commodity contracts to support the business needs of its customers. When derivative transactions are executed with its customers, the derivative contracts are offset by paired trades with third-party financial institutions. The Company may enter into derivative contracts that are either exchange-traded, centrally cleared through a clearinghouse or over-the-counter. Derivative contracts entered with central clearing organizations are settled-to-market daily to the extent the central clearing organizations’ rulebook legally characterize daily payments of variation margin as a settlement.
The Company offers various interest rate derivative contracts to its customers and enters into offsetting contracts with third-party financial institutions, including central clearing organizations, to manage its interest risk. Interest rate derivative contracts allow borrowers to lock in attractive intermediate and long-term fixed rate financing while not increasing the interest rate risk to the Company. These transactions are not linked to any specific Company assets or liabilities on the Consolidated Balance Sheet, or to forecasted transactions in a hedging relationship, and are therefore classified as economic hedges. The contracts are marked-to-market at each reporting period. The changes in fair values of the derivative contracts traded with third-party financial institutions are expected to be largely comparable to the changes in fair values of the derivative transactions executed with customers throughout the terms of these contracts, except for the credit valuation adjustment component. The Company records credit valuation adjustments on derivatives to properly reflect the variances of credit worthiness between the Company and the counterparties, considering the effects of enforceable master netting agreements and collateral arrangements.
The Company enters into foreign exchange contracts with its customers to accommodate their business needs. The foreign exchange contracts include forward and spot contracts, swaps and options. To manage the foreign exchange risk and credit exposures from the contracts with its customers, the Company enters into offsetting foreign exchange contracts with third-party financial institutions and/or enters into bilateral collateral and master netting agreements with certain customer counterparties. The changes in the fair values of contracts entered with third-party financial institutions are expected to be largely comparable to the changes in fair values of the foreign exchange transactions executed with the customers throughout the terms of these contracts. As of September 30, 2022, the Company anticipates performance by all counterparties and has not experienced nonperformance by any of its counterparties, and therefore did not incur any related losses. The Company also utilizes foreign exchange contracts that are not designated as hedging instruments to mitigate the economic effect of fluctuations in certain foreign currency-denominated on-balance sheet assets and liabilities, primarily foreign currency-denominated deposits offered to its customers. The Company’s policies permit taking proprietary currency positions within approved limits, in compliance with exemptions to proprietary trading restrictions provided under Section 619 of the Dodd-Frank Wall Street Reform and Consumer Protection Act, or the Volcker Rule. The Company does not speculate in the foreign exchange markets, and actively manages its foreign exchange exposures within prescribed risk limits and defined controls.
The Company enters into energy commodity contracts with its customers to allow them to hedge against the risk of energy commodity price fluctuations. To economically hedge against the risk of fluctuation in energy commodity prices in the products offered to its customers, the Company enters into offsetting energy commodity contracts with third-party financial institutions, including central clearing organizations. The changes in fair values of the energy commodity contracts traded with third-party financial institutions are expected to be largely comparable to the changes in fair values of the energy commodity transactions executed with customers throughout the terms of these contracts.
Additional information on the Company’s derivatives is presented in Note 1 — Summary of Significant Accounting Policies — Significant Accounting Policies — Derivatives to the Consolidated Financial Statements in the Company’s 20212022 Form 10-K, and Note 3 — Fair Value Measurement and Fair Value of Financial Instruments, and Note 6 — Derivatives to the Consolidated Financial Statements in this Form 10-Q.
Critical Accounting Policies and Estimates
The Company’s significant accounting policies are described in Note 1 — Summary of Significant Accounting Policies to the Consolidated Financial Statements in the Company’s 20212022 Form 10-K. Certain of these policies include critical accounting estimates, which are subject to valuation assumptions, subjective or complex judgments about matters that are inherently uncertain, and it is likely that materially different amounts could be reported under different assumptions and conditions. The Company has procedures and processes in place to facilitate making these judgments. The following accounting policies are critical to the Company’s Consolidated Financial Statements:
•allowance for credit losses;
•fair value estimates;
•goodwill impairment; and
•income taxes.
For additional information on the Company’s critical accounting estimates involving significant judgments, see Item 7. MD&A — Critical Accounting Estimates in the Company’s 20212022 Form 10-K.
Reconciliation of GAAP to Non-GAAP Financial Measures
To supplement the Company’s unaudited interim Consolidated Financial Statements presented in accordance with U.S. GAAP, the Company uses certain non-GAAP measures of financial performance. Non-GAAP financial measures are not prepared in accordance with, or as an alternative to U.S. GAAP. Generally, a non-GAAP financial measure is a numerical measure of a company’s performance that either excludes or includes amounts, or is subject to adjustments that have such an effect, that are not normally excluded or included in the most directly comparable financial measure that is calculated and presented in accordance with U.S. GAAP. AThe non-GAAP financial measure maymeasures discussed in this Form 10-Q are return on average TCE, adjusted efficiency ratio, and tangible book value per share. Certain additional non-GAAP financial measures that are components of the foregoing non-GAAP financial measures are also be a financial metric that is not required by U.S. GAAP or other applicable requirements.set forth and reconciled in the table below. The Company believes these non-GAAP financial measures, when taken together with the corresponding U.S. GAAP financial measures, provide meaningful supplemental information regarding its performance, and allow comparability to prior periods. These non-GAAP financial measures may be different from non-GAAP financial measures used by other companies, limiting their usefulness for comparison purposes.
The following tables present the reconciliations of U.S. GAAP to non-GAAP financial measures for the third quarters and first nine months of 2022 and 2021:periods presented:
| | | ($ in thousands) | | | Three Months Ended September 30, | | Nine Months Ended September 30, | |
| | | | Three Months Ended June 30, | | Six Months Ended June 30, |
| ($ in thousands) | ($ in thousands) | | | 2022 | | | 2021 | | 2022 | | 2021 | ($ in thousands) | | 2023 | | 2022 | | 2023 | | 2022 |
| $ | 295,339 | | | | $ | 225,449 | | | $ | 791,320 | | | $ | 655,185 | | Net income | (a) | | $ | 312,031 | | | $ | 258,329 | | | $ | 634,470 | | | $ | 495,981 | |
| Add: Amortization of core deposit intangibles | Add: Amortization of core deposit intangibles | | 485 | | | | 705 | | | 1,484 | | | 2,147 | | Add: Amortization of core deposit intangibles | | 440 | | | 488 | | | 881 | | | 999 | |
| Amortization of mortgage servicing assets | Amortization of mortgage servicing assets | | 340 | | | | 430 | | | 1,096 | | | 1,264 | | Amortization of mortgage servicing assets | | 342 | | | 364 | | | 698 | | | 756 | |
Tax effect of amortization adjustments (1) | Tax effect of amortization adjustments (1) | | (237) | | | | (322) | | | (742) | | | (968) | | Tax effect of amortization adjustments (1) | | (230) | | | (245) | | | (463) | | | (505) | |
| Tangible net income | (b) | | $ | 295,927 | | | | $ | 226,262 | | | $ | 793,158 | | | $ | 657,628 | | |
| | Tangible net income (non-GAAP) | | Tangible net income (non-GAAP) | (b) | | $ | 312,583 | | | $ | 258,936 | | | $ | 635,586 | | | $ | 497,231 | |
| | Average stockholders’ equity | Average stockholders’ equity | (c) | | $ | 5,772,638 | | | | $ | 5,680,306 | | | $ | 5,765,637 | | | $ | 5,482,705 | | Average stockholders’ equity | (c) | | $ | 6,440,996 | | | $ | 5,682,427 | | | $ | 6,312,872 | | | $ | 5,762,078 | |
| Less: Average goodwill | Less: Average goodwill | | (465,697) | | | | (465,697) | | | (465,697) | | | (465,697) | | Less: Average goodwill | | (465,697) | | | (465,697) | | | (465,697) | | | (465,697) | |
Average other intangible assets (2) | Average other intangible assets (2) | | (8,379) | | | | (10,135) | | | (8,801) | | | (10,847) | | Average other intangible assets (2) | | (6,921) | | | (8,827) | | | (7,306) | | | (9,016) | |
| Average tangible equity | (d) | | $ | 5,298,562 | | | | $ | 5,204,474 | | | $ | 5,291,139 | | | $ | 5,006,161 | | |
| Average tangible book value (non-GAAP) | | Average tangible book value (non-GAAP) | (d) | | $ | 5,968,378 | | | $ | 5,207,903 | | | $ | 5,839,869 | | | $ | 5,287,365 | |
| Return on average equity (3) | (a)/(c) | | 20.30 | % | | | 15.75 | % | | 18.35 | % | | 15.98 | % | |
Tangible return on average tangible equity (3) | (b)/(d) | | 22.16 | % | | | 17.25 | % | | 20.04 | % | | 17.56 | % | |
Return on average common equity (3) | | Return on average common equity (3) | (a)/(c) | | 19.43 | % | | 18.23 | % | | 20.27 | % | | 17.36 | % |
Return on average TCE (3) (non-GAAP) | | Return on average TCE (3) (non-GAAP) | (b)/(d) | | 21.01 | % | | 19.94 | % | | 21.95 | % | | 18.96 | % |
| |
(1)Applied statutory tax rate of 28.77%29.29% for the thirdsecond quarter and first nine monthshalf of 2022.2023. Applied statutory tax rate of 28.37%28.77% for the thirdsecond quarter and first nine monthshalf of 2021.2022.
(2)Includes core deposit intangibles and mortgage servicing assets.
(3)Annualized.
| | | | | | | | Three Months Ended June 30, | | Six Months Ended June 30, |
| ($ in thousands) | ($ in thousands) | | | Three Months Ended September 30, | | Nine Months Ended September 30, | | ($ in thousands) | | | 2023 | | 2022 | | 2023 | | 2022 |
| 2022 | | | 2021 | | 2022 | | 2021 | | |
| Net interest income before provision for (reversal of) credit losses | | $ | 551,809 | | | | $ | 395,706 | | | $ | 1,440,374 | | | $ | 1,125,874 | | | |
| Net interest income before provision for credit losses | | Net interest income before provision for credit losses | (a) | | $ | 566,746 | | | $ | 472,952 | | | $ | 1,166,607 | | | $ | 888,565 | |
| Total noninterest income | Total noninterest income | | 75,552 | | | | 73,109 | | | 233,739 | | | 214,406 | | | Total noninterest income | | 78,631 | | | 78,444 | | | 138,609 | | | 158,187 | |
| Total revenue | Total revenue | (a) | | $ | 627,361 | | | | $ | 468,815 | | | $ | 1,674,113 | | | $ | 1,340,280 | | | Total revenue | (b) | | $ | 645,377 | | | $ | 551,396 | | | $ | 1,305,216 | | | $ | 1,046,752 | |
| | Noninterest income | | Noninterest income | | 78,631 | | | 78,444 | | | 138,609 | | | 158,187 | |
Add: Write-off of AFS debt security (1) | | Add: Write-off of AFS debt security (1) | | — | | | — | | | 10,000 | | | — | |
| Adjusted noninterest income (non-GAAP) | | Adjusted noninterest income (non-GAAP) | (c) | | 78,631 | | | 78,444 | | | 148,609 | | | 158,187 | |
| Adjusted revenue (non-GAAP) | | Adjusted revenue (non-GAAP) | (a)+(c)=(d) | | $ | 645,377 | | | $ | 551,396 | | | $ | 1,315,216 | | | $ | 1,046,752 | |
| Total noninterest expense | Total noninterest expense | (b) | | $ | 215,973 | | | | $ | 205,384 | | | $ | 602,283 | | | $ | 585,984 | | | Total noninterest expense | (e) | | $ | 261,789 | | | $ | 196,860 | | | $ | 480,236 | | | $ | 386,310 | |
| Less: Amortization of tax credit and other investments | Less: Amortization of tax credit and other investments | | (19,874) | | | | (38,008) | | | (48,753) | | | (90,657) | | | Less: Amortization of tax credit and other investments | | (55,914) | | | (14,979) | | | (66,024) | | | (28,879) | |
| Amortization of core deposit intangibles | Amortization of core deposit intangibles | | (485) | | | | (705) | | | (1,484) | | | (2,147) | | | Amortization of core deposit intangibles | | (440) | | | (488) | | | (881) | | | (999) | |
| | Adjusted noninterest expense | (c) | | $ | 195,614 | | | | $ | 166,671 | | | $ | 552,046 | | | $ | 493,180 | | | |
Repurchase agreements’ extinguishment cost (1) | | Repurchase agreements’ extinguishment cost (1) | | — | | | — | | | (3,872) | | | — | |
| Adjusted noninterest expense (non-GAAP) | | Adjusted noninterest expense (non-GAAP) | (f) | | $ | 205,435 | | | $ | 181,393 | | | $ | 409,459 | | | $ | 356,432 | |
| | Efficiency ratio | Efficiency ratio | (b)/(a) | | 34.43 | % | | | 43.81 | % | | 35.98 | % | | 43.72 | % | | Efficiency ratio | (e)/(b) | | 40.56 | % | | 35.70 | % | | 36.79 | % | | 36.91 | % |
| Adjusted efficiency ratio | (c)/(a) | | 31.18 | % | | | 35.55 | % | | 32.98 | % | | 36.80 | % | | |
| Adjusted efficiency ratio (non-GAAP) | | Adjusted efficiency ratio (non-GAAP) | (f)/(d) | | 31.83 | % | | 32.90 | % | | 31.13 | % | | 34.05 | % |
|
| | | | | | | | | | | | | | | | | | | |
| | |
| ($ and shares in thousands, except per share data) | | | September 30, 2022 | | December 31, 2021 | | |
| Stockholders’ equity | (a) | | $ | 5,660,668 | | | $ | 5,837,218 | | | |
| Less: Goodwill | | | (465,697) | | | (465,697) | | | |
Other intangible assets (1) | | | (8,667) | | | (9,334) | | | |
| Tangible equity | (b) | | $ | 5,186,304 | | | $ | 5,362,187 | | | |
| | | | | | | |
| | | | | | | |
| | | | | | | |
| | | | | | | |
| | | | | | | |
| | | | | | | |
| | | | | | | |
| | | | | | | |
| | | | | | | |
| Number of common shares at period-end | (c) | | 140,918 | | | 141,908 | | | |
| Book value per common share | (a)/(c) | | $ | 40.17 | | | $ | 41.13 | | | |
| Tangible equity per common share | (b)/(c) | | $ | 36.80 | | | $ | 37.79 | | | |
| | |
| | | | | | | | | | | | | | | | | | | |
| | |
| ($ and shares in thousands, except per share data) | | | June 30, 2023 | | December 31, 2022 | | |
| Stockholders’ equity | (a) | | $ | 6,461,697 | | | $ | 5,984,612 | | | |
| Less: Goodwill | | | (465,697) | | | (465,697) | | | |
Other intangible assets (1) | | | (6,418) | | | (7,998) | | | |
| Tangible book value (non-GAAP) | (b) | | $ | 5,989,582 | | | $ | 5,510,917 | | | |
| | | | | | | |
| | | | | | | |
| | | | | | | |
| | | | | | | |
| | | | | | | |
| | | | | | | |
| | | | | | | |
| | | | | | | |
| | | | | | | |
| Number of common shares at period-end | (c) | | 141,484 | | | 140,948 | | | |
| Book value per share | (a)/(c) | | $ | 45.67 | | | $ | 42.46 | | | |
| Tangible book value per share (non-GAAP) | (b)/(c) | | $ | 42.33 | | | $ | 39.10 | | | |
| | |
(1)Includes core deposit intangibles and mortgage servicing assets.
ITEM 3. QUANTITATIVE AND QUALITATIVE DISCLOSURES ABOUT MARKET RISK
For quantitative and qualitative disclosures regarding market risk in the Company’s portfolio, see Note 6 — Derivatives to the Consolidated Financial Statements in this Form 10-Q and Item 2. MD&A — Risk Management — Market Risk Management in this Form 10-Q.
ITEM 4. CONTROLS AND PROCEDURES
Disclosure Controls and Procedures
As of SeptemberJune 30, 2022,2023, pursuant to Rule 13a-15(b) of the Securities Exchange Act of 1934, as amended (the “Exchange Act”), the Company conducted an evaluation, under the supervision and with the participation of the Company’s management, including the Chief Executive Officer and Chief Financial Officer, of the effectiveness of the Company’s disclosure controls and procedures (as defined in Rule 13a-15(e) of the Exchange Act). Based upon that evaluation, the Company’s Chief Executive Officer and Chief Financial Officer concluded that the Company’s disclosure controls and procedures were effective as of SeptemberJune 30, 2022.2023.
The Company’s disclosure controls and procedures are designed to ensure that information required to be disclosed by the Company in the reports that the Company files or submits under the Exchange Act is recorded, processed, summarized, and reported within the time periods specified in the rules and forms of the SEC. The Company’s disclosure controls and procedures include, without limitation, controls and procedures designed to ensure that information required to be disclosed by the Company in the reports that the Company files under the Exchange Act is accumulated and communicated to the Company’s management, including the Chief Executive Officer and Chief Financial Officer, as appropriate, to allow timely decisions regarding required disclosure.
Change in Internal Control over Financial Reporting
There were no changes in the Company’s internal control over financial reporting (as defined in Rule 13a-15(f) of the Exchange Act) during the quarter ended SeptemberJune 30, 2022,2023, that have materially affected or are reasonably likely to materially affect the Company’s internal control over financial reporting.
PART II — OTHER INFORMATION
ITEM 1. LEGAL PROCEEDINGS
See Note 1011 — Commitments and Contingencies — Litigation to the Consolidated Financial Statements in Part I of this Form 10-Q, incorporated herein by reference.
ITEM 1A. RISK FACTORS
The Company’s 20212022 Form 10-K contains disclosure regarding the risks and uncertainties related to the Company’s business under the heading Item 1A. Risk Factors. There hashave been no material changechanges to the Company’s risk factors as presented in the Company’s 20212022 Form 10-K.10-K, except as described below:
Risks Related to Our Operations
We may be impacted by the actions, soundness or creditworthiness of other financial institutions, which can cause disruption within the industry and increase expenses. (1)
Financial services institutions are interrelated as a result of trading, clearing, counterparty, or other relationships. We execute transactions with various counterparties in the financial industry, including broker-dealers, commercial banks, and investment banks. Defaults or failures of financial services institutions and instability in the financial services industry in general can lead to market-wide liquidity problems, increased credit risk and withdrawals of uninsured deposits. The failures of Silicon Valley Bank, Signature Bank, and First Republic Bank in the first half of 2023 resulted in significant disruption in the financial services industry and negative media attention, which has also adversely impacted the volatility and market prices of the securities of financial institutions and resulted in outflows of deposits for us and many other financial institutions. These events have adversely impacted and could continue to adversely affect our business, results of operations, and financial condition, as well as the market price and volatility of our common stock.
The cost of resolving the recent bank failures is expected to lead to special assessments by the FDIC to replenish the DIF, pursuant to a rule the FDIC proposed on May 11, 2023. Such events may also increase the risk of a recession or lead to regulatory changes and initiatives that could adversely impact the Company. Changes to laws or regulations, or the impositions of additional restrictions through supervisory or enforcement activities, could have a material impact on our business. Regulatory changes could also adversely impact our ability to access funding, increase the cost of funding, limit our access to capital markets, and negatively impact our overall financial condition.
The proportion of our deposit account balances that exceed FDIC insurance limits may expose us to enhanced liquidity risk.
A significant factor in the bank failures in the first half of 2023 appears to have been the proportion of the deposits held by each institution that exceeded applicable FDIC insurance limits, and the withdrawal of such deposits over a short period of time. If a significant portion of our deposits were to be withdrawn within a short period of time such that additional sources of funding would be required to meet withdrawal demands, we may be unable to obtain funding at favorable terms, which may have an adverse effect on our net interest margin. Moreover, obtaining adequate funding to meet our deposit obligations may be more challenging during periods of elevated interest rates and financial industry instability. Our ability to attract depositors during a time of actual or perceived distress or instability in the marketplace may be limited. Further, interest rates paid for borrowing generally exceed the interest rates paid on deposits. This spread may be exacerbated by higher prevailing interest rates. In addition, because our AFS debt securities lose value when interest rates rise, our ability to cover liquidity needs from sale or pledging of these securities may be negatively impacted during periods of elevated interest rates. Under these circumstances, we may be required to access additional funding from other sources in order to manage our liquidity risk.
ITEM 2. UNREGISTERED SALES OF EQUITY SECURITIES AND USE OF PROCEEDS
There were no unregistered sales of equity securities or repurchase activities during the third quarterthree months ended June 30, 2023.
(1) Represents an update to Item 1A. Risk Factors in the Company's 2022 Form 10-K under the heading, "The actions and soundness of 2022.other financial institutions could affect us."
ITEM 5. OTHER INFORMATION
During the three months ended June 30, 2023, none of the Company’s directors or Section 16 reporting officers adopted or terminated any Rule 10b5-1 trading arrangement or non-Rule 10b5-1 trading arrangement (as such terms are defined in Item 408 of the SEC’s Regulation S-K).
ITEM 6. EXHIBITS
The following exhibit index lists Exhibits filed, or in the case of Exhibits 32.1 and 32.2 furnished, with this report:
| | | | | | | | |
| Exhibit No. | | Exhibit Description |
| | |
| 3.1 | | |
| | |
| 3.1.1 | | |
| | |
| 3.1.2 | | |
| | |
| 3.1.3 | | |
| | |
| 3.1.4 | | |
| | |
| 3.1.5 | | |
| | |
| 3.1.6 | | |
| | |
| 3.2 | | |
| | |
| | |
| | |
| | |
| | |
| | |
| | |
10.1 | | |
| | |
| | |
| | |
| | |
| | |
| | |
| | |
| 31.1 | | |
| | |
| 31.2 | | |
| | |
| 32.1 | | |
| | |
| 32.2 | | |
| | |
| 101.INS | | The instance document does not appear in the interactive data file because its XBRL tags are embedded within the inline XBRL document. |
| | |
| 101.SCH | | Inline XBRL Taxonomy Extension Schema Document. Filed herewith. |
| | |
| 101.CAL | | Inline XBRL Taxonomy Extension Calculation Linkbase Document. Filed herewith. |
| | |
| 101.DEF | | Inline XBRL Taxonomy Extension Definition Linkbase Document. Filed herewith. |
| | |
| 101.LAB | | Inline XBRL Taxonomy Extension Label Linkbase Document. Filed herewith. |
| | |
| 101.PRE | | Inline XBRL Taxonomy Extension Presentation Linkbase Document. Filed herewith. |
| | |
| 104 | | Cover Page Interactive Data (formatted as Inline XBRL and contained in Exhibit 101 filed herewith). Filed herewith. |
| | |
|
| | |
|
GLOSSARY OF ACRONYMS
| | | | | | | | | | | |
| AFS | Available-for-sale | LCHHELOC | London Clearing HouseHome equity lines of credit |
| ALCO | Asset/Liability Committee | LGDHTM | Loss given defaultHeld-to-maturity |
| AOCI | Accumulated other comprehensive (loss) income | LIBORICS | Insured cash sweep |
| ARR | Alternative reference rate | LCH | London Interbank Offered RateClearing House |
| ASC | Accounting Standards Codification | LIBOR ActLGD | Adjustable Interest Rate (LIBOR) ActLoss given default |
| ASU | Accounting Standards Update | LIBOR | London Interbank Offered Rate |
| BTFP | Bank Term Funding Program | LTV | Loan-to-value |
| C&I | Commercial and industrial | MD&A | Management’s Discussion and Analysis of Financial Condition and Results of Operations |
CARES ActCECL | Coronavirus Aid, Relief, and Economic Security ActCurrent expected credit losses | MMBTU | Million British thermal unit |
CECLCFPB | Current expected credit lossesConsumer Financial Protection Bureau | NAV | Net asset value |
| CLO | Collateralized loan obligations | NRSRO | Nationally recognized statistical rating organizations |
| CME | Chicago Mercantile Exchange | OREO | Other real estate owned |
COVID-19 | Coronavirus Disease 2019 | OTTI | Other-than-temporary impairment |
| CRA | Community Reinvestment Act | PD | Probability of default |
| CRE | Commercial real estate | PPPRMB | Paycheck Protection ProgramChinese Renminbi |
| DIF | Deposit Insurance Fund | RMB | Chinese Renminbi |
EPS | Earnings per share | ROA | Return on average assets |
ERMEPS | Enterprise risk managementEarnings per share | ROE | Return on average equity |
EVEERM | Economic value of equityEnterprise risk management | RPA | Credit risk participation agreement |
| EVE | Economic value of equity | RSU | Restricted stock unit |
| FASB | Financial Accounting Standards Board | SBLC | Standby letters of credit |
| FDIC | Federal Deposit Insurance Corporation | RSUSEC | Restricted stock unitU.S. Securities and Exchange Commission |
| FHLB | Federal Home Loan Bank | SBLCSOFR | Standby letters of creditSecured Overnight Financing Rate |
| FIL | Financial Institution Letter | TCE | Tangible Common Equity |
| FRBSF | Federal Reserve Bank of San Francisco | SECTDR | U.S. Securities and Exchange CommissionTroubled debt restructuring |
| FTP | Funds transfer pricing | SOFRU.S. | Secured Overnight Financing RateUnited States |
| GAAP | Generally Accepted Accounting Principles | TDRUSD | Troubled debt restructuringU.S. dollar |
| GDP | Gross Domestic Product | U.S. | United States |
HELOC | Home equity lines of credit | USD | U.S. dollar |
HTM | Held-to-maturity | VIE | Variable interest entity |
SIGNATURE
Pursuant to the requirements of the Securities Exchange Act of 1934, the registrant has duly caused this report to be signed on its behalf by the undersigned thereunto duly authorized.
| | | | | | | | | | | | | | |
| Dated: | NovemberAugust 8, 20222023 | |
| | |
| | EAST WEST BANCORP, INC.
(Registrant) |
| | |
| | By | /s/ IRENE H. OH | |
| | | Irene H. Oh |
| | | Executive Vice President and
Chief Financial Officer |