Indicate by check mark whether the registrant is a large accelerated filer, an accelerated filer, a non-accelerated filer, a smaller reporting company or an emerging growth company. See the definitions of “large accelerated filer,” “accelerated filer,” “smaller reporting company” and “emerging growth company” in Rule 12b-2 of the Exchange Act.
THE MEET GROUP, INC. AND SUBSIDIARIES
INDEXTABLE OF CONTENTS
|
| | |
|
| | |
| | |
| | | |
| | |
| | | |
| | | |
| | |
| | |
| | |
| | |
| | |
| | |
| |
| | |
| | |
| PART II. OTHER INFORMATION |
| | |
| | |
| | |
| | |
| | |
| | |
| | |
| | |
| | |
| | |
| | |
| | |
| | |
| | |
| | |
| | |
| | |
CERTIFICATIONS |
INDEX TO EXHIBITS |
PART I. FINANCIAL INFORMATION
ItemITEM 1. Financial StatementsFINANCIAL STATEMENTS
THE MEET GROUP, INC. AND SUBSIDIARIES
CONDENSED CONSOLIDATED BALANCE SHEETS
(in thousands, except par value and share data)
| | | | (Unaudited) | | | (Unaudited) | | |
| | June 30,
2019 | | December 31,
2018 | March 31, 2020 | | December 31, 2019 |
| ASSETS | | | | |
| CURRENT ASSETS: | | | | |
| Assets: | | | | |
| Current assets: | | | | |
| Cash and cash equivalents | $ | 26,052,704 |
| | $ | 28,365,725 |
| $ | 32,110 |
| | $ | 27,241 |
|
| Accounts receivable, net of allowance of $1,363,319 and $383,579 at June 30, 2019 and December 31, 2018, respectively | 24,347,153 |
| | 27,148,484 |
| |
| Accounts receivable, net | | 23,966 |
| | 25,234 |
|
| Prepaid expenses and other current assets | 6,063,452 |
| | 4,911,057 |
| 5,820 |
| | 6,062 |
|
| Total current assets | 56,463,309 |
| | 60,425,266 |
| 61,896 |
| | 58,537 |
|
| Deferred tax assets | | 16,211 |
| | 16,233 |
|
| Property and equipment, net | | 3,047 |
| | 3,625 |
|
| Operating lease right-of-use assets | | 7,138 |
| | 7,034 |
|
| Intangible assets, net | | 26,945 |
| | 29,305 |
|
| Goodwill | 157,388,320 |
| | 148,132,873 |
| 155,693 |
| | 156,687 |
|
| Property and equipment, net | 4,027,033 |
| | 4,633,764 |
| |
| Operating lease right-of-use assets, net | 5,498,822 |
| | — |
| |
| Intangible assets, net | 34,648,534 |
| | 36,558,439 |
| |
| Deferred taxes | 15,318,336 |
| | 15,648,572 |
| |
| Other assets | 1,584,348 |
| | 2,453,255 |
| 850 |
| | 1,300 |
|
| Total assets | $ | 274,928,702 |
| | $ | 267,852,169 |
| $ | 271,780 |
| | $ | 272,721 |
|
| LIABILITIES AND STOCKHOLDERS’ EQUITY | | | | |
| CURRENT LIABILITIES: | | | | |
| Liabilities and stockholders' equity: | | | | |
| Current liabilities: | | | | |
| Accounts payable | $ | 5,402,910 |
| | $ | 9,071,193 |
| $ | 7,518 |
| | $ | 5,346 |
|
| Accrued liabilities | 19,030,861 |
| | 19,112,303 |
| 18,915 |
| | 20,090 |
|
| Current portion of long-term debt | 15,000,000 |
| | 18,566,584 |
| 3,500 |
| | 3,500 |
|
| Current portion of capital lease obligations | 101,446 |
| | 134,067 |
| |
| Current portion of operating lease liabilities | 2,203,055 |
| | — |
| 2,527 |
| | 2,081 |
|
| Current portion of finance lease obligations | | 9 |
| | 10 |
|
| Deferred revenue | 4,677,161 |
| | 4,620,690 |
| 3,563 |
| | 3,884 |
|
| Total current liabilities | 46,415,433 |
| | 51,504,837 |
| 36,032 |
| | 34,911 |
|
| Long-term capital lease obligations, less current portion | 12,005 |
| | 58,683 |
| |
| Long-term debt, less current portion, net | 17,681,962 |
| | 18,087,956 |
| |
| Long-term operating lease liabilities, less current portion | 3,341,631 |
| | — |
| |
| Long-term derivative liability | 231,092 |
| | 940,216 |
| |
| Long-term debt, net | | 29,523 |
| | 30,375 |
|
| Long-term operating lease liabilities | | 4,723 |
| | 5,024 |
|
| Long-term finance lease obligations | | 48 |
| | 53 |
|
| Long-term derivative liabilities | | 477 |
| | 1,451 |
|
| Deferred tax liabilities | | 2,888 |
| | 2,773 |
|
| Other liabilities | 848,334 |
| | 39,651 |
| — |
| | 894 |
|
| Total liabilities | 68,530,457 |
| | 70,631,343 |
| 73,691 |
| | 75,481 |
|
| Commitments and contingencies (see Note 7) | — |
| | — |
| |
| STOCKHOLDERS’ EQUITY: | | | | |
| Preferred stock, $.001 par value; authorized - 5,000,000 shares; no shares issued and outstanding at June 30, 2019 and December 31, 2018 | — |
| | — |
| |
| Common stock, $.001 par value; authorized - 100,000,000 shares; 76,227,583 and 74,697,526 shares issued and outstanding at June 30, 2019 and December 31, 2018, respectively | 76,228 |
| | 74,700 |
| |
| Commitments and contingencies | |
|
| |
|
|
| Stockholders' equity: | | | | |
| Preferred stock, $0.001 par value; authorized - 5,000,000 shares; no shares issued and outstanding as of March 31, 2020 and December 31, 2019 | | — |
| | — |
|
| Series A junior participating preferred stock, $0.001 par value; authorized - 200,000 shares; no shares issued and outstanding as of March 31, 2020 and December 31, 2019 | | — |
| | — |
|
| Common stock, $0.001 par value; authorized - 100,000,000 shares; 71,185,492 and 70,756,013 shares issued and outstanding as of March 31, 2020 and December 31, 2019, respectively | | 71 |
| | 71 |
|
| Additional paid-in capital | 425,075,744 |
| | 419,455,818 |
| 434,622 |
| | 430,959 |
|
| Accumulated deficit | (216,814,600 | ) | | (220,276,025 | ) | (234,073 | ) | | (231,441 | ) |
| Accumulated other comprehensive loss | (1,939,127 | ) | | (2,033,667 | ) | (2,531 | ) | | (2,349 | ) |
| Total stockholders’ equity | 206,398,245 |
| | 197,220,826 |
| 198,089 |
| | 197,240 |
|
| Total liabilities and stockholders’ equity | $ | 274,928,702 |
| | $ | 267,852,169 |
| $ | 271,780 |
| | $ | 272,721 |
|
See notes to condensed consolidated financial statements.
THE MEET GROUP, INC. AND SUBSIDIARIES
CONDENSED CONSOLIDATED STATEMENTS OF OPERATIONS AND COMPREHENSIVE (LOSS) INCOME (LOSS)
THREE AND SIX MONTHS ENDED JUNE 30, 2019 AND 2018
(UNAUDITED)
(in thousands, except share and per share data)
|
| | | | | | | | | | | | | | | |
| | Three Months Ended June 30, | | Six Months Ended June 30, |
| | 2019 | | 2018 | | 2019 | | 2018 |
| Revenues | $ | 52,000,104 |
| | $ | 42,801,745 |
| | $ | 101,513,341 |
| | $ | 80,439,538 |
|
| Operating costs and expenses: | | | | | | | |
| Sales and marketing | 9,059,530 |
| | 7,753,486 |
| | 16,900,396 |
| | 14,801,479 |
|
| Product development and content | 30,149,797 |
| | 24,411,288 |
| | 61,273,172 |
| | 46,512,825 |
|
| General and administrative | 5,892,437 |
| | 5,154,103 |
| | 10,820,219 |
| | 10,623,281 |
|
| Depreciation and amortization | 3,430,018 |
| | 3,505,180 |
| | 6,628,122 |
| | 7,134,783 |
|
| Acquisition and restructuring | 25,454 |
| | 1,036,602 |
| | 504,449 |
| | 4,386,553 |
|
| Total operating costs and expenses | 48,557,236 |
| | 41,860,659 |
| | 96,126,358 |
| | 83,458,921 |
|
| Income (loss) from operations | 3,442,868 |
| | 941,086 |
| | 5,386,983 |
| | (3,019,383 | ) |
| Other income (expense): | | | | | | | |
| Interest income | 27,605 |
| | 2,742 |
| | 59,994 |
| | 9,950 |
|
| Interest expense | (328,196 | ) | | (671,294 | ) | | (731,060 | ) | | (1,278,980 | ) |
| Gain (loss) on foreign currency transactions | (2,380 | ) | | 4,216 |
| | (67,589 | ) | | 107,259 |
|
| Other | (787 | ) | | 28,571 |
| | 2,762 |
| | 21,627 |
|
| Total other expense | (303,758 | ) | | (635,765 | ) | | (735,893 | ) | | (1,140,144 | ) |
| Income (loss) before income tax expense | 3,139,110 |
| | 305,321 |
| | 4,651,090 |
| | (4,159,527 | ) |
| Income tax expense | (935,284 | ) | | (540,593 | ) | | (1,189,665 | ) | | (288,406 | ) |
| Net income (loss) | $ | 2,203,826 |
| | $ | (235,272 | ) | | $ | 3,461,425 |
| | $ | (4,447,933 | ) |
| | | | | | | | |
| Basic and diluted net income (loss) per common stockholder: | | | | | | | |
| Basic net income (loss) per common stockholder | $ | 0.03 |
| | $ | — |
| | $ | 0.05 |
| | $ | (0.06 | ) |
| Diluted net income (loss) per common stockholder | $ | 0.03 |
| | $ | — |
| | $ | 0.04 |
| | $ | (0.06 | ) |
| | | | | | | | |
| Weighted average shares outstanding: | | | | | | | |
| Basic | 75,648,621 |
| | 72,753,487 |
| | 75,250,562 |
| | 72,369,619 |
|
| Diluted | 78,508,559 |
| | 72,753,487 |
| | 78,656,115 |
| | 72,369,619 |
|
| | | | | | | | |
| Comprehensive income (loss): | | | | | | | |
| Net income (loss) | $ | 2,203,826 |
| | $ | (235,272 | ) | | $ | 3,461,425 |
| | $ | (4,447,933 | ) |
| Other comprehensive income (loss): | | | | | | | |
| Reclassification of (gains) losses on derivative financial instruments, net of tax of $106,221, $832,995, $240,254 and $508,691, respectively | 232,239 |
| | (1,831,921 | ) | | (543,598 | ) | | (1,053,778 | ) |
| Unrealized gains (losses) on derivative financial instruments, net of tax of $50,362, $834,099, $335,560 and $416,203, respectively | (131,905 | ) | | 1,858,182 |
| | 695,763 |
| | 1,097,056 |
|
| Foreign currency translation adjustment | 263,173 |
| | (952,438 | ) | | (57,625 | ) | | (584,085 | ) |
| Other comprehensive income (loss) | 363,507 |
| | (926,177 | ) | | 94,540 |
| | (540,807 | ) |
| Comprehensive income (loss) | $ | 2,567,333 |
| | $ | (1,161,449 | ) | | $ | 3,555,965 |
| | $ | (4,988,740 | ) |
|
| | | | | | | |
| | Three Months Ended March 31, |
| | 2020 | | 2019 |
| Revenue | $ | 55,066 |
| | $ | 49,513 |
|
| Operating costs and expenses: | | | |
| Sales and marketing | 7,714 |
| | 7,841 |
|
| Product development and content | 37,671 |
| | 31,123 |
|
| General and administrative | 5,030 |
| | 4,928 |
|
| Depreciation and amortization | 2,820 |
| | 3,198 |
|
| Acquisition, restructuring and other | 3,370 |
| | 479 |
|
| Total operating costs and expenses | 56,605 |
| | 47,569 |
|
| (Loss) income from operations | (1,539 | ) | | 1,944 |
|
| Other income (expense): | | | |
| Interest income | 13 |
| | 32 |
|
| Interest expense | (396 | ) | | (403 | ) |
| Loss on foreign currency transactions | (7 | ) | | (65 | ) |
| Loss on disposal of assets | (108 | ) | | — |
|
| Other items of income, net | 2 |
| | 4 |
|
| Total other expense | (496 | ) | | (432 | ) |
| (Loss) income before income tax expense | (2,035 | ) | | 1,512 |
|
| Income tax expense | (373 | ) | | (254 | ) |
| Net (loss) income | $ | (2,408 | ) | | $ | 1,258 |
|
| | | | |
| Basic and diluted net (loss) income per share: | | | |
| Basic net (loss) income per share | $ | (0.03 | ) | | $ | 0.02 |
|
| Diluted net (loss) income per share | $ | (0.03 | ) | | $ | 0.02 |
|
| | | | |
| Weighted-average shares outstanding: | | | |
| Basic | 71,001,906 |
| | 74,848,080 |
|
| Diluted | 71,001,906 |
| | 78,799,248 |
|
| | | | |
| Comprehensive (loss) income: | | | |
| Net (loss) income | $ | (2,408 | ) | | $ | 1,258 |
|
| Other comprehensive loss: | | | |
| Reclassification of gains on derivative financial instruments, net of tax of $274 and $346, respectively | (597 | ) | | (776 | ) |
| Unrealized gains on derivative financial instruments, net of tax of $454 and $386, respectively | 822 |
| | 828 |
|
| Foreign currency translation adjustment | (407 | ) | | (321 | ) |
| Other comprehensive loss | (182 | ) | | (269 | ) |
| Comprehensive (loss) income | $ | (2,590 | ) | | $ | 989 |
|
See notes to condensed consolidated financial statements.
THE MEET GROUP, INC. AND SUBSIDIARIES
CONDENSED CONSOLIDATED STATEMENTS OF CHANGES IN STOCKHOLDERS’ EQUITY
THREE AND SIX MONTHS ENDED JUNE 30, 2019 AND 2018(UNAUDITED)
(UNAUDITED)(in thousands, except share data)
|
| | | | | | | | | | | | | | | | | | | | | | |
| | Common Stock | | Additional Paid-in Capital | | Accumulated Deficit | | Accumulated Other Comprehensive Loss | | Total Stockholders’ Equity |
| | Shares | | Amount | | | | |
| Balance-March 31, 2019 | 75,270,035 |
| | $ | 75,272 |
| | $ | 422,471,569 |
| | $ | (219,018,426 | ) | | $ | (2,302,634 | ) | | $ | 201,225,781 |
|
| Stock-based compensation expense | — |
| | — |
| | 2,865,336 |
| | — |
| | — |
| | 2,865,336 |
|
| Exercise of stock options | 5,597 |
| | 4 |
| | 21,724 |
| | — |
| | — |
| | 21,728 |
|
| Issuance of common stock for vested RSAs | 951,951 |
| | 952 |
| | (952 | ) | | — |
| | — |
| | — |
|
| RSAs withheld to cover taxes | — |
| | — |
| | (281,933 | ) | | — |
| | — |
| | (281,933 | ) |
| Other comprehensive income | — |
| | — |
| | — |
| | — |
| | 363,507 |
| | 363,507 |
|
| Net income | — |
| | — |
| | — |
| | 2,203,826 |
| | — |
| | 2,203,826 |
|
| Balance-June 30, 2019 | 76,227,583 |
| | $ | 76,228 |
| | $ | 425,075,744 |
| | $ | (216,814,600 | ) | | $ | (1,939,127 | ) | | $ | 206,398,245 |
|
| | | | | | | | | | | | |
| Balance-December 31, 2018 | 74,697,526 |
| | $ | 74,700 |
| | $ | 419,455,818 |
| | $ | (220,276,025 | ) | | $ | (2,033,667 | ) | | $ | 197,220,826 |
|
| Stock-based compensation expense | — |
| | — |
| | 5,290,053 |
| | — |
| | — |
| | 5,290,053 |
|
| Exercise of stock options | 157,334 |
| | 156 |
| | 702,561 |
| | — |
| | — |
| | 702,717 |
|
| Issuance of common stock for vested RSAs | 1,372,723 |
| | 1,372 |
| | (1,372 | ) | | — |
| | — |
| | — |
|
| RSAs withheld to cover taxes | — |
| | — |
| | (371,316 | ) | | — |
| | — |
| | (371,316 | ) |
| Other comprehensive income | — |
| | — |
| | — |
| | — |
| | 94,540 |
| | 94,540 |
|
| Net income | — |
| | — |
| | — |
| | 3,461,425 |
| | — |
| | 3,461,425 |
|
| Balance-June 30, 2019 | 76,227,583 |
| | $ | 76,228 |
| | $ | 425,075,744 |
| | $ | (216,814,600 | ) | | $ | (1,939,127 | ) | | $ | 206,398,245 |
|
| | | | | | | | | | | | |
| Balance-March 31, 2018 | 72,106,997 |
| | $ | 72,104 |
| | $ | 410,105,207 |
| | $ | (225,632,074 | ) | | $ | (739,168 | ) | | $ | 183,806,069 |
|
| Stock-based compensation expense | — |
| | — |
| | 2,090,870 |
| | — |
| | — |
| | 2,090,870 |
|
| Exercise of stock options | 131,051 |
| | 131 |
| | 232,285 |
| | | | | | 232,416 |
|
| Issuance of common stock for vested RSAs | 883,914 |
| | 883 |
| | (883 | ) | | — |
| | — |
| | — |
|
| RSAs withheld to cover taxes | — |
| | — |
| | (213,520 | ) | | — |
| | — |
| | (213,520 | ) |
| Other comprehensive loss | — |
| | — |
| | — |
| | — |
| | (926,177 | ) | | (926,177 | ) |
| Net loss | — |
| | — |
| | — |
| | (235,272 | ) | | — |
| | (235,272 | ) |
| Balance-June 30, 2018 | 73,121,962 |
| | $ | 73,118 |
| | $ | 412,213,959 |
| | $ | (225,867,346 | ) | | $ | (1,665,345 | ) | | $ | 184,754,386 |
|
| | | | | | | | | | | | |
| Balance-December 31, 2017 | 71,915,018 |
| | $ | 71,918 |
| | $ | 408,029,068 |
| | $ | (221,435,888 | ) | | $ | (1,124,538 | ) | | $ | 185,540,560 |
|
| Adoption of ASC Topic 606 | — |
| | — |
| | — |
| | 16,475 |
| | — |
| | 16,475 |
|
| Stock-based compensation expense | — |
| | — |
| | 4,259,795 |
| | — |
| | — |
| | 4,259,795 |
|
| Exercise of stock options | 131,051 |
| | 131 |
| | 232,285 |
| | — |
| | — |
| | 232,416 |
|
| Issuance of common stock for vested RSAs | 1,075,893 |
| | 1,069 |
| | (1,069 | ) | | — |
| | — |
| | — |
|
| RSAs withheld to cover taxes | — |
| | — |
| | (306,120 | ) | | — |
| | — |
| | (306,120 | ) |
| Other comprehensive loss | — |
| | — |
| | — |
| | — |
| | (540,807 | ) | | (540,807 | ) |
| Net loss | — |
| | — |
| | — |
| | (4,447,933 | ) | | — |
| | (4,447,933 | ) |
| Balance-June 30, 2018 | 73,121,962 |
| | $ | 73,118 |
| | $ | 412,213,959 |
| | $ | (225,867,346 | ) | | $ | (1,665,345 | ) | | $ | 184,754,386 |
|
|
| | | | | | | | | | | | | | | | | | | | | | |
| | Common Stock | | Additional
Paid-in
Capital | | Accumulated
Deficit | | Accumulated
Other
Comprehensive
Loss | | Total
Stockholders’
Equity |
| | Shares | | Amount | | | | |
| Balance as of January 1, 2020 | 70,756,013 |
| | $ | 71 |
| | $ | 430,959 |
| | $ | (231,441 | ) | | $ | (2,349 | ) | | $ | 197,240 |
|
| Accounting Standards Update No. 2016-13 | — |
| | — |
| | — |
| | (159 | ) | | — |
| | (159 | ) |
| Stock-based compensation expense | — |
| | — |
| | 3,185 |
| | — |
| | — |
| | 3,185 |
|
| Exercise of stock options | 162,841 |
| | — |
| | 564 |
| | — |
| | — |
| | 564 |
|
| Issuance of common stock for vested restricted stock awards | 279,573 |
| | — |
| | — |
| | — |
| | — |
| | — |
|
| Restricted stock awards withheld to cover taxes | — |
| | — |
| | (86 | ) | | — |
| | — |
| | (86 | ) |
| Repurchase and retirement of common stock | (12,935 | ) | | — |
| | — |
| | (65 | ) | | — |
| | (65 | ) |
| Other comprehensive loss | — |
| | — |
| | — |
| | — |
| | (182 | ) | | (182 | ) |
| Net loss | — |
| | — |
| | — |
| | (2,408 | ) | | — |
| | (2,408 | ) |
| Balance as of March 31, 2020 | 71,185,492 |
| | $ | 71 |
| | $ | 434,622 |
| | $ | (234,073 | ) | | $ | (2,531 | ) | | $ | 198,089 |
|
| | | | | | | | | | | | |
| Balance as of January 1, 2019 | 74,697,526 |
| | $ | 75 |
| | $ | 419,456 |
| | $ | (220,276 | ) | | $ | (2,034 | ) | | $ | 197,221 |
|
| Stock-based compensation expense | — |
| | — |
| | 2,425 |
| | — |
| | — |
| | 2,425 |
|
| Exercise of stock options | 151,737 |
| | — |
| | 681 |
| | — |
| | — |
| | 681 |
|
| Issuance of common stock for vested restricted stock awards | 420,772 |
| | 1 |
| | (1 | ) | | — |
| | — |
| | — |
|
| Restricted stock awards withheld to cover taxes | — |
| | — |
| | (89 | ) | | — |
| | — |
| | (89 | ) |
| Other comprehensive loss | — |
| | — |
| | — |
| | — |
| | (269 | ) | | (269 | ) |
| Net income | — |
| | — |
| | — |
| | 1,258 |
| | — |
| | 1,258 |
|
| Balance as of March 31, 2019 | 75,270,035 |
| | $ | 76 |
| | $ | 422,472 |
| | $ | (219,018 | ) | | $ | (2,303 | ) | | $ | 201,227 |
|
See notes to condensed consolidated financial statements.
THE MEET GROUP, INC. AND SUBSIDIARIES
CONDENSED CONSOLIDATED STATEMENTS OF CASH FLOWS
SIX MONTHS ENDED JUNE 30, 2019 AND 2018
(UNAUDITED)
(in thousands)
|
| | | | | | | |
| | Six Months Ended June 30, |
| | 2019 | | 2018 |
| Cash flows from operating activities: | | | |
| Net income (loss) | $ | 3,461,425 |
| | $ | (4,447,933 | ) |
| Adjustments to reconcile net income (loss) to net cash provided by operating activities: | | | |
| Depreciation and amortization | 6,628,122 |
| | 7,134,783 |
|
| Amortization right-of-use assets | 1,293,657 |
| | — |
|
| Stock-based compensation expense | 5,290,053 |
| | 4,259,795 |
|
| Deferred taxes | 268,015 |
| | (441,417 | ) |
| (Gain) loss on foreign currency transactions | 67,589 |
| | (107,259 | ) |
| Bad debt expense | 909,140 |
| | 290,426 |
|
| Amortization of loan origination costs | 94,006 |
| | 164,313 |
|
| Change in contingent consideration obligations | 63,667 |
| | — |
|
| Changes in operating assets and liabilities: | | | |
| Accounts receivable | 2,414,200 |
| | 2,141,980 |
|
| Prepaid expenses, other current assets and other assets | (483,916 | ) | | (2,426,711 | ) |
| Accounts payable and accrued liabilities | (6,019,870 | ) | | 2,344,109 |
|
| Deferred revenue | (19,276 | ) | | 686,332 |
|
| Net cash provided by operating activities | 13,966,812 |
| | 9,598,418 |
|
| Cash flows from investing activities: | | | |
| Purchase of property and equipment | (687,725 | ) | | (256,391 | ) |
| Acquisition of business, net of cash acquired | (11,807,925 | ) | | — |
|
| Net cash used in investing activities | (12,495,650 | ) | | (256,391 | ) |
| Cash flows from financing activities: | | | |
| Proceeds from exercise of stock options | 702,717 |
| | 232,416 |
|
| Payments of capital leases | (77,507 | ) | | (142,043 | ) |
| Proceeds from borrowings of debt | 7,000,000 |
| | — |
|
| Payments for restricted stock awards withheld for taxes | (371,316 | ) | | (306,120 | ) |
| Payments of contingent consideration | — |
| | (5,000,000 | ) |
| Payments on long-term debt | (11,066,584 | ) | | (7,500,000 | ) |
| Net cash used in financing activities | (3,812,690 | ) | | (12,715,747 | ) |
| Change in cash and cash equivalents prior to effects of foreign currency exchange rate | (2,341,528 | ) | | (3,373,720 | ) |
| Effect of foreign currency exchange rate (translation) | 28,507 |
| | (256,818 | ) |
| Net decrease in cash and cash equivalents | (2,313,021 | ) | | (3,630,538 | ) |
| Cash and cash equivalents at beginning of period | 28,365,725 |
| | 25,052,995 |
|
| Cash and cash equivalents at end of period | $ | 26,052,704 |
| | $ | 21,422,457 |
|
| Supplemental disclosure of cash flow information: | | | |
| Cash paid for interest | $ | 630,130 |
| | $ | 1,110,448 |
|
|
| | | | | | | |
| | Three Months Ended March 31, |
| | 2020 | | 2019 |
| Cash flows from operating activities: | | | |
| Net (loss) income | $ | (2,408 | ) | | $ | 1,258 |
|
| Adjustments to reconcile net (loss) income to net cash provided by operating activities: |
| | |
| Depreciation and amortization | 2,820 |
| | 3,198 |
|
| Amortization of right-of-use assets | 635 |
| | 695 |
|
| Stock-based compensation expense | 3,185 |
| | 2,425 |
|
| Deferred tax expense (benefit) | 9 |
| | (147 | ) |
| Loss on disposal of assets | 108 |
| | — |
|
| Loss on foreign currency transactions | 7 |
| | 65 |
|
| Provision for expected credit losses | 82 |
| | 325 |
|
| Non-cash interest expense | 120 |
| | 38 |
|
| Changes in derivative financial instruments | 171 |
| | — |
|
| Changes in contingent consideration obligations | 23 |
| | 16 |
|
| Changes in operating assets and liabilities: | | | |
| Accounts receivable | 944 |
| | 1,187 |
|
| Prepaid expenses, other current assets and other assets | 768 |
| | (774 | ) |
| Accounts payable and accrued liabilities | (638 | ) | | (5,009 | ) |
| Deferred revenue | (275 | ) | | 85 |
|
| Net cash provided by operating activities | 5,551 |
| | 3,362 |
|
| Cash flows from investing activities: |
| | |
| Purchases of property and equipment | (87 | ) | | (283 | ) |
| Acquisition of business, net of cash acquired | — |
| | (11,808 | ) |
| Net cash used in investing activities | (87 | ) | | (12,091 | ) |
| Cash flows from financing activities: | | | |
| Proceeds from exercise of stock options | 564 |
| | 681 |
|
| Repurchases of common stock | (65 | ) | | — |
|
| Payments of finance leases | (5 | ) | | (41 | ) |
| Proceeds from revolving loan | — |
| | 7,000 |
|
| Payments for restricted stock awards withheld for taxes | (86 | ) | | (89 | ) |
| Payments of term loan | (875 | ) | | (7,317 | ) |
| Net cash (used in) provided by financing activities | (467 | ) | | 234 |
|
| Change in cash and cash equivalents prior to effect of foreign currency exchange rate | 4,997 |
| | (8,495 | ) |
| Effect of foreign currency exchange rate | (128 | ) | | (60 | ) |
| Net increase (decrease) in cash and cash equivalents | 4,869 |
| | (8,555 | ) |
| Cash and cash equivalents as of beginning of period | 27,241 |
| | 28,366 |
|
| Cash and cash equivalents as of end of period | $ | 32,110 |
| | $ | 19,811 |
|
| Supplemental disclosure of cash flow information: | | | |
| Cash paid for interest | $ | 123 |
| | $ | 361 |
|
| Cash paid for income taxes | $ | 973 |
| | $ | 297 |
|
See notes to condensed consolidated financial statements.
THE MEET GROUP, INC. AND SUBSIDIARIES
NOTES TO CONDENSEDTHE CONSOLIDATED FINANCIAL STATEMENTS (UNAUDITED)
Note 1—1 —Description of Business, Basis of Presentation and Summary of Significant Accounting Policies
Description of Business
The Meet Group, Inc. (the “Company,(“Company,” or “The Meet Group,” “us,” or “we”Group”) is a leading provider of interactive livestreaminglive-streaming solutions. We leverageThe Company leverages a powerful live-streaminglive video platform (“Live”), empowering ourits global community to forge meaningful connections. OurThe Company’s primary appsapplications (“apps”) are MeetMe®, LOVOO®, Skout®, Tagged®, LOVOO® and Growlr®.
We operateThe Company operates location-based social networks for meeting new people — primarily on mobile platforms, including on iPhone, Android, iPad and other tablets — that facilitate interactions among users and encourage users to connect, communicate and engage with each other. Over the past two years, we have transformed our business from an advertising based revenue model to one where the majority of our revenue is derived from user pay monetization and subscriptions.
The fastest growing component of user pay monetization comes from in-app purchases, including virtual gifts associated with our live video product.
We began developing our live video platform in 2016 with the belief that we could successfully pair live-streaming and dating – a model that we had seen work effectively for Asian dating app providers. We first launched video on MeetMe early in 2017, and, in October of 2017, we began to monetize the feature by enabling gifting within the video streams. During this time period, weCompany also executed on our strategy of acquiring other properties: Skout, Inc. (“Skout”), Ifwe Inc. (“if(we)”) and Lovoo GmbH (“Lovoo”) – where we believed our live-streaming platform would fit naturally. We then integrated live video into each app. We launched the monetized video platform on Skout in the fourth quarter of 2017, Tagged in the second quarter of 2018 and Lovoo beginning in the second quarter of 2018. We have also continued to add features and enhancements intended to drive video engagement and increase monetization for all the apps. Live video has become the fastest growing revenue product in our history.
We also offeroffers online marketing capabilities, which enable marketers to display their advertisements on ourits apps. We offer significant scale to our advertising partners, with hundreds of millions of daily impressions across our active global user base, and sophisticated data science for effective targeting. We work with our advertisers and advertising networks to maximize the effectiveness of their campaigns by optimizing advertisement formats and placements.
Just as Facebook has established itself as the social network of friends and family, and LinkedIn as the social network of colleagues and business professionals, The Meet Group is creating the social entertainment network not of the people you know, but of the people you want to know. Nimble, fast-moving and already in more than 100 countries, we are challenging the dominant player in our space, Match Group, Inc., and differentiating ourselves with live video, which is not offered by many of our direct competitors. Modeled after the video products offered by Asian dating app providers, but enhanced in order to appeal to Western audiences, our live video product is aimed at the nexus of entertainment and community, where we believe our apps exhibit natural strength.
Our vision extends beyond dating and entertainment. We focus on building quality products to satisfy the universal need for human connection among all people, everywhere – not just paying subscribers. We believe meeting new people is a basic human need, especially for users aged 18-34, when so many long-lasting relationships are made. We use advanced technology to engineer serendipitous connections among people who otherwise might never have met – a sort of digital coffeehouse where everyone belongs. Over the years, The Meet Group’s apps have originated untold numbers of chats, shares, good friendships, dates, romantic relationships – even marriages.
We believe that we have significant growth opportunities enabled through our social entertainment platform. We believe our scale provides unique advantages to grow video monetization, while also establishing a high density of users within the geographic regions we serve. As The Meet Group’s networks grow and the number of users in a location increases, we believe that users who are seeking to meet new people will incrementally benefit from the quantity of relevant connections.
Basis of Presentation
The Company’s unaudited condensed consolidated financial statements are prepared in accordance with accounting principlesU.S. generally accepted in the U.S.accounting principles (“GAAP”). The condensed consolidated financial statements include the accounts of all subsidiaries and affiliates in which the Company holds a controlling financial interest as of the date of the condensed consolidated financial statements.
The condensed consolidated financial statements include the accounts of The Meet Group and its wholly-owned subsidiaries. All intercompany accounts and transactions have been eliminated in consolidation.
Unaudited Interim Financial Information
The unaudited condensed consolidated financial statements have been prepared by the Company and reflect all normal, recurring adjustments that, in the opinion of management, are necessary for a fair presentation of the interim financial information. The results of operations for the interim periods presented are not necessarily indicative of the results to be expected for any subsequent quarter or for the year ending December 31, 2019.2020. Certain information and footnote disclosures normally included in financial statements prepared in accordance with GAAP have been condensed or omitted under the rules and regulations of the U.S. Securities and Exchange Commission (“SEC”). These unaudited condensed consolidated financial statements and notes included herein should be read in conjunction with the audited consolidated financial statements and notes included therein in the Company’s Annual Report on Form 10-K for the year ended December 31, 2018,2019, which was filed with the SEC on March 8, 2019.12, 2020.
Merger Agreement
On March 5, 2020, the Company entered into a definitive agreement to be acquired by ProSiebenSat.1 Media SE’s and General Atlantic Coöperatief U.A.’s joint company, NCG – NUCOM GROUP SE, a European stock corporation (“NuCom”), through eHarmony Holding, Inc., a subsidiary of NuCom’s platform company Parship Group GmbH (“Buyer”). Pursuant to the Agreement and Plan of Merger (“Merger Agreement”), by and among the Company, Buyer, Holly Merger Sub, Inc., a Delaware corporation and a direct, wholly-owned subsidiary of Buyer (“Merger Sub”), and NuCom, solely for the purpose of guaranteeing Buyer’s obligations under the Merger Agreement, Merger Sub shall merge with and into the Company (“Merger”). As a result of the Merger, the separate corporate existence of Merger Sub shall cease, the Company shall continue as the surviving corporation in the Merger (“Surviving Corporation”) and the Surviving Corporation shall become a wholly-owned subsidiary of Buyer. The Company recorded $3.1 million of acquisition, restructuring and other expenses related to the Merger Agreement during the three months ended March 31, 2020.
The Company expects the Merger to close in the second half of 2020, subject to the satisfaction of all closing conditions.
Summary of Significant Accounting Policies
Use of Estimates
The preparation of the Company’s consolidated financial statements in conformity with GAAP requires the Company to make estimates and assumptions that affect the reported amounts of assets and liabilities and the disclosure of contingent assets and liabilities at the date of the condensed consolidated financial statements and the reported amounts of revenues and expenses during the reporting period. Significant estimates and assumptions are required in revenue recognition, accounting forthe determination of business combinations accounts receivable valuation, the fair value of financial instruments,and contingent consideration arrangements, income taxes, the valuation of long-lived assets, valuation of deferred taxincluding property and equipment, definite-lived intangible assets income taxes, contingencies,and goodwill and intangible assets, video broadcaster fees and stock-based compensation.accounting for contingencies. Some of these judgments can be subjective and complex, and, consequently, actual results may differ from these estimates. The Company’s estimates are often are based on complex judgments, probabilities and assumptions that it believes to beare reasonable but that are inherently uncertain and unpredictable. For any given individual estimate or assumption made by the Company, there may also be other estimates or assumptions that are reasonable.
The Company regularly evaluates its estimates and assumptions using historical experience and other factors, including the economic environment. As future events and their effects cannot be determined with precision, the Company’s estimates and assumptions may prove to be incomplete or inaccurate, or unanticipated events and circumstances may occur that might cause it to change those estimates and assumptions. Market conditions, such as illiquid credit markets, volatile equity markets, dramatic fluctuations in foreign currency rates and economic downturn, can increase the uncertainty already inherent in its estimates and assumptions. The Company adjusts its estimates and assumptions when facts and circumstances indicate the need for change. Those changes generally will be reflected in the Company’s condensed consolidated financial statements on a prospective basis unless they are required to be treated retrospectively under the relevant accounting standard. It is possible that other professionals, applying reasonable judgment to the same facts and circumstances, could develop and support a range of alternative estimated amounts. The Company is also subject to other risks and uncertainties that may cause actual results to differ from estimated amounts, such as changes in competition, litigation, legislation and regulations.
During the three and six months ended June 30, 2019, the Company started to take breakage on video broadcaster rewards based on historical levels of activity of video broadcasters and their corresponding video broadcaster reward balances. Based on this analysis, the Company reduced its accrual for video broadcaster rewards by $1.9 million. This reduction of expense is recognized in product development and content expense in the condensed consolidated statements of operations and comprehensive income (loss) for the three and six months ended June 30, 2019. The Company will continue to regularly evaluate the likelihood of a user redeeming video broadcaster rewards and adjust breakage accordingly.
Fair Value Measurements
The fair values of the Company’s financial instruments reflect the amounts that would be received to sell an asset or paid to transfer a liability in an orderly transaction between market participants at the measurement date (exit price).
The carrying amounts of the Company’s financial instruments of cash, cash equivalents, accounts receivable, accounts payable, accrued liabilities and deferred revenue approximate fair value due to their short maturities. The Company has evaluated the estimated fair value of financial instruments using available market information and management’s estimates. The use of different market assumptions and/or estimation methodologies could have a significant effect on the estimated fair value amounts.
In addition, the Company carries its contingent consideration liabilities related to acquisitions at fair value. In accordance with the three-tier fair value hierarchy, the Company determined the fair value of its contingent consideration liabilities using the income approach with assumed discount rates and payment probabilities. The income approach uses Level 3, or unobservable inputs as defined under the accounting guidance for fair value measurements. At June 30, 2019, the Company’s contingent consideration liability had a fair value of $1.8 million. See Note 2—Acquisitions for more information regarding the Company’s contingent consideration liability.
The Company carries a term loan facility with an outstanding balance at June 30, 2019 and December 31, 2018 of $25.9 million and $36.9 million, respectively. As part of the Growlr Acquisition (as defined in Note 2—Acquisitions), the Company drew down $7.0 million on its revolving credit facility. The outstanding balance on the Company’s revolving credit facility at June 30, 2019 was $7.0 million. The outstanding balances of the Company’s term loan and revolving credit facilities as of June 30, 2019 and December 31, 2018 approximate fair value due to the variable market interest rates and relatively short maturity associated with them. See Note 6—Long-Term Debt for more information regarding the Company’s credit facilities.
The Company leases its operating facilities in the U.S. and Germany under certain noncancelable operating leases that expire through 2023. The Company also leases certain fixed assets under capital leases that expire through 2021. The capital leases are for the Company's data centers, printers and other furniture in the Company's German offices. The outstanding balance of operating and finance leases as of June 30, 2019 and December 31, 2018 approximates fair value due to their relatively short maturities.
The Company records all derivatives on the balance sheet at fair value. The accounting for changes in the fair value of derivatives depends on the intended use of the derivative, whether the Company has elected to designate a derivative in a hedging relationship and apply hedge accounting and whether the hedging relationship has satisfied the criteria necessary to apply hedge accounting. Derivatives designated and qualifying as a hedge of the exposure to changes in the fair value of an asset, liability, or firm commitment attributable to a particular risk, such as interest rate risk, are considered fair value hedges. Derivatives designated and qualifying as a hedge of the exposure to variability in expected future cash flows, or other types of forecasted transactions, are considered cash flow hedges. Derivatives may also be designated as hedges of the foreign currency exposure of a net investment in a foreign operation. Hedge accounting generally provides for the matching of the timing of gain or loss recognition on the hedging instrument with the recognition of the changes in the fair value of the hedged asset or liability that are attributable to the hedged risk in a fair value hedge or the earnings effect of the hedged forecasted transactions in a cash flow hedge. The Company may enter into derivative contracts that are intended to economically hedge certain of its risk, even though hedge accounting does not apply or the Company elects not to apply hedge accounting.
The Company is measuring the credit risk of its derivative financial instruments that are subject to master netting agreements on a net basis by counterparty portfolio. See Note 10—Derivatives and Hedging Activities for further details.
Foreign Currency
The functional currency of our foreign subsidiaries is the local currency. The financial statements of these subsidiaries are translated to U.S. dollars using period-end rates of exchange for assets and liabilities and average quarterly rates of exchange for revenues and expenses. Translation gains (losses) are recorded in accumulated other comprehensive income (loss) as a component of stockholders’ equity. Net gains and losses resulting from foreign exchange transactions are included in other income (expense).
Net Income (Loss) per Share
Basic net income (loss) per share is computed by dividing net income (loss) attributable to common stockholders by the weighted average number of common shares outstanding. Diluted net income (loss) per share is computed by dividing net income (loss) attributable to common stockholders by the weighted average number of common shares and common stock equivalents outstanding, calculated under the treasury stock method for options, unvested restricted stock awards (“RSAs”), unvested in-the-money performance share units (“PSUs”) and warrants using the average market prices during the period.
The following table shows the computation of basic and diluted net income (loss) per share for the following:
|
| | | | | | | | | | | | | | | |
| | Three Months Ended June 30, | | Six Months Ended June 30, |
| | 2019 | | 2018 | | 2019 | | 2018 |
| Numerator: | | | | | | | |
| Net income (loss) | $ | 2,203,826 |
| | $ | (235,272 | ) | | $ | 3,461,425 |
| | $ | (4,447,933 | ) |
| | | | | | | | |
| Denominator: | | | | | | | |
| Weighted-average shares outstanding— basic | 75,648,621 |
| | 72,753,487 |
| | 75,250,562 |
| | 72,369,619 |
|
| Effect of dilutive securities | 2,859,938 |
| | — |
| | 3,405,553 |
| | — |
|
| Weighted-average shares outstanding— diluted | 78,508,559 |
| | 72,753,487 |
| | 78,656,115 |
| | 72,369,619 |
|
| |
|
| | | |
|
| | |
| Basic income (loss) per share | $ | 0.03 |
| | $ | — |
| | $ | 0.05 |
| | $ | (0.06 | ) |
| Diluted income (loss) per share | $ | 0.03 |
| | $ | — |
| | $ | 0.04 |
| | $ | (0.06 | ) |
The following table summarizes the number of dilutive securities, which may dilute future earnings per share, outstanding for each of the periods presented, but not included in the calculation of diluted earnings per share:
|
| | | | | | | | | | | |
| | Three Months Ended June 30, | | Six Months Ended June 30, |
| | 2019 | | 2018 | | 2019 | | 2018 |
| Stock options | 2,876,703 |
| | 5,081,890 |
| | 2,700,275 |
| | 5,081,890 |
|
| Unvested RSAs | 2,741,221 |
| | 3,805,547 |
| | 2,372,049 |
| | 3,805,547 |
|
| Unvested PSUs | 146,483 |
| | 1,046,350 |
| | 146,467 |
| | 1,046,350 |
|
| Total | 5,764,407 |
| | 9,933,787 |
| | 5,218,791 |
| | 9,933,787 |
|
Significant Customers and Concentration of Credit Risk
Financial instruments that potentially subject the Company to significant concentrations of credit risk consist primarily of cash, cash equivalents, and accounts receivable. The Company invests its excess cash in high-quality, liquid money market funds maintained by major U.S. banks and financial institutions. The Company has not experienced any losses on its cash and cash equivalents, including money market funds.
The Company performs ongoing credit evaluations of its customers and generally does not require collateral. The Company has no recent history of significant losses from uncollectible accounts. During the six months ended June 30, 2019 and 2018, two customers, both of which were advertising aggregators (which represent thousands of advertisers) and customer payment processors, comprised approximately 61% and 49% of total revenues, respectively. Two and three customers, which were advertising aggregators and customer payment processors, comprised approximately 44% and 36% of accounts receivable as of June 30, 2019 and December 31, 2018, respectively.
The Company does not expect its current or future credit risk exposure to have a significant impact on its operations, however, there can be no assurance that the Company’s business will not experience any adverse impact from credit risk in the future.
Recent IssuedRecently-issued Accounting Standards
Recently-adopted Accounting Standards
In FebruaryJune 2016, the Financial Accounting Standards Board (“FASB”) issued Accounting Standards Update (“ASU”) No. 2016-02, Leases2016-13, Financial Instruments — Credit Losses (Topic 842). The new standard establishes a right-of-use326): Measurement of Credit Losses on Financial Instruments (“ROU”ASU No. 2016-13”), which requires the measurement and recognition of expected credit losses for certain financial assets, including trade accounts receivable. ASU No. 2016-13 replaces the existing incurred loss impairment model with an expected loss model that requires the use of relevant information, including an entity’s historical experience, current conditions and other reasonable and supportable forecasts that affect collectability over the life of a lessee to record a ROU asset and a lease liability on the balance sheet for all leases with terms longer than 12 months. Leases will be classified as either finance or operating, with classification affecting the pattern of expense recognitionfinancial asset. The amendments in the income statement. ASU No. 2016-02 is2016-13 are effective for annual periodsfiscal years beginning after December 15, 2018, and annual and2019, including interim periods thereafter, with earlywithin those fiscal years. Early adoption was permitted. A modified retrospective transition approach is an option for lessees for capital and operating leases existing at, or entered into after, the beginning of the earliest comparative period presented in the financial statements, with certain practical expedients available. In July 2018, the FASB issued ASU No. 2018-11, Leases (Topic 842), which adds an optional transition method allowing entities to apply the new lease accounting rules through a cumulative-effect adjustment to the opening balance of retained earnings in the initial year of adoption.
The Company adopted ASU No. 2016-02 as of2016-13 on January 1, 2019, using the transition method per ASU No. 2018-11 issued2020, which resulted in July 2018 wherein entities were allowedan increase of $0.2 million to initially apply the new leases standard at adoption date and recognizeits allowance for credit losses that was recognized as a cumulative effect adjustment to the opening balance of retained earnings in the period of adoption. Accordingly, all periods prior to January 1, 2019 were presented in accordance with the previous ASC Topic 840, Leases, and noits accumulated deficit under a modified retrospective adjustments were made to the comparative periods presented. Finance leases were not impacted by the adoption of ASC 842, as finance lease liabilities and the corresponding ROU assets were already recorded in the balance sheet under the previous guidance, ASC 840.
The Company elected the package of practical expedients permitted under the new standard which, among other things, allowed the Company to not reassess the lease classification, the lease identification and the initial direct costs for any existing leases. Further, as permitted by the standard, the Company made an accounting policy election not to record ROU assets or lease liabilities for leases with a term of 12 months or less. Instead, consistent with legacy accounting guidance, the Company will recognize payments for such leases in the consolidated statement of operations on a straight-line basis over the lease term. Upon adoption on January 1, 2019, this standard resulted in the recognition of additional assets of $3.2 million and liabilities of $3.3 million on its accompanying condensed consolidated balance sheet.transition method. The new standard did not have a materialmaterially impact on the Company’s results of operations or cash flows.
In August 2018, the FASB issued ASU No. 2018-13, Fair Value Measurement (Topic 820): Disclosure Framework—Framework — Changes to the Disclosure Requirements for Fair Value Measurement(“ASU No. 2018-13”). This amendmentstandard removes, modifies and makes certain additions to the disclosure requirements onfor fair value measurement. The amendments in ASU No. 2018-13 are effective for fiscal years beginning after on December 15, 2019, and interim periods within those fiscal years. Early adoption was permitted. The Company adopted ASU No. 2018-13 on January 1, 2020, and it did not have a material impact to its consolidated financial statement disclosures.
Accounting Standards Issued and Not Yet Adopted
In December 2019, the FASB issued ASU No. 2019-12, Income Taxes (Topic 740): Simplifying the Accounting for Income Taxes (“ASU No. 2019-12”). This standard simplifies the accounting for income taxes by removing certain exceptions to the general principles in Accounting Standards Codification Topic 740, Income Taxes, and clarifies and amends certain existing guidance. The amendments in ASU No. 2019-12 are effective for fiscal years beginning after December 15, 2020, and interim periods within those fiscal years. Early adoption is permitted. The Company is currently evaluating the impact that the adoption of this new standard will have on its consolidated financial statements.
Note 2—Acquisitions
Growlr
On March 5, 2019, the Company acquired 100% of the issued and outstanding units of Initech, LLC, a privately held company that owns and operates Growlr (“Growlr”), a leading same-sex social app, for cash consideration of $11.8 million, plus an earnout of up to $2.0 million (the “Growlr Acquisition”). The Growlr Acquisition was funded by $4.8 million of cash on hand and a draw down of $7.0 million from the Company’s Revolving Credit Facility. See Note 6—Long-Term Debt for further details on the Revolving Credit Facility. The earnout of $2.0 million is to be paid in annual $1.0 million installments over the next two years if certain revenue metrics are achieved in each year. The Company expects goodwill to be deductible for tax purposes.
The acquisition-date fair value of the consideration transferred is as follows:
|
| | | |
| | At March 5, 2019 |
| | |
Cash consideration (1) | $ | 11,807,925 |
|
| Contingent consideration | 1,718,000 |
|
| Total consideration | $ | 13,525,925 |
|
(1) Cash consideration includes a $1.0 million escrow payment to be paid out 18 months from the date of the transaction.
The following is the preliminary purchase price allocation as of the March 5, 2019 acquisition date:
|
| | | |
| | At March 5, 2019 |
| Accounts receivable | $ | 544,632 |
|
| Intangible assets | 3,480,000 |
|
| Accrued expenses and other current liabilities | (10,000 | ) |
| Deferred revenue | (102,058 | ) |
| Net assets acquired | 3,912,574 |
|
| Goodwill | 9,613,351 |
|
| Total consideration | $ | 13,525,925 |
|
The preliminary fair values of the Growlr trademarks were determined using an income approach. The preliminary fair value of software acquired, which represents the primary platform on which the Growlr apps operate, was determined using a cost approach. The preliminary fair value of customer relationships was determined using an excess earnings approach. The amounts assigned to the identifiable intangible assets are as follows:
|
| | | | | |
| | Fair Value | | Weighted Average
Amortization Period
(Years) |
| Trademark | $ | 1,200,000 |
| | 10.0 |
| Software | 865,000 |
| | 3.0 |
| Customer relationships | 1,415,000 |
| | 3.6 |
| Total identifiable intangible assets | $ | 3,480,000 |
| | 5.7 |
The operatingposition, results of Growlr for the period from March 5, 2019 to June 30, 2019 are included in the Company’s consolidated statements of operations and comprehensive income (loss) for the three and six months ended June 30, 2019. Results include revenues of $0.9 million and $1.1 million and net income of approximately $0.2 million for eachcash flows.
Impact of the three and six months ended June 30, 2019 respectively. Novel Coronavirus
The Company incurred a total of $0.3 million in transaction costs in connection with the Growlr Acquisition, which were included in acquisition and restructuring costs within the consolidated statement of operations and comprehensive income (loss) for the six months ended June 30, 2019.
The following pro forma information shows the results of the Company’s operations for the three and six months ended June 30, 2019 and 2018 as if the Growlr Acquisition had occurred on January 1, 2018. The pro forma information is presented for informational purposes only and is not necessarily indicative of what would have occurred if the Growlr Acquisition had been made as of that date.
|
| | | | | | | | | | | | | | | |
| | Three Months Ended June 30, | | Six Months Ended June 30, |
| | 2019 | | 2018 | | 2019 | | 2018 |
| Revenues | $ | 52,232,377 |
| | $ | 43,978,616 |
| | $ | 102,819,067 |
| | $ | 82,788,321 |
|
| Net income (loss) | 2,387,322 |
| | 26,823 |
| | 4,052,879 |
| | (3,904,885 | ) |
Note 3—Fair Value Measurements
Accounting Standards Codification (“ASC”) Topic 820, Fair Value Measurement establishes a fair value hierarchy for instruments measured at fair value that distinguishes between assumptions based on market data (observable inputs) and the Company’s own assumptions (unobservable inputs). Observable inputs are inputs that market participants would use in pricing the asset or liability based on market data obtained from sources independent of the Company. Unobservable inputs are inputs that reflect the Company’s assumptions about the inputs that market participants would use in pricing the asset or liability, and are developed based on the best information available in the circumstances.
ASC 820 identifies fair value as the exchange price, or exit price, representing the amount that would be received to sell an asset or paid to transfer a liability in an orderly transaction between market participants. As a basis for considering market participant assumptions in fair value measurements, ASC 820 establishes a three-tier fair value hierarchy that distinguishes among the following:
Level 1—Valuations based on unadjusted quoted prices in active markets for identical assets or liabilities that the Company has the ability to access.
Level 2—Valuations based on quoted prices for similar assets or liabilities in active markets, quoted prices for identical or similar assets or liabilities in markets that are not active and models for which all significant inputs are observable, either directly or indirectly.
Level 3—Valuations based on inputs that are unobservable and significant to the overall fair value measurement.
To the extent that the valuation is based on models or inputs that are less observable or unobservable in the market, the determination of fair value requires more judgment. Accordingly, the degree of judgment exercised by the Company in determining fair value is greatest for instruments categorized in Level 3. A financial instrument’s level within the fair value hierarchy is based on the lowest level of any input that is significant to the fair value measurement.
Derivative Financial Instruments
Currently, the Company uses an interest rate swap, interest rate cap and a cross currency swapto manage its interest raterisk. The valuation of these instruments is determined using widely accepted valuation techniques, including discounted cash flow analysis on the expected cash flows of each derivative. This analysis reflects the contractual terms of the derivatives, including the period to maturity, and uses observable market-based inputs, including interest rate curves and implied volatilities. The fair values of the interest rate swap and the cross currency swap are determined using the market standard methodology of netting the discounted future fixed cash receipts (or payments) and the discounted expected variable cash payments (or receipts). The variable cash payments (or receipts) are based on an expectation of future interest rates (forward curves) derived from observable market interest rate curves.
The fair value of the interest rate cap is determined using the market standard methodology of discounting the future expected cash receipts that would occur if variable interest rates rise above the strike rate of the cap. The variable interest rates used in the calculation of projected receipts on the cap are based on an expectation of future interest rates derived from observable market interest rate curves and volatilities.
To comply with the provisions of ASC 820, the Company incorporates credit valuation adjustments to appropriately reflect both its nonperformance risk and the respective counterparty’s nonperformance risk in the fair value measurements. In adjusting the fair value of the Company’s derivative contracts for the effect of nonperformance risk, the Company has considered the impact of netting and any applicable credit enhancements, such as collateral postings, thresholds, mutual puts and guarantees. The Company made an accounting policy election to measure the credit risk of its derivative financial instruments that are subject to master netting agreements on a net basis by counterparty portfolio.
Although the Company has determined that the majority of the inputs used to value its derivatives fall within Level 2 of the fair value hierarchy, the credit valuation adjustments associated with its derivatives utilize Level 3 inputs, such as estimates of current credit spreads to evaluate the likelihood of default by the Company and its counterparties. The Company has determined thatclosely monitoring the impact of the credit valuation adjustments made to2019 novel coronavirus (“COVID-19”) on all aspects of its derivative contracts, which determinationbusiness. COVID-19 was baseddeclared a global pandemic by the World Health Organization on March 11, 2020 and the U.S. President declared the COVID-19 outbreak a national emergency. While the COVID-19 pandemic has had minimal impact on the fair value of each individual contract, was not significantCompany’s operations and financial results to date, the overall valuation. As a result, allfuture impacts of the pandemic and any resulting economic impact are largely unknown and rapidly evolving. It is possible that the COVID-19 pandemic, the measures taken by the governments of countries affected and the resulting economic impact may negatively impact the Company’s derivativesresults of operations, cash flows and financial position as well as its vendors, advertising partners and users.
Note 2 — Credit Risk and Allowance for Credit Losses
The Company is exposed to significant concentrations of credit risk for certain of its financial assets, including cash, cash equivalents and accounts receivable.
Cash and Cash Equivalents
Cash is carried on the Company’s consolidated balance sheets at amortized cost and consists primarily of U.S. dollars and euros held in insured depository accounts with major U.S. and international banks and financial institutions. The Company believes its risk of credit losses for cash is remote, and, accordingly, its allowance for credit losses was insignificant as of June 30, 2019March 31, 2020 and December 31, 2018 were classified as Level 22019. As of the fair value hierarchy. See Note 10—DerivativesMarch 31, 2020 and Hedging Activities for further discussionDecember 31, 2019, $25.4 million and $19.7 million of cash exceeded depository insurance limits, respectively.
The Company invests certain of its cash in cash equivalents that are high-quality, liquid money market funds maintained by major U.S. and international banks and financial institutions, and it does not have a history of any losses on derivative financial instruments.
Recurring Fair Value Measurements
Itemsits cash and/or cash equivalents. The Company’s cash equivalents are measured at fair value on its consolidated balance sheets using Level 1 inputs of the fair value hierarchy.
Accounts Receivable, Net
Accounts receivable are carried on the Company’s consolidated balance sheets at amortized cost, net of an allowance for expected credit losses. The Company extends credit in the normal course of business to both U.S. and international customers on a recurringnon-collateralized basis include money market mutual funds, derivativesunder payment terms that typically range from 30 to 120 days. Accounts receivable are written-off in the period that management determines they are uncollectible.
The following table sets forth the composition of accounts receivable, net as of March 31, 2020 and hedging instrumentsDecember 31, 2019:
|
| | | | | | | |
| (in thousands) | March 31, 2020 | | December 31, 2019 |
| Accounts receivable | $ | 24,476 |
| | $ | 25,503 |
|
| Less: Allowance for credit losses | (510 | ) | | (269 | ) |
| Accounts receivable, net | $ | 23,966 |
| | $ | 25,234 |
|
The Company estimates an allowance for credit losses on its accounts receivable using historical information, current events and contingent consideration. Duringreasonable and supportable forecasts of future events. Such information includes, but is not limited to, the periods presented,Company’s historical collections trends, its customers’ credit histories and other financial information, customer type, customer-specific circumstances, industry, peer and economic data. To estimate the allowance for credit losses, the Company has not changed the manner in which it values assets and liabilitiesuses an aging method that are measured at fair value using Level 3 inputs. The following fair value hierarchy table presents information aboutassigns a provision for expected credit losses to each majoraging category of the Company’s financial assets and liabilities measured at fair value onaccounts receivable, including current accounts, which increases as accounts age and/or extend past their due dates. The Company does not have a recurring basis:significant history of material losses from uncollectible accounts.
|
| | | | | | | | | | | | | | | |
| | Quoted Prices in Active Markets for Identical Items (Level 1) | | Significant Other Observable Inputs (Level 2) | | Significant Unobservable Inputs (Level 3) | | Total |
| June 30, 2019 | | | | | | | |
| Assets | | | | | | | |
| Money market | $ | 8,164,197 |
| | $ | — |
| | $ | — |
| | $ | 8,164,197 |
|
| Derivative assets | — |
| | 762,757 |
| | — |
| | 762,757 |
|
| Total assets | $ | 8,164,197 |
| | $ | 762,757 |
| | $ | — |
| | $ | 8,926,954 |
|
| Liabilities | | | | | | | |
| Contingent consideration | $ | — |
| | $ | — |
| | $ | 1,781,667 |
| | $ | 1,781,667 |
|
| Derivative liability | — |
| | 231,092 |
| | — |
| | 231,092 |
|
| Total liabilities | $ | — |
| | $ | 231,092 |
| | $ | 1,781,667 |
| | $ | 2,012,759 |
|
| December 31, 2018 | | | | | | | |
| Assets | | | | | | | |
| Money market | $ | 7,639,866 |
| | $ | — |
| | $ | — |
| | $ | 7,639,866 |
|
| Derivative asset | — |
| | 972,784 |
| | — |
| | 972,784 |
|
| Total assets | $ | 7,639,866 |
| | $ | 972,784 |
| | $ | — |
| | $ | 8,612,650 |
|
| Liabilities | | | | | | | |
| Derivative liability | $ | — |
| | $ | 940,216 |
| | $ | — |
| | $ | 940,216 |
|
| Total liabilities | $ | — |
| | $ | 940,216 |
| | $ | — |
| | $ | 940,216 |
|
The following table sets forth a summary of the changes in the fair valueCompany’s allowance for credit losses related to accounts receivable for the three months ended March 31, 2020 and 2019:
|
| | | | | | | | |
| | | Three Months Ended March 31, |
| (in thousands) | | 2020 | | 2019 |
| Balance as of January 1 | | $ | 428 |
| | $ | 384 |
|
| Provision for expected credit losses | | 82 |
| | 325 |
|
| Balance as of March 31 | | $ | 510 |
| | $ | 709 |
|
Concentration of Credit Risk
Three customers, which were advertising aggregators or payment processors representing thousands of advertisers, comprised 63% and 42% of the Company’s contingent consideration liability, which represents a recurring measurement that is classified within Levelaccounts receivable as of March 31, 2020 and December 31, 2019, respectively.
Note 3 — Prepaid Expenses and Other Current Assets
The following table sets forth the composition of prepaid expenses and other current assets as of March 31, 2020 and December 31, 2019:
|
| | | | | | | |
| (in thousands) | March 31, 2020 | | December 31, 2019 |
| Value-added tax and income tax receivables | $ | 1,786 |
| | $ | 1,312 |
|
| Fair value of derivative assets | 655 |
| | 583 |
|
| Prepaid insurance | 402 |
| | 659 |
|
| Prepaid support contracts | 555 |
| | 443 |
|
| Prepaid service providers | 1,606 |
| | 1,765 |
|
| Prepaid advertising | 404 |
| | 680 |
|
| Other prepaid expenses and other current assets | 412 |
| | 620 |
|
| Total prepaid expenses and other current assets | $ | 5,820 |
| | $ | 6,062 |
|
Note 4 — Property and Equipment, Net
The following table sets forth the composition of the fair value hierarchy, wherein fair valueCompany’s property and equipment, net as of March 31, 2020 and December 31, 2019:
|
| | | | | | | |
| (in thousands) | March 31, 2020 | | December 31, 2019 |
| Servers, computer equipment and software | $ | 14,930 |
| | $ | 14,901 |
|
| Office furniture and equipment | 879 |
| | 863 |
|
| Leasehold improvements | 677 |
| | 671 |
|
| Total property and equipment | 16,486 |
| | 16,435 |
|
| Less: Accumulated depreciation | (13,439 | ) | | (12,810 | ) |
| Total property and equipment, net | $ | 3,047 |
| | $ | 3,625 |
|
Depreciation expense was $0.6 million for each of the three months ended March 31, 2020 and 2019.
Note 5 —Leases
The Company has operating leases for its operating facilities, data center storage facilities and certain data storage equipment in the U.S. and Germany, and finance leases for certain data centers, printers and other furniture in its German offices. The Company's lease terms include options to extend or terminate the lease and the Company includes these options in the lease term when it is estimated using significant unobservable inputs:reasonably certain to exercise that option.
The following table sets forth the Company’s lease costs for the three months ended March 31, 2020 and 2019:
|
| | | |
| Contingent
Consideration |
| Balance as of December 31, 2018 | $ | — |
|
| Amounts acquired | 1,718,000 |
|
| Accretion | 63,667 |
|
| Balance as of June 30, 2019 | $ | 1,781,667 |
|
|
| | | | | | | | |
| | | Three Months Ended March 31, |
| (in thousands) | | 2020 | | 2019 |
| Lease costs: | | | | |
Operating lease cost(1) | | $ | 723 |
| | $ | 725 |
|
| | | | | |
| Finance lease cost: | | | | |
| Depreciation expense | | $ | 5 |
| | $ | 2 |
|
| Interest on lease liabilities | | 1 |
| | 2 |
|
| Total finance lease cost | | $ | 6 |
| | $ | 4 |
|
(1) Short-term lease costs were immaterial.
The following table sets forth the supplemental cash flow information for the Company’s leases for the three months ended March 31, 2020 and 2019:
|
| | | | | | | |
| | Three Months Ended March 31, |
| (in thousands) | 2020 | | 2019 |
| Cash paid for amounts included in the measurement of lease liabilities: | | | |
| Operating cash flows for operating leases | $ | 683 |
| | $ | 738 |
|
| Operating cash flows for finance leases | $ | 1 |
| | $ | 2 |
|
| Financing cash flows for finance leases | $ | 5 |
| | $ | 41 |
|
| | | | |
| Right-of-use assets obtained in exchange for lease obligations: | | | |
| Operating leases | $ | 794 |
| | $ | 4,070 |
|
The following table sets forth the Company’s aggregate future lease payments for operating and finance leases as of March 31, 2020:
|
| | | | | | | | |
| (in thousands) | | | | |
| Years Ending December 31, | | Operating Leases | | Finance Leases |
| Remaining in 2020 | | $ | 2,167 |
| | $ | 9 |
|
| 2021 | | 2,459 |
| | 12 |
|
| 2022 | | 1,109 |
| | 12 |
|
| 2023 | | 585 |
| | 12 |
|
| 2024 | | 549 |
| | 12 |
|
| Thereafter | | 1,163 |
| | 9 |
|
| Total minimum lease payments | | 8,032 |
| | 66 |
|
| Less: Amount representing interest | | 782 |
| | 9 |
|
| Present value of minimum lease payments | | 7,250 |
| | 57 |
|
| Less: Current portion | | 2,527 |
| | 9 |
|
| Long-term portion | | $ | 4,723 |
| | $ | 48 |
|
The Company determinedfollowing table sets forth the fair value of its contingent consideration liabilities using the income approach with assumedCompany’s weighted-average remaining lease terms and discount rates and payment probabilities. as of March 31, 2020:
|
| | |
| Weighted-average Remaining Lease Terms and Discount Rates |
| Weighted-average remaining lease terms (years): | |
| Operating leases | 4.27 |
|
| Finance leases | 5.50 |
|
| |
| Weighted-average discount rates: | |
| Operating leases | 4.41 | % |
| Finance leases | 3.06 | % |
Note 6 — Intangible Assets, Net
The income approach uses Level 3, or unobservable inputs, as defined underfollowing table sets forth the accounting guidance, for fair value measurements. Based oncomposition of the Company’s projected results, the Company estimated the probability of success to be 100% for the contingent consideration related to the Growlr Acquisitionintangible assets, net as of June 30, 2019. The contingent consideration is recorded in accrued expensesMarch 31, 2020 and other long-term liabilities on the accompanying condensed consolidated balance sheet as of June 30, 2019.
The Company recognizes transfers between levels of the fair value hierarchy as of the end of the reporting period. There were no transfers within the levels of the fair value hierarchy during the six months ended June 30, 2019 and as of the year ended December 31, 2018.
Note 4— Intangible Assets and Goodwill
Intangible assets consist of the following:
2019:
| | | | June 30, 2019 | March 31, 2020 |
| | Gross Carrying Amount | | Accumulated Amortization | | Net Carrying Amount | |
| (in thousands) | | Gross Carrying Amount | | Accumulated Amortization | | Net Carrying Amount |
| Trademarks and domain names | $ | 35,798,758 |
| | $ | (15,474,450 | ) | | $ | 20,324,308 |
| $ | 35,381 |
| | $ | (18,266 | ) | | $ | 17,115 |
|
| Customer relationships | 15,293,096 |
| | (8,629,061 | ) | | 6,664,035 |
| 15,183 |
| | (10,621 | ) | | 4,562 |
|
| Software | 19,578,444 |
| | (11,918,253 | ) | | 7,660,191 |
| 19,537 |
| | (14,269 | ) | | 5,268 |
|
| Total | $ | 70,670,298 |
| | $ | (36,021,764 | ) | | $ | 34,648,534 |
| |
| Total intangible assets, net | | $ | 70,101 |
| | $ | (43,156 | ) | | $ | 26,945 |
|
|
| | | | | | | | | | | |
| | December 31, 2019 |
| (in thousands) | Gross Carrying Amount | | Accumulated Amortization | | Net Carrying Amount |
| Trademarks and domain names | $ | 35,602 |
| | $ | (17,423 | ) | | $ | 18,179 |
|
| Customer relationships | 15,248 |
| | (10,081 | ) | | 5,167 |
|
| Software | 19,561 |
| | (13,602 | ) | | 5,959 |
|
| Total intangible assets, net | $ | 70,411 |
| | $ | (41,106 | ) | | $ | 29,305 |
|
|
| | | | | | | | | | | |
| | December 31, 2018 |
| | Gross Carrying Amount | | Accumulated Amortization | | Net Carrying Amount |
| Trademarks and domain names | $ | 34,636,802 |
| | $ | (13,406,226 | ) | | $ | 21,230,576 |
|
| Customer relationships | 13,901,313 |
| | (7,130,285 | ) | | 6,771,028 |
|
| Software | 18,722,187 |
| | (10,165,352 | ) | | 8,556,835 |
|
| Total | $ | 67,260,302 |
| | $ | (30,701,863 | ) | | $ | 36,558,439 |
|
Amortization expense was approximately $2.8$2.2 million and $3.0$2.6 million for the three months ended June 30,March 31, 2020 and 2019, and 2018, respectively, and $5.3 million and $6.0 million forrespectively.
The following table sets forth the six months ended June 30, 2019 and 2018, respectively.
AnnualCompany’s annual future amortization expense on intangible assets for the Company’s intangible assets isnext five years and thereafter as follows:
of March 31, 2020:
|
| | | | |
| (in thousands) | | Amortization |
| Years Ending December 31, | | Expense |
| Remaining in 2020 | | $ | 6,349 |
|
| 2021 | | 7,058 |
|
| 2022 | | 4,120 |
|
| 2023 | | 2,723 |
|
| 2024 | | 2,160 |
|
| Thereafter | | 4,535 |
|
| Total amortization expense | | $ | 26,945 |
|
|
| | | |
| Year ending December 31, | Amortization Expense |
| Remaining in 2019 | $ | 5,210,855 |
|
| 2020 | 8,590,701 |
|
| 2021 | 7,108,018 |
|
| 2022 | 4,164,598 |
|
| 2023 | 2,762,863 |
|
| Thereafter | 6,811,499 |
|
| Total | $ | 34,648,534 |
|
Note 7 —Goodwill
The changesfollowing table sets forth the change in the carrying amount of goodwill for the six months ended June 30, 2019 are as follows:
|
| | | |
| | June 30, 2019 |
| Balance at December 31, 2018 | $ | 148,132,873 |
|
| Goodwill acquired from Growlr Acquisition | 9,613,351 |
|
| Foreign currency translation adjustments | (357,904 | ) |
| Balance at June 30, 2019 | $ | 157,388,320 |
|
Note 5— Property and Equipment
Property and equipment consist of the following:
|
| | | | | | | |
| | June 30,
2019 | | December 31,
2018 |
| Servers, computer equipment and software | $ | 14,287,458 |
| | $ | 13,656,176 |
|
| Office furniture and equipment | 621,800 |
| | 574,559 |
|
| Leasehold improvements | 648,134 |
| | 646,123 |
|
| | 15,557,392 |
| | 14,876,858 |
|
| Less accumulated depreciation | (11,530,359 | ) | | (10,243,094 | ) |
| Property and equipment - net | $ | 4,027,033 |
| | $ | 4,633,764 |
|
Property and equipment depreciation expense was approximately $0.7 million and $0.6 millionCompany’s goodwill for the three months ended June 30, 2019 and 2018, respectively, and $1.3 million and $1.1 million for the six months ended June 30, 2019 and 2018, respectively.March 31, 2020:
|
| | | |
| (in thousands) | Goodwill |
| Balance as of January 1, 2020 | $ | 156,687 |
|
| Foreign currency translation adjustment | (994 | ) |
| Balance as of March 31, 2020 | $ | 155,693 |
|
Note 6—Long-Term Debt8 — Accrued Liabilities
The following table sets forth the composition of the Company’s accrued liabilities as of March 31, 2020 and December 31, 2019:
|
| | | | | | | |
| (in thousands) | March 31, 2020 | | December 31, 2019 |
| Accrued broadcaster fees, net of breakage | $ | 5,994 |
| | $ | 5,350 |
|
| Accrued professional fees | 2,551 |
| | 1,889 |
|
| Accrued employee-related costs | 2,710 |
| | 4,803 |
|
| Accrued service providers | 337 |
| | 940 |
|
| Accrued advertising | 1,472 |
| | 2,315 |
|
| Accrued current tax payable | 717 |
| | 1,209 |
|
| Accrued value-added, sales, use and other taxes | 1,691 |
| | 1,472 |
|
| Contingent consideration | 917 |
| | — |
|
| Other accrued expenses | 2,526 |
| | 2,112 |
|
| Total accrued liabilities | $ | 18,915 |
| | $ | 20,090 |
|
Note 9 —Debt
The following table sets forth the composition of the Company’s debt as of March 31, 2020 and December 31, 2019:
|
| | | | | | | |
| (in thousands) | March 31, 2020 | | December 31, 2019 |
| Term loan facility | $ | 33,250 |
| | $ | 34,125 |
|
| Less: Debt discount, net | (174 | ) | | (192 | ) |
| Less: Debt issuance costs, net | (53 | ) | | (58 | ) |
| Net carrying amount | 33,023 |
| | 33,875 |
|
| Less: Current portion | 3,500 |
| | 3,500 |
|
| Long-term debt, net | $ | 29,523 |
| | $ | 30,375 |
|
Credit Facilities
On September 18, 2017, in connection withFor the Company’s acquisition of all ofthree months ended March 31, 2020, the outstanding shares of Lovoo (the “Lovoo Acquisition”), the Company entered into an amended and restated credit agreement (the “Amended and Restated Credit Agreement”) with the several banks and other financial institutions party thereto and JPMorgan Chase Bank, N.A., as administrative agent (the “Agent”), amending and restating the Credit Agreement, dated March 3, 2017. The Amended and Restated Credit Agreement provides for a $20.0 million revolving credit facility (the “Revolving Credit Facility”) and a $60.0 million delayed draw term loan facility (the “Term Loan Facility,” and together with the “Revolving Credit Facility”, the “Credit Facilities”). On October 18, 2017, the Company drew down $60.0 million from its Term Loan Facility in connection with the Lovoo Acquisition. Fees and direct costs incurred when the Company entered into the Credit Facilities were $0.6 million. Fees and direct costs incurred are offset against long-term debt on the accompanying condensed consolidated balance sheets.
On March 7, 2018, the Company entered into an amendment to the Amended and Restated Credit Agreement, that among other things, amends the definition of “Applicable Rate” and “EBITDA” and makes certain changes to the financial covenants. On July 27, 2018, the Company entered into an amendment to the Amended and Restated Credit Agreement that amends the Company’s obligation to use certain of its excess cash flow to prepay its obligations under the Credit Agreement by limiting the applicable period for the fiscal year ended December 31, 2017 to the period commencing October 31, 2017 and ended December 31, 2017. The Company made an excess cash flow payment of approximately $4.3 million in the third quarter of 2018.
In March 2019, the Company made an excess cash flow payment of $3.6 million related to the fiscal year end December 31, 2018. On March 5, 2019, in connection with the Growlr Acquisition, as discussed in Note 2—Acquisitions, the Company drew down $7.0 million from its Revolving Credit Facility. Borrowings on the Revolving Credit Facility are included in long-term debt, less current portion, net, on the accompanying condensed consolidated balance sheets.
The Company intends to use the remaining proceeds of the Revolving Credit Facility to finance working capital needs and for general corporate purposes. Amounts under the Revolving Credit Facility may be borrowed, repaid and re-borrowed from time to time until the maturity date of the Credit Agreement on September 18, 2020. The Term Loan Facility is subject to quarterly payments of principal in an amount equal to $3,750,000 commencing December 31, 2017 and continuing through maturity. At the Company’s election, loans made under the Credit Facilities will bear interest at either (i) a base rate (“Base Rate”) plus an applicable margin or (ii) a London interbank offered rate (“LIBO Rate”) plus an applicable margin, subject to adjustment if an event of default under the Amended and Restated Credit Agreement has occurred and is continuing. The Base Rate means the highest of (a) the Agent’s “prime rate,” (b) the federal funds effective rate plus 0.50% and (c) the LIBO Rate for an interest period of one month plus 1%. The Company’s present and future domestic subsidiaries (the “Guarantors”) will guarantee the obligations of the Company and its subsidiaries under the Credit Facilities. The obligations of the Company and its subsidiaries under the Credit Facilities are secured by all of the assets of the Company and the Guarantors, subject to certain exceptions and exclusions as set forth in the Amended and Restated Credit Agreement and other loan documents.
The Credit Facilities consist of the following:
|
| | | | | | | |
| | June 30, 2019 | | December 31, 2018 |
| Credit Facilities | | | |
| Term Loan Facility | $ | 25,873,574 |
| | $ | 36,940,158 |
|
| Revolving Credit Facility | 7,000,000 |
| | — |
|
| Total Credit Facilities | 32,873,574 |
| | 36,940,158 |
|
| Less: Debt discount, net | (191,612 | ) | | (285,618 | ) |
| Net carrying amount | $ | 32,681,962 |
| | $ | 36,654,540 |
|
| Less: current portion | 15,000,000 |
| | 18,566,584 |
|
| Long-term debt, net | $ | 17,681,962 |
| | $ | 18,087,956 |
|
The weighted averageweighted-average interest rate on the Credit Facilities at June 30, 2019Company’s term loan facility amounted to 3.69%, and the unused commitment fee on the Company’s revolving credit facility was 5.83%.0.25% per annum. There were 0 outstanding borrowings under the Company’s revolving credit facility as of March 31, 2020.
The Company was in compliance with its debt covenants as of March 31, 2020.
Scheduled Principal Payments
The following table sets forth the Company’s minimum future principal payments under the credit facilities as of March 31, 2020:
|
| | | | |
| (in thousands) | | Minimum |
| Years Ending December 31, | | Principal Payments |
| Remaining in 2020 | | $ | 2,625 |
|
| 2021 | | 3,500 |
|
| 2022 | | 27,125 |
|
| Total minimum principal payments | | $ | 33,250 |
|
Note 7— 10—Commitments and Contingencies
Cloud Data Storage
The Company stores a portion of its user and business data using Amazon Web Services in the U.S. with a minimum commitment agreement that expires in 2021. Lovoo stores2021, and a majority of its user and business data in the Google Cloud Platform in Germany under a noncancelablenon-cancelable minimum commitment agreement that expires in 2023.
A summary ofThe following table sets forth the minimum future commitments requiredcommitment payments under the Company’s cloud data storage contracts as of June 30, 2019 are as follows:
March 31, 2020:
|
| | | | |
| | | Minimum Commitment Payments |
| (in thousands) | |
| Years Ending December 31, | |
| Remaining in 2020 | | $ | 3,814 |
|
| 2021 | | 6,862 |
|
| 2022 | | 1,023 |
|
| 2023 | | 1,125 |
|
| Total minimum commitment payments | | $ | 12,824 |
|
|
| | | | |
| For the Years Ending December 31, | | Cloud Data Storage |
| Remaining in 2019 | | $ | 2,654,058 |
|
| 2020 | | 5,706,469 |
|
| 2021 | | 6,895,895 |
|
| 2022 | | 1,057,227 |
|
| 2023 | | 1,162,950 |
|
| Thereafter | | — |
|
| Total minimum lease payments | | $ | 17,476,599 |
|
Credit Facility
A summary of minimum future principal payments under our Credit Facilities as of June 30, 2019 are as follows:
|
| | | | |
| For the Years Ending December 31, | | Credit Facilities(1) |
| Remaining in 2019 | | $ | 7,500,000 |
|
| 2020 | | 25,373,574 |
|
| Total minimum loan payments | | $ | 32,873,574 |
|
| |
(1) | Interest rates on the Credit Facilities are variable in nature, however, the Company is party to a fixed-pay amortizing interest rate swap having a remaining notional amount of $18.8 million and a non-amortizing interest rate cap with a notional amount of $10.7 million. If interest rates were to remain at the June 30, 2019 level, we would receive interest payments of $0.04 million in 2019 and $0.02 millionin2020 of net settlements on the fixed-pay amortizing interest rate swap and non-amortizing interest rate cap.
|
Litigation
From time to time, we arethe Company is party to certain legal proceedings that arise in the ordinary course of, and are incidental to, ourits business. We operate ourThe Company operates its business online, which is subject to extensive regulation by U.S. federal and state and foreign governments. Future events or circumstances, currently unknown to management, will determine whether the resolution of pending or threatened litigation or claims will ultimately have a material effect on ourthe Company’s consolidated financial position, liquidity or results of operations in any future reporting periods.
Note 11—Stockholders’ Equity
Tax Benefits Preservation Plan
In connection with the execution of the Merger Agreement, the Company entered into an amendment to its Tax Benefits Preservation Plan to render it inapplicable to the Merger Agreement, the execution thereof and the performance or consummation of the transactions contemplated thereby, including, without limitation, the Merger.
Retirement PlanStock-based Compensation Expense
The Company maintains The Meet Group, Inc. 401(k) Retirement Plan (the “Plan”), which is a savings and investment plan intended to be qualified underfollowing table sets forth the Internal Revenue Code. The Plan covers the majorityallocation of the employees of the Company. In January 2014, the Company began providing matching contributions to the Plan, based on a participant’s contribution. The Company’s 401(k) matchstock-based compensation expense totaled $0.4 million for each of the six months ended June 30, 2019 and 2018, respectively. The expense is included in sales and marketing, product development and content, and general and administrative expenses in the condensed consolidated statements of operations and comprehensive (loss) income (loss).for the three months ended March 31, 2020 and 2019:
|
| | | | | | | |
| | Three Months Ended March 31, |
| (in thousands) | 2020 | | 2019 |
| Sales and marketing | $ | 124 |
| | $ | 70 |
|
| Product development and content | 1,928 |
| | 1,500 |
|
| General and administrative | 1,133 |
| | 855 |
|
| Total stock-based compensation expense | $ | 3,185 |
| | $ | 2,425 |
|
Note 8— Stockholders’ Equity
Preferred Stock
The total number of shares of preferred stock, $.001 par value, that the Company is authorized to issue is 5,000,000.
The Board of Directors may, without further action by the stockholders, issue a series of preferred stock and fix the rights and preferences of those shares, including the dividend rights, dividend rates, conversion rights, exchange rights, voting rights, terms of redemption, redemption price or prices, liquidation preferences, the number of shares constituting any series and the designation of such series.
As of June 30, 2019March 31, 2020, there was $0.1 million, $14.0 million and December 31, 2018 there were no shares$3.0 million of preferredtotal unrecognized stock-based compensation expense, which is expected to be recognized over a weighted-average vesting period of 0.3 years, 1.4 years and 1.9 years for the Company’s stock issued and outstanding.
Common Stock
The total number of shares of common stock, $0.001 par value, that the Company is authorized to issue is 100,000,000.
The Company issued shares of common stock of 157,334 and 1,079,496 related to exercises of stock options, and 1,372,723 and 1,591,662 related to restricted stock awards in the six months ended June 30, 2019(“RSAs”) and the year ended December 31, 2018,performance share units (“PSUs”), respectively.
On June 14, 2019, the Company announced that its Board of Directors had approved a share repurchase program that authorizes the Company to purchase up to $30.0 million of common stock in the open market or through negotiated transactions intended to comply with SEC Rule 10b-18, which may be facilitated through one or more 10b5-1 share repurchase plans with a third party broker. The share repurchase program is effective through 2021. During the three and six months ended June 30, 2019, the Company did not repurchase any shares under this program.Stock Options
Stock-Based Compensation
The fair value ofStock-based compensation expense for stock options iswas estimated on the date of grant using the Black-Scholes option pricing model, based on weighted average assumptions. Expected volatility is based on historical volatility of the Company’s common stock. The risk-free rate is based on the U.S. Treasury yield curve in effect over the expected term at the time of grant. Compensation expense is recognizedand amortized on a straight-line basis over the requisite service period of the award. The Company uses the simplified method to determine the expected option term since the Company’s stock option exercise experience does not provide a reasonable basis upon which to estimate the expected option term.
The Company began granting RSAs to its employees in April 2013.based on their fair value. The fair value of RSAs is determinedstock options was estimated on the grant date using the fair valueBlack-Scholes option pricing model, based on weighted-average assumptions. Stock options generally vest over a three-year period with 33% vesting at the end of year one and the remaining vesting annually thereafter. The Company has not awarded any stock options since November 2017.
The following table sets forth the Company’s common stock onoptions activity for the datethree months ended March 31, 2020:
|
| | | | | | | | | | | | | |
| | | Number of Stock Options | | Weighted- average Exercise Price | | Weighted- average Remaining Contractual Life (Years) | | Aggregate Intrinsic Value |
(in thousands, except share and per share data) Stock Options | | | | |
| Outstanding as of January 1, 2020 | | 3,680,146 |
| | $ | 3.60 |
| | | | |
|
| Exercised | | (162,841 | ) | | 3.47 |
| | | | |
|
| Forfeited or expired | | (85,000 | ) | | 3.65 |
| | | | |
|
| Outstanding as of March 31, 2020 | | 3,432,305 |
| | $ | 3.61 |
| | 4.8 | | $ | 7,791 |
|
| Exercisable as of March 31, 2020 | | 3,333,817 |
| | $ | 3.60 |
| | 4.7 | | $ | 7,607 |
|
The total intrinsic values of grant. stock options exercised during the three months ended March 31, 2020 and 2019 were $0.4 million and $0.2 million, respectively. The Company recorded stock-based compensation expense related to its stock options of $0.2 million and $0.4 million and for the three months ended March 31, 2020 and 2019, respectively.
Restricted Stock Awards
Stock-based compensation expense for RSAs is amortizedrecognized on a straight-line basis over the requisite service period. RSAs generally vest over a three-year period with 33% vesting at the end of year one year and the remaining vesting annually thereafter.
The following table sets forth the Company’s RSA activity for the three months ended March 31, 2020:
|
| | | | | | | |
| | | Number of | | |
| | | Restricted Stock | | Weighted-average |
| Restricted Stock Awards | | Awards | | Stock Price |
| Outstanding as of January 1, 2020 | | 4,036,398 |
| | $ | 4.85 |
|
| Granted | | 620,277 |
| | 5.51 |
|
| Vested | | (295,389 | ) | | 5.18 |
|
| Forfeited or expired | | (112,723 | ) | | 5.57 |
|
| Outstanding as of March 31, 2020 | | 4,248,563 |
| | $ | 4.90 |
|
Shares are forfeited if not vested within three years from the date of grant. The Company recorded stock-based compensation expense related to its RSAs of $2.5 million and $1.9 million for the three months ended March 31, 2020 and 2019, respectively.
Performance Share Units
The Company began granting PSUs to certain employees in April and July 2018. PSUs are based on a relative Total Shareholder Returntotal shareholder return (“TSR”) metric over a performance period spanning three years from the grant date of the PSU. PSU awardsPSUs will vest at the end of the performance period and will be paid immediately in shares of common stock. Stock-based compensation expense for PSUs is estimated on the date of grant and amortized on a straight-line basis over the performance period. PSU awardsPSUs are forfeited if the participant is no longer employed on the third anniversary of the grant date, except in the event of an involuntary termination, death, disability or change in control. The Company estimated the fair value of the PSU awards using a Monte-Carlo simulation model utilizing several key assumptions including expected Company and Russell 2000 Peer Group share price volatility, correlation coefficients between peers, the risk-free rate of return, the expected dividend yield and other award design features.
The assumptions used in calculating the fair value of stock-based awards represent the Company’s best estimates, but these estimates involve inherent uncertainties and the application of management judgment. As a result, if factors change and the Company uses different assumptions, the Company’s stock-based compensation expense could be materially different in the future.
Stock-based compensation expense is recognized on a straight-line basis over the requisite service period of all awards given by the Company. Stock-based compensation expense includes incremental stock-based compensation expense and is allocated on the condensed consolidated statements of operations and comprehensive income (loss) as follows:
|
| | | | | | | | | | | | | | | |
| | Three Months Ended June 30, | | Six Months Ended June 30, |
| | 2019 | | 2018 | | 2019 | | 2018 |
| Sales and marketing | $ | 106,323 |
| | $ | 112,222 |
| | $ | 176,498 |
| | $ | 230,769 |
|
| Product development and content | 1,642,931 |
| | 1,161,863 |
| | 3,142,324 |
| | 2,275,930 |
|
| General and administrative | 1,116,082 |
| | 816,785 |
| | 1,971,231 |
| | 1,753,096 |
|
| Total stock-based compensation expense | $ | 2,865,336 |
| | $ | 2,090,870 |
| | $ | 5,290,053 |
| | $ | 4,259,795 |
|
As of June 30, 2019, there was approximately $1.0 million, $16.9 million and $3.5 million of total unrecognized compensation cost which is expected to be recognized over a weighted-average vesting period of approximately of 0.8 years, 2.2 years and 2.5 years relating to stock options, RSAs and PSUs, respectively.
Stock Compensation Plans
2018 Omnibus Incentive Plan
On June 1, 2018, the Company’s stockholders approved the 2018 Omnibus Incentive Plan (the “2018 Plan”), providing for the issuance of up to 8.8 million shares of the Company’s common stock, including approximately 0.3 million shares previously approved by the Company’s stockholders under the Company’s Amended and Restated 2012 Omnibus Incentive Plan (the “2012 Plan”), minus one share of common stock for every one share of common stock that was subject to an option granted after April 9, 2018 but before June 1, 2018 under the 2012 Plan, plus an additional number of shares of common stock equal to the number of options previously granted under the 2012 Plan and the Amended and Restated 2006 Stock Incentive Plan (the “2006 Stock Plan”) that either terminate, expire, or are forfeited after April 9, 2018 and any restricted stock awards that either terminate, expire, or are forfeited equal to the number of awards granted under the 2012 Plan and 2006 Stock Plan multiplied by the fungible ratio of 1.4. As of June 30, 2019, there were approximately 3.4 million shares of common stock available for grant.
Restricted Stock Awards Under 2018 Plan
A summary of RSA activity under the 2018 Plan during the six months ended June 30, 2019 is as follows:
|
| | | | | | | |
| RSAs | | Number of RSAs | | Weighted-Average Stock Price |
| Outstanding at December 31, 2018 | | 1,677,227 |
| | $ | 4.18 |
|
| Granted | | 2,289,591 |
| | 5.34 |
|
| Vested | | (606,623 | ) | | 4.16 |
|
| Forfeited or expired | | (85,961 | ) | | 4.90 |
|
| Outstanding and unvested at June 30, 2019 | | 3,274,234 |
| | 4.97 |
|
Shares are forfeited if not vested within three years from the date of grant and vest in three equal annual increments. The Company recorded stock-based compensation expense related to RSAs under the 2018 Plan of approximately $1.6 million and $0.1 million for the three months ended June 30, 2019 and 2018, respectively, and $2.5 million and $0.1 million for the six months ended June 30, 2019 and 2018, respectively.
Performance Share Awards Under 2018 Omnibus Incentive Plan
PSU share payouts range from a threshold of 33% to a maximum of 170% based on the relative ranking of the Company’s TSR as compared to the TSR of the companies in the Russell 2000 Peer Group.peer group. The PSU award stipulates certain limitations to the payout in the event the payout reaches a defined ceiling level or the Company’s TSR is negative.
The Company estimatedfollowing table sets forth the fair value ofCompany’s PSU activity for the PSU awards at the date of grant using a Monte-Carlo simulation model utilizing several key assumptions including expected Company and Russell 2000 Peer Group share price volatility, correlation coefficients between peers, the risk-free rate of return, the expected dividend yield and other award design features.
A summary of PSU awards under the 2018 Plan during the sixthree months ended June 30, 2019 is as follows:
March 31, 2020:
|
| | | | | | | |
| | | Number of | | |
| | | Performance Share | | Weighted-average |
| Performance Share Units | | Units | | Stock Price |
| Outstanding as of January 1, 2020 | | 1,086,100 |
| | $ | 4.34 |
|
| Granted | | 60,000 |
| | 6.61 |
|
| Outstanding as of March 31, 2020 | | 1,146,100 |
| | $ | 4.46 |
|
|
| | | | | | | |
| PSUs | | Number of
PSUs | | Weighted-Average
Stock Price |
| Outstanding at December 31, 2018 | | 60,000 |
| | $ | 4.65 |
|
| Granted | | 416,100 |
| | 6.18 |
|
| Vested | | — |
| | — |
|
| Forfeited or expired | | — |
| | — |
|
| Outstanding at June 30, 2019 | | 476,100 |
| | 5.99 |
|
The Company recorded stock-based compensation expense related to its PSUs under the 2018 Plan of approximately $0.2 million for each of the three and six months ended June 30, 2019.
Amended and Restated 2012 Omnibus Incentive Plan
On December 16, 2016, the Company’s stockholders approved the 2012 Plan, providing for the issuance of up to 10.5 million shares of the Company’s common stock, including approximately 2.1 million shares previously approved by the Company’s stockholders under the Company’s 2006 Stock Plan, less one share of common stock for every one share of common stock that was subject to an option or other award granted after December 31, 2011 under the 2006 Stock Plan, plus an additional number of shares of common stock equal to the number of shares previously granted under the 2006 Stock Plan that either terminate, expire, or are forfeited after December 31, 2011. As of June 1, 2018, grants are no longer issued from the 2012 Plan.
A summary of stock option activity under the 2012 Plan during the six months ended June 30, 2019 is as follows:
|
| | | | | | | | | | | | | |
| Options | | Number of Stock Options | | Weighted- Average Exercise Price | | Weighted Average Remaining Contractual Life | | Aggregate Intrinsic Value |
| Outstanding at December 31, 2018 | | 2,447,315 |
| | $ | 3.27 |
| | | | |
| Granted | | — |
| | — |
| | | | |
| Exercised | | (106,903 | ) | | 4.33 |
| | | | |
| Forfeited or expired | | (8,333 | ) | | 5.35 |
| | | | |
| Outstanding at June 30, 2019 | | 2,332,079 |
| | 3.22 |
| | 6.6 | | $ | 1,714,956 |
|
| Exercisable at June 30, 2019 | | 2,028,441 |
| | 3.04 |
| | 6.4 | | 1,642,040 |
|
The total intrinsic values of options exercised under the 2012 Plan was $0.2 million during each of the six months ended June 30, 2019 and 2018. The Company recorded stock-based compensation expense related to options under the 2012 Plan of approximately $0.3$0.4 million and $0.4$0.2 million for the three months ended June 30,March 31, 2020 and 2019, and 2018, respectively, and $0.6 million and $0.8 million for the six months ended June 30, 2019 and 2018, respectively.
Restricted Stock Awards Under Amended and Restated 2012 Omnibus Incentive Plan
A summary of RSA activity under the 2012 Plan during the six months ended June 30, 2019 is as follows:
|
| | | | | | | |
| RSAs | | Number of RSAs | | Weighted-Average Stock Price |
| Outstanding at December 31, 2018 | | 1,166,535 |
| | $ | 3.58 |
|
| Granted | | — |
| | — |
|
| Vested | | (758,337 | ) | | 3.30 |
|
| Forfeited or expired | | (10,066 | ) | | 4.73 |
|
| Outstanding and unvested at June 30, 2019 | | 398,132 |
| | 4.08 |
|
Shares are forfeited if not vested within three years from the date of grant and vest in three equal annual increments. The Company recorded stock-based compensation expense related to RSAs under the 2012 Plan of approximately $0.4 million and $1.1 million for the three months ended June 30, 2019 and 2018, respectively, and $1.1 million and $2.2 million for the six months ended June 30, 2019 and 2018, respectively.
Performance Share Awards Under Amended and Restated 2012 Omnibus Incentive Plan
PSU share payouts range from a threshold of 33% to a maximum of 170% based on the relative ranking of the Company’s TSR as compared to the TSR of the companies in the Russell 2000 Peer Group. The PSU award stipulates certain limitations to the payout in the event the payout reaches a defined ceiling level or the Company’s TSR is negative. The Company estimated the fair value of the PSU awards at the date of grant using a Monte-Carlo simulation model utilizing several key assumptions including expected Company and Russell 2000 Peer Group share price volatility, correlation coefficients between peers, the risk-free rate of return, the expected dividend yield and other award design features.
A summary of PSU awards under the 2012 Plan during the six months ended June 30, 2019 is as follows:
|
| | | | | | | |
| PSUs | | Number of
PSUs | | Weighted-Average
Stock Price |
| Outstanding at December 31, 2018 | | 550,000 |
| | $ | 2.94 |
|
| Granted | | — |
| | — |
|
| Vested | | — |
| | — |
|
| Forfeited or expired | | — |
| | — |
|
| Outstanding at June 30, 2019 | | 550,000 |
| | 2.94 |
|
The Company recorded stock-based compensation expense related to PSUs under the 2012 Plan of approximately $0.1 million and $0.3 million for the three and six months ended June 30, 2019, respectively, and $0.1 million in each of the three and six months ended June 30, 2018.
Amended and Restated 2006 Stock Incentive Plan
On June 27, 2007, the Company’s stockholders approved the 2006 Stock Plan, providing for the issuance of up to 3.7 million shares of common stock plus an additional number of shares of common stock equal to the number of shares previously granted under the 1998 Stock Option Plan that either terminate, expire, or lapse after the date of the Board of Directors’ approval of the 2006 Stock Plan. All options granted and outstanding have been fully expensed prior to 2016.
A summary of stock option activity under the 2006 Stock Plan during the six months ended June 30, 2019 is as follows:
|
| | | | | | | | | | | | | |
| Options | | Number of Stock Options | | Weighted- Average Exercise Price | | Weighted Average Remaining Contractual Life | | Aggregate Intrinsic Value |
| Outstanding at December 31, 2018 | | 1,074,411 |
| | $ | 4.00 |
| | | | |
| Granted | | — |
| | — |
| | | | |
| Exercised | | (23,764 | ) | | 3.78 |
| | | | |
| Forfeited or expired | | — |
| | — |
| | | | |
| Outstanding at June 30, 2019 | | 1,050,647 |
| | 4.00 |
| | 2.3 | | $ | 25,200 |
|
| Exercisable at June 30, 2019 | | 1,006,468 |
| | 4.02 |
| | 2.3 | | 25,200 |
|
The total intrinsic values of options exercised under the 2006 Stock Plan were $0.05 million during the six months ended June 30, 2019. No options under the 2006 Stock Plan were exercised during the six months ended June 30, 2018.
Amended and Restated 2016 Inducement Omnibus Incentive Plan
On October 3, 2016, in connection with the closing of the acquisition of Skout, the Company’s Board of Directors adopted the 2016 Inducement Omnibus Incentive Plan in accordance with NASDAQ Listing Rule 5635(c)(4). At the closing of the acquisition of Skout, the Company granted stock options to purchase an aggregate of up to 355,000 shares of its common stock to 25 former Skout employees as an inducement material to becoming non-executive employees of the Company. On February 27, 2017, the Company amended and restated the 2016 Inducement Omnibus Incentive Plan (as so amended and restated, the “2016 Stock Plan”) and authorized an additional 2,000,000 shares of common stock under the 2016 Stock Plan. At the closing of the acquisition of if(we), the (“if(we) Acquisition”), the Company granted options to purchase an aggregate of up to 75,000 shares of its common stock and restricted stock awards representing an aggregate of 717,500 shares of common stock to 83 former if(we) employees as an inducement material to becoming non-executive employees of the Company. At the closing of the Lovoo Acquisition, the Company granted restricted stock awards representing an aggregate of 531,500 shares of common stock to 96 former Lovoo employees as an inducement material to becoming non-executive employees of the Company.
Options Under The 2016 Stock Plan
A summary of stock option activity under the 2016 Stock Plan during the six months ended June 30, 2019 is as follows:
|
| | | | | | | | | | | | | |
| Options | | Number of Stock Options | | Weighted- Average Exercise Price | | Weighted- Average Remaining Contractual Life | | Aggregate Intrinsic Value |
| Outstanding at December 31, 2018 | | 444,168 |
| | $ | 5.10 |
| | | | |
| Granted | | — |
| | — |
| | | | |
| Exercised | | (26,667 | ) | | 5.69 |
| | | | |
| Forfeited or expired | | (97,501 | ) | | 5.02 |
| | | | |
| Outstanding at June 30, 2019 | | 320,000 |
| | 5.07 |
| | 7.6 | | $ | — |
|
| Exercisable at June 30, 2019 | | 213,333 |
| | 5.07 |
| | 7.6 | | — |
|
The total intrinsic values of options exercised under the 2016 Stock Plan were $0.01 million during the six months ended June 30, 2019. No options under the 2016 Stock Plan were exercised during the six months ended June 30, 2018. The Company recorded stock-based compensation expense related to options under the 2016 Stock Plan of approximately $0.1 million for each of the three months ended June 30, 2019 and 2018 and $0.2 million for each of the six months ended June 30, 2019 and 2018.
Restricted Stock Awards Under The 2016 Stock Plan
A summary of RSA activity under the 2016 Stock Plan during the six months ended June 30, 2019 is as follows:
|
| | | | | | | |
| RSAs | | Number of RSAs | | Weighted-Average Stock Price |
| Outstanding at December 31, 2018 | | 474,686 |
| | $ | 4.25 |
|
| Granted | | — |
| | — |
|
| Vested | | (93,332 | ) | | 5.25 |
|
| Forfeited or expired | | (63,002 | ) | | 3.83 |
|
| Outstanding and unvested at June 30, 2019 | | 318,352 |
| | 4.04 |
|
Shares are forfeited if not vested within three years from the date of grant, and vest in three equal annual increments. The Company recorded stock-based compensation expense related to RSAs under the 2016 Stock Plan of approximately $0.2 million and $0.3 million for the three months ended June 30, 2019 and 2018, respectively, and $0.4 million and $0.7 million for the six months ended June 30, 2019 and 2018, respectively.
Note 9— Income Taxes
The Company recorded a net income tax expense of approximately $0.9 million and $0.5 million for the three months ended June 30, 2019 and 2018, respectively. The net income tax expense recorded during the three months ended June 30, 2019 is primarily related to the mix of earnings between the US and Germany, the estimated GILTI tax and the discrete tax impact of stock based compensation.
The Company recorded a net income tax expense of approximately $1.2 million and $0.3 million for the six months ended June 30, 2019 and 2018, respectively. The net income tax expense recorded during the six months ended June 30, 2019 is primarily related to the mix of earnings between the US and Germany and the estimated GILTI tax, partially offset by discrete tax benefits related to an excess benefit on stock-based compensation.
For the six months ended June 30, 2019, the Company’s effective tax rate (“ETR”) from operations is 25.6%, compared to 1.0% for the six months ended June 30, 2018. The difference between the Company’s ETR and the current U.S. statutory rate of 21%, as well as the difference in the ETR for the six months ended June 30, 2019 compared to the six months ended June 30, 2018, are primarily related to permanent addback items, the difference in tax rates between the U.S. and Germany, the discrete tax impact of stock-based compensation and income during the six months ended June 30, 2019 as opposed to loss during the six months ended June 30, 2018.
As of each reporting date, management considers new evidence, both positive and negative, that could affect its view of the future realization of deferred tax assets (primarily federal and state net operating losses (“NOLs”). As of June 30, 2019 and December 31, 2018, the Company has a valuation allowance related to acquired state NOLs that the Company believes it is not more likely than not will be realized.
During the three and six months ended June 30, 2019 and 2018, the Company had no material changes in uncertain tax positions.
Note 10— 12—Derivatives and Hedging Activities
Risk Management Objective of Using Derivatives
The Company is exposed to certain riskrisks arising from both its business operations and economic conditions. The Company principally manages its exposures to a wide variety of business and operational risks through management of its core business activities. The Company manages economic risks, including interest rate, liquidity and credit risk primarily by managing the amount, sources and duration of its assets and liabilities and the use of derivative financial instruments. Specifically, the Company enters into derivative financial instruments to manage exposures that arise from business activities that result in the receipt or payment of future known and uncertain cash amounts, the value of which are determined by interest rates. The Company’s derivative financial instruments are used to manage differences in the amount, timing and duration of the Company’s known or expected cash receipts and its known or expected cash payments principally related to the Company’s borrowings.
Certain of the Company’s foreign operations expose the Companyit to fluctuations of foreign exchange rates. These fluctuations may impact the value of the Company’s cash receipts and payments in terms of the Company’sits functional currency. The Company enters into derivative financial instruments to protect the value or fix the amount of certain liabilities in terms of its functional currency, the U.S. dollar.
Cash Flow Hedges of
Interest Rate Risk Management
The Company’s objectives in using interest rate derivatives are to add stability to interest expense and to manage its exposure to interest rate movements. To accomplish this objective, the Company primarily uses interest rate swaps and caps as part of its interest rate risk management strategy. Interest rate swaps designated as cash flow hedges involve the receipt of variable amounts from a counterparty in exchange for the Company making fixed-rate payments over the life of the agreements without exchange of the underlying notional amount. Interest rate caps designated as cash flow hedges involve the receipt of variable amounts from a counterparty if interest rates rise above the strike rate on the contract in exchange for an up-front premium. During 20192020 and 2018,2019, such derivatives were used to hedge the variable cash flows associated with the Company’s existing variable-rate debt.
ForPrior to March 5, 2020, the Company’s interest rate derivatives were designated and that qualifyqualified as cash flow hedges of interest rate risk, where the gain or loss on the derivative iswas recorded in accumulated other comprehensive income (loss)or loss and subsequently reclassified into interest expense in the same period(s) during whichperiod that the hedged transaction affectsaffected earnings. Gains and losses on the derivative representingthat represented hedge components excluded from the assessment of effectiveness arewere recognized over the life of the hedge on a systematic and rational basis, as documented at hedge inception in accordance with the Company’s accounting policy election. The earnings recognition of excluded components iswas presented in interest expense. Amounts reported in accumulated other comprehensive income (loss)or loss related to derivatives will bewere reclassified to interest expense as interest payments arewere made on the Company’s variable-rate debt. Between June 30, 2019
On March 5, 2020, given the potential for changes in the Company’s future expected interest payments that were hedged by these interest rate derivatives as a result of the Merger Agreement, such derivatives no longer qualified as cash flow hedges and June 30, 2020,were dedesignated as such. Following this dedesignation, all changes in the Company estimatesfair values of the Company’s interest rate derivatives are recognized as a component of interest expense in the consolidated statements of operations and comprehensive (loss) income. The cumulative remaining unrealized gains at the dedesignation date that an additional $0.01 millionwere previously recognized in accumulated other comprehensive loss will be reclassified as an increaseamortized to interest expense.expense in the consolidated statements of operations and comprehensive (loss) income over the remaining contractual terms for the Company’s interest rate derivatives.
As of June 30, 2019,The following table sets forth the Company had the followingCompany’s outstanding interest rate derivatives that were not designated as cash flow hedgesa hedging instrument of interest rate risk:
risk as of March 31, 2020:
|
| | | | | | | | |
| (in thousands) | | Number of Instruments | | At Inception Notional | | As of March 31, 2020 Notional | | Weighted-average
Maturity Date
(Years) |
| Interest Rate Derivatives | | | | |
| Interest rate swaps | | 2 | | $57,185 | | $22,560 | | 1.76 |
| Interest rate cap | | 1 | | $15,000 | | $10,690 | | 0.47 |
|
| | | | | | |
| | | Number of | | At Inception | | At June 30, 2019 |
| Interest Rate Derivative | | Instruments | | Notional | | Notional |
| Interest rate swaps | | 1 | | $45,000,000 | | $18,750,000 |
| Interest rate caps | | 1 | | $15,000,000 | | $10,690,158 |
Cash Flow Hedges of Foreign Exchange Risk Management
The Company is exposed to fluctuations in various foreign currencies against its functional currency, the U.S. dollar. The Company uses foreign currency derivatives including cross-currency interest rate swaps to manage its exposure to fluctuations in the USD-EURU.S. dollar to euro exchange rate. Cross-currency interest rate swaps involve exchanging fixed ratefixed-rate interest payments for fixed ratefixed-rate interest receipts, both of which will occur at the USD-EURU.S. dollar to euro forward exchange rates in effect upon entering into the instrument. The Company designates these derivatives as cash flow hedges of foreign exchange risks.
For derivatives that are designated and that qualify as cash flow hedges of foreign exchange risk, the gain or loss on the derivative is recorded in accumulated other comprehensive income (loss) and subsequently reclassified in the period(s) during whichperiod that the hedged transaction affects earnings within the same income statement line item as the earnings effect of the hedged transaction. During the next 12 months, the Company estimates that an additional $0.7$0.6 million will be reclassified as a decrease to interest expense.
As of June 30, 2019,The following table sets forth the Company had the followingCompany’s outstanding foreign currency derivatives that were used to hedge itsdesignated as cash flow hedges of foreign exchange risks:risk as of March 31, 2020:
|
| | | | | | | | |
| (in thousands) | | Number of Instruments | | At Inception Notional | | As of March 31, 2020 Notional | | Weighted-average
Maturity Date
(Years) |
| Foreign Currency Derivative | | | | |
| Cross-currency swap | | 1 | | €35,963 | | $39,750 | | 2.41 |
| | | | | (amortizing to €35,058 as of March 31, 2020) | | (amortizing to $38,750 as of March 31, 2020) | | |
The following table sets forth the effect of the Company’s cash flow hedge accounting on its other comprehensive loss for the three months ended March 31, 2020 and 2019:
|
| | | | | | |
| Foreign Currency Derivative | | Number of Instruments | | Pay Fixed Notional | | Receive Fixed Notional |
| Cross-currency interest rate swap | | 1 | | €42,000,517 | | $48,750,000 |
| | | | | (amortizing to €35,969,673 as of June 30, 2019) | | (amortizing to $41,750,000 as of June 30, 2019) |
|
| | | | | | | | |
| (in thousands) | | | | |
| Location of Loss (Gain) Reclassified from Other Comprehensive Loss into Income or Loss | | Amount of Loss (Gain) Reclassified from Other Comprehensive Loss into Income or Loss
|
| |
| | | Three Months Ended March 31, |
| | | 2020 | | 2019 |
| Interest expense | | $ | 14 |
| | $ | (53 | ) |
| Interest expense on foreign currency transactions | | (122 | ) | | (203 | ) |
| Foreign currency transactions | | (763 | ) | | (866 | ) |
| Total gain reclassified | | $ | (871 | ) | | $ | (1,122 | ) |
|
| | | | | | | | |
| (in thousands) | | Amount of (Loss) Gain Recognized in Other Comprehensive Loss from Derivatives |
| Derivatives in Cash Flow Hedging Relationships | |
| | | Three Months Ended March 31, |
| | | 2020 | | 2019 |
| Interest rate products | | $ | (583 | ) | | $ | (61 | ) |
| Cross-currency swap | | 1,859 |
| | 1,275 |
|
| Total unrealized gain | | $ | 1,276 |
| | $ | 1,214 |
|
The following table sets forth the effect of the Company’s derivative financial instruments on its consolidated statements of operations for the three months ended March 31, 2020 and 2019:
|
| | | | | | | |
| | Interest Expense |
| | Three Months Ended March 31, |
| (in thousands) | 2020 | | 2019 |
| Total amounts of interest expense presented in the consolidated statements of operations | $ | (396 | ) | | $ | (403 | ) |
| Loss on derivatives not designated as a hedging instrument: | | | |
| Amount of loss related to changes in fair values of interest rate derivatives not designated as a hedging instrument | $ | (171 | ) | | $ | — |
|
| | | | |
| Gain on cash flow hedging relationships: | | | |
| Amount of gain reclassified from accumulated other comprehensive loss into income or loss | $ | (125 | ) | | $ | (256 | ) |
| Amount of loss reclassified from accumulated other comprehensive loss into income or loss as a result of a forecasted transaction being no longer probable of occurring | $ | 17 |
| | $ | — |
|
|
| | | | | | | |
| | Foreign Currency Transactions |
| | Three Months Ended March 31, |
| (in thousands) | 2020 | | 2019 |
| Total amounts of loss on foreign currency transactions presented in the consolidated statements of operations | $ | (7 | ) | | $ | (65 | ) |
| Gain on cash flow hedging relationships: | | | |
| Amount of gain reclassified from accumulated other comprehensive loss into income or loss | $ | (763 | ) | | $ | (867 | ) |
Fair Value of Derivative Financial Instruments
The following table below presentssets forth the fair value of the Company’s derivative financial instruments, as well as their classification on the consolidated balance sheetsheets, as of June 30, 2019March 31, 2020 and December 31, 2018.
2019:
|
| | | | | | | | | | | | | | | | | | |
| | | | | Fair Value of Derivative Financial Instruments |
| | | | | Asset Derivatives | | Liability Derivatives |
| | | | | March 31, 2020 | | December 31, 2019 | | March 31, 2020 | | December 31, 2019 |
| (in thousands) | | Balance Sheet Location | | Fair Value | | Fair Value | | Fair Value | | Fair Value |
| Derivatives not designated as hedging instruments: | | | | | | | | | | |
| Interest rate products | | Accrued liabilities | | $ | — |
| | $ | — |
| | $ | (288 | ) | | $ | — |
|
| Interest rate products | | Long-term derivative liabilities | | — |
| | — |
| | (477 | ) | | — |
|
| | | | | | | | | | | |
| Derivatives designated as hedging instruments: | | | | | | | | | | |
| Interest rate products | | Prepaid expenses and other current assets / Accrued liabilities | | — |
| | 15 |
| | — |
| | (12 | ) |
| Interest rate products | | Long-term derivative liabilities | | — |
| | — |
| | — |
| | (9 | ) |
| Cross-currency swap | | Prepaid expenses and other current assets | | 655 |
| | 568 |
| | — |
| | — |
|
| Cross-currency swap | | Other assets / Long-term derivative liabilities | | 162 |
| | — |
| | — |
| | (1,442 | ) |
| Total derivative financial instruments | | | | $ | 817 |
| | $ | 583 |
| | $ | (765 | ) | | $ | (1,463 | ) |
|
| | | | | | | | | | | | | | | | | | |
| | | | | Fair Value of Derivative Instruments |
| | | | | Asset Derivatives | | Liability Derivatives |
| | | | | June 30, 2019 | | December 31, 2018 | | June 30, 2019 | | December 31, 2018 |
| Derivatives Designated as Hedging Instruments | | Balance Sheet Location | | Fair Value | | Fair Value | | Fair Value | | Fair Value |
| Interest rate products | | Prepaid expenses and other current assets | | $ | 1,451 |
| | $ | 166,058 |
| | $ | — |
| | $ | — |
|
| Interest rate products | | Other assets - non-current | | 368 |
| | 53,355 |
| | (3,540 | ) | | — |
|
| Cross currency contract | | Prepaid expenses and other current assets | | 760,939 |
| | 753,371 |
| | — |
| | — |
|
| Cross currency contract | | Other assets - non-current / Long-term liability | | — |
| | — |
| | (227,552 | ) | | (940,216 | ) |
| Total derivatives designated as hedging instruments | | | | $ | 762,758 |
| | $ | 972,784 |
| | $ | (231,092 | ) | | $ | (940,216 | ) |
The tables below presents the effect of cash flow hedge accounting on accumulated other comprehensive income (loss) for the three and six months ended June 30, 2019 and 2018.
|
| | | | | | | | | | | | | | | | |
| Derivatives in Subtopic 815-20 Hedging Relationships | | Amount of Gain (Loss) Recognized in OCI on Derivatives |
| | | Three Months Ended June 30, | | Six Months Ended June 30, |
| | | 2019 | | 2018 | | 2019 | | 2018 |
| Derivatives in Cash Flow Hedging Relationships | | | | | | | | |
| Interest rate products | | $ | (70,188 | ) | | $ | 95,236 |
| | $ | (130,997 | ) | | $ | 363,785 |
|
| Cross currency contract | | (112,079 | ) | | 2,597,045 |
| | 1,162,320 |
| | 1,149,474 |
|
| Total | | $ | (182,267 | ) | | $ | 2,692,281 |
| | $ | 1,031,323 |
| | $ | 1,513,259 |
|
|
| | | | | | | | | | | | | | | | |
| Location of Gain (Loss) Reclassified from Accumulated OCI into Income | | Amount of Gain (Loss) Reclassified from Accumulated OCI into Income |
| | | Three Months Ended June 30, | | Six Months Ended June 30, |
| | | 2019 | | 2018 | | 2019 | | 2018 |
| Interest expense | | $ | 30,673 |
| | $ | 17,297 |
| | $ | 83,214 |
| | $ | (20,982 | ) |
| Interest expense | | 200,025 |
| | 218,805 |
| | 402,850 |
| | 438,305 |
|
| Gain (loss) on foreign currency transactions | | (569,158 | ) | | 2,428,813 |
| | 297,788 |
| | 1,145,146 |
|
| Total | | $ | (338,460 | ) | | $ | 2,664,915 |
| | $ | 783,852 |
| | $ | 1,562,469 |
|
The table below presents the effectfair value of the Company’s derivative financial instruments is determined using widely-accepted valuation techniques, including a discounted cash flows analysis on the income statement forexpected cash flows of each derivative. This analysis reflects the threecontractual terms of the derivatives, including the period to maturity, and six months ended June 30, 2019uses observable market-based inputs, including interest rate curves and 2018.implied volatilities. The fair values of the interest rate swaps and the cross-currency swap are determined using the market-standard methodology of netting the discounted future fixed cash receipts (or payments) and the discounted expected variable cash payments (or receipts). The variable cash payments (or receipts) are based on an expectation of future interest rates (forward curves) derived from observable market interest rate curves.
The fair value of the interest rate cap is determined using the market-standard methodology of discounting the future expected cash receipts that would occur if variable interest rates rise above the strike rate of the cap. The variable interest rates used in the calculation of projected receipts on the cap are based on an expectation of future interest rates derived from observable market interest rate curves and volatilities. |
| | | | | | | | | | | | | | | |
| | Three Months Ended June 30, | | Six Months Ended June 30, |
| | 2019 | | 2019 |
| | Interest Expense | | Foreign Currency Adjustment | | Interest Expense | | Foreign Currency Adjustment |
| Total amounts of income and expense line items presented in the statement of financial performance in which the effects of fair value or cash flow hedges are recorded | $ | (328,196 | ) | | $ | (2,380 | ) | | $ | (731,060 | ) | | $ | (67,589 | ) |
| Gain (loss) on cash flow hedging relationships in Subtopic 815-20 | | | | | | | |
| Interest contracts | | | | | | | |
| Amount of gain (loss) reclassified from accumulated other comprehensive income (loss) into income | $ | 230,698 |
| | $ | (569,158 | ) | | $ | 486,064 |
| | $ | 297,788 |
|
| Amount of gain (loss) reclassified from accumulated other comprehensive income (loss) into income as a result that a forecasted transaction is no longer probable of occurring | $ | — |
| | $ | — |
| | $ | — |
| | $ | — |
|
|
| | | | | | | | | | | | | | | |
| | Three Months Ended June 30, | | Six Months Ended June 30, |
| | 2018 | | 2018 |
| | Interest Expense | | Foreign Currency Adjustment | | Interest Expense | | Foreign Currency Adjustment |
| Total amounts of income and expense line items presented in the statement of financial performance in which the effects of fair value or cash flow hedges are recorded | $ | (671,294 | ) | | $ | 4,216 |
| | $ | (1,278,980 | ) | | $ | 107,259 |
|
| Gain or (loss) on cash flow hedging relationships in Subtopic 815-20 | | | | | | | |
| Interest contracts | | | | | | | |
| Amount of gain or (loss) reclassified from accumulated other comprehensive income into income | $ | 236,103 |
| | $ | 2,428,813 |
| | $ | 417,324 |
| | $ | 1,145,146 |
|
| Amount of gain or (loss) reclassified from accumulated other comprehensive income into income as a result that a forecasted transaction is no longer probable of occurring | $ | — |
| | $ | — |
| | $ | — |
| | $ | — |
|
As of June 30, 2019,The Company incorporates credit valuation adjustments to appropriately reflect both its non-performance risk and the respective counterparty’s non-performance risk in the fair value measurements. In adjusting the fair value of the Company’s derivative contracts for the effect of non-performance risk, the Company has considered the impact of netting and any applicable credit enhancements, such as collateral postings, thresholds, mutual puts and guarantees. The Company made an accounting policy election to measure the credit risk of its derivative financial instruments that are subject to master netting agreements on a net basis by counterparty portfolio.
Although the Company has determined that the majority of the inputs used to value its derivatives fall within Level 2 of the fair value hierarchy, the credit valuation adjustments associated with its derivatives utilize Level 3 inputs, such as estimates of current credit spreads to evaluate the likelihood of default by the Company and its counterparties. The Company has determined the impact of the credit valuation adjustments made to its derivative contracts, which determination was based on the fair value of each individual contract, was not significant to the overall valuation. As a result, all of the Company’s derivatives held as of March 31, 2020 and 2019 were classified as Level 2 within the fair value hierarchy.
As of March 31, 2020, the fair value of the Company’s derivatives was in a net liability position related to these agreements,of $0.8 million for its contracts, which includesincluded accrued interest but excludesexcluded any adjustment for nonperformance risk, was $0.002 million.non-performance risk. As of June 30, 2019,March 31, 2020, the Company had not posted any collateral related to these agreements.contracts. If the Company had breached any of credit-risk related provisions at June 30, 2019,as of March 31, 2020, it could have been required to settle its obligations under the agreementscontracts at their termination value of $0.002$0.8 million.
Note 11— 13—Revenue
The Company recognizes revenue when controlDisaggregation of the promised good or service is transferred to the customer in an amount that the Company expects to be entitled in exchange for the good or service.Revenue
The following table presentssets forth the Company’s revenuesrevenue disaggregated by revenue source for the three and six months ended June 30, 2019March 31, 2020 and 2018:
2019:
|
| | | | | | | | | | | | | | | | | | | | | | | | | | | |
| | Three Months Ended June 30, | | Six Months Ended June 30, |
| | 2019 | | 2018 | | 2019 | | 2018 |
| | $ | | % | | $ | | % | | $ | | % | | $ | | % |
| User pay revenue | $ | 36,921,301 |
| | 71.0 | % | | $ | 25,570,553 |
| | 59.7 | % | | $ | 72,746,410 |
| | 71.7 | % | | $ | 47,976,083 |
| | 59.6 | % |
| Advertising | 15,078,803 |
| | 29.0 | % | | 17,231,192 |
| | 40.3 | % | | 28,766,931 |
| | 28.3 | % | | 32,463,455 |
| | 40.4 | % |
| Total revenue | $ | 52,000,104 |
| | 100.0 | % | | $ | 42,801,745 |
| | 100.0 | % | | $ | 101,513,341 |
| | 100.0 | % | | $ | 80,439,538 |
| | 100.0 | % |
|
| | | | | | | | | | | | | |
| | Three Months Ended March 31, |
| | 2020 | | 2019 |
| (in thousands) | $ | | % | | $ | | % |
| User pay revenue: | | |
| | | |
|
| Video | $ | 28,633 |
| | 52.0 | % | | $ | 20,229 |
| | 40.9 | % |
| Subscription and other in-app products | 14,395 |
| | 26.1 | % | | 15,596 |
| | 31.5 | % |
| Total user pay revenue | 43,028 |
| | 78.1 | % | | 35,825 |
| | 72.4 | % |
| Advertising revenue | 12,038 |
| | 21.9 | % | | 13,688 |
| | 27.6 | % |
| Total revenue | $ | 55,066 |
| | 100.0 | % | | $ | 49,513 |
| | 100.0 | % |
User Pay RevenueSignificant Customers
User payDuring the three months ended March 31, 2020 and 2019, three customers, all of which were advertising aggregators or payment processors representing thousands of advertisers, comprised 73% and 61% of total revenue, is earned from in-app purchase productsrespectively.
Contract Assets and subscriptions sold to mobile application and website users. Contract Liabilities
The Company offers in-app products such as Credits, Points, Gold, Icebreakers, Flash! and Shout! (collectively,following table sets forth the “In-App Products”). Users purchase the In-App Products to exchange forcomposition of the Company’s virtual products. The In-App Products allow users to engage with other users on the applicationscontract assets and in live video. They also put users in the spotlight, helping them get more attention from the community in order to meet more people faster. Platform users do not own the In-App Products but have a limited right to use the In-App Products on virtual products offered for sale on the Company’s platforms. In-App Products may be used to purchase virtual gifts for other users. These virtual gifts are received by other usersliabilities as of March 31, 2020 and converted into Diamonds. Diamonds represent an intermediary currency that the Company manages. Diamonds can either be converted back into credits or may be used to claim rewards, including in some instances cash rewards. The In-App Products are not transferable, cannot be sold or exchanged outside of our platforms, are not redeemable for any sum of money, cannot be gifted to other users and can only be used on our platforms. The In-App Products are recorded in deferred revenue when purchased and recognized as revenue over time when: (i) the In-App Products are used by the customer; or (ii) the Company determines the likelihood of the In-App Products being redeemed by the customer is remote (breakage) and there is not a legal obligation to remit the unredeemed In-App Products to the relevant jurisdiction. The breakage rate is based upon Company-specific historical redemption patterns. Breakage is recognized in revenue as the In-App Products are used on a pro rata basis over a three or six-month period (life of the user) beginning at the date of the sale and are included in revenue in the condensed consolidated statements of operations and comprehensive income (loss). Breakage recognized during each of the three and six months ended June 30, 2019 and 2018 was $0.9 million and $1.6 million, respectively. For MeetMe+, Tagged, Skout and Lovoo subscription based products, the Company recognizes revenue over the term of the subscription.December 31, 2019:
|
| | | | | | | |
| (in thousands) | March 31, 2020 | | December 31, 2019 |
| Assets: | | | |
| Accounts receivable | $ | 24,476 |
| | $ | 25,503 |
|
| Total contract assets | $ | 24,476 |
| | $ | 25,503 |
|
| Liabilities: | |
| | |
| Deferred revenue | $ | 3,563 |
| | $ | 3,884 |
|
| Total contract liabilities | $ | 3,563 |
| | $ | 3,884 |
|
Under ASC 606, user pay revenue has a single performance obligation. Subscriptions provide customers with premium access to the application and include credits on MeetMe+, while In-App Product purchases are satisfied by standing ready to allow users to exchange the In-App Products for virtual products. The consideration received for these services is fixed at the time of purchase. The customer simultaneously receives and consumes the benefits of user pay features as the Company performs the services. Revenue is recorded in deferred revenue when purchased by customer and recognized as revenue over time as the performance obligation is satisfied.
Advertising Revenue
Advertising revenue is comprised of mobile and web advertising. Within each revenue stream, the Company has one performance obligation to publish advertisements as specified by the respective contracts. The amount of consideration that the Company expects to receive for the services is variable based on the volume of advertisement impressions. The Company does not offer any discounts or free impressions and has not historically experienced any collectability issues.
The Company also recognizes revenue from cross-platform/social theater and cost-per-action (“CPA”) offers. Each of these revenue streams has one performance obligation. For cross-platform/social theater contracts, the consideration promised is fixed per ad campaign and term, and required services to be delivered. However, the monthly revenue could vary depending on the actual delivery of impressions throughout the contract term. These contracts are typically based on cost per thousand rates and number of impressions served due to traffic volume and the specific ad campaign. For CPA offers, the consideration promised is variable based on a revenue share rate, and/or based on the number of actions delivered per the agreement. As such, the Company recognizes all actual advertising revenues from impressions or actions delivered on a monthly basis rather than estimating revenue at the beginning of the period.
The Company has transactions with several partners that qualify for principal agent considerations. The Company recognizes revenue, net of amounts retained by the third-party partners, pursuant to revenue sharing agreements with advertising networks.
The form of the agreements is such that the Company provides services in exchange for a fee. The Company determines only the fee for providing its services to advertising agencies and has no latitude in establishing prices with third party advertisers.
In instances where the Company works directly with an advertiser, revenue is recognized on a gross basis. The Company is the primary obligor in arrangements made with direct advertisers, as there is no third-party facilitating or managing the sales process. The Company is solely responsible for determining price, product or service specifications, and which advertisers to use. The Company assumes all credit risk in the sales arrangements made with direct advertisers.
The Company has determined that the performance obligation under the advertising revenue streams is recognized ratably over time utilizing the “Right to Invoice” practical expedient as customers simultaneously consume and receive benefits of the advertisement impressions.
Deferred Revenue
The Company records deferred revenue when the consideration for a good or service is received in advance of its performing the obligation. TheCompany’s deferred revenue balance for the sixthree months ended June 30, 2019March 31, 2020 increased $72.7by $42.5 million due to subscription and in-app purchases consideration received in advance of providing the good or serviceservices to the customers.subscription and in-app purchases’ customers, including in-app purchases related to video. This amount was offset by $72.7$42.8 million of revenue recognized from deferred revenue due to performance obligations satisfied during the sixthree months ended June 30, 2019.March 31, 2020.
Note 12— Leases14 — Net (Loss) Income per Share
The following table sets forth the computation of the Company’s basic and diluted net (loss) income per share for the three months ended March 31, 2020 and 2019:
|
| | | | | | | |
| | Three Months Ended March 31, |
| (in thousands, except share and per share data) | 2020 | | 2019 |
| Numerator: | | | |
| Net (loss) income | $ | (2,408 | ) | | $ | 1,258 |
|
| Denominator: | | | |
| Weighted-average shares outstanding — basic | 71,001,906 |
| | 74,848,080 |
|
| Effect of dilutive securities | — |
| | 3,951,168 |
|
| Weighted-average shares outstanding — diluted | 71,001,906 |
| | 78,799,248 |
|
| Basic net (loss) income per share | $ | (0.03 | ) | | $ | 0.02 |
|
| Diluted net (loss) income per share | $ | (0.03 | ) | | $ | 0.02 |
|
Basic net (loss) income per share is computed by dividing net (loss) income by the weighted-average number of common shares outstanding. Diluted net (loss) income per share is computed by dividing net (loss) income by the weighted-average number of common shares and common stock equivalents outstanding, calculated using the treasury stock method for options, RSAs and unvested in-the-money PSUs using the average market price during the period.
For the three months ended March 31, 2020, all of the stock-based compensation awards were excluded from the calculation of net loss per share because their inclusion would have an anti-dilutive effect. For the three months ended March 31, 2019, 1.1 million shares of the Company’s stock-based compensation awards that could potentially dilute basic net income per share in the future were excluded from the calculation of diluted net income per share as their effect would have been anti-dilutive.
Note 15 — Retirement Plan
The Company has operating leasesmaintains The Meet Group, Inc. 401(k) Retirement Plan (“401(k) Plan”), which is a savings and investment plan intended to be qualified under of the Internal Revenue Code. The 401(k) Plan covers the majority of the employees of the Company. In January 2014, the Company began providing employer-matching contributions to the 401(k) Plan based on a participant’s contribution. The Company’s employer-matching contributions expense totaled $0.2 million for its corporate officeseach of the three months ended March 31, 2020 and data centers2019. This expense is included in sales and marketing expenses, product development and content expenses and general and administrative expenses in the consolidated statements of operations and comprehensive (loss) income.
Note 16 — Income Taxes
Income tax expense was $0.4 million and $0.3 million for the three months ended March 31, 2020 and 2019, respectively. For the three months ended March 31, 2020, the Company’s effective tax rate (“ETR”) was (18.3)%, compared with an ETR of 16.8% for the three months ended March 31, 2019. The increase in the Company’s income tax expense and ETR for the three months ended March 31, 2020 were primarily attributable to certain non-deductible transaction costs incurred in connection with the Merger Agreement, the geographic mix of earnings between the U.S. and Germany, which has a higher statutory tax rate, and finance leases fora decrease in windfall tax benefits on stock-based compensation. These increases were partially offset by the discrete impact of certain data centers, printersdeductible transaction costs incurred in connection with the Merger Agreement.
As of each reporting date, management considers new evidence, both positive and other furniture innegative, that could affect its German offices. The Company's lease terms include options to extend or terminateview of the leasefuture realization of deferred tax assets, primarily U.S. federal and state net operating loss carryforwards (“NOLs”). As of March 31, 2020 and December 31, 2019, the Company includes these optionshad a partial valuation allowance related to certain acquired state NOLs that it believes are more-likely-than-not to remain unutilized.
During each of the three months ended March 31, 2020 and 2019, the Company had 0 material changes in uncertain tax positions.
The Coronavirus Aid, Relief and Economic Security Act (“CARES Act”) was signed into law on March 27, 2020. The CARES Act made significant changes to U.S. federal tax law, including a five-year carryback of NOLs for the 2018, 2019 and 2020 tax years, and a temporary increase in the lease term when it is reasonably certainlimitation of interest deductibility for the 2019 and 2020 tax years. Due to exercise that option.the Company's historical NOLs and limited interest deductibility, the provisions of the CARES Act are not expected to have a material impact to its financial position, results of operations or cash flows.
Note 17—Fair Value Measurements
The carrying amounts of the Company’s financial instruments of cash and certain cash equivalents, accounts receivable, accounts payable, accrued liabilities and deferred revenue approximate their fair values due to their short maturities. The Company determines,has evaluated the estimated fair values of these financial instruments using available market information and management’s estimates. The use of different market assumptions and/or estimation methodologies could have a significant effect on the estimated fair value amounts.
The outstanding balance of the Company’s term loan facility as of March 31, 2020 and December 31, 2019 approximates fair value due to its variable market interest rate and relative short maturity.
Items measured at fair value on a recurring basis include the inception of a contract, if the arrangement is a lease and whether it meets the classification criteria for a finance or operating lease. ROU assets represent the Company's right to use an underlying asset during the lease term and lease liabilities represent the Company's obligation to make lease payments arising from the lease. ROUCompany’s money market funds, derivative assets and lease liabilities and contingent consideration. During the periods presented, the Company has not changed the manner in which it values assets and liabilities that are recognizedmeasured at commencement date based on the presentfair value of fixed lease payments over the lease term. ROU assets also include any advance lease payments and exclude lease incentives. As mostusing Level 3 inputs of the Company's operating leases do not provide an implicit rate, the Company uses its incremental borrowing rate based on information available at commencement date in determining the presentfair value of lease payments. Finance lease agreements generally include an interest rate that is used to determine the present value of future lease payments. Operating fixed lease expense and finance lease depreciation expense are recognized on a straight-line basis over the lease term.hierarchy.
Operating Leases
The Company leases its operating facilities, data center storage facilities and certain data storage equipment in the U.S. and Germany under certain noncancelable operating leases that expire at various times through 2022. These leases are renewable at the Company’s option.
Capital Leases
The Company leases certain fixed assets under capital leases that expire at various times through 2021. The capital leases are for the Company’s computer equipment and printers in its German offices. Principal and interest are payable monthly at interest rates ranging from 4.7% to 7.0% per annum, rates varying based on the type of leased asset. The Company did not enter into any new capital lease agreements during the six months ended June 30, 2019.
The following table presentssets forth the fair value hierarchy information for each major category of the Company’s lease costsassets and liabilities measured at fair value on a recurring basis as of March 31, 2020 and December 31, 2019:
|
| | | | | | | | | | | | | | | |
| (in thousands) | Quoted Prices in Active Markets for Identical Items (Level 1) | | Significant Other Observable Inputs (Level 2) | | Significant Unobservable Inputs (Level 3) | | Total |
| March 31, 2020 | | | | | | | |
| Assets: | | | | | | | |
| Money market funds | $ | 12,090 |
| | $ | — |
| | $ | — |
| | $ | 12,090 |
|
| Derivative assets | — |
| | 817 |
| | — |
| | 817 |
|
| Total assets | $ | 12,090 |
| | $ | 817 |
| | $ | — |
| | $ | 12,907 |
|
| Liabilities: | | | | | | | |
| Contingent consideration | $ | — |
| | $ | — |
| | $ | (917 | ) | | $ | (917 | ) |
| Derivative liabilities | — |
| | (765 | ) | | — |
| | (765 | ) |
| Total liabilities | $ | — |
| | $ | (765 | ) | | $ | (917 | ) | | $ | (1,682 | ) |
| December 31, 2019 | | | | | | | |
| Assets: | | | | | | | |
| Money market funds | $ | 7,108 |
| | $ | — |
| | $ | — |
| | $ | 7,108 |
|
| Derivative assets | — |
| | 583 |
| | — |
| | 583 |
|
| Total assets | $ | 7,108 |
| | $ | 583 |
| | $ | — |
| | $ | 7,691 |
|
| Liabilities: | | | | | | | |
| Contingent consideration | $ | — |
| | $ | — |
| | $ | (894 | ) | | $ | (894 | ) |
| Derivative liabilities | — |
| | (1,463 | ) | | — |
| | (1,463 | ) |
| Total liabilities | $ | — |
| | $ | (1,463 | ) | | $ | (894 | ) | | $ | (2,357 | ) |
Fair Value of Contingent Consideration
The following table sets forth a summary of changes in the fair value of the Company’s contingent consideration liability for the acquisition of Initech, LLC as of March 31, 2020:
|
| | | |
| (in thousands) | Contingent Consideration |
| Balance as of December 31, 2019 | $ | 894 |
|
| Accretion | 23 |
|
| Balance as of December 31, 2020 | $ | 917 |
|
The Company’s contingent consideration liability represents its contingent performance obligations related to the acquisition of Initech, LLC on March 5, 2019 and is measured at fair value using the income approach with assumed discount rates and payment probabilities. These assumptions are based on unobservable inputs in the market, which represents a Level 3 measurement within the fair value hierarchy. The Company assesses these estimates on an ongoing basis as additional data impacting the assumptions is obtained. The fair value of the Company’s contingent consideration liability is recognized on its consolidated balance sheets within accrued liabilities as of March 31, 2020 and within other liabilities as of December 31, 2019 and any changes therein are recognized within acquisition, restructuring and other expenses in the consolidated statements of operations and comprehensive (loss) income for the three and six months ended June 30, 2019:March 31, 2020 and 2019.
|
| | | | | | | |
| | Three Months Ended | | Six Months Ended |
|
| | June 30, 2019 | | June 30, 2019 |
| Lease Costs: | | | |
| Operating lease cost* | $ | 655,033 |
| | $ | 1,380,269 |
|
| | | | |
| Finance lease cost: | | | |
| Amortization of right-of-use assets | $ | — |
| | $ | 1,518 |
|
| Interest on lease liabilities | 1,444 |
| | 3,746 |
|
| Total finance lease cost | $ | 1,444 |
| | $ | 5,264 |
|
* Short term lease costs were immaterial.
Supplemental cash flow information is as follows:
|
| | | |
| | Six Months Ended |
|
| | June 30, 2019 |
| Cash paid for amounts included in the measurement of lease liabilities: | |
| Operating cash flows from operating leases | $ | 1,373,309 |
|
| Operating cash flows from finance leases | 3,746 |
|
| Financing cash flows from finance leases | 77,507 |
|
| | |
| Right-of-use assets obtained in exchange for lease obligations: | |
| Operating leases | 6,440,016 |
|
The aggregate future lease payments for ROU assets and finance leases as of June 30, 2019 are as follows:
|
| | | | | | | | |
| For the Years Ending December 31, | | ROU Assets | | Financing |
| Remaining in 2019 | | $ | 1,308,078 |
| | $ | 79,173 |
|
| 2020 | | 2,107,386 |
| | 32,065 |
|
| 2021 | | 1,816,930 |
| | 4,773 |
|
| 2022 | | 559,110 |
| | — |
|
| 2023 | | 43,559 |
| | — |
|
| Thereafter | | — |
| | — |
|
| Total minimum lease payments | | 5,835,063 |
| | 116,011 |
|
| Less: amount representing interest | | 290,377 |
| | 2,560 |
|
| Total present value of minimum payments | | 5,544,686 |
| | 113,451 |
|
| Less: current portion | | 2,203,055 |
| | 101,446 |
|
| Long-term obligations | | $ | 3,341,631 |
| | $ | 12,005 |
|
Weighted average remaining lease terms and discount rates were as follows:
|
| | |
Weighted average remaining lease term (years) | June 30, 2019 |
Operating leases | 2.67 |
|
Finance leases | 0.81 |
|
| |
Weighted average discount rate | |
Operating leases | 4.87 | % |
Finance leases | 5.56 | % |
ITEM 2. MANAGEMENT’S DISCUSSION AND ANALYSIS OF FINANCIAL CONDITION AND RESULTS OF OPERATIONS.
Company Overview
The Meet Group, Inc. (“Company,” “The Meet Group,” “us” or “we”) is a leading provider of interactive live-streaming solutions. We leverage a powerful live video platform (“Live”), empowering our global community to forge meaningful connections. Our primary applications (“apps”) are MeetMe®, Skout®, Tagged®, LOVOO® and Growlr®.
We operate location-based social networks for meeting new people — primarily on mobile platforms, including on iPhone, Android, iPad and other tablets — that facilitate interactions among users and encourage users to connect, communicate and engage with each other. Over the past three years we have transformed our business from an advertising-based revenue model to one where the majority of our revenue is derived from user pay monetization and subscriptions. The fastest-growing component of user pay monetization comes from in-app purchases, including virtual gifts associated with Live.
We began developing Live in 2016 with the belief that we could successfully pair live streaming and dating — a model that we had seen work effectively for Asian dating app providers. We first launched Live on the MeetMe app in early 2017, and, in October 2017, we began to monetize the feature by enabling virtual gifting within live video broadcasts. During this time period, we also executed on our strategy of acquiring other properties — Skout, Inc. (“Skout”), Ifwe, Inc. (“if(we)”) and LOVOO GmbH (“LOVOO”) — where we believed Live would fit naturally. We launched the monetized version of Live on the Skout app in the fourth quarter of 2017, and the Tagged and LOVOO apps in the second quarter of 2018. We have also continued to add features and enhancements intended to drive video engagement and increase monetization across all of our apps, and we recently launched and intend to monetize Live on the Growlr app — which we acquired in 2019 as part of our acquisition of Initech LLC (“Initech”) — in 2020. Live has become the fastest-growing revenue product in our history.
Looking ahead, we intend to leverage Live by making it available to third-party apps (and users of third-party apps) as a video-as-a-service platform (“vPaaS”). With vPaaS, we intend that users of Live will appear on and be able to interact with users of other mobile apps and vice versa, leading to mutually-beneficial revenue-share arrangements with the owners of these other third-party apps.
We also offer online marketing capabilities, which enable marketers to display their advertisements on our apps. We offer significant scale to our advertising partners, delivering more than 10 billion monthly advertising impressions across our active global user base, and sophisticated programmatic strategies for effective targeting. We work with advertising partners to maximize the effectiveness of their campaigns by optimizing advertisement formats and placements for maximum performance and return on investment.
Just as Facebook has established itself as the social network of friends and family, and LinkedIn has established itself as the social network of colleagues and business professionals, we have created the social entertainment network not of the people you know, but of the people you want to know. Nimble, fast-moving and already in more than 100 countries, we are differentiating ourselves from other dating brands with Live, which is not offered by many of our direct competitors. Modeled after the live video platforms offered by Asian dating app providers, but enhanced in order to appeal to Western audiences, Live is aimed at the nexus of entertainment and community, where we believe our apps exhibit a natural strength.
Our vision extends beyond dating and entertainment. We focus on building quality products to satisfy the universal need for human connection among all people, everywhere — not just paying subscribers. We believe meeting new people is a basic human need, especially for users aged 18 to 34, when so many long-lasting relationships are made. We use advanced technology to engineer serendipitous connections among people who otherwise might never have met — a sort of digital coffeehouse, where everyone belongs. Over the years, our apps have originated untold numbers of chats, shares, good friendships, dates and romantic relationships — even marriages.
We believe we have significant growth opportunities enabled through our social entertainment platform. We believe our scale provides unique advantages to grow video monetization, while also establishing a high density of users within the geographic regions we serve. As our networks grow and the number of users in a location increases, we believe that users who are seeking to meet new people will incrementally benefit from the quantity of relevant connections.
Cautionary Note Regarding Forward-LookingForward-looking Statements
Management’sCertain statements in this “Management’s Discussion and Analysis of Financial Condition and Results of OperationsOperations” (“MD&A”) is set forth below. Certain statements inand the rest of this reportQuarterly Report on Form 10-Q (“Quarterly Report”) may be considered to be “forward-looking statements” as that term is defined in the U.S. Private Securities Litigation Reform Act of 1995.
In particular, these forward-looking statements include, among others, statements about:
Liquidity;liquidity;
Capitalcapital expenditures;
Opportunitiesopportunities for our business;
Growthgrowth of our business; and
Anticipationsanticipations and expectations regarding mobile usage and monetization.
the closing of the transactions contemplated by the Merger Agreement (defined below), including the Merger (defined below); and
the potential impact of the 2019 novel coronavirus (“COVID-19”).
All statements other than statements of historical facts contained in this report,Quarterly Report, including statements regarding our future financial position, liquidity, business strategy, plans and objectives of management for future operations, are forward-looking statements. The words “believe,” “may,” “estimate,” “continue,” “anticipate,” “intend,” “should,” “plan,” “could,” “target,” “potential,” “is likely,” “expect” and similar expressions, as they relate to us, are intended to identify forward-looking statements. We have based these forward-looking statements largely on our current expectations and projections about future events and financial trends that we believe may affect our financial condition, results of operations, business strategy and financial needs.
Important factors that could cause actual results to differ from those in the forward-looking statements include users’ willingness to try new product offerings and engage in our Appapp upgrades and new features, the risk that unanticipated events affect the functionality of our Appapps with popular mobile operating systems, any changes in such operating systems that degrade our App’sapps’ functionality and other unexpected issues which could adversely affect usage on mobile devices, the risk that the mobile advertising market will not grow, the ongoing existence of such demand and the willingness of our users to complete mobile offers or pay for Credits, Points, Gold, and Icebreakers, Flash! and Shout!. Any forward-looking statement made by us in this reportQuarterly Report speaks only as of the date on which it is made. Factors or events that could cause our actual results to differ may emerge from time to time, and it is not possible for us to predict all of them. We undertake no obligation to publicly update any forward-looking statement, whether as a result of new information, future developments or otherwise, except as may be required by law.
YouOne should read the following discussion in conjunction with our audited historical consolidated financial statements. MD&A contains forward-looking statements that reflect our plans, estimates and beliefs. Our actual results could differ materially from those discussed in the forward-looking statements. Factors that could cause or contribute to these differences include those discussed elsewhere in “Risk Factors,” located at Part II,“Part I, Item 1A of this report and— Risk Factors” included in our Annual Report on Form 10-K (“Annual Report”) for the year ended December 31, 2018.2019. Additional risks that we do not presently know or that we currently believe are immaterial could materially and adversely affect any of our business, financial position, future results or prospects.
This MD&A is provided as a supplement to, and should be read in conjunction with, our audited consolidated financial statements,“Consolidated Financial Statements” and the related notes thereto and the MD&A included in our Annual Report on Form 10-K for the year ended December 31, 2018 (“Annual Report”),2019, as well as our condensed consolidated financial statementsunaudited “Consolidated Financial Statements” and the accompanyingrelated notes thereto included elsewhere in this report.Quarterly Report.
Company OverviewMerger Agreement
The MeetOn March 5, 2020, we announced that we entered into a definitive agreement to be acquired by ProSiebenSat.1 Media SE’s and General Atlantic Coöperatief U.A.’s joint company, NCG – NUCOM GROUP SE, a European stock corporation (“NuCom”), through eHarmony Holding, Inc., a subsidiary of NuCom’s platform company Parship Group GmbH (“Buyer”). Pursuant to the Agreement and Plan of Merger (“Merger Agreement”), dated as of March 5, 2020, by and among us, Buyer, Holly Merger Sub, Inc. (the “Company,” “The Meet Group,” “us,” or “we”, a Delaware corporation and a direct, wholly-owned subsidiary of Buyer (“Merger Sub”), and NuCom, solely for the purpose of guaranteeing Buyer’s obligations under the Merger Agreement as set forth therein, and upon the terms and subject to the conditions thereof and in accordance with Section 251 of the General Corporation Law of the State of Delaware, Merger Sub shall merge with and into us (“Merger”). As a result of the Merger, the separate corporate existence of Merger Sub shall cease, we shall continue as the surviving corporation in the Merger (“Surviving Corporation”) isand the Surviving Corporation shall become a leading providerwholly-owned subsidiary of interactive livestreaming solutions. We leverageBuyer. Pursuant to the Merger Agreement, we filed a powerful live-streaming video platform, empowering our global communitydefinitive proxy statement and notice of a special meeting to forge meaningful connections. Our primary apps are MeetMe®, LOVOO®, Skout®, Tagged®solicit stockholder approval of the Merger Agreement with the U.S. Securities and Growlr®.Exchange Commission (“SEC”) on April 22, 2020.
We operate location-based social networks for meeting new people, primarily on mobile platforms, including on iPhone, Android, iPadAt the effective time of the Merger, and other tablets, that facilitate interactions among userssubject to the terms and encourage users to connect, communicate and engage with each other. Overconditions of the past two years, we have transformed our business from an advertising based revenue model to one where the majorityMerger Agreement, all shares of our revenue is derived from user pay monetizationcommon stock, other than (i) shares with respect to which appraisal rights are properly exercised and subscriptions. The fastest growing component of user pay monetization comes from in-app purchases, including virtual gifts associated with our live video product.
We began developing our live video platform in 2016 with the belief that we could successfully pair live-streaming and dating – a model that we had seen work effectively for Asian dating app providers. We first launched video on MeetMe early in 2017, and, in October of 2017, we began to monetize the feature by enabling gifting within the video streams. During this time period, we also executed on our strategy of acquiring other properties: Skout, Inc. (“Skout”), Ifwe Inc. (“if(we)”) and Lovoo GmbH (“Lovoo”) – where we believed our live-streaming platform would fit naturally. We then integrated live video into each app. We launched the monetized video platform on Skoutnot withdrawn under Delaware law, or (ii) as otherwise provided in the fourth quarterMerger Agreement, will automatically be converted into the right to receive $6.30 in cash, without interest. Additionally, (i) each outstanding stock option to acquire shares of 2017, Taggedour common stock, (ii) each outstanding share of restricted stock and (iii) each outstanding restricted stock unit that is subject to performance-based vesting will be cancelled in exchange for a cash payment, as established in the Merger Agreement.
We expect the Merger will be completed in the second half of 2020, subject to the satisfaction of all closing conditions.
Impact of the 2019 Novel Coronavirus
We are closely monitoring the impact of the COVID-19 pandemic on all aspects of our business. In the first quarter of 2018 and Lovoo beginning2020, we took a number of precautionary measures designed to help minimize the risk of the spread of the virus to our employees, including suspending all non-essential travel worldwide for our employees, temporarily closing our offices in the second quarterU.S. and Germany and requiring all employees to work remotely.
In March 2020, we experienced an increase in demand for our services as more people around the world practiced social distancing. We saw an increase in the demand for Live, which was partially offset by a slight decrease in demand for our dating products. As a result of 2018. We havethese shifts in users’ behavior, video daily active users (“vDAU”) and average daily video revenue per video daily active user (“vARPDAU”) increased, yielding an increase in video revenue.
Starting in March 2020, we also continuedsaw lower industry demand for advertising, which we attribute to add featuresthe global macroeconomic effects of the COVID-19 pandemic. As a result of this lower demand for advertising, advertising rates within the industry declined for the three months ended March 31, 2020, and enhancements intended to drive video engagement and increase monetization for all the apps. Live video has become the fastest growing revenue productwe saw a decrease in our history.advertising revenue. Our advertising products yield a higher margin when compared to Live and our dating products. Given the differential in margin, if this increased customer demand for Live and lower advertising rates continues, we expect our margins may be negatively impacted for the duration of 2020 or longer unless offset by rising Live revenue and we are unable to predict the duration or degree of such impact with any certainty.
We also offer online marketing capabilities, which enable marketers to display their advertisements onThis situation is changing rapidly, and additional impacts may arise that we are not aware of currently. As a result, the effects of COVID-19 may not be fully reflected in our apps. We offer significant scale to our advertising partners, with hundreds of millions of daily impressions across our active global user base, and sophisticated data sciencefinancial results until future periods. One should review “Part II, Item 1A —Risk Factors” in this Quarterly Report for effective targeting. We work with our advertisers and advertising networks to maximize the effectiveness of their campaigns by optimizing advertisement formats and placements.
Just as Facebook has established itself as the social network of friends and family, and LinkedIn as the social network of colleagues and business professionals, The Meet Group is creating the social entertainment network nota description of the people you know, but of the people you want to know. Nimble, fast-moving and already in more than 100 countries, we are challenging the dominant player in our space, Match Group, Inc., and differentiating ourselves with live video, which is not offered by many of our direct competitors. Modeled after the video products offered by Asian dating app providers, but enhanced in order to appeal to Western audiences, our live video product is aimed at the nexus of entertainment and community, where we believe our apps exhibit natural strength.
Our vision extends beyond dating and entertainment. We focus on building quality products to satisfy the universal need for human connection among all people, everywhere – not just paying subscribers. We believe meeting new people is a basic human need, especially for users aged 18-34, when so many long-lasting relationships are made. We use advanced technology to engineer serendipitous connections among people who otherwise might never have met – a sort of digital coffeehouse where everyone belongs. Over the years, The Meet Group’s apps have originated untold numbers of chats, shares, good friendships, dates, romantic relationships – even marriages.
We believematerial risks that we have significant growth opportunities enabled through our social entertainment platform. We believe our scale provides unique advantages to grow video monetization, while also establishing a high density of users within the geographic regions we serve. As The Meet Group’s networks grow and the number of userscurrently face in a location increases, we believe that users who are seeking to meet new people will incrementally benefit from the quantity of relevant connections.connection with COVID-19.
Operating Metrics
We measure website and applicationapp activity in terms of monthly active users (“MAUs”) and daily active users (“DAUs”). We define aan MAU as a registered user of one of our platforms who has logged in and visited within the last month of measurement. We define a DAU as a registered user of one of our platforms who has logged in and visited within the day of measurement. We define a vDAU as a registered user of one of our platforms who has logged in and visited Live, either as a broadcaster or a viewer, on the day of measurement. For the quartersthree months ended June 30,March 31, 2020 and 2019, and 2018, the total MAUs were approximately 18.2418.63 million and 15.9417.59 million, respectively, and total DAUs were approximately 5.124.75 million and 4.754.93 million and total vDAUs were 0.95 million and 0.88 million, respectively.
The following table sets forth our average MAU, DAU and vDAU for the three months ended March 31, 2020 and 2019:
|
| | | | | |
| | Monthly Average for the Quarter Ended |
| | June 30, |
| | 2019 | | 2018 |
| MAU | 18,241,668 |
| | 15,935,099 |
|
|
| | | | | |
| | Average for the |
| | Three Months Ended March 31, |
| (in thousands) | 2020 | | 2019 |
| MAU | 18,628 |
| | 17,585 |
|
| DAU | 4,749 |
| | 4,931 |
|
| vDAU | 954 |
| | 876 |
|
|
| | | | | |
| | For the Quarter Ended |
| | June 30, |
| | 2019 | | 2018 |
| DAU | 5,118,282 |
| | 4,747,788 |
|
SecondFirst Quarter of 20192020 Highlights
| |
| • | Revenue: Our revenue was $55.1 million for the three months ended March 31, 2020, up 11.2% from $49.5 million for the three months ended March 31, 2019. |
Total revenue was $52.0 million for the second quarter of 2019, up 22% from $42.8 million in the second quarter of 2018.
| |
| • | Net Loss: We incurred a net loss of $2.4 million for the three months ended March 31, 2020, which was primarily attributable to $3.1 million of acquisition, restructuring and other expenses related to the Merger Agreement and the aforementioned impacts of the COVID-19 pandemic. Our comparative net income for the three months ended March 31, 2019 was $1.3 million. |
| |
| • | Adjusted EBITDA: Our adjusted earnings before interest, taxes, depreciation and amortization (“Adjusted EBITDA”) was $7.9 million for the three months ended March 31, 2020, down 2.9% from $8.1 million for the three months ended March 31, 2019. For the definition of Adjusted EBITDA, please refer to the heading “Non-GAAP Financial Measure” included in this MD&A. |
Net income for the second quarter of 2019 was $2.2 million. Adjusted EBITDA was $9.8 million for the second quarter of 2019. (See the important discussion about the presentation of non-GAAP financial measures, and reconciliation from the most directly comparable GAAP financial measures, below.)
| |
| • | Cash and Cash Equivalents: We had cash and cash equivalents of $32.1 million as of March 31, 2020. |
Cash and cash equivalents totaled $26.1 million at June 30, 2019.
Trends in Our Metrics
In addition to MAUs and DAUs, we measure activity on the Company’sour apps in terms of average revenue per user (“ARPU”) and, average daily revenue per daily active user (“ARPDAU”). and vARPDAU. We define ARPU as the quarterly revenue per average MAU. We define ARPDAU as the average daily revenue per DAU. We define vARPDAU as the average daily video revenue per vDAU. We define a mobile MAU as a user who accessed our sites by one of our mobile applicationsapps or by the mobile optimized version of our websites for MeetMe, Skout and Lovoo,LOVOO, whether on a mobile phone or tablet during the month of measurement. We define a mobile DAU as a user who accessed our sites by one of our mobile applicationsapps or by the mobile optimized version of our websites for MeetMe, Skout and Lovoo,LOVOO, whether on a mobile phone or tablet during the day of measurement.
InFor the quarterthree months ended June 30, 2019, the CompanyMarch 31, 2020, we averaged 16.1716.63 million mobile MAUs and 18.2418.63 million total MAUs, compared to 13.65with 15.18 million mobile MAUs and 15.9417.59 million total MAUs inon average for the quarterthree months ended June 30, 2018, a netMarch 31, 2019, which amounted to an increase of 2.521.45 million, or 18%9.6%, for mobile MAUs, and a netan increase of 2.301.04 million, or 14%5.9%, for total MAUs. Mobile DAUs were 4.56averaged 4.25 million for the quarterthree months ended June 30, 2019,March 31, 2020, compared to 4.13 millionwith average mobile DAUs of 4.35 million for the quarterthree months ended June 30, 2018,March 31, 2019, which amounted to a net increasedecrease of approximately 0.430.10 million, total MAUs, or 10%. For2.3%, for mobile DAUs. In the quarterthree months ended June 30, 2019, the CompanyMarch 31, 2020, we averaged 5.124.75 million total DAUs, compared to 4.75with 4.93 million total DAUs on average in the three months ended March 31, 2019, which amounted to a decrease of 0.18 million, or 3.7%, for total DAUs. In the quarterthree months ended June 30, 2018, a netMarch 31, 2020, we averaged 0.95 million vDAUs, compared with 0.88 million vDAUs on average in the three months ended March 31, 2019, which amounted to an increase of approximately 0.370.08 million, total DAUs, or 8%.8.9%, for vDAUs.
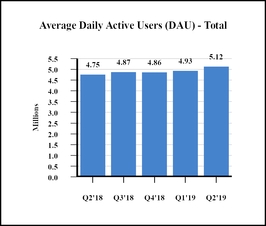
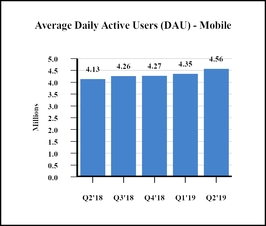
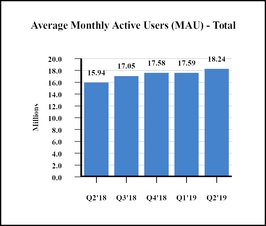

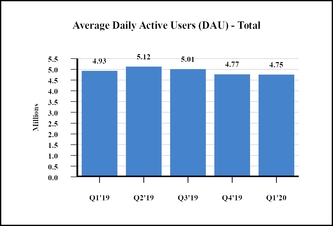
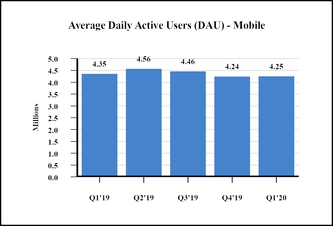

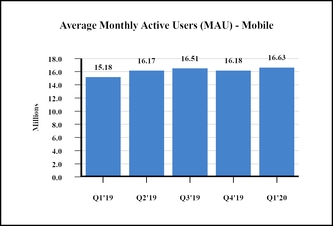
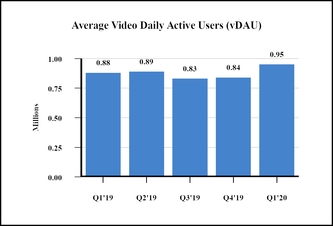
In the quarterthree months ended June 30, 2019, the CompanyMarch 31, 2020, we earned an averageARPU of $1.53 ARPU$1.21 on the web and $2.90 ARPUAPRU of $3.04 on our mobile applications,apps, compared to $1.67with ARPU of $1.45 on the web and $2.61 inARPU of $2.89 on our mobile apps for the three months ended March 31, 2019, which amounted to a decrease of $0.24, or 16.6%, on the web and an increase of $0.15, or 5.2%, on our mobile apps. In the three months ended March 31, 2020, we earned ARPDAU of $0.07 on the web and ARPDAU of $0.13 on our mobile apps, compared with APRDAU of $0.08 on the web and ARPDAU of $0.11 on our mobile apps for the three months ended March 31, 2019, which amounted to a decrease of $0.01, or 12.5%, on the web and an increase of $0.02, or 18.2%, on our mobile apps. In the three months ended March 31, 2020, we earned vARPDAU of $0.33, compared with vARPDAU of $0.26 for the three months ended March 31, 2019, which amounted to an increase of $0.07, or 26.9%.
The following graphs set forth our web ARPU, mobile ARPU, for the quarter ended June 30, 2018. In the quarter ended June 30, 2019, the Company earned an average of $0.079 in web ARPDAU, and $0.113 in mobile ARPDAU comparedand vARPDAU by quarter from the three months ended March 31, 2019 to $0.092 in web ARPDAU and $0.095 in mobile ARDAU for the quarterthree months ended June 30, 2018.March 31, 2020:
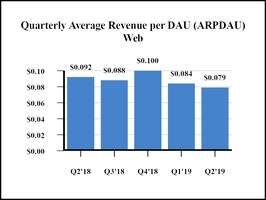
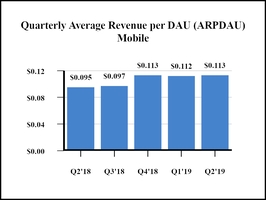
Factors Affecting Our Performance
We believe the following factors affect our performance:
| |
| • | Number of MAUs, DAUs and vDAUs: We believe our ability to grow web and mobile MAUs, DAUs and vDAUs affects our revenue and financial results by influencing the number of advertisements we are able to show, the value of those advertisements and the volume of subscriptions and in-app purchases, as well as our expenses and capital expenditures. |
| |
| • | User Engagement: We believe changes in user engagement patterns affect our revenue and financial performance. Specifically, the number of visits and the amount of time spent by each MAU, DAU or vDAU generates affects the number of advertisements we are able to display and therefore the rate at which we are able to monetize our active user base. In addition, the number of users that make in-app purchases and the amounts that they purchase directly impact our revenue. We continue to create new features and enhance existing features to drive additional engagement. The percent of MAU and DAU that engage with our video products and their conversion to paying users also affects the amount of in-app purchases revenue we are able to earn. |
Number of MAUs and DAUs: We believe our ability to grow web and mobile MAUs and DAUs affects our revenue and financial results by influencing the number of advertisements we are able to show, the value of those advertisements, and the volume of subscriptions and in-app purchases, as well as our expenses and capital expenditures.
| |
| • | Advertising Rates: We believe our revenue and financial results are materially dependent on industry trends, and any changes to the cost per thousand advertising impressions could affect our revenue and financial results. In 2017, we experienced declining advertising rates, which negatively affected our revenue. In 2018, we saw some stabilization in advertising rates and a return to normal seasonality in advertising trends. In 2019, we saw continued stabilization in advertising rates and another year of typical seasonality. We expect to continue investing in new types of advertising and new placements. Additionally, we are prioritizing initiatives that generate revenue directly from users, including new in-app purchases products and a premium subscription product, in part to reduce our dependency on advertising revenue. |
| |
| • | User Geography: The geography of our users influences our revenue and financial results because we currently monetize users in distinct geographies at varying average rates. For example, ARPU in the U.S. and Canada is significantly higher than in Latin America. |
| |
| • | New User Sources: The percentage of our new users that are acquired through inorganic, paid sources impacts our financial performance, specifically with regard to ARPU for web and mobile. Inorganically-acquired users tend to have lower engagement rates, tend to generate fewer visits and advertisement impressions and to be less likely to make in-app purchases. When paid marketing campaigns are ongoing, our overall usage and traffic increases due to the influx of inorganically-acquired users, but the rate at which we monetize the average active user overall declines as a result. |
| |
| • | Advertisement Inventory Management: Our revenue trends are affected by advertisement inventory management changes affecting the number, size or prominence of advertisements we display. In general, more prominently-displayed advertising units generate more revenue per impression. |
| |
| • | Apple App Store and Google Play Store: Our mobile apps are distributed through the Apple App Store and the Google Play Store. Our business will suffer if we are unable to maintain good relationships with Apple and Google, if their terms and conditions or pricing change to our detriment, if we violate, or either company believes that we have violated, its terms and conditions or if either of these platforms are unavailable for a prolonged period of time. |
| |
| • | Seasonality: Historically, advertising spending has been seasonal with a peak in the fourth quarter of each year. With the decline in advertising rates in 2017, we did not experience this seasonality consistent with prior years. In 2018 and 2019, we saw some stabilization in advertising rates and a return to normal seasonality in advertising trends. We believe this seasonality in advertising spending affects our quarterly results, which historically have reflected a growth in advertising revenue between the third and fourth quarters and a decline in advertising revenue between the fourth and subsequent first and second quarters each year. Growth trends in web and mobile MAUs, DAUs and vDAUs affect our revenue and financial results by influencing the number of advertisements we are able to show, the value of those advertisements, the volume of payments transactions and our expenses and capital expenditures. |
| |
| • | Business Combinations: Acquisitions have been an important part of our growth strategy. In 2016 and 2017, we acquired three companies (Skout, if(we) and LOVOO), representing four significant brands for our portfolio (Skout, Tagged, Hi5 and LOVOO). In 2019, we acquired Initech and the Growlr app. Our ability to integrate acquired apps into our portfolio will impact our financial performance. As a consequence of the contributions of these businesses and acquisition-related expenses, our consolidated results of operations may not be comparable between periods. |
User Engagement: We believe changes in user engagement patterns affect our revenue and financial performance. Specifically, the number of visits and the amount of time spent by each MAU or DAU generates affects the number of advertisements we are able to display and therefore the rate at which we are able to monetize our active user base. In addition, the number of users that make in-app purchases and the amounts that they purchase directly impact our revenue. We continue to create new features and enhance existing features to drive additional engagement. The percent of MAU and DAU that engage with our video products and their conversion to paying users also affects the amount of in-app purchase revenue we are able to earn.
| |
| • | The Merger: Failure to complete the previously announced Merger could adversely impact the market price of our common stock as well as our business and operating results. This risk, as well as other risks associated with the Merger, are identified further in “Part I, Item 1A — Risk Factors” included in our Annual Report for the year ended December 31, 2019. |
| |
| • | COVID-19: While the COVID-19 pandemic has had a minimal impact on our operations and financial results to date, the future impacts of the pandemic and any resulting economic impact are largely unknown and rapidly evolving. It is possible that the COVID-19 pandemic, the measures taken by the governments of countries affected and the resulting economic impact may negatively impact our results of operations, cash flows and financial position as well as our vendors, advertising partners and users. As a result, the effects of COVID-19 may not be fully reflected in our financial results until future periods. Refer to “Part II, Item 1A — Risk Factors” in this Quarterly Report for a description of the material risks that the Company currently faces in connection with COVID-19. The impact of the COVID-19 pandemic may also exacerbate other risks discussed in “Part I, Item 1A — Risk Factors” included in the Company’s Annual Report for the year ended December 31, 2019. |
Advertising Rates: We believe our revenue and financial results are materially dependent on industry trends, and any changes to the revenue we earn per thousand advertising impressions could affect our revenue and financial results. In 2017, we experienced declining advertising rates, which negatively affected our revenue. In 2018, we saw some stabilization in advertising rates and a return to normal seasonality in advertising trends. We expect to continue investing in new types of advertising and new placements. Additionally, we are prioritizing initiatives that generate revenue directly from users, including new in-app purchases products and a premium subscription product, in part to reduce our dependency on advertising revenue.
User Geography: The geography of our users influences our revenue and financial results because we currently monetize users in distinct geographies at varying average rates. For example, ARPU in the U.S. and Canada is significantly higher than in Latin America.
New User Sources: The percentage of our new users that are acquired through inorganic, paid sources impacts our financial performance, specifically with regard to ARPU for web and mobile. Inorganically acquired users tend to have lower engagement rates, tend to generate fewer visits and ad impressions and tend to be less likely to make in-app purchases. When paid marketing campaigns are ongoing, our overall usage and traffic increases due to the influx of inorganically acquired users, but the rate at which we monetize the average active user overall declines as a result.
Ad Inventory Management: Our revenue trends are affected by advertisement inventory management changes affecting the number, size, or prominence of advertisements we display. In general, more prominently displayed advertising units generate more revenue per impression. Our Social Theater campaign expenses are materially dependent on the percentage of Social Theater campaigns that run on MeetMe versus the percentage that run on other networks. We work to maximize the share of Social Theater campaigns that run on MeetMe and run campaigns on other networks only when necessary.
Google Play Store and Apple App Store: Our mobile applications are distributed through the Google Play Store and the Apple App Store. Our business will suffer if we are unable to maintain good relationships with Google and Apple, if their terms and conditions or pricing change to our detriment, if we violate, or either company believes that we have violated, its terms and conditions, or if either of these platforms are unavailable for a prolonged period of time.
Increased Social Theater Competition: A significant portion of the revenue generated by the Social Theater is derived from advertising campaigns, powered by Social Theater technology, that run on networks other than The Meet Group networks. A recent increase in competitors offering similar technology solutions, and in some cases their own cross-platform distribution networks, has made it more difficult to compete on price and win business. We expect this downward pressure on price to continue and impact our operating results in the future.
Seasonality: Historically, advertising spending has traditionally been seasonal with a peak in the fourth quarter of each year. With the decline in advertising rates in 2017, we did not experience this seasonality consistent with prior years. In 2018, we saw some stabilization in advertising rates and a return to normal seasonality in advertising trends. We believe that this seasonality in advertising spending affects our quarterly results, which historically have reflected a growth in advertising revenue between the third and fourth quarters and a decline in advertising spending between the fourth and subsequent first and second quarters each year. Growth trends in web and mobile MAUs and DAUs affect our revenue and financial results by influencing the number of advertisements we are able to show, the value of those advertisements, the volume of payments transactions, as well as our expenses and capital expenditures.
Business Combinations: Acquisitions have been an important part of our growth strategy. During the two years in the period ended December 31, 2017, we acquired three companies (Skout, if(we) and Lovoo), representing four significant brands for our portfolio (Skout, Tagged, Hi5 and Lovoo). We also acquired Growlr in March 2019. Our ability to integrate acquired apps into our portfolio will impact our financial performance. As a consequence of the contributions of these businesses and acquisition-related expenses, our consolidated results of operations may not be comparable between periods.
Growth trends in web and mobile MAUs and DAUs affect our revenue and financial results by influencing the number of advertisements we are able to show, the value of those advertisements, the volume of payments transactions, as well as our expenses and capital expenditures.
Changes in user engagement patterns from web to mobile, international diversification and the rollout of our live video productLive also affect our revenue and financial performance. We believe that overall engagement as measured by the percentage of users who create content (such as video broadcasts, status posts, messages or photos) or generate feedback increases as our user base grows. We continue to create new and improved features to drive social sharing and increase monetization.
We believe our revenue trends are also affected by advertisement inventory management changes affecting the number, size or prominence of the advertisements we display and traditional seasonality. Social Theater is a revenue product for the MeetMe platform and on third-party sites. Social Theater growth may be affected by large brand penetration, the ability to grow the advertiser base, and advertiser spending budgets.
Critical Accounting Policies and Estimates
Our critical accounting policies and estimates are described in Part II, Item 7, “Management’s Discussion and Analysis of Financial Condition and Results of Operations” ofthe MD&A included in our Annual Report filed withfor the SEC on March 8,year ended December 31, 2019. We believe there have been no new critical accounting policies, or material changes to our existing critical accounting policies and estimates during the sixthree months ended June 30, 2019, compared to those discussed in our Annual Report, except for our adoption of the new lease standard.
Leases
We determine, at the inception of a contract, if the arrangement is a lease and whether it meets the classification criteria for a finance or operating lease. Right-of-use (“ROU”) assets represent our right to use an underlying asset during the lease term and lease liabilities represent our obligation to make lease payments arising from the lease. ROU assets and lease liabilities are recognized at commencement date based on the present value of fixed lease payments over the lease term. ROU assets also include any advance lease payments and exclude lease incentives. As most of our operating leases do not provide an implicit rate, we use our incremental borrowing rate based on information available at commencement date in determining the present value of lease payments. Finance lease agreements generally include an interest rate that is used to determine the present value of future lease payments. Operating fixed lease expense and finance lease depreciation expense are recognized on a straight-line basis over the lease term.March 31, 2020.
Recent Accounting Pronouncements
For detailed information regarding recently issuedrecently-adopted and recently-issued accounting pronouncements and thetheir actual or expected impact onimpacts to our unaudited consolidated financial statements, see “Note 1—1 —Description of Business, Basis of Presentation and Summary of Significant Accounting Policies in the accompanying notes” to the condensed consolidated financial statementsunaudited “Consolidated Financial Statements” and the related notes thereto included elsewhere in this Quarterly Report on Form 10-Q.
Report.
Comparison of Our Operating Results for the three months ended June 30,Three Months Ended March 31, 2020 and 2019 and 2018
The following table sets forth our condensedunaudited consolidated statements of operations for the three months ended June 30,March 31, 2020 and 2019, and 2018 that is used in the following discussions of our results of operations:
| | | | Three Months Ended June 30, | | Change From Prior Year | Three Months Ended March 31, | | Change From Prior Year |
| | 2019 | | 2018 | | ($) | | % | |
| Revenues | $ | 52,000,104 |
| | $ | 42,801,745 |
| | $ | 9,198,359 |
| | 21.5 | % | |
| (in thousands) | | 2020 | | 2019 | | ($) | | % |
| Revenue | | $ | 55,066 |
| | $ | 49,513 |
| | $ | 5,553 |
| | 11.2 | % |
| Operating costs and expenses: | | | | | | | | | | | | | | |
| Sales and marketing | 9,059,530 |
| | 7,753,486 |
| | 1,306,044 |
| | 16.8 | % | 7,714 |
| | 7,841 |
| | (127 | ) | | (1.6 | )% |
| Product development and content | 30,149,797 |
| | 24,411,288 |
| | 5,738,509 |
| | 23.5 | % | 37,671 |
| | 31,123 |
| | 6,548 |
| | 21.0 | % |
| General and administrative | 5,892,437 |
| | 5,154,103 |
| | 738,334 |
| | 14.3 | % | 5,030 |
| | 4,928 |
| | 102 |
| | 2.1 | % |
| Depreciation and amortization | 3,430,018 |
| | 3,505,180 |
| | (75,162 | ) | | (2.1 | )% | 2,820 |
| | 3,198 |
| | (378 | ) | | (11.8 | )% |
| Acquisition and restructuring costs | 25,454 |
| | 1,036,602 |
| | (1,011,148 | ) | | (97.5 | )% | |
| Acquisition, restructuring and other | | 3,370 |
| | 479 |
| | 2,891 |
| | 603.5 | % |
| Total operating costs and expenses | 48,557,236 |
| | 41,860,659 |
| | 6,696,577 |
| | 16.0 | % | 56,605 |
| | 47,569 |
| | 9,036 |
| | 19.0 | % |
| Income from operations | 3,442,868 |
| | 941,086 |
| | 2,501,782 |
| | 265.8 | % | |
| (Loss) income from operations | | (1,539 | ) | | 1,944 |
| | (3,483 | ) | | (179.2 | )% |
| Other income (expense): | | | | | | | | | | | | | | |
| Interest income | 27,605 |
| | 2,742 |
| | 24,863 |
| | 906.7 | % | 13 |
| | 32 |
| | (19 | ) | | (59.4 | )% |
| Interest expense | (328,196 | ) | | (671,294 | ) | | 343,098 |
| | 51.1 | % | (396 | ) | | (403 | ) | | 7 |
| | (1.7 | )% |
| Gain (loss) on foreign currency adjustment | (2,380 | ) | | 4,216 |
| | (6,596 | ) | | (156.5 | )% | |
| Other | (787 | ) | | 28,571 |
| | (29,358 | ) | | 102.8 | % | |
| Loss on foreign currency transactions | | (7 | ) | | (65 | ) | | 58 |
| | (89.2 | )% |
| Loss on disposal of assets | | (108 | ) | | — |
| | (108 | ) | | (100.0 | )% |
| Other items of income, net | | 2 |
| | 4 |
| | (2 | ) | | (50.0 | )% |
| Total other expense | (303,758 | ) | | (635,765 | ) | | 332,007 |
| | 52.2 | % | (496 | ) | | (432 | ) | | (64 | ) | | 14.8 | % |
| Income before income tax expense | 3,139,110 |
| | 305,321 |
| | 2,833,789 |
| | 928.1 | % | |
| (Loss) income before income tax expense | | (2,035 | ) | | 1,512 |
| | (3,547 | ) | | (234.6 | )% |
| Income tax expense | (935,284 | ) | | (540,593 | ) | | (394,691 | ) | | (73.0 | )% | (373 | ) | | (254 | ) | | (119 | ) | | 46.9 | % |
| Net income (loss) | $ | 2,203,826 |
| | $ | (235,272 | ) | | $ | 2,439,098 |
| | 1,036.7 | % | |
| Net (loss) income | | $ | (2,408 | ) | | $ | 1,258 |
| | $ | (3,666 | ) | | (291.4 | )% |
Revenue
Revenues
Our revenues were approximately $52.0revenue was $55.1 million for the three months ended June 30, 2019,March 31, 2020, which represented an increase of $9.2$5.6 million, or 21.5%11.2%, compared to $42.8with revenue of $49.5 million for the three months ended June 30, 2018. March 31, 2019.
The following table presentssets forth our revenuesrevenue disaggregated by revenue source for the three months ended June 30, 2019March 31, 2020 and 2018:
2019:
|
| | | | | | | | | | | | | |
| | Three Months Ended June 30, |
| | 2019 | | 2018 |
| | ($) | | % | | ($) | | % |
| User pay revenue | $ | 36,921,301 |
| | 71.0 | % | | $ | 25,570,553 |
| | 59.7 | % |
| Advertising | 15,078,803 |
| | 29.0 | % | | 17,231,192 |
| | 40.3 | % |
| Total revenue | $ | 52,000,104 |
| | 100.0 | % | | $ | 42,801,745 |
| | 100.0 | % |
|
| | | | | | | | | | | | | |
| | Three Months Ended March 31, |
| | 2020 | | 2019 |
| (in thousands) | $ | | % | | $ | | % |
| User pay revenue: | | | | | | | |
| Video | $ | 28,633 |
| | 52.0 | % | | $ | 20,229 |
| | 40.9 | % |
| Subscription and other in-app products | 14,395 |
| | 26.1 | % | | 15,596 |
| | 31.5 | % |
| Total user pay revenue | 43,028 |
| | 78.1 | % | | 35,825 |
| | 72.4 | % |
| Advertising revenue | 12,038 |
| | 21.9 | % | | 13,688 |
| | 27.6 | % |
| Total revenue | $ | 55,066 |
| | 100.0 | % | | $ | 49,513 |
| | 100.0 | % |
The increase in revenue isfor the three months ended March 31, 2020 was primarily attributable to a $11.4$7.2 million increase in user pay revenue, which was partially offset by a $2.2$1.7 million decrease in advertising revenue. The increase in user pay revenue is attributedwas primarily attributable to increased adoptionthe continued growth and improved monetization of MeetMeusers on Live Skout Live and Tagged Live. In addition,across all of our apps, as well as the increase in user pay revenue is attributeddemand for our services as more people around the world practiced social distancing in response to the adoption of Lovoo Live, which went live in the second quarter of 2018.COVID-19 pandemic. The decrease in advertising revenue iswas primarily dueattributable to the decrease in the number oflower advertising impressionsrates for the three months ended June 30, 2019March 31, 2020, and 2018.lower industry demand for advertising starting in March 2020, which were both negatively impacted by the global macroeconomic effects of the COVID-19 pandemic.
Operating Costs and Expenses
| |
| • | Sales and Marketing: Sales and marketing expenses decreased $0.1 million, or 1.6%, to $7.7 million for the three months ended March 31, 2020, compared with sales and marketing expenses of $7.8 million for the three months ended March 31, 2019. The decrease in sales and marketing expenses for the three months ended March 31, 2020 was primarily attributable to a $0.4 million decrease in user acquisition expense and a $0.2 million decrease in employee-related expense, which were partially offset by a $0.4 million increase in other sales and marketing expense and a $0.1 million increase in stock-based compensation expense. |
| |
| • | Product Development and Content: Product development and content expenses increased $6.5 million, or 21.0%, to $37.7 million for the three months ended March 31, 2020, compared with product development and content expenses of $31.1 million for the three months ended March 31, 2019. The increase in product development and content expenses for the three months ended March 31, 2020 was primarily attributable to an increase in variable mobile content costs, net of broadcaster rewards breakage, of $3.8 million due to increased revenue from Live, a $0.9 million increase in safety moderation expense, a $0.7 million increase in employee-related expense, a $0.6 million increase in technical operations expense, a $0.4 million increase in stock-based compensation expense and a $0.1 million increase in other product development and content expense. |
| |
| • | General and Administrative: General and administrative expenses were largely unchanged at $5.0 million for the three months ended March 31, 2020, compared with general and administrative expenses of $4.9 million for the three months ended March 31, 2019. The slight increase in general and administrative expenses for the three months ended March 31, 2020 was primarily attributable to a $0.3 million increase in stock-based compensation expense, which was partially offset by a $0.2 million decrease in the provision for expected credit losses. |
| |
| • | Depreciation and Amortization: Depreciation and amortization expense decreased $0.4 million, or 11.8%, to $2.8 million for the three months ended March 31, 2020, compared with depreciation and amortization expense of $3.2 million for the three months ended March 31, 2019. The decrease in depreciation and amortization expense for the three months ended March 31, 2020 was primarily attributable to lower amortization expense for certain intangible assets acquired in our acquisitions of if(we) and LOVOO, which was partially offset by higher amortization expense for the intangible assets acquired in our acquisition of Initech. |
| |
| • | Acquisition, Restructuring and Other: Acquisition, restructuring and other expenses amounted to $3.4 million for the three months ended March 31, 2020, compared with acquisition, restructuring and other expenses of $0.5 million for the three months ended March 31, 2019. Acquisition, restructuring and other expenses for the three months ended March 31, 2020 were primarily attributable to investment banking, legal, professional service and other transaction-related costs incurred in connection with the Merger Agreement. Further, we expect to continue to incur Merger-related costs, and acquisition, restructuring and other expenses could increase if we incur litigation-related expenses associated with our defense against legal claims related to the Merger. Acquisition, restructuring and other expenses for the three months ended March 31, 2019 were primarily attributable to legal, professional service and other transaction-related costs incurred in connection with our acquisition of Initech. |
Sales and Marketing: Sales and marketing expenses increased approximately $1.3 million, or 16.8%, to $9.1Interest Expense
Interest expense was largely unchanged at $0.4 million for the three months ended June 30, 2019 from $7.8 millionMarch 31, 2020 and 2019. Interest expense for the three months ended June 30, 2018. The net increaseMarch 31, 2020 was primarily attributable to $0.3 million in salesinterest charges for our credit facilities, a $0.2 million unrealized loss for the changes in the fair values of our dedesignated interest rate derivatives and marketing expenses is due to increased advertising spend of approximately $1.0$0.1 million to attract more users toin other non-cash interest expense, which were partially offset by $0.2 million in counterparty receipts from our apps.
Product Development and Content: Product development and content expenses increased approximately $5.7 million, or 23.5%, to $30.1 millioncross-currency swap. Interest expense for the three months ended June 30,March 31, 2019 from $24.4 million for the three months ended June 30, 2018. The net increase in product development and content expense iswas primarily attributable to an increase in mobile content costs of $7.3 million due to the increased adoption of MeetMe Live, Skout Live, Tagged Live and Lovoo Live offset by a reduction for video broadcaster reward breakage of $1.9 million during the three months ended June 30, 2019.
General and Administrative: General and administrative expenses increased approximately $0.7 million, or 14.3%, to $5.9 million for the three months ended June 30, 2019 from $5.2 million for the three months ended June 30, 2018. The increase in general and administrative expense is primarily attributable to the increase in the accounts receivable allowance and stock based compensation of $0.6 million and $0.3 million, respectively. The increase isin interest charges for our prior credit facilities, which was partially offset by a decrease$0.2 million in travel related expenses of $0.1 million and office related expenses due to the closing ofcounterparty receipts from our office in San Francisco, CA of approximately $0.1 million.cross-currency swap.
Depreciation and Amortization Expense:Depreciation and amortization expenses decreased approximately $0.1 million, or 2.1%, to $3.4 million for the three months ended June 30, 2019 from $3.5 million for the three months ended June 30, 2018. The decrease in depreciation and amortization expense is primarily attributable to lower amortization of intangibles related to the if(we) Acquisition and the Lovoo Acquisition, partially offset by the amortization of the intangibles related to the Growlr Acquisition.
Acquisition and Restructuring Costs:Acquisition and restructuring costs decreased approximately $1.0 million, or 97.5%, to $0.03 million for the three months ended June 30, 2019 from $1.0 million for the three months ended June 30, 2018. Acquisition and restructuring costs include the transaction costs, including legal and diligence costs for acquisitions, the accrual of the exit cost of non-cancellable leases and employee exit and relocation costs. The decrease in acquisition and restructuring costs is mainly due to a decrease in severance costs in the three months ended June 30, 2019.
Comparison of Stock-Based Compensation and Income Taxes
Stock-Based Compensation
Stock-based compensation expense, included in the operating expense by category, increased approximately $0.8 million to $2.9 million for the three months ended June 30, 2019 from $2.1 million for the three months ended June 30, 2018. Stock-based compensation expense represented 5.9% and 5.0% of operating expenses for the three months ended June 30, 2019 and 2018, respectively.
As of June 30, 2019, there was approximately $1.0 million, $16.9 million and $3.5 million of total unrecognized compensation cost which is expected to be recognized over a weighted-average vesting period of approximately of 0.8 years, 2.2 years and 2.5 years relating to stock options, RSAs and PSUs, respectively.
|
| | | | | | | | | | | |
| | Three Months Ended June 30, | | Change from Prior Year |
| | 2019 | | 2018 | | ($) |
| Sales and marketing | $ | 106,323 |
| | $ | 112,222 |
| | $ | (5,899 | ) |
| Product development and content | 1,642,931 |
| | 1,161,863 |
| | 481,068 |
|
| General and administrative | 1,116,082 |
| | 816,785 |
| | 299,297 |
|
| Total stock-based compensation expense | $ | 2,865,336 |
| | $ | 2,090,870 |
| | $ | 774,466 |
|
InterestTax Expense
InterestIncome tax expense decreased approximatelywas $0.4 million toand $0.3 million for the three months ended June 30,March 31, 2020 and 2019, from $0.7respectively. For the three months ended March 31, 2020, our effective tax rate (“ETR”) was (18.3)%, compared with an ETR of 16.8% for the three months ended March 31, 2019. The increase in our income tax expense and ETR for the three months ended March 31, 2020 were primarily attributable to certain non-deductible transaction costs incurred in connection with the Merger Agreement, the geographic mix of earnings between the U.S. and Germany, which has a higher statutory tax rate, and a decrease in windfall tax benefits on stock-based compensation. These increases were partially offset by the discrete impact of certain deductible transaction costs incurred in connection with the Merger Agreement.
Comparison of Our Stock-based Compensation Expense for the Three Months Ended March 31, 2020 and 2019
Stock-based compensation expense, included in our operating costs and expenses by category, increased $0.8 million, or 31.3%, to $3.2 million for the three months ended June 30, 2018. The decrease in interest expense is due to a lower debt balance and a lower effective interest rate during the three months ended June 30, 2019.
Income Tax Expense
We recorded a net income taxMarch 31, 2020, compared with stock-based compensation expense of approximately $0.9 million and $0.5$2.4 million for the three months ended June 30, 2019March 31, 2019. Stock-based compensation expense represented 5.6% and 2018, respectively. Our effective tax rate from operations5.1% of operating costs and expenses for the three months ended June 30,March 31, 2020 and 2019, was lower than the effective tax rate for the three months ended June 30, 2018 due to permanent addback items, the difference in tax rates between the U.S. and Germany and the discrete tax impact of stock based compensation. During the three months ended June 30, 2019, we had more book income and less additional tax expense related to stock based compensation as compared to the three months ended June 30, 2018.respectively.
Comparison of the six months ended June 30, 2019 and 2018
The following table sets forth the allocation of stock-based compensation expense in our condensedunaudited consolidated statements of operations and comprehensive (loss) income for the sixthree months ended June 30, 2019March 31, 2020 and 2018 that is used in the following discussions of our results of operations:2019:
|
| | | | | | | | | | | | | | |
| | Six Months Ended June 30, | | Change From Prior Year |
| | 2019 | | 2018 | | ($) | | % |
| Revenues | $ | 101,513,341 |
| | $ | 80,439,538 |
| | $ | 21,073,803 |
| | 26.2 | % |
| Operating costs and expenses: | | | | | | | |
| Sales and marketing | 16,900,396 |
| | 14,801,479 |
| | 2,098,917 |
| | 14.2 | % |
| Product development and content | 61,273,172 |
| | 46,512,825 |
| | 14,760,347 |
| | 31.7 | % |
| General and administrative | 10,820,219 |
| | 10,623,281 |
| | 196,938 |
| | 1.9 | % |
| Depreciation and amortization | 6,628,122 |
| | 7,134,783 |
| | (506,661 | ) | | (7.1 | )% |
| Acquisition and restructuring | 504,449 |
| | 4,386,553 |
| | (3,882,104 | ) | | (88.5 | )% |
| Total operating costs and expenses | 96,126,358 |
| | 83,458,921 |
| | 12,667,437 |
| | 15.2 | % |
| Income (loss) from operations | 5,386,983 |
| | (3,019,383 | ) | | 8,406,366 |
| | 278.4 | % |
| Other income (expense): | | | | | | | |
| Interest income | 59,994 |
| | 9,950 |
| | 50,044 |
| | 503.0 | % |
| Interest expense | (731,060 | ) | | (1,278,980 | ) | | 547,920 |
| | 42.8 | % |
| Gain (loss) on foreign currency transactions | (67,589 | ) | | 107,259 |
| | (174,848 | ) | | (163.0 | )% |
| Other | 2,762 |
| | 21,627 |
| | (18,865 | ) | | (87.2 | )% |
| Total other expense | (735,893 | ) | | (1,140,144 | ) | | 404,251 |
| | 35.5 | % |
| Income (loss) before income tax expense | 4,651,090 |
| | (4,159,527 | ) | | 8,810,617 |
| | 211.8 | % |
| Income tax expense | (1,189,665 | ) | | (288,406 | ) | | (901,259 | ) | | (312.5 | )% |
| Net income (loss) | $ | 3,461,425 |
| | $ | (4,447,933 | ) | | $ | 7,909,358 |
| | 177.8 | % |
|
| | | | | | | | | | | |
| | Three Months Ended March 31, | | Change from Prior Year |
| (in thousands) | 2020 | | 2019 | | ($) |
| Sales and marketing | $ | 124 |
| | $ | 70 |
| | $ | 54 |
|
| Product development and content | 1,928 |
| | 1,500 |
| | 428 |
|
| General and administrative | 1,133 |
| | 855 |
| | 278 |
|
| Total stock-based compensation expense | $ | 3,185 |
| | $ | 2,425 |
| | $ | 760 |
|
Liquidity and Capital Resources
Revenues
Cash Flows
Our revenues were approximately $101.5 million for the six months ended June 30, 2019, an increase of $21.1 million or 26.2% compared to $80.4 million for the six months ended June 30, 2018.
The following table presentssets forth the changes in our revenues disaggregated by revenue sourcecash and cash equivalents for the sixthree months ended June 30, 2019March 31, 2020 and 2018:2019:
|
| | | | | | | | | | | | | |
| | Six Months Ended June 30, |
| | 2019 | | 2018 |
| | $ | | % | | $ | | % |
| User pay revenue | $ | 72,746,410 |
| | 71.7 | % | | $ | 47,976,083 |
| | 59.6 | % |
| Advertising | 28,766,931 |
| | 28.3 | % | | 32,463,455 |
| | 40.4 | % |
| Total revenue | $ | 101,513,341 |
| | 100.0 | % | | $ | 80,439,538 |
| | 100.0 | % |
|
| | | | | | | |
| | Three Months Ended March 31, |
| (in thousands) | 2020 | | 2019 |
| Net cash provided by operating activities | $ | 5,551 |
| | $ | 3,362 |
|
| Net cash used in investing activities | (87 | ) | | (12,091 | ) |
| Net cash (used in) provided by financing activities | (467 | ) | | 234 |
|
| Change in cash and cash equivalents prior to effect of foreign currency exchange rate | $ | 4,997 |
| | $ | (8,495 | ) |
Operating Activities
We received $5.6 million and $3.4 million in cash flows from our operating activities for the three months ended March 31, 2020 and 2019, respectively. The increase in revenue isour operating cash flows for the three months ended March 31, 2020 was primarily attributable to a $24.8$5.3 million increase in user pay revenue,working capital inflows, which was partially offset by a $3.7 million decrease in advertising revenue. The increasenet income.
Investing Activities
We used $0.1 million and $12.1 million in user pay revenue is attributed tocash flows for our investing activities for the continued growth in revenue on the Company’s Live platform across all of our apps in the sixthree months ended June 30,March 31, 2020 and 2019, compared torespectively. For the sixthree months ended June 30, 2018. The second quarterMarch 31, 2020, our cash used for investing activities was fully attributable to $0.1 million in purchases of property and equipment. For the three months ended March 31, 2019, reflects a full quarterour cash used for investing activities was fully attributable to cash consideration payments of revenue$11.8 million for Lovoo Live as it went liveour acquisition of Initech, and $0.3 million in the second quarterpurchases of 2018. The decreaseproperty and equipment.
Financing Activities
We used $0.5 million in advertising revenue is primarily due to the decrease in the number of advertising impressionscash flows for our financing activities for the sixthree months ended June 30, 2019 compared toMarch 31, 2020 and received $0.2 million in cash flows from our financing activities for the sixthree months ended June 30, 2018.
Operating Costs and Expenses
Sales and Marketing: Sales and marketing expenses increased approximately $2.1 million, or 14.2%, to $16.9 million forMarch 31, 2019. For the sixthree months ended June 30, 2019 from $14.8 millionMarch 31, 2020, our cash used for the six months ended June 30, 2018. The net increase in sales and marketing expenses is due to increased user acquisition spend of approximately $1.8 million to attract more users to our apps.
Product Development and Content: Product development and content expenses increased approximately $14.8 million, or 31.7%, to $61.3 million for the six months ended June 30, 2019 from $46.5 million for the six months ended June 30, 2018. The net increase in product development and content expense is attributable to the increase in mobile content costs of $16.6 million due to the increased adoption on MeetMe Live, Skout Live, Tagged Live and Lovoo Live offset by a reduction for video broadcaster reward breakage of $1.9 million during the six months ended June 30, 2019.
General and Administrative: General and administrative expenses increased $0.2 million or 1.9%, to $10.8 million for the six months ended June 30, 2019 from $10.6 million for the six months ended June 30, 2018. The net increase in general and administrative expense is primarily due to increase in stock based compensation of approximately $0.2 million and other general administrative costs of $0.5 million offset by a decrease in office related expenses of approximately $0.3 million and travel related costs of $0.2 million. The increase in other general and administrative costs isfinancing activities was primarily attributable to an increase to the accounts receivable allowance.
Depreciation and Amortization: Depreciation and amortization expenses decreased $0.5payments of $0.9 million or 7.1%, to $6.6 million for the six months ended June 30, 2019 from $7.1 million for the six months ended June 30, 2018. The decrease in depreciation and amortization expense is primarily attributable to lower amortization of intangibles related to the if(we) Acquisition and the Lovoo Acquisition,on our term loan facility, which was partially offset by the amortization of the intangibles related to the Growlr Acquisition.
Acquisition and Restructuring: Acquisition and restructuring expenses decreased $3.9 million or 88.5%, to $0.5 million for the six months ended June 30, 2019 from $4.4 million for the six months ended June 30, 2018. Acquisition and restructuring costs include the employee retention bonuses in connection with the acquisitions, employee related restructuring costs, the accrual of the exit cost of non-cancellable leases and employee exit and relocation costs. The decrease in acquisition and restructuring costs is mainly due to a decrease in severance costs, partially offset by transaction costs from the Growlr Acquisition of approximately $0.3 million.
Comparison of Stock-Based Compensation and Income Taxes
Stock Based Compensation
Stock-based compensation expense, included in the operating expense by category, increased approximately $1.0 million to $5.3 million for the six months ended June 30, 2019 from $4.3 million for the six months ended June 30, 2018. Stock-based compensation expense represented 5.5% and 5.1% of operating expenses for the six months ended June 30, 2019 and 2018, respectively.
As of June 30, 2019, there was approximately $1.0 million, $16.9 million and $3.5 million of total unrecognized compensation cost which is expected to be recognized over a weighted-average vesting period of approximately of 0.8 years, 2.2 years and 2.5 years relating to stock options, RSAs and PSUs, respectively.
|
| | | | | | | | | | | |
| | Six Months Ended June 30, | | Change from Prior Year |
| | 2019 | | 2018 | | ($) |
| Sales and marketing | $ | 176,498 |
| | $ | 230,769 |
| | $ | (54,271 | ) |
| Product development and content | 3,142,324 |
| | 2,275,930 |
| | 866,394 |
|
| General and administrative | 1,971,231 |
| | 1,753,096 |
| | 218,135 |
|
| Total stock-based compensation expense | $ | 5,290,053 |
| | $ | 4,259,795 |
| | $ | 1,030,258 |
|
Interest Expense
Interest expense decreased approximately $0.6 million to $0.7 million for the six months ended June 30, 2019 from $1.3 million for the six months ended June 30, 2018. The decrease in interest expense is due to a lower debt balance, partially offset by a higher effective interest rate during the six months ended June 30, 2019.
Income Tax Expense
Income tax expense was $1.2 million and $0.3 million for the six months ended June 30, 2019 and 2018, respectively. For the six months ended June 30, 2019, our ETR from operations was 25.6%, compared to 1.0% for the six months ended June 30, 2018. The difference between our ETR and the current U.S. statutory rate of 21%, as well as the difference in the ETR for the six months ended June 30, 2019 compared to the six months ended June 30, 2018, are primarily related to permanent addback items, the difference in tax rates between the U.S. and Germany, the discrete tax impact of stock-based compensation and income during the six months ended June 30, 2019 as opposed to loss during the six months ended June 30, 2018.
Liquidity and Capital Resources
|
| | | | | | | |
| | Six Months Ended June 30, |
| | 2019 | | 2018 |
| Net cash provided by operating activities | $ | 13,966,812 |
| | $ | 9,598,418 |
|
| Net cash used in investing activities | (12,495,650 | ) | | (256,391 | ) |
| Net cash used in financing activities | (3,812,690 | ) | | (12,715,747 | ) |
| | $ | (2,341,528 | ) | | $ | (3,373,720 | ) |
Net cash provided by operations was approximately $14.0 million for the six months ended June 30, 2019 compared to approximately $9.6 million for the six months ended June 30, 2018.
For the six months ended June 30, 2019, net cash provided by operations consisted primarily of net income of approximately $3.5 million adjusted for certain non-cash expenses of approximately $6.6 million of depreciation and amortization expense, $5.3 million related to stock-based compensation expense, $1.3 million of amortization of right-of-use assets and $0.9 million of bad debt expense. Additionally, changes in working capital decreased net cash provided by operations. These changes included decreases in accounts payable and accrued liabilities of $6.0 million and increases of $0.5 million in prepaid expenses, other current assets and other assets, offset by a decrease in accounts receivable of approximately $2.4 million resulting from collections.
Net cash used in investing activities in the six months ended June 30, 2019 was primarily due to the Growlr Acquisition of approximately $11.8 million and $0.7 million of capital expenditures for computer equipment to increase capacity and improve performance.
Net cash used in financing activities in the six months ended June 30, 2019 of approximately $3.8 million was due to $7.0 million of proceeds from borrowings from our Revolving Credit Facility and $0.7 million of proceedsreceived from the exercise of employee stock options. TheseFor the three months ended March 31, 2019, our cash received from financing activities was primarily attributable to a $7.0 million draw on our prior revolving credit facility to finance a portion of our acquisition of Initech and $0.7 million in proceeds received from the exercise of employee stock options, which were partially offset by $11.1payments of $7.3 million of debt payments and $0.4 million of payments for restricted stock awards withheld for taxes.on our prior term loan facility.
Cash and Cash Equivalents
The following table sets forth our cash and cash equivalents as a percentage of our total assets as of March 31, 2020 and December 31, 2019:
| | | | June 30,
2019 | | December 31,
2018 | |
| (in thousands) | | March 31, 2020 | | December 31, 2019 |
| Cash and cash equivalents | $ | 26,052,704 |
| | $ | 28,365,725 |
| $ | 32,110 |
| | $ | 27,241 |
|
| Total assets | $ | 274,928,702 |
| | $ | 267,852,169 |
| $ | 271,780 |
| | $ | 272,721 |
|
| Percentage of total assets | 9.5 | % | | 10.6 | % | 11.8 | % | | 10.0 | % |
The following discussion and analysis includes both financial measures in accordance with GAAP,U.S. generally accepted accounting principles (“GAAP”), as well as Adjusted EBITDA (defined below), which is a non-GAAP financial measure. Generally, a non-GAAP financial measure is a numerical measure of a company’s performance, financial position or cash flows that either excludes or includes amounts that are not normally included or excluded in the most directly comparable measure calculated and presented in accordance with GAAP. Non-GAAP financial measures should be viewed as supplemental to, and should not be considered as alternatives to, net income, operating income and cash flowflows from operating activities, liquidity or any other financial measures. They may not be indicative of our historical operating results nor are they intended to be predictive of potential future results. Investors should not consider non-GAAP financial measures in isolation or as substitutes for performance measures calculated in accordance with GAAP.
We believe that both management and stockholders benefit from referring to Adjusted EBITDA (defined below) in planning, forecasting and analyzing future periods. We use this non-GAAP financial measure in evaluating our financial and operational decision makingdecision-making and as a means to evaluate period-to-periodperiod to period comparison.
PART II. OTHER INFORMATION
Not applicable.
Not applicable.
Not applicable.