Washington, D.C. 20549
ALIGN TECHNOLOGY, INC.
Indicate by check mark whether the registrant is a large accelerated filer, an accelerated filer, a non-accelerated filer, a smaller reporting company, or an emerging growth company. See definitions of “large accelerated filer,” “accelerated filer,” “smaller reporting company” and "emerging“emerging growth company"company” in Rule 12b-2 of the Exchange Act. (Check one):
ALIGN TECHNOLOGY, INC.
The accompanying notes are an integral part of these unaudited condensed consolidated financial statements.
ALIGN TECHNOLOGY, INC.
The accompanying notes are an integral part of these unaudited condensed consolidated financial statements.
ALIGN TECHNOLOGY, INC.
The accompanying notes are an integral part of these unaudited condensed consolidated financial statements.
ALIGN TECHNOLOGY, INC.
The accompanying notes are an integral part of these unaudited condensed consolidated financial statements.
ALIGN TECHNOLOGY, INC.
Note 1. Summary of Significant Accounting Policies
The accompanying unaudited Condensed Consolidated Financial Statements have been prepared by Align Technology, Inc. (“we”, “our”, "Company", or “Align”) on a consistent basis with the audited Consolidated Financial Statements for the year ended December 31, 2022, and contains all adjustments, including normal recurring adjustments, necessary to fairly state the information set forth herein. The unaudited Condensed Consolidated Financial Statements have been prepared in accordance with the rules and regulations of the Securities and Exchange Commission ("SEC"(“SEC”), and, contain all adjustments, including normal recurring adjustments,therefore, omit certain information and footnote disclosures necessary to state fairly our results of operations forpresent the three and nine months ended September 30, 2017 and 2016, our comprehensive income for the three and nine months ended September 30, 2017 and 2016, our financial position as of September 30, 2017 and our cash flows for the nine months ended September 30, 2017 and 2016. Theunaudited Condensed Consolidated Balance Sheet as of December 31, 2016 was derived from the December 31, 2016 audited financial statements but does not include all disclosures required byFinancial Statements in accordance with accounting principles generally accepted in the United States of America.America (“U.S.”).
The preparation of financial statements in conformity with generally accepted accounting principles ("GAAP"(“GAAP”) in the United States of America (“U.S.”) requires our management to make estimates and assumptions that affect the amounts reported in the consolidated financial statements and accompanying notes. Actual results could differ materially from those estimates. On an ongoing basis, we evaluate our estimates, including those related to the fair values of financial instruments, long-lived assets and goodwill, equity method investments,revenue recognition, useful lives of intangible assets and property and equipment, revenue recognition,long-lived assets and goodwill, income taxes, contingent liabilities, the fair values of financial instruments, stock-based compensation equity lossesand the valuation of investee, income taxes and contingent liabilities,investments in privately held companies among others. We base our estimates on historical experience and on various other assumptions that are believed to be reasonable, the results of which form the basis for making judgments about the carrying values of assets and liabilities.
The securities that we invest in are generally deemed to be low risk based on their credit ratings from the major rating agencies. The longer the duration of these securities, the more susceptible they are to changes in market interest rates and bond yields. As interest rates increase, those securities purchased at a lower yield show a mark-to-market unrealized loss. TheOur unrealized losses as of March 31, 2023 and December 31, 2022 are primarily due primarily to changes in interest rates and credit spreads and interest rates. We expect to realizespreads.
In the normal course of business to facilitate transactions in our services and products, we indemnify certain parties: customers, vendors, lessors, and other parties with respect to certain matters, including, but not limited to, services to be provided by us and intellectual property infringement claims made by third parties. In addition, we have entered into indemnification agreements with our directors and our executive officers that will require us, among other things, to indemnify them against certain liabilities that may arise by reason of their status or service as directors or officers. Several of these agreements limit the time within which an indemnification claim can be made and the amount of the claim.
It is not possible to make a reasonable estimate of the maximum potential amount under these indemnification agreements due to the unique facts and circumstances involved in each particular agreement. Additionally, we have a limited history of prior indemnification claims and the payments we have made under such agreements have not had a material adverse effect on our results of operations, cash flows or financial position. However, to the extent that valid indemnification claims arise in the future, future payments by us could be significant and could have a material adverse effect on our results of operations or cash flows in a particular period. As of September 30, 2017,March 31, 2023, we did not have any material indemnification claims that were probable or reasonably possible.
The fair value of the option component of the 2010 Purchase Plan shares was estimated at the grant date using the Black-Scholes option pricing model with the following weighted average assumptions:
We exercise significant judgment in regards to estimates of future market growth, forecasted earnings and projected taxable income in determining the provision for income taxes and for purposes of assessing our ability to utilize any future benefit from deferred tax assets. We continue to assess the realizability of the deferred tax assets as we take into account new information.
The following discussion and analysis of our financial condition and results of operations should be read together with our condensed consolidated financial statements and related notes included elsewhere in this Quarterly Report on Form 10-Q and with our audited consolidated financial statements included in our Annual Report on formForm 10-K for the year ended December 31, 2016,2022 as filed with the Securities and Exchange Commission.Commission (the “SEC”).
Stock Repurchases: April 2016 Repurchase Program. On April 28, 2016, we announced that our Board of Directors had authorized a plan to repurchase up to $300.0 million of our stock. On May 2, 2017, we entered into an accelerated share repurchase ("ASR") to repurchase $50.0 million of our common stock ("2017 ASR"). The 2017 ASR was completed on August 3, 2017. The final number of shares repurchased wasbudgets based on our volume-weighted average stock price duringexisting and new products. Our efforts to succeed with these innovative treatment options may result in larger and unpredictable variations in geographic and product mix and selling prices, causing uncertainty, including variations in products sold, changes in the termamount and timing of deferred revenues and other potential impacts on our financial statements and business operations.
We strive to manage the challenges from the macroeconomic conditions, the conflict in Ukraine, COVID-19 and the evolution of our target markets by focusing on improving our operations, building flexibility and efficiencies in our processes, adjusting our business models to changing circumstances and offering products that meet market demand. Specifically, we are managing cost impacts through pricing actions, cost saving measures that drive value and maintaining control of our employee headcount. We also continue to innovate, introducing new and enhanced products that augment our doctor customer and patient experiences.
Further discussion of the transaction, less an agreed upon discount. We received a totalimpact of approximately 0.4 million shares at a weighted average share pricethese challenges on our business may be found in Part II, Item 1A of $146.48this Quarterly Report on Form 10-Q under the 2017 ASR. All repurchased shares were retired. heading “Risk Factors.”
Key Financial and Operating Metrics
We measure our performance against these strategic priorities by the achievement of key financial and operating metrics.
For the three months ended March 31, 2023, our business operations reflect the following:
•Revenues of $943.1 million, a decrease of 3.1% year-over-year;
•Clear Aligner revenues of $789.8 million, a decrease of 2.5% year-over-year;
◦Americas Clear Aligner revenues of $361.3 million, a decrease of 4.0% year-over-year;
◦International Clear Aligner revenues of $354.2 million, a decrease of 4.5% year-over-year;
◦Clear Aligner case volume decrease of 3.9% year-over-year and Clear Aligner case volume increase for teenage patients of 3.8% year-over-year;
•Imaging Systems and CAD/CAM Services revenues of $153.3 million, a decrease of 6.2% year-over-year;
•Income from operations of $133.5 million and operating margin of 14.2%;
•Effective tax rate of 34.8%;
•Net income of $87.8 million with diluted net income per share of $1.14;
•Cash, cash equivalents and marketable securities of $921.4 million as of March 31, 2023;
•Operating cash flow of $199.9 million;
•Capital expenditures of $64.1 million, predominantly related to increases in our manufacturing capacity and facilities; and
•Number of employees was 23,035 as of March 31, 2023, a decrease of 2.5% year-over-year.
Other Statistical Data and Trends
•As of September 30, 2017, weMarch 31, 2023, approximately 15.1 million people worldwide have $250.0 million remaining underbeen treated with our Invisalign system. Management measures these results by comparing to the April 2016 Repurchase Plan.millions of people who can benefit from straighter teeth and uses this data to target opportunities to expand the market for orthodontics by educating consumers about the benefits of straighter teeth using the Invisalign system.
•For the first quarter of 2023, total Invisalign cases submitted with a digital scanner in the Americas increased to 93.1%, up from 90.6% in the first quarter of 2022 and international scans increased to 87.0%, up from 82.8% in the first quarter of 2022. For the first quarter of 2023, 97.7% of Invisalign cases submitted by North American orthodontists were submitted digitally.
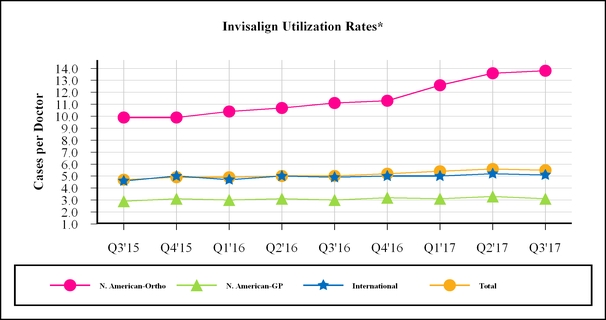
•The total utilization rate in the first quarter of 2023 decreased to 7.0 cases per doctor compared to 7.3 cases per doctor in the first quarter of 2022. Utilization rates in North America and our International locations were as follows:
▪North America: Theutilization rate among our North American orthodontist customers decreased to 26.2 cases per doctor in the first quarter of 2023 compared to 26.8 cases per doctor in the first quarter of 2022 and the utilization rate among our North American GP customers decreased to 4.9 cases per doctor in the first quarter of 2023 compared to 5.0 cases per doctor in the first quarter of 2022.
▪International: International doctor utilization rate was 6.2 cases per doctor in the first quarter of 2023 compared to 6.4 cases per doctor in the first quarter of 2022.

SmileDirectClub. On July 24, 2017, we increased* Invisalign utilization rates are calculated by the revolving linenumber of creditcases shipped divided by the number of doctors to SmileDirectClub, LLC ("SDC"whom cases were shipped. Our International region includes Europe, Middle East and Africa (“EMEA”) and Asia Pacific (“APAC”). Latin America (“LATAM”) is excluded from $15.0 millionthe International region based on its immateriality to $30.0 million. As of September 30, 2017, $17.0 million under the Loan Facility was outstanding. On July 24, 2017, we purchased an additional 2% equity interestquarter; however is included in SDC for $12.8 million. As a result of this purchase, we hold a 19% equity interest in SDC on a fully diluted basis (Refer to Note 4 "Equity Method Investments" of the Notes to Condensed Consolidated Financial Statements for details on accounting treatment). Additionally, we expect the supply agreement to be incremental to revenue growth in 2017.
Total utilization.
New Corporate Headquarters Office Purchase. We completed the purchase of our new headquarters on January 26, 2017 for the purchase price of $44.1 million. In addition, we incurred $29.7 million in building improvements during 2017 and moved into the facility in August 2017.
Results of Operations
Net revenuesRevenues by Reportable Segment
We group our operations into two reportable segments: Clear Aligner segment and ScannerSystems and Services segment.
•Our Clear Aligner segment consists of Comprehensive Products, Non-Comprehensive Products and Non-Case revenues as defined below:
| |
◦ | Comprehensive Products include our Invisalign Full, Teen and Assist products. |
| |
◦ | Non-Comprehensive Products include our Express/Lite products in addition to revenues from the sale of aligners to SmileDirectClub (“SDC”) under our supply agreement, which commenced in the fourth quarter of 2016. Revenue from SDC is recorded after eliminating outstanding intercompany transactions. |
| |
◦ | Non-Case includes our Vivera retainers along with our training and ancillary products for treating malocclusion. |
▪Comprehensive Products include, but are not limited to, Invisalign Comprehensive and Invisalign First.
▪Non-Comprehensive Products include, but are not limited to, Invisalign Moderate, Lite and Express packages and Invisalign Go and Invisalign Go Plus.
▪Non-Case products include, but are not limited to, retention products, Invisalign training, adjusting tools used by dental professionals during the course of treatment and Invisalign Accessory Products that are complementary to our doctor-prescribed principal products such as aligner cases (clamshells), teeth whitening products, cleaning solutions (crystals, foam and other material) and other oral health products available in certain commerce channels in select markets. We also offer in the U.S. and Canada, a Doctor Subscription Program which is a monthly subscription program based on the doctor’s monthly need for retention or limited treatment. The program allows doctors the flexibility to order both “touch-up” or retention aligners within their subscribed tier and is designed for a segment of experienced Invisalign trained doctors who are currently not regularly using our retainers or low-stage aligners.
•Our ScannerSystems and Services segment consists of our iTero intraoral scanning systems, which includes a single hardware platform and additionalrestorative or orthodontic software options. Our services available with the intraoral scannersinclude subscription software, disposables, rentals, leases, pay per scan services, as well as exocad’s CAD/CAM software solutions that provide digital alternativesintegrate workflows to the traditional cast models. This segment includes our iTero scannerdental labs and OrthoCAD services.dental practices.
Net revenues for our Clear Aligner and Scanner segmentSystems and Services segments by region for the three and nine months ended September 30, 2017March 31, 2023 and 2016 is2022 are as follows (in millions):
| | | | | | | | | | | | | | | | | | | | | | | | | | | | | | | | | | |
| | | Three Months Ended
March 31, | | | | | | | | | | |
| Net Revenues | | 2023 | | 2022 | | Change | | | | | | |
| Clear Aligner net revenues: | | | | | | | | | | | | | | | | |
| Americas | | $ | 361.3 | | | $ | 376.2 | | | $ | (15.0) | | | (4.0) | % | | | | | | | | |
| International | | 354.2 | | | 371.1 | | | (16.9) | | | (4.5) | % | | | | | | | | |
| Non-case | | 74.3 | | | 62.4 | | | 12.0 | | | 19.2 | % | | | | | | | | |
| Total Clear Aligner net revenues | | $ | 789.8 | | | $ | 809.7 | | | $ | (19.9) | | | (2.5) | % | | | | | | | | |
| Systems and Services net revenues | | 153.3 | | | 163.5 | | | (10.2) | | | (6.2) | % | | | | | | | | |
| Total net revenues | | $ | 943.1 | | | $ | 973.2 | | | $ | (30.1) | | | (3.1) | % | | | | | | | | |
|
| | | | | | | | | | | | | | | | | | | | | | | | | | | | | |
| | Three Months Ended
September 30, | | Nine Months Ended
September 30, |
| Net Revenues | 2017 | | 2016 | | Net Change | | % Change | | 2017 | | 2016 | | Net Change | | % Change |
| Clear Aligner revenues: | | | | | | | | | | | | | | | |
| North America | $ | 193.8 |
| | $ | 143.8 |
| | $ | 50.0 |
| | 34.8 | % | | $ | 545.1 |
| | $ | 423.4 |
| | $ | 121.7 |
| | 28.7 | % |
| International | 126.6 |
| | 84.3 |
| | 42.3 |
| | 50.2 | % | | 340.2 |
| | 237.9 |
| | 102.3 |
| | 43.0 | % |
| Non-case | 21.2 |
| | 15.6 |
| | 5.6 |
| | 35.9 | % | | 59.7 |
| | 45.5 |
| | 14.2 |
| | 31.2 | % |
| Total Clear Aligner net revenues | $ | 341.6 |
| | $ | 243.7 |
| | $ | 97.9 |
| | 40.2 | % | | $ | 945.0 |
| | $ | 706.8 |
| | $ | 238.2 |
| | 33.7 | % |
| Scanner net revenues | 43.7 |
| | 34.9 |
| | 8.8 |
| | 25.2 | % | | 107.0 |
| | 79.9 |
| | 27.1 |
| | 33.9 | % |
| Total net revenues | $ | 385.3 |
| | $ | 278.6 |
| | $ | 106.7 |
| | 38.3 | % | | $ | 1,052.1 |
| | $ | 786.7 |
| | $ | 265.4 |
| | 33.7 | % |
Changes and percentages are based on actual values. Certain tables may not sum or recalculate due to rounding.
Clear Aligner Case Volume by Region
Case volume data which represents Clear Aligner case shipments by region for the three and nine months ended September 30, 2017March 31, 2023 and 20162022 is as follows (in thousands):
| | | | | | | | | | | | | | | | | | | | | | | | | | | | | | | | | | |
| | | Three Months Ended
March 31, | | | | | | | | | | | | |
| | 2023 | | 2022 | | Change | | | | | | |
| | | | | | | | | | | | | | | | |
| | | | | | | | | | | | | | | | |
| Total case volume | | 575.3 | | | 598.8 | | | (23.6) | | | (3.9) | % | | | | | | | | |
| | | | | | | | | | | | | | | | |
| | | | | | | | | | | | | | | | |
| | | | | | | | | | | | | | | | |
| | | | | | | | | | | | | | | | |
|
| | | | | | | | | | | | | | | | | | | | | | | |
| | Three Months Ended
September 30, | | Nine Months Ended
September 30, |
| Region | 2017 | | 2016 | | Net Change | | % Change | | 2017 | | 2016 | | Net Change | | % Change |
| North America | 164.2 |
| | 115.9 |
| | 48.3 |
| | 41.7 | % | | 455.0 |
| | 341.3 |
| | 113.7 |
| | 33.3 | % |
| International | 91.2 |
| | 61.9 |
| | 29.3 |
| | 47.3 | % | | 251.8 |
| | 177.2 |
| | 74.6 |
| | 42.1 | % |
| Total case volume | 255.4 |
| | 177.8 |
| | 77.6 |
| | 43.6 | % | | 706.7 |
| | 518.5 |
| | 188.2 |
| | 36.3 | % |
Changes and percentages are based on actual values. Certain tables may not sum or recalculate due to rounding.
For the three and nine months ended September 30, 2017, total net revenues increased by $106.7 million and $265.4 million as compared to the same periods in 2016 primarily as a result of case volume growth across all regions and most products as well as increased non-case revenues.
Clear Aligner - North America
For the three months ended September 30, 2017, North AmericaMarch 31, 2023, total net revenues increased by $50.0decreased $30.1 million as compared to the same period in 20162022, primarily due to a decrease in both Clear Aligner case volume growth across all channelsvolumes and most products which increased netscanner volumes and unfavorable foreign exchange rates, partially offset by increases in service revenues by $59.8 million. This increase was offset in part by lower average selling prices (“ASP”) which decreased net revenues by $9.8 million. The ASP decline is a result of a shift in product mix towards Non-Comprehensive Products, primarily driven by increased SDC revenues which carry a lower ASP and higher promotional discounts, which collectively reduced revenues by $19.6 million. These factors contributing to the decline in ASP were offset in part by an increase in additional aligner revenue, which contributed $6.7 million to net revenues, as well as price increases on our Comprehensive Products effective April 1, 2017, which contributed $4.5 million to netClear Aligner non-case revenues.
Clear Aligner - Americas
For the ninethree months ended September 30, 2017, North AmericaMarch 31, 2023, Americas net revenues increaseddecreased by $121.7$15.0 million as compared to the same period in 2016 primarily2022 due to a 5.3% decrease in case volume growth across all channels and productsvolumes, which reduced net revenues by $20.0 million, partially offset by an increase in ASP which increased net revenues by $141.0$5.0 million. This increaseHigher ASP was mainly due to price increases on most products which increased revenues by $19.3 million along with higher additional aligners which increased net revenues by $5.0 million. The increases in ASP were partially offset in part by lower ASPunfavorable promotional discounts which decreased net revenues by $19.3 million. The ASP decline is$15.8 million and a result
of a shift in product mix towards Non-Comprehensive Products, primarily driven by increased SDC revenuesshift to lower priced products which carry a lower ASP and higher Invisalign promotional discounts, which collectively reduceddecreased net revenues by $34.1$2.6 million. These factors contributing to the decline in ASP were offset in part by an increase in additional aligner revenue, which contributed $10.0 million to net revenues, as well as price increases on our Comprehensive Products effective on April 1 of 2016 and 2017, which contributed $6.9 million to net revenues.
Clear Aligner - International
For the three months ended September 30, 2017,March 31, 2023, International net revenues increaseddecreased by $42.3$16.9 million as compared to the same period in 2016 primarily driven2022, due to a 2.3% decrease in case volumes, which decreased net revenues by case volume growth across all channels$8.4 million, and lower ASP which decreased net revenues by $8.5 million. Lower ASP was largely due to a product mix shift to lower priced products which decreased net revenues by $33.1 million, unfavorable foreign exchange rates which resulted in lower net revenues of $26.4 million, and unfavorable promotional discounts which decreased net revenues $6.0 million. The decrease in ASP was partially offset by higher additional aligners which increased net revenues by $30.9 million and price increases on most products which increased net revenues by $40.0$24.4 million. This increase resulted in higher ASP which increased net revenues by $2.3 million. The increase in ASP is primarily a result of price increases in our Comprehensive Products effective July 1, 2017, a favorable impact of foreign exchange rates and the impact from acquiring a distributor as we now recognize direct sales at full ASP rather than the discounted ASP, all of which collectively contributed $6.6 million to net revenues. These factors contributing to the increase in ASP were offset in part by $4.9 million related to higher promotional discounts and increased net deferrals.
Clear Aligner - Non-Case
For the ninethree months ended September 30, 2017, InternationalMarch 31, 2023, non-case net revenues increased by $102.3$12.0 million as compared to the same period in 20162022 mainly due to increased volumes from the Doctor Subscription program and retention products across all regions primarily driven by case volume growth across all channelsVivera retainers.
Systems and products which increased net revenues by $102.5 million. This increase was offset in part by slightly lower ASP. The ASP decline was primarily due to higher promotional discounts and the impact of foreign exchange rates, offset in part by price increases in our Comprehensive Products effective on July 1 of 2016 and 2017, the impact from acquiring certain distributors as we now recognize direct sales at full ASP rather than the discounted ASP, as well as an increase in additional aligner revenue.Services
Clear Aligner - Non-Case
For the three and nine months ended September 30, 2017, non-caseMarch 31, 2023, Systems and Services net revenues consisting of training fees and ancillary product revenues, increaseddecreased by $5.6 million and $14.2$10.2 million as compared to the same periodsperiod in 20162022 primarily due to increased Vivera volume in both North America and International.
Scanner
For the three and nine months ended September 30, 2017, scanner and services net revenues increased by $8.8 million and $27.1 million as compared to the same periods in 2016. Scanner and services net revenues increased for the three and nine months ended September 30, 2017 as compared to the same periods in 2016 primarily as a result of an increase in thelower number of scanners recognizedsold which decreased net revenues by $27.3 million.
The decrease in net revenue due to lower scanner volume was partially offset by higher service and other revenues which increased net revenues by $15.2 million mostly due to a larger scanner installed base and higher volume of CAD/CAM services resulting from a larger installed base of scanners, offset in part by a decrease in scanner ASP.ASP which increased net revenues $1.9 million.
Cost of net revenues and gross profit (in millions): | | | | | | | | | | | | | | | | | | | | | | | | | | |
| | | Three Months Ended
March 31, | | | | | | |
| | | 2023 | | 2022 | | Change | | | | | | |
| Clear Aligner | | | | | | | | | | | | |
| Cost of net revenues | | $ | 223.7 | | | $ | 204.0 | | | $ | 19.7 | | | | | | | |
| % of net segment revenues | | 28.3 | % | | 25.2 | % | | | | | | | | |
| Gross profit | | $ | 566.1 | | | $ | 605.7 | | | $ | (39.6) | | | | | | | |
| Gross margin % | | 71.7 | % | | 74.8 | % | | | | | | | | |
| Systems and Services | | | | | | | | | | | | |
| Cost of net revenues | | $ | 58.8 | | | $ | 59.9 | | | $ | (1.0) | | | | | | | |
| % of net segment revenues | | 38.4 | % | | 36.6 | % | | | | | | | | |
| Gross profit | | $ | 94.5 | | | $ | 103.7 | | | $ | (9.1) | | | | | | | |
| Gross margin % | | 61.6 | % | | 63.4 | % | | | | | | | | |
| Total cost of net revenues | | $ | 282.5 | | | $ | 263.9 | | | $ | 18.6 | | | | | | | |
| % of net revenues | | 30.0 | % | | 27.1 | % | | | | | | | | |
| Gross profit | | $ | 660.7 | | | $ | 709.3 | | | $ | (48.7) | | | | | | | |
| Gross margin % | | 70.0 | % | | 72.9 | % | | | | | | | | |
|
| | | | | | | | | | | | | | | | | | | | | | | |
| | Three Months Ended
September 30, | | Nine Months Ended
September 30, |
| | 2017 | | 2016 | | Change | | 2017 | | 2016 | | Change |
| Clear Aligner | | | | | | | | | | | |
| Cost of net revenues | $ | 75.3 |
| | $ | 54.4 |
| | $ | 20.9 |
| | $ | 208.0 |
| | $ | 154.1 |
| | $ | 53.9 |
|
| % of net segment revenues | 22.1 | % | | 22.3 | % | | | | 22.0 | % | | 21.8 | % | | |
| Gross profit | $ | 266.3 |
| | $ | 189.3 |
| | $ | 77.0 |
| | $ | 737.0 |
| | $ | 552.6 |
| | $ | 184.4 |
|
| Gross margin % | 77.9 | % | | 77.7 | % | | | | 78.0 | % | | 78.2 | % | | |
| Scanner | | | | | | | | | | | |
| Cost of net revenues | $ | 17.5 |
| | $ | 15.0 |
| | $ | 2.5 |
| | $ | 45.1 |
| | $ | 37.5 |
| | $ | 7.6 |
|
| % of net segment revenues | 40.0 | % | | 42.9 | % | | | | 42.1 | % | | 46.9 | % | | |
| Gross profit | $ | 26.2 |
| | $ | 20.0 |
| | $ | 6.2 |
| | $ | 62.0 |
| | $ | 42.4 |
| | $ | 19.6 |
|
| Gross margin % | 60.0 | % | | 57.1 | % | | | | 57.9 | % | | 53.1 | % | | |
| Total cost of net revenues | $ | 92.8 |
| | $ | 69.4 |
| | $ | 23.4 |
| | $ | 253.1 |
| | $ | 191.6 |
| | $ | 61.5 |
|
| % of net revenues | 24.1 | % | | 24.9 | % | | | | 24.1 | % | | 24.4 | % | | |
| Gross profit | $ | 292.5 |
| | $ | 209.2 |
| | $ | 83.3 |
| | $ | 799.0 |
| | $ | 595.0 |
| | $ | 204.0 |
|
| Gross margin % | 75.9 | % | | 75.1 | % | | | | 75.9 | % | | 75.6 | % | | |
Changes and percentages are based on actual values. Certain tables may not sum or recalculate due to rounding.
Cost of net revenues for our Clear Aligner and Scanner segments includes personnel-related costs including payroll and stock-based compensation for staff involved in the production process, the cost of materials, packaging, freight and shipping related costs, depreciation on capital equipment and facilities used in the production process, amortization of acquired intangible assets and training costs.
Clear Aligner
For the three months ended September 30, 2017, gross margin percentage increased as compared to the same period in 2016 primarily driven by lower costs per case.
For the nine months ended September 30, 2017, gross margin percentage declined as compared to the same period in 2016 primarily due to an increase in aligners per case driven by additional aligners and lower ASP.
Scanner
For the three ended September 30, 2017, gross margin increased compared to the same period in 2016 primarily driven by lower service costs. This was partially offset by a lower ASP.
For the nine months ended September 30, 2017, gross margin increased compared to the same period in 2016 primarily due to a favorable product mix shift to our lower cost iTero Element scanner.
Selling, general and administrative (in millions):
|
| | | | | | | | | | | | | | | | | | | | | | | |
| | Three Months Ended
September 30, | | Nine Months Ended
September 30, |
| | 2017 | | 2016 | | Change | | 2017 | | 2016 | | Change |
| Selling, general and administrative | $ | 169.5 |
| | $ | 126.7 |
| | $ | 42.8 |
| | $ | 483.6 |
| | $ | 360.4 |
| | $ | 123.2 |
|
| % of net revenues | 44.0 | % | | 45.5 | % | | | | 46.0 | % | | 45.8 | % | | |
Changes and percentages are based on actual values. Certain tables may not sum or recalculate due to rounding.
Selling, general and administrative expense includes personnel-related costs including payroll, commissions and stock-based compensation, marketing and administration in addition to media and advertising expenses, clinical education, trade shows and industry events, product marketing, outside consulting services, equipment and maintenance costs, depreciation and amortization expense and allocations of corporate overhead expenses including facilities and IT.
For the three months ended September 30, 2017, selling, general and administrative expense increased compared to the same period in 2016 primarily due to higher compensation related costs of $23.8 million mainly as a result of increased headcount. We also incurred higher expenses from equipment and maintenance costs of $6.6 million, advertising and marketing of $5.5 million, and outside services costs of $4.2 million.
For the nine months ended September 30, 2017, selling, general and administrative expense increased compared to the same period in 2016 primarily due to higher compensation related costs of $57.9 million mainly as a result of increased headcount. We also incurred higher expenses from advertising and marketing of $23.9 million, equipment and maintenance costs of $17.5 million, and outside services costs of $15.4 million.
Research and development (in millions):
|
| | | | | | | | | | | | | | | | | | | | | | | |
| | Three Months Ended
September 30, | | Nine Months Ended
September 30, |
| | 2017 | | 2016 | | Change | | 2017 | | 2016 | | Change |
| Research and development | $ | 24.2 |
| | $ | 20.4 |
| | $ | 3.8 |
| | $ | 71.4 |
| | $ | 54.1 |
| | $ | 17.3 |
|
| % of net revenues | 6.3 | % | | 7.3 | % | | | | 6.8 | % | | 6.9 | % | | |
Changes and percentages are based on actual values. Certain tables may not sum or recalculate due to rounding.
Research and development expense includes the personnel-related costs including payroll and stock-based compensation and outside consulting expenses associated with the research and development of new products and enhancements to existing products and allocations of corporate overhead expenses including facilities and IT.
For the three and nine months ended September 30, 2017, research and development expense increased compared to the same periods in 2016 primarily due to higher compensation costs as a result of increased headcount.
Income from operations (in millions):
|
| | | | | | | | | | | | | | | | | | | | | | | |
| | Three Months Ended
September 30, | | Nine Months Ended
September 30, |
| | 2017 | | 2016 | | Change | | 2017 | | 2016 | | Change |
| Clear Aligner | | | | | | | | | | | |
| Income from operations | $ | 154.6 |
| | $ | 102.4 |
| | $ | 52.2 |
| | $ | 403.3 |
| | $ | 306.8 |
| | $ | 96.5 |
|
| Operating margin % | 45.3 | % | | 42.0 | % | | | | 42.7 | % | | 43.4 | % | | |
| Scanner | | | | | | | | | | | |
| Income from operations | $ | 13.5 |
| | $ | 12.0 |
| | $ | 1.5 |
| | $ | 28.3 |
| | $ | 20.3 |
| | $ | 8.0 |
|
| Operating margin % | 31.0 | % | | 34.3 | % | | | | 26.5 | % | | 25.5 | % | | |
Total income from operations (1) | $ | 98.8 |
| | $ | 62.1 |
| | $ | 36.7 |
| | $ | 244.0 |
| | $ | 180.5 |
| | $ | 63.5 |
|
| Operating margin % | 25.6 | % | | 22.3 | % | | | | 23.2 | % | | 23.0 | % | | |
Changes and percentages are based on actual values. Certain tables may not sum or recalculate due to rounding.
(1) Refer to Note 14 "Segments and Geographical Information" of the Notes to Condensed Consolidated Financial Statements for details on unallocated corporate expenses and the reconciliation to consolidated income from operations.
Clear Aligner
For the three months ended September 30, 2017, operatingMarch 31, 2023, our gross margin percentage increaseddecreased as compared to the same period in 20162022 primarily due to greater Invisalign revenuesincreased manufacturing spend as we continue to ramp our new manufacturing facility in Poland in addition to higher mix of additional aligners.
Systems and higher operating margin from sales to SDC, lower costs per case, partially offset by higher compensation related costs and marketing expenses.Services
For the ninethree months ended September 30, 2017, operatingMarch 31, 2023, our gross margin percentage declineddecreased as compared to the same period in 20162022 primarily due to manufacturing inefficiencies from lower production volumes and higher marketing spend and, to a lesser extent, lower ASP,inventory costs. These factors were partially offset by a higher operating margin from sales to SDC.service revenues and higher ASP.
Scanner
For the three ended September 30, 2017, operating margin percentage decreased compared to the same period in 2016 due to higher operating expenses along with a lower ASP. This was partially offset by lower service costs.
For the nine months ended September 30, 2017, operating margin percentage increased compared to the same period in 2016 due to a favorable product mix shift to our lower cost iTero Element scanner.
InterestSelling, general and other income (expenses), netadministrative (in millions): | | | | | | | | | | | | | | | | | | | | | | | | | | |
| | | Three Months Ended
March 31, | | | | | | |
| | | 2023 | | 2022 | | Change | | | | | | |
| Selling, general and administrative | | $ | 439.7 | | | $ | 439.5 | | | $ | 0.2 | | | | | | | |
| % of net revenues | | 46.6 | % | | 45.2 | % | | | | | | | | |
|
| | | | | | | | | | | | | | | | | | | | | | | |
| | Three Months Ended
September 30, | | Nine Months Ended
September 30, |
| | 2017 | | 2016 | | Change | | 2017 | | 2016 | | Change |
| Interest and other income (expenses), net | $ | 3.8 |
| | $ | 1.5 |
| | $ | 2.3 |
| | $ | 8.6 |
| | $ | 1.2 |
| | $ | 7.4 |
|
Changes and percentages are based on actual values. Certain tables may not sum or recalculate due to rounding.
InterestSelling, general and other income (expenses), net,administrative expense generally includes foreign currency revaluation gainspersonnel-related costs, including payroll, stock-based compensation and losses, interest income earned on cash, cash equivalentscommissions for our sales force, marketing and investment balances, gainsadvertising expenses including media, clinical education, marketing materials, trade shows and losses on foreign currency forward contractsindustry events, legal and other miscellaneous charges.outside service costs, equipment, software and maintenance costs, depreciation and amortization expense and allocations of corporate overhead expenses including facilities and Information Technology (“IT”).
For the three and nine months ended September 30, 2017, interestMarch 31, 2023, selling, general and other income (expenses), net increasedadministrative expense remained flat compared to the same periodsperiod in 2016 mainly2022 primarily due to higher foreign exchange gains as a result of the Euro strengthening to the U.S. dollar.salaries expense, fringe benefits and stock-based and incentive compensation, offset by lower advertising and marketing costs and outside service costs.
Equity in losses of investee, net of tax
Research and development (in millions): | | | | | | | | | | | | | | | | | | | | | | | | | | |
| | | Three Months Ended
March 31, | | | | | | |
| | | 2023 | | 2022 | | Change | | | | | | |
| Research and development | | $ | 87.4 | | | $ | 71.8 | | | $ | 15.6 | | | | | | | |
| % of net revenues | | 9.3 | % | | 7.4 | % | | | | | | | | |
|
| | | | | | | | | | | | | | | | | | | | | | | |
| | Three Months Ended
September 30, | | Nine Months Ended
September 30, |
| | 2017 | | 2016 | | Change | | 2017 | | 2016 | | Change |
| Equity in losses of investee, net of tax | $ | 1.6 |
| | $ | 0.5 |
| | $ | 1.1 |
| | $ | 5.0 |
| | $ | 0.5 |
| | $ | 4.5 |
|
Changes and percentages are based on actual values. Certain tables may not sum or recalculate due to rounding.
Research and development expense generally includes personnel-related costs, including payroll and stock-based compensation, outside service costs associated with the research and development of new products and enhancements to existing products, software, equipment, material and maintenance costs, depreciation and amortization expense and allocations of corporate overhead expenses including facilities and IT.
For the three and nine months ended September 30, 2017, equity in losses of investee, net of taxMarch 31, 2023, research and development expense increased compared to the same periodsperiod in 20162022 primarily due to higher losses attributablesalaries expense, fringe benefits and stock-based and incentive compensation as we continue to equity methodfocus on our investments including a higher sharein innovation and research.
Income from operations (in millions): | | | | | | | | | | | | | | | | | | | | | | | | | | |
| | | Three Months Ended
March 31, | | | | | | |
| | | 2023 | | 2022 | | Change | | | | | | |
| Clear Aligner | | | | | | | | | | | | |
| Income from operations | | $ | 277.5 | | | $ | 312.7 | | | $ | (35.2) | | | | | | | |
| Operating margin % | | 35.1 | % | | 38.6 | % | | | | | | | | |
| Systems and Services | | | | | | | | | | | | |
| Income from operations | | $ | 35.6 | | | $ | 50.8 | | | $ | (15.2) | | | | | | | |
| Operating margin % | | 23.2 | % | | 31.1 | % | | | | | | | | |
Total income from operations 1 | | $ | 133.5 | | | $ | 198.1 | | | $ | (64.6) | | | | | | | |
| Operating margin % | | 14.2 | % | | 20.4 | % | | | | | | | | |
Changes and percentages are based on actual values. Certain tables may not sum or recalculate due to an additional investment in the third quarter of 2017 (rounding.
1 Refer to Note 4 "Equity Method Investments"13 “Segments and Geographical Information” of the Notes to Condensed Consolidated Financial Statements for details on equity method investments).unallocated corporate expenses and the reconciliation to Condensed Consolidated Income from Operations.
Income tax (in millions):
|
| | | | | | | | | | | | | | | | | | | | | | | |
| | Three Months Ended
September 30, | | Nine Months Ended
September 30, |
| | 2017 | | 2016 | | Change | | 2017 | | 2016 | | Change |
| Provision for income taxes | $ | 18.3 |
| | $ | 11.7 |
| | $ | 6.6 |
| | $ | 26.5 |
| | $ | 39.2 |
| | $ | (12.7 | ) |
| Effective tax rates | 17.9 | % | | 18.4 | % | | | | 10.5 | % | | 21.6 | % | | |
For the three months ended September 30, 2017March 31, 2023, our operating margin percentage decreased compared to the same period in 2022 primarily due to lower gross margin.
Systems and 2016, provisionServices
For the three months ended March 31, 2023, our operating margin percentage decreased compared to the same period in 2022 primarily due to higher operating expenses as a percentage of net revenues as well as lower gross margin.
Interest income (in millions): | | | | | | | | | | | | | | | | | | | | | | | | | | |
| | | Three Months Ended
March 31, | | | | | | |
| | | 2023 | | 2022 | | Change | | | | | | |
| Interest income | | $ | 2.3 | | | $ | 0.7 | | | $ | 1.7 | | | | | | | |
| % of net revenues | | 0.2 | % | | 0.1 | % | | | | | | | | |
Changes and percentages are based on actual values. Certain tables may not sum or recalculate due to rounding.
Interest income generally includes interest earned on cash, cash equivalents and investment balances.
For the three months ended March 31, 2023, interest income increased compared to the same period in 2022 primarily due to higher interest rates in the first quarter of 2023.
Other income (expense), net (in millions): | | | | | | | | | | | | | | | | | | | | | | | | | | |
| | | Three Months Ended
March 31, | | | | | | |
| | | 2023 | | 2022 | | Change | | | | | | |
| Other income (expense), net | | $ | (1.2) | | | $ | (11.3) | | | $ | 10.0 | | | | | | | |
| % of net revenues | | (0.1) | % | | (1.2) | % | | | | | | | | |
Changes and percentages are based on actual values. Certain tables may not sum or recalculate due to rounding.
Other income (expense), net, generally includes foreign exchange gains and losses, gains and losses on foreign currency forward contracts, interest expense, gains and losses on equity investments and other miscellaneous charges.
For the three months ended March 31, 2023, other income (expense), net increased compared to the same period in 2022 primarily due to the favorable impact of foreign exchange rates and higher interest rates.
Provision for income taxes was $18.3 million(in millions): | | | | | | | | | | | | | | | | | | | | | | | | | | |
| | | Three Months Ended
March 31, | | | | | | |
| | | 2023 | | 2022 | | Change | | | | | | |
| Provision for income taxes | | $ | 46.8 | | | $ | 53.2 | | | $ | (6.4) | | | | | | | |
| Effective tax rates | | 34.8 | % | | 28.4 | % | | | | | | | | |
Changes and $11.7 million, respectively, representingpercentages are based on actual values. Certain tables may not sum or recalculate due to rounding.
Our effective tax rate differs from the statutory federal income tax rate of 21% for both the three month periods ended March 31, 2023 and 2022 primarily due to the recognition of additional tax expense resulting from foreign income taxed at different rates, of 17.9% and 18.4%, respectively. Our provision forstate income taxes, was $26.5 million and $39.2 million fornon-deductible expenses in the nine months ended September 30, 2017 and 2016, respectively, representing effective tax rates of 10.5% and 21.6%, respectively. U.S.
The decreaseincrease in our effective tax rate for the three months ended September 30, 2017March 31, 2023 compared to the same period in 20162022 is primarily attributable to the adoptiondecrease and change in our jurisdictional mix of ASU 2016-09 in 2017 which requiresincome, foreign income taxed at different rates, and lower excess tax benefits related tofrom stock-based compensation to be recognized as a reduction of income tax expense, and certain one-time tax charges recognized as a result of the implementation of the international corporate restructure on July 1, 2016 that is no longer pertinent to the current period. The decrease in effective tax rate for the nine months ended September 30, 2017 compared to the same period in 2016 is primarily attributable to the adoption of ASU 2016-09 in the first quarter of fiscal year 2017, which requires excess tax benefits related to stock-based compensation to be recognized as a reduction of income tax expense. In addition, the effective tax rate for the prior period was increased due to certain one-time tax charges recognized as a result of the implementation of the international corporate restructure during the third quarter of fiscal year 2016. For the three and nine months ended September 30, 2017, we recognized excess tax benefits of $1.7 million and $24.1 million, respectively, in our provision for income taxes.compensation.
On July 1, 2016, we implemented a new international corporate structure. This changed the structure of our international procurement and sales operations, as well as realigned the ownership and use of intellectual property among our wholly-owned subsidiaries. We continue to anticipate that an increasing percentage of our consolidated pre-tax income will be derived from, and reinvested in our foreign operations. We believe that income taxed in certain foreign jurisdictions at a lower rate relative to the U.S. federal statutory rate will have a beneficial impact on our worldwide effective tax rate over time.
In June 2017, the Costa Rica Ministry of Foreign Trade, an agency of the Government of Costa Rica, granted an extension of certain income tax incentives for an additional twelve year period, which were originally granted in 2002 and was set to expire in June 2017. Under these incentives, all of the income in Costa Rica is subject to a reduced tax rate. In order to receive the benefit of these incentives, we must hire specified numbers of employees and maintain certain minimum levels of fixed asset investment in Costa Rica. If we do not fulfill these conditions for any reason, our incentive could lapse, and our income in Costa Rica would be subject to taxation at higher rates which could have a negative impact on our operating results. The Costa Rica corporate income tax rate that would apply, absent the incentives, is 30% for 2017 and 2016. For the three and nine months ended September 30, 2017, the reduction in income taxes was minimal primarily due to the new international corporate structure implemented on July 1, 2016. For the three and nine months ended September 30, 2016, income taxes were reduced by $0.3 million with minimal impact to diluted net income per share and $17.5 million representing a benefit to diluted net income per share of $0.21, respectively (Refer to Note 12 "Accounting for Income Taxes" for details on income taxes).
Liquidity and Capital Resources
We fund our operations primarily from product salesLiquidity and available cash and cash equivalents and marketable securities. Trends
As of September 30, 2017March 31, 2023 and December 31, 2016,2022, we had the following cash and cash equivalents and short-term and long-term marketable securities (in thousands):
|
| | | | | | | | |
| | | September 30, | | December 31, |
| | | 2017 | | 2016 |
| Cash and cash equivalents | | $ | 362,613 |
| | $ | 389,275 |
|
| Short-term marketable securities | | 316,454 |
| | 250,981 |
|
| Long-term marketable securities | | 58,842 |
| | 59,783 |
|
| Total | | $ | 737,909 |
| | $ | 700,039 |
|
| | | | | | | | | | | | | | |
| | March 31, 2023 | | December 31, 2022 |
| Cash and cash equivalents | | $ | 832,383 | | | $ | 942,050 | |
| Marketable securities, short-term | | 51,644 | | | 57,534 | |
| Marketable securities, long-term | | 37,379 | | | 41,978 | |
| Total | | $ | 921,406 | | | $ | 1,041,562 | |
Cash flows (in thousands):
|
| | | | | | | | |
| | | Nine Months Ended
September 30, |
| | | 2017 | | 2016 |
| Net cash flow provided by (used in): | | | | |
| Operating activities | | $ | 276,213 |
| | $ | 166,674 |
|
| Investing activities | | (228,620 | ) | | 142,859 |
|
| Financing activities | | (79,036 | ) | | (57,619 | ) |
| Effect of exchange rate changes on cash and cash equivalents | | 4,781 |
| | 320 |
|
| Net increase (decrease) in cash and cash equivalents | | $ | (26,662 | ) | | $ | 252,234 |
|
As of September 30, 2017, we had $737.9March 31, 2023 and December 31, 2022, approximately $610.9 million in cash, cash equivalents and short-term and long-term marketable securities. Cash equivalents and marketable securities are comprised of money market funds and highly liquid debt instruments which primarily include commercial paper, corporate bonds, U.S. government agency bonds, U.S. government treasury bonds and certificates of deposit.
As of September 30, 2017, approximately $501.6$653.7 million, respectively, of cash, cash equivalents and short-term and long-term marketable securities waswere held by our foreign subsidiaries. Amounts held by foreign subsidiaries are generally subjectWe intend to U.S. income taxation on repatriation to the U.S. The costs to repatriatecontinue reinvesting our foreign subsidiary earnings indefinitely and expect the additional costs upon repatriation of these foreign earnings not to the U.S. would likely be material; however, our intent is to permanently reinvest our earnings from foreign operations, and our current plans do not require us to repatriate them to fund our U.S. operations as wesignificant. We generate sufficient domestic operating cash flow and have access to external funding under our current$300.0 million revolving line of credit. We believe that our current cash balances and the borrowing capacity under our credit facility, if necessary, will be sufficient to fund our business for at least the next 12 months.
Stock RepurchasesThe sanctions against Russian banks or international bank messaging systems due to the military conflict between Ukraine and Russia could impact our ability to access our cash in Russia but would not materially impact our liquidity position. As of March 31, 2023, cash and cash equivalents domiciled in Russia, which is required to fund their current operating requirements, represent approximately 2.2% of our total cash, cash equivalents and marketable securities.
Our material cash requirements are as follows:
•For 2023, we expect our investments in capital expenditures to exceed $200.0 million. Capital expenditures primarily relate to building construction and improvements as well as additional manufacturing capacity to support our international expansion. This includes our investment in an aligner fabrication facility in Wroclaw, Poland which began serving doctors during the second quarter of 2022 as a part of our strategy to bring operational facilities closer to customers. As we continue growing, we intend to expand our investments in research and development, manufacturing, treatment planning, sales and marketing operations to meet actual and anticipated local and regional demands.
•During the three months ended March 31, 2023, we entered into or completed ASRs providing for the repurchase of our common stock based on the volume-weighted average price during the term of the agreement, less an agreed upon discount. As of March 31, 2023, the May 2021 Repurchase Program was completed. In January 2023, our Board of Directors authorized a plan to repurchase up to $1.0 billion of our common stock (“January 2023 Repurchase Program”), none of which had been utilized as of March 31, 2023. Refer to Note 11 "Common9 “Common Stock Repurchase Program"Program” of the Notes to Condensed Consolidated Financial Statements for details on our stock repurchase program.programs.
April 2016 Repurchase Program. On April 28, 2016, we announced that•There have been no material changes to our Boardpurchase commitments for goods and services and future operating lease payments during the periods covered by this 10-Q outside the normal course of Directors had authorized a planbusiness compared to repurchase up to $300.0 millionthe disclosures in Part II, Item 7 of our stock. On May 2, 2017, we entered into an accelerated share repurchase ("ASR") to repurchase $50.0 millionAnnual Report on Form 10-K for the year ended December 31, 2022.
Sources and Uses of Cash
The following table summarizes our common stock ("2017 ASR"). The 2017 ASR was completed on August 3, 2017. The final numbercondensed consolidated cash flows for the three months ended March 31, 2023 and 2022 (in thousands):
| | | | | | | | | | | | | | |
| | | Three Months Ended
March 31, |
| | | 2023 | | 2022 |
| Net cash flow provided by (used in): | | | | |
| Operating activities | | $ | 199,895 | | | $ | 30,498 | |
| Investing activities | | (52,829) | | | (90,198) | |
| Financing activities | | (258,961) | | | (111,742) | |
| Effect of exchange rate changes on cash, cash equivalents, and restricted cash | | 2,221 | | | (1,826) | |
| Net (decrease) increase in cash, cash equivalents, and restricted cash | | $ | (109,674) | | | $ | (173,268) | |
Operating Activities
For the ninethree months ended September 30, 2017,March 31, 2023, cash flows from operations of $276.2$199.9 million resulted primarily from our net income of approximately $221.2$87.8 million as well as the following:
Significant non-cash activitiesadjustments to net income
•Stock-based compensation was $44.0of $37.7 million related to equity incentive compensationawards granted to employees and directors,directors;
•Depreciation and amortization of $26.7$35.8 million related to our investments in property, plant and equipment and intangible assets, andassets;
Net change•Deferred taxes of $18.4 million related to increase in long term deferred tax assetsposition; and
•Non-cash operating lease costs of $5.5 million.$7.8 million related majority to amortization of deferred commissions.
Significant changes in working capital
•Increase of $84.4 million in accounts receivable which is primarily a result of the increase in net revenues,
Increase of $53.2 million in deferred revenues corresponding to the increases in case shipments, and
Increase of $19.0$37.4 million in accrued and other long-term liabilities primarily due to higher incentive accruals for 2023, as well as timing of payment of other activities;
•Decrease of $32.7 million in accounts receivable due to timing of paymentscollections and activities.offset by an increased sales volumes;
•Increase of $27.7 million in deferred revenues due to the deferral of revenue on shipments over the period as well as timing of revenue recognition; and
•Increase of $24.0 million in inventories primarily due our efforts to manage stock at appropriate levels as required.
Investing Activities
Net cash used in investing activities was $228.6$52.8 million for the ninethree months ended September 30, 2017March 31, 2023 which primarily consisted of purchases of marketable securities of $356.9 million, property, and plant and equipment purchases of $126.2$64.1 million of which $63.0 million is related to the purchase of our new headquarters along with building improvements, $23.0 million of loan advances to equity investee and $9.0 million paid for certain distributor acquisitions, net of cash received. These outflows were partially offset by maturities and salespurchases of marketable securities of $292.8$2.4 million, partially offset by sales and loan repayment from equity investeematurities of $6.0our marketable securities of $13.7 million.
For the remainder of 2017, we expect to invest an additional $55.0 million to $60.0 million on capital expenditures primarily related to additional manufacturing capacity to support our international expansion. Although we believe our current investment portfolio has little risk of impairment, we cannot predict future market conditions or market liquidity and can provide no assurance that our investment portfolio will remain unimpaired.
Financing Activities
Net cash used in financing activities was $79.0$259.0 million for the ninethree months ended September 30, 2017 primarily resulting fromMarch 31, 2023 which consisted of common stock repurchases of $53.8$252.4 million and payroll taxes paid for vesting of restricted stock unitsequity awards through share withholdings of $39.1 million. These outflows$20.9 million which were partially offset in part by $13.9$14.3 million fromof proceeds from the issuance of common stock.
Contractual Obligations
Our contractual obligations have not significantly changed since December 31, 2016 as disclosed in our Annual Report on Form 10-K, other than obligations described in the Form 10-Q herein. We believe that our current cash, cash equivalents and short-term marketable securities combined with our existing borrowing capacity will be sufficient to fund our operations for at least the next 12 months. If we are unable to generate adequate operating cash flows and need more funds beyond our available liquid investments and those availablestock under our credit facility, we may need to suspend ouremployee stock repurchase program or seek additional sources of capital through equity or debt financing, collaborative or other arrangements with other companies, bank financing and other sources in order to realize our objectives and to continue our operations. There can be no assurance that we will be able to obtain additional debt or equity financing on terms acceptable to us, or at all. If adequate funds are not available, we may need to make business decisions that could adversely affect our operating results such as modifications to our pricing policy, business structure or operations. Accordingly, the failure to obtain sufficient funds on acceptable terms when needed could have a material adverse effect on our business, results of operations and financial condition.purchase plan.
Off-Balance Sheet Arrangements
As of September 30, 2017, we had no off-balance sheet arrangements that have, or are reasonably likely to have, a current or future material effect on our consolidated financial condition, results of operations, liquidity, capital expenditures or capital resources.
Critical Accounting Policies and Estimates
Management’s discussion and analysis of our financial condition and results of operations is based upon our Condensed Consolidated Financial Statements which have been prepared in accordance with accounting principles generally accepted in the United States of America. The preparation of condensed consolidated financial statements requires management to make estimates and judgments that affect the reported amounts of assets and liabilities, revenues and expenses and disclosures at the date of the financial statements. We evaluate our estimates on an on-going basis, including those related to revenue recognition, stock-based compensation, goodwill and finite-lived acquired intangible assets, income taxes, legal proceedings and related impairment, and income taxes.litigations. We use authoritative pronouncements, historical experience and other assumptions as the basis for making the estimates. Actual results could differ from those estimates.
Revenue Recognition
Our revenues are derived primarily from the sale of aligners, scanners, and services from our Clear Aligner and Systems and Services segments. We enter into sales contracts that may consist of multiple distinct performance obligations where certain performance obligations of the sales contract are not delivered in one reporting period. We measure and allocate revenues according to ASC 606-10, “Revenues from Contracts with Customers.”
Determining the standalone selling price (“SSP”) in order to allocate consideration from the contract to the individual performance obligations is the result of various factors, such as changing trends and market conditions, historical prices, costs, and gross margins. While changes in the allocation of the SSP between performance obligations will not affect the amount of total revenues recognized for a particular contract, any material changes could impact the timing of revenue recognition, which would have a material effect on our financial position and result of operations. This is because the contract consideration is allocated to each performance obligation, delivered or undelivered, at the inception of the contract based on the SSP of each distinct performance obligation.
We believeallocate revenues for each clear aligner treatment plan based on each unit’s SSP. Management considers a variety of factors such as same or similar product historical sales, costs, and gross margin, which may vary over time depending upon the following critical accounting policiesunique facts and estimates affectcircumstances related to each performance obligation in making these estimates. In addition to historical data, we take into consideration changing trends and market conditions. For treatment plans with multiple options, we also consider usage rates, which is the number of times a customer is expected to order more aligners after the initial shipment. Our process for estimating usage rates requires significant judgment and evaluation of inputs, including historical usage data by region, country and channel.
We estimate the SSP of each element in a scanner system and services sale taking into consideration same or similar product historical prices as well as our more significant judgments used in the preparation of our consolidated financial statements. These critical accounting policies and related disclosures appear in our Annual Report on Form 10-K for the year ended December 31, 2016:discounting strategies.
Revenue Recognition;
Stock-Based Compensation Expense;
Goodwill and Finite-Lived Acquired Intangible Assets;
Impairment of Goodwill, Finite-Lived Acquired Intangible Assets and Long-Lived Assets; and
Accounting for Income Taxes.
Recent Accounting Pronouncements
See Note 1 “Summary“Summary of Significant Accounting Policies” Policies” of the Notes to Condensed Consolidated Financial Statements for a discussion of recent accounting pronouncements.
ITEMItem 3.QUANTITATIVE AND QUALITATIVE DISCLOSURES ABOUT MARKET RISK Quantitative and Qualitative Disclosures About Market Risk.
In the normal course of business, we are exposed to interest rate, foreign currency exchange rate and interest rateinflation risks that could impact our financial position and results of operations. In addition, we are subject to the broad market risk that is created by the global market disruptions and uncertainties resulting from macroeconomic challenges, the military conflict between Russia and Ukraine and the COVID-19 pandemic. Further discussion on these risks may be found in Item 1A of this is Quarterly Report on Form 10-Q under the heading “Risk Factors.”
Interest Rate Risk
Changes in interest rates could impact our anticipated interest income on our cash equivalents and investments in marketable securities. Our cash equivalents and investments are fixed-rate short-term and long-term securities. Fixed-rate securities may have their fair market value adversely impacted due to a rise in interest rates, and, as a result, our future investment income may fall short of expectations due to changes in interest rates or we may suffer losses in principal if forced to sell securities which have declined in market value due to changes in interest rates. As of September 30, 2017,March 31, 2023, we had approximately $566.1$89.0 million invested in available-for-sale marketable securities. An immediate 10% change in interest rates would not have a material adverse impact on our future operating results and cash flows.
We do not enter into investments for trading or speculative purposes and have not used any derivative financial instruments to manage our interest rate risk exposure. We do not have interest bearing liabilities asAs of September 30, 2017, and, therefore,March 31, 2023, we are not subject to risks from immediate interest rate increases.increases on our unsecured revolving line of credit facility.
Currency Rate Risk
As a result of our international business activities, our financial results could behave been affected by factors such as changes in foreign currency exchange rates oras well as economic conditions in foreign markets, and there is no assurance that exchange rate fluctuations will not harm our business in the future. We generally sell our products in the local currency of the respective countries. This provides some natural hedging because most of the subsidiaries’ operating expenses are generally denominated in their local currencies as discussed further below.currencies. Regardless of this natural hedging, our results of operations may be adversely impacted by exchange rate fluctuations.
We have in the past and may in the future enter into foreign currency hedging transactions in an effortforward contracts for currencies where we have exposures, primarily the Euro, Chinese Yuan, Polish Zloty, Canadian Dollar, to cover someminimize the short-term impact of our exposure to foreign currency exchange rate fluctuations on cash and certain trade and intercompany receivables and payables.These forward contracts are not designated as hedging instruments and do not subject us to material balance sheet risk due to fluctuations in foreign currency exchange rates. The gains and losses on these forward contracts are intended to offset the gains and losses in the underlying foreign currency denominated monetary assets and liabilities being economically hedged. These instruments are generally one month in original maturity and are marked to market through earnings every period and generally are one month in original maturity.period. We do not enter into foreign currency forward contracts for trading or speculative purposes. As our international operations grow, we will continue to reassess our approach to managing the risks relating to fluctuations in currency rates. It is difficult to predict the impact hedging activitiesforward contracts could have on our results of operations. As
Although we will continue to monitor our exposure to currency fluctuations, and, where appropriate, may use financial hedging techniques in the futureforward contracts to minimize the effect of these fluctuations, the impact of an aggregate change of 10% in foreign currency exchange rates relative to the U.S. dollar on our results of operations and financial position could be material.
Military Conflict in Ukraine ITEM
After beginning in 2022, the military conflict between Russia and Ukraine has continued to escalate and create challenges to already uncertain macroeconomic conditions. As of March 31, 2023, we do not expect these events to have any material impact on our operations. Our Russia net revenues as a percentage of our consolidated net revenues and our assets domiciled in Russia, including cash and cash equivalents, as a percentage of our total assets, are immaterial.
Inflation Risk
The economy has been impacted by certain macroeconomic challenges which have contributed to a rising inflationary trend that have impacted both our revenues and costs globally, and which we expect will continue into the foreseeable future. If our costs become subject to significant inflationary pressures, we may not be able to fully offset such higher costs through price increases. There can be no assurance that our results of operations and financial condition will not be materially impacted by inflation in the future.
Item 4.CONTROLS AND PROCEDURES Controls and Procedures.
Evaluation of disclosure controls and procedures.
Under the supervision and with the participation of our management, including our Chief Executive Officer and our Chief Financial Officer, we have evaluated the effectiveness of the design and operation of our disclosure controls and procedures (as defined in Rules 13a-15(e) and 15d-15(e) under the Exchange Act) as of the end of the period covered by this Quarterly Report on Form 10-Q. Based upon that evaluation, our Chief Executive Officer and our Chief Financial Officer have concluded that our disclosure controls and procedures are effective as of September 30, 2017,March 31, 2023, to provide reasonable assurance that information required to be disclosed by us in the reports that we file or submit under the Exchange Act is accumulated and communicated to our management, including our Chief Executive Officer and our Chief Financial Officer, as appropriate, to allow timely decisions regarding required disclosure, and that such information is recorded, processed, summarized and reported within the time periods specified in the Securities and Exchange CommissionSEC rules and forms.
Changes in internal control over financial reporting.
There were no changes in our internal control over financial reporting during the quarter ended September 30, 2017March 31, 2023 that have materially affected, or are reasonably likely to materially affect, our internal control over financial reporting.
PART II—OTHER INFORMATION
ITEMItem 1. LEGAL PROCEEDINGSLegal Proceedings.
In the courseFor a discussion of Align's operations, Align is involved in a variety of claims, suits, investigations, and proceedings, including actions with respect to intellectual property claims, patent infringement claims, government investigations, labor and employment claims, breach of contract claims, tax, and other matters. Regardless of the outcome, these proceedings can have an adverse impact on us because of defense costs, diversion of management resources, and other factors. Although the results of complex legal proceedings, are difficultrefer to predict and Align's view of these matters may change in the future as litigation and events related thereto unfold; Align currently does not believe that these matters, individually or in the aggregate, will materially affect Align's financial position, results of operations or cash flows (Refer to Note 8 "Legal Proceedings"6 “Legal Proceedings” of the Notes to Condensed Consolidated Financial StatementsStatements in Part I, Item 1 of this Form 10-Q.
Item 1A. Risk Factors.
The following discusses some of the risks that may affect our business, results of operations, financial condition and the price of our stock. You should carefully review this section, as well as our condensed consolidated financial statements and notes thereto and other information appearing in this Quarterly Report on Form 10-Q, for detailsimportant information regarding these and other risks that may affect us. The order we have chosen to list the risks below or the sections in which we have identified them should not be interpreted to mean we deem any risks to be more or less important or likely to occur or, if any do occur, that their impact may be any less significant than others. These risk factors should be considered in connection with evaluating the forward-looking statements contained in this report because they could cause our actual results and conditions to differ materially from those statements. Before you invest in Align, you should know that investing involves risks, including those described below. The risks below are not the only ones we face. If any of the risks actually occur, our business, financial
condition and results of operations could be negatively affected, the trading price of our common stock could decline, and you may lose all or part of your investment.
Summary of Risk Factors
Our business is subject to a number of risks, including risks that may prevent us from achieving our business objectives or may adversely affect our business, financial condition, results of operations, cash flows, and prospects. These risks are discussed more fully below and include, but are not limited to:
Macroeconomic and External Risks
•Global and regional economic conditions
•Major health crises
•Political events, international disputes, war and terrorism
•Natural disasters
Business and Industry Risks
•Changes in demand for our products
•Increased competition
•Failure of our new products, or changes to our existing products, to attract or retain consumers or generate revenue
•Our ability to successfully integrate our acquisitions
Operational Risks
•Business disruptions
•Predicting demand
•Availability of supplies
•Shipping delays
•Personnel development and retention
•Effectiveness of marketing and our ability to attract consumers
Legal, Regulatory and Compliance Risks
•Government investigations, enforcement actions, and settlements
•Our ability to comply with laws and regulatory and legislative mandates or guidance
•Privacy, cybersecurity and data protection
•Litigation, including class action lawsuits
Intellectual Property Risks
•Our ability to obtain, maintain, protect, and enforce our intellectual property rights
Financial, Tax and Accounting Risks
•Impairment of our goodwill
•Compliance with accounting, financial reporting, and tax laws
•Management of our stock plans
•Volatility of our stock
Macroeconomic and External Risks
Our operations and financial performance depend on legal proceedings).global and regional economic conditions. Inflation, fluctuations in currency exchange rates, changes in consumer confidence and demand, and general economic weakness and threats, or actual recessions, have and could in the future materially affect our business, results of operations, and financial condition.
Macroeconomic conditions impact consumer confidence and discretionary spending, which can adversely affect demand for our products. Consumer spending habits are affected by, among other things, inflation, fluctuations in currency exchange rates, general economic weakness, threats or actual recessions, pandemics, wars and military actions, employment levels, wages, debt obligations, discretionary income, interest rates, volatility in capital, and consumer confidence and perceptions of current and future economic conditions. Changes and uncertainty can, among other things, reduce or shift spending away from elective procedures, drive patients to purchase orthodontic treatments that cost less than our Invisalign treatment options, decrease the number of orthodontic and dental case starts, reduce patient traffic in dentists’ offices or reduce demand for dental services generally. Further, decreased demand for dental services can cause dentists and labs to postpone investments in capital equipment, such as intraoral scanners and CAD/CAM equipment and software. The recent declines in, or uncertain economic outlooks for, the U.S., Chinese, European and certain other international economies have and may continue to adversely affect consumer and dental practice spending. The increase in the cost of fuel and energy, food and other essential items along with higher interest rates could reduce consumers' disposable income, resulting in decreased discretionary spending for products like ours. Decreases in disposable income and discretionary spending or changes in consumer confidence and spending habits has and may continue to adversely affect our revenues and operating results.
ITEM 1A.RISK FACTORSInflation continues to adversely impact spending and trade activities, causing unpredictable impacts on global and regional economies. Higher inflation has also increased domestic and international shipping costs, raw material prices, and labor rates, which has adversely impacted the costs of producing, procuring and shipping our products. Our ability to recover these cost
increases through price increases may continue to lag, resulting in downward pressure on our operating results. Attempts to offset cost increases with price increases may reduce sales, increase customer dissatisfaction or otherwise harm our reputation. Further, we cannot predict the impact of efforts by central banks and federal, state and local governments to combat higher inflation. If their efforts are too aggressive, they may lead to a recession. Alternatively, if they are insufficient or are not sustained long enough to lower inflation to acceptable levels, consumer spending may be adversely impacted for a prolonged period of time. Additionally, the responses by regulators to recent bank failures could cause or continue to cause volatility in the credit or capital markets, market-wide liquidity issues, bank-runs and general concern across the global financial industry that may adversely impact consumer spending. While we have not been materially impacted by any of the recent bank failures, these conditions may also limit access to capital for us and our vendors and customers, making it difficult to accurately forecast and plan future business activities. Any of these events could materially affect our business and operating results.
We depend onhave international operations and sales outside the saleU.S. We earn a large portion of our total revenues from international sales generated through our foreign direct and indirect operations and we expect to increase our sales and presence outside the U.S., particularly in markets we believe have high-growth potential. Moreover, we perform most of our key production steps in locations outside of the Invisalign system forU.S. For instance, we perform our digital treatment planning and aligner fabrication in multiple international locations, including large-scale operations in Mexico, Costa Rica, Poland, Japan and China. Additionally, we maintain significant global sales and marketing operations in Switzerland, Singapore and China, along with research and development operations globally, including in the vast majorityU.S., Spain, Israel, Armenia and Germany. Our reliance on international operations and sales exposes us to fluctuations in foreign currencies that may adversely impact our business or results of operations. Although the U.S. dollar is our reporting currency, a growing portion of our net revenues and net income are generated in foreign currencies. While we utilize forward contracts to reduce the adverse earnings impact from the effect of exchange rate fluctuations on certain assets and liabilities, our hedging strategies may not be successful, and currency exchange rate fluctuations have and could continue to have a material adverse effect on our operating results and cash flows. In addition, our foreign currency exposure on assets, liabilities and cash flows that we do not hedge have and could continue to have a material impact on our financial results in periods when the U.S. dollar significantly fluctuates in relation to foreign currencies.
Our business could be impacted by political events, trade and other international disputes, war, and terrorism, including the military conflictbetween Russia and Ukraine.
Political events, trade and other international disputes, war, and terrorism could harm or disrupt international commerce and the global economy and could have a material effect on our business as well as our customers, suppliers, contract manufacturers, distributors, and other business partners. Such risks include inflation, supply chain and trade disruptions, trade sanctions, reduced consumer spending, disruptions to our IT systems, including through network failures, malicious or disruptive software, or cyberattacks, energy shortages or rationing that adversely impacts our manufacturing facilities, rising fuel or rising costs of producing, procuring and shipping our products, fluctuations to foreign currency exchange rates, and constraints, volatility or disruption in the financial markets.
Political events, trade and other international disputes, wars, and terrorism can lead to unexpected tariffs or trade restrictions, which may adversely impact our business. Tariffs increase the cost of our products and the components and raw materials used to make them. Increased costs could adversely impact our gross margin and reduce demand for our products. Countries may also adopt other measures, such as controls on imports or exports of goods, technology or data, that adversely impact our operations and supply chain, limit our ability to offer products and services or inhibit our ability to comply due to contradictions with other laws. These measures could require us to take various actions, including changing suppliers or restructuring business relationships. Complying with new or changed trade restrictions is expensive, time-consuming and disruptive to our operations. Such restrictions can be announced with little or no advance notice and we may be unable to effectively mitigate their adverse impacts. If disputes and conflicts escalate in the future, the responses by governments may be significantly more restrictive and could materially affect our business.
Political unrest, threats, tensions, actions and responses to any social, economic, business, geopolitical, military, terrorism, or acts of war involving key commercial, development or manufacturing markets such as China, Mexico, Israel, Europe, or other countries could materially impact our international operation. For example, our employees in Israel could be obligated to perform reserve duty in the Israeli military and be called for additional active duty under emergency circumstances. If any of these events or conditions occur, the impact to us, our employees and customers is uncertain, particularly if emergency circumstances, armed conflicts or an escalation in political instability or violence disrupts our product development, data or information exchange, payroll or banking operations, product or materials shipping by us or our suppliers and other unanticipated business disruptions, interruptions and limitations in telecommunication services or critical systems or applications reliant on a stable and uninterrupted communications infrastructure.
The military conflictbetween Russia and Ukraine has materially adversely impacted global economies. Our commercial operations have been impacted by the conflict and if we fail to support existing customers, we may harm our reputation, and be subject to legal and regulatory actions in Russia. Additionally, although the majority of our research and development personnel
formerly headquartered in Russia have relocated, some personnel remain. Whether those that are in Russia or those in their new locations remain with us over the long-term is unknown. If we are unable to retain key skilled personnel, or we are unable to quickly replace such personnel with individuals of equivalent technical expertise and qualifications, our business and financial condition could be materially effected. Moreover, production could be impaired as a result of the military conflict in other countries such as Poland, where one of our aligner fabrication facilities is located. We have no way to predict the progress or outcome of the conflict in Ukraine or the reactions by governments, businesses or consumers but it could have a material effect on our business and operating results.
Our business could be impacted by major public health issues, including pandemics, and our business has been materially affected by the global and regional spread of COVID-19.
Major public health issues, including pandemics such as COVID-19, have adversely affected, and could in the future materially affect, our business due to their impact on the global and regional economies, demand for consumer products, and the imposition or removal of public safety measures. Public health concerns may also limit the movement of goods between regions, disrupt or delay supply chains and sales and distribution channels, resulting in interruptions of the supply of products. Insurance coverage, if available, may be insufficient to cover all losses that may arise.
COVID-19 created significant, widespread and unprecedented volatility, uncertainty, and economic instability, disrupting broad aspects of global and regional economies, our operations and the businesses of our customers and suppliers. Therefore, comparing our financial results for the reporting periods of 2023 to the same reporting periods of 2022 or earlier may not be a useful means by which to evaluate the health of our business and our results of operations. We cannot predict future direct and ancillary impacts on our business or results of operations from the COVID-19 pandemic, although they may be material to our business as well as the businesses of our customers, suppliers and economic activity generally.
Our operations may be impacted by natural disasters, which may become more frequent or severe as a result of climate change, and may adversely impact our business and operating results as well as those of our customers and suppliers.
Natural disasters can impact our operations as well as those of our customers and critical suppliers. Natural disasters include earthquakes, tsunamis, floods, droughts, hurricanes, wildfires, and other extreme weather conditions that can cause deaths, injuries, and critical health crises, power outages, restrictions and shortages of food, water, shelter, and medical supplies, telecommunications failures, materials scarcity, price volatility and other ramifications. Climate change is likely to increase both the frequency and severity of natural disasters and, consequently, risks to our business and operations. Our digital dental modeling and certain of our customer facing operations are primarily processed in our facilities located in Costa Rica. Our aligner molds and finished aligners are fabricated in China, Mexico and Poland. Our locations in Costa Rica and Mexico as well as others are in earthquake and hurricane zones and may be subject to other natural disasters. Moreover, a significant portion of our research and development activities are located in California, which suffers from earthquakes, periodic droughts, heat waves, flooding, power shortages and wildfires. If a natural disaster occurs in a region where one of these facilities is located, our employees could be impacted, our research lost, and our ability to create treatment plans, respond to customer inquiries or manufacture and ship our aligners or intraoral scanners could be compromised which could result in our customers experiencing significant product and services delays.
The effects of climate change on regional and global economies could change the supply, demand or availability of sources of energy or other resources material to our products and operations and affect the availability or cost of natural resources and goods and services on which we and our suppliers rely.
Business and Industry Risks
Demand for our products may not increase or may decrease due to resistance to non-traditional treatment methods, which could have a material impact on our business and operating results.
Invisalign treatment is a significant change from traditional metal wires and brackets orthodontic treatment, and customers and consumers may not find it cost-effective or preferable to traditional treatment. For instance, a number of dental professionals continue to believe Invisalign treatment is only appropriate for a limited percentage of patients or are reluctant to move from analog to digital. Increased market acceptance of our products depends in part on the recommendations of dental professionals, as well as other factors including efficacy, safety, ease of use, reliability, aesthetics, and price compared to competing products and treatment methods. If demand for our products fails to increase, our business and operating results may be harmed.
Our net revenues depend primarily on our Invisalign system and iTero scanners and any decline in sales of Invisalign treatment for any reason, or a decline in average selling prices wouldprice of these products may adversely affect net revenues, gross margin and net income.
Our net revenues remain largely dependent on sales of our Invisalign system of clear aligners and iTero intraoral scanners. Of the two, we expect that net revenues from the sale of the Invisalign System,system, primarily Invisalign Full and Invisalign Teen,our comprehensive products, will continue to account for the vast majority of our total net revenues, formaking the foreseeable future. Continuedcontinued and widespread market acceptance of the Invisalign system by orthodontists, GPs and consumers is critical to our future success. If Our iTero business also contributes a material percentage of our overall net revenues. Our CAD/CAM software solutions are important to the continuing evolution of our Align Digital Platform and our business overall. Our operating results could be harmed if:
•orthodontists and GPs experience a reduction in consumer demand for orthodontic services, if services;
•consumers proveare unwilling to adopt Invisalign system treatment as rapidly as we anticipate or in the volume thatvolumes we anticipate if and at the prices offered;
•orthodontists or GPs choose to use acontinue using wires and brackets or competitive productproducts rather than the Invisalign system or if the rates at which they utilize the Invisalign system fail to increase or increase as rapidly as anticipated;
•sales of our iTero scanners decline or fail to grow sufficiently or as anticipated;
•the growth of CAD/CAM solutions does not produce the results anticipated; or
•the average selling price of our products declines.
The average selling prices of our products, particularly our Invisalign system, are influenced by numerous factors, including the type and timing of products sold (particularly the timing of orders for additional clear aligners for certain Invisalign products) and foreign exchange rates. In addition, we sell a number of products at different list prices which may differ based on country. Our average selling prices for our Invisalign system and iTero scanners have been impacted in the past and may be adversely affected again in the future if:
•we introduce new or change existing promotions, general or volume-based discount programs, product declines foror services bundles, or consumer rebate programs;
•participation in any reason, including as a result of a shiftpromotions or programs unexpectedly increases, decreases or drives demand in unexpected and material ways;
•our geographic, channel, or product mix towardsshifts to lower priced products or to products with a higher percentage of deferred revenue;
•we decrease prices on one or more products or services in response to increasing competitive pricing pressures;
•we introduce new or change existing products or services, or modify how we market or sell any of our operating results wouldnew or existing products or services;
•governments impose pricing regulations such as volume-based procurement regulations in China; or
•estimates used in the calculation of deferred revenue differ from actual average selling prices.
If our average selling prices decline, our net revenues, gross margin and net income may be harmed.adversely affected.
Competition in the markets for our products is intenseincreasing and we expect aggressive competition from existing competitors, and other companies that may introduce new technologies or products in the future.future and customers who alone or with others create orthodontic appliances and solutions or other products or services that compete with us.
The dental industry is in a period of immense and rapid digital transformation involving products, technologies, distribution channels and business models. While solutions such as our Invisalign system, iTero scanners and CAD/CAM software facilitate this transition, whether our technologies will achieve market acceptance and, if adopted, whether and when they may become obsolete, remains unclear.
Currently, our products compete directlythe Invisalign system competes primarily against productstraditional metal wires and brackets and increasingly against clear aligners manufactured and distributed by variousnew market entrants and manufacturers of traditional wires and brackets, and from traditional medical device companies, both withinlaboratories, startups and, outside the U.S. Manyin some cases, doctors and Dental Support Organizations ("DSOs") themselves. The number and types of these manufacturers, including Danaher Corporation, Dentsply Sirona Inc., Straumann Groupcompetitors are diverse and 3M, have substantially greater financial resourcesgrowing rapidly. They vary by segment, geography, and manufacturingsize, and marketing experience than we do. In addition, as a result of the expiration of certain key patents owned by us, commencinginclude new and well-established regional competitors in 2017, we expect that these existing competitorsdental markets, as well as new entrants into the clear aligner market will begin offering an orthodontic system more similar to ours in the near future. Severallarger companies or divisions of these competitors will likely have greater resources as well as the ability to leverage their existing channels in the dental market to compete directlylarger companies with us, and therefore our share of the clear aligner market could decline which would likely have a material adverse effect on our business, results of operationsubstantial sales, marketing, research and financial condition. In addition, corresponding foreign patents will start to expirecapabilities. Our competitors also include direct-to-consumer (“DTC”) companies that provide clear aligners using a remote business model requiring little or no in-office care from trained and licensed doctors, and doctors and DSOs who manufacture custom aligners in 2018 which will likely result in increased competition in some of the markets outside the U.S.their offices using 3D printing technology. Large consumer product companies may also enterstart supplying orthodontic products.
The manipulation and movement of teeth and bone is a complex and delicate process with potentially painful and debilitating results if improperly performed or monitored. Accordingly, we deliver our Invisalign system solutions primarily through trained and skilled doctors and are reliant on their recommendations and support of our products. The Invisalign system requires a doctor's prescription and an in-person physical examination of the orthodontic supply market. Furthermore,patient’s dentition before beginning treatment; however, with the advent of DTC providers, there has been a shift away from traditional dental practices that may impact our primary selling channels. Doctors and DSOs are sampling alternative products and taking advantage of competitive promotions and sale opportunities. In addition, we also face competition from companies that now offer clear aligner therapy directly to the consumer eliminating the need for the consumer to visit a dental office. In addition,introduce new technologies and we may also face competition in the future from new companies that may introduce new technologies. We may be unable
to compete with these competitors and one or more of these competitorsthey may render our technology obsolete or economically unattractive. If we are unable to compete effectively with existing products or respond effectively to any products developed by new or existing competitors,technologies, our business could be harmed. Increased competition has resulted in the past
Our iTero intraoral scanner can be used to start clear aligner therapy, as well as other dental procedures, including restorative, implant planning and dentures, and also functions as a diagnostic tool. The iTero intraoral scanner competes with polyvinyl siloxane (“PVS”) impressions that doctors use for clear aligner therapy or other dental procedures, as well as other intraoral scanners. It also competes with traditional bite wing 2D dental x-rays for detecting interproximal caries. If we are unable to compete effectively with these existing products, existing competitors, new market entrants, or respond effectively to new technologies, our Systems and Services segment could be harmed.
To stimulate product and services demand, we have a history of offering volume discounts, price reductions and other promotions to targeted customers and consumers. Whether or not successful, these promotional campaigns have had and may in the future result in volume discountinghave unexpected and price reductions,unintended consequences, including reduced gross margins, reduced profitability and loss of market share, and reduce dental professionals’ efforts and commitment to expand their use of our products, any of which could have a material adverse effect on ouraverage selling prices, net revenues, volume growth, and net income and stock price. income.
We cannot assurebe sure that we will be able to compete successfully against our current or future competitors or that competitive pressures will not have a material adverse effect on our business, results of operations and financial condition.
We are dependentOur success depends on our international operations, which exposes usability to foreign operational, politicalsuccessfully develop, introduce, achieve market acceptance of, and other risks that may harm our business.manage new products and services.
Our key production steps are performedsuccess depends on our ability to profitably and quickly develop, manufacture, market, obtain and maintain regulatory approval or clearance of new products and services along with improvements to existing products and services. There is no assurance we can successfully develop, sell and achieve market acceptance of our new or improved products and services. The extent and rate at which new products or services may achieve market acceptance and penetration is a function of many variables, including our ability to:
•successfully predict and timely innovate and develop new technologies, applications and products preferred by customers and consumers and that have features and functionality to meet the needs of patients;
•successfully and timely obtain regulatory approval or clearance of new and improved products or services from government agencies such as the FDA and analogous agencies in operations located outsideother countries;
•cost-effectively and efficiently develop, manufacture, quality test, market, dispose of, and sell new or improved products and services offerings, including localized versions for international markets;
•properly forecast the U.S. In San Jose, Costa Rica, technicians use a sophisticated, internally developed computer-modeling program to prepare digital treatment plans, which are then transmitted electronically to Juarez, Mexico. These digital files form the basisamount and timing of the ClinCheck treatment plannew or improved product and are used to manufacture aligner molds. Our order acquisition, aligner fabrication and shipping operations are conducted in Juarez, Mexico, and we also have order acquisition for the EMEA region atservices demand;
•allocate our facility in Amsterdam, the Netherlands. We will continue to establish additional order acquisition and treatment planning facilities closer to our international customers in order to improve our operational efficiency. In addition to the research and development efforts conductedfunding to products and services with higher growth prospects;
•ensure the compatibility of our technology, services and systems with those of our customers;
•anticipate and rapidly innovate in response to new competitive products and services offerings and technologies;
•differentiate our products and product offerings from our competitors as well as other products in our North America facilities,own portfolio and successfully articulate the benefits to our customers;
•manage the impact of nationalism or initiatives encouraging consumer purchases from domestic vendors, or dissuade interoperability of products and technologies between companies;
•qualify for third-party reimbursement for procedures involving our products or services; and
•encourage customers to adopt new technologies and provide the needed technical, sales and marketing support to make new product and services launches successful.
If we also carry outfail to accurately predict the needs and preferences of customers and their patients, or fail to produce viable technologies, we may invest heavily in research and development in Moscow, Russia. We also have customer-care, accounts receivable, creditthat does not lead to significant revenues. Even if we successfully innovate and collections, customer event registrationdevelop new products and accounts payable organizations located atproduct improvements, we may incur substantial costs doing so and our facility in San Jose, Costa Rica. profitability may suffer. It may be difficult to gain market share and acceptance for new or improved products. Introduction and acceptance of any products and services may take significant time and effort, particularly if they require doctor education and training to understand their benefits or doctors choose to withhold judgment on a product until patients complete their treatments. For instance, it can take up to 24 months or longer to complete treatment using our Invisalign system.
In addition, we periodically introduce new business and sales initiatives to meet customers’ needs and demands. In general, our internal resources support these initiatives without clear indications they will prove successful or be without short-term execution challenges. Should these initiatives be unsuccessful, our business, results of operations and financial condition could be materially impacted.
We may invest in or acquire other businesses, products or technologies which may require significant management attention, disrupt our business, dilute stockholder value and adversely affect our results of operations.
Periodically, we have and may in the future acquire, or make investments in, companies, products or technologies. Alternatively, we may be unable to find suitable investment or acquisition targets or be unable to complete investments or acquisitions on favorable terms, if at all. If we make investments or complete acquisitions, we may not ultimately strengthen our competitive position or achieve our goals or desired synergies, and investments or acquisitions we complete could be viewed negatively by our customers, securities analysts and investors. Moreover, to the extent we make strategic investments, the companies in which we invest may fail or we may ultimately own less than a majority of the outstanding shares of the company and be outvoted on critical issues that could harm us or the value of our investment.
Additionally, as an organization we do not have a history of significant acquisitions or integrating their operations in Israel where the design and wandcultures with our own. As such, we are assembled and our intraoral scanner is manufactured. Our reliance on international operations exposes ussubject to various risks and uncertainties that may affectwhen making a strategic investment or acquisition which could materially impact our business or results of operation, including:operations, including that we may:
difficulties in hiring and retaining employees generally, as well as difficulties in hiring and retaining employees with the necessary skills•fail to perform proper due diligence and inherit unexpected material issues or assets, including intellectual property ("IP") or other litigation or ongoing investigations, accounting irregularities or improprieties, bribery, corruption or other compliance liabilities;
•fail to comply with regulations, governmental orders or decrees;
•experience IT security and privacy compliance issues;
•invest in companies that generate net losses or the more technical aspectsmarkets for their products, services or technologies may be slow or fail to develop;
•not realize a positive return on investment or determine that our investments have declined in value, such that it may be necessary to record impairments such as future impairments of intangible assets and goodwill;
•have to pay cash, incur debt or issue equity securities to pay for an acquisition, adversely affecting our liquidity, financial condition or the value of our common stock. The sale of equity or issuance of debt to finance any acquisition could result in dilution to our stockholders. The occurrence of indebtedness would result in increased fixed obligations and could also include covenants or other restrictions that impede our ability to manage our operations;
difficulties in managing international operations, including any travel restrictions•find it difficult to or from our facilities;
fluctuations in currency exchange rates;
increased income taxes,implement and harmonize company-wide financial reporting, forecasting and budgeting, accounting, billing, IT and other restrictionssystems due to inconsistencies in standards, internal controls, procedures and limitations, if we werepolicies;
•require significant time and resources to decideeffectuate the integration;
•fail to repatriateretain key personnel or harm our existing culture or the culture of an acquired entity;
•not realize any or all or material portions of the expected synergies and benefits of the acquisition; or
•unsuccessfully evaluate or utilize the acquired technology or acquired company’s know-how or fail to successfully integrate the technologies acquired.
Moreover, opposition to one or more acquisitions may lead to negative ratings by analysts or investors, give rise to stockholder objections or result in stockholder activism, any of which could disrupt our foreign cash balances back tooperations or harm our stock price.
Operational Risks
Business disruptions could seriously harm our financial condition.
Our global operations have been disrupted in the U.S.;
importpast and export license requirementswill likely be disrupted and restrictions;
controlling production volume and quality ofharmed again in the manufacturing process;
political, social and economic instability, including as a result of increased levels of violence in Juarez, Mexico or the Middle East. We cannot predict the effect on usfuture. The occurrence of any future armed conflict, political instabilitymaterial or violence in these regions. In addition, some of our employees in Israel are obligated to perform annual reserve duty in the Israeli military and are subject to being called for additional active duty under emergency circumstances. We cannot predict the full impact of these conditions on us in the future, particularly if emergency circumstancesprolonged business disruptions, whether internal or an escalation in the political situation occurs. If many of our employees are called for active duty, our operations in Israel and our business may not be able to function at full capacity;
acts of terrorism and acts of war;
general geopolitical instability and the responses to it, such as the possibility of additional sanctions against Russia which continue to bring uncertainty to this region;
interruptions and limitations in telecommunication services;
product or material transportation delays or disruption, including as a result of increased levels of violence, acts of terrorism, acts of war or health epidemics restricting travel to and from our international locations or as a result of natural disasters, such as earthquakes or volcanic eruptions;
burdens of complying with a wide variety of local country and regional laws, including the risks associated with the Foreign Corrupt Practices Act and local anti-bribery compliance;
trade restrictions and changes in tariffs; and
potential adverse tax consequences.
If any of these risks materialize in the future, wekey suppliers, could experience production delays and lost or delayed revenue.
In addition, President Donald Trump and his administration have made statements regarding the possibility of changing the way in which international operations of U.S. companies are taxed, including through the implementation of a border tax, tariff or increase in custom duties on products manufactured in countries outside of the U.S., such as Mexico, and imported into the U.S. In the event such taxes, tariffs, increased custom duties or other measures are implemented, they could have a materially adverse effect onharm our business and or operating results of operations, result in material losses, seriously harm our revenues, profitability and we may havefinancial condition, adversely affect our competitive position, increase our costs and expenses, and require substantial expenditures and recovery time in order to consider relocating some of our internationalfully resume operations.
We earn an increasingly larger portion of our total revenues from international sales and face risks attendant to those operations.
We earn an increasingly larger portion of our total revenues from international sales generated through our foreign direct and indirect operations. Since our growth strategy dependsWhen business disruptions occur, they may, individually or in part onthe aggregate, affect our ability to further penetrate markets outsideprovide products, services and solutions to our customers, and could cause production delays or limitations, create adverse effects on distributors, disrupt supply chains, result in shipping and distribution disruptions and reduce the U.S. and increase the localizationavailability of our products and services, we expector access to continue to increase our sales and presence outside the U.S., particularly in the high-growth markets. Our international operations are subject to risks that are customarily encountered in non-U.S. operations, including:
local political and economic instability;
the engagement of activities by our employees, contractors, partners and agents, especially in countries with developing economies, that are prohibited by international and local trade and labor laws and other laws prohibiting corrupt payments to government officials, including the Foreign Corrupt Practices Act, the UK Bribery Act of 2010 and export control laws, in spite of ourone or more facilities. We have policies and procedures designedwhich are intended to ensure compliancemitigate the impact of the business disruptions and crises that we believe could be most significant, and we train employees and work with these laws;
although it is our intentionsuppliers to indefinitely reinvest earnings outsideprepare for potential disruptions. However, the U.S., restrictions on the transfer of funds held by our foreign subsidiaries, including with respect to restrictions on our ability to repatriate foreign cash to the U.S. at favorable tax rates;
fluctuations in currency exchange rates; and
increased expense of developing, testing and making localized versions of our products.
Anydesign or implementation of these factors, either individually or in combination,policies and practices may fail to adequately address particular disruptions, which could materially impact our international operations and adversely affect our business, as a whole.
We face risks related to our international sales, including the need to obtain necessary foreign regulatory clearance or approvals.
Outside of North America, we currently sell our products in certain countries within Europe, Asia Pacific, Latin America and the Middle East and may expand into other countries from time to time. For sales of our products outside the U.S., we are subject to foreign regulatory requirements that vary widely from country to country. The time required to obtain clearances or approvals required by other countries may be longer than that required for FDA clearance or approval, and requirements for such approvals may differ from FDA requirements. We may be unable to obtain regulatory approvals in one or more of the other countries in which we do business or in which we may do business in the future. We may also incur significant costs in attempting to obtain and maintain foreign regulatory approvals. If we experience delays in receipt of approvals to market our products outside of the U.S., or if we fail to receive these approvals, we may be unable to market our products or enhancements in international markets in a timely manner, if at all, which could materially impact our international operations and adversely affect our business as a whole.
Demand for our products may not increase as rapidly as we anticipate due to a variety of factors including a weakness in general economic conditions.
Consumer spending habits are affected by, among other things, prevailing economic conditions, levels of employment, salaries and wage rates, gas prices, consumer confidence and consumer perception of economic conditions. A general slowdown in the U.S. economy and certain international economies or an uncertain economic outlook would adversely affect consumer spending habits which may, among other things, result in a decrease in the number of overall orthodontic case starts, reduced patient traffic in dentists’ offices, reduction in consumer spending on higher value procedures or a reduction in the demand for dental services generally, each of which would have a material adverse effect on our sales and operating results. Weakness in the global economy results in a challenging environment for selling dental technologies and dentists may postpone investments in capital equipment, such as intraoral scanners. In addition, Invisalign treatment, which currently accounts for the vast majority of our net revenues, represents a significant change from traditional orthodontic treatment, and customers and consumers may be reluctant to accept it or may not find it preferable to traditional treatment. We have generally received positive feedback from orthodontists, GPs and consumers regarding Invisalign treatment as both an alternative to braces and as a clinical method for the treatment of malocclusion, but a number of dental professionals believe that the Invisalign treatment is appropriate for only a limited percentage of their patients. Increased market acceptance of all of our products will depend in part upon the recommendations of dental professionals, as well as other factors including effectiveness, safety, ease of use, reliability, aesthetics, and price compared to competing products.
The frequency of use of the Invisalign system by orthodontists or GPs may not increase at the rate that we anticipate or at all.
One of our key objectives is to continue to increase utilization, or the adoption and frequency of use, of the Invisalign System by new and existing customers. If utilization of the Invisalign System by our existing and newly trained orthodontists or GPs does not occur or does not occur as quickly as we anticipate, our operating results could be harmed.
We may experience declines in average selling prices of our products which may decrease our net revenues.
We provide volume-based discount programs to our doctors. In addition, we sell a number of products at different list prices. If we change the volume-based discount accounting that affects our average selling prices; if we introduce any price reductions or consumer rebate programs; if we expand our discount programs in the future or participation in these programs increases; or if our product mix shifts to lower priced products or products that have a higher percentage of deferred revenue, our average selling prices would be adversely affected and our net revenues, gross profit, gross margin and net income may be reduced.
We are exposed to fluctuations in currency exchange rates, which could negatively affect our financial condition and results of operations.
AlthoughOur operating results have and will continue to fluctuate in the U.S. dollar isfuture, which makes predicting the timing and amount of customer demand, our reporting currency,revenues, costs and expenditures difficult.
Our quarterly and annual operating results have and will continue to fluctuate for a portionvariety of reasons, including as a result of changing doctor and consumer product demand. In addition to the factors otherwise described herein, some of the other factors that have historically, and could in the future, cause our operating results to fluctuate include:
•higher manufacturing, delivery and inventory costs;
•the creditworthiness, liquidity and solvency of our net revenuescustomers and net income are generatedtheir ability to timely make payments when due;
•changes in foreign currencies. Net revenuesthe timing of revenue recognition and net income generated by subsidiaries operating outsideour average selling prices, including as a result of the U.S. are translated into U.S. dollars using exchange rates effective duringtiming of receipt of product orders and shipments, product and services mix, geographic mix, product and services deferrals, the respective periodintroduction of new products and are affected bysoftware releases, product pricing, bundling and promotions, pricing for fees or expenses, modifications to our terms and conditions such as payment terms, or as a result of new accounting pronouncements or changes to critical accounting estimates including, without limitation, estimates based on matters such as our predicted usage of additional aligners;
•seasonal fluctuations, including those related to patient demographics or seasonality as well as the availability of doctors to take appointments;
•longer customer payment cycles and greater difficulty in exchange rates.accounts receivable collection for our international sales;
•costs and expenditures, including in connection with new treatment planning and fabrication facilities, the hiring and deployment of personnel, and litigation; and
•timing and fluctuation of spending around marketing and brand awareness campaigns and industry trade shows.
If we underestimate product demand, demand may exceed our manufacturing capacity or that of one or more of our suppliers, we may be understaffed and we may not have sufficient materials needed for production. Specifically, our manufacturing process relies on sophisticated computer software and requires new technicians to undergo a relatively long training process, often 120 days or longer. As a result, negative movementsif we are unable to accurately predict demand, we may have an insufficient number of trained technicians to ensure products are timely manufactured and delivered to meet customers’ expectations, which could damage our relationships with our existing customers or harm our ability to attract new customers. Specifically, production levels for our intraoral scanner are generally forecasted based on forecasts and historic product demand and we often place orders with suppliers for materials, components and sub-assemblies (“materials and components”) as well as finished products weeks or more in currency exchange rates against the U.S. dollar will adversely affect our netadvance of projected customer orders.
Conversely, if we overestimate customer demand, we may lose opportunities to increase revenues and net incomeprofits, we may have excessive staffing, materials, components and finished products, or capacity. If we hire and train too many technicians in anticipation of demand that does not materialize or materializes slower than anticipated, our consolidatedcosts and expenditures may outpace our revenues or revenue growth, harming our gross margin and financial statements. The exchange rate between the U.S. dollar and foreign currencies has fluctuated substantially in recent years and may continueresults. Additionally, to fluctuate substantially in the future. We have in the past and may in the futuresecure supplies for production of products, we periodically enter into currency hedging transactions in an effortnon-cancelable minimum purchase commitments with vendors, which could impact our ability to cover some of our exposureadjust inventory for declining demand. If product demand decreases or increases more than forecast, we may be required to foreign currency exchange fluctuations. These transactions may not operate to fullypurchase or effectively hedge our exposure to currency fluctuations,lease additional or larger facilities and under certain circumstances, these transactions could have an adverse effect on our financial condition.
Asadditional equipment, or we continue to grow, we are subject to growth related risks, including risks related to excess or constrained capacity at our existing facilities.
We are subject to growth related risks, including excess or constrained capacity and pressure on our internal systems and personnel. In order to manage current operations and future growth effectively, we will need to continue to implement and improve our operational, financial and management information systems and to hire, train, motivate, manage and retain employees. We may be unable to manage such growth effectively. Any such failure could have a material adverse impact on our business, operations and prospects. We are establishing additional order acquisition and treatment planning facilities closer to our international customers in order to improve our operational efficiency and provide doctors with a better experience to further improve their confidence in using Invisalign to treat more patients, more often. Our ability to plan, construct and equip additional order acquisition, treatment planning and manufacturing facilities is subject to significant risk and uncertainty, including risks inherentfulfill customer demand in the establishment of a facility, such as hiringtime frames and retaining employees and delays and cost overruns as a result of a number of factors, any of whichwith the quantities required. Responding to unanticipated changes in demand may be out of our control. If the transition into these additional facilities is significantly delayed or demand for our product exceeds our current expectations, we may not be abletake time to fulfill orders timely, which may negatively impact our financial results and overall business. In addition, because we cannot immediately adapt our production capacity and related cost structures to changing market conditions, our facility capacity may at times exceed or fall short of our production requirements. In addition, if product demand decreases or we fail to forecast demand accurately, we could be required to write off inventory or record excess capacity charges, which wouldaccomplish, lower our gross margin.margin, inhibit sales or harm our reputation. Production of our Invisalign clear aligners and iTero intraoral scanners mayare also be limited by capacity constraints due to a variety of factors, including labor shortages, shipping delays, our dependency on third partythird-party vendors for key materials, parts, components in addition toand equipment, and limited production yields. Any or all of these problems could result in the loss of customers, provide an opportunity for competing products to gain market acceptance and otherwise harm our business and financial results.
If we fail to sustain or increase profitability or revenue growth in future periods, the market price for our common stock may decline.
If we are to sustain or increase profitability in future periods, we will need to continue to increase our net revenues, while controlling our expenses. Becauseresults and those of our business is evolving,partners.
Improvements to or changes in our products may affect the demand, making it is difficultless predictable. We routinely review inventory for usage potential, including fulfillment of customer warranty obligations and spare part requirements, and write down to predict our future operating resultsthe lower of cost or levels of growth,net realized value the excess and we have not in the past and may not in the future be able to sustain our historical growth rates. If we do not increase profitability or revenue growth or otherwise meet the expectations of securities analysts or investors, the market price of our common stock will likely decline.
Our financial results have fluctuated in the past and may fluctuate in the futureobsolete inventory, which may materially affect our results of operations. For instance, periodically we announce new products, capabilities, or technologies that replace or shorten the life cycles of legacy products or cause volatility in our stock price.
Our operating results have fluctuated incustomers to defer or stop purchasing legacy products until new products become available. These risks increase the past and we expect our future quarterly and annual operating results to fluctuate as we focus on increasing doctor and consumerdifficulty of accurately forecasting demand for our products. These fluctuations could cause our stock price to decline or significantly fluctuate. Some of the factors that could cause our operating results to fluctuate include:
limited visibility into and difficulty predicting the level of activity in our customers’ practices from quarter to quarter including limited visibility into the number of aligners purchased by SmileDirectClub, LLC ("SDC") under the supply agreement from quarter to quarter;
weakness in consumer spending as a result of the slowdown in the U.S. economy and global economies;
changes in relationships with our distributors;
changes in the timing of receipt of Invisalign case product orders during a given quarter which, given our cycle time and the delay between case receipts and case shipments, could have an impact on which quarter revenue can be recognized;
fluctuations in currency exchange rates against the U.S. dollar;
changes in product mix;
our inability to scale production of our iTero Element scanner to meet customer demand;
if participation in our customer rebate or discount programs increases our average selling price will be adversely affected;
seasonal fluctuations in the number of doctors in their offices and their availability to take appointments;
success of or changes to our marketing programs from quarter to quarter;
our reliance on our contract manufacturers for the production of sub-assemblies for our intraoral scanners;
timing of industry tradeshows;
changes in the timing of when revenue is recognized, including as a result of the introduction of new products or promotions, modifications to our terms and conditions or as a result of changes to critical accounting estimates or new accounting pronouncements;
changes to our effective tax rate;
unanticipated delays in production caused by insufficient capacity or availability of raw materials;
any disruptions in the manufacturing process, including unexpected turnover in the labor force or the introduction of new production processes, power outages or natural or other disasters beyond our control;
the development and marketing of directly competitive products by existingdiscontinued and new competitors;
disruptions to our business as a result of our agreement to manufacture clear aligners for SDC, including market acceptance of the SDC business model and product, possible adverse customer reaction and negative publicity about us and our products;
impairments in the value of our strategic investments in SDC and other privately held companies could be material;
major changes in available technology or the preferences of customers may cause our current product offerings to become less competitive or obsolete;
aggressive price competition from competitors;
costs and expenditures in connection with litigation;
the timing of new product introductions by us and our competitors,products as well as customer order deferrals in anticipationthe likelihood of enhancements or new products;inventory obsolescence, loss of revenue and associated gross profit.
unanticipated delays in our receipt of patient records made through an intraoral scanner for any reason;
disruptions to our business due to political, economic or other social instability, including the impact of an epidemic any of which results in changes in consumer spending habits, consumers unable or unwilling to visit the orthodontist or general practitioners office, as well as any impact on workforce absenteeism;
inaccurate forecasting of net revenues, production and other operating costs,
investments in research and development to develop new products and enhancements;
changes in accounting standards, policies and estimates including changes made by our equity investee; and
our ability to successfully hedge against a portion of our foreign currency-denominated assets and liabilities.
To respond to these and other factors, weWe may need to make business decisions that could adversely affect our operating results such as modifications to our pricing policy,policies and payment terms, promotions, development efforts, product releases, business structure or operations. Most of our expenses, such as employee compensation
and lease payment obligations, are relatively fixed in the short term. Moreover, our expense levels are based, in part, on our expectations regardingfor future revenue levels.revenues. As a result, if our net revenues for a particular period fallare below our expectations, whether caused by changes in consumer spending, consumer preferences, weakness in the U.S. or global economies, changes in customer behavior related to advertising and prescribing our product or other factors, we may be unable to adjusttimely or effectively reduce spending quickly enough to offset any shortfall in net revenues. Due to these and other factors, we believe that quarter-to-quarter comparisons of our operating results may not be meaningful. You should not rely on our results for any one quarter as an indication of our future performance.
Our future success may depend on our ability to develop, successfully introduce and achieve market acceptance of new products.
Our future success may depend on our ability to develop, manufacture, market and obtain regulatory approval or clearance of new products. There can be no assurance that we will be able to successfully develop, sell and achieve market acceptance of these and other new products and applications and enhanced versions of our existing product or software. The extent of, and rate at which, market acceptance and penetration are achieved by future products is a function of many variables, which include, among other things, our ability to:
correctly identify customer needs and preferences and predict future needs and preferences;
include functionality and features that address customer requirements;
ensure compatibility of our computer operating systems and hardware configurations with those of our customers;
allocate our research and development funding to products with higher growth prospects;
anticipate and respond to our competitors’ development of new products and technological innovations;
differentiate our offerings from our competitors’ offerings;
innovate and develop new technologies and applications;
the availability of third-party reimbursement of procedures using our products;
obtain adequate intellectual property rights; and
encourage customers to adopt new technologies.
If we fail to accurately predict customer needs and preferences or fail to produce viable technologies, we may invest heavily in research and development of products that do not lead to significant revenue. Even if we successfully innovate and develop new products and produce enhancements, we may incur substantial costs in doing so and our profitability may suffer. In addition, even if our new products are successfully introduced, it is unlikely that they will rapidly gain market share and acceptance primarily due to the relatively long period of time it takes to successfully treat a patient with Invisalign. Since it takes approximately 12 to 24 months to treat a patient, our customers may be unwilling to rapidly adopt our new products until they successfully complete at least one case or until more historical clinical results are available.
Our ability to market and sell new products may also be subject to government regulation, including approval or clearance by the FDA and foreign government agencies. Any failure in our ability to successfully develop and introduce or achieve market acceptance of our new products or enhanced versions of existing products could have a material adverse effect on our operating results and could cause our net revenues to decline.shortfall.
A disruption in the operations of our primary freight carrier or higher shipping costs could cause a decline in our net revenues or a reduction in our earnings.
We are dependent on commercial freight carriers, primarily UPS,subject to deliver our products to our customers. If the operations of these carriers are disrupted for any reason, we may be unable to deliver our products to our customers on a timely basis. If we cannot deliver our products in an efficientoperating risks, including excess or constrained capacity and timely manner, our customers may reduce their orders from us and our net revenues and operating profits could materially decline. In a rising fuel cost environment, our freight costs will increase. If freight costs materially increase and we are unable to pass that increase along to our customers for any reason or otherwise offset such increases in our cost of net revenues, our gross margin and financial results could be adversely affected.
If we are unable to accurately predict our volume growth, and fail to hire a sufficient number of technicians in advance of such demand, the delivery time of our products could be delayedoperational inefficiencies, which could adversely affect our results of operations.
Treatment planning is a key step leading to our manufacturing process which relies on sophisticated computer technology requiring new technicians to undergo a relatively long training process. Training production technicians takes approximately 90 to 120 days. As a result, if we are unable to accurately predict our volume growth, we may not have a sufficient number of trained technicians to deliver our products within the time frame our customers expect. Such a delay could cause us to lose existing customers or fail to attract new customers. This could cause a decline in our net revenues and net income and could adversely affect our results of operations.
Our headquarters, digital dental modeling processes, and other manufacturing processes are principally located in regions thatWe are subject to earthquakesoperating risks, including excess or constrained capacity and other natural disasters.pressure on our internal systems, personnel and suppliers. To manage current and anticipated future operations effectively, we must continually implement and improve our operational, financial and management information systems, hire, train, motivate, manage and retain employees, and ensure our
Our digital dental modeling is primarily processed in
suppliers remain diverse and capable of meeting demand for the systems, raw materials, parts and components essential to the manufacture and delivery of our facility located in San Jose, Costa Rica. The operations team in Costa Rica creates ClinCheck treatment plans using sophisticated computer software. In addition, our customer facing operations are located in Costa Rica. Our aligner molds and finished aligners are fabricated in Juarez, Mexico. Both locations in Costa Rica and Mexico are in earthquake zones andproducts. We may be unable to balance near-term efforts to meet existing demand with future demand, including adding personnel, creating scalable, secure and robust systems and operations, and automating processes needed for long term efficiencies. Any such failure could have a material impact on our business, operations and prospects.
Additionally, we have established treatment planning and manufacturing facilities closer to our international customers to provide them with better experiences, improve their confidence using our products to treat patients, create efficiencies, and provide redundancy should other facilities be temporarily or permanently unavailable. Our ability to obtain and maintain regulatory clearance and certifications and equip facilities is subject to other natural disasters.significant risk and uncertainty. If therea facility is a major earthquaketemporarily or any other natural disaster in a region where one of these facilities is located,permanently, partially or fully shut down, or if demand for our products outpaces our ability to create ClinCheck treatment plans, respondhire qualified personnel and effectively implement systems and infrastructure, we may be unable to customer inquiriesfulfill orders timely, or manufactureat all, which may negatively impact our financial results, reputation and ship our aligners could be compromised which could result in our customers experiencing a significant delay in receiving their completed aligners and a decrease in service levels for a period of time. In addition, our corporate headquarters facility in California is located in the San Francisco Bay Area. An earthquake or other natural disaster in this region could result in a disruption in our operations. Any such business interruption could materially and adversely affect our business, financial condition and results of operations.overall business.
Our products and information technology systems are critical to our business. SystemIssues with product development or enhancements, IT system and software integration, implementation, updates and implementation issuesupgrades have previously and system security risks could again in the future disrupt our operations which couldand have a material adverse impact on our business, our reputation and operating results.
We rely on the efficient, uninterrupted and uninterruptedsecure operation of our own complex information technology systems.IT systems and are dependent on key third party software embedded in our products and IT systems as well as third-party hosted IT systems to support our operations. All information technologysoftware and IT systems are vulnerable to damage, cyber attacks or interruption from a variety of sources. As our business has grown in size and complexity, the growth has placed, and will continue to place, significant demands on our information technology systems. To effectively manage this growth,and improve our informationoperations, our IT systems and applications require an ongoing commitment of significant expenditures and resources to maintain, protect, upgrade, enhance and enhancerestore existing systems and develop new systems to keep pace with continuing changes in information processing technology, evolving industry and regulatory standards, increasingly sophisticated cyber threats, and changing customer preferences. We are in a multi-year, company-wide programExpanded remote working and increased usage of online and hosted technology platforms by us, our customers and suppliers, including teledentistry and new or expanded use of online service platforms, products and solutions such as video conferencing applications, doctor, consumer and patient apps have increased the demands on and risks to our IT systems and personnel. Moreover, we continue to transform certain business processes, or extend established processes which includes the transition to a new subsidiaries and/or implement additional functionality in our enterprise resource planning, ("ERP")product development, manufacturing, and other software system. We implemented the first phase of our ERP on July 1, 2016 and while we believe we are past any potential significant business disruption, we are still monitoring and troubleshooting potential issues. The implementation of additional functionality in the ERP systemIT systems which entails certain risks, including difficulties with changes in business processes that could disruptdisruption of our operations, such as our ability to develop and update products that are safe and secure, track orders and timely ship products, manage our supply chain and aggregate financial and operational data. Additionally, ifFailure to adequately protect and maintain the integrity of our products and IT systems may materially impact our financial position, results of operations and cash flows.
We have a complex, global iTero intraoral scanner installed base of older and newer models. These models are continually updated to add, expand or improve features with new hardware from us or third parties, or to provide repair or replacement parts. We have experienced hardware issues in the past and may in the future, including issues relating to manufacturing, design, quality, or safety, of which we arebecome aware only after products or changes have been introduced into the market. We also have not ablebeen and may be unable to accurately forecast expenses relatedensure that third party components or changes to the project, this maythem will be compatible with, or not have an adversea negative impact on the functionality of, our financial conditioniTero intraoral scanners. As a result, there have been and operating results.
Ifmay be widespread failures of our iTero intraoral scanners or we may experience epidemic failures of our iTero intraoral scanner to perform as anticipated. Previously, we have not been and in the information we rely uponfuture may not be prepared for, or have the infrastructure to, runtimely and adequately remediate or implement corrective measures for such failures, including due to our businesses weredependency on third party providers or suppliers. As a consequence, remediation has been and may be in the future time-consuming and difficult to be found to be inaccurate or unreliable, if we fail to properly maintainachieve, which may materially impact our information systemscustomers and data integrity, or if we fail to develop new capabilities to meet our business needspartners, damage our reputation and result in a timely manner, we could have operational disruptions, have customer disputes, lose our ability to produce timelylost business and accurate reports, have regulatory or other legal problems, have increases in operatingrevenue opportunities, and administrative expenses, lose existing customers, have difficulty in attracting new customers or in implementing our growth strategies, or suffer other adverse consequences. In addition, experienced computer programmers and hackers may be able to penetrate our network security or our cloud-based software servers hosted by third party and misappropriate our confidential information or that of third parties, create system disruptions or cause shutdowns. Furthermore, sophisticated hardware and operating system software and applications that we either internally develop or procure from third parties which we depend upon may contain defects in design and manufacture, including “bugs” and other problems that can unexpectedly interfere with the operation of the system. The costs to eliminate or alleviate security problems, viruses and bugs could be significant, and the efforts to address these problems could result in interruptions that may have a material adverse impact on our operations, net revenues and operating results.materially costly.
System upgrades and enhancements require significant expenditures and allocation of valuable employee resources. Delays in integration or disruptions to our business from implementation of these new or upgraded systems could have a material adverse impact on our financial condition and operating results.
Additionally, we continuously upgrade ourand issue new releases of customer facing software applications, specifically the ClinCheckupon which customer facing, manufacturing and MyAligntech software.treatment planning operations depend. Software applications and products containing software frequently contain errors or defects, especially when they are first introduced or when new versions are released. Additionally, the third-party software integrated into or interoperable with our products and services will routinely reach end of life, and as a consequence, certain models of our iTero intraoral scanners may be exposed to additional vulnerabilities, including increased security risks, errors and malfunctions that may be irreparable or difficult to repair. The discovery of a defect, or error or thesecurity vulnerability in our products, software applications or IT systems, incompatibility with thecustomers’ computer operating systemsystems and hardware configurations of customers inwith a new release or upgraded version or the failure of our products or primary informationIT systems may result in the followingcause adverse consequences, among others:including: delay or loss of revenue orrevenues, significant remediation costs, delay in market acceptance, loss of data, disclosure of financial, health or other personal information of our customers or their patients, product recalls, damage to our reputation, loss of market share or increased service costs, any of which could have a material adverse effect on our business, financial condition or results of our operations and the operations of our customers or our business partners.
A significant portion of our clear aligner production is dependent on digital scans from our globally dispersed and decentralized installed base of iTero and third-party intraoral scanners. Failures of all or any portion of ours or third-party software or other components or systems to interoperate with iTero or third-party scanners, termination of interoperability with third-party scanners, malware or ransomware attacks, product or system vulnerabilities or defects, interference or disruptions for us, our customers, labs or other business partners in the use of our products or the transmission or processing of data needed
for the use or ordering of our products, or a system outage for any reason have harmed our operations previously and in the future could affect materially and adversely our ability to accept scans, manufacture clear aligners or restorative procedures or treatments and services or otherwise service our customers which may, amongst other things, harm our sales, damage our reputation, adversely impact our strategic partners or result in litigation.
We are highly dependent on third-party suppliers, some of whom are sole source suppliers, for certain key machines, components and materials, and our business and operating results could be harmed if supply is restricted or ends, or if the price of raw materials used in our manufacturing process increases.
We are highly dependent on our supply chain, particularly manufacturers of specialized scanning equipment, rapid prototyping machines, resin and other advanced materials, as well as the optics, electronic and other mechanical components of our intraoral scanners. We maintain single supply relationships for many of these machines and materials such as our CT scanning and stereolithography equipment and resin and polymer used in clear aligner manufacturing. By using single suppliers in limited locations for materials and manufacturing, we are exposed to multiple supply chain vulnerabilities. For example, damage to or destruction of a facility can materially disrupt the delivery of key parts, components and materials or products or a supplier could encounter financial, operating or other difficulties, be unable to hire or maintain personnel, fail to timely obtain supplies, or fail to maintain manufacturing standards or controls. The occurrence of any of these may adversely impact our supply chain.
Because of our dependence on our suppliers, changes in key relationships can materially disrupt our supply chain. For instance, we may be unable to quickly establish or qualify replacement suppliers creating production interruptions, delays and inefficiencies. Finding substitute manufacturers may be expensive, time-consuming or impossible and could result in a significant interruption in the supply of one or more products causing us to lose revenues and suffer damage to our customer relationships. Technology changes by our service providers, vendors, and other third parties could disrupt access to required manufacturing capacity or require expensive, time-consuming development efforts to adapt and integrate new equipment or processes. In the event of technology changes, delivery delays, labor stoppages or shortages, or shortages of, or increases in price for these items, sales may decrease and our business and prospects may be harmed.
We use distributors for a portion of the importation, marketing and sales efforts related to our products and services, which exposes us to risks to our sales and operations and reputation, including the risk that these distributors do not comply with applicable laws or our internal procedures.
In addition to our direct sales force, we have and expect to continue to use distributors to import, market, sell, service and support our products. Our agreements with these distributors are generally non-exclusive and terminable by either party with little notice. If alternative distributors must be quickly found and trained in the use, marketing, sales and support of our products and services, our revenues and ability to sell or service our products in markets key to our business could be adversely affected. These distributors may also choose to sell alternative or competing products or services. In addition, we may be held responsible for the actions of these distributors and their employees and agents for compliance with laws and regulations, including fair competition, bribery and corruption, trade compliance, safety, data privacy and marketing and sales activities. The conduct of these distributors also reflects on us and our brand. If our distributors fail to satisfy customers, our reputation and brand loyalty could be harmed. A distributor may also affect our ability to effectively market our products in certain foreign countries or regulatory jurisdictions if it holds the regulatory authorization in such countries or within such regions and causes, by action or inaction, the suspension of such marketing authorization or sanctions for non-compliance or prevents us from taking control of any such authorization. It may be difficult, expensive, and time-consuming for us to re-establish market access or regulatory compliance.
A disruption in the operations of a primary freight carrier, higher shipping costs or shipping delays could disrupt our supply chain and impact our revenues or gross margin.
We are dependent on commercial freight carriers, primarily UPS, to deliver our products. If the operations of carriers are disrupted or if we fail to mitigate the impacts from freight carrier disruptions, we may be unable to timely deliver our products to our customers who may choose alternative products, causing our net revenues and gross margin to decline, possibly materially. Moreover, when fuel costs increase, our freight costs generally do so as well. In addition, we earn an increasingly larger portion of our total revenues from international sales, which carry higher shipping costs that could negatively impact our gross margin and results of operations. If freight costs materially increase and we are unable to successfully pass all or significant portions of the increases along to our customers, or we cannot otherwise offset such increases in our cost of net revenues, our gross margin and financial results could be materially affected.
Our success depends on our personnel. If we cannot attract, motivate, train or retain our personnel, it may be difficult to grow effectively and pursue our strategic priorities, materially effecting our results of operations.
We are highly dependent on the talent and efforts of our personnel, including highly skilled personnel like orthodontists and production technicians in our treatment planning facilities, and employees on our clinical engineering, technology development and sales teams. We strive to retain our personnel by providing competitive compensation and benefits, development opportunities and training, flexible work options, and an inclusive corporate culture. However, there is substantial competition in our industry for highly-skilled personnel, in particular significantly higher demand for technical and digital talent. Furthermore, our compensation and benefit arrangements, such as our equity award programs, may not successfully attract new employees and retain and motivate existing employees. In addition, other internal and external factors can impact our ability to hire and retain talent, including insufficient advancement or career opportunities and restrictive immigration policies. The loss of any of our key personnel, particularly executive management, key research and development personnel or key sales team personnel, could harm our business requiresand prospects and could impede the secure transmissionachievement of confidential information over public networks. Becauseour research and development, operational or strategic objectives.
We provide significant training to our personnel and our business will be harmed if our training fails to properly prepare them to perform the work required, we are unable to successfully instill technical expertise in new and existing personnel or if our techniques prove unsuccessful or are not cost-effective. Moreover, for certain roles, this training and experience can make key personnel, such as our sales personnel, highly desirable to competitors and lead to increased attrition. The loss of the confidential health informationservices and knowledge of our highly-skilled employees may significantly delay or prevent the achievement of our development and business objectives that may harm our business. For example, it can take up to twelve months or more to train sales representatives to successfully market and sell our products and for them to establish strong customer relationships.
Additionally, facilitating seamless leadership transitions for key positions is critical to sustaining the culture and maintaining our organizational success. If our succession planning efforts are ineffective, it could adversely impact our business. We continue to assess the key personnel we storebelieve essential to our long-term success. Moreover, future organizational changes could cause our employee attrition rate to increase. If we fail to effectively manage any organizational or strategic changes, our financial condition, results of operations, and transmit, security breachesreputation, as well as our ability to successfully attract, motivate and retain key employees, could expose usbe harmed.
We have adopted a hybrid work schedule in many of our offices, allowing employees the opportunity to collaborate and connect with others for several days each week while providing the option to work remotely other days. This hybrid work approach may materially increase our costs or create unforeseen challenges or complications, including:
•difficulties maintaining our corporate culture, disruption of morale or decreased loyalty;
•difficulties with hiring and retention, particularly if we must compete against other companies that offer generous or broad remote working policies or employees who prefer to work in offices or geographies different from where they were hired or are expected to work;
•negative impacts to collaboration, performance and productivity;
•increased stress, fatigue or “burn out” by employees unable to disengage their work life from home life;
•increased operational, governance, compliance, and tax risks;
•problems managing office space requirements;
•concerns regarding favoritism or discrimination;
•strains to our business continuity plans and difficulties achieving our strategic objectives; and
•increased labor and employment claims and litigation.
Also, we believe a riskkey to our success has been the culture we have created that emphasizes a shared vision and values focusing on agility, customer success and accountability. We believe this culture fosters an environment of regulatory action, litigation, possible liabilityintegrity, innovation, creativity, and loss.teamwork. We have experienced such breachesand may continue to experience in the pastfuture, difficulties attracting and retaining employees that meet the qualifications, experience, compliance mindset and values we expect. If we cannot attract and retain personnel that meet our selection criteria or relax our standards our corporate culture, ability to achieve our strategic objectives, and our security measurescompliance with obligations under our internal controls and other requirements may be inadequate to prevent security breaches, and our business operations and profitability would be adversely affected by, among other things, loss of customers and potential criminal and civil sanctions if they are not prevented.
There can be no assurance that our process of improving existing systems, developing new systems to support our expanding operations, integrating new systems, protecting confidential patient information, and improving service levels will not be delayed or that additional systems issues will not arise in the future. Failure to adequately protect and maintain the integrity of our information systems and data may result inharmed. This could have a material adverse effect on our financial position, results of operations and cash flows.our ability to maintain market share.
If the securityWe depend on our marketing activities to deepen our market penetration and raise awareness of our customerbrands and patientproducts, which may not prove successful or may become less effective or more costly to maintain in the long term.
Our marketing efforts and costs are significant and include national and regional campaigns in multiple countries involving television, print and social media and alliances with professional sports teams, social media influencers and other strategic partners. We design our advertising campaigns to increase brand awareness, adoption and goodwill; however, there is no assurance they will achieve the returns on advertising spend desired, increase brand or product awareness sufficiently or generate goodwill and positive reputational goals. Moreover, should any entity or individual endorsing us or our products take actions, make or publish statements in support of, or lend support to events or causes which may be perceived by a portion of
society negatively, our sponsorships or support of these entities or individuals may be questioned, our products boycotted, and our reputation harmed, any of which could have a material effect on our financial results and business overall.
In addition, various countries prohibit certain types of marketing activities. For example, some countries restrict direct to consumer advertising of medical devices. We have in the past and may again in the future be alleged to violate certain marketing restrictions and be ordered to stop certain marketing activities or prevented from selling our products. Moreover, competitors do not always follow these restrictions, creating an unfair advantage and making it more difficult and costly for us to compete.
Additionally, we rely heavily on data generated from our campaigns to target specific audiences and evaluate their effectiveness, particularly data generated from internet activities on mobile devices. To obtain this data, we are dependent on third parties and popular mobile operating systems, networks, technologies, products, and standards that we do not control, such as the Android and iOS operating systems and mobile browsers. Changes in such systems that degrade or eliminate our ability to target or measure the results of ads or increase costs to target audiences could adversely affect the effectiveness of our campaigns. For example, Apple has released mobile operating systems that include significant data privacy changes that may limit our ability to interpret, target and measure ads effectively.
Legal, Regulatory and Compliance Risks
We are subject to antitrust and competition regulations, litigation and enforcement that may result in fines, penalties, restrictions on our business practices, and product or operational changes which could materially impact our business.
We are and may in the future be subject to antitrust or competition related investigations, enforcement actions by governmental agencies, competitors, consumers, customers, and others which could cause us to incur substantial costs, enter into settlements, consents or be subject to judgments. Resolving these matters may require us to change our business practices in a manner materially adverse to our business. Governments and regulators are actively developing new competition laws and regulations aimed at the technology sector, artificial intelligence and digital platforms and coordinating their activities globally, including in large markets such as the EU, U.S., and China. Government regulatory actions and court decisions may result in fines or hinder our ability to provide certain benefits to our consumers, reducing the attractiveness of our products and the revenue derived from them. Other companies and government agencies have in the past and may in the future allege that our actions violate antitrust or competition laws or otherwise constitute unfair competition. Such claims and investigations, even if unfounded, may be expensive to defend, involve negative publicity, and divert management time and attention, any of which may materially impact our results of operations.
Obtaining approvals and complying with governmental regulations, particularly those related to personal healthcare and financial information, quality systems, anti-corruption and anti-bribery are expensive and time-consuming. Any failure to obtain or maintain approvals or comply with regulations regarding our products or services or those of our suppliers could materially harm our sales, result in substantial penalties and fines and cause harm to our reputation.
We and many of our healthcare provider customers, suppliers and distributors are subject to extensive and frequently changing regulations under numerous federal, state, local and foreign laws, including those regulating:
•the storage, transmission and disclosure of personal and medical information as well as healthcare records;
•prohibitions against the offer, payment or receipt of remuneration to induce referrals to entities providing healthcare services or goods or to induce the order, purchase or recommendation of our products; and
•the design, manufacture marketing and advertising of our products.
The healthcare and technology markets are also highly regulated and subject to changing political, economic and regulatory influences. Global regulators are expanding and changing regulations and guidance for products, which can limit the potential benefits of products and cause protracted review timelines for new products. As we continue to incorporate artificial intelligence, including machine learning and independent algorithms, into our software to make it more effective for us, our customers, suppliers and consumers, it subjects us to risks of compliance with the expanding and changing regulations regarding the use and scope of artificial intelligence. Our critical vendors and service providers are similarly subject to various regulations. Our failure or the failure of our suppliers, customers, advertisers and influencers to strictly adhere to clearances or approvals in the labeling, marketing and sales of our products and services could subject us to claims or litigation, including allegations of false or misleading advertising or violations of laws or regulations, which may result in costly investigations, fines, penalties, as well as material judgments, settlements or decrees. We are also subject to complex and changing environmental and health and safety regulations. Additionally, a large portion of our revenues are derived from international sales and we are dependent on our international operations, which exposes us to additional foreign regulations not otherwise described in these risk factors. There can be no assurance we can adequately address the business risks associated with the
implementation and compliance with such laws and our internal processes and procedures to comply with such laws or that we will be able to take advantage of any resulting business opportunities.
Furthermore, before we can sell a new medical device or market a new use of or claim for an existing product, we must frequently obtain clearance or approval to do so. For instance, in the U.S., FDA regulations are wide ranging and govern, among other things, product design, development, manufacturing and testing; product labeling and product storage. It takes significant time, effort and expense to obtain and maintain clearances and approvals of products and services, and there is compromised,no guarantee we will timely succeed, if at all, in the countries in which we do business. In other countries, the requirements, time, effort and expense to obtain and maintain clearances may differ materially from those of the FDA. Moreover, these laws may change, resulting in additional time and expense or loss of market access. If approvals to market our products or services are delayed, we may be unable to offer them in markets we deem important to our business. Additionally, failure to comply with applicable regulatory requirements could result in enforcement actions with sanctions including, among other things, fines, civil penalties and criminal prosecution. Delays or failures to obtain or maintain regulatory approvals or to comply with regulatory requirements may materially harm our domestic or international operations, and adversely impact our business.
We and certain of our vendors must also comply with and adhere to facility registration and product listing requirements for Quality System regulations. The FDA enforces its Quality System regulations through periodic unannounced inspections. Failure to satisfactorily correct an adverse inspection finding or to comply with applicable manufacturing regulations can result in enforcement actions, or we may be required to find alternative manufacturers, which could be a long and costly process and may cause reputational harm. Enforcement actions by regulators could have a material effect on our business.
We are also subject to anti-corruption and anti-bribery (“ABAC”) laws such as the Foreign Corrupt Practices Act ("FCPA") and the U.K. Bribery Act of 2010, which generally prohibit corrupt payments to foreign officials for the purpose of obtaining or maintaining business, securing an advantage and directing business to another. To comply with ABAC laws, regulators require we maintain accurate books and records and a system of internal accounting controls. Under the FCPA, we may be held liable for corruption by directors, officers, employees, agents, or other strategic or local partners or representatives.
In addition, while we have policies requiring compliance with applicable laws and regulations and we provide significant training to foster compliance, our employees, third parties acting on our behalf and customers may not properly adhere to our policies or applicable laws or regulations, including the use of certain electronic communications and maintaining accurate books and records. If our personnel or those of our agents or suppliers fail to comply with any laws, regulations, policies or procedures, or we fail to audit and enforce compliance, our reputation may be harmed, we may lose customers, revenues, or face regulatory investigations, actions and fines.
Security breaches, data breaches, cyber attacks, other cybersecurity incidents or the failure to comply with privacy, security and data protection laws could materially impact our operations, patient care could suffer, and we could be liable for related damages, and our reputation could be impaired.
We retain confidential customer and patient information in our processing centers. Therefore, it is critical that our facilities and infrastructure remain secure and that our facilities and infrastructure are perceived by the marketplace and our customers to be secure. Despite the implementation of security measures, we have experienced such breaches in the past and our infrastructure may be vulnerable to physical break-ins, computer viruses, programming errors, attacks by third parties or similar disruptive problems. If we fail to meet our customer and patient’s expectations regarding the security of healthcare information, we could be liable for damages, and our business, operations and reputation could be impaired.harmed.
We retain confidential customer personal and financial, patient health and our own proprietary information and data essential to our business operations. We rely on the effectiveness of our IT systems, our policies and contracts and policies of our vendors and the IT systems of our service providers and other third parties to safeguard the information and data. Additionally, our success is dependent on the success of healthcare providers, many of whom are individual or small operations with limited IT experience and inadequate or untested security protocols, to manage data privacy and security requirements. It is critical that the facilities, infrastructure and IT systems on which we depend and the products we develop remain secure and be perceived by the marketplace and our customers as secure. Despite the implementation of security features in our products and security measures in our IT systems, we and our service providers, vendors, and other third parties are targeted by or subject to physical break-ins, computer viruses and other malicious code, unauthorized or fraudulent access, programming errors or other technical malfunctions, hacking or phishing attacks, malware, ransomware, employee error or malfeasance, cyber attacks, and other breaches of IT systems or similar disruptive actions, including by organized groups and nation-state actors. For example, we have experienced, and may again experience in the future, cybersecurity incidents and unauthorized internal employee ex filtration of company information.
Further, the frequency and sophistication of third-party cyber-attacks is increasing. In 2022, to respond to potential increases in cyber-attacks due to the military conflict in Ukraine, we increased efforts to identify and respond to attacks, including placing our cybersecurity operations team on high alert. Significant service disruptions, breaches in our infrastructure and IT systems or other cybersecurity incidents could expose us to litigation or regulatory investigations, impair our reputation and competitive position, be distracting to management, and require significant time and resources to address. Affected parties or regulatory agencies could initiate legal or regulatory action against us, which could prevent us from resolving issues quickly or force us to resolve them in unanticipated ways, cause us to incur significant expense and damages, or result in orders forcing us to cease operations or modify our business practices in ways that could materially limit or restrict the capabilities of our products and services. Concerns over our privacy practices could adversely affect others’ perception of us and deter customers and patients from using our products. In addition, patient care could suffer, and we could be liable if our products or IT systems fail to timely deliver correct informationaccurate and complete information. We have internal monitoring and detection systems as well as
cybersecurity and other forms of insurance coverage related to a breach event. However, damages and claims arising from such incidents may not be covered or may exceed the amount of any coverage and do not cover the time and effort we incur investigating and responding to any incidents, which may be material.The costs to eliminate, mitigate or recover from security problems and cyber attacks and incidents could be material and depending on the nature and extent of the problem and the networks or products impacted, may result in network or systems interruptions, decreased product sales, or data loss that may have a material impact on our operations, net revenues and operating results.
Additionally, our globally-dispersed installed base of iTero intraoral scanners at customer, strategic business partner or other locations may be independently or collectively the target of cybersecurity incidents or attacks or subject to viruses, bugs, or other similar negative intruders. Due to the large and growing number of these decentralized devices, we may be unable to, or not have the capacity, knowledge, or infrastructure to, respond to or remedy a cybersecurity issue in a timely manner. manner, which may cause loss or damage to us or our customers or strategic business partners or may cause further malfunctions in, or damage to, our servers, databases, systems or products and services, loss or damage of our data, interruption or temporary cessation of our operations, or an overall negative impact to our business or reputation.
We are also subject to federal, state and foreign laws and regulations respecting the security and privacy of patient healthcare information applicable to healthcare providers and their business associates, such as HIPAA, as well as those relating to privacy, data security, content regulation, and consumer protection. We are subject to various national and regional data localization or data residency laws such as the EU General Data Protection Regulation and analogous laws in China which generally require certain types of data collected within a country be stored and processed only within that country or approved countries. Other countries are considering similar data localization or data residency laws. We have and likely will again in the future be required to implement new or expand existing data storage protocols, build new storage facilities, and/or devote additional resources to comply with such laws, any of which could be costly. We are also subject to data export restrictions and international transfer laws which prohibit or impose conditions upon the transfer of such data. These laws and regulations are constantly evolving and may be created, interpreted, applied, or amended in ways that adversely affect our business.
Our business exposes us to potential liability for the quality and safety of our products and services, how we advertise and market those products and services and how and to whom we sell them, and we may incur substantial expenses or be found liable for substantial damages or penalties if we are subject to claims or litigation.
Our products and services involve an inherent risk of claims concerning their design, materials, manufacture, safety and performance, how they are marketed and advertised in a complex framework of highly regulated domestic and international laws and regulations, how we package, bundle or sell them to individual customers or companies, including hospitals and clinics, and how we train and support doctors, their staffs and patients who use our products. Moreover, consumer products and services are routinely subject to claims of false, deceptive or misleading advertising, consumer fraud and unfair business practices. Additionally, we may be held liable if products we market and sell or services we offer or perform cause injury or are otherwise found unhealthy. If our products are safe but they are promoted for use or used in unintended or unexpected ways or for which we have not obtained clearance (“off-label” usage), we may be investigated, fined or have our products or services enjoined or approvals rescinded or we may be required to defend ourselves in litigation. Although we maintain insurance for product liability, business practices and other types of activities we make or offer, coverage may not protectbe available on acceptable terms, if at all, and may be insufficient for actual liabilities. Any claim for product liability, sales, advertising and business practices, regardless of its merit or eventual outcome, could result in material legal defense costs and damage our reputation, increase our expenses and divert management’s attention.
Increased focus on current and anticipated environmental, social and governance (“ESG”) laws and scrutiny of our ESG policies and practices may materially increase our costs, expose us to liability, adversely impact our reputation, employee retention, willingness of customers and suppliers to do business with us and willingness of investors to invest in us.
Our operations are subject to a variety of existing local, regional and global ESG laws and regulations, and we will likely be required to comply with new, broader, more complex and more costly laws and regulations that focus on ESG matters. Our compliance obligations will likely span all aspects of our business and operations, including product design and development, materials sourcing and other procurement activities, product packaging, product safety, energy and natural resources usage, facilities design and utilization, recycling and collection, transportation, disposal activities and workers’ rights.
Environmental regulations related to greenhouse gases are expected to have an increasingly larger impact on our or our suppliers’ energy sources. Many U.S. and foreign regulators have or are considering enacting new or additional disclosure requirements or limits on the emissions of greenhouse gases, including carbon dioxide and methane, from power generation units using fossil fuels. The effects of greenhouse gas emission limits on power generation are subject to significant uncertainties, including the timing of any new requirements, levels of emissions reductions and the scope and types of emissions regulated. These limits may increase our costs and those of our suppliers and could result in manufacturing, transportation and supply chain disruptions if clean energy alternatives are not readily available in adequate amounts when
required. Moreover, alternative energy sources, coupled with reduced investments in traditional energy production and infrastructure, may not provide predictable, reliable, and consistent energy that we, our suppliers and other businesses require.
Regulations related to the sourcing of certain metals may have an impact on our business. For instance, the sourcing and availability of metals used in the manufacture of, or contained in, our products may be affected by laws and regulations regarding the use of minerals obtained from certain regions of the world like the Democratic Republic of Congo and adjoining countries. Although we do not believe we source minerals from this risk.region, our expanding geographic operations may increase the risk of purchasing conflict minerals. Further, these laws and regulations may decrease the number of suppliers capable of supplying our needs for certain metals, thereby negatively affecting our ability to manufacture products in sufficient quantities at competitive prices, leading customers to potentially choose competitive goods and services.
Meeting our obligations under existing ESG laws, rules, or regulations is costly to us and our suppliers, and we expect those costs to increase, possibly materially. Additionally, we expect regulators to perform investigations, inspections and periodically audits of our compliance with these laws and regulations, and we cannot provide assurance that our efforts or operations will be compliant. If we fail to comply with any requirements, we could be subject to significant penalties or liabilities and we may be required to implement new and materially more costly processes and procedures to come into compliance. Further these laws are subject to unpredictable changes. Even if we successfully comply with these laws and regulations, our suppliers may not. We may also suffer financial and reputational harm if customers require, and we are unable to deliver, certification that our products are conflict free. In all of these situations, customers may stop purchasing products from us, and may take legal action against us, which could harm our reputation, revenues and results of operations.
Investor advocacy groups, institutional investors, investment funds, proxy advisory services, stockholders, and customers are also increasingly focused on corporate ESG practices. Additionally, public interest and legislative pressure related to companies’ ESG practices continues to grow. If our ESG practices fail to meet investor or other industry stakeholders' evolving and frequently evolving expectations and standards, including environmental stewardship, support for local communities, board of director and employee diversity, human capital management, employee health and safety practices, product quality, supply chain management, corporate governance and transparency and employing ESG strategies in our operations, our brand, reputation and employee retention may be harmed, customers and suppliers may be unwilling to do business with us and investors may be unwilling to invest in us. We also expect to incur additional costs and require additional resources to monitor, report, and comply with our various ESG practices. If we fail to adopt ESG standards or practices as quickly as stakeholders desire, report on our ESG efforts or practices accurately, or satisfy the disclosure and other expectations of stakeholders, our reputation, business, financial performance, growth, and stock price may be adversely impacted.
Intellectual Property Risks
Our success depends in part on our proprietary technology, and if we are unablefail to successfully obtain or enforce our intellectual propertyIP rights, our competitive position may be harmed. Litigating claims of this type is costly and could distract our management and cause a decline in our results of operations and stock price.
Our success will dependdepends in part on our ability to maintain existing intellectual propertyIP rights and to obtain and maintain further intellectual propertyIP protection for our products, both in the U.S. and in other countries.products. Our inability to do so could harm our competitive position. As of September 30, 2017, we had issued 454 U.S. patents, 447 foreign issued patents, and 402 pending global patent applications.
We intend to rely on our portfolio of issued and pending patent applications in the U.S. and in other countries to protect a large part of our intellectual propertyIP and our competitive position; however, these patents may be insufficient because our currently pending or future patent filings may not result in the issuance of patents. Additionally, any patents issued to us may be challenged, invalidated, held unenforceable, circumvented, or may not be sufficiently broad enough to prevent third parties from producing competing products similar in design to our products. In addition, any protection afforded byours and foreign patents protections may be more limited than that providedthose under U.S. patent and IP laws.
Additionally, any of our patent applications may not result in an issued patent or the scope of the patent ultimately issued may be narrower than initially sought. We may not be afforded the protection of a patent if our currently pending or future patent filings do not result in the issuance of patents or we fail to timely apply for patent protection. We may fail to apply for a patent if our personnel fail to disclose or recognize new patentable ideas or innovations. Remote working can decrease the opportunities for our personnel to collaborate, thereby reducing the opportunities for effective invention disclosures and intellectual property laws. patent application filings. We may choose not to file a foreign patent application if the limited protections provided by a foreign patent do not outweigh the costs to obtain it.
We also rely on protection ofprotect our IP through copyrights, trademarks, trade secrets, know-how and proprietary information.confidentiality obligations. We generally enter into confidentiality agreements with our employees, consultants and our collaborative partners upon commencement of a relationship with us; however,us. However, despite the existence of these protections, we have experienced incidents in which our proprietary information has been misappropriated and believe it will be misappropriated again in the future. If these agreements maydo not provide meaningful protection against the unauthorized use or disclosure of our trade secrets or other confidential information, and adequate remedies may not exist ifto prevent unauthorized useuses or disclosure were to occur. disclosures.
Our inability to maintain the proprietary nature of our technology through patents, copyrights or trade secrets would impair our competitive advantages and could have a material adverse effect on our operating results, financial condition and future
growth prospects. In particular, a failure to protect our proprietaryIP rights might allow competitors to copy our technology or create counterfeit or pirated versions of our products, which could adversely affect our reputation, pricing and market share. In addition,
Litigation regarding our IP rights, rights claimed by third parties, or IP litigation by any vendors on whose products or services we rely for our products and services may impact our ability to grow our business, adversely impact our results of operations and adversely impact our reputation.
Extensive litigation over IP rights is common in an effortmedical device, optical scanner, 3D printing and other technologies and industries on which our products and services are based. Litigation, interferences, oppositions, re-exams, inter partes reviews, post grant reviews or other proceedings have been necessary and will likely be needed in the future to protectdetermine the validity and scope of certain of our intellectual property weIP rights and those claimed by third parties. These proceedings are used to determine the validity, scope or non-infringement of certain patent rights pertinent to the manufacture, use or sale of our products and the products of competitors. We have been sued for infringement of third parties’ patents in the past been and are currently defending patent infringement lawsuits and other legal claims. In addition, we periodically receive letters from third parties drawing our attention to their IP rights and there may be other third-party IP rights of which we are presently unaware. Asserting or defending these proceedings can be unpredictable, protracted, time-consuming, expensive and distracting to management and technical personnel. Their outcomes may adversely affect the validity and scope of our IP rights, hinder our ability to manufacture and market our products, require us to seek licenses for infringing products or technologies or result in the futureassessment of significant monetary damages. Unfavorable rulings could include monetary damages, injunctions prohibiting us from selling our products, or exclusion orders preventing us from importing our products in one or more countries. Moreover, independent actions by competitors, customers or others have alleged that our efforts to enforce our IP rights constitute unfair competition or violations of antitrust laws and investigations and additional litigation based on the same or similar claims may be involvedbrought in litigation.the future. The potential effects on our business operations resulting from litigation, that we may participate in the future, whether or not ultimately determined in our favor or settled by us, are costly and divert the efforts and attention of our management and technical personnel from normal business operations.
Litigation, interferences, oppositions, inter partes reviews or other proceedings are, have been and may in the future be necessary in some instances to determine the validity and scope of certain of our proprietary rights, and in other instances to determine the validity, scope or non-infringement of certain patent rights claimed by third parties to be pertinent to the manufacture,
use or sale of our products. Litigation, interference, oppositions, inter partes reviews, administrative challenges or other similar types of proceedings are unpredictable and may be protracted, expensive and distracting to management. The outcome of such proceedings could adversely affect the validity and scope of our patent or other proprietary rights, hinder our ability to manufacture and market our products, require us to seek a license for the infringed product or technology or result in the assessment of significant monetary damages. An unfavorable ruling could include monetary damages or, in cases where injunctive relief is sought, an injunction prohibiting us from selling our products. Any of these results from our litigation could adverselymaterially affect our results of operations and stock price.reputation.
While
Financial, Tax and Accounting Risks
If our goodwill or long-lived assets become impaired, we believemay be required to record a material charge to earnings.
Under GAAP, we currentlyreview our goodwill and long-lived asset group for impairment when events or changes in circumstances indicate the carrying value may not be recoverable. Additionally, goodwill must be tested for impairment at least annually. The qualitative and quantitative analysis used to test goodwill are dependent upon various assumptions and reflect management’s best estimates. Changes in certain assumptions, including revenue growth rates, discount rates, earnings multiples and future cash flows may cause a change in circumstances indicating that the carrying value of goodwill or the asset group may be impaired and assessing these assumptions and predicting and forecasting future events can be difficult. Goodwill and purchased assets require periodic fair value assessments to determine if they have adequate internal control overbecome impaired. Consequently, we may be required to record a material charge to earnings in the financial reporting, westatements during the period in which any impairment of goodwill or long-lived asset group is determined.
Changes in, or interpretations of, accounting rules and regulations, could result in unfavorable accounting charges.
We prepare our consolidated financial statements in conformity with GAAP. These principles are subject to interpretation by the SEC and various bodies formed to interpret and create appropriate accounting policies. A change in these policies or in the way these policies are interpreted by us or regulators could materially effect our reported results and may even retroactively affect previously reported financial statements.
We are required to annually assess our internal control over financial reporting on an annual basis and any future adverse results from such assessment couldmay result in a loss of investor confidence in our financial reports and have an adverse effect onadversely affect our stock price.
Pursuant to the Sarbanes-Oxley Act of 2002 and the rules and regulations promulgated by the SEC, weWe are required to furnish in our Form 10-K a report by our management regarding the effectiveness of our internal control over financial reporting. The reportreporting that includes, among other things, an assessment of the effectiveness of our internal control over financial reporting as of the end of our fiscal year, including a statement as to whether or not our internal control over financial reportingit is effective. This assessment must include disclosure of any material weaknesses in ourOur internal control over financial reporting identified by management. While we believe our internal control over financial reporting is currently effective, the effectiveness of our internal controls in future periods is subject to the risk that our controls may become inadequate because of changes in conditions including our transitionpersonnel, updates and upgrades to or migration away from existing software, failure to maintain accurate books and records, changes in accounting standards or interpretations of further business operations into our ERP software system,existing standards, and, as a result, the degree of compliance of our internal control over financial reporting with the existing policies or procedures may become ineffective. Establishing, testing and maintaining an effective system of internal control over financial reporting requires significant resources and time commitments on the part of our management and our finance staff, may require additional staffing and infrastructure investments and would increaseincreases our costs of doing business. If we are unable to assert that our internal control over financial reporting is effective in any future period (or if our auditors are unable to express an opinion on the effectiveness of our internal controls or conclude that our internal controls are ineffective), the timely filing of our financial reports could be delayed or we could be required to restate past reports, and cause us to lose investor confidence in the accuracy and completeness of our financial reports in the future, which could have an adverse effect on our stock price.
If we lose our key personnel or are unable to attract and retain key personnel, we may be unable to pursue business opportunities or develop our products.
We are highly dependent on the key employees in our clinical engineering, technology development, sales, training and marketing personnel and management teams. The loss of the services provided by those individuals may significantly delay or prevent the achievement of our product development and other business objectives and could harm our business. Our future success will also depend on our ability to identify, recruit, train and retain additional qualified personnel, including orthodontists. Few orthodontists are accustomed to working in a manufacturing environment since they are generally trained to work in private practices, universities and other research institutions. Thus, we may be unable to attract and retain personnel with the advanced qualifications necessary for the further development of our business. Furthermore, we may not be successful in retaining our key personnel or their services. If we are unable to attract and retain key personnel, our business could be materially harmed.
If we infringe the patents or proprietary rights of other parties or are subject to a patent infringement claim, our ability to grow our business may be severely limited.
Extensive litigation over patents and other intellectual property rights is common in the medical device industry. We have been sued for infringement of third party’s patents in the past and we may be the subject of patent or other litigation in the future. From time to time, we have received and may in the future receive letters from third parties drawing our attention to their patent rights. While we do not believe that we infringe upon any valid and enforceable rights that have been brought to our attention, there may be other more pertinent rights of which we are presently unaware. The defense and prosecution of intellectual property suits, interference proceedings and related legal and administrative proceedings could result in substantial expense to us and significant diversion of effort by our technical and management personnel. An adverse determination of any litigation or interference proceeding to which we may become a party could subject us to significant liabilities. An adverse determination of this nature could also put our patents at risk of being invalidated or interpreted narrowly or require us to seek licenses from third parties. Licenses may not be available on commercially reasonable terms or at all, in which event, our business would be materially adversely affected.
We maintain single supply relationships for certain of our key machines and materials technologies, and our business and operating results could be harmed if supply is restricted or ends or the price of raw materials used in our manufacturing process increases.
We are highly dependent on manufacturers of specialized scanning equipment, rapid prototyping machines, resin and other advanced materials, as well as the optics, electronic and other mechanical components of our intraoral scanners. We maintain single supply relationships for many of these machines and materials technologies. In particular, our CT scanning and stereolithography equipment used in our aligner manufacturing and many of the critical components for the optics of our scanners are provided by single suppliers. We are also committed to purchasing the vast majority of our resin and polymer, the primary raw materials used in our manufacturing process for clear aligners, from a single source. If these or other suppliers encounter financial, operating or other difficulties or if our relationship with them changes, we might not be able to quickly establish or qualify replacement sources of supply and could face production interruptions, delays and inefficiencies. In addition, technology changes by our vendors could disrupt access to required manufacturing capacity or require expensive, time consuming development efforts to adapt and integrate new equipment or processes. Our growth may exceed the capacity of one or more of these manufacturers to produce the needed equipment and materials in sufficient quantities to support our growth. Conversely, in order to secure supplies for production of products, we sometimes enter into non-cancelable purchase commitments with vendors, which could impact our ability to adjust our inventory to reflect declining market demands. If demand for our products is less than we expect, we may experience additional excess and obsolete inventories and be forced to incur additional charges and our profitability may suffer. In the event of technology changes, delivery delays, or shortages of or increases in price for these items, our business and growth prospects may be harmed.
We depend on a single contract manufacturer and supplier of parts used in our iTero scanner and any disruption in this relationship may cause us to fail to meet the demands of our customers and damage our customer relationships.
We rely on a third party manufacturer to supply key sub-assemblies for our iTero Element scanner. As a result, if this third party manufacturer fails to deliver its components, if we lose its services or if we fail to negotiate acceptable terms, we may be unable to deliver our products in a timely manner and our business may be harmed. Any difficulties encountered by the third party manufacturer with respect to hiring personnel and maintaining acceptable manufacturing standards, controls, procedures and policies could disrupt our ability to deliver our products in a timely manner. Finding a substitute manufacturer may be expensive, time-consuming or impossible and could result in a significant interruption in the supply of our intraoral scanning products. Any failure by our contract manufacturer that results in delays in our fulfillment of customer orders may cause us to lose revenues and suffer damage to our customer relationships.
We primarily rely on our direct sales force to sell our products, and any failure to maintain our direct sales force could harm our business.
Our ability to sell our products and generate revenues primarily depends upon our direct sales force within our North American and international markets. We do not have any long-term employment contracts with the members of our direct sales force. The loss of the services provided by these key personnel may harm our business. If we are unable to retain our direct sales force personnel or replace them with individuals of equivalent technical expertise and qualifications, or if we are unable to successfully instill such technical expertise or if we fail to establish and maintain strong relationships with our customers within a relatively short period of time, our net revenues and our ability to maintain market share could be materially harmed. In addition, due to our large and fragmented customer base, we may not be able to provide all of our customers with product support immediately upon the launch of a new product. As a result, adoption of new products by our customers may be slower than anticipated and our ability to grow market share and increase our net revenues may be harmed.
If our distributor relationships are not successful, our ability to market and sell our products would be harmed and our financial performance will be adversely affected.
We depend on relationships with distributors for the marketing and sales of our products in various geographic regions, and we have a limited ability to influence their efforts. Relying on distributors for our sales and marketing could harm our business for various reasons, including:
agreements with distributors may terminate prematurely due to disagreements or may result in litigation between the partners;
we may not be able to renew existing distributor agreements on acceptable terms;
our distributors may not devote sufficient resources to the sale of products;
our distributors may be unsuccessful in marketing our products;
our existing relationships with distributors may preclude us from entering into additional future arrangements with other distributors; and
we may not be able to negotiate future distributor agreements on acceptable terms.
Complying with regulations enforced by the FDA and other regulatory authorities is an expensive and time-consuming process, and any failure to comply could result in substantial penalties.
Our products are considered medical devices and are subject to extensive regulation in the U.S. and internationally. FDA regulations are wide ranging and govern, among other things:
product design, development, manufacturing and testing;
product labeling;
product storage;
pre-market clearance or approval;
complaint handling and corrective actions;
advertising and promotion; and
product sales and distribution.
Our failure to comply with applicable regulatory requirements could result in enforcement action by the FDA or state agencies, which may include any of the following sanctions:
warning letters, fines, injunctions, consent decrees and civil penalties;
repair, replacement, refunds, recall or seizure of our products;
operating restrictions or partial suspension or total shutdown of production;
refusing our requests for 510(k) clearance or pre-market approval of new products, new intended uses, or modifications to existing products;
withdrawing clearance or pre-market approvals that have already been granted; and
criminal prosecution.
If any of these events were to occur, they could harm our business. We must comply with facility registration and product listing requirements of the FDA and adhere to applicable Quality System regulations. The FDA enforces its Quality System regulations through periodic unannounced inspections. Our failure to take satisfactory corrective action in response to an adverse inspection or the failure to comply with applicable manufacturing regulations could result in enforcement action, and we may be required to find alternative manufacturers, which could be a long and costly process. Any FDA enforcement action could have a material adverse effect on us.
Before we can sell a new medical device in the U.S., or market a new use of or claim for an existing product, we must obtain FDA clearance or approval unless an exemption applies. Obtaining regulatory clearances or approvals can be a lengthy and time-consuming process. Even though the devices we market have obtained the necessary clearances from the FDA, we may be unable to maintain such clearances in the future. Furthermore, we may be unable to obtain the necessary clearances for new devices that
we intend to market in the future. Our inability to maintain or obtain regulatory clearances or approvals could materially harm our business.
In addition, as part of the Dodd-Frank Wall Street Reform and Consumer Protection Act, the SEC adopted disclosure requirements regarding the use of certain minerals, known as conflict minerals, which are mined from the Democratic Republic of Congo and adjoining countries, as well as procedures regarding a manufacturer's efforts to identify and discourage the sourcing of such minerals and metals produced from those minerals. Additional reporting obligations are being proposed by the European Union. The U.S. requirements and any additional requirements in Europe could affect the sourcing and availability of metals used in the manufacture of a limited number of parts (if any) contained in our products. For example, these disclosure requirements may decrease the number of suppliers capable of supplying our needs for certain metals, thereby negatively affecting our ability to obtain products in sufficient quantities or at competitive prices. Our material sourcing is broad based and multi-tiered, and we may be unable to conclusively verify the origins for all metals used in our products. We may suffer financial and reputational harm if customers require, and we are unable to deliver, certification that our products are conflict free. Regardless, we will incur additional costs associated with compliance with these disclosure requirements, including time-consuming and costly efforts to determine the source of any conflict minerals used in our products.
If compliance with healthcare regulations becomes costly and difficult for our customers or for us, we may not be able to grow our business.
Participants in the healthcare industry are subject to extensive and frequently changing regulations under numerous laws administered by governmental entities at the federal, state and local levels, some of which are, and others of which may be, applicable to our business. In response to perceived increases in health care costs, Congress passed health care reform legislation that was signed into law in March 2010. This legislation contains many provisions designed to generate the revenues necessary to fund the coverage expansions. The most relevant of these provisions are those that impose fees or taxes on certain health-related industries, including medical device manufacturers.
Furthermore, our healthcare provider customers are also subject to a wide variety of laws and regulations that could affect the nature and scope of their relationships with us. The healthcare market itself is highly regulated and subject to changing political, economic and regulatory influences. Regulations implemented pursuant to the Health Insurance Portability and Accountability Act ("HIPAA"), including regulations affecting the security and privacy of patient healthcare information held by healthcare providers and their business associates may require us to make significant and unplanned enhancements of software applications or services, result in delays or cancellations of orders, or result in the revocation of endorsement of our products and services by healthcare participants. The effect of HIPAA and newly enforced regulations on our business is difficult to predict, and there can be no assurance that we will adequately address the business risks created by HIPAA and its implementation or that we will be able to take advantage of any resulting business opportunities.
Extensive and changing government regulation of the healthcare industry may be expensive to comply with and exposes us to the risk of substantial government penalties.
In addition to medical device laws and regulations, numerous state and federal healthcare-related laws regulate our business, covering areas such as:
storage, transmission and disclosure of medical information and healthcare records;
prohibitions against the offer, payment or receipt of remuneration to induce referrals to entities providing healthcare services or goods or to induce the order, purchase or recommendation of our products; and
the marketing and advertising of our products.
Complying with these laws and regulations could be expensive and time-consuming, and could increase our operating costs or reduce or eliminate certain of our sales and marketing activities or our revenues.
Our business exposes us to potential product liability claims, and we may incur substantial expenses if we are subject to product liability claims or litigation.
Medical devices involve an inherent risk of product liability claims and associated adverse publicity. We may be held liable if any product we develop or any product that uses or incorporates any of our technologies causes injury or is otherwise found unsuitable. Although we intend to continue to maintain product liability insurance, adequate insurance may not be available on acceptable terms, if at all, and may not provide adequate coverage against potential liabilities. A product liability claim, regardless
of its merit or eventual outcome, could result in significant legal defense costs. These costs would have the effect of increasing our expenses and diverting management’s attention away from the operation of our business, and could harm our business.
Historically, the market price for our common stock has been volatile.
The market price of our common stock could be subject to wide price fluctuations in response to various factors, many of which are beyond our control. The factors include:
quarterly variations in our results of operations and liquidity;
changes in recommendations by the investment community or in their estimates of our net revenues or operating results;
speculation in the press or investment community concerning our business and results of operations;
strategic actions by our competitors, such as product announcements or acquisitions;
announcements of technological innovations or new products by us, our customers or competitors; and
general economic market conditions.
In addition, the stock market, in general and the market for technology and medical device companies, in particular, have experienced extreme price and volume fluctuations that have often been unrelated to or disproportionate to the operating performance of those companies. These broad market and industry factors may seriously harm the market price of our common stock, regardless of our operating performance. Historically, class action litigation is often brought against an issuing company following periods of volatility in the market price of a company’s securities.
Future sales of significant amounts of our common stock may depress our stock price.
A large percentage of our outstanding common stock is currently owned by a small number of significant stockholders. These stockholders have sold in the past, and may sell in the future, large amounts of common stock over relatively short periods of time. Sales of substantial amounts of our common stock in the public market by our existing stockholders may adversely affect the market price of our common stock. Such sales could create public perception of difficulties or problems with our business and may depress our stock price.
We are subject to risks associated with our strategic investments. Impairments in the value of our investments and related loan could negatively impact our financial results.
We have invested in SmileDirectClub, LLC ("SDC") and other privately held companies for strategic reasons and to support key business initiatives, and we may not realize a return on our strategic investments. Many of such companies generate net losses and the market for their products, services or technologies may be slow to develop. Further, valuations of privately held companies are inherently complex due to the lack of readily available market data. If we determine that our investments and related loan in SDC or other privately held companies have experienced a decline in value, we may be required to record impairments, which could be material and could have an adverse impact on our financial results.
If our goodwill or long-lived assets become impaired, we may be required to record a significant charge to earnings.
Under Generally Accepted Accounting Principles in the United States (“U.S. GAAP”), we review our goodwill and long-lived asset group for impairment when events or changes in circumstances indicate the carrying value may not be recoverable. Additionally, goodwill is required to be tested for impairment at least annually. The qualitative and quantitative analysis used to test goodwill are dependent upon various assumptions and reflect management’s best estimates. Changes in certain assumptions including revenue growth rates, discount rates, earnings multiples and future cash flows may cause a change in circumstances indicating that the carrying value of goodwill or the asset group may be impaired. We may be required to record a significant charge to earnings in the financial statements during the period in which any impairment of goodwill or asset group are determined.
Changes in, or interpretations of, accounting rules and regulations, could result in unfavorable accounting charges.
We prepare our consolidated financial statements in conformity with U.S. GAAP. These principles are subject to interpretation by the SEC and various bodies formed to interpret and create appropriate accounting policies. A change in these policies can have a significant effect on our reported results and may even retroactively affect previously reported transactions. Our accounting policies that recently have been, or may be affected by changes in the accounting rules relate to stock-based compensation, revenue recognition and leases.
If we fail to manage our exposure to global financial and securities market riskrisks successfully, our operating results and financial statements could be materially impacted.
The primary objective of our investment activities is to preserve principal. To achieve this objective, aA majority of our marketable investments are investment grade, liquid, fixed-income securities and money market instruments denominated in U.S. dollars. If the carrying value of our investmentsan investment exceeds the fair value, and the decline in fair value is deemed to be other-than-temporary, we will beare required to write down the value of our investments,the investment, which could materially harm our results of operations and financial condition. Moreover, the performance of certain securities in our investment portfolio correlates with the credit condition of the U.S. financial sector. In an unstable credit or economic environment, it is necessary to assess the value of our investments more frequently and we might incur significantmaterial realized, unrealized or impairment losses associated with these investments.
On July 1, 2016, we changed our corporate structure; however, if we are unable Additionally, bank failures could cause or continue to maintain this structure or if it is challenged by U.S. or foreign tax authorities, we may be unable to realize tax savings which could materially and adversely affect our operating results.
We implemented a new international corporate structure on July 1, 2016. This corporate structure may reduce our overall effective tax rate over time through changescause volatility in the structurecredit or capital markets, market-wide liquidity issues, bank-runs and general concern across the global financial industry. These conditions could limit our access to capital or impair the value of our international procurement and sales operations, as well as realignment of the ownership and use of intellectual property among our wholly-owned subsidiaries.assets we hold.
The structure includes legal entities located in jurisdictions with income tax rates lower than the U.S. federal statutory tax rate. Such intercompany arrangements would be designed to result in income earned by such entities in accordance with arm’s-length principles and commensurate with functions performed, risks assumed and ownership of valuable corporate assets. We believe that income taxed in certain foreign jurisdictions at a lower rate relative to the U.S. federal statutory rate will have a beneficial impact on our worldwide effective tax rate over the medium to long term.
If the structure is challenged by U.S. or foreign tax authorities, if changes in domestic and international tax laws negatively impact the structure, including proposed legislation to reform U.S. taxation of international business activities, or if we do not operate our business in a manner consistent with the structure and applicable regulatory provisions, we may fail to achieve the financial and operational efficiencies that we anticipate as a result of the structure, and our business, financial condition and operating results may be materially and adversely affected.
Our effective tax rate may vary significantly from period to period.
Align operates globally and is subject to taxes in the U.S. and foreign countries. Various internal and external factors may have favorable or unfavorable effects onaffect our future effective tax rate. These factors include but are not limited to,changes in the global economic environment, changes in our legal entity structure or activities performed within our entities, changes in our business operations, changes in tax laws, regulations and/or rates, new or changes to existing accounting pronouncements, non-deductible goodwill impairments, changing interpretations of existing tax laws or regulations, changes in the relative proportions of revenues and income before taxes in the various jurisdictions in which we operate that have differing statutory tax rates, changes in overall levels of pretax earnings, the future levels of tax benefits of stock-based compensation, settlement of income tax audits and changes in overall levels of pretax earnings. With the adoption of ASU 2016-09, we also anticipate our first quarternon-deductible goodwill impairments.
Our effective tax rate is also dependent in part on forecasts of full year results which can vary materially. Furthermore, we may continue to vary significantly dueexperience significant variation in our effective tax rate related to excess tax benefits on stock-based compensation, particularly in the timingfirst quarter of each year when the majority of our equity compensation vests each year. Other quarters can also be impacted depending onawards vest.
New tax laws and practices, changes to existing tax laws and practices, or disputes regarding the timing of equity vests. Our subsidiary in Israel is under audit by the localpositions we take regarding tax authoritieslaws, could negatively affect our provision for calendar years 2006 through 2013.income taxes as well as our ongoing operations.
In addition,Compliance with tax laws requires significant judgment concerning our tax rate may be impacted by tax holidays or incentives. In June 2017, the Costa Rica Ministry of Foreign Trade, an agency of the Government of Costa Rica, granted an extension of certain income tax incentivesworldwide provision for an additional twelve year period, which was originally granted in 2002 and was set to expire in June 2017. Under these incentives, all of the income in Costa Rica during these twelve year incentive periods is subject to a reduced tax rate. In order to receive the benefit of these incentives, we must hire specified numbers of employees and maintain certain minimum levels of fixed asset investment in Costa Rica. If we do not fulfill these conditions for any reason, our incentive could lapse, and our income in Costa Rica would be subject to taxation at higher rates, which could have a negative impact on our operating results. The Costa Rica corporate income tax rate that would apply, absent the incentives, is 30% for 2017 and 2016. For the three and nine months ended September 30, 2017, the new corporate structure implemented on July 1, 2016 had a minimal impact on income taxes. For the three and nine months ended September 30, 2016, income taxes were reduced by $0.3 million with minimal impact to diluted net income per share and $17.5 million representing a benefit to diluted net income per share of $0.21, respectively.
Changes in tax laws or changes to how those laws are applied to our business in practice, could affect the amount of tax rulings could negatively impact our income tax provision and net income.
As a U.S. multinational corporation,to which we are subject to changing tax laws both within and outside of the U.S. Changes in tax laws or tax rulings, or changes in interpretations of existing tax laws, could affect our income tax provision and net income or require us to change the manner in which we operate our business. Many countries in Europe, as well as a number of other countries and organizations, have recently proposed or recommended changes to existing tax laws or have enacted new laws. For example,operate. Additionally, the Organization for Economic Cooperation and Development ("OECD"Development’s (“OECD”) has been working on a "BaseBase Erosion and Profit Shifting Project," which is focused on a number of issues, including the shifting of profits between affiliated entities(“BEPS”) project has resulted in different tax jurisdictions.considerable new reporting obligations worldwide. The OECD issued in 2015,continues to publish guidance pursuant to the BEPS and is expected to continue to issue, guidelines and proposals thatother projects which, if adopted by member countries, may change various aspects of the existing framework under whichaffect our tax obligations are determinedpositions in many of the countries in which we do business.
Moreover, the application of indirect taxes (such as sales and use tax (“SUT”), value-added tax (“VAT”), goods and services tax (“GST”), and other indirect taxes) to our operations is complex and evolving. U.S. states, local and foreign taxing jurisdictions have differing rules and regulations governing differing types of taxes, and these rules and regulations are subject to varying interpretations and exemptions that may change over time. We collect and remit SUT, VAT, GST and other taxes in many jurisdictions and we are routinely subject to audits. We are also routinely audited regarding our tax reporting and remissions by local and national governments, and may also be subject to audits in jurisdictions for which we have not accrued tax liabilities. The positions we take regarding taxes as well as the amounts we collect or remit may be challenged and we may be liable for failing to collect or remit all or any portion of taxes deemed owed or the taxes could exceed our estimates. One or more U.S. states or countries may seek to impose incremental or new sales, use, or other tax collection obligations on us or may determine that such taxes should have but have not been paid by us. If we dispute rulings or positions taken by tax authorities, we may incur expenses and expend significant time and effort to defend our positions, which may be costly.
The application of existing and new tax laws, and the results of audits could harm our business. Furthermore, there have been and will continue to be substantial ongoing costs associated with complying with the various tax requirements and defending our positions in the numerous markets in which we conduct or will conduct business.
Historically, the market price for our common stock has been volatile.
The market price of our common stock is subject to rapid and large price fluctuations attributable to various factors, many of which are beyond our control. The factors include:
•quarterly variations in our results of operations and liquidity or changes in our forecasts and guidance;
•our ability to regain or sustain our historical growth rates;
•changes in recommendations by the investment community or speculation in the press or investment community regarding estimates of our net revenues, operating results or other performance indicators;
•announcements by us or our competitors or new market entrants, including strategic actions, management changes, and material transactions or acquisitions;
•technical factors in the public trading markets for our stock that may produce price movements inconsistent with macro, industry or company-specific fundamentals, including the sentiment of retail investors (as it may be expressed on financial trading and other social media sites), the amount and status of short interest in our securities, access to margin debt, trading in options and other derivatives on our common stock, fractional share trading, and other technical trading factors or strategies;
•announcements regarding stock repurchases, sales or purchases of our common stock by us, our officers or directors, credit agreements and debt issuances;
•announcements of technological innovations, new, additional or revised programs, business models, products or product offerings by us, our customers or competitors;
•key decisions in pending litigation, new litigation, settlements, judgments or decrees; and
•general economic market conditions, including rising interest rates, inflationary pressures, recessions, consumer sentiment and demand, global political conflict and industry factors unrelated to our actual performance.
In addition, the currentstock market in general, and the market for technology and medical device companies, in particular, have experienced extreme price and volume fluctuations often unrelated to or disproportionate to corporate operating performance. These broad market and industry factors may include market expectations of, or actual changes in, monetary policies that have the goal of easing or tightening interest rates such as the U.S. administrationfederal funds rate and key membersausterity measures of Congressgovernments intended to control budget deficits. Historically, securities litigation, including securities class action lawsuits and securities derivative lawsuits, is often brought against an issuer following periods of volatility in the market price of its securities and we have made public statements indicatingnot been exempt from such litigation.
We cannot guarantee that we will continue to repurchase our common stock in the future, and any repurchases that we may make may not achieve our desired objectives.
We have a history of recurring stock repurchase programs intended to return capital to our investors. Future stock repurchase programs are contingent on a variety of factors, including our financial condition, results of operations, business requirements, and our Board of Directors' continuing determination that stock repurchases are in the best interests of our stockholders and in compliance with all applicable laws and agreements. There is no assurance that we will continue repurchasing our common stock in the future at historical levels or at all, or that our stock repurchase programs will beneficially impact our stock price. Additionally, effective January 1, 2023, the IRA imposes a 1% excise tax reformon our stock repurchases, which will increase our tax liabilities and the cost to retire stock and may impact if and how much stock we choose to repurchase in the future.
Future sales of significant amounts of our common stock may depress our stock price.
A significant percentage of our outstanding common stock is currently owned by a priority. Certain changes to U.S. tax laws, including limitations onsmall number of stockholders. These stockholders have sold in the ability to defer U.S. taxation on earnings outsidepast, and may sell in the future, large amounts of the United States until those earnings are repatriated to the United States, couldour stock over relatively short periods of time. Sales of substantial amounts of our stock by existing stockholders may adversely affect the tax treatmentmarket price of our foreign earnings.stock by creating the perception of difficulties or problems with our business that may depress our stock price.
Item 2. Unregistered Sales of Equity Securities and Use of Proceeds.
ITEM 2.UNREGISTERED SALES OF EQUITY SECURITIES AND USE OF PROCEEDSUnregistered Sales of Equity Securities
Following is a summaryNone
Purchases of Equity Securities by the Issuer and Affiliated Purchasers
The following table summarizes the stock repurchasesrepurchase activity for the three months ended September 30, 2017:March 31, 2023:
| | | | | | | | | | | | | | | | | | | | | | | | | | |
| Period | | Total Number of Shares Purchased | | Average Price Paid per Share | | Total Number of Shares Purchased as Part of Publicly Announced Programs | | Approximate Dollar Value of Shares that May Yet Be Purchased Under the Programs(1)(2) |
January 1, 2023 through January 31, 2023 | | — | | | $ | — | | | — | | | $ | 290,000,067 | |
| February 1, 2023 through February 28, 2023 | | 719,368 | | | $ | 333.63 | | | 719,368 | | | $ | 50,000,148 | |
| March 1, 2023 through March 31, 2023 | | 222,988 | | | $ | 224.23 | | | 222,988 | | | $ | — | |
| Total | | 942,356 | | | | | 942,356 | | | |
|
| | | | | | | | | | | | | | |
| Period | | Total Number of Shares Repurchased | | Average Price Paid per Share | | Total Number of Shares Repurchased as Part of Publicly Announced Program | | Approximate Dollar Value of Shares that May Yet Be Repurchased Under the Programs (1) |
| July 1, 2017 through July 31, 2017 | | — |
| | $ | — |
| | — |
| | $ | 250,000,000 |
|
| August 1, 2017 through August 31, 2017 | | 80,387 |
| | $ | 186.60 |
| | 80,387 |
| | $ | 250,000,000 |
|
| September 1, 2017 through September 30, 2017 | | — |
| | $ | — |
| | — |
| | $ | 250,000,000 |
|
(1)1 May 2021 Repurchase Program. On April 28, 2016,May 13, 2021, we announced that our Board of Directors had authorized a plan to repurchase up to $300.0 million$1.0 billion of our stock under our April 2016common stock. See Note 9 “Common Stock Repurchase Programs” of the Notes to Consolidated Financial Statements for details on the May 2021 Repurchase Program.
2 January 2023 Repurchase Program. On May 2, 2017,February 1, 2023, we entered into an accelerated share repurchase ("ASR")announced that our Board of Directors had authorized a plan to repurchase $50.0 millionup to $1.0 billion of our common stock ("2017 ASR"January 2023 Repurchase Program")., none of which had been utilized as of March 31, 2023. The 2017 ASR was completed on August 3, 2017. The final number of shares repurchased was based on our volume-weighted average stock price during the termrepurchase program does not have an expiration date. See Note 9 “Common Stock Repurchase Programs” of the transaction, less an agreed upon discount. We received a total of approximately 0.4 million shares at a weighted average share price of $146.48 under the 2017 ASR. All repurchased shares were retired. As of September 30, 2017, we have $250.0 million remaining under the April 2016 Repurchase Plan.Notes to Consolidated Financial Statements for additional details.
ITEM
Item 3.DEFAULTS UPON SENIOR SECURITIES Defaults Upon Senior Securities.
Not applicable.
ITEMItem 4.MINE SAFETY DISCLOSURES Mine Safety Disclosures.
Not applicable.
ITEMItem 5. OTHER INFORMATIONOther Information.
None
ITEM
Item 6. EXHIBITSExhibits.
(a) Exhibits: | | | | | | | | | | | | | | | | | | | | | | | | | | | | | | | | |
Exhibit Number | | Description | | Filing | | Date | | Exhibit Number | | Filed
herewith |
| | | | S-1, as amended (File No. 333-49932) | | 12/28/2000 | | 3.1 | | |
| | | | 8-K | | 5/20/2016 | | 3.01 | | |
| | | | | | | | | | |
| | | | 8-K | | 3/01/2023 | | 3.1 | | |
| | | | | | | | | | * |
| | | | | | | | | | * |
| | | | | | | | | | * |
| | | | | | | | | | * |
| | | | | | | | | | * |
| | | | | | | | | | * |
| | | | | | | | | | * |
| | | | | | | | | | * |
| | | | | | | | | | * |
| | | | | | | | | | * |
| 101.INS | | Inline XBRL Instance Document (the instance document does not appear in the Interactive Data File because its XBRL tags are embedded within the Inline XBRL document). | | | | | | | | * |
| 101.SCH | | Inline XBRL Taxonomy Extension Schema Document | | | | | | | | * |
| 101.CAL | | Inline XBRL Taxonomy Extension Calculation Linkbase Document | | | | | | | | * |
| 101.DEF | | Inline XBRL Taxonomy Extension Definition Linkbase Document | | | | | | | | * |
| 101.LAB | | Inline XBRL Taxonomy Extension Label Linkbase Document | | | | | | | | * |
| 101.PRE | | Inline XBRL Taxonomy Extension Presentation Linkbase Document | | | | | | | | * |
| 104 | | Cover Page Interactive Data File (formatted as inline XBRL and contained in Exhibit 101) | | | | | | | | * |
|
| | | | | | | | | | | |
Exhibit Number | | Description | | Filing | | Date | | Exhibit Number | | Filed here with |
| 10.1 | | Purchase and Sale Agreement dated July 24, 2017 between Align Technology de Costa Rica, S.R.L. and Belan Business Center, S.A. | | Form 8-K | | 7/27/2017 | | 10.1 |
| | |
| 10.2 | | Membership Interest Purchase Agreement dated July 24, 2017 between Align Technology, Inc. and SmileDirectClub, LLC. | | Form 8-K | | 7/27/2017 | | 10.2 |
| | |
| 10.3 | | First Amendment to Loan and Security Agreement dated July 24, 2017 between Align Technology, Inc. and SmileDirectClub, LLC. | | Form 8-K | | 7/27/2017 | | 10.3 |
| | |
| 10.4 | | Sixth Amendment to Credit Agreement dated July 24, 2017 between Align Technology, Inc. and Wells Fargo Bank, National Association | | Form 8-K | | 7/27/2017 | | 10.4 |
| | |
| 31.1 | | Certification of Chief Executive Officer pursuant to 18 U.S.C. Section 1350, as adopted pursuant to Section 302 of the Sarbanes-Oxley Act of 2002. | | | | | | | | * |
| 31.2 | | Certification of Chief Financial Officer pursuant to 18 U.S.C. Section 1350, as adopted pursuant to Section 302 of the Sarbanes-Oxley Act of 2002. | | | | | | | | * |
| 32.1 | | Certification pursuant to 18 U.S.C. Section 1350, as adopted pursuant to Section 906 of the Sarbanes-Oxley Act of 2002. | | | | | | | | * |
| 101.INS | | XBRL Instance Document | | | | | | | | * |
| 101.SCH | | XBRL Taxonomy Extension Schema Document | | | | | | | | * |
| 101.CAL | | XBRL Taxonomy Extension Calculation Linkbase Document | | | | | | | | * |
| 101.DEF | | XBRL Taxonomy Extension Definition Linkbase Document | | | | | | | | * |
| 101.LAB | | XBRL Taxonomy Extension Label Linkbase Document | | | | | | | | * |
| 101.PRE | | XBRL Taxonomy Extension Presentation Linkbase Document | | | | | | | | * |
SIGNATURES
Pursuant to the requirements of the Securities Exchange Act of 1934, as amended, the registrant has duly caused this report to be signed on its behalf by the undersigned thereunto duly authorized.
| | | | | | | | |
| | |
| | |
| ALIGN TECHNOLOGY, INC. |
| | |
November 2, 2017May 5, 2023 | By: | /s/ JOSEPH M. HOGAN |
| | Joseph M. Hogan President and Chief Executive Officer |
| | |
| May 5, 2023 | By: | /s/ JOHN F. MORICI |
| | John F. Morici
Chief Financial Officer
and Executive Vice President, Global Finance |
EXHIBIT INDEX
|
| | | | | | | | | | | |
Exhibit Number | | Description | | Filing | | Date | | Exhibit Number | | Filed here with |
| | | | Form 8-K | | 7/27/2017 | | 10.1 |
| | |
| | | | Form 8-K | | 7/27/2017 | | 10.2 |
| | |
| | | | Form 8-K | | 7/27/2017 | | 10.3 |
| | |
| | | | Form 8-K | | 7/27/2017 | | 10.4 |
| | |
| | | | | | | | | | * |
| | | | | | | | | | * |
| | | | | | | | | | * |
| 101.INS | | XBRL Instance Document | | | | | | | | * |
| 101.SCH | | XBRL Taxonomy Extension Schema Document | | | | | | | | * |
| 101.CAL | | XBRL Taxonomy Extension Calculation Linkbase Document | | | | | | | | * |
| 101.DEF | | XBRL Taxonomy Extension Definition Linkbase Document | | | | | | | | * |
| 101.LAB | | XBRL Taxonomy Extension Label Linkbase Document | | | | | | | | * |
| 101.PRE | | XBRL Taxonomy Extension Presentation Linkbase Document | | | | | | | | * |