Table of Contents
UNITED STATES
SECURITIES AND EXCHANGE COMMISSION
Washington, D.C. 20549
FORM 10-Q
x Quarterly report pursuant to Section 13 or 15(d) of the Securities Exchange Act of 1934
For the quarterly period ended March 31,June 30, 2013
or
o Transition report pursuant to Section 13 or 15(d) of the Securities Exchange Act of 1934
For the transition period from to
Commission file number 001-34856
THE HOWARD HUGHES CORPORATION
(Exact name of registrant as specified in its charter)
Delaware |
| 36-4673192 |
(State or other jurisdiction of | | (I.R.S. employer |
incorporation or organization) | | identification number) |
13355 Noel Road, 22nd Floor, Dallas, Texas 75240
(Address of principal executive offices, including zip code)
(214) 741-7744
(Registrant’s telephone number, including area code)
N / A
(Former name, former address and former fiscal year, if changed since last report)
Indicate by check mark whether the registrant: (1) has filed all reports required to be filed by Section 13 or 15(d) of the Securities Exchange Act of 1934 during the preceding 12 months (or for such shorter period that the registrant was required to file such reports), and (2) has been subject to such filing requirements for the past 90 days. xYes o No
Indicate by check mark whether the registrant has submitted electronically and posted on its corporate Web site, if any, every Interactive Data File required to be submitted and posted pursuant to Rule 405 of Regulation S-T (§232.405 of this chapter) during the preceding 12 months (or for such shorter period that the registrant was required to submit and post such files). xYes o No
Indicate by check mark whether the registrant is a large accelerated filer, an accelerated filer, a non-accelerated filer, or a smaller reporting company. See the definitions of “large accelerated filer,” “accelerated filer” and “smaller reporting company” in Rule 12b-2 of the Exchange Act.
Large accelerated filer x | | Accelerated filer o |
| | |
Non-accelerated filer o | | Smaller reporting company o |
(Do not check if a smaller reporting company) | | |
Indicate by check mark whether the registrant is a shell company (as defined in Rule 12b-2 of the Exchange Act). o Yes x No
The number of shares of common stock, $0.01 par value, outstanding as of MayAugust 5, 2013 was 39,498,912.39,576,344.
Table of Contents
THE HOWARD HUGHES CORPORATION
INDEX
| | PAGE |
|
| NUMBER |
| | |
| | |
PART I | FINANCIAL INFORMATION | | |
| Item 1: Condensed Consolidated Financial Statements (Unaudited) | | |
| | | | |
| | Condensed Consolidated Balance Sheets
as of March 31,June 30, 2013 and December 31, 2012 | | 3 |
| | | | |
| | Condensed Consolidated Statements of Operations
for the three and six months ended March 31,June 30, 2013 and 2012 | | 4 |
| | | | |
| | Condensed Consolidated Statements of Comprehensive Income (Loss)
for the three and six months ended March 31,June 30, 2013 and 2012 | | 5 |
| | | | |
| | Condensed Consolidated Statements of Equity
for the threesix months ended March 31,June 30, 2013 and 2012 | | 6 |
| | | | |
| | Condensed Consolidated Statements of Cash Flows
for the threesix months ended March 31,June 30, 2013 and 2012 | | 7 |
| | | | |
| | Notes to Condensed Consolidated Financial Statements | 8
| 9 |
| | | | |
| Item 2: Management’s Discussion and Analysis of Financial Condition and Results of Operations | 30
| 33 |
| | | | |
| Item 3: Quantitative and Qualitative Disclosures about Market Risk | 52
| 56 |
| | | | |
| Item 4: Controls and Procedures | 52
| 57 |
| | | | |
PART II | OTHER INFORMATION |
|
| | | |
| Item 1: Legal Proceedings | 5257
|
| | | | |
| Item 1A: Risk Factors | 5357
|
| | | | |
| Item 6: Exhibits | 53
| 57 |
| | | | |
| SIGNATURE | 54
| 58 |
| | | | |
| EXHIBIT INDEX | 55
| 59 |
| | | | | |
2
Table of Contents
THE HOWARD HUGHES CORPORATION
CONDENSED CONSOLIDATED BALANCE SHEETS
UNAUDITED
| | March 31, | | December 31, | | | June 30, | | December 31, | |
| | 2013 | | 2012 | | | 2013 | | 2012 | |
| | (In thousands, except share amounts) | | | (In thousands, except share amounts) | |
Assets: | | | | | | | | | | |
Investment in real estate: | | | | | | | | | | |
Master Planned Community assets | | $ | 1,561,668 | | $ | 1,563,122 | | | $ | 1,562,745 | | $ | 1,563,122 | |
Land | | 252,593 | | 252,593 | | | 253,341 | | 252,593 | |
Buildings and equipment | | 660,412 | | 657,268 | | | 719,111 | | 657,268 | |
Less: accumulated depreciation | | (117,972 | ) | (112,491 | ) | | (123,794 | ) | (112,491 | ) |
Developments | | 326,866 | | 273,613 | | | 307,434 | | 273,613 | |
Net property and equipment | | 2,683,567 | | 2,634,105 | | | 2,718,837 | | 2,634,105 | |
Investment in Real Estate Affiliates | | 33,646 | | 32,179 | | | 56,732 | | 32,179 | |
Net investment in real estate | | 2,717,213 | | 2,666,284 | | | 2,775,569 | | 2,666,284 | |
Cash and cash equivalents | | 200,536 | | 229,197 | | | 213,196 | | 229,197 | |
Accounts receivable, net | | 16,640 | | 13,905 | | | 18,667 | | 13,905 | |
Municipal Utility District receivables, net | | 102,166 | | 89,720 | | | 116,982 | | 89,720 | |
Notes receivable, net | | 26,272 | | 27,953 | | | 22,976 | | 27,953 | |
Tax indemnity receivable, including interest | | 319,617 | | 319,622 | | | 313,925 | | 319,622 | |
Deferred expenses, net | | 9,731 | | 12,891 | | | 17,478 | | 12,891 | |
Prepaid expenses and other assets, net | | 154,237 | | 143,470 | | | 125,803 | | 143,470 | |
Total assets | | $ | 3,546,412 | | $ | 3,503,042 | | | $ | 3,604,596 | | $ | 3,503,042 | |
| | | | | | | | | | |
Liabilities: | | | | | | | | | | |
Mortgages, notes and loans payable | | $ | 696,761 | | $ | 688,312 | | | $ | 715,530 | | $ | 688,312 | |
Deferred tax liabilities | | 77,925 | | 77,147 | | | 89,331 | | 77,147 | |
Warrant liabilities | | 156,600 | | 123,573 | | | 267,800 | | 123,573 | |
Uncertain tax position liability | | 134,568 | | 132,492 | | | 136,387 | | 132,492 | |
Accounts payable and accrued expenses | | 187,842 | | 170,521 | | | 178,232 | | 170,521 | |
Total liabilities | | 1,253,696 | | 1,192,045 | | | 1,387,280 | | 1,192,045 | |
| | | | | | | | | | |
Commitments and Contingencies (see Note 13) | | | | | | |
Commitments and Contingencies (see Note 14) | | | | | | |
| | | | | | | | | | |
Equity: | | | | | | | | | | |
Preferred stock: $.01 par value; 50,000,000 shares authorized, none issued | | — | | — | | | — | | — | |
Common stock: $.01 par value; 150,000,000 shares authorized, 39,498,912 shares issued and outstanding as of March 31, 2013 and December 31, 2012 | | 395 | | 395 | | |
Common stock: $.01 par value; 150,000,000 shares authorized, 39,576,344 shares issued and outstanding as of June 30, 2013 and 39,498,912 shares issued and outstanding as of December 31, 2012 | | | 396 | | 395 | |
Additional paid-in capital | | 2,825,174 | | 2,824,031 | | | 2,826,609 | | 2,824,031 | |
Accumulated deficit | | (532,737 | ) | (509,613 | ) | | (609,291 | ) | (509,613 | ) |
Accumulated other comprehensive loss | | (9,567 | ) | (9,575 | ) | | (7,773 | ) | (9,575 | ) |
Total stockholders’ equity | | 2,283,265 | | 2,305,238 | | | 2,209,941 | | 2,305,238 | |
Noncontrolling interests | | 9,451 | | 5,759 | | | 7,375 | | 5,759 | |
Total equity | | 2,292,716 | | 2,310,997 | | | 2,217,316 | | 2,310,997 | |
Total liabilities and equity | | $ | 3,546,412 | | $ | 3,503,042 | | | $ | 3,604,596 | | $ | 3,503,042 | |
See Notes to Condensed Consolidated Financial Statements.
3
Table of Contents
THE HOWARD HUGHES CORPORATION
CONDENSED CONSOLIDATED STATEMENTS OF OPERATIONS
UNAUDITED
| | Three Months Ended March 31, | | | Three Months Ended June 30, | | Six Months Ended June 30, | |
| | 2013 | | 2012 | | | 2013 | | 2012 | | 2013 | | 2012 | |
| | (In thousands, except per share amounts) | | | (In thousands, except per share amounts) | |
Revenues: | | | | | | | | | | | | | | |
Master Planned Community land sales | | $ | 47,226 | | $ | 36,089 | | | $ | 66,021 | | $ | 43,928 | | $ | 113,247 | | $ | 80,017 | |
Builder price participation | | 1,275 | | 813 | | | 2,426 | | 1,528 | | 3,701 | | 2,341 | |
Minimum rents | | 18,926 | | 18,898 | | | 20,134 | | 20,577 | | 39,060 | | 39,474 | |
Tenant recoveries | | 5,325 | | 5,864 | | | 5,065 | | 6,003 | | 10,390 | | 11,867 | |
Condominium unit sales | | — | | 134 | | |
Condominium rights and unit sales | | | 30,381 | | 134 | | 30,381 | | 267 | |
Resort and conference center revenues | | 11,104 | | 9,657 | | | 11,270 | | 11,970 | | 22,374 | | 21,626 | |
Other land revenues | | 2,802 | | 3,568 | | | 3,830 | | 3,531 | | 6,632 | | 7,048 | |
Other rental and property revenues | | 3,433 | | 4,742 | | | 7,925 | | 6,268 | | 11,358 | | 11,062 | |
Total revenues | | 90,091 | | 79,765 | | | 147,052 | | 93,939 | | 237,143 | | 173,702 | |
| | | | | | | | | | |
Expenses: | | | | | | | | | | | | | | |
Master Planned Community cost of sales | | 25,699 | | 18,739 | | | 29,854 | | 22,978 | | 55,553 | | 41,657 | |
Master Planned Community operations | | 8,496 | | 10,988 | | | 9,794 | | 9,979 | | 18,290 | | 21,026 | |
Other property operating costs | | 15,520 | | 14,210 | | | 17,334 | | 15,044 | | 32,854 | | 29,373 | |
Rental property real estate taxes | | 3,757 | | 3,839 | | | 3,359 | | 3,171 | | 7,116 | | 7,009 | |
Rental property maintenance costs | | 1,805 | | 1,955 | | | 2,143 | | 2,086 | | 3,948 | | 4,041 | |
Condominium unit cost of sales | | — | | 59 | | |
Condominium rights and unit cost of sales | | | 15,272 | | 36 | | 15,272 | | 96 | |
Resort and conference center operations | | 7,476 | | 7,414 | | | 7,680 | | 7,371 | | 15,156 | | 14,785 | |
Provision for doubtful accounts | | 429 | | — | | | 277 | | 164 | | 706 | | 45 | |
General and administrative | | 11,171 | | 8,399 | | | 6,769 | | 8,160 | | 17,940 | | 16,557 | |
Depreciation and amortization | | 6,444 | | 5,058 | | | 6,780 | | 5,893 | | 13,224 | | 10,951 | |
Total expenses | | 80,797 | | 70,661 | | | 99,262 | | 74,882 | | 180,059 | | 145,540 | |
| | | | | | | | | | | | | | |
Operating income | | 9,294 | | 9,104 | | | 47,790 | | 19,057 | | 57,084 | | 28,162 | |
| | | | | | | | | | | | | | |
Interest income | | 2,356 | | 2,332 | | | 2,067 | | 2,342 | | 4,423 | | 4,673 | |
Interest expense | | (143 | ) | — | | | — | | (200 | ) | (143 | ) | (201 | ) |
Warrant liability loss | | (33,027 | ) | (121,851 | ) | |
Warrant liability gain (loss) | | | (111,200 | ) | 23,430 | | (144,227 | ) | (98,421 | ) |
Reduction in tax indemnity receivable | | (1,904 | ) | — | | | (7,499 | ) | (8,782 | ) | (9,403 | ) | (8,782 | ) |
Equity in earnings from Real Estate Affiliates | | 2,733 | | 2,677 | | | 5,707 | | 446 | | 8,440 | | 3,122 | |
Loss before taxes | | (20,691 | ) | (107,738 | ) | |
Income (loss) before taxes | | | (63,135 | ) | 36,293 | | (83,826 | ) | (71,447 | ) |
Provision for income taxes | | 2,479 | | 3,784 | | | 13,361 | | 1,301 | | 15,840 | | 5,085 | |
Net loss | | (23,170 | ) | (111,522 | ) | |
Net income (loss) attributable to noncontrolling interests | | 46 | | (736 | ) | |
Net loss attributable to common stockholders | | $ | (23,124 | ) | $ | (112,258 | ) | |
Net income (loss) | | | (76,496 | ) | 34,992 | | (99,666 | ) | (76,532 | ) |
Net income attributable to noncontrolling interests | | | (58 | ) | (682 | ) | (12 | ) | (1,418 | ) |
Net income (loss) attributable to common stockholders | | | $ | (76,554 | ) | $ | 34,310 | | $ | (99,678 | ) | $ | (77,950 | ) |
| | | | | | | | | | | | | | |
Basic/diluted loss per share: | | $ | (0.59 | ) | $ | (2.96 | ) | |
Basic earnings (loss) per share: | | | $ | (1.94 | ) | $ | 0.91 | | $ | (2.53 | ) | $ | (2.06 | ) |
| | | | | | | | | | |
Diluted earnings (loss) per share: | | | $ | (1.94 | ) | $ | 0.27 | | $ | (2.53 | ) | $ | (2.06 | ) |
See Notes to Condensed Consolidated Financial Statements.
4
Table of Contents
THE HOWARD HUGHES CORPORATION
CONDENSED CONSOLIDATED STATEMENTS OF COMPREHENSIVE INCOME (LOSS)
UNAUDITED
| | Three Months Ended March 31, | |
| | 2013 | | 2012 | |
| | (In thousands) | |
Comprehensive loss, net of tax: | | | | | |
Net loss | | $ | (23,170 | ) | $ | (111,522 | ) |
Other comprehensive income (loss): | | | | | |
Interest rate swaps (a) | | 421 | | 102 | |
Capitalized swap interest (b) | | (413 | ) | (410 | ) |
Other comprehensive income (loss) | | 8 | | (308 | ) |
Comprehensive loss | | (23,162 | ) | (111,830 | ) |
Comprehensive income (loss) attributable to noncontrolling interests | | 46 | | (736 | ) |
Comprehensive loss attributable to common stockholders | | $ | (23,116 | ) | $ | (112,566 | ) |
| | Three Months Ended June 30, | | Six Months Ended June 30, | |
| | 2013 | | 2012 | | 2013 | | 2012 | |
| | (In thousands) | | (In thousands) | |
| | | | | | | | | |
Comprehensive income (loss), net of tax: | | | | | | | | | |
Net income (loss) | | $ | (76,496 | ) | $ | 34,992 | | $ | (99,666 | ) | $ | (76,532 | ) |
Other comprehensive income (loss): | | | | | | | | | |
Interest rate swaps (a) | | 2,112 | | (2,263 | ) | 2,533 | | (2,161 | ) |
Capitalized swap interest (b) | | (318 | ) | (159 | ) | (731 | ) | (569 | ) |
Other comprehensive income (loss) | | 1,794 | | (2,422 | ) | 1,802 | | (2,730 | ) |
Comprehensive income (loss) | | (74,702 | ) | 32,570 | | (97,864 | ) | (79,262 | ) |
Comprehensive income attributable to noncontrolling interests | | (58 | ) | (682 | ) | (12 | ) | (1,418 | ) |
Comprehensive income (loss) attributable to common stockholders | | $ | (74,760 | ) | $ | 31,888 | | $ | (97,876 | ) | $ | (80,680 | ) |
(a) Net of deferred tax expense of $0.1
(a) | | Net of deferred tax expense of $0.3 million for the three months ended March 31, 2013 and 2012. (b) Net of deferred tax benefit of $0.2 million for the three months ended March 31, 2013 and $0.4 million for the three and six months ended June 30, 2013. Net of deferred tax benefit of $0.3 million and $0.2 million for the three and six months ended June 30, 2012.
|
(b) | | Net of deferred tax benefit of $0.2 million and $0.4 million for the three and six months ended June 30, 2013. Net of deferred tax benefit of $0.1 million and $0.3 million for the three and six months ended June 30, 2012. |
See Notes to Condensed Consolidated Financial Statements.
5
Table of Contents
THE HOWARD HUGHES CORPORATION
CONDENSED CONSOLIDATED STATEMENTS OF EQUITY
UNAUDITED
| | | | | | | | | | Accumulated | | | | | | | | | | | | | | | Accumulated | | | | | |
| | | | | | Additional | | | | Other | | | | | | | | | | | Additional | | | | Other | | | | | |
| | | | Common | | Paid-In | | Accumulated | | Comprehensive | | Noncontrolling | | Total | | | | | Common | | Paid-In | | Accumulated | | Comprehensive | | Noncontrolling | | Total | |
(In thousands, except shares) | | Shares | | Stock | | Capital | | Deficit | | Income (Loss) | | Interests | | Equity | | |
(In thousands, except share amounts) | | | Shares | | Stock | | Capital | | Deficit | | Income (Loss) | | Interests | | Equity | |
Balance, January 1, 2012 | | 37,945,707 | | $ | 379 | | $ | 2,711,109 | | $ | (381,325 | ) | $ | (5,578 | ) | $ | 5,014 | | $ | 2,329,599 | | | 37,945,707 | | $ | 379 | | $ | 2,711,109 | | $ | (381,325 | ) | $ | (5,578 | ) | $ | 5,014 | | $ | 2,329,599 | |
Net income (loss) | | | | — | | — | | (112,258 | ) | — | | 736 | | (111,522 | ) | | | | — | | — | | (77,950 | ) | — | | 1,418 | | (76,532 | ) |
Interest rate swaps, net of tax of $101 | | | | — | | — | | — | | 102 | | — | | 102 | | |
Capitalized swap interest, net of tax of $244 | | | | — | | — | | — | | (410 | ) | — | | (410 | ) | |
Interest rate swaps, net of tax of ($150) | | | | | — | | — | | — | | (2,161 | ) | — | | (2,161 | ) |
Capitalized swap interest, net of tax of $330 | | | | | — | | — | | — | | (569 | ) | — | | (569 | ) |
Stock plan activity | | — | | — | | 871 | | — | | — | | — | | 871 | | | 27,933 | | — | | 2,069 | | — | | — | | — | | 2,069 | |
Balance, March 31, 2012 | | 37,945,707 | | $ | 379 | | $ | 2,711,980 | | $ | (493,583 | ) | $ | (5,886 | ) | $ | 5,750 | | $ | 2,218,640 | | |
Balance, June 30, 2012 | | | 37,973,640 | | $ | 379 | | $ | 2,713,178 | | $ | (459,275 | ) | $ | (8,308 | ) | $ | 6,432 | | $ | 2,252,406 | |
| | | | | | | | | | | | | | | | | | | | | | | | | | | | | | |
Balance, January 1, 2013 | | 39,498,912 | | $ | 395 | | $ | 2,824,031 | | $ | (509,613 | ) | $ | (9,575 | ) | $ | 5,759 | | $ | 2,310,997 | | | 39,498,912 | | $ | 395 | | $ | 2,824,031 | | $ | (509,613 | ) | $ | (9,575 | ) | $ | 5,759 | | $ | 2,310,997 | |
Net income (loss) | | | | — | | — | | (23,124 | ) | — | | (46 | ) | (23,170 | ) | | | | — | | — | | (99,678 | ) | — | | 12 | | (99,666 | ) |
Adjustment to noncontrolling interest | | | | — | | — | | — | | — | | 3,750 | | 3,750 | | | | | — | | — | | — | | — | | 1,616 | | 1,616 | |
Preferred dividend payment on behalf of REIT subsidiary | | | | — | | — | | — | | — | | (12 | ) | (12 | ) | | | | — | | — | | — | | — | | (12 | ) | (12 | ) |
Interest rate swaps, net of tax of $80 | | | | — | | — | | — | | 421 | | — | | 421 | | |
Capitalized swap interest, net of tax of $198 | | | | — | | — | | — | | (413 | ) | — | | (413 | ) | |
Interest rate swaps, net of tax of ($379) | | | | | — | | — | | — | | 2,533 | | — | | 2,533 | |
Capitalized swap interest, net of tax of $377 | | | | | — | | — | | — | | (731 | ) | — | | (731 | ) |
Stock plan activity | | — | | — | | 1,143 | | — | | — | | — | | 1,143 | | | 77,432 | | 1 | | 2,578 | | — | | — | | — | | 2,579 | |
Balance, March 31, 2013 | | 39,498,912 | | $ | 395 | | $ | 2,825,174 | | $ | (532,737 | ) | $ | (9,567 | ) | $ | 9,451 | | $ | 2,292,716 | | |
Balance, June 30, 2013 | | | 39,576,344 | | $ | 396 | | $ | 2,826,609 | | $ | (609,291 | ) | $ | (7,773 | ) | $ | 7,375 | | $ | 2,217,316 | |
See Notes to Condensed Consolidated Financial Statements.
6
Table of Contents
THE HOWARD HUGHES CORPORATION
CONDENSED CONSOLIDATED STATEMENTS OF CASH FLOWS
UNAUDITED
| | Three months ended March 31, | | | Six Months Ended June 30, | |
| | 2013 | | 2012 | | | 2013 | | 2012 | |
| | (In thousands) | | | (In thousands) | |
Cash Flows from Operating Activities: | | | | | | | | | | |
Net loss | | $ | (23,170 | ) | $ | (111,522 | ) | | $ | (99,666 | ) | $ | (76,532 | ) |
Adjustments to reconcile net loss to cash provided by (used in) operating activities: | | | | | | |
Provision for doubtful accounts | | 429 | | — | | |
Adjustments to reconcile net loss to cash provided by operating activities: | | | | | | |
Depreciation | | 5,483 | | 4,214 | | | 11,427 | | 8,853 | |
Amortization | | 961 | | 844 | | | 1,797 | | 2,098 | |
Amortization of deferred financing costs and debt market rate adjustments, net | | 144 | | 156 | | | 338 | | (155 | ) |
Amortization of intangibles other than in-place leases | | 260 | | (44 | ) | | 192 | | (89 | ) |
Straight-line rent amortization | | 70 | | (265 | ) | | (705 | ) | (482 | ) |
Deferred income taxes | | 2,196 | | 3,728 | | | 15,871 | | 4,612 | |
Restricted stock and stock option amortization | | 1,143 | | 871 | | | 2,578 | | 2,069 | |
Warrant liability loss | | 33,027 | | 121,851 | | | 144,227 | | 98,421 | |
Reduction in tax indemnity receivable | | 1,904 | | — | | | 9,403 | | 8,782 | |
Equity in earnings (loss) from Real Estate Affiliates, net of distributions | | 70 | | (151 | ) | | (5,441 | ) | 72 | |
Master Planned Community and condominium development expenditures | | (33,329 | ) | (24,284 | ) | |
Master Planned Community and condominium cost of sales | | 22,553 | | 17,857 | | |
Provision for doubtful accounts | | | 706 | | 45 | |
Master Planned Community development expenditures | | | (67,484 | ) | (47,235 | ) |
Master Planned Community cost of sales | | | 48,731 | | 39,371 | |
Condominium development expenditures | | | (6,761 | ) | — | |
Condominium cost of sales | | | 15,270 | | 96 | |
Deferred revenue from sale of condominium rights | | | 17,119 | | — | |
Net changes: | | | | | | | | | | |
Accounts and notes receivable | | (3,472 | ) | 3,770 | | | (4,951 | ) | 9,682 | |
Prepaid expenses and other assets | | 463 | | (2,791 | ) | | 11,776 | | 2,191 | |
Deferred expenses | | 2,397 | | (1,432 | ) | | (760 | ) | (1,730 | ) |
Accounts payable and accrued expenses | | 4,940 | | (13,193 | ) | | (5,918 | ) | (20,508 | ) |
Other, net | | 570 | | (487 | ) | | 1,666 | | (10 | ) |
Cash provided by (used in) operating activities | | 16,639 | | (878 | ) | |
Cash provided by operating activities | | | 89,415 | | 29,551 | |
| | | | | | | | | | |
Cash Flows from Investing Activities: | | | | | | | | | | |
Real estate and property expenditures | | (43,940 | ) | (7,605 | ) | | (96,175 | ) | (20,036 | ) |
Investments in Real Estate Affiliates, net | | (1,537 | ) | (345 | ) | |
Increase in restricted cash | | (11,121 | ) | (1,001 | ) | |
Consideration paid to acquire Millennium Waterway Apartments, net of cash acquired | | | — | | (2,721 | ) |
Distribution from Millennium Waterway Apartments | | | — | | 6,876 | |
Proceeds from sales of investment in Real Estate Affiliates | | | — | | 8,579 | |
Investments in Summerlin Las Vegas Baseball Club, LLC | | | (10,200 | ) | — | |
Investment in KR Holdings, LLC | | | (16,750 | ) | — | |
Investments in other Real Estate Affiliates, net | | | (758 | ) | (1,450 | ) |
Change in restricted cash | | | (12,673 | ) | 7,703 | |
Cash used in investing activities | | (56,598 | ) | (8,951 | ) | | (136,556 | ) | (1,049 | ) |
| | | | | | | | | | |
Cash Flows from Financing Activities: | | | | | | | | | | |
Proceeds from issuance of mortgages, notes and loans payable | | 68,313 | | 217 | | | 94,575 | | 35,827 | |
Principal payments on mortgages, notes and loans payable | | (57,003 | ) | (7,465 | ) | | (60,829 | ) | (36,308 | ) |
Deferred financing costs | | — | | (515 | ) | | (460 | ) | (1,299 | ) |
Preferred dividend payment on behalf of REIT subsidiary | | (12 | ) | — | | | (12 | ) | — | |
Cash provided by (used in) financing activities | | 11,298 | | (7,763 | ) | |
Net change in cash and cash equivalents | | (28,661 | ) | (17,592 | ) | |
Cash and cash equivalents at beginning of period | | 229,197 | | 227,566 | | |
Cash and cash equivalents at end of period | | $ | 200,536 | | $ | 209,974 | | |
Distributions to noncontrolling interests | | | (2,134 | ) | — | |
Cash provided provided by (used in) financing activities | | | 31,140 | | (1,780 | ) |
| | | | | | | | | | | | |
Supplemental Disclosure of Cash Flow Information: | | | | | | |
Interest paid | | $ | 7,348 | | $ | 6,070 | | |
Interest capitalized | | 9,869 | | 6,692 | | |
Income taxes paid | | 885 | | 132 | | |
| | | | | | |
Non-Cash Transactions: | | | | | | |
Special Improvement District bond transfers associated with land sales | | 3,146 | | 978 | | |
Real estate and property expenditures | | 17,136 | | 1,711 | | |
7
Table of Contents
THE HOWARD HUGHES CORPORATION
CONDENSED CONSOLIDATED STATEMENTS OF CASH FLOWS
UNAUDITED
| | Six Months Ended June 30, | |
| | 2013 | | 2012 | |
| | (In thousands) | |
| | | | | |
Net change in cash and cash equivalents | | (16,001 | ) | 26,722 | |
Cash and cash equivalents at beginning of period | | 229,197 | | 227,566 | |
Cash and cash equivalents at end of period | | $ | 213,196 | | $ | 254,288 | |
| | | | | |
Supplemental Disclosure of Cash Flow Information: | | | | | |
Interest paid | | $ | 15,401 | | $ | 10,284 | |
Interest capitalized | | 18,202 | | 13,253 | |
Income taxes paid | | 1,914 | | 824 | |
| | | | | |
Non-Cash Transactions: | | | | | |
Acquisition of Millennium Waterway Apartments | | | | | |
Land | | — | | (15,917 | ) |
Building and equipment | | — | | (56,002 | ) |
Other Assets | | — | | (2,669 | ) |
Mortgages, notes and loans payable | | — | | 55,584 | |
Other liabilities | | — | | 754 | |
Reduction in investments in Real Estate Affiliates due to the Millennium Waterway Apartments’ acquisition | | — | | 22,405 | |
Special Improvement District bond transfers associated with land sales | | 6,823 | | 2,189 | |
Real estate and property expenditures | | 27,469 | | 4,345 | |
Non-cash increase in Property due to consolidation of Real Estate Affiliate | | 3,750 | | — | |
Transfer of condominium buyer deposits to Real Estate Affiliate | | 34,220 | | — | |
See Notes to Condensed Consolidated Financial Statements.
78
Table of Contents
THE HOWARD HUGHES CORPORATION
NOTES TO CONDENSED CONSOLIDATED FINANCIAL STATEMENTS
UNAUDITED
NOTE 1 BASIS OF PRESENTATION AND ORGANIZATION
The accompanying unaudited condensed consolidated financial statements have been prepared in accordance with accounting principles generally accepted in the United States of America (“GAAP”) for interim financial statements and in accordance with the instructions to Form 10-Q and Article 10 of Regulation S-X as issued by the Securities and Exchange Commission (the “SEC”). Such condensed consolidated financial statements do not include all of the information and disclosures required by GAAP for complete financial statements. In addition, readers of this Quarterly Report on Form 10-Q (“Quarterly Report”) should refer to The Howard Hughes Corporation’s (“HHC” or the “Company”) audited Consolidated and Combined Financial Statements for the year ended December 31, 2012 which are included in the Company’s Annual Report on Form 10-K (the “Annual Report”) for the fiscal year ended December 31, 2012. In the opinion of management, all adjustments (consisting of normal recurring adjustments) necessary for a fair presentation of the financial position, results of operations and cash flows for the interim periods have been included. We have made certain reclassifications in 2012 to conform to the 2013 presentation. We reclassified $1.4 million of certain salaries and overhead costs related to land development activities for The Woodlands from general and administrative expenses to Master Planned Community operations. In addition, we reclassified $0.2 million of operating costs related to the Columbia office properties from Master Planned Community operations to other property costs. The results for the interim periodthree and six months ended March 31,June 30, 2013 and 2012 are not necessarily indicative of the results to be expected for the full fiscal year.
Management has evaluated all material events occurring subsequent to the date of the condensed consolidated financial statements up to the date and time this Quarterly Report was filed.
NOTE 2 SPONSORS AND MANAGEMENT WARRANTS
On November 9, 2010 (the “Effective Date”), we issued warrants to purchase 8.0 million shares of our common stock to certain of our sponsors (the “Sponsors Warrants”) with an estimated initial value of approximately $69.5 million. The initial exercise price for the warrants of $50.00 per share and the number of shares of common stock underlying each warrant are subject to adjustment for future stock dividends, splits or reverse splits of our common stock or certain other events. On December 7, 2012, the affiliates of Blackstone Real Estate Partners and the Fairholme Fund and the Fairholme Focused Income Fund, each sold their sponsor warrants totaling 333,333 and 1,916,667, respectively, to HHC for $30.00 cash per warrant. These transactions were accounted for as the settlement of a liability for cash consideration of $67.5 million. On November 9, 2012, affiliates of Brookfield Asset Management, Inc. (“Brookfield”), one of our sponsors, exercised their warrants to purchase 1,525,272 shares of our common stock at an exercise price of $50.00 per warrant, or $76.3 million. In addition, Brookfield sold their remaining warrants to purchase 2,308,061 shares of our common stock to HHC for $89.3 million. The cash consideration paid to Brookfield net of the exercise price was $13.0 million. As a result of these transactions, $108.6 million of additional paid-in capital was recorded in our financial statements in the year ended December 31, 2012. The Sponsors Warrants expire on November 9, 2017.
In November 2010 and February 2011, we entered into certain agreements (the “Management Warrants”) with David R. Weinreb, our Chief Executive Officer, Grant Herlitz, our President, and Andrew C. Richardson, our Chief Financial Officer, in each case prior to his appointment to such position, to purchase shares of our common stock. The Management Warrants representing 2,862,687 underlying shares, which may be adjusted pursuant to a net settlement option, were issued pursuant to such agreements at fair value in exchange for a combined total of approximately $19.0 million in cash from such executives at the commencement of their respective employment. Mr. Weinreb and Mr. Herlitz’s warrants have exercise prices of $42.23 per share and Mr. Richardson’s warrant has an exercise price of $54.50 per share. Generally, the Management Warrants become exercisable in November 2016 and expire by February 2018.
89
Table of Contents
THE HOWARD HUGHES CORPORATION
NOTES TO CONDENSED CONSOLIDATED FINANCIAL STATEMENTS (Continued)
UNAUDITED
The estimated $71.3$126.4 million fair value for the Sponsors Warrants representing warrants to purchase 1,916,667 shares and estimated $85.3$141.4 million fair value for the Management Warrants representing warrants to purchase 2,862,687 shares outstanding as of March 31,June 30, 2013, have been recorded as liabilities because the holders of these warrants could require us to settle such warrants in cash upon a change of control. The estimated fair values for the outstanding Sponsors Warrants and Management Warrants were $58.5 million and $65.1 million, respectively, as of December 31, 2012. The fair values were estimated using an option pricing model and Level 3 inputs due to the unavailability of comparable market data, as further discussed in Note 5.6 — Fair Value of Financial Instruments. Decreases and increases in the fair value of the Sponsors Warrants and the Management Warrants are recognized as either warrant liability gains or losses, respectively, in the Condensed Consolidated Statements of Operations.
NOTE 3EARNINGS PER SHARE
Basic lossearnings (loss) per share (“EPS”) is computed by dividing net loss availableincome (loss) attributable to common stockholders by the weighted-average number of common shares outstanding. Diluted EPS is computed after adjusting the numerator and denominator of the basic EPS computation for the effects of all potentially dilutive common shares. The dilutive effect of options and nonvested stock issued under stock-based compensation plans is computed using the “treasury stock”treasury stock method. The dilutive effect of the Sponsors Warrants and Management Warrants is computed using the if-converted method. Gains associated with the Sponsors Warrants and Management Warrants are excluded from the numerator in computing diluted earnings per share because inclusion of such gains in the computation would be anti-dilutive.
Information related to our EPS calculations is summarized as follows:
| | Three Months Ended March 31, | |
| | 2013 | | 2012 | |
| | (In thousands, except per share amounts) | |
Basic and Diluted EPS: | | | | | |
Numerator: | | | | | |
Net loss | | $ | (23,170 | ) | $ | (111,522 | ) |
Net income (loss) attributable to noncontrolling interests | | 46 | | (736 | ) |
Net loss attributable to common stockholders | | $ | (23,124 | ) | $ | (112,258 | ) |
| | | | | |
Denominator: | | | | | |
Weighted average basic common shares outstanding | | 39,441 | | 37,903 | |
| | | | | |
Basic and diluted EPS: | | $ | (0.59 | ) | $ | (2.96 | ) |
| | Three Months Ended June 30, | | Six Months Ended June 30, | |
| | 2013 | | 2012 | | 2013 | | 2012 | |
| | (In thousands, except per share amounts) | |
Basic EPS: | | | | | | | | | |
Numerator: | | | | | | | | | |
Net income (loss) | | $ | (76,496 | ) | $ | 34,992 | | $ | (99,666 | ) | $ | (76,532 | ) |
Net income attributable to noncontrolling interests | | (58 | ) | (682 | ) | (12 | ) | (1,418 | ) |
Net income (loss) attributable to common stockholders | | $ | (76,554 | ) | $ | 34,310 | | $ | (99,678 | ) | $ | (77,950 | ) |
| | | | | | | | | |
Denominator: | | | | | | | | | |
Weighted average basic common shares outstanding | | 39,445 | | 37,907 | | 39,443 | | 37,905 | |
| | | | | | | | | |
Diluted EPS: | | | | | | | | | |
Numerator: | | | | | | | | | |
Net income (loss) attributable to common stockholders | | $ | (76,554 | ) | $ | 34,310 | | $ | (99,678 | ) | $ | (77,950 | ) |
Less: Warrant liability gain | | — | | (23,430 | ) | — | | — | |
Adjusted net income (loss) attributable to common stockholders | | $ | (76,554 | ) | $ | 10,880 | | $ | (99,678 | ) | $ | (77,950 | ) |
| | | | | | | | | |
Denominator: | | | | | | | | | |
Weighted average basic common shares outstanding | | 39,445 | | 37,907 | | 39,443 | | 37,905 | |
Restricted stock and stock options | | — | | 5 | | — | | — | |
Warrants | | — | | 2,339 | | — | | — | |
Weighted average diluted common shares oustanding | | 39,445 | | 40,251 | | 39,443 | | 37,905 | |
| | | | | | | | | |
Basic earnings (loss) per share: | | $ | (1.94 | ) | $ | 0.91 | | $ | (2.53 | ) | $ | (2.06 | ) |
| | | | | | | | | |
Diluted earnings (loss) per share: | | $ | (1.94 | ) | $ | 0.27 | | $ | (2.53 | ) | $ | (2.06 | ) |
10
Table of Contents
THE HOWARD HUGHES CORPORATION
NOTES TO CONDENSED CONSOLIDATED FINANCIAL STATEMENTS (Continued)
UNAUDITED
The diluted EPS computation for the three and six months ended March 31,June 30, 2013 excludes 890,040918,440 stock options, 57,933122,332 shares of restricted stock, 1,916,667 shares of common stock underlying the Sponsors Warrants and 2,862,687 shares of common stock underlying the Management Warrants because their inclusion would have been anti-dilutive.
Additionally, the diluted EPS computation for the three months ended March 31,June 30, 2012 excludes 731,437847,937 stock options and 42,55314,900 shares of restricted stock because their inclusion would have been anti-dilutive. The diluted EPS computation for the six months ended June 30, 2012 excludes 847,937 stock options, 57,933 shares of restricted stock and 10,682,68710,862,687 Sponsors and Management Warrantswarrants because their inclusion would have been anti-dilutive.
9
Table of Contents
THE HOWARD HUGHES CORPORATIONNOTE 4 RECENT TRANSACTIONS
NOTES TO CONDENSED CONSOLIDATED FINANCIAL STATEMENTS (Continued)In 2012, we formed another 50/50 joint venture, KR Holdings, LLC (“KR Holdings”) with two partners to develop a 23-story luxury condominium tower, ONE Ala Moana Tower Condominium Project. On September 17, 2012, KR Holdings closed on $40.0 million non-recourse mezzanine financing commitments with List Island Properties, LLC and A & B Properties, Inc., including funding for $3.0 million of pre-development costs.
UNAUDITEDOn May 15, 2013, KR Holdings, LLC (“KR Holdings”) closed on a first mortgage construction loan. Upon closing and under the terms of our joint venture agreement, we sold to KR Holdings our interest in the condominium rights for $47.5 million and received net cash proceeds of $30.8 million and a 50% equity interest in KR Holdings. Our partner contributed $16.8 million of cash for their 50% equity interest. Due to our continuing involvement in KR Holdings, we accounted for the transaction as a partial sale representing 50% of the $47.5 million sales value of the condominium rights, and accordingly, we recognized net profit of $11.8 million. The remaining $23.7 million sales value of the condominium rights will be recognized on the same percentage of completion basis as KR Holdings. As of June 30, 2013 the project was 27.9% complete, and we recognized an additional $3.3 million of profit on the sale for the three months ended June 30, 2013. Please refer to Note 7 — Real Estate Affiliates for further discussion of the ONE Ala Moana Tower Condominium Project.
NOTE 45 IMPAIRMENT
We review our real estate assets, including operating assets, land held for development and sale and developments in progress, for potential impairment indicators whenever events or changes in circumstances indicate that the carrying amount may not be recoverable. GAAP requires that if impairment indicators exist and the undiscounted cash flows expected to be generated by an asset are less than its carrying amount, an impairment charge should be recorded to write down the carrying amount of such asset to fair value (or for land held for sale, fair value less cost to sell). The impairment analysis does not consider the timing of future cash flows and whether the asset is expected to earn an above or below market rate of return.
Our investment in each of the Real Estate Affiliates is evaluated periodically and as deemed necessary for recoverability and valuation declines that are other-than-temporary. If the decrease in value of our investment in a Real Estate Affiliate is deemed to be other-than-temporary, our investment in such Real Estate Affiliate is reduced to its estimated fair value.
No impairment charges were recorded during the three or six months ended March 31,June 30, 2013 or 2012. We continually evaluate our strategic alternatives with respect to each of our properties and may revise our strategy from time to time, including our intent to hold the asset on a long-term basis or the timing of potential asset dispositions. For example, we may decide to sell property that is held for use and the sale price may be less than the carrying amount. As a result, these changes in strategy could result in impairment charges in future periods.
11
Table of Contents
THE HOWARD HUGHES CORPORATION
NOTES TO CONDENSED CONSOLIDATED FINANCIAL STATEMENTS (Continued)
UNAUDITED
NOTE 56 FAIR VALUE OF FINANCIAL INSTRUMENTS
The following table presents, for each of the fair value hierarchy levels required under Accounting Standards Codification (“ASC”) 820, “Fair Value Measurement,” our assets and liabilities that are measured at fair value on a recurring basis.
| | March 31, 2013 | | December 31, 2012 | |
| | Fair Value Measurements Using | | Fair Value Measurements Using | |
| | Total | | Quoted Prices in
Active Markets for
Identical Assets
(Level 1) | | Significant
Other
Observable
Inputs
(Level 2) | | Significant
Unobservable
Inputs
(Level 3) | | Total | | Quoted Prices in
Active Markets
for Identical
Assets (Level 1) | | Significant
Other
Observable
Inputs
(Level 2) | | Significant
Unobservable
Inputs
(Level 3) | |
| | (In thousands) | | (In thousands) | |
Liabilities | | | | | | | | | | | | | | | | | |
Warrants | | $ | 156,600 | | $ | — | | $ | — | | $ | 156,600 | | $ | 123,573 | | $ | — | | $ | — | | $ | 123,573 | |
Interest rate swaps | | 6,691 | | — | | 6,691 | | — | | 7,183 | | — | | 7,183 | | — | |
| | | | | | | | | | | | | | | | | | | | | | | | | |
10
Table of Contents
THE HOWARD HUGHES CORPORATION
NOTES TO CONDENSED CONSOLIDATED FINANCIAL STATEMENTS (Continued)
UNAUDITED
| | June 30, 2013 | | December 31, 2012 | |
| | Fair Value Measurements Using | | Fair Value Measurements Using | |
| | Total | | Quoted Prices in
Active Markets for
Identical Assets
(Level 1) | | Significant
Other
Observable
Inputs
(Level 2) | | Significant
Unobservable
Inputs
(Level 3) | | Total | | Quoted Prices in
Active Markets
for Identical
Assets (Level 1) | | Significant
Other
Observable
Inputs
(Level 2) | | Significant
Unobservable
Inputs
(Level 3) | |
| | | | (In thousands) | | | | | | (In thousands) | | | |
Liabilities | | | | | | | | | | | | | | | | | |
Warrants | | $ | 267,800 | | $ | — | | $ | — | | $ | 267,800 | | $ | 123,573 | | $ | — | | $ | — | | $ | 123,573 | |
Interest rate swaps | | 4,281 | | — | | 4,281 | | — | | 7,183 | | — | | 7,183 | | — | |
| | | | | | | | | | | | | | | | | | | | | | | | | |
The valuation of warrants is based on an option pricing valuation model. The inputs to the model include the fair value of the stock related to the warrants, exercise price of the warrants, term, expected volatility, risk-free interest rate and dividend yield.
The fair values of interest rate swaps are determined using the market standard methodology of netting the discounted future fixed cash payments and the discounted expected variable cash receipts. The variable cash receipts are based on an expectation of future interest rates derived from observable market interest rate curves.
The following table presents a reconciliation of the beginning and ending balances of the fair value measurements using significant unobservable inputs (Level 3) which are our Sponsors and Management Warrants:
| | 2013 | | 2012 | | | 2013 | | 2012 | |
| | (In thousands) | | | (In thousands) | |
Balance as of January 1, | | $ | 123,573 | | $ | 127,764 | | | $ | 123,573 | | $ | 127,764 | |
Warrant liability loss | | 33,027 | | 121,851 | | | 144,227 | | 98,421 | |
Balance as of March 31, | | $ | 156,600 | | $ | 249,615 | | |
Balance as of June 30, | | | $ | 267,800 | | $ | 226,185 | |
The fair values were estimated using an option pricing model and Level 3 inputs due to the unavailability of comparable market data. Changes in the fair value of the Sponsors Warrants and the Management Warrants are recognized in earnings as a warrant liability gain or loss.
12
Table of Contents
THE HOWARD HUGHES CORPORATION
NOTES TO CONDENSED CONSOLIDATED FINANCIAL STATEMENTS (Continued)
UNAUDITED
The significant unobservable input used in the fair value measurement of our warrants designated as Level 3 as of March 31,June 30, 2013 is as follows:
| | Fair Value | | Valuation
Technique | | Unobservable
Input | | Average | |
| | (In thousands) | | | | | | | |
Warrants | | $ | 156,600 | | Option Pricing Valuation Model | | Expected Volatility (a) | | 22.0 | % |
| | | | | | | | | | |
| | Fair Value | | Valuation
Technique | | Unobservable
Input | | Average
Volatility | |
| | (In thousands) | | | | | | | |
Warrants | | $ | 267,800 | | Option Pricing Valuation Model | | Expected Volatility (a) | | 28.0 | % |
| | | | | | | | | | |
(a) Based on the asset volatility of comparable companies. |
The expected volatility in the table above is a significant unobservable input used to estimate the fair value of our warrant liabilities. An increase in expected volatility would increase the fair value of the liability, while a decrease in expected volatility would decrease the fair value of the liability.
11
Table of Contents
THE HOWARD HUGHES CORPORATION
NOTES TO CONDENSED CONSOLIDATED FINANCIAL STATEMENTS (Continued)
UNAUDITED
The estimated fair values of our financial instruments that are not measured at fair value on a recurring basis are as follows:
| | March 31, 2013 | | December 31, 2012 | | | June 30, 2013 | | December 31, 2012 | |
| | Carrying
Amount | | Estimated
Fair Value | | Carrying
Amount | | Estimated
Fair Value | | | Carrying
Amount | | Estimated
Fair Value | | Carrying
Amount | | Estimated
Fair Value | |
| | (In thousands) | | | (In thousands) | |
Assets: | | | | | | | | | | | | | | | | | | |
Notes receivable, net | | $ | 26,272 | | $ | 26,272 | | $ | 27,953 | | $ | 27,953 | | | $ | 22,976 | | $ | 22,976 | | $ | 27,953 | | $ | 27,953 | |
Tax indemnity receivable, including interest | | 319,617 | | | (a) | 319,622 | | | (a) | | 313,925 | | | (a) | 319,622 | | | (a) |
| | | | | | | | | | | | | | | | | | |
Liabilities: | | | | | | | | | | | | | | | | | | |
Fixed-rate debt | | $ | 158,610 | | $ | 159,916 | | $ | 158,636 | | $ | 158,879 | | | $ | 158,310 | | $ | 152,610 | | $ | 158,636 | | $ | 158,879 | |
Variable-rate debt (b) | | 491,894 | | 491,894 | | 479,964 | | 479,964 | | | 515,497 | | 515,497 | | 479,964 | | 479,964 | |
SID bonds | | 46,257 | | 48,775 | | 49,712 | | 56,475 | | | 41,723 | | 47,665 | | 49,712 | | 56,475 | |
Total mortgages, notes and loans payable | | $ | 696,761 | | $ | 700,585 | | $ | 688,312 | | $ | 695,318 | | | $ | 715,530 | | $ | 715,772 | | $ | 688,312 | | $ | 695,318 | |
(a) It is not practicable to estimate the fair value of the tax indemnity receivable, including interest, as the timing and ultimate amount received under contract is highly dependent on numerous future events that cannot be reliably predicted. |
(b) As more fully described below, $172.0 million of variable-rate debt has been swapped to a fixed rate for the term of the related debt. |
Notes receivable are carried at net realizable value, which approximates fair value. The estimated fair values of these notes receivable are categorized as Level 3 due to certain factors, such as current interest rates, terms of the note and credit worthiness of the borrower.
The fair value of debt in the table above was estimated based on a discounted future cash payment model using Level 2 inputs, which includes risk premiums for loans of comparable quality and a risk free rate derived from the current London Interbank Offered Rate (“LIBOR”) or U.S. Treasury obligation interest rates. The discount rates reflect our judgment as to what the approximate current lending rates for loans or groups of loans with similar maturities and credit quality would be if credit markets were operating efficiently and assuming that the debt is outstanding through maturity.
The carrying amounts of cash and cash equivalents and accounts receivable approximate fair value because of the short-term maturity of these instruments.
13
Table of Contents
THE HOWARD HUGHES CORPORATION
NOTES TO CONDENSED CONSOLIDATED FINANCIAL STATEMENTS (Continued)
UNAUDITED
NOTE 67 REAL ESTATE AFFILIATES
In the ordinary course of business, we enter into partnerships or joint ventures primarily for the development and operations of real estate assets which are referred to as Real“Real Estate Affiliates.Affiliates”. These partnerships or joint ventures are typically characterized by a non-controlling ownership interest with decision making and distribution of expected gains and losses being proportionate to the ownership interest. We account for these partnerships and joint ventures in accordance with ASC 810 (“ASC 810”).
In accordance with ASC 810, as amended, we assess our joint ventures at inception to determine if any meet the qualifications of a variable interest entity (“VIE”). We consider a partnership or joint venture a VIE if: (a) the total
12
Table of Contents
THE HOWARD HUGHES CORPORATION
NOTES TO CONDENSED CONSOLIDATED FINANCIAL STATEMENTS (Continued)
UNAUDITED
equity investment is not sufficient to permit the entity to finance its activities without additional subordinated financial support; (b) characteristics of a controlling financial interest are missing (either the ability to make decisions through voting or other rights, the obligation to absorb the expected losses of the entity or the right to receive the expected residual returns of the entity); or (c) the voting rights of the equity holders are not proportional to their obligations to absorb the expected losses of the entity and/or their rights to receive the expected residual returns of the entity, and substantially all of the entity’s activities either involve or are conducted on behalf of an investor that has disproportionately few voting rights. Upon the occurrence of certain events outlined in ASC 810, we reassess our initial determination of whether the partnership or joint venture is a VIE.
We also perform a qualitative assessment of each VIE on an ongoing basis to determine if we are the primary beneficiary, as required by ASC 810. TheUnder ASC 810, a company concludes that it is the primary beneficiary and consolidates the VIE if the company has both (a) the power to direct the economically significant activities of the entity and (b) the obligation to absorb losses of, or the right to receive benefits from, the entity that could potentially be significant to the VIE. The company considers the contractual agreements that define the ownership structure, distribution of profits and losses, risks, responsibilities, indebtedness, voting rights and board representation of the respective parties in determining if the company is the primary beneficiary. As required by ASC 810, management’s assessment of whether the company is the primary beneficiary of a VIE is continuously performed.
We account for investments in joint ventures deemed to be VIEs for which we are not considered to be the primary beneficiary but have significant influence using the equity method, and investments in joint ventures where we do not have virtually nosignificant influence on the joint venture’s operatingoperations and financial policies, on the cost method. Generally, the operating agreements with respect to our Real Estate Affiliates provide that assets, liabilities and funding obligations are shared in accordance with our ownership percentages.
In certain cases, the company is required to consolidate certain VIEs. As of March 31,June 30, 2013, the carrying values of the assets and liabilities associated with the operations of the consolidated VIEs were $20.0$34.1 million and $2.8$2.3 million, respectively. As of December 31, 2012, the carrying values of the assets and liabilities associated with the operations of the consolidated VIEVIEs were $11.7$28.3 million and $1.0 million, respectively. The assets of the VIEVIEs are restricted for use only by the particular VIEVIEs and are not available for our general operations.
14
Table of Contents
THE HOWARD HUGHES CORPORATION
NOTES TO CONDENSED CONSOLIDATED FINANCIAL STATEMENTS (Continued)
UNAUDITED
Our recent and more significant VIEs are discussed below.
ONE Ala Moana Condominium Development Project
On October 11, 2011, we and an entity jointly owned byjoined two local development partners formedto form a joint venture called HHMK Development, LLC (“HHMK Development”). The joint venture was created to explore the development of a luxury condominium tower at the Ala Moana Center in Honolulu, HI. We own 50% and our partners jointly own the remaining 50% of the venture and unanimous consent of the partners is required for all major decisions.Hawaii. On June 14, 2012, we formed another 50/50 joint venture, KR Holdings, LLC (“KR Holdings”), with the same development partners. The initial capital contribution which, is due at closingWe own 50% of each venture and our partners jointly own the construction loan, will include our interest in the condominium declaration and condominium rights for the condominium tower, owned by our wholly-owned subsidiary and cash from our partner for theirremaining 50% interest. We expect the construction loan to close in the second quarter of 2013. .
On September 17, 2012, KR Holdings closed on two $20.0 million non-recourse mezzanine loan commitments with List Island Properties, LLC and A & B Properties, Inc. These loans have a blended interest rate of 12%, must bewere drawn in full at the construction loan closing dateon May 15, 2013 and mature on April 30, 2018 with the option to extend for one year. In addition to the mezzanine loans, A & B Properties and List Island Properties both have a profit interest in KR Holdings, which entitles them to receive a share of the profits, up to a maximum of $3.0 million, after we get a return of, our capital plusand a 13% preferred return, on our capital. The venture drew $3.0 million of
KR Holdings closed the $40.0 million provided by the mezzanine lenders to fund the predevelopment costs of the venture. Perfirst mortgage construction loan on May 15, 2013. Upon closing and under the terms of the mezzanine loans,venture agreement, we sold to KR Holdings our interest in the venture is not required to repay this $3.0condominium rights for net cash proceeds of $30.8 million if theand a 50% equity interest in KR Holdings. Our partner contributed $16.8 million of cash for their 50% equity interest.
The construction loan failswill be drawn over the course of construction with the total proceeds not to close orexceed $132.0 million. The loan is secured by the condominium rights and buyers’ deposits, has no recourse to us, matures on May 15, 2016, and bears interest at one-month LIBOR plus 3.00%. Revenue recognition for individual units in a condominium project failsrequires, among other criteria, that the sales contracts be analyzed to go forward. Ofascertain that the committed predevelopment costs, $3.0 million has been funded as of March 31, 2013, of which $2.0 million is non-interest bearing. Total predevelopment costs through March 31, 2013 for bothbuyer’s initial and continuing investments are adequate. KR Holdings and HHMK, are $5.4 million, and our sharedetermined that the value of the predevelopment costs is $2.7 million.
13
Tablebuyers’ deposits qualified as sufficient investment by the buyers to recognize revenue using the percentage of Contents
THE HOWARD HUGHES CORPORATION
NOTES TO CONDENSED CONSOLIDATED FINANCIAL STATEMENTS (Continued)
UNAUDITEDcompletion method. We recorded $5.2 million in equity in earnings from Real Estate Affiliates related to KR Holdings in the condensed consolidated statement of operations for the three months ended June 30, 2013.
Millennium Woodlands Phase II, LLC
On May 14, 2012, we entered into a joint venture, Millennium Woodlands Phase II, LLC (“Millennium Phase II”), with The Dinerstein Companies, the same joint venture partner related to the Millennium Waterway Apartments I project, for the construction of a new 314-unit Class A multi-family complex in The Woodlands Town Center. Our partner is the managing member of Millennium Phase II. As the managing member, our partner controls, directs, manages and administers the affairs of Millennium Phase II. On July 5, 2012, Millennium Phase II was capitalized by our contribution of 4.8 acres of land valued at $15.5 million to the joint venture, our partner’s contribution of $3.0 million in cash and by a construction loan in the amount of $37.7 million which is guaranteed by our partner. The development of Millennium Phase II further expands our multi-family portfolio in The Woodlands Town Center.
Columbia Parcel D Joint Venture (The Metropolitan)
On October 27, 2011, we entered into a joint venture, Parcel D Development, LLC, with a local developer, Kettler, Inc., to construct a Class A apartment building with ground floor retail space in downtown Columbia, MD.Maryland. We and our partner each own 50% of the venture, and unanimous consent of the partners is required for all major decisions. At formation, we contributed land with a fair value of $20.3 million and have since made capital contributions to the venture of $0.6 million. Pursuant to the joint venture agreement, we have been making improvements to the land. Subsequent to June 30, 2013, the joint venture closed a $64.1 million construction loan which is non-recourse to us, and we received a cash distribution of $7.6 million. The loan bears interest at LIBOR plus 2.4% and matures in July 2020.
15
Table of Contents
THE HOWARD HUGHES CORPORATION
NOTES TO CONDENSED CONSOLIDATED FINANCIAL STATEMENTS (Continued)
UNAUDITED
Summerlin Las Vegas Baseball Club
On August 6, 2012, we entered into a joint venture for the purpose of acquiring 100% of the operating assets of the Las Vegas 51s, a Triple-A baseball team which is a member of the Pacific Coast League. We own 50% of the venture and our partners jointly own the remaining 50%. Unanimous consent of the partners is required for all major decisions. In August 2012, we contributed $0.3 million to the joint venture pending final approval of the acquisition by Major League Baseball. In May 2013, after approval was received, we funded our remaining capital obligation of $10.2 million and the joint venture completed the acquisition. Our strategy in acquiring an ownership interest is to pursue a potential relocation of the team to a to-be-built stadium in our Summerlin master planned community. There can be no assurance that such a stadium will ultimately be built.
HHMK Development, KR Holdings, Millennium Phase II, Parcel D Development, LLC and the Summerlin Las Vegas Baseball Club joint venture entities included in the table below are VIEs. We are not the primary beneficiary of any of thethese VIEs discussed above because we do not have the unilateral power to direct activities that most significantly impact the economic performance of thesuch joint ventureventures and therefore we report our interests on the equity method.
HHMK Development, KR Holdings, Millennium Phase II, and the Parcel D Development, LLC joint venture entities included in the table below are VIEs. The aggregate carrying value of the unconsolidated VIEs was $9.4$32.7 million and $7.8$8.1 million as of March 31,June 30, 2013 and December 31, 2012, respectively, and was classified as Investments in Real Estate Affiliates in the Condensed Consolidated Balance Sheets. These joint ventures are in the pre development stage, therefore there were no earnings for the three months ended March 31, 2013 and 2012, respectively. Our maximum exposure to loss as a result of these investments is limited to the aggregate carrying value of the investment as we have not provided any guarantees or otherwise made firm commitments to fund amounts on behalf of these VIEs.
Below is a summary of our Investments in Real Estate Affiliates:
| | Economic/ Legal Ownership | | Carrying Value | | Share of Earnings/Dividends | |
| | June 30, | | December 31, | | June 30, | | December 31, | | Three Months Ended June 30, | | Six Months Ended June 30, | |
Equity Method Investments | | 2013 | | 2012 | | 2013 | | 2012 | | 2013 | | 2012 | | 2013 | | 2012 | |
| | (In percentages) | | (In thousands) | | (In thousands) | |
| | | | | | | | | | | | | | | | | |
Circle T | | 50.00 | % | 50.00 | % | $ | 9,036 | | $ | 9,004 | | $ | — | | $ | — | | $ | — | | $ | — | |
Forest View/Timbermill Apartments (a) | | — | | — | | — | | — | | — | | 2 | | — | | 4 | |
HHMK Development, LLC | | 50.00 | % | 50.00 | % | 163 | | 1,257 | | 153 | | — | | 153 | | — | |
KR Holdings, LLC | | 50.00 | % | 50.00 | % | 13,508 | | — | | 5,191 | | — | | 5,191 | | — | |
Millennium Waterway Apartments (b) | | 100.00 | % | 100.00 | % | — | | — | | — | | 185 | | — | | 406 | |
Millennium Woodlands Phase II, LLC (c) | | 81.43 | % | 81.43 | % | 2,196 | | 2,190 | | — | | — | | — | | — | |
Parcel D Development, LLC | | 50.00 | % | 50.00 | % | 6,302 | | 4,330 | | — | | — | | — | | — | |
Stewart Title | | 50.00 | % | 50.00 | % | 3,887 | | 3,871 | | 326 | | 257 | | 517 | | 316 | |
Woodlands Sarofim #1 | | 20.00 | % | 20.00 | % | 2,526 | | 2,450 | | 37 | | 2 | | 76 | | 20 | |
Summerlin Las Vegas Baseball Club | | 50.00 | % | 50.00 | % | 10,500 | | 300 | | — | | — | | — | | — | |
| | | | | | 48,118 | | 23,402 | | 5,707 | | 446 | | 5,937 | | 746 | |
Cost basis investments (d) | | | | | | 8,614 | | 8,777 | | — | | — | | 2,503 | | 2,376 | |
Investment in Real Estate Affiliates | | | | | | $ | 56,732 | | $ | 32,179 | | $ | 5,707 | | $ | 446 | | $ | 8,440 | | $ | 3,122 | |
14(a)On April 19, 2012, the joint ventures owning the Forest View and Timbermill Apartments completed their sale to a third party. Our share of the distributable cash, after repayment of debt and transaction expenses, was $8.6 million.
(b)On May 31, 2012, we acquired our partner’s interest for $6.9 million and consolidated this property. See below for further discussion.
(c)Represents our ownership percentage as of July 5, 2012, the date that the partners contributed capital to the venture.
(d)Includes distribution received from Summerlin Hospital Medical Center.
16
Table of Contents
THE HOWARD HUGHES CORPORATION
NOTES TO CONDENSED CONSOLIDATED FINANCIAL STATEMENTS (Continued)
UNAUDITED
Below isOn May 31, 2012, we acquired our partner’s interest in the 393-unit Millennium Waterway Apartments for $6.9 million, following the funding of a summary$55.6 million ten-year non-recourse mortgage bearing interest at 3.75%. Prior to the acquisition, we accounted for our investment in Millennium Waterway Apartments under the equity method. We now own 100% of this stabilized Class A multi-family property located in The Woodlands Town Center. Total assets of $78.6 million and liabilities of $56.4 million, including the then recently funded loan, were consolidated into our Investments in Real Estate Affiliates:
| | Economic/ Legal Ownership | | Carrying Value | | Share of Earnings/Dividends | |
| | March 31, | | December 31, | | March 31, | | December 31, | | Three Months Ended March 31, | |
Equity Method Investments | | 2013 | | 2012 | | 2013 | | 2012 | | 2013 | | 2012 | |
| | (In percentages) | | (In thousands) | | (In thousands) | |
| | | | | | | | | | | | | |
Circle T | | 50.00 | % | 50.00 | % | $ | 9,004 | | $ | 9,004 | | $ | — | | $ | — | |
Forest View/Timbermill Apartments | | — | | — | | — | | — | | — | | 4 | |
HHMK Development, LLC | | 50.00 | % | 50.00 | % | 1,796 | | 1,257 | | — | | — | |
KR Holdings, LLC | | 50.00 | % | 50.00 | % | — | | — | | — | | — | |
Millennium Waterway Apartments | | 100.00 | % | 100.00 | % | — | | — | | — | | 220 | |
Millennium Woodlands Phase II, LLC | | 81.43 | % | 81.43 | % | 2,190 | | 2,190 | | — | | — | |
Parcel D Development, LLC | | 50.00 | % | 50.00 | % | 5,410 | | 4,330 | | — | | — | |
Stewart Title | | 50.00 | % | 50.00 | % | 3,762 | | 3,871 | | 191 | | 59 | |
Woodlands Sarofim #1 | | 20.00 | % | 20.00 | % | 2,489 | | 2,450 | | 39 | | 18 | |
Other investments | | | | | | 300 | | 300 | | — | | — | |
| | | | | | 24,951 | | 23,402 | | 230 | | 301 | |
Cost basis investments (a) | | | | | | 8,695 | | 8,777 | | 2,503 | | 2,376 | |
Investment in Real Estate Affiliates | | | | | | $ | 33,646 | | $ | 32,179 | | $ | 2,733 | | $ | 2,677 | |
(a) Includes distribution received from Summerlin Hospital Medical Center.financial statements at fair value as of the acquisition date.
As of March 31,June 30, 2013, approximately $15.9$56.7 million of indebtedness was secured by the properties owned by our Real Estate Affiliates of which our share was approximately $7.9$29.5 million based upon our economic ownership. The debt is non-recourse to us.
15
Table of Contents
THE HOWARD HUGHES CORPORATION
NOTES TO CONDENSED CONSOLIDATED FINANCIAL STATEMENTS (Continued)
UNAUDITED
NOTE 78 MORTGAGES, NOTES AND LOANS PAYABLE
Mortgages, notes and loans payable are summarized as follows:
| | March 31, | | December 31, | | | June 30, | | December 31, | |
| | 2013 | | 2012 | | | 2013 | | 2012 | |
| | (In thousands) | | | (In thousands) | |
Fixed-rate debt: | | | | | | | | | | | | |
Collateralized mortgages, notes and loans payable | | $ | 158,610 | | $ | 158,636 | | | $ | 158,310 | | $ | 158,636 | |
Special Improvement District bonds | | 46,257 | | 49,712 | | | 41,723 | | 49,712 | |
Variable-rate debt: | | | | | | | | | | |
Collateralized mortgages, notes and loans payable (a) | | 491,894 | | 479,964 | | | 515,497 | | 479,964 | |
Total mortgages, notes and loans payable | | $ | 696,761 | | $ | 688,312 | | | $ | 715,530 | | $ | 688,312 | |
(a) As more fully described below, $172.0 million of variable-rate debt has been swapped to a fixed rate for the term of the related debt.
17
Table of Contents
THE HOWARD HUGHES CORPORATION
NOTES TO CONDENSED CONSOLIDATED FINANCIAL STATEMENTS (Continued)
UNAUDITED
The following table presents our mortgages, notes, and loans payable by property:
| | | | | | Maximum | | Carrying Value | |
| | | | Interest | | Facility | | June 30, | | December 31, | |
$ In thousands | | Maturity (a) | | Rate | | Amount | | 2013 | | 2012 | |
| | | | | | | | (In thousands) | |
Master Planned Communities | | | | | | | | | | | |
The Woodlands Master Credit Facility (b) | | March 2015 | | 5.00 | % | $ | 270,000 | | $ | 176,663 | | $ | 176,704 | |
Bridgeland Land Loan (c) | | June 2022 | | 5.50 | % | | | 18,066 | | 18,066 | |
Bridgeland Development Loan (d) | | June 2015 | | 5.00 | % | 30,000 | | 10,388 | | — | |
Summerlin West - S808/S810 | | April 2031 | | 7.13 | % | | | 18,432 | | 22,185 | |
Summerlin South - S151 | | June 2025 | | 6.00 | % | | | 7,034 | | 10,501 | |
Summerlin South - S128C | | December 2030 | | 6.05 | % | | | 5,625 | | 5,739 | |
Summerlin South - S132 | | December 2020 | | 6.00 | % | | | 4,478 | | 4,822 | |
Summerlin South - S108 | | December 2016 | | 5.95 | % | | | 947 | | 1,067 | |
Summerlin South - S128 | | December 2020 | | 7.30 | % | | | 747 | | 787 | |
Summerlin South - S124 | | December 2019 | | 5.95 | % | | | 305 | | 324 | |
Master Planned Communities Total | | | | | | | | 242,685 | | 240,195 | |
| | | | | | | | | | | |
Operating Assets | | | | | | | | | | | |
Victoria Ward (e) | | September 2016 | | 3.39 | % | 250,000 | | 229,000 | | 229,000 | |
Millennium Waterway Apartments | | June 2022 | | 3.75 | % | | | 55,584 | | 55,584 | |
4 Waterway Square | | December 2023 | | 4.88 | % | | | 39,695 | | 40,140 | |
The Woodlands Resort and Conference Center (f) | | February 2019 | | 3.69 | % | 95,000 | | 36,100 | | 36,100 | |
110 N. Wacker (g) | | October 2019 | | 5.21 | % | | | 29,000 | | 29,000 | |
3 Waterway Square (h) | | January 2017 | | 2.84 | % | 43,295 | | 26,713 | | 9,150 | |
70 Columbia Corporate Center | | August 2017 | | 4.25 | % | | | 16,287 | | 16,037 | |
20/25 Waterway Avenue | | May 2022 | | 4.79 | % | | | 14,450 | | 14,450 | |
9303 New Trails | | December 2023 | | 4.88 | % | | | 13,554 | | 13,706 | |
Columbia Regional Building (i) | | March 2018 | | 2.25 | % | 23,008 | | 1,266 | | — | |
Capital lease obligation | | various | | 3.82 | % | | | 13 | | 41 | |
Operating Assets Total | | | | | | | | 461,662 | | 443,208 | |
| | | | | | | | | | | |
Strategic Developments | | | | | | | | | | | |
One Hughes Landing (j) | | November 2017 | | 2.84 | % | 38,000 | | 6,367 | | 10 | |
The Shops at Summerlin - S128 | | December 2030 | | 6.05 | % | | | 3,635 | | 3,701 | |
The Shops at Summerlin - S108 | | December 2016 | | 5.95 | % | | | 520 | | 586 | |
Strategic Developments Total | | | | | | | | 10,522 | | 4,297 | |
| | | | | | | | | | | |
Other Financing Arrangements | | July 2015 | | — | | | | 661 | | 612 | |
| | | | | | | | | | | |
| | | | | | | | $ | 715,530 | | $ | 688,312 | |
| | | | | | | | | | | | | | |
16(a)Maturity date includes any extension periods which can be exercised at our option.
(b)Loan bears interest at one-month LIBOR + 4.00% and has a 5.00% minimum rate.
(c)Loan is for ten year term. First five years interest is fixed at 5.50% and for second five years interest rate is floating based on three-month LIBOR +2.75%.
(d)Revolving development loan provides for a maximum of $30.0 million outstanding balance at any time with all draws not exceeding $140.0 million. The loan bears interest at the greater of 5.00% or LIBOR + 3.25%.
(e)Loan has a stated interest rate of one-month LIBOR + 2.50%. $143.0 million of the outstanding principal balance is swapped to a 3.80% fixed rate through maturity.
(f)Loan was refinanced in February 2013 and bears interest at one-month LIBOR + 3.50%.
(g)Loan has a stated interest rate of one-month LIBOR + 2.25%. The $29.0 million outstanding principal balance is swapped to a 5.21% fixed rate through maturity.
(h)On August 2, 2013, the loan was refinanced with a $52.0 million loan bearing interest at 3.94% and maturity in August 2028.
(i)Loan bears interest at prime rate for draws less than $0.5 million. For draws over $0.5 million, we may elect to use LIBOR + 2.00% or the prime rate.
(j)Loan bears interest at one-month LIBOR + 2.65%.
18
Table of Contents
THE HOWARD HUGHES CORPORATION
NOTES TO CONDENSED CONSOLIDATED FINANCIAL STATEMENTS (Continued)
UNAUDITED
| | | | | | Maximum | | Carrying Value | |
| | | | Interest | | Facility | | March 31, | | December 31, | |
$ In Thousands | | Maturity (a) | | Rate | | Amount | | 2013 | | 2012 | |
| | | | | | | | (In thousands) | |
| | | | | | | | | | | |
110 N. Wacker (b) | | October 2019 | | 5.21 | % | | | $ | 29,000 | | $ | 29,000 | |
| | | | | | | | | | | |
70 Columbia Corporate Center | | August 2017 | | 4.25 | % | | | 16,037 | | 16,037 | |
| | | | | | | | | | | |
Columbia Regional Building (c) | | March 2018 | | 3.25 | % | $ | 23,008 | | 212 | | — | |
| | | | | | | | | | | |
Other Financing Arrangements | | July 2015 | | — | | | | 897 | | 612 | |
| | | | | | | | | | | |
Bridgeland | | | | | | | | | | | |
Land Loan (d) | | June 2022 | | 5.50 | % | | | 18,066 | | 18,066 | |
Development Loan (e) | | June 2015 | | 5.00 | % | $ | 30,000 | | 4,963 | | — | |
Bridgeland Total | | | | | | | | 23,029 | | 18,066 | |
| | | | | | | | | | | |
Special Improvement District bonds | | | | | | | | | | | |
Summerlin South - S108 | | December 2016 | | 5.95 | % | | | 1,067 | | 1,067 | |
Summerlin South - S124 | | December 2019 | | 5.95 | % | | | 324 | | 324 | |
Summerlin South - S128 | | December 2020 | | 7.30 | % | | | 787 | | 787 | |
Summerlin South - S128C | | December 2030 | | 6.05 | % | | | 5,739 | | 5,739 | |
Summerlin South - S132 | | December 2020 | | 6.00 | % | | | 4,757 | | 4,822 | |
Summerlin South - S151 | | June 2025 | | 6.00 | % | | | 7,419 | | 10,501 | |
Summerlin West - S810 | | April 2031 | | 7.13 | % | | | 21,877 | | 22,185 | |
The Shops at Summerlin Centre - S108 | | December 2016 | | 5.95 | % | | | 586 | | 586 | |
The Shops at Summerlin Centre - S128 | | December 2030 | | 6.05 | % | | | 3,701 | | 3,701 | |
Special Improvement District bonds Total | | | | | | | | 46,257 | | 49,712 | |
| | | | | | | | | | | |
The Woodlands | | | | | | | | | | | |
Master Credit Facility (f) | | March 2015 | | 5.00 | % | $ | 270,000 | | 176,663 | | 176,704 | |
Resort and Conference Center (g) | | February 2019 | | 3.70 | % | $ | 95,000 | | 36,100 | | 36,100 | |
Capital lease obligation | | various | | 3.31 | % | | | 26 | | 41 | |
4 Waterway Square | | December 2023 | | 4.88 | % | $ | 41,000 | | 39,919 | | 40,140 | |
9303 New Trails | | December 2023 | | 4.88 | % | $ | 14,000 | | 13,631 | | 13,706 | |
3 Waterway Square (h) | | January 2017 | | 2.85 | % | $ | 43,295 | | 15,946 | | 9,150 | |
One Hughes Landing (h) | | November 2017 | | 2.85 | % | $ | 38,000 | | 10 | | 10 | |
20/25 Waterway Avenue | | May 2022 | | 4.79 | % | $ | 14,450 | | 14,450 | | 14,450 | |
Millennium Waterway Apartments | | June 2022 | | 3.75 | % | $ | 55,600 | | 55,584 | | 55,584 | |
The Woodlands Total | | | | | | | | 352,329 | | 345,885 | |
| | | | | | | | | | | |
Ward Centers (i) | | September 2016 | | 3.39 | % | $ | 250,000 | | 229,000 | | 229,000 | |
| | | | | | | | $ | 696,761 | | $ | 688,312 | |
(a)Maturity date includes any extension periods which can be exercised at our option.
(b)Loan has a stated interest rate of one-month LIBOR + 2.25%. The $29.0 million outstanding principal balance is swapped to a 5.21% fixed rate through maturity.
(c)Loan bears interest at prime rate for draws less than $0.5 million. For draws over $0.5 million, we make election to use LIBOR+2.00% or the prime rate. Loan payments are interest only until March 2016.
(d)Loan is for ten year term. First five years interest is fixed at 5.50% and for second five years interest rate is floating based on three-month LIBOR +2.75%.
(e)Revolving development loan provides for a maximum of $30.0 million outstanding balance at any time with aggregate draws not to exceed $140.0 million. The loan bears interest at the greater of 5.00% or LIBOR + 3.25%.
(f)Loan bears interest at one-month LIBOR + 4.00% and has a 5.00% minimum rate.
(g)Loan was refinanced in February 2013 and bears interest at one-month LIBOR + 3.50%.
(h)Loan bears interest at one-month LIBOR + 2.65%.
(i)Loan has a stated interest rate of one-month LIBOR + 2.50%. $143.0 million of the outstanding principal balance is swapped to a 3.80% fixed rate through maturity.
The weighted average interest rate on our mortgages, notes and loans payable was 4.30%4.25% and 4.49% as of March 31,June 30, 2013 and December 31, 2012, respectively.
Mortgages, Notes and Loans Payable
As of March 31,June 30, 2013, we had $696.8$715.5 million of mortgages, notes and loans payable. All of the debt is secured by the individual properties as listed in the table above and is non-recourse to HHC, except for a $7.0 million parent guarantee associated with the 110 N. Wacker mortgage. The Woodlands Master Credit Facility and Resort and
17
Table of Contents
THE HOWARD HUGHES CORPORATION
NOTES TO CONDENSED CONSOLIDATED FINANCIAL STATEMENTS (Continued)
UNAUDITED
Conference Center loans are also recourse to the partnerships that directly own The Woodlands operations. Certain of our loans contain provisions which grant the lender a security interest in the operating cash flow of the property that represents the collateral for the loan. Such provisions are not expected to impact our operations in 2013. Certain mortgage notes may be prepaid, but may be subject to a prepayment penalty equal to a yield-maintenance premium, defeasance or a percentage of the loan balance. As of June 30, 2013, land, buildings and equipment and developments in progress with a cost basis of $1.6 billion have been pledged as collateral for our mortgages, notes and loans payable. On July 26, 2013, we closed on a $22.5 million loan to acquire a company airplane. The loan bears interest at 3.0 %, requires $1.0 million annual amortization and matures in July 2018.
As of June 30, 2013, we were in compliance with all of the financial covenants related to our debt agreements.
Master Planned Communities
The Woodlands Master Credit Facility is a $270.0 million facility consisting of a $170.0 million term loan and a $100.0 million revolving credit line (together, the “TWL Facility”). As of March 31,June 30, 2013, the TWL Facility had an outstanding balance of $176.7 million. The TWL Facility bears interest at one-month LIBOR plus 4.00% with a 1.00% LIBOR5.00% floor, has a March 29, 2014 initial maturity date and a one-year extension at borrower’s option. The TWL Facility also contains certain restrictions or covenants that, among other things, require the maintenance of specified financial ratios, restrictlimit the incurrence of additional recourse indebtedness at The Woodlands, and limit distributions from The Woodlands to us. Until The Woodlands leverage, as defined by the credit agreement, is less than a 40.0% loan to value ratio, we must amortize the debt on a dollar for dollar basis for any distributions that we make from The Woodlands. As of March 31,June 30, 2013, leverage was approximately 25.0%25.5%. There was $58.3 million of undrawn and available borrowing capacity under the TWL Facility based on the collateral underlying the facility and covenants as of March 31,June 30, 2013. The TWL Facility also requires mandatory principal amortization payments during its initial term and during the extension period, if exercised. Repayments of $30.0 million are required on March 29, 2014. Furthermore, $10.0 million is due on each of June 29, September 29 and December 29, 2014 during the extension period.
On September 30, 2011, we closed on a $250.0 million non-recourse first mortgage financing secured by Ward Centers in Honolulu, Hawaii, that bears interest at one month LIBOR plus 2.50%. The loan may be drawn to a maximum $250.0 million to fund capital expenditures at the property, provided that the outstanding principal balance cannot exceed 65% of the property’s appraised value and the borrowers are required to have a minimum 10.0% debt yield in order to draw additional loan proceeds under the facility. The loan also permits partial repayment during its term in connection with property releases for development. The loan matures on September 29, 2016, and $143.0 million of the principal balance was swapped to a 3.80% fixed rate for the term of the loan. The loan had a weighted-average interest rate of 3.39% as of March 31, 2013. The unused portion of this mortgage was $21.0 million as of March 31, 2013.
The Woodlands Resort and Conference Center loan had a $36.1 million outstanding balance as of December 31, 2012. On February 8, 2013, we closed on a $95.0 million of non-recourse construction financing which repaid the existing $36.1 million mortgage and provides funding for the redevelopment of The Woodlands Resort and Conference Center. The loan bears interest at one month LIBOR plus 3.50% and has an initial maturity of February 8, 2016, with three one-year extensions at our option. The loan is secured by a 440-room and 40-acre conference center and resort located within The Woodlands, and requires the maintenance of specified financial ratios after completion of construction.
On May 31, 2012, as part of our acquisition of our former partner’s interest in Millennium Waterway Apartments, we consolidated a $55.6 million non-recourse first mortgage loan. The proceeds from the mortgage were used to refinance the joint venture’s existing debt and to fund our acquisition of the partner’s interest in the property. The loan matures on June 1, 2022 and has a fixed interest rate of 3.75%. Payments are interest only until June 2017, then monthly principal and interest payments of $257,418 with the unpaid principal balance due at maturity.
On February 2, 2012, we closed on a non-recourse financing totaling $43.3 million for the construction of 3 Waterway Square, an eleven-story, 232,000-square foot office building in The Woodlands. The loan matures on January 31, 2015 and has two, one-year extension options. The loan bears interest at one month LIBOR plus 2.65%.
On December 5, 2011, we obtained a $41.0 million loan for 4 Waterway Square and a $14.0 million loan for 9303 New Trails. The non-recourse mortgages mature on December 11, 2023 and have fixed interest rates of 4.88%.
18
Table of Contents
THE HOWARD HUGHES CORPORATION
NOTES TO CONDENSED CONSOLIDATED FINANCIAL STATEMENTS (Continued)
UNAUDITED
On November 14, 2012, we closed on a non-recourse financing totaling $38.0 million for the construction of One Hughes Landing, an eight-story, 195,000 square foot office building in The Woodlands. The loan matures on November 15, 2015 and has two, one-year extension options. The loan bears interest at LIBOR plus 2.65%.
On March 15, 2013, we closed on a non-recourse financing totaling $23.0 million for the redevelopment of The Columbia Regional Building (also known as The Rouse Building), an office building located in Columbia, Maryland. The loan bears interest at LIBOR plus 2.00% and is interest only through the initial maturity date of March 15, 2016. The loan has two one-year extension options.
During the second quarter of 2012, we refinanced $18.1 million of existing debt related to our Bridgeland Master Planned Community with a ten-year term loan facility at a fixed interest rate of 5.50% for the first five years and three-month LIBOR plus 2.75% for the remaining term and maturing on June 29, 2022. Beginning on June 29, 2014, annual principal payments are required in the amount of 5.00% of the then outstanding principal balance. In addition, we simultaneously entered into a three-year revolving credit facility with aggregate borrowing capacity of $140.0 million of which $31.4$39.2 million has been utilized and which has a $30.0 million maximum outstanding loan amount at any time. The revolving loan bears interest at the greater of 5.00% or LIBOR plus 3.25% and matures on June 29, 2015. This loan is intended to provide working capital at Bridgeland in order to accelerate development efforts to meet the demand of homebuilders for finished lots in the community. The Bridgeland loans are cross collateralizedcross-collateralized and cross-defaulted and the Bridgeland Master Planned Community serves as collateral for the loans. The loans also require that Bridgeland maintain a minimum $3.0 million cash balance and a minimum net worth of $250.0 million. Additionally, we are restricted from making cash distributions from Bridgeland unless the revolver has no outstanding balance and one year of real estate taxes and debt service on the term loan have been escrowed with the lender.
On August 15, 2012, we assumed a $16.0 million loan as part19
Table of the acquisition of 70 Columbia Corporate Center (“70 CCC”). The non-recourse, interest only promissory note matures on August 31, 2017, has a fixed rate of 4.25% and is secured by the property. The loan includes a participation right to the lender for 30% of the appreciation in the market value of the property after our preferred our 10% cumulative preferred return and repayment of the outstanding debt and our contributed equity. This participation obligation is fair valued each quarter and the change in fair value is recorded through interest expense. For the three months ended March 31, 2013, $2.6 million relating to the increase in value of the participation due to increased leasing of the property was recorded as interest expense. Virtually all of the interest was capitalized due to our development activities.
On April 26, 2012, we closed on a 10-year, fixed rate loan with interest at 4.79% secured by 20/25 Waterway Avenue. The proceeds from the loan were $13.6 million.
As of March 31, 2013, $1.5 billion of land, buildings and equipment and developments in progress (before accumulated depreciation) have been pledged as collateral for our mortgages, notes and loans payable.Contents
Special Improvement District BondsTHE HOWARD HUGHES CORPORATION
NOTES TO CONDENSED CONSOLIDATED FINANCIAL STATEMENTS (Continued)
UNAUDITED
The Summerlin Master Planned Community uses Special Improvement District bonds to finance certain common infrastructure improvements. These bonds are issued by the municipalities and, although unrated, are secured by the assessments on the land. The majority of proceeds from each bond issued is held in a construction escrow and disbursed to us as infrastructure projects are completed, inspected by the municipalities and approved for reimbursement. Accordingly, the Special Improvement District bonds have been classified as debt. The Summerlin Master Planned Community pays the debt service on the bonds semi-annually. However, our residential land sales contracts provide for the reimbursement of the principal amounts included in these debt service payments. In addition, as Summerlin sells land, the purchasers assume a proportionate share of the bond obligation.
AsOperating Assets
On March 15, 2013, we closed on a non-recourse financing totaling $23.0 million for the redevelopment of The Columbia Regional Building (also known as The Rouse Building), an office building located in Columbia, Maryland. The loan bears interest at one-month LIBOR plus 2.00% and is interest only through the initial maturity date of March 31,15, 2016. The loan has two, one-year extension options.
On February 8, 2013, we wereclosed on a $95.0 million non-recourse construction loan which repaid the existing $36.1 million mortgage and provides funding for the redevelopment of The Woodlands Resort and Conference Center. The loan bears interest at one-month LIBOR plus 3.50% and has an initial maturity of February 8, 2016, with three one-year extensions at our option. The loan is secured by a 440-room and 40-acre conference center and resort located within The Woodlands, and requires the maintenance of specified financial ratios after completion of construction.
On August 15, 2012, we assumed a $16.0 million loan as part of the acquisition of 70 Columbia Corporate Center (“70 CCC”). The non-recourse, interest only promissory note matures on August 31, 2017, has a fixed rate of 4.25% and is secured by the property. The loan includes a participation right to the lender for 30% of the appreciation in compliance withthe market value of the property after our 10% cumulative preferred return and repayment of the outstanding debt and our contributed equity. The fair value of the participation obligation is remeasured each quarter and the change in fair value is recorded through interest expense. For the six months ended June 30, 2013, $2.7 million relating to the increase in value of the participation due to increased leasing of the property was recorded as interest expense. Virtually all of the financial covenants relatedinterest was capitalized due to our development activities.
On May 31, 2012, as part of the acquisition of our former partner’s interest in Millennium Waterway Apartments, we consolidated a $55.6 million non-recourse first mortgage loan. The proceeds from the mortgage were used to refinance the joint venture’s existing debt agreements.and to fund our acquisition of the partner’s interest in the property. The loan matures on June 1, 2022 and has a fixed interest rate of 3.75%. Payments are interest only until June 2017, then monthly principal and interest payments of $257,418 with the unpaid principal balance due at maturity.
On April 26, 2012, we closed on a 10-year, fixed rate loan with interest at 4.79% secured by 20/25 Waterway Avenue. The proceeds from the loan were $13.6 million.
On February 2, 2012, we closed on a non-recourse financing totaling $43.3 million for the construction of 3 Waterway Square, an eleven-story, 232,000-square foot office building in The Woodlands. The loan matures on January 31, 2015 and has two, one-year extension options. The loan bears interest at one-month LIBOR plus 2.65%. On August 2, 2013, we refinanced the loan with a $52.0 million non-recourse first mortgage financing bearing interest at 3.94% and maturing in August 2028.
On December 5, 2011, we obtained a $41.0 million loan for 4 Waterway Square and a $14.0 million loan for 9303 New Trails. The non-recourse mortgages mature on December 11, 2023 and have fixed interest rates of 4.88%.
1920
Table of Contents
THE HOWARD HUGHES CORPORATION
NOTES TO CONDENSED CONSOLIDATED FINANCIAL STATEMENTS (Continued)
UNAUDITED
On September 30, 2011, we closed on a $250.0 million non-recourse first mortgage financing secured by Ward Centers in Honolulu, Hawaii, that bears interest at one-month LIBOR plus 2.50%. The loan may be drawn to a maximum $250.0 million to fund capital expenditures at the property, provided that the outstanding principal balance cannot exceed 65% of the property’s appraised value, and the borrowers are required to have a minimum 10.0% debt yield in order to draw additional loan proceeds under the facility. The loan also permits partial repayment during its term in connection with property releases for development. The loan matures on September 29, 2016, and $143.0 million of the principal balance was swapped to a 3.80% fixed rate for the term of the loan. The loan had a weighted-average interest rate of 3.39% as of June 30, 2013. The unused portion of this mortgage was $21.0 million as of June 30, 2013.
Strategic Developments
On November 14, 2012, we closed on a non-recourse financing totaling $38.0 million for the construction of One Hughes Landing, an eight-story, 197,000 square foot office building in The Woodlands. The loan matures on November 15, 2015 and has two, one-year extension options. The loan bears interest at LIBOR plus 2.65%.
NOTE 89 DERIVATIVE INSTRUMENTS AND HEDGING ACTIVITIES
We are primarily exposed to interest rate risks related to our variable interest debt, and we seek to manage this risk by utilizing interest rate derivatives. Our objectives in using interest rate derivatives are to add stability to interest costs by reducing our exposure to interest rate movements. To accomplish this objective, and predictability, we use interest rate swaps and caps as part of our interest rate risk management strategy. Interest rate swaps designated as cash flow hedges involve the receipt of variable amounts from a counterparty in exchange for the Company making fixed-rate payments over the life of the agreements without exchange of the underlying notional amount. Interest rate caps designated as cash flow hedges involve the receipt of variable amounts from a counterparty if interest rates rise above the strike rate on the contract in exchange for an up-front premium.
The effective portion of changes in the fair value of derivatives designated and that qualify as cash flow hedges is recorded in Accumulated Other Comprehensive Income (“AOCI”) and is subsequently reclassified into earnings in the period that the hedged forecasted transaction affects earnings. The outstanding derivatives as of March 31,June 30, 2013, were used to hedge the variable cash flows associated with existing variable-rate debt. The ineffective portion of the change in fair value of the derivatives is recognized directly in earnings. During the three and six months ended March 31,June 30, 2013, the ineffective portion recorded in earnings was insignificant.
Amounts reported in AOCI related to derivatives will be reclassified to interest expense as interest payments are made on our variable-rate debt. Over the next 12 months, we estimate that an additional $2.3 million will be reclassified as an increase to interest expense.
As of March 31,June 30, 2013, we had gross notional amounts of $172.0 million for interest rate swaps and a $100.0 million interest rate cap that were designated as cash flow hedges of interest rate risk. The fair value of the interest rate cap derivative was insignificant.
If the interest rate swap agreements are terminated prior to their maturity, the amounts previously recorded in AOCI are recognized into earnings over the period that the hedged transaction impacts earnings. If the hedging relationship is discontinued because it is probable that the forecasted transaction will not occur according to the original strategy, any related amounts previously recorded in AOCI are recognized in earnings immediately.
The table below presents the fair value of our derivative financial instruments which are included in accounts payable and accrued liabilities in the Condensed Consolidated Balance Sheets:
| | March 31, | | December 31, | |
| | 2013 | | 2012 | |
| | (In thousands) | |
Interest Rate Swaps | | $ | 6,691 | | $ | 7,183 | |
Total derivatives designated as hedging instruments | | $ | 6,691 | | $ | 7,183 | |
2021
Table of Contents
THE HOWARD HUGHES CORPORATION
NOTES TO CONDENSED CONSOLIDATED FINANCIAL STATEMENTS (Continued)
UNAUDITED
The table below presents the fair value of our derivative financial instruments which are included in accounts payable and accrued liabilities in the Condensed Consolidated Balance Sheets:
| | June 30, | | December 31, | |
| | 2013 | | 2012 | |
| | (In thousands) | |
Interest Rate Swaps | | $ | 4,281 | | $ | 7,183 | |
Total derivatives designated as hedging instruments | | $ | 4,281 | | $ | 7,183 | |
The table below presents the effect of our derivative financial instruments on the Condensed Consolidated Statements of Operations for the three and six months ended March 31,June 30, 2013 and 2012:
| | | | | | | | | Three Months Ended June 30, | |
| | Three months ended March 31, | | | | Three months ended March 31, | | | Three Months Ended June 30, | | Location of Gain | | 2013 | | 2012 | |
| | 2013 | | 2012 | | Location of Gain | | 2013 | | 2012 | | | 2013 | | 2012 | | (Loss) Reclassified | | Amount of (Loss) | | Amount of (Loss) | |
Cash Flow Hedges | | Amount of (Loss)
Recognized in OCI | | Amount of (Loss)
Recognized in OCI | | (Loss) Reclassified
from AOCI into
Earnings | | Amount of (Loss)
Reclassified from
AOCI into Earnings | | Amount of (Loss)
Reclassified from
AOCI into Earnings | | | Amount of Gain
Recognized in OCI | | Amount of (Loss)
Recognized in OCI | | from AOCI into
Earnings | | Reclassified from
AOCI into Earnings | | Reclassified from
AOCI into Earnings | |
| | (In thousands) | | | | (In thousands) | | | (In thousands) | | | | (In thousands) | |
| | | | | | | | | | | | | | | | | | | | | | |
Interest Rate Swaps | | $ | (98 | ) | $ | (391 | ) | Interest Expense | | $ | (519 | ) | $ | (493 | ) | | $ | 1,583 | | $ | (2,770 | ) | Interest Expense | | $ | (528 | ) | $ | (507 | ) |
| | $ | (98 | ) | $ | (391 | ) | | | $ | (519 | ) | $ | (493 | ) | | $ | 1,583 | | $ | (2,770 | ) | | | $ | (528 | ) | $ | (507 | ) |
| | | | | | | | Six Months Ended June 30, | |
| | Six Months Ended June 30, | | Location of Gain | | 2013 | | 2012 | |
| | 2013 | | 2012 | | (Loss) Reclassified | | Amount of (Loss) | | Amount of (Loss) | |
Cash Flow Hedges | | Amount of Gain
Recognized in OCI | | Amount of (Loss)
Recognized in OCI | | from AOCI into
Earnings | | Reclassified from
AOCI into Earnings | | Reclassified from
AOCI into Earnings | |
| | (In thousands) | | | | (In thousands) | |
| | | | | | | | | | | |
Interest Rate Swaps | | $ | 1,486 | | $ | (3,161 | ) | Interest Expense | | $ | (1,047 | ) | $ | (1,000 | ) |
| | $ | 1,486 | | $ | (3,161 | ) | | | $ | (1,047 | ) | $ | (1,000 | ) |
22
Table of Contents
THE HOWARD HUGHES CORPORATION
NOTES TO CONDENSED CONSOLIDATED FINANCIAL STATEMENTS (Continued)
UNAUDITED
NOTE 910 INCOME TAXES
Several of our subsidiaries are involved in a dispute with the IRS relating to years in which those subsidiaries were owned by General Growth Properties (“GGP”), and in connection therewith, GGP has provided us with an indemnity against certain potential tax liabilities. Pursuant to the Tax Matters Agreement, GGP has indemnified us from and against 93.75% of any and all losses, claims, damages, liabilities and reasonable expenses to which we become subject (the “Tax Indemnity”), in each case solely to the extent directly attributable to certain taxes related to sales of certain assets in our Master Planned Communities segment prior to March 31, 2010 (“MPC Taxes”), in an amount up to $303.8 million, plus interest and penalties related to these amounts (the “Indemnity Cap”) so long as GGP controls the action in the United States Tax Court (the “Tax Court”) related to the dispute with the IRS as described below. We recorded the Tax Indemnity receivable at the Indemnity Cap amount as of the spinoff date. The unrecognized tax benefits and related accrued interest recorded through March 31,June 30, 2013 are primarily related to the taxes that are the subject of the Tax Indemnity. We have recorded interest income receivable on the Tax Indemnity receivable in the amounts of $38.4$40.2 million and $36.4 million as of March 31,June 30, 2013 and December 31, 2012, respectively.
The timing of the utilization of the tax assets attributable to indemnified and non-indemnified gains results in changes to the Tax Indemnity receivable and is dependent on numerous future events, such as the timing of recognition of indemnified and non-indemnified gains, the amount of each type of gain recognized in each year, the use of specific deductions and the ultimate amount of indemnified gains recognized. These non-cash changes could be material to our financial statements. Resolution of the Tax Court case noted below could also result in changes to the Master Planned Community deferred gains and the timing of utilization of the tax assets, both of which could result in changes to the Tax Indemnity receivable. We record the Tax Indemnity receivable based on the amounts indemnified which are determined in accordance with the provisions set forth in ASC 740 (Income Taxes).
During the three and six months ended March 31,June 30, 2013, the reduction in tax indemnity receivable of $1.9$7.5 million and $9.4 million related to our utilization of tax assets that contractually limit the amount we can receive pursuant to the Tax Matters Agreement and changes to our deferred tax liability for the MPC Taxes.
On May 6, 2011, GGP filed Tax Court petitions on behalf of the two former taxable REIT subsidiaries of GGP seeking a redetermination of federal income tax for the years 2007 and 2008. The petitions seek to overturn determinations by the IRS that the taxpayers were liable for combined deficiencies totaling $144.1 million. On October 20, 2011, GGP filed a motion in the Tax Court to consolidate the cases of the two former taxable REIT
21
Table of Contents
THE HOWARD HUGHES CORPORATION
NOTES TO CONDENSED CONSOLIDATED FINANCIAL STATEMENTS (Continued)
UNAUDITED
subsidiaries of GGP subject to litigation with the Internal Revenue Service due to the common nature of the cases’ facts and circumstances and the issues being litigated. The Tax Court granted the motion to consolidate. The case was heard by the Tax Court in November 2012. We expect the Tax Court to rule on the case within the next 12 months.
Unrecognized tax benefits recorded pursuant to uncertain tax positions were $95.9 million as of March 31,June 30, 2013 and December 31, 2012, excluding interest, of which this entire amount would not impact our effective tax rate. Accrued interest related to these unrecognized tax benefits amounted to $38.7$40.5 million and $36.6 million as of March 31,June 30, 2013 and December 31, 2012, respectively. We recognized an increase in interest expense related to the unrecognized tax benefits of $2.1$1.8 million and $3.9 million for the three and six months ended March 31, 2013.June 30, 2013, respectively. A significant amount of the unrecognized tax benefits recorded in the financial statements are related to the Tax Court litigation and are expected to be resolved within the next 12 months.
We file a consolidated corporate tax return which includes all of our subsidiaries with the exception of Victoria Ward, Limited (“Ward”), substantially all of which is owned by us. Ward elected to be taxed as a REIT, commencing with the taxable year beginning January 1, 2002. Ward has satisfied the REIT distribution requirements for 2012, and presently we intend to continue to operate Ward as a REIT.
23
Table of Contents
THE HOWARD HUGHES CORPORATION
NOTES TO CONDENSED CONSOLIDATED FINANCIAL STATEMENTS (Continued)
UNAUDITED
NOTE 1011 STOCK-BASED PLANS
Stock Options
Our stock based plans are described, and informational disclosures provided, in the Notes to the Consolidated Financial Statements included in our Form 10-K for the year ended December 31, 2012. The following table summarizes our stock option plan activity for the threesix months ended March 31,June 30, 2013:
| | Stock Options | | Weighted
Average
Exercise Price | | | Stock Options | | Weighted
Average
Exercise Price | |
Stock Options Outstanding at December 31, 2012 | | 861,940 | | $ | 59.17 | | | 861,940 | | $ | 59.17 | |
Granted | | 36,100 | | 81.80 | | | 72,100 | | 92.54 | |
Forfeited | | (8,000 | ) | 59.37 | | | (15,600 | ) | 59.63 | |
Stock Options Outstanding at March 31, 2013 | | 890,040 | | $ | 60.08 | | |
Stock Options Outstanding at June 30, 2013 | | | 918,440 | | $ | 61.78 | |
OptionsGenerally, options granted vest ratably over five years,requisite service periods, expire ten years after the grant date and generally do not become exercisable until their restriction on exercise lapses after the five-year anniversary of the grant date. In May 2013 certain key employees were granted options that vest after four years of service and half of such shares vest on a graduated scale based on total shareholder return in 2017.
Restricted Stock
During the second quarter of 2013, we granted 66,038 shares of restricted stock at a share price of $101.77. The restrictions on the shares lapse after four years of service and 50% of such shares vest on a graduated scale based on achieving certain stock price appreciation in 2017. In addition, 11,394 shares of restricted stock at a share price of $97.72 were awarded to certain non-employee directors as part of an annual retainer for their services during the second quarter of 2013. Likewise, 13,033 of restricted stock shares at a share price of $60.15 were awarded during the second quarter of 2012. The restrictions on the shares granted in 2012 have lapsed and the restrictions on the shares granted in 2013 will generally lapse in the second quarter of 2014. As of June 30, 2013, there were 122,332 shares of restricted stock outstanding.
2224
Table of Contents
THE HOWARD HUGHES CORPORATION
NOTES TO CONDENSED CONSOLIDATED FINANCIAL STATEMENTS (Continued)
UNAUDITED
NOTE 1112 OTHER ASSETS AND LIABILITIES
Prepaid Expenses and Other Assets
The following table summarizes the significant components of Prepaid expenses and other assets.
| | March 31, | | December 31, | | | June 30, | | December 31, | |
| | 2013 | | 2012 | | | 2013 | | 2012 | |
| | (In thousands) | | | (In thousands) | |
Special Improvement District receivable | | $ | 39,666 | | $ | 39,659 | | | $ | 39,644 | | $ | 39,659 | |
Other receivables | | 829 | | 2,346 | | |
Tenant and other receivables | | | 9,457 | | 2,346 | |
Federal income tax receivable | | 5,580 | | 5,367 | | | 5,349 | | 5,367 | |
Prepaid expenses | | 6,497 | | 4,757 | | | 3,947 | | 4,757 | |
Below-market ground leases | | 20,256 | | 20,341 | | | 20,171 | | 20,341 | |
Condominium deposits | | 33,349 | | 19,616 | | | — | | 19,616 | |
Security and escrow deposits | | 10,356 | | 12,865 | | | 9,689 | | 12,865 | |
Above-market tenant leases | | 1,981 | | 1,896 | | | 1,200 | | 1,896 | |
Uncertain tax position asset | | 13,528 | | 12,801 | | | 14,165 | | 12,801 | |
In-place leases | | 10,336 | | 11,516 | | | 10,517 | | 11,516 | |
Intangibles | | 3,714 | | 3,714 | | | 3,714 | | 3,714 | |
Other | | 8,145 | | 8,592 | | | 7,950 | | 8,592 | |
| | $ | 154,237 | | $ | 143,470 | | | $ | 125,803 | | $ | 143,470 | |
The increasedecrease of $13.7$19.6 million in condominium deposits as of March 31,June 30, 2013 as compared to December 31, 2012 is attributeddue to the cash deposits received for the condominium pre-sales at ONE Ala Moana condominium tower. The asset and liability for these condominium deposits will be contributed, along withsale of our condominium declaration and condominium rights, to the joint venture at closingrights. The increase of the construction loan. See also Note 6 — Real Estate Affiliates. The decrease of $2.5$7.1 million in securitytenant and escrow depositsother receivables is primarily related to the utilization of $2.1$2.0 million of escrow funds establishedlease incentives at the acquisition of 70 CCC.Ward and a $4.5 million legal settlement at Riverwalk.
2325
Table of Contents
THE HOWARD HUGHES CORPORATION
NOTES TO CONDENSED CONSOLIDATED FINANCIAL STATEMENTS (Continued)
UNAUDITED
Accounts Payable and Accrued Expenses
The following table summarizes the significant components of Accounts payable and accrued expenses.
| | March 31, | | December 31, | | | June 30, | | December 31, | |
| | 2013 | | 2012 | | | 2013 | | 2012 | |
| | (In thousands) | | | (In thousands) | |
Construction payable | | $ | 18,249 | | $ | 17,501 | | | $ | 29,380 | | $ | 17,501 | |
Accounts payable and accrued expenses | | 52,504 | | 39,634 | | | 53,737 | | 39,634 | |
Condominium deposits | | 33,349 | | 19,616 | | | — | | 19,616 | |
Membership deposits | | 21,166 | | 20,248 | | | 22,416 | | 20,248 | |
Above-market ground leases | | 2,550 | | 2,590 | | | 2,510 | | 2,590 | |
Deferred gains/income | | 7,445 | | 7,767 | | | 13,770 | | 7,767 | |
Accrued interest | | 2,368 | | 2,425 | | | 2,316 | | 2,425 | |
Accrued real estate taxes | | 3,883 | | 6,622 | | | 5,259 | | 6,622 | |
Tenant and other deposits | | 9,906 | | 8,096 | | | 11,832 | | 8,096 | |
Insurance reserve | | 4,876 | | 9,037 | | | 2,832 | | 9,037 | |
Accrued payroll and other employee liabilities | | 5,889 | | 11,514 | | | 9,073 | | 11,514 | |
Interest rate swaps | | 6,691 | | 7,183 | | | 4,281 | | 7,183 | |
Special assessment | | 2,868 | | 2,868 | | | 2,868 | | 2,868 | |
Other | | 16,098 | | 15,420 | | | 17,958 | | 15,420 | |
| | $ | 187,842 | | $ | 170,521 | | | $ | 178,232 | | $ | 170,521 | |
The increase of $12.9$11.9 million in accountsconstruction payable and accrued expenses as of March 31,June 30, 2013 as compared to December 31, 2012 is primarily due to construction and renovation activities at a lease termination payment obligation relating to onenumber of the properties under development. Payments of approximately $3.3 million are due in 2014 and 2015. The decrease of $5.6$19.6 million in accrued payroll and other employee liabilitiescondominium deposits as of June 30, 2013 compared to December 31, 2012 is due to the sale of our condominium rights. The increase of $6.0 million in deferred gains/income is primarily due to increased land sales and the annual incentive compensation payout indeferral of a portion of the first quarter of 2013.income for post-sale land development obligations at our Summerlin MPC.
2426
Table of Contents
THE HOWARD HUGHES CORPORATION
NOTES TO CONDENSED CONSOLIDATED FINANCIAL STATEMENTS (Continued)
UNAUDITED
NOTE 1213 ACCUMULATED OTHER COMPREHENSIVE INCOME (LOSS)
The following table summarizes Accumulated other comprehensive income (loss)AOCI for the period indicated (amounts in thousands):
Changes in Accumulated Other Comprehensive Income (Loss) by Component (a)
For the period ended March 31, 2013Gains and Losses on Cash Flow Hedges
(In Thousands)
| | Gains and Losses on
Cash flow hedges | |
| | (In Thousands) | |
Balance as of January 1, 2013 | | $ | (9,575 | ) |
| | | |
Other comprehensive income (loss) before reclassifications | | (511 | ) |
Amounts reclassified from accumulated other comprehensive income | | 519 | |
| | | |
Net current-period other comprehensive income | | 8 | |
Balance as of March 31, 2013 | | $ | (9,567 | ) |
| | For the Three Months Ended
June 30, 2013 | | | | For the Six Months Ended
June 30, 2013 | |
Balance as of April 1, 2013 | | $ | (9,567 | ) | Balance as of January 1, 2013 | | $ | (9,575 | ) |
Other comprehensive income before reclassifications | | 1,266 | | Other comprehensive income before reclassifications | | 755 | |
Amounts reclassified from accumulated other comprehensive income (loss) | | 528 | | Amounts reclassified from accumulated other comprehensive income (loss) | | 1,047 | |
Net current-period other comprehensive income | | 1,794 | | Net current-period other comprehensive income | | 1,802 | |
Balance as of June 30, 2013 | | $ | (7,773 | ) | Balance as of June 30, 2013 | | $ | (7,773 | ) |
(a) All amounts are net of tax. Amounts in parentheses indicate debits.
The following table summarizes the amounts reclassified out of Accumulated other comprehensive income (loss)AOCI for the period indicated (amounts in thousands):
Reclassifications out of Accumulated Other Comprehensive Income (loss)(Loss) (a)
For the period ended March 31, 2013(In Thousands)
Accumulated Other Comprehensive Income
(Loss) Components | | Amounts reclassified
from Accumulated
Other Comprehensive
Income (Loss) | | Affected line item in the
Statement of Operations | | |
| | | Amounts reclassified from Accumulated Other Comprehensive
Income (Loss) | | | |
Accumulated Other Comprehensive
Income Components | | | For the Three Months
Ended June 30, 2013 | | For the Six Months Ended
June 30, 2013 | | Affected line item in the
Statement of Operations | |
Gains and losses on cash flow hedges | | | | | | | | | | | | |
Interest rate swap contracts | | $ | (449 | ) | Interest income/(expense) | | | $ | (458 | ) | $ | (907 | ) | Interest (expense) | |
| | (70 | ) | Tax (expense) or benefit | | | (70 | ) | (140 | ) | Provision for income taxes | |
Total reclassifications for the period | | $ | (519 | ) | Net of tax | | | $ | (528 | ) | (1,047 | ) | Net of tax | |
|
(a) Amounts in parentheses indicate debits to profit/loss.
2527
Table of Contents
THE HOWARD HUGHES CORPORATION
NOTES TO CONDENSED CONSOLIDATED FINANCIAL STATEMENTS (Continued)
UNAUDITED
NOTE 1314 COMMITMENTS AND CONTINGENCIES
In the normal course of business, from time to time, we are involved in legal proceedings relating to the ownership and operations of our properties. In management’s opinion, the liabilities, if any, that may ultimately result from such legal actions are not expected to have a material effect on our consolidated financial position, results of operations or liquidity.
We had outstanding letters of credit and surety bonds of $43.4$47.9 million and $49.3 million as of March 31,June 30, 2013 and December 31, 2012, respectively. These letters of credit and bonds were issued primarily in connection with insurance requirements, special real estate assessments and construction obligations.
See Note 910 — Income Taxes for additional contingencies related to our uncertain tax positions.
On June 29, 2012, we entered into an agreement to amend and restate the South Street Seaport ground lease with27, 2013, the City of New York accordingexecuted the amended and restated ground lease for South Street Seaport. The restated lease terms provide for annual fixed rent of $1.2 million starting July 1, 2013 with an expiration of December 30, 2072, including our option to extend. The annual rent escalates 3.0% compounded annually. In addition to the terms described inannual base rent of $1.2 million, we are required to make annual payments of $210,000 as additional rent through the term of the lease. The additional rent escalates annually at CPI. We are entitled to a non-binding lettertotal rent credit of intent, dated December 12, 2011 between$1.5 million, to be taken monthly over a 30 month period. Simultaneously with the New York City Economic Development Corporation and us. The agreement allowsexecution of the lease, we executed a completion guaranty for the redevelopment of Pier 17 (“Renovation Project”). On March 21, 2013, we received unanimous approval from the New York City Council17. The completion guaranty requires us to perform certain obligations under the Uniform Land Use Review Procedure (“ULURP”) for the redevelopment of Pier 17 at the South Street Seaport. The restated ground lease, will become effective when we meet certain milestones, the most important of which isincluding the commencement of construction by October 1, 2013. Following commencement2013 with a scheduled completion date of construction of the Renovation Project, annual ground rent will be fixed at $1.2 million with an escalation of 3.0% annually. We will also be entitled to a total $1.5 million rent credit, to be taken monthly over a 30-month period. However, we must provide a completion guarantee to New York City for the Renovation Project. We agreed to pay approximately $1.1 million of esplanade maintenance costs over a five-year period. The initial esplanade payment of $210,000 per year escalates annually at CPI for the duration of the lease.March 31, 2016.
In the fourth quarter of 2012, as a result of Superstorm Sandy, the Uplands portion of South Street Seaport suffered damage due to flooding, but the Pier 17 structure was not significantly damaged. Reconstruction efforts are ongoing and the property is only partially operating. We have received $5.0$6.0 million in insurance recoveries at South Street Seaport related to property damage recoveries through March 31,June 30, 2013. Remediation costs incurred through March 31, 2013 were $2.4 million, and we expect recoveries to be in excess of our carrying value. We believe that our insurance will cover substantially all of the cost of repairing the property and will also compensate us for any revenueprofits that hashave been lost as a result of the storm.
28
Table of Contents
THE HOWARD HUGHES CORPORATION
NOTES TO CONDENSED CONSOLIDATED FINANCIAL STATEMENTS (Continued)
UNAUDITED
NOTE 1415 SEGMENTS
We have three business segments which offer different products and services. Our three segments are managed separately because each requires different operating strategies or management expertise and are reflective of management’s operating philosophies and methods. In addition, our segments or assets within such segment could change in the future as development of certain properties commences or other operational or management changes occur. We do not distinguish or group our combined operations on a geographic basis. Furthermore, all operations are within the United States and no customer or tenant comprises more than 10% of revenues. Our reportable segments are as follows:
·Master Planned Communities (“MPCs”) — includes the development and sale of land in large-scale, long-term community development projects in and around Las Vegas, Nevada; Houston, Texas; and Columbia, Maryland.
· Operating Assets — includes retail and office properties, a multi-family property, The Woodlands Resort and Conference Center and other real estate investments. These assets are currently generating revenues, and we believe there is an opportunity to redevelop or reposition many of these assets to improve operating performance.
· Strategic Developments — includes all properties held for development and redevelopment which have no substantial operations.
2629
Table of Contents
THE HOWARD HUGHES CORPORATION
NOTES TO CONDENSED CONSOLIDATED FINANCIAL STATEMENTS (Continued)
UNAUDITED
The assets included in each segment as of March 31,June 30, 2013, are contained in the following chart:
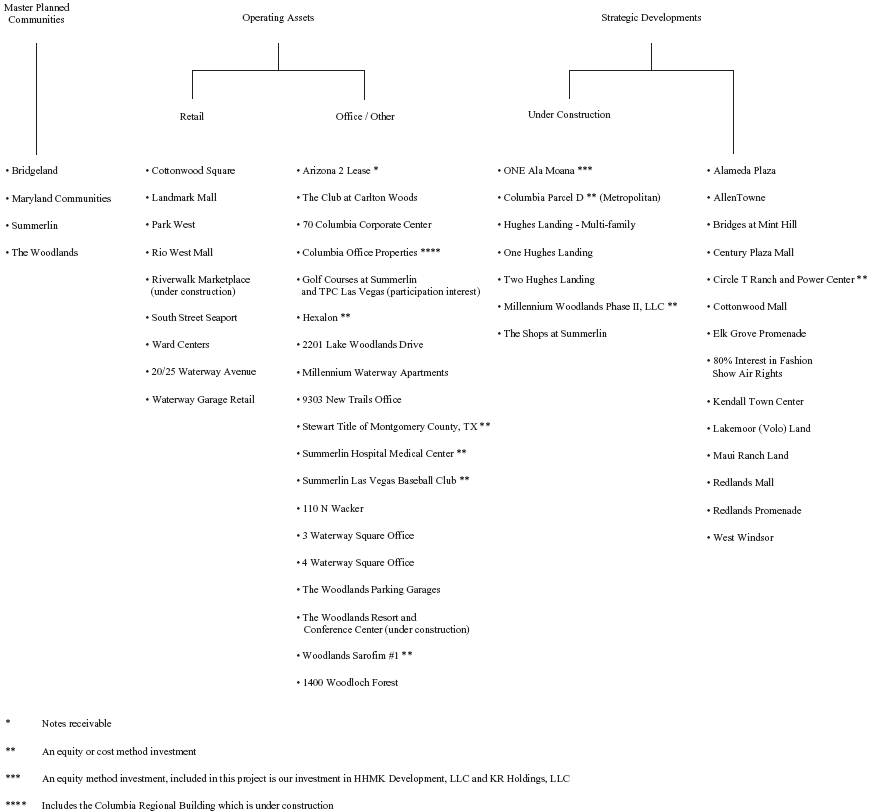
As our segments are managed separately, different operating measures are utilized to assess operating results and allocate resources among the segments. The one common operating measure used to assess operating results for the business segments is Real Estate Property Earnings Before Taxes (“REP EBT”), which represents the operating revenues of the properties less property operating expenses and adjustments for interest, as further described below. We believe REP EBT provides useful information about the operating performance for all of our assets, projects and properties.
REP EBT, as it relates to our business, is defined as net income (loss) excluding general and administrative expenses, corporate interest income, corporate interest and depreciation expense, provision for income taxes, warrant liability lossgain (loss) and the reduction in tax indemnity receivable. We present REP EBT because we use this measure, among others, internally to assess the core operating performance of our assets. We also present this measure because we believe certain investors use it as a measure of a company’s historical operating performance and its ability to service and incur debt. We believe that the inclusion of certain adjustments to net income (loss) to calculate REP EBT is appropriate to provide additional information to investors.
2730
Table of Contents
THE HOWARD HUGHES CORPORATION
NOTES TO CONDENSED CONSOLIDATED FINANCIAL STATEMENTS (Continued)
UNAUDITED
Segment operating results are as follows:
| | Three Months Ended June 30, | | Six Months Ended June 30, | |
| | 2013 | | 2012 | | 2013 | | 2012 | |
| | (In thousands) | | (In thousands) | |
Master Planned Communities | | | | | | | | | |
Land sales | | $ | 66,021 | | $ | 43,928 | | $ | 113,247 | | $ | 80,017 | |
Builder price participation | | 2,426 | | 1,528 | | 3,701 | | 2,341 | |
Minimum rents | | 194 | | 121 | | 389 | | 254 | |
Other land revenues | | 3,830 | | 3,531 | | 6,632 | | 7,016 | |
Other rental and property revenues | | — | | 19 | | — | | 35 | |
Total revenues | | 72,471 | | 49,127 | | 123,969 | | 89,663 | |
| | | | | | | | | |
Cost of sales - land | | 29,854 | | 22,978 | | 55,553 | | 41,657 | |
Land sales operations | | 8,359 | | 8,269 | | 15,312 | | 17,173 | |
Land sales real estate and business taxes | | 1,435 | | 1,698 | | 2,978 | | 3,782 | |
Depreciation and amortization | | 8 | | 2 | | 15 | | 3 | |
Interest income | | (1 | ) | (61 | ) | (16 | ) | (130 | ) |
Interest expense (*) | | (3,646 | ) | (3,657 | ) | (9,606 | ) | (7,071 | ) |
Total expenses | | 36,009 | | 29,229 | | 64,236 | | 55,414 | |
MPC EBT | | 36,462 | | 19,898 | | 59,733 | | 34,249 | |
| | | | | | | | | |
Operating Assets | | | | | | | | | |
Minimum rents | | 19,756 | | 20,222 | | 38,267 | | 38,744 | |
Tenant recoveries | | 5,041 | | 5,956 | | 10,293 | | 11,787 | |
Resort and conference center revenues | | 11,270 | | 11,970 | | 22,374 | | 21,626 | |
Other rental and property revenues | | 6,612 | | 6,240 | | 10,045 | | 10,965 | |
Total revenues | | 42,679 | | 44,388 | | 80,979 | | 83,122 | |
| | | | | | | | | |
Other property operating costs | | 16,552 | | 14,594 | | 31,517 | | 28,421 | |
Rental property real estate taxes | | 2,923 | | 2,607 | | 5,906 | | 5,226 | |
Rental property maintenance costs | | 2,032 | | 1,885 | | 3,688 | | 3,725 | |
Resort and conference center operations | | 7,680 | | 7,371 | | 15,156 | | 14,785 | |
Provision for doubtful accounts | | 277 | | 174 | | 706 | | 149 | |
Depreciation and amortization | | 6,398 | | 5,672 | | 12,516 | | 10,529 | |
Interest income | | (44 | ) | (41 | ) | (90 | ) | (86 | ) |
Interest expense | | 3,893 | | 3,714 | | 10,698 | | 7,060 | |
Equity in Earnings from Real Estate Affiliates | | (363 | ) | (446 | ) | (3,096 | ) | (3,122 | ) |
Total expenses | | 39,348 | | 35,530 | | 77,001 | | 66,687 | |
Operating Assets EBT | | 3,331 | | 8,858 | | 3,978 | | 16,435 | |
| | | | | | | | | |
Strategic Developments | | | | | | | | | |
Minimum rents | | 184 | | 234 | | 404 | | 476 | |
Tenant recoveries | | 24 | | 47 | | 97 | | 80 | |
Condominium rights and unit sales | | 30,381 | | 134 | | 30,381 | | 267 | |
Other land revenues | | — | | — | | — | | 32 | |
Other rental and property revenues | | 1,313 | | 9 | | 1,313 | | 62 | |
Total revenues | | 31,902 | | 424 | | 32,195 | | 917 | |
| | | | | | | | | |
Condominium rights and unit cost of sales | | 15,272 | | 36 | | 15,272 | | 96 | |
Condominium sales operations | | — | | 13 | | — | | 71 | |
Other property operating costs | | 782 | | 441 | | 1,337 | | 952 | |
Real estate taxes | | 436 | | 564 | | 1,210 | | 1,783 | |
Rental property maintenance costs | | 111 | | 201 | | 260 | | 316 | |
Provision for doubtful accounts | | — | | — | | — | | (104 | ) |
Depreciation and amortization | | 48 | | 59 | | 91 | | 117 | |
Interest expense * | | (675 | ) | 180 | | (962 | ) | 254 | |
Equity in Earnings from Real Estate Affiliates | | (5,344 | ) | — | | (5,344 | ) | — | |
Total expenses | | 10,630 | | 1,494 | | 11,864 | | 3,485 | |
Strategic Developments EBT | | 21,272 | | (1,070 | ) | 20,331 | | (2,568 | ) |
REP EBT | | $ | 61,065 | | $ | 27,686 | | $ | 84,042 | | $ | 48,116 | |
(*) Negative interest expense amounts relate to interest capitalized on debt assigned to our Operating Assets Segments.
31
Table of Contents
THE HOWARD HUGHES CORPORATION
NOTES TO CONDENSED CONSOLIDATED FINANCIAL STATEMENTS (Continued)
UNAUDITED
Segment operating results are as follows:
| | Three Months Ended March 31, | |
| | 2013 | | 2012 | |
| | (In thousands) | |
Master Planned Communities | | | | | |
Land sales | | $ | 47,226 | | $ | 36,089 | |
Builder price participation | | 1,275 | | 813 | |
Minimum rents | | 195 | | 132 | |
Other land revenues | | 2,802 | | 3,485 | |
Other rental and property revenues | | — | | 16 | |
Total revenues | | 51,498 | | 40,535 | |
Cost of sales - land | | 25,699 | | 18,679 | |
Land sales operations | | 6,953 | | 8,903 | |
Land sales real estate and business taxes | | 1,543 | | 2,085 | |
Depreciation and amortization | | 7 | | 2 | |
Interest income | | (15 | ) | (70 | ) |
Interest expense (*) | | (5,960 | ) | (3,414 | ) |
Total expenses | | 28,227 | | 26,185 | |
MPC EBT | | 23,271 | | 14,350 | |
| | | | | |
Operating Assets | | | | | |
Minimum rents | | 18,511 | | 18,522 | |
Tenant recoveries | | 5,252 | | 5,830 | |
Resort and conference center revenues | | 11,104 | | 9,657 | |
Other rental and property revenues | | 3,433 | | 4,726 | |
Total revenues | | 38,300 | | 38,735 | |
Other property operating costs | | 14,965 | | 13,804 | |
Rental property real estate taxes | | 2,983 | | 2,620 | |
Rental property maintenance costs | | 1,656 | | 1,840 | |
Resort and conference center operations | | 7,476 | | 7,414 | |
Provision for doubtful accounts | | 429 | | — | |
Depreciation and amortization | | 6,118 | | 4,857 | |
Interest income | | (46 | ) | (45 | ) |
Interest expense | | 6,805 | | 3,346 | |
Equity in Earnings from Real Estate Affiliates | | (2,733 | ) | (2,677 | ) |
Total expenses | | 37,653 | | 31,159 | |
Operating Assets EBT | | 647 | | 7,576 | |
| | | | | |
Strategic Developments | | | | | |
Minimum rents | | 220 | | 243 | |
Tenant recoveries | | 73 | | 34 | |
Overage rent revenue | | — | | 52 | |
Condominium unit sales | | — | | 134 | |
Other land revenues | | — | | 32 | |
Total revenues | | 293 | | 495 | |
Condominium unit cost of sales | | — | | 59 | |
Condominium sales operations | | — | | 58 | |
Other property operating costs | | 555 | | 408 | |
Real estate taxes | | 774 | | 1,219 | |
Rental property maintenance costs | | 149 | | 115 | |
Depreciation and amortization | | 43 | | 59 | |
Interest expense * | | (287 | ) | 74 | |
Total expenses | | 1,234 | | 1,992 | |
Strategic Developments EBT | | (941 | ) | (1,497 | ) |
REP EBT | | $ | 22,977 | | $ | 20,429 | |
(*) Negative interest expense amounts relate to interest capitalized on debt assigned to our Operating Assets Segments.
28
Table of Contents
THE HOWARD HUGHES CORPORATION
NOTES TO CONDENSED CONSOLIDATED FINANCIAL STATEMENTS (Continued)
UNAUDITED
The following reconciles REP EBT to GAAP-basis net income (loss):
Reconciliation of REP EBT to GAAP-net | | Three Months Ended March 31, | | | Three Months Ended June 30, | | Six Months Ended June 30, | |
income (loss) | | 2013 | | 2012 | | | 2013 | | 2012 | | 2013 | | 2012 | |
| | (In thousands) | | | (In thousands) | | (In thousands) | |
| | | | | | | | | | | | | | |
REP EBT | | $ | 22,977 | | $ | 20,429 | | | $ | 61,065 | | $ | 27,686 | | $ | 84,042 | | $ | 48,116 | |
General and administrative | | (11,171 | ) | (8,399 | ) | | (6,769 | ) | (8,160 | ) | (17,940 | ) | (16,557 | ) |
Corporate interest income, net | | 2,710 | | 2,223 | | | 1,594 | | 2,277 | | 4,304 | | 4,499 | |
Warrant liability loss | | (33,027 | ) | (121,851 | ) | |
Warrant liability gain (loss) | | | (111,200 | ) | 23,430 | | (144,227 | ) | (98,421 | ) |
Provision for income taxes | | (2,479 | ) | (3,784 | ) | | (13,361 | ) | (1,301 | ) | (15,840 | ) | (5,085 | ) |
Reduction in tax indemnity receivable | | (1,904 | ) | — | | | (7,499 | ) | (8,782 | ) | (9,403 | ) | (8,782 | ) |
Corporate depreciation | | (276 | ) | (140 | ) | | (326 | ) | (158 | ) | (602 | ) | (302 | ) |
Net loss | | $ | (23,170 | ) | $ | (111,522 | ) | |
Net income (loss) | | | $ | (76,496 | ) | $ | 34,992 | | $ | (99,666 | ) | $ | (76,532 | ) |
The following reconciles segment revenue to GAAP-basis consolidated revenues:
Reconciliation of Segment Basis Revenues to | | Three Months Ended March 31, | | | Three Months Ended June 30, | | Six Months Ended June 30, | |
GAAP Revenues | | 2013 | | 2012 | | | 2013 | | 2012 | | 2013 | | 2012 | |
| | (In thousands) | | | (In thousands) | | (In thousands) | |
| | | | | | | | | | | | | | |
Master Planned Communities | | $ | 51,498 | | $ | 40,535 | | | $ | 72,471 | | $ | 49,127 | | $ | 123,969 | | $ | 89,663 | |
Operating Assets | | 38,300 | | 38,735 | | | 42,679 | | 44,388 | | 80,979 | | 83,122 | |
Strategic Developments | | 293 | | 495 | | | 31,902 | | 424 | | 32,195 | | 917 | |
Total revenues - GAAP basis | | $ | 90,091 | | $ | 79,765 | | |
Total revenues | | | $ | 147,052 | | $ | 93,939 | | $ | 237,143 | | $ | 173,702 | |
The assets by segment and the reconciliation of total segment assets to the total assets in the condensed consolidated balance sheets as of March 31,June 30, 2013 and December 31, 2012 are summarized as follows:
| | March 31, | | December 31, | | | June 30, | | December 31, | |
| | 2013 | | 2012 | | | 2013 | | 2012 | |
| | (In thousands) | | | (In thousands) | |
Master Planned Communities | | $ | 1,781,811 | | $ | 1,756,625 | | | $ | 1,816,675 | | $ | 1,756,625 | |
Operating Assets | | 967,088 | | 944,562 | | |
Operating Assets * | | | 1,069,209 | | 944,562 | |
Strategic Developments | | 321,012 | | 288,287 | | | 265,284 | | 288,287 | |
Total segment assets | | 3,069,911 | | 2,989,474 | | | 3,151,168 | | 2,989,474 | |
Corporate and other * | | 476,501 | | 513,568 | | |
Corporate and other ** | | | 453,428 | | 513,568 | |
Total assets | | $ | 3,546,412 | | $ | 3,503,042 | | | $ | 3,604,596 | | $ | 3,503,042 | |
* Certain assets included in our Operating Asset segments are in various stages of redevelopment and are included in Developments on our condensed consolidated balance sheets.
** Assets included in Corporate and other consist primarily of the Tax indemnity receivable, including interest, and Cash and cash equivalents.
The increase in the Strategic DevelopmentOperating Assets segment’s asset balance as of March 31,June 30, 2013 of $32.7$125.0 million as compared to December 31, 2012 is primarily due to approximately $9.6$50.8 million of costs incurred relatedtotal assets from 3 Waterway Square being reclassified from the Strategic Developments segment because it was placed in service. The decrease in the Corporate and other segment’s asset balance as of June 30, 2013 of $60.1 million as compared to December 31, 2012 is primarily due to increased real estate and property cash expenditures for our Woodlandsongoing re-development and development projects within our Operating Assets and the collection of an additional $13.7 million of pre-sale condominium deposits from our ONE Ala Moana project. The balance of the increase is due to costs incurred related to our other development projects.Strategic Developments segments.
2932
Table of Contents
ITEM 2. MANAGEMENT’S DISCUSSION AND ANALYSIS OF FINANCIAL CONDITION AND RESULTS OF OPERATIONS
The following discussion should be read in conjunction with the Condensed Consolidated Financial Statements and related Notes. All references to numbered Notes are to specific footnotesnotes to our Condensed Consolidated Financial Statements included in this Quarterly Report.
Forward-looking information
We may make forward-looking statements in this Quarterly Report and in other reports that we file with the SEC. In addition, our management may make forward-looking statements orally to analysts, investors, creditors, the media and others.
Forward-looking statements include:
· Projections of our revenues, operating income, net income, earnings per share, REP EBT, capital expenditures, income tax, other contingent liabilities, dividends, leverage, capital structure or other financial items;
· Forecasts of our future economic performance; and
· Descriptions of assumptions underlying or relating to any of the foregoing.
In this Quarterly Report, for example, we make forward-looking statements discussing our expectations about:
· Capital required for our operations and development opportunities for the properties in our Strategic Developments segment;
· Expected performance of our Master Planned Communities segment and other current income producing properties; and
· Future liquidity, development opportunities, development spending and management plans.
Forward-looking statements discuss matters that are not historical facts. Because they discuss future events or conditions, forward-looking statements often include words such as “anticipate,” “believe,” “can,” “could,” “estimate,” “expect,” “forecast,” “intend,” “may,” “likely,” “plan,” “project,” “realize,” “should,” “target,” “would,” and other words of similar expressions. Forward-looking statements should not be unduly relied upon. They give our expectations about the future and are not guarantees. Forward-looking statements speak only as of the date they are made, and we might not update them to reflect changes that occur after the date they are made, except as required by law.
There are several factors, many beyond our control, which could cause results to differ materially from our expectations. These risk factors are described in our Annual Report on Form 10-K for the year ended December 31, 2012 (the “Annual Report”) and are incorporated herein by reference. Any factor could, by itself, or together with one or more other factors, adversely affect our business, results of operations or financial condition. There may also be other factors that we have not described in this Quarterly Report or in our Annual Report that could cause results to differ from our expectations. These forward-looking statements present our estimates and assumptions only as of the date of this Quarterly Report. Except as may be required by law, we undertake no obligation to modify or revise any forward-looking statements to reflect events or circumstances occurring after the date of this Quarterly Report.
Real Estate Property Earnings Before Taxes
We use a number of operating measures for assessing operating performance of our communities, assets, properties and projects within our segments, some of which may not be common among all three of our segments. We believe that investors may find some operating measures more useful than others when separately evaluating each segment. One common operating measure used to assess operating results for our business segments is Real Estate Property Earnings Before Taxes (“REP EBT”). We believe REP EBT provides useful information about our operating performance because it excludes certain non-recurring and non-cash items which we believe are not indicative of our core business.
3033
Table of Contents
REP EBT, as it relates to our business, is defined as net income (loss) excluding general and administrative expenses, corporate interest income, corporate interest and depreciation expense, provision (benefit) for income taxes, warrant liability gain (loss) and the reduction in tax indemnity receivable. We present REP EBT because we use this measure, among others, internally to assess the core operating performance of our assets. We also present this measure because we believe certain investors use it as a measure of a company’s historical operating performance and its ability to service and incur debt. We believe that the inclusion of certain adjustments to net income (loss) to calculate REP EBT is appropriate to provide additional information to investors. A reconciliation of REP EBT to consolidated net income (loss) as computed in accordance with GAAP has been presented in Note 1415 — Segments.
REP EBT should not be considered as an alternative to GAAP net income (loss) attributable to common stockholders or GAAP net income (loss), as it has limitations as an analytical tool, and should not be considered in isolation, or as a substitute for analysis of our results as reported under GAAP. Some of the limitations of this metric are that it:
· does not reflect our cash expenditures, or future requirements for capital expenditures or contractual commitments;
· does not reflect corporate general and administrative expenses;
· does not reflect income taxes that we may be required to pay;
· does not reflect any cash requirements for replacement of depreciated or amortized assets or that these assets have different useful lives;
· does not reflect limitations on, or costs related to, transferring earnings from our Real Estate Affiliates to us; and
· may be calculated differently by other companies in our industry, limiting its usefulness as a comparative measure.
Operating Assets Net Operating Income
We believe that net operating income (“NOI”) is a useful supplemental measure of the performance of our Operating Assets because it provides a performance measure that, when compared year over year, reflects the revenues and expenses directly associated with owning and operating real estate properties and the impact on operations from trends in rental and occupancy rates, rental rates and operating costs. We define NOI as revenues (rental income, tenant recoveries and other income) less expenses (real estate taxes, repairs and maintenance, marketing and other property expenses). NOI also excludes straight line rents and tenant incentives, net interest expense, depreciation, ground rent and other amortization expenses and equity in earnings from Real Estate Affiliates. We use NOI to evaluate our operating performance on a property-by-property basis because NOI allows us to evaluate the impact that factors such as lease structure, lease rates and tenant base, which vary by property, have on our operating results, gross margins and investment returns.
Although we believe that NOI provides useful information to the investors about the performance of our Operating Assets, due to the exclusions noted above, NOI should only be used as an alternative measure of the financial performance of such assets and not as an alternative to GAAP operating income (loss) or net income (loss) available to common stockholders.. For reference, and as an aid in understanding our computation of NOI, a reconciliation of NOI to REP EBT has been presented in the Operating Assets segment discussion below.
Results of Operations
Our revenues are primarily derived from the sale of individual lots at our Master Planned Communities to home builders and from tenants at our Operating Assets in the form of fixed minimum rents, overage rent and recoveries of operating expenses.
Consolidated revenues for the three and six months ended March 31,June 30, 2013 increased 12.9%$53.1 million and $63.4 million, respectively, compared to $90.1the corresponding periods in 2012, primarily due to higher revenues in our MPCs and Strategic Developments segments. MPC segment land sale revenues increased $22.1 million from $79.8and $33.2 million for the three and six months ended June 30, 2013, respectively, due to the higher demand for our residential superpad sites in Summerlin and lots in The Woodlands. Strategic Developments revenue increased $31.5 million and $31.3 million for the three and six months ended June 30, 2013 due to the sale of our ONE Ala Moana condominium rights in the second quarter.
The net loss attributable to common stockholders was $76.6 million, or $1.94 loss per diluted share, for the three months ended March 31,June 30, 2013 as compared to a net income attributable to common stockholders of $34.3 million, or $0.27 earnings per diluted share, for the corresponding period in 2012. The increase$110.9 million lower net income for the three months ended June 30, 2013 as compared to the same period in revenues2012 was primarily due to higher revenues at Summerlin of $22.9 million, which was the result of an increase in the acres sold. Our acquisition of Millenium Waterway Apartments in mid-2012 also increased first quarter 2013 revenues by $1.8 million. The Woodlands Resort and Conference Center revenues increased $1.4 million due to a 9.6% increase in revenue per available room (“RevPAR”) to $120.33 for the first quarter of 2013 as compared to $109.75 in the first quarter of 2012. Thesewarrant liability
3134
Table of Contents
increases wereloss of $111.2 million for the three months ended June 30, 2013 compared to a warrant liability gain of $23.4 million for the corresponding period in 2012. In addition, the decrease in net income was caused by higher income tax provision of $12.1 million and lower earnings from our Operating Assets segment of $5.5 million partially offset by $8.1higher MPC and Strategic Developments segment earnings of $16.6 million and $22.3 million, respectively, lower general and administrative expenses of $1.4 million and a lower land sales revenues at The Woodlands duereduction in the tax indemnity receivable of $1.3 million compared to the acceleration of sales into December of 2012 resulting from the August 2012, lot auction, lower minimum rents at South Street Seaport of $2.5 million resulting from Superstorm Sandy and lower sales at Bridgeland of $1.8 million.same period in 2012.
The net loss attributable to common stockholders was $23.1$99.7 million, or $0.59$2.53 loss per diluted share, for the threesix months ended March 31,June 30, 2013 as compared to a net loss attributable to common stockholders of $112.3$78.0 million, or $2.96$2.06 loss per diluted share, for the corresponding period in 2012. The $88.4$21.7 million lowerincrease in net loss for the three months ended March 31, 2013 as compared to the three months ended March 31, 2012 was primarily due to higher revenues of $10.3 million and a lowerhigher warrant liability loss of $88.8$45.8 million, partially offset bylower earnings from our Operating Assets segment of $12.5 million, a higher costincome tax provision of sales of $7.0$10.8 million relating to the increase in land sales,and higher general and administrative expense of $2.8$1.4 million partially offset by higher MPC and Strategic Developments segment earnings of $25.5 million and higher depreciation expense$22.9 million, respectively, and lower income attributable to our noncontrolling interest of $1.4 million.
Segment Operations
Please refer to Note 1415 - Segments for additional information including reconciliations of our segment basis results to generally accepted accounting principles (“GAAP”) basis results.
Master Planned Communities Segment
MPC revenues vary between periods based on economic conditions and several factors such as, but not limited to, location, development density and commercial or residential use. Although our business does not involve the sale or resale of homes, we believe that net new home sales are an important indicator of future demand for our pads sites and lots; therefore, we use this statistic in the discussion of our MPCs below. Reported results may differ significantly from actual cash flows generated principally because cost of sales for GAAP purposes is derived from margins calculated using carrying values, projected future improvements and other capitalized costs in relation to projected future land sale revenues. Carrying values, generally, represent acquisition costs and development costs less adjustments for previous impairment charges. Development expenditures are capitalized and generally not reflected in the Condensed Consolidated Statements of Operations in the current year.
3235
Table of Contents
MPC sales data for the three months ended March 31,June 30, 2013 and 2012 is summarized as follows:
| | Land Sales | | Acres Sold | | Number of Lots/Units | | Price per Acre | | Price per Lot | | | Land Sales | | Acres Sold | | Number of Lots/Units | | Price per Acre | | Price per Lot | |
| | Three Months ended March 31, | | | Three Months ended June 30, | |
($ In thousands) | | 2013 | | 2012 | | 2013 | | 2012 | | 2013 | | 2012 | | 2013 | | 2012 | | 2013 | | 2012 | | |
($ in thousands) | | | 2013 | | 2012 | | 2013 | | 2012 | | 2013 | | 2012 | | 2013 | | 2012 | | 2013 | | 2012 | |
| | | | | | | | | | | | | | | | | | | | | | | | | | | | | | | | | | | | | | | | | | |
Columbia | | | | | | | | | | | | | | | | | | | | | | | | | | | | | | | | | | | | | | | | | | |
Residential | | | | | | | | | | | | | | | | | | | | | | | | | | | | | | | | | | | | | | | | | | |
Townhomes | | $ | — | | $ | 1,923 | | — | | 0.6 | | — | | 13 | | $ | — | | $ | 3,419 | | $ | — | | $ | 148 | | | $ | — | | $ | 2,233 | | — | | 0.7 | | — | | 15 | | $ | — | | $ | — | | $ | — | | $ | 149 | |
| | — | | 1,923 | | — | | 0.6 | | — | | 13 | | — | | 3,419 | | — | | 148 | | | — | | 2,233 | | — | | 0.7 | | — | | 15 | | — | | — | | — | | 149 | |
| | | | | | | | | | | | | | | | | | | | | | | | | | | | | | | | | | | | | | | | | | |
Bridgeland | | | | | | | | | | | | | | | | | | | | | | | | | | | | | | | | | | | | | | | | | | |
Residential | | | | | | | | | | | | | | | | | | | | | | | | | | | | | | | | | | | | | | | | | | |
Single family - detached | | 3,589 | | 5,345 | | 12.0 | | 19.9 | | 52 | | 98 | | 299 | | 269 | | 69 | | 55 | | | 1,869 | | 5,669 | | 6.0 | | 21.6 | | 28 | | 111 | | 312 | | 262 | | 67 | | 51 | |
| | 3,589 | | 5,345 | | 12.0 | | 19.9 | | 52 | | 98 | | 299 | | 269 | | 69 | | 55 | | | 1,869 | | 5,669 | | 6.0 | | 21.6 | | 28 | | 111 | | 312 | | 262 | | 67 | | 51 | |
| | | | | | | | | | | | | | | | | | | | | | | | | | | | | | | | | | | | | | | | | | |
Summerlin | | | | | | | | | | | | | | | | | | | | | | | | | | | | | | | | | | | | | | | | | | |
Residential | | | | | | | | | | | | | | | | | | | | | | | | | | | | | | | | | | | | | | | | | | |
Single family - detached | | 6,099 | | 1,208 | | 8.4 | | 1.8 | | 63 | | 14 | | 726 | | 671 | | 97 | | 86 | | | 2,086 | | 6,536 | | 2.7 | | 9.5 | | 25 | | 66 | | 773 | | 688 | | 83 | | 99 | |
Custom lots | | 1,007 | | 790 | | 1.2 | | 0.7 | | 2 | | 2 | | 839 | | 1,068 | | 504 | | 395 | | | 1,733 | | 2,456 | | 1.7 | | 3.4 | | 4 | | 6 | | 1,019 | | 722 | | 433 | | 409 | |
Super pad sites | | 21,075 | | 5,110 | | 89.4 | | 22.7 | | 401 | | 95 | | 236 | | 225 | | 53 | | 54 | | |
Superpad sites | | | 20,434 | | 3,706 | | 55.2 | | 16.5 | | 272 | | 84 | | 370 | | 225 | | 75 | | 44 | |
Commercial | | | | | | | | | | | | | | | | | | | | | | |
Retail | | | — | | 784 | | — | | 1.0 | | — | | — | | — | | 784 | | — | | — | |
| | 28,181 | | 7,108 | | 99.0 | | 25.2 | | 466 | | 111 | | 285 | | 282 | | 60 | | 64 | | | 24,253 | | 13,482 | | 59.6 | | 30.4 | | 301 | | 156 | | 407 | | 443 | | 81 | | 81 | |
| | | | | | | | | | | | | | | | | | | | | | | | | | | | | | | | | | | | | | | | | | |
The Woodlands | | | | | | | | | | | | | | | | | | | | | | | | | | | | | | | | | | | | | | | | | | |
Residential | | | | | | | | | | | | | | | | | | | | | | | | | | | | | | | | | | | | | | | | | | |
Single family - detached | | 12,231 | | 21,035 | | 25.2 | | 58.0 | | 112 | | 202 | | 485 | | 362 | | 109 | | 104 | | | 40,581 | | 14,527 | | 65.4 | | 40.5 | | 241 | | 161 | | 621 | | 359 | | 168 | | 90 | |
Single family - attached | | 702 | | — | | 1.7 | | — | | 18 | | — | | 413 | | — | | 39 | | — | | | 872 | | — | | 2.1 | | — | | 22 | | — | | 415 | | — | | 40 | | — | |
Commercial | | | | | | | | | | | | | | | | | | | | | | |
Office and other | | | — | | 5,106 | | — | | 10.4 | | — | | — | | — | | 491 | | — | | — | |
Retail | | | — | | 1,250 | | — | | 1.2 | | — | | — | | — | | 1,042 | | — | | — | |
Other | | | 135 | | 50 | | 0.7 | | 0.8 | | — | | — | | 193 | | 63 | | — | | — | |
| | 12,933 | | 21,035 | | 26.9 | | 58.0 | | 130 | | 202 | | 481 | | 362 | | 99 | | 104 | | | 41,588 | | 20,933 | | 68.2 | | 52.9 | | 263 | | 161 | | 610 | | 396 | | 158 | | 90 | |
Total acreage sales revenue | | 44,703 | | 35,411 | | 137.9 | | 103.7 | | 648 | | 424 | | | | | | | | | | | 67,710 | | 42,317 | | 133.8 | | 105.6 | | 592 | | 443 | | | | | | | | | |
Deferred revenue | | (1,604 | ) | (743 | ) | | | | | | | | | | | | | | | | | | (6,055 | ) | (77 | ) | | | | | | | | | | | | | | | | |
Special Improvement District revenue | | 4,127 | | 1,421 | | | | | | | | | | | | | | | | | | | 4,366 | | 1,688 | | | | | | | | | | | | | | | | | |
Total segment land sale revenues | | $ | 47,226 | | $ | 36,089 | | | | | | | | | | | | | | | | | | | $ | 66,021 | | $ | 43,928 | | | | | | | | | | | | | | | | | |
|
3336
Table of Contents
Total MPC sales data for the six months ended June 30, 2013 and 2012 is summarized as follows:
| | Land Sales | | Acres Sold | | Number of Lots/Units | | Price per Acre | | Price per Lot | |
| | Six Months ended June 30, | |
($ in thousands) | | 2013 | | 2012 | | 2013 | | 2012 | | 2013 | | 2012 | | 2013 | | 2012 | | 2013 | | 2012 | |
| | | | | | | | | | | | | | | | | | | | | |
Columbia | | | | | | | | | | | | | | | | | | | | | |
Residential | | | | | | | | | | | | | | | | | | | | | |
Townhomes | | $ | — | | $ | 4,156 | | — | | 1.2 | | — | | 28 | | $ | — | | $ | — | | $ | — | | $ | 148 | |
| | — | | 4,156 | | — | | 1.2 | | — | | 28 | | — | | — | | — | | 148 | |
| | | | | | | | | | | | | | | | | | | | | |
Bridgeland | | | | | | | | | | | | | | | | | | | | | |
Residential | | | | | | | | | | | | | | | | | | | | | |
Single family - detached | | 5,458 | | 11,014 | | 18.0 | | 41.5 | | 80 | | 209 | | 303 | | 266 | | 68 | | 53 | |
| | 5,458 | | 11,014 | | 18.0 | | 41.5 | | 80 | | 209 | | 303 | | 266 | | 68 | | 53 | |
| | | | | | | | | | | | | | | | | | | | | |
Summerlin | | | | | | | | | | | | | | | | | | | | | |
Residential | | | | | | | | | | | | | | | | | | | | | |
Single family - detached | | 8,185 | | 7,744 | | 11.1 | | 11.3 | | 88 | | 80 | | 737 | | 685 | | 93 | | 97 | |
Custom lots | | 2,740 | | 3,246 | | 2.9 | | 4.1 | | 6 | | 8 | | 945 | | 792 | | 457 | | 406 | |
Superpad sites | | 41,509 | | 8,816 | | 143.0 | | 39.2 | | 673 | | 179 | | 290 | | 225 | | 62 | | 49 | |
Commercial | | | | | | | | | | | | | | | | | | | | | |
Retail | | — | | 784 | | — | | 1.0 | | — | | — | | — | | 784 | | — | | — | |
Not-for-profit | | — | | — | | — | | — | | — | | — | | — | | — | | — | | — | |
| | 52,434 | | 20,590 | | 157.0 | | 55.6 | | 767 | | 267 | | 334 | | 370 | | 68 | | 74 | |
| | | | | | | | | | | | | | | | | | | | | |
The Woodlands | | | | | | | | | | | | | | | | | | | | | |
Residential | | | | | | | | | | | | | | | | | | | | | |
Single family - detached | | 52,812 | | 35,562 | | 90.6 | | 98.7 | | 353 | | 363 | | 583 | | 360 | | 150 | | 98 | |
Single family - attached | | 1,574 | | — | | 3.8 | | — | | 40 | | — | | 414 | | — | | 39 | | — | |
Commercial | | | | | | | | | | | | | | | | | | | | | |
Office and other | | — | | 5,106 | | — | | 10.4 | | — | | — | | — | | 491 | | — | | — | |
Retail | | — | | 1,250 | | — | | 1.2 | | — | | — | | — | | 1,042 | | — | | — | |
Other | | 135 | | 50 | | 0.7 | | 0.8 | | — | | — | | 193 | | 63 | | — | | — | |
| | 54,521 | | 41,968 | | 95.1 | | 111.1 | | 393 | | 363 | | 573 | | 378 | | 138 | | 98 | |
Total acreage sales revenue | | 112,413 | | 77,728 | | 270.1 | | 209.4 | | 1,240 | | 867 | | | | | | | | | |
Deferred revenue | | (7,659 | ) | (820 | ) | | | | | | | | | | | | | | | | |
Special Improvement District revenue | | 8,493 | | 3,109 | | | | | | | | | | | | | | | | | |
Total segment land sale revenues | | $ | 113,247 | | $ | 80,017 | | | | | | | | | | | | | | | | | |
| | | | | | | | | | | | | | | | | | | | | | | | | | | |
37
Table of Contents
MPC segment land sales increased $11.150.3%, or $22.1 million, to $47.2$66.0 million for the three months ended March 31,June 30, 2013, and increased 41.5%, or $33.2 million to $113.2 million for the six months ended June 30, 2013, as compared to $36.1$43.9 million and $80.0 million for the same periods in 2012. Land sales for the three months ended March��31, 2012. Residential land sales,ending June 30, 2013, including Special Improvement District (“SID”) assumptions and reimbursements and deferred revenue adjustments, increased at Summerlin and The Woodlands by $22.978.1%, or $28.1 million to $64.2 million, partially offset by a decrease of $11.8$6.0 million in land sales at Bridgeland Columbiaand Columbia. Residential land sales for the six months ended June 30, 2013, including SID assumptions and reimbursements and deferred revenue adjustments, increased at Summerlin and The Woodlands.Woodlands by 66.2%, or $42.9 million to $107.8 million, partially offset by a decrease of $9.7 million in land sales at Bridgeland and Columbia. The increase in residential land sales is primarily due to increased pad site salesstrong homebuilder demand for superpad sites at Summerlin and the closing of $16.0 million resulting from significant improvementsales of 267 high priced auction lots in market conditions. There were no commercial land sales at any of our MPCs during the first quarter of 2013 or 2012.The Woodlands.
Price per acre is a function of density and lot price. However, higher density does not always result in higher price per acre as in certain communities larger lots generate a significant premium. For large MPCs such as ours, sales prices on a per lot basis and per acre basis generally increase as the size of the developed lot grows. This is because smaller lots are more commodity-like and larger lots may have more unique features. The average homebuyer will findfinds more competition for new and resale homes on the lower end of the price range in the broader residential market. As lot sizes and prices increase, the number of potential customercustomers and developer basedevelopers decreases. Barring a softening in market conditions, when a MPC reaches the level whereby land is scarce, pricing begins to escalate markedly on a per lot and per acre basis due to a scarcity premium resulting from the market’s realization that new home site inventory will be depleted.
The Woodlands and Bridgeland MPCs
The Woodlands residential land sales were $12.9increased 98.7%, or $20.7 million, representing 130to $41.6 million and increased 29.9%, or $12.5 million to $54.5 million, for the three and six months ended June 30, 2013, respectively, compared to $20.9 million and $42.0 million for the corresponding periods in 2012 due to the higher number of lots sold duringat significantly higher prices. The increase in the number of lots sold for both the three and six months ended March 31,June 30, 2013, which was $8.1primarily relates to 215 lot closings from lot auctions conducted at the end of 2012 and in 2013 representing $36.9 million lower and 72 lots fewer than the same period in 2012. Lot sales revenues were lowerof revenue in the firstsecond quarter of 2013. In the second quarter of 2013, dueone of the builders accelerated their lot takedown by 40 lots, which provided additional revenues of $10.0 million. Per the auction contract, these lots were scheduled to be spread out equally and close on a quarterly basis starting in the thirdsecond quarter lot auction described below, which accelerated sales toof 2013 through the fourth quarter of 2012 that normally would have closed in the first quarter of 2013. The price per acre for the three months ended March 31, 2013 was $481,000, which was $119,000, or 32.9% higher than the $362,000 per acre for the same period in 2012. The increase in average price per acre is a direct result of the auction process for lots in The Woodlands, which was implemented in the third quarter of 2012.2014.
In the third quarter of 2012, we modified our production lot sales program to an auction process that generated a substantial increase in average lot price.prices. Since August 2012, The first auction offered 375Woodlands has auctioned 858 lots in seven sectionsthrough June 30, 2013. In 2012, 298 of these lots closed providing $38.5 million of revenues. For the six month ended June 30, 2013, another 267 of these lots have closed representing $43.6 million of revenues. The remaining 293 lots are projected to home builders inclose over the next three years for $49.7 million. 93 lots are projected to close prior to the end of 2013 representing $12.6 million of revenues. Three auctions have occurred to date with lot prices increasing significantly at each auction. The Woodlands. Thethird auction generated an aggregate price increase in price of approximately $16.7 million, or 49.4%,98% as compared to selling prices prior to the auction. During the fourth quarter of 2012, 298 of these lots closed representing $38.5 million. In the first quarter of 2013, another 26 of these lots closed providing $4.6 million in sales. The remaining 51 lots will be closed during the remainder of 2013. During December 2012 and the first quarter of 2013, another 316 lots were offered in our second auction. This auction generated anticipated revenues of $51.8 million, assuming all contracts close, representing a 25.6% average price increase over our prior auction prices for similar sized lots. Termsimplementation of the contracts provide for lot closings over a three-year period. The first 26 lots, representing $2.0 million, closedauction program in the first quarter of 2013 and $12.7 million are scheduled to close during the remainder of 2013. We plan to continue the auction process for future sections to ensure we maximize values.2012.
Bridgeland’s land sales revenues were $3.6decreased $3.8 million with 52 lot salesto $1.9 million for the three months ended March 31,June 30, 2013 asand decreased $5.6 million to $5.5 million for the six months ended June 30, 2013, compared to $5.3$5.7 million and 98 lot sales$11.0 million for the same periodcorresponding periods in 2012. The decrease in lot sales revenues in both the first quarter ofthree and six months ended June 30, 2013, as compared to the same periodperiods in 2012 relates primarily to the availability of lot inventory. As described in the following paragraph, Bridgeland’s inventory levels are low due to pending permits from the U.S. Army Corps of Engineers (“USACE”). The average price per acre at Bridgeland increased 11.2% to $299,000 per acre for the first quarter of 2013, as compared to $269,000 per acre in the first quarter of 2012. The average lot price in the first quarter of 2013 increased 25.5% as compared to the first quarter of 2012. This increase resulted from both increases in lot pricing during 2012 and the mix of higher end lots sold. Due to decreased inventory levels, there were fewer lower priced lots sold in the first quarter of 2013 as compared to the first quarter of 2012.
At Bridgeland, and as described in our financial statements for the year ended 2012, weWe are pursuing a wetland permit from the USACE to build on 806 acres of land for future development. We do not expect toand reasonably believe that we will receive the permit until the second half of 2013; however, the timing of receiving the permit is unknown.before year end. Bridgeland had 6642 lots in inventory as of March 31,June 30, 2013, and until the permit is received, finished lot inventory production will be slowedslow dramatically. Based on the foregoing, weWe expect lot sales at Bridgeland to be downdecrease significantly infor the second and third quartershalf of 2013 as compared to 2012, and production could continue to be slow beyond that period if receipt of the permit is delayed further.
The average price per acre at Bridgeland increased 19.1% to $312,000 per acre for the second quarter of 2013, as compared to $262,000 per acre in the second quarter of 2012. The average lot price in the second quarter of 2013 increased to $67,000 as compared to $51,000 in the second quarter of 2012. This 31.4% increase resulted from increases in lot pricing during 2012 and more higher end lots sold. Due to decreased inventory levels, we sold fewer lower priced lots in the second quarter of 2013 as compared to the second quarter of 2012.
3438
Table of Contents
There were no commercial land sales at Bridgeland for the three months ended March 31, 2013. We expect minimal commercial sales until new home sales generate a critical mass of demand for local commercial retail, office and lodging properties.
The Houston, Texas area has benefittedcontinues to benefit from a strong energy sector. AccordingAdditionally, we expect the construction of the Grand Parkway to positively impact the Bureausurrounding areas. The Grand Parkway is an approximate 180-mile circumferential highway traversing seven counties and encircling the Greater Houston region. Construction of Labor Statistics (“BLS”),Segment E (from IH 10 to US 290) of the area’s unemployment rate atGrand Parkway should be completed by late 2013 or early 2014, and segments F1 (from US 290 to SH 249) and F2 (from SH 249 to IH 45) are scheduled for completion in early 2015, both of which will have a positive impact on travel patterns for residents living in The Woodlands and Bridgeland. In addition, the end of February 2013Grand Parkway was approximately 6.3%, which was 1.8 percentage points lower than the 8.1% national average. ExxonMobil is constructinginstrumental in ExxonMobil’s decision to relocate and construct a large corporate campus on a 385-acre site just south of The Woodlands. The site is expected to include approximately 20 buildings, representing three million square feet of space.space, and is one of the largest construction projects currently under way in the U.S. ExxonMobil expects to begin relocating employees intoto this new location starting in early 2014 and ending in 2015. Upon completion of the relocation, ExxonMobil projects there will be approximately 10,000 employees workingwill work at the new campus.campus, of which approximately 2,000 workers will relocate from out of state. We believe that the direct and indirect jobs related to this relocation will have a significantly positivepositively impact on The Woodlands and Bridgeland due to increased housing demand, as well as commercial space needs for companies servicing ExxonMobil. Construction of Segment E of The Grand Parkway should be completed by late 2013 or early 2014, and segments F1 and F2 are scheduled for completion in early 2015, both of which will have a positive impact on travel patterns for residents living in The Woodlands and Bridgeland.
Summerlin MPC
Summerlin’s residential land sales improvedincreased 79.9%, or $10.8 million, to $28.2$24.3 million for the first quarter of 2013, which was a $21.1 million, or a 297.2% increase, as compared to the $7.1 million of land sales in the first quarter of 2012. Summerlin sold 466 residential lots during the three months ended March 31,June 30, 2013, asand increased 154.7%, or $31.8 million to $52.4 million for the six months ended June 30, 2013, compared to 111 residential lots during$13.5 million and $20.6 million for the three months ended March 31, 2012. The primary reason for this increasecorresponding periods in revenues was the sale of 401 home sites on 89.4 acres2012 primarily due to significantly higher sales of superpad sites.sites in terms of volume and price per acre. Superpad sites are siteslocations where major utilities (water, sewer and drainage) and roads are constructed to the edge of the property and the homebuilder completes the on-site utilities and roads providing finished lots. The average price per acre for superpads increased 64.4% to $370,000 for the three months ended March 31,second quarter 2013 was $285,000 as compared to $282,000 during the same time period insecond quarter 2012. The average price per lot was $60,000increase is caused primarily by a scarcity of attractive developable residential land in the first quarter of 2013 as compared to $64,000 in the first quarter of 2012. The decrease in average lot price was due to the high volume of superpad site sales in 2013, which are priced lower than single family finished lotsmarket and custom lots.improving new housing demand.
Builder activity continues to improve in Summerlin with 160179 new home sales during the firstsecond quarter of 2013, which is a 35.6%34.6% increase as compared to the 118133 new home sales in the firstsecond quarter of 2012. Inventory levels for both the new home segment and the resale market continue to decline, resulting in improved home pricing, which we believe will translate to increasinghigher per acre land prices through the remainder of 2013. As new home prices increase, we also earn higher price participation fees from the homebuilders and the value of our land inventory also increases. As of March 31,June 30, 2013, Summerlin had 246710 residential lots under contract representing approximately $40.0$79.6 million of sales, of which $11.9$51.5 million are scheduled to close in 2013.
35
Table of Contents
Total revenuerevenues and expenses for the MPC segment isare summarized as follows:
Master Planned Communities Revenues and Expenses (*)
| | Three months Ended March 31, | | | Three Months Ended June 30, | | Six Months Ended June 30, | |
| | 2013 | | 2012 | | | 2013 | | 2012 | | 2013 | | 2012 | |
| | (In thousands) | | | (In thousands) | | (In thousands) | |
| | | | | | | | | | | | | | |
Land sales | | $ | 47,226 | | $ | 36,089 | | | $ | 66,021 | | $ | 43,928 | | $ | 113,247 | | $ | 80,017 | |
Builder price participation | | 1,275 | | 813 | | | 2,426 | | 1,528 | | 3,701 | | 2,341 | |
Other land sale revenues | | 2,997 | | 3,633 | | |
Other land revenues and minimum rents | | | 4,024 | | 3,671 | | 7,021 | | 7,305 | |
Total revenues | | 51,498 | | 40,535 | | | 72,471 | | 49,127 | | 123,969 | | 89,663 | |
| | | | | | | | | | | | | | |
Cost of sales - land | | 25,699 | | 18,679 | | | 29,854 | | 22,978 | | 55,553 | | 41,657 | |
Land sales operations | | 8,496 | | 10,988 | | | 9,794 | | 9,967 | | 18,290 | | 20,955 | |
Depreciation and amortization | | 7 | | 2 | | | 8 | | 2 | | 15 | | 3 | |
Interest expense, net | | (5,975 | ) | (3,484 | ) | | (3,647 | ) | (3,718 | ) | (9,622 | ) | (7,201 | ) |
Total expenses | | 28,227 | | 26,185 | | | 36,009 | | 29,229 | | 64,236 | | 55,414 | |
MPC REP EBT | | $ | 23,271 | | $ | 14,350 | | | $ | 36,462 | | $ | 19,898 | | $ | 59,733 | | $ | 34,249 | |
(*) For a detailed breakdown of our MPC segment EBT, please refer to Note 1415 - Segments of our Condensed Consolidated Financial Statements.
Summerlin land sales, including SID reimbursements and deferred revenue adjustments, increased $22.9 million for the three months ended March 31, 2013. This land sales increase was offset by $11.8 million lower land sales at Columbia, Bridgeland and The Woodlands in the first quarter39
Table of 2013. The net land sales increase for the first quarter of 2013 was $11.1 million.Contents
Builder price participation represents the contractual percentage we collect from builder home settlements with thesales to homebuyers. Generally, the percentage ranges from one to two percent of the home price, but can vary by contract and community. Builder price participation increased $0.5$0.9 million inand $1.4 million for the first quarter ofthree and six months ended June 30, 2013, respectively, as compared to the first quarter ofsame periods in 2012, primarily due to increased home closings at Summerlin.Summerlin and The Woodlands.
Other land sale revenues for the three months ended March 31,June 30, 2013 increased $0.4 million and for the six months ended June 30, 2013 decreased by $0.6$0.3 million, as compared to the three and six months ended March 31,June 30, 2012. The primary reason for thisthe increase in the second quarter was due to a change of land use fee collected in Summerlin while the year-to-date decrease was due to lower easement fee revenues in The Woodlands. The contract that provided this source of revenueseasement fees in The Woodlands expired in June 2012.
The cost of sales - land sales increased by $7.0$6.9 million and $13.9 million for the three and six months ended March 31,June 30, 2013, respectively, as compared to the same periodperiods in 2012, primarily due to higher land sales revenue at Summerlin.Summerlin and The Woodlands. Our total land sales gross margins, which include builder price participation, decreasedincreased to 47.0%56.4% and 52.5% for the first quarter ofthree and six months ended June 30, 2013, respectively, as compared to 49.5% and 49.4%, respectively, for the first quarter ofsame periods in 2012. The decreaseincrease in gross margin relates primarily to the cost percentages attributable to the Summerlin MPC,mix of higher revenues at The Woodlands which generated 65.0% of the revenues in the first quarter of 2013 versus 21.6% of the revenues in the first quarter of 2012. Summerlin’s average cost ratio was 61.3% in the first quarter of 2013 versus thehas a lower cost ratios at Bridgeland and The Woodlands of 32.4% and 44.2%, respectively. Summerlin has an overall lower gross marginsales than Bridgeland and The Woodlands.Summerlin.
Land sales operations decreased $2.5$0.2 million and $2.7 million for the quarterthree and six months ended March 31,June 30, 2013, respectively, as compared to the same periodperiods in 2012. The majority of this decrease relates to reduced advertising and marketing costs, commissions and selling expenses, repairs and maintenance costs, general and administrative expenses and real estate taxes. There were no commercialoffice or retail land sales in the firstsecond quarter of 2013, which resulted in lower commissions and selling expenses. In addition, there was a reduction inwe reduced advertising and marketing expenses resulting from theas a result of co-branding of The Woodlands and Bridgeland.
36
Table of Contents
Interest expense, net reflects the amount of interest that is capitalized at the project level. The increase for the threesix months ended March 31,June 30, 2013, as compared to the same period in 2012, is related to a higher qualified asset base and increased debt levels providing the opportunity forwhich resulted in increased capitalized interest.
In addition to REP EBT for the Master Planned Communities,MPCs, we believe that certain investors measure the value of the assets in this segment based on their annual contribution to liquidity and capital available for investment. Accordingly, the following table sets forth MPC Net Contribution for the three months ended March 31, 2013 and 2012. MPC Net Contribution is defined as MPC REP EBT, plus MPC cost of sales, provisions for impairment and depreciation and amortization, and reduced by MPC development and acquisition expenditures.
MPC Net Contribution
| | Three months Ended March 31, | |
| | 2013 | | 2012 | |
| | (In thousands) | |
MPC REP EBT (*) | | $ | 23,271 | | $ | 14,350 | |
Plus: | | | | | |
Cost of sales - land | | 25,699 | | 18,679 | |
Depreciation and amortization | | 7 | | 2 | |
Less: | | | | | |
MPC land/residential development and acquisitions expenditures | | 33,329 | | 24,284 | |
MPC Net Contribution | | $ | 15,648 | | $ | 8,747 | |
(*) For a detailed breakdown of our MPC segment EBT, please refer to Note 14 - Segments of our Condensed Consolidated Financial Statements.
Current period expenditures primarily relate to land expected to be sold in future periods. The increase in the MPC Net Contribution of $6.9 million to $15.6 million for the first quarter of 2013 as compared to $8.7 million for the first quarter of 2012 is primarily attributable to the increased land sales and SID reimbursements at Summerlin, offset by increased development expenditures at Bridgeland, Summerlin and The Woodlands. Bridgeland’s land development costs include the expansion of a regional sewer treatment plant and two intract sections, while the higher development expenditures at Summerlin and The Woodlands include costs to deliver lot inventory for sales during the remainder of 2013. Although MPC Net Contribution can be computed from GAAP elements of income and cash flows, it is not a GAAP based operational metric and should not be used to measure operating performance of the MPC assets as a substitute for GAAP measures of such performance. A reconciliation of REP EBT to consolidated and combined statements of operationsnet income (loss) as computed in accordance with GAAP has been presented in Note 1415 - Segments. The following table sets forth the MPC Net Contribution for the three and six months ended June 30, 2013 and 2012. MPC Net Contribution is defined as MPC REP EBT, plus MPC cost of sales and depreciation and amortization reduced by MPC development and acquisition expenditures.
3740
Table of Contents
MPC Net Contribution
| | Three Months Ended June 30, | | Six Months Ended June 30, | |
| | 2013 | | 2012 | | 2013 | | 2012 | |
| | (In thousands) | | (In thousands) | |
MPC REP EBT (*) | | $ | 36,462 | | $ | 19,898 | | $ | 59,733 | | $ | 34,249 | |
Plus: | | | | | | | | | |
Cost of sales - land | | 29,854 | | 22,978 | | 55,553 | | 41,657 | |
Depreciation and amortization | | 8 | | 2 | | 15 | | 3 | |
Less: | | | | | | | | | |
MPC land/residential development and acquisitions expenditures | | 36,289 | | 22,951 | | 67,484 | | 47,235 | |
MPC Net Contribution | | $ | 30,035 | | $ | 19,927 | | $ | 47,817 | | $ | 28,674 | |
(*) For a detailed breakdown of our MPC segment EBT, please refer to Note 15 - Segments of our Condensed Consolidated Financial Statements.
The MPC Net Contribution increased by $10.1 million and $19.1 million for the three and six months ended June 30, 2013, respectively, as compared to the same periods in 2012. The increase in MPC Net Contribution was primarily attributable to increased land sales at Summerlin and The Woodlands, and SID assumptions and reimbursements at Summerlin, partially offset by increased development expenditures at Bridgeland, Summerlin and The Woodlands. MPC land and residential development expenditures consist primarily of land development costs, such as water, sewer, drainage and paving. Bridgeland’s land development costs include the expansion of a regional sewer treatment plant and construction of an elevated water storage tank, while the higher development expenditures at Summerlin and The Woodlands include the costs to deliver lot inventory necessary for future sales.
41
Table of Contents
Operating Assets Segment
We view NOI as an important measure of the operating performance of our Operating Assets. These assets typically generate rental revenues sufficient to cover their operating costs, and variances between years in net operating income typically result from changes in rental rates, occupancy, tenant mix and operating expenses. We view NOI as an important measure of the operating performance of our Operating Assets.
Operating Assets NOI and REP EBT
| | Three Months Ended March 31, | | | Three Months Ended June 30, | | Six Months Ended June 30, | |
| | 2013 | | 2012 | | | 2013 | | 2012 | | 2013 | | 2012 | |
| | (In thousands) | | | (In thousands) | | (In thousands) | |
| | | | | | | | | | | | | | |
Retail | | | | | | | | | | | | | | |
Ward Centers | | $ | 5,979 | | $ | 5,564 | | | $ | 5,883 | | $ | 5,555 | | $ | 11,862 | | $ | 11,119 | |
South Street Seaport | | (1,661 | ) | 458 | | | (1,776 | ) | 1,749 | | (3,437 | ) | 2,207 | |
Rio West Mall | | 346 | | 400 | | | 292 | | 330 | | 638 | | 730 | |
Landmark Mall | | 143 | | 275 | | | 251 | | 234 | | 394 | | 509 | |
Riverwalk Marketplace | | (433 | ) | 164 | | | (338 | ) | 315 | | (771 | ) | 479 | |
Cottonwood Square | | 100 | | 113 | | | 143 | | 110 | | 243 | | 223 | |
Park West | | 283 | | 266 | | | 281 | | 222 | | 564 | | 488 | |
20/25 Waterway Avenue | | 314 | | 439 | | | 276 | | 396 | | 590 | | 835 | |
Waterway Garage Retail | | (13 | ) | 3 | | | 84 | | 7 | | 71 | | 10 | |
Total Retail | | 5,058 | | 7,682 | | | 5,096 | | 8,918 | | 10,154 | | 16,600 | |
Office | | | | | | | | | | | | | | |
110 N. Wacker | | 1,496 | | 1,530 | | | 1,508 | | 1,507 | | 3,004 | | 3,037 | |
Columbia Office Properties | | 392 | | 410 | | | 271 | | 695 | | 663 | | 1,105 | |
70 Columbia Corporate Center | | 52 | | — | | | 91 | | — | | 143 | | — | |
3 Waterway Square (e) | | | 71 | | — | | 71 | | — | |
4 Waterway Square | | 1,601 | | 1,055 | | | 1,372 | | 1,607 | | 2,973 | | 2,662 | |
9303 New Trails | | 477 | | 389 | | | 452 | | 571 | | 929 | | 960 | |
1400 Woodloch Forest | | 382 | | 375 | | | 287 | | 444 | | 669 | | 819 | |
2201 Lake Woodlands Drive | | 42 | | — | | | (73 | ) | (2 | ) | (31 | ) | (2 | ) |
Total Office | | 4,442 | | 3,759 | | | 3,979 | | 4,822 | | 8,421 | | 8,581 | |
| | | | | | | | | | | | | | |
Millennium Waterway Apartments (a) | | 1,196 | | — | | |
Millennium Waterway Apartments (f) | | | 1,181 | | 260 | | 2,377 | | 260 | |
The Woodlands Resort and Conference Center | | 3,628 | | 2,243 | | | 3,590 | | 4,599 | | 7,218 | | 6,841 | |
Total Retail, Office, Multi-family, Resort and Conference Center | | 14,324 | | 13,684 | | | 13,846 | | 18,599 | | 28,170 | | 32,282 | |
| | | | | | | | | | | | | | |
The Club at Carlton Woods | | (1,118 | ) | (1,008 | ) | | (497 | ) | (1,294 | ) | (1,615 | ) | (2,302 | ) |
The Woodlands Parking Garages | | (164 | ) | (255 | ) | | (240 | ) | (238 | ) | (404 | ) | (493 | ) |
The Woodlands Ground Leases | | 103 | | 99 | | | 121 | | 92 | | 224 | | 191 | |
Other Properties | | (64 | ) | 327 | | | (67 | ) | 391 | | (131 | ) | 721 | |
Total Other | | (1,243 | ) | (837 | ) | | (683 | ) | (1,049 | ) | (1,926 | ) | (1,883 | ) |
Total Operating Assets NOI- Consolidated | | 13,081 | | 12,847 | | |
Total Operating Assets NOI - Consolidated | | | 13,163 | | 17,550 | | 26,244 | | 30,399 | |
| | | | | | | | | | | | | | |
Straight-line lease amortization | | (177 | ) | 210 | | |
Straight-line lease and incentives amortization | | | 444 | | 207 | | 267 | | 417 | |
Depreciation and amortization | | (6,118 | ) | (4,857 | ) | | (6,398 | ) | (5,672 | ) | (12,516 | ) | (10,529 | ) |
Write-off of lease intangibles and other | | | (392 | ) | — | | (2,505 | ) | — | |
Equity in earnings from Real Estate Affiliates | | 2,733 | | 2,677 | | | 363 | | 446 | | 3,096 | | 3,122 | |
Interest expense, net | | (6,759 | ) | (3,301 | ) | | (3,849 | ) | (3,673 | ) | (10,608 | ) | (6,974 | ) |
Write-off of lease intangibles and other | | (2,113 | ) | — | | |
Total Operating Assets REP EBT (b) | | $ | 647 | | $ | 7,576 | | |
Total Operating Assets REP EBT (g) | | | $ | 3,331 | | $ | 8,858 | | $ | 3,978 | | $ | 16,435 | |
3842
Table of Contents
| | Three Months Ended March 31, | | | Three Months Ended June 30, | | Six Months Ended June 30, | |
| | 2013 | | 2012 | | | 2013 | | 2012 | | 2013 | | 2012 | |
| | (In thousands) | | | (In thousands) | | (In thousands) | |
| | | | | | | | | | | | | | |
Operating Assets NOI - Equity and Cost Method Investments | | | | | | | | | | | | | | |
Millennium Waterway Apartments (a)(f) | | $ | — | | $ | 1,034 | | | $ | — | | $ | 734 | | $ | — | | $ | 1,768 | |
Woodlands Sarofim # 1 | | 317 | | 286 | | | 332 | | 190 | | 649 | | 476 | |
Stewart Title (title company) | | 399 | | 133 | | |
Stewart Title | | | 667 | | 536 | | 1,066 | | 669 | |
Forest View/Timbermill Apartments (c)(h) | | — | | 494 | | | — | | 88 | | — | | 582 | |
Total NOI - equity investees | | 716 | | 1,947 | | | 999 | | 1,548 | | 1,715 | | 3,495 | |
| | | | | | | | | | | | | | |
Adjustments to NOI (d)(i) | | (33 | ) | (934 | ) | | (36 | ) | (517 | ) | (69 | ) | (1,452 | ) |
Equity Method Investments REP EBT | | 683 | | 1,013 | | | 963 | | 1,031 | | 1,646 | | 2,043 | |
Less: Joint Venture Partner’s Share of REP EBT | | (453 | ) | (712 | ) | | (600 | ) | (585 | ) | (1,053 | ) | (1,297 | ) |
Equity in earnings (loss) from Real Estate Affiliates | | 230 | | 301 | | |
Equity in earnings from Real Estate Affiliates | | | 363 | | 446 | | 593 | | 746 | |
| | | | | | | | | | | | | | |
Distributions from Summerlin Hospital Investment | | 2,503 | | 2,376 | | | — | | — | | 2,503 | | 2,376 | |
Segment equity in earnings from Real Estate Affiliates | | $ | 2,733 | | $ | 2,677 | | | $ | 363 | | $ | 446 | | $ | 3,096 | | $ | 3,122 | |
| | | | | | | | | | | | | | |
Company’s Share of Equity Method Investments NOI | | | | | | | | | | | | | | |
Millennium Waterway Apartments (a)(f) | | $ | — | | $ | 864 | | | $ | — | | $ | 613 | | $ | — | | $ | 1,477 | |
Woodlands Sarofim # 1 | | 63 | | 57 | | | 66 | | 38 | | 130 | | 95 | |
Stewart Title (title company) | | 200 | | 67 | | |
Stewart Title | | | 334 | | 268 | | 533 | | 335 | |
Forest View/Timbermill Apartments (c)(h) | | — | | 247 | | | — | | 44 | | — | | 291 | |
Total NOI - equity investees | | $ | 263 | | $ | 1,235 | | | $ | 400 | | $ | 963 | | $ | 663 | | $ | 2,198 | |
| | Economic | | March 31, 2013 | |
| | Ownership | | Debt | |
| | | | (In thousands) | |
Woodlands Sarofim #1 | | 20.00 | % | $ | 6,763 | |
Stewart Title(title company) | | 50.00 | % | — | |
Forest View/Timbermill Apartments (c) | | 50.00 | % | not applicable | |
| | | | | | |
Company’s Share of Equity Method Investments Debt and Cash
| | Economic | | June 30, 2013 | |
| | Ownership | | Debt | | Cash | |
| | | | (In thousands) | |
Woodlands Sarofim #1 | | 20.00 | % | $ | 6,692 | | $ | 587 | |
Stewart Title | | 50.00 | % | — | | 1,045 | |
Summerlin Las Vegas Baseball Club | | 50.00 | % | –– | | 398 | |
| | | | | | | | | |
(a)Superstorm Sandy negatively impacted South Street Seaport NOI by approximately $(3.5) million and $(5.6) million for the three and six months ended June 30, 2013, respectively.
(b)Riverwalk Marketplace NOI was negatively impacted by vacating tenants for redevelopment. Redevelopment began in the second quarter of 2013.
(c)The NOI decrease for the three and six months ended June 30, 2013, as compared to 2012 was primarily attributable to a vacancy resulting from a tenant lease termination. We have executed a new lease for a replacement tenant who will take possession of the space in the third quarter of 2013.
(d)70 Columbia Corporate Center was 94.7% leased as of August 7, 2013 and is expected to generate approximately $2.9 million of annual NOI by 2015 when tenants have taken occupancy and free-rent periods conclude.
(e)3 Waterway Square was completed in June 2013 and was 97% leased as of August 7, 2013. Stabilized annual NOI based on in-place leases is approximately $6.0 million.
(f) On May 31, 2012, we acquired our partner’s interest in the 393-unit Millennium Waterway Apartments. NOI for periods prior to June 1, 2012 is includedare reported in the Operating Assets NOI - Equity and Cost Method Investment.Investment table.
(b) (g) For a detailed breakdown of our Operating Asset segment REP EBT, please refer to Note 1415 - Segments in the Condensed Consolidated Financial Statements.
(c) (h) On April 19, 2012, the joint ventures owning the Forest View and Timbermill Apartments completed their sale to a third party. Our share of the distributable cash after repayment of debt and transaction expenses was $8.6 million.
(d) (i) Adjustments to NOI include straight-line and market lease amortization, depreciation and amortization and non-real estate taxes.
3943
Table of Contents
Reconciliation of Operating Assets Segment Equity in Earnings
| | Three Months Ended March 31, | | |
| | 2013 | | 2012 | | | Three Months Ended June 30, | | Six Months Ended June 30, | |
| | (In thousands) | | | 2013 | | 2012 | | 2013 | | 2012 | |
| | | | | | | (In thousands) | | (In thousands) | |
Segment Equity in Earnings from Real Estate Affiliates | | $ | 2,733 | | $ | 2,677 | | | $ | 363 | | $ | 446 | | $ | 3,096 | | $ | 3,122 | |
Less: Equity Method Investments Share of REP EBT | | (230 | ) | (301 | ) | | (363 | ) | (446 | ) | (593 | ) | (746 | ) |
Cost Basis Investments and dividends | | 2,503 | | 2,376 | | | — | | — | | 2,503 | | 2,376 | |
| | | | | | | | | | | | | | |
Add HHC Equity Method investments: | | | | | | | | | | | | | | |
Forest View/ Timbermill Apartments | | — | | 4 | | | — | | 2 | | — | | 4 | |
Millennium Waterway Apartments | | — | | 220 | | | — | | 185 | | — | | 406 | |
Stewart Title (title company) | | 191 | | 59 | | | 326 | | 257 | | 517 | | 316 | |
Woodlands Sarofim #1 | | 39 | | 18 | | | 37 | | 2 | | 76 | | 20 | |
Equity in Earnings from Real Estate Affiliates | | $ | 2,733 | | $ | 2,677 | | | $ | 363 | | $ | 446 | | $ | 3,096 | | $ | 3,122 | |
Retail Properties
Retail NOI of $5.1 million for the three months ended March 31,June 30, 2013 decreased $2.6$3.8 million to $5.1 million as compared to $7.7$8.9 million for the same period in 2012. The decrease includes a $2.1Retail NOI for the six months ended June 30, 2013 decreased $6.4 million to $10.2 million as compared to $16.6 million for the same period in 2012. Both decreases for the three and six months ended June 30, 2013, include the negative impact offrom Superstorm Sandy of $3.5 million and $5.6 million, respectively, on South Street Seaport’s NOI and a $0.6 millionthe negative impact from vacating Riverwalk Marketplace for redevelopment of $0.7 million and $1.3 million, respectively, in advance of construction which is expected to begin during the second quarter ofbegan in June 2013.
For the threesix months ended March 31,June 30, 2013, we executed 38 retail97 leases representing 130,875 square feet. There are 28 leases representing 104,621for a total of 310,882 square feet and average starting rents of $22.10 per square foot. Of the executed leases, 132,584 square feet represent pre-leased space under development with average minimumstarting rents of $15.79$30.84 per square foot. The remaining 10 leases, representing 26,254pre-leases have total tenant improvement commitments of $7.9 million, or $64.65 per square foot and total leasing commissions of $0.3 million, or $17.27 per square foot. In addition, 150,996 square feet are short-term leases at properties being positioned for redevelopment with percentage-in-lieu rents. Of the 38 leases, 42.1% represent comparable leases where therewhereby the square footage was atenant occupied within 12 months prior tenant with a decreaseto the executed agreement. The executed comparable leases represent an increase in cash basis rentrents of less than 1%. Additionally, we had11% over previous rents. The remaining 27,302 square feet represent non-comparable leases and are associated with space which was previously vacant. The comparable and non-comparable leases have total tenant improvement costscommitments of $0.1$0.8 million, for the three months ended March 31, 2013 with a costor $20.52 per square foot, and total leasing commissions of $11.48.$0.2 million, or $15.45 per square foot. The minimal amount of leasing commissions paid relative to the total executed leased space is reflective of the success of our internal leasing efforts.
Ward Centers
Ward Centers NOI increased $0.3 million to $5.9 million and $0.7 million to $11.9 million for the three and six months ended June 30, 2013, respectively, as compared to the same periods in 2012, primarily due to the commencement of the TJ Maxx lease in May 2012. In April 2013, Bed Bath & Beyond took occupancypossession of approximately 30,000 square feet inof space formerly occupied by Borders and Bed Bath & Beyond is expected towhich will provide an additional $0.8 million in annual NOI. Additionally, during
During 2012, we substantially completed and opened the upper level of Phase One of The Ward Village Shops consisting of approximately 70,000 square feet at Ward Centers ata total cost of $32.1 million. The 36,000 square foot upper level with a cost of approximately $20.5 million (including our predecessor’s cost). The space is approximately 36,000was placed in service in May 2012 when the TJ Maxx lease commenced. In the second quarter of 2013, we completed the remaining 34,000 square feet, and was leased to TJ Maxx commencing in May 2012. We are seekingwith a tenant for the approximately 34,000 square foot space in the lower level. Approximatelycost of $11.6 million (including our predecessor’s costs) has been incurred to complete this space as of March 31, 2013, and we estimate approximately $4.2 million of additional costs (including tenant allowances) to complete. Bed Bath & Beyond is expected to provide an additional $0.8 million in annual NOI.million.
On July 25, 2012, we announced the development of Phase Two of Ward Village Shops, a 57,000 square foot, two storytwo-story retail center. Construction began in the third quarter of 2012. Our anticipated investment is expected to be approximately $26.2 million with2012 and remains on schedule for an expected opening in the fall of 2013. Approximately $10.7We expect to invest approximately $26.2 million in this project of which $17.6 million of costs have been incurred as of March 31,June 30, 2013. Phase Two is 100% leased. Pier 1 Imports and Nordstrom Rack have executed leases to occupy 100% of this retail center and are relocating from their current locations making their current locations availablewithin Ward Centers. The original Pier 1 Imports location is the site of one of the first two planned market-rate condominium towers for developmentwhich we expect to launch pre-sales by the end of a mixed-use condominium tower. These tenants2013. Pier 1 Imports and Nordstrom Rack are expected to contribute an incremental $1.0 million of combined annual NOI when they take possession in late 2013 or early 2014.2013.
In October 2012, we announced plans to transform Ward Centers into Ward Village, a vibrant neighborhood offering unique retail experiences, dining and entertainment, along with exceptional residences and workforce
40
Table of Contents
housing set among dynamic open public spaces and pedestrian-friendly streets. The development of Ward Village is consistent with theOur master plan approved bydevelopment agreement with the Hawaii Community Development Authority (“HCDA”). In January 2011, we entered into a development agreement with the HCDA which allows for up to 9.3 million square feet, including up to 7.6 million square feet of residential (4,000 units which are initially estimated to average approximately 1,500 square feet per unit), and up to 1.7 million square feet of retail, office, commercial and other uses. Ward Village has development rights for 22 high-rise towers in an urban master planned community setting. Full build-out is estimated to take over 15 years, but will ultimately depend on market absorption and many other factors that are difficult to estimate. Phase I
44
Table of Contents
The first phase of the redevelopment continues to progress. It consistsmaster plan includes the renovation of four components on four separate blocks consistingthe IBM Building and the development of approximately 500 market rate condominium units, in two mixed-use residential towers at least 125and development of one other tower with workforce residential units in one tower withhaving sales prices lower than market rate. This phase is projected for completion in 2016.
During the market rate towers and the renovationfirst quarter of the IBM Building. The2013, we began redevelopment of the IBM Building was announced during the first quarter of 2013. During the redevelopment of the IBM Building, the majority of the space will continue to serve as an office building whileinto a portion will serve as the futureworld-class information center and residential sales gallery for Ward Village.the entire project. The building renovation is plannedon schedule for completion inby the fallend of 2013, with an anticipated investment of $24.4 million. Approximately $1.1$7.7 million has been incurred on this project as of March 31,June 30, 2013.
Development permit applications and detailed plans for the three residential towers have been submitted to the HCDA. We are planning for HCDA approval during the third quarter of 2013, which allows us to submit Condominium Documents to the Hawaii Real Estate Commission. We anticipate that we will receive the Real Estate Commission’s approval in the fourth quarter of 2013. We expect to launch pre-sales for the market rate units by the end of 2013 and anticipate breaking ground on the towers in 2014 with an expected completion in 2016.2013. We have incurred pre-development costs of $6.9 million as of June 30, 2013.
South Street Seaport
In the fourth quarter of 2012, as a result of Superstorm Sandy, the Uplands portion of South Street Seaport (areas excluding Pier 17) suffered damage due to flooding, but the Pier 17 structure was not significantly damaged. The operating losslosses at South Street Seaport during the three and six months ended March 31,June 30, 2013 of $1.7were $1.8 million wasand $3.4 million, respectively. These operating losses were primarily due to lower revenues of $2.5$3.1 million which isand $6.1 million, respectively, mainly due to mucha majority of the leasable space being untenantable due to the storm. Reconstruction efforts are ongoing and the property is only partially operating. During the second quarter of 2013, we launched the SEE/CHANGE marketing campaign to re-brand South Street Seaport. SEE/CHANGE campaign is accompanied by an extraordinary summer program to re-energize the Seaport by activating the Uplands public areas with unique food and beverage operations, pop-up retail in shipping containers, art installations, and a stage/screen and lawn area for outdoor films and concerts.
We believe that our insurance will cover substantially all of the cost of repairing the property and will also compensate us for any revenue that has been lost as a result of the storm.
As more fully described in Note 13 — CommitmentsIn June 2013, the City of New York executed the amended and Contingencies, during June 2012, we entered into an agreement to amend and restate therestated ground lease for South Street Seaport, ground lease, which allows us to renovate and rehabilitate Pier 17 (“Renovation Project”). The Renovation Project includeswas the final step necessary for the commencement of the renovation and reconstruction of the existing Pier 17 Building which upon renovation will contain approximately 195,000 square feet of leasable area. On March 21, 2013, we received unanimous approval from(“Renovation Project”). Per our prior agreement with the New York City Council, underwe postponed the Uniform Land Use Review Procedure (“ULURP”) forcommencement of construction until October 1, 2013 allowing merchants struggling in the redevelopmentaftermath of Superstorm Sandy to remain in business through the summer. The Renovation Project will increase the leasable area of Pier 17 at the South Street Seaport. The projectto approximately 195,000 square feet and features a complete transformation of the Pier 17 building, including a vibrant, open rooftop with 40% more open space, upscale retail, outdoor entertainment venues and a dynamic food market. Construction will begin by October 1, 2013 andWe are currently finalizing the project is expected to be completed in 2015. We continue to completedevelopment budget, completing pre-development efforts, pursuepursuing potential tenants and secure project funding.securing financing. Also, during the second quarter of 2013, we named RKF as exclusive leasing consultant for the leasing of South Street Seaport Pier 17. As of March 31,June 30, 2013, we have incurred $10.9$14.3 million of costs related to this project.
Riverwalk Marketplace
On July 26,The $0.7 million and $1.3 million NOI decrease for the three and six months ended June 30, 2013, respectively, as compared to 2012 we announced planswas primarily attributable to redevelopvacating tenants in advance of the commencement of construction in June 2013 to transform the property into The Outlet Collection at Riverwalk, Marketplace into an upscale outlet center. The Outlet Collection at Riverwalk will be the nation’s first outlet center located in the downtown of a major city. The redevelopment will feature a tenant mix of top national retailers with established outlet stores, local retailers and several dining and entertainment options. Plans currently include expandingWe plan to expand the current leasable area by approximately 50,000 square feet to 250,000 square feet. Approximately 83% of the space has been pre-leased as of August 7, 2013. The estimated project budget is approximately $82 million (exclusive of our land value) with an expected opening date in 2014. We have retailer commitments for a majorityincurred $8.3 million of the property and are in the process of converting these commitments to leases. Approximately $5.5 million has been incurredcosts on this project as of March 31,June 30, 2013 and expect to close on construction financing in the third quarter 2013. We are documenting a mortgage financing for the redevelopment, and we anticipate that construction will begin during the second quarter
45
Table of 2013 with a projected opening in 2014. The $0.6 million NOI decrease for the three months ended March 31, 2013 as compared to 2012 is primarily attributable to the redevelopment announcement and subsequent termination of tenant leases to prepare for the redevelopment.Contents
Landmark Mall
We are pursuing the redevelopment of Landmark Mall, an 879,294 square foot shopping mall, located in Alexandria, Virginia. Any successful redevelopment efforts are contingent upon us reaching agreement with Macy’s and Sears, the existing anchor tenants who own their pad sites. During the first quarter of 2013, we reached an agreement with Lord & Taylor for the early termination of theirits leasehold interest.interest, and during the second quarter of 2013, we received unanimous rezoning approval from the Alexandria City Council for the redevelopment of Landmark Mall. In addition, the redevelopment is subject to the approval of Sears and Macy’s. We expect to transform this 11-acre site into an open-air community with retail, residential and entertainment components designed to create an urban village on the west end of Alexandria, Virgina. The 750,000 square foot redevelopment will include 285,000 square feet of retail, up to 400 residential units and an upscale dine-in movie theater. Sears and Macy’s will continue to have ongoing
41
Table of Contents
discussions withanchor the two other anchors regarding the latest proposed plan.property. We have also submitted a design plandevelopment permit application and anticipate approval later in 2013. We expect construction to the City of Alexandria which calls for demolishing the central regionbegin in 2014 with an anticipated completion of the mall and replacing it with a mixed-use residential and retail complex that will include one level devotedfirst phase in Spring 2016. As of June 30, 2013, we have incurred $12.9 million of costs, of which $6.2 million was paid, related to retail outlets and restaurants, andthis project including termination of the remaining allocated to residential units. The proposed plan would create between 350 and 400 apartments. We anticipate obtaining city approval for the plan by the end of 2013.anchor lease.
Office Properties
All of the office properties listed in the NOI schedule, except for 110 N. Wacker, 70 CCC and the Columbia Office Properties and 70 CCC are located in The Woodlands. Leases related to our office properties, except those located in Columbia, Maryland, are generally triple net leases. TheseTriple net leases typically require tenants to pay their pro-rata share of certain property operating costs, such as real estate taxes, utilities and insurance.
Office property NOI of $4.4decreased $0.8 million increased $0.7 million, or 18.2%,and was flat during the three and six months ended June 30, 2013, respectively, as compared to the same periods in 2012. NOI for the three months ended March 31, 2013 as compared to $3.8 million for the same period in 2012. As of March 31, 2013, all of the completed office properties have reached stabilized NOI with the exception of 70 CCC and certain properties included in the Columbia Office portfolio that are more fully described below. The increase in NOI is associated with 4 Waterway Square, and 9303 New Trails and relates1400 Woodloch Forest was negatively impacted by $(0.5) million due to overbillings of tenant recoveries in the prior year which were credited to the stabilizationtenants in the current year as part of these assets. Both properties were fullythe annual operating expense reconciliation. NOI for the Columbia Office Properties decreased for the three and six months ended June 30, 2013 primarily due to the relocation of a major tenant to 70 Columbia Corporate Center from the Columbia Office Properties.
For the six months ended June 30, 2013, we executed 13 leases for a total of 140,211 square feet and average starting rents of $25.71 per square foot. Of the executed leases, 64,720 square feet represent pre-leased space under development with average starting rents of $25.82 per square foot. The pre-leases have total tenant improvement commitments of $3.8 million, or $58.22 per square foot and total leasing commissions of $1.1 million, or $19.31 per square foot. In addition, 11,506 square feet represent comparable leases whereby the square footage was tenant occupied aswithin 12 months prior to the executed agreement. The executed comparable leases represent an increase in cash rents of March 31, 2013.7% over previous rents. The remaining 63,985 square feet represent non-comparable leases and are associated with space which was previously vacant. The comparable and non-comparable leases have total tenant improvement commitments of $3.1 million, or $42.24 per square foot, and total leasing commissions of $1.0 million, or $12.67 per square foot.
During June of 2013, we substantially completed the construction of 3 Waterway Square, an 11-story, 232,000 square foot Class A office building. The building is 97% leased. We expect the property to reach stabilized annual NOI of $6.0 million by 2014. Total project costs incurred to-date for this building are $43.3 million (exclusive of land value) of which $3.8 million represents prepaid leasing costs. Total budgeted costs for this project are $51.4 million (exclusive of land value). We expect an additional $8.1 million in project costs will be incurred to complete construction. On August 2, 2013, we refinanced the $43.3 million non-recourse construction loan with a $52.0 million non-recourse mortgage at 3.94% maturing in August 2028.
On August 15, 2012, we acquired 70 CCC, a 167,513 square foot Class A office building located in Columbia, Maryland. In February 2013, we executed a lease for 63,640 square feet that will increase occupancy to approximately 94.7% in July 2013 when the tenant takes possession whichand annual NOI is estimatedexpected to occur in July 2013 and increase annual NOI to approximately $2.9 million by 2015.
DuringIn 2012, we entered into agreements with Whole Foods Market, Inc. and The Columbia Association to lease the majority of the approximately 89,000 square feet of ourfoot Columbia Regional Building. In March 2013, we began a complete restoration and redevelopment of the building, which we believe will serve as a catalyst for future development in the Columbia Town Center. We anticipate completion of the renovation to occur during the thirdfourth quarter of 2014. Based on the pre-leasing as of March 31, 2013, we estimate annual NOI of $2.1 million in the second quarter of 2015, as compared to our annual losses of approximately $1.0 million. Also, in March of 2013, we closed on a $23.0 million construction loan bearing interest at LIBOR plus 2.0% with an initiala final maturity date of March 15, 2016 with two one-year extensions at our option. We expect to invest2018. Budgeted construction costs are approximately $24.6 million (exclusive of land). Costs incurred to date are approximately $2.6$5.3 million (excluding our existing building and land basis). We expect to reach annual NOI of $2.1 million in the second quarter of 2015.
For the three months ended March 31, 2013, we executed nine leases representing 111,310 square feet with average annual rents46
Table of $24.20 per square foot during the initial year of the lease term. Of the nine leases, five are leases for space that has never been occupied at the Columbia Office Properties or represents pre-leasing at 3 Waterway Square and One Hughes Landing, which are currently under construction. The remaining four leases represent comparable leases where there was a prior tenant with an increase in cash basis rent of 9.3%. Additionally, we had total tenant improvement costs of $5.1 million and leasing commissions and tenant concessions of $1.7 million during the first quarter of 2013 with a cost per square foot of $45.37 and $15.11, respectively.Contents
Multi-family
On May 31, 2012, we acquired our partner’s interest in Millennium Waterway Apartments at a negotiated $72.0 million valuation of the property and consolidated the asset after the purchase. This asset addsproperty is a stabilized Class A multi-family property located in The Woodlands Town Center to our portfolio.Center. The property is currently 93.2%92.6% occupied as of August 7, 2013 and when stabilized is expected to generate stabilized annual NOI of approximately $4.9 million. In conjunction with this acquisition, we entered into a joint venture agreement with our partner to construct a 314-unit Class A multi-family property as more fully discussed under our Strategic Developments segment.
The Woodlands Resort and Conference Center
The Woodlands Resort and Conference Center’sCenter NOI of $3.6 million for the firstthree months ended June 30, 2013, decreased $1.0 million compared to $4.6 million for the second quarter of2012 due to lower group business caused by the renovation project. NOI increased $0.4 million to $7.2 million for the six months ended June 30, 2013, increased $1.4 million as compared to the first quarter ofsame period in 2012, primarily due to an increase in room rate to $197.91 from $191.27, or 3.5%, and an increase in revenue per available room (“RevPAR”) to $120.33$123.98 from $109.75,$121.50, or
42
Table of Contents
9.6% 2.0%. Increased business activity and strong local economic conditions at The Woodlands and surrounding areas, along with strong yield management, resulted in increased revenue and NOI.room rates. During the first quarter of 2013, we announced the expansion and redevelopment of The Woodlands Resort and Conference Center. RedevelopmentConstruction continued on pace through the second quarter and the redevelopment is slated for completion during the summer of 2014. The renovation will encompass renovation and222 existing guest rooms, the replacement of approximately 425 existing guest and lodge218 rooms with a new wing withconsisting of 184 guest rooms and suites, a new lobby, an update of the 13,000 square foot spa facility, the revitalization of the 60,000 square feet of meeting and event facilities. Duringfacilities, and the development of a 1,000 linear foot lazy river. Additionally, during the first quarter of 2013, we closed on a $95.0 million non-recourse mortgage bearing interest at LIBOR plus 3.5% and having an initial maturity date of February 8, 2016 with three, one- yearone-year extensions at our option. The mortgage refinanced the existing $36.1 million mortgage and will provide the majority of the funding for thethis redevelopment. Total budgeted construction costs for this project isare $75.4 million, of which $7.4$9.2 million had been incurred as of March 31,June 30, 2013.
Other
The Club at Carlton Woods (the “Club”) is a 36-hole golf and country club at The Woodlands with 664667 total members as of March 31,June 30, 2013. The Club sold 4159 new golf memberships during the first quarter of 2013 and NOI for the threesix months ended March 31, 2013 was flat compared to the three months ended March 31, 2012.June 30, 2013. We estimate the Club requires approximately 800 members to achieve break-even NOI, and therefore we expect to continue to incur NOI losses for the foreseeable future.
The Woodlands Parking Garages comprise nearly 3,000 parking spaces in two separate parking structures. The Waterway Square Garage (1,933 spaces) is located in The Woodlands Town Center and has excess parking capacity for future commercial development. Woodloch Forest garage has approximately 1,000 total spaces with 300 spaces available for future adjacent office development.
47
Table of Contents
Partially Owned
During the first quarter of 2013 and 2012, we received distributions of $2.5 million and $2.4 million, respectively, for the distribution from our Summerlin Hospital investment. Distributions from the Summerlin Hospital are typically made one time per year in the first quarter.
On April 19,In 2012, we entered into a joint venture for the purpose of acquiring 100% of the operating assets of the Las Vegas 51s, a Triple-A baseball team which is a member of the Pacific Coast League. We own 50% of the venture and our partners jointly own the remaining 50%. In August 2012, we contributed $0.3 million to the joint ventures owningventure pending final approval of the Forest Viewacquisition by Major League Baseball. In May 2013, after the approval was received, we funded our remaining capital obligation of $10.2 million and Timbermill tax-credit apartmentsthe joint venture completed their salethe acquisition. The team is located near our Summerlin MPC. Our strategy in acquiring an ownership interest is to pursue a potential relocation of the team to a third party.to-be-built stadium in our Summerlin master planned community. There wascan be no gain or loss recognized on these sales. Our share of the distributable cash, after repayment of debt and transaction costs, was $8.6 million. The NOI associated with the management fees for operating these joint ventures were included in Other Properties on the schedule of Operating Assets NOI and REP EBT.
43
Table of Contentsassurance that such a stadium will ultimately be built.
Total revenuerevenues and expenses for the Operating Assets segment isare summarized as follows:
Operating Assets Revenues and Expenses (*)
| | Three Months Ended March 31, | | | Three Months Ended June 30, | | Six Months Ended June 30, | |
| | 2013 | | 2012 | | | 2013 | | 2012 | | 2013 | | 2012 | |
| | (In thousands) | | | (In thousands) | | (In thousands) | |
| | | | | | | | | | | | | | |
Minimum rents | | $ | 18,511 | | $ | 18,522 | | | $ | 19,756 | | $ | 20,222 | | $ | 38,267 | | $ | 38,744 | |
Resort and conference center revenues | | 11,104 | | 9,657 | | | 11,270 | | 11,970 | | 22,374 | | 21,626 | |
Other rental and property revenues | | 8,685 | | 10,556 | | | 11,653 | | 12,196 | | 20,338 | | 22,752 | |
Total revenues | | 38,300 | | 38,735 | | | 42,679 | | 44,388 | | 80,979 | | 83,122 | |
| | | | | | | | | | | | | | |
Other property operating costs | | 14,965 | | 13,804 | | | 16,552 | | 14,594 | | 31,517 | | 28,421 | |
Rental property real estate taxes | | 2,983 | | 2,620 | | | 2,923 | | 2,607 | | 5,906 | | 5,226 | |
Rental property maintenance costs | | 1,656 | | 1,840 | | | 2,032 | | 1,885 | | 3,688 | | 3,725 | |
Resort and conference center operations | | 7,476 | | 7,414 | | | 7,680 | | 7,371 | | 15,156 | | 14,785 | |
Provison for doubtful accounts | | 429 | | — | | | 277 | | 174 | | 706 | | 149 | |
Depreciation and amortization | | 6,118 | | 4,857 | | | 6,398 | | 5,672 | | 12,516 | | 10,529 | |
Interest expense, net | | 6,759 | | 3,301 | | | 3,849 | | 3,673 | | 10,608 | | 6,974 | |
Equity in Earnings from Real Estate Affiliates | | (2,733 | ) | (2,677 | ) | | (363 | ) | (446 | ) | (3,096 | ) | (3,122 | ) |
Total expenses | | 37,653 | | 31,159 | | | 39,348 | | 35,530 | | 77,001 | | 66,687 | |
Operating Assets REP EBT | | $ | 647 | | $ | 7,576 | | | $ | 3,331 | | $ | 8,858 | | $ | 3,978 | | $ | 16,435 | |
(*) For a detailed breakdown of our Operating Assets segment EBT, please refer to Note 1415 - Segments.
Minimum rents for the three and six months ended March 31,June 30, 2013 of $18.5$19.8 million were flat asand $38.3 million, respectively, decreased $0.5 million compared to both the three and six months ended June 30, 2012. The decrease was primarily due to lower minimum rents for the three and six months ended June 30, 2013 at South Street Seaport of $2.5 million and $5.0 million, respectively, resulting from Superstorm Sandy and at Riverwalk Marketplace of $0.7 million and $1.3 million, respectively, resulting from tenants vacating due to the redevelopment. These decreases were partially offset primarily by $1.8increased rents for the three and six months ended June 30, 2013 of $1.9 million of rentsand $3.7 million, respectively, related to ourthe acquisition of our partner’s interest in Millennium Waterway Apartments in May 2012 and increased occupancy and rental growth at our other properties.
ResortWard Centers of $0.6 million and conference center revenues$1.1 million for the three and six months ended March 31,June 30, 2013, increased $1.4 million or 15.0%,respectively, primarily duerelated to an increasethe commencement of the TJ Maxx lease in RevPar. RevPar was $120.33 and $109.75 for the three months ended March 31, 2013 and 2012, respectively. Occupancy increased from 56.3% in the first quarterMay 2012.
48
Table of 2012 to 61.2% for the first quarter of 2013.Contents
Other property operating costs increased $1.2$2.0 million and $3.1 million to $15.0$16.6 million and $31.5 million, respectively, for the three and six months ended March 31,June 30, 2013 as compared to 2012. The increase in 2013 is caused by a $1.2primarily resulted from write-offs of $1.5 million write-off of an in-place lease intangible related to a terminatedintangible lease assets for the six months ended June 30, 2013 resulting from the termination of leases at South Street Seaport and The Woodlands. The in-place lease intangible was established when we acquired our partner’s interest in The Woodlands. Other property operating costs generally include recoverableWoodlands and non-recoverable costs such as utilities and property management expenses relatingthe remainder of the increase is due to our operating assets, with the exception of real estate taxes and maintenance which are shown separately.various other small amounts.
The provision for doubtful accounts increased for the threesix months ended March 31,June 30, 2013 by $0.4$0.6 million as compared to the same period in 2012 primarily due to bad debt charges at South Street Seaport related to Superstorm Sandy which resulted in several tenant terminations.
Depreciation expense for the threesix months ended March 31,June 30, 2013 increased $1.3$2.0 million as compared to the same period in 2012 primarily due to depreciation related to our acquisition of Millennium Waterway Apartments.
Net interest expense increased $3.5$0.2 million and $3.6 million for the three and six months ended March 31,June 30, 2013, respectively, as compared to the same periods in 2012 primarily due to interest expensean increase of $0.5$0.9 million relating to the debt associated with refinancing the existing loan on the Millennium Waterway Apartments and $2.6$2.7 million related to 70 CCC lender’s participation right in the
44
Table of Contents
property. property during the six months ended June 30, 2013. The participation obligationright is fair valuedremeasured each quarter based on the estimated fair value of the property and the change in fair value is recorded through interest expense. TheWe executed a new 63,640 square feetfoot tenant lease in the first quarter of 2013, which increased the estimated value of the lender’s participation during the first quarter of 2013.participation.
Strategic Developments Segment
Our Strategic Development assets generally require substantial future development to achieve their highest and best use. For our development projects, the total estimated costs of a project including the budgeted construction costs, are exclusive of our land value unless otherwise noted. Most of the properties in this segment generate no revenues. Our expenses relating to these assets are primarily related to carrying costs, such as property taxes and insurance, and other ongoing costs relating to maintaining the assets in their current condition. If we decide to redevelopdevelop a Strategic Development asset, we would expect that, upon completion of redevelopment,development, the asset would either be sold or reclassified to the Operating Assets segment and NOI would become an important measure of its operating performance.
Total revenuerevenues and expenses for the Strategic Developments segment isare summarized as follows:
Strategic Developments Revenues and Expenses (*)
| | Three Months Ended March 31, | | | Three Months Ended June 30, | | Six Months Ended June 30, | |
| | 2013 | | 2012 | | | 2013 | | 2012 | | 2013 | | 2012 | |
| | (In thousands) | | | (In thousands) | | (In thousands) | |
| | | | | | | | | | | | | | |
Minimum rents | | $ | 220 | | $ | 243 | | | $ | 184 | | $ | 234 | | $ | 404 | | $ | 476 | |
Condominium unit sales | | — | | 134 | | |
Condominium rights and unit sales | | | 30,381 | | 134 | | 30,381 | | 267 | |
Other rental and property revenues | | 73 | | 118 | | | 1,337 | | 56 | | 1,410 | | 174 | |
Total revenues | | 293 | | 495 | | | 31,902 | | 424 | | 32,195 | | 917 | |
| | | | | | | | | | | | | | |
Condominium unit cost of sales | | — | | 59 | | |
Condominium sales operations | | — | | 58 | | |
Condominium rights and unit cost of sales | | | 15,272 | | 49 | | 15,272 | | 167 | |
Rental and other property operations | | 1,478 | | 1,742 | | | 1,329 | | 1,206 | | 2,807 | | 3,051 | |
Provision for doubtful accounts | | | — | | — | | — | | (104 | ) |
Depreciation and amortization | | 43 | | 59 | | | 48 | | 59 | | 91 | | 117 | |
Interest expense, net | | (287 | ) | 74 | | | (675 | ) | 180 | | (962 | ) | 254 | |
Equity in Earnings from Real Estate Affiliates | | | (5,344 | ) | — | | (5,344 | ) | — | |
Total expenses | | 1,234 | | 1,992 | | | 10,630 | | 1,494 | | 11,864 | | 3,485 | |
Strategic Developments REP EBT | | $ | (941 | ) | $ | (1,497 | ) | | $ | 21,272 | | $ | (1,070 | ) | $ | 20,331 | | $ | (2,568 | ) |
(*) For a detailed breakdown of our Strategic Developments segment of EBT, refer to Note 1415 - Segments.
There were insignificant changes in revenue and expenses for the Strategic Development segment during the first quarter49
Table of 2013 as comparedContents
Revenues increased $31.5 million to 2012. The decrease in revenues is primarily due to selling one condominium unit at Nouvelle at Natick$31.9 million for the three months ended March 31, 2012. No units were sold during the three months ended March 31,June 30, 2013 as the project was sold out during the second quarter of 2012. The reduction in expensesand $31.3 million to $32.2 million, for the periodsix months then ended, March 31, 2013 is alsorespectively, primarily due to the sale of our condominium rights related to the completionONE Ala Moana project and the sale of one of the Nouvelleremaining parcels at Natick project.Alameda Plaza. The increase in condominium rights and unit sales and condominium rights and unit cost of sales for the three and six month period ended June 30, 2013 represents partial recognition of the gain on sale of the condominium rights to the joint venture in which we have a 50% interest and the portion of the deferred sale relating to our ongoing interest in the condominium rights that we recognized on the percentage of completion basis. Net interest expense decreased as compared to prior year due to higher capitalized interest from construction projects. The Equity in Earnings from Real Estate Affiliates includes our share of the profit from the ONE Ala Moana condominium venture.
The following describes the status of our active Strategic Development Projects as of March 31,June 30, 2013:
The Woodlands
In the first quarter of 2012, construction began on 3 Waterway Square, an 11-story 232,000 square foot Class A office building. It is on schedule for completion during the second quarter of 2013. The project has incurred approximately $31.2 million (exclusive of land value) of costs as of March 31, 2013. Included in this amount is approximately $2.6 million in prepaid leasing costs. Total budgeted cost for this project is $51.4 million (exclusive of land value). We estimate an additional $20.2 million will be required to complete construction. This project is financed with a $43.3 million non-recourse loan bearing interest at LIBOR plus 2.65% having an initial maturity
45Hughes Landing
Table of Contents
date of January 2015 with two one-year extensions at our option. Approximately 94.0% of the space has been pre-leased as of March 31, 2013 and we currently expect the property to reach stabilized annual NOI of $5.9 million in the third quarter of 2013.
During July of 2012, we announced plans for the first mixed-use development on Lake Woodlands called Hughes Landing. The development will encompass approximately 66 acres and is envisioned to contain over one million square feet of office space in up to eight office buildings, approximately 200,000 square feet of retail and entertainment venues, 1,500 multi-family units (of which 400 will be in phase one) and a 175-room boutique hotel.
We began construction of the first office building, One Hughes Landing, a 195,000197,000 square foot Class A office building and an adjacent garage in November 2012. The building is setsituated on 2.7 acres and the garage will contain 632approximately 630 parking spaces. ItBudgeted construction costs are $49.6 million and project completion is expected to be complete by September of 2013. AsWe have incurred $24.3 million of March 31,costs related to this project as of June 30, 2013, it was 35.2% pre-leased. Thisincluding approximately $1.8 million in prepaid leasing costs. The project is 87% pre-leased as of August 7, 2013 and is financed withby a $38.0 million non-recourse loan bearing interest at LIBOR plus 2.65% and having an initialwith a final maturity date of November 2015,2017.
On June 21, 2013, we began construction of Two Hughes Landing, the second Class A office building in the 66-acre mixed-use development of Hughes Landing on Lake Woodlands. Two Hughes Landing will be a 197,000 square foot, eight-story office building with two one-year extensions at our option. Total budgeted construction costan adjacent parking garage containing approximately 630 spaces and is $47.1 million (exclusivethe second of up to eight office buildings planned for Hughes Landing. The building and the garage will be situated on 3.6 acres of land value).and is estimated to cost approximately $48.6 million. We have incurred $14.2$0.8 million (exclusive of land value) of costs related to this project as of March 31,June 30, 2013. We continue to seek tenants for this building and anticipate closing on construction financing by the end of the third quarter 2013.
In June of 2013, we announced plans to begin construction of a Class A, multi-family project within Hughes Landing on Lake Woodlands. It will be comprised of 391 multi-family units, 20,970 square feet of retail and an approximately 750 space parking garage, all situated on 2.92 acres of land. The eight-story building will consist of ground floor retail with seven stories of residential and parking above. Construction is scheduled to commence in the third quarter of 2013 with completion expected in the first quarter of 2015. The project is estimated to cost $88.5 million. We have incurred $0.7 million of costs related to this project as of June 30, 2013. We anticipate closing on construction financing by the end of 2013.
Millennium Woodlands Phase II
Millennium Woodlands Phase II, a joint venture with The Dinerstein Companies, began construction of a 314-unit Class A multi-family complex in The Woodlands Town Center in the second quarter of 2012. Our partner is the managing member of Millennium Phase II and is the manager on Millennium Phase I, a 393-unit apartment complex that we purchased in 2012. We contributed 4.8 acres of land at a $75.00 per square foot valuation as compared to $51.40 per square foot attributed to the Phase I land contribution. Our partner invested $3.0 million in cash and provided recourse guarantees for a $37.7 million construction loan. Budgeted construction costs are $38.4 million. Approximately $5.9Construction continues to be on pace for initial occupancy in January of 2014 and completion in April 2014. The project has incurred $11.4 million of construction costs have been incurred as of March 31,June 30, 2013. The project is expected to be completed byOur partner guaranteed the third quarter$37.7 million construction loan.
50
Table of 2014.Contents
ONE Ala Moana Tower Condominium Project
We own the rights to develop a residential condominium tower over a parking structure at Ala Moana Center in Honolulu, Hawaii, pursuant to a condominium property regime declaration. In 2011, we and an entity jointly owned by two local development partners formed a joint venture called HHMK Development, LLC (“HHMK Development”). The joint venture was created to explore the development of a 23-story luxury condominium tower.tower above an existing parking structure at Ala Moana Center. We own 50% and our partners jointly own the remaining 50%. In 2012, we formed another 50/50 joint venture, KR Holdings, LLC (“KR Holdings”), with the same two development partners. On September 17, 2012, KR Holdings closed on $40.0 million non-recourse mezzanine financing commitments with List Island Properties, LLC and A & B Properties, Inc., including funding for $3.0 million of pre-development costs ($2.0 million of which are non-interest bearing) which are not required to be repaid if the construction loan fails to close or the project fails to go forward. If the construction loan funds, the mezzanine financing will mature on April 30, 2018 and List Island Properties, LLC and A & B Properties, Inc. will have a profit interest in the project that entitles them to receive a share of the profits after we receive a return of our capital plus a 13.0% preferred return on our capital.costs.
During the fourth quarter of 2012, our Restated Condo Documents received approval from the Real Estate Commission, and in December we launched pre-sales of the 206-condominium units. Allsold all of the condominium units were sold at an average price of $1.6 million, or approximately $1,170 per square foot and as of March 31,July 1, 2013, we havethe venture had collected $33.3 million of deposits and we are expecting our joint venture to collect an additional $32.9all $66.2 million of buyer deposits to be received by July 1, 2013. During April 2013 we commenced construction on the 23-story ultra-luxury condominium tower built atop an existing parking structure at Ala Moana Center.deposits. The 206-unit tower will consist of one, two and three-bedroom units ranging from 760 to 4,100 square feet. On March 8,During April 2013, KR Holdings entered into a preliminary construction financing commitment for $132.0 million which is expected to close in the second quarter of 2013. Upon closing of the construction loan, we will sell our condominium rights, owned by our wholly-owned subsidiary, into the joint venture at their $47.5 million valuation and expect to receive approximately $32.1 million of net proceeds for the sale.commenced construction. The project is expected to cost approximately $250.5 million.$241.3 million, and approximately $67.4 million (inclusive of land value) of project costs have been incurred by the venture as of June 30, 2013. We anticipate that ONE Ala Moana will be completed by the end of 2014.
KR Holdings closed on the condominium project construction loan on May 15, 2013. Upon closing of the loan and pursuant to the terms of the venture agreement, we sold our condominium rights to KR Holdings for $47.5 million and received net cash proceeds of $30.8 million and an equity interest of 50% in KR Holdings. Our partner contributed cash of $16.8 million for its 50% equity interest. Additionally, KR Holdings reimbursed HHMK Development for its development expenditures related to the project. We also received a cash distribution from HHMK Development in the amount of $3.1 million representing the return of our investment. Due to our continuing involvement in KR Holdings, we accounted for the transaction as a partial sale representing 50% of the $47.5 million sales value of the condominium right, and accordingly, we recognized net profit of $11.8 million. The remaining $23.7 million sales value of the condominium rights will be recognized on the same percentage of completion basis as KR Holdings which is discussed below. As of March 31,June 30, 2013, the project was 27.9% complete, and we recognized an additional $3.3 million of profit on the sale for the three months ended June 30, 2013.
The construction loan will be drawn over the course of construction with the total pre-development costs incurrednot to dateexceed $132.0 million. The loan is non-recourse, bears interest at one-month LIBOR plus 3.00%, is secured by the condominiums and buyers’ deposits, and matures May 15, 2016, with the option to extend for one year. Additionally, both HHMKof the $20.0 million non-recourse mezzanine loan commitments with List Island Properties and A&B Properties were drawn in full on May 15, 2013. These loans have a blended interest rate of 12% and mature on April 30, 2018 with the option to extend for one year. In addition to the mezzanine loans, A&B Properties and List Island Properties both have a profit interest in KR Holdings, which entitles them to receive a share of the profit, after a return of our capital plus a 13% preferred return on our capital. A&B Properties’ participation is $5.4capped at $3.0 million. KR Holdings determined that the value of the buyer deposits qualified as a sufficient investment by the buyers to recognize revenue using the percentage of completion method. Equity in earnings from Real Estate Affiliates includes $5.2 million, andwhich represents our share of the pre-development cost is $2.7 million.
46
Table of Contentsincome recognized by KR Holdings.
The Shops at Summerlin
We have substantially completedDuring the design for Downtown Summerlin and assecond quarter of March 31, 2013, we have obtained commitments from Macy’s and Dillard’s for approximately 380,000 square feet. They represent our two major department store anchors for the Shops at Summerlin. When completed,commenced construction of The Shops at Summerlin, will be an approximate 106-acre project within a 400-acre site located in Downtowndowntown Summerlin, a community of Las Vegas, Nevada. The Shops at Summerlin will be approximately 1.6 million square feet and will consist of a 1.1 million square foot Fashion Center which will ultimately have three anchor tenants, small-shop retail and restaurants. Additionally, the project will include an approximate 200,000 square foot office building and approximately 280,000 square feet of big box and junior anchor retail space adjacent to the Fashion Center. We believe the projects will also be accretive to the value of our remaining land at Summerlin.have obtained commitments from two major department store anchors, Macy’s and Dillard’s, for approximately 380,000 square feet. We are currently pursuing tenantspre-leasing and seeking construction financing for the project. The project and subjectis expected to obtaining a sufficient levelcost approximately $390 million with completion anticipated at the end of leasing and securing construction financing, we anticipate beginning construction later in 2013.2014. We have incurred approximately $12.8$17.1 million of developmentproject costs on this project as of March 31,June 30, 2013.
51
Table of Contents
The Metropolitan Downtown Columbia Project (formerly Parcel D)
On April 12, 2012, Columbia Parcel D venture, in which we are a 50% partner with a multi-family developer, received approval of the final development plan component of the entitlement process for the first phase. The approval allows for development of a 380-unit apartment building in Parcel D, and an additional 437 multi-family units in Parcel C. In total, the approvalentitlement provides a density plan for up to 817 residential units, and up to 76,000 square feet of retail to be developed inon two parcels. One parcel includes Parcel D which will be a 380-unit apartment building, and the two parcels.second parcel will include 437 multi-family units (Parcel C).
WeThe venture began construction on Parcel Dof the 380-unit apartment building in February 2013 and we expect to complete constructioncompletion is expected in 2014. The total project budget is $95.7$96.9 million including our contributed land value of $20.3 million. UponAs of June 30, 2013, our total costs incurred for this project were $4.0 million of which $0.6 million was incurred by the expected second quarter closing ofjoint venture.
On July 11, 2013 the venture closed on a $64.1 million non-recourse construction loan bearing interest at one-month LIBOR plus 2.4% having a maturity date of July 10, 2020. As required in the partnership agreement, the venture will “step-up”“stepped-up” the value of our contributed land to $53,500 per unit, or $20.3 million, and we expect to receivereceived a $3.6$7.6 million cash distribution. Our anticipated cash investmentdistribution, which represented the difference between our capital balance in this project, in addition to the value of our contributed land, is expected to be $5.9 million. Our share of the venture’s development costs as of March 31, 2013 was $2.6 million (excluding our land basis).
Bridgesventure at Mint Hill
On September 8, 2011 we entered into a joint venture with the owner of land adjacent to our Bridges of Mint Hill property located near Charlotte, North Carolina to develop a shopping center on our combined properties. On October 30, 2012, the partners contributed their respective parcelsloan closing and we also contributed $4.5 million in cash to pay off an existing mortgage on our partner’s land. As a resultcapital balance. Both partners are required to make future capital contributions of the mortgage payoff, our ownership share of the venture increased from 79.0% to 90.5%, and we direct the significant development activities of this venture. The development is contingent upon obtaining agreements with major retailers, final approval for off-site improvement and financing. Our share of the development costs incurred through March 31, 2013 (excluding land and the payoff of our partner’s land mortgage) is $0.8$3.3 million.
47
Table of Contents
General and Administrative and Other Expenses
General and administrative, warrant liability loss,gain(loss), reduction in tax indemnity receivable, provision for income taxes and equity in earnings from Real Estate Affiliates are summarized as follows:
| | | Three Months Ended June 30, | | Six Months Ended June 30, | |
| | Three Months Ended March 31, | | | 2013 | | 2012 | | 2013 | | 2012 | |
| | 2013 | | 2012 | | | (In thousands) | | (In thousands) | |
| | (In thousands) | | | | | | | | | | | | | | |
General and administrative | | $ | 11,171 | | $ | 8,399 | | | $ | 6,769 | | $ | 8,160 | | $ | 17,940 | | $ | 16,557 | |
Warrant liability loss | | 33,027 | | 121,851 | | |
Warrant liability gain (loss) | | | (111,200 | ) | 23,430 | | (144,227 | ) | (98,421 | ) |
Reduction in tax indemnity receivable | | 1,904 | | — | | | (7,499 | ) | (8,782 | ) | (9,403 | ) | (8,782 | ) |
Provision for income taxes | | 2,479 | | 3,784 | | | 13,361 | | 1,301 | | 15,840 | | 5,085 | |
Equity in earnings from Real Estate Affiliates | | (2,733 | ) | (2,677 | ) | | 5,707 | | 446 | | 8,440 | | 3,122 | |
|
Our generalGeneral and administrative expenses fordecreased $1.4 million during the three months ended March 31,June 30, 2013 totaled $11.2 million, as compared to $8.5 million and $8.4 million for three months ended December 31, 2012 and March 31, 2012, respectively. General and administrative expenses for the three months ended March 31, 2013 increased $2.6$6.8 million as compared to the three months ended December 31,same period in 2012 primarily due to higher headcounta $4.5 million favorable legal settlement relating to the British Petroleum oil spill in the Gulf of Mexico in 2010, which was partially offset by increased compensation, benefits and benefitstravel expenses of $0.9approximately $2.2 million. General and administrative expenses increased $1.4 million during the six months ended June 2013 as compared to 2012 primarily due to increased compensation and travel expenses of approximately $3.8 million, professional fees of $0.8 million and various other items of $1.3 million, which was partially offset by the $4.5 million favorable legal settlement. Compensation and benefit expenses increased $1.7 million to $6.9 million and $3.1 million to $13.5 million for the three and six months ended March 31,June 30, 2013, increased $2.8 millionrespectively, as compared to the three months ended March 31, 2012 primarily due to higher headcount and benefits of $1.5 million and the timing of certain professional fees of $0.7 million related to our annual audit. Corporate compensation and benefit expenses totaled approximately $6.7 million, $5.8 million, and $5.3 million for the three months ended March 31, 2013, December 31, 2012 and March 31, 2012, respectively. Compensation and benefits increasedsame periods in 2012. These increases are due to the addition of resources in order to execute management’s strategic plans.staffing as several of our development projects begin construction.
The warrant liability loss for the three and six months ended March 31,June 30, 2013 was lowerhigher than the same periods in 2012 due to a lower amount ofthe warrants outstanding which resulted from the warrant transactions by Brookfield, Fairholme and Blackstone in the fourth quarter of 2012. In addition, the warrant values arebeing valued higher due to theour higher stock price.price and change in volatility.
The reduction in tax indemnity receivable of $1.9$9.4 million infor the six months ended June 30, 2013 relatedrelates to the utilization of tax assets. Please refer to Note 910 - Income Taxes for more information related to the reduction in tax indemnity receivable.
52
Table of Contents
The equity in earnings from Real Estate Affiliates of $2.7$5.7 million and $8.4 million for the three and six months ended March 31,June 30, 2013, is slightly higher thanrespectively, increased over the same periodperiods in 2012.2012 primarily due to the recognition of our share of the profit related to the ONE Ala Moana condominium project on a percentage of completion basis.
The decreaseincrease in provision for income taxes of $1.3$12.1 million and $10.8 million for the three and six months ended June 30, 2013, was primarily attributable to decreasesincreases in valuation allowancesoperating income as compared to the same periodperiods in 2012. The provision for income taxes was also impacted by changes in operating income,valuation allowances, unrecognized tax benefit interest expense and other permanent items.
We have significant permanent differences, primarily from warrant liability gains and losses, interest income on the tax indemnity receivable, and changes in valuation allowances that cause our effective tax rate to deviate greatly from statutory rates. The effective tax raterates based upon actual operating results were (21.1)% and (18.9)% for the three and six months ended March 31,June 30, 2013, was (12.0%) asrespectively, compared to (3.5%)3.7% and (7.0)% for the same period in 2012.three and six months ended June 30, 2012, respectively. The changes in the tax rate were primarily attributable to the changes in the warrant liability and the valuation allowance.
DuringFor the quarterthree and six months ended March 31,June 30, 2013, we capitalized $2.0$2.3 million and $4.3 million, respectively, of internal costs related to our MPC segment, as compared to $1.8$2.2 million and $4.1 million for the same periodperiods in 2012. Of those capitalized internal costs, salariescompensation costs represented $1.4$1.5 million and $2.9 million for the quarterthree and six months ended March 31,June 30, 2013, respectively, as compared to $1.3 million and $2.7 million for the same periodperiods in 2012. We capitalized $1.0$1.2 million and $2.2 million of internal costs related to the major redevelopment of assets in our Operating AssetAssets Segment for the quarterthree and six months ended March 31,June 30, 2013, respectively, as compared to $0.6$1.1 million and $1.7 million for the same periodperiods in 2012. Approximately $0.8$1.0 million and $1.8 million of these costs arewere related to salariescompensation costs for the quarterthree and six months ended March 31,June 30, 2013, respectively, as compared to $0.5$0.8 million and $1.3 million for the
48
Table of Contents
same periodperiods in 2012. Additionally, we capitalized $1.1$0.7 million and $1.8 million for the three and six months ended June 30, 2013, respectively, of internal costs in our Strategic Development Segment as compared to $0.4$0.5 million and $0.9 million for the same periodperiods in 2012. Approximately $0.9$0.6 million and $1.4 million of these costs arewere related to salariescompensation costs for the quarterthree and six months ended March 31,June 30, 2013, respectively, as compared to $0.4$0.3 million and $0.7 million for the same periodperiods in 2012. Capitalized internal costs have increased with respect to our Operating AssetAssets and Strategic DevelopmentDevelopments segments, in the first quarter of 2012 as we were in the initial stages of evaluating ourhave increased staffing and development projects.activities compared to 2012.
Liquidity and Capital Resources
Our primary sources of cash include cash flow from land sales in our Master Planned CommunitiesMPC segment, and cash generated from our operating assets and first mortgage financings secured by our assets. Our primary uses of cash include working capital, overhead, debt service, property improvements, pre-development and development costs. We believe that our sources of cash, including existing cash on hand, will provide sufficient liquidity to meet our existing non-discretionary obligations and anticipated ordinary course operating expenses for at least the next twelve months. The development and re-development opportunities in our Operating Assets and Strategic Developments segments are capital intensive and will require significant additional funding. Most of these costs are currently discretionary, which means that we could discontinue spending on these activities if our liquidity profile, economic conditions or the feasibility of projects changes. We currently intend to raise this additional funding with a mix of construction, bridge and long-term financings, by entering into joint venture arrangements and the sale of non-core assets at the appropriate time.
As of March 31,June 30, 2013, our consolidated debt was $696.8$715.5 million and our share of the debt of our Real Estate Affiliates aggregated $7.9$29.5 million. Please refer to Note 78 — Mortgages, Notes and Loans Payable to our condensed consolidated financial statements for a table showing our debt maturity dates.
Subsequent to June 30, 2013, we closed on several loan agreements instrumental to our development efforts. Our Parcel D joint venture (The Metropolitan) in Columbia closed a seven-year $64.1 million non-recourse construction loan to fund project construction. We closed on a $52.0 million 15- year non-recourse mortgage on 3 Waterway Square at The Woodlands which refinanced a $43.3 million construction loan.
53
Table of Contents
During the first quarter of 2013, we refinanced $36.1 million of existing debt related to The Woodlands Resort and Conference Center with a $95.0 million three-year non-recourse construction loan that bears interest at one-month LIBOR plus 3.50% and has an initial maturity of February 8, 2016, with three one-year extensions at our option. The financing provides funding for the redevelopment of The Woodlands Resort and Conference Center and is secured by the 440-room and 40-acre resortResort and conference center located within The Woodlands.
On March 15, 2013, we secured non-recourse financing totaling $23.0 million for the complete restoration and redevelopment of The Columbia Regional Building (also known as The Rouse Building) located in Columbia, Maryland. The loan bears interest at one-month LIBOR plus 2.00% and is interest only through the initial maturity date of March 15, 2016 and has two one-year extension options.
The following table summarizes our Net Debt on a segment basis as of March 31,June 30, 2013. Net Debt is defined as our share of mortgages, notes and loans payable, at our ownership share, reduced by short-term liquidity sources to satisfy such obligations such as our ownership share of cash and cash equivalents and SID receivables. Although Net Debt is not a recognized GAAP financial measure, it is readily computable from existing GAAP information and we believe, as with our other non-GAAP measures, that such information is useful to our investors and other users of our financial statements.
49
Table of Contents
Segment Basis Net Debt
| | Master | | | | | | | | Non- | | Total | | | Master | | | | | | | | Non- | | Total | |
| | Planned | | Operating | | Strategic | | Segment | | Segment | | March 31, | | | Planned | | Operating | | Strategic | | Segment | | Segment | | June 30, | |
Segment Basis (a) | | Communities | | Assets | | Developments | | Totals | | Amounts | | 2013 | | | Communities | | Assets | | Developments | | Totals | | Amounts | | 2013 | |
| | | (In thousands) | | | |
| | (In thousands) | | | | | | |
Mortgages, notes and loans payable | | $ | 241,670 | (b) | $ | 441,820 | (c) | $ | 20,244 | | $ | 703,734 | | $ | 897 | | $ | 704,631 | | | $ | 242,691 | (b) | $ | 462,994 | (c) | $ | 38,682 | (d) | $ | 744,367 | | $ | 661 | | $ | 745,028 | |
Less: Cash and cash equivalents | | (46,728 | ) | (27,868 | )(d) | (1,672 | ) | (76,268 | ) | (125,528 | ) | (201,796 | ) | | (69,012 | ) | (31,975 | )(e) | (13,421 | )(f) | (114,408 | ) | (104,961 | ) | (219,369 | ) |
Special Improvement District receivables | | (39,666 | ) | — | | — | | (39,666 | ) | — | | (39,666 | ) | | (39,644 | ) | — | | — | | (39,644 | ) | — | | (39,644 | ) |
Municipal Utility District receivables | | (102,166 | ) | — | | — | | (102,166 | ) | — | | (102,166 | ) | | (116,982 | ) | — | | — | | (116,982 | ) | — | | (116,982 | ) |
Net debt | | $ | 53,110 | | $ | 413,952 | | $ | 18,572 | | $ | 485,634 | | $ | (124,631 | ) | $ | 361,003 | | | $ | 17,053 | | $ | 431,019 | | $ | 25,261 | | $ | 473,333 | | $ | (104,300 | ) | $ | 369,033 | |
(a)Please refer to Note 1415 - Segments in the Notes to Condensed Consolidated Financial Statements.
(b)Includes The Woodlands’ $176.7 million Master Credit Facility outstanding balance.
(c)Includes our $7.9$1.3 million share of debt of our Real Estate Affiliates.Affiliates in Operating Assets Segment (Woodlands-Sarofim #1).
(d)Includes our $1.3$28.2 million share of debt of our Real Estate Affiliates in Strategic Developments segment (KR Holdings, LLC and Millennium Phase II).
(e)Includes our $0.8 million share of cash and cash equivalents of our Real Estate Affiliates.Affiliates in the Operating Assets segment (Woodlands - Sarofim #1, Summerlin Las Vegas Baseball Club, LLC, and Stewart Title).
(f)Includes our $5.3 million share of cash and cash equivalents of our Real Estate Affiliates in the Strategic Development segment (KR Holdings, LLC, and HHMK Development, LLC).
54
Table of Contents
Cash Flows
Operating Activities
MPC development hasland sales have a significant impact on our business. The cash flows and earnings from the business can be much more variable than from our Operating Assets because the MPC business generates revenues from land sales rather than recurring contractual revenues from operating leases. MPC land sales are a substantial portion of our cash flows from operating activities and are partially offset by MPC expenditures.
Cash provided by operating activities was $16.6$89.4 million for the threesix months ended March 31,June 30, 2013 as compared to cash used inprovided by operating activities of $0.9$29.6 million for the threesix months ended March 31,June 30, 2012.
The $17.5$59.9 million increase in cash provided by operating activities for the threesix months ended March 31,June 30, 2013 compared to the same period in 2012 was primarily the result of the collection of $13.7$47.5 million inrelated to the sale of our condominium deposits on the ONE Ala Moana condominium tower project, an $11.1air rights to a joint venture, a $22.1 million increase in MPC land sales and a $1.4the receipt of $4.5 million increase in The Woodlands Resort and Conference Center revenue,legal settlement at Riverwalk, partially offset by increased MPC expenditures of $9.0 million.$20.2 million primarily at The Woodlands. We expect Summerlin MPC expenditures to ramp up through the remainder of the year to fulfill sales currently under contract.
Investing Activities
Cash used in investing activities was $56.6$136.6 million for the threesix months ended March 31,June 30, 2013 as compared to $9.0$1.0 million for the same period in 2012.
Cash used for development of real estate and property expenditures was $43.9increased $76.1 million to $96.2 million for the threesix months ended March 31,June 30, 2013 an increase of $36.3 million compared to $7.6$20.0 million for the threesix months ended March 31,June 30, 2012. There has beenThe increased development expenditures in the first quarter of 2013 as compared to 2012 relatedrelate primarily to the construction of properties in development.Ward Centers, One Hughes Landing, Landmark, Seaport and Shops at Summerlin. The increase in restricted cash of $10.1$20.4 million for the threesix months ended March 31,June 30, 2013 compared to the same period in 2012 was primarily due to the receipt of $13.7$14.6 million in condominium deposits on the ONE Ala Moana condominium tower project partially offset byin the first six months of 2013 compared to a decrease$5.7 million reduction in restricted cash in the first six months of $2.5 million in security2012 due to escrow restrictions being lifted on The Woodlands Resort and escrow deposits primarily related to the utilization of $2.1 million of escrow funds established at the acquisition of 70 CCC.Conference Center debt.
Financing Activities
CashOur financing activity in the first half of June 30, 2013 provided cash of $31.1 million, an increase of $32.9 million over the cash used by financing activities was $11.3of ($1.8) million for the threesix months ended March 31, 2013 and cash used in financing activities was $7.8 million for the three months ended March 31,June 30, 2012.
50
TableDuring the six months ended June 30, 2013, we received loan proceeds of Contents
Proceeds$94.6 million from the issuance of mortgages, notes and loans payable were $68.3 millionpayable. Cash was obtained to partially fund activity at the Bridgeland MPC provide for strategic development of 3 Waterway Square and One Hughes Landing, and refinance existing debt to take advantage of lower interest rates. During the threesix months ended March 31,June 30, 2013, we made principal payments of $60.8 million. Comparatively, in the six month period ended June 30, 2012, we received loan proceeds of $35.8 million and $0.2 million for the three months ended March 31, 2012.
Principalmade principal payments on mortgages, notes and loan payable were $57.0 million for the three months ended March 31, 2013 and $7.5 million for the three months ended March 31, 2012.of $36.3 million.
Off-Balance Sheet Financing Arrangements
We do not have any material off-balance sheet financing arrangements. Although we have interests in certain property owning non-consolidated ventures which have mortgage financing, the financings are non-recourse to us and totaled $15.9$56.7 million as of March 31,June 30, 2013.
REIT Requirements
In order for Victoria Ward to remain qualified as a REIT for federal income tax purposes, Victoria Ward must meet a number of organizational and operational requirements, including a requirement that it distribute or pay tax on 100% of its capital gains and distribute at least 90% of its ordinary taxable income to its stockholders, including us. Please refer to Note 910 — Income Taxes for more detail on Victoria Ward’s ability to remain qualified as a REIT.
55
Table of Contents
Seasonality
Generally, revenues from our Operating Assets segment, Master Planned Communities segment and Strategic Developments segment are not subject to seasonal variations; however, rental incomes for certain retail tenants are subject to overage rent terms, which are based on tenant sales. These retail tenants are generally subject to seasonal variations, with a significant portion of their sales and earnings occurring during the last two months of the year. As such, our rental income is higher in the fourth quarter of each year.
Critical Accounting Policies
Critical accounting policies are those that are both significant to the overall presentation of our financial condition and results of operations and require management to make difficult, complex or subjective judgments.
Recently Issued Accounting Pronouncements
We have implemented all new accounting pronouncements that are in effect. These pronouncements did not have any material impact on the financial statements unless otherwise disclosed, and we do not believe that there are any other new accounting pronouncements that have been issued that might have a material impact on our financial position or results of operations.
In February 2013, the FASB issued Accounting Standards Update No. 2013-02, Comprehensive Income (Topic 220): Reporting of Amounts Reclassified Out of Accumulated Other Comprehensive Income (“ASU 2013-02”). This update requires companies to present information about amounts reclassified out of accumulated other comprehensive income and their corresponding effect on net income in one place and reference the amounts to the related footnote disclosures. Current accounting standards present this information in different places throughout the financial statements. ASU 2013-02 is effective for fiscal years, and interim periods within those years, beginning after December 15, 2012. Adoption of this guidance at the beginning of fiscal 2013 resulted in the additional disclosures in Note 12 — Accumulated Other Comprehensive Income (Loss), but did not otherwise have any effect on our condensed consolidated financial statements or on its financial condition.
51
Table of Contents
ITEM 3. QUANTITATIVE AND QUALITATIVE DISCLOSURES ABOUT MARKET RISK
We are subject to interest rate risk with respect to our fixed-rate financing in that changes in interest rates will impact the fair value of our fixed-rate financing and with respect to our variable rate financings in that increases in interest rates could increase our payments under these variable rates. As of March 31,June 30, 2013, we had $491.9$515.5 million of variable rate debt outstanding of which $172.0 million has been swapped to a fixed-rate. Approximately $176.7 million of the $319.9$343.5 million of total variable rate debt that has not been swapped to a fixed rate is represented by the Master Credit Facility at The Woodlands. Due to the revolving nature of this type of debt, it is generally inefficient to use interest rate swaps as a hedging instrument; rather, we have purchased an interest rate cap for this facility to mitigate our exposure to rising interest rates. We also did not swap to a fixed rate $86.0 million of the outstanding balance on the Victoria Ward financing because it is structured to permit partial repayments to release collateral for re-development.redevelopment. Due to the uncertain timing of such partial repayments, hedging this portion of the outstanding balance is inefficient. As of March 31,June 30, 2013, annual interest costs would increase approximately $3.2$3.4 million for every 1% increase in floating interest rates. Generally, our interest costs are capitalized due to the level of assets we currently have under development; therefore, the impact of a change in our interest rate on our Condensed Consolidated Statements of Operations and Condensed Consolidated Statements of Comprehensive Income (Loss) is expected to be minimal. For additional information concerning our debt, and management’s estimation process to arrive at a fair value of our debt as required by GAAP, reference is made to the Liquidity and Capital Resources section of Item 2 — Management’s Discussion and Analysis of Financial Condition and Results of Operations, Note 2 — Summary of Significant Accounting Policies to our Condensed Consolidated Financial Statements, and Note 7 — Mortgages, Notes and Loan Payable and Note 9 — Derivative Instruments and Hedging Activities in our Annual Report. We intend to manage a portion of our variable interest rate exposure by using interest rate swaps and caps.
56
Table of Contents
ITEM 4. CONTROLS AND PROCEDURES
Disclosure Controls and Procedures
We maintain disclosure controls and procedures (as defined in Rule 13(a)-15(e) under the Exchange Act) that are designed to provide reasonable assurance that information required to be disclosed in our reports to the SEC is recorded, processed, summarized and reported within the time periods specified in the SEC’s rules and forms, and that such information is accumulated and communicated to our management, including our principal executive officer and our principal financial and accounting officer, as appropriate, to allow timely decisions regarding required disclosure.
As required by SEC rules, we carried out an evaluation, under the supervision and with the participation of our management, including our principal executive officer and our principal financial and accounting officer, of the effectiveness of the design and operation of our disclosure controls and procedures as of March 31,June 30, 2013, the end of the period covered by this report. Based on the foregoing, our principal executive officer and principal financial and accounting officer concluded that our disclosure controls and procedures were effective as of March 31,June 30, 2013.
Internal Controls over Financial Reporting
There have been no changes in our internal controls during our most recently completed fiscal quarter that have materially affected or are reasonably likely to materially affect our internal control over financial reporting.
PART II OTHER INFORMATION
ITEM 1. LEGAL PROCEEDINGS
In the ordinary course of our business, we are from time to time involved in legal proceedings related to the ownership and operations of our properties. Neither we nor any of our real estate affiliates are currently involved in
52
Table of Contents
any legal or administrative proceedings that we believe are likely to have a materially adverse effect on our business, results of operations or financial condition.
ITEM 1A. RISK FACTORS
There are no material changes to the risk factors previously disclosed in our Annual Report.
ITEM 6 EXHIBITS
The Exhibit Index following the signature page to this Quarterly Report lists the exhibits furnished as required by Item 601 of Regulation S-K and is incorporated by reference.
5357
Table of Contents
SIGNATURE
Pursuant to the requirements of the Securities Exchange Act of 1934, the registrant has duly caused this report to be signed on its behalf by the undersigned thereunto duly authorized.
| The Howard Hughes Corporation |
| | |
| By: | /s/ Andrew C. Richardson |
| | Andrew C. Richardson |
| | Chief Financial Officer (principal financial officer) |
| | May 9,August 8, 2013
|
5458
Table of Contents
EXHIBIT INDEX
31.110.1*+
| Form of Restricted Stock Agreement for Executive Officers under The Howard Hughes Corporation Amended and Restated 2010 Incentive Plan |
| |
31.1+ | Certification of Chief Executive Officer Pursuant to Section 302 of the Sarbanes-Oxley Act of 2002.*2002 |
| | |
31.2
| 31.2+ | Certification of Chief Financial Officer Pursuant to Section 302 of the Sarbanes-Oxley Act of 2002.*2002 |
| | |
32.1
| 32.1+ | Certification of Chief Executive Officer and Chief Financial Officer Pursuant to Section 906 of the Sarbanes-Oxley Act of 2002.*2002 |
| | |
101.INS
| 101.INS+ | XBRL Instance Document.*Document |
| | |
101.SCH
| 101.SCH+ | XBRL Taxonomy Extension Schema Document.*Document |
| | |
101.CAL
| 101.CAL+ | XBRL Taxonomy Extension Calculation Linkbase Document.*Document |
| | |
101.LAB
| 101.LAB+ | XBRL Taxonomy Extension Label Linkbase Document.*Document |
| | |
101.PRE
| 101.PRE+ | XBRL Taxonomy Extension Presentation Linkbase Document.*Document |
| | |
101.DEF
| 101.DEF+ | XBRL Taxonomy Extension Definition Linkbase Document.*Document |
*Management contract, compensatory plan or arrangement
+ Filed herewith
Pursuant to Item 601(b)(4)(v) of Regulation S-K, the registrant has not filed debt instruments relating to long-term debt that is not registered and for which the total amount of securities authorized thereunder does not exceed 10% of total assets of the registrant and its subsidiaries on a consolidated basis as of March 31,June 30, 2013. The registrant agrees to furnish a copy of such agreements to the SEC upon request.
Attached as Exhibit 101 to this report are the following documents formatted in XBRL (Extensible Business Reporting Language): (i) the Condensed Consolidated Statements of Operations for the three and six months ended March 31,June 30, 2013 and 2012, (ii) Condensed Consolidated Statements of Comprehensive Income (Loss) for the three and six months ended March 31,June 30, 2013 and 2012, (iii) the Condensed Consolidated Balance Sheets as of March 31,June 30, 2013 and December 31, 2012, (iv) Condensed Consolidated Statements of Equity for the threesix months ended March 31,June 30, 2013 and 2012, and (v) the Condensed Consolidated Statements of Cash Flows for the threesix months ended March 31,June 30, 2013 and 2012.
5559