Table of Contents
UNITED STATES
SECURITIES AND EXCHANGE COMMISSION
Washington, D.C. 20549
FORM 10-Q
x Quarterly report pursuant to Section 13 or 15(d) of the Securities Exchange Act of 1934 | Quarterly report pursuant to Section 13 or 15(d) of the Securities Exchange Act of 1934
|
For the quarterly period ended September 30, 2013March 31, 2014
or
o Transition report pursuant to Section 13 or 15(d) of the Securities Exchange Act of 1934 | Transition report pursuant to Section 13 or 15(d) of the Securities Exchange Act of 1934
|
For the transition period from to
Commission file number 001-34856
THE HOWARD HUGHES CORPORATION
(Exact name of registrant as specified in its charter)
Delaware |
| 36-4673192 |
(State or other jurisdiction of | | (I.R.S. employer
|
incorporation or organization)
| | (I.R.S. employer
identification number) |
13355 Noel Road, 22nd Floor, Dallas, Texas 75240
(Address of principal executive offices, including zip code)
(214) 741-7744
(Registrant’s telephone number, including area code)
N / A
(Former name, former address and former fiscal year, if changed since last report)
Indicate by check mark whether the registrant: (1) has filed all reports required to be filed by Section 13 or 15(d) of the Securities Exchange Act of 1934 during the preceding 12 months (or for such shorter period that the registrant was required to file such reports), and (2) has been subject to such filing requirements for the past 90 days. xYes o No
Indicate by check mark whether the registrant has submitted electronically and posted on its corporate Web site, if any, every Interactive Data File required to be submitted and posted pursuant to Rule 405 of Regulation S-T (§232.405 of this chapter) during the preceding 12 months (or for such shorter period that the registrant was required to submit and post such files). x Yes o No
Indicate by check mark whether the registrant is a large accelerated filer, an accelerated filer, a non-accelerated filer, or a smaller reporting company. See the definitions of “large accelerated filer,” “accelerated filer” and “smaller reporting company” in Rule 12b-2 of the Exchange Act.
Large accelerated filer x | | Accelerated filer o |
| | |
Non-accelerated filer o (Do
(Do not check if a smaller reporting company) | | Smaller reporting company o |
Indicate by check mark whether the registrant is a shell company (as defined in Rule 12b-2 of the Exchange Act). o Yes x No
The number of shares of common stock, $0.01 par value, outstanding as of NovemberMay 5, 20132014 was 39,576,344.39,630,548.
Table of Contents
THE HOWARD HUGHES CORPORATION
INDEX
| | PAGE |
|
| NUMBER |
| | |
PART I | FINANCIAL INFORMATION | |
| Item 1: | Condensed Consolidated Financial Statements (Unaudited) | |
| | | |
| | Condensed Consolidated Balance Sheets
as of September 30, 2013March 31, 2014 and December 31, 20122013 | 3 |
| | | |
| | Condensed Consolidated Statements of Operations
for the three and nine months ended September 30,March 31, 2014 and 2013 and 2012 | 4 |
| | | |
| | Condensed Consolidated Statements of Comprehensive Income (Loss)
for the three and nine months ended September 30,March 31, 2014 and 2013 and 2012 | 5 |
| | | |
| | Condensed Consolidated Statements of Equity
for the ninethree months ended September 30,March 31, 2014 and 2013 and 2012 | 6 |
| | | |
| | Condensed Consolidated Statements of Cash Flows
for the ninethree months ended September 30,March 31, 2014 and 2013 and 2012 | 7 |
| | | |
| | Notes to Condensed Consolidated Financial Statements | 9 |
| | | |
| Item 2: | Management’s Discussion and Analysis of
Financial Condition and Results of Operations | 34 |
| | | |
| Item 3: | Quantitative and Qualitative Disclosures about Market Risk | 6057
|
| | | |
| Item 4: | Controls and Procedures | 6058
|
|
| |
PART II | OTHER INFORMATION | |
| | |
| Item 1: | Legal Proceedings | 6158
|
| | | |
| Item 1A: | Risk Factors | 6158
|
| | | |
| Item 6: | Exhibits | 6258
|
| | |
| SIGNATURE | 6359
|
| | |
| EXHIBIT INDEX | 6460
|
2
Table of Contents
THE HOWARD HUGHES CORPORATION
CONDENSED CONSOLIDATED BALANCE SHEETS
UNAUDITED
| | September 30, | | December 31, | | | March 31, | | December 31, | |
| | 2013 | | 2012 | | | 2014 | | 2013 | |
| | (In thousands, except share amounts) | | | (In thousands, except share amounts) | |
Assets: | | | | | | | | | | |
Investment in real estate: | | | | | | | | | | |
Master Planned Community assets | | $ | 1,560,476 | | $ | 1,563,122 | | | $ | 1,537,167 | | $ | 1,537,758 | |
Land | | 255,707 | | 252,593 | | | 244,041 | | 244,041 | |
Buildings and equipment | | 712,961 | | 657,268 | | | 769,606 | | 754,878 | |
Less: accumulated depreciation | | (112,841 | ) | (112,491 | ) | | (120,727 | ) | (111,728 | ) |
Developments | | 380,174 | | 273,613 | | | 634,973 | | 488,156 | |
Net property and equipment | | 2,796,477 | | 2,634,105 | | | 3,065,060 | | 2,913,105 | |
Investment in Real Estate Affiliates | | 57,673 | | 32,179 | | |
Investment in Real Estate and Other Affiliates | | | 67,323 | | 61,021 | |
Net investment in real estate | | 2,854,150 | | 2,666,284 | | | 3,132,383 | | 2,974,126 | |
Cash and cash equivalents | | 210,760 | | 229,197 | | | 827,087 | | 894,948 | |
Accounts receivable, net | | 19,682 | | 13,905 | | | 24,259 | | 21,409 | |
Municipal Utility District receivables, net | | 125,344 | | 89,720 | | | 106,669 | | 125,830 | |
Notes receivable, net | | 19,122 | | 27,953 | | | 19,051 | | 20,554 | |
Tax indemnity receivable, including interest | | 316,504 | | 319,622 | | | 322,350 | | 320,494 | |
Deferred expenses, net | | 22,234 | | 12,891 | | | 51,623 | | 36,567 | |
Prepaid expenses and other assets, net | | 151,434 | | 143,470 | | | 216,319 | | 173,940 | |
Total assets | | $ | 3,719,230 | | $ | 3,503,042 | | | $ | 4,699,741 | | $ | 4,567,868 | |
| | | | | | | | | | |
Liabilities: | | | | | | | | | | |
Mortgages, notes and loans payable | | $ | 765,980 | | $ | 688,312 | | | $ | 1,559,381 | | $ | 1,514,623 | |
Deferred tax liabilities | | 94,172 | | 77,147 | | | 92,582 | | 89,365 | |
Warrant liabilities | | 272,279 | | 123,573 | | | 402,000 | | 305,560 | |
Uncertain tax position liability | | 137,243 | | 132,492 | | | 131,042 | | 129,183 | |
Accounts payable and accrued expenses | | 223,980 | | 170,521 | | | 354,091 | | 283,991 | |
Total liabilities | | 1,493,654 | | 1,192,045 | | | 2,539,096 | | 2,322,722 | |
| | | | | | | | | | |
Commitments and Contingencies (see Note 14) | | | | | | | | | | |
| | | | | | | | | | |
Equity: | | | | | | | | | | |
Preferred stock: $.01 par value; 50,000,000 shares authorized, none issued | | — | | — | | |
Common stock: $.01 par value; 150,000,000 shares authorized, 39,576,344 shares issued and outstanding as of September 30, 2013 and 39,498,912 shares issued and outstanding as of December 31, 2012 | | 396 | | 395 | | |
Preferred stock: .01 par value; 50,000,000 shares authorized, none issued | | | — | | — | |
Common stock: .01 par value; 150,000,000 shares authorized, 39,630,548 shares issued and outstanding as of March 31, 2014 and 39,576,344 shares issued and outstanding as of December 31, 2013 | | | 396 | | 396 | |
Additional paid-in capital | | 2,828,142 | | 2,824,031 | | | 2,831,577 | | 2,829,813 | |
Accumulated deficit | | (601,956 | ) | (509,613 | ) | | (669,719 | ) | (583,403 | ) |
Accumulated other comprehensive loss | | (8,479 | ) | (9,575 | ) | | (8,156 | ) | (8,222 | ) |
Total stockholders’ equity | | 2,218,103 | | 2,305,238 | | | 2,154,098 | | 2,238,584 | |
Noncontrolling interests | | 7,473 | | 5,759 | | | 6,547 | | 6,562 | |
Total equity | | 2,225,576 | | 2,310,997 | | | 2,160,645 | | 2,245,146 | |
Total liabilities and equity | | $ | 3,719,230 | | $ | 3,503,042 | | | $ | 4,699,741 | | $ | 4,567,868 | |
See Notes to Condensed Consolidated Financial Statements.
3
Table of Contents
THE HOWARD HUGHES CORPORATION
CONDENSED CONSOLIDATED STATEMENTS OF OPERATIONS
UNAUDITED
| | Three Months Ended September 30, | | Nine Months Ended September 30, | | | Three Months Ended March 31, | |
| | 2013 | | 2012 | | 2013 | | 2012 | | | 2014 | | 2013 | |
| | (In thousands, except per share amounts) | | | (In thousands, except per share amounts) | |
Revenues: | | | | | | | | | | | | | | |
Master Planned Community land sales | | $ | 53,734 | | $ | 40,218 | | $ | 166,981 | | $ | 120,235 | | | $ | 47,671 | | $ | 47,226 | |
Builder price participation | | 2,002 | | 1,867 | | 5,703 | | 4,208 | | | 4,097 | | 1,275 | |
Minimum rents | | 21,538 | | 23,135 | | 60,598 | | 62,609 | | | 20,360 | | 18,926 | |
Tenant recoveries | | 5,291 | | 6,065 | | 15,681 | | 17,932 | | | 6,015 | | 5,325 | |
Condominium rights and unit sales | | 810 | | — | | 31,191 | | 267 | | | 3,126 | | — | |
Resort and conference center revenues | | 8,169 | | 8,328 | | 30,543 | | 29,954 | | | 9,426 | | 11,104 | |
Other land revenues | | 7,478 | | 6,385 | | 14,110 | | 13,433 | | | 2,512 | | 2,802 | |
Other rental and property revenues | | 4,492 | | 8,817 | | 15,850 | | 19,879 | | | 5,446 | | 3,433 | |
Total revenues | | 103,514 | | 94,815 | | 340,657 | | 268,517 | | | 98,653 | | 90,091 | |
Expenses: | | | | | | | | | | | | | | |
Master Planned Community cost of sales | | 27,063 | | 21,439 | | 82,616 | | 63,096 | | | 23,078 | | 25,699 | |
Master Planned Community operations | | 9,764 | | 9,936 | | 28,054 | | 30,962 | | | 9,482 | | 8,496 | |
Other property operating costs | | 22,626 | | 16,933 | | 55,480 | | 46,306 | | | 17,807 | | 15,520 | |
Rental property real estate taxes | | 3,698 | | 3,574 | | 10,814 | | 10,583 | | | 3,740 | | 3,757 | |
Rental property maintenance costs | | 2,048 | | 2,263 | | 5,996 | | 6,304 | | | 1,915 | | 1,805 | |
Condominium rights and unit cost of sales | | 406 | | — | | 15,678 | | 96 | | | 1,571 | | — | |
Resort and conference center operations | | 7,381 | | 6,965 | | 22,537 | | 21,750 | | | 7,511 | | 7,476 | |
Provision for doubtful accounts | | 204 | | 240 | | 910 | | 285 | | | 143 | | 429 | |
Demolition costs | | 1,386 | | — | | 1,386 | | — | | | 2,516 | | — | |
General and administrative | | 11,914 | | 11,464 | | 34,310 | | 28,021 | | | 16,882 | | 11,171 | |
Other income | | (3,662 | ) | (2,125 | ) | (8,118 | ) | (2,125 | ) | | (10,448 | ) | — | |
Depreciation and amortization | | 9,986 | | 6,764 | | 23,210 | | 17,715 | | | 10,509 | | 6,444 | |
Total expenses | | 92,814 | | 77,453 | | 272,873 | | 222,993 | | | 84,706 | | 80,797 | |
| | | | | | | | | | | | | | |
Operating income | | 10,700 | | 17,362 | | 67,784 | | 45,524 | | | 13,947 | | 9,294 | |
| | | | | | | | | | | | | | |
Interest income | | 2,061 | | 2,375 | | 6,484 | | 7,048 | | | 2,188 | | 2,356 | |
Interest expense | | (1 | ) | (445 | ) | (144 | ) | (646 | ) | | (7,321 | ) | (143 | ) |
Warrant liability loss | | (4,479 | ) | (64,303 | ) | (148,706 | ) | (162,724 | ) | | (96,440 | ) | (33,027 | ) |
Increase (reduction) in tax indemnity receivable | | 730 | | (2,873 | ) | (8,673 | ) | (11,655 | ) | |
Equity in earnings from Real Estate Affiliates | | 3,594 | | 310 | | 12,034 | | 3,432 | | |
Income (loss) before taxes | | 12,605 | | (47,574 | ) | (71,221 | ) | (119,021 | ) | |
Reduction in tax indemnity receivable | | | — | | (1,904 | ) |
Equity in earnings from Real Estate and Other Affiliates | | | 6,068 | | 2,733 | |
Loss before taxes | | | (81,558 | ) | (20,691 | ) |
Provision for income taxes | | 5,172 | | 2,618 | | 21,012 | | 7,703 | | | 4,773 | | 2,479 | |
Net income (loss) | | 7,433 | | (50,192 | ) | (92,233 | ) | (126,724 | ) | |
Net (income) loss attributable to noncontrolling interests | | (98 | ) | 781 | | (110 | ) | (637 | ) | |
Net income (loss) attributable to common stockholders | | $ | 7,335 | | $ | (49,411 | ) | $ | (92,343 | ) | $ | (127,361 | ) | |
Net loss | | | (86,331 | ) | (23,170 | ) |
Net loss attributable to noncontrolling interests | | | 15 | | 46 | |
Net loss attributable to common stockholders | | | $ | (86,316 | ) | $ | (23,124 | ) |
| | | | | | | | | | | | | | |
Basic earnings (loss) per share: | | $ | 0.19 | | $ | (1.30 | ) | $ | (2.34 | ) | $ | (3.36 | ) | |
Basic loss per share: | | | $ | (2.19 | ) | $ | (0.59 | ) |
| | | | | | | | | | | | | | |
Diluted earnings (loss) per share: | | $ | 0.17 | | $ | (1.30 | ) | $ | (2.34 | ) | $ | (3.36 | ) | |
Diluted loss per share: | | | $ | (2.19 | ) | $ | (0.59 | ) |
See Notes to Condensed Consolidated Financial Statements.
4
Table of Contents
THE HOWARD HUGHES CORPORATION
CONDENSED CONSOLIDATED STATEMENTS OF COMPREHENSIVE INCOME (LOSS)
UNAUDITED
| | Three Months Ended September 30, | | Nine Months Ended September 30, | |
| | 2013 | | 2012 | | 2013 | | 2012 | |
| | (In thousands) | |
Comprehensive income (loss), net of tax: | | | | | | | | | |
Net income (loss) | | $ | 7,433 | | $ | (50,192 | ) | $ | (92,233 | ) | $ | (126,724 | ) |
Other comprehensive income (loss): | | | | | | | | | |
Interest rate swaps (a) | | (413 | ) | (954 | ) | 2,120 | | (3,115 | ) |
Capitalized swap interest (b) | | (293 | ) | (328 | ) | (1,024 | ) | (897 | ) |
Other comprehensive income (loss) | | (706 | ) | (1,282 | ) | 1,096 | | (4,012 | ) |
Comprehensive income (loss) | | 6,727 | | (51,474 | ) | (91,137 | ) | (130,736 | ) |
Comprehensive (income) loss attributable to noncontrolling interests | | (98 | ) | 781 | | (110 | ) | (637 | ) |
Comprehensive income (loss) attributable to common stockholders | | $ | 6,629 | | $ | (50,693 | ) | $ | (91,247 | ) | $ | (131,373 | ) |
| | Three Months Ended March 31, | |
| | 2014 | | 2013 | |
| | (In thousands) |
Comprehensive loss, net of tax: | | | | | |
Net loss | | $ | (86,331 | ) | $ | (23,170 | ) |
Other comprehensive income (loss): | | | | | |
Interest rate swaps (a) | | 199 | | 421 | |
Capitalized swap interest (b) | | (133 | ) | (413 | ) |
Other comprehensive income | | 66 | | 8 | |
Comprehensive loss | | (86,265 | ) | (23,162 | ) |
Comprehensive loss attributable to noncontrolling interests | | 15 | | 46 | |
Comprehensive loss attributable to common stockholders | | $ | (86,250 | ) | $ | (23,116 | ) |
(a)Net of deferred tax expense of $0.4zero and $0.1 million for the ninethree months ended September 30,March 31, 2014 and 2013, respectively.
(b)Net of deferred tax benefit of $0.1 million and $0.2 million for the three and nine months ended September 30, 2012, respectively.
(b)Net of deferred tax benefit of $0.2 millionMarch 31, 2014 and $0.5 million for the three and nine months ended September 30, 2013, respectively. Net of deferred tax benefit of $0.2 million and $0.5 million for the three and nine months ended September 30, 2012, respectively.
See Notes to Condensed Consolidated Financial Statements.
5
Table of Contents
THE HOWARD HUGHES CORPORATION
CONDENSED CONSOLIDATED STATEMENTS OF EQUITY
UNAUDITED
| | | | | | | | | | Accumulated | | | | | |
| | | | | | Additional | | | | Other | | | | | |
| | | | Common | | Paid-In | | Accumulated | | Comprehensive | | Noncontrolling | | Total | |
(In thousands, except share amounts) | | Shares | | Stock | | Capital | | Deficit | | Income (Loss) | | Interests | | Equity | |
Balance, January 1, 2012 | | 37,945,707 | | $ | 379 | | $ | 2,711,109 | | $ | (381,325 | ) | $ | (5,578 | ) | $ | 5,014 | | $ | 2,329,599 | |
Net income (loss) | | | | — | | — | | (127,361 | ) | — | | 637 | | (126,724 | ) |
Interest rate swaps, net of tax of $212 | | | | — | | — | | — | | (3,115 | ) | — | | (3,115 | ) |
Capitalized swap interest, net of tax of $523 | | | | — | | — | | — | | (897 | ) | — | | (897 | ) |
Stock plan activity | | 27,933 | | — | | 3,149 | | — | | — | | — | | 3,149 | |
Balance, September 30, 2012 | | 37,973,640 | | $ | 379 | | $ | 2,714,258 | | $ | (508,686 | ) | $ | (9,590 | ) | $ | 5,651 | | $ | 2,202,012 | |
| | | | | | | | | | | | | | | |
Balance, January 1, 2013 | | 39,498,912 | | $ | 395 | | $ | 2,824,031 | | $ | (509,613 | ) | $ | (9,575 | ) | $ | 5,759 | | $ | 2,310,997 | |
Net income (loss) | | | | — | | — | | (92,343 | ) | — | | 110 | | (92,233 | ) |
Adjustment to noncontrolling interest | | | | — | | — | | — | | — | | 1,616 | | 1,616 | |
Preferred dividend payment on behalf of REIT subsidiary | | | | — | | — | | — | | — | | (12 | ) | (12 | ) |
Interest rate swaps, net of tax of ($376) | | | | — | | — | | — | | 2,120 | | — | | 2,120 | |
Capitalized swap interest, net of tax of $542 | | | | — | | — | | — | | (1,024 | ) | — | | (1,024 | ) |
Stock plan activity | | 77,432 | | 1 | | 4,111 | | — | | — | | — | | 4,112 | |
Balance, September 30, 2013 | | 39,576,344 | | $ | 396 | | $ | 2,828,142 | | $ | (601,956 | ) | $ | (8,479 | ) | $ | 7,473 | | $ | 2,225,576 | |
| | | | | | | | | | Accumulated | | | | | |
| | | | | | Additional | | | | Other | | | | | |
| | | | Common | | Paid-In | | Accumulated | | Comprehensive | | Noncontrolling | | Total | |
(In thousands, except share amounts) | | Shares | | Stock | | Capital | | Deficit | | Income (Loss) | | Interests | | Equity | |
Balance, January 1, 2013 | | 39,498,912 | | $ | 395 | | $ | 2,824,031 | | $ | (509,613 | ) | $ | (9,575 | ) | $ | 5,759 | | $ | 2,310,997 | |
Net loss | | | | — | | — | | (23,124 | ) | — | | (46 | ) | (23,170 | ) |
Adjustment to noncontrolling interest | | | | — | | — | | — | | — | | 3,750 | | 3,750 | |
Preferred dividend payment on behalf of REIT subsidiary | | | | — | | — | | — | | — | | (12 | ) | (12 | ) |
Interest rate swaps, net of tax of $80 | | | | — | | — | | — | | 421 | | — | | 421 | |
Capitalized swap interest, net of tax of $198 | | | | — | | — | | — | | (413 | ) | — | | (413 | ) |
Stock plan activity | | — | | — | | 1,143 | | — | | — | | — | | 1,143 | |
Balance, March 31, 2013 | | 39,498,912 | | $ | 395 | | $ | 2,825,174 | | $ | (532,737 | ) | $ | (9,567 | ) | $ | 9,451 | | $ | 2,292,716 | |
| | | | | | | | | | | | | | | |
Balance, January 1, 2014 | | 39,576,344 | | $ | 396 | | $ | 2,829,813 | | $ | (583,403 | ) | $ | (8,222 | ) | $ | 6,562 | | $ | 2,245,146 | |
Net loss | | | | — | | — | | (86,316 | ) | — | | (15 | ) | (86,331 | ) |
Interest rate swaps, net of tax of $10 | | | | — | | — | | — | | 199 | | — | | 199 | |
Capitalized swap interest, net of tax of $75 | | | | — | | — | | — | | (133 | ) | — | | (133 | ) |
Stock plan activity | | 54,204 | | — | | 1,764 | | — | | — | | — | | 1,764 | |
Balance, March 31, 2014 | | 39,630,548 | | $ | 396 | | $ | 2,831,577 | | $ | (669,719 | ) | $ | (8,156 | ) | $ | 6,547 | | $ | 2,160,645 | |
See Notes to Condensed Consolidated Financial Statements.
6
Table of Contents
THE HOWARD HUGHES CORPORATION
CONDENSED CONSOLIDATED STATEMENTS OF CASH FLOWS
UNAUDITED
| | Nine Months Ended September 30, | | |
| | 2013 | | 2012 | | | Three Months Ended March 31, | |
| | (In thousands) | | | 2014 | | 2013 | |
| | | | | | | (In thousands) | |
Cash Flows from Operating Activities: | | | | | | | | | | |
Net loss | | $ | (92,233 | ) | $ | (126,724 | ) | | $ | (86,331 | ) | $ | (23,170 | ) |
Adjustments to reconcile net loss to cash provided by operating activities: | | | | | | | | | | |
Depreciation | | 20,197 | | 14,062 | | | 9,346 | | 5,483 | |
Amortization | | 3,013 | | 3,653 | | | 1,163 | | 961 | |
Amortization of deferred financing costs and debt market rate adjustments, net | | 1,060 | | (49 | ) | | 1,014 | | 144 | |
Amortization of intangibles other than in-place leases | | 271 | | (263 | ) | | 161 | | 260 | |
Straight-line rent amortization | | (2,087 | ) | (379 | ) | | (472 | ) | 70 | |
Deferred income taxes | | 19,712 | | 6,454 | | | 4,465 | | 2,196 | |
Restricted stock and stock option amortization | | 4,111 | | 3,149 | | | 1,764 | | 1,143 | |
Gain on disposition of asset | | | (2,373 | ) | — | |
Warrant liability loss | | 148,706 | | 162,724 | | | 96,440 | | 33,027 | |
Reduction in tax indemnity receivable | | 8,673 | | 11,655 | | | — | | 1,904 | |
Equity in earnings (loss) from Real Estate Affiliates, net of distributions | | (5,408 | ) | 14 | | |
Equity in earnings from Real Estate and Other Affiliates, net of distributions | | | (3,743 | ) | 70 | |
Provision for doubtful accounts | | 910 | | 285 | | | 143 | | 429 | |
Master Planned Community land acquisitions | | (5,667 | ) | — | | |
Master Planned Community development expenditures | | (95,061 | ) | (72,741 | ) | | (28,434 | ) | (33,329 | ) |
Master Planned Community cost of sales | | 73,201 | | 60,407 | | | 20,815 | | 22,553 | |
Condominium development expenditures | | (10,891 | ) | — | | | (5,604 | ) | — | |
Condominium and other cost of sales | | 15,678 | | — | | | 1,571 | | — | |
Deferred revenue from sale of condominium rights | | 16,309 | | — | | |
Percentage of completion revenue recognition from sale of condominium rights | | | (3,126 | ) | — | |
Net changes: | | | | | | | | | | |
Accounts and notes receivable | | (3,705 | ) | 13,284 | | | 19,780 | | (3,472 | ) |
Prepaid expenses and other assets | | 12,143 | | 1,168 | | | (38,786 | ) | 463 | |
Deferred expenses | | (7,156 | ) | (2,377 | ) | | (3,093 | ) | 2,397 | |
Accounts payable and accrued expenses | | 5,773 | | (15,341 | ) | | 38,147 | | 4,940 | |
Other, net | | 1,217 | | 279 | | | 3,378 | | 570 | |
Cash provided by operating activities | | 108,766 | | 59,260 | | | 26,225 | | 16,639 | |
| | | | | | | | | | |
Cash Flows from Investing Activities: | | | | | | | | | | |
Property and equipment expenditures | | (26,527 | ) | (2,356 | ) | | (2,053 | ) | (1,563 | ) |
Operating property improvements | | (22,623 | ) | (7,878 | ) | | (877 | ) | (2,313 | ) |
Operating property redevelopments | | (126,819 | ) | (26,581 | ) | | (137,579 | ) | (40,064 | ) |
Consideration paid to acquire Millennium Waterway Apartments, net of cash acquired | | — | | (2,721 | ) | |
Distribution from Millennium Waterway Apartments | | — | | 6,876 | | |
Proceeds from sales of investments in Real Estate Affiliate | | — | | 8,579 | | |
Proceeds from sales of operating assets | | 10,831 | | — | | |
Investment in Summerlin Las Vegas Baseball Club, LLC | | (10,350 | ) | — | | |
Investment in KR Holdings, LLC | | (16,750 | ) | — | | |
Investments in other Real Estate Affiliates, net | | (1,031 | ) | (496 | ) | |
Investments in Real Estate and Other Affiliates, net | | | (807 | ) | (1,537 | ) |
Proceeds from dispositions | | | 5,500 | | — | |
Change in restricted cash | | (18,268 | ) | 4,251 | | | (4,943 | ) | (11,121 | ) |
Cash used in investing activities | | (211,537 | ) | (20,326 | ) | | (140,759 | ) | (56,598 | ) |
| | | | | | | | | | |
Cash Flows from Financing Activities: | | | | | | | | | | |
Proceeds from issuance of mortgages, notes and loans payable | | 360,788 | | 44,828 | | | 48,811 | | 68,313 | |
Principal payments on mortgages, notes and loans payable | | (271,871 | ) | (37,193 | ) | | (2,138 | ) | (57,003 | ) |
Deferred financing costs | | (2,437 | ) | (1,281 | ) | |
Preferred dividend payment on behalf of REIT subsidiary | | (12 | ) | — | | | — | | (12 | ) |
Distributions to noncontrolling interests | | (2,134 | ) | — | | |
Cash provided provided by financing activities | | 84,334 | | 6,354 | | | 46,673 | | 11,298 | |
| | | | | | | | | | |
Net change in cash and cash equivalents | | (18,437 | ) | 45,288 | | | (67,861 | ) | (28,661 | ) |
Cash and cash equivalents at beginning of period | | 229,197 | | 227,566 | | | 894,948 | | 229,197 | |
Cash and cash equivalents at end of period | | $ | 210,760 | | $ | 272,854 | | | $ | 827,087 | | $ | 200,536 | |
7
Table of Contents
THE HOWARD HUGHES CORPORATION
CONDENSED CONSOLIDATED STATEMENTS OF CASH FLOWS
UNAUDITED
| | Nine Months Ended September 30, | |
| | 2013 | | 2012 | |
| | (In thousands) | |
Supplemental Disclosure of Cash Flow Information: | | | | | |
Interest paid | | $ | 23,228 | | $ | 16,398 | |
Interest capitalized | | 26,537 | | 19,737 | |
Income taxes paid | | 2,127 | | 966 | |
| | | | | |
Non-Cash Transactions: | | | | | |
Acquisition of Millennium Waterway Apartments | | | | | |
Land | | — | | (15,917 | ) |
Building and equipment | | — | | (56,002 | ) |
Other assets | | — | | (2,669 | ) |
Mortgages, notes and loans payable | | — | | 55,584 | |
Other liabilities | | — | | 754 | |
Reduction in investments in real estate affiliates due to the Millennium Waterway Apartments’ acquisition | | — | | 22,405 | |
Acquisition of 70 CCC | | | | | |
Land | | — | | (1,281 | ) |
Building and equipment | | — | | (13,089 | ) |
Other assets | | — | | (2,957 | ) |
Mortgages, notes and loans payable | | — | | 16,037 | |
Other liabilities | | — | | 1,290 | |
Special Improvement District bond transfers associated with land sales | | 11,549 | | 2,689 | |
Real estate and property expenditures | | 56,763 | | 11,984 | |
MPC Land contributed to real estate affiliate | | — | | (2,190 | ) |
Purchase of land from GGP | | — | | (1,315 | ) |
Non-cash increase in property due to consolidation of real estate affiliate | | 3,750 | | — | |
Transfer of condominium buyer deposits to real estate affiliate | | 34,220 | | — | |
| | | | | | | |
| | Three Months Ended March 31, | |
| | 2014 | | 2013 | |
| | (In thousands) | |
Supplemental Disclosure of Cash Flow Information: | | | | | |
Interest paid | | $ | 7,051 | | $ | 7,348 | |
Interest capitalized | | 11,281 | | 9,869 | |
Income taxes paid | | — | | 885 | |
| | | | | |
Non-Cash Transactions: | | | | | |
Special Improvement District bond transfers associated with land sales | | 2,259 | | 3,146 | |
Real estate and property expenditures | | 25,550 | | 17,136 | |
| | | | | | | |
See Notes to Condensed Consolidated Financial Statements.
8
Table of Contents
THE HOWARD HUGHES CORPORATION
NOTES TO CONDENSED CONSOLIDATED FINANCIAL STATEMENTS
UNAUDITED
NOTE 1BASIS OF PRESENTATION AND ORGANIZATION
The accompanying unaudited condensed consolidated financial statements have been prepared in accordance with accounting principles generally accepted in the United States of America (“GAAP”) for interim financial statements and in accordance with the instructions to Form 10-Q and Article 10 of Regulation S-X as issued by the Securities and Exchange Commission (the “SEC”). Such condensed consolidated financial statements do not include all of the information and disclosures required by GAAP for complete financial statements. In addition, readers of this Quarterly Report on Form 10-Q (“Quarterly Report”) should refer to The Howard Hughes Corporation’s (“HHC” or the “Company”) audited Consolidated and Combined Financial Statements for the year ended December 31, 20122013 which are included in the Company’s Annual Report on Form 10-K (the “Annual Report”) for the fiscal year ended December 31, 2012.2013. In the opinion of management, all adjustments (consisting of normal recurring adjustments) necessary for a fair presentation of the financial position, results of operations and cash flows for the interim periods have been included. The results for the three and nine months ended September 30, 2013March 31, 2014 are not necessarily indicative of the results for the full fiscal year.
Management has evaluated all material events occurring subsequent to the date of the condensed consolidated financial statements up to the date and time this Quarterly Report was filed.
Use of Estimates
On August 22, 2013, in conjunction with the Hawaii Community Development Authority’s (“HCDA”) unanimous approval for two mixed-use towers at Ward Village, we reevaluated the useful life of the existing buildings and improvements located on the sites where this future development will take place. As a result, the estimated remaining useful lives of the assets were reduced which increased depreciation expense $1.2 million during the three months ended September 30, 2013.
Investment in Real Estate - Developments
Demolition costs associated with our redevelopments are expensed as incurred. During the three months ended September 30, 2013, we incurred $1.4 million in demolition costs related to the interiors of our Outlet Collection at Riverwalk and Columbia Regional buildings.
NOTE 2SPONSORS AND MANAGEMENT WARRANTS
On November 9, 2010 (the “Effective Date”), we issued warrants to purchase 8.0 million shares of our common stock to certain of our sponsors (the “Sponsors Warrants”) with an estimated initial value of approximately $69.5 million.which 1.9 million remain outstanding. The initial exercise price for the warrants of $50.00 per share and the number of shares of common stock underlying each warrant are subject to adjustment for future stock dividends, splits or reverse splits of our common stock or certain other events. On December 7, 2012, the affiliates of Blackstone Real Estate Partners and the Fairholme Fund and the Fairholme Focused Income Fund, each sold their portion of the Sponsors Warrants totaling 333,333 and 1,916,667, respectively, to HHC for $30.00 cash per warrant. These transactions were accounted for as the settlement of a liability for cash consideration of $67.5 million. On November 9, 2012, affiliates of Brookfield Asset Management, Inc. (“Brookfield”), one of our sponsors, exercised their warrants to purchase 1,525,272 shares of our common stock at an exercise price of $50.00 per warrant, or $76.3 million. In addition, Brookfield sold their remaining warrants to purchase 2,308,061 shares of our common stock to HHC for $89.3 million. The cash consideration paid to Brookfield net of the exercise price was $13.0 million. As a result of these transactions, $108.6 million of additional paid-in capital was recorded in our financial statements in the year ended December 31, 2012. The Sponsors Warrants expire on November 9, 2017.
9
Table of Contents
THE HOWARD HUGHES CORPORATION
NOTES TO CONDENSED CONSOLIDATED FINANCIAL STATEMENTS
UNAUDITED
In November 2010 and February 2011, we entered into certain agreements (the “Management Warrants”) with David R. Weinreb, our Chief Executive Officer, Grant Herlitz, our President, and Andrew C. Richardson, our Chief Financial Officer, in each case prior to his appointment to such position, to purchase shares of our common stock. The Management Warrants representing 2,862,687 underlying shares, which may be adjusted pursuant to a net settlement option, were issued pursuant to such agreements at fair value in exchange for a combined total of approximately $19.0 million in cash from such executives at the commencement of their respective employment. Mr. Weinreb and Mr. Herlitz’s warrants have exercise prices of $42.23 per share and Mr. Richardson’s warrant has an exercise price of $54.50 per share. Generally, the Management Warrants become exercisable in November 2016 and expire inby February 2018.
The estimated $126.6$182.2 million fair value for the Sponsors Warrants representing warrants to purchase 1,916,667 shares and estimated $145.7$219.8 million fair value for the Management Warrants representing warrants to purchase 2,862,687 shares outstanding as of September 30, 2013,March 31, 2014, have been recorded as liabilities because the holders of these warrants could require us to settle such warrants in cash upon a change of control. The estimated fair values for the outstanding Sponsors Warrants and Management Warrants were $58.5$141.8 million and $65.1$163.8 million, respectively, as of December 31, 2012.2013. The fair values were estimated using an option pricing model and Level 3 inputs due to the unavailability of comparable market data, as further discussed in Note 6 — Fair Value of Financial Instruments. Decreases and increases in the fair value of the Sponsors Warrants and the Management Warrants are recognized as either warrant liability gains or losses, respectively, in the Condensed Consolidated Statements of Operations.
NOTE 3EARNINGS PER SHARE
Basic earnings (loss) per share (“EPS”) is computed by dividing net income (loss) attributable to common stockholders by the weighted-average number of common shares outstanding. Diluted EPS is computed after adjusting the numerator and denominator of the basic EPS computation for the effects of all potentially dilutive common shares. The dilutive effect of options and nonvested stock issued under stock-based compensation plans is computed using the treasury stock method. The dilutive effect of the Sponsors Warrants and Management Warrants is computed using the if-converted method. Gains associated with the Sponsors Warrants and Management Warrants are excluded from the numerator in computing diluted earnings per share because inclusion of such gains in the computation would be anti-dilutive.
109
Table of Contents
THE HOWARD HUGHES CORPORATION
NOTES TO CONDENSED CONSOLIDATED FINANCIAL STATEMENTS
UNAUDITED
Information related to our EPS calculations is summarized as follows:
| | Three Months Ended September 30, | | Nine Months Ended September 30, | | | Three Months Ended March 31, | |
| | 2013 | | 2012 | | 2013 | | 2012 | | | 2014 | | 2013 | |
| | (In thousands, except per share amounts) | | | (In thousands, except per share amounts) | |
Basic EPS: | | | | | | | | | | | | | | |
Numerator: | | | | | | | | | | | | | | |
Net income (loss) | | $ | 7,433 | | $ | (50,192 | ) | $ | (92,233 | ) | $ | (126,724 | ) | |
Net (income) loss attributable to noncontrolling interests | | (98 | ) | 781 | | (110 | ) | (637 | ) | |
Net income (loss) attributable to common stockholders | | $ | 7,335 | | $ | (49,411 | ) | $ | (92,343 | ) | $ | (127,361 | ) | |
Net loss | | | $ | (86,331 | ) | $ | (23,170 | ) |
Net loss attributable to noncontrolling interests | | | 15 | | 46 | |
Net loss attributable to common stockholders | | | $ | (86,316 | ) | $ | (23,124 | ) |
| | | | | | | | | | | | | | |
Denominator: | | | | | | | | | | | | | | |
Weighted average basic common shares outstanding | | 39,454 | | 37,916 | | 39,447 | | 37,909 | | | 39,454 | | 39,441 | |
| | | | | | | | | | | | | | |
Diluted EPS: | | | | | | | | | | | | | | |
Numerator: | | | | | | | | | | | | | | |
Net income (loss) attributable to common stockholders | | $ | 7,335 | | $ | (49,411 | ) | $ | (92,343 | ) | $ | (127,361 | ) | |
Net loss attributable to common stockholders | | | $ | (86,316 | ) | $ | (23,124 | ) |
Less: Warrant liability gain | | — | | — | | — | | — | | | — | | — | |
| | | | | | |
Adjusted net income (loss) attributable to common stockholders | | $ | 7,335 | | $ | (49,411 | ) | $ | (92,343 | ) | $ | (127,361 | ) | | $ | (86,316 | ) | $ | (23,124 | ) |
| | | | | | | | | | |
| | | | | | | | | | |
Denominator: | | | | | | | | | | | | | | |
Weighted average basic common shares outstanding | | 39,454 | | 37,916 | | 39,447 | | 37,909 | | | 39,454 | | 39,441 | |
Restricted stock and stock options | | 253 | | — | | — | | — | | | — | | — | |
Warrants | | 2,732 | | — | | — | | — | | | — | | — | |
Weighted average diluted common shares oustanding | | 42,439 | | 37,916 | | 39,447 | | 37,909 | | |
Weighted average diluted common shares outstanding | | | 39,454 | | 39,441 | |
| | | | | | | | | | | | | | |
Basic earnings (loss) per share: | | $ | 0.19 | | $ | (1.30 | ) | $ | (2.34 | ) | $ | (3.36 | ) | | $ | (2.19 | ) | $ | (0.59 | ) |
| | | | | | | | | | | | | | |
Diluted earnings (loss) per share: | | $ | 0.17 | | $ | (1.30 | ) | $ | (2.34 | ) | $ | (3.36 | ) | | $ | (2.19 | ) | $ | (0.59 | ) |
The diluted EPS computation for the ninethree months ended September 30, 2013March 31, 2014 excludes 930,9401,024,940 stock options, 122,332176,536 shares of restricted stock, 1,916,667 shares of common stock underlying the Sponsors Warrants and 2,862,687 shares of common stock underlying the Management Warrants because their inclusion would have been anti-dilutive.
The diluted EPS computations for the three and nine months ended September 30, 2012 exclude 843,962March 31, 2013 excludes 890,040 stock options, 57,933 shares of restricted stock, 8,000,0001,916,667 shares of common stock underlying the Sponsor Warrants and 2,862,687 shares of common stock underlying the Management Warrants because their inclusion would have been anti-dilutive.
10
Table of Contents
THE HOWARD HUGHES CORPORATION
NOTES TO CONDENSED CONSOLIDATED FINANCIAL STATEMENTS
UNAUDITED
NOTE 4 RECENT TRANSACTIONS
On September 30, 2013,February 28, 2014, we sold our Rio West MallRedlands Promenade property, a 514,253 square foot shopping center on 50consisting of approximately 10 acres of land located in Gallup, New MexicoRedlands, California, for $12.0$5.5 million. The sale includes our ground lease interest, all buildings, structures and improvements, machinery, equipment and furnishings, and all leases and security deposits. Our pre-tax gain recognized on the sale was $0.6$2.4 million.
In 2012, we formed a 50/50 joint venture, KR Holdings, LLC (“KR Holdings”), with an entity jointly owned by two local development partners to develop a 23-story luxury condominium tower, ONE Ala Moana Tower Condominium Project. On September 17, 2012, KR Holdings closed on two $20.0 million non-recourse mezzanine financing commitments with List Island Properties, LLC and A & B Properties, Inc., including funding for $3.0 million of pre-development costs.
On May 15, 2013, KR Holdings closed on a first mortgage construction loan. Upon closing and under the terms of our joint venture agreement, we sold to KR Holdings our interest in the condominium rights for $47.5 million and
11
Table of Contents
THE HOWARD HUGHES CORPORATION
NOTES TO CONDENSED CONSOLIDATED FINANCIAL STATEMENTS
UNAUDITED
received net cash proceeds of $30.8 million and a 50% equity interest in KR Holdings. Our partner contributed $16.8 million of cash for a 50% equity interest. Due to our continuing involvement in KR Holdings, we accounted for the transaction as a partial sale representing 50% of the $47.5 million sales value of the condominium rights, and accordingly, we recognized net profit of $11.8 million. The remaining $23.7 million sales value of the condominium rights will be recognized on the same percentage of completion basis as KR Holdings. As of September 30, 2013 the project was 31.3% complete, and we recognized an additional $0.4 million and $3.7 million of profit on the sale for the three and nine months ended September 30, 2013. Please refer to Note 7 — Real Estate Affiliates for further discussion of the ONE Ala Moana Tower Condominium Project.
NOTE 5 IMPAIRMENT
We review our real estate assets, including operating assets, land held for development and sale and developments in progress, for potential impairment indicators whenever events or changes in circumstances indicate that the carrying amount may not be recoverable. GAAP requires that if impairment indicators exist and the undiscounted cash flows expected to be generated by an asset are less than its carrying amount, an impairment charge should be recorded to write down the carrying amount of such asset to fair value (or for land held for sale, fair value less cost to sell). The impairment analysis does not consider the timing of future cash flows and whether the asset is expected to earn an above or below market rate of return.
Our investment in each of the Real Estate and Other Affiliates is evaluated periodically and as deemed necessary for recoverability and valuation declines that are other-than-temporary. If the decrease in value of our investment in a Real Estate and Other Affiliate is deemed to be other-than-temporary, our investment in such Real Estate and Other Affiliate is reduced to its estimated fair value.
No impairment charges were recorded during the three or nine months ended September 30, 2013March 31, 2014 or 2012.2013. We continually evaluate our strategic alternatives with respect to each of our properties and may revise our strategy from time to time, including our intent to hold the asset on a long-term basis or the timing of potential asset dispositions. For example, we may decide to sell property that is held for use and the sale price may be less than the carrying amount. As a result, these changes in strategy could result in impairment charges in future periods.
NOTE 6 FAIR VALUE OF FINANCIAL INSTRUMENTS
The following table presents, for each of the fair value hierarchy levels required under Accounting Standards Codification (“ASC”) 820, “Fair(“ASC 820”) Fair Value Measurement” our assets and liabilities that are measured at fair value on a recurring basis.
| | September 30, 2013 | | December 31, 2012 | | | March 31, 2014 | | December 31, 2013 | |
| | Fair Value Measurements Using | | Fair Value Measurements Using | | | Fair Value Measurements Using | | Fair Value Measurements Using | |
| | Total | | Quoted Prices in
Active Markets for
Identical Assets
(Level 1) | | Significant
Other
Observable
Inputs
(Level 2) | | Significant
Unobservable
Inputs
(Level 3) | | Total | | Quoted Prices in
Active Markets
for Identical
Assets (Level 1) | | Significant
Other
Observable
Inputs
(Level 2) | | Significant
Unobservable
Inputs
(Level 3) | | | Total | | Quoted Prices
in Active
Markets for
Identical Assets
(Level 1) | | Significant
Other
Observable
Inputs
(Level 2) | | Significant
Unobservable
Inputs
(Level 3) | | Total | | Quoted Prices
in Active
Markets for
Identical Assets
(Level 1) | | Significant
Other
Observable
Inputs
(Level 2) | | Significant
Unobservable
Inputs
(Level 3) | |
| | (In thousands) | | (In thousands) | | | (In thousands) | | | | (In thousands) | |
Liabilities | | | | | | | | | | | | | | | | | | |
Assets: | | | | | | | | | | | | | | | | | | |
Cash equivalents | | | $ | 200,004 | | $ | 200,004 | | $ | — | | $ | — | | $ | — | | $ | — | | $ | — | | $ | — | |
Liabilities: | | | | | | | | | | | | | | | | | | |
Warrants | | $ | 272,279 | | $ | — | | $ | — | | $ | 272,279 | | $ | 123,573 | | $ | — | | $ | — | | $ | 123,573 | | | 402,000 | | — | | — | | 402,000 | | 305,560 | | — | | — | | 305,560 | |
Interest rate swaps | | 4,696 | | — | | 4,696 | | — | | 7,183 | | — | | 7,183 | | — | | | 3,956 | | — | | 3,956 | | — | | 4,164 | | — | | 4,164 | | — | |
|
Cash equivalents consist primarily of two registered money market mutual funds which invests in United States treasury securities that are valued at the net asset value of the underlying shares in the funds as of the close of business at the end of each period. The fair value approximates carrying value.
The valuation of warrants is based on an option pricing valuation model. The inputs to the model include the fair value of the stock related to the warrants, exercise price of the warrants, term, expected volatility, risk-free interest rate and dividend yield.
12
Table of Contents
THE HOWARD HUGHES CORPORATION
NOTES TO CONDENSED CONSOLIDATED FINANCIAL STATEMENTS
UNAUDITED
The fair values of interest rate swaps are determined using the market standard methodology of netting the discounted future fixed cash payments and the discounted expected variable cash receipts. The variable cash receipts are based on an expectation of future interest rates derived from observable market interest rate curves.
11
Table of Contents
THE HOWARD HUGHES CORPORATION
NOTES TO CONDENSED CONSOLIDATED FINANCIAL STATEMENTS
UNAUDITED
The following table presents a reconciliation of the beginning and ending balances of the fair value measurements using significant unobservable inputs (Level 3) which are our Sponsors and Management Warrants:
| | 2013 | | 2012 | | | 2014 | | 2013 | |
| | (In thousands) | | | (In thousands) | |
Balance as of January 1, | | $ | 123,573 | | $ | 127,764 | | | $ | 305,560 | | $ | 123,573 | |
Warrant liability loss | | 148,706 | | 162,724 | | | 96,440 | | 33,027 | |
Balance as of September 30, | | $ | 272,279 | | $ | 290,488 | | |
Balance as of March 31, | | | $ | 402,000 | | $ | 156,600 | |
The fair values were estimated using an option pricing model and Level 3 inputs due to the unavailability of comparable market data. Changes in the fair value of the Sponsors Warrants and the Management Warrants are recognized in earnings as a warrant liability gain or loss.
The significant unobservable input used in the fair value measurement of our warrants designated as Level 3 as of September 30, 2013March 31, 2014 is as follows:
| | Fair Value | | Valuation
Technique | | Unobservable
Input | | Volatility | |
| | (In thousands) | | | | | | | |
Warrants | | $ | 272,279 | | Option Pricing Valuation Model | | Expected Volatility (a) | | 30.0 | % |
| | | | | | | | | | |
| | Fair Value | | Valuation
Technique | | Unobservable
Input | | Volatility | |
| | (In thousands) | | | | | | | |
Warrants | | $ | 402,000 | | Option Pricing Valuation Model | | Expected Volatility (a) | | 28.3 | % |
| | | | | | | | | | |
(a) Based on the assetequity volatility of comparable companies.
The expected volatility in the table above is a significant unobservable input used to estimate the fair value of our warrant liabilities. An increase in expected volatility would increase the fair value of the liability, while a decrease in expected volatility would decrease the fair value of the liability.
1312
Table of Contents
THE HOWARD HUGHES CORPORATION
NOTES TO CONDENSED CONSOLIDATED FINANCIAL STATEMENTS
UNAUDITED
The estimated fair values of our financial instruments that are not measured at fair value on a recurring basis are as follows:
| | September 30, 2013 | | December 31, 2012 | | | March 31, 2014 | | December 31, 2013 | |
| | Carrying
Amount | | Estimated
Fair Value | | Carrying
Amount | | Estimated
Fair Value | | | Carrying
Amount | | Estimated
Fair Value | | Carrying
Amount | | Estimated
Fair Value | |
| | (In thousands) | | | (In thousands) | |
Assets: | | | | | | | | | | | | | | | | | | | | | | |
Cash and cash equivalents (a) | | | $ | 627,083 | | $ | 627,083 | | $ | 894,948 | | $ | 894,948 | |
Notes receivable, net | | $ | 19,122 | | $ | 19,122 | | $ | 27,953 | | $ | 27,953 | | | 19,051 | | 19,051 | | 20,554 | | 20,554 | |
Tax indemnity receivable, including interest | | 316,504 | | | (a) | 319,622 | | | (a) | | 322,350 | | | (b) | 320,494 | | | (b) |
| | | | | | | | | | | | | | | | | | |
Liabilities: | | | | | | | | | | | | | | | | | | |
Fixed-rate debt | | $ | 231,036 | | $ | 224,488 | | $ | 158,636 | | $ | 158,879 | | | $ | 971,559 | | $ | 1,011,965 | | $ | 971,786 | | $ | 1,012,461 | |
Variable-rate debt (b) | | 498,150 | | 498,151 | | 479,964 | | 479,964 | | |
Variable-rate debt (c) | | | 556,981 | | 556,981 | | 509,737 | | 509,737 | |
SID bonds | | 36,794 | | 38,669 | | 49,712 | | 56,475 | | | 30,841 | | 30,616 | | 33,100 | | 32,837 | |
Total mortgages, notes and loans payable | | $ | 765,980 | | $ | 761,308 | | $ | 688,312 | | $ | 695,318 | | | $ | 1,559,381 | | $ | 1,599,562 | | $ | 1,514,623 | | $ | 1,555,035 | |
(a) Consists of bank deposits with original maturities of 90 days or less.
(b) It is not practicable to estimate the fair value of the tax indemnity receivable, including interest, as the timing and ultimate amount received under the agreement is highly dependent on numerous future events that cannot be reliably predicted.
(b)(c) $172.0 million of variable-rate debt has been swapped to a fixed rate for the term of the related debt.
Notes receivable are carried at net realizable value, which approximates fair value. The estimated fair values of these notes receivable are categorized as Level 3 due to certain factors, such as current interest rates, terms of the note and credit worthiness of the borrower.
The fair value of debt in the table above, not including our Senior Notes, was estimated based on a discounted future cash payment model using Level 2 inputs, which includes risk premiums for loans of comparable quality and a risk free rate derived from the current London Interbank Offered Rate (“LIBOR”) or U.S. Treasury obligation interest rates. The discount rates reflect our judgment as to what the approximate current lending rates for loans or groups of loans with similar maturities and credit quality would be if credit markets were operating efficiently and assuming that the debt is outstanding through maturity.
The fair value of our Senior Notes included in Fixed-rate debt in the table above was estimated based on quoted market prices for similar issues.
The carrying amounts of cash and cash equivalents and accounts receivable approximate fair value because of the short-term maturity of these instruments.
NOTE 7 REAL ESTATE AND OTHER AFFILIATES
In the ordinary course of business, we enter into partnerships or joint ventures primarily for the development and operations of real estate assets which are referred to as “Real Estate Affiliates”. These partnerships or joint ventures are typically characterized by a non-controlling ownership interest with decision making and distribution of expected gains and losses being proportionate to the ownership interest. We account for these partnerships and joint ventures in accordance with ASC 810 (“ASC 810”) Consolidations.
13
Table of Contents
THE HOWARD HUGHES CORPORATION
NOTES TO CONDENSED CONSOLIDATED FINANCIAL STATEMENTS
UNAUDITED
In accordance with ASC 810, we assess our joint ventures at inception to determine if any meet the qualifications of a variable interest entity (“VIE”). We consider a partnership or joint venture a VIE if: (a) the total equity investment is not sufficient to permit the entity to finance its activities without additional subordinated financial support; (b) characteristics of a controlling financial interest are missing (either the ability to make decisions through voting or other rights, the obligation to absorb the expected losses of the entity or the right to receive the expected residual returns of the entity); or (c) the voting rights of the equity holders are not proportional to their obligations to absorb the expected losses of the entity and/or their rights to receive the expected residual returns of the entity, and
14
Table of Contents
THE HOWARD HUGHES CORPORATION
NOTES TO CONDENSED CONSOLIDATED FINANCIAL STATEMENTS
UNAUDITED
substantially all of the entity’s activities either involve or are conducted on behalf of an investor that has disproportionately few voting rights. Upon the occurrence of certain events outlined in ASC 810, we reassess our initial determination of whether the partnership or joint venture is a VIE.
We also perform a qualitative assessment of each VIE on an ongoing basis to determine if we are the primary beneficiary, as required by ASC 810. Under ASC 810, a company concludes that it is the primary beneficiary and consolidates the VIE if the company has both (a) the power to direct the economically significant activities of the entity and (b) the obligation to absorb losses of, or the right to receive benefits from, the entity that could potentially be significant to the VIE. The company considers the contractual agreements that define the ownership structure, distribution of profits and losses, risks, responsibilities, indebtedness, voting rights and board representation of the respective parties in determining if the company is the primary beneficiary. As required by ASC 810, management’s assessment of whether the company is the primary beneficiary of a VIE is continuously performed.
We account for investments in joint ventures deemed to be VIEs for which we are not considered to be the primary beneficiary but have significant influence using the equity method, and investments in joint ventures where we do not have significant influence onover the joint venture’s operations and financial policies, on the cost method. Generally, the operating agreements with respect to our Real Estate Affiliates provide that assets, liabilities and funding obligations are shared in accordance with our ownership percentages.
In certain cases,14
Table of Contents
THE HOWARD HUGHES CORPORATION
NOTES TO CONDENSED CONSOLIDATED FINANCIAL STATEMENTS
UNAUDITED
Our investment in real estate and other affiliates which are reported on the companyequity and cost methods are as follows:
| | Economic/ Legal Ownership | | Carrying Value | | Share of Earnings/Dividends | |
| | March 31, | | December 31, | | March 31, | | December 31, | | Three Months Ended March 31, | |
| | 2014 | | 2013 | | 2014 | | 2013 | | 2014 | | 2013 | |
| | (In percentages) | | (In thousands) | | (In thousands) | |
Equity Method Investments: | | | | | | | | | | | | | |
Circle T Ranch and Power Center | | 50.00 | % | 50.00 | % | $ | 9,004 | | $ | 9,004 | | $ | — | | $ | — | |
HHMK Development, LLC (a) | | 50.00 | % | 50.00 | % | 13 | | 13 | | 290 | | — | |
KR Holdings, LLC (a) | | 50.00 | % | 50.00 | % | 25,478 | | 19,764 | | 4,009 | | — | |
Millennium Woodlands Phase II, LLC (a) | | 81.43 | % | 81.43 | % | 2,171 | | 2,174 | | (36 | ) | — | |
Parcel C (a) | | 50.00 | % | 50.00 | % | 6,531 | | 5,801 | | — | | — | |
Stewart Title | | 50.00 | % | 50.00 | % | 3,736 | | 3,843 | | 93 | | 191 | |
Summerlin Apartments, LLC (a) | | 50.00 | % | — | | — | | — | | — | | — | |
Summerlin Las Vegas Baseball Club, LLC (a) | | 50.00 | % | 50.00 | % | 10,510 | | 10,636 | | (126 | ) | — | |
The Metropolitan Downtown Columbia Project (b) | | 50.00 | % | 50.00 | % | 3,505 | | 3,461 | | — | | — | |
Woodlands Sarofim #1 | | 20.00 | % | 20.00 | % | 2,582 | | 2,579 | | 57 | | 39 | |
| | | | | | 63,530 | | 57,275 | | 4,287 | | 230 | |
Cost basis investments | | | | | | 3,793 | | 3,746 | | 1,781 | (c) | 2,503 | (c) |
Investment in Real Estate and Other Affiliates | | | | | | $ | 67,323 | | $ | 61,021 | | $ | 6,068 | | $ | 2,733 | |
(a) | Equity method variable interest entities. |
(b) | This entity was previously considered a VIE, whose reassessment in 2013 caused it to no longer be considered a VIE. Please refer to the discussion in the section following the table. |
(c) | Includes distribution received from Summerlin Hospital Medical Center. |
We are not the primary beneficiary of any of the VIEs listed above because we do not have the power to direct activities that most significantly impact the economic performance of such joint ventures and therefore we report our interests on the equity method. Our maximum exposure to loss as a result of these investments is requiredlimited to consolidate certainthe aggregate carrying value of the investment as we have not provided any guarantees or otherwise made firm commitments to fund amounts on behalf of these VIEs. The aggregate carrying value of the unconsolidated VIEs was $44.7 million and $38.4 million as of March 31, 2014 and December 31, 2013, respectively. As of September 30,March 31, 2014, approximately $81.5 million of indebtedness was secured by the properties owned by our Real Estate Affiliates of which our share was approximately $46.9 million based upon our economic ownership. All of this debt is without recourse to us.
At March 31, 2014, the Company was the primary beneficiary of one VIE which we therefore consolidated. The creditors of the consolidated VIE do not have recourse to the Company’s general credit. As of both March 31, 2014 and December 31, 2013 the carrying values of the assets and liabilities associated with the operations of the consolidated VIEsVIE were $41.2$20.6 million and $3.3$0.1 million, respectively. As of December 31, 2012,2013, the carrying values of the assets and liabilities associated with the operations of the consolidated VIEsVIE were $28.3$20.6 million and $1.0$0.1 million, respectively. The assets of the VIEs are restricted for use only by the particular VIEs and are not available for our general operations.
Our recent and more significant VIEsinvestments in Real Estate Affiliates and the related accounting considerations are discusseddescribed below.
ONE Ala Moana Condominium Project
On October 11, 2011, we and an entity jointly owned by two local development partners formed a joint venture called HHMK Development, LLC (“HHMK Development”) to explore the development of a luxury condominium tower at the Ala Moana Center in Honolulu, Hawaii. On June 14, 2012, we formed another 50/50 joint venture, KR Holdings, with the same partner. We own 50% of each venture and our partnerpartners jointly ownsown the remaining 50%.
On September 17, 2012, KR Holdings closed on two $20.0 million non-recourse mezzanine loan commitments with List Island Properties, LLC and A & B Properties, Inc. These loans have a blended interest rate of 12%, were drawn in full on May 15, 2013 and mature on April 30, 2018 with the option to extend for one year. In addition to the mezzanine loans, A & B Properties and List Island Properties both have profit interests in KR Holdings, which entitles them to receive a share of the profits, up to a maximum of $3.0 million, after a return of our capital andplus a 13% preferred return on our capital. A & B Properties’ participation is capped at $3.0 million.
15
Table of Contents
THE HOWARD HUGHES CORPORATION
NOTES TO CONDENSED CONSOLIDATED FINANCIAL STATEMENTS
UNAUDITED
KR Holdings closed the first mortgage construction loan on May 15, 2013. Upon closing and under the terms of the venture agreement, we sold to KR Holdings our interest in the condominium rights for net cash proceeds of $30.8 million and a 50% equity interest in KR Holdings. Our partner contributed $16.8 million of cash for their 50% equity interest.
The construction loan will be drawn over the course of construction with the total proceeds not to exceed $132.0 million. The loan is secured by the condominium rights and buyers’ deposits, has no recourse to us, matures on May 15, 2016, and bears interest at one-month LIBOR plus 3.00%. Revenue recognition for individual units in a condominium project requires, among other criteria, that the sales contracts be analyzed to ascertain that the buyer’s initial and continuing investments are adequate. KR Holdings determined that the value of the buyers’ deposits qualified as sufficient investment to recognize revenue using the percentage of completion method. We recorded
15
Table of Contents
THE HOWARD HUGHES CORPORATION
NOTES TO CONDENSED CONSOLIDATED FINANCIAL STATEMENTS
UNAUDITED
$2.7 million and $7.9 million in equity in earnings from Real Estate Affiliates related to KR Holdings in the Condensed Consolidated Statement of Operations for the three and nine months ended September 30, 2013, respectively.
Millennium Woodlands Phase II, LLC
On May 14, 2012, we entered into a joint venture, Millennium Woodlands Phase II, LLC (“Millennium Phase II”), with The Dinerstein Companies, the same joint venture partner related toin the Millennium Waterway Apartments I project, for the construction of a new 314-unit Class A multi-family complex in The Woodlands Town Center. Our partner is the managing member of Millennium Phase II. As the managing member, our partner controls, directs, manages and administers the affairs of Millennium Phase II. On July 5, 2012, Millennium Phase II was capitalized by our contribution of 4.8 acres of land valued at $15.5 million to the joint venture, our partner’s contribution of $3.0 million in cash and a construction loan in the amount of $37.7 million which is guaranteed by our partner. The development of Millennium Phase II further expands our multi-family portfolio in The Woodlands Town Center.
Columbia Parcel D Joint Venture (The Metropolitan)C
On October 27, 2011,4, 2013, we entered into a joint venture Parcel D Development, LLC,agreement with a local developer, Kettler, Inc. (“Kettler”), to construct a 437-unit, Class A apartment building with 31,000 square feet of ground floor retail spaceon Parcel C in downtown Columbia, Maryland. We contributed approximately five acres of land having an approximate book value of $4.0 million to the joint venture. Our land was valued at $23.4 million or $53,500 per constructed unit. When the venture closes on the construction loan and upon completion of certain other conditions, including obtaining completed site development and construction plans and an approved project budget, our partner will be required to contribute cash to the venture.
Summerlin Apartments, LLC
On January 24, 2014, we entered into a joint venture with a national multi-family real estate developer, The Calida Group (“Calida”), to construct, own and operate a 124-unit gated luxury apartment development. We and our partner each own 50% of the venture, and unanimous consent of the partners is required for all major decisions. On July 11, 2013,This project represents the joint venture closedfirst residential development in Summerlin’s 400-acre downtown and is located within walking distance to The Shops at Summerlin. We will contribute a $64.1 million construction loan which is non-recourse to us. The loan bears interest at one-month LIBOR plus 2.4% and matures in July 2020. At loan closing, our5.5-acre parcel of land contribution was valued at $20.3 million and Kettler contributed $13.3with an agreed value of $3.2 million in exchange for a 50% interest in the venture when construction financing closes. Our partner will contribute cash of which $7.0 million was distributed to us. Both wefor their 50% interest, act as the development manager, fund all pre-development activities, obtain construction financing and Kettler areprovide any guarantees required to each make future contributions of $3.1 million toby the joint venture in accordance with the loan agreement, thus increasing our total capital account to $16.4 million. This transaction was accounted for aslender. Upon a partial sale of the land for whichproperty, we recognized a net profit of $0.7 million. As of September 30, 2013, we have contributed $1.7 millionare entitled to 100% of the $3.1 millionproceeds in excess of an amount determined by applying a 7.0% capitalization rate to NOI. The venture is expected to begin construction in the joint venture.fall of 2014 with a projected second quarter 2015 opening for the first phase and the final phase being opened by the end of 2015.
16
Table of Contents
THE HOWARD HUGHES CORPORATION
NOTES TO CONDENSED CONSOLIDATED FINANCIAL STATEMENTS
UNAUDITED
Summerlin Las Vegas Baseball Club, LLC
On August 6, 2012, we entered into a joint venture for the purpose of acquiring 100% of the operating assets of the Las Vegas 51s, a Triple-A baseball team which is a member of the Pacific Coast League. We own 50% of the venture and our partners jointly own the remaining 50%. Unanimous consent of the partners is required for all major decisions. In August 2012, we contributed $0.3 million to the joint venture pending final approval of the acquisition by Major League Baseball. In May 2013, after approval was received, we funded our remaining capital obligation of $10.2 million and the joint venture completed the acquisition.acquisition of the baseball team. Our strategy in acquiring an ownership interest is to pursue a potential relocation of the team to a to-be-built stadium in our Summerlin master planned community. There can be no assurance that such a stadium will ultimately be built.
HHMK Development, KR Holdings, Millennium Phase II,The Metropolitan Downtown Columbia Project
On October 27, 2011, we entered into a joint venture, Parcel D Development, LLC (“Parcel D”), with Kettler, to construct a Class A apartment building with ground floor retail space in downtown Columbia, Maryland. We and our partner each own 50% of the Summerlin Las Vegas Baseball Clubventure, and unanimous consent of the partners is required for all major decisions. On July 11, 2013, the joint venture closed a $64.1 million construction loan which is non-recourse to us. The loan bears interest at one-month LIBOR plus 2.4% and matures in July 2020. At loan closing, our land contribution was valued at $53,500 per unit, or $20.3 million, and Kettler contributed $13.3 million in cash, of which $7.0 million was distributed to us. Both we and Kettler made additional contributions of $3.1 million to the joint venture in accordance with the loan agreement, thus increasing our total capital account to $16.4 million. This transaction was accounted for as a partial sale of the land for which we recognized a net profit of $0.7 million.
Upon formation of the joint venture, we determined that Parcel D was a VIE, and that we were not the primary beneficiary. Accordingly, we accounted for our investment in Parcel D using the equity method. Upon closing of the first mortgage construction loan, the entity was recapitalized resulting in a reconsideration of the initial determination of VIE status. As a result of the reconsideration, we determined that Parcel D was no longer considered a VIE. We still account for our investment in Parcel D using the equity method.
Other
Our interest in Westlake Retail Associates, Ltd. (“Circle T Ranch”) and 170 Retail Associates (“Circle T Power Center”), and together with Circle T Ranch, (“Circle T”), located in the Dallas/Fort Worth, Texas area are held through joint venture entities included in the table belowwhich we own non-controlling interests. Woodlands Sarofim #1 Ltd. (“Woodlands Sarofim”) industrial buildings and Stewart Title of Montgomery County, Inc. (“Stewart Title”) are VIEs. We are not the primary beneficiary of any of these VIEs because we do not have the power to direct activities that most significantly impact the economic performance of suchreflected in our financial statements as non-consolidated joint ventures and therefore we report our interestsare accounted for on the equity method. The aggregate carrying value of the unconsolidated VIEs was $33.8 million and $8.1 million as of September 30, 2013 and December 31, 2012, respectively, and was classified as Investments in Real Estate Affiliates in the Condensed Consolidated Balance Sheets. Our maximum exposure to loss as a result of these investments is limited to the aggregate carrying value of the investment as we have not provided any guarantees or otherwise made firm commitments to fund amounts on behalf of these VIEs.
1617
Table of Contents
THE HOWARD HUGHES CORPORATION
NOTES TO CONDENSED CONSOLIDATED FINANCIAL STATEMENTS
UNAUDITED
Below is a summary of our Investments in Real Estate Affiliates:
| | Economic/ Legal Ownership | | Carrying Value | | Share of Earnings/Dividends | |
| | September 30, | | December 31, | | September 30, | | December 31, | | Three Months Ended Setpember 30, | | Nine Months Ended September 30, | |
| | 2013 | | 2012 | | 2013 | | 2012 | | 2013 | | 2012 | | 2013 | | 2012 | |
| | (In percentages) | | (In thousands) | | (In thousands) | |
Equity Method Investments: | | | | | | | | | | | | | | | | | |
| | | | | | | | | | | | | | | | | |
Forest View/Timbermill Apartments (a) | | — | | — | | $ | — | | $ | — | | $ | — | | $ | — | | $ | — | | $ | 4 | |
Millennium Waterway Apartments (b) | | 100.00 | % | 100.00 | % | — | | — | | — | | — | | — | | 406 | |
Millennium Woodlands Phase II, LLC (c) | | 81.43 | % | 81.43 | % | 2,160 | | 2,190 | | (59 | ) | — | | (59 | ) | — | |
KR Holdings, LLC (c) | | 50.00 | % | 50.00 | % | 16,762 | | — | | 2,716 | | — | | 7,907 | | — | |
Summerlin Las Vegas Baseball Club (c) | | 50.00 | % | 50.00 | % | 10,870 | | 300 | | 220 | | — | | 220 | | — | |
Circle T | | 50.00 | % | 50.00 | % | 9,004 | | 9,004 | | — | | — | | — | | — | |
Parcel D Development, LLC (c) | | 50.00 | % | 50.00 | % | 3,873 | | 4,330 | | — | | — | | — | | — | |
Stewart Title | | 50.00 | % | 50.00 | % | 3,769 | | 3,871 | | 382 | | 324 | | 899 | | 640 | |
HHMK Development, LLC (c) | | 50.00 | % | 50.00 | % | 110 | | 1,257 | | 290 | | — | | 443 | | — | |
Woodlands Sarofim #1 | | 20.00 | % | 20.00 | % | 2,570 | | 2,450 | | 45 | | (14 | ) | 121 | | 6 | |
| | | | | | 49,118 | | 23,402 | | 3,594 | | 310 | | 9,531 | | 1,056 | |
Cost basis investments | | | | | | 8,555 | | 8,777 | | — | | — | | 2,503 | (d) | 2,376 | (d) |
Investment in Real Estate Affiliates | | | | | | $ | 57,673 | | $ | 32,179 | | $ | 3,594 | | $ | 310 | | $ | 12,034 | | $ | 3,432 | |
(a)On April 19, 2012, the joint ventures owning the Forest View and Timbermill Apartments completed their sale to a third party. Our share of the distributable cash, after repayment of debt and transaction expenses, was $8.6 million.
(b)On May 31, 2012, we acquired our partner’s interest for $6.9 million and consolidated this property. See below for further discussion.
(c)Equity method variable interest entities.
(d)Includes distribution received from Summerlin Hospital Medical Center.
On May 31, 2012, we acquired our partner’s interest in the 393-unit Millennium Waterway Apartments for $6.9 million, following the funding of a $55.6 million ten-year non-recourse mortgage bearing interest at 3.75%. Prior to the acquisition, we accounted for our investment in Millennium Waterway Apartments under the equity method. We now own 100% of this stabilized Class A multi-family property located in The Woodlands Town Center. Total assets of $78.6 million and liabilities of $56.4 million, including the then recently funded loan, were consolidated into our financial statements at fair value as of the acquisition date.
As of September 30, 2013, approximately $61.6 million of indebtedness was secured by the properties owned by our Real Estate Affiliates of which our share was approximately $33.6 million based upon our economic ownership. The debt is non-recourse to us.
NOTE 8MORTGAGES, NOTES AND LOANS PAYABLE
Mortgages, notes and loans payable are summarized as follows:
| | September 30, | | December 31, | | | March 31, | | December 31, | |
| | 2013 | | 2012 | | | 2014 | | 2013 | |
| | (In thousands) | | | (In thousands) | |
Fixed-rate debt: | | | | | | | | | | |
Collateralized mortgages, notes and loans payable | | $ | 231,036 | | $ | 158,636 | | | $ | 971,559 | | $ | 971,786 | |
Special Improvement District bonds | | 36,794 | | 49,712 | | | 30,841 | | 33,100 | |
Variable-rate debt: | | | | | | | | | | |
Collateralized mortgages, notes and loans payable (a) | | 498,150 | | 479,964 | | | 556,981 | | 509,737 | |
Total mortgages, notes and loans payable | | $ | 765,980 | | $ | 688,312 | | | $ | 1,559,381 | | $ | 1,514,623 | |
(a) As more fully described below, $172.0 million of variable-rate debt has been swapped to a fixed rate for the term of the related debt.
1718
Table of Contents
THE HOWARD HUGHES CORPORATION
NOTES TO CONDENSED CONSOLIDATED FINANCIAL STATEMENTS
UNAUDITED
The following table presents our mortgages, notes, and loans payable by property:
| | | | | | | | Carrying Value | | | | | | | Maximum | | Carrying Value | |
| | | | Interest | | Maximum | | September 30, | | December 31, | | | | | Interest | | Facility | | March 31, | | December 31, | |
$ In thousands | | Maturity (a) | | Rate | | Facility Amount | | 2013 | | 2012 | | | Maturity (a) | | Rate | | Amount | | 2014 | | 2013 | |
| | | | | | | | (In thousands) | | |
Master Planned Communities | | | | | | | | | | | | | | | | | | | | | | |
The Woodlands Master Credit Facility (b) | | August 2018 | | 2.93 | % | $ | 250,000 | | $ | 176,662 | | $ | 176,704 | | |
Bridgeland Land Loan (c) | | June 2022 | | 5.50 | % | | | 18,066 | | 18,066 | | |
Bridgeland Development Loan (d) | | June 2015 | | 5.00 | % | 30,000 | | 5,950 | | — | | |
Bridgeland Land Loan (b) | | | June 2022 | | 5.50 | % | | | $ | 18,084 | | $ | 18,066 | |
Bridgeland Development Loan (c) | | | June 2015 | | 5.00 | % | $ | 30,000 | | — | | — | |
Summerlin West SID Bonds - S808/S810 | | April 2031 | | 7.13 | % | | | 13,704 | | 22,185 | | | April 2031 | | 7.13 | % | | | 8,974 | | 11,168 | |
Summerlin South SID Bonds - S151 | | June 2025 | | 6.00 | % | | | 6,889 | | 10,501 | | | June 2025 | | 6.00 | % | | | 6,625 | | 6,623 | |
Summerlin South SID Bonds - S128C | | December 2030 | | 6.05 | % | | | 5,625 | | 5,739 | | | December 2030 | | 6.05 | % | | | 5,511 | | 5,511 | |
Summerlin South SID Bonds - S132 | | December 2020 | | 6.00 | % | | | 4,423 | | 4,822 | | | December 2020 | | 6.00 | % | | | 3,895 | | 3,962 | |
Summerlin South SID Bonds - S108 | | December 2016 | | 5.95 | % | | | 946 | | 1,067 | | | December 2016 | | 5.95 | % | | | 823 | | 823 | |
Summerlin South SID Bonds - S128 | | December 2020 | | 7.30 | % | | | 747 | | 787 | | | December 2020 | | 7.30 | % | | | 707 | | 707 | |
Summerlin South SID Bonds - S124 | | December 2019 | | 5.95 | % | | | 305 | | 324 | | | December 2019 | | 5.95 | % | | | 285 | | 285 | |
The Woodlands Master Credit Facility | | | August 2018 | | 2.90 | % | 250,000 | | 176,663 | | 176,663 | |
Master Planned Communities Total | | | | | | | | 233,317 | | 240,195 | | | | | | | | | 221,567 | | 223,808 | |
| | | | | | | | | | | | | | | | | | | | | | |
Operating Assets | | | | | | | | | | | | | | | | | | | | | | |
Victoria Ward (e) | | September 2016 | | 3.38 | % | 250,000 | | 228,716 | | 229,000 | | |
70 Columbia Corporate Center (d) | | | August 2017 | | 4.25 | % | | | 16,287 | | 16,287 | |
Columbia Regional Building | | | March 2018 | | 2.15 | % | 23,008 | | 14,926 | | 9,207 | |
One Hughes Landing (e) | | | November 2017 | | 2.80 | % | 38,000 | | 27,593 | | 19,128 | |
Millennium Waterway Apartments | | June 2022 | | 3.75 | % | | | 55,584 | | 55,584 | | | June 2022 | | 3.75 | % | | | 55,584 | | 55,584 | |
3 Waterway Square (f) | | August 2028 | | 3.94 | % | | | 52,000 | | 9,150 | | |
110 N. Wacker (f) | | | October 2019 | | 5.21 | % | | | 29,000 | | 29,000 | |
9303 New Trails | | | December 2023 | | 4.88 | % | | | 13,318 | | 13,398 | |
Outlet Collection at Riverwalk | | | October 2018 | | 2.90 | % | 64,400 | | 14,733 | | — | |
The Woodlands Resort & Conference Center | | | February 2019 | | 3.65 | % | 95,000 | | 45,036 | | 36,100 | |
Victoria Ward (g) | | | September 2016 | | 3.35 | % | 250,000 | | 238,716 | | 238,716 | |
20/25 Waterway Avenue | | | May 2022 | | 4.79 | % | | | 14,450 | | 14,450 | |
3 Waterway Square | | | August 2028 | | 3.94 | % | | | 52,000 | | 52,000 | |
4 Waterway Square | | December 2023 | | 4.88 | % | | | 39,467 | | 40,140 | | | December 2023 | | 4.88 | % | | | 39,004 | | 39,237 | |
The Woodlands Resort and Conference Center (g) | | February 2019 | | 3.68 | % | 95,000 | | 36,100 | | 36,100 | | |
110 N. Wacker (h) | | October 2019 | | 5.21 | % | | | 29,000 | | 29,000 | | |
One Hughes Landing (i) | | November 2017 | | 2.83 | % | 38,000 | | 17,467 | | 10 | | |
70 Columbia Corporate Center | | August 2017 | | 4.25 | % | | | 16,287 | | 16,037 | | |
20/25 Waterway Avenue | | May 2022 | | 4.79 | % | | | 14,450 | | 14,450 | | |
9303 New Trails | | December 2023 | | 4.88 | % | | | 13,476 | | 13,706 | | |
Columbia Regional Building (j) | | March 2018 | | 2.18 | % | 23,008 | | 4,255 | | — | | |
Capital lease obligation | | various | | 3.60 | % | | | 12 | | 41 | | |
Capital lease obligations | | | Various | | 3.60 | % | | | 186 | | 205 | |
Operating Assets Total | | | | | | | | 506,814 | | 443,218 | | | | | | | | | 560,833 | | 523,312 | |
| | | | | | | | | | | | | | | | | | | | | | |
Strategic Developments | | | | | | | | | | | | | | | | | | | | | | |
Two Hughes Landing (i) | | September 2018 | | 2.83 | % | 41,230 | | — | | — | | |
Hughes Landing Retail | | | December 2018 | | 2.10 | % | 36,575 | | 918 | | 913 | |
Two Hughes Landing (e) | | | September 2018 | | 2.80 | % | 41,230 | | 9,396 | | 10 | |
One Lake’s Edge | | | November 2018 | | 2.65 | % | 73,525 | | — | | — | |
The Shops at Summerlin SID Bonds - S128 | | December 2030 | | 6.05 | % | | | 3,635 | | 3,701 | | | December 2030 | | 6.05 | % | | | 3,569 | | 3,569 | |
The Shops at Summerlin SID Bonds - S108 | | December 2016 | | 5.95 | % | | | 520 | | 586 | | | December 2016 | | 5.95 | % | | | 452 | | 452 | |
Strategic Developments Total | | | | | | | | 4,155 | | 4,287 | | | | | | | | | 14,335 | | 4,944 | |
| | | | | | | | | | | | | | | | | | | | | | |
Other Corporate Financing Arrangements (k) | | Various | | Various | | | | 21,694 | | 612 | | |
Other Corporate Financing Arrangements | | | Various | | 3.00 | % | 22,700 | | 21,052 | | 21,309 | |
Senior Notes | | | October 2021 | | 6.88 | % | | | 750,000 | | 750,000 | |
| | | | | | | | | | | | |
Unamortized underwriting fees | | | | | | | | | (8,406 | ) | (8,750 | ) |
| | | | | | | | | | | | | | | | | | | $ | 1,559,381 | | $ | 1,514,623 | |
| | | | | | | | $ | 765,980 | | $ | 688,312 | | | | | | | | | | | | | | | |
|
(a)Maturity date includes any extension periods which can be exercised at our option. (b)On August 8, 2013, the loan was modified and extended to a August 2018 final maturity date. The interest rate was reduced from one-month LIBOR + 4.00%, with a 5.00% minimum rate to a LIBOR + 2.75% with no floor. The maximum available balance was reduced to $250.0 million from $270.0 million.
(c)Loan is fixed at 5.50% through June 2017 and is floating based on three-month LIBOR +2.75% thereafter.
(d)Revolving development loan provides for a maximum of $30.0 million outstanding balance at any time with all draws not exceeding $140.0 million. The loan bears interest at the greater of 5.00% or LIBOR + 3.25%.
(e)Loan has a stated interest rate of one-month LIBOR + 2.50%. $143.0 million of the outstanding principal balance is swapped to a 3.80% fixed rate through maturity.
(f)On August 2, 2013, the loan was refinanced with a $52.0 million loan bearing interest at 3.94% and maturity in August 2028.
(g)Loan was refinanced in February 2013 and bears interest at one-month LIBOR + 3.50%.
(h)Loan has a stated interest rate of one-month LIBOR + 2.25%. The $29.0 million outstanding principal balance is swapped to a 5.21% fixed rate through maturity.
(i)Loan bears interest at one-month LIBOR + 2.65%.
(j)Loan bears interest at prime rate for draws less than $0.5 million. For draws over $0.5 million, we make election to use one-month LIBOR + 2.00% or the prime rate.
(k)Includes the partial funding of a $22.7 million loan used to acquire a company airplane. The loan bears interest at 3.00% and requires approximately $1.0 million annual amortization through maturity in July 2018.
| | Maturity date includes any extension periods which can be exercised at our option. |
(b) | | Loan is fixed at 5.50% through June 2017 and is floating based on three-month LIBOR plus 2.75% thereafter. |
(c) | | Revolving development loan provides for a maximum of $30.0 million outstanding balance at any one time with all draws not exceeding $140.0 million. The loan bears interest at the greater of 5.00% or LIBOR plus 3.25%. |
(d) | | On April 15, 2014 this loan was fully repaid using cash on hand. Please refer to Note 16 — Subsequent Events for a description of the repayment. |
(e) | | Loan bears interest at one-month LIBOR plus 2.65%. |
(f) | | Loan has a stated interest rate of one-month LIBOR plus 2.25%. The $29.0 million outstanding principal balance is swapped to a 5.21% fixed rate through maturity. |
(g) | | Loan has a stated interest rate of one-month LIBOR plus 2.50%. $143.0 million of the outstanding principal balance is swapped to a 3.80% fixed rate through maturity. |
1819
Table of Contents
THE HOWARD HUGHES CORPORATION
NOTES TO CONDENSED CONSOLIDATED FINANCIAL STATEMENTS
UNAUDITED
The weighted average interest rate on our mortgages, notes and loans payable was 3.75%5.18% and 4.49%5.25% as of September 30, 2013March 31, 2014 and December 31, 2012,2013, respectively.
As of September 30, 2013,March 31, 2014, we had $766.0$1,559.4 million of mortgages, notes and loans payable. All of the mortgage debt is secured by the individual properties as listed in the table above and is non-recourse to us,HHC, except for a $7.0 million parent guarantee associated with the 110 N. Wacker mortgage.mortgage and $14.7 million of construction financing for the Outlet Collection at Riverwalk. The $750.0 million of Senior Notes and $21.1 million of Other Corporate Financing Arrangements are also recourse to us. The Woodlands Master Credit Facility and The Woodlands Resort and& Conference Center loans are recourse to the entities that directly own The Woodlands operations. Certain of our loans contain provisions which grant the lender a security interest in the operating cash flow of the property that represents the collateral for the loan. Such provisions are not expected to impact our operations in 2013.2014. Certain mortgage notes may be prepaid, but may be subject to a prepayment penalty equal to a yield-maintenance premium, defeasance, or a percentage of the loan balance. As of September 30, 2013,March 31, 2014, land, buildings and equipment and developments in progress with a cost basis of $1.6$1.7 billion have been pledged as collateral for our mortgages, notes and loans payable. On July 26, 2013, we closed on a $22.7 million loan to acquire a company airplane. The loan bears interest at 3.0%, requires approximately $1.0 million annual amortization and matures in July 2018.
As of September 30, 2013,March 31, 2014, we were in compliance with all of the financial covenants related to our debt agreements.
Master Planned Communities
On August 8, 2013, theThe Woodlands refinanced its existing Master Credit Facility with a $250.0 million credit facility consisting of a $125.0 million term loan and a $125.0 million revolver (together, the “TWL Facility”). The TWL Facility bears interest at one-month LIBOR plus 2.75% and has an initial three-year term through August 2016 with two, one-year extension options. The extension options require a reduction of the total commitment to $220.0 million for the first extension and $185.0 million for the second extension. The TWL Facility also contains certain restrictions or covenants that, among other things, require the maintenance of specified financial ratios, limit the incurrence of additional recourse indebtedness at The Woodlands, and limit distributions from The Woodlands to us.us based on a loan-to-value test. There was $73.3 million of undrawn and available borrowing capacity under the TWL Facility based on the collateral underlying the facility and loan covenants as of September 30, 2013.March 31, 2014.
During the second quarter of 2012, we refinanced $18.1 million of existing debt related to our Bridgeland Master Planned Community with a ten-year term loan facility at a fixed interest rate of 5.50% for the first five years and three-month LIBOR plus 2.75% for the remaining term and maturing on June 29, 2022. Beginning on June 29, 2014, annual principal payments are required in the amount of 5.00% of the then outstanding principal balance. In addition, we simultaneously entered into a three-year revolving credit facility with aggregate borrowing capacity of $140.0 million of which $39.2 million has been utilized and which has a $30.0 million maximum outstanding loan amount at any time. New residential lot development has been delayed while we pursue a permit from the U.S. Army Corps of Engineers to develop an additional 806 acres of land in Bridgeland. Due to the delayed lot development and low level of lot inventory, we can no longer draw upon the revolving credit facility until the permit is received. The revolving loan bears interest at the greater of 5.00% or one-month LIBOR plus 3.25% and matures on June 29, 2015. This loan is intended to provide working capital at Bridgeland to accelerate development efforts to meet the demand of homebuilders for finished lots in the community. The Bridgeland loans are cross-collateralized and cross-defaulted and the Bridgeland Master Planned Community serves as collateral for the loans. The loans also require that Bridgeland maintain a minimum $3.0 million cash balance and a minimum net worth of $250.0 million. Additionally, we are restricted from making cash distributions from Bridgeland unless the revolving credit facility has no outstanding balance and one year of real estate taxes and debt service on the term loan have been escrowed with the lender.
The Summerlin Master Planned Community uses Special Improvement District (“SID”) bonds to finance certain common infrastructure improvements. These bonds are issued by the municipalities and, although unrated, are secured by the assessments on the land. The majority of proceeds from each bond issued is held in a construction escrow and disbursed to us as infrastructure projects are completed, inspected by the municipalities and approved for reimbursement. Accordingly, the Special Improvement DistrictSID bonds have been classified as debt, and the Summerlin Master Planned Community pays the debt service on the bonds semi-annually. As Summerlin sells land,
19
Table of Contents
THE HOWARD HUGHES CORPORATION
NOTES TO CONDENSED CONSOLIDATED FINANCIAL STATEMENTS
UNAUDITED
the buyers assume a proportionate share of the bond obligation at closing, and the residential sales contracts provide for the reimbursement of the principal amounts that we previously paid with respect to such proportionate share of the bond.
20
Table of Contents
THE HOWARD HUGHES CORPORATION
NOTES TO CONDENSED CONSOLIDATED FINANCIAL STATEMENTS
UNAUDITED
Operating Assets
On February 2, 2012,October 24, 2013, we closed on a $64.4 million partial recourse construction loan for the Outlet Collection at Riverwalk. The loan bears interest at one-month LIBOR plus 2.75%, with an initial maturity date of October 24, 2016 with two, one-year extension options.
On August 2, 2013, we refinanced a non-recourse first mortgage financing totaling $43.3$52.0 million for the construction of 3 Waterway Square, an 11-story, 232,000 square foot office building in The Woodlands. The loan matures on January 31, 2015 and has two, one-year extension options. The loan bears interest at one-month LIBOR plus 2.65%. On August 2, 2013, we refinanced the loan with a $52.0 million non-recourse first mortgage financing bearing interest at 3.94% and maturingmatures on August 11, 2028.
On March 15, 2013, we closed on a non-recourse financing totaling $23.0 million for the redevelopment of The Columbia Regional Building (also known as The Rouse Building), an office building located in Columbia, Maryland. The loan bears interest at prime rate for borrowings of less than $0.5 million. For borrowings over $0.5 million, we elect to use one-month LIBOR plus 2.00% and. The loan is interest only through the initial maturity date of March 15, 2016. The loan has two, one-year extension options.
On February 8, 2013, we closed on a $95.0 million non-recourse construction loan which repaid the existing $36.1 million mortgage and provides funding for the redevelopment of The Woodlands Resort and& Conference Center. The loan bears interest at one-month LIBOR plus 3.50% and has an initial maturity of February 8, 2016, with three one-year extensions at our option. The loan is secured by a 440-room and 40-acre conference center and resort located within The Woodlands, and requires the maintenance of specified financial ratios after completion of construction.
On November 14, 2012, we closed on a non-recourse financing totaling $38.0 million for the construction of One Hughes Landing, an eight-story, 197,000 square foot office building in The Woodlands. The loan matures on November 14, 2015 and has two, one-year extension options. The loan bears interest at one-month LIBOR plus 2.65%.
On August 15, 2012, we assumed a $16.0 million loan as part of the acquisition of 70 Columbia Corporate Center (“70 CCC”), located in Columbia, MD. The non-recourse, interest only promissory note matures on August 31, 2017, has a fixed rate of 4.25% and is secured by the property. The loan includes a participation right to the lender for 30% of the appreciation in the market value of the property after our 10% cumulative preferred return and repayment of the outstanding debt and our contributed equity. The fair value of the participation obligation is remeasuredre-measured each quarter and the resulting change in fair value is recorded through interest expense. For the nine months ended September 30, 2013, $2.8 million relating to the estimated increase infair value of the participation right is duerecorded as interest expense. For the three months ended March 31, 2014, $2.1 million relating to increased leasingthe decrease in the value of the property andparticipation right was recorded in interest expense. Virtually allexpense resulting from the repayment of the interestloan. On April 15, 2014 the loan was capitalized due to our development activities.repaid in full. See Note 16 — Subsequent Events for further information.
On May 31, 2012, as part of the acquisition of our former partner’s interest in Millennium Waterway Apartments, located within The Woodlands, we consolidated a $55.6 million non-recourse first mortgage loan. The proceeds from the mortgage were used to refinance the joint venture’s existing debt and to fund our acquisition of the partner’s interest in the property. The loan matures on June 1, 2022 and has a fixed interest rate of 3.75%. Payments are interest only until September 2017, then monthly principal and interest payments of $257,418 with the unpaid principal balance due at maturity.
On April 26, 2012, we closed on a $14.5 million non-recourse financing secured by 20/25 Waterway Avenue, located within The Woodlands. The loan bears interest at 4.79% and matures on May 1, 2022.
21
Table of Contents
THE HOWARD HUGHES CORPORATION
NOTES TO CONDENSED CONSOLIDATED FINANCIAL STATEMENTS
UNAUDITED
On December 5, 2011, we obtained a $41.0 million loan for 4 Waterway Square and a $14.0 million loan for 9303 New Trails, both located within The Woodlands. These non-recourse mortgages mature on December 11, 2023 and have fixed interest rates of 4.88%.
20
Table of Contents
THE HOWARD HUGHES CORPORATION
NOTES TO CONDENSED CONSOLIDATED FINANCIAL STATEMENTS
UNAUDITED
On September 30, 2011, we closed on a $250.0 million non-recourse first mortgage financing secured by Ward CentersVillage in Honolulu, Hawaii, that bears interest at one-month LIBOR plus 2.50%. The loan may be drawn to a maximum $250.0 million to fund capital expenditures at the property, provided that the outstanding principal balance cannot exceed 65% of the property’s appraised value, and the borrowers are required to have a minimum 10.0% debt yield to draw additional loan proceeds under the facility. The loan permits partial repayment during its term in connection with property releases for development. In the third quarter of 2013, certain properties securing the loan were approved for condominium development. As a result, the properties were removed from the collateral pool and a minor principal paydown of the loan was required. The loan matures on September 29, 2016, and $143.0 million of the principal balance was swapped to a 3.80% fixed rate for the term of the loan. The loan had a weighted-average interest rate of 3.38% as of September 30, 2013. The unused portion of this mortgage was $21.3$11.3 million as of September 30, 2013.March 31, 2014.
On May 10, 2011, we closed a $29.0 million first mortgage financing secured by our office building located at 110 N. Wacker Drive in Chicago, IL. The loan term is coterminous with the expiration of the first term of the existing tenant’s lease. The loan has an interest-only period through April 2015 and, thereafter, amortizes ratably to $12.0 million through maturity.maturity on October 31, 2019. We provided a $7.0 million repayment guarantee for the loan, which is reduced on a dollar for dollar basis during the amortization period.
Strategic Developments
On December 20, 2013, we closed on a $36.6 million non-recourse loan for the construction of Hughes Landing Retail, a 123,000 square foot retail component of Hughes Landing. The loan bears interest at one-month LIBOR plus 1.95% with an initial maturity date of December 20, 2016, with two, one-year extension options.
On November 25, 2013, we closed on a $73.5 million non-recourse loan for the construction of an eight-story, Class A, multi-family project within Hughes Landing called One Lake’s Edge. One Lake’s Edge will be comprised of 390 multi-family units (averaging 984 square feet per unit), 22,289 square feet of retail and an approximately 750 space parking garage, all situated on 2.92 acres of land. The loan bears interest at one-month LIBOR plus 2.50% with an initial maturity date of November 25, 2016, with two, one-year extension options.
On September 11, 2013, we closed on a non-recourse financing totaling $41.2 million for the construction of Two Hughes Landing, the second Class A office building in the 66-acre mixed-use development of Hughes Landing on Lake Woodlands, located in The Woodlands. Two Hughes Landing will be a 197,000 square foot, eight-story office building with an adjacent parking garage containing approximately 630 spaces and is the second of up to 11 office buildings planned for Hughes Landing. The loan matures on September 11, 2016 and has two, one-year extension options. The loan bears interest at one-month LIBOR plus 2.65% due monthly.
Corporate
On October 2, 2013, we issued $750.0 million in aggregate principal amount of 6.875% Senior Notes due 2021 (the “Senior Notes”) and raised approximately $741.3 million of net cash proceeds. Interest is payable semiannually, on April 1 and October 1 of each year starting in April 2014. At any time prior to October 1, 2016, we may redeem up to 35% of the Senior Notes at 6.875% maturing October 2021. Neta price equal to 106.875% using the proceeds from the transaction totaled approximately $739.6 million. Please refer to Note 20 — Subsequent Events for a more complete descriptionequity offerings. We may redeem all or part of the notes.Senior Notes at any time on or after October 1, 2016 with a declining call premium thereafter to maturity. The Senior Notes contain customary terms and covenants for non-investment grade senior notes and have no maintenance covenants.
22
Table of Contents
THE HOWARD HUGHES CORPORATION
NOTES TO CONDENSED CONSOLIDATED FINANCIAL STATEMENTS
UNAUDITED
NOTE 9DERIVATIVE INSTRUMENTS AND HEDGING ACTIVITIES
We are primarily exposed to interest rate risks related to our variable interest debt, and we manage this risk by utilizing interest rate derivatives. Our objectives in using interest rate derivatives are to add stability to interest costs by reducing our exposure to interest rate movements. To accomplish this objective, we use interest rate swaps and caps as part of our interest rate risk management strategy. Interest rate swaps designated as cash flow hedges involve the receipt of variable amounts from a counterparty in exchange for the Company’s fixed-rate payments over the life of the agreements without exchange of the underlying notional amount. Interest rate caps designated as cash flow hedges involve the receipt of variable amounts from a counterparty if interest rates rise above the strike rate on the contract in exchange for an up-front premium.
The effective portion of changes in the fair value of derivatives designated and that qualify as cash flow hedges is recorded in Accumulated Other Comprehensive Income (“AOCI”) and is subsequently reclassified into earnings in the period that the hedged forecasted transaction affects earnings. The ineffective portion of the change in fair value of the derivatives is recognized directly in earnings. During the three and nine months ended September 30, 2013,March 31, 2014, the ineffective portion recorded in earnings was insignificant.
As of September 30, 2013,March 31, 2014, we had gross notional amounts of $172.0 million for interest rate swaps and a $100.0 million interest rate cap that were designated as cash flow hedges of interest rate risk. The fair value of the interest rate cap derivative was insignificant.
21
Table of Contents
THE HOWARD HUGHES CORPORATION
NOTES TO CONDENSED CONSOLIDATED FINANCIAL STATEMENTS
UNAUDITED
If the interest rate swap agreements are terminated prior to their maturity, the amounts previously recorded in AOCI are recognized into earnings over the period that the hedged transaction impacts earnings. If the hedging relationship is discontinued because it is probable that the forecasted transaction will not occur according to the original strategy, any related amounts previously recorded in AOCI are recognized in earnings immediately.
Amounts reported in AOCI related to derivatives will be reclassified to interest expense as interest payments are made on our variable-rate debt. Over the next 12 months, we estimate that an additional $2.3$2.4 million will be reclassified as an increase to interest expense.
The table below presents the fair value of our derivative financial instruments which are included in accounts payable and accrued liabilities in the Condensed Consolidated Balance Sheets:
| | September 30, | | December 31, | | | March 31, | | December 31, | |
| | 2013 | | 2012 | | | 2014 | | 2013 | |
| | (In thousands) | | | (In thousands) | |
Interest Rate Swaps | | $ | 4,696 | | $ | 7,183 | | | $ | 3,956 | | $ | 4,164 | |
Total derivatives designated as hedging instruments | | $ | 4,696 | | $ | 7,183 | | | $ | 3,956 | | $ | 4,164 | |
The table below presents the effect of our derivative financial instruments on the Condensed Consolidated Statements of Operations for the three and nine months ended September 30, 2013March 31, 2014 and 2012:2013:
| | | | | | Three Months Ended September 30, | | |
| | Three Months Ended September 30, | | Location of Gain | | 2013 | | 2012 | | | Three Months Ended March 31, | | | | Three Months Ended March 31, | |
| | 2013 | | 2012 | | (Loss) Reclassified | | Amount of Gain | | Amount of (Loss) | | | 2014 | | 2013 | | | | 2014 | | 2013 | |
Cash Flow Hedges | | Amount of (Loss)
Recognized in OCI | | Amount of (Loss)
Recognized in OCI | | from AOCI into
Earnings | | Reclassified from
AOCI into Earnings | | Reclassified from
AOCI into Earnings | | | Amount of Loss
Recognized in OCI | | Amount of Loss
Recognized in OCI | | Location of Loss
Reclassified from
AOCI into Earnings | | Amount of Loss
Reclassified from
AOCI into Earnings | | Amount of Loss
Reclassified from
AOCI into Earnings | |
| | (In thousands) | | | | (In thousands) | | | (In thousands) | | | | (In thousands) | |
| | | | | | | | | | | | | | | | | | | | | | |
Interest Rate Swaps | | $ | (407 | ) | $ | (1,466 | ) | Interest Expense | | $ | 6 | | $ | (512 | ) | | $ | (342 | ) | $ | (98 | ) | Interest Expense | | $ | (541 | ) | $ | (519 | ) |
| | $ | (407 | ) | $ | (1,466 | ) | | | $ | 6 | | $ | (512 | ) | | $ | (342 | ) | $ | (98 | ) | | | $ | (541 | ) | $ | (519 | ) |
| | | | | | Nine Months Ended September 30, | |
| | Nine Months Ended September 30, | | Location of Gain | | 2013 | | 2012 | |
| | 2013 | | 2012 | | (Loss) Reclassified | | Amount of (Loss) | | Amount of (Loss) | |
Cash Flow Hedges | | Amount of Gain
Recognized in OCI | | Amount of (Loss)
Recognized in OCI | | from AOCI into
Earnings | | Reclassified from
AOCI into Earnings | | Reclassified from
AOCI into Earnings | |
| | (In thousands) | | | | (In thousands) | |
| | | | | | | | | | | |
Interest Rate Swaps | | $ | 1,079 | | $ | (4,627 | ) | Interest Expense | | $ | (1,041 | ) | $ | (1,512 | ) |
| | $ | 1,079 | | $ | (4,627 | ) | | | $ | (1,041 | ) | $ | (1,512 | ) |
23
Table of Contents
THE HOWARD HUGHES CORPORATION
NOTES TO CONDENSED CONSOLIDATED FINANCIAL STATEMENTS
UNAUDITED
NOTE 10INCOME TAXES
Several of our subsidiaries are involved in a dispute with the IRS relating to years in which those subsidiaries were owned by General Growth Properties (“GGP”), and in connection therewith, GGP has provided us with an indemnity against certain potential tax liabilities. Pursuant to the Tax Matters Agreement, with GGP, GGP has indemnified us from and against 93.75% of any and all losses, claims, damages, liabilities and reasonable expenses
22
Table of Contents
THE HOWARD HUGHES CORPORATION
NOTES TO CONDENSED CONSOLIDATED FINANCIAL STATEMENTS
UNAUDITED
to which we become subject (the “Tax Indemnity”), in each case solely to the extent directly attributable to certain taxes related to sales of certain assets in our Master Planned Communities segment prior to March 31, 2010 (“MPC Taxes”), in an amount up to $303.8 million, plus interest and penalties related to these amounts (the “Indemnity Cap”) so long as GGP controls the action in the United States Tax Court (the “Tax Court”) related to the dispute with the IRS as described below. We recorded the Tax Indemnity receivable at the Indemnity Cap amount as of the spinoff date. The unrecognized tax benefits and related accrued interest recorded through September 30, 2013March 31, 2014 are primarily related to the taxes that are the subject of the Tax Indemnity. We have recorded interest income receivable on the Tax Indemnity receivable in the amounts of $42.1$40.5 million and $36.4$38.6 million as of September 30, 2013March 31, 2014 and December 31, 2012,2013, respectively.
The timing of the utilization of the tax assets attributable to indemnified and non-indemnified gains results in changes to the Tax Indemnity receivable and is dependent on numerous future events, such as the timing of recognition of indemnified and non-indemnified gains, the amount of each type of gain recognized in each year, the use of specific deductions and the ultimate amount of indemnified gains recognized. These non-cash changes could be material to our financial statements. Resolution of the Tax Court case noted below could also result in material changes to the Master Planned Community deferred gains and the timing of utilization of the tax assets, both of which could result in material changes to the Tax Indemnity receivable. We record the Tax Indemnity receivable based on the amounts indemnified which are determined in accordance with the provisions set forth in ASC 740 (Income Taxes).(“ASC 740”) Income Taxes.
During the three months ended September 30, 2013,March 31, 2014, the Tax Indemnitytax indemnity receivable increased by $2.5$1.9 million. This increase was due to the increase in the related interest income of $1.8 million and a$1.9 million. There is no remeasurement gain of $0.7 million resulting from a reductionincome or loss in our planned utilization of tax assets that contractually limit the amount we can receive pursuant to the Tax Matters Agreement. During the nine monthsquarter ended September 30, 2013, the reduction in Tax Indemnity receivable of $3.1 million related to interest income that was offset by our utilization of tax assets that contractually limit the amount we can receive pursuant to the Tax Matters Agreement and changes to our deferred tax liability for the MPC Taxes.March 31, 2014.
On May 6, 2011, GGP filed Tax Court petitions on behalf of the two former taxable REIT subsidiaries of GGP seeking a redetermination of federal income tax for the years 2007 and 2008. The petitions seek to overturn determinations by the IRS that the taxpayers were liable for combined deficiencies totaling $144.1 million. On October 20, 2011, GGP filed a motion in the Tax Court to consolidate the cases of the two former taxable REIT subsidiaries of GGP subject to litigation with the IRSInternal Revenue Service due to the common nature of the cases’ facts and circumstances and the issues being litigated. The Tax Court granted the motion to consolidate. The case was heard by the Tax Court in November 2012. We expect the Tax Court to rule on the case within the next 12 months.
Unrecognized tax benefits recorded pursuant to uncertain tax positions were $95.1 million and $95.9$90.5 million as of September 30, 2013March 31, 2014 and December 31, 2012, respectively,2013, excluding interest, of which this entire amount would not impact our effective tax rate. Accrued interest related to these unrecognized tax benefits amounted to $42.2$40.5 million and $36.6$38.7 million as of September 30, 2013March 31, 2014 and December 31, 2012,2013, respectively. We recognized an increase in interest expense related to the unrecognized tax benefits of $1.7 million and $5.6$1.9 million for the three and nine months ended September 30, 2013, respectively.March 31, 2014. A significant amount of the unrecognized tax benefits recorded in the financial statements are related to the Tax Court litigation and are expected to be resolved within the next 12 months.
We file a consolidated corporate tax return which includes all of our subsidiaries with the exception of Victoria Ward, Limited (“Ward”), substantially all of which is owned by us. Ward elected to be taxed as a REIT, commencing with the taxable year beginning January 1, 2002. Ward has satisfied the REIT distribution requirements for 2012,2013. In connection with the planned condominium development of Ward that was approved by the Hawaii Real Estate Commission during the fourth quarter of 2013, the Company now intends to revoke the REIT election within the next few years, before future phases of condominium development commence. As a result of our intention to revoke the REIT status, we recorded deferred tax liabilities in the fourth quarter 2013 of $48.0 million for book and presentlytax basis differences that we intendno longer expect to continue to operatereverse while Victoria Ward asLimited is a REIT.
2324
Table of Contents
THE HOWARD HUGHES CORPORATION
NOTES TO CONDENSED CONSOLIDATED FINANCIAL STATEMENTS
UNAUDITED
NOTE 11STOCK-BASED PLANS
Our stock based plans are described, and informational disclosures are provided, in the Notes to the Consolidated Financial Statements included in our Form 10-K for the year ended December 31, 2012.2013.
Stock Options
The following table summarizes our stock option plan:
| | Stock Options | | Weighted
Average Exercise
Price | | | Stock Options | | Weighted
Average Exercise
Price | |
Stock Options outstanding at January 1, 2013 | | 861,940 | | $ | 59.17 | | |
Stock Options outstanding at January 1, 2014 | | | 965,440 | | $ | 64.57 | |
Granted | | 93,600 | | 94.81 | | | 63,000 | | 144.38 | |
Forfeited | | (24,600 | ) | 58.41 | | | (3,500 | ) | 61.30 | |
Stock Options outstanding at September 30, 2013 | | 930,940 | | $ | 62.77 | | |
Stock Options outstanding at March 31, 2014 | | | 1,024,940 | | $ | 69.49 | |
Generally, options granted vest ratably over requisite service periods, expire ten years after the grant date and generally do not become exercisable until their restriction on exercise lapses after the five-year anniversary of the grant date. In May 2013,February 2014, certain key employees were granted stock options, whereby half vest after four years of service and the remaining halfwhich cliff vest on a graduated scale basedDecember 31, 2018. The remaining options also cliff vest on totalDecember 31, 2018, however, the amount of options are diminished if certain prescribed shareholder return in 2017.hurdles are not met. Option grantees must be employed by the Company on the vesting date to be eligible to receive the award.
Restricted Stock
Restricted stock awards issued under the Equity Plan provide that shares awarded may not be sold or otherwise transferred until restrictions have lapsed as established by the Committee. For the three months ended March 31, 2014, compensation expense of $0.8 million is included in general and administrative expense related to restricted stock awards. The balance of unamortized restricted stock expense as of March 31, 2014 was $12.4 million, which is expected to be recognized over a weighted-average period of 4.11 years.
The following table summarizes restricted stock activity:
| | Restricted
Stock | | Weighted
Average Grant
Date Fair Value | | | Restricted
Stock | | Weighted
Average Grant
Date Fair Value | |
Restricted stock outstanding at January 1, 2013 | | 57,933 | | $ | 65.72 | | |
Restricted stock outstanding at January 1, 2014 | | | 122,332 | | $ | 75.21 | |
Granted | | 77,432 | | 79.77 | | | 54,204 | | 123.43 | |
Vested | | (13,033 | ) | 60.15 | | | — | | — | |
Restricted Stock outstanding at September 30, 2013 | | 122,332 | | $ | 75.21 | | |
Restricted Stock outstanding at March 31, 2014 | | | 176,536 | | $ | 90.01 | |
DuringIn addition to the second quarter of 2013, we granted 66,038 sharesgranting of restricted stock at a share priceto certain members of $101.77.management, we award restricted stock to our non-employee directors as part of their annual retainer. The restrictionsrestriction on the non-employee director shares lapse after four yearsin May of service and 50%each year. In February 2014, certain employees were granted restricted stock, half of such shareswhich cliff vest on a graduated scale basedDecember 31, 2018. The remaining restricted stock awards also cliff vest on achievingDecember 31, 2018, however, the total return on our stock through 2017. In addition, 11,394 sharesamount of restricted stock were awarded toawards are diminished if certain non-employee directors at a priceprescribed shareholder return hurdles are not met. Generally, upon termination of $97.72 as part of an annual retainer for their services duringemployment, the second quarter of 2013. Likewise, 13,033 of restricted stock shares were awarded at a share price of $60.15 during the second quarter of 2012. The restrictions on the shares granted in 2012that have lapsed and the restriction on the shares granted in 2013 will generally lapse in the second quarter of 2014. As of September 30, 2013, there were 122,332 shares of restricted stock outstanding.not vested are forfeited.
2425
Table of Contents
THE HOWARD HUGHES CORPORATION
NOTES TO CONDENSED CONSOLIDATED FINANCIAL STATEMENTS
UNAUDITED
NOTE 12OTHER ASSETS AND LIABILITIES
Prepaid Expenses and Other Assets
The following table summarizes the significant components of prepaid expenses and other assets.
| | September 30, | | December 31, | | | March 31, | | December 31, | |
| | 2013 | | 2012 | | | 2014 | | 2013 | |
| | (In thousands) | | | (In thousands) | |
Special Improvement District receivable | | $ | 39,667 | | $ | 39,659 | | | $ | 39,712 | | $ | 39,688 | |
Equipment | | 22,301 | | — | | |
Tenant and other receivables | | 4,959 | | 2,346 | | |
Equipment, net of accumulated depreciation of $1.1 million and $0.7 million, respectively | | | 21,551 | | 21,978 | |
Tenant incentives and other receivables | | | 5,750 | | 6,757 | |
Federal income tax receivable | | 5,913 | | 5,367 | | | 6,099 | | 6,053 | |
Prepaid expenses | | 7,266 | | 4,757 | | | 8,528 | | 4,744 | |
Below-market ground leases | | 20,087 | | 20,341 | | | 19,917 | | 20,002 | |
Condominium deposits | | — | | 19,616 | | | 50,232 | | 12,405 | |
Security and escrow deposits | | 15,007 | | 12,865 | | | 32,762 | | 28,082 | |
Above-market tenant leases | | 1,147 | | 1,896 | | | 1,042 | | 1,095 | |
Uncertain tax position asset | | 14,756 | | 12,801 | | | 14,178 | | 13,528 | |
In-place leases | | 9,946 | | 11,516 | | | 8,755 | | 9,306 | |
Intangibles | | 3,714 | | 3,714 | | | 3,683 | | 3,714 | |
Other | | 6,671 | | 8,592 | | | 4,110 | | 6,588 | |
| | $ | 151,434 | | $ | 143,470 | | | $ | 216,319 | | $ | 173,940 | |
The $7.9$42.4 million increase as of September 30, 2013March 31, 2014 compared to December 31, 20122013 primarily relates to a $22.3 million increase in equipment related to an airplane purchase, a $2.6 million increase in tenant and other receivables, primarily related to $2.0 million of lease incentives at Ward Centers, which was offset by a decrease of $19.6 million in condominium deposits due to the sale of our condominium rights for ONE Ala Moana.
25
Table of Contents
THE HOWARD HUGHES CORPORATION
NOTES TO CONDENSED CONSOLIDATED FINANCIAL STATEMENTS
UNAUDITED
Accounts Payable and Accrued Expenses
The following table summarizes the significant components of accounts payable and accrued expenses.
| | September 30, | | December 31, | |
| | 2013 | | 2012 | |
| | (In thousands) | |
Construction payables | | $ | 63,694 | | $ | 17,501 | |
Accounts payable and accrued expenses | | 53,402 | | 39,634 | |
Condominium deposits | | — | | 19,616 | |
Membership deposits | | 23,136 | | 20,248 | |
Above-market ground leases | | 2,470 | | 2,590 | |
Deferred income | | 20,956 | | 7,767 | |
Accrued interest | | 6,123 | | 2,425 | |
Accrued real estate taxes | | 8,262 | | 6,622 | |
Tenant and other deposits | | 11,891 | | 8,096 | |
Insurance reserve | | 2,087 | | 9,037 | |
Accrued payroll and other employee liabilities | | 13,035 | | 11,514 | |
Special assessment | | 2,868 | | 2,868 | |
Interest rate swaps | | 4,696 | | 7,183 | |
Other | | 11,360 | | 15,420 | |
| | $ | 223,980 | | $ | 170,521 | |
The $53.5 million increase as of September 30, 2013 compared to December 31, 2012 is primarily due to the increase of $46.2$37.8 million in construction payables, which relates to construction and renovation activities primarilyrestricted condominium cash deposits for The Shopsthe two new market rate towers at Summerlin, Ward Village and Riverwalk properties that are under development, an increase of $13.2 million in deferred income primarily due to increased landfor which we began public sales and the deferral of a portion of the income for post-sale land development obligations at our Summerlin MPC, and an increase of $13.8 million in accounts payable and accrued expenses primarily due to the accrual of $8.6 million for lease terminations. These increases were partially offset by the decrease of $19.6 million in condominium deposits as of September 30, 2013 compared to December 31, 2012 due to the sale of our condominium rights.on February 1, 2014.
26
Table of Contents
THE HOWARD HUGHES CORPORATION
NOTES TO CONDENSED CONSOLIDATED FINANCIAL STATEMENTS
UNAUDITED
Accounts Payable and Accrued Expenses
The following table summarizes the significant components of accounts payable and accrued expenses.
| | March 31, | | December 31, | |
| | 2014 | | 2013 | |
| | (In thousands) | |
Construction payables | | $ | 140,724 | | $ | 106,741 | |
Accounts payable and accrued expenses | | 37,770 | | 46,998 | |
Condominium deposits | | 50,232 | | 12,405 | |
Membership deposits | | 26,167 | | 24,830 | |
Above-market ground leases | | 2,391 | | 2,431 | |
Deferred income | | 23,893 | | 18,963 | |
Accrued interest | | 28,338 | | 17,463 | |
Accrued real estate taxes | | 4,811 | | 8,581 | |
Tenant and other deposits | | 10,374 | | 9,490 | |
Insurance reserve | | 577 | | 1,417 | |
Accrued payroll and other employee liabilities | | 7,919 | | 15,666 | |
Special assessment | | 2,603 | | 4,164 | |
Interest rate swaps | | 3,956 | | 2,603 | |
Other | | 14,336 | | 12,239 | |
| | $ | 354,091 | | $ | 283,991 | |
The $70.1 million increase as of March 31, 2014 compared to December 31, 2013 is primarily due to the increase of $37.8 million in condominium deposits for the two new market rate towers at Ward Village and a $34.0 million increase in construction payables primarily due to increased development activities at The Shops at Summerlin, The Woodlands Resort & Conference Center, Outlet Collection at Riverwalk, South Street Seaport and One Hughes Landing.
27
Table of Contents
THE HOWARD HUGHES CORPORATION
NOTES TO CONDENSED CONSOLIDATED FINANCIAL STATEMENTS
UNAUDITED
NOTE 13ACCUMULATED OTHER COMPREHENSIVE INCOME (LOSS)
The following table summarizes AOCI for the period indicated:
Changes in Accumulated Other Comprehensive Income (Loss) by Component (a)
Gains and Losses on Cash Flow Hedges
(In Thousands)For the Three Months Ended March 31, 2014
| | For the Three Months Ended
September 30, 2013 | |
| | | |
Balance as of July 1, 2013 | | $ | (7,773 | ) |
Other comprehensive income (loss) before reclassifications | | (700 | ) |
Amounts reclassified from accumulated other comprehensive income (loss) | | (6 | ) |
Net current-period other comprehensive income | | (706 | ) |
Balance as of September 30, 2013 | | $ | (8,479 | ) |
| | For the Nine Months Ended
September 30, 2013 | |
| | | |
Balance as of January 1, 2013 | | $ | (9,575 | ) |
Other comprehensive income before reclassifications | | 55 | |
Amounts reclassified from accumulated other comprehensive income (loss) | | 1,041 | |
Net current-period other comprehensive income | | 1,096 | |
Balance as of September 30, 2013 | | $ | (8,479 | ) |
| | Gains and
Losses on Cash
Flow Hedges | |
| | (In Thousands) | |
Balance as of January 1, 2014 | | $ | (8,222 | ) |
| | | |
Other comprehensive income before reclassifications | | (475 | ) |
Amounts reclassified from accumulated other comprehensive loss | | 541 | |
Net current-period other comprehensive income | | 66 | |
Balance as of March 31, 2014 | | $ | (8,156 | ) |
(a) All amounts are net of tax. Amounts in parentheses indicate debits to profit (loss).
The following table summarizes the amounts reclassified out of AOCI for the period indicated:
Reclassifications out of Accumulated Other Comprehensive Income (Loss) (a)
(In Thousands)For the period ended March 31, 2014
Accumulated Other Comprehensive
Income (Loss) Components | | | Amounts reclassified from
Accumulated Other
Comprehensive Income
(Loss) | | Affected line item in the
Statement of Operations | |
| | Amounts reclassified from Accumulated Other Comprehensive
Income (Loss) | | | | | (In Thousands) | | | |
Accumulated Other Comprehensive
Income Components | | For the Three Months Ended
September 30, 2013 | | For the Nine Months Ended
September 30, 2013 | | Affected line item in the Statement of
Operations | | |
Gains and losses on cash flow hedges | | | | | | | | | | | | |
Interest rate swap contracts | | $ | 76 | | $ | (831 | ) | Interest (expense) | | | $ | (614 | ) | Interest expense | |
| | (70 | ) | (210 | ) | Provision for income taxes | | | 73 | | Provision for income taxes | |
Total reclassifications for the period | | $ | 6 | | $ | (1,041 | ) | Net of tax | | | $ | (541 | ) | Net of tax | |
(a) Amounts in parentheses indicate debits to profit/loss.profit (loss).
27
Table of Contents
THE HOWARD HUGHES CORPORATION
NOTES TO CONDENSED CONSOLIDATED FINANCIAL STATEMENTS
UNAUDITED
NOTE 14COMMITMENTS AND CONTINGENCIES
In the normal course of business, from time to time, we are involved in legal proceedings relating to the ownership and operations of our properties. In management’s opinion, the liabilities, if any, that may ultimately result from such legal actions are not expected to have a material effect on our consolidated financial position, results of operations or liquidity.
We had outstanding letters of credit and surety bonds of $51.2$53.1 million and $49.3$58.7 million as of September 30, 2013March 31, 2014 and December 31, 2012,2013, respectively. These letters of credit and bonds were issued primarily in connection with insurance requirements, special real estate assessments and construction obligations.
On June 27, 2013, the City of New York executed the amended and restated ground lease for South Street Seaport. The restated lease terms provide for annual fixed rent of $1.2 million starting July 1, 2013 with an expiration of December 30, 2072, including our optionsoption to extend. The annual rent escalates 3.0% compounded annually. On July 1, 2048 the base rent will be adjusted to the higher of the fair market value or the then base rent. In addition to the annual base rent of $1.2 million, we are required to make annual payments of $210,000 as additional rent through the term of the lease. The additional rent escalates annually at CPI.based on the Consumer Price Index. We are entitled to a total rent credit of $1.5 million, to be taken monthly over a 30-month period beginning October 2013.period. Simultaneously with the execution of the lease, we executed a completion guaranty for the redevelopment of Pier 17. The completion guaranty requires us to perform certain obligations under the lease, including the commencement of construction by October 1, 2013 with a scheduled completion date of March 31,in 2016.
In the fourth quarter of 2012, as a result of Superstorm Sandy, the Uplands portion of South Street Seaport (area west of the FDR Drive) suffered damage due to flooding, but the Pier 17 structure was not significantly damaged. Reconstruction efforts are ongoing and the property is only partially operating. We have received $11.0 million in insurance proceeds through September 30, 2013 at South Street Seaport related to property damage of which we recognized a $3.0 million pre-tax gain during the three months ended September 30, 2013. We believe that our insurance will cover substantially all of the cost of repairing the property and will also compensate us for any revenue that has been lost as a result of the storm.
Please refer to Note 10 — Income Taxes for additional contingencies related to our uncertain tax positions.
28
Table of Contents
THE HOWARD HUGHES CORPORATION
NOTES TO CONDENSED CONSOLIDATED FINANCIAL STATEMENTS
UNAUDITED
In the fourth quarter of 2012, the Uplands portion of South Street Seaport suffered damage due to flooding as a result of Superstorm Sandy. Reconstruction efforts are ongoing and the property is only partially operating. We have received $28.3 million in insurance proceeds through March 31, 2014 at South Street Seaport related to our claim of which we have recognized $20.0 million in Other income to date, including $7.8 million during the three months ended March 31, 2014. We believe that our insurance will reimburse substantially all of the costs of repairing the property and will also compensate us for substantially all lost income resulting from the storm.
Please refer to Note 10 — Income Taxes for additional contingencies related to our uncertain tax positions.
NOTE 15SEGMENTS
We have three business segments which offer different products and services. Our three segments are managed separately because each requires different operating strategies or management expertise and are reflective of management’s operating philosophies and methods. In addition, our segments or assets within such segment could change in the future as development of certain properties commences or other operational or management changes occur. We do not distinguish or group our combined operations on a geographic basis. Furthermore, all operations are within the United States and no customer or tenant comprises more than 10% of revenues. Our reportable segments are as follows:
· Master Planned Communities (“MPCs”) — includes the development and sale of land in large-scale, long-term community development projects in and around Las Vegas, Nevada; Houston, Texas; and Columbia, Maryland.
· Operating Assets — includes retail, office and industrial properties, a multi-family property, The Woodlands Resort and& Conference Center and other real estate investments. These assets are currently generating revenues, and we believe there is an opportunity to redevelop or reposition many of these assets to improve operating performance.
· Strategic Developments — includes all properties held for development or redevelopment which have no substantial operations.
29
Table of Contents
THE HOWARD HUGHES CORPORATION
NOTES TO CONDENSED CONSOLIDATED FINANCIAL STATEMENTS
UNAUDITED
The assets included in each segment as of September 30, 2013,March 31, 2014, are contained in the following chart:
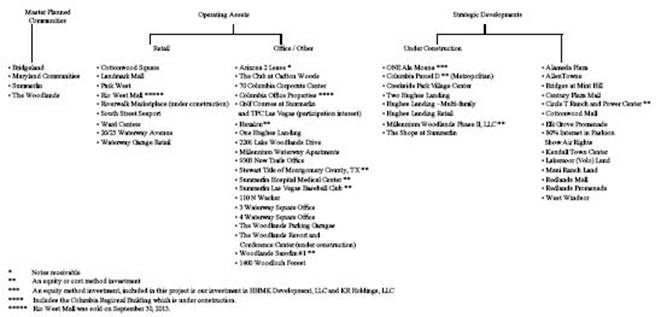
Master Planned | | Operating Assets | | Strategic Developments |
Communities | | | | | |
| | | | | | | | | |
| | Retail | Office / Other | Under Construction | | |
· Bridgeland | · Cottonwood Square | · Arizona 2 Lease * | · Creekside Village Green | · Alameda Plaza |
· Maryland Communities | · Landmark Mall | · 70 Columbia Corporate Center | · ExxonMobil Build-to-Suit | · AllenTowne |
· Summerlin | · Park West | · Columbia Office Properties **** | · Hughes Landing Retail | · Bridges at Mint Hill |
· The Woodlands | · Outlet Collection at Riverwalk | · Golf Courses at Summerlin | · Millennium Woodlands Phase II, LLC ** | · Century Plaza Mall |
| · South Street Seaport | and TPC Las Vegas (participation interest) | · ONE Ala Moana *** | · Circle T Ranch and Power Center ** |
| · Ward Village | · 2201 Lake Woodlands Drive | · One Lake’s Edge | · Cottonwood Mall |
| · 20/25 Waterway Avenue | · Millennium Waterway Apartments | · The Metropolitan Downtown | · Elk Grove Promenade |
| · Waterway Garage Retail | · 9303 New Trails Office | Columbia Project ** | · 80% Interest in Fashion |
| | · 110 N Wacker | · 3831 Technology Forest Drive | Show Air Rights |
| | · One Hughes Landing | · The Shops at Summerlin | · Kendall Town Center |
| | · Stewart Title of Montgomery County, TX ** | · Two Hughes Landing | · Lakemoor (Volo) Land |
| | · Summerlin Hospital Medical Center ** | | · Maui Ranch Land |
| | · Summerlin Las Vegas Baseball Club ** | | · Parcel C ** |
| | · The Club at Carlton Woods | | · Redlands Mall |
| | · The Woodlands Resort & | | · Summerlin Apartments, LLC ** |
| | Conference Center (under construction) | | · West Windsor |
| | · Woodlands Sarofim #1 ** | | |
| | · 1400 Woodloch Forest | | |
| | · Waterway Square Garage | | |
| | · 3 Waterway Square Office | | |
| | · 4 Waterway Square Office | | |
| | | | | | | | | | | |
* | Notes receivable. |
** | An equity or cost method investment. |
*** | Asset consists of two equity method investments. |
**** | Includes the Columbia Regional Building which is under construction. |
As our segments are managed separately, different operating measures are utilized to assess operating results and allocate resources among the segments. The one common operating measure used to assess operating results for the business segments is Real Estate Property Earnings Before Taxes (“REP EBT”), which represents the operating revenues of the properties less property operating expenses and adjustments for interest, as further described below. We believe REP EBT provides useful information about the operating performance for all of our properties.
29
Table of Contents
THE HOWARD HUGHES CORPORATION
NOTES TO CONDENSED CONSOLIDATED FINANCIAL STATEMENTS
UNAUDITED
REP EBT, as it relates to our business, is defined as net income (loss) excluding general and administrative expenses, other income, corporate interest income, corporate interest and depreciation expense, provision for income taxes, warrant liability gain (loss)loss and the increase (reduction)reduction in tax indemnity receivable. We present REP EBT because we use this measure, among others, internally to assess the operating performance of our assets. We also present this measure because we believe certain investors use it as a measure of a company’s historical operating performance and its ability to service and incur debt. We believe that the inclusion of certain adjustments to net income (loss) to calculate REP EBT is appropriate to provide additional information to investors.
30
Table of Contents
THE HOWARD HUGHES CORPORATION
NOTES TO CONDENSED CONSOLIDATED FINANCIAL STATEMENTS
UNAUDITED
Segment operating results are as follows:
| | Three Months Ended September 30, | | Nine Months Ended September 30, | |
| | 2013 | | 2012 | | 2013 | | 2012 | |
| | (In thousands) | | (In thousands) | |
Master Planned Communities | | | | | | | | | |
Land sales | | $ | 53,734 | | $ | 40,218 | | $ | 166,981 | | $ | 120,235 | |
Builder price participation | | 2,002 | | 1,867 | | 5,703 | | 4,208 | |
Minimum rents | | 196 | | 130 | | 585 | | 384 | |
Other land revenues | | 3,579 | | 6,385 | | 10,211 | | 13,401 | |
Other rental and property revenues | | — | | (7 | ) | — | | 28 | |
Total revenues | | 59,511 | | 48,593 | | 183,480 | | 138,256 | |
| | | | | | | | | |
Cost of sales - land | | 27,063 | | 21,439 | | 82,616 | | 63,096 | |
Land sales operations | | 7,393 | | 8,209 | | 22,705 | | 25,382 | |
Land sales real estate and business taxes | | 2,370 | | 1,751 | | 5,348 | | 5,533 | |
Depreciation and amortization | | 10 | | 64 | | 25 | | 67 | |
Interest income | | — | | (49 | ) | (16 | ) | (179 | ) |
Interest expense (*) | | (3,689 | ) | (3,638 | ) | (13,295 | ) | (10,709 | ) |
Total expenses | | 33,147 | | 27,776 | | 97,383 | | 83,190 | |
MPC EBT | | 26,364 | | 20,817 | | 86,097 | | 55,066 | |
| | | | | | | | | |
Operating Assets | | | | | | | | | |
Minimum rents | | 21,160 | | 22,788 | | 59,427 | | 61,532 | |
Tenant recoveries | | 5,254 | | 6,030 | | 15,547 | | 17,817 | |
Resort and conference center revenues | | 8,169 | | 8,328 | | 30,543 | | 29,954 | |
Other rental and property revenues | | 4,493 | | 4,342 | | 14,538 | | 15,307 | |
Total revenues | | 39,076 | | 41,488 | | 120,055 | | 124,610 | |
| | | | | | | | | |
Other property operating costs | | 18,688 | | 14,853 | | 50,205 | | 43,274 | |
Rental property real estate taxes | | 3,148 | | 2,934 | | 9,054 | | 8,160 | |
Rental property maintenance costs | | 1,906 | | 2,126 | | 5,594 | | 5,851 | |
Resort and conference center operations | | 7,381 | | 6,965 | | 22,537 | | 21,750 | |
Provision for doubtful accounts | | 201 | | 237 | | 907 | | 386 | |
Depreciation and amortization | | 9,171 | | 6,440 | | 21,687 | | 16,969 | |
Interest income | | (32 | ) | (48 | ) | (122 | ) | (134 | ) |
Interest expense | | 4,017 | | 4,313 | | 14,715 | | 11,373 | |
Equity in Earnings from Real Estate Affiliates | | (647 | ) | (310 | ) | (3,743 | ) | (3,432 | ) |
Total expenses | | 43,833 | | 37,510 | | 120,834 | | 104,197 | |
Operating Assets EBT | | (4,757 | ) | 3,978 | | (779 | ) | 20,413 | |
| | | | | | | | | |
Strategic Developments | | | | | | | | | |
Minimum rents | | 182 | | 217 | | 586 | | 693 | |
Tenant recoveries | | 38 | | 35 | | 135 | | 115 | |
Condominium rights and unit sales | | 810 | | — | | 31,191 | | 267 | |
Other land revenues | | 3,899 | | — | | 3,899 | | 32 | |
Other rental and property revenues | | (2 | ) | 4,482 | | 1,311 | | 4,544 | |
Total revenues | | 4,927 | | 4,734 | | 37,122 | | 5,651 | |
| | | | | | | | | |
Condominium rights and unit cost of sales | | 406 | | (24 | ) | 15,678 | | 143 | |
Other property operating costs | | 3,940 | | 2,080 | | 5,277 | | 3,032 | |
Real estate taxes | | 549 | | 640 | | 1,759 | | 2,423 | |
Rental property maintenance costs | | 142 | | 137 | | 402 | | 453 | |
Provision for doubtful accounts | | 3 | | 3 | | 3 | | (101 | ) |
Demolition costs | | 1,386 | | — | | 1,386 | | — | |
Depreciation and amortization | | 48 | | 56 | | 139 | | 173 | |
Interest expense * | | (401 | ) | (193 | ) | (1,363 | ) | 61 | |
Equity in Earnings from Real Estate Affiliates | | (2,947 | ) | — | | (8,291 | ) | — | |
Total expenses | | 3,126 | | 2,699 | | 14,990 | | 6,184 | |
Strategic Developments EBT | | 1,801 | | 2,035 | | 22,132 | | (533 | ) |
| | | | | | | | | |
REP EBT | | $ | 23,408 | | $ | 26,830 | | $ | 107,450 | | $ | 74,946 | |
(*) Negative interest expense amounts relate to interest capitalized on debt assigned to our Operating Assets Segments.
| | Three Months Ended March 31, | |
| | 2014 | | 2013 | |
| | (In thousands) | |
Master Planned Communities | | | | | |
Land sales | | $ | 47,671 | | $ | 47,226 | |
Builder price participation | | 4,097 | | 1,275 | |
Minimum rents | | 197 | | 195 | |
Other land revenues | | 2,504 | | 2,802 | |
Other rental and property revenues | | 67 | | — | |
Total revenues | | 54,536 | | 51,498 | |
| | | | | |
Cost of sales - land | | 23,078 | | 25,699 | |
Land sales operations | | 7,304 | | 6,953 | |
Land sales real estate and business taxes | | 1,954 | | 1,543 | |
Depreciation and amortization | | 100 | | 7 | |
Interest income | | (57 | ) | (15 | ) |
Interest expense (*) | | (5,066 | ) | (5,960 | ) |
Total expenses | | 27,313 | | 28,227 | |
MPC EBT | | 27,223 | | 23,271 | |
| | | | | |
Operating Assets | | | | | |
Minimum rents | | 19,900 | | 18,511 | |
Tenant recoveries | | 5,884 | | 5,252 | |
Resort and conference center revenues | | 9,426 | | 11,104 | |
Other rental and property revenues | | 5,110 | | 3,433 | |
Total revenues | | 40,320 | | 38,300 | |
| | | | | |
Other property operating costs | | 15,260 | | 14,965 | |
Rental property real estate taxes | | 3,107 | | 2,983 | |
Rental property maintenance costs | | 1,800 | | 1,656 | |
Resort and conference center operations | | 7,511 | | 7,476 | |
Provision for doubtful accounts | | 143 | | 429 | |
Demolition costs | | 2,494 | | — | |
Depreciation and amortization | | 9,010 | | 6,118 | |
Interest income | | (119 | ) | (46 | ) |
Interest expense | | 2,044 | | 6,805 | |
Equity in Earnings from Real Estate and Other Affiliates | | (1,805 | ) | (2,733 | ) |
Total expenses | | 39,445 | | 37,653 | |
Operating Assets EBT | | 875 | | 647 | |
| | | | | |
Strategic Developments | | | | | |
Minimum rents | | 263 | | 220 | |
Tenant recoveries | | 131 | | 73 | |
Condominium rights and unit sales | | 3,126 | | — | |
Other land revenues | | 8 | | — | |
Other rental and property revenues | | 269 | | — | |
Total revenues | | 3,797 | | 293 | |
| | | | | |
Condominium rights and unit cost of sales | | 1,571 | | — | |
Other property operating costs | | 2,771 | | 555 | |
Real estate taxes | | 633 | | 774 | |
Rental property maintenance costs | | 115 | | 149 | |
Provision for doubtful accounts | | — | | — | |
Demolition costs | | 22 | | — | |
Depreciation and amortization | | 424 | | 43 | |
Other income | | (2,373 | ) | — | |
Interest expense (*) | | (2,649 | ) | (287 | ) |
Equity in Earnings from Real Estate and Other Affiliates | | (4,263 | ) | — | |
Total expenses | | (3,749 | ) | 1,234 | |
Strategic Developments EBT | | 7,546 | | (941 | ) |
REP EBT | | $ | 35,644 | | $ | 22,977 | |
31
Table of Contents
THE HOWARD HUGHES CORPORATION
NOTES TO CONDENSED CONSOLIDATED FINANCIAL STATEMENTS
UNAUDITED
The following reconciles REP EBT to GAAP-basis net income (loss):
Reconciliation of REP EBT to GAAP-net | | Three Months Ended September 30, | | Nine Months Ended September 30, | | | Three Months Ended March 31, | |
income (loss) | | 2013 | | 2012 | | 2013 | | 2012 | | | 2014 | | 2013 | |
| | (In thousands) | | | (In thousands) | |
| | | | | | | | | | | | | | |
REP EBT | | $ | 23,408 | | $ | 26,830 | | $ | 107,450 | | $ | 74,946 | | | $ | 35,644 | | $ | 22,977 | |
General and administrative | | (11,914 | ) | (11,464 | ) | (34,310 | ) | (28,021 | ) | | (16,882 | ) | (11,171 | ) |
Corporate interest income, net | | 1,955 | | 2,315 | | 6,259 | | 6,814 | | |
Corporate interest (expense)/income, net | | | (10,980 | ) | 2,710 | |
Warrant liability loss | | (4,479 | ) | (64,303 | ) | (148,706 | ) | (162,724 | ) | | (96,440 | ) | (33,027 | ) |
Provision for income taxes | | (5,172 | ) | (2,618 | ) | (21,012 | ) | (7,703 | ) | | (4,773 | ) | (2,479 | ) |
Increase (reduction) in tax indemnity receivable | | 730 | | (2,873 | ) | (8,673 | ) | (11,655 | ) | |
Reduction in tax indemnity receivable | | | — | | (1,904 | ) |
Other income | | 3,662 | | 2,125 | | 8,118 | | 2,125 | | | 8,075 | | — | |
Corporate depreciation | | (757 | ) | (204 | ) | (1,359 | ) | (506 | ) | | (975 | ) | (276 | ) |
Net income (loss) | | $ | 7,433 | | $ | (50,192 | ) | $ | (92,233 | ) | $ | (126,724 | ) | |
Net loss | | | $ | (86,331 | ) | $ | (23,170 | ) |
The following reconciles segment revenue to GAAP-basis consolidated revenues:
Reconciliation of Segment Basis Revenues to | | Three Months Ended September 30, | | Nine Months Ended September 30, | | | Three Months Ended March 31, | |
GAAP Revenues | | 2013 | | 2012 | | 2013 | | 2012 | | | 2014 | | 2013 | |
| | (In thousands) | | | (In thousands) | |
| | | | | | | | | | | | | | |
Master Planned Communities | | $ | 59,511 | | $ | 48,593 | | $ | 183,480 | | $ | 138,256 | | | $ | 54,536 | | $ | 51,498 | |
Operating Assets | | | 39,076 | | | 41,488 | | | 120,055 | | | 124,610 | | | 40,320 | | 38,300 | |
Strategic Developments | | | 4,927 | | | 4,734 | | | 37,122 | | | 5,651 | | | 3,797 | | 293 | |
Total revenues | | $ | 103,514 | | $ | 94,815 | | $ | 340,657 | | $ | 268,517 | | | $ | 98,653 | | $ | 90,091 | |
The assets by segment and the reconciliation of total segment assets to the total assets in the Condensed Consolidated Balance Sheets are summarized as follows:
| | September 30, | | December 31, | | | March 31, | | December 31, | |
| | 2013 | | 2012 | | | 2014 | | 2013 | |
| | (In thousands ) | | | (In thousands) | |
Master Planned Communities | | $ | 1,792,635 | | $ | 1,756,625 | | | $ | 1,749,030 | | $ | 1,760,639 | |
Operating Assets (a) | | 1,130,601 | | 944,562 | | | 1,170,079 | | 1,158,337 | |
Strategic Developments | | 296,295 | | 288,287 | | | 658,317 | | 462,525 | |
Total segment assets | | 3,219,531 | | 2,989,474 | | | 3,577,426 | | 3,381,501 | |
Corporate and other (b) | | 499,699 | | 513,568 | | | 1,122,315 | | 1,186,367 | |
Total assets | | $ | 3,719,230 | | $ | 3,503,042 | | | $ | 4,699,741 | | $ | 4,567,868 | |
(a)Certain assets included in our Operating AssetAssets segment are in various stages of redevelopment and are included in Developments on our Condensed Consolidated Balance Sheets.
(b)Assets included in Corporate and other consist primarily of Cash and cash equivalents and the Tax Indemnity receivable, including interest, and Cash and cash equivalents.
The increase in the Operating Assets segment’s asset balance as of September 30, 2013 of $186.0 million as compared to December 31, 2012 is primarily due to $61.8 million of total assets from 3 Waterway Square and $37.8 million of total assets from One Hughes Landing being reclassified from the Strategic Developments segment because they were placed in service. We also invested approximately $85.6 million related to development activities in our Operating Assets segment.accrued interest.
32
Table of Contents
THE HOWARD HUGHES CORPORATION
NOTES TO CONDENSED CONSOLIDATED FINANCIAL STATEMENTS
UNAUDITED
A portion of the tax indemnification asset in the amount of $185.7 million was incorrectly included in the Operating Assets segment at December 31, 2013 rather than the Corporate segment. The amounts in the table above at December 31, 2013 have been corrected to appropriately include the entire tax indemnification asset of $320.5 million in the Corporate segment.
The increase in the Strategic Developments segment’s asset balance as of March 31, 2014 of $195.8 million compared to December 31, 2013 is primarily due to $37.8 million of deposits collected on the sale of condominium units for both our market rate towers at Ward Village, $18.0 million in buildings and equipment from the completion of the transformation of the IBM building at Ward Village into an information center and sales gallery and development and other costs of $72.8 million for The Shops at Summerlin, $10.0 million for Hughes Landing multi-family and $16.7 million for Ward Village.
NOTE 16 SUBSEQUENT EVENTS
On October 2, 2013,April 15, 2014, we issued $750.0paid $17.0 million cash in aggregate principal amountfull satisfaction of 6.875% Senior Notesthe $16.0 million loan that we assumed as part of the acquisition of 70 Columbia Corporate Center (“70 CCC”) in August 2012. The non-recourse, interest only promissory note was due 2021 (the “Senior Notes”).to mature on August 31, 2017, and included a participation right to the lender for 30% of the appreciation in the market value of the property after our 10% cumulative preferred return and repayment of the outstanding debt and our contributed equity. The final payment included approximately $0.7 million of this participation right based upon $28.0 million appraised value for the property. We intend to use the net proceedsseek long-term mortgage financing for development, acquisitions and other general corporate purposes. Interest is payable semiannually, on April 1 and October 1 of each year starting in April 2014. At any time prior to October 1, 2016, we may redeem up to 35% of the Notes using the proceeds from equity offerings or we may redeem some or all of the Notes at a price equal to 106.875% of the principal amount. We may redeem all or part of the Notes at any time on or after October 1, 2016 with a declining call premium there after to maturity. The Notes contain customary terms and covenants for non-investment grade senior notes and have no maintenance covenants.
On October 4, 2013, we entered into a joint venture agreement with Kettler, Inc., to construct a 437 unit, Class A apartment building with 31,000 square feet of ground floor retail on Parcel C in downtown Columbia, MD. We contributed approximately five acres of land having an estimated book value of $4.0 million to the joint venture. The transaction values our land at $23.4 million or $53,500 per constructed unit. When the venture closes on the construction loan and upon completion of certain other conditions, including obtaining completed site development and construction plans and an approved project budget, our partner will be required to contribute cash to the venture.
On October 24, 2013, we closed on a $64.4 million partial recourse construction loan for The Outlet at Riverwalk. The loan bears interest at one-month LIBOR plus 2.75%, with an initial maturity date of October 24, 2016 with two one-year extension options.
On October 30, 2013, we sold our interest in Head Acquisition, LP (“Head”), a cost basis investment, for net cash proceeds of $13.3 million resulting in a gain of approximately $8.5 million, which will be recognized in the fourth quarter of 2013. Our investment in Head had previously been impaired resulting in a significant book/tax difference and the recognition of a deferred tax asset of $76.4 million, which had been fully reserved due to the uncertainty around our ability to recognize the tax benefit in future periods. Due to the sale of our interest in Head Acquisition, LP and certain tax planning strategies that are now in place, we may release some or all of the valuation allowance in the fourth quarter 2013.this asset.
33
Table of Contents
ITEM 2. MANAGEMENT’S DISCUSSION AND ANALYSIS OF FINANCIAL CONDITION AND RESULTS OF OPERATIONS
The following discussion should be read in conjunction with the Condensed Consolidated Financial Statements and related Notes. All references to numbered Notes are to specific notes to our Condensed Consolidated Financial Statements included in this Quarterly Report.
Forward-looking information
We may make forward-looking statements in this Quarterly Report and in other reports that we file with the SEC. In addition, our management may make forward-looking statements orally to analysts, investors, creditors, the media and others.
Forward-looking statements include:
· projections of our revenues, operating income, net income, earnings per share, REP EBT, capital expenditures, income tax, other contingent liabilities, dividends, leverage, capital structure or other financial items;
· forecasts of our future economic performance; and
· descriptions of assumptions underlying or relating to any of the foregoing.
In this Quarterly Report, for example, we make forward-looking statements discussing our expectations about:
· capital required for our operations and development opportunities for the properties in our Operating Assets and Strategic Developments segments;
· expected performances of our Master Planned Communities segment and other current income producing properties; and
· future liquidity, development opportunities, development spending and management plans.
Forward-looking statements discuss matters that are not historical facts. Because they discuss future events or conditions, forward-looking statements often include words such as “anticipate,” “believe,” “can,” “could,” “estimate,” “expect,” “forecast,” “intend,” “may,” “likely,” “plan,” “project,” “realize,” “should,” “target,” “would,” and other words of similar expressions. Forward-looking statements should not be unduly relied upon. They give our expectations about the future and are not guarantees.
There are several factors, many beyond our control, which could cause results to differ materially from our expectations. These risk factors are described in our Annual Report on Form 10-K for the year ended December 31, 20122013 (the “Annual Report”) and are incorporated herein by reference. Any factor could, by itself, or together with one or more other factors, adversely affect our business, results of operations or financial condition. There may also be other factors that we have not described in this Quarterly Report or in our Annual Report that could cause results to differ from our expectations. These forward-looking statements present our estimates and assumptions only as of the date of this Quarterly Report. Except as may be required by law, we undertake no obligation to modify or revise any forward-looking statements to reflect events or circumstances occurring after the date of this Quarterly Report.
Real Estate Property Earnings Before Taxes
We use a number of operating measures for assessing operating performance of our communities, assets, properties and projects within our segments, some of which may not be common among all three of our segments. We believe that investors may find some operating measures more useful than others when separately evaluating each segment. One common operating measure used to assess operating results for our business segments is Real Estate Property Earnings Before Taxes (“REP EBT”). We believe REP EBT provides useful information about our operating performance because it excludes certain non-recurring and non-cash items which we believe are not indicative of our core business.
34
Table of Contents
REP EBT, as it relates to our business, is defined as net income (loss) excluding general and administrative expenses, corporate interest income, corporate interest and depreciation expense, provision for income taxes, warrant liability gain (loss), other income and the increase (reduction)changes in tax indemnity receivable. We present REP EBT because
34
Table of Contents
we use this measure, among others, internally to assess the core operating performance of our assets. We also present this measure because we believe certain investors use it as a measure of a company’s historical operating performance and its ability to service existing and incurobtain additional debt. We believe that the inclusion of certain adjustments to net income (loss) to calculate REP EBT is appropriate to provide additional information to investors. A reconciliation of REP EBT to consolidated net income (loss) as computed in accordance with GAAP has been presented in Note 15 — Segments.
REP EBT should not be considered as an alternative to GAAP net income (loss) attributable to common stockholders or GAAP net income (loss), as it has limitations as an analytical tool, and should not be considered in isolation, or as a substitute for analysis of our results as reported under GAAP. Some of the limitations of this metric are that it:it does not include the following:
· does not include our cash expenditures, or future requirements for capital expenditures or contractual commitments;
· does not include corporate general and administrative expenses;
· does not include interest expense on our corporate debt;
· does not include income taxes that we may be required to pay;
· does not include any cash requirements for replacement of depreciated or amortized assets or take into account that these assets have different useful lives; and
· does not include limitations on, or costs related to, transferring earnings from our Real Estate Affiliates to us; and
·may be calculated differently by other companies in our industry, limiting its usefulness as a comparative measure.us.
Operating Assets Net Operating Income
We believe that net operating income (“NOI”) is a useful supplemental measure of the performance of our Operating Assets because it provides a performance measure that, when compared year over year, reflects the revenues and expenses directly associated with owning and operating real estate properties and the impact on operations from trends in rental and occupancy rates and operating costs. We define NOI as revenues (rental income, tenant recoveries and other income) less expenses (real estate taxes, repairs and maintenance, marketing and other property expenses). NOI also excludes straight line rents and amortization of tenant incentives amortization, net interest expense, ground rent, anddemolition costs, amortization, depreciation and other amortization expenses and equity in earnings from Real Estate Affiliates. We use NOI to evaluate our operating performance on a property-by-property basis because NOI allows us to evaluate the impact that factors such as lease structure, lease rates and tenant base, which vary by property, have on our operating results, gross margins and investment returns.
Although we believe that NOI provides useful information to the investors about the performance of our Operating Assets, due to the exclusions noted above, NOI should only be used as an alternative measure of the financial performance of such assets and not as an alternative to GAAP net income (loss). For reference, and as an aid in understanding our computation of NOI, a reconciliation of NOI to REP EBT has been presented in the Operating Assets segment discussion below.
Results of Operations
Consolidated revenues for the three and nine months ended September 30, 2013March 31, 2014 increased $8.7$8.6 million and $72.1 million, respectively, compared to the corresponding periodssame period in 2012,2013, primarily due to higher revenues in our MPCs and Strategic Developments segments. MPC segment land salebuilder price participation revenues increased $13.5 million and $46.7$2.8 million for the three and nine months ended September 30, 2013, respectively,March 31, 2014 compared to the corresponding periodssame period in 2012,2013, due to the higherincreased demand for our residential superpad siteshome sales at higher prices in Summerlin and finished lotshigher home sales prices in The Woodlands. Strategic Developments revenue increased $0.2 million and $31.5$3.5 million for the three and nine months ended September 30, 2013, respectively,March 31, 2014 compared to the corresponding periodssame period in 2012,2013, due to the recognition during the first quarter of 2014 of deferred revenue from the sale of our ONE Ala Moana condominium air rights into a 50/50 joint venture in the second quarter.quarter 2013.
The net incomeloss attributable to common stockholders was $7.3$86.3 million, or $0.17 earnings$2.19 loss per diluted share, for the three months ended September 30, 2013 asMarch 31, 2014 compared to a net loss attributable to common stockholders of $49.4$23.1 million, or $0.59 loss per diluted share, for the same period in 2013. The $63.2 million higher net loss for the three months ended March 31, 2014 compared to the same period in 2013 was primarily due to a warrant liability loss of $96.4 million for the three months ended March 31, 2014 compared to a warrant liability loss of $33.0 million for the same period in 2013, higher corporate net interest expense of $13.7 million and general and administrative expenses of $5.7 million offset by other income of $7.8 million from South Street Seaport insurance proceeds and higher earnings of $8.5 million and $4.0 million from the Strategic Development and MPC segments, respectively.
35
Table of Contents
million, or $1.30 loss per diluted share, for the corresponding period in 2012. The $56.7 million higher net income for the three months ended September 30, 2013 as compared to the same period in 2012 was primarily due to a warrant liability loss of $4.5 million for the three months ended September 30, 2013 compared to a warrant liability loss of $64.3 million for the corresponding period in 2012.
The net loss attributable to common stockholders was $92.3 million, or $2.34 loss per diluted share, for the nine months ended September 30, 2013 as compared to a net loss attributable to common stockholders of $127.4 million, or $3.36 loss per diluted share, for the corresponding period in 2012. The $35.0 million decrease in net loss for 2013 as compared to 2012 was primarily due to higher earnings from our MPC segment of $31.0 million, higher earnings from our Strategic Developments segment of $22.7 million, and lower warrant liability loss of $14.0 million, offset by lower earnings in our Operating Assets segment of $21.2 million and higher income tax expense of $13.3 million. The lower earnings in our Operating Assets segment was mainly due to increased interest expense of $3.3 million, increased depreciation and amortization of $4.7 million, increased other property operating costs of $6.9 million, and decreased revenues of $4.6 million. Please refer to the individual segment operations sections and the general and administrative section for explanations of these variances.
Segment Operations
Please refer to Note 15 - Segments for additional information including reconciliations of our segment basis results to generally accepted accounting principles (“GAAP”) basis results.
Master Planned Communities Segment
MPC revenues vary between periods based on economic conditions and several factors such as, but not limited to, location, availability of land for sale, development density and commercialresidential or residentialcommercial use. Although our business does not involve the sale or resale of homes, we believe that net new home sales are an important indicator of future demand for our padssuperpad sites and lots; therefore, we use this statistic in the discussion of our MPCs below. Net new home sales reflect home sales made by home builders, less cancelations. Cancelations occur when a home buyer signs a contract to purchase a home, but later fails to qualify for a home mortgage or is unable to provide an adequate down payment to complete the home sale. Reported results may differ significantly from actual cash flows generated principally because cost of sales for GAAP purposes is derived from margins calculated using carrying values, projected future improvements and other capitalized project costs in relation to projected future land sale revenues. Carrying values, generally, represent acquisition and development costs, less adjustmentadjustments for previous impairment charges. Development expenditures are capitalized and generally not reflected in the Condensed Consolidated Statements of Operations in the current year.
36
Table of Contents
MPC sales for the three months ended SeptemberMarch 30, 20132014 and 20122013 is summarized as follows:
| | MPC Sales Summary | | | MPC Sales Summary | |
| | Land Sales | | Acres Sold | | Number of Lots/Units | | Price per Acre | | Price per Lot/Units | | | Land Sales | | Acres Sold | | Number of Lots/Units | | Price per Acre | | Price per Lot/Units | |
| | Three Months Ended September 30, | | | Three Months Ended March 31, | |
($ in thousands) | | 2013 | | 2012 | | 2013 | | 2012 | | 2013 | | 2012 | | 2013 | | 2012 | | 2013 | | 2012 | | | 2014 | | 2013 | | 2014 | | 2013 | | 2014 | | 2013 | | 2014 | | 2013 | | 2014 | | 2013 | |
| | | | | | | | | | | | | | | | | | | | | | | | | | | | | | | | | | | | | | | | | | |
Columbia | | | | | | | | | | | | | | | | | | | | | | | | | | | | | | | | | | | | | | | | | | |
Commercial | | | | | | | | | | | | | | | | | | | | | | |
Multi-family | | $ | — | | $ | 5,300 | | — | | 18.7 | | — | | — | | $ | — | | $ | 283 | | $ | — | | $ | — | | |
No land sales | | | | | | | | | | | | | | | | | | | | | | |
| | | | | | | | | | | | | | | | | | | | | | | | | | | | | | | | | | | | | | | | | | |
Bridgeland | | | | | | | | | | | | | | | | | | | | | | | | | | | | | | | | | | | | | | | | | | |
Residential | | | | | | | | | | | | | | | | | | | | | | | | | | | | | | | | | | | | | | | | | | |
Single family - detached | | 1,761 | | 6,170 | | 6.0 | | 22.2 | | 29.0 | | 104.0 | | 294 | | 278 | | 61 | | 59 | | | $ | 136 | | $ | 3,589 | | 0.5 | | 12.0 | | 3 | | 52 | | $ | 272 | | $ | 299 | | $ | 45 | | $ | 69 | |
Commercial | | | | | | | | | | | | | | | | | | | | | | |
Multi-family | | 2,636 | | — | | 16.6 | | — | | — | | — | | 159 | | — | | — | | — | | |
| | 4,397 | | 6,170 | | 22.6 | | 22.2 | | 29.0 | | 104.0 | | 195 | | 278 | | 61 | | 59 | | |
| | | | | | | | | | | | | | | | | | | | | | | | | | | | | | | | | | | | | | | | | | |
Summerlin | | | | | | | | | | | | | | | | | | | | | | | | | | | | | | | | | | | | | | | | | | |
Residential | | | | | | | | | | | | | | | | | | | | | | | | | | | | | | | | | | | | | | | | | | |
Superpad sites | | | 16,281 | | 21,075 | | 31.3 | | 89.4 | | 121 | | 401 | | 520 | | 236 | | 135 | | 53 | |
Custom lots | | | 5,036 | | 1,007 | | 3.8 | | 1.2 | | 8 | | 2 | | 1,325 | | 839 | | 630 | | 504 | |
Single family - detached | | 1,661 | | 3,524 | | 2.1 | | 5.1 | | 20.0 | | 41.0 | | 791 | | 691 | | 83 | | 86 | | | 4,800 | | 6,099 | | 6.9 | | 8.4 | | 25 | | 63 | | 696 | | 726 | | 192 | | 97 | |
Custom lots | | 1,698 | | 515 | | 1.9 | | 0.6 | | 5.0 | | 1.0 | | 894 | | 858 | | 340 | | 515 | | |
Superpad sites | | 26,340 | | 3,689 | | 72.5 | | 16.0 | | 316.0 | | 53.0 | | 363 | | 231 | | 83 | | 70 | | |
Commercial | | | | | | | | | | | | | | | | | | | | | | |
Not-for-profit | | | 2,250 | | — | | 10.0 | | — | | — | | — | | 225 | | — | | — | | — | |
| | 29,699 | | 7,728 | | 76.5 | | 21.7 | | 341.0 | | 95.0 | | 388 | | 356 | | 87 | | 81 | | | 28,367 | | 28,181 | | 52.0 | | 99.0 | | 154 | | 466 | | 546 | | 285 | | 170 | | 60 | |
| | | | | | | | | | | | | | | | | | | | | | | | | | | | | | | | | | | | | | | | | | |
The Woodlands | | | | | | | | | | | | | | | | | | | | | | | | | | | | | | | | | | | | | | | | | | |
Residential | | | | | | | | | | | | | | | | | | | | | | | | | | | | | | | | | | | | | | | | | | |
Single family - detached | | 18,098 | | 19,898 | | 27.5 | | 52.3 | | 117.0 | | 235.0 | | 658 | | 380 | | 155 | | 85 | | | 17,271 | | 12,231 | | 23.8 | | 25.2 | | 83 | | 112 | | 726 | | 485 | | 208 | | 109 | |
Single family - attached | | 1,225 | | — | | 1.8 | | — | | 21.0 | | — | | 681 | | — | | 58 | | — | | | 938 | | 702 | | 1.4 | | 1.7 | | 14 | | 18 | | 670 | | 413 | | 67 | | 39 | |
Commercial | | | | | | | | | | | | | | | | | | | | | | |
Retail | | 1,500 | | — | | 2.1 | | — | | — | | — | | 714 | | — | | — | | — | | |
Office and other | | — | | 1,330 | | — | | 2.8 | | — | | — | | — | | 475 | | — | | — | | |
| | 20,823 | | 21,228 | | 31.4 | | 55.1 | | 138.0 | | 235.0 | | 663 | | 385 | | 140 | | 85 | | | 18,209 | | 12,933 | | 25.2 | | 26.9 | | 97 | | 130 | | 723 | | 481 | | 188 | | 99 | |
Total acreage sales revenue | | 54,919 | | 40,426 | | 130.5 | | 117.7 | | 508.0 | | 434.0 | | | | | | | | | | | 46,712 | | 44,703 | | 77.7 | | 137.9 | | 254 | | 648 | | | | | | | | | |
| | | | | | | | | | | | | | | | | | | | | | |
Deferred revenue | | (6,791 | ) | (1,051 | ) | | | | | | | | | | | | | | | | | |
Special Improvement District revenue | | 5,606 | | 843 | | | | | | | | | | | | | | | | | | |
Deferred revenue* | | | (1,658 | ) | (1,604 | ) | | | | | | | | | | | | | | | | |
Special Improvement District revenue* | | | 2,617 | | 4,127 | | | | | | | | | | | | | | | | | |
Total land sales revenue - GAAP basis | | $ | 53,734 | | $ | 40,218 | | | | | | | | | | | | | | | | | | | $ | 47,671 | | $ | 47,226 | | | | | | | | | | | | | | | | | |
|
* Applicable exclusively to Summerlin
37
Table of Contents
MPC sales for the nine months ended September 30, 2013 and 2012 is summarized as follows:
| | MPC Sales Summary | |
| | Land Sales | | Acres Sold | | Number of Lots/Units | | Price per Acre | | Price per Lot/Units | |
| | Nine Months Ended September 30, | |
($ in thousands) | | 2013 | | 2012 | | 2013 | | 2012 | | 2013 | | 2012 | | 2013 | | 2012 | | 2013 | | 2012 | |
| | | | | | | | | | | | | | | | | | | | | |
Columbia | | | | | | | | | | | | | | | | | | | | | |
Residential | | | | | | | | | | | | | | | | | | | | | |
Townhomes | | $ | — | | $ | 4,156 | | — | | 1.2 | | — | | 28.0 | | $ | — | | $ | 3,463 | | $ | — | | $ | 148 | |
Commercial | | | | | | | | | | | | | | | | | | | | | |
Multi-family | | — | | 5,300 | | — | | 18.7 | | — | | — | | — | | 283 | | — | | — | |
| | — | | 9,456 | | — | | 19.9 | | — | | 28.0 | | — | | 475 | | — | | 148 | |
| | | | | | | | | | | | | | | | | | | | | |
Bridgeland | | | | | | | | | | | | | | | | | | | | | |
Residential | | | | | | | | | | | | | | | | | | | | | |
Single family - detached | | 7,219 | | 17,183 | | 24.0 | | 63.9 | | 109.0 | | 313.0 | | 301 | | 269 | | 66 | | 55 | |
Commercial | | | | | | | | | | | | | | | | | | | | | |
Multi-family | | 2,636 | | — | | 16.6 | | — | | — | | — | | 159 | | — | | — | | — | |
| | 9,855 | | 17,183 | | 40.6 | | 63.9 | | 109.0 | | 313.0 | | 243 | | 269 | | 66 | | 55 | |
| | | | | | | | | | | | | | | | | | | | | |
Summerlin | | | | | | | | | | | | | | | | | | | | | |
Residential | | | | | | | | | | | | | | | | | | | | | |
Single family - detached | | 9,846 | | 11,268 | | 13.2 | | 16.4 | | 108.0 | | 121.0 | | 746 | | 687 | | 91 | | 93 | |
Custom lots | | 4,438 | | 3,761 | | 4.8 | | 4.8 | | 11.0 | | 9.0 | | 925 | | 784 | | 403 | | 418 | |
Superpad sites | | 67,849 | | 12,505 | | 215.5 | | 55.3 | | 989.0 | | 232.0 | | 315 | | 226 | | 69 | | 54 | |
Commercial | | | | | | | | | | | | | | | | | | | | | |
Retail | | — | | 784 | | — | | 1.0 | | — | | — | | — | | 784 | | — | | — | |
| | 82,133 | | 28,318 | | 233.5 | | 77.5 | | 1,108.0 | | 362.0 | | 352 | | 365 | | 74 | | 76 | |
| | | | | | | | | | | | | | | | | | | | | |
The Woodlands | | | | | | | | | | | | | | | | | | | | | |
Residential | | | | | | | | | | | | | | | | | | | | | |
Single family - detached | | 70,910 | | 55,459 | | 118.1 | | 151.0 | | 470.0 | | 598.0 | | 600 | | 367 | | 151 | | 93 | |
Single family - attached | | 2,799 | | — | | 5.6 | | — | | 61.0 | | — | | 500 | | — | | 46 | | — | |
Commercial | | | | | | | | | | | | | | | | | | | | | |
Retail | | 1,500 | | 6,437 | | 2.1 | | 10.4 | | — | | — | | 714 | | 619 | | — | | — | |
Office and other | | — | | 1,250 | | — | | 1.2 | | — | | — | | — | | 1,042 | | — | | — | |
Other | | 135 | | 50 | | 0.7 | | 0.8 | | — | | — | | 193 | | 63 | | — | | — | |
| | 75,344 | | 63,196 | | 126.5 | | 163.4 | | 531.0 | | 598.0 | | 596 | | 387 | | 139 | | 93 | |
Total acreage sales revenue | | 167,332 | | 118,153 | | 400.6 | | 324.7 | | 1,748.0 | | 1,301.0 | | | | | | | | | |
Deferred revenue | | (14,450 | ) | (1,870 | ) | | | | | | | | | | | | | | | | |
Special Improvement District revenue | | 14,099 | | 3,952 | | | | | | | | | | | | | | | | | |
Total land sales revenue - GAAP basis | | $ | 166,981 | | $ | 120,235 | | | | | | | | | | | | | | | | | |
| | | | | | | | | | | | | | | | | | | | | | | | | | | |
38
Table of Contents
MPC segment land sales, increased 33.6%, or $13.5 million, to $53.7 million for the three months ended September 30, 2013, and increased 38.9%, or $46.7 million, to $167.0 million for the nine months ended September 30, 2013, as compared to $40.2 million and $120.2 million for the same periods in 2012. Land sales for the three months ending September 30, 2013, including Special Improvement District (“SID”) transfers and reimbursements and deferred revenue adjustments, increased 0.9%, or $0.4 million, to $47.7 million for the three months ended March 31, 2014 compared to $47.2 million for the same period in 2013. Land sales increased 40.8%, or $5.3 million, to $18.2 million at Summerlin and The Woodlands by 71.6%for the three months ended March 31, 2014 compared to $49.3 million, partiallythe same period in 2013, offset by a decrease of $7.1 million in land sales of $3.5 million and $1.4 million at Bridgeland and Columbia. Land sales forSummerlin, respectively, compared to the nine months ended September 30, 2013, including SID assumptions and reimbursements and deferred revenue, increased at Summerlin and The Woodlands by 67.9% to $157.1 million, partially offset by a decrease of $16.8 millionsame period in land sales at Bridgeland and Columbia.2013. The increase in residential land sales at The Woodlands is primarily due to strong economic conditions and homebuilder demand for superpad siteslots at Summerlin andprices that are approximately 89.9% higher in the improved averagefirst quarter of 2014 compared to the same period in 2013. Bridgeland lot sales price due to a competitive residential lot bid process.
The single family detached average lot price for our combined MPC’s increased 71.8%, or $56,757 to $135,778 forwere lower in the three months ended September 30, 2013, and increased 57.2%, or $48,179 to $132,397 for the nine months ended September 30, 2013,first quarter of 2014 as compared to $79,021the same period in 2013 as a result of a lack of lot inventory because we could not develop lots in 2013 pending receipt of a wetlands permit. On February 27, 2014, we received the wetlands permit and $84,218expect to begin delivering new finished lots by mid-2014. Summerlin’s land sales revenues remained relatively unchanged for the first quarter of 2014 compared to the same periodsperiod in 2012.2013 as a result of per acre pricing that is 91.6% higher, due primarily to low lot inventory levels in the Las Vegas market, offset by lower acreage sold in the first quarter 2014 compared to the first quarter 2013.
For large MPCs such as ours, sales prices on a per lot basis and per acre basis generally increase as the size of the developed lot grows. This is because smaller lots are more commodity-like and larger lots may have more unique features. TheAdditionally, the average homebuyer finds more competition for new and resale homes on the lower end of the price range in the broader residential market. As lot sizes and prices increase, the number of potential customers and developers decreases. Barring a softening in market conditions, when a MPC reaches the level whereby land is scarce, pricing begins to escalate on a per lot and per acre basis due to a scarcity premium resulting from the market’smarket's realization that new home site inventory will be depleted.
The Woodlands and Bridgeland MPCs
The Woodlands land sales decreased 1.9%increased $5.3 million, or $0.4 million40.8% to $20.8 million and increased 19.2% or $12.1 million to $75.3$18.2 million for the three and nine months ended September 30, 2013, respectively,March 31, 2014 compared to $21.2 million and $63.2$12.9 million for the corresponding periodssame period in 2012.2013. The increase was due to the increase in the average lot bid process introduced inprice as there were fewer acres sold during the first quarter 2014 compared to the first quarter 2013. The average price per acre at The Woodlands increased 50.3%, or $242,000 to $723,000 for the three months ended March 31, 2014 compared to $481,000 for the same period in August 2012 resulted2013. The average lot price increased 89.9%, or $89,000, to $188,000 for the three months ended March 31, 2014 compared to $99,000 for the same period in increased revenues of $13.42013.
Bridgeland’s land sales decreased $3.5 million to $0.1 million for the ninethree months ending September 30, 2013ended March 31, 2014 compared to $3.6 million for the same period in 2013. The decrease in lot sales revenues for the three months ended March 31, 2014, compared to the same period in 2012. The 49.7% increase in average lot price to $139,000 in 2013 from $93,000 in 2012 is primarily due to the competitive bid process begun in August 2012 and the scarcity of remaining available residential land in The Woodlands.
From August 2012 through September 30, 2013, The Woodlands sold 1,062 residential lots through a competitive bid process. Of these lots, 674 have closed as of September 30, 2013, providing total revenues of $59.0 million for the nine months ended September 30, 2013 and $38.5 million in 2012. Another 103 lots are expected to close in the fourth quarter of 2013 providing an estimated $18.8 million of revenues. The remaining 285 lots are expected to close in 2014 and 2015 providing an estimated $51.7 million of revenues.
Bridgeland’s land sales decreased $1.8 million to $4.4 million and decreased $7.3 million to $9.9 million for the three and nine months ended September 30, 2013, respectively compared to land sales of $6.2 million and $17.2 million for the corresponding periods in 2012. The decrease in lot sales revenues in both the three and nine months ended September 30, 2013, as compared to the same periods in 2012, relates primarily to the availabilitylack of finished lot inventory. Bridgeland’s finished lot inventory levels are lowis expected to increase significantly during 2014 due to pending permitsreceiving the wetlands permit as discussed above. We recently received bids from homebuilders for the U.S. Army Corpssale of Engineers (“USACE”). We are pursuing a wetland permit from509 lots at an average price of $90,000 per lot, or approximately 17.4% higher than the USACE to build on 806 acresaverage finished lot prices during 2013, of land. Bridgeland had 13 lots in inventory as of September 30, 2013 and expects to add 32which we currently expect 448 lots to inventory during the fourth quarter of 2013. These lots will be offered for saleclose in a bid process during the fourth quarter 2013 with anticipated closing by the end of this year. Land sales for the three and nine months ended September 30, 2013 include a $2.6 million sale of a commercial parcel.2014.
The average price per residential acre at Bridgeland increased 5.6%, or $16,000 to $294,000 per acre forWe expect the three months ended September 30, 2013, and 11.9%, or $32,000 to $301,000 for the nine months ended September 30, 2013 as
39
Tablecompletion of Contents
compared to $278,000 and $269,000 per acre, respectively, for the same periods in 2012. The average lot price for the nine months ended September 30, 2013 increased to $66,000 as compared to $55,000 in the same period of 2012. This 20.6% increase resulted from increases in lot pricing during 2013 and more sales of higher-end lots.
The Houston, Texas area continues to benefit from a strong energy sector. Additionally, we expect the construction of the Grand Parkway to positively impact the surrounding areas. The Grand Parkway is an approximate 180-mile circumferential highway traversing seven counties and encircling the Greater Houston region. ConstructionThe new 385-acre ExxonMobil campus is located just south of segment E, which bisects Bridgeland, (from IH 10The Woodlands and is in close proximity to US 290) of the Grand Parkway shouldParkway. The segment connecting Bridgeland to I-45 near the ExxonMobil campus is expected to be completed by late 2013 or early 2014, and segments F1 (from US 290 to SH 249) and F2 (from SH 249 to IH 45) are scheduled for completion in early 2015. Completion of these segments will have a positive impact on travel patterns for residents living in The Woodlands and Bridgeland. The groundbreaking for segments F1 and F2 was in July 2013. In addition, the Grand Parkway was instrumental in ExxonMobil’s decision to relocate and construct a large corporateExxonMobil campus on a 385-acre site just south of The Woodlands. The site is expected to include approximately 20 buildings, representing three million square feet of space, and we believe it is one of the largest construction projects currently under way in the U.S.United States. Additionally, ExxonMobil expects to beginbegan relocating employees to thisits new location starting in earlyMarch 2014 and ending inwill continue with relocation continuing into 2015. Upon completion of the relocation, ExxonMobil expects approximately 10,000 employees will workbe employed at the new campus. The direct and indirect jobs related to this relocation are positively impacting The Woodlands and Bridgeland due to increased housing demand, as well as commercial space needs for companies servicing ExxonMobil.
As more fully discussed in the Strategic Developments segment, ExxonMobil has pre-leased 478,000 square feet in two Class A office buildings currently under construction at Hughes Landing in The Woodlands.
38
Table of Contents
Summerlin MPC
Summerlin’s land sales revenue increased 284.3%$0.2 million, or $22.0 million0.7% to $29.7$28.4 million for the three months ended September 30, 2013, and increased 190.0% or $53.8 millionMarch 31, 2014 compared to $82.1$28.2 million for the nine months ended September 30,same period in 2013, compared to $7.7 millioncomprised of a 120.3% increase in average price per superpad acre sold and $28.3 million for the corresponding periods in 2012. These increases were primarily47.5% lower acreage volume. First quarter 2014 volume decreased due to significantly higher salestiming of superpad sitesthe development and delivery of parcels for sale. Homebuilder demand for land in termsSummerlin remains strong, and our strategy is to manage the development and delivery of volume and price per acre.parcels for sale to increase the long-term value of the project. Superpad sites are typically approximatelygenerally 20 to 25 acre parcels of unimproved land where we develop and construct the major utilities (water, sewer and drainage) and roads to the borders of the parcel and the homebuilder completes the on-site utilities, roads and finished lots. The average price per superpad acre for superpads increased 57.1%, or $132,000,$284,000 to $363,000$520,000 for the third quarter 2013 and 39.4%, or $89,000,three months ended March 31, 2014 compared to $315,000$236,000 for the nine months ended September 30, 2013 when compared to the same periodsperiod in 2012.2013. The increase ofin average price per acre is primarily due to a scarcity of attractive developable residential land in the Las Vegas market and improvingthe continued strong growth in demand for new housing demand.housing.
Builder andSummerlin had 109 new home sales activity continuesfor the three months ended March 31, 2014, representing a 31.9% decrease compared to improve in Summerlin with 153the 160 new home sales duringfor the third quartersame period in 2013. This decrease is the result of 2013, representing a 19.5% increasetemporary lack of moderately priced homes available in Summerlin, as compared to the 128 new home sales in the third quarter of 2012. Inventory levels for both the new home segment and the resale market continue to decline, resulting in improved home pricing, which we believe will translate to higher per acre land prices in the future. The totalwell as a limited number of properties listed for sale has declined 12.6% during the past yearproduct choices. Homebuilders in the Las Vegas market. AsSummerlin are currently working to bring several new home prices increase, we also earn higher price participation fees from the homebuilders, and the value of our land inventory also increases. Furthermore, as more fully discussed in our Strategic Developments segment, we are constructing the 1.6 million square foot Summerlin Downtown mixed-use development on 106 acres in Summerlin. We believe that this destination for shopping and entertainment will further increase residential sales and pricing when completed in the fourth quarter of 2014. As of September 30, 2013, Summerlin had 377 residential lots under contract of which 225 lots are scheduled to close in 2013, providing an estimated $23.9 million of revenues. The remaining 152 lots are scheduled to closeneighborhoods online in 2014 that will greatly increase the range of product choices and 2015, providing an estimated $29.1 million of revenues.
40
Table of Contentsprice points available to homebuyers.
Total revenues and expenses for the MPC segment are summarized as follows:
Master Planned Communities Revenues and Expenses (*)
| | Three Months Ended September 30, | | Nine Months Ended September 30, | | |
| | 2013 | | 2012 | | 2013 | | 2012 | | | Three Months Ended March 31, | |
| | (In thousands) | | (In thousands) | | | 2014 | | 2013 | |
| | | | | | | | | | | (In thousands) | |
Land sales | | $ | 53,734 | | $ | 40,218 | | $ | 166,981 | | $ | 120,235 | | | $ | 47,671 | | $ | 47,226 | |
Builder price participation | | 2,002 | | 1,867 | | 5,703 | | 4,208 | | | 4,097 | | 1,275 | |
Other land revenues and minimum rents | | 3,775 | | 6,508 | | 10,796 | | 13,813 | | | 2,768 | | 2,997 | |
Total revenues | | 59,511 | | 48,593 | | 183,480 | | 138,256 | | | 54,536 | | 51,498 | |
| | | | | | | | | | | | | | |
Cost of sales - land | | 27,063 | | 21,439 | | 82,616 | | 63,096 | | | 23,078 | | 25,699 | |
Land sales operations | | 9,763 | | 9,960 | | 28,053 | | 30,915 | | | 9,258 | | 8,496 | |
Depreciation and amortization | | 10 | | 64 | | 25 | | 67 | | | 100 | | 7 | |
Interest expense, net | | (3,689 | ) | (3,687 | ) | (13,311 | ) | (10,888 | ) | | (5,123 | ) | (5,975 | ) |
Total expenses | | 33,147 | | 27,776 | | 97,383 | | 83,190 | | | 27,313 | | 28,227 | |
MPC REP EBT | | $ | 26,364 | | $ | 20,817 | | $ | 86,097 | | $ | 55,066 | | | $ | 27,223 | | $ | 23,271 | |
(*) For a detailed breakdown of our MPC segment EBT, please refer to Note 15 - Segments of our Condensed Consolidated Financial Statements.
Builder price participation represents the contractual amount we collect from builder home salesbuilders when the home sellshomes they have constructed sell for greater than an agreed upon sales priceamount when the land was sold to the builder.them. Builder price participation increased $0.1 million and $1.5$2.8 million for the three and nine months ended September 30, 2013, respectively, asMarch 31, 2014 compared to the same periodsperiod in 2012,2013, primarily due to increasedmore home closings at higher prices at Summerlin and The Woodlands.
OtherCost of sales - land revenues decreased $2.7 million and $3.0$2.6 million for the three months and nine months ended September 30, 2013, respectively, as compared to the three and nine months ended September 30, 2012. The primary reason for the decreases were land use modification fees collected in 2012 that were not repeated in 2013 and the termination of a contract in June 2012 that provided easement fee revenues in The Woodlands.
Cost of sales - land increased $5.6 million and $19.5 million for the three and nine months ended September 30, 2013, respectively, asMarch 31, 2014 compared to the same periodsperiod in 2012,2013, primarily due to higher land sales revenueincreased margins at Summerlin as a result of achieving higher per-acre prices on all superpads sold, and higher margins at The Woodlands.Woodlands as a result of the new competitive bid process that began in 2012. Our total land sales gross margins, which include builder price participation, increased to 51.4% and 52.2%55.4% for the three and nine months ended September 30, 2013, respectively, asMarch 31, 2014 compared to 49.1% and 49.3%, respectively,47.0% for the same periodsperiod in 2012. Gross margins2013. The increase in gross margin relates primarily to higher lot prices at bothThe Woodlands and Summerlin and The Woodlands increased in 2013 due to significant increases in the average lothigher builder price for superpad sites at Summerlin and the significant increase in the average lot priceparticipation.
39
Table of single family lots at The Woodlands.Contents
Land sales operations expenses were flatincreased $0.8 million for the three months ended September 30, 2013 and decreased $2.9 million for the nine months ended September 30, 2013, asMarch 31, 2014 compared to the same periodsperiod in 2012.2013. The majority of this decrease relatesincrease is attributable to reduced advertising and marketing costs, commissions, closing costs, sale incentives and real estate taxes. There were fewer commercial land saleshigher legal fees in the third quarter of 2013, which resulted in lower commissions and selling expenses. In addition, advertising and marketing expenses were lower as a result of co-branding The Woodlands and Bridgeland.higher real estate taxes in The Woodlands and Summerlin due to retail lot prices increasing.
Interest expense, net reflects the amount of interest from other segments that is capitalized at the project level. The $2.4 million increaseprimary reason for the nine$0.9 million decrease for the three months ended September 30, 2013, asMarch 31, 2014, compared to the same period in 2012,2013 is due to the transfer of land from the MPC segment to the Strategic Developments segment related to the higher qualified asset base and higher consolidated company debt levels which resultedour internally developed projects resulting in increased capitalized interest.a lower basis for interest capitalization.
In addition to REP EBT for the MPCs, we believe that certain investors measure the value of the assets in this segment based on their contribution to liquidity and capital available for investment. MPC Net Contribution is defined as MPC REP EBT, plus MPC cost of sales and depreciation and amortization reduced by MPC development and acquisition expenditures. Although MPC Net Contribution can be computed from GAAP elements of income and cash flows, it is not a GAAP-based operational metric and should not be used to measure operating performance of the MPC assets as a substitute for GAAP measures of such performance. A reconciliation of REP EBT to
41
Table of Contents
consolidated net income (loss) as computed in accordance with GAAP has been presented in Note 15 - Segments. The following table sets forth the MPC Net Contribution for the three and nine months ended September 30, 2013March 31, 2014 and 2012.2013. MPC Net Contribution is defined as MPC REP EBT, plus MPC cost of sales and depreciation and amortization reduced by MPC development and acquisition expenditures.
| | Three Months Ended September 30, | | Nine Months Ended September 30, | | | Three Months Ended March 31, | |
| | 2013 | | 2012 | | 2013 | | 2012 | | | 2014 | | 2013 | |
| | (In thousands) | | (In thousands) | | | (In thousands) | |
MPC REP EBT (*) | | $ | 26,364 | | $ | 20,817 | | $ | 86,097 | | $ | 55,066 | | | $ | 27,223 | | $ | 23,271 | |
Plus: | | | | | | | | | | | | | | |
Cost of sales - land | | 27,063 | | 21,439 | | 82,616 | | 63,096 | | | 23,078 | | 25,699 | |
Depreciation and amortization | | 10 | | 64 | | 25 | | 67 | | | 100 | | 7 | |
Less: | | | | | | | | | | | | | | |
MPC land/residential development and acquisitions expenditures | | 33,244 | | 25,506 | | 100,728 | | 72,741 | | | 28,434 | | 33,329 | |
MPC Net Contribution | | $ | 20,193 | | $ | 16,814 | | $ | 68,010 | | $ | 45,488 | | | $ | 21,967 | | $ | 15,648 | |
(*) For a detailed breakdown of our MPC segment EBT, please refer to Note 15 - Segments of our Condensed Consolidated Financial Statements.
The MPC Net Contribution increased by $3.4 million and $22.5$6.3 million for the three and nine months ended September 30, 2013, respectively, asMarch 31, 2014 compared to the same periodsperiod in 2012.2013. The increase in MPC Net Contribution was primarily attributable to increased land saleshigher builder price participation revenues at Summerlin and The Woodlands, and SID transfers andas well as a reduction in net development costs due to increased MUD reimbursements at Summerlin, partially offset by increased development expenditures at Bridgeland, Summerlin and The Woodlands. MPC land and residential development expenditures consist primarily of land development costs, such as water, sewer, drainage and paving.Woodlands in the first quarter 2014 compared to the first quarter 2013.
4240
Table of Contents
Operating Assets Segment
OperatingThese assets typically generate rental revenues sufficient to cover their operating costs except when a substantial portion, or all, of the property is being redeveloped or vacated for development. Variances between years in NOInet operating income typically result from changes in rental rates, occupancy, tenant mix and operating expenses. The table below shows NOI for our Operating Assets. We view NOI as an important measure of the operating performance of our Operating Assets. Beginning in the first quarter 2014, we reclassified certain retail Operating Assets that are substantially shutdown due to redevelopment-related construction activities underway to the Redevelopments section in the table below.
Operating Assets NOI and REP EBT
| | Three Months Ended September 30, | | Nine Months Ended September 30, | | |
| | 2013 | | 2012 | | 2013 | | 2012 | | | Three Months Ended March 31, | |
| | (In thousands) | | | 2014 | | 2013 | |
| | | | | | | | | | | (In thousands) | |
Retail | | | | | | | | | | | | | | |
Cottonwood Square | | $ | 83 | | $ | 97 | | $ | 326 | | $ | 320 | | | $ | 153 | | $ | 100 | |
Landmark Mall (a) | | 21 | | 153 | | 415 | | 662 | | | 549 | | 143 | |
Park West | | 406 | | 251 | | 970 | | 739 | | | 564 | | 283 | |
Rio West Mall (b) | | 213 | | 265 | | 851 | | 995 | | |
Riverwalk Marketplace (c) | | (35 | ) | 94 | | (806 | ) | 573 | | |
South Street Seaport (c) | | (3,501 | ) | 1,878 | | (6,938 | ) | 4,085 | | |
Ward Centers | | 6,006 | | 5,616 | | 17,868 | | 16,735 | | |
20/25 Waterway Avenue (d) | | 365 | | 407 | | 955 | | 1,242 | | |
Ward Village (b) | | | 5,629 | | 5,979 | |
20/25 Waterway Avenue | | | 421 | | 314 | |
Waterway Garage Retail | | 137 | | (8 | ) | 208 | | 2 | | | 168 | | (13 | ) |
Total Retail | | 3,695 | | 8,753 | | 13,849 | | 25,353 | | | 7,484 | | 6,806 | |
Office | | | | | | | | | | | | | | |
70 Columbia Corporate Center | | | 144 | | 52 | |
Columbia Office Properties (c) | | | 88 | | 392 | |
2201 Lake Woodlands Drive | | | (33 | ) | 42 | |
One Hughes Landing (d) | | | 469 | | — | |
9303 New Trails | | | 467 | | 477 | |
110 N. Wacker | | 1,512 | | 1,517 | | 4,516 | | 4,554 | | | 1,520 | | 1,496 | |
1400 Woodloch Forest (e) | | 245 | | 440 | | 914 | | 1,202 | | |
Columbia Office Properties | | 202 | | 593 | | 865 | | 1,698 | | |
70 Columbia Corporate Center (f) | | 233 | | (8 | ) | 376 | | (8 | ) | |
2201 Lake Woodlands Drive | | (43 | ) | 23 | | (74 | ) | 21 | | |
4 Waterway Square | | 1,494 | | 1,478 | | 4,467 | | 4,140 | | | 1,441 | | 1,601 | |
9303 New Trails | | 387 | | 475 | | 1,316 | | 1,435 | | |
3 Waterway Square (g) | | 514 | | — | | 585 | | — | | |
One Hughes Landing (g) | | (106 | ) | — | | (106 | ) | — | | |
3 Waterway Square (d) | | | 1,567 | | — | |
1400 Woodloch Forest | | | 240 | | 382 | |
Total Office | | 4,438 | | 4,518 | | 12,859 | | 13,042 | | | 5,903 | | 4,442 | |
| | | | | | | | | | | | | | |
Millennium Waterway Apartments (h) | | 1,029 | | 1,147 | | 3,406 | | 1,407 | | |
The Woodlands Resort and Conference Center | | 788 | | 1,363 | | 8,006 | | 8,205 | | |
Total Retail, Office, Multi-family, Resort and Conference Center | | 9,950 | | 15,781 | | 38,120 | | 48,007 | | |
Millennium Waterway Apartments | | | 1,060 | | 1,196 | |
The Woodlands Resort & Conference Center (e) | | | 1,915 | | 3,628 | |
Total Retail, Office, Multi-family, Resort & Conference Center | | | 16,362 | | 16,072 | |
| | | | | | | | | | | | | | |
The Club at Carlton Woods (i) | | (2,505 | ) | (1,081 | ) | (4,120 | ) | (3,383 | ) | |
The Club at Carlton Woods (f) | | | (1,213 | ) | (1,118 | ) |
The Woodlands Ground leases | | | 110 | | 103 | |
The Woodlands Parking Garages | | (152 | ) | (236 | ) | (556 | ) | (729 | ) | | (179 | ) | (164 | ) |
The Woodlands Ground Leases | | 111 | | 98 | | 335 | | 289 | | |
Other Properties | | (54 | ) | 260 | | (185 | ) | 1,037 | | | 280 | | (64 | ) |
Total Other | | (2,600 | ) | (959 | ) | (4,526 | ) | (2,786 | ) | | (1,002 | ) | (1,243 | ) |
Operating Assets NOI - Consolidated and Owned as of March 31, 2014 | | | 15,360 | | 14,829 | |
| | | | | | |
Redevelopments | | | | | | |
Outlet Collection at Riverwalk | | | (252 | ) | (433 | ) |
South Street Seaport (g) | | | (2,222 | ) | (1,661 | ) |
Total Operating Asset Redevelopments | | | (2,474 | ) | (2,094 | ) |
| | | | | | |
Dispositions | | | | | | |
Rio West Mall (h) | | | 49 | | 346 | |
Total Operating Asset Dispositions | | | 49 | | 346 | |
Total Operating Assets NOI - Consolidated | | 7,350 | | 14,822 | | 33,594 | | 45,221 | | | 12,935 | | 13,081 | |
| | | | | | | | | | | | | | |
Straight-line lease and incentives amortization | | 780 | | (449 | ) | 1,047 | | (32 | ) | |
Straight-line lease amortization | | | (436 | ) | (177 | ) |
Demolition costs | | | (2,494 | ) | — | |
Depreciation and amortization | | (9,171 | ) | (6,440 | ) | (21,687 | ) | (16,969 | ) | | (9,010 | ) | (6,118 | ) |
Write-off of lease intangibles and other | | (378 | ) | — | | (2,883 | ) | — | | | — | | (2,113 | ) |
Equity in earnings from Real Estate Affiliates | | 647 | | 310 | | 3,743 | | 3,432 | | | 1,805 | | 2,733 | |
Interest expense, net | | (3,985 | ) | (4,265 | ) | (14,593 | ) | (11,239 | ) | |
Total Operating Assets REP EBT (j) | | $ | (4,757 | ) | $ | 3,978 | | $ | (779 | ) | $ | 20,413 | | |
Interest, net | | | (1,925 | ) | (6,759 | ) |
Total Operating Assets REP EBT (i) | | | $ | 875 | | $ | 647 | |
4341
Table of Contents
| | Three Months Ended September 30, | | Nine Months Ended September 30, | |
| | 2013 | | 2012 | | 2013 | | 2012 | |
| | (In thousands) | | (In thousands) | |
| | | | | | | | | |
Operating Assets NOI - Equity and Cost Method Investments | | | | | | | | | |
Forest View/Timbermill Apartments (k) | | $ | — | | $ | (25 | ) | $ | — | | $ | 557 | |
Millennium Waterway Apartments (h) | | — | | — | | — | | 1,768 | |
Summerlin Baseball Club Member, LLC | | 165 | | — | | 165 | | — | |
Stewart Title | | 782 | | 665 | | 1,848 | | 1,333 | |
Woodlands Sarofim # 1 | | 376 | | 61 | | 1,025 | | 537 | |
Total NOI - equity investees | | 1,323 | | 701 | | 3,038 | | 4,195 | |
| | | | | | | | | |
Adjustments to NOI (l) | | 98 | | (22 | ) | 29 | | (1,473 | ) |
Equity Method Investments REP EBT | | 1,421 | | 679 | | 3,067 | | 2,722 | |
Less: Joint Venture Partner’s Share of REP EBT | | (774 | ) | (369 | ) | (1,827 | ) | (1,666 | ) |
Equity in earnings from Real Estate Affiliates | | 647 | | 310 | | 1,240 | | 1,056 | |
| | | | | | | | | |
Distributions from Summerlin Hospital Investment | | — | | — | | 2,503 | | 2,376 | |
Segment equity in earnings from Real Estate Affiliates | | $ | 647 | | $ | 310 | | $ | 3,743 | | $ | 3,432 | |
| | | | | | | | | |
Company’s Share of Equity Method Investments NOI | | | | | | | | | |
Millennium Waterway Apartments (h) | | $ | — | | $ | — | | $ | — | | $ | 1,477 | |
Woodlands Sarofim # 1 | | 75 | | 12 | | 205 | | 107 | |
Stewart Title | | 391 | | 333 | | 924 | | 667 | |
Summerlin Las Vegas Baseball Club | | 83 | | — | | 83 | | — | |
Forest View/Timbermill Apartments (k) | | — | | (13 | ) | — | | 279 | |
Total NOI - equity investees | | $ | 549 | | $ | 332 | | $ | 1,212 | | $ | 2,530 | |
| | Three Months Ended March 31, | |
| | 2014 | | 2013 | |
| | (In thousands) | |
Operating Assets NOI - Equity and Cost Method Investments | | | | | |
Stewart Title (title company) | | $ | 198 | | $ | 399 | |
Summerlin Baseball Club Member, LLC | | (247 | ) | — | |
Woodlands Sarofim # 1 | | 401 | | 317 | |
Total NOI - equity investees | | 352 | | 716 | |
| | | | | |
Adjustments to NOI (j) | | (31 | ) | (33 | ) |
Equity Method Investments REP EBT | | 321 | | 683 | |
Less: Joint Venture Partner’s Share of REP EBT | | (297 | ) | (453 | ) |
Equity in earnings from Real Estate and Other Affiliates | | 24 | | 230 | |
| | | | | |
Distributions from Summerlin Hospital Investment (k) | | 1,781 | | 2,503 | |
Segment equity in earnings from Real Estate and Other Affiliates | | $ | 1,805 | | $ | 2,733 | |
| | | | | |
Company’s Share of Equity Method Investments NOI | | | | | |
Stewart Title (title company) | | $ | 99 | | $ | 200 | |
Summerlin Baseball Club Member, LLC | | (124 | ) | — | |
Woodlands Sarofim # 1 | | 80 | | 63 | |
Total NOI - equity investees | | $ | 55 | | $ | 263 | |
Company’s Share of Equity Method Investments Debt and Cash
| | Economic | | September 30, 2013 | | | Economic | | March 31, 2014 | |
| | Ownership | | Debt | | Cash | | | Ownership | | Debt | | Cash | |
| | | | (In thousands) | | | | | (In thousands) | |
Stewart Title (title company) | | | 50.00 | % | $ | — | | $ | 653 | |
Summerlin Las Vegas Baseball Club | | | 50.00 | % | — | | 566 | |
Woodlands Sarofim #1 | | | 20.00 | % | 6,470 | | 588 | |
| | | | | | | | | | | | | | | | |
Woodlands Sarofim #1 | | 20.00 | % | 1,324 | | 153 | | |
Stewart Title | | 50.00 | % | — | | 409 | | |
Summerlin Las Vegas Baseball Club | | 50.00 | % | — | | 365 | | |
(a)The NOI increase for Landmark Mall for the three months ended March 31, 2014 compared to 2013 is due to a favorable property tax settlement with the City of Alexandria for $0.7 million, offset by reduced rental rates on tenant renewals as a result of the upcoming redevelopment. (b)The NOI decrease for Ward Village for the three months ended March 31, 2014 compared to 2013 was primarily attributable to additional utility costs at the property. (c)The NOI decrease for Columbia Office Properties for the three months ended March 31, 2014 compared to 2013 is due to relocation of a major tenant to 70 Columbia Corporate Center in addition to increased utilities and snow removal due to the extreme winter weather. (d)Both One Hughes Landing and 3 Waterway Square were placed in service during mid-2013. Please refer to the discussion in the section following the table. (e)The NOI decrease for The Woodlands Resort & Conference Center for the three months ended March 31, 2014 compared to 2013 is due to lower occupied room nights and lower banquet and catering revenues resulting from the ongoing renovation project. (f)During the first quarter 2014 and 2013 the Club at Carlton Woods collected $1.1 million and $0.9 million, respectively, of membership deposits not included in NOI because they are not recognized as revenue when collected, but are recognized over the expected life of the membership which is estimated to be a 12-year period. (g)The NOI decrease for South Street Seaport for the three months ended March 31, 2014 compared to 2013 is due to the continued redevelopment of this property. During the first quarter 2014, SEE/CHANGE-related expenses were approximately $1.1 million. Please refer to the discussion in the section following the table. (h)Rio West Mall was sold on September 30, 2013. (i)For a detailed breakdown of our Operating Asset segment REP EBT, please refer to Note 15 - Segments in the Condensed Consolidated Financial Statements. (j)Adjustments to NOI include straight-line and market lease amortization, depreciation and amortization and non-real estate taxes. (k)The lower distribution from Summerlin Hospital Investment in the first quarter 2014 compared to the same period in 2013 is primarily attributable to the hospital’s revenue being down due to a higher mix of uninsured patients in 2014 compared to 2013. | Occupancy down to 77.6% as of September 30, 2013 compared to 90.6% as of September 30, 2012 due to the upcoming redevelopment.
|
(b)
| Rio West Mall was sold on September 30, 2013.
|
(c)
| Property is in redevelopment as of September 30, 2013; see discussion in section following the table.
|
(d)
| The NOI decrease for the three and nine months ended September 30, 2013, as compared to 2012 was primarily attributable to a vacancy resulting from a tenant lease termination. We executed a new lease for a replacement tenant who took possession of the space in July 2013.
|
(e)
| The NOI decrease for the three and nine months ended September 30, 2013 as compared to 2012 was primatily related to the planned relocation of one tenant moving to 3 Waterway Square in June 2013. Approximately 70% of the square footage vacated by the tenant remains vacant as of September 30, 2013.
|
(f)
| 70 Columbia Corporate Center was acquired on August 15, 2012; see discussion in section following the table for more information.
|
(g)
| Property was placed in service during 2013; see discussion in section following the table.
|
(h)
| On May 31, 2012, we acquired our partner’s interest in the 393-unit Millennium Waterway Apartments. NOI for periods prior to June 1, 2012 is reported in the Operating Assets NOI - Equity and Cost Method Investment table.
|
(i)
| See discussion in section following the table.
|
(j)
| For a detailed breakdown of our Operating Asset segment REP EBT, please refer to Note 15 - Segments in the Condensed Consolidated Financial Statements.
|
(k)
| On April 19, 2012, the joint ventures owning the Forest View and Timbermill Apartments completed their sale to a third party. Our share of the distributable cash after repayment of debt and transaction expenses was $8.6 million.
|
(l)
| Adjustments to NOI include straight-line and market lease amortization, depreciation and amortization and non-real estate taxes.
|
4442
Table of Contents
Reconciliation of Operating Assets Segment Equity in Earnings
| | Three Months Ended September 30, | | Nine Months Ended September 30, | |
| | 2013 | | 2012 | | 2013 | | 2012 | |
| | (In thousands) | |
Equity Method investments: | | | | | | | | | |
Forest View/Timbermill Apartments | | $ | — | | $ | — | | $ | — | | $ | 4 | |
Millennium Waterway Apartments | | — | | — | | — | | 406 | |
Summerlin Baseball Club Member, LLC | | 220 | | — | | 220 | | — | |
Stewart Title | | 382 | | 324 | | 899 | | 640 | |
Woodlands Sarofim #1 | | 45 | | (14 | ) | 121 | | 6 | |
| | 647 | | 310 | | 1,240 | | 1,056 | |
Cost basis investments and dividends | | — | | — | | 2,503 | | 2,376 | |
Operating Assets segment Equity in Earnings from Real Estate Affiliates | | 647 | | 310 | | 3,743 | | 3,432 | |
Strategic Developments segment Equity in Earnings from Real Estate Affiliates | | 2,947 | | — | | 8,291 | | — | |
Equity in Earnings from Real Estate Affiliates | | $ | 3,594 | | $ | 310 | | $ | 12,034 | | $ | 3,432 | |
| | Three Months Ended March 31, | |
(In thousands) | | 2014 | | 2013 | |
Equity Method investments | | 24 | | 230 | |
Cost basis investments and dividends | | 1,781 | | 2,503 | |
Operating Assets segment Equity in Earnings from Real Estate and Other Affiliates | | 1,805 | | 2,733 | |
Strategic Developments segment Equity in Earnings from Real Estate and Other Affiliates | | 4,263 | | — | |
Equity in Earnings from Real Estate and Other Affiliates | | $ | 6,068 | | $ | 2,733 | |
| | | | | | | |
Retail Properties
Retail NOI for the three months ended September 30, 2013 decreased $5.1March 31, 2014 increased $0.7 million to $3.7$7.5 million as compared to $8.8$6.8 million for the same period in 2012. Retail NOI for the nine months ended September 30, 2013 decreased $11.5 million to $13.8 million as compared to $25.4 million for the same period in 2012. Both decreases for the three and nine months ended September 30, 2013, were2013. The increase was primarily attributable to a favorable real estate tax settlement at Landmark and increased revenue due to higher occupancy at 20/25 Waterway, Waterway Garage, and Park West offset by a decrease at Ward Village due to higher energy costs which are highly correlated to the price of oil.
The following table summarizes the leases we executed at our South Street Seaport property. South Street Seaport’s NOI decreased $5.4 million and $11.0 million forretail properties during the three and nine months ended September 30, 2013, respectively, compared to the same periods in 2012. For further details related to this variance, please refer to the South Street Seaport discussion hereinafter.March 31, 2014:
| | | | | | Square Footage | | Per Square Foot | | Annual (thousands) | |
Retail Properties (a) | | Total
Executed | | Avg. Lease
Term
(Months) | | Total
Leased | | Associated with
Tenant
Improvements | | Associated with
Leasing
Commissions | | Avg. Starting
Rents per
Annum | | Total Tenant
Improvements | | Total Leasing
Commissions | | Avg.
Starting
Rents | | Tenant
Improvements | | Leasing
Commissions | |
Pre-leased (b) | | 31 | | 108 | | 148,785 | | 131,976 | | 34,461 | | $ | 41.74 | | $ | 107.27 | | $ | 11.49 | | $ | 6,210 | | $ | 14,157 | | $ | 396 | |
Comparable (c) | | 8 | | 54 | | 12,640 | | — | | — | | 35.16 | | — | | — | | 444 | | — | | — | |
Non-comparable (d) | | 4 | | 46 | | 6,881 | | 6,881 | | 6,881 | | 25.08 | | 8.34 | | 3.72 | | 173 | | 57 | | 26 | |
Total | | | | | | 168,306 | | 138,857 | | 41,342 | | | | | | | | $ | 6,827 | | $ | 14,214 | | $ | 422 | |
| | | | | | | | | | | | | | | | | | | | | | | | | | | | | |
For the nine
(a) Excludes executed leases with a term of 12 months ended September 30, 2013, we executed 126 retail leases for a total of 498,683 square feet with average starting rents of $24.57 per square foot. This square footageor less.
(b) Pre-leased information is comprised of (1) pre-leased space associated with projects currently under development (2) comparable spaceat March 31, 2014.
(c) Comparable information is associated with stabilized assets whereby the square footage was occupied by a tenant within 12 months prior to the executed agreement, (3) non-comparable spaceagreement. These leases represent an increase in average cash rents from $34.35 per square foot to $35.16 per square foot, or 2.3% over previous rents.
(d) Non-comparable information is associated with stabilized assets whereby the square footage was previously vacant for more than 12 months or has never been occupied,months.
Landmark Mall
During 2013, we reached an agreement with Lord & Taylor for the early termination of its leasehold interest. We also received unanimous rezoning approval from the City of Alexandria for Phase I of the redevelopment which includes converting 11 acres of our 22 acre site, located within the center of the property between Macy’s and (4) space executedSears, from a traditional enclosed mall to a vibrant outdoor mixed-use environment with street retail shops and occupied priorrestaurants with high density residential. The redevelopment requires the consent of Macy’s and Sears, and within Phase I we expect to construct approximately 285,000 square feet of new retail including an upscale dine-in movie theater, and up to 400 residential units. We have submitted a development permit application to the dispositionCity of an asset.
OfAlexandria and anticipate approval later in 2014 at which time construction will commence. Future phases may include the executed retail leases, 343,704balance of the mall site with mixed-use densities to total up to 5.5 million square feet represent pre-leased space under development with average starting rentsas prescribed in the City of $26.40 per square foot and an average lease term of 108 months. Leases representing pre-leased space have total tenant improvement commitments of $15.9 million, or $54.32 per square foot and total leasing commissions of $1.2 million, or $6.75 per square foot. In addition, 108,107 square feet represent comparable leases whereby the square footage was previously occupied by another tenant within 12 months priorAlexandria’s 2009 Van Dorn Small Area Plan. Future redevelopment will also be subject to the executed agreement. The executed comparable leases represent an increase in cash rents of 2.8% over previous rents. The remaining 46,872 square feet represent non-comparable leases and are associated with space which was previously vacant. The comparable and non-comparable leases have an average lease term of 51 months and have total tenant improvement commitments of $1.3 million, or $21.08 per square foot, and total leasing commissions of $0.3 million, or $8.70 per square foot. Additionally,approval of the total comparable and non-comparable square footage, 38,922 square feet represent space which was executed and occupied at Rio West prior to its saleanchor tenants as part of a reciprocal easement agreement that governs the property. As of March 31, 2014, we have incurred $14.6 million of development costs on September 30, 2013. The minimal amount of leasing commissions paid relative tothis project, including the total executed leased space is reflectiveearly termination of the successanchor lease. On January 24, 2014, an agreement was reached with the City of our internal leasing efforts.Alexandria regarding the tax assessment for years 2007, 2010, 2011 and 2013. As a result of the settlement we were awarded a tax credit of $0.7 million. This credit will be used to offset future real estate taxes for this property.
Ward CentersVillage
Ward Centers NOI increased $0.4 millionIn November 2013, we substantially completed construction of the Auahi Shops, a 57,000 square foot, two-story retail center. We expect our final investment to $6.0be approximately $24.2 million, and $1.1as of March 31, 2014, we have incurred $23.8 million. Pier 1 Imports and Nordstrom Rack occupy 100% of this retail center and in the fourth quarter 2013 we relocated these tenants from other areas within Ward Village. Pier 1 Imports and Nordstrom Rack are contributing an incremental $1.0 million to $17.9 millionof combined annual NOI over their previously leased space in Ward Village. The Pier 1 Imports former location is the site of one of the first two planned market rate condominium towers for the three and nine months ended September 30, 2013, respectively, as compared to the same periods in 2012. The increase is primarilywhich we have begun pre-sales.
4543
Table of Contents
due to the commencement of the 36,000 square foot TJ Maxx lease in May 2012. In April 2013, Bed Bath & Beyond opened its approximately 30,000 square foot store which provided an additional $0.8 million in annual NOI.
During 2012, we substantially completed Phase One of The Ward Village Shops consisting of approximately 70,000 square feet for a total cost of $32.1 million. The 36,000 square foot upper level cost $20.5 million and was placed in service in May 2012 when TJ Maxx took occupancy.
On July 25, 2012, we announced the development of Phase Two of Ward Village Shops, a 57,000 square foot, two-story retail center. Construction began in the third quarter of 2012 and remains on schedule for an expected opening in the fourth quarter of 2013. We expect to invest approximately $26.2 million in this project of which $21.8 million of costs have been incurred as of September 30, 2013. Pier 1 Imports and Nordstrom Rack have executed leases to occupy 100% of this retail center and are relocating from their current locations within Ward Centers during the fourth quarter 2013. The original Pier 1 Imports location is the site of one of the first two planned market-rate condominium towers for which we expect to launch pre-sales by the end of 2013/early 2014. Pier 1 Imports and Nordstrom Rack are expected to contribute an incremental $1.0 million of combined annual NOI when they take possession in late 2013.
In October 2012, we announced plans to transform the property formerly known as Ward Centers into Ward Village, a vibrant neighborhood offering unique retail experiences, dining and entertainment, along with exceptional residences and workforce housing set among open public spaces and pedestrian-friendly streets. Our master plan development agreement with the Hawaii Community Development Authority (“HCDA”) allows for up to 9.3 million square feet, including up to 7.6 million square feet of residential (4,000(approximately 4,000 units which are initially estimated to average approximately 1,500 square feet per unit), and up toover 1.7 million square feet of retail, office, commercial and other uses. Full build-out is estimated to takeoccur over 1512-15 years, but will ultimately depend on market absorption and many other factors that are difficult to estimate.
The first phase of the master plan includes the renovation of the IBM Building, which has been substantially completed, and the development of approximately 482 condominium units in two mixed-use residential towers and development of one other tower witha workforce residential unitstower having salesunit sale prices lower than the market rate. We expect the first two market-rate towers to be completed in 2016.rate towers.
During the first quarter of 2013, we began redevelopment of theThe IBM Building, intowhose renovation was completed in January 2014, serves as a world-classworld class information center and residential sales gallery for the entire Ward Village project. The building renovation is on schedulesales center dedicates a section to telling the story of the history of the land, while another section showcases our vision for completion by the end of 2013, with an anticipated cost ofWard Village. Total development costs are expected to be approximately $24.4 million. Approximately $13.4As of March 31, 2014 we have incurred $22.8 million has been incurredof development costs on this project as of September 30, 2013.project.
Development permit applications and detailed plans for Phase One, which includes the first three residential towers were approved by the HCDA in the third quarter of 2013 and condominium documents have been submitted toapproved by the Hawaii Real Estate Commission. We anticipate that weCommission for two market rate towers in 2013. The first of the two market rate towers, Waiea, meaning “water of life” in Hawaiian, is planned to be developed at a surface parking lot on Ala Moana Boulevard and will receive the Real Estate Commission’s approvalhave 171 market rate condominium units for sale, six levels of parking and approximately 8,000 square feet of new retail space. Waiea will consist of one, two and three-plus bedroom units, villas and penthouses ranging from approximately 1,100 to 17,500 square feet. Construction is expected to commence in the fourth quarter of 2013 and expect to launch pre-sales2014 with projected completion by the end of 2013/early 2014. We2016. As of March 31, 2014, we have incurred pre-development$13.2 million of development costs for Phase One of approximately $11.9 million as of September 30, 2013.on this project.
SouthThe second market rate tower, Anaha, meaning “reflection of light,” is planned for Auahi Street Seaportand will have 311 market rate condominium units for sale, six levels of parking and approximately 17,000 square feet of new retail space. Anaha will consist of studios, one, two and three-bedroom units, townhomes and penthouses ranging from approximately 450 to 6,500 square feet. Construction is expected to commence in 2014 with projected completion by the end of 2016. As of March 31, 2014, we have incurred $10.6 million of development costs on this project.
DuringOn February 1, 2014 we began public presales of the fourth quarterfirst two market rate residential condominium towers at Ward Village. Sales contracts are subject to a 30-day rescission period, and the buyers are required to make a deposit equal to 5% of 2012, the Uplands portionpurchase price at signing and an additional 5% deposit 30 days later at which point their total deposit of South Street Seaport (areas west10% of Pier 17) suffered flooding damage duethe purchase price becomes non-refundable. Buyers are required to Superstorm Sandy which rendered the Uplands space untenantable. The NOI losses at South Street Seaport during the three and ninemake an additional 10% deposit within approximately four months ended September 30, 2013 were $3.5 million and $6.9 million, respectively, and were primarily attributable to lower revenues of $3.4 million and $9.5 million, respectively. Reconstruction efforts are ongoing and partial operations resumed during 2013.signing.
In August 2013 we filed a claim with our insurance carriers relating to property damage and lost income from Superstorm Sandy. We believe that our insurance will cover substantially all of the cost of repairing the property and will also compensate us for any revenue that has been lost as a result of the storm. As of September 30, 2013,May 1, 2014, we had received $11.0$55 million of insurance proceeds. Insurance recoveries to date have exceededbuyer deposits, representing $609 million of gross sales revenue assuming the then book valuebuyers close on the units when completed. As of May 1, 2014, approximately 52% of the property at482 total units in the datetwo towers have been contracted and passed their 30-day rescission period for which the buyers have made 10% non-refundable deposits (61% in the Waiea tower and 47% in the Anaha tower). Including signed contracts that have not passed their 30-day rescission period, approximately 70% of the stormunits in Waiea and 54% of units in Anaha have been sold.
The workforce housing tower is planned for the three months ended September 30, 2013,a site on Ward Avenue and preliminary designs include 424 condominium units, six levels of parking and approximately 25,000 square feet of new retail space. We are finalizing plans for this tower. As of March 31, 2014 we recorded a $3.0have incurred $2.6 million pre-tax gain in Other Income.of development costs on this project.
4644
Table of Contents
During the second quarter of 2013, we launched the SEE/CHANGE marketing campaign to re-brand South Street Seaport. The SEE/CHANGE campaign is accompanied by seasonal programming to re-energize the Seaport by activating the Uplands public areas with unique food and beverage operations, pop-up retail in shipping containers, art installations, and a lawn area complete with a stage and screen for outdoor films and concerts. The purpose of this program is to draw local New York residents to the Seaport, while changing the perception that South Street Seaport is primarily a tourist destination. During the third quarter of 2013, SEE/CHANGE-related expenses were approximately $1.0 million. We also incurred a $1.2 million charge related to an early lease termination.
In June 2013, the City of New York executed the amended and restated ground lease for South Street Seaport, which was the final step necessary for the commencement of the renovation and reconstruction of the existing Pier 17 Building (“Renovation Project”). Per our prior agreement with the New York City Council, we postponed the commencement of construction until October 1, 2013 allowing merchants struggling in the aftermath of Superstorm Sandy to remain in business through the summer. The Renovation Project will increase the leasable area of Pier 17 to approximately 195,000 square feet and features a complete transformation of the Pier 17 building, and is designed to include a vibrant, open rooftop with 40% more open space, upscale retail, outdoor entertainment venues and a dynamic food market. Additionally, we plan to lease approximately 180,000 square feet of retail space in the Uplands. The estimated budget for the Renovation Project and redevelopment of the Uplands is approximately $425 million, $11.2 million of which are demolition costs that will be expensed as incurred. As of September 30, 2013, we have incurred approximately $17.9 million of development costs related to this project and have incurred no demolition costs.
Riverwalk Marketplace
The $0.1 million and $1.4 million NOI decrease for the three and nine months ended September 30, 2013, respectively, as compared to the same periods in 2012 was primarily attributable to vacating tenants in advance of the commencement of construction in June 2013 to transform the property into The Outlet Collection at Riverwalk, an upscale outlet center. The Outlet Collection at Riverwalk will be the nation’s first outlet center located in the downtown of a major city. The redevelopment will feature a tenant mix of top national retailers with established outlet stores, local retailers and several dining and entertainment options. We plan to expand the current leasable area by approximately 50,000 square feet to 250,000 square feet and approximately 94% of the space has been pre-leased. During the redevelopment, approximately 6,000 square feet of space will remain occupied and operating. We have commitments from a strong roster of retailers and restaurants including Last Call Studio by Neiman Marcus, Coach Men’s Factory Store, Tommy Bahama, Toby Keith’s I Love This Bar & Grill, Hartstrings Childrenswear, U.S. Polo Assn. Outlet, It’s Sugar, Sunglass Warehouse, Red Mango and New Balance Factory Stores. The estimated project budget is approximately $82 million (exclusive of our land value) of which approximately $1.1 million are demolition costs with an expected opening date in the second quarter of 2014. As of September 30, 2013, we have incurred $16.8 million of development costs (exclusive of land value) on this project of which $0.3 million is pre-leasing and $1.0 million represents demolition costs.
On October 24, 2013, we closed on a $64.4 million construction loan bearing interest at one-month LIBOR plus 2.75% with an initial maturity date of October 24, 2016 with two one-year extension options.
Landmark Mall
During the first quarter of 2013, we reached an agreement with Lord & Taylor for the early termination of its leasehold interest. In the second quarter 2013, we received unanimous rezoning approval from the Alexandria City Council for the redevelopment of Landmark Mall. The redevelopment is subject to the approval of Sears and Macy’s as both are part of the Reciprocal Easement Agreement that governs the property. Our plan is to transform this 11-acre site into an open-air community with retail, residential and entertainment components designed to create an urban village on the west end of Alexandria, Virgina. The 750,000 square foot redevelopment will include 285,000 square feet of retail, up to 400 residential units and an upscale dine-in movie theater. Sears and Macy’s will continue to anchor the property. We have submitted a development permit application and anticipate approval later in 2013 from the City of Alexandria. As of September 30, 2013, we have incurred $13.4 million of development costs related to this project, including termination of the anchor lease.
47
Table of Contents
Rio West Mall
On September 30, 2013, we sold the property for $12.0 million and received $10.8 million of net proceeds inclusive of a credit to the purchaser for certain improvement obligations. The net book value of the property was $10.2 million and we recognized a pre-tax gain of $0.6 million which is included in other income.
Office Properties
All of the office properties listed in the NOI schedule, except for 110 N. Wacker, the Columbia Office Properties and 70 Columbia Corporate Center (“70 CCC”) are located in The Woodlands. Leases related to our office properties, except those located in Columbia, Maryland, are generally triple net leases. Triple net leases typically require tenants to pay their pro-rata share of certain property operating costs, such as real estate taxes, utilities and insurance.
Office property NOI was flat during the three and nine months ended September 30, 2013, respectively,increased $1.5 million to $5.9 million as compared to $4.4 million for the same periodsperiod in 2012. NOI for2013. The Woodlands office properties increased for the threeincrease was primarily attributable to placing One Hughes Landing and nine months ended September 30, 2013 due primarily to 3 Waterway Square being placedinto service in service. NOI for2013, partially offset by higher operating costs at the Columbia Office Properties decreased forand 70 Columbia Corporate Center.
The following table summarizes our executed office property leases during the three and nine months ended September 30, 2013, primarily due to the relocation of a major tenant to 70 CCC from the Columbia Office Properties.March 31, 2014:
| | | | | | Square Footage | | Per Square Foot | | Annual (thousands) | |
Office Properties (a) | | Total
Executed | | Avg. Lease
Term
(Months) | | Total
Leased | | Associated
with Tenant
Improvements | | Associated
with Leasing
Commissions | | Avg. Starting
Rents per
Annum | | Total Tenant
Improvements | | Total Leasing
Commissions | | Avg.
Starting
Rents | | Tenant
Improvements | | Leasing
Commissions | |
Pre-leased (b) | | 5 | | 127 | | 108,595 | | 108,595 | | 92,701 | | $ | 24.85 | | $ | 53.98 | | $ | 21.32 | | $ | 2,699 | | $ | 5,862 | | $ | 1,976 | |
Comparable (c) | | 3 | | 44 | | 19,673 | | 19,673 | | 19,673 | | 21.90 | | 6.16 | | 5.37 | | $ | 431 | | $ | 121 | | $ | 106 | |
Total | | | | | | 128,268 | | 128,268 | | 112,374 | | | | | | | | $ | 3,130 | | $ | 5,983 | | $ | 2,082 | |
| | | | | | | | | | | | | | | | | | | | | | | | | | | | | |
For the nine
(a) Excludes executed leases with a term of 12 months ended September 30, 2013, we executed 21 office leases for a total of 264,744 square feetor less.
(b) Pre-leased information is associated with average starting rents of $26.22 per square foot. This square footageprojects under development at March 31, 2014.
(c) Comparable information is comprised of: (1) space identified as pre-leased in previous quarters but has since stabilized; (2) comparable space associated with stabilized assets whereby the square footage was occupied by a tenant within 12 months prior to the executed agreement; and (3) non-comparable space associated with stabilized assets whereby the square footage was previously vacant for more than 12 months or has never been occupied.
Of the executed office leases, 59,120 square feet represent space leased in previous periods prior to the building being placed in service, with average starting rents of $27.12 per square foot and an average lease term of 108 months. Leases representing pre-leased space on developments have total tenant improvement commitments of $3.2 million, or $54.73 per square foot and total leasing commissions of $1.1 million, or $19.31 per square foot. In addition, 48,436 square feet represent comparable leases whereby the square footage was occupied by a tenant within 12 months prior to the executed agreement. The executed comparableThese leases represent an increase in average cash rents of 8.6%from $19.04 per square foot to $21.90 per square foot, or 15.0% over previous rents. The remaining 157,188 square feet represent non-comparable leases and are associated with space which was previously vacant. The comparable and non-comparable leases have an average lease term of 73 months and have total tenant improvement commitments of $9.1 million, or $47.07 per square foot, and total leasing commissions of $3.5 million, or $17.18 per square foot.
On September 19,The Woodlands
During 2013, we substantially completed and opened One Hughes Landing, the first office building in Hughes Landing, a 66-acre, mixed-use development situated on the 200-acre Lake Woodlands. One Hughes Landing is a 197,719 square foot eight-story, Class A office building. The building that is 92% leased.97.8% leased as of March 31, 2014. Based on leases in place, we expect the property to reach stabilized annual NOI of approximately $5.8$5.6 million by the second quarter of 2014. Total budgeted costs are expected to be $47.1 million for this project are $49.6 million. Weproject. As of March 31, 2014, we have incurred $32.1$44.4 million (exclusive of land value) as of September 30, 2013, of which $2.8 million represents leasing costs.the remaining amounts to be spent represent tenant improvements. The project is financed by a $38.0 million non-recourse mortgage bearing interest at one-month LIBOR plus 2.65% with an initial maturity date of November 14, 2015 with two, one-year extension options.
During June of 2013, we substantially completed the construction ofopened 3 Waterway Square, an 11-story,a 232,000 square foot Class A office building. Final costs are expected to be approximately $47.0 million for this project. The building is 97%98.4% leased and presently 90.3% occupied.as of March 31, 2014. Based on leases in place, we expect the property to reachreached stabilized annual NOI of $6.0$6.5 million by first quarter 2014. Total budgeted costs for this project are $51.4 million (exclusive of land value). We have incurred $46.0 million (exclusive of land value), as of September 30, 2013, of which $5.0 million represents prepaid leasing costs.March 31, 2014.
On August 15, 2012, we acquired 70 CCC, a 167,513 square foot Class A office building located in Columbia Maryland. Office PropertiesIn February 2013, we executed a lease for 63,640 square feet that increased occupancy to
48
Table of Contents
approximately 94.7% when the tenant took possession in July 2013. We expect annual NOI to increase to approximately $2.7 million by fourth quarter 2015 based on leases in place as of September 30, 2013.
In 2012, we entered into agreements with Whole Foods Market, Inc. and The Columbia Association to lease the majority of the approximately 89,000 square foot Columbia Regional Building. In March 2013, we began a complete restoration and redevelopment of the building,Columbia Regional Building, which we believe will serve as a catalyst for future development in the Columbia Town Center. WeDowntown Columbia. Construction remains on schedule and we anticipate completion of the renovation during the fourth quarter of 2014. DuringTotal development costs are expected to be $25 million (exclusive of land value), and we have incurred $20.3 million as of March 2013, we closed on31, 2014. The project is financed by a $23.0 million construction loan bearing interest at one-month LIBOR plus 2.0% and having an initial maturity date of March 15, 2016, with two, one-year extension options. Budgeted construction costs are approximately $24.6 million (exclusive of land value) of which $0.4 million are demolition costs. We have incurred $10.1 million aspre-leased a majority of September 30, 2013 (excluding our existingthe 89,000 square foot building to Whole Foods Market, Inc. and land basis) of which $0.4 million are demolition costs. Approximately $0.3 million of our costs are prepaid leasing costs. WeThe Columbia Association and we expect to reach annual NOI of $2.1 million in the second quarter of 2015.
Multi-family
On May 31,August 15, 2012, we acquired our partner’s interest in Millennium Waterway Apartments at70 Columbia Corporate Center (“70 CCC”), a negotiated $72.0 million valuation of the property and consolidated the asset after the purchase. This property is a stabilized168,000 square foot Class A multi-family propertyoffice building located in Columbia, Maryland by assuming a $16.0 million participating mortgage at 4.25% that we repaid in full with cash on hand on April 15, 2014. The Woodlands Town Center. Thecurrent occupancy is 94.7% and we expect annual NOI decrease of $0.1to increase to approximately $2.5 million forby the three months ended September 30, 2013 as compared to the same periodfourth quarter 2015 based on leases in 2012 is primarily due to increased property taxes due to a higher assessed value. The property is 90.1% occupiedplace as of September 30, 2013 and stabilized NOI is expected to reach approximately $4.4 million in 2013. In conjunction with this acquisition, we entered into a joint venture agreement with our partner to construct a 314-unit Class A multi-family property as more fully discussed under our Strategic Developments segment.March 31, 2014.
45
Table of Contents
The Woodlands Resort and& Conference Center
The Woodlands Resort and& Conference CenterCenter’s NOI of $0.8$1.9 million for the three months ended September 30, 2013,March 31, 2014, decreased $0.6$1.7 million compared to $1.4$3.6 million for the third quarter 2012 due to lower group business caused by the construction activities related to the renovation project. The third quarter is also typically the slowest quarter of the year due to lower group business in August. NOI decreased $0.2 million to $8.0 million for the nine months ended September 30, 2013, compared to the same period in 2012,2013, primarily due to increased compensationa decrease of 3,500 occupied room nights and benefit expenses offsetlower banquet and catering business, all caused by an increase in room rate to $193.04 from $187.26, or 3.1%, and an increase in revenue per available room (“RevPAR”) to $116.97 from $113.64, or 2.9%. Increased business activity and strong local economic conditions at The Woodlands and surrounding areas, along with strong yield management, resulted in increased room rates.the ongoing renovation project. During the first quarter of 2013, we announced the expansion and redevelopment of The Woodlands Resort & Conference Center and Conference Center. Total budgeted construction costs for this project are $75.4 million, of which $16.0 million had been incurred as of September 30, 2013. Construction is expected to be completed during the summer of 2014. The renovation will encompass 222 existing guest rooms, the replacement of 218 rooms with a new wing consisting of 184 guest rooms and suites, a new lobby, an update of the 13,000 square foot spa facility, the revitalization of 60,000 square feet of meeting and event facilities, an addition of a new Steak House, and the development of a 1,000 linear foot lazy river. Additionally, duringWe expect the first quarterrenovation, when complete, will have a significant positive impact on NOI due to the replacement of 2013,a majority of the older rooms which have the lowest revenue per available room (“RevPAR”) of the existing rooms available and the addition of amenities such as the Steak House and lazy river, which should increase weekend occupancy. RevPAR is calculated based on dividing total room revenues by total occupied rooms for the period. Construction costs are expected to total approximately $77 million and as of March 31, 2014, we closed onhave incurred $40.0 million. This project is financed by a $95.0 million non-recourse mortgage bearing interest at one-month LIBOR plus 3.5% and having an initial maturity date of February 8, 2016 with three, one-year extensions at our option. The mortgage refinanced the existing $36.1 million mortgage and will provide the majority of the funding for this redevelopment.
Other
The Club at Carlton Woods (the “Club”) is a 36-hole golf and country club at The Woodlands with 680725 total members as of September 30, 2013March 31, 2014, consisting of 571595 golf memberships and 109130 sports memberships. The Club sold 7619 new golf memberships during the ninethree months ended September 30, 2013.March 31, 2014. We estimate the Club requires approximately 800 golf members to achieve break-evenbreak even NOI, and therefore, we expect to continue to incur NOI losses for the foreseeable future. The Club had a $2.5$1.2 million NOI loss for the three months ended September 30, 2013,March 31, 2014, an increase in loss of $1.4$0.1 million compared to the $1.1 million NOI loss in the third quarter of 2012. The decrease in NOI is due primarily to increased payroll and related costs and legal fees. The decrease in NOI of $0.7 million for the nine months ended September 30, 2013 compared to the same period in 2012 was due primarily to2013. For the third quarterthree months ended March 31, 2014 and 2013, unfavourable variances as described above.cash membership deposits collected but not recognized in revenue or included in NOI were $1.1 million and $0.9 million, respectively.
The Woodlands Parking Garages comprise nearly 3,000 parking spaces in two separate parking structures. The Waterway Square Garage (1,933 spaces)has 1,933 spaces and is located in The Woodlands Town Center andCenter. The Waterway Square Garage has excess parking capacity
49
Table of Contents
for future commercial development. Woodloch Forest garage has approximately 1,000 total spaces with 300 spaces available for future adjacent office development.
Partially Owned
During the first quarterquarters of 20132014 and 2012,2013, we received distributions of $2.5$1.8 million and $2.4$2.5 million, respectively, from our Summerlin Hospital investment. Distributions from the Summerlin Hospital are typically made one time per year in the first quarter.
In 2012,Redevelopments
Outlet Collection at Riverwalk
During June 2013, tenants were vacated to transform the property into the Outlet Collection at Riverwalk, an urban upscale outlet center located in New Orleans, Louisiana. We believe the Outlet Collection at Riverwalk will be the nation’s first outlet center located in the downtown of a major city. The redevelopment will feature a tenant mix of top national retailers with established outlet stores, local retailers and several dining and entertainment options. We have expanded the current leasable area by approximately 50,000 square feet to 250,000 square feet. Total development costs are expected to be approximately $82 million (exclusive of our land value), with an announced opening date in May 2014. As of March 31, 2014, we becamehave incurred $53.7 million of development costs of which $1.0 million were demolition costs that we expensed as incurred. The project is financed by a 50% partner in a joint venture formed for the purpose$64.4 million partial recourse construction loan bearing interest at one-month LIBOR plus 2.75% with an initial maturity date of acquiring 100% of the operating assets of the Las Vegas 51s, a Triple-A baseball team which is a member of the Pacific Coast League. In May 2013, the joint venture acquired the team for approximately $21.0 million, and our share of the purchase price was $10.5 million. The team is located near our Summerlin MPC. Our strategy in acquiring an ownership interest is to pursue a potential relocation of the team to a to-be-built stadium in our Summerlin master planned community. There can be no assurance that such a stadium will ultimately be built.October 24, 2016 with two, one-year extension options.
5046
Table of Contents
During the redevelopment, approximately 6,700 square feet of space remained occupied and operating. The space under redevelopment has been 99.2% pre-leased with a strong roster of retailers and restaurants that will appeal to both locals and visitors to New Orleans. When stabilized, the project is expected to reach annual NOI of $7.8 million based on leases in place.
South Street Seaport
NOI for the three months ended March 31, 2014 decreased $0.6 million to negative $(2.2) million compared to negative $(1.7) million for the same period in 2013. NOI for 2013 includes a $15.2 million negative impact from the closure of a majority of the property due to Superstorm Sandy in October 2012. NOI for 2014 includes the negative impact from closing Pier 17 and the majority of the historic area for redevelopment. Revenues for the approximately 53,000 square feet of space that have reopened since Superstorm Sandy and are not planned for renovation were $1.0 million for the three months ended March 31, 2014.
On October 29, 2012, as a result of Superstorm Sandy, the historic area of South Street Seaport (area west of FDR Drive) suffered significant damages due to flooding. During 2013, we filed a claim with our insurance carriers for property damages, lost income and other expenses resulting from the storm and we believe insurance will cover substantially all of these losses. We are continuing to work through the claims process with the insurance carriers and have collected $28.3 million in insurance proceeds through March 31, 2014. Insurance recoveries to date have exceeded the book value of the buildings and equipment at the date of the storm. For the three months ended March 31, 2014, we recorded $7.8 million in Other income from insurance recoveries, which is excluded from NOI.
During the first half of 2013, we established the SEE/CHANGE program in an effort to revitalize the South Street Seaport following the damage caused by Superstorm Sandy. SEE/CHANGE is an innovative seasonal program developed to re-energize and re-activate the Seaport area and to create a gathering place for the community that did not exist in the aftermath of the storm. The program includes bringing to Seaport for each season an array of new retail, culinary and cultural events to attract local residents and tourists, and an intensive social media campaign to advertise the events.
On June 27, 2013, the City of New York executed the amended and restated ground lease for South Street Seaport and we provided a completion guarantee to New York City for the Renovation Project (as defined below). The execution of the amended and restated ground lease was the final step necessary for the commencement of the renovation and reconstruction of the existing Pier 17 Building (“Renovation Project”). Construction began during September 2013 and is expected to conclude in 2016. The Renovation Project will increase the leasable area of Pier 17 to approximately 182,000 square feet, features a complete rebuild of the Pier 17 building and is designed to include a vibrant open rooftop, upscale retail and outdoor entertainment venues. Additionally, we plan to re-tenant a significant portion of the 180,000 square feet of retail space in the historic area.
The redevelopment of Pier 17 and renovation of the historic area is expected to cost approximately $425 million, $11.0 million of which are expected to be demolition costs that will be expensed as incurred. As of March 31, 2014, we have incurred $34.6 million of development costs on this project, which includes $3.0 million of demolition costs and $1.5 million of marketing costs
On December 11, 2013, we executed a 20-year anchor lease with iPic Entertainment for 46,145 square feet in the Fulton Market Building located in the historic area. iPic Theatres will serve as an anchor attraction for residents, workers and tourists.
On November 20, 2013, we announced plans for further redevelopment of the South Street Seaport district which includes approximately 700,000 square feet of additional space, East River Esplanade improvements, a marina, restoration of the historic Tin Building, and the creation of a dynamic food market, replacement of wooden platform piers adjacent to Pier 17 and a newly constructed mixed-use building. The plans are subject to a Uniform Land Use Review Procedure (“ULURP”) that requires approval by the New York City Council, the New York City Landmarks Preservation Commission and other various government agencies. We have begun outreach and consultation with community stakeholders and public officials and expect to begin the formal approval process in mid-2014.
47
Table of Contents
Dispositions
Rio West Mall
On September 30, 2013, we sold the property for $12.0 million and received $10.8 million of net proceeds. The net book value of the property was $10.2 million and we recognized a pre-tax gain of $0.6 million which was included in other income in the third quarter of 2013.
Total revenues and expenses for the Operating Assets segment are summarized as follows:
Operating Assets Revenues and Expenses (*)
| | Three Months Ended September 30, | | Nine Months Ended September 30, | |
| | 2013 | | 2012 | | 2013 | | 2012 | |
| | (In thousands) | | (In thousands) | |
| | | | | | | | | |
Minimum rents | | $ | 21,160 | | $ | 22,788 | | $ | 59,427 | | $ | 61,532 | |
Resort and conference center revenues | | 8,169 | | 8,328 | | 30,543 | | 29,954 | |
Tenant recoveries | | 5,254 | | 6,030 | | 15,547 | | 17,817 | |
Other rental and property revenues | | 4,493 | | 4,342 | | 14,538 | | 15,307 | |
Total revenues | | 39,076 | | 41,488 | | 120,055 | | 124,610 | |
| | | | | | | | | |
Other property operating costs | | 18,688 | | 14,853 | | 50,205 | | 43,274 | |
Rental property real estate taxes | | 3,148 | | 2,934 | | 9,054 | | 8,160 | |
Rental property maintenance costs | | 1,906 | | 2,126 | | 5,594 | | 5,851 | |
Resort and conference center operations | | 7,381 | | 6,965 | | 22,537 | | 21,750 | |
Provison for doubtful accounts | | 201 | | 237 | | 907 | | 386 | |
Depreciation and amortization | | 9,171 | | 6,440 | | 21,687 | | 16,969 | |
Interest expense, net | | 3,985 | | 4,265 | | 14,593 | | 11,239 | |
Equity in Earnings from Real Estate Affiliates | | (647 | ) | (310 | ) | (3,743 | ) | (3,432 | ) |
Total expenses | | 43,833 | | 37,510 | | 120,834 | | 104,197 | |
Operating Assets REP EBT | | $ | (4,757 | ) | $ | 3,978 | | $ | (779 | ) | $ | 20,413 | |
(*) For a detailed breakdown of our Operating Assets segment EBT, please refer to Note 15 - Segments.
| | Three Months Ended March 31, | |
| | 2014 | | 2013 | |
| | (In thousands) | |
| | | | | |
Minimum rents | | $ | 19,900 | | $ | 18,511 | |
Tenant recoveries | | 5,884 | | 5,252 | |
Resort and conference center revenues | | 9,426 | | 11,104 | |
Other rental and property revenues | | 5,110 | | 3,433 | |
Total revenues | | 40,320 | | 38,300 | |
| | | | | |
Other property operating costs | | 15,260 | | 14,965 | |
Rental property real estate taxes | | 3,107 | | 2,983 | |
Rental property maintenance costs | | 1,800 | | 1,656 | |
Resort and conference center operations | | 7,511 | | 7,476 | |
Provison for doubtful accounts | | 143 | | 429 | |
Demolition costs | | 2,494 | | — | |
Depreciation and amortization | | 9,010 | | 6,118 | |
Interest expense, net | | 1,925 | | 6,759 | |
Equity in Earnings from Real Estate and Other Affiliates | | (1,805 | ) | (2,733 | ) |
Total expenses | | 39,445 | | 37,653 | |
Operating Assets REP EBT | | $ | 875 | | $ | 647 | |
Minimum rents for the three and nine months ended September 30, 2013March 31, 2014 of $21.2$19.9 million and $59.4increased $1.4 million respectively, decreased $1.6 million and $2.1 million respectively, compared to both$18.5 million for the same period in 2013. The increase was primarily due to One Hughes Landing and 3 Waterway Square being placed into service in 2013. These increases were offset by decreased rents for the three and nine months ended September 30, 2012.March 31, 2014 of ($0.6) million related to the closing of the Outlet Collection at Riverwalk for redevelopment.
Resort and conference center revenues for the three months ended March 31, 2014 of $9.4 million decreased $1.7 million compared to $11.1 million for the same period in 2013. The decrease was primarily due to lower minimum rentsoccupied room nights and lower banquet and catering business, all caused by the ongoing renovation project.
Other rental and property revenues for the three and nine months ended September 30, 2013 at South Street SeaportMarch 31, 2014 of $2.2$5.1 million and $7.2increased $1.7 million respectively, resulting from Superstorm Sandy and at Riverwalk Marketplace of $1.2compared to $3.4 million and $2.4 million, respectively, resulting from vacating tenantsin the same period in 2013. The increase was primarily due to the redevelopment. These decreases were partially offset by increased rentsopening of One Hughes Landing and 3 Waterway Square and special events at Seaport related to the SEE/CHANGE program.
The $2.5 million in demolition costs for the three and nine months ended September 30,March 31, 2014 are due to the demolition of Pier 17 as part of the Renovation Project at the South Street Seaport.
Depreciation expense for the three months ended March 31, 2014 of $9.0 million increased $2.9 million compared to $6.1 million in the same period in 2013 primarily due to a shortened useful life of $0.8 millionthe building and $5.3 million, respectively,improvements at Landmark related to the acquisition of our partner’s interest in Millennium Waterway Apartments in May 2012,upcoming redevelopment, and the opening of 3 Waterway Square. The increased occupancySquare and rental growthOne Hughes Landing. Additionally increases in leasehold improvements at Ward Centers of $0.7 millionPark West and $1.8 million for the three and nine months ended September 30, 2013, respectively, primarily related to the commencement of the TJ Maxx lease in May 2012 and Bed Bath & Beyond lease in April 2013 further offset the decrease in minimum rents noted above.
Other property operating costs increased $3.8 million and $6.9 million to $18.7 million and $50.2 million, respectively, for the three and nine months ended September 30, 2013 as compared to the same periods in 2012. The increase for the nine months ended September 30, 2013 primarily resulted from the termination of leases at South Street Seaport totaling approximately $1.2 million, SEE/CHANGE-related expenses of approximately $1.8 million, increased costs of $1.8 million relating to the Club at Carlton Woods and 3 Waterway Square being placed in service in second quarter 2013.
The provision for doubtful accounts increased for the nine months ended September 30, 2013 by $0.5 million as compared to the same period in 2012 primarily due to bad debt charges at South Street Seaport related to Superstorm Sandy which70 CCC resulted in several tenant terminations.
Depreciation expense for the nine months ended September 30, 2013 increased $4.7 million as compared to the same period in 2012 primarily due to depreciation related to our acquisition of Millennium Waterway Apartments and Phase One of The Ward Village Shops and the increased depreciation expense recorded as a result of the change in useful lives of certain assets approved for redevelopment at Ward Centers.
Net interest expense decreased $0.3 million and increased $3.4 million for the three and nine months ended September 30, 2013, respectively, as compared to the same periods in 2012. The decrease in the three months ended September 30, 2013 is primarily due to interest being capitalized as certain of our Operating Assets are beginning redevelopment. The increase for the nine months ended September 30, 2013 is primarily due to an increase of $1.0additional depreciation.
5148
Table of Contents
Net interest expense decreased $4.8 million relatingfor the three months ended March 31, 2014 compared to the debt associated with Millennium Waterway Apartments and $2.8 million relatedsame period in 2013. The decrease is mostly due to 70 CCC lender’s participation rightthe change in the property partially offset by capitalized interest associated with certain of our operating assets which are now under redevelopment. The participation right is remeasured each quarter based on the estimated fair value of the property and the change in fair valueparticipation right which is recorded throughin interest expense. We executed a new 63,985 square foot tenant lease inexpense resulting from the first quarter of 2013, which increased the estimated valuerepayment of the lender’s participation.70 CCC loan.
Strategic Developments Segment
Our Strategic Development assets generally require substantial future development to achieve their highest and best use. For our redevelopment and development projects, the total estimated costs of a project including the budgeted construction costs are exclusive of our land value unless otherwise noted. Most of the properties and projects in this segment generate no revenues.revenues with the exception of our condominium projects. Our expenses relating to these assets are primarily related to carrying costs, such as property taxes and insurance, and other ongoing costs relating to maintaining the assets in their current condition. If we decide to redevelop or develop a Strategic Development asset, we would expect that, upon completion of development, the asset would either be sold or reclassified to the Operating Assets segment and NOI would become an important measure of its operating performance.
Total revenues and expenses for the Strategic Developments segment are summarized as follows:
Strategic Developments Revenues and Expenses (*)
Strategic Developments Revenues and Expenses (*) | | Strategic Developments Revenues and Expenses (*) | |
| | | | |
| | Three Months Ended September 30, | | Nine Months Ended September 30, | | | Three Months Ended March 31, | |
| | 2013 | | 2012 | | 2013 | | 2012 | | | 2014 | | 2013 | |
| | (In thousands) | | | (In thousands) | |
| | | | | | | | | | | | | | |
Minimum rents | | $ | 182 | | $ | 217 | | $ | 586 | | $ | 693 | | | $ | 263 | | $ | 220 | |
Condominium rights and unit sales | | 810 | | — | | 31,191 | | 267 | | | 3,126 | | — | |
Other land, rental and property revenues | | 3,935 | | 4,517 | | 5,345 | | 4,691 | | | 408 | | 73 | |
Total revenues | | 4,927 | | 4,734 | | 37,122 | | 5,651 | | | 3,797 | | 293 | |
| | | | | | | | | | | | | | |
Condominium rights and unit cost of sales | | 406 | | (24 | ) | 15,678 | | 143 | | | 1,571 | | — | |
Other property operating costs | | 4,631 | | 2,857 | | 7,438 | | 5,908 | | | 3,541 | | 1,478 | |
Provision for doubtful accounts | | 3 | | 3 | | 3 | | (101 | ) | | — | | — | |
Demolition costs | | 1,386 | | — | | 1,386 | | — | | |
Depreciation and amortization | | 48 | | 56 | | 139 | | 173 | | | 424 | | 43 | |
Interest expense * | | (401 | ) | (193 | ) | (1,363 | ) | 61 | | |
Equity in Earnings from Real Estate Affiliates | | (2,947 | ) | — | | (8,291 | ) | — | | |
Other income | | | (2,373 | ) | — | |
Interest expense (*) | | | (2,649 | ) | (287 | ) |
Equity in Earnings from Real Estate and Other Affiliates | | | (4,263 | ) | — | |
Total expenses | | 3,126 | | 2,699 | | 14,990 | | 6,184 | | | (3,749 | ) | 1,234 | |
Strategic Developments REP EBT | | $ | 1,801 | | $ | 2,035 | | $ | 22,132 | | $ | (533 | ) | | $ | 7,546 | | $ | (941 | ) |
(*) For a detailed breakdown of our Strategic Developments segment of EBT, refer to Note 15 - Segments.
Revenues increased $0.2$3.5 million to $4.9$3.8 million for the three months ended September 30, 2013 and $31.5 millionMarch 31, 2014 compared to $37.1 million for the nine months ended September 30, 2013, respectively,March 31, 2013. The increase is primarily due to the May 2013 salerecognition of our condominium rights$3.1 million of deferred revenue related to the ONEOne Ala Moana project.which is recognized on the percentage of completion basis. The increase in condominium rights and unit sales and condominium rights and unit cost of sales of $1.6 million for the three and nine month periodmonths ended September 30, 2013March 31, 2014 represents partial recognition of the gain on saleour book basis of the condominium rights sold to the joint venture in which we have a 50% interest and the portion ofKR Holdings that is associated with the deferred sale relating to our ongoing interest inrevenues recognized during the condominium rights that we recognized onquarter, as discussed below under the percentage of completion basis.One Ala Moana Tower Condominium salesProject.
Other property operating costs increased $0.8 million and $30.9 million and the related cost of sales increased $0.4 million and $15.6$2.1 million for the three and nine months ended September 30, 2013, respectively, primarily dueMarch 31, 2014 compared to the ONE Ala Moana project noted above. The $1.4same period in 2013. During the first quarter 2014, we expensed $1.9 million in demolitionmarketing costs primarily related to our Ward Village, Downtown Columbia and The Shops at Summerlin development projects.
Other income of $2.4 million for the three and nine months ended September 30, 2013 are dueMarch 31, 2014 relates to costs to demolish a portionthe sale of the existing structures at our Riverwalk and Columbia Regional Building construction projects. Redlands Promenade land.
49
Table of Contents
Net interest (income) expense decreasedincreased for the three months ended March 31, 2014 as compared to prior periodssame period in 2013 due to higher capitalized interest from projects under construction. In addition, the Equity in Earnings from Real Estate Affiliates includesprimarily represents our share of the profit from the ONE Ala Moana condominium venture.
52
Table of Contents
The following describes the status of our active Strategic Development projectsProjects as of September 30, 2013:March 31, 2014:
The Woodlands
Hughes Landing
During July 2012, we announced plans for the first mixed-use development on Lake Woodlands called Hughes Landing. The development will encompass approximately 66 acres and is envisioned to contain up to two million square feet of office space in approximately 11 office buildings, approximately 200,000 square feet of retail and entertainment venues, 1,500 multi-family units (of which 400 will be in Phase One) and a 175-room hotel.
On September 19, 2013, we placed One Hughes Landing into service, the first office building in Hughes Landing. The property was reclassified to the Operating Assets segment.
On September 21,third quarter 2013, we began construction of Two Hughes Landing, the second Class A office building in Hughes Landing.Landing and anticipate completion of construction during the second quarter of 2014. Two Hughes Landing will be a 197,000 square foot, eight-story office building with an adjacent parking garage containing approximately 630 spaces. The building and the garage will be situated on 3.6 acres of land and isare estimated to cost approximately $48.6$49 million. WeAs of March 31, 2014 we have incurred $10.0$26.7 million of development costs (exclusive of land value) related to this project as of September 30, 2013. We continue to seek tenants for this building and anticipate completion in the second quarter of 2014.project. The project is financed by a $41.2 million non-recourse construction loan bearing interest at one-month LIBOR plus 2.65% with an initial maturity date of September 11, 2016, with two, one-year extension options.
In October 2013, we began construction of an eight-story, Class A, multi-family project within Hughes Landing called One Lake’s Edge.Edge and anticipate completion of construction in the first quarter of 2015. One Lake’s Edge will be comprised of 390 multi-family units (averaging 984 square feet per unit), 22,289 square feet of retail and an approximatelya 750 space parking garage, all situated on 2.92 acres of land. Additionally, the project will feature an amenity deck on the third floor which will house thefeature a pool, courtyard and other amenities overlooking Lake Woodlands. Completion isTotal development costs are expected in the first quarterto be approximately $88 million. As of 2015.March 31, 2014, we have incurred $15.9 million of development costs. The project hasis financed by a $73.5 million non-recourse construction loan bearing interest at one-month LIBOR plus 2.50% with an estimated costinitial maturity date of $86.8 million (exclusive of land value). We have incurred $1.4 million related to this project as of September 30, 2013, and anticipate closing on construction financing by the end of 2013.November 25, 2016, with two, one-year extension options.
During the fourth quarter 2013, we expect to beginbegan construction of Hughes Landing Retail, the 122,400123,000 square foot retail component of Hughes Landing. The project will consist of Whole Foods, an anchor tenant with 40,000 square feet of space, 32,30032,900 square feet of retail, and a 50,100 square foot restaurant row. Total development costs are expected to be approximately $36 million and as of March 31, 2014 we have incurred $7.2 million of development costs. The project is financed by a $36.6 million non-recourse construction loan bearing interest at one-month LIBOR plus 1.95% with an initial maturity date of December 20, 2016, with two, one-year extension options. The project is expected to be completed in the fourth quarter of 2014. The majority of the restaurants on restaurant row will open during the first quarter 2015. We have pre-leased 43.1% of the project as of March 31, 2014.
On December 16, 2013, we announced that we would begin construction on a Class A office project comprised of two adjacent buildings for Exxon Mobil Corporation (“ExxonMobil”). The project is expected to be completed by the fourth quarter of 2015. The West Building will be 12-stories and approximately 318,000 leasable square feet and the East Building will be 13-stories and approximately 329,000 leasable square feet. A 2,617-car structured parking garage will also be located on the 4.3 acre site and will be exclusive to the office project. Total development costs are expected to be $36.2 million (excluding land value) with construction beginning in the fourth quarterapproximately $172 million. As of 2013. WeMarch 31, 2014, we have incurred $0.6$15.2 million of projectdevelopment costs (excluding land value) as of September 30, 2013 of which $0.1$6.7 million is related to leasing costs.leasing. ExxonMobil has executed leases to occupy the entire West Building for twelve years, and 160,000 square feet in the East Building for eight years with an option to lease the remaining space before the building opens. We have pre-leased 43.8%expect to reach stabilized annual NOI, based on ExxonMobil’s current 478,000 square foot commitment, of approximately $10.7 million in 2018. If ExxonMobil exercises their option for the project as of September 30, 2013 and anticipate closing on a project financing during the fourth quarter 2013 or first quarter 2014.remaining space, stabilized annual NOI will increase to approximately $14.5 million.
DuringCreekside Village Green
Creekside Village Green is located within the fourth quarter 2013, we expect to begin construction100-acre mixed-use commercial development that is anchored by HEB grocery store and based on current planning will ultimately include 400,000 square feet of retail and office space, 800 units of multi-family, 200 units of senior living facility and an 85,000 square foot campus within the Lone Star College System. Creekside Park Village Center,Green is a 74,35274,500 square foot retail center in Creekside Park in The Woodlands. The projectwhich will consist of retail, restaurant and professional office space across two main buildings and a centrally located restaurant building. Included in the property is
50
Table of Contents
Creekside Village Green will also include a one-acre tree lined village greentree-lined park designed to be the hub of all activity within the greater 100-acre village center. The project is expected to cost $18.5 milliondevelopment. During the fourth quarter 2013 we began construction, and we anticipate the project will open in the fourth quarter of 2014. Total development costs are expected to be approximately $19 million. As of September 30, 2013,March 31, 2014, we have incurred $0.6$5.1 million of costs (excluding land value) of which $0.1 million is prepaid leasing.development costs. We plan to fund the development by using The Woodlands Master Credit Facility (described in Note 8 - Mortgages, Notes and Loan Payable). Our anticipated cash investmentWe have pre-leased 37.4% of the project as of March 31, 2014.
3831 Technology Forest Drive
In March 2014, we began development of a 95,000-square foot, four story office building which is expected to be completed by December of 2014. Kiewit Energy Group (“Kiewit”) executed a ten-year lease to occupy approximately 71,000 square feet and has an option to lease the remainder of the building. The building will be located on a 5.74-acre land parcel at 3831 Technology Forest Drive. Total development costs are expected to be approximately $20 million. As of March 31, 2014, we have incurred $1.6 million of development costs on this project of which $1.4 is related to leasing commissions. We expect the property to generate annual NOI of approximately $1.7 million in the first quarter of 2015 based on Kiewit’s current commitment of 71,000 square feet. If Kiewit exercises their option to take the remaining space or we lease this space at a comparable rent, we expect stabilized annual NOI to increase to approximately $2.1 million.
Millennium Woodlands Phase II
Millennium Woodlands Phase II, a joint venture with The Dinerstein Companies, began construction of a 314-unit Class A multi-family complex in The Woodlands Town Center in the second quarter of 2012. We contributed 4.8 acres of land at a $75.00 per square foot valuation as compared to $51.40 per square foot attributed to the Phase I
53
Table of Contents
land contribution. Budgeted construction costs are $38.4 million. Construction2012 that is expected to be completed in June 2014. On July 5, 2012, Millennium Phase II was capitalized by our contribution of 4.8 acres of land valued at $15.5 million (compared to $2.2 million book value), our partner’s contribution of $3.0 million in cash and a construction loan in the second quarteramount of 2014. The$37.7 million, which is guaranteed by our partner. Development costs are estimated to be approximately $38 million and as of March 31, 2014, the project has incurred $14.2$25.9 million of construction costs as of September 30, 2013. Our partner guaranteed the $37.7 million construction loan.development costs.
ONE Ala Moana Tower Condominium Project
In 2011, we and an entity jointly owned by two local development partners formed a joint venture called HHMK Development, LLC (“HHMK Development”). The joint venture was created to explore the development of a 23-story luxury condominium tower above an existing parking structure at Ala Moana Center. We own 50% and our partner jointly owns the remaining 50%. In 2012, we formed anothera 50/50 joint venture, KR Holdings, LLC (“KR Holdings”), with the same two local development partners. On September 17, 2012, KR Holdings closed on $40.0 million non-recourse mezzanine financing commitments with List Island Properties, LLCThe venture is responsible for the construction of a luxury 23-story, 206-unit condominium tower consisting of one, two and A & B Properties, Inc., including funding for $3.0 million of pre-development costs.
During the fourth quarter of 2012, we sold allthree-bedroom units ranging from 760 to 4,100 square feet. All of the available condominium units have been sold at an average price of $1.6 million, or approximately $1,170 per square foot and as of July 1, 2013,March 31, 2014, the venture had collected all $66.2$68.0 million of buyer deposits.deposits, representing 20% of contracted sales prices. The 206-unit tower will consistis being constructed above an existing parking structure at Ala Moana Center, a successful regional mall owned by a third party. Construction commenced in April of one, two2013 and three-bedroom units ranging from 760 to 4,100 square feet. During April 2013, we commenced construction. The project is expected to cost approximately $241.3 million, and approximately $75.6 million (inclusive of land value), or 31.3% of expected project costs have been incurred by the venture as of September 30, 2013. The project remains on schedule and we anticipate that ONE Ala Moana will be completed by the end of 2014. The venture expects to invest a total of $265.1 million, which includes construction, selling and all financing costs. As of March 31, 2014 the venture had incurred $143.4 million (inclusive of condominium rights) of total development costs. The project is financed by a $132.0 million construction loan and two $20.0 million non-recourse mezzanine loans with List Island Properties and A & B Properties. The construction loan is non-recourse, bears interest at one-month LIBOR plus 3.00%, is secured by the condominiums and buyers’ deposits, and matures May 15, 2016, with the option to extend for one year. The mezzanine loans have a blended interest rate of 12% and mature on April 30, 2018 with the option to extend for one year. In addition to the mezzanine loans, A & B Properties and List Island Properties both have a profit interest in KR Holdings, which entitles them to receive a share of the profit, after a return of our capital plus a 13% preferred return on our capital. A & B Properties’ participation is capped at $3.0 million. As of March 31, 2014, the project was approximately 52% complete, and for the three months then ended our share of the earnings was $4.0 million.
KR Holdings closed onUpon closing of the condominium project construction loan on May 15, 2013. Upon closing of the loan2013 and pursuant to the terms of the venture agreement, we sold our condominium rights to KR Holdings for $47.5 million and received net cash proceeds of $30.8 million and an equity interest of 50% in KR Holdings. Our partner contributed cash of $16.8 million for its 50% equity interest. Additionally, KR Holdings reimbursed HHMK Development for its development expenditures related to the project. We also received a cash distribution from HHMK Development in the amount of $3.1 million representing the return of our investment. Due to our continuing involvement in KR Holdings, we accounted for the transaction as a partial sale representing 50% of the $47.5 million sales value of the condominium right,rights, and accordingly, we recognized net profit of $11.8 million. Thethe remaining $23.7 million sales value of the condominium rights will be50% is being recognized on the same percentage of completion basis as KR Holdings. As of September 30, 2013,Since the project was 31.3% complete, andconstruction loan closing through March 31, 2014, we have recognized an additional $0.4 million and $3.7$36.1 million of profit on the sale for the three and nine months ended September 30, 2013.
The project is financed by a $132.0$47.5 million construction loan. The loan is non-recourse, bears interest at one-month LIBOR plus 3.00%, is secured by the condominiums and buyers’ deposits, and matures May 15, 2016, with the option to extend for one year. Additionally, both of the $20.0 million non-recourse mezzanine loan commitments with List Island Properties and A&B Properties were drawn in full on May 15, 2013. These loans have a blended interest rate of 12% and mature on April 30, 2018 with the option to extend for one year. In addition to the mezzanine loans, A&B Properties and List Island Properties both have a profit interest in KR Holdings, which entitles them to receive a share of the profit, after a return of our capital plus a 13% preferred return on our capital. A&B Properties’ participation is capped at $3.0 million. KR Holdings determined that thesales value of the buyer deposits qualified as a sufficient investment by the buyers to recognize revenue using the percentage of completion method. Equity in earnings from Real Estate Affiliates includes $2.7 million and $7.9 million forcondominium rights. For the three and nine months ended September 30, 2013, respectively, which represents our shareMarch 31, 2014 we recognized $3.1 million sales value for a profit of income recognized by KR Holdings.$1.6 million.
5451
Table of Contents
Summerlin
The Shops at Summerlin
During the second quarter of 2013, we commenced construction of The Shops at Summerlin, an approximate 106-acre project within our 400-acre site located in downtown Summerlin.Summerlin and anticipate completion in the fall of 2014. The Shops at Summerlin will be approximately 1.6 million square feet and will consist of a 1.1 million square foot Fashion Center which is designed to have three anchor tenants, small-shop retail and restaurants. Additionally, the project will include an approximate 200,000 square foot office building and approximately 280,000 square feet of big box and junior anchor retail space adjacent to the Fashion Center. In 2012Total estimated development costs are $391 million and as of March 31, 2014, we obtained commitments fromhave incurred $181.1 million of development costs (exclusive of land value). Approximately 48.2% of the space has been committed which includes executed agreements with two major department store anchors, Macy’s and Dillard’s, for approximately 380,000 square feet and on July 29, 2013 we executedleasing commitments from a ten-year lease withstrong roster of retailers and restaurants, including Michael Kors, Sephora, True Religion, Victoria Secret, Nordstrom Rack, American Eagle, The Art of Shaving, Bath & Body Works, Buckle, Clark’s, Everything But Water, It’s Sugar, Old Navy, Pandora, Resto Lounge, Sur La Table, Teavana, Ulta, Chico’s, Francesca’s Collection, Kay Jewelers, New Balance, Soma, White House/Black Market, Trader Joe’s and Crave Restaurant.
Summerlin Apartments, LLC
On January 24, 2014, we entered into a joint venture with a national multi-family real estate developer, The Calida Group (“Calida”), to construct, own and operate a 124-unit gated luxury apartment development, which we believe will be the first of its kind in the Las Vegas Valley. We and our partner each own 50% of the venture, and unanimous consent of the partners is required for 35,473 square feet.all major decisions. This project represents the first residential development in Summerlin’s 400-acre downtown and is located within walking distance to The Shops at Summerlin. We will contribute a 5.5-acre parcel of land with an agreed value of $3.2 million in exchange for a 50% interest in the venture when construction financing closes. Our partner will contribute cash for their 50% interest, act as the development manager, fund all pre-development activities, obtain construction financing and provide any guarantees required by the lender. Upon a sale of the property, we are currently seeking financing forentitled to 100% of the project.proceeds in excess of an amount determined by applying a 7.0% capitalization rate to NOI. The projectventure is expected to cost approximately $391 millionbegin construction in the fall of 2014 with completion anticipated ata projected second quarter 2015 opening for the first phase and the final phase being opened by the end of 2014. We have incurred $52.5 million of project costs (exclusive of land value) as of September 30, 2013 of which $0.1 million represents pre-leasing costs.2015.
The Metropolitan Downtown Columbia Project
On April 12, 2012, Columbia Parcel D venture, in which we are a 50% partner with Kettler, Inc. (“Kettler”), a multi-family developer, received approval of the final development plan component of the entitlement process for the first phase. The entitlement provides a density plan for up to 817 residential units, and up to 76,000 square feet of retail to be developed on two parcels. One parcel includes The Metropolitan (Parcel D)(“Parcel D”) which will be a 380-unit apartment building, and the second parcel will include 437 multi-family units (Parcel C)a 437-unit apartment building (“Parcel C”).
The Columbia Parcel D venture began construction of The Metropolitan in February 2013 and completion is expected in the fourth quarter of 2014. The total project budget is $96.9estimated development costs are approximately $97 million including ourland value and as of March 31, 2014 the venture has incurred $46.5 million of development costs. In 2013, we contributed land valueto the venture valued at $20.3 million and received a net distribution of $20.3$3.9 million. As of September 30, 2013,Our total capital balance in the venture is $16.4 million and our total net investment for this project is $5.8$3.5 million.
On July 11, 2013, the The joint venture closedobtained a $64.1 million construction loan which is non-recourse to us. The loan bears interest at one-month LIBOR plus 2.4% and matures in July 2020. At loan closing, our land contribution was valued at $20.3 million and Kettler contributed $13.3 million in cash, of which $7.0 million was distributed to us. Both we and Kettler are required to each make future contributions of $3.1 million, to the joint venture in accordance with the loan agreement, thus increasing our total capital account to $16.4 million. This transaction was accounted for as a partial sale of the land for which we recognized a net profit of $0.7 million. As of September 30, 2013, we have contributed $1.7 million of the $3.1 million to the joint venture.
On October 4, 2013, we entered into a joint venture agreement with Kettler to construct a 437-unit, Class A apartment building with 31,000 square feet of ground floor retail on Parcel C. We contributed approximately five acres of land having an estimateda book value of $4.0 million, toin exchange for a 50% interest in the venture. Our partner will provide construction and property management services, including the funding and oversight of development activities, as well as obtaining construction financing. When the joint venture. The transaction valuesventure closes on a construction loan our land atinterest in the joint venture will be increased to $23.4 million or $53,500 per constructed unit. When the venture closes on the construction loan and upon completionAs of certain other conditions, including obtaining completed site development and construction plans and an approvedMarch 31, 2014, our total net investment in this project budget, our partner will be required to contribute cash to the venture.was $6.5 million.
5552
Table of Contents
The following table summarizes our projects under construction, and related debt, for Operating Assets and Strategic Developments as of March 31, 2014. As further described in the footnotes below, we are documenting construction financing of approximately $312.0 million for our Summerlin project and are seeking construction financing of approximately $143.0 million for our ExxonMobil Build-to-Suit project at Hughes Landing. We expect to close construction financing on both of these projects by the end of the second quarter 2014.
($ in thousands)
Announced Project | | Total Estimated
Costs (a) | | Costs Paid Through
March 31, 2014 (b) | | Estimated Remaining
to be Spent | | Committed/
Allocated
Debt (c) | | Amount Drawn
Through March
31, 2014 | | Remaining Debt
to be Drawn | | Estimated Costs Remaining in
Excess of Remaining Financing to
be Drawn (d) | | Estimated
Completion
Date | |
Operating Assets | | (A) | | (B) | | (A) - (B) = (C) | | (D) | | (E) | | (D) - (E) = (F) | | (C) - (F) = (G) | | | |
Columbia Regional Building | | $ | 24,616 | | $ | 17,330 | | $ | 7,286 | | $ | 23,008 | | $ | 14,926 | | $ | 8,082 | | $ | (796 | ) | Q4 2014 | |
One Hughes Landing | | 49,615 | | 40,365 | | 9,250 | | 38,000 | | 27,593 | | 10,407 | | (1,157 | ) | Complete(e) | |
Outlet Collection at Riverwalk | | 81,778 | | 37,757 | | 44,021 | | 60,000 | | 14,733 | | 45,267 | | (1,246 | ) | Q2 2014 | |
Seaport - Pier 17 | | 424,880 | | 27,037 | | 397,843 | | — | | — | | — | | 397,843 | | Q4 2016 | |
The Woodlands Resort & Conference Center | | 76,714 | | 32,609 | | 44,105 | | 48,900 | | 8,936 | | 39,964 | | 4,141 | | Q3 2014 | |
Total Operating Assets | | 657,603 | | 155,098 | | 502,505 | | 169,908 | | 66,188 | | 103,720 | | 398,785 | | | |
| | | | | | | | | | | | | | | | | |
Strategic Developments | | | | | | | | | | | | | | | | | |
Two Hughes Landing | | 48,603 | | 21,497 | | 27,106 | | 41,230 | | 9,396 | | 31,834 | | (4,728 | ) | Q2 2014 | |
Creekside Village Green | | 18,536 | | 2,796 | | 15,740 | | 18,536 | | 2,796 | | 15,740 | | — | (f) | Q4 2014 | |
ExxonMobil Build-to-Suit | | 171,489 | | 9,670 | | 161,819 | | — | | — | | — | | 161,819 | (g) | Q4 2015 | |
Hughes Landing Retail | | 36,207 | | 4,727 | | 31,480 | | 36,575 | | 918 | | 35,657 | | (4,177 | ) | Q4 2014 | |
One Lake’s Edge | | 88,494 | | 11,348 | | 77,146 | | 73,525 | | — | | 73,525 | | 3,621 | | Q1 2015 | |
3831 Technology Forest Drive | | 19,518 | | 175 | | 19,343 | | 19,518 | | 175 | | 19,343 | | — | (h) | Q4 2014 | |
The Shops at Summerlin | | 391,369 | | 115,534 | | 275,835 | | — | | — | | — | | 275,835 | (i) | Q4 2014 | |
Total Strategic Developments | | 774,216 | | 165,747 | | 608,469 | | 189,384 | | 13,285 | | 176,099 | | 432,370 | | | |
| | | | | | | | | | | | | | | | | |
Combined Total at March 31, 2014 | | $ | 1,431,819 | | $ | 320,845 | | $ | 1,110,974 | | $ | 359,292 | | $ | 79,473 | | $ | 279,819 | | $ | 831,155 | | | |
| | | | | | | | | | | | | | | | | |
| | | | | | Projects For Which We Are Seeking Financing: | | | | | |
| | | | | | Exxon Mobil Corp Build-to-Suit | | 142,900 | (g) | | |
| | | | | | The Shops at Summerlin | | 311,800 | (i) | | |
| | | | | | Est. Costs to be funded net of financing assuming closing on Exxon Mobil Corp Build-to-Suit and The Shops at Summerlin | | $ | 376,455 | | | |
(a) Total Estimated Costs represent all costs to be incurred on the project which includes, construction costs, demolition costs, marketing costs, capitalized leasing and deferred financing and excludes capitalized interest allocated to the project.
(b) Costs Paid Through March 31, 2014 includes construction costs, demolition costs, marketing costs, capitalized leasing, payroll and deferred financing costs, but excludes retainage payable and capitalized corporate interest.
(c) Committed Debt details:
· Riverwalk - total commitment of $64,400, which includes $60,000 for construction and a $4,400 earnout which is available after completion and the achievement of operational covenants.
·- The Woodlands Resort & Conference Center - a total commitment of $95,000, which includes $48,900 for construction, a $10,000 earnout and $36,100 which refinanced prior mortgage debt.
(d) Negative balances represent cash to be received in excess of Estimated Remaining to be Spent as we had costs, primarily related to March spending that had not been financed. We expect to finance these costs in the future.
(e) This project was placed in service during 2013 but still requires some remaining capital to be invested.
(f) Creekside Village will be financed by The Woodlands master credit facility.
(g) We are seeking financing and expect to close on a $143 million construction loan during the second quarter of 2014.
(h) 3831 Technology Forest Drive will be financed by The Woodlands Master Credit Facility.
(i) We are currently documenting construction financing approximating $312 million and expect to close during the second quarter of 2014.
53
Table of Contents
General and Administrative and Other Expenses
General and administrative, warrant liability gain(loss),loss, reduction in tax indemnity receivable, provision for income taxes and equity in earnings from Real Estate Affiliates are summarized as follows:
| | Three Months Ended September 30, | | Nine Months Ended September 30, | | | Three Months Ended March 31, | |
| | 2013 | | 2012 | | 2013 | | 2012 | | | 2014 | | 2013 | |
| | (In thousands) | | (In thousands) | | | (In thousands) | |
General and administrative | | $ | 11,914 | | $ | 11,464 | | $ | 34,310 | | $ | 28,021 | | | $ | 16,882 | | $ | 11,171 | |
Warrant liability loss | | (4,479 | ) | (64,303 | ) | (148,706 | ) | (162,724 | ) | | 96,440 | | 33,027 | |
Increase (reduction) in tax indemnity receivable | | 730 | | (2,873 | ) | (8,673 | ) | (11,655 | ) | |
Reduction in tax indemnity receivable | | | — | | 1,904 | |
Other income | | (3,662 | ) | (2,125 | ) | (8,118 | ) | (2,125 | ) | | (8,075 | ) | — | |
Provision for income taxes | | 5,172 | | 2,618 | | 21,012 | | 7,703 | | | 4,773 | | 2,479 | |
Equity in earnings from Real Estate Affiliates | | 3,594 | | 310 | | 12,034 | | 3,432 | | |
Equity in earnings from Real Estate and Other Affiliates | | | (6,068 | ) | (2,733 | ) |
|
General and administrative expenses increased $0.5$5.7 million during the three months ended September 30, 2013 to $11.9 million asMarch 31, 2014 compared to the same period in 20122013. Non-cash stock based compensation amortization included in general and administrative expenses was $1.8 million and $1.1 million for the three months ended March 31, 2014 and 2013, respectively. The $5.7 million overall increase is primarily due to increased compensation and benefit expenses. General and administrative expenses increased $6.3$2.0 million of additional performance awards relating to 2013 that were approved during the nine months ended September 30, 2013 as compared to 2012 primarilyfirst quarter 2014, $0.9 million of additional compensation costs due to increased compensation, benefitsheadcount, $1.1 million of increased travel related expenses and travel expenses of approximately $5.0 million and professionaladditional legal fees of $0.7$0.5 million. The increases in compensation and benefit expenses are due
Other income for the three months ended March 31, 2014 includes a $7.8 million pre-tax gain recognized on insurance proceeds received relating to the addition of administrative staffing to support our developments as they begin construction.South Street Seaport.
The warrant liability loss for the three and nine months ended September 30,March 31, 2014 and 2013 was lower than the same periods in 2012 due to less appreciation in theour stock price, in 2013 impactingthereby increasing the valuevalues of the warrants and 6.1 million fewer outstanding warrants during 2013.
The reduction in tax indemnity receivable of $8.7 million for the nine months ended September 30, 2013 relates to the utilization of tax assets. Please refer to Note 10 - Income Taxes for more information related to the increase in tax indemnity receivable for the three months ended September 30, 2013.
Other income for the three months ended September 30, 2013 includes a $3.0 million pre-tax gain recognized on insurance proceeds received to date at South Street Seaport related to property damage suffered as a result of Superstorm Sandy as well as the $0.6 million pre-tax gain recognized on the sale of our Rio West property. Other income for the nine months ended September 30, 2013 also includes a $4.5 million favorable legal settlement relating to the British Petroleum oil spill in the Gulf of Mexico in 2010. Other income for the three and nine months ended September 30, 2012 includes $2.1 million favorable legal settlement from three homebuilders.warrants.
The increase in provision for income taxes of $2.6$2.3 million for the three months ended September 30, 2013March 31, 2014 was primarily attributable to a deferred tax expense taken as a result of income for the period. The increase in provision for income taxes of $13.3 million for the nine months ended September 30, 2013 was primarily attributable to increases in operating income as compared to the same period in 2012. The provision for income taxes was also impacted by changes in2013, reduction of valuation allowances unrecognized tax benefit interest expensein 2013, and other permanent items.
We have significant permanent differences, primarily from warrant liability gains and losses, interest income on the tax indemnity receivable, and changes in valuation allowances that cause our effective tax rate to deviate greatly from statutory rates. The effective tax rates based upon actual operating results were 41.4% and (29.5)(5.9)% for the three and nine months ended September 30, 2013, respectively,March 31, 2014 compared to (5.6)% and (6.4)(12)% for the three and nine months ended September 30, 2012, respectively.March 31, 2013. The changes in the tax rate were primarily attributable to the changes in the warrant liability, and the valuation allowance.allowance, and other permanent items.
The equity in earnings from Real Estate Affiliates of $3.6 million and $12.0$6.1 million for the three and nine months ended September 30, 2013, respectively,March 31, 2014 increased overfor the same periodsperiod in 20122013 primarily due to the recognition of $4.0 million representing our share of the profit related to the ONE Ala Moana condominium project on a percentage of completion basis.
For the three and nine months ended September 30, 2013, we capitalized $2.1 million and $6.4 million, respectively, of internal costs related to our MPC segment, as compared to $1.9 million and $5.8 million for the same periods inproject.
5654
Table of Contents
2012. Of thoseThe following table represents our capitalized internal costs compensation costs represented $1.3 million and $4.2 millionby segment for the three and nine months ended September 30, 2013, respectively, as compared to $1.2 millionMarch 31, 2014 and $3.7 million for the same periods in 2012. We capitalized $1.3 million and $3.5 million of internal costs related to the major redevelopment of assets in our Operating Assets Segment for the three and nine months ended September 30, 2013, respectively, as compared to $0.9 million and $2.6 million for the same periods in 2012. Approximately $1.1 million and $2.9 million of these costs were related to compensation costs for the three and nine months ended September 30, 2013, respectively, as compared to $0.6 million and $2.0 million for the same periods in 2012. Additionally, we capitalized $1.0 million and $2.8 million for the three and nine months ended September 30, 2013, respectively, of internal costs in our Strategic Developments Segment as compared to $1.0 million and $1.9 million for the same periods in 2012. Approximately $1.0 million and $2.4 million of these costs were related to compensation costs for three and nine months ended September 30, 2013, respectively, as compared to $0.8 million and $1.5 million for the same periods in 2012. 2013:
| | Capitalized internal costs | | Capitalized internal costs related
to compensation costs | |
| | Three Months Ended March 31, | | Three Months Ended March 31, | |
| | 2014 | | 2013 | | 2014 | | 2013 | |
| | (In millions) | | (In millions) | |
MPC segment | | $ | 1.5 | | $ | 2.0 | | $ | 1.3 | | $ | 1.4 | |
Operating Assets segment | | 2.6 | | 1.0 | | 2.2 | | 0.8 | |
Strategic Developments segment | | 3.1 | | 1.1 | | 2.7 | | 0.9 | |
Total | | $ | 7.2 | | $ | 4.1 | | $ | 6.2 | | $ | 3.1 | |
Capitalized internal costs (which include compensation costs) have increased with respect to our Operating Assets and Strategic Developments segments as we have increased staffing and related costs from 2013 to correspond with our increase in development activities compared to 2012.activities.
Liquidity and Capital Resources
Our primary sources of cash include cash flow from land sales in our MPC segment, and cash generated from our operating assets, first mortgage financings secured by our assets and the corporate debt market.proceeds from our Senior Notes offering. Our primary uses of cash include working capital, overhead, debt service, property improvements pre-development and development costs. We believe that our sources of cash, including existing cash on hand, will provide sufficient liquidity to meet our existing non-discretionary obligations and anticipated ordinary course operating expenses for at least the next twelve months. The development and re-development opportunities in our Operating Assets and Strategic Developments segments are capital intensive and will require significant additional funding. Most of these costs are currently discretionary, which means that we could discontinue spending on these activities if our liquidity profile, economic conditions or the feasibility of projects changes. We currently intend to raise this additional funding with a mix of construction, bridge and long-term financings, by entering into joint venture arrangements and the sale of non-core assets.assets at the appropriate time.
Total outstandingAs of March 31, 2014, our consolidated debt was $766.0$1,559.4 million was outstanding as of September 30, 2013. Ourand our share of the debt of our Real Estate Affiliates aggregated $33.6$46.9 million. Please refer to Note 8 — Mortgages, Notes and Loans Payable to our condensed consolidated financial statements for a table showing our debt maturity dates.
On October 2, 2013, we issued $750.0 million in aggregate principal amount of 6.875% Senior Notes due 2021. We intendhave used and will continue to use the net proceeds for development, acquisitions and other general corporate purposes. Interest is payable semiannually, on April 1 and October 1 of each year starting in April 2014. We may redeem all or part of the Notes at any time on or after October 1, 2016. At any time prior to October 1, 2016, we may redeem up to 35% of the Notes using the proceeds from equity offerings or we may redeem some or all of the Notes at a price equal to 106.875% of the principal amount with a declining call premium thereafter to maturity. The Senior Notes contain customary terms and covenants for non-investment grade senior notes and have no maintenance covenants.
Subsequent to September 30, 2013, we closed on a $64.4 million 50% recourse construction loan to fund The Outlet Collection at Riverwalk project. The recourse obligation will be reduced to 25%including events of the outstanding principal balance upon meeting certain performance obligations.default.
The following table summarizes our Net Debt on a segment basis as of September 30, 2013.March 31, 2014. Net Debt is defined as our share of mortgages, notes and loans payable, at our ownership share, reduced by short-term liquidity sources to satisfy such obligations such as our ownership share of cash and cash equivalents and SID receivables. Although Net Debt is not a recognized GAAP financial measure, it is readily computable from existing GAAP information and we believe, as with our other non-GAAP measures, that such information is useful to our investors and other users of our financial statements.
5755
Table of Contents
Segment Basis Net Debt
| | Master | | | | | | | | | | Total | | | Master | | | | | | | | | | Total | |
| | Planned | | Operating | | Strategic | | Segment | | Non-Segment | | September 30, | | | Planned | | Operating | | Strategic | | Segment | | Non-Segment | | March 31, | |
Segment Basis (a) | | Communities | | Assets | | Developments | | Totals | | Amounts | | 2013 | | | Communities | | Assets | | Developments | | Totals | | Amounts | | 2014 | |
| | (In thousands) | | | (In thousands) | |
Mortgages, notes and loans payable | | $ | 233,322 | (b) | $ | 508,132 | (c) | $ | 36,387 | (d) | $ | 777,841 | | $ | 21,694 | | $ | 799,535 | | | $ | 221,567 | | $ | 562,008 | (b) | $ | 59,965 | (c) | $ | 843,540 | | $ | 762,764 | | $ | 1,606,304 | |
Less: cash and cash equivalents | | (42,414 | ) | (49,178 | )(e) | (3,968 | )(f) | (95,560 | ) | (118,210 | ) | (213,770 | ) | | (38,422 | ) | (41,725 | )(d) | (11,015 | )(e) | (91,162 | ) | (737,288 | ) | (828,450 | ) |
Special Improvement District receivables | | (39,667 | ) | — | | — | | (39,667 | ) | — | | (39,667 | ) | | (39,712 | ) | — | | — | | (39,712 | ) | — | | (39,712 | ) |
Municipal Utility District receivables | | (125,344 | ) | — | | — | | (125,344 | ) | — | | (125,344 | ) | | (106,669 | ) | — | | — | | (106,669 | ) | — | | (106,669 | ) |
Net Debt | | $ | 25,897 | | $ | 458,954 | | $ | 32,419 | | $ | 517,270 | | $ | (96,516 | ) | $ | 420,754 | | | $ | 36,764 | | $ | 520,283 | | $ | 48,950 | | $ | 605,997 | | $ | 25,476 | | $ | 631,473 | |
(a) | Please refer to Note 15 - Segments. |
(b) | Includes The Woodlands’ $176.7 million Master Credit Facility outstanding balance. |
(c)
| Includes our $1.3 million share of debt of our Real Estate and Other Affliates in Operating Assets segment (Woodlands-Sarofim #1).
|
(d)(c)
| Includes our $32.2$45.6 million share of debt of our Real Estate and Other Affliates in Strategic Developments segment (KR Holdings, LLC, Millennium Woodlands Phase II, LLC and Millennium Phase II)The Metropolitan Downtown Columbia Project). |
(e)(d)
| Includes our $0.9$0.7 million share of cash and cash equivalents of our Real Estate and Other Affliates in Operating Assets segment (Woodlands-Sarofim #1, Summerlin Las Vegas Baseball Club, LLC, and Stewart Title). |
(f)(e)
| Includes our $2.1$0.6 million share of cash and cash equivalent of our Real Estate and Other Affliates in Strategic Developments segment (KR Holdings, LLC, and HHMK Development, LLC)LLC, Parcel C and The Metropolitan Downtown Columbia Project). |
Cash Flows
Operating Activities
MPC land sales haveMaster Planned Community development has a significant impact on our business. The cash flows and earnings from the business can be muchvary more variable than from our Operating Assetsoperating assets because the MPC business generates revenues from land sales rather than recurring contractual revenues from operating leases. MPC landLand sales are a substantial portion of our cash flows from operating activities and are partially offset by MPC development expenditures.
CashNet cash provided by operating activities was $108.8$26.2 million for the ninethree months ended September 30, 2013 asMarch 31, 2014 compared to net cash provided by operating activities of $59.3$16.6 million for the ninethree months ended September 30, 2012.March 31, 2013. The $49.5$9.6 million increase in cash provided by operating activities for the nine months ended September 30, 2013 compared to the same period in 2012 was primarily the result of higher MUD collections of $22.5 million and $7.8 million in proceeds received in the collection of $47.5 millionfirst quarter 2014 from our insurance carriers related to the sale of our condominium air rights to a joint venture, a $46.7 million increase in MPC land sales, $3.0 million in insurance proceeds related to theSuperstorm Sandy claim at South Street Seaport and the receipt of $4.5 million legal settlement at Riverwalk, offset by increased condominium development expenditures of $10.9$5.6 million, MPC expendituresincreased general and administrative expenses of $28.0$5.7 million, primarilyhigher leasing commissions of $5.5 million at The Woodlands,our projects under development and $6.0 million in increased compensation, benefits and professional fees due to staff additions necessary to support growth. We expect Summerlin MPC expenditures to ramp up through the remainderdemolition costs of the year to complete land development necessary to fulfill sales currently under contract.$2.5 million.
Investing Activities
CashNet cash used in investing activities was $211.5$140.8 million and $56.6 million for the ninethree months ended September 30,March 31, 2014 and 2013, as compared to $20.3 million for the same period in 2012.
respectively. Cash used for development of real estate and property expenditures increased $139.2was $140.5 million to $176.0and $43.9 million for the ninethree months ended September 30,March 31, 2014 and 2013, compared to $36.8 million for nine months ended September 30, 2012.respectively. The increased development expenditures in 2014 compared to the same periods in 2013 relate primarily to the construction of The Shops at Summerlin, One Hughes Landing Multi-family, Two Hughes Landing, 3 Waterway, Ward Centers,South Street Seaport, Landmark, and Riverwalk. The increase in restricted cash of $22.5 million for the nine months ended September 30, 2013 compared to the same period in 2012 was primarily due to the receipt of $14.6 million in condominium deposits on the ONE Ala Moana condominium tower project in the first nine months of 2013 compared to a $5.7 million reduction in restricted cash in the first nine months of 2012 due to escrow restrictions being lifted on the former debt for The Woodlands Resort & Conference Center and Conference Center.
58
Table of Contentsthe Outlet Collection at Riverwalk.
Financing Activities
Our financing activity in the first nine months of September 30, 2013 provided cash of $84.3 million, an increase of $78.0 million over theNet cash provided by financing activities of $6.4was $46.7 million and $11.3 million for the ninethree months ended September 30, 2012.
DuringMarch 31, 2014 and 2013, respectively. Cash provided by financing activities for 2014 period includes loan proceeds of $48.8 million from draws on construction loans. Comparatively, for the ninethree months ended September 30,March 31, 2013, we received loan proceeds of $360.8 million from the issuance of$68.3 million. Principal payments on mortgages, notes and loans payable. The proceeds partially funded development activity atpayable were $2.1 million and $57.0 million for the Bridgeland MPC, funded development of 3 Waterway Square and One Hughes Landing, and refinanced existing debt to extend maturities and to take advantage of lower interest rates. During the ninethree months ended September 30,March 31, 2014 and 2013, we made principal payments of $271.9 million. Comparatively, in the nine month period ended September 30, 2012, we received loan proceeds of $44.8 million and made principal payments of $37.2 million.
Contractual Cash Obligations and Commitments
The following table includes significant updates to our contractual obligations and commitments made during the third quarter 2013. Additional information regarding our contractual obligations and commitments as well as items not included below can be found under the heading “Contractual Cash Obligations and Commitments” in our 2012 Form 10-K.
The following table summarizes our contractual obligations as of September 30, 2013:
Note 16: Commitments
(In thousands) | | Q4 2013 | | 2014 | | 2015 | | 2016 | | 2017 | | 2018 | | Subsequent
/ Other | | Total | |
| | | | | | | | | | | | | | | | | |
Mortgages, notes and loans payable (a) | | $ | 7,338 | | $ | 5,806 | | $ | 25,740 | | $ | 242,997 | | $ | 26,728 | | $ | 204,057 | | $ | 253,314 | | $ | 765,980 | |
Interest payments (b) | | 1,705 | | 6,798 | | 6,667 | | 5,921 | | 5,489 | | 4,536 | | 25,300 | | 56,416 | |
Ground lease payments (c) | | 2,676 | | 10,482 | | 10,362 | | 9,704 | | 8,663 | | 8,377 | | 303,266 | | 353,530 | |
Total | | $ | 11,719 | | $ | 23,086 | | $ | 42,769 | | $ | 258,622 | | $ | 40,880 | | $ | 216,970 | | $ | 581,880 | | $ | 1,175,926 | |
(a) Refinanced The Woodlands Credit Facility $250.0 million, new financing for 3 Waterway $52.0 million, One Hughes Landing $38.0 million, Columbia Regional Building $23.0 million and Other Corporate financing $21.7 million.
(b) Interest is based on the borrowings that are presently outstanding and the timing of payments indicated in the above table.
(c) Executed new lease at South Street Seaport.
The table above excludes the $750.0 million 6.875% Senior Notes due 2021 issued on October 2, 2013. Annual debt service on the notes is $51.6 million.respectively.
Off-Balance Sheet Financing Arrangements
We do not have any material off-balance sheet financing arrangements. Although we have interests in certain property owning non-consolidated ventures which have mortgage financing, the financings are non-recourse to us and totaled $61.6$81.5 million as of September 30, 2013.March 31, 2014.
56
Table of Contents
REIT Requirements
In order for Victoria Ward to remain qualified as a REIT for federal income tax purposes, Victoria Ward must meet a number of organizational and operational requirements, including a requirement that it distribute or pay tax on 100% of its capital gains and distribute at least 90% of its ordinary taxable income to its stockholders, including us. We intend to revoke Victoria Ward’s REIT status sometime in the next few years, at which time Victoria Ward will become a regular “C” corporation subsidiary. Please refer to Note 109 — Income Taxes for more detail on Victoria Ward’s ability to remain qualified as a REIT.
Seasonality
Generally, revenues from our Operating Assets segment, Master Planned Communities segment and Strategic Developments segment are not subject to seasonal variations; however, rental incomes for certain retail tenants are subject to overage rent terms, which are based on tenant sales. These retail tenants are generally subject to seasonal variations, with a significant portion of their sales and earnings occurring during the last two months of the year. As such, our rental income is higher in the fourth quarter of each year.
59
Table of Contents
Critical Accounting Policies
Critical accounting policies are those that are both significant to the overall presentation of our financial condition and results of operations and require management to make difficult, complex or subjective judgments. There have been no changes to our critical accounting policies.
Recently Issued Accounting Pronouncements
We have implemented all new accounting pronouncements that are in effect. These pronouncements did not have any material impact on the financial statements unless otherwise disclosed, and we do not believe that there are any other new accounting pronouncements that have been issued that might have a material impact on our financial position or results of operations.
In April 2014, the FASB issued ASU 2014-08, “Presentation of Financial Statements (Topic 205) and Property, Plant, and Equipment (Topic 360): Reporting Discontinued Operations and Disclosures of Disposals of Components of an Entity”. The amendments in the ASU change the criteria for reporting discontinued operations while enhancing disclosures in this area. The new guidance requires expanded disclosures about discontinued operations that will provide financial statement users with more information about the assets, liabilities, income, and expenses of discontinued operations. The new guidance also requires disclosure of the pre-tax income attributable to a disposal of a significant part of an organization that does not qualify for discontinued operations reporting. The amendments in the ASU are effective in the first quarter of 2015 for public organizations with calendar year ends. Early adoption is permitted. The Company elects to adopt this guidance as of the date of this filing. There is no impact of the adoption on the Company’s consolidated financial statements because the Company does not have any discontinued operations
ITEM 3.QUANTITATIVE AND QUALITATIVE DISCLOSURES ABOUT MARKET RISK
We are subject to interest rate risk with respect to our fixed-rate financing in that changes in interest rates will impact the fair value of our fixed-rate financing and with respect to our variable rate financings in that increases in interest rates couldwill increase our payments under these variable rates. With respect to fixed rate financings, increases in interest rates could make it more difficult to refinance such debt when due. As of September 30, 2013,March 31, 2014, we had $498.2$557.0 million of variable rate debt outstanding of which $172.0 million has been swapped to a fixed-rate. Approximately $176.7 million of the $326.2$385.0 million of total variable rate debt that has not been swapped to a fixed rate is represented by the Master Credit Facility at The Woodlands. Due to the revolving nature of this type of debt, it is generally inefficient to use interest rate swaps as a hedging instrument; rather, we have purchased an interest rate cap having a $100.0 million notional amount for this facility to mitigate our exposure to rising interest rates. We also did not swap to a fixed rate $85.7$95.7 million of the outstanding balance on the Victoria Ward financing because it is structured to permit partial repayments to release collateral for redevelopment. Due to the uncertain timing of such partial repayments, hedging this portion of the outstanding balance is inefficient. As of September 30, 2013,March 31, 2014, annual interest costs would increase approximately $3.3$3.85 million for every 1%1.00% increase in floating interest rates. Generally, our interest costs are capitalized due to the level of assets we currently have under development; therefore, the impact of
57
Table of Contents
a change in our interest rate on our Condensed Consolidated Statements of Operations and Condensed Consolidated Statements of Comprehensive Income (Loss) is expected to be minimal.minimal, but we would incur higher payments. For additional information concerning our debt and management’s estimation process to arrive at a fair value of our debt as required by GAAP, reference is madeplease refer to the Liquidity and Capital Resources section of Item“Item 2 — Management’s Discussion and Analysis of Financial Condition and Results of Operations,Operations”, Note 2 — Summary of Significant Accounting Policies to our Condensed Consolidated Financial Statements, Note 8 — Mortgages, Notes and LoanLoans Payable and Note 13 — Derivative Instruments and Hedging Activities in our Annual Report. See also Note 16 — Subsequent Events regarding the $750.0 million Senior Notes offering that occurred in October 2013, which will also bear the same market risks as our other fixed rate debt as noted above. We intend to manage a portion of our variable interest rate exposure by using interest rate swaps and caps.
ITEM 4.CONTROLS AND PROCEDURES
Disclosure Controls and Procedures
We maintain disclosure controls and procedures (as defined in Rule 13(a)-15(e) under the Exchange Act) that are designed to provide reasonable assurance that information required to be disclosed in our reports to the SEC is recorded, processed, summarized and reported within the time periods specified in the SEC’s rules and forms, and that such information is accumulated and communicated to our management, including our principal executive officer and our principal financial and accounting officer, as appropriate, to allow timely decisions regarding required disclosure.
As required by SEC rules, we carried out an evaluation, under the supervision and with the participation of our management, including our principal executive officer and our principal financial and accounting officer, of the effectiveness of the design and operation of our disclosure controls and procedures as of September 30, 2013,March 31, 2014, the end of the period covered by this report. Based on the foregoing, our principal executive officer and principal financial and accounting officer concluded that our disclosure controls and procedures were effective as of September 30, 2013.
60
Table of ContentsMarch 31, 2014.
Internal Controls over Financial Reporting
There have been no changes in our internal controlscontrol over financial reporting during our most recently completed fiscal quarterthe period covered by this report that have materially affected or are reasonably likely to materially affect our internal control over financial reporting. However, we implemented a new version of our Enterprise Resource Planning (“ERP”) system on February 24, 2014. This new system changed certain of our business processes and internal controls impacting financial reporting. We believe that the new version of our ERP system and related changes to internal controls will further enhance our internal control over financial reporting. We have taken the necessary steps to monitor and maintain appropriate internal control over financial reporting during this period of system change.
PART IIOTHER INFORMATION
ITEM 1. LEGAL PROCEEDINGS
In the ordinary course of our business, we are from time to time involved in legal proceedings related to the ownership and operations of our properties. Neither we nor any of our real estate affiliates are currently involved in any legal or administrative proceedings that we believe is likely to have a materially adverse effect on our business, results of operations or financial condition.
ITEM 1A. RISK FACTORS
Our risk profile has changed significantly as a result of the $750.0 million Senior Notes offering that occurred in October 2013 in additionThere are no material changes to an increased exposure to the same market risks as our other fixed rate debt which caused certain of the risk factors includedpreviously disclosed in our Annual Report on Form 10-K for the year ended December 31, 2012 to change.Report.
The following risk factors have changed and are amended in their entirety as set forth below:
·“Indebtedness could have an adverse impact on our financial condition and operating flexibility”
·“We are obligated to comply with financial and other covenants that could affect our operating activities”
Amended Risk Factors
Our substantial indebtedness could adversely affect our business, prospects, financial condition or results of operations and prevent us from fulfilling our obligations under the notes.
We have a significant amount of indebtedness. As of September 30, 2013, our total consolidated debt was approximately $766.0 million (excluding an undrawn balance of $73.3 million under our revolving facility), of which $7.0 million was recourse to the Company. As of September 30, 2013, our share of the debt of our Real Estate Affiliates was $35.6 million based upon our economic ownership and is non-recourse to us. On October 2, 2013, we issued $750.0 million in aggregate principal amount of 6.875% Senior Notes due 2021. As of September 30, 2013, after giving effect to the offering, our total consolidated debt would have been $1,516.0 million, of which $757.0 million was recourse to the Company.
Subject to the limits contained in the indenture governing the Senior Notes and any limits under our other debt agreements, we may be able to incur substantial additional indebtedness from time to time, including project indebtedness at our subsidiaries. If we do so, the risks related to our level of indebtedness could intensify. Specifically, a high level of indebtedness could have important consequences to holders of the notes and equity holders, including:
·making it more difficult for us to satisfy our obligations with respect to the notes and our other debt;
·limiting our ability to obtain additional financing to fund future working capital, capital expenditures, debt service requirements, execution of our business strategy or other general corporate requirements, or requiring us to make non-strategic divestitures, particularly when the availability of financing in the capital markets is limited;
·requiring a substantial portion of our cash flow to be dedicated to debt service payments instead of other purposes, thereby reducing the amount of cash flow available for working capital, capital expenditures, acquisitions, dividends and other general corporate purposes;
·increasing our vulnerability to general adverse economic and industry conditions, including increases in interest rates, particularly given that certain indebtedness bears interest at variable rates;
61
Table of Contents
·limiting our ability to capitalize on business opportunities, reinvest in and develop properties, and to react to competitive pressures and adverse changes in government regulations;
·placing us at a disadvantage compared to other, less leveraged competitors;
·limiting our ability, or increasing the costs, to refinance indebtedness; and
·resulting in an event of default if we fail to satisfy our obligations under the notes or our other debt or fail to comply with the financial and other restrictive covenants contained in the indenture governing the notes or our other debt, which event of default could result in the notes and all of our debt becoming immediately due and payable and, in the case of our secured debt, could permit the lenders to foreclose on our assets securing such debt.
The indenture governing our Senior Notes contains, and our other debt agreements contain, restrictions which may limit our ability to operate our business.
The indenture governing our Senior Notes contains, and some of our other debt agreements contain, certain restrictions. These restrictions limit our ability or the ability of certain of our subsidiaries to, among other things:
·pay dividends on, redeem or repurchase capital stock or make other restricted payments;
·make investments;
·incur indebtedness or issue certain equity;
·create certain liens;
·incur obligations that restrict the ability of our subsidiaries to make dividend or other payments to us;
·consolidate, merge or transfer all or substantially all of our assets;
·enter into transactions with our affiliates; and
·create or designate unrestricted subsidiaries.
Additionally, certain of our debt agreements also contain various restrictive covenants, including minimum net worth requirements, maximum payout ratios on distributions, minimum debt yield ratios, minimum fixed charge coverage ratios, minimum interest coverage ratio and maximum leverage ratios.
The restrictions under the indenture and or other debt agreements could limit our ability to finance our future operations or capital needs, make acquisitions or pursue available business opportunities.
We may be required to take action to reduce our debt or act in a manner contrary to our business objectives to meet such ratios and satisfy the covenants in our debt agreements. Events beyond our control, including changes in economic and business conditions in the markets in which we operate, may affect our ability to do so. We may not be able to meet the ratios or satisfy the covenants in our debt agreements, and we cannot assure you that our lenders will waive any failure to do so. A breach of any of the covenants in, or our inability to maintain the required financial ratios under, our debt agreements could result in a default under such debt agreements, which could lead to that debt becoming immediately due and payable and, if such debt is secured, foreclosure on our assets that secure such debt. A breach of any of the covenants in, or our inability to maintain the required financial ratios under, our debt agreements also would prevent us from borrowing additional money under such agreements that include revolving lending facilities. A default under any of our debt agreements could, in turn, result in defaults under other obligations and result in other creditors accelerating the payment of other obligations and foreclosing on assets securing such obligations, if any.
Any such defaults could materially impair our financial condition and liquidity. In addition, if the lenders under any of our debt agreements or other obligations accelerate the maturity of those obligations, we cannot assure you that we will have sufficient assets to satisfy our obligations under the notes or our other debt.
ITEM 6 EXHIBITS
The Exhibit Index following the signature page to this Quarterly Report lists the exhibits furnished as required by Item 601 of Regulation S-K and is incorporated by reference.
6258
Table of Contents
SIGNATURE
Pursuant to the requirements of the Securities Exchange Act of 1934, the registrant has duly caused this report to be signed on its behalf by the undersigned thereunto duly authorized.
| The Howard Hughes Corporation |
| | |
| By: | /s/ Andrew C. Richardson |
| | Andrew C. Richardson |
| | Chief Financial Officer (principal financial officer) |
| | November 7, 2013May 8, 2014
|
6359
Table of Contents
EXHIBIT INDEX
4.1
| | Indenture, dated October 2, 2013, by and between The Howard Hughes Corporation and Wells Fargo Bank, National Association, as Trustee (incorporated by reference to Exhibit 4.1 to the Company’s Current Report on Form 8-K, filed on October 2, 2013).
|
| | |
4.210.1*+
| | Form of 6.875% Senior Notes due 2021 (included in Exhibit 4.1). |
| | |
10.1
| | ThirdRestricted Stock Agreement for Executive Officers under The Howard Hughes Corporation Amended and Restated Master Credit Agreement dated as of August 8, 2013, by and among The Woodlands Commercial Properties Company, L.P, The Woodlands Land Development Company, L.P., as borrowers, Keybank National Association, the other lenders that are a party thereto and the other lending institutions which may become a party thereto, as lenders, and Keybank National Association, as administrative agent for the lenders (incorporated by reference to Exhibit 10.1 to the Company’s Current Report on Form 8-K, filed August 14, 2013).2010 Incentive Plan
|
| | |
31.1+ | | Certification of Chief Executive Officer Pursuant to Section 302 of the Sarbanes-Oxley Act of 2002 |
| | |
31.2+ | | Certification of Chief Financial Officer Pursuant to Section 302 of the Sarbanes-Oxley Act of 2002 |
| | |
32.1+ | | Certification of Chief Executive Officer and Chief Financial Officer Pursuant to Section 906 of the Sarbanes-Oxley Act of 2002 |
| | |
101.INS+ | | XBRL Instance Document |
| | |
101.SCH+ | | XBRL Taxonomy Extension Schema Document |
| | |
101.CAL+ | | XBRL Taxonomy Extension Calculation Linkbase Document |
| | |
101.LAB+ | | XBRL Taxonomy Extension Label Linkbase Document |
| | |
101.PRE+ | | XBRL Taxonomy Extension Presentation Linkbase Document |
| | |
101.DEF+ | | XBRL Taxonomy Extension Definition Linkbase Document |
*Management contract, compensatory plan or arrangement
+ Filed herewith
Pursuant to Item 601(b)(4)(v) of Regulation S-K, the registrant has not filed debt instruments relating to long-term debt that is not registered and for which the total amount of securities authorized thereunder does not exceed 10% of total assets of the registrant and its subsidiaries on a consolidated basis as of September 30, 2013.March 31, 2014. The registrant agrees to furnish a copy of such agreements to the SEC upon request.
Attached as Exhibit 101 to this report are the following documents formatted in XBRL (Extensible Business Reporting Language): (i) the Condensed Consolidated Statements of Operations for the three and nine months ended September 30,March 31, 2014 and 2013, and 2012, (ii) Condensed Consolidated Statements of Comprehensive Income (Loss) for the three and nine months ended September 30,March 31, 2014 and 2013, and 2012, (iii) the Condensed Consolidated Balance Sheets as of September 30, 2013March 31, 2014 and December 31, 2012,2013, (iv) Condensed Consolidated Statements of Equity for the ninethree months ended September 30,March 31, 2014 and 2013, and 2012, and (v) the Condensed Consolidated Statements of Cash Flows for the ninethree months ended September 30, 2013March 31, 2014 and 2012.2013.
6460