CMS Energy Corporation
Consumers Energy Company
Quarterly Reports on Form 10-Q to the Securities and Exchange Commission for the Period Ended September 30, 2016March 31, 2017
2 | ||
7 | ||
7 | ||
7 | ||
11 | ||
11 | ||
Management’s Discussion and Analysis of Financial Condition and Results of Operations |
| |
| ||
| ||
| ||
| ||
| ||
| ||
| ||
| ||
| ||
| ||
| ||
Certain terms used in the text and financial statements are defined below.
20082016 Energy Law
Comprehensive energy reform package enacted in Michigan in 20082016
20152016 Form 10-K
Each of CMS Energy’s and Consumers’ Annual Report on Form 10-K for the year ended December 31, 20152016
ABATE
Association of Businesses Advocating Tariff Equity
AOCI
Accumulated other comprehensive income (loss)
ARO
Asset retirement obligation
ASU
Financial Accounting Standards Board Accounting Standards Update
Bay Harbor
A residential/commercial real estate area located near Petoskey, Michigan, in which CMS Energy sold its interest in 2002
bcf
Billion cubic feet
Cantera Gas Company
Cantera Gas Company LLC, a non-affiliated company, formerly known as CMS Field Services
Cantera Natural Gas, Inc.
Cantera Natural Gas, Inc., a non-affiliated company that purchased CMS Field Services
CCR
Coal combustion residual
CEO
Chief Executive Officer
CERCLA
Comprehensive Environmental Response, Compensation, and Liability Act of 1980
CFO
Chief Financial Officer
Clean Air Act
Federal Clean Air Act of 1963, as amended
Clean Water Act
Federal Water Pollution Control Act of 1972, as amended
CMS Capital
CMS Capital, L.L.C., a wholly owned subsidiary of CMS Energy
CMS Energy
CMS Energy Corporation and its consolidated subsidiaries, unless otherwise noted; the parent of Consumers and CMS Enterprises
CMS Enterprises
CMS Enterprises Company, a wholly owned subsidiary of CMS Energy
CMS Field Services
CMS Field Services, Inc., a former wholly owned subsidiary of CMS Gas Transmission Company, a wholly owned subsidiary of CMS Enterprises
CMS Land
CMS Land Company, a wholly owned subsidiary of CMS Capital
CMS MST
CMS Marketing, Services and Trading Company, a wholly owned subsidiary of CMS Enterprises, whose name was changed to CMS Energy Resource Management Company in 2004
Consumers
Consumers Energy Company and its consolidated subsidiaries, unless otherwise noted; a wholly owned subsidiary of CMS Energy
CSAPR
The Cross-State Air Pollution Rule
DB Pension Plan
Defined benefit pension plan of CMS Energy and Consumers, including certain present and former affiliates and subsidiaries
DB SERP
Defined Benefit Supplemental Executive Retirement Plan
DIG
Dearborn Industrial Generation, L.L.C., a wholly owned subsidiary of Dearborn Industrial Energy, L.L.C., a wholly owned subsidiary of CMS Energy
Dodd-Frank Act
Dodd-Frank Wall Street Reform and Consumer Protection Act of 2010
DTIA
Distribution-Transmission Interconnection Agreement dated April 1, 2001 between METC and Consumers, as amended
EBITDA
Earnings before interest, taxes, depreciation, and amortization
EnerBank
EnerBank USA, a wholly owned subsidiary of CMS Capital
EPAenergy waste reduction
The reduction of energy consumption through energy efficiency and demand-side energy conservation, as established under the 2016 Energy Law
Entergy
Entergy Corporation, a non-affiliated company
EPA
U.S. Environmental Protection Agency
EPS
Earnings per share
Exchange Act
Securities Exchange Act of 1934
FDIC
Federal Deposit Insurance Corporation
FERC
The Federal Energy Regulatory Commission
FMBForsite
First Mortgage BondForsite Development, Inc. and its subsidiaries, each a non-affiliated company
FTR
Financial transmission right
GAAP
U.S. Generally Accepted Accounting Principles
Gas AMR
Consumers’ gas automated meter reading project, which involves the installation of communication modules to allow drive-by meter reading
GCR
Gas cost recovery
Genesee
Genesee Power Station Limited Partnership, a variable interest entity in which HYDRA-CO Enterprises, Inc., a wholly owned subsidiary of CMS Enterprises, has a 50 percent50-percent interest
kWh
Kilowatt-hour, a unit of energy equal to one thousand watt-hours
Ludington
Ludington pumped-storage plant, jointly owned by Consumers and DTE Electric Company, a non-affiliated company
MATS
Mercury and Air Toxics Standards, which limit mercury, acid gases, and other toxic pollution from coal-fueled and oil-fueled power plants
MD&A
Management’s Discussion and Analysis of Financial Condition and Results of Operations
MDEQ
Michigan Department of Environmental Quality
METC
Michigan Electric Transmission Company, LLC, a non-affiliated company
MGP
Manufactured gas plant
Michigan Mercury Rule
Michigan Air Pollution Control Rules, Part 15, Emission Limitations and Prohibitions – Mercury, addressing mercury emissions from coal-fueled electric generating units
MISO
Midcontinent Independent System Operator, Inc.
mothball
To place a generating unit into a state of extended reserve shutdown in which the unit is inactive and unavailable for service for a specified period, during which the unit can be brought back into service after receiving appropriate notification and completing any necessary maintenance or other work; generation owners in MISO must request approval to mothball a unit, and MISO then evaluates the request for reliability impacts
MPSC
Michigan Public Service Commission
MW
Megawatt, a unit of power equal to one million watts
NAAQS
National Ambient Air Quality Standards
NAV
Net asset value
NERC
The North American Electric Reliability Corporation, a non-affiliated company responsible for developing and enforcing reliability standards, monitoring the bulk power system, and educating and certifying industry personnel
NPDES
National Pollutant Discharge Elimination System, a permit system for regulating point sources of pollution under the Clean Water Act
NREPA
Part 201 of the Michigan Natural Resources and Environmental Protection Act, a statute that covers environmental activities including remediation
NSR
New Source Review, a construction-permitting program under the Clean Air Act
OPEB
Other Post-Employment Benefits
OPEB Plan
Postretirement health care and life insurance plans of CMS Energy and Consumers, including certain present and former affiliates and subsidiaries
Palisades
Palisades nuclear power plant, sold by Consumers to Entergy in 2007
PCB
Polychlorinated biphenyl
PPA
Power purchase agreement
PSCR
Power supply cost recovery
RECRCRA
The Federal Resource Conservation and Recovery Act of 1976
REC
Renewable energy credit established under the 2008 Energy Law
ROA
Retail Open Access, which allows electric generation customers to choose alternative electric suppliers pursuant to a Michigan statute enacted in 2000
SEC
U.S. Securities and Exchange Commission
securitization
A financing method authorized by statute and approved by the MPSC which allows a utility to sell its right to receive a portion of the rate payments received from its customers for the repayment of securitization bonds issued by a special-purpose entity affiliated with such utility
Sherman Act
Sherman Antitrust Act of 1890
Smart Energy
Consumers’ Smart Energy grid modernization project, which includes the installation of smart meters that transmit and receive data, a two-way communications network, and modifications to Consumers’ existing information technology system to manage the data and enable changes to key business processes
This combined Form 10-Q is separately filed by CMS Energy and Consumers. Information in this combined Form 10-Q relating to each individual registrant is filed by such registrant on its own behalf. Consumers makes no representation regarding information relating to any other companies affiliated with CMS Energy other than its own subsidiaries. None of CMS Energy, CMS Enterprises, nor any of CMS Energy’s other subsidiaries (other than Consumers) has any obligation in respect of Consumers’ debt securities and holders of such debt securities should not consider the financial resources or results of operations of CMS Energy, CMS Enterprises, nor any of CMS Energy’s other subsidiaries (other than Consumers and its own subsidiaries (in relevant circumstances)) in making a decision with respect to Consumers’ debt securities. Similarly, neither Consumers nor any other subsidiary of CMS Energy has any obligation in respect of debt securities of CMS Energy.
This report should be read in its entirety. No one section of this report deals with all aspects of the subject matter of this report. This report should be read in conjunction with the consolidated financial statements and related notes and with MD&A included in the 20152016 Form 10-K.
CMS Energy’s internet address is www.cmsenergy.com. CMS Energy routinely posts important information on its website and considers the Investor Relations section, www.cmsenergy.com/investor-relations, a channel of distribution. Information contained on CMS Energy’s website is not incorporated herein.
FORWARD-LOOKING STATEMENTS AND INFORMATION
This Form 10-Q and other CMS Energy and Consumers disclosures may contain forward-looking statements as defined by the Private Securities Litigation Reform Act of 1995. The use of “might,” “may,” “could,” “should,” “anticipates,” “believes,” “estimates,” “expects,” “intends,” “plans,” “projects,” “forecasts,” “predicts,” “assumes,” and other similar words is intended to identify forward-looking statements that involve risk and uncertainty. This discussion of potential risks and uncertainties is designed to highlight important factors that may impact CMS Energy’s and Consumers’ businesses and financial outlook. CMS Energy and Consumers have no obligation to update or revise forward-looking statements regardless of whether new information, future events, or any other factors affect the information contained in the statements. These forward-looking statements are subject to various factors that could cause CMS Energy’s and Consumers’ actual results to differ materially from the results anticipated in these statements. These factors include, but are not limited to, the following, all of which are potentially significant:
· the impact of new regulation by the MPSC, FERC, and other applicable governmental proceedings and regulations, including any associated impact on electric or gas rates or rate structures
· potentially adverse regulatory treatment or failure to receive timely regulatory orders affecting Consumers that are or could come before the MPSC, FERC, or other governmental authorities
· changes in the performance of or regulations applicable to MISO, METC,Michigan Electric Transmission Company, LLC, pipelines, railroads, vessels, or other service providers that CMS Energy, Consumers, or any of their affiliates rely on to serve their customers
· the adoption of federal or state laws or regulations or challenges to federal or state laws or regulations, or changes in applicable laws, rules, regulations, principles, or practices, or in their interpretation, such as those related to energy
policy and ROA, infrastructure integrity or security,
gas pipeline safety, gas pipeline capacity, energy efficiency,waste reduction, the environment, regulation or deregulation, reliability, health care reforms (including comprehensive health care reform enacted in 2010), taxes, accounting matters, climate change, air emissions, renewable energy, potential effects of the Dodd-Frank Act, and other business issues that could have an impact on CMS Energy’s, Consumers’, or any of their affiliates’ businesses or financial results
· factors affecting operations, such as costs and availability of personnel, equipment, and materials; weather conditions; natural disasters; catastrophic weather-related damage; scheduled or unscheduled equipment outages; maintenance or repairs; environmental incidents; failures of equipment or materials; and electric transmission and distribution or gas pipeline system constraints
· increases in demand for renewablesrenewable energy by customers seeking to meet sustainability goals
· the ability of Consumers to execute its cost-reduction strategies
· potentially adverse regulatory or legal interpretations or decisions regarding environmental matters, or delayed regulatory treatment or permitting decisions that are or could come before the MDEQ, EPA, and/or U.S. Army Corps of Engineers, and potential environmental remediation costs associated with these interpretations or decisions, including those that may affect Bay Harbor or Consumers’ routine maintenance, repair, and replacement classification under NSR regulations
· changes in energy markets, including availability and price of electric capacity and the timing and extent of changes in commodity prices and availability and deliverability of coal, natural gas, natural gas liquids, electricity, oil, and certain related products
· the price of CMS Energy common stock, the credit ratings of CMS Energy and Consumers, capital and financial market conditions, and the effect of these market conditions on CMS Energy’s and Consumers’ interest costs and access to the capital markets, including availability of financing to CMS Energy, Consumers, or any of their affiliates
· the investment performance of the assets of CMS Energy’s and Consumers’ pension and benefit plans, the discount rates used in calculating the plans’ obligations, and the resulting impact on future funding requirements
· the impact of the economy, particularly in Michigan, and potential future volatility in the financial and credit markets on CMS Energy’s, Consumers’, or any of their affiliates’ revenues, ability to collect accounts receivable from customers, or cost and availability of capital
· changes in the economic and financial viability of CMS Energy’s and Consumers’ suppliers, customers, and other counterparties and the continued ability of these third parties, including those in bankruptcy, to meet their obligations to CMS Energy and Consumers
· population changes in the geographic areas where CMS Energy and Consumers conduct business
· national, regional, and local economic, competitive, and regulatory policies, conditions, and developments
· loss of customer demand for electric generation supply to alternative energyelectric suppliers, increased use of distributed generation, or energy efficiencywaste reduction
· federal regulation of electric sales and transmission of electricity, including periodic re-examination by federal regulators of CMS Energy’s and Consumers’ market-based sales authorizations
· the impact of credit markets, economic conditions, and any new banking and consumer protection regulations on EnerBank
· the availability, cost, coverage, and terms of insurance, the stability of insurance providers, and the ability of Consumers to recover the costs of any insurance from customers
· the effectiveness of CMS Energy’s and Consumers’ risk management policies, procedures, and strategies, including strategies to hedge risk related to future prices of electricity, natural gas, and other energy-related commodities
· factors affecting development of electric generation projects and gas and electric transmission and distribution infrastructure replacement, conversion, and expansion projects, including factors related to project site identification, construction material pricing, schedule delays, availability of qualified construction personnel, permitting, acquisition of property rights, and government approvals
· potential disruption to, interruption of, or other impacts on facilities, utility infrastructure, or operations due to accidents, explosions, physical disasters, cyber incidents, vandalism, war, or terrorism, and the ability to obtain or maintain insurance coverage for these events
· changes or disruption in fuel supply, including but not limited to supplier bankruptcy and delivery disruptions
· potential costs, lost revenues, or other consequences resulting from misappropriation of assets or sensitive information, corruption of data, or operational disruption in connection with a cyber attack or other cyber incident
· technological developments in energy production, storage, delivery, usage, and metering
· the ability to implement technology successfully
· the impact of CMS Energy’s and Consumers’ integrated business software system and its effects on their operations, including utility customer billing and collections
· adverse consequences resulting from any past, present, or future assertion of indemnity or warranty claims associated with assets and businesses previously owned by CMS Energy or Consumers, including claims resulting from attempts by foreign or domestic governments to assess taxes on or to impose environmental liability associated with past operations or transactions
· the outcome, cost, and other effects of any legal or administrative claims, proceedings, investigations, or settlements
· the reputational impact on CMS Energy and Consumers of operational incidents, violations of corporate policies, regulatory violations, inappropriate use of social media, and other events
· restrictions imposed by various financing arrangements and regulatory requirements on the ability of Consumers and other subsidiaries of CMS Energy to transfer funds to CMS Energy in the form of cash dividends, loans, or advances
· earnings volatility resulting from the application of fair value accounting to certain energy commodity contracts or interest rate contracts
· changes in financial or regulatory accounting principles or policies
· other matters that may be disclosed from time to time in CMS Energy’s and Consumers’ SEC filings, or in other public documents
All forward-looking statements should be considered in the context of the risk and other factors described above and as detailed from time to time in CMS Energy’s and Consumers’ SEC filings. For additional details regarding these and other uncertainties, see Part I—Item 1. Financial Statements—MD&A—Outlook and Notes to the Unaudited Consolidated Financial Statements—Note 2, Regulatory Matters and Note 3, Contingencies and Commitments; and Part II—Item 1A. Risk Factors.
INDEX TO FINANCIAL STATEMENTS
Management’s Discussion and Analysis of Financial Condition and Results of Operations | 12 | |
CMS Energy Consolidated Financial Statements |
| |
| ||
| ||
| ||
| ||
| ||
Consumers Consolidated Financial Statements |
| |
| ||
| ||
| ||
| ||
| ||
| ||
| ||
| ||
| ||
| ||
| ||
| ||
| ||
| ||
| ||
| ||
63 | ||
| ||
CMS Energy Corporation
Consumers Energy Company
Management’s Discussion and Analysis of Financial Condition and Results of Operations
This MD&A is a combined report of CMS Energy and Consumers.
EXECUTIVE OVERVIEW
CMS Energy is an energy company operating primarily in Michigan. It is the parent holding company of several subsidiaries, including Consumers, an electric and gas utility, and CMS Enterprises, primarily a domestic independent power producer. Consumers’ electric utility operations include the generation, purchase, transmission, distribution, and sale of electricity, and Consumers’ gas utility operations include the purchase, transmission, storage, distribution, and sale of natural gas. Consumers’ customer base consists of a mix of residential, commercial, and diversified industrial customers. CMS Enterprises, through its subsidiaries and equity investments, owns and operates power generation facilities.
CMS Energy and Consumers manage their businesses by the nature of services each provides. CMS Energy operates principally in three business segments: electric utility; gas utility; and enterprises, its non-utility operations and investments. Consumers operates principally in two business segments: electric utility and gas utility.
CMS Energy and Consumers earn revenue and generate cash from operations by providing electric and natural gas utility services; electric distribution, transmission, and generation; gas transmission, storage, and distribution; and other energy-related services. Their businesses are affected primarily by:
· regulation and regulatory matters
· economic conditions
· weather
· energy commodity prices
· interest rates
· their securities’ credit ratings
The key elements of CMS Energy’s and Consumers’ business strategy are depicted below:


CMS Energy and Consumers are focused on the “triple bottom line”: people, planet, and profit, underpinned by performance. They are committed to sustainable business practices and to pursuing the goals of safe and excellent operations, a strong ethical culture, environmental quality, and social responsibility. Consumers’ 2016 Sustainability Report, which is available to the public, provides an overview of Consumers’ efforts to continue meeting Michigan’s energy needs safely, efficiently, affordably, and reliably. The report also highlights Consumers’ commitment to Michigan businesses, its corporate citizenship, and its role in reducing the state’s air emissions. In a 2016 report published by Sustainalytics, a global leader in sustainability research and analysis, CMS Energy scored the highest among 54 U.S. utilities in environmental, social, and governance performance.
Safe, Excellent Operations
The safety of employees, customers, and the general public remains a priority of CMS Energy and Consumers. Accordingly, CMS Energy and Consumers have worked to integrate a set of safety principles into their business operations and culture. These principles include complying with applicable safety, health, and security regulations and implementing programs and processes aimed at continually improving safety and security conditions. In 2015, Consumers reduced recordable safety incidents by 29 percent compared with 2014. The number of recordable safety incidents in 20152016 was the lowest in Consumers’ history. For the nine months ended September 30, 2016, Consumers reduced recordable safety incidents by a further 21 percent compared with the same period in 2015.
Customer Value
Consumers continues to placeplaces a high priority on customer value. Consumers’ capital investment program is aimed at improving safety and increasing electric and gas reliability, which has resulted in measureable improvements in customer satisfaction.
Additionally, Consumers has undertaken several initiatives to keep electricity and natural gas affordable for its customers. These initiatives include the adoption of a lean operations model that is focused on completing work safely and correctly the first time, thus minimizing rework and waste, while delivering services on time. Other cost-saving initiatives undertaken by Consumers include accelerated pension funding, employee and retiree health care cost sharing, replacement of coal-fueled generation with more efficient gas-fueled generation, targeted infrastructure investment, including the installation of smart meters, negotiated labor agreements, information and control system efficiencies, and productivity improvements. In addition, Consumers’ gas commodity costs declined by 6468 percent from 20052006 through 2015,2016, due not only to a decrease in partmarket prices but also to Consumers’ improvements to its gas infrastructure and optimization of its gas purchasing and storage strategy. These savings are all passed on to customers.
In December 2016, Consumers and Entergy reached an agreement to terminate their PPA in May 2018, four years ahead of schedule. Under the PPA, Consumers purchases virtually all of the capacity and energy produced by Palisades, up to the annual average capacity of 798 MW. The prices that Consumers pays under the PPA, and which it recovers from its electric customers, are presently higher than the cost to purchase electricity from the market. Under the agreement, Consumers will make a termination payment of $172 million to Entergy. Consumers expects that, as a result of terminating the PPA, its electric customers will realize substantial savings from lower future energy and capacity costs. Actual savings will depend on market conditions. The agreement is contingent on the MPSC’s approval of Consumers’ recovery in electric rates of the termination payment. The MPSC has indicated that it will make a final determination on this recovery by September 2017, after full evaluation of the prudency of the termination payment and of how the termination will impact Michigan’s electric reliability and resource adequacy.
Utility Investment
Consumers expects to make capital investments of about $17$18 billion from 20162017 through 2025.2026. While Consumersit has substantially more investment opportunities that would add customer value, Consumers has limited its capital investment program to those investments it believes are needed to provide safe, reliable, and efficient service to its customers. Consumers’ capital investment program is expected to result in annual rate-base growth of six to eight percent. This rate-base growth, together with Consumers’ cost-control initiatives, should allow Consumers to maintain sustainable customer base rate increases (excluding PSCR and GCR charges) at or below the rate of inflation.
Presented in the following illustration are planned capital investments of about $8.5$9.0 billion that Consumers expects to make in 2016from 2017 through 2020:2021:
| ||
| Electric base ($2.6 billion) | |
| Gas base ($ | |
| Gas reliability enhancements | |
| Electric reliability | |
|
| |
|
| |
|
| |
|
| |
| Environmental ($0.5 billion) | |
| Smart Energy and Gas AMR ($0.3 billion) | |
| Other ($1.1 billion) |
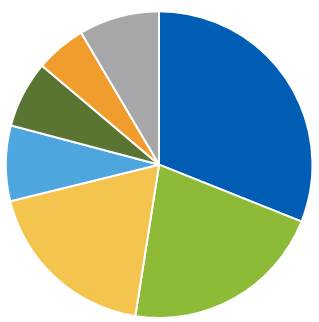
Consumers’ planned base capital investments of $4.4$4.6 billion represent projects to maintain Consumers’its system and comprise $2.6 billion at the electric utility to preserve reliability and capacity and $1.8$2.0 billion at the gas utility to sustain deliverability and enhance pipeline integrity. An additional $2.3$2.5 billion of planned reliability investments at Consumers are aimed at reducing outages and improving customer satisfaction; these investments comprise $1.6$1.8 billion at the gas utility to replace mains and enhance transmission and storage systems and $0.7 billion at the electric utility to strengthen circuits and substations and replace poles. Consumers also expects to spend $0.6$0.5 billion on environmental investments needed to comply with state and federal laws and regulations.
Consumers’ Smart Energy program also represents a major capital investment. TheConsumers began the full-scale deployment of advanced metering infrastructure beganfor electric and combination customers in 2012 and is plannedplans to continue throughcomplete it by the end of 2017. Consumers has spent $0.5$0.6 billion through 20152016 on its Smart Energy program, and expects to spend an additional $0.3$0.1 billion following a phased approach, throughin 2017. In addition, Consumers expects to spend $0.2 billion through 2019 in deploying Gas AMR technology beginning in 2017.for gas-only customers.
Regulation
Regulatory matters are a key aspect of CMS Energy’s and Consumers’ businesses, particularly Consumers’ rate cases and regulatory proceedings before the MPSC. Important regulatory events and developments are summarized below.
· 2016 Electric Rate Case:In March 2016, Consumers filed an application with the MPSC seeking an annual rate increase of $225 million, based on a 10.7 percent authorized return on equity. The filing also seeks approval of an investment recovery mechanism that would provide for additional annual rate increases of $38 million beginning in 2017, $92 million beginning in 2018, and $92 million beginning in 2019 for incremental investments that Consumers plans to make in those years, subject to reconciliation. In September 2016, Consumers self-implemented an annual rate increase of $170 million, subject to refund with interest. The MPSC issued an order in February 2017, authorizing an annual rate increase of $113 million, based on a 10.1 percent authorized return on equity.
·2017 Electric Rate Case: In March 2017, Consumers filed an application with the MPSC seeking an annual rate increase of $173 million, based on a 10.5 percent authorized return on equity.
· Gas Rate Case: In August 2016, Consumers filed an application with the MPSC seeking an annual rate increase of $90 million, based on a 10.6 percent authorized return on equity. The largest component of the request is anIn March 2017, Consumers reduced its requested annual revenue requirement of $84 million relatedrate increase to new investments that will allow Consumers to strengthen infrastructure and improve system capacity and deliverability.
$80 million. The filing also seeks approval of two rate adjustment mechanisms: one that would reconcile annually Consumers’ actual nonfuel revenues with the revenues approved by the MPSC, and another that would provide for additional annual rate increases of $35 million beginning in 2018 and another $35 million beginning in 2019 for incremental investments that Consumers plans to make in those years, subject to reconciliation. These future investments are intendedThe MPSC issued an order in January 2017, limiting Consumers’ self-implementation to help ensure adequate system capacity and deliverability.an annual rate increase of $20 million. Accordingly, in January 2017, Consumers self-implemented an annual rate increase of $20 million, subject to refund with interest.
In 2015, Michigan’s governor outlined several key goals for the state’s energy policy, with a focus on increasing the use of clean energy sources, reducing Michigan’s reliance on coal, deploying smart meters, investing in the power grid and pipeline system, eliminating energy waste, and ensuring affordable, reliable, and adaptable energy while protecting the environment. The Michigan Senate and House of Representatives are considering two separate but similar pieces of legislation to address energy policy. Consumers is unable to predict the form and timing of any final legislation. While most of the proposed changes represent potential benefits to Consumers’ customers, Consumers’ business plan assumes no changes to the existing law.
In SeptemberDecember 2016, Michigan’s governor signed the 2016 Energy Law, which became effective in April 2017. Among other things, the 2016 Energy Law:
·raises the renewable energy standard from the present ten-percent requirement to 12.5 percent by 2019 and MISO announced15 percent by 2021
·establishes a goal of 35 percent combined renewable energy and energy waste reduction by 2025
·authorizes incentives for demand response programs and expands existing incentives for energy efficiency programs
·authorizes incentives for new PPAs with non-affiliates
·establishes an integrated planning process for new generation resources
·shortens from twelve months to ten months the time by which the MPSC must issue a final order in general rate cases, but prohibits electric and gas utilities from filing general rate cases for increases in rates more often than once every twelve months
·eliminates utilities’ self-implementation of rates under general rate cases
·requires the MPSC to implement equitable cost-of-service rates for customers participating in a net metering program
The 2016 Energy Law also establishes a path to ensure that MISO will submit a proposal to FERCforward capacity is secured for all electric customers in November 2016 that would impose capacity requirements onMichigan, including customers served by alternative electric suppliers operating in Michigan. Presently, under the 2008 Energy Law,ROA. Under existing Michigan law, electric customers in Consumers’ service territory are allowed to buy electric generation service from alternative electric suppliers in an aggregate amount up to ten percent of Consumers’ weather-adjusted retail sales for the preceding calendar year. UnderThe 2016 Energy Law retains the joint proposal,ten percent cap on ROA, with certain exceptions. The new law also authorizes the MPSC to ensure that alternative electric suppliers would be required to procurehave procured enough capacity to cover their anticipated capacity
requirements for the subsequent three-yearfour-year forward period. IfIn March 2017, the MPSC indicated that it plans to achieve this objective through the use of a state reliability mechanism. Under such a mechanism, if an alternative electric supplier did not procure enoughdemonstrate that it had procured its capacity itsrequirements for the four-year forward period, ROA customers would then pay a charge to the utility for capacity charge setthat is not provided by the MPSC. The capacity charge would be determined in a separate proceeding in 2017, should FERC approve MISO’s proposal. Consumers cannot predict the outcome of this proposal.alternative electric supplier.
Environmental and health and safety regulations are other areas of importance for CMS Energy and Consumers, and they are monitoring numerous legislative and regulatory initiatives, including those to regulate greenhouse gases, and related litigation. CMS Energy and Consumers believe that these laws and regulations related to their operations will continue to become more stringent and require them to make additional substantial capital expenditures for emissions control equipment, CCR disposal and storage, cooling water intake equipment, effluent treatment, PCB remediation, and gas pipeline safety. Present and reasonably anticipated state and federal environmental statutes and regulations including but not limited to the Clean Air Act, including the Clean Power Plan, as well as the Clean Water Act, the Federal Resource Conservation and Recovery Act of 1976, CERCLA, and the Pipeline Safety, Regulatory Certainty, and Job Creation Act of 2011, will continue to have a material effect on CMS Energy and Consumers.
Financial Performance
For the ninethree months ended September 30, 2016,March 31, 2017, CMS Energy’s net income available to common stockholders was $474$199 million and diluted EPS were $1.70.$0.71. This compares with net income available to common stockholders of $417$164 million and diluted EPS of $1.51$0.59 for the ninethree months ended September 30, 2015.March 31, 2016. Among the primary factors contributing to CMS Energy’s increased earnings in 20162017 were benefits from electric and gas rate increases, and higher electric sales due mainly to warmer-than-normal summer weather.deliveries, a property tax settlement, and cost reductions. These changes were offset partially by higher depreciation and property
taxes on increased plant in service and by lower gas deliveries, reflecting the second-warmest winter in Consumers’ history.service.
Consumers’ utility operations are seasonal. The consumption of electric energy typically increases in the summer months, due primarily to the use of air conditioners and other cooling equipment, while peak demand for natural gas occurs in the winter due to colder temperatures and the resulting use of natural gas as heating fuel. In addition, Consumers’ electric rates, which follow a seasonal rate design, are higher in the summer months than in the remaining months of the year. A more detailed discussion of the factors affecting CMS Energy’s and Consumers’ performance can be found in the Results of Operations section that follows this Executive Overview.
Consumers expects that a continued rise in industrial production in its service territory will drive its total electric deliveries to increase annually by about one-half percent on average through 2020.2021. Excluding the impacts of energy efficiencywaste reduction programs, Consumers expects its total electric deliveries to increase by about one percent annually through 2020.2021. Consumers is projecting that its gas deliveries will remain stable through 2020.2021. This outlook reflects growth in gas demand offset by energy efficiency and conservation.
As Consumers seeks to continue to receive fair and timely regulatory treatment, delivering customer value will remain a key strategic priority. In order to minimize increases in customer base rates, Consumers has set goalswill continue to achieve further annual productivity improvements. Additionally, Consumerspursue cost savings through its lean operations model, and will strivecontinue to give priority to capital investments that increase customer value or lower costs.
Consumers expects to continue to have sufficient borrowing capacity to fund its investment-based growth plans. CMS Energy also expects its sources of liquidity to remain sufficient to meet its cash requirements. To identify potential implications for CMS Energy’s and Consumers’ businesses and future financial needs, the companies will continue to monitor developments in the financial and credit markets, as well as government policy responses to those developments.
RESULTS OF OPERATIONS
CMS Energy Consolidated Results of Operations
|
| In Millions, Except Per Share Amounts |
| ||||||||||||||||
|
| Three Months Ended |
| Nine Months Ended |
| ||||||||||||||
September 30 |
| 2016 |
| 2015 |
| Change |
| 2016 |
| 2015 |
| Change |
| ||||||
Net Income Available to Common Stockholders |
| $ | 186 |
| $ | 148 |
| $ | 38 |
| $ | 474 |
| $ | 417 |
| $ | 57 |
|
Basic Earnings Per Share |
| $ | 0.67 |
| $ | 0.53 |
| $ | 0.14 |
| $ | 1.71 |
| $ | 1.51 |
| $ | 0.20 |
|
Diluted Earnings Per Share |
| $ | 0.67 |
| $ | 0.53 |
| $ | 0.14 |
| $ | 1.70 |
| $ | 1.51 |
| $ | 0.19 |
|
|
| In Millions, Except Per Share Amounts |
| ||||||||||||||||||||||||||||||
Three Months Ended March 31 | Three Months Ended March 31 |
| 2017 |
| 2016 |
| Change |
| |||||||||||||||||||||||||
Net Income Available to Common Stockholders | Net Income Available to Common Stockholders |
| $ | 199 |
| $ | 164 |
| $ | 35 |
| ||||||||||||||||||||||
Basic Earnings Per Share | Basic Earnings Per Share |
| $ | 0.71 |
| $ | 0.59 |
| $ | 0.12 |
| ||||||||||||||||||||||
Diluted Earnings Per Share | Diluted Earnings Per Share |
| $ | 0.71 |
| $ | 0.59 |
| $ | 0.12 |
| ||||||||||||||||||||||
|
| In Millions |
|
|
|
| |||||||||||||||||||||||||||
|
| Three Months Ended |
| Nine Months Ended |
|
| In Millions |
| |||||||||||||||||||||||||
September 30 |
| 2016 |
| 2015 |
| Change |
| 2016 |
| 2015 |
| Change |
| ||||||||||||||||||||
Three Months Ended March 31 | Three Months Ended March 31 |
| 2017 |
| 2016 |
| Change |
| |||||||||||||||||||||||||
Electric utility |
| $ | 191 |
| $ | 166 |
| $ | 25 |
| $ | 395 |
| $ | 342 |
| $ | 53 |
| Electric utility |
| $ | 124 |
| $ | 91 |
| $ | 33 |
| |||
Gas utility |
| 3 |
| (7 | ) | 10 |
| 102 |
| 115 |
| (13 | ) | Gas utility |
| 87 |
| 81 |
| 6 |
| ||||||||||||
Enterprises |
| 8 |
| 3 |
| 5 |
| 17 |
| 10 |
| 7 |
| Enterprises |
| 12 |
| 6 |
| 6 |
| ||||||||||||
Corporate interest and other |
| (16 | ) | (14 | ) | (2 | ) | (40 | ) | (50 | ) | 10 |
| Corporate interest and other |
| (24 | ) | (14 | ) | (10 | ) | ||||||||||||
Net Income Available to Common Stockholders |
| $ | 186 |
| $ | 148 |
| $ | 38 |
| $ | 474 |
| $ | 417 |
| $ | 57 |
| Net Income Available to Common Stockholders |
| $ | 199 |
| $ | 164 |
| $ | 35 |
| |||
Presented in the following table are specific after-tax changes to net income available to common stockholders:
|
| In Millions |
|
| In Millions |
| ||||||||||||||
|
| September 30, 2016 better/(worse) than 2015 |
|
| March 31, 2017 better/(worse) than 2016 |
| ||||||||||||||
Reasons for the change |
| Three Months Ended |
| Nine Months Ended |
|
| Three Months Ended |
| ||||||||||||
Consumers electric utility and gas utility |
|
|
|
|
|
|
|
|
|
|
|
|
|
|
|
|
|
|
|
|
Electric sales |
|
|
|
|
|
|
|
|
|
|
|
|
|
|
|
|
|
|
|
|
Weather |
| $ 29 |
|
|
|
|
| $ 19 |
|
|
|
|
|
| $ (2) |
|
|
|
|
|
Non-weather |
| 7 |
| $ 36 |
|
|
| 15 |
| $ 34 |
|
|
|
| 8 |
| $ 6 |
|
|
|
Gas sales |
|
|
|
|
|
|
|
|
|
|
|
|
|
|
|
|
|
|
|
|
Weather |
| (1 | ) |
|
|
|
| (48 | ) |
|
|
|
|
| (2) |
|
|
|
|
|
Non-weather |
| 1 |
| - |
|
|
| 12 |
| (36 | ) |
|
|
| 1 |
| (1) |
|
|
|
Electric rate increase |
|
|
| 7 |
|
|
|
|
| 43 |
|
|
|
|
|
| 20 |
|
|
|
Gas rate increase |
|
|
| 2 |
|
|
|
|
| 14 |
|
|
|
|
|
| 4 |
|
|
|
Property tax settlement |
|
|
| 7 |
|
|
| |||||||||||||
Operating and maintenance costs |
|
|
| 19 |
|
|
|
|
| 26 |
|
|
|
|
|
| 5 |
|
|
|
Employee benefit costs |
|
|
| 6 |
|
|
|
|
| 18 |
|
|
| |||||||
Depreciation and property taxes, net |
|
|
| (22 | ) |
|
|
|
| (50 | ) |
|
|
|
|
| (17) |
|
|
|
Voluntary separation program costs |
|
|
| (7 | ) |
|
|
|
| (7 | ) |
|
| |||||||
Other |
|
|
| (6 | ) | $ 35 |
|
|
| (2 | ) | $ 40 |
| |||||||
Other, including intercompany gain |
|
|
| 15 |
| $ 39 |
| |||||||||||||
Enterprises |
|
|
|
|
|
|
|
|
|
|
|
|
|
|
|
|
|
|
|
|
Subsidiary earnings |
|
|
|
|
| 5 |
|
|
|
|
| 7 |
|
|
|
|
|
| 6 |
|
Corporate interest and other |
|
|
|
|
|
|
|
|
|
|
|
|
|
|
|
|
|
|
|
|
Michigan tax settlement |
|
|
|
|
| - |
|
|
|
|
| 5 |
| |||||||
EnerBank earnings |
|
|
|
|
| - |
|
|
|
|
| 2 |
| |||||||
Elimination of intercompany gain |
|
|
|
|
| (9) |
| |||||||||||||
Other |
|
|
|
|
| (2 | ) |
|
|
|
| 3 |
|
|
|
|
|
| (1) |
|
Total change |
|
|
|
|
| $ 38 |
|
|
|
|
| $ 57 |
|
|
|
|
|
| $ 35 |
|
Consumers Electric Utility Results of Operations
|
|
|
| In Millions |
| ||||||||||||||||||||||||
|
| Three Months Ended |
| Nine Months Ended |
| ||||||||||||||||||||||||
September 30 |
| 2016 |
| 2015 |
| Change |
| 2016 |
| 2015 |
| Change |
| ||||||||||||||||
In Millions | In Millions | ||||||||||||||||||||||||||||
Three Months Ended March 31 | 2017 | 2016 | Change |
| |||||||||||||||||||||||||
Net Income Available to Common Stockholders |
| $ | 191 |
| $ | 166 |
| $ | 25 |
| $ | 395 |
| $ | 342 |
| $ | 53 |
|
| $ | 124 |
| $ | 91 |
| $ | 33 |
|
Reasons for the change |
|
|
|
|
|
|
|
|
|
|
|
|
|
|
|
|
|
|
|
|
|
|
| ||||||
Electric deliveries and rate increases |
|
|
|
|
| $ | 45 |
|
|
|
|
| $ | 88 |
|
|
|
|
|
|
|
| $ | 45 |
| ||||
Power supply costs and related revenue |
|
|
|
|
| (3 | ) |
|
|
|
| (3 | ) | ||||||||||||||||
Maintenance and other operating expenses |
|
|
|
|
| 15 |
|
|
|
|
| 36 |
|
|
|
|
|
|
|
|
| 3 |
| ||||||
Depreciation and amortization |
|
|
|
|
| (6 | ) |
|
|
|
| (16 | ) |
|
|
|
|
|
|
|
| (13) |
| ||||||
General taxes |
|
|
|
|
| (3 | ) |
|
|
|
| (9 | ) |
|
|
|
|
|
|
|
| 9 |
| ||||||
Other income, net of expenses |
|
|
|
|
| (2 | ) |
|
|
|
| (8 | ) |
|
|
|
|
|
|
|
| 6 |
| ||||||
Interest charges |
|
|
|
|
| (3 | ) |
|
|
|
| (5 | ) |
|
|
|
|
|
|
|
| (1) |
| ||||||
Income taxes |
|
|
|
|
| (18 | ) |
|
|
|
| (30 | ) |
|
|
|
|
|
|
|
| (16) |
| ||||||
Total change |
|
|
|
|
| $ | 25 |
|
|
|
|
| $ | 53 |
|
|
|
|
|
|
|
| $ | 33 |
| ||||
Following is a discussion of significant changes to net income available to common stockholders.
Electric Deliveries and Rate Increases: For the three months ended September 30, 2016,March 31, 2017, electric delivery revenues increased $45 million compared with 2015.2016. This change reflected a $52$32 million rate increase, $9 million in higher deliveries, and a $4 million increase in sales due primarily to favorable weather. Additionally, revenues increased $14 million due to a rate increase self-implemented in September 2016. These increases were offset partially by a $15 million decrease resulting from lower summer rates as authorized in the December 2015 rate order and a $6 million decrease in other revenues associated with securitization bonds that Consumers issued in 2001 and retired in October 2015.revenues. Deliveries to end-use customers were 10.79.2 billion kWh in 20162017 and 10.19.1 billion kWh in 2015.2016.
For the nine months ended September 30, 2016, electric delivery revenues increased $88 million compared with 2015. This change reflected $59 million from a December 2015 rate increase and a September 2016 self-implemented rate increase, $46 million from an increase in sales due primarily to favorable weather, and a $9 million increase associated with energy efficiency programs. These increases were offset partially by a $26 million decrease in revenue associated with securitization bonds that Consumers issued in 2001 and retired in October 2015. Deliveries to end-use customers were 28.9 billion kWh in 2016 and 28.4 billion kWh in 2015.
Maintenance and Other Operating Expenses: For the three months ended September 30, 2016,March 31, 2017, maintenance and other operating expenses decreased $15$3 million compared with 2015.2016. This change was due to a $10reflected the absence, in 2017, of $7 million decrease in expenses at the seven coal-fueledcoal-fuel electric generating units that Consumers retired in April 2016 and a $6 million decrease in2016. Additionally, postretirement benefit costs attributable primarily to the change todecreased by $3 million, reflecting a full-yield-curve approach to calculate the service cost and interest expense components of net periodic benefit costs for the DB Pension and OPEB Plans. Also contributing to the change were a $4$5 million reduction in service restoration expenses andassociated with the early adoption of a $1 million decrease in other operating and maintenance costs. These reductions werenew accounting standard, offset partially by a $6$2 million charge associated with a voluntary separation program.
of cost increases. For additional details on the nine months ended September 30, 2016, maintenance and other operating expenses decreased $36 million compared with 2015. This change was due to a $21 million decrease in expenses at the seven coal-fueled electric generating units that Consumers retired in April 2016, a $19 million decrease in
postretirement benefit costs attributable primarily to the change to a full-yield-curve approach to calculate the service cost and interest expense componentsimplementation of net periodic benefit costs for the DB Pension and OPEB Plans, and a $10 million decrease in uncollectible accounts expense. Also contributing to the change was a $4 million decrease associated with a State of Michigan use tax settlement reached in June 2016.this standard, see Note 1, New Accounting Standards. These decreases were offset partially by a $9$7 million increase associated with energy efficiency programs, a $6 million chargein maintenance and other operating expenses, resulting primarily from higher service restoration costs associated with a voluntary separation program, and a $3 million increase in forestry expenses.March 2017 wind storm.
Depreciation and Amortization: For the three months ended September 30, 2016,March 31, 2017, depreciation and amortization expense increased $6$13 million compared with 2015. This change reflected a $27 million increase in depreciation expense related2016, due primarily to increased plant in service and an increase in depreciation rates that became effective in December 2015, offset partially by a $21 million decrease in amortization of securitized assets, reflecting the conclusion in October 2015 of Consumers’ 2001 securitization program.service.
For the nine months ended September 30, 2016, depreciation and amortization expense increased $16 million compared with 2015. This change reflected a $72 million increase in depreciation expense related to increased plant in service and an increase in depreciation rates that became effective in December 2015, offset partially by a $56 million decrease in amortization associated primarily with securitized assets, reflecting the conclusion in October 2015 of Consumers’ 2001 securitization program.
General Taxes: For the ninethree months ended September 30, 2016,March 31, 2017, general taxes increaseddecreased $9 million compared with 2015. This change was2016, due primarilylargely to an $8 million increase inthe settlement of a property taxes, reflecting higher capital spending, and a $1 million increase to payroll taxestax appeal related to a voluntary separation program.Consumers’ Zeeland plant.
Other Income, Net of Expenses: For the ninethree months ended September 30, 2016,March 31, 2017, other income, net of expenses, decreased $8increased $6 million compared with 2015.2016. This decrease reflected the absence, in 2016, ofchange was due to a $6$9 million gain related toon a donation of CMS Energy stock by Consumers. The gainConsumers, which was eliminated on CMS Energy’s consolidated statements of income. The decrease also reflectedincome, and a $2$1 million charitable contribution madeincrease in 2016.
Interest Charges: For the nine months ended September 30, 2016, interest charges increased $5 million compared with 2015.other income, net of expenses. These changesincreases were due primarily to higher average debt levels.
Income Taxes: For the three months ended September 30, 2016, income taxes increased $18 million compared with 2015. This change was attributable primarily to higher electric utility earnings.
For the nine months ended September 30, 2016, income taxes increased $30 million compared with 2015. This increase reflected $34 million related to higher electric utility earnings, offset partially by a $4 million decrease due to a changereduction in the treatment of excess tax benefits on restricted stock awards as a result ofnonoperating retirement benefit credits associated with the early adoption of a new accounting standard. For additional details on the implementation of this standard, see Note 1, New Accounting Standards.
Income Taxes: For the three months ended March 31, 2017, income taxes increased $16 million compared with 2016. This change reflected a $19 million increase attributable to higher electric utility earnings, offset partially by a $3 million reduction of other income taxes.
Consumers Gas Utility Results of Operations
|
|
|
| In Millions |
| ||||||||||||||||||||||||
|
| Three Months Ended |
| Nine Months Ended |
| ||||||||||||||||||||||||
September 30 |
| 2016 |
| 2015 |
| Change |
| 2016 |
| 2015 |
| Change |
| ||||||||||||||||
Net Income (Loss) Available to Common Stockholders |
| $ | 3 |
| $ | (7 | ) | $ | 10 |
| $ | 102 |
| $ | 115 |
| $ | (13 | ) | ||||||||||
In Millions | In Millions | ||||||||||||||||||||||||||||
Three Months Ended March 31 | 2017 | 2016 | Change |
| |||||||||||||||||||||||||
Net Income Available to Common Stockholders |
| $ | 87 |
| $ | 81 |
| $ | 6 |
| |||||||||||||||||||
Reasons for the change |
|
|
|
|
|
|
|
|
|
|
|
|
|
|
|
|
|
|
|
|
|
|
| ||||||
Gas deliveries and rate increases |
|
|
|
|
| $ | 8 |
|
|
|
|
| $ | (27 | ) |
|
|
|
|
|
|
| $ | 10 |
| ||||
Maintenance and other operating expenses |
|
|
|
|
| 9 |
|
|
|
|
| 22 |
|
|
|
|
|
|
|
|
| 10 |
| ||||||
Depreciation and amortization |
|
|
|
|
| (3 | ) |
|
|
|
| (15 | ) |
|
|
|
|
|
|
|
| (11) |
| ||||||
General taxes |
|
|
|
|
| (1 | ) |
|
|
|
| (4 | ) |
|
|
|
|
|
|
|
| (3) |
| ||||||
Other income, net of expenses |
|
|
|
|
| - |
|
|
|
|
| (1 | ) |
|
|
|
|
|
|
|
| 2 |
| ||||||
Income taxes |
|
|
|
|
| (3 | ) |
|
|
|
| 12 |
|
|
|
|
|
|
|
|
| (2) |
| ||||||
Total change |
|
|
|
|
| $ | 10 |
|
|
|
|
| $ | (13 | ) |
|
|
|
|
|
|
| $ | 6 |
| ||||
Following is a discussion of significant changes to net income available to common stockholders.
Gas Deliveries and Rate Increases: For the three months ended September 30, 2016,March 31, 2017, gas delivery revenues increased $8$10 million compared with 2015.2016. This change reflected a $4 million increase from a January 20162017 self-implemented rate increase of $6 million and a $4 million increase in other revenues. Deliveries to end-use customers were 26119 bcf in 20162017 and 27121 bcf in 2015.2016.
For the nine months ended September 30, 2016, gas delivery revenues decreased $27 million compared with 2015. This change reflected a $50 million decrease in sales due primarily to milder winter weather. This decrease was offset partially by $23 million related to a January 2016 rate increase. Deliveries to end-use customers were 196 bcf in 2016 and 223 bcf in 2015.
Maintenance and Other Operating Expenses: For the three months ended September 30, 2016,March 31, 2017, maintenance and other operating expenses decreased $9$10 million compared with 2015.2016. This change was due to a $4decrease reflects $6 million decrease in postretirement benefit costs attributable primarily to the change to a full-yield-curve approach to calculate the service costof lower gas distribution and interestcustomer operations expense components of net periodic benefit costs for the DB Pension and OPEB Plans and a $2 million decreasereduction in uncollectible accounts expense. Also contributing to the change was a $7 million reduction in other gas distribution operating and maintenance expenses, offset partially by a $4 million charge associated with a voluntary separation program.
For the nine months ended September 30, 2016, maintenance and other operating expenses decreased $22 million compared with 2015. This change was due to a $12$2 million decrease in postretirement benefit costs, attributable primarily to the change toreflecting a full-yield-curve approach to calculate the service cost and interest expense components of net periodic benefit costs for the DB Pension and OPEB Plans and a $6 million decrease in uncollectible accounts expense. Additionally, there was an $8$4 million reduction in other gas distribution operating and maintenance expenses. These decreases wereassociated with the early adoption of a new accounting standard, offset partially by a $4$2 million charge associated with a voluntary separation program.of cost increases. For additional details on the implementation of this standard, see Note 1, New Accounting Standards.
Depreciation and Amortization: For the ninethree months ended September 30, 2016,March 31, 2017, depreciation and amortization expense increased $15$11 million compared with 2015,2016, due primarily to increased plant in service.
General Taxes: For the ninethree months ended September 30, 2016,March 31, 2017, general taxes increased $4$3 million compared with 2015,2016, due primarily to increased property taxes, reflecting higher capital spending.
Other Income, Taxes: Net of Expenses:For the ninethree months ended September 30, 2016,March 31, 2017, other income, taxes decreased $12net of expenses, increased $2 million compared with 2015.2016. This change reflected a $10 million reduction related to lower gas utility earnings and a $2 million decreasewas due to a change$5 million gain on a donation of CMS Energy stock by Consumers, which was eliminated on CMS Energy’s consolidated statements of income. This increase was offset partially by a $3 million reduction in the treatment of excess tax benefits on restricted stock awards as a result ofnonoperating retirement benefit credits associated with the early adoption of a new accounting standard. For additional details on the implementation of this standard, see Note 1, New Accounting Standards.
Income Taxes: For the three months ended March 31, 2017, income taxes increased $2 million compared with 2016, attributable to higher gas utility earnings.
Enterprises Results of Operations
|
| In Millions |
| ||||||||||||||||
|
| Three Months Ended |
| Nine Months Ended |
| ||||||||||||||
September 30 |
| 2016 |
| 2015 |
| Change |
| 2016 |
| 2015 |
| Change |
| ||||||
Net Income Available to Common Stockholders |
| $ | 8 |
| $ | 3 |
| $ | 5 |
| $ | 17 |
| $ | 10 |
| $ | 7 |
|
In Millions | ||||||||||
Three Months Ended March 31 | 2017 | 2016 | Change |
| ||||||
Net Income Available to Common Stockholders |
| $ | 12 |
| $ | 6 |
| $ | 6 |
|
For the three months ended September 30, 2016,March 31, 2017, net income of the enterprises segment increased $5$6 million compared with 2015,2016, due primarily to higher prices for capacity and demand revenue from DIG and $1 million resulting from delays in planned maintenance at equity method investees.
For the nine months ended September 30, 2016, net income of the enterprises segment increased $7 million compared with 2015, due primarily to higher prices for capacity and demand revenue from DIG and $2 million resulting from lower maintenance expenses at equity method investees.DIG.
Corporate Interest and Other Results of Operations
|
| In Millions |
| ||||||||||||||||||||||||||
|
| Three Months Ended |
| Nine Months Ended |
| ||||||||||||||||||||||||
September 30 |
| 2016 |
| 2015 |
| Change |
| 2016 |
| 2015 |
| Change |
| ||||||||||||||||
In Millions | In Millions | ||||||||||||||||||||||||||||
Three Months Ended March 31 | 2017 | 2016 | Change |
| |||||||||||||||||||||||||
Net Income (Loss) Available to Common Stockholders |
| $ | (16 | ) | $ | (14 | ) | $ | (2 | ) | $ | (40 | ) | $ | (50 | ) | $ | 10 |
|
| $ | (24) |
| $ | (14) |
| $ | (10) |
|
For the three months ended September 30, 2016,March 31, 2017, corporate interest and other net expenses increased $2 million compared with 2015, due primarily to higher fixed charges reflecting higher debt levels, offset partially by lower average interest rates.
For the nine months ended September 30, 2016, corporate interest and other net expenses decreased $10 million compared with 2015,2016, due primarily to a settlement reached with the Michigan Department of Treasury that resulted in after-tax reductions of $2 million in general taxes and $3 million in income tax expense. Also contributing to the change were the absence, in 2016,elimination of a $5$9 million intercompany charge related to aafter-tax gain resulting from the donation of CMS Energy stock by Consumers and $2 million of higher net earnings at EnerBank. These decreases were offset partially by higher fixed charges.Consumers.
For additional details on the settlement with the Michigan Department of Treasury, see Note 3, Contingencies and Commitments—Other Contingencies.
CASH POSITION, INVESTING, AND FINANCING
At September 30, 2016,March 31, 2017, CMS Energy had $367$463 million of consolidated cash and cash equivalents, which included $28$30 million of restricted cash and cash equivalents. At September 30, 2016,March 31, 2017, Consumers had $49$212 million of consolidated cash and cash equivalents, which included $28$30 million of restricted cash and cash equivalents.
Operating Activities
Presented in the following table are specific components of net cash provided by operating activities for the ninethree months ended September 30, 2016March 31, 2017 and 2015:2016:
|
| In Millions |
| |||||||||||||||||
Nine Months Ended September 30 |
| 2016 |
| 2015 |
| Change |
| |||||||||||||
In Millions | In Millions |
| ||||||||||||||||||
Three Months Ended March 31 | 2017 | 2016 | Change |
| ||||||||||||||||
CMS Energy, including Consumers |
|
|
|
|
|
|
|
|
|
|
|
|
|
|
|
| ||||
Net income |
| $ | 475 |
| $ | 418 |
| $ | 57 |
|
| $ | 199 |
| $ | 164 |
| $ | 35 |
|
Non-cash transactions1 |
| 870 |
| 898 |
| (28 | ) |
|
| 373 |
| 327 |
|
| 46 |
| ||||
Changes in core working capital2 |
| 62 |
| 239 |
| (177 | ) |
|
| 198 |
| 242 |
|
| (44) |
| ||||
Postretirement benefits contributions |
| (6 | ) | (35 | ) | 29 |
|
|
| (5) |
| (2) |
|
| (3) |
| ||||
Changes in other assets and liabilities, net |
| (160 | ) | (100 | ) | (60 | ) |
|
| (119) |
| (99) |
|
| (20) |
| ||||
Net cash provided by operating activities |
| $ | 1,241 |
| $ | 1,420 |
| $ | (179 | ) |
| $ | 646 |
| $ | 632 |
| $ | 14 |
|
Consumers |
|
|
|
|
|
|
|
|
|
|
|
|
|
|
|
| ||||
Net income |
| $ | 499 |
| $ | 459 |
| $ | 40 |
|
| $ | 211 |
| $ | 172 |
| $ | 39 |
|
Non-cash transactions1 |
| 857 |
| 709 |
| 148 |
|
|
| 351 |
| 316 |
|
| 35 |
| ||||
Changes in core working capital2 |
| 76 |
| 244 |
| (168 | ) |
|
| 202 |
| 261 |
|
| (59) |
| ||||
Postretirement benefits contributions |
| (4 | ) | (33 | ) | 29 |
|
|
| (3) |
| (1) |
|
| (2) |
| ||||
Changes in other assets and liabilities, net |
| (140 | ) | 48 |
| (188 | ) |
|
| (113) |
| (83) |
|
| (30) |
| ||||
Net cash provided by operating activities |
| $ | 1,288 |
| $ | 1,427 |
| $ | (139 | ) |
| $ | 648 |
| $ | 665 |
| $ | (17) |
|
1 Non-cash transactions comprise depreciation and amortization, changes in deferred income taxes, postretirement benefits expense, and other non-cash operating activities.activities and reconciling adjustments.
2 Core working capital comprises accounts receivable, notes receivable, accrued revenue, inventories, accounts payable, and accrued rate refunds.
For the ninethree months ended September 30, 2016,March 31, 2017, net cash provided by operating activities at CMS Energy decreased $179increased $14 million compared with 20152016 and net cash provided by operating activities at Consumers decreased $139$17 million compared with 2015. These decreases were due primarily to lower collections from customers, including collections2016. At both CMS Energy and Consumers, higher net income, net of GCR underrecoveries and gas sold at lower prices in 2016, and higher energy optimization spending. These changes werenon-cash transactions, was offset partially by reduced customer collections, attributable to lower gas
prices and sales volumes. The change at Consumers also reflected a decreasereimbursement received from CMS Energy in 2016 for a prior-year postretirement benefits contributions, gas purchases at lower prices in 2016, and higher net income. At Consumers, the greater impact from changes in other assets and liabilities and the increase in non-cash transactions reflected an increase in the deferred income tax liability and expense associated with bonus depreciation on higher capital expenditures.contribution.
Investing Activities
Presented in the following table are specific components of net cash used in investing activities for the ninethree months ended September 30, 2016March 31, 2017 and 2015:2016:
| In Millions |
| ||||||||||||||||||
Nine Months Ended September 30 |
| 2016 |
| 2015 |
| Change |
| |||||||||||||
In Millions | In Millions |
| ||||||||||||||||||
Three Months Ended March 31 | 2017 | 2016 | Change |
| ||||||||||||||||
CMS Energy, including Consumers |
|
|
|
|
|
|
|
|
|
|
|
|
|
|
|
| ||||
Capital expenditures |
| $ | (1,224 | ) | $ | (1,102 | ) | $ | (122 | ) |
| $ | (365) |
| $ | (407) |
| $ | 42 |
|
Increase in EnerBank notes receivable |
| (87 | ) | (186 | ) | 99 |
| |||||||||||||
Decrease (increase) in EnerBank notes receivable |
|
| 14 |
| (16) |
|
| 30 |
| |||||||||||
Proceeds from the sale of EnerBank notes receivable |
| - |
| 48 |
| (48 | ) |
|
| 19 |
| - |
|
| 19 |
| ||||
DB SERP fund contributions |
| - |
| (25 | ) | 25 |
| |||||||||||||
Costs to retire property and other investing activities |
| (94 | ) | (75 | ) | (19 | ) |
|
| (14) |
| (21) |
|
| 7 |
| ||||
Net cash used in investing activities |
| $ | (1,405 | ) | $ | (1,340 | ) | $ | (65 | ) |
| $ | (346) |
| $ | (444) |
| $ | 98 |
|
Consumers |
|
|
|
|
|
|
|
|
|
|
|
|
|
|
|
| ||||
Capital expenditures |
| $ | (1,214 | ) | $ | (1,093 | ) | $ | (121 | ) |
| $ | (361) |
| $ | (406) |
| $ | 45 |
|
DB SERP fund contributions |
| - |
| (17 | ) | 17 |
| |||||||||||||
Costs to retire property and other investing activities |
| (95 | ) | (76 | ) | (19 | ) |
|
| (21) |
| (19) |
|
| (2) |
| ||||
Net cash used in investing activities |
| $ | (1,309 | ) | $ | (1,186 | ) | $ | (123 | ) |
| $ | (382) |
| $ | (425) |
| $ | 43 |
|
For the ninethree months ended September 30, 2016,March 31, 2017, net cash used in investing activities at CMS Energy increased $65decreased $98 million compared with 20152016 and net cash used in investing activities at Consumers increased $123decreased $43 million compared with 2015.2016. These changes were due primarily to higherlower capital expenditures and costs to retire property at Consumers, offset partially by the absence, in 2016, of DB SERP fund contributions.Consumers. The change at CMS Energy was also due to the absence,slower growth in 2016, of proceeds fromEnerBank consumer lending and the sale of EnerBank notes receivable and was offset partially by slower growth in EnerBank consumer lending.receivable.
Financing Activities
Presented in the following table are specific components of net cash provided by (used in)used in financing activities for the ninethree months ended September 30, 2016March 31, 2017 and 2015:2016:
|
| In Millions |
| |||||||
Nine Months Ended September 30 |
| 2016 |
| 2015 |
| Change |
| |||
CMS Energy, including Consumers |
|
|
|
|
|
|
| |||
Issuance of debt |
| $ | 775 |
| $ | 100 |
| $ | 675 |
|
Issuance of common stock |
| 69 |
| 40 |
| 29 |
| |||
Proceeds from EnerBank certificates of deposit, net |
| 64 |
| 135 |
| (71 | ) | |||
Payment of dividends on common and preferred stock |
| (260 | ) | (241 | ) | (19 | ) | |||
Retirement of debt |
| (215 | ) | (148 | ) | (67 | ) | |||
Increase (decrease) in notes payable |
| (174 | ) | 8 |
| (182 | ) | |||
Payment of capital leases and other financing activities |
| (22 | ) | (31 | ) | 9 |
| |||
Net cash provided by (used in) financing activities |
| $ | 237 |
| $ | (137 | ) | $ | 374 |
|
Consumers |
|
|
|
|
|
|
| |||
Issuance of debt |
| $ | 446 |
| $ | - |
| $ | 446 |
|
Stockholder contribution from CMS Energy |
| 275 |
| 150 |
| 125 |
| |||
Payment of dividends on common and preferred stock |
| (362 | ) | (360 | ) | (2 | ) | |||
Retirement of debt |
| (185 | ) | (48 | ) | (137 | ) | |||
Increase (decrease) in notes payable |
| (174 | ) | 8 |
| (182 | ) | |||
Payment of capital leases and other financing activities |
| (8 | ) | (19 | ) | 11 |
| |||
Net cash used in financing activities |
| $ | (8 | ) | $ | (269 | ) | $ | 261 |
|
In Millions |
| |||||||||
Three Months Ended March 31 | 2017 | 2016 | Change |
| ||||||
CMS Energy, including Consumers |
|
|
|
|
|
|
|
|
|
|
Issuance of debt |
| $ | 923 |
| $ | 30 |
| $ | 893 |
|
Issuance of common stock |
|
| 3 |
|
| 63 |
|
| (60) |
|
Net increase (decrease) in EnerBank certificates of deposit |
|
| (29 | ) |
| 14 |
|
| (43) |
|
Payment of dividends on common stock |
|
| (94 | ) |
| (86) |
|
| (8) |
|
Retirement of debt |
|
| (475 | ) |
| (30) |
|
| (445) |
|
Decrease in notes payable |
|
| (398 | ) |
| (249) |
|
| (149) |
|
Payment of capital leases and other financing activities |
|
| (24 | ) |
| (12) |
|
| (12) |
|
Net cash used in financing activities |
| $ | (94 | ) | $ | (270) |
| $ | 176 |
|
Consumers |
|
|
|
|
|
|
|
|
|
|
Issuance of debt |
| $ | 349 |
| $ | - |
| $ | 349 |
|
Stockholder contribution from CMS Energy |
|
| 250 |
|
| 150 |
|
| 100 |
|
Payment of dividends on common stock |
|
| (148 | ) |
| (155) |
|
| 7 |
|
Retirement of debt |
|
| (250 | ) |
| - |
|
| (250) |
|
Decrease in notes payable |
|
| (398 | ) |
| (249) |
|
| (149) |
|
Payment of capital leases and other financing activities |
|
| (9 | ) |
| (1) |
|
| (8) |
|
Net cash used in financing activities |
| $ | (206 | ) | $ | (255) |
| $ | 49 |
|
For the ninethree months ended September 30, 2016,March 31, 2017, net cash provided byused in financing activities at CMS Energy increased $374decreased $176 million compared with 20152016 and net cash used in financing activities at Consumers decreased $261$49 million compared with 2015. At2016. Higher debt issuances and, at Consumers, an increased stockholder contribution from CMS Energy the change was due to an increase in debt and common stock issuances. These changes were offset partially by higher debt retirements and higher repayments under Consumers’ commercial paper program and an increase in debt retirements.program.
At Consumers, the change was due primarily to an increase in debt issuances and contributions from CMS Energy, offset partially by higher debt repayments under the commercial paper program and an increase in debt retirements.
CAPITAL RESOURCES AND LIQUIDITY
CMS Energy uses dividends and tax-sharing payments from its subsidiaries and external financing and capital transactions to invest in its utility and non-utility businesses, retire debt, pay dividends, and fund its other obligations. The ability of CMS Energy’s subsidiaries, including Consumers, to pay dividends to CMS Energy depends upon each subsidiary’s revenues, earnings, cash needs, and other factors. In addition, Consumers’ ability to pay dividends is restricted by certain terms included in its debt covenants and articles of incorporation and potentially by FERC requirements and provisions under the Federal Power Act and the Natural Gas Act. For additional details on Consumers’ dividend restrictions, see Note 4, Financings and Capitalization—Dividend Restrictions. For the ninethree months ended September 30, 2016,March 31, 2017, Consumers paid $361$148 million in dividends on its common stock to CMS Energy.
As a result of federal tax legislation passed in December 2015 that extends bonus depreciation, CMS Energy expects to be able to extend the use of federal net operating loss carryforwards and, accordingly, defer its federal income tax payments through 2020. As a consequence, however, CMS Energy expects to receive lower tax-sharing payments from Consumers during that period. This may require CMS Energy to maintain higher levels of debt in order to invest in its businesses, pay
dividends, and fund its general obligations. Despite this, CMS Energy does not anticipate a need for a block equity offering.
In April 2015,March 2017, CMS Energy entered into an updated continuous equity offering program. Under this program, CMS Energy may sell, from time to time in “at the market” offerings, common stock having an aggregate sales price of up to $100 million. CMS Energy issued common stockThere have been no sales of securities under the program and received net proceeds of $60 million in March 2016 and $30 million in 2015.this program.
Consumers uses cash flows generated from operations and external financing transactions, as well as stockholder contributions from CMS Energy, to fund capital expenditures, retire debt, pay dividends, contribute to its employee benefit plans, and fund its other obligations. As a result of accelerated pension funding in recent years and several initiatives to reduce costs, Consumers anticipates continued strong cash flows from operating activities for the remainder of 2016.2017.
Access to the financial and capital markets depends on CMS Energy’s and Consumers’ credit ratings and on market conditions. As evidenced by past financing transactions, CMS Energy and Consumers have had ready access to these markets. Barring major market dislocations or disruptions, CMS Energy and Consumers expect to continue to have ready access to the financial and capital markets. If access to these markets were to diminish or otherwise become restricted, CMS Energy and Consumers would implement contingency plans to address debt maturities, which could include reduced capital spending.
At September 30, 2016,March 31, 2017, CMS Energy had $549 million of its secured revolving credit facility available and Consumers had $893 million available. CMS Energy and Consumers use these credit facilities for general working capital purposes and to issue letters of credit. An additional source of liquidity is Consumers’ commercial paper program, which allows Consumers to issue, in one or more placements, up to $500 million in the aggregate in commercial paper notes with maturities of up to 365 days and that bear interest at fixed or floating rates. These issuances are supported by one of Consumers’ revolving credit facilities. While the amount of outstanding commercial paper does not reduce the revolving credit facility’s available capacity, Consumers does not intend to issue commercial paper in an amount exceeding the available facility capacity. At September 30, 2016, $75 million ofMarch 31, 2017, no commercial paper notes were outstanding under this program. For additional details on CMS Energy’s and Consumers’ secured revolving credit facilities and commercial paper program, see Note 4, Financings and Capitalization.
Certain of CMS Energy’s and Consumers’ credit agreements, debt indentures, and other facilities contain covenants that require CMS Energy and Consumers to maintain certain financial ratios, as defined therein. At September 30, 2016,March 31, 2017, no default had occurred with respect to any financial covenants contained in CMS Energy’s and Consumers’ credit agreements, debt indentures, or other facilities. CMS Energy and Consumers were each in compliance with these covenants as of September 30, 2016,March 31, 2017, as presented in the following table:
|
|
| |||||||
Credit Agreement, Indenture, or Facility | Limit |
| Actual |
| |||||
CMS Energy, parent only |
|
|
|
|
| ||||
Debt to EBITDA1 |
|
| 6.0 to 1.0 |
|
| ||||
Consumers |
|
|
|
|
| ||||
Debt to Capital2 |
|
| 0.65 to 1.0 |
|
| ||||
1 Applies to CMS Energy’s $550 million revolving and $180 million term loan credit agreements.
2 Applies to Consumers’ $650 million $250 million, and $30$250 million revolving credit agreements and its $68 million, $35 million, and $68$30 million reimbursement agreements.
Components of CMS Energy’s and Consumers’ cash management plan include controlling operating expenses and capital expenditures and evaluating market conditions for financing and refinancing opportunities. CMS Energy’s and Consumers’ present level of cash and expected cash flows from operating activities, together with access to sources of liquidity, are anticipated to be sufficient to fund the companies’ contractual obligations for 20162017 and beyond.
Off-Balance-Sheet Arrangements
CMS Energy, Consumers, and certain of their subsidiaries enter into various arrangements in the normal course of business to facilitate commercial transactions with third parties. These arrangements include indemnities, surety bonds, letters of credit, and financial and performance guarantees. Indemnities are usually agreements to reimburse a counterparty that may incur losses due to outside claims or breach of contract terms. The maximum payment that could be required under a number of these indemnity obligations is not estimable; the maximum obligation under indemnities for which such amounts were estimable was $153 million at September 30, 2016.March 31, 2017. While CMS Energy and Consumers believe it is unlikely that they will incur any material losses related to indemnities they have not recorded as liabilities, they cannot predict the impact of these contingent obligations on their liquidity and financial condition. For additional details on these and other guarantee arrangements, see Note 3, Contingencies and Commitments—Guarantees.
OUTLOOK
Several business trends and uncertainties may affect CMS Energy’s and Consumers’ financial condition and results of operations. These trends and uncertainties could have a material impact on CMS Energy’s and Consumers’ consolidated income, cash flows, or financial position. For additional details regarding these and other uncertainties, see Forward-Looking Statements and Information; Note 2, Regulatory Matters; Note 3, Contingencies and Commitments; and Part II—Item 1A. Risk Factors.
Consumers Electric Utility and Gas Utility Outlook and Uncertainties
Energy Waste Reduction Plan: The 2016 Energy Law, which became effective in April 2017, expands the existing energy optimization program to include demand response programs, calling the combined initiatives energy waste reduction. The 2016 Energy Law:
·extends the requirement to achieve annual reductions of 1.0 percent in customers’ electricity use through 2021 and 0.75 percent in customers’ natural gas use indefinitely
·removes limits on investments under the program and provides for a higher return on those investments; together, these provisions effectively double the financial incentives Consumers may earn for exceeding the statutory targets
·establishes a goal of 35 percent combined renewable energy and energy waste reduction by 2025
Under its existing energy optimization plan, Consumers provides its customers with incentives to reduce usage by offering energy audits, rebates and discounts on purchases of highly efficient appliances, and other incentives and programs. In March 2017, Consumers filed applications with the MPSC for approval of an energy waste reduction plan that would amend and expand Consumers’ existing energy optimization plan and allow for recovery of increased investments to meet the requirements of the 2016 Energy Law.
Smart Energy and Gas AMR: Consumers began the full-scale deployment of smart meters in 2012 and expects to complete it inby the end of 2017. Smart meters allow customers to monitor and manage their energy usage, which Consumers expects will help reduce demand during critical peak times, resulting in lower peak electric capacity requirements. In addition, Consumers is able to disconnect and reconnect service, read, and bill from smart meters remotely. Consumers will continue to add further functionality to its smart meters. Consumers is also installing communication modules on gas meters in areas where it provides both electricity and natural gas to customers. The communication modules allow Consumers to read and bill from gas meters remotely.
Consumers expects that under its Smart Energy program it will have installed a total of 1.8 million smart meters and 600,000 communication modules throughout its service territory by the end of 2017. As of September 30, 2016,March 31, 2017, Consumers had upgraded 1.21.5 million electric customers to smart meters and had installed 250,000470,000 communication modules on gas meters.
In areas where it provides only natural gas to customers, Consumers will deploybegan the deployment of Gas AMR technology beginning in 2017.2017 and expects to complete it in 2019. Under this program, Consumers plans to install communication modules are expected to be installed on 1.2 million gas meters, allowing Consumersit to conduct drive-by meter reading.
Consumers Electric Utility Outlook and Uncertainties
Clean Energy Plan:Resource Planning: Consumers continues to experience increasing demand for electricity due to Michigan’s recoveringgrowing economy and increased use of air conditioning, consumer electronics, and other
electric devices, offset partially by the predicted effects of energy efficiency and conservation.
In orderApril 2016, Consumers retired seven of its coal-fueled electric generating units, representing 950 MW of capacity. In December 2016, Consumers and Entergy reached an agreement to address futureterminate their PPA under which Consumers purchases virtually all of the capacity requirements and growingenergy produced by Palisades, up to the annual average capacity of 798 MW. Under the agreement, which is contingent on the MPSC’s approval of Consumers’ recovery in electric demandrates of the termination payment, the PPA would terminate in Michigan,May 2018, four years ahead of schedule.
Even with the retirements of seven of its coal-fueled units and the expected termination of the Palisades PPA, Consumers has a comprehensive clean energy plan designedexpects to meet the short-term and long-term electricity needscapacity requirements of its full-service customers through:
· energy efficiency
·demand managementwaste reduction
· expanded use of renewable energy
·the use of the Jackson plant, a 540-MW natural gas-fueled electric generating plant purchased in 2015
· construction or purchase of electric generating units
· continued operation or upgrade of existing units, including upgrades at Ludington
·renegotiations of existing PPAs
· purchases of short-term market capacity
InSpecifically, to address the potential termination of the Palisades PPA, Consumers issued a request for proposals in April 2016, Consumers retired seven of its coal-fueled electric generating units, representing 950 MW of generating capacity. Even with these retirements, Consumers expects2017 to meet the capacity requirements of its full-service customers for 2016 through 2020 through the use ofacquire a 540-MW natural gas-fueled electric generating plant purchasedof up to 800 MW. Consumers is interested in December 2015, upgrades at Ludington, expanded use of renewable energy, energy efficiency programs, and demand management programs. In October 2016,acquiring a simple-cycle or combined-cycle generating plant operating in Michigan’s Lower Peninsula. Also, Consumers completed an auction to purchase generation capacity for 2017. The MSPC must approve any2018. Any contracts that Consumers entersentered into as a result of the auction. As demand forecasts become more certain, Consumers may take additional actionsrequest for proposals and the auction are subject to cover any remaining capacity requirements for its full-service customers, including participation inMPSC approval and are contingent on the annual MISO planning resource auction.MPSC’s approval of the termination of the Palisades PPA.
Renewable Energy Plan: Consumers’The 2016 Energy Law raises the renewable energy plan details howstandard from the present ten-percent requirement to 15 percent in 2021, with an interim target of 12.5 percent in 2019. Consumers expects to meet REC and capacity standards prescribed by the 2008 Energy Law. This law requires Consumersis required to submit RECs, which represent proof that the associated electricity was generated from a renewable energy resource, in an amount equal to at least ten percentthe required percentage of Consumers’ electric sales volume each year. Under its renewable energy plan, Consumers expects to meet its renewable energy requirement each year with a combination of newly generated RECs and previously generated RECs carried over from prior years.
In conjunction with its renewable energy plan, Consumers signed a 15-year agreement in September 2015 to purchase renewable capacity, energy, and RECs from a 100-MW wind park to be constructed in Huron County, Michigan. The wind park is expected to be operational inby the end of 2017. In September 2016,addition, Consumers applied forhas obtained a special land use permit for the construction of two additional phases at its Cross Winds® Energy Park PhasesPark: Phase II, with a nameplate capacity of 44 MW, and III. ThisPhase III, with a nameplate capacity of 76 MW. In March 2017, the MPSC approved Consumers’ application to construct Phase II, which is expected to be operational by the end of 2017. Both phases of the project will qualify for certain federal production tax credits, thatwhich are expected to reduce thegenerate cost of the construction. These cost savings that will be passed on to customers. Consumers also completed construction of two community solar projects in 2016. Together, these solar projects provide a combined four MW of nameplate capacity.
Electric Customer Deliveries and Revenue: Consumers’ electric customer deliveries are largely dependent on Michigan’s economy. Consumers expects weather-adjusted electric deliveries to increase in 20162017 by one-half to one percent compared with 2015.2016.
Over the next five years, Consumers plans conservatively for average electric delivery growth of about one-half percent annually. This increase reflects growth in electric demand, offset partially by the predicted effects of energy efficiencywaste reduction programs and appliance efficiency standards. Actual delivery levels will depend on:
· energy conservation measures and results of energy efficiencywaste reduction programs
· �� weather fluctuations
· Michigan’s economic conditions, including utilization, expansion, or contraction of manufacturing facilities, population trends, and housing activity
Electric ROA: The 2008 Energy Law allowsUnder existing Michigan law, electric customers in Consumers’ service territory are allowed to buy electric generation service from alternative electric suppliers in an aggregate amount up to ten percent of Consumers’ weather-adjusted retail sales for the preceding calendar year. At September 30, 2016,March 31, 2017, electric deliveries under the ROA program were at the ten-percent limit and alternative electric suppliers were providing 748 MW of generation service to ROA customers.limit. Of Consumers’ 1.8 million electric customers, 302 customers, or 0.02 percent, purchased electric generation service under the ROA program.
The 2016 Energy Law, which became effective in April 2017, retains the ten percent cap on ROA, with certain exceptions, but establishes a path to ensure that forward capacity is secured for all electric customers in Michigan, Energy Policy: In 2015, Michigan’s governor outlined several key goals for the state’s energy policy, with a focus on increasing the use of clean energy sources, reducing Michigan’s reliance on coal, deploying smart meters, investing in the power grid and pipeline system, eliminating energy waste, and ensuring affordable, reliable, and adaptable energy while protecting the environment. The Michigan Senate and House of Representatives are considering two separate but similar pieces of legislation to address energy policy. Consumers is unable to predict the form and timing of any final legislation. While most of the proposed changes represent potential benefits to Consumers’including customers Consumers’ business plan assumes no changes to the existing law.
In September 2016, Michigan’s governor and MISO announced that MISO will submit a proposal to FERC in November 2016 that would impose capacity requirements onserved by alternative electric suppliers operating in Michigan. Underunder ROA. The new law also authorizes the joint proposal,MPSC to ensure that alternative electric suppliers would be required to procurehave procured enough capacity to cover their anticipated capacity requirements for the subsequent three-yearfour-year forward period. IfTo this end, the MPSC issued an order in March 2017, directing Consumers to file an application to implement a state reliability mechanism. Under such a mechanism, if an alternative electric supplier did not procure enoughdemonstrate that it had procured its capacity itsrequirements for the four-year forward period, ROA customers would then pay a charge to the utility for capacity charge setthat is not provided by the MPSC. The capacity charge would be determinedalternative electric supplier. Consumers filed its application in a separate proceeding in 2017, should FERC approve MISO’s proposal. Consumers cannot predict the outcome of this proposal.April 2017.
Electric Rate Matters: Rate matters are critical to Consumers’ electric utility business. For additional details on rate matters, see Note 2, Regulatory Matters.
FERC Transmission Order:2017 Electric Rate Case: In September 2016, FERC issuedMarch 2017, Consumers filed an order reducingapplication with the MPSC seeking an annual rate increase of $173 million, based on a 10.5 percent authorized return on equity earnedequity. The filing requested authority to recover new investment in system reliability, environmental compliance, and technology enhancements. Presented in the following table are the components of the requested increase in revenue:
In Millions |
| |||
Components of the rate increase |
|
|
| |
Investment in rate base |
| $ | 47 |
|
Operating and maintenance costs |
| 56 |
| |
Gross margin |
| 42 |
| |
Cost of capital |
| 37 |
| |
Working capital |
| (9 | ) | |
Total |
| $ | 173 |
|
Palisades PPA: In December 2016, Consumers and Entergy reached an agreement to terminate their PPA in May 2018, four years ahead of schedule. Under the PPA, Consumers purchases virtually all of the capacity and energy produced by transmission owners operating within MISOPalisades, up to a basethe annual average capacity of 10.32 percent798 MW. The prices that Consumers pays under the PPA, and which it recovers from 12.38 percent. FERC ordered MISO and transmission owners to provide refunds, with interest, to transmission customers such as Consumers for the period from November 2013 through February 2015. Consumers would return to its electric customers any refund it received as a result of this order, whichthrough the PSCR ratemaking process, are presently higher than the cost to purchase electricity from the market. In exchange for early termination, Consumers agreed to pay Entergy $172 million on the termination date.
The agreement is subject to further legal proceedings.MPSC approval. In February 2017, Consumers requested authorization to recover the termination payment through securitization. The MPSC indicated that it will make a final determination on the securitization filing by September 2017. If the MPSC does not approve Consumers’ request by September 30, 2017, the agreement will be null and void (unless otherwise extended) and the PPA will continue until April 2022 under its original terms.
Depreciation Rate Case: In November 2016, Consumers filed a depreciation rate case related to its Ludington electric utility property, requesting to increase depreciation expense by $15 million annually.
As a transmission owner sinceSale of Coal-Fueled Generating Units: In April 2016,2017, Consumers would provide no refundreached an agreement to sell its transmission customers.retired B.C. Cobb and J.R. Whiting coal-fueled electric generating units to Forsite. Under the terms of the agreement, which is contingent on MPSC approval, Consumers will transfer the generating units and associated land to Forsite. Consumers securitized the generating units in 2014; thus, the book value of the assets is zero. In addition, Consumers is eligible for a 50-basis-point increasewill pay Forsite $63 million to its transmission return on equitydecommission the units and perform cleanup activities at the sites. This payment will be recorded as a transmission-owning memberreduction to Consumers’ cost of MISO.removal regulatory liability. Consumers estimates that this divestiture will save its electric customers $30 million in decommissioning costs.
Electric Environmental Outlook: Consumers’ operations are subject to various state and federal environmental laws and regulations. Consumers estimates that it will incur capital expenditures of $0.6$0.5 billion from 20162017 through 20202021 to continue to comply with the Clean Air Act, Clean Water Act, and numerous state and federal environmental regulations. Consumers expects to recover these costs in customer rates, but cannot guarantee this result. Consumers’ primary environmental compliance focus includes, but is not limited to, the following matters.
Air Quality: CSAPR, which became effective in January 2015, requires Michigan and 27 other states to improve air quality by reducing power plant emissions that, according to EPA computer models, contribute to ground-level ozone and fine particle pollution in other downwind states. In September 2016, the EPA finalized new ozone season standards for CSAPR, which will begin in May 2017. CSAPR is presently being litigated; however, any decision will not impact Consumers’ compliance strategy, as Consumers expects its emissions to be within the CSAPR allowance allocations.
In 2012, the EPA published emission standards for electric generating units, based on Section 112 of the Clean Air Act, calling the final rule MATS. Under MATS, all of Consumers’ existing coal-fueled electric generating units were required to add additional controls for hazardous air pollutants. Consumers met the extended deadline of April 2016 for five coal-fueled units and two oil/gas-fueled units it continues to operate and retired its seven remaining coal-fueled units. MATS is presently being litigated, but any decision is not expected to impact Consumers’ MATS compliance strategy. In addition, Consumers must still comply with the Michigan Mercury Rule and with its settlement agreement with the EPA entered into in November 2014 concerning opacity and NSR.
In October 2015, the EPA released its new rule to lower the NAAQS for ozone. The new ozone NAAQS will make it more difficult to construct or modify power plants in many areas of the country, including some parts of Michigan, if the areas are designated to be in nonattainment of the new standard. The NAAQS for ozone are presently being litigated. Consumers is monitoring the designation process of this rule, as well as the litigation, to determine what, if any, effect it will have on its electric generating units.
Consumers’ strategy to comply with air quality regulations, including CSAPR, NAAQS, and MATS, involved the installation of emission control equipment at some facilities and the suspension of operations at others; however, Consumers continues to evaluate these rules in conjunction with other EPA rulemakings, litigation, and congressional action. This evaluation could result in:
· a change in Consumers’ fuel mix
· changes in the types of generating units Consumers may purchase or build in the future
·changes in how certain units are used
· the retirement, mothballing, or repowering with an alternative fuel of some of Consumers’ generating units
· changes in Consumers’ environmental compliance costs
Greenhouse Gases:There have been numerous legislative and regulatory initiatives at the state, regional, national, and international levels that involve the potential regulation of greenhouse gases. Consumers continues to monitor and comment on these initiatives and to follow litigation involving greenhouse gases. Consumers believes Congress may eventually pass greenhouse gas legislation, but is unable to predict the form and timing of any final legislation.
In August 2015, the EPA finalized new rules pursuant to Section 111(b) of the Clean Air Act to limit carbon dioxide emissions from new electric generating units. New coal-fueled units will not be able to meet this limit without installing carbon dioxide control equipment using such methods as carbon capture and sequestration. Also in August 2015,In addition, the EPA finalized new rules pursuant to Section 111(b) of the Clean Air Act to limit carbon dioxide emissions from modified or reconstructed electric generating units. Both of these rules are being litigated.
In OctoberAlso in 2015, the EPA published final rules pursuant to Section 111(d) of the Clean Air Act to limit carbon dioxide emissions from existing electric generating units, calling the rules the “Clean Power Plan.” Certain states, corporations, and industry groups have initiated litigation opposing the proposed Clean Power Plan. In February 2016, the U.S. Supreme Court stayed the Clean Power Plan while the litigation proceeds. While Michigan’s Attorney General has joined the litigation, the governor had indicated that Michigan intended to file a state carbon implementation plan, which was to be submitted for EPA review and approval in 2018. Work on this plan has ceased, however, in light of the stay of the Clean Power Plan and pending outcome of the litigation.
The rules would require a 32 percent nationwide reduction in carbon emissions from existing power plants by 2030 (based on 2005 levels). Initial state implementation plans would have been due September 2016 with extensions available until 2018. It is expected that these deadlines will be extended as a result of the rules being stayed. States choosing not to develop their own implementation plans would be subject to the federal plan. The Trump administration issued an executive order in March 2017 directing the EPA and other federal agencies to review rules and policies that burden domestic energy production, including the Clean Power Plan. The EPA subsequently filed motions to hold the Section 111(b) and Clean Power Plan litigation in abeyance while it reconsiders the rule.
In December 2015, a group of 195 countries finalized the Paris Agreement, which governs carbon dioxide reduction measures beginning in 2020. As part of this agreement, the United States pledged a 26 percent reduction in greenhouse gas emissions by 2025 (with aspirations to achieve a 28 percent reduction) compared with 2005 levels. These targets are in line with the now-stayed Clean Power Plan targets. While these emission reduction commitments are non-binding, they will be governed by the Clean Power Plan should it survive
judicial scrutiny. The Trump administration has indicated that it intends to re-examine the Paris Agreement in the coming months.
While Consumers believes thatcannot predict the outcome of changes in policy under the Trump administration or of other legislative or regulatory initiatives involving the potential regulation of greenhouse gases, it is favorably positionedintends to dealcontinue to move forward with the impact of carbon regulation through its clean energy plan, its present carbon reduction target, and its emphasis on supply diversity. Consumers cannot, however, predict the outcome of these EPA rules in court, or of Michigan’s potential implementation plan. Consumers will continue to monitor regulatory activity regarding greenhouse gas emissions standards that may affect electric generating units.
Litigation, as well as federal laws, EPA regulations regarding greenhouse gases, or similar treaties, state laws, or rules, if enacted or ratified, could ultimately require Consumers to replace equipment, install additional emission control equipment, purchase emission allowances, curtail operations, arrange for alternative sources of supply, or take other steps to manage or lower the emission of greenhouse gases. Although associated capital or operating costs relating to greenhouse gas regulation or legislation could be material and cost recovery cannot be assured, Consumers expects to recover these costs and capital expenditures in rates consistent with the recovery of other reasonable costs of complying with environmental laws and regulations.
CCRs: In April 2015, the EPA published a final rule regulating CCRs, such as coal ash, under the Federal Resource Conservation and Recovery Act of 1976.RCRA. The final rule adopts minimum standards for beneficially reusing and disposing of non-hazardous CCRs. The rule establishes new minimum requirements for site location, groundwater monitoring, flood protection, storm water design, fugitive dust control, and public disclosure of information. The rule also sets out conditions under which CCR units would be forced to cease receiving CCR and non-CCR waste and initiate closure based on the inability to achieve minimum safety standards, meet a location standard, or meet minimum groundwater standards. Consumers continues to develop work plans for submission to the MDEQ for concurrence to ensure coordination between federal and state requirements. Furthermore, Congress passed legislation in December 2016 that allows states to develop a permitting program for CCR under RCRA, and Michigan will likely adopt such a program. As a result, Consumers may need to adjust its recorded asset retirement obligationARO associated with coal ash disposal sites depending on the outcome of its submissions to the MDEQ.MDEQ and on a future RCRA permitting program under MDEQ, if the EPA approves a state-level program. Consumers has historically been authorized to recover in electric rates costs incurred related to cleanup and closure of coal ash disposal sites.
Water:The EPA’s rule to regulate existing electric generating plant cooling water intake systems under Section 316(b) of the Clean Water Act became effective in October 2014. The rule is aimed at reducing alleged harmful impacts on fish and shellfish. In November 2015, the EPA released its final effluent limitation guidelines, which set stringent new requirements for the discharge from electric generating units into wastewater streams. In April 2017, the EPA announced a decision to reconsider the final rule, which is being litigated, and administratively stayed and delayed the compliance dates. Consumers believes that its environmental strategy will allow it to achieve compliance with thesethe final rules.rule, should it survive reconsideration and judicial review.
In June 2015, the EPA and the U.S. Army Corps of Engineers published a final rule redefining “waters of the United States,” which designates the EPA’s jurisdiction under the Clean Water Act. Numerous states and other interested parties, including Michigan’s Attorney General, have filed suits in federal courts to block the rule, which was stayed in October 2015, and that litigation remains pending. The Trump administration issued an executive order in February 2017 directing the EPA and the U.S. Army Corps of Engineers to re-examine the “waters of the United States” rule. Consumers does not expect any adverse changes to its environmental strategy as a result of the final rule.rule or its re-examination.
Many of Consumers’ facilities maintain NPDES permits, which are valid for five years and vital to the facilities’ operations. Failure of the MDEQ to renew any NPDES permit, a successful appeal against a permit, or onerous terms contained in a permit could have a significant detrimental effect on the operations of a facility.
PCBs:In 2010, the EPA issued an Advance Notice of Proposed Rulemaking, indicating that it is considering a variety of regulatory actions with respect to PCBs. One approach would aim to phase out equipment containing PCBs by 2025. Another approach would eliminate an exemption for small equipment containing PCBs. To comply with any such regulatory actions, Consumers could incur substantial costs associated with existing electrical equipment potentially containing PCBs. A proposed ruleThe timing of any future rulemaking is expected in 2017.uncertain as the Trump administration has not indicated that a PCB rulemaking is a priority.
Other electric environmental matters could have a material impact on Consumers’ outlook. For additional details on other electric environmental matters, see Note 3, Contingencies and Commitments—Consumers Electric Utility Contingencies—Electric Environmental Matters.
Consumers Gas Utility Outlook and Uncertainties
Gas Deliveries: Consumers expects weather-adjusted gas deliveries in 2016 to increase by about two percent compared with 2015. Over2017 and over the next five years Consumers plans conservatively forto remain stable deliveries.relative to 2016. This outlook reflects modest growth in gas demand offset by the predicted effects of energy efficiency and conservation. Actual delivery levels from year to year may vary from this expectation due to:
· weather fluctuations
· use by power producers
· availability and development of renewable energy sources
· gas price changes
· Michigan economic conditions, including population trends and housing activity
· the price of competing energy sources or fuels
· energy efficiency and conservation impacts
Gas Rate Matters: Rate matters are critical to Consumers’ gas utility business. For additional details on rate matters, see Note 2, Regulatory Matters.
Gas Rate Case: Transmission:In AugustSeptember 2016, Consumers filed an application with the MPSC seekingto invest $610 million in the construction of a 95-mile, 24-inch-diameter natural gas pipeline in Saginaw, Genesee, and Oakland Counties, Michigan. The MPSC issued an annual rate increase of $90 million, based on a 10.6 percent authorized return on equity. The largest component of the request is an annual revenue requirement of $84 million related to new investments that will alloworder in March 2017 authorizing Consumers to strengthen infrastructureconstruct and improve system capacity and deliverability.
The filing also seeks approval of two rate adjustment mechanisms: one that would reconcile annually Consumers’ actual nonfuel revenues withoperate the revenues approvedpipeline. Consumers expects the pipeline to be operational by the MPSC, and another that would provide for additional annual rate increasesend of $35 million beginning in 2018 and another $35 million beginning in 2019 for incremental investments that Consumers plans to make in those years, subject to reconciliation. These future investments are intended to help ensure adequate system capacity and deliverability.
Depreciation Rate Case: In August 2016, Consumers filed a depreciation rate case related to its gas utility property, requesting to decrease depreciation expense by $3 million annually.2022.
Gas Pipeline SafetySafety:: In October 2016, A new rule from the U.S. Department of Transportation’s Pipeline and Hazardous Materials Safety Administration, published a final rule that will requireeffective in April 2017, requires the installation of additional safety valves on certain gas distribution service lines beginning in 2017.lines. Consumers is evaluating the cost of complying with this rule, but expects that it will be able to recover the cost in rates, consistent with the recovery of other reasonable costs of complying with laws and regulations.
Gas Environmental Outlook: Consumers expects to incur response activity costs at a number of sites, including 23 former MGP sites. For additional details, see Note 3, Contingencies and Commitments—Consumers Gas Utility Contingencies—Gas Environmental Matters.
Enterprises Outlook and Uncertainties
The primary focus with respect to CMS Energy’s non-utility businesses is to optimize cash flow and maximize the value of their generating assets, which represent 1,077 MW of capacity.capacity, and to pursue opportunities for the development of renewable generation projects.
Trends, uncertainties, and other matters that could have a material impact on CMS Energy’s consolidated income, cash flows, or financial position include:
· changes in energy and capacity prices
· changes in commodity prices and interest rates on certain derivative contracts that do not qualify for hedge accounting and must be marked to market through earnings
· changes in various environmental laws, regulations, principles, or practices, or in their interpretation
· the outcome of certain legal proceedings
· indemnity and environmental remediation obligations at Bay Harbor
· obligations related to a tax claim from the government of Equatorial Guinea
· representations, warranties, and indemnities provided by CMS Energy in connection with previous sales of assets
For additional details regarding the enterprises segment’s uncertainties, see Note 3, Contingencies and Commitments.
Other Outlook and Uncertainties
EnerBank: EnerBank is a Utah state-chartered, FDIC-insured industrial bank providing unsecured consumer installment loans for financing home improvements. EnerBank represented four percent of CMS Energy’s net assets at September 30, 2016March 31, 2017 and fivefour percent of CMS Energy’s net income available to common stockholders for the ninethree months ended September 30, 2016.March 31, 2017. The carrying value of EnerBank’s loan portfolio was $1.2 billion at September 30, 2016.March 31, 2017. Its loan portfolio was funded primarily by certificates of deposit of $1.2 billion. The twelve-month rolling average net default rate on loans held by EnerBank was 0.81.1 percent at September 30, 2016.March 31, 2017. CMS Energy is required both by law and by contract to provide financial support, including infusing additional capital, to ensure that EnerBank satisfies mandated capital requirements and has sufficient liquidity to operate. With its self-funding plan, EnerBank has exceeded these requirements historically and exceeded them as of September 30, 2016.
Employee Separation Program: In June 2016, CMS Energy and Consumers announced a voluntary separation program for non-union employees. During the three months ended September 30, 2016, CMS Energy and Consumers recorded a charge of $11 million related to this program, under which 176 employees accepted and were approved for early separation. After hiring replacements for certain positions, CMS Energy and Consumers expect a net reduction of 140 employees. This will result in future cost savings, as employee staffing levels will be better matched to workload demand, which reflects CMS Energy’s and Consumers’ ongoing productivity and quality improvements.March 31, 2017.
Litigation: CMS Energy, Consumers, and certain of their subsidiaries are named as parties in various litigation matters, as well as in administrative proceedings before various courts and governmental agencies, arising in the ordinary course of business. For additional details regarding these and other legal matters, see Note 2, Regulatory Matters and Note 3, Contingencies and Commitments.
NEW ACCOUNTING STANDARDS
For details regarding new accounting standards issued but not yet effective, see Note 1, New Accounting Standards.
CMS Energy Corporation
Consolidated Statements of Income (Unaudited)
|
| In Millions, Except Per Share Amounts |
| |||||||||||||||||
|
| Three Months Ended |
| Nine Months Ended |
| |||||||||||||||
September 30 |
| 2016 |
| 2015 |
| 2016 |
| 2015 |
| |||||||||||
In Millions, Except Per Share Amounts | In Millions, Except Per Share Amounts |
| ||||||||||||||||||
Three Months Ended March 31 |
| 2017 |
| 2016 |
| |||||||||||||||
|
|
|
|
|
|
|
|
|
|
|
|
|
|
| ||||||
Operating Revenue |
| $ | 1,587 |
| $ | 1,486 |
| $ | 4,759 |
| $ | 4,947 |
|
| $ | 1,829 |
| $ | 1,801 |
|
|
|
|
|
|
|
|
|
|
|
|
|
|
|
| ||||||
Operating Expenses |
|
|
|
|
|
|
|
|
|
|
|
|
|
| ||||||
Fuel for electric generation |
| 145 |
| 161 |
| 367 |
| 462 |
|
| 117 |
| 125 |
| ||||||
Purchased and interchange power |
| 454 |
| 392 |
| 1,165 |
| 1,082 |
|
| 333 |
| 346 |
| ||||||
Purchased power – related parties |
| 22 |
| 21 |
| 65 |
| 61 |
|
| 22 |
| 22 |
| ||||||
Cost of gas sold |
| 45 |
| 52 |
| 490 |
| 754 |
|
| 336 |
| 354 |
| ||||||
Maintenance and other operating expenses |
| 290 |
| 311 |
| 859 |
| 906 |
|
| 290 |
| 303 |
| ||||||
Depreciation and amortization |
| 183 |
| 173 |
| 597 |
| 564 |
|
| 262 |
| 238 |
| ||||||
General taxes |
| 62 |
| 59 |
| 209 |
| 200 |
|
| 81 |
| 87 |
| ||||||
Total operating expenses |
| 1,201 |
| 1,169 |
| 3,752 |
| 4,029 |
|
| 1,441 |
| 1,475 |
| ||||||
|
|
|
|
|
|
|
|
|
|
|
|
|
|
| ||||||
Operating Income |
| 386 |
| 317 |
| 1,007 |
| 918 |
|
| 388 |
| 326 |
| ||||||
|
|
|
|
|
|
|
|
|
|
|
|
|
|
| ||||||
Other Income (Expense) |
|
|
|
|
|
|
|
|
|
|
|
|
|
| ||||||
Interest income |
| 1 |
| 1 |
| 4 |
| 3 |
|
| 5 |
| 1 |
| ||||||
Allowance for equity funds used during construction |
| 3 |
| 3 |
| 9 |
| 7 |
|
| 2 |
| 3 |
| ||||||
Income from equity method investees |
| 5 |
| 4 |
| 12 |
| 9 |
|
| 4 |
| 4 |
| ||||||
Nonoperating retirement benefits, net |
| 3 |
| 10 |
| |||||||||||||||
Other income |
| 2 |
| 2 |
| 7 |
| 8 |
|
| 2 |
| 3 |
| ||||||
Other expense |
| (6 | ) | (3 | ) | (13 | ) | (11 | ) |
| (2 | ) | (3 | ) | ||||||
Total other income |
| 5 |
| 7 |
| 19 |
| 16 |
|
| 14 |
| 18 |
| ||||||
|
|
|
|
|
|
|
|
|
|
|
|
|
|
| ||||||
Interest Charges |
|
|
|
|
|
|
|
|
|
|
|
|
|
| ||||||
Interest on long-term debt |
| 103 |
| 95 |
| 306 |
| 288 |
|
| 100 |
| 100 |
| ||||||
Other interest expense |
| 8 |
| 7 |
| 22 |
| 20 |
|
| 8 |
| 7 |
| ||||||
Allowance for borrowed funds used during construction |
| (1 | ) | (1 | ) | (4 | ) | (3 | ) |
| (1 | ) | (1 | ) | ||||||
Total interest charges |
| 110 |
| 101 |
| 324 |
| 305 |
|
| 107 |
| 106 |
| ||||||
|
|
|
|
|
|
|
|
|
|
|
|
|
|
| ||||||
Income Before Income Taxes |
| 281 |
| 223 |
| 702 |
| 629 |
|
| 295 |
| 238 |
| ||||||
Income Tax Expense |
| 95 |
| 75 |
| 227 |
| 211 |
|
| 96 |
| 74 |
| ||||||
|
|
|
|
|
|
|
|
|
|
|
|
|
|
| ||||||
Net Income |
| 186 |
| 148 |
| 475 |
| 418 |
| |||||||||||
Income Attributable to Noncontrolling Interests |
| - |
| - |
| 1 |
| 1 |
| |||||||||||
|
|
|
|
|
|
|
|
|
| |||||||||||
Net Income Available to Common Stockholders |
| $ | 186 |
| $ | 148 |
| $ | 474 |
| $ | 417 |
|
| $ | 199 |
| $ | 164 |
|
|
|
|
|
|
|
|
|
|
|
|
|
|
|
| ||||||
Basic Earnings Per Average Common Share |
| $ | 0.67 |
| $ | 0.53 |
| $ | 1.71 |
| $ | 1.51 |
|
| $ | 0.71 |
| $ | 0.59 |
|
Diluted Earnings Per Average Common Share |
| $ | 0.67 |
| $ | 0.53 |
| $ | 1.70 |
| $ | 1.51 |
|
| $ | 0.71 |
| $ | 0.59 |
|
|
|
|
|
|
|
|
|
|
|
|
|
|
|
| ||||||
Dividends Declared Per Common Share |
| $ | 0.31 |
| $ | 0.29 |
| $ | 0.93 |
| $ | 0.87 |
|
| $ | 0.33 |
| $ | 0.31 |
|
The accompanying notes are an integral part of these statements.
CMS Energy Corporation
Consolidated Statements of Comprehensive Income (Unaudited)
|
| In Millions |
| ||||||||||
|
| Three Months Ended |
| Nine Months Ended |
| ||||||||
September 30 |
| 2016 |
| 2015 |
| 2016 |
| 2015 |
| ||||
|
|
|
|
|
|
|
|
|
| ||||
Net Income |
| $ | 186 |
| $ | 148 |
| $ | 475 |
| $ | 418 |
|
|
|
|
|
|
|
|
|
|
| ||||
Retirement Benefits Liability |
|
|
|
|
|
|
|
|
| ||||
Amortization of net actuarial loss, net of tax of $-, $1, $-, and $3 |
| 1 |
| 2 |
| 2 |
| 4 |
| ||||
Amortization of prior service credit, net of tax of $- for all periods |
| - |
| (1 | ) | (1 | ) | (1 | ) | ||||
|
|
|
|
|
|
|
|
|
| ||||
Investments |
|
|
|
|
|
|
|
|
| ||||
Unrealized gain (loss) on investments, net of tax of $-, $(1), $-, and $(1) |
| 1 |
| (2 | ) | 1 |
| (3 | ) | ||||
|
|
|
|
|
|
|
|
|
| ||||
Other Comprehensive Income (Loss) |
| 2 |
| (1 | ) | 2 |
| - |
| ||||
|
|
|
|
|
|
|
|
|
| ||||
Comprehensive Income |
| 188 |
| 147 |
| 477 |
| 418 |
| ||||
|
|
|
|
|
|
|
|
|
| ||||
Comprehensive Income Attributable to Noncontrolling Interests |
| - |
| - |
| 1 |
| 1 |
| ||||
|
|
|
|
|
|
|
|
|
| ||||
Comprehensive Income Attributable to CMS Energy |
| $ | 188 |
| $ | 147 |
| $ | 476 |
| $ | 417 |
|
|
|
|
| In Millions |
| |||
Three Months Ended March 31 |
| 2017 |
| 2016 |
| |||
|
|
|
|
|
| |||
Net Income |
| $ | 199 |
| $ | 164 |
| |
|
|
|
|
|
| |||
Investments |
|
|
|
|
| |||
Unrealized gain on investments, net of tax of $- for all periods |
| 1 |
| - |
| |||
|
|
|
|
|
| |||
Other Comprehensive Income |
| 1 |
| - |
| |||
|
|
|
|
|
| |||
Comprehensive Income |
| $ | 200 |
| $ | 164 |
| |
The accompanying notes are an integral part of these statements.
(This page intentionally left blank)
CMS Energy Corporation
Consolidated Statements of Cash Flows (Unaudited)
|
|
|
| In Millions |
|
| In Millions |
| ||||||
Nine Months Ended September 30 |
| 2016 |
| 2015 |
| |||||||||
Three Months Ended March 31 |
| 2017 |
| 2016 |
| |||||||||
|
|
|
|
|
|
|
|
|
|
| ||||
Cash Flows from Operating Activities |
|
|
|
|
|
|
|
|
|
| ||||
Net income |
| $ | 475 |
| $ | 418 |
|
| $ | 199 |
| $ | 164 |
|
Adjustments to reconcile net income to net cash provided by operating activities |
|
|
|
|
|
|
|
|
|
| ||||
Depreciation and amortization |
| 597 |
| 564 |
|
| 262 |
| 238 |
| ||||
Deferred income taxes and investment tax credit |
| 219 |
| 210 |
|
| 90 |
| 68 |
| ||||
Other non-cash operating activities |
| 54 |
| 124 |
| |||||||||
Other non-cash operating activities and reconciling adjustments |
| 21 |
| 21 |
| |||||||||
Cash provided by (used in) changes in assets and liabilities |
|
|
|
|
|
|
|
|
|
| ||||
Accounts receivable, notes receivable, and accrued revenue |
| 51 |
| 219 |
| |||||||||
Accounts and notes receivable and accrued revenue |
| 37 |
| 16 |
| |||||||||
Inventories |
| 35 |
| 54 |
|
| 201 |
| 274 |
| ||||
Accounts payable and accrued refunds |
| (24 | ) | (34 | ) |
| (40 | ) | (48 | ) | ||||
Other current and non-current assets and liabilities |
| (166 | ) | (135 | ) |
| (124 | ) | (101 | ) | ||||
Net cash provided by operating activities |
| 1,241 |
| 1,420 |
|
| 646 |
| 632 |
| ||||
|
|
|
|
|
|
|
|
|
|
| ||||
Cash Flows from Investing Activities |
|
|
|
|
|
|
|
|
|
| ||||
Capital expenditures (excludes assets placed under capital lease) |
| (1,224 | ) | (1,102 | ) |
| (365 | ) | (407 | ) | ||||
Increase in EnerBank notes receivable |
| (87 | ) | (186 | ) | |||||||||
Decrease (increase) in EnerBank notes receivable |
| 14 |
| (16 | ) | |||||||||
Proceeds from the sale of EnerBank notes receivable |
| - |
| 48 |
|
| 19 |
| - |
| ||||
Cost to retire property and other investing activities |
| (94 | ) | (100 | ) |
| (14 | ) | (21 | ) | ||||
Net cash used in investing activities |
| (1,405 | ) | (1,340 | ) |
| (346 | ) | (444 | ) | ||||
|
|
|
|
|
|
|
|
|
|
| ||||
Cash Flows from Financing Activities |
|
|
|
|
|
|
|
|
|
| ||||
Proceeds from issuance of debt |
| 775 |
| 100 |
|
| 923 |
| 30 |
| ||||
Issuance of common stock |
| 69 |
| 40 |
|
| 3 |
| 63 |
| ||||
Proceeds from EnerBank certificates of deposit, net |
| 64 |
| 135 |
| |||||||||
Payment of dividends on common and preferred stock |
| (260 | ) | (241 | ) | |||||||||
Net increase (decrease) in EnerBank certificates of deposit |
| (29 | ) | 14 |
| |||||||||
Payment of dividends on common stock |
| (94 | ) | (86 | ) | |||||||||
Retirement of long-term debt |
| (215 | ) | (148 | ) |
| (475 | ) | (30 | ) | ||||
Increase (decrease) in notes payable |
| (174 | ) | 8 |
| |||||||||
Decrease in notes payable |
| (398 | ) | (249 | ) | |||||||||
Payment of capital lease obligations and other financing costs |
| (22 | ) | (31 | ) |
| (24 | ) | (12 | ) | ||||
Net cash provided by (used in) financing activities |
| 237 |
| (137 | ) | |||||||||
Net cash used in financing activities |
| (94 | ) | (270 | ) | |||||||||
|
|
|
|
|
|
|
|
|
|
| ||||
Net Increase (Decrease) in Cash and Cash Equivalents |
| 73 |
| (57 | ) | |||||||||
Cash and Cash Equivalents, Beginning of Period |
| 266 |
| 207 |
| |||||||||
Net Increase (Decrease) in Cash and Cash Equivalents, Including Restricted Amounts |
| 206 |
| (82 | ) | |||||||||
Cash and Cash Equivalents, Including Restricted Amounts, Beginning of Period |
| 257 |
| 288 |
| |||||||||
|
|
|
|
|
|
|
|
|
|
| ||||
Cash and Cash Equivalents, End of Period |
| $ | 339 |
| $ | 150 |
| |||||||
Cash and Cash Equivalents, Including Restricted Amounts, End of Period |
| $ | 463 |
| $ | 206 |
| |||||||
|
|
|
|
|
|
|
|
|
|
| ||||
Other non-cash investing and financing activities |
|
|
|
|
|
|
|
|
|
| ||||
Non-cash transactions |
|
|
|
|
|
|
|
|
|
| ||||
Capital expenditures not paid |
| $ | 159 |
| $ | 147 |
|
| $ | 112 |
| $ | 173 |
|
Note receivable recorded for future refund of use taxes paid and capitalized |
| 29 |
| - |
| |||||||||
The accompanying notes are an integral part of these statements.
CMS Energy Corporation
Consolidated Balance Sheets (Unaudited)
ASSETS
ASSETS |
|
|
|
|
| |||||||||
|
|
|
| In Millions |
|
|
|
| In Millions |
| ||||
|
| September 30 |
| December 31 |
|
| March 31 |
| December 31 |
| ||||
|
| 2016 |
| 2015 |
|
| 2017 |
| 2016 |
| ||||
|
|
|
|
|
|
|
|
|
|
| ||||
Current Assets |
|
|
|
|
|
|
|
|
|
| ||||
Cash and cash equivalents |
| $ | 339 |
| $ | 266 |
|
| $ | 433 |
| $ | 235 |
|
Restricted cash and cash equivalents |
| 28 |
| 19 |
|
| 30 |
| 19 |
| ||||
Accounts receivable and accrued revenue, less allowances of $27 in 2016 and $28 in 2015 |
| 634 |
| 774 |
| |||||||||
Notes receivable, less allowances of $12 in 2016 and $9 in 2015 |
| 146 |
| 128 |
| |||||||||
Accounts receivable and accrued revenue, less allowance of $24 for both periods |
| 775 |
| 821 |
| |||||||||
Notes receivable, less allowance of $17 in 2017 and $16 in 2016 |
| 186 |
| 180 |
| |||||||||
Notes receivable held for sale |
| 41 |
| 16 |
|
| 19 |
| 39 |
| ||||
Accounts receivable – related parties |
| 12 |
| 11 |
|
| 12 |
| 12 |
| ||||
Inventories at average cost |
|
|
|
|
|
|
|
|
|
| ||||
Gas in underground storage |
| 553 |
| 568 |
|
| 243 |
| 446 |
| ||||
Materials and supplies |
| 119 |
| 126 |
|
| 118 |
| 119 |
| ||||
Generating plant fuel stock |
| 64 |
| 84 |
|
| 64 |
| 61 |
| ||||
Deferred property taxes |
| 152 |
| 235 |
|
| 203 |
| 250 |
| ||||
Regulatory assets |
| 16 |
| 16 |
|
| 12 |
| 17 |
| ||||
Prepayments and other current assets |
| 94 |
| 77 |
|
| 120 |
| 81 |
| ||||
Total current assets |
| 2,198 |
| 2,320 |
|
| 2,215 |
| 2,280 |
| ||||
|
|
|
|
|
|
|
|
|
|
| ||||
Plant, Property, and Equipment |
|
|
|
|
|
|
|
|
|
| ||||
Plant, property, and equipment, gross |
| 20,698 |
| 18,943 |
|
| 21,265 |
| 21,010 |
| ||||
Less accumulated depreciation and amortization |
| 5,953 |
| 5,747 |
|
| 6,206 |
| 6,056 |
| ||||
Plant, property, and equipment, net |
| 14,745 |
| 13,196 |
|
| 15,059 |
| 14,954 |
| ||||
Construction work in progress |
| 698 |
| 1,509 |
|
| 798 |
| 761 |
| ||||
Total plant, property, and equipment |
| 15,443 |
| 14,705 |
|
| 15,857 |
| 15,715 |
| ||||
|
|
|
|
|
|
|
|
|
|
| ||||
Other Non-current Assets |
|
|
|
|
|
|
|
|
|
| ||||
Regulatory assets |
| 1,765 |
| 1,840 |
|
| 2,072 |
| 2,091 |
| ||||
Accounts and notes receivable |
| 1,110 |
| 1,027 |
|
| 1,092 |
| 1,118 |
| ||||
Investments |
| 68 |
| 64 |
|
| 66 |
| 65 |
| ||||
Other |
| 258 |
| 343 |
|
| 321 |
| 353 |
| ||||
Total other non-current assets |
| 3,201 |
| 3,274 |
|
| 3,551 |
| 3,627 |
| ||||
|
|
|
|
|
|
|
|
|
|
| ||||
Total Assets |
| $ | 20,842 |
| $ | 20,299 |
|
| $ | 21,623 |
| $ | 21,622 |
|
LIABILITIES AND EQUITY
LIABILITIES AND EQUITY |
|
|
|
|
| |||||||||
|
|
|
| In Millions |
|
|
|
| In Millions |
| ||||
|
| September 30 |
| December 31 |
|
| March 31 |
| December 31 |
| ||||
|
| 2016 |
| 2015 |
|
| 2017 |
| 2016 |
| ||||
|
|
|
|
|
|
|
|
|
|
| ||||
Current Liabilities |
|
|
|
|
|
|
|
|
|
| ||||
Current portion of long-term debt, capital leases, and financing obligation |
| $ | 1,005 |
| $ | 706 |
|
| $ | 812 |
| $ | 886 |
|
Notes payable |
| 75 |
| 249 |
|
| - |
| 398 |
| ||||
Accounts payable |
| 539 |
| 633 |
|
| 479 |
| 598 |
| ||||
Accounts payable – related parties |
| 9 |
| 9 |
|
| 9 |
| 12 |
| ||||
Accrued rate refunds |
| 33 |
| 26 |
|
| 73 |
| 21 |
| ||||
Accrued interest |
| 76 |
| 106 |
|
| 73 |
| 98 |
| ||||
Accrued taxes |
| 93 |
| 349 |
|
| 260 |
| 348 |
| ||||
Regulatory liabilities |
| 80 |
| 82 |
|
| 85 |
| 95 |
| ||||
Other current liabilities |
| 159 |
| 142 |
|
| 135 |
| 199 |
| ||||
Total current liabilities |
| 2,069 |
| 2,302 |
|
| 1,926 |
| 2,655 |
| ||||
|
|
|
|
|
|
|
|
|
|
| ||||
Non-current Liabilities |
|
|
|
|
|
|
|
|
|
| ||||
Long-term debt |
| 8,722 |
| 8,400 |
|
| 9,129 |
| 8,640 |
| ||||
Non-current portion of capital leases and financing obligation |
| 110 |
| 118 |
|
| 104 |
| 110 |
| ||||
Regulatory liabilities |
| 2,053 |
| 2,088 |
|
| 2,068 |
| 2,041 |
| ||||
Postretirement benefits |
| 560 |
| 591 |
|
| 781 |
| 789 |
| ||||
Asset retirement obligations |
| 445 |
| 439 |
|
| 451 |
| 447 |
| ||||
Deferred investment tax credit |
| 74 |
| 56 |
|
| 72 |
| 73 |
| ||||
Deferred income taxes |
| 2,230 |
| 2,017 |
|
| 2,390 |
| 2,287 |
| ||||
Other non-current liabilities |
| 283 |
| 313 |
|
| 295 |
| 290 |
| ||||
Total non-current liabilities |
| 14,477 |
| 14,022 |
|
| 15,290 |
| 14,677 |
| ||||
|
|
|
|
|
|
|
|
|
|
| ||||
Commitments and Contingencies (Notes 2 and 3) |
|
|
|
|
|
|
|
|
|
| ||||
|
|
|
|
|
|
|
|
|
|
| ||||
Equity |
|
|
|
|
|
|
|
|
|
| ||||
Common stockholders’ equity |
|
|
|
|
|
|
|
|
|
| ||||
Common stock, authorized 350.0 shares; outstanding 279.1 shares in 2016 and 277.2 shares in 2015 |
| 3 |
| 3 |
| |||||||||
Common stock, authorized 350.0 shares; outstanding 280.0 shares in 2017 and 279.2 shares in 2016 |
| 3 |
| 3 |
| |||||||||
Other paid-in capital |
| 4,908 |
| 4,837 |
|
| 4,927 |
| 4,916 |
| ||||
Accumulated other comprehensive loss |
| (45 | ) | (47 | ) |
| (49 | ) | (50 | ) | ||||
Accumulated deficit |
| (607 | ) | (855 | ) |
| (511 | ) | (616 | ) | ||||
Total common stockholders’ equity |
| 4,259 |
| 3,938 |
|
| 4,370 |
| 4,253 |
| ||||
Noncontrolling interests |
| 37 |
| 37 |
|
| 37 |
| 37 |
| ||||
Total equity |
| 4,296 |
| 3,975 |
|
| 4,407 |
| 4,290 |
| ||||
|
|
|
|
|
|
|
|
|
|
| ||||
Total Liabilities and Equity |
| $ | 20,842 |
| $ | 20,299 |
|
| $ | 21,623 |
| $ | 21,622 |
|
The accompanying notes are an integral part of these statements.
CMS Energy Corporation
Consolidated Statements of Changes in Equity (Unaudited)
|
|
|
|
|
|
|
|
| In Millions |
|
|
|
| In Millions |
| ||||||
|
| Three Months Ended |
|
| Nine Months Ended |
| |||||||||||||||
September 30 |
| 2016 |
| 2015 |
|
| 2016 |
| 2015 |
| |||||||||||
Three Months Ended March 31 |
| 2017 |
| 2016 |
| ||||||||||||||||
|
|
|
|
|
|
|
|
|
|
|
|
|
|
|
| ||||||
Total Equity at Beginning of Period |
| $ | 4,193 |
| $ | 3,855 |
|
| $ | 3,975 |
| $ | 3,707 |
|
| $ | 4,290 |
| $ | 3,975 |
|
|
|
|
|
|
|
|
|
|
|
|
|
|
|
|
| ||||||
Common Stock |
|
|
|
|
|
|
|
|
|
|
|
|
|
|
| ||||||
At beginning and end of period |
| 3 |
| 3 |
|
| 3 |
| 3 |
|
| 3 |
| 3 |
| ||||||
|
|
|
|
|
|
|
|
|
|
|
|
|
|
|
| ||||||
Other Paid-in Capital |
|
|
|
|
|
|
|
|
|
|
|
|
|
|
| ||||||
At beginning of period |
| 4,906 |
| 4,812 |
|
| 4,837 |
| 4,774 |
|
| 4,916 |
| 4,837 |
| ||||||
Common stock issued |
| 3 |
| 17 |
|
| 82 |
| 56 |
|
| 8 |
| 70 |
| ||||||
Common stock repurchased |
| (1 | ) | - |
|
| (11 | ) | (11 | ) |
| (12 | ) | (10 | ) | ||||||
Common stock reissued |
| - |
| - |
|
| - |
| 10 |
|
| 15 |
| - |
| ||||||
At end of period |
| 4,908 |
| 4,829 |
|
| 4,908 |
| 4,829 |
|
| 4,927 |
| 4,897 |
| ||||||
|
|
|
|
|
|
|
|
|
|
|
|
|
|
|
| ||||||
Accumulated Other Comprehensive Loss |
|
|
|
|
|
|
|
|
|
|
|
|
|
|
| ||||||
At beginning of period |
| (47 | ) | (48 | ) |
| (47 | ) | (49 | ) |
| (50 | ) | (47 | ) | ||||||
Retirement benefits liability |
|
|
|
|
|
|
|
|
|
|
|
|
|
|
| ||||||
At beginning of period |
| (43 | ) | (46 | ) |
| (43 | ) | (48 | ) | |||||||||||
Amortization of net actuarial loss |
| 1 |
| 2 |
|
| 2 |
| 4 |
| |||||||||||
Amortization of prior service credit |
| - |
| (1 | ) |
| (1 | ) | (1 | ) | |||||||||||
At end of period |
| (42 | ) | (45 | ) |
| (42 | ) | (45 | ) | |||||||||||
At beginning and end of period |
| (50 | ) | (43 | ) | ||||||||||||||||
Investments |
|
|
|
|
|
|
|
|
|
|
|
|
|
|
| ||||||
At beginning of period |
| (4 | ) | (2 | ) |
| (4 | ) | (1 | ) |
| - |
| (4 | ) | ||||||
Unrealized gain (loss) on investments |
| 1 |
| (2 | ) |
| 1 |
| (3 | ) | |||||||||||
Unrealized gain on investments |
| 1 |
| - |
| ||||||||||||||||
At end of period |
| (3 | ) | (4 | ) |
| (3 | ) | (4 | ) |
| 1 |
| (4 | ) | ||||||
At end of period |
| (45 | ) | (49 | ) |
| (45 | ) | (49 | ) |
| (49 | ) | (47 | ) | ||||||
|
|
|
|
|
|
|
|
|
|
|
|
|
|
|
| ||||||
Accumulated Deficit |
|
|
|
|
|
|
|
|
|
|
|
|
|
|
| ||||||
At beginning of period |
| (706 | ) | (949 | ) |
| (855 | ) | (1,058 | ) |
| (616 | ) | (855 | ) | ||||||
Cumulative effect of change in accounting principle |
| - |
| - |
|
| 33 |
| - |
|
| - |
| 33 |
| ||||||
Net income attributable to CMS Energy |
| 186 |
| 148 |
|
| 474 |
| 417 |
|
| 199 |
| 164 |
| ||||||
Dividends declared on common stock |
| (87 | ) | (80 | ) |
| (259 | ) | (240 | ) |
| (94 | ) | (86 | ) | ||||||
At end of period |
| (607 | ) | (881 | ) |
| (607 | ) | (881 | ) |
| (511 | ) | (744 | ) | ||||||
|
|
|
|
|
|
|
|
|
|
|
|
|
|
|
| ||||||
Noncontrolling Interests |
|
|
|
|
|
|
|
|
|
|
|
|
|
|
| ||||||
At beginning of period |
| 37 |
| 37 |
|
| 37 |
| 37 |
| |||||||||||
Income attributable to noncontrolling interests |
| - |
| - |
|
| 1 |
| 1 |
| |||||||||||
Distributions and other changes in noncontrolling interests |
| - |
| - |
|
| (1 | ) | (1 | ) | |||||||||||
At end of period |
| 37 |
| 37 |
|
| 37 |
| 37 |
| |||||||||||
At beginning and end of period |
| 37 |
| 37 |
| ||||||||||||||||
|
|
|
|
|
|
|
|
|
|
|
|
|
|
|
| ||||||
Total Equity at End of Period |
| $ | 4,296 |
| $ | 3,939 |
|
| $ | 4,296 |
| $ | 3,939 |
|
| $ | 4,407 |
| $ | 4,146 |
|
The accompanying notes are an integral part of these statements.
(This page intentionally left blank)
Consumers Energy Company
Consolidated Statements of Income (Unaudited)
|
|
|
|
|
| In Millions |
|
|
|
| In Millions |
| ||||||||
|
| Three Months Ended |
| Nine Months Ended |
| |||||||||||||||
September 30 |
| 2016 |
| 2015 |
| 2016 |
| 2015 |
| |||||||||||
Three Months Ended March 31 |
| 2017 |
| 2016 |
| |||||||||||||||
|
|
|
|
|
|
|
|
|
|
|
|
|
|
| ||||||
Operating Revenue |
| $ | 1,498 |
| $ | 1,417 |
| $ | 4,514 |
| $ | 4,726 |
|
| $ | 1,737 |
| $ | 1,723 |
|
|
|
|
|
|
|
|
|
|
|
|
|
|
|
| ||||||
Operating Expenses |
|
|
|
|
|
|
|
|
|
|
|
|
|
| ||||||
Fuel for electric generation |
| 118 |
| 138 |
| 290 |
| 381 |
|
| 89 |
| 99 |
| ||||||
Purchased and interchange power |
| 445 |
| 389 |
| 1,148 |
| 1,072 |
|
| 331 |
| 343 |
| ||||||
Purchased power – related parties |
| 23 |
| 21 |
| 66 |
| 61 |
|
| 22 |
| 22 |
| ||||||
Cost of gas sold |
| 39 |
| 46 |
| 477 |
| 737 |
|
| 332 |
| 351 |
| ||||||
Maintenance and other operating expenses |
| 265 |
| 289 |
| 788 |
| 845 |
|
| 265 |
| 278 |
| ||||||
Depreciation and amortization |
| 182 |
| 172 |
| 592 |
| 560 |
|
| 260 |
| 237 |
| ||||||
General taxes |
| 61 |
| 57 |
| 207 |
| 194 |
|
| 79 |
| 85 |
| ||||||
Total operating expenses |
| 1,133 |
| 1,112 |
| 3,568 |
| 3,850 |
|
| 1,378 |
| 1,415 |
| ||||||
|
|
|
|
|
|
|
|
|
|
|
|
|
|
| ||||||
Operating Income |
| 365 |
| 305 |
| 946 |
| 876 |
|
| 359 |
| 308 |
| ||||||
|
|
|
|
|
|
|
|
|
|
|
|
|
|
| ||||||
Other Income (Expense) |
|
|
|
|
|
|
|
|
|
|
|
|
|
| ||||||
Interest income |
| 1 |
| 1 |
| 3 |
| 3 |
|
| 4 |
| 1 |
| ||||||
Interest and dividend income – related parties |
| - |
| - |
| 1 |
| - |
| |||||||||||
Allowance for equity funds used during construction |
| 3 |
| 3 |
| 9 |
| 7 |
|
| 2 |
| 3 |
| ||||||
Nonoperating retirement benefits, net |
| 3 |
| 9 |
| |||||||||||||||
Other income |
| 2 |
| 2 |
| 7 |
| 17 |
|
| 14 |
| 3 |
| ||||||
Other expense |
| (6 | ) | (3 | ) | (13 | ) | (11 | ) |
| (2 | ) | (3 | ) | ||||||
Total other income |
| - |
| 3 |
| 7 |
| 16 |
|
| 21 |
| 13 |
| ||||||
|
|
|
|
|
|
|
|
|
|
|
|
|
|
| ||||||
Interest Charges |
|
|
|
|
|
|
|
|
|
|
|
|
|
| ||||||
Interest on long-term debt |
| 65 |
| 62 |
| 195 |
| 188 |
|
| 66 |
| 65 |
| ||||||
Other interest expense |
| 3 |
| 4 |
| 9 |
| 11 |
|
| 3 |
| 3 |
| ||||||
Allowance for borrowed funds used during construction |
| (1 | ) | (1 | ) | (4 | ) | (3 | ) |
| (1 | ) | (1 | ) | ||||||
Total interest charges |
| 67 |
| 65 |
| 200 |
| 196 |
|
| 68 |
| 67 |
| ||||||
|
|
|
|
|
|
|
|
|
|
|
|
|
|
| ||||||
Income Before Income Taxes |
| 298 |
| 243 |
| 753 |
| 696 |
|
| 312 |
| 254 |
| ||||||
Income Tax Expense |
| 103 |
| 83 |
| 254 |
| 237 |
|
| 101 |
| 82 |
| ||||||
|
|
|
|
|
|
|
|
|
|
|
|
|
|
| ||||||
Net Income |
| 195 |
| 160 |
| 499 |
| 459 |
| |||||||||||
Preferred Stock Dividends |
| - |
| - |
| 1 |
| 1 |
| |||||||||||
|
|
|
|
|
|
|
|
|
| |||||||||||
Net Income Available to Common Stockholder |
| $ | 195 |
| $ | 160 |
| $ | 498 |
| $ | 458 |
|
| $ | 211 |
| $ | 172 |
|
The accompanying notes are an integral part of these statements.
Consumers Energy Company
Consolidated Statements of Comprehensive Income (Unaudited)
|
|
|
|
|
| In Millions |
| ||||||
|
| Three Months Ended |
| Nine Months Ended |
| ||||||||
September 30 |
| 2016 |
| 2015 |
| 2016 |
| 2015 |
| ||||
|
|
|
|
|
|
|
|
|
| ||||
Net Income |
| $ | 195 |
| $ | 160 |
| $ | 499 |
| $ | 459 |
|
|
|
|
|
|
|
|
|
|
| ||||
Retirement Benefits Liability |
|
|
|
|
|
|
|
|
| ||||
Amortization of net actuarial loss, net of tax of $-, $-, $-, and $1 |
| - |
| 1 |
| - |
| 3 |
| ||||
|
|
|
|
|
|
|
|
|
| ||||
Investments |
|
|
|
|
|
|
|
|
| ||||
Unrealized gain (loss) on investments, net of tax of $(1), $-, $2, and $(1) |
| (2 | ) | - |
| 3 |
| (2 | ) | ||||
Reclassification adjustments included in net income, net of tax of $-, $-, $-, and $(3) |
| - |
| - |
| - |
| (5 | ) | ||||
|
|
|
|
|
|
|
|
|
| ||||
Other Comprehensive Income (Loss) |
| (2 | ) | 1 |
| 3 |
| (4 | ) | ||||
|
|
|
|
|
|
|
|
|
| ||||
Comprehensive Income |
| $ | 193 |
| $ | 161 |
| $ | 502 |
| $ | 455 |
|
|
|
|
| In Millions |
| ||
Three Months Ended March 31 |
| 2017 |
| 2016 |
| ||
|
|
|
|
|
| ||
Net Income |
| $ | 211 |
| $ | 172 |
|
|
|
|
|
|
| ||
Investments |
|
|
|
|
| ||
Unrealized gain on investments, net of tax of $- and $2 |
| 2 |
| 3 |
| ||
Reclassification adjustments included in net income, net of tax of $(5) and $- |
| (8 | ) | - |
| ||
|
|
|
|
|
| ||
Other Comprehensive Income (Loss) |
| (6 | ) | 3 |
| ||
|
|
|
|
|
| ||
Comprehensive Income |
| $ | 205 |
| $ | 175 |
|
The accompanying notes are an integral part of these statements.
(This page intentionally left blank)
Consumers Energy Company
Consolidated Statements of Cash Flows (Unaudited)
|
|
|
| In Millions |
|
|
|
| In Millions |
| ||||
Nine Months Ended September 30 |
| 2016 |
| 2015 |
| |||||||||
Three Months Ended March 31 |
| 2017 |
| 2016 |
| |||||||||
|
|
|
|
|
|
|
|
|
|
| ||||
Cash Flows from Operating Activities |
|
|
|
|
|
|
|
|
|
| ||||
Net income |
| $ | 499 |
| $ | 459 |
|
| $ | 211 |
| $ | 172 |
|
Adjustments to reconcile net income to net cash provided by operating activities |
|
|
|
|
|
|
|
|
|
| ||||
Depreciation and amortization |
| 592 |
| 560 |
|
| 260 |
| 237 |
| ||||
Deferred income taxes and investment tax credit |
| 220 |
| 33 |
|
| 69 |
| 62 |
| ||||
Other non-cash operating activities |
| 45 |
| 116 |
| |||||||||
Other non-cash operating activities and reconciling adjustments |
| 22 |
| 17 |
| |||||||||
Cash provided by (used in) changes in assets and liabilities |
|
|
|
|
|
|
|
|
|
| ||||
Accounts receivable, notes receivable, and accrued revenue |
| 72 |
| 221 |
| |||||||||
Accounts and notes receivable and accrued revenue |
| 43 |
| 33 |
| |||||||||
Inventories |
| 35 |
| 53 |
|
| 197 |
| 270 |
| ||||
Accounts payable and accrued refunds |
| (31 | ) | (30 | ) |
| (38 | ) | (42 | ) | ||||
Other current and non-current assets and liabilities |
| (144 | ) | 15 |
|
| (116 | ) | (84 | ) | ||||
Net cash provided by operating activities |
| 1,288 |
| 1,427 |
|
| 648 |
| 665 |
| ||||
|
|
|
|
|
|
|
|
|
|
| ||||
Cash Flows from Investing Activities |
|
|
|
|
|
|
|
|
|
| ||||
Capital expenditures (excludes assets placed under capital lease) |
| (1,214 | ) | (1,093 | ) |
| (361 | ) | (406 | ) | ||||
Cost to retire property and other investing activities |
| (95 | ) | (93 | ) |
| (21 | ) | (19 | ) | ||||
Net cash used in investing activities |
| (1,309 | ) | (1,186 | ) |
| (382 | ) | (425 | ) | ||||
|
|
|
|
|
|
|
|
|
|
| ||||
Cash Flows from Financing Activities |
|
|
|
|
|
|
|
|
|
| ||||
Proceeds from issuance of long-term debt |
| 446 |
| - |
|
| 349 |
| - |
| ||||
Stockholder contribution |
| 275 |
| 150 |
|
| 250 |
| 150 |
| ||||
Payment of dividends on common and preferred stock |
| (362 | ) | (360 | ) | |||||||||
Payment of dividends on common stock |
| (148 | ) | (155 | ) | |||||||||
Retirement of long-term debt |
| (185 | ) | (48 | ) |
| (250 | ) | - |
| ||||
Increase (decrease) in notes payable |
| (174 | ) | 8 |
| |||||||||
Decrease in notes payable |
| (398 | ) | (249 | ) | |||||||||
Payment of capital lease obligations and other financing costs |
| (8 | ) | (19 | ) |
| (9 | ) | (1 | ) | ||||
Net cash used in financing activities |
| (8 | ) | (269 | ) |
| (206 | ) | (255 | ) | ||||
|
|
|
|
|
|
|
|
|
|
| ||||
Net Decrease in Cash and Cash Equivalents |
| (29 | ) | (28 | ) | |||||||||
Cash and Cash Equivalents, Beginning of Period |
| 50 |
| 71 |
| |||||||||
Net Increase (Decrease) in Cash and Cash Equivalents, Including Restricted Amounts |
| 60 |
| (15 | ) | |||||||||
Cash and Cash Equivalents, Including Restricted Amounts, Beginning of Period |
| 152 |
| 71 |
| |||||||||
|
|
|
|
|
|
|
|
|
|
| ||||
Cash and Cash Equivalents, End of Period |
| $ | 21 |
| $ | 43 |
| |||||||
Cash and Cash Equivalents, Including Restricted Amounts, End of Period |
| $ | 212 |
| $ | 56 |
| |||||||
|
|
|
|
|
|
|
|
|
|
| ||||
Other non-cash investing and financing activities |
|
|
|
|
|
|
|
|
|
| ||||
Non-cash transactions |
|
|
|
|
|
|
|
|
|
| ||||
Capital expenditures not paid |
| $ | 145 |
| $ | 147 |
|
| $ | 101 |
| $ | 154 |
|
Note receivable recorded for future refund of use taxes paid and capitalized |
| 29 |
| - |
| |||||||||
The accompanying notes are an integral part of these statements.
Consumers Energy Company
Consolidated Balance Sheets (Unaudited)
ASSETS
|
|
|
| In Millions |
|
|
|
| In Millions |
| ||||
|
| September 30 |
| December 31 |
|
| March 31 |
| December 31 |
| ||||
|
| 2016 |
| 2015 |
|
| 2017 |
| 2016 |
| ||||
|
|
|
|
|
|
|
|
|
|
| ||||
Current Assets |
|
|
|
|
|
|
|
|
|
| ||||
Cash and cash equivalents |
| $ | 21 |
| $ | 50 |
|
| $ | 182 |
| $ | 131 |
|
Restricted cash and cash equivalents |
| 28 |
| 19 |
|
| 30 |
| 19 |
| ||||
Accounts receivable and accrued revenue, less allowances of $27 in 2016 and $28 in 2015 |
| 616 |
| 758 |
| |||||||||
Accounts receivable and accrued revenue, less allowance of $24 for both periods |
| 755 |
| 800 |
| |||||||||
Notes receivable |
| 29 |
| 29 |
| |||||||||
Accounts receivable – related parties |
| 2 |
| 17 |
|
| 2 |
| 9 |
| ||||
Inventories at average cost |
|
|
|
|
|
|
|
|
|
| ||||
Gas in underground storage |
| 553 |
| 568 |
|
| 243 |
| 446 |
| ||||
Materials and supplies |
| 114 |
| 120 |
|
| 113 |
| 114 |
| ||||
Generating plant fuel stock |
| 60 |
| 80 |
|
| 63 |
| 57 |
| ||||
Deferred property taxes |
| 152 |
| 235 |
|
| 203 |
| 250 |
| ||||
Regulatory assets |
| 16 |
| 16 |
|
| 12 |
| 17 |
| ||||
Prepayments and other current assets |
| 85 |
| 66 |
|
| 114 |
| 70 |
| ||||
Total current assets |
| 1,647 |
| 1,929 |
|
| 1,746 |
| 1,942 |
| ||||
|
|
|
|
|
|
|
|
|
|
| ||||
Plant, Property, and Equipment |
|
|
|
|
|
|
|
|
|
| ||||
Plant, property, and equipment, gross |
| 20,528 |
| 18,797 |
|
| 21,092 |
| 20,838 |
| ||||
Less accumulated depreciation and amortization |
| 5,893 |
| 5,676 |
|
| 6,143 |
| 5,994 |
| ||||
Plant, property, and equipment, net |
| 14,635 |
| 13,121 |
|
| 14,949 |
| 14,844 |
| ||||
Construction work in progress |
| 692 |
| 1,467 |
|
| 794 |
| 759 |
| ||||
Total plant, property, and equipment |
| 15,327 |
| 14,588 |
|
| 15,743 |
| 15,603 |
| ||||
|
|
|
|
|
|
|
|
|
|
| ||||
Other Non-current Assets |
|
|
|
|
|
|
|
|
|
| ||||
Regulatory assets |
| 1,765 |
| 1,840 |
|
| 2,072 |
| 2,091 |
| ||||
Accounts and notes receivable |
| 56 |
| 10 |
|
| 25 |
| 27 |
| ||||
Investments |
| 34 |
| 29 |
|
| 20 |
| 33 |
| ||||
Other |
| 151 |
| 239 |
|
| 218 |
| 250 |
| ||||
Total other non-current assets |
| 2,006 |
| 2,118 |
|
| 2,335 |
| 2,401 |
| ||||
|
|
|
|
|
|
|
|
|
|
| ||||
Total Assets |
| $ | 18,980 |
| $ | 18,635 |
|
| $ | 19,824 |
| $ | 19,946 |
|
LIABILITIES AND EQUITY
|
|
|
| In Millions |
|
|
|
| In Millions |
| ||||
|
| September 30 |
| December 31 |
|
| March 31 |
| December 31 |
| ||||
|
| 2016 |
| 2015 |
|
| 2017 |
| 2016 |
| ||||
|
|
|
|
|
|
|
|
|
|
| ||||
Current Liabilities |
|
|
|
|
|
|
|
|
|
| ||||
Current portion of long-term debt, capital leases, and financing obligation |
| $ | 296 |
| $ | 220 |
|
| $ | 327 |
| $ | 397 |
|
Notes payable |
| 75 |
| 249 |
|
| - |
| 398 |
| ||||
Accounts payable |
| 521 |
| 613 |
|
| 465 |
| 580 |
| ||||
Accounts payable – related parties |
| 9 |
| 15 |
|
| 13 |
| 18 |
| ||||
Accrued rate refunds |
| 33 |
| 26 |
|
| 73 |
| 21 |
| ||||
Accrued interest |
| 48 |
| 65 |
|
| 47 |
| 67 |
| ||||
Accrued taxes |
| 114 |
| 352 |
|
| 291 |
| 354 |
| ||||
Regulatory liabilities |
| 80 |
| 82 |
|
| 85 |
| 95 |
| ||||
Other current liabilities |
| 127 |
| 109 |
|
| 99 |
| 164 |
| ||||
Total current liabilities |
| 1,303 |
| 1,731 |
|
| 1,400 |
| 2,094 |
| ||||
|
|
|
|
|
|
|
|
|
|
| ||||
Non-current Liabilities |
|
|
|
|
|
|
|
|
|
| ||||
Long-term debt |
| 5,365 |
| 5,183 |
|
| 5,419 |
| 5,253 |
| ||||
Non-current portion of capital leases and financing obligation |
| 110 |
| 118 |
|
| 104 |
| 110 |
| ||||
Regulatory liabilities |
| 2,053 |
| 2,088 |
|
| 2,068 |
| 2,041 |
| ||||
Postretirement benefits |
| 500 |
| 529 |
|
| 723 |
| 730 |
| ||||
Asset retirement obligations |
| 444 |
| 438 |
|
| 450 |
| 446 |
| ||||
Deferred investment tax credit |
| 74 |
| 56 |
|
| 72 |
| 73 |
| ||||
Deferred income taxes |
| 2,958 |
| 2,710 |
|
| 3,119 |
| 3,042 |
| ||||
Other non-current liabilities |
| 212 |
| 236 |
|
| 223 |
| 218 |
| ||||
Total non-current liabilities |
| 11,716 |
| 11,358 |
|
| 12,178 |
| 11,913 |
| ||||
|
|
|
|
|
|
|
|
|
|
| ||||
Commitments and Contingencies (Notes 2 and 3) |
|
|
|
|
|
|
|
|
|
| ||||
|
|
|
|
|
|
|
|
|
|
| ||||
Equity |
|
|
|
|
|
|
|
|
|
| ||||
Common stockholder’s equity |
|
|
|
|
|
|
|
|
|
| ||||
Common stock, authorized 125.0 shares; outstanding 84.1 shares for both periods |
| 841 |
| 841 |
|
| 841 |
| 841 |
| ||||
Other paid-in capital |
| 3,999 |
| 3,724 |
|
| 4,249 |
| 3,999 |
| ||||
Accumulated other comprehensive loss |
| (3 | ) | (6 | ) |
| (9 | ) | (3 | ) | ||||
Retained earnings |
| 1,087 |
| 950 |
|
| 1,128 |
| 1,065 |
| ||||
Total common stockholder’s equity |
| 5,924 |
| 5,509 |
|
| 6,209 |
| 5,902 |
| ||||
Preferred stock |
| 37 |
| 37 |
|
| 37 |
| 37 |
| ||||
Total equity |
| 5,961 |
| 5,546 |
|
| 6,246 |
| 5,939 |
| ||||
|
|
|
|
|
|
|
|
|
|
| ||||
Total Liabilities and Equity |
| $ | 18,980 |
| $ | 18,635 |
|
| $ | 19,824 |
| $ | 19,946 |
|
The accompanying notes are an integral part of these statements.
Consumers Energy Company
Consolidated Statements of Changes in Equity (Unaudited)
|
|
|
|
|
|
|
|
| In Millions |
|
|
|
| In Millions |
| ||||||
|
| Three Months Ended |
|
| Nine Months Ended |
| |||||||||||||||
September 30 |
| 2016 |
| 2015 |
|
| 2016 |
| 2015 |
| |||||||||||
Three Months Ended March 31 |
| 2017 |
| 2016 |
| ||||||||||||||||
|
|
|
|
|
|
|
|
|
|
|
|
|
|
|
| ||||||
Total Equity at Beginning of Period |
| $ | 5,916 |
| $ | 5,466 |
|
| $ | 5,546 |
| $ | 5,277 |
|
| $ | 5,939 |
| $ | 5,546 |
|
|
|
|
|
|
|
|
|
|
|
|
|
|
|
|
| ||||||
Common Stock |
|
|
|
|
|
|
|
|
|
|
|
|
|
|
| ||||||
At beginning and end of period |
| 841 |
| 841 |
|
| 841 |
| 841 |
|
| 841 |
| 841 |
| ||||||
|
|
|
|
|
|
|
|
|
|
|
|
|
|
|
| ||||||
Other Paid-in Capital |
|
|
|
|
|
|
|
|
|
|
|
|
|
|
| ||||||
At beginning of period |
| 3,999 |
| 3,724 |
|
| 3,724 |
| 3,574 |
|
| 3,999 |
| 3,724 |
| ||||||
Stockholder contribution |
| - |
| - |
|
| 275 |
| 150 |
|
| 250 |
| 150 |
| ||||||
At end of period |
| 3,999 |
| 3,724 |
|
| 3,999 |
| 3,724 |
|
| 4,249 |
| 3,874 |
| ||||||
|
|
|
|
|
|
|
|
|
|
|
|
|
|
|
| ||||||
Accumulated Other Comprehensive Loss |
|
|
|
|
|
|
|
|
|
|
|
|
|
|
| ||||||
At beginning of period |
| (1 | ) | (12 | ) |
| (6 | ) | (7 | ) |
| (3 | ) | (6 | ) | ||||||
Retirement benefits liability |
|
|
|
|
|
|
|
|
|
|
|
|
|
|
| ||||||
At beginning of period |
| (19 | ) | (24 | ) |
| (19 | ) | (26 | ) | |||||||||||
Amortization of net actuarial loss |
| - |
| 1 |
|
| - |
| 3 |
| |||||||||||
At end of period |
| (19 | ) | (23 | ) |
| (19 | ) | (23 | ) | |||||||||||
At beginning and end of period |
| (21 | ) | (19 | ) | ||||||||||||||||
Investments |
|
|
|
|
|
|
|
|
|
|
|
|
|
|
| ||||||
At beginning of period |
| 18 |
| 12 |
|
| 13 |
| 19 |
|
| 18 |
| 13 |
| ||||||
Unrealized gain (loss) on investments |
| (2 | ) | - |
|
| 3 |
| (2 | ) | |||||||||||
Unrealized gain on investments |
| 2 |
| 3 |
| ||||||||||||||||
Reclassification adjustments included in net income |
| - |
| - |
|
| - |
| (5 | ) |
| (8 | ) | - |
| ||||||
At end of period |
| 16 |
| 12 |
|
| 16 |
| 12 |
|
| 12 |
| 16 |
| ||||||
At end of period |
| (3 | ) | (11 | ) |
| (3 | ) | (11 | ) |
| (9 | ) | (3 | ) | ||||||
|
|
|
|
|
|
|
|
|
|
|
|
|
|
|
| ||||||
Retained Earnings |
|
|
|
|
|
|
|
|
|
|
|
|
|
|
| ||||||
At beginning of period |
| 1,040 |
| 876 |
|
| 950 |
| 832 |
|
| 1,065 |
| 950 |
| ||||||
Net income |
| 195 |
| 160 |
|
| 499 |
| 459 |
|
| 211 |
| 172 |
| ||||||
Dividends declared on common stock |
| (148 | ) | (105 | ) |
| (361 | ) | (359 | ) |
| (148 | ) | (155 | ) | ||||||
Dividends declared on preferred stock |
| - |
| - |
|
| (1 | ) | (1 | ) | |||||||||||
At end of period |
| 1,087 |
| 931 |
|
| 1,087 |
| 931 |
|
| 1,128 |
| 967 |
| ||||||
|
|
|
|
|
|
|
|
|
|
|
|
|
|
|
| ||||||
Preferred Stock |
|
|
|
|
|
|
|
|
|
|
|
|
|
|
| ||||||
At beginning and end of period |
| 37 |
| 37 |
|
| 37 |
| 37 |
|
| 37 |
| 37 |
| ||||||
|
|
|
|
|
|
|
|
|
|
|
|
|
|
|
| ||||||
Total Equity at End of Period |
| $ | 5,961 |
| $ | 5,522 |
|
| $ | 5,961 |
| $ | 5,522 |
|
| $ | 6,246 |
| $ | 5,716 |
|
The accompanying notes are an integral part of these statements.
CMS Energy Corporation
Consumers Energy Company
Notes to the Unaudited Consolidated Financial Statements
These interim consolidated financial statements have been prepared by CMS Energy and Consumers in accordance with GAAP for interim financial information and with the instructions to Form 10-Q and Article 10 of Regulation S-X. As a result, CMS Energy and Consumers have condensed or omitted certain information and note disclosures normally included in consolidated financial statements prepared in accordance with GAAP. CMS Energy and Consumers have reclassified certain prior period amounts to conform to the presentation in the current period.period and to reflect the implementation of new accounting standards. In management’s opinion, the unaudited information contained in this report reflects all adjustments of a normal recurring nature necessary to ensure the fair presentation ofthat CMS Energy’s and Consumers’ financial position, results of operations, and cash flows for the periods presented.presented are fairly stated. The notes to the unaudited consolidated financial statements and the related unaudited consolidated financial statements should be read in conjunction with the consolidated financial statements and related notes contained in the 20152016 Form 10-K. Due to the seasonal nature of CMS Energy’s and Consumers’ operations, the results presented for this interim period are not necessarily indicative of results to be achieved for the fiscal year.
Implementation of New Accounting Standards
ASU 2014-12, Accounting for Share-Based Payments When2017-07, Improving the TermsPresentation of an Award Provide That a Performance Target Could Be Achieved after the Requisite Service Period: Net Periodic Pension Cost and Net Periodic Postretirement Benefit Cost:This standard which was issued to improve the reporting of net benefit cost by employers that offer defined benefit pension plans and other postretirement benefit plans. The required effective on January 1, 2016date of the standard for CMS Energy and Consumers addresses stock awards with performance targets that can be met after an employee has completed the required service period. The standard was issued to resolve diversity in practice regarding the accounting treatment for this type of award. Under the new guidance, the probability of the performance target being met should be factored into compensation expense each period. This guidance is consistent with the accounting that CMS Energy and Consumers already applied to awards of this type. Therefore, the standard had no impact on CMS Energy’s or Consumers’ consolidated financial statements.
ASU 2015-02, Amendments to the Consolidation Analysis: This standard, which was effective on January 1, 2016 for CMS Energy and Consumers, provides amended guidance on whether reporting entities should consolidate certain legal entities, including limited partnerships. CMS Energy and Consumers determined that the standard does not change any of their consolidation conclusions or have any impact on their consolidated income, cash flows, or financial position.
ASU 2015-03, Simplifying the Presentation of Debt Issuance Costs: This standard, which was effective on January 1, 2016 for CMS Energy and Consumers, requires that debt issuance costs be presented as a direct deduction from the carrying amount of long-term debt on the balance sheet. Previously, debt issuance costs were reported as an asset. The new guidance aligns the presentation of debt issuance costs with debt discounts and premiums. In accordance with the standard, CMS Energy included $44 million and Consumers included $25 million of unamortized debt issuance costs in long-term debt on their consolidated balance sheets at September 30, 2016. In addition, this standard requires that companies apply the new guidance retrospectively to all prior periods presented. Accordingly, CMS Energy reclassified $41 million and Consumers reclassified $23 million of unamortized debt issuance costs from other non-current assets to long-term debt on their consolidated balance sheets at December 31, 2015.
ASU 2016-09, Improvements to Employee Share-Based Payment Accounting: This standard was issued to simplify and improve the accounting for employee share-based payment awards. The standard will be effective on January 1, 2017 for CMS Energy and Consumers,2018, but early adoption is permitted.permitted in the first interim period of 2017. CMS Energy and Consumers elected to adopt the standard as of January 1, 2016.2017. The standard requires all excess tax benefits and deficiencies that occur upon vestingemployers to report the service cost component of net benefit cost in the same line item on the income statement as other employee stock awardscompensation costs, while presenting the other cost components separately outside of operating income. This change is to be recognized in net income. Previously,applied retrospectively to all prior periods presented. Accordingly, for the three months ended March 31, 2017 and 2016, CMS Energy and Consumers did not record excess taxhave presented the service cost component of their retirement benefits plans in maintenance and other operating expenses on restricted stock awardsthe consolidated statements of income, while presenting the other components in nonoperating retirement benefits, net, under other income but, under(expense). Prior to this standard, CMS Energy and Consumers recorded $7 millionhad presented all of excess tax benefitsthe cost components in net income for the nine months ended September 30, 2016. Also, in accordance withmaintenance and other operating expenses. Under a practical expedient permitted by the standard, CMS Energy recorded a $33 million cumulative adjustmentand Consumers used benefit cost amounts disclosed for prior periods as the basis for retrospective application.
In addition, under this standard, only the service cost component is eligible for capitalization as part of the cost of an asset. This change is to its accumulated deficit at January 1, 2016. This amount represented excess federal tax benefits thatbe applied prospectively upon adoption. Accordingly, for the three months ended March 31, 2017, CMS Energy had not recognizedand Consumers capitalized a portion of the service cost component of their retirement benefits plans to plant, property, and equipment, while recognizing the other components in net income. In prior periods, due toa portion of all cost components was capitalized. For further details on the usenet periodic cost of tax loss carryforwards.CMS Energy’s and Consumers’ retirement benefits plans, see Note 8, Retirement Benefits. The implementation of this standard had no other major impactsdid not have a material impact on CMS Energy’s or Consumers’ consolidated net income, cash flows, or financial statements.position.
New Accounting Standards Not Yet Effective
ASU 2014-09, Revenue from Contracts with Customers: This standard which will become effective January 1, 2018 for CMS Energy and Consumers, provides new guidance for recognizing revenue from contracts with customers. A primary objective of the standard is to provide a single, comprehensive revenue recognition model that will be applied across entities, industries, and capital markets. The new guidance will replace most of the existing revenue recognition requirements in GAAP, although certain guidance specific to rate-regulated utilities will be retained. The standard will be effective on January 1, 2018 for CMS Energy and Consumers, but early adoption in 2017 is permitted. Entities will have the option to apply the standard retrospectively to all prior periods presented, or to apply it retrospectively only to contracts existing at the effective date, with the cumulative effect of the standard recorded as an adjustment to beginning retained earnings. CMS Energy and Consumers are evaluating the impact ofhave determined that they will not elect to adopt the standard early, but they are still assessing how they will apply the standard upon adoption.
CMS Energy and Consumers have determined that the standard will have no impact on a majority of their consolidated financial statements.revenues. They have also determined that it is unlikely that the standard will require changes in their accounting for utility contributions in aid of construction or their existing practice of recognizing revenue at the billing rates, with associated expenses for uncollectible accounts. While CMS Energy and Consumers have not yet identified any changes in their revenue recognition practices that may be required, they are continuing to evaluate the standard.
ASU 2016-01, Recognition and Measurement of Financial Assets and Financial Liabilities: This standard, which will be effective January 1, 2018 for CMS Energy and Consumers, is intended to improve the accounting for financial instruments. The standard will require investments in equity securities to be measured at fair value, with changes in fair value recognized in net income, except for certain investments such as those that qualify for equity-method accounting. The standard will no longer permit unrealized gains and losses for certain equity investments to be recorded in AOCI. CMS Energy and Consumers presently record unrealized gains and losses on certain equity investments, including the mutual funds in the DB SERP and Consumers’ investment in CMS Energy common stock, in AOCI.AOCI, except that unrealized losses determined to be other than temporary are reported in earnings. For further details on these investments, see Note 6, Financial Instruments. Entities will apply the standard using a modified retrospective approach, with a cumulative-effect adjustment recorded to beginning retained earnings on the effective date.
ASU 2016-02, Leases: This standard which will be effective January 1, 2019 for CMS Energy and Consumers, establishes a new accounting model for leases. The standard will require companiesentities to recognize lease assets and liabilities on the balance sheet for all leases with a term of more than one year, including operating leases, which are not recorded on the balance sheet under existing standards. As a result, CMS Energy and Consumers expect to recognize additional lease assets and liabilities for their operating leases under this standard. The new guidance will also amend the definition of a lease to require that a lessee control the use of a specified asset, and not simply control or take the output of the asset. On the income statement, leases that meet existing capital lease criteria will generally be accounted for under a financing model, while operating leases will generally be accounted for under a straight-line expense model. The standard will be effective on January 1, 2019 for CMS Energy and Consumers, but early adoption is permitted. CMS Energy and Consumers are evaluatingcontinuing to evaluate the impact of the standard on their consolidated financial statements.statements and do not presently expect to adopt the standard early.
ASU 2016-13, Measurement of Credit Losses on Financial Instruments: This standard, which will be effective January 1, 2020 for CMS Energy and Consumers, provides new guidance for estimating and recording credit losses on financial instruments. The standard will apply to the recognition of loan losses
at EnerBank as well as to the recognition of uncollectible accounts expense at Consumers. Entities will apply the standard using a modified retrospective approach, with a cumulative-effect adjustment recorded
to beginning retained earnings on the effective date. CMS Energy and Consumers are evaluating the impact of the standard on their consolidated financial statements.
ASU 2016-15, Classification of Certain Cash Receipts and Cash Payments: This standard provides guidance on how certain cash receipts and cash payments should be classified in the statement of cash flows, with the objective of reducing diversity in practice. The standard addresses various cash flow issues, including the classification of debt prepayment or debt extinguishment costs. Under the new guidance, these costs, including premiums paid, will be classified as cash flows from financing activities. CMS Energy and Consumers presently classify premiums paid to retire debt early as cash flows from operating activities, but will classify these payments as cash flows from financing activities under this guidance. CMS Energy and Consumers do not expect the other issues addressed in this standard to have a major impact on their consolidated financial statements. The standard will be effective on January 1, 2018 for CMS Energy and Consumers, but early adoption is permitted. The standard is to be applied retrospectively to each prior period presented, unless impracticable. CMS Energy and Consumers are considering adopting this standard early.
Regulatory matters are critical to Consumers. The Michigan Attorney General, ABATE, the MPSC Staff, and certain other parties typically participate in MPSC proceedings concerning Consumers, such as Consumers’ rate cases and PSCR and GCR processes. These parties often challenge various aspects of those proceedings, including the prudence of Consumers’ policies and practices, and seek cost disallowances and other relief. The parties also have appealed significant MPSC orders. Depending upon the specific issues, the outcomes of rate cases and proceedings, including judicial proceedings challenging MPSC orders or other actions, could negatively affect CMS Energy’s and Consumers’ liquidity, financial condition, and results of operations. Consumers cannot predict the outcome of these proceedings.
There are multiple appeals pending that involve various issues concerning cost recovery from customers, the adequacy of the record evidence supporting the recovery of Smart Energy investments, and other matters. Consumers is unable to predict the outcome of these appeals.
2014 Electric Rate Case: In December 2014, Consumers filed an application with the MPSC seeking an annual rate increase of $163 million, and in June 2015, Consumers self-implemented an annual rate increase of $110 million, subject to refund with interest. The MPSC issued an order in November 2015, authorizing an annual rate increase of $165 million, based on a 10.3 percent authorized rate of return on equity. In April 2016, upon the retirement of seven coal-fueled electric generating units, the annual rate increase was reduced to $126 million.
In February 2016, Consumers filed a reconciliation of total revenues collected during self-implementation to those that would have been collected under final rates. In June 2016, the MPSC approved a settlement agreement that resulted in a $1 million refund to customers.
2016 Electric Rate Case: In March 2016, Consumers filed an application with the MPSC seeking an annual rate increase of $225 million, based on a 10.7 percent authorized return on equity. In September 2016, Consumers self-implemented an annual rate increase of $170 million, subject to refund with interest. The filing requested authority to recover new investmentMPSC issued an order in system reliability, environmental compliance, and technology enhancements. Presented in the following table are the componentsFebruary 2017, authorizing an annual rate increase of the requested increase in revenue:$113 million, based on a 10.1 percent authorized return on equity. Consumers had a recorded liability of $16 million for customer refunds at March 31, 2017.
|
| In Millions |
| |
Components of the rate increase |
|
|
| |
Investment in rate base |
| $ | 161 |
|
Operating and maintenance costs |
| 21 |
| |
Gross margin |
| 17 |
| |
Cost of capital |
| 15 |
| |
Working capital |
| 11 |
| |
Total |
| $ | 225 |
|
Gas Rate Case: In August 2016, Consumers filed an application with the MPSC seeking an annual rate increase of $90 million, based on a 10.6 percent authorized return on equity. In March 2017, Consumers reduced its requested annual rate increase to $80 million, of which the majority relates to new investments that will allow Consumers to strengthen infrastructure and improve system capacity and deliverability.
The filing also seeks approval of an investment recovery mechanismtwo rate adjustment mechanisms: one that would reconcile annually Consumers’ actual nonfuel revenues with the revenues approved by the MPSC, and another that would provide for additional annual rate increases of $38 million beginning in 2017, $92$35 million beginning in 2018 and $92another $35 million beginning in 2019 for incremental investments that Consumers plans to make in those years, subject to reconciliation. These future investments are intended to help ensure adequate system capacity and deliverability.
In September 2016, Consumers self-implementedThe MPSC issued an order in January 2017, limiting Consumers’ self-implementation to an annual rate increase of $170 million, subject to refund with interest. Consumers had a recorded reserve for customer refunds at September 30, 2016 that it believes is adequate.
Gas Rate Case: In July 2015, Consumers filed an application with the MPSC seeking an annual rate increase of $85 million, based on a 10.7 percent authorized return on equity. In$20 million. Accordingly, in January 2016,2017, Consumers self-implemented an annual rate increase of $60$20 million, subject to refund with interest. In April 2016, the MPSC approved a settlement agreement authorizing a $40 million annual rate increase.
In July 2016, Consumers filed a reconciliation of total revenues collected during self-implementation to those that would have been collected under final rates. The reconciliation indicated that a $10 million refund would be required, which Consumers had recorded as a reserve for customer refunds at September 30, 2016.
Energy Optimization Plan Incentive: In SeptemberConsumers will file its 2016 energy optimization reconciliation in May 2017, requesting the MPSC approved a settlement agreement authorizing ConsumersMPSC’s approval to collect the maximum performance incentive of $18 million during 2017 as an incentivefrom customers for exceeding its statutory savings targets in 2015 and for achieving certain other goals.2016. Consumers recognized incentive revenue under this program of $18 million in 2015.2016.
Electric Transmission:Depreciation Rate Case: In August 2016, Consumers became registered under NERC standards asfiled a transmission owner, transmission planner, and transmission operator in October 2015. Consumers had previously received approval fromdepreciation rate case related to its gas utility property, requesting to decrease depreciation expense by $3 million annually. In March 2017, the MPSC approved a settlement agreement authorizing the requested decrease in 2014 and FERC in 2015 to reclassify $34 milliondepreciation expense effective as of net plant assets from distribution to transmission. In March 2016, Consumers received FERC approval to begin collecting transmission revenues under MISO’s transmission tariff effective April 2016. Consumers completed the reclassification of plant assets from distribution to transmission in April 2016.January 2017.
In a separate matter, in February 2015, METC notified Consumers that the reclassified assets need to be conveyed by Consumers to METC under the terms of the DTIA. Consumers disagrees with METC’s interpretation of the provisions of the DTIA. The parties remain in dispute resolution.
In April 2016, METC filed a formal challenge to Consumers’ transmission revenue requirement calculation filed at FERC. METC claims that Consumers’ annual transmission revenue requirement should be reduced from $9 million to $6 million. Consumers is disputing METC’s claim at FERC.
2016 PSCR Plan:FERC Transmission Order: In OctoberSeptember 2016, FERC issued an order reducing the MPSC approved Consumers’ 2016 PSCR plan, with the exceptionrate of the recovery of litigation costs relatedreturn on equity earned by transmission owners operating within MISO to a complaint thatbase of 10.32 percent from
12.38 percent. FERC ordered MISO and transmission owners to provide refunds, with interest, to transmission customers such as Consumers filed againstfor the period from November 2013 through February 2015. In February 2017, as a rail transportation company. Inresult of this order, Consumers received from MISO a credit of $28 million, which it will return to its electric customers through the PSCR ratemaking process. The FERC order the MPSC indicated that this expense could be included for consideration in a general rate case. In connection with this disallowance, Consumers recognized, in September 2016, a charge of $6 million relatedis subject to litigation costs incurred during 2015 and 2016.further legal proceedings.
3: CONTINGENCIES AND COMMITMENTS
CMS Energy and Consumers are involved in various matters that give rise to contingent liabilities. Depending on the specific issues, the resolution of these contingencies could negatively affect CMS Energy’s and Consumers’ liquidity, financial condition, and results of operations. In their disclosures of these matters, CMS Energy and Consumers provide an estimate of the possible loss or range of loss when such an estimate can be made. Disclosures that state that CMS Energy or Consumers cannot predict the outcome of a matter indicate that they are unable to estimate a possible loss or range of loss for the matter.
CMS Energy Contingencies
Gas Index Price Reporting Litigation: CMS Energy, along with CMS MST, CMS Field Services, Cantera Natural Gas, Inc., and Cantera Gas Company, have been named as defendants in four class action lawsuits and one individual lawsuit arising as a result of alleged inaccurate natural gas price reporting to publications that report trade information. Allegations include price-fixing conspiracies, restraint of trade, and artificial inflation of natural gas retail prices in Kansas, Missouri, and Wisconsin. Plaintiffs are making claims for the following: treble damages, full consideration damages, exemplary damages, costs, interest, and/or attorneys’ fees.
After removal to federal court, all of the cases were transferred to a single federal district court pursuant to the multidistrict litigation process. In 2010 and 2011, all claims against CMS Energy defendants were dismissed by the district court based on FERC preemption. Plaintiffs filed appeals in all of the cases. The issues on appeal were whether the district court erred in dismissing the cases based on FERC preemption and denying the plaintiffs’ motions for leave to amend their complaints to add a federal Sherman Act antitrust claim.
In 2013, the U.S. Court of Appeals for the Ninth Circuit reversed the district court decision. The appellate court found that FERC preemption does not apply under the facts of these cases. The appellate court affirmed the district court’s denial of leave to amend to add federal antitrust claims. The matter was appealed to the U.S. Supreme Court, which in 2015 upheld the Ninth Circuit’s decision. The cases were remanded back to the federal district court. In May 2016, the federal district court granted the defendants’ motion for summary judgment in the individual lawsuit based on a release in a prior settlement involving similar allegations and reinstated CMS Energy as a defendant in one of the class action lawsuits. The order of summary judgment has been appealed. In December 2016, CMS Energy entities reached a tentative settlement with the plaintiffs in the three Kansas and Missouri cases for an amount that was not material to CMS Energy. The tentative settlement and request for preliminary approval have been filed in the federal district court. The settlement will be subject to court approval. Other CMS Energy entities remain as defendants in all four remainingthe two Wisconsin class action lawsuits.
These cases involve complex facts, a large number of similarly situated defendants with different factual positions, and multiple jurisdictions. Presently, any estimate of liability would be highly speculative; the amount of CMS Energy’s reasonably possible loss would be based on widely varying models previously untested in this context. If the outcome after appeals is unfavorable, these cases could negatively affect CMS Energy’s liquidity, financial condition, and results of operations.
Bay Harbor: CMS Land retained environmental remediation obligations for the collection and treatment of leachate, a liquid consisting of water and other substances, at Bay Harbor after selling its interests in the development in 2002. Leachate is produced when water enters into cement kiln dust piles left over from former cement plant operations at the site. In 2012, CMS Land and the MDEQ finalized an agreement that established the final remedies and the future water quality criteria at the site. CMS Land
completed all construction necessary to implement the remedies required by the agreement and will continue to maintain and operate a system to discharge treated leachate into Little Traverse Bay under an NPDES permit issued in 2010 and renewed in October 2016. The renewed NPDES permit is valid through September 2020.
Various claims have been brought against CMS Land or its affiliates, including CMS Energy, alleging environmental damage to property, loss of property value, insufficient disclosure of environmental matters, breach of agreement relating to access, or other matters. CMS Land and other parties have received a demand for payment from the EPA in the amount of $8 million, plus interest. The EPA is seeking recovery under CERCLA of response costs allegedly incurred at Bay Harbor. These costs exceed what was agreed to in a 2005 order between CMS Land and the EPA, and CMS Land has communicated to the EPA that it does not believe that this is a valid claim. The EPA has filed a lawsuit to collect these costs.
At September 30, 2016,March 31, 2017, CMS Energy had a recorded liability of $52$51 million for its remaining obligations.obligations for environmental remediation. CMS Energy calculated this liability based on discounted projected costs, using a discount rate of 4.34 percent and an inflation rate of one percent on annual operating and maintenance costs. The undiscounted amount of the remaining obligation is $67$64 million. CMS Energy expects to pay the following amounts for long-term liquid disposal and operating and maintenance costs in 20162017 and in each of the next four years:
|
|
|
|
|
|
|
| In Millions |
|
|
|
|
|
|
|
| In Millions |
| ||||||||||||||
|
| 2016 |
| 2017 |
| 2018 |
| 2019 |
| 2020 |
|
| 2017 |
| 2018 |
| 2019 |
| 2020 |
| 2021 |
| ||||||||||
CMS Energy |
|
|
|
|
|
|
|
|
|
|
|
|
|
|
|
|
|
|
|
|
|
| ||||||||||
Long-term liquid disposal and operating and maintenance costs |
| $ | 5 |
| $ | 5 |
| $ | 4 |
| $ | 4 |
| $ | 4 |
|
| $ | 4 |
| $ | 4 |
| $ | 4 |
| $ | 4 |
| $ | 4 |
|
CMS Energy’s estimate of response activity costs and the timing of expenditures could change if there are changes in circumstances or assumptions used in calculating the liability. Although a liability for its present estimate of remaining response activity costs has been recorded, CMS Energy cannot predict the ultimate financial impact or outcome of this matter.
Equatorial Guinea Tax Claim: In 2002, CMS Energy sold its oil, gas, and methanol investments in Equatorial Guinea. The government of Equatorial Guinea claims that, in connection with the sale, CMS Energy owes $152 million in taxes, plus significantsubstantial penalties and interest in connection withthat could be up to the sale.amount of the taxes claimed. The matter is proceeding to formal arbitration. CMS Energy has concluded that the government’s tax claim is without merit and is contesting the claim, but cannot predict the financial impact or outcome of the matter. An unfavorable outcome could have a material adverse effect on CMS Energy’s liquidity, financial condition, and results of operations.
Consumers Electric Utility Contingencies
Electric Environmental Matters: Consumers’ operations are subject to environmental laws and regulations. Historically, Consumers has generally been able to recover, in customer rates, the costs to operate its facilities in compliance with these laws and regulations.
Cleanup and Solid Waste: Consumers expects to incur remediation and other response activity costs at a number of sites under the NREPA. Consumers believes that these costs should be recoverable in rates, but cannot guarantee that outcome. Consumers estimates that its liability for NREPA sites for which it can
estimate a range of loss will be between $3 million and $4 million. At September 30, 2016,March 31, 2017, Consumers had a recorded liability of $3 million, the minimum amount in the range of its estimated probable NREPA liability.liability, as no amount in the range was considered a better estimate than any other amount.
Consumers is a potentially responsible party at a number of contaminated sites administered under CERCLA. CERCLA liability is joint and several. In 2010, Consumers received official notification from the EPA that identified Consumers as a potentially responsible party for cleanup of PCBs at the Kalamazoo River CERCLA site. The notification claimed that the EPA has reason to believe that Consumers disposed of PCBs and arranged for the disposal and treatment of PCB-containing materials at portions of the site. In 2011, Consumers received a follow-up letter from the EPA requesting that Consumers agree to participate in a removal action plan along with several other companies for an area of lower Portage Creek, which is connected to the Kalamazoo River. All parties, including Consumers, that were asked to participate in the removal action plan declined to accept liability. Until further information is received from the EPA, Consumers is unable to estimate a range of potential liability for cleanup of the river.
Based on its experience, Consumers estimates that its share of the total liability for known CERCLA sites will be between $3 million and $8 million. Various factors, including the number and creditworthiness of potentially responsible parties involved with each site, affect Consumers’ share of the total liability. At September 30, 2016,March 31, 2017, Consumers had a recorded liability of $3 million for its share of the total liability at these sites, the minimum amount in the range of its estimated probable CERCLA liability.liability, as no amount in the range was considered a better estimate than any other amount.
The timing of payments related to Consumers’ remediation and other response activities at its CERCLA and NREPA sites is uncertain. Consumers periodically reviews these cost estimates. A change in the underlying assumptions, such as an increase in the number of sites, different remediation techniques, the nature and extent of contamination, and legal and regulatory requirements, could affect its estimates of NREPA and CERCLA liability.
Ludington PCB: In 1998, during routine maintenance activities, Consumers identified PCB as a component in certain paint, grout, and sealant materials at Ludington. Consumers removed part of the PCB material and replaced it with non-PCB material. Consumers has had several communications with the EPA regarding this matter. Consumersmatter, but cannot predict the financial impact or outcome of this matter.outcome.
Consumers Gas Utility Contingencies
Gas Environmental Matters: Consumers expects to incur remediation and other response activity costs at a number of sites under the NREPA. These sites include 23 former MGP facilities. Consumers operated the facilities on these sites for some part of their operating lives. For some of these sites, Consumers has no present ownership interest or may own only a portion of the original site.
At September 30, 2016,March 31, 2017, Consumers had a recorded liability of $108$106 million for its remaining obligations for these sites. This amount represents the present value of long-term projected costs, using a discount rate of 2.57 percent and an inflation rate of 2.5 percent. The undiscounted amount of the remaining obligation is $118$115 million. Consumers expects to pay the following amounts for remediation and other response activity costs in 20162017 and in each of the next four years:
|
|
|
|
|
|
|
| In Millions |
| |||||||
|
| 2016 |
| 2017 |
| 2018 |
| 2019 |
| 2020 |
| |||||
Consumers |
|
|
|
|
|
|
|
|
|
|
| |||||
Remediation and other response activity costs |
| $ | 6 |
| $ | 35 |
| $ | 14 |
| $ | 19 |
| $ | 10 |
|
|
|
|
|
|
|
|
| In Millions |
| |||||||
|
| 2017 |
| 2018 |
| 2019 |
| 2020 |
| 2021 |
| |||||
Consumers |
|
|
|
|
|
|
|
|
|
|
| |||||
Remediation and other response activity costs |
| $ | 33 |
| $ | 14 |
| $ | 19 |
| $ | 10 |
| $ | 5 |
|
Consumers periodically reviews these cost estimates. Any significant change in the underlying assumptions, such as an increase in the number of sites, changes in remediation techniques, or legal and regulatory requirements, could affect Consumers’ estimates of annual response activity costs and the MGP liability.
Pursuant to orders issued by the MPSC, Consumers defers its MGP-related remediation costs and recovers them from its customers over a ten-year period. At September 30, 2016,March 31, 2017, Consumers had a regulatory asset of $140$138 million related to the MGP sites.
Consumers estimates that its liability to perform remediation and other response activities at NREPA sites other than the MGP sites could reach $3 million. At September 30, 2016,March 31, 2017, Consumers had a recorded liability of less than $1 million, the minimum amount in the range of its estimated probable liability.liability, as no amount in the range was considered a better estimate than any other amount.
Guarantees
Presented in the following table are CMS Energy’s and Consumers’ guarantees at September 30, 2016:March 31, 2017:
|
|
|
| In Millions |
|
|
|
|
|
|
|
| In Millions |
| ||||||||
|
|
|
|
|
| Maximum |
| Carrying |
|
|
|
|
|
| Maximum |
| Carrying |
| ||||
Guarantee Description |
| Issue Date |
| Expiration Date |
| Obligation |
| Amount |
|
| Issue Date |
| Expiration Date |
| Obligation |
| Amount |
| ||||
CMS Energy, including Consumers |
|
|
|
|
|
|
|
|
|
|
|
|
|
|
|
|
|
| ||||
Indemnity obligations from stock and asset sales agreements1 |
| Various |
| Indefinite |
| $ | 153 |
| $ | 7 |
| |||||||||||
Indemnity obligations from stock and asset sale agreements1 |
| Various |
| Indefinite |
| $ | 153 |
| $ | 7 |
| |||||||||||
Guarantees2 |
| Various |
| Indefinite |
| 48 |
| - |
|
| Various |
| Indefinite |
| 45 |
| - |
| ||||
Consumers |
|
|
|
|
|
|
|
|
|
|
|
|
|
|
|
|
|
| ||||
Gurarantee2 |
| July 2011 |
| Indefinite |
| $ | 30 |
| $ | - |
| |||||||||||
Guarantee2 |
| July 2011 |
| Indefinite |
| $ | 30 |
| $ | - |
| |||||||||||
1 These obligations arose from stock and asset sale agreements under which CMS Energy or a subsidiary of CMS Energy indemnified the purchaser for losses resulting from various matters, primarily claims related to taxes. CMS Energy believes the likelihood of material loss to be remote for the indemnity obligations not recorded as liabilities.
2 At Consumers, this obligation comprises a guarantee provided to the U.S. Department of Energy in connection with a settlement agreement regarding damages resulting from the department’s failure to accept spent nuclear fuel from nuclear power plants formerly owned by Consumers. At CMS Energy, the guarantee obligations comprise Consumers’ guarantee to the U.S. Department of Energy and CMS Energy’s 1994 guarantee of non-recourse revenue bonds issued by Genesee.
Additionally, in the normal course of business, CMS Energy, Consumers, and certain other subsidiaries of CMS Energy have entered into various agreements containing tax and other indemnity provisions for which they are unable to estimate the maximum potential obligation. The current carrying value of these indemnity obligations is less than $1 million. CMS Energy and Consumers consider the likelihood that they would be required to perform or incur substantial losses related to these indemnities to be remote.
Other Contingencies
Michigan Sales and Use Tax Litigation: In 2010, the Michigan Department of Treasury finalized a sales and use tax audit of Consumers for the period from October 1997 through December 2004. It determined that Consumers’ electric distribution equipment and its natural gas system were not eligible for an industrial-processing exemption and therefore were subject to the use tax. Consumers paid the tax for the period from 1997 through 2004 and filed a claim in the Michigan Court of Claims disputing the tax determination. Consumers continued to apply the industrial-processing exemption for the years subsequent to 2004.
In December 2015 and June 2016, Consumers and the Michigan Department of Treasury reached settlement agreements under which the Michigan Department of Treasury will refund to Consumers $60 million of use tax that Consumers paid on its electric distribution equipment and its natural gas
system from 1997 through 2015. This amount comprises a $42 million refund of taxes paid, a $12 million refund of interest paid, and $6 million of interest owed to Consumers.
In June 2016, Consumers received $13 million of the total settlement amount and recorded a note receivable for the remainder, of which $30 million will be received in 2017 and $17 million in 2018. Also in June 2016, Consumers recorded a $4 million reduction in maintenance and other operating expenses, and a reduction in plant, property, and equipment for the portion of the taxes paid that had been capitalized as a cost of equipment. Consumers had previously recognized the effects of $37 million of the total settlement amount in its consolidated financial statements in December 2015.
Concurrently with the June 2016 sales and use tax settlement, CMS Energy reached agreement with the Michigan Department of Treasury on two other tax matters that were under dispute relating to Michigan single business tax and Michigan corporate income tax. As a result, CMS Energy recognized a $3 million reduction in income tax expense and a $3 million reduction in general taxes.
Other:In addition to the matters disclosed in this Note and Note 2, Regulatory Matters, there are certain other lawsuits and administrative proceedings before various courts and governmental agencies arising in the ordinary course of business to which CMS Energy, Consumers, and certain other subsidiaries of CMS Energy are parties. These other lawsuits and proceedings may involve personal injury, property damage, contracts, environmental matters, federal and state taxes, rates, licensing, employment, and other matters. Further, CMS Energy and Consumers occasionally self-report certain regulatory non-compliance matters that may or may not eventually result in administrative proceedings. CMS Energy and Consumers
believe that the outcome of any one of these proceedings will not have a material negative effect on their consolidated results of operations, financial condition, or liquidity.
4: FINANCINGS AND CAPITALIZATION
Financings:Presented in the following table is a summary of major long-term debt transactions during the ninethree months ended September 30, 2016.March 31, 2017.
|
|
|
|
|
|
|
|
|
| |
|
| Principal |
|
|
| Issue/Retirement |
|
|
| |
|
| (In Millions) |
| Interest Rate |
| Date |
| Maturity Date |
| |
Debt issuances |
|
|
|
|
|
|
|
|
| |
CMS Energy, parent only |
|
|
|
|
|
|
|
|
| |
Senior notes |
| $ | 300 |
| 3.000 | % | May 2016 |
| May 2026 |
|
Total CMS Energy, parent only |
| $ | 300 |
|
|
|
|
|
|
|
Consumers |
|
|
|
|
|
|
|
|
| |
FMBs |
| $ | 450 |
| 3.250 | % | August 2016 |
| August 2046 |
|
Total Consumers |
| $ | 450 |
|
|
|
|
|
|
|
Total CMS Energy |
| $ | 750 |
|
|
|
|
|
|
|
Debt retirements |
|
|
|
|
|
|
|
|
| |
Consumers |
|
|
|
|
|
|
|
|
| |
FMBs |
| $ | 173 |
| 5.500 | % | August 2016 |
| August 2016 |
|
Total Consumers |
| $ | 173 |
|
|
|
|
|
|
|
Total CMS Energy |
| $ | 173 |
|
|
|
|
|
|
|
|
| Principal |
| Interest Rate |
| Issue/Retirement |
| Maturity Date |
| ||
Debt issuances |
|
|
|
|
|
|
|
|
|
| |
CMS Energy, parent only |
|
|
|
|
|
|
|
|
|
| |
Senior notes |
| $ | 350 |
| 3.450 | % |
| February 2017 |
| August 2027 |
|
Consumers |
|
|
|
|
|
|
|
|
|
| |
First mortgage bonds |
| $ | 350 |
| 3.950 | % |
| February 2017 |
| July 2047 |
|
Debt retirements |
|
|
|
|
|
|
|
|
|
| |
Consumers |
|
|
|
|
|
|
|
|
|
| |
First mortgage bonds |
| $ | 250 |
| 5.150 | % |
| February 2017 |
| February 2017 |
|
Term Loan: In April 2016,2017, CMS Energy reached an agreement to extend the maturity date of its $180 million term loan by one year, through April 2018.2019.
Regulatory Authorization for Financings: Consumers is required to maintain FERC authorization for financings. In June 2016, Consumers received authorization from FERC to have outstanding, at any one time, up to $800 million of secured and unsecured short-term securities for general corporate purposes. FERC also authorized Consumers to issue and sell up to $1.795 billion of secured and unsecured long-
term securities for general corporate purposes. The authorization was effective July 1, 2016 and will terminate on June 30, 2018.
Revolving Credit Facilities: The following secured revolving credit facilities with banks were available at September 30, 2016:March 31, 2017:
|
|
|
|
|
|
|
| In Millions |
| ||||
|
|
|
|
|
| Letters of Credit |
|
|
| ||||
Expiration Date |
| Amount of Facility |
| Amount Borrowed |
| Outstanding |
| Amount Available |
| ||||
CMS Energy, parent only |
|
|
|
|
|
|
|
|
| ||||
May 27, 20211,2 |
| $ | 550 |
| $ | - |
| $ | 1 |
| $ | 549 |
|
Consumers |
|
|
|
|
|
|
|
|
| ||||
May 27, 20211,3 |
| $ | 650 |
| $ | - |
| $ | 7 |
| $ | 643 |
|
November 23, 20173 |
| 250 |
| - |
| - |
| 250 |
| ||||
May 9, 20183 |
| 30 |
| - |
| 30 |
| - |
| ||||
|
|
|
|
|
|
|
| In Millions |
| ||||
Expiration Date |
| Amount of Facility |
| Amount Borrowed |
| Letters of Credit |
| Amount Available |
| ||||
CMS Energy, parent only |
|
|
|
|
|
|
|
|
| ||||
May 27, 20211 |
| $ | 550 |
| $ | - |
| $ | 1 |
| $ | 549 |
|
Consumers |
|
|
|
|
|
|
|
|
| ||||
May 27, 20212 |
| $ | 650 |
| $ | - |
| $ | 7 |
| $ | 643 |
|
November 23, 20182 |
| 250 |
| - |
| - |
| 250 |
| ||||
May 9, 20182 |
| 30 |
| - |
| 30 |
| - |
| ||||
1 In May 2016, the expiration date of this revolving credit agreement was extended from 2020 to 2021.
2During the ninethree months ended September 30, 2016,March 31, 2017, CMS Energy’s average borrowings totaled $3$85 million with a weighted-average interest rate of 1.682.02 percent. Obligations under this facility are secured by Consumers common stock.
32 Obligations under this facility are secured by FMBsfirst mortgage bonds of Consumers.
Short-term Borrowings: Under Consumers’ commercial paper program, Consumers may issue, in one or more placements, commercial paper notes with maturities of up to 365 days and that bear interest at fixed or floating rates. These issuances are supported by Consumers’ $650 million revolving credit facility and may have an aggregate principal amount outstanding of up to $500 million. While the amount of outstanding commercial paper does not reduce the revolver’s available capacity, Consumers does not intend to issue commercial paper in an amount exceeding the available revolver capacity. At September 30, 2016, $75 million ofMarch 31, 2017, no commercial paper notes were outstanding under this program and are recorded as current notes payable on the consolidated balance sheets of CMS Energy and Consumers.program.
Dividend Restrictions: At September 30, 2016,March 31, 2017, payment of dividends by CMS Energy on its common stock was limited to $4.3$4.4 billion under provisions of the Michigan Business Corporation Act of 1972.
Under the provisions of its articles of incorporation, at September 30, 2016,March 31, 2017, Consumers had $1.0$1.1 billion of unrestricted retained earnings available to pay dividends on its common stock to CMS Energy. Provisions of the Federal Power Act and the Natural Gas Act appear to restrict dividends payable by Consumers to the amount of Consumers’ retained earnings. Several decisions from FERC suggest that under a variety of circumstances dividends from Consumers on its common stock would not be limited to amounts in Consumers’ retained earnings. Any decision by Consumers to pay dividends on its common stock in excess of retained earnings would be based on specific facts and circumstances and would be subject to a formal regulatory filing process.
For the ninethree months ended September 30, 2016,March 31, 2017, Consumers paid $361$148 million in dividends on its common stock to CMS Energy.
Issuance of Common Stock:In April 2015,March 2017, CMS Energy entered into an updated continuous equity offering program permitting it to sell, from time to time in “at the market” offerings, common stock having an aggregate sales price of up to $100 million. Presented in the following table are the transactions that CMS Energy entered intoThere have been no sales of securities under the program:this program.
|
|
|
|
|
|
|
| ||
|
| Number of |
| Average |
| Proceeds |
| ||
|
| Shares Issued |
| Price per Share |
| (In Millions) |
| ||
April – July 2015 |
| 888,610 |
| $ | 33.76 |
| $ | 30 |
|
March 2016 |
| 1,449,171 |
| 41.40 |
| 60 |
| ||
Total |
| 2,337,781 |
| $ | 38.50 |
| $ | 90 |
|
Accounting standards define fair value as the price that would be received to sell an asset or paid to transfer a liability in an orderly transaction between market participants. When measuring fair value, CMS Energy and Consumers are required to incorporate all assumptions that market participants would use in pricing an asset or liability, including assumptions about risk. A fair value hierarchy prioritizes inputs used to measure fair value according to their observability in the market. The three levels of the fair value hierarchy are as follows:
· Level 1 inputs are unadjusted quoted prices in active markets for identical assets or liabilities.
· Level 2 inputs are observable, market-based inputs, other than Level 1 prices. Level 2 inputs may include quoted prices for similar assets or liabilities in active markets, quoted prices in inactive markets, and inputs derived from or corroborated by observable market data.
· Level 3 inputs are unobservable inputs that reflect CMS Energy’s or Consumers’ own assumptions about how market participants would value their assets and liabilities.
CMS Energy and Consumers classify fair value measurements within the fair value hierarchy based on the lowest level of input that is significant to the fair value measurement in its entirety.
Assets and Liabilities Measured at Fair Value on a Recurring Basis
Presented in the following table are CMS Energy’s and Consumers’ assets and liabilities recorded at fair value on a recurring basis:
|
|
|
|
|
|
|
| In Millions |
|
|
|
|
|
|
|
| In Millions |
| ||||||||
|
| CMS Energy, including Consumers |
| Consumers |
|
| CMS Energy, including Consumers |
| Consumers |
| ||||||||||||||||
|
| September 30 |
| December 31 |
| September 30 |
| December 31 |
|
| March 31 |
| December 31 |
| March 31 |
| December 31 |
| ||||||||
|
| 2016 |
| 2015 |
| 2016 |
| 2015 |
|
| 2017 |
| 2016 |
| 2017 |
| 2016 |
| ||||||||
Assets1 |
|
|
|
|
|
|
|
|
|
|
|
|
|
|
|
|
|
| ||||||||
Cash equivalents |
| $ | 153 |
| $ | 158 |
| $ | - |
| $ | - |
|
| $ | 50 |
| $ | 44 |
| $ | - |
| $ | - |
|
Restricted cash equivalents |
| 28 |
| 19 |
| 28 |
| 19 |
|
| 30 |
| 19 |
| 30 |
| 19 |
| ||||||||
CMS Energy common stock |
| - |
| - |
| 34 |
| 29 |
|
| - |
| - |
| 20 |
| 33 |
| ||||||||
Nonqualified deferred compensation plan assets |
| 11 |
| 10 |
| 8 |
| 7 |
|
| 12 |
| 12 |
| 9 |
| 8 |
| ||||||||
DB SERP |
|
|
|
|
|
|
|
|
|
|
|
|
|
|
|
|
|
| ||||||||
Cash equivalents |
| 1 |
| 2 |
| 1 |
| 2 |
|
| - |
| 3 |
| - |
| 2 |
| ||||||||
Mutual funds |
| 144 |
| 146 |
| 103 |
| 104 |
|
| 143 |
| 141 |
| 102 |
| 102 |
| ||||||||
Derivative instruments |
|
|
|
|
|
|
|
|
|
|
|
|
|
|
|
|
|
| ||||||||
Commodity contracts |
| 2 |
| 1 |
| 2 |
| 1 |
|
| - |
| 1 |
| - |
| 1 |
| ||||||||
Total |
| $ | 339 |
| $ | 336 |
| $ | 176 |
| $ | 162 |
|
| $ | 235 |
| $ | 220 |
| $ | 161 |
| $ | 165 |
|
Liabilities1 |
|
|
|
|
|
|
|
|
|
|
|
|
|
|
|
|
|
| ||||||||
Nonqualified deferred compensation plan liabilities |
| $ | 11 |
| $ | 10 |
| $ | 8 |
| $ | 7 |
|
| $ | 12 |
| $ | 12 |
| $ | 9 |
| $ | 8 |
|
Derivative instruments |
|
|
|
|
|
|
|
|
|
|
|
|
|
|
|
|
|
| ||||||||
Commodity contracts |
| 1 |
| - |
| 1 |
| - |
|
| 1 |
| - |
| - |
| - |
| ||||||||
Total |
| $ | 12 |
| $ | 10 |
| $ | 9 |
| $ | 7 |
|
| $ | 13 |
| $ | 12 |
| $ | 9 |
| $ | 8 |
|
1 All assets and liabilities were classified as Level 1 with the exception of some commodity contracts, which were classified as Level 3.
Cash Equivalents: Cash equivalents and restricted cash equivalents consist of money market funds with daily liquidity. Short-term debt instruments classified as cash equivalents on the consolidated balance sheets are not included since they are recorded at amortized cost.
Nonqualified Deferred Compensation Plan Assets and Liabilities: The nonqualified deferred compensation plan assets consist of mutual funds, which are valued using the daily quoted NAVs.net asset values. CMS Energy and Consumers value their nonqualified deferred compensation plan liabilities based on the fair values of the plan assets, as they reflect what is owed to the plan participants in accordance with their investment elections. CMS Energy and Consumers report the assets in other non-current assets and the liabilities in other non-current liabilities on their consolidated balance sheets.
DB SERP Assets: The DB SERP cash equivalents consist of a money market fund with daily liquidity. The DB SERP invests in mutual funds that hold primarily fixed-income instruments of varying maturities. In order to meet their investment objectives, the funds hold investment-grade debt securities, and may invest a portion of their assets in high-yield securities, foreign debt, and derivative instruments. CMS Energy and Consumers value these funds using the daily quoted NAVs.net asset values. CMS Energy and Consumers report their DB SERP assets in other non-current assets on their consolidated balance sheets. For additional details about DB SERP securities, see Note 6, Financial Instruments.
Derivative Instruments: CMS Energy and Consumers value their derivative instruments using either a market approach that incorporates information from market transactions, or an income approach that discounts future expected cash flows to a present value amount. CMS Energy values its exchange-traded
derivative contracts based on Level 1 quoted prices. CMS Energy’s and Consumers’ remaining derivatives are classified as Level 3.
The majority of these derivatives are FTRs held by Consumers. Consumers uses FTRs to manage price risk related to electricity transmission congestion. An FTR is a financial instrument that entitles its holder to receive compensation or requires its holder to remit payment for congestion-related transmission charges. Under regulatory accounting, all changes in fair value associated with FTRs are deferred as regulatory assets and liabilities until the instruments are settled. Due to the lack of quoted pricing information, Consumers determines the fair value of its FTRs based on Consumers’ average historical settlements.
Presented in the following table are the carrying amounts and fair values, by level within the fair value hierarchy, of CMS Energy’s and Consumers’ financial instruments that are not recorded at fair value. The table does not include information onexcludes cash, cash equivalents, short-term financial instruments, and trade accounts receivable and notes receivable, short-term investments, and current liabilities since thepayable whose carrying amounts of these items approximate their fair values because of their short-term nature.values. For information about assets and liabilities recorded at fair value and for additional details regarding the fair value hierarchy, see Note 5, Fair Value Measurements.
In Millions |
| ||||||||||||||||||||||||||||||
|
| September 30, 2016 |
| December 31, 2015 |
| ||||||||||||||||||||||||||
|
|
|
| Fair Value |
|
|
| Fair Value |
| ||||||||||||||||||||||
|
| Carrying |
|
|
| Level |
| Carrying |
|
|
| Level |
| ||||||||||||||||||
|
| Amount |
| Total |
| 1 |
| 2 |
| 3 |
| Amount |
| Total |
| 1 |
| 2 |
| 3 |
| ||||||||||
CMS Energy, including Consumers |
|
|
|
|
|
|
|
|
|
|
|
|
|
|
|
|
| ||||||||||||||
Assets |
|
|
|
|
|
|
|
|
|
|
|
|
|
|
|
|
|
|
|
|
| ||||||||||
Long-term receivables1 |
| $ | 23 |
| $ | 23 |
| $ | - |
| $ | - |
| $ | 23 |
| $ | - |
| $ | - |
| $ | - |
| $ | - |
| $ | - |
|
Notes receivable2 |
| 1,286 |
| 1,374 |
| - |
| - |
| 1,374 |
| 1,161 |
| 1,228 |
| - |
| - |
| 1,228 |
| ||||||||||
Securities held to maturity |
| 13 |
| 14 |
| - |
| 14 |
| - |
| 11 |
| 11 |
| - |
| 11 |
| - |
| ||||||||||
Liabilities |
|
|
|
|
|
|
|
|
|
|
|
|
|
|
|
|
|
|
|
|
| ||||||||||
Long-term debt3 |
| 9,706 |
| 10,651 |
| - |
| 9,628 |
| 1,023 |
| 9,084 |
| 9,599 |
| - |
| 8,648 |
| 951 |
| ||||||||||
Long-term payables4 |
| 22 |
| 23 |
| - |
| - |
| 23 |
| 14 |
| 14 |
| - |
| - |
| 14 |
| ||||||||||
Consumers |
|
|
|
|
|
|
|
|
|
|
|
|
|
|
|
|
|
|
|
|
| ||||||||||
Assets |
|
|
|
|
|
|
|
|
|
|
|
|
|
|
|
|
|
|
|
|
| ||||||||||
Long-term receivables1 |
| $ | 23 |
| $ | 23 |
| $ | - |
| $ | - |
| $ | 23 |
| $ | - |
| $ | - |
| $ | - |
| $ | - |
| $ | - |
|
Notes receivable |
| 45 |
| 44 |
| - |
| - |
| 44 |
| - |
| - |
| - |
| - |
| - |
| ||||||||||
Liabilities |
|
|
|
|
|
|
|
|
|
|
|
|
|
|
|
|
|
|
|
|
| ||||||||||
Long-term debt5 |
| 5,640 |
| 6,232 |
| - |
| 5,209 |
| 1,023 |
| 5,381 |
| 5,684 |
| - |
| 4,733 |
| 951 |
| ||||||||||
Long-term payables |
| 6 |
| 6 |
| - |
| - |
| 6 |
| - |
| - |
| - |
| - |
| - |
| ||||||||||
|
| In Millions |
| ||||||||||||||||||||||||||||
|
| March 31, 2017 |
| December 31, 2016 |
| ||||||||||||||||||||||||||
|
|
|
| Fair Value |
|
|
| Fair Value |
| ||||||||||||||||||||||
|
| Carrying |
|
|
| Level |
| Carrying |
|
|
| Level |
| ||||||||||||||||||
|
| Amount |
| Total |
| 1 |
| 2 |
| 3 |
| Amount |
| Total |
| 1 |
| 2 |
| 3 |
| ||||||||||
CMS Energy, including Consumers |
|
|
|
|
|
|
|
|
|
|
|
|
|
|
| ||||||||||||||||
Assets |
|
|
|
|
|
|
|
|
|
|
|
|
|
|
|
|
|
|
|
|
| ||||||||||
Long-term receivables1 |
| $ | 18 |
| $ | 18 |
| $ | - |
| $ | - |
| $ | 18 |
| $ | 22 |
| $ | 22 |
| $ | - |
| $ | - |
| $ | 22 |
|
Notes receivable2 |
| 1,288 |
| 1,373 |
| - |
| - |
| 1,373 |
| 1,326 |
| 1,415 |
| - |
| - |
| 1,415 |
| ||||||||||
Securities held to maturity |
| 12 |
| 12 |
| - |
| 12 |
| - |
| 13 |
| 13 |
| - |
| 13 |
| - |
| ||||||||||
Liabilities |
|
|
|
|
|
|
|
|
|
|
|
|
|
|
|
|
|
|
|
|
| ||||||||||
Long-term debt3 |
| 9,919 |
| 10,345 |
| - |
| 9,367 |
| 978 |
| 9,504 |
| 9,953 |
| - |
| 8,990 |
| 963 |
| ||||||||||
Long-term payables4 |
| 18 |
| 18 |
| - |
| - |
| 18 |
| 17 |
| 17 |
| - |
| - |
| 17 |
| ||||||||||
Consumers |
|
|
|
|
|
|
|
|
|
|
|
|
|
|
|
|
|
|
|
|
| ||||||||||
Assets |
|
|
|
|
|
|
|
|
|
|
|
|
|
|
|
|
|
|
|
|
| ||||||||||
Long-term receivables1 |
| $ | 18 |
| $ | 18 |
| $ | - |
| $ | - |
| $ | 18 |
| $ | 22 |
| $ | 22 |
| $ | - |
| $ | - |
| $ | 22 |
|
Notes receivable5 |
| 45 |
| 45 |
| - |
| - |
| 45 |
| 45 |
| 45 |
| - |
| - |
| 45 |
| ||||||||||
Liabilities |
|
|
|
|
|
|
|
|
|
|
|
|
|
|
|
|
|
|
|
|
| ||||||||||
Long-term debt6 |
| 5,724 |
| 5,999 |
| - |
| 5,021 |
| 978 |
| 5,628 |
| 5,903 |
| - |
| 4,940 |
| 963 |
| ||||||||||
1 Includes current accounts receivable of $13$12 million at September 30,March 31, 2017 and December 31, 2016.
2 Includes current portion of notes receivable of $187$205 million at September 30, 2016March 31, 2017 and $144$219 million at December 31, 2015.2016.
3 Includes current portion of long-term debt of $984$790 million at September 30, 2016March 31, 2017 and $684$864 million at December 31, 2015.2016.
4 Includes current portion of long-term payables of $1 million at September 30, 2016March 31, 2017 and December 31, 2015.2016.
5 Includes current portion of notes receivable of $29 million at March 31, 2017 and December 31, 2016.
6 Includes current portion of long-term debt of $275$305 million at September 30, 2016March 31, 2017 and $198$375 million at December 31, 2015.2016.
At CMS Energy, notes receivable consist primarily of EnerBank’s fixed-rate installment loans. EnerBank estimates the fair value of these loans using a discounted cash flows technique that incorporates market interest rates as well as assumptions about the remaining life of the loans and credit risk.
CMS Energy and Consumers estimate the fair value of their long-term debt using quoted prices from market trades of the debt, if available. In the absence of quoted prices, CMS Energy and Consumers calculate market yields and prices for the debt using a matrix method that incorporates market data for similarly rated debt. Depending on the information available, other valuation techniques and models may be used that rely on assumptions that cannot be observed or confirmed through market transactions.
The effects of third-party credit enhancements are excluded from the fair value measurements of long-term debt. At September 30, 2016March 31, 2017 and December 31, 2015,2016, CMS Energy’s long-term debt included $103 million principal amount that was supported by third-party credit enhancements. This entire principal amount was at Consumers.
Presented in the following table are CMS Energy’s and Consumers’ investment securities classified as available for sale or held to maturity:
|
|
|
|
|
|
|
|
|
|
|
|
|
| In Millions |
|
| In Millions |
| ||||||||||||||||||||||||||||||||
|
| September 30, 2016 |
| December 31, 2015 |
| March 31, 2017 |
| December 31, 2016 |
| |||||||||||||||||||||||||||||||||||||||||
|
|
|
| Unrealized |
| Unrealized |
| Fair |
|
|
| Unrealized |
| Unrealized |
| Fair |
|
|
|
| Unrealized |
| Unrealized |
| Fair |
|
|
| Unrealized |
| Unrealized |
| Fair |
| ||||||||||||||||
|
| Cost |
| Gains |
| Losses |
| Value |
| Cost |
| Gains |
| Losses |
| Value |
|
| Cost |
| Gains |
| Losses |
| Value |
| Cost |
| Gains |
| Losses |
| Value |
| ||||||||||||||||
CMS Energy, including Consumers | CMS Energy, including Consumers |
|
|
|
|
|
|
|
|
|
|
|
|
| CMS Energy, including Consumers |
|
|
|
|
|
|
|
|
|
|
| ||||||||||||||||||||||||
Available for sale |
|
|
|
|
|
|
|
|
|
|
|
|
|
|
|
|
|
|
|
|
|
|
|
|
|
|
|
|
|
|
|
|
|
| ||||||||||||||||
DB SERP |
|
|
|
|
|
|
|
|
|
|
|
|
|
|
|
|
|
|
|
|
|
|
|
|
|
|
|
|
|
|
|
|
|
| ||||||||||||||||
Mutual funds |
| $ | 149 |
| $ | - |
| $ | 5 |
| $ | 144 |
| $ | 152 |
| $ | - |
| $ | 6 |
| $ | 146 |
|
| $ | 142 |
| $ | 1 |
| $ | - |
| $ | 143 |
| $ | 141 |
| $ | - |
| $ | - |
| $ | 141 |
|
Held to maturity |
|
|
|
|
|
|
|
|
|
|
|
|
|
|
|
|
|
|
|
|
|
|
|
|
|
|
|
|
|
|
|
|
|
| ||||||||||||||||
Debt securities |
| 13 |
| 1 |
| - |
| 14 |
| 11 |
| - |
| - |
| 11 |
|
| 12 |
| - |
| - |
| 12 |
| 13 |
| - |
| - |
| 13 |
| ||||||||||||||||
Consumers |
|
|
|
|
|
|
|
|
|
|
|
|
|
|
|
|
|
|
|
|
|
|
|
|
|
|
|
|
|
|
|
|
|
| ||||||||||||||||
Available for sale |
|
|
|
|
|
|
|
|
|
|
|
|
|
|
|
|
|
|
|
|
|
|
|
|
|
|
|
|
|
|
|
|
|
| ||||||||||||||||
DB SERP |
|
|
|
|
|
|
|
|
|
|
|
|
|
|
|
|
|
|
|
|
|
|
|
|
|
|
|
|
|
|
|
|
|
| ||||||||||||||||
Mutual funds |
| $ | 107 |
| $ | - |
| $ | 4 |
| $ | 103 |
| $ | 108 |
| $ | - |
| $ | 4 |
| $ | 104 |
|
| $ | 102 |
| $ | - |
| $ | - |
| $ | 102 |
| $ | 102 |
| $ | - |
| $ | - |
| $ | 102 |
|
CMS Energy common stock |
| 4 |
| 30 |
| - |
| 34 |
| 4 |
| 25 |
| - |
| 29 |
|
| 2 |
| 18 |
| - |
| 20 |
| 4 |
| 29 |
| - |
| 33 |
| ||||||||||||||||
The mutual funds classified as available for sale hold primarily fixed-income instruments of varying maturities. Debt securities classified as held to maturity consist primarily of mortgage-backed securities and Utah Housing Corporation bonds held by EnerBank.
Presented in the following table are details of CMS Energy’s and Consumers’ current and non-current notes receivable:
|
|
|
| In Millions |
|
|
|
| In Millions |
| ||||
|
| September 30, 2016 |
| December 31, 2015 |
|
| March 31, 2017 |
| December 31, 2016 |
| ||||
CMS Energy, including Consumers |
|
|
|
|
|
|
|
|
|
| ||||
Current |
|
|
|
|
|
|
|
|
|
| ||||
EnerBank notes receivable, net of allowance for loan losses |
| $ | 146 |
| $ | 128 |
|
| $ | 157 |
| $ | 151 |
|
EnerBank notes receivable held for sale |
| 41 |
| 16 |
|
| 19 |
| 39 |
| ||||
State of Michigan tax settlement |
| 29 |
| 29 |
| |||||||||
Non-current |
|
|
|
|
|
|
|
|
|
| ||||
EnerBank notes receivable |
| 1,051 |
| 1,017 |
|
| 1,064 |
| 1,088 |
| ||||
State of Michigan tax settlement |
| 48 |
| - |
|
| 19 |
| 19 |
| ||||
Total notes receivable |
| $ | 1,286 |
| $ | 1,161 |
|
| $ | 1,288 |
| $ | 1,326 |
|
Consumers |
|
|
|
|
|
|
|
|
|
| ||||
Current |
|
|
|
|
| |||||||||
State of Michigan tax settlement |
| $ | 29 |
| $ | 29 |
| |||||||
Non-current |
|
|
|
|
|
|
|
|
|
| ||||
State of Michigan tax settlement |
| $ | 45 |
| $ | - |
|
| 16 |
| 16 |
| ||
Total notes receivable |
| $ | 45 |
| $ | - |
|
| $ | 45 |
| $ | 45 |
|
EnerBank notes receivable are unsecured consumer installment loans for financing home improvements. EnerBank records its notes receivable at cost, less an allowance for loan losses. In March 2017, EnerBank completed a sale of notes receivable, receiving proceeds of $19 million and recording an insignificant gain. At September 30, 2016, $41March 31, 2017, $19 million of notes receivable wereremained classified as held for sale; the fair value of notes receivable held for sale exceeded their carrying value. These notes are expected to be sold in 2016.2017.
Authorized contractors pay fees to EnerBank to provide borrowers with same-as-cash, zero interest, or reduced interest loans. Unearned income associated with the loan fees, which is recorded as a reduction to notes receivable on CMS Energy’s consolidated balance sheets, was $82$83 million at September 30, 2016March 31, 2017 and $84 million at December 31, 2015.2016. Unearned income associated with the loan fees for notes receivable held for sale was $8$4 million at September 30, 2016March 31, 2017 and $3$8 million at December 31, 2015.2016.
The allowance for loan losses is a valuation allowance to reflect estimated credit losses. The allowance is increased by the provision for loan losses and decreased by loan charge-offs net of recoveries. Management estimates the allowance balance required by taking into consideration historical loan loss experience, the nature and volume of the portfolio, economic conditions, and other factors. Loan losses are charged against the allowance when the loss is confirmed, but no later than the point at which a loan becomes 120 days past due.
Loans that are 30 days or more past due are considered delinquent. The balance of EnerBank’s delinquent consumer loans was $10$9 million at September 30, 2016March 31, 2017 and $8$11 million at December 31, 2015.2016.
At September 30, 2016March 31, 2017 and December 31, 2015,2016, $1 million of EnerBank’s loans had been modified as troubled debt restructurings.
CMS Energy and Consumers provide pension, OPEB, and other retirement benefits to employees under a number of different plans.
In January 2016, CMS Energy and Consumers changed the method they use to determine the discount rate used to calculate the service cost and interest expense components of net periodic benefit costs for the DB Pension and OPEB Plans. Historically, the discount rate used for this purpose represented a single weighted-average rate derived from the yield curve used to determine the benefit obligation. CMS Energy
and Consumers have elected to use instead a full-yield-curve approach inadopt ASU 2017-07, Improving the estimationPresentation of service costNet Periodic Pension Cost and interest expense; this approach is more accurate in that it applies individual spot rates along the yield curve to future projected benefit payments basedNet Periodic Postretirement Benefit Cost, as of January 1, 2017. For further details on the timeimplementation of payment. As a result of changing to the full-yield-curve approach to determine the discount rate, for the nine months ended September 30, 2016, the service cost and interest expense components of net periodic benefit costs were reduced by $17 million for the DB Pension Plan and $9 million for the OPEB Plan for CMS Energy and by $17 million for the DB Pension Plan and $9 million for the OPEB Plan for Consumers.this standard, see Note 1, New Accounting Standards.
Presented in the following table are the costs (credits) and other changes in plan assets and benefit obligations incurred in CMS Energy’s and Consumers’ retirement benefits plans:
In Millions |
| |||||||||||||||||||||||||||||||||||||
|
| DB Pension Plan |
| OPEB Plan |
|
|
|
|
|
| In Millions |
| ||||||||||||||||||||||||||
|
| Three Months Ended |
| Nine Months Ended |
| Three Months Ended |
| Nine Months Ended |
|
| DB Pension Plan |
| OPEB Plan |
| ||||||||||||||||||||||||
September 30 |
| 2016 |
| 2015 |
| 2016 |
| 2015 |
| 2016 |
| 2015 |
| 2016 |
| 2015 |
| |||||||||||||||||||||
Three Months Ended March 31 |
| 2017 |
| 2016 |
| 2017 |
| 2016 |
| |||||||||||||||||||||||||||||
CMS Energy, including Consumers | CMS Energy, including Consumers |
|
|
|
|
|
|
|
|
|
|
|
|
|
|
|
|
|
|
|
|
| ||||||||||||||||
Net periodic cost (credit) |
|
|
|
|
|
|
|
|
|
|
|
|
|
|
|
|
|
|
|
|
|
|
|
|
|
| ||||||||||||
Service cost |
| $ | 10 |
| $ | 13 |
| $ | 31 |
| $ | 37 |
| $ | 5 |
| $ | 7 |
| $ | 14 |
| $ | 19 |
|
| $ | 11 |
| $ | 11 |
| $ | 5 |
| $ | 5 |
|
Interest expense |
| 21 |
| 26 |
| 64 |
| 77 |
| 12 |
| 14 |
| 35 |
| 43 |
| |||||||||||||||||||||
Interest cost |
| 22 |
| 21 |
| 13 |
| 12 |
| |||||||||||||||||||||||||||||
Expected return on plan assets |
| (36 | ) | (35) |
| (110 | ) | (104) |
| (22 | ) | (23) |
| (65 | ) | (68 | ) |
| (38 | ) | (37 | ) | (22 | ) | (22 | ) | ||||||||||||
Amortization of: |
|
|
|
|
|
|
|
|
|
|
|
|
|
|
|
|
|
|
|
|
|
|
|
|
|
| ||||||||||||
Net loss |
| 17 |
| 22 |
| 52 |
| 67 |
| 5 |
| 5 |
| 16 |
| 16 |
|
| 20 |
| 17 |
| 8 |
| 5 |
| ||||||||||||
Prior service cost (credit) |
| 1 |
| - |
| 3 |
| 1 |
| (10 | ) | (10) |
| (31 | ) | (31 | ) |
| 1 |
| 1 |
| (9 | ) | (10 | ) | ||||||||||||
Net periodic cost (credit) |
| $ | 13 |
| $ | 26 |
| $ | 40 |
| $ | 78 |
| $ | (10 | ) | $ | (7) |
| $ | (31 | ) | $ | (21 | ) |
| $ | 16 |
| $ | 13 |
| $ | (5 | ) | $ | (10 | ) |
Consumers |
|
|
|
|
|
|
|
|
|
|
|
|
|
|
|
|
|
|
|
|
|
|
|
|
|
| ||||||||||||
Net periodic cost (credit) |
|
|
|
|
|
|
|
|
|
|
|
|
|
|
|
|
|
|
|
|
|
|
|
|
|
| ||||||||||||
Service cost |
| $ | 11 |
| $ | 12 |
| $ | 31 |
| $ | 36 |
| $ | 4 |
| $ | 7 |
| $ | 13 |
| $ | 19 |
|
| $ | 11 |
| $ | 10 |
| $ | 5 |
| $ | 4 |
|
Interest expense |
| 20 |
| 25 |
| 62 |
| 74 |
| 12 |
| 14 |
| 34 |
| 42 |
| |||||||||||||||||||||
Interest cost |
| 21 |
| 21 |
| 13 |
| 11 |
| |||||||||||||||||||||||||||||
Expected return on plan assets |
| (35 | ) | (34) |
| (107 | ) | (101) |
| (20 | ) | (22) |
| (60 | ) | (65 | ) |
| (37 | ) | (36 | ) | (21 | ) | (20 | ) | ||||||||||||
Amortization of: |
|
|
|
|
|
|
|
|
|
|
|
|
|
|
|
|
|
|
|
|
|
|
|
|
|
| ||||||||||||
Net loss |
| 16 |
| 22 |
| 50 |
| 66 |
| 5 |
| 6 |
| 16 |
| 17 |
|
| 20 |
| 17 |
| 8 |
| 6 |
| ||||||||||||
Prior service cost (credit) |
| 1 |
| - |
| 3 |
| 1 |
| (10 | ) | (10) |
| (30 | ) | (30 | ) |
| 1 |
| 1 |
| (9 | ) | (10 | ) | ||||||||||||
Net periodic cost (credit) |
| $ | 13 |
| $ | 25 |
| $ | 39 |
| $ | 76 |
| $ | (9 | ) | $ | (5) |
| $ | (27 | ) | $ | (17 | ) |
| $ | 16 |
| $ | 13 |
| $ | (4 | ) | $ | (9 | ) |
Presented in the following table is a reconciliation of the statutory U.S. federal income tax rate to the effective income tax rate from continuing operations:
Nine Months Ended September 30 |
| 2016 |
| 2015 |
| |||||
Three Months Ended March 31 |
| 2017 |
| 2016 |
| |||||
CMS Energy, including Consumers |
|
|
|
|
|
|
|
|
|
|
U.S. federal income tax rate |
| 35.0 | % | 35.0 | % |
| 35.0 | % | 35.0 | % |
Increase (decrease) in income taxes from: |
|
|
|
|
|
|
|
|
|
|
State and local income taxes, net of federal effect |
| 4.2 |
| 4.8 |
|
| 4.7 |
| 4.1 |
|
Accelerated flow-through of regulatory tax benefits1 |
| (4.7 | ) | (4.9 | ) |
| (4.3 | ) | (4.7 | ) |
Employee share-based awards2 |
| (0.8 | ) | - |
| |||||
Employee share-based awards |
| (1.9 | ) | (2.2 | ) | |||||
Other, net |
| (1.4 | ) | (1.4 | ) |
| (1.0 | ) | (1.1 | ) |
Effective tax rate |
| 32.3 | % | 33.5 | % |
| 32.5 | % | 31.1 | % |
Consumers |
|
|
|
|
|
|
|
|
|
|
U.S. federal income tax rate |
| 35.0 | % | 35.0 | % |
| 35.0 | % | 35.0 | % |
Increase (decrease) in income taxes from: |
|
|
|
|
|
|
|
|
|
|
State and local income taxes, net of federal effect |
| 4.6 |
| 4.8 |
|
| 4.5 |
| 4.4 |
|
Accelerated flow-through of regulatory tax benefits1 |
| (4.0 | ) | (4.2 | ) |
| (4.2 | ) | (4.2 | ) |
Employee share-based awards2 |
| (0.7 | ) | - |
| |||||
Employee share-based awards |
| (1.7 | ) | (2.0 | ) | |||||
Other, net |
| (1.2 | ) | (1.5 | ) |
| (1.2 | ) | (0.9 | ) |
Effective tax rate |
| 33.7 | % | 34.1 | % |
| 32.4 | % | 32.3 | % |
1 Since 2014, Consumers has followed a new regulatory treatment ordered by the MPSC that accelerates the return of certain income tax benefits to customers. This change, which also accelerates Consumers’ recognition of the income tax benefits, reduced Consumers’ income tax expense by $30$13 million for the ninethree months ended September 30, 2016March 31, 2017 and by $29$11 million for the ninethree months ended September 30, 2015.
2 CMS Energy and Consumers elected to adopt ASU 2016-09, Improvements to Employee Share-Based Payment Accounting, as of January 1,March 31, 2016. For further details on the implementation of this standard, see Note 1, New Accounting Standards.
10: EARNINGS PER SHARE—CMS ENERGY
Presented in the following table are CMS Energy’s basic and diluted EPS computations based on net income:
|
|
|
| In Millions, Except Per Share Amounts |
| |||||||||||||||
|
| Three Months Ended |
| Nine Months Ended |
| |||||||||||||||
September 30 |
| 2016 |
| 2015 |
| 2016 |
| 2015 |
| |||||||||||
In Millions, Except Per Share Amounts | In Millions, Except Per Share Amounts |
| ||||||||||||||||||
Three Months Ended March 31 |
| 2017 |
| 2016 |
| |||||||||||||||
Income available to common stockholders |
|
|
|
|
|
|
|
|
|
|
|
|
|
| ||||||
Net income |
| $ | 186 |
| $ | 148 |
| $ | 475 |
| $ | 418 |
| |||||||
Less income attributable to noncontrolling interests |
| - |
| - |
| 1 |
| 1 |
| |||||||||||
Net income available to common stockholders – basic and diluted |
| $ | 186 |
| $ | 148 |
| $ | 474 |
| $ | 417 |
|
| $ | 199 |
| $ | 164 |
|
Average common shares outstanding |
|
|
|
|
|
|
|
|
|
|
|
|
|
| ||||||
Weighted-average shares – basic |
| 278.2 |
| 276.0 |
| 277.7 |
| 275.4 |
|
| 278.9 |
| 276.7 |
| ||||||
Add dilutive nonvested stock awards |
| 1.0 |
| 0.9 |
| 1.1 |
| 0.9 |
|
| 1.0 |
| 1.2 |
| ||||||
Weighted-average shares – diluted |
| 279.2 |
| 276.9 |
| 278.8 |
| 276.3 |
|
| 279.9 |
| 277.9 |
| ||||||
Net income per average common share available to common stockholders |
|
|
|
|
|
|
|
|
|
|
|
|
|
| ||||||
Basic |
| $ | 0.67 |
| $ | 0.53 |
| $ | 1.71 |
| $ | 1.51 |
|
| $ | 0.71 |
| $ | 0.59 |
|
Diluted |
| 0.67 |
| 0.53 |
| 1.70 |
| 1.51 |
|
| 0.71 |
| 0.59 |
| ||||||
Nonvested Stock Awards
CMS Energy’s nonvested stock awards are composed of participating and non-participating securities. The participating securities accrue cash dividends when common stockholders receive dividends. Since the recipient is not required to return the dividends to CMS Energy if the recipient forfeits the award, the nonvested stock awards are considered participating securities. As such, the participating nonvested stock awards were included in the computation of basic EPS. The non-participating securities accrue stock dividends that vest concurrently with the stock award. If the recipient forfeits the award, the stock dividends accrued on the non-participating securities are also forfeited. Accordingly, the non-participating awards and stock dividends were included in the computation of diluted EPS, but not basic EPS.
Presented in the following table are the components of total cash and cash equivalents, including restricted amounts, and their location on CMS Energy’s and Consumers’ consolidated balance sheets:
|
|
|
| In Millions |
| ||
|
| March 31 |
| December 31 |
| ||
|
| 2017 |
| 2016 |
| ||
CMS Energy, including Consumers |
|
|
|
|
| ||
Cash and cash equivalents |
| $ | 433 |
| $ | 235 |
|
Restricted cash and cash equivalents |
| 30 |
| 19 |
| ||
Other non-current assets |
| - |
| 3 |
| ||
Cash and cash equivalents, including restricted amounts |
| $ | 463 |
| $ | 257 |
|
Consumers |
|
|
|
|
| ||
Cash and cash equivalents |
| $ | 182 |
| $ | 131 |
|
Restricted cash and cash equivalents |
| 30 |
| 19 |
| ||
Other non-current assets |
| - |
| 2 |
| ||
Cash and cash equivalents, including restricted amounts |
| $ | 212 |
| $ | 152 |
|
Cash and Cash Equivalents: Cash and cash equivalents include short-term, highly liquid investments with original maturities of three months or less.
Restricted Cash and Cash Equivalents: Restricted cash and cash equivalents are held primarily for the repayment of securitization bonds. Cash and cash equivalents may also be restricted to pay other contractual obligations such as leasing of coal rail cars. These amounts are classified as current assets since they relate to payments that could or will occur within one year.
Other Non-current Assets: The majority of cash equivalents classified as other non-current assets represent an investment in a money market fund held in the DB SERP rabbi trust. See Note 5, Fair Value Measurements for more information regarding the DB SERP.
Implementation of ASU 2016-18, Restricted Cash: CMS Energy and Consumers have early adopted the provisions of ASU 2016-18, Restricted Cash, which requires restricted cash and cash equivalents to be included with cash and cash equivalents when reconciling beginning-of-period and end-of-period amounts shown on the statement of cash flows. In addition, the standard requires that entities apply the new guidance retrospectively to all prior periods presented. Accordingly, CMS Energy and Consumers made the following adjustments to prior-period amounts on their consolidated statements of cash flows:
|
| In Millions |
| |
Three Months Ended March 31 |
| 2016 |
| |
CMS Energy, including Consumers |
|
|
| |
Increase (decrease) in: |
|
|
| |
Net cash used in investing activities |
| $ | (7 | ) |
Cash and cash equivalents, including restricted amounts, end of period |
| 29 |
| |
Consumers |
|
|
| |
Increase (decrease) in: |
|
|
| |
Net cash used in investing activities |
| $ | (8 | ) |
Cash and cash equivalents, including restricted amounts, end of period |
| 29 |
| |
Reportable segments consist of business units defined by the products and services they offer. CMS Energy and Consumers evaluate the performance of each segment based on its contribution to net income available to CMS Energy’s common stockholders.
CMS Energy
The reportable segments for CMS Energy are:
· electric utility, consisting of regulated activities associated with the generation, transmission, and distribution of electricity in Michigan
· gas utility, consisting of regulated activities associated with the transportation, storage, and distribution of natural gas in Michigan
· enterprises, consisting of various subsidiaries engaging primarily in domestic independent power production
CMS Energy presents EnerBank and corporate interest and other expenses within other reconciling items.
Consumers
The reportable segments for Consumers are:
· electric utility, consisting of regulated activities associated with the generation, transmission, and distribution of electricity in Michigan
· gas utility, consisting of regulated activities associated with the transportation, storage, and distribution of natural gas in Michigan
Consumers’ other consolidated entities are presented within other reconciling items.
Presented in the following tables is financial information by reportable segment:
|
|
|
|
|
|
|
| In Millions |
|
|
|
| In Millions |
| ||||||
|
| Three Months Ended |
| Nine Months Ended |
| |||||||||||||||
September 30 |
| 2016 |
| 2015 |
| 2016 |
| 2015 |
| |||||||||||
Three Months Ended March 31 |
| 2017 |
| 2016 |
| |||||||||||||||
CMS Energy, including Consumers |
|
|
|
|
|
|
|
|
|
|
|
|
|
| ||||||
Operating revenue |
|
|
|
|
|
|
|
|
|
|
|
|
|
| ||||||
Electric utility |
| $ | 1,313 |
| $ | 1,233 |
| $ | 3,348 |
| $ | 3,273 |
|
| $ | 1,036 |
| $ | 1,013 |
|
Gas utility |
| 185 |
| 184 |
| 1,166 |
| 1,453 |
|
| 701 |
| 710 |
| ||||||
Enterprises |
| 59 |
| 43 |
| 156 |
| 148 |
|
| 59 |
| 48 |
| ||||||
Other reconciling items |
| 30 |
| 26 |
| 89 |
| 73 |
|
| 33 |
| 30 |
| ||||||
Total operating revenue – CMS Energy |
| $ | 1,587 |
| $ | 1,486 |
| $ | 4,759 |
| $ | 4,947 |
|
| $ | 1,829 |
| $ | 1,801 |
|
Consumers |
|
|
|
|
|
|
|
|
|
|
|
|
|
| ||||||
Operating revenue |
|
|
|
|
|
|
|
|
|
|
|
|
|
| ||||||
Electric utility |
| $ | 1,313 |
| $ | 1,233 |
| $ | 3,348 |
| $ | 3,273 |
|
| $ | 1,036 |
| $ | 1,013 |
|
Gas utility |
| 185 |
| 184 |
| 1,166 |
| 1,453 |
|
| 701 |
| 710 |
| ||||||
Total operating revenue – Consumers |
| $ | 1,498 |
| $ | 1,417 |
| $ | 4,514 |
| $ | 4,726 |
|
| $ | 1,737 |
| $ | 1,723 |
|
CMS Energy, including Consumers |
|
|
|
|
|
|
|
|
|
|
|
|
|
| ||||||
Net income (loss) available to common stockholders |
|
|
|
|
|
|
|
|
|
|
|
|
|
| ||||||
Electric utility |
| $ | 191 |
| $ | 166 |
| $ | 395 |
| $ | 342 |
|
| $ | 124 |
| $ | 91 |
|
Gas utility |
| 3 |
| (7) |
| 102 |
| 115 |
|
| 87 |
| 81 |
| ||||||
Enterprises |
| 8 |
| 3 |
| 17 |
| 10 |
|
| 12 |
| 6 |
| ||||||
Other reconciling items |
| (16 | ) | (14) |
| (40 | ) | (50 | ) |
| (24 | ) | (14 | ) | ||||||
Total net income available to common stockholders – CMS Energy |
| $ | 186 |
| $ | 148 |
| $ | 474 |
| $ | 417 |
|
| $ | 199 |
| $ | 164 |
|
Consumers |
|
|
|
|
|
|
|
|
|
|
|
|
|
| ||||||
Net income (loss) available to common stockholder |
|
|
|
|
|
|
|
|
| |||||||||||
Net income available to common stockholder |
|
|
|
|
| |||||||||||||||
Electric utility |
| $ | 191 |
| $ | 166 |
| $ | 395 |
| $ | 342 |
|
| $ | 124 |
| $ | 91 |
|
Gas utility |
| 3 |
| (7) |
| 102 |
| 115 |
|
| 87 |
| 81 |
| ||||||
Other reconciling items |
| 1 |
|
| 1 |
| 1 |
|
| 1 |
| |||||||||
Total net income available to common stockholder – Consumers |
| $ | 195 |
| $ | 160 |
| $ | 498 |
| $ | 458 |
|
| $ | 211 |
| $ | 172 |
|
|
|
|
| In Millions |
|
|
|
| In Millions |
| ||||
|
| September 30, 2016 |
| December 31, 2015 |
|
| March 31, 2017 |
| December 31, 2016 |
| ||||
CMS Energy, including Consumers |
|
|
|
|
|
|
|
|
|
| ||||
Plant, property, and equipment, gross |
|
|
|
|
|
|
|
|
|
| ||||
Electric utility1 |
| $ | 14,396 |
| $ | 13,059 |
|
| $ | 14,715 |
| $ | 14,540 |
|
Gas utility1 |
| 6,117 |
| 5,723 |
|
| 6,362 |
| 6,283 |
| ||||
Enterprises |
| 158 |
| 120 |
|
| 158 |
| 157 |
| ||||
Other reconciling items |
| 27 |
| 41 |
|
| 30 |
| 30 |
| ||||
Total plant, property, and equipment, gross – CMS Energy |
| $ | 20,698 |
| $ | 18,943 |
|
| $ | 21,265 |
| $ | 21,010 |
|
Consumers |
|
|
|
|
|
|
|
|
|
| ||||
Plant, property, and equipment, gross |
|
|
|
|
|
|
|
|
|
| ||||
Electric utility1 |
| $ | 14,396 |
| $ | 13,059 |
|
| $ | 14,715 |
| $ | 14,540 |
|
Gas utility1 |
| 6,117 |
| 5,723 |
|
| 6,362 |
| 6,283 |
| ||||
Other reconciling items |
| 15 |
| 15 |
|
| 15 |
| 15 |
| ||||
Total plant, property, and equipment, gross – Consumers |
| $ | 20,528 |
| $ | 18,797 |
|
| $ | 21,092 |
| $ | 20,838 |
|
CMS Energy, including Consumers |
|
|
|
|
|
|
|
|
|
| ||||
Total assets |
|
|
|
|
|
|
|
|
|
| ||||
Electric utility1 |
| $ | 12,892 |
| $ | 12,660 |
|
| $ | 13,653 |
| $ | 13,429 |
|
Gas utility1 |
| 6,033 |
| 5,912 |
|
| 6,131 |
| 6,446 |
| ||||
Enterprises |
| 273 |
| 270 |
|
| 269 |
| 269 |
| ||||
Other reconciling items |
| 1,644 |
| 1,457 |
|
| 1,570 |
| 1,478 |
| ||||
Total assets – CMS Energy2 |
| $ | 20,842 |
| $ | 20,299 |
| |||||||
Total assets – CMS Energy |
| $ | 21,623 |
| $ | 21,622 |
| |||||||
Consumers |
|
|
|
|
|
|
|
|
|
| ||||
Total assets |
|
|
|
|
|
|
|
|
|
| ||||
Electric utility1 |
| $ | 12,892 |
| $ | 12,660 |
|
| $ | 13,656 |
| $ | 13,430 |
|
Gas utility1 |
| 6,033 |
| 5,912 |
|
| 6,131 |
| 6,446 |
| ||||
Other reconciling items |
| 55 |
| 63 |
|
| 37 |
| 70 |
| ||||
Total assets – Consumers2 |
| $ | 18,980 |
| $ | 18,635 |
| |||||||
Total assets – Consumers |
| $ | 19,824 |
| $ | 19,946 |
| |||||||
1 Amounts include a portion of Consumers’ other common assets attributable to both the electric and gas utility businesses.
2 CMS Energy and Consumers changed the reporting of debt issuance costs on their consolidated balance sheets in accordance with ASU 2015-03, Simplifying the Presentation of Debt Issuance Costs, as of January 1, 2016, and retrospectively adjusted prior-period amounts for comparability. For further details on the implementation of this standard, see Note 1, New Accounting Standards.
Item 2.Management’s Discussion and Analysis of Financial Condition and Results of Operations
Management’s discussion and analysis of financial condition and results of operations for CMS Energy and Consumers is contained in Part I—Item 1. Financial Statements—MD&A, which is incorporated by reference herein.
Item 3.Quantitative and Qualitative Disclosures About Market Risk
There have been no material changes to market risk as previously disclosed in Part II—Item 7A. Quantitative and Qualitative Disclosures About Market Risk, in the 20152016 Form 10-K.
Item 4.Controls and Procedures
CMS ENERGY
Disclosure Controls and Procedures: CMS Energy’s management, with the participation of its CEO and CFO, has evaluated the effectiveness of its disclosure controls and procedures (as such term is defined in Rules 13a-15(e) and 15d-15(e) under the Exchange Act) as of the end of the period covered by this report. Based on such evaluation, CMS Energy’s CEO and CFO have concluded that, as of the end of such period, its disclosure controls and procedures are effective.
Internal Control Over Financial Reporting: There have not been any changes in CMS Energy’s internal control over financial reporting (as such term is defined in Rules 13a-15(f) and 15d-15(f) under the Exchange Act) during the last fiscal quarter that have materially affected, or are reasonably likely to materially affect, its internal control over financial reporting.
CONSUMERS
Disclosure Controls and Procedures: Consumers’ management, with the participation of its CEO and CFO, has evaluated the effectiveness of its disclosure controls and procedures (as such term is defined in Rules 13a-15(e) and 15d-15(e) under the Exchange Act) as of the end of the period covered by this report. Based on such evaluation, Consumers’ CEO and CFO have concluded that, as of the end of such period, its disclosure controls and procedures are effective.
Internal Control Over Financial Reporting: There have not been any changes in Consumers’ internal control over financial reporting (as such term is defined in Rules 13a-15(f) and 15d-15(f) under the Exchange Act) during the last fiscal quarter that have materially affected, or are reasonably likely to materially affect, its internal control over financial reporting.
CMS Energy, Consumers, and certain of their affiliates are parties to various lawsuits and regulatory matters in the ordinary course of business. For information regarding material legal proceedings, including updates to information reported under Part I—Item 3. Legal Proceedings, of the 20152016 Form 10-K, see Part I—Item 1. Financial Statements—Notes to the Unaudited Consolidated Financial Statements—Note 2, Regulatory Matters and Note 3, Contingencies and Commitments.
There have been no material changes to the Risk Factors as previously disclosed in Part I—Item 1A. Risk Factors, in the 20152016 Form 10-K, which Risk Factors are incorporated herein by reference.
Item 2.Unregistered Sales of Equity Securities and Use of Proceeds
UNREGISTERED SALES OF EQUITY SECURITIES
None.
ISSUER REPURCHASES OF EQUITY SECURITIES
Presented in the following table are CMS Energy’s repurchases of equity securities for the three months ended September 30, 2016:March 31, 2017:
|
|
|
|
|
|
|
|
|
|
|
|
|
|
|
| Total Number of |
| Maximum Number of |
|
|
|
|
|
|
| Shares Purchased as |
| Shares That May Yet Be |
|
|
| Total Number |
| Average |
| Part of Publicly |
| Purchased Under Publicly |
|
|
| of Shares |
| Price Paid |
| Announced Plans or |
| Announced Plans or |
|
Period |
| Purchased1 |
| per Share |
| Programs |
| Programs |
|
July 1, 2016 to |
|
|
|
|
|
|
|
|
|
July 31, 2016 |
| 18,112 |
| $ 45.62 |
| - |
| - |
|
August 1, 2016 to |
|
|
|
|
|
|
|
|
|
August 31, 2016 |
| - |
| - |
| - |
| - |
|
September 1, 2016 to |
|
|
|
|
|
|
|
|
|
September 30, 2016 |
| 1,061 |
| 42.20 |
| - |
| - |
|
Total |
| 19,173 |
| $ 45.43 |
| - |
| - |
|
Period |
| Total Number |
| Average |
| Total Number of |
| Maximum Number of |
| |
January 1, 2017 to |
|
|
|
|
|
|
|
|
| |
January 31, 2017 |
| 176,572 |
| $ | 42.29 |
| - |
| - |
|
February 1, 2017 to |
|
|
|
|
|
|
|
|
| |
February 28, 2017 |
| 741 |
| 42.62 |
| - |
| - |
| |
March 1, 2017 to |
|
|
|
|
|
|
|
|
| |
March 31, 2017 |
| 103,594 |
| 45.01 |
| - |
| - |
| |
Total |
| 280,907 |
| $ | 43.29 |
| - |
| - |
|
1 All of the common shares were repurchased to satisfy the minimum statutory income tax withholding obligation for common shares that have vested under the Performance Incentive Stock Plan. The value of shares repurchased is based on the market price on the vesting date.
Item 3.Defaults Upon Senior Securities
None.
Item 4.Mine Safety Disclosures
Not applicable.
None.On April 25, 2017, CMS Energy and JPMorgan Chase Bank, N.A., in its capacity as agent (the “Agent”) for itself and the other financial institutions (the “Banks”) named in the $180 million unsecured Term Loan Credit Agreement dated June 11, 2015 between CMS Energy, the Banks, and the Agent (the “Agreement”), agreed to extend the maturity date of the term loans made thereunder. The Agreement was previously filed as Exhibit 10.1 to the Form 8-K filed June 16, 2015 and is incorporated herein by reference. Subject to the terms of the Agreement, effective as of April 25, 2017, the maturity date will extend for a period of one year to April 25, 2019.
The Banks have provided banking and underwriting services to CMS Energy in the ordinary course of business.
See CMS Energy’s and Consumers’ Exhibit Index included as the last part of this report, which is incorporated herein by reference.
Pursuant to the requirements of the Securities Exchange Act of 1934, each registrant has duly caused this report to be signed on its behalf by the undersigned thereunto duly authorized. The signature for each undersigned company shall be deemed to relate only to matters having reference to such company or its subsidiary.
|
| CMS ENERGY CORPORATION |
|
|
|
Dated: | By: | /s/ Thomas J. Webb |
|
| |
Thomas J. Webb | ||
|
| Executive Vice President and Chief Financial Officer |
|
|
|
|
|
|
|
| CONSUMERS ENERGY COMPANY |
|
|
|
Dated: | By: | /s/ Thomas J. Webb |
|
| Thomas J. Webb |
|
| |
Executive Vice President and Chief Financial Officer |
(This page intentionally left blank)
EXHIBITS