| Large accelerated filer | ☒ | Accelerated filer | ☐ | |||||||||||
Non-accelerated filer | ☐ | Smaller reporting company | ☐ | |||||||||||
| Emerging growth company | ☐ | |||||||||||||
| Title of each class | Outstanding at | Trading Symbol | Name of each exchange on which registered | |||||||||||||||||
Common Stock, $0.001 par value per share |
| SUPN | The Nasdaq Global Market | |||||||||||||||||
| |||||
| Page No. | |||||
| |||||
| |||||
| |||||
| |||||
| |||||
| |||||
| |||||
| |||||
| |||||
| |||||
| |||||
|
| March 31, |
| December 31, |
| ||
|
| 2019 |
| 2018 |
| ||
|
| (unaudited) |
|
|
| ||
Assets |
|
|
|
|
| ||
Current assets |
|
|
|
|
| ||
Cash and cash equivalents |
| $ | 122,778 |
| $ | 192,248 |
|
Marketable securities |
| 170,165 |
| 163,770 |
| ||
Accounts receivable, net |
| 79,950 |
| 102,922 |
| ||
Inventories, net |
| 26,518 |
| 25,659 |
| ||
Prepaid expenses and other current assets |
| 20,556 |
| 8,888 |
| ||
Total current assets |
| 419,967 |
| 493,487 |
| ||
Long term marketable securities |
| 522,551 |
| 418,798 |
| ||
Property and equipment, net |
| 4,226 |
| 4,095 |
| ||
Intangible assets, net |
| 30,063 |
| 31,368 |
| ||
Lease assets |
| 20,049 |
| — |
| ||
Deferred income taxes |
| 27,967 |
| 29,683 |
| ||
Other assets |
| 625 |
| 380 |
| ||
|
|
|
|
|
| ||
Total assets |
| $ | 1,025,448 |
| $ | 977,811 |
|
|
|
|
|
|
| ||
Liabilities and stockholders’ equity |
|
|
|
|
| ||
Current liabilities |
|
|
|
|
| ||
Accounts payable |
| $ | 7,240 |
| $ | 3,195 |
|
Accrued product returns and rebates |
| 88,200 |
| 107,063 |
| ||
Accrued expenses and other current liabilities |
| 36,607 |
| 36,535 |
| ||
Income taxes payable |
| 17,233 |
| 12,377 |
| ||
Non-recourse liability related to sale of future royalties, current portion |
| 2,426 |
| 2,183 |
| ||
Total current liabilities |
| 151,706 |
| 161,353 |
| ||
Convertible notes, net |
| 333,310 |
| 329,462 |
| ||
Non-recourse liability related to sale of future royalties, long term |
| 21,957 |
| 22,575 |
| ||
Lease liabilities, long term |
| 27,824 |
| — |
| ||
Other non-current liabilities |
| 10,633 |
| 11,398 |
| ||
Total liabilities |
| 545,430 |
| 524,788 |
| ||
|
|
|
|
|
| ||
Stockholders’ equity |
|
|
|
|
| ||
Common stock, $0.001 par value, 130,000,000 shares authorized 52,374,248 and 52,316,583 shares issued and outstanding as of March 31, 2019 and December 31, 2018, respectively |
| 52 |
| 52 |
| ||
Additional paid-in capital |
| 373,707 |
| 369,637 |
| ||
Accumulated other comprehensive earnings (loss), net of tax |
| 1,427 |
| (3,158 | ) | ||
Retained earnings |
| 104,832 |
| 86,492 |
| ||
Total stockholders’ equity |
| 480,018 |
| 453,023 |
| ||
|
|
|
|
|
| ||
Total liabilities and stockholders’ equity |
| $ | 1,025,448 |
| $ | 977,811 |
|
data)
| March 31, | December 31, | ||||||||||
| 2020 | 2019 | ||||||||||
| (unaudited) | |||||||||||
| Assets | |||||||||||
| Current assets | |||||||||||
| Cash and cash equivalents | $ | 225,767 | $ | 181,381 | |||||||
| Marketable securities | 175,104 | 165,692 | |||||||||
| Accounts receivable, net | 119,195 | 87,332 | |||||||||
| Inventories, net | 24,418 | 26,628 | |||||||||
| Prepaid expenses and other current assets | 12,564 | 11,611 | |||||||||
| Total current assets | 557,048 | 472,644 | |||||||||
| Long term marketable securities | 534,712 | 591,773 | |||||||||
| Property and equipment, net | 18,011 | 17,068 | |||||||||
| Intangible assets, net | 23,579 | 24,840 | |||||||||
| Lease assets | 21,911 | 21,279 | |||||||||
| Deferred income taxes | 34,067 | 32,063 | |||||||||
| Other assets | 538 | 615 | |||||||||
| Total assets | $ | 1,189,866 | $ | 1,160,282 | |||||||
| Liabilities and stockholders’ equity | |||||||||||
| Current liabilities | |||||||||||
| Accounts payable | $ | 3,124 | $ | 10,141 | |||||||
| Accrued product returns and rebates | 119,453 | 107,629 | |||||||||
| Accrued expenses and other current liabilities | 33,003 | 37,130 | |||||||||
| Income taxes payable | 9,097 | 2,443 | |||||||||
| Nonrecourse liability related to sale of future royalties, current portion | 3,658 | 3,244 | |||||||||
| Total current liabilities | 168,335 | 160,587 | |||||||||
| Convertible notes, net | 349,232 | 345,170 | |||||||||
| Nonrecourse liability related to sale of future royalties, long term | 18,369 | 19,248 | |||||||||
| Lease liabilities, long term | 30,804 | 30,440 | |||||||||
| Other liabilities | 9,743 | 9,409 | |||||||||
| Total liabilities | 576,483 | 564,854 | |||||||||
| Stockholders’ equity | |||||||||||
| Common stock, $0.001 par value; 130,000,000 shares authorized; 52,537,159 and 52,533,348 shares issued and outstanding as of March 31, 2020 and December 31, 2019, respectively | 53 | 53 | |||||||||
| Additional paid-in capital | 392,430 | 388,410 | |||||||||
| Accumulated other comprehensive earnings (loss), net of tax | (166) | 7,417 | |||||||||
| Retained earnings | 221,066 | 199,548 | |||||||||
| Total stockholders’ equity | 613,383 | 595,428 | |||||||||
| Total liabilities and stockholders’ equity | $ | 1,189,866 | $ | 1,160,282 | |||||||
|
| Three Months ended March 31, |
| ||||
|
| 2019 |
| 2018 |
| ||
|
| (unaudited) |
| ||||
|
|
|
|
|
| ||
Revenues |
|
|
|
|
| ||
Net product sales |
| $ | 83,099 |
| $ | 89,120 |
|
Royalty revenues |
| 2,375 |
| 1,309 |
| ||
Total revenues |
| 85,474 |
| 90,429 |
| ||
|
|
|
|
|
| ||
Costs and expenses |
|
|
|
|
| ||
Cost of product sales |
| 3,684 |
| 3,278 |
| ||
Research and development |
| 15,394 |
| 18,908 |
| ||
Selling, general and administrative |
| 40,968 |
| 36,849 |
| ||
|
|
|
|
|
| ||
Total costs and expenses |
| 60,046 |
| 59,035 |
| ||
|
|
|
|
|
| ||
Operating earnings |
| 25,428 |
| 31,394 |
| ||
|
|
|
|
|
| ||
Other expenses, net |
| (1,189 | ) | (212 | ) | ||
|
|
|
|
|
| ||
Earnings before income taxes |
| 24,239 |
| 31,182 |
| ||
|
|
|
|
|
| ||
Income tax expense |
| 5,899 |
| 4,830 |
| ||
Net earnings |
| $ | 18,340 |
| $ | 26,352 |
|
|
|
|
|
|
| ||
Earnings per share |
|
|
|
|
| ||
Basic |
| $ | 0.35 |
| $ | 0.51 |
|
Diluted |
| $ | 0.34 |
| $ | 0.49 |
|
|
|
|
|
|
| ||
Weighted-average shares outstanding |
|
|
|
|
| ||
Basic |
| 52,336,443 |
| 51,536,474 |
| ||
Diluted |
| 53,985,385 |
| 53,788,346 |
| ||
| Three Months ended March 31, | |||||||||||||||||||||||||||||
| 2020 | 2019 | ||||||||||||||||||||||||||||
| (unaudited) | |||||||||||||||||||||||||||||
| Revenues | |||||||||||||||||||||||||||||
| Net product sales | $ | 92,490 | $ | 83,099 | |||||||||||||||||||||||||
| Royalty revenues | 2,486 | 2,375 | |||||||||||||||||||||||||||
| Total revenues | 94,976 | 85,474 | |||||||||||||||||||||||||||
| Costs and expenses | |||||||||||||||||||||||||||||
| Cost of goods sold | 4,152 | 3,684 | |||||||||||||||||||||||||||
| Research and development | 18,937 | 15,394 | |||||||||||||||||||||||||||
| Selling, general and administrative | 42,875 | 40,968 | |||||||||||||||||||||||||||
| Total costs and expenses | 65,964 | 60,046 | |||||||||||||||||||||||||||
| Operating earnings | 29,012 | 25,428 | |||||||||||||||||||||||||||
| Other income (expense) | |||||||||||||||||||||||||||||
| Interest expense | (5,755) | (5,870) | |||||||||||||||||||||||||||
| Interest income, net | 5,777 | 4,681 | |||||||||||||||||||||||||||
| Total other income (expense) | 22 | (1,189) | |||||||||||||||||||||||||||
| Earnings before income taxes | 29,034 | 24,239 | |||||||||||||||||||||||||||
| Income tax expense | 7,516 | 5,899 | |||||||||||||||||||||||||||
| Net earnings | $ | 21,518 | $ | 18,340 | |||||||||||||||||||||||||
| Earnings per share | |||||||||||||||||||||||||||||
| Basic | $ | 0.41 | $ | 0.35 | |||||||||||||||||||||||||
| Diluted | $ | 0.40 | $ | 0.34 | |||||||||||||||||||||||||
| Weighted-average shares outstanding | |||||||||||||||||||||||||||||
| Basic | 52,534,787 | 52,336,443 | |||||||||||||||||||||||||||
| Diluted | 53,581,051 | 53,985,385 | |||||||||||||||||||||||||||
|
| Three Months ended March 31, |
| ||||
|
| 2019 |
| 2018 |
| ||
|
| (unaudited) |
| ||||
|
|
|
|
|
| ||
Net earnings |
| $ | 18,340 |
| $ | 26,352 |
|
Other comprehensive earnings (loss) |
|
|
|
|
| ||
Unrealized gain (loss) on marketable securities, net of tax |
| 4,585 |
| (1,544 | ) | ||
Other comprehensive earnings (loss) |
| 4,585 |
| (1,544 | ) | ||
|
|
|
|
|
| ||
Comprehensive earnings |
| $ | 22,925 |
| $ | 24,808 |
|
| Three Months ended March 31, | |||||||||||||||||||||||||||||
| 2020 | 2019 | ||||||||||||||||||||||||||||
| (unaudited) | |||||||||||||||||||||||||||||
| Net earnings | $ | 21,518 | $ | 18,340 | |||||||||||||||||||||||||
| Other comprehensive (loss) earnings | |||||||||||||||||||||||||||||
| Unrealized (loss) gain on marketable securities, net of tax | (7,583) | 4,585 | |||||||||||||||||||||||||||
| Other comprehensive (loss) earnings | (7,583) | 4,585 | |||||||||||||||||||||||||||
| Comprehensive earnings | $ | 13,935 | $ | 22,925 | |||||||||||||||||||||||||
2019
|
| Common Stock |
| Additional |
| Accumulated Other |
| Retained |
| Total |
| |||||||
|
| Shares |
| Amount |
| Paid-in Capital |
| Earnings (Loss) |
| Earnings |
| Equity |
| |||||
|
|
|
|
|
|
|
|
|
|
|
|
|
| |||||
Balance, December 31, 2018 |
| 52,316,583 |
| $ | 52 |
| $ | 369,637 |
| $ | (3,158 | ) | $ | 86,492 |
| $ | 453,023 |
|
Share-based compensation |
| — |
| — |
| 3,287 |
| — |
| — |
| 3,287 |
| |||||
Exercise of stock options |
| 57,665 |
| — |
| 783 |
| — |
| — |
| 783 |
| |||||
Net earnings |
| — |
| — |
| — |
| — |
| 18,340 |
| 18,340 |
| |||||
Unrealized gains on marketable securities, net of tax |
| — |
| — |
| — |
| 4,585 |
| — |
| 4,585 |
| |||||
Balance, March 31, 2019 |
| 52,374,248 |
| $ | 52 |
| $ | 373,707 |
| $ | 1,427 |
| $ | 104,832 |
| $ | 480,018 |
|
|
| Common Stock |
| Additional |
| Accumulated Other |
| Retained |
| Total |
| |||||||
|
| Shares |
| Amount |
| Paid-in Capital |
| Loss |
| Deficit) |
| Equity |
| |||||
|
|
|
|
|
|
|
|
|
|
|
|
|
| |||||
Balance, December 31, 2017 |
| 51,314,850 |
| $ | 51 |
| $ | 294,999 |
| $ | (747 | ) | $ | (26,823 | ) | $ | 267,480 |
|
Cumulative-effect of adoption of ASC 606 |
| — |
| — |
| — |
| — |
| 2,322 |
| 2,322 |
| |||||
Balance, January 1, 2018 |
| 51,314,850 |
| 51 |
| 294,999 |
| (747 | ) | (24,501 | ) | 269,802 |
| |||||
Share-based compensation |
| — |
| — |
| 2,635 |
| — |
| — |
| 2,635 |
| |||||
Exercise of stock options |
| 319,141 |
| 1 |
| 2,857 |
| — |
| — |
| 2,858 |
| |||||
Equity component of convertible notes, net of tax |
| — |
| — |
| 56,215 |
| — |
| — |
| 56,215 |
| |||||
Purchase of convertible note hedges, net of tax |
| — |
| — |
| (70,137 | ) | — |
| — |
| (70,137 | ) | |||||
Issuance of warrants |
| — |
| — |
| 65,688 |
| — |
| — |
| 65,688 |
| |||||
Net earnings |
| — |
| — |
| — |
| — |
| 26,352 |
| 26,352 |
| |||||
Unrealized loss on marketable securities, net of tax |
| — |
| — |
| — |
| (1,544 | ) | — |
| (1,544 | ) | |||||
Balance, March 31, 2018 |
| 51,633,991 |
| $ | 52 |
| $ | 352,257 |
| $ | (2,291 | ) | $ | 1,851 |
| $ | 351,869 |
|
| j | Common Stock | Additional Paid-in Capital | Accumulated Other Comprehensive Earnings (Loss) | Retained Earnings | Total Stockholders’ Equity | ||||||||||||||||||||||||||||||||||||
| Shares | Amount | ||||||||||||||||||||||||||||||||||||||||
| Balance, December 31, 2019 | 52,533,348 | $ | 53 | $ | 388,410 | $ | 7,417 | $ | 199,548 | $ | 595,428 | ||||||||||||||||||||||||||||||
| Share-based compensation | — | — | 3,988 | — | — | 3,988 | |||||||||||||||||||||||||||||||||||
| Exercise of stock options | 3,811 | — | 32 | — | — | 32 | |||||||||||||||||||||||||||||||||||
| Net earnings | — | — | — | — | 21,518 | 21,518 | |||||||||||||||||||||||||||||||||||
| Unrealized loss on marketable securities, net of tax | — | — | — | (7,583) | — | (7,583) | |||||||||||||||||||||||||||||||||||
| Balance, March 31, 2020 | 52,537,159 | $ | 53 | $ | 392,430 | $ | (166) | $ | 221,066 | $ | 613,383 | ||||||||||||||||||||||||||||||
| Common Stock | Additional Paid-in Capital | Accumulated Other Comprehensive Earnings (Loss) | Retained Earnings | Total Stockholders’ Equity | |||||||||||||||||||||||||||||||||||||
| Shares | Amount | ||||||||||||||||||||||||||||||||||||||||
| Balance, December 31, 2018 | 52,316,583 | $ | 52 | $ | 369,637 | $ | (3,158) | $ | 86,492 | $ | 453,023 | ||||||||||||||||||||||||||||||
| Share-based compensation | — | — | 3,287 | — | — | 3,287 | |||||||||||||||||||||||||||||||||||
| Exercise of stock options | 57,665 | — | 783 | — | — | 783 | |||||||||||||||||||||||||||||||||||
| Net earnings | — | — | — | — | 18,340 | 18,340 | |||||||||||||||||||||||||||||||||||
| Unrealized gain on marketable securities, net of tax | — | — | — | 4,585 | — | 4,585 | |||||||||||||||||||||||||||||||||||
| Balance, March 31, 2019 | 52,374,248 | $ | 52 | $ | 373,707 | $ | 1,427 | $ | 104,832 | $ | 480,018 | ||||||||||||||||||||||||||||||
|
| Three Months ended March 31, |
| ||||
|
| 2019 |
| 2018 |
| ||
|
| (unaudited) |
| ||||
Cash flows from operating activities |
|
|
|
|
| ||
Net earnings |
| $ | 18,340 |
| $ | 26,352 |
|
|
|
|
|
|
| ||
Adjustments to reconcile net earnings to net cash provided by operating activities: |
|
|
|
|
| ||
Realized loss on sales of securities |
| (8 | ) | — |
| ||
Depreciation and amortization |
| 1,679 |
| 1,707 |
| ||
Amortization of operating lease assets |
| 879 |
| — |
| ||
Amortization of deferred financing costs and debt discount |
| 3,848 |
| 612 |
| ||
Amortization of premium/discount on marketable securities |
| (1,094 | ) | 89 |
| ||
Non-cash interest expense |
| 1,437 |
| 701 |
| ||
Non-cash royalty revenue |
| (1,576 | ) | (1,300 | ) | ||
Share-based compensation expense |
| 3,287 |
| 2,635 |
| ||
Deferred income tax (benefit) provision |
| 279 |
| (1,120 | ) | ||
Changes in operating assets and liabilities: |
|
|
|
|
| ||
Accounts receivable |
| 23,013 |
| (798 | ) | ||
Inventories |
| (859 | ) | (2,771 | ) | ||
Prepaid expenses and other current assets |
| (1,799 | ) | (62 | ) | ||
Other non-current assets |
| (196 | ) | (342 | ) | ||
Accounts payable |
| 4,045 |
| (3,440 | ) | ||
Accrued product returns and rebates |
| (18,863 | ) | 4,691 |
| ||
Accrued expenses and other current liabilities |
| (3,177 | ) | (1,132 | ) | ||
Income taxes payable |
| 4,856 |
| 327 |
| ||
Other non-current liabilities |
| (1,098 | ) | 984 |
| ||
Net cash provided by operating activities |
| 32,993 |
| 27,133 |
| ||
|
|
|
|
|
| ||
Cash flows from investing activities |
|
|
|
|
| ||
Purchases of marketable securities |
| (150,167 | ) | (57,757 | ) | ||
Sales and maturities of marketable securities |
| 47,143 |
| 7,343 |
| ||
Purchases of property and equipment |
| (221 | ) | (253 | ) | ||
Deferred legal fees |
| (1 | ) | (343 | ) | ||
Net cash used in investing activities |
| (103,246 | ) | (51,010 | ) | ||
|
|
|
|
|
| ||
Cash flows from financing activities |
|
|
|
|
| ||
Proceeds from issuance of convertible notes |
| — |
| 402,500 |
| ||
Convertible notes issuance financing costs |
| — |
| (10,435 | ) | ||
Proceeds from issuance of warrants |
| — |
| 65,688 |
| ||
Purchases of convertible note hedges |
| — |
| (92,897 | ) | ||
Proceeds from issuance of common stock |
| 783 |
| 2,857 |
| ||
Net cash provided by financing activities |
| 783 |
| 367,713 |
| ||
|
|
|
|
|
| ||
Net change in cash and cash equivalents |
| (69,470 | ) | 343,836 |
| ||
Cash and cash equivalents at beginning of year |
| 192,248 |
| 100,304 |
| ||
Cash and cash equivalents at end of period |
| $ | 122,778 |
| $ | 444,140 |
|
|
|
|
|
|
| ||
Supplemental cash flow information |
|
|
|
|
| ||
Cash paid for interest on convertible notes |
| $ | 1,258 |
| $ | — |
|
Income taxes paid |
| $ | 800 |
| $ | 5,623 |
|
Cash paid for amounts included in the measurement of lease liabilities |
|
|
|
|
| ||
Operating cash flows from operating leases |
| $ | 1,313 |
| $ | 1,385 |
|
|
|
|
|
|
| ||
Non-cash investing and financing activities |
|
|
|
|
| ||
Deferred legal fees included in accounts payable and accrued expenses |
| $ | 250 |
| $ | 304 |
|
Lease assets and tenant receivable obtained for new operating leases |
| $ | 17,136 |
| $ | — |
|
| Three Months ended March 31, | |||||||||||||||||
| 2020 | 2019 | ||||||||||||||||
| (unaudited) | |||||||||||||||||
| Cash flows from operating activities | |||||||||||||||||
| Net earnings | $ | 21,518 | $ | 18,340 | |||||||||||||
| Adjustments to reconcile net earnings to net cash provided by operating activities: | |||||||||||||||||
| Share-based compensation expense | 3,988 | 3,287 | |||||||||||||||
| Depreciation and amortization | 1,732 | 1,679 | |||||||||||||||
| Amortization of premium/discount on marketable securities | (451) | (1,102) | |||||||||||||||
| Amortization of deferred financing costs and debt discount | 4,061 | 3,848 | |||||||||||||||
| Noncash interest expense | 1,366 | 1,437 | |||||||||||||||
| Noncash royalty revenue | (1,567) | (1,576) | |||||||||||||||
| Noncash operating lease cost | 991 | 879 | |||||||||||||||
| Deferred income tax benefit | 538 | 279 | |||||||||||||||
| Changes in operating assets and liabilities: | |||||||||||||||||
| Accounts receivable | (31,823) | 23,013 | |||||||||||||||
| Inventories | 2,210 | (859) | |||||||||||||||
| Prepaid expenses and other current assets | (454) | (1,799) | |||||||||||||||
| Other noncurrent assets | — | (196) | |||||||||||||||
| Accounts payable | (7,017) | 4,045 | |||||||||||||||
| Accrued product returns and rebates | 11,824 | (18,863) | |||||||||||||||
| Accrued expenses and other current liabilities | (3,634) | (3,177) | |||||||||||||||
| Income taxes payable | 6,654 | 4,856 | |||||||||||||||
| Other liabilities | (1,020) | (1,098) | |||||||||||||||
| Net cash provided by operating activities | 8,916 | 32,993 | |||||||||||||||
| Cash flows from investing activities | |||||||||||||||||
| Purchases of marketable securities | (15,382) | (150,167) | |||||||||||||||
| Sales and maturities of marketable securities | 53,357 | 47,143 | |||||||||||||||
| Purchases of property and equipment | (2,537) | (221) | |||||||||||||||
| Deferred legal fees | — | (1) | |||||||||||||||
| Net cash provided by (used in) investing activities | 35,438 | (103,246) | |||||||||||||||
| Cash flows from financing activities | |||||||||||||||||
| Proceeds from issuance of common stock | 32 | 783 | |||||||||||||||
| Net cash provided by financing activities | 32 | 783 | |||||||||||||||
| Net change in cash and cash equivalents | 44,386 | (69,470) | |||||||||||||||
| Cash and cash equivalents at beginning of year | 181,381 | 192,248 | |||||||||||||||
| Cash and cash equivalents at end of period | $ | 225,767 | $ | 122,778 | |||||||||||||
| Supplemental cash flow information | |||||||||||||||||
| Cash paid for interest on convertible notes | $ | 1,258 | $ | 1,258 | |||||||||||||
| Income taxes paid | $ | 324 | $ | 800 | |||||||||||||
| Noncash investing and financing activities | |||||||||||||||||
| Deferred legal fees and fixed assets included in accounts payable and accrued expenses | $ | 708 | $ | 250 | |||||||||||||
| Property and equipment additions from utilization of tenant improvement allowance | $ | — | $ | 282 | |||||||||||||
significant unmet medical needs and market opportunities.
Revenue Recognition
There were no contract assets or liabilities recorded as of March 31, 2019.
other adverse factors.
The Company’s products are distributed through a third party fulfillment center.
Customer orders are generally fulfilled within a few days of receipt, resulting in minimal order backlog. The Company does not adjust revenue for any financing effects, in transactions where the Company expects the period between the transfer of the goods or services and collection to be less than one year. There are no minimum product purchase requirements with customers.
Variabilitydiscounts. These are collectively considered "sales deductions."
are recorded.
Sales deductions are primarily comprised of rebates, product returns and sales discounts.
·
Both types of rebates vary over time.
Becausepharmacies, but as of the end of the reporting period, from the date on which the prescription is filledthis product has not been dispensed to the date the Company receives and pays the invoice varies, thea patient.
The sensitivity of the Company’s estimates can vary by program and by type of customer. If actual rebates vary from estimated amounts, the Company may need to adjust the balances of such accrued rebates to reflect actual expenditures with respect to these programs. These changes could materially affect net product sales and earnings in the period of adjustment.rates under each specific program. The Company records an estimated liability for rebates at the time the customer takes title to the product (i.e., at the time of sale to wholesalers/distributors), and records this liability as a reduction to gross product sales andsales. This liability is recorded as an increase in
·liabilities on our condensed consolidated balance sheets.
The Company estimates the liability for returns based on the actual returns experience for its two commercial products, in conjunction with industry experience for return of similar products (i.e., ambient temperature storage for oral formulations). Because the Company’s products have not reached maturity, the return rate of its products has and is expected to continue to vary.
liabilities on our condensed consolidated balance sheets. The Company’s estimatedCompany estimates the liability for product returns is also affected by price increases taken subsequent tobased primarily on the date of sale. Theactual returns experience for its 2 commercial products.
· Those adjustments may be material to our financial results.
The Company accounts for these discounts at the time of sale, as a reduction to gross product sales, and records these amountsdiscounts as an a valuation allowance against
Customer orders are generally fulfilled within a few days of receipt, resulting in minimal order backlog. Open purchase orders for products from customers are expected to be fulfilled within
condensed consolidated balance sheets.
Company and its licensee.
Revenue associated with future milestones will be recognized when the related event occurs or sales-based target is achieved.
Consequent to this agreement, the Company recorded a nonrecourse liability related to this transaction, and amortizes this amount as noncash royalty revenue.
Preclinical Studyagreements.
Development Expense and Related Accrued Research and Development Expenses
Self-insurance Liabilities
As
The Company recorded self-insurance liability of approximately $515,000U.S. Treasury Note rate, as of March 31, 2019 in Accrued expenses and other current liabilities in the condensed consolidated balance sheets.
week the award is issued, with a term that most closely resembles the expected term of the award.
In February 2016, the Financial Accounting Standards Board (FASB) issued Accounting Standards Update (ASU) No. 2016-02, “Leases (Topic 842)” and its related amendments (New Lease Standard). The New Lease Standard requires a lessee to recognize a right-of-use (ROU) lease asset and a corresponding lease liability on the balance sheet. The Company adopted the New Lease Standard on January 1, 2019 using the modified retrospective method, which applies the provision of the New Lease Standard at the effective date without adjusting comparative periods presented. In addition, the Company elected the package of practical expedients permitted under the transition guidance within the New Lease Standard which, among other things, allowed the Company to carry forward the historical lease classification.
The adoption of the New Lease Standard resulted in the recognition of lease assets and lease liabilities for operating leases as of January 1, 2019 of approximately $4.0 million. Financial reporting for periods on or after January 1, 2019 are presented under the new guidance. Prior period amounts are not adjusted and continue to be reported in accordance with previous guidance. The standard did not materially impact the Company’s condensed consolidated net earnings and had no impact on cash flows (see Note 14, Leases).
New Accounting Pronouncements Not Yet Adopted
In June 2016, the FASB issued
| Three Months ended March 31, | |||||||||||||||||||||||||||||
| 2020 | 2019 | ||||||||||||||||||||||||||||
| (unaudited) | |||||||||||||||||||||||||||||
| Net product sales | |||||||||||||||||||||||||||||
| Trokendi XR | $ | 68,551 | $ | 63,693 | |||||||||||||||||||||||||
| Oxtellar XR | 23,939 | 19,406 | |||||||||||||||||||||||||||
| Total net product sales | $ | 92,490 | $ | 83,099 | |||||||||||||||||||||||||
| Royalty revenues | 2,486 | 2,375 | |||||||||||||||||||||||||||
| Total revenues | $ | 94,976 | $ | 85,474 | |||||||||||||||||||||||||
3.multi-year period. However, in the first quarter of 2020, the return rate for the final blister pack lots of Trokendi XR produced in 2017 exhibited a return rate significantly higher than had been experienced with all previous lots. The lots for which a higher return rate was observed are the last lots which were produced and distributed.
·
·
·
| Fair Value Measurements at March 31, 2020 (unaudited) | |||||||||||||||||||||||
| Total Fair Value at March 31, 2020 | Quoted Prices in Active Markets for Identical Assets (Level 1) | Significant Other Observable Inputs (Level 2) | |||||||||||||||||||||
| Assets: | |||||||||||||||||||||||
| Cash and cash equivalents | |||||||||||||||||||||||
| Cash | $ | 19,911 | $ | 19,911 | $ | — | |||||||||||||||||
| Money market funds | 205,856 | 205,856 | |||||||||||||||||||||
| Marketable securities | |||||||||||||||||||||||
| Corporate debt securities | 174,939 | — | 174,939 | ||||||||||||||||||||
| Municipal debt securities | 165 | — | 165 | ||||||||||||||||||||
| Long term marketable securities | |||||||||||||||||||||||
| Corporate debt securities | 524,683 | 255 | 524,428 | ||||||||||||||||||||
| U.S. government agency debt securities | 10,029 | — | 10,029 | ||||||||||||||||||||
| Other noncurrent assets | |||||||||||||||||||||||
| Marketable securities - restricted (SERP) | 342 | 8 | 334 | ||||||||||||||||||||
| Total assets at fair value | $ | 935,925 | $ | 226,030 | $ | 709,895 | |||||||||||||||||
| Fair Value Measurements at December 31, 2019 (unaudited) | |||||||||||||||||||||||
| Total Fair Value at December 31, 2019 | Quoted Prices in Active Markets for Identical Assets (Level 1) | Significant Other Observable Inputs (Level 2) | |||||||||||||||||||||
| Assets: | |||||||||||||||||||||||
| Cash and cash equivalents | |||||||||||||||||||||||
| Cash | $ | 78,912 | $ | 78,912 | $ | — | |||||||||||||||||
| Money market funds | 102,469 | 102,469 | — | ||||||||||||||||||||
| Marketable securities | |||||||||||||||||||||||
| Corporate debt securities | 165,527 | — | 165,527 | ||||||||||||||||||||
| Municipal debt securities | 165 | — | 165 | ||||||||||||||||||||
| Long term marketable securities | |||||||||||||||||||||||
| Corporate debt securities | 571,828 | 254 | 571,574 | ||||||||||||||||||||
| U.S. government agency and municipal debt securities | 19,945 | — | 19,945 | ||||||||||||||||||||
| Other noncurrent assets | |||||||||||||||||||||||
| Marketable securities - restricted (SERP) | 418 | 3 | 415 | ||||||||||||||||||||
| Total assets at fair value | $ | 939,264 | $ | 181,638 | $ | 757,626 | |||||||||||||||||
| March 31, 2020 | December 31, 2019 | ||||||||||
| (unaudited) | |||||||||||
| Corporate and U.S. government agency and municipal debt securities | |||||||||||
| Amortized cost | $ | 710,072 | $ | 747,598 | |||||||
| Gross unrealized gains | 5,362 | 10,031 | |||||||||
| Gross unrealized losses | (5,618) | (164) | |||||||||
| Total fair value | $ | 709,816 | $ | 757,465 | |||||||
| March 31, 2020 | |||||
| (unaudited) | |||||
| Less than 1 year | $ | 175,104 | |||
| 1 year to 2 years | 181,141 | ||||
| 2 years to 3 years | 199,207 | ||||
| 3 years to 4 years | 154,364 | ||||
| Greater than 4 years | — | ||||
| Total | $ | 709,816 | |||
|
| March 31, 2019 |
| December 31, 2018 |
| ||||||||
|
| (unaudited) |
|
|
|
|
| ||||||
|
| Carrying Value |
| Fair Value |
| Carrying Value |
| Fair Value |
| ||||
2023 Notes |
| $ | 333,310 |
| $ | 388,664 |
| $ | 329,462 |
| $ | 375,834 |
|
thousands):
| March 31, 2020 | December 31, 2019 | ||||||||||||||||||||||||||||||||||
| (unaudited) | |||||||||||||||||||||||||||||||||||
| Carrying Value | Fair Value (Level 2) | Carrying Value | Fair Value (Level 2) | ||||||||||||||||||||||||||||||||
| 2023 Notes | $ | 349,232 | $ | 328,038 | $ | 345,170 | $ | 366,023 | |||||||||||||||||||||||||||
Unrestricted available-for-sale marketable securities held by the Company are as follows, in thousands of dollars:
|
| March 31, 2019 |
| December 31, 2018 |
| ||
|
| (unaudited) |
|
|
| ||
Corporate and government debt securities |
|
|
|
|
| ||
Amortized cost |
| $ | 690,853 |
| $ | 586,726 |
|
Gross unrealized gains |
| 2,905 |
| 55 |
| ||
Gross unrealized losses |
| (1,042 | ) | (4,213 | ) | ||
Total fair value |
| $ | 692,716 |
| $ | 582,568 |
|
The contractual maturities of the unrestricted available-for-sale marketable securities held by the Company are as follows, in thousands of dollars:
|
| March 31, |
| |
|
| 2019 |
| |
|
| (unaudited) |
| |
|
|
|
| |
Less than 1 year |
| $ | 170,165 |
|
1 year to 2 years |
| 170,246 |
| |
2 years to 3 years |
| 181,872 |
| |
3 years to 4 years |
| 170,433 |
| |
Greater than 4 years |
| — |
| |
Total |
| $ | 692,716 |
|
The Company has not experienced any other-than-temporary losses on its marketable securities.
4. Inventories
Inventories consist of the following, in thousands of dollars:
|
| March 31, |
| December 31, |
| ||
|
| 2019 |
| 2018 |
| ||
|
| (unaudited) |
|
|
| ||
|
|
|
|
|
| ||
Raw materials |
| $ | 5,377 |
| $ | 5,742 |
|
Work in process |
| 5,661 |
| 7,275 |
| ||
Finished goods |
| 15,480 |
| 12,642 |
| ||
Total |
| $ | 26,518 |
| $ | 25,659 |
|
traders.
Property and equipment consists of the following, in thousands of dollars:
|
| March 31, |
| December 31, |
| ||
|
| 2019 |
| 2018 |
| ||
|
| (unaudited) |
|
|
| ||
|
|
|
|
|
| ||
Lab equipment and furniture |
| $ | 9,056 |
| $ | 8,995 |
|
Leasehold improvements |
| 3,014 |
| 2,731 |
| ||
Software |
| 2,197 |
| 2,181 |
| ||
Computer equipment |
| 1,313 |
| 1,313 |
| ||
Construction-in-progress |
| 238 |
| 94 |
| ||
|
| 15,818 |
| 15,314 |
| ||
Less accumulated depreciation and amortization |
| (11,592 | ) | (11,219 | ) | ||
Total |
| $ | 4,226 |
| $ | 4,095 |
|
Depreciation and amortization expense on property and equipment was approximately $0.4 million for both three month periods ended March 31, 2019 and 2018.
The Company performs its annual impairment assessment in the fourth quarter, or earlier if impairment indicators exist. As of March 31, 2019, there were no identified indicators of impairment.
6. Intangible Assets
Intangible assets consist of patent defense costs, which are legal fees incurred in conjunction with defending patents for Oxtellar XR and Trokendi XR. The Company amortizes those costs over the useful life of the respective patents.
The following sets forth the gross carrying amount and related accumulated amortization of the intangible assets, in thousands of dollars:
|
| Weighted- |
| March 31, |
| December 31, |
| ||
|
| Average Life |
| 2019 |
| 2018 |
| ||
|
| (unaudited) |
| ||||||
|
|
|
|
|
|
|
| ||
Capitalized patent defense costs |
| 3.75 - 8.00 years |
| $ | 44,725 |
| $ | 44,724 |
|
Less accumulated amortization |
|
|
| (14,662 | ) | (13,356 | ) | ||
Total |
|
|
| $ | 30,063 |
| $ | 31,368 |
|
Amortization expense on intangible assets was approximately $1.3 million for both three month periods ended March 31, 2019 and 2018.
The Company performs its annual impairment assessment in the fourth quarter, or earlier, if impairment indicators exist. As of March 31, 2019, there were no identified indicators of impairment.
7. Accrued Expenses and Other Current Liabilities
Accrued expenses and other current liabilities consist of the following, in thousands of dollars:
|
| March 31, |
| December 31, |
| ||
|
| 2019 |
| 2018 |
| ||
|
| (unaudited) |
|
|
| ||
|
|
|
|
|
| ||
Accrued clinical trial and clinical supply costs |
| $ | 15,420 |
| $ | 14,034 |
|
Accrued compensation |
| 11,545 |
| 13,546 |
| ||
Accrued professional fees |
| 3,336 |
| 3,706 |
| ||
Accrued interest expense |
| — |
| 650 |
| ||
Accrued product costs |
| 751 |
| 38 |
| ||
Lease liabilities, current |
| 3,250 |
| — |
| ||
Other accrued expenses |
| 2,305 |
| 4,561 |
| ||
Total |
| $ | 36,607 |
| $ | 36,535 |
|
8. Accrued Product Returns and Rebates
Accrued product returns and rebates consist of the following, in thousands of dollars:
|
| March 31, |
| December 31, |
| ||
|
| 2019 |
| 2018 |
| ||
|
| (unaudited) |
|
|
| ||
|
|
|
|
|
| ||
Accrued rebates |
| $ | 66,090 |
| $ | 85,003 |
|
Accrued product returns |
| 22,110 |
| 22,060 |
| ||
Total |
| $ | 88,200 |
| $ | 107,063 |
|
9. Convertible Senior Notes Due 2023
The total principal amount of 2023 Notes is $402.5 million.
noteholders may require the Company to repurchase their 2023 Notes at a cash repurchase price equal to the principal amount of the 2023 Notes to be repurchased, plus accrued and unpaid interest, if any.
adjustment.
|
| March 31, |
| December 31, |
| ||
|
| 2019 |
| 2018 |
| ||
|
| (unaudited) |
|
|
| ||
Principal amount of the 2023 Notes |
| $ | 402,500 |
| $ | 402,500 |
|
Debt discount |
| (76,434 | ) | (76,434 | ) | ||
Deferred financing costs |
| (8,452 | ) | (8,452 | ) | ||
Accretion of debt discount and deferred financing costs |
| 15,696 |
| 11,848 |
| ||
Total carrying value |
| $ | 333,310 |
| $ | 329,462 |
|
Nothousands):
| March 31, 2020 | December 31, 2019 | ||||||||||
| (unaudited) | |||||||||||
| 2023 Notes | $ | 402,500 | $ | 402,500 | |||||||
| Unamortized debt discount and deferred financing costs | (53,268) | (57,330) | |||||||||
| Total carrying value | $ | 349,232 | $ | 345,170 | |||||||
10. Other Expenses
Other expenses consist of the following, in thousands of dollars:
|
| Three Months ended March 31, |
| ||||
|
| 2019 |
| 2018 |
| ||
|
| (unaudited) |
| ||||
|
|
|
|
|
| ||
Interest income |
| $ | 4,681 |
| $ | 1,206 |
|
Interest expense |
| (4,710 | ) | (717 | ) | ||
Interest expense-nonrecourse liability related to sale of future royalties |
| (1,160 | ) | (701 | ) | ||
|
|
|
|
|
| ||
Total |
| $ | (1,189 | ) | $ | (212 | ) |
Interest expense includes non-cash interest expense relates to amortization of deferred financing costs and debt discount in the amount of $3.8 million and $0.6 million for the three month periods ended March2020 or December 31, 2019 and 2018, respectively.
11.2019.
| Three Months ended March 31, | |||||||||||||||||||||||||||||
| 2020 | 2019 | ||||||||||||||||||||||||||||
| (unaudited) | |||||||||||||||||||||||||||||
| Research and development | $ | 681 | $ | 574 | |||||||||||||||||||||||||
| Selling, general and administrative | 3,307 | 2,713 | |||||||||||||||||||||||||||
| Total | $ | 3,988 | $ | 3,287 | |||||||||||||||||||||||||
|
| Number of |
| Weighted- |
| Weighted- |
| |
|
|
|
|
|
|
|
| |
Outstanding, December 31, 2018 |
| 3,916,963 |
| $ | 19.98 |
| 7.10 |
|
Granted (unaudited) |
| 831,835 |
| $ | 36.75 |
|
|
|
Exercised (unaudited) |
| (57,665 | ) | $ | 13.57 |
|
|
|
Forfeited (unaudited) |
| (10,437 | ) | $ | 30.69 |
|
|
|
Outstanding, March 31, 2019 (unaudited) |
| 4,680,696 |
| $ | 23.01 |
| 7.40 |
|
|
|
|
|
|
|
|
| |
As of December 31, 2018: |
|
|
|
|
|
|
| |
Vested and expected to vest |
| 3,916,963 |
| $ | 19.98 |
| 7.10 |
|
Exercisable |
| 1,889,947 |
| $ | 12.47 |
| 5.96 |
|
|
|
|
|
|
|
|
| |
As of March 31, 2019: |
|
|
|
|
|
|
| |
Vested and expected to vest (unaudited) |
| 4,680,696 |
| $ | 23.01 |
| 7.40 |
|
Exercisable (unaudited) |
| 2,605,591 |
| $ | 15.33 |
| 6.22 |
|
12.
| Number of Options | Weighted- Average Exercise Price (per share) | Weighted- Average Remaining Contractual Term (in years) | |||||||||||||||
| Outstanding, December 31, 2019 | 4,606,559 | $ | 23.05 | 6.66 | |||||||||||||
| Granted | 1,105,925 | $ | 23.99 | ||||||||||||||
| Exercised | (3,811) | $ | 8.33 | ||||||||||||||
| Forfeited | (25,275) | $ | 28.12 | ||||||||||||||
| Outstanding, March 31, 2020 (unaudited) | 5,683,398 | $ | 23.22 | 7.08 | |||||||||||||
| As of December 31, 2019: | |||||||||||||||||
| Vested and expected to vest | 4,606,559 | $ | 23.05 | 6.66 | |||||||||||||
| Exercisable | 2,598,112 | $ | 15.68 | 5.48 | |||||||||||||
| As of March 31, 2020: | |||||||||||||||||
| Vested and expected to vest | 5,683,398 | $ | 23.22 | 7.08 | |||||||||||||
| Exercisable | 3,394,315 | $ | 18.71 | 5.75 | |||||||||||||
|
| Three Months ended March 31, |
| ||
|
| 2019 |
| 2018 |
|
|
| (unaudited) |
| ||
|
|
|
|
|
|
Warrants to purchase common stock |
| 7,966,488 |
| 1,752,793 |
|
Convertible notes |
| 239,272 |
| 22,634 |
|
Convertible notes hedges |
| 240 |
| 23 |
|
Stock options, SAR and ESPP awards |
| 608,948 |
| 208,661 |
|
anti-dilutive:
| Three Months ended March 31, | ||||||||||||||||||||||||||
| 2020 | 2019 | |||||||||||||||||||||||||
| (unaudited) | ||||||||||||||||||||||||||
| Stock options, RSUs, PSUs | 3,034,099 | 608,948 | ||||||||||||||||||||||||
|
| Three Months ended March 31, |
| ||||
|
| 2019 |
| 2018 |
| ||
|
| (unaudited) |
| ||||
|
|
|
|
|
| ||
Numerator, in thousands: |
|
|
|
|
| ||
Net earnings used for calculation of basic and diluted EPS |
| $ | 18,340 |
| $ | 26,352 |
|
|
|
|
|
|
| ||
Denominator: |
|
|
|
|
| ||
Weighted average shares outstanding, basic |
| 52,336,443 |
| 51,536,474 |
| ||
|
|
|
|
|
| ||
Effect of dilutive potential common shares: |
|
|
|
|
| ||
Stock options and SAR |
| 1,648,942 |
| 2,251,872 |
| ||
Total dilutive potential common shares |
| 1,648,942 |
| 2,251,872 |
| ||
Weighted average shares outstanding, diluted |
| 53,985,385 |
| 53,788,346 |
| ||
|
|
|
|
|
| ||
Earnings per share, basic |
| $ | 0.35 |
| $ | 0.51 |
|
Earnings per share, diluted |
| $ | 0.34 |
| $ | 0.49 |
|
13.amounts):
| Three Months ended March 31, | |||||||||||||||||||||||||||||
| 2020 | 2019 | ||||||||||||||||||||||||||||
| (unaudited) | |||||||||||||||||||||||||||||
| Numerator, dollars in thousands: | |||||||||||||||||||||||||||||
| Net earnings | $ | 21,518 | $ | 18,340 | |||||||||||||||||||||||||
| Denominator: | |||||||||||||||||||||||||||||
| Weighted average shares outstanding, basic | 52,534,787 | 52,336,443 | |||||||||||||||||||||||||||
| Effect of dilutive securities: | |||||||||||||||||||||||||||||
| Stock options, PSU, RSU and SAR | 1,046,264 | 1,648,942 | |||||||||||||||||||||||||||
| Weighted average shares outstanding, diluted | 53,581,051 | 53,985,385 | |||||||||||||||||||||||||||
| Earnings per share, basic | $ | 0.41 | $ | 0.35 | |||||||||||||||||||||||||
| Earnings per share, diluted | $ | 0.40 | $ | 0.34 | |||||||||||||||||||||||||
Tax Expense
|
| Three Months ended March 31, |
| ||||
|
| 2019 |
| 2018 |
| ||
|
| (unaudited) |
| ||||
|
|
|
|
|
| ||
Income tax expense |
| $ | 5,899 |
| $ | 4,830 |
|
Effective tax rate |
| 24.34 | % | 15.49 | % | ||
The income tax expense for the three month period ended March 31, 2019 was attributable to U.S. federal and state income taxes.
For the three month periodmonths ended March 31, 2020 and 2019, the Company recorded $5.9 million of income tax expense, an increase from $4.8 million as compared to the same period of 2018. (dollars in thousands):
| Three Months ended March 31, | |||||||||||||||||||||||||||||
| 2020 | 2019 | ||||||||||||||||||||||||||||
| (unaudited) | |||||||||||||||||||||||||||||
| Income tax expense | $ | 7,516 | $ | 5,899 | |||||||||||||||||||||||||
| Effective tax rate | 25.9 | % | 24.3 | % | |||||||||||||||||||||||||
The Company recorded income tax benefits relatedthe more significant provisions which are expected to exercisesimpact the
14. Leases
does not expect interest expense to be limited. The Company determines if an arrangement is a lease at inception. Some leases include options to terminate or to extend for one or more years. These options are included in the lease term when it is reasonably certain that the option will be exercised.
The Company has lease arrangements that contain lease components (e.g., minimum rent payments) and non-lease components (e.g., maintenance, labor charges, etc.) and accounts for these components as a single lease component. The Company’s lease agreements do not contain any material residual value guarantees or material restrictive covenants.
Operating leases are included in Lease assets, Accrued expenses and other current liabilities, and Lease liabilities, long term on the condensed consolidated balance sheets. Operating lease assets and lease liabilities are recognized at the commencement date, based on the present valueultimate impact of the future minimum lease payments overCARES Act may differ from this estimate due to changes in interpretations and assumptions, guidance that may be issued and actions the lease term. Lease expense for operating leasesCompany may take in response to the CARES Act. The CARES Act is recognized as an operating cost.highly detailed and the Company will continue to assess the impact that various provisions will have on its business.
arrangement, the Company applies a portfolio approach to effectively account for the operating lease assets and liabilities.
Lease assets, lease-related assets and
| March 31, 2020 | December 31, 2019 | ||||||||||
| (unaudited) | |||||||||||
| Assets | |||||||||||
| Lease assets | $ | 21,911 | $ | 21,279 | |||||||
| Liabilities | |||||||||||
| Accrued expenses and other current liabilities | |||||||||||
| Lease liabilities, current | $ | 3,456 | $ | 2,825 | |||||||
| Non-current | |||||||||||
| Lease liabilities, long term | 30,804 | 30,440 | |||||||||
| Total lease liabilities | $ | 34,260 | $ | 33,265 | |||||||
| Weighted-average remaining lease term (years) | 12.1 | 12.5 | |||||||||
| Weighted-average discount rate | 4.3 | % | 4.4 | % | |||||||
|
|
|
| March 31, |
| |
|
|
|
| 2019 |
| |
|
|
|
| (unaudited) |
| |
Assets |
| Balance Sheet Classification |
|
|
| |
Operating leases |
| Lease assets |
| $ | 20,049 |
|
Tenant receivable |
| Prepaid expenses and other current assets |
| 10,151 |
| |
Total lease and lease-related assets |
|
|
| $ | 30,200 |
|
|
|
|
|
|
| |
Liabilities |
|
|
|
|
| |
Current |
|
|
|
|
| |
Operating leases |
| Accrued expenses and other current liabilities |
| $ | 3,250 |
|
Non-current |
|
|
|
|
| |
Operating leases |
| Lease liabilities, long term |
| 27,824 |
| |
Total lease liabilities |
|
|
| $ | 31,074 |
|
Lease costs for the three month period ended March 31, 2019thousands):
| Three Months ended March 31, | |||||||||||||||||||||||||||||||||||
| 2020 | 2019 | ||||||||||||||||||||||||||||||||||
| (unaudited) | |||||||||||||||||||||||||||||||||||
| Fixed lease cost | $ | 1,497 | $ | 1,032 | |||||||||||||||||||||||||||||||
| Variable lease cost | 627 | 465 | |||||||||||||||||||||||||||||||||
| Total operating lease cost | $ | 2,124 | $ | 1,497 | |||||||||||||||||||||||||||||||
|
| Three Months ended |
| |
|
| March 31, 2019 |
| |
|
| (unaudited) |
| |
|
|
|
| |
Operating leases cost |
|
|
| |
Fixed lease cost |
| $ | 1,032 |
|
Variable lease cost |
| 465 |
| |
Total operating leases cost |
| $ | 1,497 |
|
Weighted average lease term and discount rate for the three month period ended March 31, 2019 are as follows:
| |||
| |||
| |||
| |||
|
| ||
| |||
|
|
|
thousands):
| Three Months ended March 31, | |||||||||||||||||
| 2020 | 2019 | ||||||||||||||||
| (unaudited) | |||||||||||||||||
| Cash paid for operating leases | $ | 1,261 | $ | 1,313 | |||||||||||||
| Lease assets and tenant receivables obtained for new operating leases | $ | 1,715 | $ | 17,136 | |||||||||||||
| 2020 (remaining) | $ | 3,672 | |||
| 2021 | 4,760 | ||||
| 2022 | 4,226 | ||||
| 2023 | 2,537 | ||||
| 2024 | 2,587 | ||||
| Thereafter | 26,784 | ||||
| Total future minimum lease payments | $ | 44,566 | |||
Less: Imputed interest (1) | (10,306) | ||||
| Present value of lease liabilities | $ | 34,260 | |||
|
| Operating leases |
| |
Year ending December 31: |
|
|
| |
2019 (remaining) |
| $ | 2,512 |
|
2020 |
| 2,938 |
| |
2021 |
| 2,527 |
| |
2022 |
| 2,486 |
| |
2023 |
| 2,536 |
| |
Thereafter |
| 29,371 |
| |
Total future minimum lease payments |
| $ | 42,370 |
|
Less: Imputed interest (1) |
| 11,296 |
| |
Present value of lease liabilities |
| $ | 31,074 |
|
(1)Calculated using the interest rate for each lease.
Year ending December 31: 2019 $ 3,400 2020 2,287 Thereafter 1,840 Total $ 7,527 Three Months ended March 31, 2019 2018 (unaudited) Net product sales Trokendi XR $ 63,693 $ 70,555 Oxtellar XR 19,406 18,565 Total net product sales 83,099 89,120 Royalty revenues 2,375 1,309 Total revenues $ 85,474 $ 90,429 Trokendi XR. The Company agreement. February 28, 2020. have access to liquidity. product candidates and proprietary drug technologies. We expect to incur significant expenses as we: invest in research and development related to the continued development of each of our product candidates through intellectual property portfolio. We believe a once-daily dosing regimen improves compliance, making it more probable that patients take their medication and maintain sufficient levels of medication in their bloodstream. Trokendi XR's unique smooth pharmacokinetic profile results in lower peak plasma concentrations, higher trough plasma concentrations, and slower plasma uptake rates. This results in smoother and more consistent plasma concentrations than immediate release topiramate formulations. We believe that such a profile mitigates blood level fluctuations that are frequently associated with many side effects, thereby reducing the likelihood of breakthrough seizures or migraine headaches that patients can suffer when taking immediate release products. Side effects associated with immediate release products may lead patients to skip doses, which could place them at higher risk for breakthrough seizures or migraine headaches. FDA. Candidate U.S. product profile. 2021. completed. incurred, with minimal adjustments to expense in the subsequent periods. 2019 The following table provides information regarding our revenues during the periods indicated, Three Months ended March 31, Increase Percent 2019 2018 (Decrease) Change (%) Net product sales Trokendi XR $ 63,693 $ 70,555 $ (6,862 ) -10 % Oxtellar XR 19,406 18,565 841 5 % Total net product sales 83,099 89,120 (6,021 ) -7 % Royalty revenues 2,375 1,309 1,066 81 % Total revenues $ 85,474 $ 90,429 $ (4,955 ) -5 % for the three months ended March 31, 2020 as compared to the prior year, is primarily due to the favorable impact of the 8% price increase taken January 1, 2020, favorable unit prescription growth for Oxtellar XR and the adverse impact of the pipeline inventory reduction in 2019. These effects were partially offset by unfavorable changes in net sales deductions. This sales. Accrued Liabilities Product Allowance for Rebates Returns Sales Discounts Total Balance at December 31, 2018 $ 85,003 $ 22,060 $ 11,548 $ 118,611 Provision Provision for sales in current year 63,941 1,724 11,214 76,879 Adjustments relating to prior year sales (844 ) (42 ) (43 ) (929 ) Total provision $ 63,097 $ 1,682 $ 11,171 $ 75,950 Less: Actual payments/credits (82,010 ) (1,632 ) (14,909 ) (98,551 ) Balance at March 31, 2019 $ 66,090 $ 22,110 $ 7,810 $ 96,010 Accrued Liabilities Product Allowance for Rebates Returns Sales Discounts Total Balance at December 31, 2017 $ 49,460 $ 18,883 $ 8,892 $ 77,235 Provision Provision for sales in current year 53,837 2,354 12,208 68,399 Adjustments relating to prior year sales (1,681 ) 29 (3 ) (1,655 ) Total provision $ 52,156 $ 2,383 $ 12,205 $ 66,744 Less: Actual payments/credits (49,086 ) (762 ) (11,739 ) (61,587 ) Balance at March 31, 2018 $ 52,530 $ 20,504 $ 9,358 $ 82,392 2020. This increase was driven by prescription volume growth. Supernus records noncash royalty based on these product sales. Goods Sold Three Months ended March 31, Percent 2019 2018 Increase Change (%) Cost of product sales $ 3,684 $ 3,278 $ 406 12 % year over year increase in prescriptions, as well as the aforementioned reduction in channel level inventory which occurred in the first quarter of 2019. Three Months ended March 31, Percent 2019 2018 Decrease Change (%) Research and development $ 15,394 $ 18,908 $ (3,514 ) -19 % 2019. Three Months ended March 31, Percent 2019 2018 Increase Change (%) Selling and marketing $ 30,749 $ 26,676 $ 4,073 15 % General and administrative 10,219 10,173 46 0 % Total $ 40,968 $ 36,849 $ 4,119 11 % $1.0 million. higher occupancy-related costs, and $0.9 million increase in professional and consulting fees. Income (Expense) Three Months ended March 31, Percent 2019 2018 Increase Change (%) Interest income $ 4,681 $ 1,206 $ 3,475 288 % Interest expense (4,710 ) (717 ) 3,993 557 % Interest expense-nonrecourse liability related to sale of future royalties (1,160 ) (701 ) 459 65 % Total $ (1,189 ) $ (212 ) Three Months ended March 31, Percent 2019 2018 Increase Change (%) Income tax expense $ 5,899 $ 4,830 $ 1,069 22 % Effective tax rate 24.34 % 15.49 % Oxtellar XR. We were cash flow positive and profitable from operations in 2019. initiatives. We will continue to actively manage our capital structure and to consider all financing opportunities that could strengthen our long-term financial profile. Any such capital raises may or may not be similar to transactions in which we have engaged in the past. There can be no assurance that any such financing opportunities will be available on acceptable terms, if at all. Three Months ended March 31, Increase 2019 2018 (Decrease) Net cash provided by (used in): Operating activities Operating earnings $ 27,071 $ 29,676 $ (2,605 ) Working capital 5,922 (2,543 ) 8,465 Total operating activities 32,993 27,133 5,860 Investing activities (103,246 ) (51,010 ) (52,236 ) Financing activities 783 367,713 (366,930 ) Net (decrease) increase in cash and cash equivalents $ (69,470 ) $ 343,836 $ (413,306 ) settlement of payables, as described below. Three Months ended March 31, 2019 2018 Explanation of Change (Increase) Decrease in: Accounts receivable $ 23,013 $ (798 ) Timing of cash collections; decreased receivables due to higher fourth quarter of 2018 sales as a result of higher fourth quarter of 2018 channel inventory levels. Inventories (859 ) (2,771 ) Increased inventory volume to support increased product demand. Prepaid expenses, other current assets and other non-current assets (1,995 ) (404 ) Timing differences related to deposit for equipment purchase; progress of clinical trials. Increase (Decrease) in: Accounts payable and accrued other non-current liabilities 868 (4,572 ) Timing of vendor payments. Accrued product returns and rebates (18,863 ) 4,691 Increased provision directly related to growth in prescriptions, the growth in Medicaid rebates consequent taking price increases and higher levels of patient co-pay assistance. Income taxes payable 4,856 327 Timing of income tax payments. Other (1,098 ) 984 Timing of compensation payments. $ 5,922 $ (2,543 ) thousands): 2019. 2020, subject to certain conditions, including the expiration of the waiting period under the Hart-Scott-Rodino Antitrust Improvements Act and other customary conditions. 31.2 32.1 32.2 The cover page of the Company’s Quarterly Report on Form 10-Q for the quarter ended March 31, 2020, formatted in Inline XBRL DATED: May By: /s/ Jack A. Khattar Jack A. Khattar /s/ Gregory S. Patrick Gregory S. PatrickDislcosure Related to Periods Prior to Adoption leased vehicles for the years ended December 31, 2018, 2017 and 2016 was2019, the Company recorded allowances of approximately $3.6 million, $2.7$10.3 million and $2.7$11.0 million, respectively.Future minimum lease payments under non-cancelable operating leases as of December 31, 2018 are as follows, in thousands of dollars:15. Accounts ReceivableThe Company recorded an allowance of approximately $7.8 million and $11.5 millionrespectively, for expected sales discounts and allowances related to prompt pay discounts and contractual service fees for service arrangements withpaid to the Company’s customers, who are primarily pharmaceutical wholesalers and distributors, ascustomers.March 31,
2020December 31,
2019(unaudited) Raw materials $ 4,331 $ 4,582 Work in process 8,221 11,428 Finished goods 11,866 10,618 Total $ 24,418 $ 26,628 20192020 and December 31, 2018, respectively.16. Disaggregated RevenuesThe following table summarizes2019, the disaggregation of revenues by nature, in thousands of dollars:The majorityCompany did not capitalize any pre-launch inventory costs.Company’s product sales are with pharmaceutical wholesalersfollowing (dollars in thousands):March 31,
2020December 31,
2019(unaudited) Lab equipment and furniture $ 11,538 $ 11,053 Leasehold improvements 14,974 14,217 Software 2,225 2,225 Computer equipment 2,013 1,839 Construction-in-progress 431 433 31,181 29,767 Less accumulated depreciation and amortization (13,170) (12,699) Total $ 18,011 $ 17,068 distributors who, in turn, sell the products to chainamortization expense on property and independent pharmacies, hospitalsequipment was approximately $0.5 million and other customers. Three pharmaceutical wholesalers/distributors collectively accounted for more than 90% of the Company’s total net product sales and accounts receivables as of and$0.4 million for the three month periodsmonths ended March 31, 2020 and 2019, respectively.2018.recognized non-cash royalty revenueamortizes these costs over the useful life of $1.6the respective patents.Weighted-
Average Life
(Years)March 31,
2020December 31,
2019(unaudited) Capitalized patent defense costs 2.76 - 7.01 years $ 43,375 $ 43,375 Less accumulated amortization (19,796) (18,535) Total $ 23,579 $ 24,840 and $1.3 for theboth three month periods ended March 31, 2020 and 2019, respectively.2018, respectively.Other Current LiabilitiesMarch 31,
2020December 31,
2019(unaudited) $ 11,224 $ 13,285 Accrued compensation 9,549 11,223 Accrued professional fees 4,706 3,936 Lease liabilities, current 3,456 2,825 Other accrued expenses 4,068 5,861 Total $ 33,003 $ 37,130 No milestone revenue was recordedMarch 31,
2020December 31,
2019(unaudited) Accrued product rebates $ 94,612 $ 88,811 Accrued product returns 24,841 18,818 Total $ 119,453 $ 107,629 Three Months ended March 31, 2020 2019 (unaudited) Interest income $ 5,777 $ 4,681 Interest expense (4,693) (4,710) Interest expense on nonrecourse liability related to sale of future royalties (1,062) (1,160) Total $ 22 $ (1,189) month periodsmonths ended March 31, 2020 and 2019, and 2018, respectively.For the three month period ended March 31, 2019, revenues recognized from performance obligations related to prior periods (e.g., due to changes in transaction price) were not material in the aggregate to Net Product Sales and Royalty Revenues.certaindefined milestones. TheIf these products are ultimately commercialized, the Company is also obligated to pay royalties to third parties, as percentage of net product sales, for each respective product under a license agreement, if these products are ultimately commercialized.a $30.0 million payment pursuant to a Royalty Interest Acquisition Agreement related to the purchase by HC Royalty of certain of the Company’s rights under the Company’s agreement with United Therapeutics, related to the commercialization of Orenitram (treprostinil) Extended-Release Tablets. The Company will retain fullFull ownership of the royalty rights will revert to the Company if and when a certain cumulative payment threshold is reached, per the terms of the agreement.agreement (see Note 2, Note 3 and Note 16).recordedwill bear all development costs incurred by either the Company or Navitor up to a non-recourse liability relatedmaximum of $50 million. The Development Agreement provides Navitor an option to request that the Company pay certain development costs in excess of $50 million once expenses reach this threshold and grants the Company a right of first refusal to negotiate for rights to develop and commercialize any composition of matter that has a similar mechanism of action as NV-5138.amortizes this amount as non-cash royalty revenue.other customary conditions.also recognizes non-cash interest expense relatedis currently reviewing the details of this Notice Letter and intends to this liability and accrues at an effective interest rate. That rate is determined based on projectionsvigorously enforce its intellectual property rights relating to Oxtellar XR.20182019 and the related Management’s Discussion and Analysis of Financial Condition and Results of Operations, both of which are contained in our Annual Report on Form 10-K, filed with the Securities and Exchange Commission on March 1, 2019.diseasesdiseases. We have a portfolio of commercial products and product candidates.neurologytreatment-resistant depression.psychiatry.We market twoPurchase Agreement to acquire the CNS portfolio of US WorldMeds Partners, LLC. With the acquisition, the Company will add three established, marketed products Oxtellar XR and Trokendi XR,a product candidate in late-stage development to its portfolio.United States (U.S.). WeSPN-812 adult trial; adverse impact on selling and marketing efforts as a result of temporarily halting in-person interactions by our sales force with healthcare providers; adverse impact on net product sales as a result of decreased new prescriptions due to fewer patient visits to physician’s offices to begin or to maintain treatment; potential changes in payer segment mix; and increased use of co-pay programs due to rising unemployment. Financial effects could include impairment of intangible and long-lived assets, increased reserves for sales deductions that could impact our net product sales; and adjustments for market volatility for items subject to fair value measurement, such as marketable securities.throughit has also not negatively impacted our own sales force and seek strategic collaborations with other pharmaceutical companiesliquidity position in a material way. We expect to commercializecontinue to generate cash flows to meet our products outside of the U.S. via license agreements.In addition, we are developing multiple proprietary product candidates in the CNS market to address significant unmet medicalshort-term liquidity needs and market opportunities.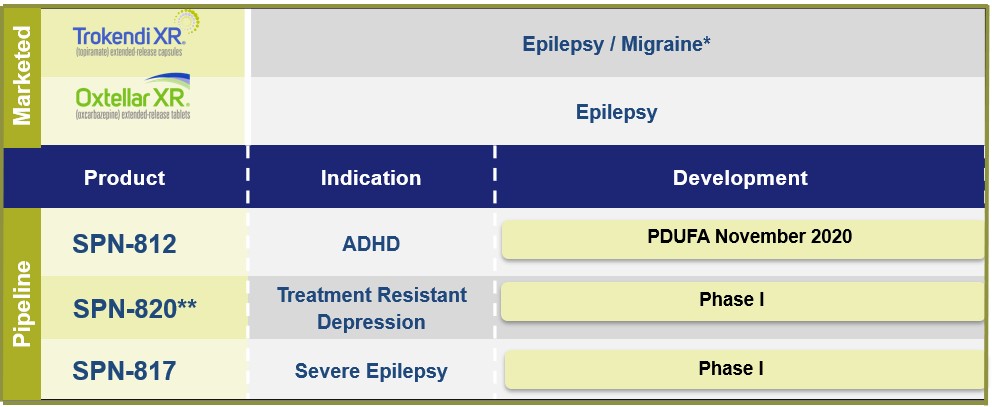
Initial program is for Impulsive Aggression (IA) in patients with ADHD, with plans SPN-820 = NV-5138 (Navitor Partnership)add other indications, such as IA in patients with autism, PTSD, bipolar disorder, Alzheimer’sresearch and other formsdevelopment of dementia.FDAU.S. Food and Drug Administration (FDA) approval or until the program terminates; expand product indications for approved products; invest in sales and marketing resources for existing and new products; enter into agreements to purchase products, product candidates or other companiescompanies; and invest in support forof our business, technology, regulatory and legal matters. the following two commercial products and one product candidate for the treatment of neurological diseases.the adjunctive treatment of partial onset seizures of epilepsy. During the first quarterWith its novel pharmacokinetic profile showing lower peak plasma concentrations, a slower rate of 2019,plasma input, and smoother and more consistent blood levels as compared to immediate release products, we launchedbelieve Oxtellar XR improves the tolerability of oxcarbazepine and thereby reduces side effects. In addition, Oxtellar XR once-per-day dosing is designed to improve patient compliance compared to the current immediate release products that must be taken multiple times per day.Three Months ended
March 31,Change 2020 2019 Volume Percent Prescriptions Trokendi XR 160,315 160,940 (625) —% Oxtellar XR 43,089 38,580 4,509 12% Total prescriptions 203,404 199,520 3,884 2% recently approved monotherapydrug's anticonvulsant activity, which has been shown in preclinical models for treatment of partial onset seizures of epilepsy in adults and in children 6 to 17 years of age.These two commercial products differ from immediate release formulations by offering once-daily dosing and unique pharmacokinetic profiles, which we believe can have very positive clinical effects for many patients. We believe a once-daily dosing regimen improves adherence, making it more probable that patients maintain sufficient levels of medication in their bloodstreams to protect against seizures and migraines. In addition, we believe thatDravet Syndrome. SPN-817 is in clinical development, and has received an Orphan Drug designation for Dravet Syndrome from the unique smooth and steady pharmacokinetic profiles of our once-daily formulations reduce the peak to trough blood level fluctuations, which are typically associated with immediate release products and which may result in increased adverse events (AEs), more side effects and decreased efficacy.Product PrescriptionsWe expect the number of prescriptions filled for Oxtellar XR and Trokendi XR to continue to increase through 2019 and in subsequent years. Data from IQVIA shows that 199,520 total prescriptions were filled for both of these drugs during the three month periods ended March 31, 2019, which is 11% higher than the 179,711 prescriptions reported for the same period in 2018.Total prescriptions for Trokendi XR increased by 15,945 or 11% in the first quarter of 2019 as compared to the same quarter period in 2018. Total prescriptions for Oxtellar XR increased by 3,864 or 11% in the first quarter of 2019 as compared to the same quarter in 2018.Product CandidateSPN-817 (huperzine A)SPN-817 will utilize a novel synthetic form of huperzine A, whose mechanism of action (MOA) includes potent acetyl cholinesterase inhibition with pharmacological activities in CNS conditions such as epilepsy. pediatric epilepsy disorders. A Phase I proof-of-concept trial is currently underway outside of the U.SU.S. in adult patients with refractory complex partial seizures, to studystudying the efficacy, safety and pharmacokinetic profile of a new extended release formulation of non-synthetic huperzine A. The Company initiated preclinical Investigational New Drug (IND) enabling activities in the U.S.form prior to conducting additional clinical trials.form. Given the potency of huperzine A, a novel extended release oral dosage form is critical to the success of this program, because initial studies with the immediate release formulations of nonsyntheticnon-synthetic huperzine A have shown dose-limiting, serious side effects.the following fourtwo product candidates, SPN-812 and SPN-820, for the treatment of psychiatric disorders.Candidates structurally distinct, bicyclic, serotonin norepinephrine modulating agent with New Chemical Entity (NCE) status in the U.S. We(SNMA), which we are developing SPN-812 as a novel non-stimulant for the treatment for ADHD in pediatric and adolescent patients.of ADHD. We believe that SPN-812 could be a better alternative thanwell-differentiated as compared to other non-stimulant and stimulant therapiestreatments due to its uniquedifferent pharmacological and pharmacokinetic profile. The active ingredient in SPN-812, viloxazine hydrochloride, has an extensive safety record in Europe, where it was previously marketed for many years as an antidepressant.SPN-812 Development ProgramOur Phase III program consists of four three-arm, placebo-controlled trials: P301 and P303 trials in patients 6 to 11 years old and P302 and P304 trials in patients 12-17 years old. The Phase III program for SPN-812antidepressant, albeit at much higher dosage levels. Viloxazine hydrochloride is complete. In December 2018, we announced positive topline results from the pediatric trials (P301 and P303) and the first adolescent trial (P302). In March 2019, we announced topline results from the second adolescent trial (P304), confirming the positive results seena structurally distinct, bicyclic, SNMA with NCE status in the previous three Phase III trials.P304 study is a randomized, double-blind, placebo controlled, multicenter, parallel group clinical trial in adolescents 12 to 17 years of age diagnosed with ADHD. Each treatment was administered orally once a day over seven weeks, including one week of titration for 400 mg dosing and two weeks of titration for 600 mg dosing. SPN-812 400 mg dose reached statistical significance compared to placebo, consistent with our previous Phase III studies. While SPN-812 600 mg dose narrowly missed statistical significance, it is not needed forFDA accepted the submissionreview of the NDA for SPN-812 for the treatment of children and adolescents. The 600 mg dose was included to check foradolescents with ADHD in January 2020 and assigned a potentially higher levelPDUFA target action date of efficacy, to help in identifying the maximum effective dose, and to help in designing our trials for the adult population.The Company continues to be focused on compiling the New Drug Application (NDA) for submission to the U.S. Food and Drug Administration (FDA) in the second half of this year.November 8, 2020. We expectplan to launch SPN-812, assumingit, pending FDA approval, in the second halffourth quarter of 2020.Patients completing We expect SPN-812, if approved, to have five-year market exclusivity due to its NCE status in the Phase III trials were permitted to continue treatment under our open label extension trial. That trial is expected to continue through 2020.Further,U.S. Furthermore, we are continuing to develop and expand our intellectual property (IP) portfoliopursuing IP covering the novel synthesis process for the active ingredient in SPN-812, its novel use in treatment of ADHD and its novel extended release delivery.SPN-810 (molindone hydrochloride)are developing SPN-810 as a novel treatmentcontinue to prepare for IA in patients who have ADHD,the commercial launch of SPN-812 at the end of 2020. The Company remains engaged with the potential to beFDA regarding the first product available to address this serious, unmet medical need. Molindone hydrochloride was previously marketed in the United StatesNDA for SPN-812 for the treatment of schizophrenia under the trade name Moban at much higher strengths and different dosage forms than we are using in our development program. If we are successful in developing SPN-810 asADHD. novel treatment for IA in patients who have ADHD, we may then develop the product as a candidate for treating other indications, e.g., patients with IA in autism, PTSD, bipolar disorder, Alzheimer’s and other forms of dementia.SPN-810 Development ProgramOur Phase III program consists of two clinical studies in patients 6 to 11 years old (P301 and P302) and oneadults in patients 12 to 17 years old (P503). Data from the first Phase III trial (P301) and second trial (P302) are expected in second halfthird quarter of 2019. The SPN-812 adult trial reached approximately 75% of the targeted enrollment before additional enrollment was put on hold in March 2020 due to the impact of COVID-19. We expect patient enrollment inare employing virtual efforts to ensure that currently enrolled subjects can progress to completion of treatment. This trial was ahead of schedule prior to the adolescent trial (P503) to continue through 2020.We expect to submit the NDA for SPN-810COVID-19 pandemic, with a potential data release in the second half of 2020,this year. Depending on when the Company can restart enrollment and to launch it, assuming FDA approval, incomplete the second half of 2021.Patients completing the Phase III trials can continue treatment under our open label extension trial. Enrollmentstudy, data from the P301 and P302 trialstrial may be pushed out into the open label extension trial continues at 90% or higher. On average, a patient in the open label extension study stays on SPN-810 for approximately 10 months, which we believe is an encouraging sign of both tolerability and efficacy.We continue to develop and expand our IP portfolio covering the novel synthesis process for the active ingredient in SPN-810, its novel use in IA and its novel extended release delivery.SPN-809 (viloxazine hydrochloride)SPN-809 is a novel once-daily product candidate for the treatment of depression. SPN-809 incorporates the same active ingredient as SPN-812.Because SPN-809 contains the same active ingredient as SPN-812, we expect that many of our activities related to the development of SPN-812 will also benefit the development of SPN-809.SPN-604 (extended release oxcarbazepine for treatment of bipolar disorder)We continue to progress our plans to initiate pivotal Phase III studies for the treatment of bipolar disorder in the second half of 2019. If approved, this would represent the first approval for treatment of bipolar patients with oxcarbazepine in the U.S.Our extended release oxcarbazepine patent portfolio currently includes twelve U.S. patents, nine of which cover Oxtellar XR. We own all of the issued patents and the pending patent applications. We have also obtained two patents each for extended release oxcarbazepine in Europe and Australia, and one patent each in Canada, Japan, China and Mexico. In addition, we have a pending U.S. patent application that covers various extended release formulations containing oxcarbazepine. The nine issued U.S. patents covering Oxtellar XR will expire no earlier than 2027.nineten U.S. patents that cover Trokendi XR. We own all of the issued patents and pending patent applications. We have one patent issued each in Mexico, Australia, Japan and Canada for extended release topiramate.topiramate in each of the following countries: Mexico; Australia; Japan; and Canada. We also have two patents issued in Europe for extended release topiramate.Europe. The nineten issued U.S. patents covering Trokendi XR will expire no earlier than 2027. We own all of the issued patents.also containscurrently includes twelve U.S. patents, nine of which cover Oxtellar XR. The nine issued U.S. patents covering Oxtellar XR will expire no earlier than 2027. We have two issued patents for extended release oxcarbazepine in both Europe and Australia, and one patent applications relating toissued in each of the following countries: Canada; Japan; China and Mexico. In addition, we have a pending U.S. patent application that covers various extended release formulations containing oxcarbazepine. We own all of the issued patents and the pending U.S. patent application.products. product, SPN-812, we have three families of pending U.S. non-provisional and foreign counterpart patent applications. Patents, if issued, could expire from 2029 to 2033. We have one patent issued each in Europe and Canada, covering a method of treating ADHD using viloxazine hydrochloride. In another family, covering the novel synthesis process of active ingredient, we have four patents issued in the U.S., five patents issued in Mexico, two patents issued in Japan, and one patent issued each in Europe, Canada and Australia. We have four patents issued in the U.S. covering modified release formulations of viloxazine hydrochloride, two patents issued in Japan and Australia and one patent issued in Mexico. We own all of the issued patents and the pending patent applications.measurement scales, products and product candidates.1—1—Legal Proceedings for additional information.basesbasis of presentation for our condensed consolidated financial statements are described in Part I, Item 1, Financial Statements, Note 2, Summary of Significant Accounting Policies, in the Notes to the Condensed Consolidated Financial Statements. Our condensed consolidated financial statements are prepared in accordance with U.S. generally accepted accounting principles (GAAP)(U.S. GAAP), requiring us to make estimates and assumptions that affect the reported amounts of assets, liabilities, revenues, and expenses, and to disclose material contingent assets and liabilities. Actual results could differ materially from thoseour estimates.includingincluding: estimated rebates, discounts, and allowances,rebates; sales discounts; and an estimated liability for future product returns (collectively, “sales deductions”). We adjust our estimates at the earlier of when the most likely amount of consideration we expect to receive changes, or when the consideration becomes fixed. For a complete description of our revenue recognition policy, see Part I, Item 1, Financial Statements, Note 2, Revenue from Product Sales, in the Notes to Condensed Consolidated Financial Statements. In addition, see Results of Operations, Sales deductions and related accruals for more information.ClinicalResearch and Development ExpensesResearchWe estimate preclinical and development costs primarily consist of: employee-relatedclinical trial expenses including salaries and benefits; share-based compensation expense; expenses incurred under agreementsbased on services performed pursuant to contracts with research institutions, clinical investigators, clinical research organizations (CROs); fees paid to investigators who are participating in our clinical trials; consultants and other vendorsservice providers that assist inconduct activities on the conductCompany’s behalf. If the actual timing of the Company’s clinical trials;performance of services or the costlevel of acquiring and manufacturing clinical trial materials, including materials used in process validation (i.e., to the extent that those materials are manufactured prior to receiving regulatory approval for those products and are not expected to be sold commercially); facilities costs that do not have an alternative future use; related depreciation and other allocated expenses; license fees for and milestoneeffort varies from our estimate, we adjust our accrued expenses or our deferred advance payments related to in-licensed products and technologies; and costs associated with animal testing activities and regulatory approvals. Assets acquired that are used foraccordingly. For a complete description of our research and development expense, preclinical trial, and that have no future alternative use are expensed as in-process researchclinical trial accrual policies, see Part I, Item 1, Financial Statements, Note 2, Summary of Significant Accounting Policies—Research and development.ClinicalDevelopment Expense and Related Accrued Research and Development Expensessubstantial period of time,month or several months, we are often are required to estimate, and therefore accrue, a significant portion of our clinicalthe incurred expenses. This process involves reviewing open contracts and communicating with our subject matter expert personnel, as well as with the appropriate service provider personnel, to identify services that have been performed on our behalf but for which no invoice has been received. This includes services provided by CROs, as well as services provided by clinical investigators and other service providers. We accrue the cost for unbilled services performed, bothwhether partially andor fully completed, and the associated cost incurred. We work with each service provider to obtain an estimate for incurred but unbilled services as of the end of the calendar quarter, including estimates for payments to site investigators.companyCompany generated calculations.calculations by relying primarily on estimates provided by our vendors. If we and/or the service provider underestimates or overestimates the costcosts associated with a trial or service at any given point in time, adjustments to research and development expenses maywould be necessary in the following periods. Historically, our estimated accrued clinical expenses have closely approximated the actual expenses incurred.three month periodsThree Months ended March 31, 20192020 and 2018including percent changes (dollar amount(dollars in thousands):Three Months ended
March 31,Change 2020 2019 Amount Percent Net product sales Trokendi XR $ 68,551 $ 63,693 $ 4,858 8% Oxtellar XR 23,939 19,406 4,533 23% Total net product sales $ 92,490 $ 83,099 $ 9,391 11% Royalty revenues 2,486 2,375 111 5% Total revenues $ 94,976 $ 85,474 $ 9,502 11% based oncomputed as gross revenue generated from our product shipments to our customers, which are primarily pharmaceutical wholesalers and distributors, less estimates various forms of variable consideration, including: estimated liabilityrebates,rebates; estimated liability for future product returnsreturns; and estimated allowance for discounts. These are collectively considered "sales deductions."discounts.third quarter of 2018. We estimate that this caused net product sales to be approximately $10 million higher in the fourth quarter of 2018 than it would have been otherwise, had channel inventory levels remained consistent, quarter topreceding quarter.processaction was effectively reversed in the first quarter of 2019. Specifically, based on analysis of sales and inventory data, inventory levels at wholesalers, distributors, and pharmacies declined to the prevailing levels of the third quarter of 2018. As a result, both gross sales and net product sales decreased in the first quarter of 2019 as compared both towere adversely impacted, with the prior year as well as the prior quarter. The adverse impact on net product sales due to the reduction in channel inventory is estimated atof approximately $10 million.Partially offsettingreduction in channel inventory was year over year growth in prescriptions of 11%, coupled with price increases. For the three month period ended March 31,provision for sales deductions and reduced net product sales decreased by $6.0 million, from 2018 to 2019.decreased $6.9increased by $4.9 million, or 10% for the three month period ended March 31, 2019 versus 2018. The primary driver was the aforementioned channel inventory reduction, which was partially offset by growth in prescriptions and the net impact of an 8% price increase. Oxtellar XR net product sales grew by $0.8 million, or 5%, for the three month periodmonths ended March 31, 20192020, as compared to 2018. Growththe same period in prescription volumes and2019. This increase was driven by the netfavorable impact of an 8% price increase were modestlyin 2020. The adverse impact in sales deductions year over year was essentially offset by the negative impact in the first quarter of 2019 of the aforementioned channel inventory reduction.and recordson our condensed consolidated balance sheets. We record sales discounts as an a valuation allowance against Accounts receivable valuation allowance.on the condensed consolidated balance sheets. These outstanding amounts are generally affected by changes in the level of gross product sales, changes in the provision for net product sales deductions and timing of payments/credits.forduring the three month periods ended March 31, 2019 and 2018,indicated, (dollars in thousandsthousands):Accrued Product Returns and Rebates Product
RebatesProduct
ReturnsAllowance for
Sales DiscountsTotal Balance at December 31, 2019 $ 88,811 $ 18,818 $ 11,013 $ 118,642 Provision Provision for sales in current year 87,114 2,681 15,524 105,319 Adjustments relating to prior year sales 3,716 7,951 147 11,814 Total provision $ 90,830 $ 10,632 $ 15,671 $ 117,133 Less: Actual payments/credits (85,029) (4,609) (16,398) (106,036) Balance at March 31, 2020 $ 94,612 $ 24,841 $ 10,286 $ 129,739 dollars:Balance at December 31, 2018 $ 85,003 $ 22,060 $ 11,548 $ 118,611 Provision Provision for sales in current year 63,941 1,724 11,214 76,879 Adjustments relating to prior year sales (844) (42) (43) (929) Total provision $ 63,097 $ 1,682 $ 11,171 $ 75,950 Less: Actual payments/credits (82,010) (1,632) (14,909) (98,551) Balance at March 31, 2019 $ 66,090 $ 22,110 $ 7,810 $ 96,010 fromon gross product sales wasincreased by $41.2 million, from $76.0 million in 2019 to $117.1 million in 2020. Approximately 67% of this increase, or $27.7 million, was attributable to the year over year increase in the provision for product rebates, from $63.1 million in 2019 to $90.8 million in 2020.$66.7managed care programs. Growth in prescriptions, and the impact of the 8% price increase taken in January 2020, also contributed to the increase in product rebates.month periodsmonths ended March 31, 2019 and 2018, respectively. The overall increase2020, respectively, was due primarily to unfavorable actual returns experience in the first quarter of 2020 for discontinued blister pack Trokendi XR configurations.was directly related to growthfor product returns, based on the most recent experience. This change in prescriptions, the growthestimate resulted in Medicaid rebates consequent to taking price increases, and higher levels of patient co-pay assistance in responsean increase to the growth in high deductible health care plans. Adjustments related to prior year sales due to changes in estimate had a de minimis impact onprovision for product returns of $8.0 million, decreased net product sales of $8.0 million and decreased net earnings of $5.9 million, or $0.11 per basic and per diluted share, for the periodsthree months ended March 31, 2020.2018.revenuesrevenue includes royalty revenueroyalties from the following products (dollars in thousands):Three Months ended
March 31,Change 2020 2019 Amount Percent $ 919 $ 800 $ 119 15% 1,567 1,575 (8) (1)% Total $ 2,486 $ 2,375 $ 111 5% (now a subsidiary of Takeda Pharmaceuticals Company Ltd.), and non-cashconsequentpursuant to theour agreement with Healthcare Royalty Partners III, L.P. (HC Royalty) arrangement.. HC Royalty receives royalty payments from United Therapeutics Corporation (United Therapeutics), based on net product sales of United Therapeutics’ product Orenitram.grew 81% inwere essentially flat for the three month periodmonths ended March 31, 2019,2020, compared to the same period in 2018, primarily due to increased sales2019.Product Salesproduct salesgoods sold during the periods indicated including percent changes (dollar amounts(dollars in thousands):Three Months ended
March 31,Change 2020 2019 Amount Percent Cost of goods sold $ 4,152 $ 3,684 $ 468 13% product salesgoods sold during the three month periodmonths ended March 31, 20192020 was $4.2 million, $0.5 million higher than the $3.7 million slightly higher than $3.3 millionincurred for the same period in 2018.2019. The increase iswas primarily attributable to higher unit volume, partially offset by manufacturing efficiencies.expenses (R&D) expenses during the periods indicated including percent changes (dollar amounts(dollars in thousands):Three Months ended
March 31,Change 2020 2019 Amount Percent Research and development $ 18,937 $ 15,394 $ 3,543 23% decreasedincreased by $3.5 million or 19%, in the three month periodmonths ended March 31, 20192020 as compared to the same period in 2018. This decrease is2019. The increase quarter over quarter was primarily driven by enrollment in the completion of the fourSPN-812 Phase III clinical trialsprogram for SPN-812adults that was initiated in late 2018/early 2019, partially offset by the manufacture of validation and registration lots for SPN-812 to support our upcoming NDA filing.expenses (SG&A) expenses during the periods indicated including percent changes (dollar amounts(dollars in thousands):Three Months ended
March 31,Change 2020 2019 Amount Percent Selling and marketing $ 29,041 $ 30,749 $ (1,708) (6)% General and administrative 13,834 10,219 3,615 35% Total $ 42,875 $ 40,968 $ 1,907 5% increaseddecreased by $4.1$1.7 million or 15%, in the three month periodmonths ended March 31, 20192020 as compared to the same period in 2018. Approximately $3.8 million of the total increase is2019. The change was due to increaseddecreased employee-related expenses for promotionalof $0.5 million and marketing programs, speaker programsexpense for commercial products of $2.3 million, partially offset by increased professional and consulting services to support our commercial products, particularly the migraine indicationspending for Trokendi XR and the launchSPN-812 pre-launch activities of monotherapy for partial seizures, in January 2019, for Oxtellar XR.administrative.Administrative. General and administrative expenses increased slightly by $46,000, in$3.6 million for the three month periodmonths ended March 31, 2019,2020 as compared to the same period in 2018,2019. The change was primarily due to the $1.4 million increase in employee-related expenses due to increased cost of facilitiesheadcount and insurance offset by a decreasehigher share-based compensation expense, $1.3 million increase in patent amortization expense.Expensesexpensesincome (expense) during the periods indicated including percent changes (dollar amounts(dollars in thousands):Three Months ended
March 31,Change 2020 2019 Amount Percent Interest income $ 5,777 $ 4,681 $ 1,096 23% Interest expense (4,693) (4,710) 17 —% Interest expense on nonrecourse liability related to sale of future royalties (1,062) (1,160) 98 (8)% Total $ 22 $ (1,189) $ 1,211 (102)% $3.5$1.1 million infor the three month periodmonths ended March 31, 20192020, primarily due to gains from sales and maturity of marketable securities.2018. This increase was primarily attributable to an increase in cash, cash equivalents and marketable security holdings resultant from the issuance of $402.5 million of 0.625% Convertible Senior Notes, due 2023 (2023 Notes) in March 2018.Interest expense increased by approximately $4.0 million in the three month period ended March 31, 2019 as compared to the same period in 2018. The increase was primarily due to non-cash interest expense of $3.8 million related to the amortization of deferred financing costs and debt discount on the 2023 Notes recorded in the first quarter of 2019.Non-cash interest expense related to our non-recourse royalty liability increased by $0.5 million in the three month period ended March 31, 2019 as compared to the same period in 2018, primarily due to changes in the projection of future royalties on sales of Orenitram, coupled with an increase in the liability amortization term as a result of a favorable settlement of patent litigation for United Therapeutics.including percent changes (dollar amounts(dollars in thousands):Three Months ended
March 31,Change 2020 2019 Amount Percent Income tax expense $7,516 $5,899 $1,617 27% Effective tax rate 25.9% 24.3% increaseincreases in income tax expense and in the effective tax rate for the three month periodmonths ended March 31, 20192020, as compared to the same periodsperiod in 2018 isthe prior year, was primarily attributable to larger excess tax benefits consequenthigher income before taxes, increase in the number of states in which we owe taxes and an increase in non-deductible expenses.Three Months ended March 31, Change 2020 2019 Amount Percent Net earnings $ 21,518 $ 18,340 $ 3,178 17% exercises of employee stock options in 2018. The Company recorded income tax benefits related to exercise of employee stock options of approximately $0.3 million and $2.0 million for the three month periods ended March 31, 2019 and 2018, respectively.Liquidity and Capital ResourcesSinceincreased revenue generated from our inception in 2005, we have devoted most of our cash resources to manufacturing, research and development, and selling, general and administrative activities related to the development and commercialization of ourtwo commercial products, Trokendi XR and Oxtellar XR,XR.our product candidates. We are highly dependent on the commercial success of our two commercial products, which we launched in 2013. Capital Resourcessecurities, borrowings under debt facilities, royaltysecurities. Continued cash generation is highly dependent on the commercial success of our two commercial products, Trokendi XR and licensing arrangements.netexisting cash and cash equivalents, marketable securities and cash received from product sales will be sufficient to finance ongoing operations, indevelop our new products and fund label expansions for existing products. To continue to grow our business over the current yearlong-term, we plan to commit substantial resources to: product development and subsequent years, including R&D expenses for our clinical trials increased expenses to support our commercial productsof product candidates; product acquisition; and pre-launch activities in anticipation of launching our product candidates. We also expect to incur increased R&D expenses for 2019 to support the development of SPN-810, SPN-812, SPN-817,in-licensing; and SPN-604.We expect our SG&A expenses to continue to increase for the foreseeable future, as we continue to invest in the commercialization of Trokendi XR and Oxtellar XR, and in supportive functions such as compliance, finance, management of and information technology systems and personnel. In each case, spending iswould be commensurate with the growth of ourthe business.are actively looking formay, from time to time, consider raising additional capital through: new collaborative arrangements; strategic alliances; additional equity and/or debt financings; or financing from other sources, especially in conjunction with opportunistic business development opportunities.March 31 December 31 Change 2020 2019 Amount Percent Cash and cash equivalents $ 225,767 $ 181,381 $ 44,386 24% Marketable securities 175,104 165,692 9,412 6% Long term marketable securities 534,712 591,773 (57,061) (10)% Total $ 935,583 $ 938,846 $ (3,263) —% Working capital 388,713 312,057 76,656 25% Convertible notes, net (2023 Notes) 349,232 345,170 4,062 1% Total stockholder's equity 613,383 595,428 17,955 3% 20192020 was $268.3$388.7 million, a decreasean increase of $63.8$76.7 million, as compared to $332.1$312.1 million at December 31, 2018.2019. The decreaseincrease was primarily due to timingincreased accounts receivable of receivable collections$31.9 million and increased investment in long term marketable securities. In addition, our long termcash, cash equivalents, and marketable securities at March 31, 2019 were $522.6of $53.8 million an increaseoffset by increases in current liabilities of $103.8 million, as compared to $418.8 million at December 31, 2018. This increase was primarily attributable to the net cash proceeds generated from operations.Our stockholders’ equity increased by $27.0$7.7 million during the three month periodmonths ended March 31, 2020.$18.3$21.5 million coupled with option exercises, share-based compensation andof $4.0 million. These increases were offset by unrealized gainslosses on marketable securities, net of $4.6tax of $7.6 million. These changes were partially offset by the purchaseconvertible note hedges, as described below.We achieved positive cash flow and achieved profitability from operations in the three month periods ended March 31, 2019 and 2018. While we expect continued profitability in the current year and in subsequent years as we continue to increase sales, we anticipate there may be significant variability from quarter to quarter in our level of profitability.Three Months ended March 31, Change 2020 2019 Amount Net cash provided by (used in): Operating activities Operating earnings $ 32,176 $ 27,071 $ 5,105 Working capital (23,260) 5,922 (29,182) Total operating activities 8,916 32,993 (24,077) Investing activities 35,438 (103,246) 138,684 Financing activities 32 783 (751) Net change in cash and cash equivalents $ 44,386 $ (69,470) $ 113,856 earningsearnings; and cash provided by (used in) changes in working capital. The decrease in net cash provided by operating activities, is$8.9 million, was primarily driven by a period over period decreaseincreased operating earnings, but reduced by increased working capital. Cash utilized in revenue generated from salesworking capital primarily reflects the timing impacts of our two commercial products, Trokendi XRcash collections on receivables and Oxtellar XR.thousands: Three Months ended March 31, 2020 2019 Explanation of Change (Increase) Decrease in: Accounts receivable $ (31,823) $ 23,013 Receivables increase in 2020 is due to increase in prescription volume and timing of receivable collections. Receivables decreased in 2019 because of sequential decline in prescription volume, coupled with channel inventory reduction in first quarter 2019. Inventories 2,210 (859) Decreased inventory due to increased product demand; timing of inventory production. Prepaid expenses, other current assets and other assets (454) (1,995) Timing differences related to deposits for equipment purchases in 2019 and prepaid clinical trial costs. Increase (Decrease) in: Accounts payable and accrued expenses and noncurrent liabilities (10,651) 868 Timing of vendor payments. Accrued product returns and rebates 11,824 (18,863) Timing of rebate payments; increased provision for rebates due to growth in prescriptions; growth in Medicaid and managed care rebates; higher expenditures for patient co-pay programs; higher provision for returns in 2020; impact of channel inventory reduction in first quarter 2019. Income taxes payable 6,654 4,856 Increased current tax provision due to higher taxable income. Other (1,020) (1,098) Decreased employee-related costs. Total $ (23,260) $ 5,922 increased by $52.2of $103.2 million for the same period in 2019. The change is primarily due to higher levels of purchases of marketable securities in 2019. These purchases reflect investment of excess cash in long term marketable securities.month periodmonths ended March 31, 2019,2020 remained essentially unchanged as compared to the same period 2018. The increase was primarily due to net purchases of marketable securities.Financing ActivitiesNet cash provided by financing activities decreased to $0.8 million for the three month periods ended March 31, 2019 versus $367.7 million provided in the same period in 2018. The decrease was primarily related to issuance of the 2023 Notes and the related convertible note hedges and warrants, in March 2018.“Contractual“Contractual Obligations and Commitments” section withinin “Part II, Item 7 — Management’s Discussion and Analysis of Liquidity and Capital Resources” of our Annual Report on Form 10-K for the year ended December 31, 20182019, for a discussion of our contractual obligations.In addition, duringfirst quarter of 2019, weCompany entered into a new lease agreementDevelopment and Option Agreement (Development Agreement) with Advent Key West, LLCNavitor Pharmaceuticals, Inc. (Navitor). Under the terms of the Development Agreement, the Company and Navitor will jointly conduct a Phase II clinical program for our new headquartersNV-5138 in Rockville, MD. Refertreatment-resistant depression. In addition, Navitor has granted the Company an exclusive option to Note 14license or acquire NV-5138 in all world territories, excluding Greater China, prior to initiation of a Phase III clinical program. In consideration of the rights granted under the Development Agreement, the Company will make a one time, non-refundable and non-creditable cash payment of $25 million to Navitor in the Notessecond quarter of 2020, comprised of an option fee of $10 million and $15 million for preferred equity shares, representing approximately 13% ownership in Navitor. The Company will also bear all development costs incurred up to Condensed Consolidated Financial Statementsa maximum of $50 million.Part I, Item 1late-stage development to its CNS portfolio. The transaction is expected to close in the second quarter of this Quarterly Report on Form 10-Q.On January 1, 2019, we adopted Accounting Standards Codification (ASC) Topic 842, Leases, or ASC 842. liquidity risk. risk of default by investing in investment grade securities with maturities of four years or less. We do not enter into financial instruments for trading or speculative purposes.$815.5 million. $935.6 million and $938.8 million, respectively. Our cash and cash equivalents consist primarily of cash held at banks, certificates of deposit and money market funds, all of which have short-term maturities.Notes andNotes. Issuance of warrants was intended to partially offset the cost to purchase the Convertible Note Hedge Transactions, respectively. We do not engage in any hedging activities against changes in interest rates. Because of the short-term maturities of our cash, cash equivalents, marketable securities and long term marketable securities, and because we generally hold these securities to maturity, we do not believe that an increase in interest rates would have any significant impact on the realizable value of our investments. Transactions.the outstanding warrants to purchase common stock and the convertible note hedges.United States.U.S. We do not hedge our foreign currency exchange rate risk. Transactions denominated in currencies other than the U.S. dollar are recorded based on exchange rates at the time such transactions arise. As of March 31, 20192020 and December 31, 2018,2019, substantially all of our liabilities were denominated in the U.S. dollar.clinical trial costs.the cost of services provided by our vendors. We do not believe that inflation and changing prices over the three month periodsmonths ended March 31, 20192020 and 20182019 had a significant impact on our condensed consolidated results of operations.forms, and thatforms. Moreover, such information is accumulated and communicated to our management, including our CEO and CFO, to allow timely decisions regarding required disclosure.2019,2020, the end of the period covered by this report. Based on that evaluation, under the supervision and with the participation of our management, including our CEO and CFO, we concluded that our disclosure controls and procedures were effective as of March 31, 2019.2020.20192020 that have materially affected, or are reasonably likely to materially affect, our internal control over financial reporting. As of March 31, 2019,has no outstanding litigation.received a Paragraph IV Notice Letter from Apotex Inc. and Apotex Corp advising Supernus of the submission by Apotex of an Abbreviated New Drug Application to the U.S. Food and Drug Administration (FDA) seeking approval for oxcarbazepine extended-release tablets. The Company is currently reviewing the details of this Notice Letter and intends to vigorously enforce its intellectual property rights relating to Oxtellar XR.notes, andnotes; the additional information in the other reports we file with the Securities and Exchange Commission, along withCommission; and the risks described in our Annual Report on Form 10-K for the year ended December 31, 2018.2019. These risks may result in material harm to our business and our financial condition and results of operations. In such an eventuality,If a material, adverse event were to occur, the market price of our common stock may decline and you could lose part or all of your investment.month periodmonths ended March 31, 2019,2020, the Company granted options to employees and directors to purchase an aggregate of 831,8351,105,925 shares of common stock at a weighted-average exercise price of $36.75$23.99 per share. Once vested, the options are exercisable for a period of ten years from the grant date. In addition, the Company granted restricted stock units of 26,055 shares at a weighted-average fair value grant date of $23.99 per share and performance stock units of 31,250 shares at a weighted-average fair value grant date of $23.70 per share. These issuances wereare exempt from registration in reliance on Section 4(a)(2) of the Securities Act as transactions not involving a public offering.31.131.1 Certification of Chief Executive Officer pursuant to Rule 13a-14(a). Certification of Chief Financial Officer pursuant to Rule 13a-14(a). Certification of Chief Executive Officer pursuant to 18 U.S.C. Section 1350, as adopted pursuant to Section 906 of the Sarbanes-Oxley Act of 2002. Certification of Chief Financial Officer pursuant to 18 U.S.C. Section 1350, as adopted pursuant to Section 906 of the Sarbanes-Oxley Act of 2002. 101.INSXBRL Instance Document.101.SCHTaxonomy Extension Schema Document.101.CALXBRL Taxonomy Extension Calculation Linkbase Document.101.DEFXBRL Taxonomy Extension Definition Linkbase Document.101.LABXBRL Taxonomy Extension Label/Linkbase Document.101.PREXBRL Taxonomy Extension Presentation Linkbase Document.EXHIBIT INDEXNumberDescriptionNumber Description 31.1 101.INSXBRL Instance Document.101.SCHTaxonomy Extension Schema Document.(included with the Exhibit 101 attachments).101.CALXBRL Taxonomy Extension Calculation Linkbase Document.101.DEFXBRL Taxonomy Extension Definition Linkbase Document.101.LABXBRL Taxonomy Extension Label/Linkbase Document.101.PREXBRL Taxonomy Extension Presentation Linkbase Document.SUPERNUS PHARMACEUTICALS, INC. 10, 2019
President, Secretary and Chief Executive OfficerDATED: May 15, 2020 By: DATED: May 10, 2019By:
Senior Vice President and Chief Financial Officer