UNITED STATES
SECURITIES AND EXCHANGE COMMISSION
WASHINGTON, D.C. 20549
FORM 10-Q
(Mark One)
x QUARTERLY REPORT PURSUANT TO SECTION 13 OR 15(d)15(D) OF THE SECURITIES EXCHANGE ACT OF 1934
For the quarterly period ended September 30, 2019March 31, 2020
OR
¨ TRANSITION REPORT PURSUANT TO SECTION 13 OR 15(d) OF THE SECURITIES EXCHANGE ACT OF 1934
For the transition period from____ to ____
Commission File Number: 001-32295
FENNEC PHARMACEUTICALS INC.
(Exact Name of Registrant as Specified in Its Charter)
British Columbia, Canada (State or Other Jurisdiction of Incorporation or Organization |
20-0442384 (I.R.S. Employer Identification No.) |
PO Box 13628, 68 TW Alexander Drive Research Triangle Park, North Carolina (Address of Principal Executive Offices) | 27709 (Zip Code) |
Registrant's Telephone Number, Including Area Code: (919) 636-4530
Securities registered pursuant to Section 12(b) of the Act:
Indicate by check mark whether the registrant: (1) has filed all reports required to be filed by section 13 or 15(d) of the Securities Exchange Act of 1934 during the preceding 12 months (or for such shorter period that the registrant was required to file such reports), and (2) has been subject to such filing requirements for the past 90 days. YESx NO¨
Indicate by check mark whether the registrant has submitted electronically and posted on its corporate Web site, if any, every Interactive Data File required to be submitted and posted pursuant to Rule 405 of Regulation S-T (§232.405 of this chapter) during the preceding 12 months (or for such shorter period that the registrant was required to submit and post such files).
Yesþx No¨
Indicate by check mark whether the registrant is a large accelerated filer, an accelerated filer, a non-accelerated filer, a smaller reporting company, or an emerging growth company. See the definitions of “large accelerated filer,” “accelerated filer,” “smaller reporting company,” and “emerging growth company” in Rule 12b-2 of the Exchange Act.
| Large Accelerated Filer | ¨ | Accelerated Filer | |||
| Non-Accelerated Filer | Smaller reporting company | x | |||
| Emerging growth company | ¨ |
If an emerging growth company, indicate by check mark if the registrant has elected not to use the extended transition period for complying with any new or revised financial accounting standards provided pursuant to Section 13(a) of the Exchange Act.¨
Indicated by check mark whether the registrant is a shell company (as defined in Rule 12b-2 of the Exchange Act).YES. YES¨NOx
Securities registered pursuant to Section 12(b) of the Act:
| Title of each class | Trading Symbol(s) | Name of each exchange on which registered |
| Common Shares, no par value | FENC | Nasdaq Capital Market |
As of November 12, 2019,May 13, 2020, there were 19,895,83025,356,034 shares of Fennec Pharmaceuticals Inc. common stock outstanding.
TABLE OF CONTENTS
2 |
Condensed Consolidated Balance Sheets
(U.S. Dollars and shares in thousands)
| March 31, | December 31, | |||||||||||||||
| September 30, 2019 | December 31, | 2020 | 2019 | |||||||||||||
| (unaudited) | 2018 | (unaudited) | ||||||||||||||
| Assets | ||||||||||||||||
| Current assets: | ||||||||||||||||
| Cash and cash equivalents | $ | 15,240 | $ | 22,781 | $ | 9,901 | $ | 13,650 | ||||||||
| Prepaid expenses | 387 | 168 | 220 | 226 | ||||||||||||
| Other current assets | - | 1 | 2 | 8 | ||||||||||||
| Total current assets | 15,627 | 22,950 | 10,123 | 13,884 | ||||||||||||
| Non-current assets: | ||||||||||||||||
| Deferred issuance costs | 326 | - | 326 | 326 | ||||||||||||
| Amortization of deferred issuance costs | (46 | ) | - | (81 | ) | (64 | ) | |||||||||
| Total non-current assets: | 280 | - | 245 | 262 | ||||||||||||
| Total assets | $ | 15,907 | $ | 22,950 | $ | 10,368 | $ | 14,146 | ||||||||
| Liabilities and stockholders' equity | ||||||||||||||||
| Current liabilities: | ||||||||||||||||
| Accounts payable | $ | 788 | $ | 1,032 | $ | 1,675 | $ | 1,612 | ||||||||
| Accrued liabilities | 117 | 605 | 232 | 659 | ||||||||||||
| Total current liabilities | 905 | 1,637 | 1,907 | 2,271 | ||||||||||||
| Commiments and Contingencies (Note 7) | ||||||||||||||||
| Stockholders' equity: | ||||||||||||||||
| Common stock, no par value; unlimited shares authorized; 19,896 shares issued and outstanding (2018-19,896) | 106,392 | 106,392 | ||||||||||||||
| Common stock, no par value; unlimited shares authorized; 19,896 shares issued and outstanding (2019-19,896) | 106,392 | 106,392 | ||||||||||||||
| Additional paid-in capital | 47,788 | 44,934 | 48,683 | 48,271 | ||||||||||||
| Accumulated deficit | (140,421 | ) | (131,256 | ) | (147,857 | ) | (144,031 | ) | ||||||||
| Accumulated other comprehensive income | 1,243 | 1,243 | 1,243 | 1,243 | ||||||||||||
| Total stockholders’ equity | 15,002 | 21,313 | 8,461 | 11,875 | ||||||||||||
| Total liabilities and stockholders’ equity | $ | 15,907 | $ | 22,950 | $ | 10,368 | $ | 14,146 | ||||||||
The accompanying notes are an integral part of these unaudited interim condensed consolidated financial statements.
3 |
Condensed Consolidated Statements of Operations
(U.S. Dollars and shares in thousands, except per share amounts)
(Unaudited)
| Three Months Ended | Nine Months Ended | Three Months Ended | ||||||||||||||||||||||
| September 30, | September 30, | September 30, | September 30, | March 31, | March 31, | |||||||||||||||||||
| 2019 | 2018 | 2019 | 2018 | 2020 | 2019 | |||||||||||||||||||
| Revenue | $ | - | $ | - | $ | - | $ | - | $ | - | $ | - | ||||||||||||
| Operating expenses: | ||||||||||||||||||||||||
| Research and development | 795 | 1,798 | 4,435 | 3,285 | 1,393 | 1,671 | ||||||||||||||||||
| General and administrative | 1,068 | 1,050 | 4,921 | 4,019 | 2,442 | 1,009 | ||||||||||||||||||
| Loss from operations | (1,863 | ) | (2,848 | ) | (9,356 | ) | (7,304 | ) | (3,835 | ) | (2,680 | ) | ||||||||||||
| Other (expense) income : | ||||||||||||||||||||||||
| Unrealized gain (Note 4) | - | - | - | 167 | ||||||||||||||||||||
| Other (loss)/gain | 1 | (2 | ) | (9 | ) | - | ||||||||||||||||||
| Other (loss) | (9 | ) | - | |||||||||||||||||||||
| Amortization expense | (17 | ) | - | (46 | ) | - | (17 | ) | (12 | ) | ||||||||||||||
| Interest income and other | 70 | 101 | 246 | 233 | 35 | 66 | ||||||||||||||||||
| Total other income/(expense), net | 54 | 99 | 191 | 400 | ||||||||||||||||||||
| Total other income, net | 9 | 54 | ||||||||||||||||||||||
| Net loss | $ | (1,809 | ) | $ | (2,749 | ) | $ | (9,165 | ) | $ | (6,904 | ) | $ | (3,826 | ) | $ | (2,626 | ) | ||||||
| Basic net loss per common share | $ | (0.09 | ) | $ | (0.14 | ) | $ | (0.46 | ) | $ | (0.37 | ) | $ | (0.19 | ) | $ | (0.13 | ) | ||||||
| Diluted net loss per common share | $ | (0.09 | ) | $ | (0.14 | ) | $ | (0.46 | ) | $ | (0.37 | ) | $ | (0.19 | ) | $ | (0.13 | ) | ||||||
| Weighted-average number of common shares outstanding, basic | 19,896 | 18,968 | 19,896 | 18,648 | 19,896 | 19,896 | ||||||||||||||||||
| Weighted-average number of common shares outstanding, diluted | 19,896 | 18,968 | 19,896 | 18,648 | 19,896 | 19,896 | ||||||||||||||||||
The accompanying notes are an integral part of these unaudited interim condensed consolidated financial statements.
4 |
Condensed Consolidated Statements of Cash Flows
(U.S. Dollars in thousands)
(Unaudited)
| Three Months Ended | Nine Months Ended | Three Months Ended | ||||||||||||||||||||||
| September 30, | September 30, | September 30, | September 30, | March 31, | March 31, | |||||||||||||||||||
| 2019 | 2018 | 2019 | 2018 | 2020 | 2019 | |||||||||||||||||||
| Cash flows used in: | ||||||||||||||||||||||||
| Operating activities: | ||||||||||||||||||||||||
| Net loss | $ | (1,809 | ) | $ | (2,749 | ) | $ | (9,165 | ) | $ | (6,904 | ) | $ | (3,826 | ) | $ | (2,626 | ) | ||||||
| Adjustments to reconcile net loss to net cash used in operating activities: | ||||||||||||||||||||||||
| Unrealized gain on derivative | - | - | - | (167 | ) | |||||||||||||||||||
| Amortization of deferred issuance cost | 17 | - | 46 | - | 17 | 12 | ||||||||||||||||||
| Stock-based compensation - contractors | 21 | 46 | 395 | 243 | 21 | 43 | ||||||||||||||||||
| Stock-based compensation - employees | 314 | 222 | 2,204 | 1,603 | 391 | 221 | ||||||||||||||||||
| Changes in operating assets and liabilities: | ||||||||||||||||||||||||
| Prepaid assets | (331 | ) | (351 | ) | (219 | ) | (283 | ) | 6 | 60 | ||||||||||||||
| Other current assets | 1 | 4 | 1 | 13 | 6 | (3 | ) | |||||||||||||||||
| Accounts payable | (440 | ) | 1,157 | (244 | ) | 1,011 | 63 | 266 | ||||||||||||||||
| Accrued liabilities | (8 | ) | 72 | (488 | ) | (412 | ) | (427 | ) | (452 | ) | |||||||||||||
| Net cash used in operating activities | (2,235 | ) | (1,599 | ) | (7,470 | ) | (4,896 | ) | (3,749 | ) | (2,479 | ) | ||||||||||||
| Financing activities: | ||||||||||||||||||||||||
| Short swing profit judgment offset with settlement expense | - | - | - | 18 | ||||||||||||||||||||
| Capitalized deferred issuance cost | - | - | (71 | ) | - | - | (71 | ) | ||||||||||||||||
| Options and warrants exercised | - | 483 | - | 1,142 | ||||||||||||||||||||
| Net cash provided by/(used in) financing activities | - | 483 | (71 | ) | 1,160 | |||||||||||||||||||
| Net cash used in financing activities | - | (71 | ) | |||||||||||||||||||||
| Decrease in cash and cash equivalents | (2,235 | ) | (1,116 | ) | (7,541 | ) | (3,736 | ) | (3,749 | ) | (2,550 | ) | ||||||||||||
| Cash and cash equivalents - Beginning of period | 17,475 | 25,640 | 22,781 | 28,260 | 13,650 | 22,781 | ||||||||||||||||||
| Cash and cash equivalents - End of period | $ | 15,240 | $ | 24,524 | $ | 15,240 | $ | 24,524 | $ | 9,901 | $ | 20,231 | ||||||||||||
| Supplemental non-cash disclosure: | ||||||||||||||||||||||||
| Non-cash deferred issuance cost (warrant value) | $ | - | $ | - | $ | 255 | $ | - | $ | - | $ | 255 | ||||||||||||
The accompanying notes are an integral part of these unaudited interim condensed consolidated financial statements.
5 |
Condensed Consolidated Statements of Stockholders' Equity
Three Months Ended March 31, 2020 and nine-Months Ended September 30, 2019 and 2018
(U.S. dollars and shares in thousands)
(Unaudited)
| Accumulated | Accumulated | |||||||||||||||||||||||||||||||||||||||||||||||
| Additional | Other | Total | Additional | Other | Total | |||||||||||||||||||||||||||||||||||||||||||
| Common Stock | Paid-in | Accumulated | Comprehensive | Stockholders' | Common Stock | Paid-in | Accumulated | Comprehensive | Stockholders' | |||||||||||||||||||||||||||||||||||||||
| Number (Note 4) | Amount | Capital | Deficit | Income | Equity | |||||||||||||||||||||||||||||||||||||||||||
| Balance at December 31, 2019 | 19,896 | $ | 106,392 | $ | 48,271 | $ | (144,031 | ) | $ | 1,243 | $ | 11,875 | ||||||||||||||||||||||||||||||||||||
| Stock options issued to employees | - | - | 391 | - | - | 391 | ||||||||||||||||||||||||||||||||||||||||||
| Stock options issued to contractors | - | - | 21 | - | - | 21 | ||||||||||||||||||||||||||||||||||||||||||
| Net loss | - | - | - | (3,826 | ) | - | (3,826 | ) | ||||||||||||||||||||||||||||||||||||||||
| Balance at March 31, 2020 | 19,896 | $ | 106,392 | $ | 48,683 | $ | (147,857 | ) | $ | 1,243 | $ | 8,461 | ||||||||||||||||||||||||||||||||||||
| Number (Note 5) | Amount | Capital | Deficit | Income | Equity | |||||||||||||||||||||||||||||||||||||||||||
| Balance at December 31, 2018 | 19,896 | $ | 106,392 | $ | 44,934 | $ | (131,256 | ) | $ | 1,243 | $ | 21,313 | 19,896 | $ | 106,392 | $ | 44,934 | $ | (131,256 | ) | $ | 1,243 | $ | 21,313 | ||||||||||||||||||||||||
| Stock options issued to employees | - | - | 221 | - | - | 221 | - | - | 221 | - | - | 221 | ||||||||||||||||||||||||||||||||||||
| Stock options issued to contractors | - | - | 43 | - | - | 43 | - | - | 43 | - | - | 43 | ||||||||||||||||||||||||||||||||||||
| Warrants issued to consultants | - | - | 255 | - | - | 255 | - | - | 255 | - | - | 255 | ||||||||||||||||||||||||||||||||||||
| Net loss | - | - | - | (2,626 | ) | - | (2,626 | ) | - | - | - | (2,626 | ) | - | (2,626 | ) | ||||||||||||||||||||||||||||||||
| Balance at March 31, 2019 | 19,896 | $ | 106,392 | $ | 45,453 | $ | (133,882 | ) | $ | 1,243 | $ | 19,206 | 19,896 | $ | 106,392 | $ | 45,453 | $ | (133,882 | ) | $ | 1,243 | $ | 19,206 | ||||||||||||||||||||||||
| Stock options issued to employees | - | - | 1,669 | - | - | 1,669 | ||||||||||||||||||||||||||||||||||||||||||
| Stock options issued to contractors | - | - | 331 | - | - | 331 | ||||||||||||||||||||||||||||||||||||||||||
| Net loss | - | - | - | (4,730 | ) | - | (4,730 | ) | ||||||||||||||||||||||||||||||||||||||||
| Balance at June 30, 2019 | 19,896 | $ | 106,392 | $ | 47,453 | $ | (138,612 | ) | $ | 1,243 | $ | 16,476 | ||||||||||||||||||||||||||||||||||||
| Stock options issued to employees | - | - | 314 | - | - | 314 | ||||||||||||||||||||||||||||||||||||||||||
| Stock options issued to contractors | - | - | 21 | - | - | 21 | ||||||||||||||||||||||||||||||||||||||||||
| Net loss | - | - | - | (1,809 | ) | - | (1,809 | ) | ||||||||||||||||||||||||||||||||||||||||
| Balance at September 30, 2019 | 19,896 | $ | 106,392 | $ | 47,788 | $ | (140,421 | ) | $ | 1,243 | $ | 15,002 | ||||||||||||||||||||||||||||||||||||
| Balance at December 31, 2017 | 18,411 | $ | 103,045 | $ | 43,837 | $ | (121,368 | ) | $ | 1,243 | $ | 26,757 | ||||||||||||||||||||||||||||||||||||
| Stock options issued to employees | - | - | 174 | - | - | 174 | ||||||||||||||||||||||||||||||||||||||||||
| Stock options issued to contractors | - | - | 114 | - | - | 114 | ||||||||||||||||||||||||||||||||||||||||||
| Exercise of stock options | 23 | 71 | (35 | ) | - | - | 36 | |||||||||||||||||||||||||||||||||||||||||
| Exercise of warrants | 50 | 221 | (71 | ) | - | - | 150 | |||||||||||||||||||||||||||||||||||||||||
| Net loss | - | - | - | (1,568 | ) | - | (1,568 | ) | ||||||||||||||||||||||||||||||||||||||||
| Balance at March 31, 2018 | 18,484 | 103,337 | 44,019 | (122,936 | ) | 1,243 | 25,663 | |||||||||||||||||||||||||||||||||||||||||
| Short swing profit Manchester | - | - | 18 | - | - | 18 | ||||||||||||||||||||||||||||||||||||||||||
| Stock options issued to employees | - | - | 1,207 | - | - | 1,207 | ||||||||||||||||||||||||||||||||||||||||||
| Stock options issued to contractors | - | - | 83 | - | - | 83 | ||||||||||||||||||||||||||||||||||||||||||
| Exercise of stock options | 18 | 75 | (40 | ) | - | - | 35 | |||||||||||||||||||||||||||||||||||||||||
| Exercise of warrants | 292 | 598 | �� | (160 | ) | - | - | 438 | ||||||||||||||||||||||||||||||||||||||||
| Net loss | - | - | - | (2,587 | ) | - | (2,587 | ) | ||||||||||||||||||||||||||||||||||||||||
| Balance at June 30, 2018 | 18,794 | 104,010 | 45,127 | (125,523 | ) | 1,243 | 24,857 | |||||||||||||||||||||||||||||||||||||||||
| Stock options issued to employees | - | - | 222 | - | - | 222 | ||||||||||||||||||||||||||||||||||||||||||
| Stock options issued to contractors | - | - | 46 | - | - | 46 | ||||||||||||||||||||||||||||||||||||||||||
| Exercise of stock options | 81 | 290 | (151 | ) | - | - | 139 | |||||||||||||||||||||||||||||||||||||||||
| Exercise of warrants | 229 | 470 | (126 | ) | - | - | 344 | |||||||||||||||||||||||||||||||||||||||||
| Net loss | - | - | - | (2,749 | ) | - | (2,749 | ) | ||||||||||||||||||||||||||||||||||||||||
| Balance at September 30, 2018 | 19,104 | $ | 104,770 | $ | 45,118 | $ | (128,272 | ) | $ | 1,243 | $ | 22,859 | ||||||||||||||||||||||||||||||||||||
The accompanying notes are an integral part of these unaudited interim condensed consolidated financial statements.
6 |
Notes to the Unaudited Interim Condensed Consolidated Financial Statements
(U.S. dollars and shares in thousands, except per share information)
1. Nature of Business and Going Concern
Fennec Pharmaceuticals Inc. (“Fennec,” the “Company,” “we,” “us,” or “our”) is a biopharmaceutical company focused on the development of PEDMARKTM (a unique formulation of Sodium Thiosulfate (“STS”))Thiosulfate) for the prevention of platinum-induced ototoxicity in pediatric cancer patients. We incorporated under the Canada Business Corporations Act ("CBCA”) in September 1996. Effective on August 25, 2011, the Company continued from the CBCA to the Business Corporations Act (British Columbia) (the “Continuance”). The Continuance was approved by our shareholders at our June 2011 Annual and Special Meeting and by resolution of the Board of Directors on August 10, 2011. We have four wholly-owned subsidiaries: Oxiquant, Inc. and Fennec Pharmaceuticals, Inc., both Delaware corporations, Cadherin Biomedical Inc., a Canadian company and Fennec Pharmaceuticals (EU) Limited (“Fennec Limited”), an Ireland company formed in 2018. With the exception of Fennec Pharmaceuticals, Inc., all subsidiaries are inactive.
These unaudited interim condensed consolidated financial statements have been prepared in accordance with generally accepted accounting principles in the United States of America (“US GAAP”) that are applicable to a going concern which contemplates that the Company will continue in operation for the foreseeable future and will be able to realize its assets and discharge its liabilities in the normal course of business.
During the three and nine-monthsthree-months ended September 30, 2019,March 31, 2020, the Company incurred a loss from operations of $1,863 and $9,356, respectively.$3,835. At September 30, 2019, the CompanyMarch 31, 2020, it had an accumulated deficit of $140.4$147.9 million and had experienced negative cash flows from operating activities during the three and nine-monthsthree-months ended September 30, 2019March 31, 2020 in the amount of $2,235 and $7,470, respectively.$3,749.
On February 1, 2019, the Company’s wholly-owned subsidiary, Fennec Pharmaceuticals Inc., entered into a Loan and Security Agreement with Bridge Bank, a division of Western Alliance Bank, an Arizona corporation, pursuant to which the Bank agreed to loan $12.5 million to the Company, to be made available upon New Drug Application (“NDA”)NDA approval of PEDMARKTM by no later than September 30, 2020. The proceeds from the loan will be used for working capital purposes and to fund general business requirements in accordance with the terms of the Loan and Security Agreement. Interest under the Term Loans shall bear interest, on the outstanding daily balance thereof, at a floating per annum rate equal to the Effective Interest Rate (as defined in the Loan and Security Agreement) which is equal to the sum of the Prime Rate published in the Wall Street Journal (currently 5.0%3.25%) plus one percent (1.00%). The debt facility is to have interest-only monthly payments due for the first eighteen months from the funding date and then monthly principal and interest payments are due through the remainder of the term which has a maturity date of October 1, 2023. In connection with the facility, Fennec granted Bridge Bank a warrant to purchase up to 3939,130 common shares at an exercise price of $6.80 per common share, for a term of ten years from the date of issuance, subject to early termination under certain conditions.
The Company believes the aforementioned debt facility, along with current cash on hand,plus funds raised subsequent to March 31, 2020 in the public offering which closed in May of 2020, provides sufficient funding for the Company to carry-out its planned activities including NDA approval and the commencement of commercialization efforts for the at least the next twelve to fifteentwenty four months as it continues its strategic development of PEDMARKTM.
These financial statements do not reflect the potentially material adjustments in the carrying values of assets and liabilities, the reported expenses, and the balance sheet classifications used, that would be necessary if the going concern assumption were not appropriate.
2. Significant Accounting Policies
Fennec Pharmaceuticals Inc.
Notes to the Unaudited Interim Condensed Consolidated Financial Statements
(U.S. dollars and shares in thousands, except per share information)
Basis of presentation
The accompanying unaudited interim condensed consolidated financial statements have been prepared in accordance with US GAAP and are the responsibility of the Company’s management. These unaudited interim condensed consolidated financial statements do not include all of the information and notes required by US GAAP for annual financial statements. Accordingly, these unaudited interim condensed consolidated financial statements should be read in conjunction with the Company's audited consolidated financial statements and notes filed with the Securities and Exchange Commission (“SEC”) in the Company's Annual Report on Form 10-K for the year ended December 31, 2018.2019. The Company's accounting policies are materially consistent with those presented in the audited consolidated financial statements included in the Annual Report on Form 10-K for the year ended December 31, 2018.2019. These unaudited interim condensed consolidated financial statements have been prepared in U.S. dollars. All amounts presented are in thousands except for per share amounts.
Use of estimates
The preparation of financial statements in conformity with US GAAP requires management to make estimates and assumptions that impact the reported amounts of assets and liabilities and disclosure of contingent assets and liabilities as of the date of the interim condensed consolidated financial statements and the reported amounts of expense during the reporting period. Actual results could differ from those estimates.
7 |
Fennec Pharmaceuticals Inc.
Notes to the Unaudited Interim Condensed Consolidated Financial Statements
(U.S. dollars and shares in thousands, except per share information)
In the opinion of management, these unaudited interim condensed consolidated financial statements include all adjustments, which are normal and recurring in nature, necessary for the fair presentation of the Company’s financial position at September 30, 2019March 31, 2020 and to state fairly the results for the periods presented. The most significant estimates utilized during the nine monthsquarter ended September 30, 2019March 31, 2020 included estimates necessary to value grants of stock options to contractorsemployees and employees andvarious contractors, warrants issued to Bridge Bank in connection with the aforementionedto secure debt facility, disclosed in Note 5.4.
New accounting pronouncements
In August 2018, the FASB issued ASU 2018-13, Fair Value Measurement (Topic 820): Disclosure Framework-Changes to the Disclosure Requirements for Fair Value Measurement. ASU 2018-13 removes certain disclosures, modifies certain disclosures and adds additional disclosures. The ASU is effective for us on January 1, 2020, and interim periods within that fiscal year. Early adoption is permitted. Certain disclosures in ASU 2018-13 would need to be applied on a retrospective basis and others on a prospective basis. We are currently evaluating the impact this guidance may have on our consolidated financial statements.
In June 2018, the FASB issued ASU 2018-07 to expand the scope of ASC Topic 718, Compensation - Stock Compensation (Topic 718): Improvements to Nonemployee Share-Based Payment Accounting, to include share-based payment transactions for acquiring goods and services from nonemployees. The pronouncement is effective for fiscal years, and for interim periods within those fiscal years, beginning after December 15, 2018. We adopted this policy as of January 1, 2019. The Company concluded after evaluation, that the impact of ASU 2018-072018-13 on our consolidated financial statements and disclosures was de minimis.
In February 2016, the FASB issued ASU 2016-02, Leases (Topic 842). The new guidance requires the recognition of lease liabilities, representing future minimum lease payments, on a discounted basis, and corresponding right-of-use assets on a balance sheet for most leases, along with requirements for enhanced disclosures to give financial statement users the ability to assess the amount, timing and uncertainty of cash flows arising from leasing arrangements. In July 2018, the FASB issued ASU 2018-10 and 2018-11 which permit application of the new guidance at the beginning of the year of adoption, recognizing a cumulative-effect adjustment to the opening balance of retained earnings in the period of adoption, in addition to the method of applying the new guidance retrospectively to each prior reporting period presented. The ASU was effective for us on January 1, 2019. We have concluded the impact of this guidance is negligible on our consolidated financial statements, given we have no material leases.
8
Fennec Pharmaceuticals Inc.
Notes to the Unaudited Interim Condensed Consolidated Financial Statements
(U.S. dollars and shares in thousands, except per share information)
Cash and cash equivalents
Cash equivalents consist of highly liquid investments with original maturities at the date of purchase of three months or less. The Company places its cash and cash equivalents in investments held by highly rated financial institutions in accordance with its investment policy designed to protect the principal investment. At September 30, 2019,March 31, 2020, the Company had $15,240$9,901 in cash, savings and money market accounts ($22,78113,650 at December 31, 2018)2019). At September 30, 2019,March 31, 2020, the Company held $104$382 in cash of which $39$12 (as presented in U.S. dollars) was in Canadian dollars ($12130 at December 31, 20182019 as presented in U.S. dollars). At September 30, 2019,March 31, 2020, the Company held $15,136$9,519 in money market investments. Money market investments typically have minimal risks. The Company has not experienced any loss or write-down of its money market investments since inception.
3. Earnings per Share
Earnings per common share is presented under two formats: basic earnings per common share and diluted earnings per common share. Basic earnings per common share is computed by dividing net income attributable to common shareholders by the weighted average number of common shares outstanding during the period. Diluted earnings per common share is computed by dividing net income by the weighted average number of common shares outstanding during the period, plus the potentially dilutive impact of common stock equivalents (i.e. stock options and warrants). Dilutive common share equivalents consist of the incremental common shares issuable upon exercise of stock options and warrants. The following table sets forth the computation of basic and diluted net loss per share:
| Three Months Ended September 30, | Nine Months Ended September 30, | Three Months Ended March 31, | ||||||||||||||||||||||
| 2019 | 2018 | 2019 | 2018 | 2020 | 2019 | |||||||||||||||||||
| Numerator: Net (loss) | $ | (1,809 | ) | $ | (2,749 | ) | $ | (9,165 | ) | $ | (6,904 | ) | ||||||||||||
| Numerator: | ||||||||||||||||||||||||
| Net (loss) | $ | (3,826 | ) | $ | (2,626 | ) | ||||||||||||||||||
| Denominator: Weighted-average common shares, basic | 19,896 | 18,968 | 19,896 | 18,648 | ||||||||||||||||||||
| Denominator: | ||||||||||||||||||||||||
| Weighted-average common shares, basic | 19,896 | 19,896 | ||||||||||||||||||||||
| Dilutive effect of stock options | - | - | - | - | - | - | ||||||||||||||||||
| Dilutive effect of warrants | - | - | - | - | - | - | ||||||||||||||||||
| Incremental dilutive shares | - | - | - | - | - | - | ||||||||||||||||||
| Weighted-average common shares, dilutive | 19,896 | 18,968 | 19,896 | 18,648 | 19,896 | 19,896 | ||||||||||||||||||
| Net (loss) per share, basic and diluted | $ | (0.09 | ) | $ | (0.14 | ) | $ | (0.46 | ) | $ | (0.37 | ) | $ | (0.19 | ) | $ | (0.13 | ) | ||||||
The following outstanding options and warrants were excluded from the computation of basic and diluted net loss per share for the periods presented because including them would have had an anti-dilutive effect:
| Three Months Ended September 30, | Nine Months Ended September 30, | |||||||||||||||
| 2019 | 2018 | 2019 | 2018 | |||||||||||||
| Options to purchase common stock | 3,018 | 2,498 | 3,018 | 2,498 | ||||||||||||
| Warrants to purchase common stock | 39 | 792 | 39 | 792 | ||||||||||||
| Three Months Ended March 31, | ||||||||
| 2020 | 2019 | |||||||
| Options to purchase common stock | 3,088 | 2,498 | ||||||
| Warrants to purchase common stock | 39 | 39 | ||||||
9
8 |
Fennec Pharmaceuticals Inc.
Notes to the Unaudited Interim Condensed Consolidated Financial Statements
(U.S. dollars and shares in thousands, except per share information)
As of September 30, 2019 and 2018, the Company no longer has outstanding derivative instruments. Prior to March 31, 2018, the Company had outstanding options denominated in Canadian dollars which were not considered to be indexed to its own stock because the exercise price was denominated in Canadian dollars and the Company's functional currency is U.S. dollars. Therefore, these options were treated as derivative financial instruments and recorded at their fair value as a liability. All other outstanding convertible instruments are considered to be indexed to the Company's stock, because their exercise price is denominated in the same currency as the Company's functional currency and are included in stockholders' equity.
These options were recorded at their fair value as a liability at issuance and were re-measured at fair value as a liability at each subsequent balance sheet date until they were exercised, forfeited or expired. Any change in value between reporting periods was recorded as unrealized gain/(loss). The fair value of these options was estimated using the Black-Scholes option-pricing model.4. Stockholders' Equity
Comparative data related to gain/(loss) recorded on re-measurement of the derivative liability for the three and nine-month periods ended September 30, 2019 and 2018 are summarized in the table below. There is no cash flow impact for these derivatives until the options are exercised. When the options are exercised, the Company receives the proceeds from the exercise at the current exchange rate at the time of exercise.
| Three Months Ended September 30, | Nine Months Ended September 30, | |||||||||||||||
| Gain on Derivative Instruments | 2019 | 2018 | 2019 | 2018 | ||||||||||||
| Options to contractors | $ | - | $ | - | $ | - | $ | 167 | ||||||||
| Gain on Derivative Instruments | $ | - | $ | - | $ | - | $ | 167 | ||||||||
During the fiscal years ended December 31, 2011 and 2010, the Company issued 36 and 29, respectively, options to contractors with a Canadian dollar denominated strike price. Consequently, the Company had derivatives relating to these options since the strike price is denominated in a currency other than the US dollar functional currency of the Company. While there is an exception to this rule for employees in ASU 2010-13 "Compensation-Stock Compensation (Topic 718): Effect of denominating the exercise price of a share-based payment award in the currency of the market in which the underlying equity security trades", no such exception exists for contractors.
There are no Canadian dollar denominated contractor options remaining.
10
Fennec Pharmaceuticals Inc.
Notes to the Unaudited Interim Condensed Consolidated Financial Statements
(U.S. dollars and shares in thousands, except per share information)
Authorized capital stock
The Company’s authorized capital stock consists of an unlimited number of shares of no-par common stock.
Warrants to Purchase Common Stock
On February 1,During the quarter ended March 31, 2019, the Company issued warrants to purchase common stock priced in U.S. dollars with a weighted average price of $6.80 and had weighted average remaining life of 9.338.83 years as of September 30, 2019.March 31, 2020. During the three and nine-monthsthree-months ended September 30, 2019,March 31, 2020, there were 0no warrants exercised resulting in gross proceeds to the Company of $0.issued or exercised. The following table details the Company’s warrant activity from DecemberMarch 31, 2018:2019:
| Investor Warrants | Common Shares Issuable Upon Exercise of Outstanding Warrants | Weighted-Average Exercise Price $USD | ||||||
| Outstanding December 31, 2018 | - | - | ||||||
| Issued | 39 | 6.80 | ||||||
| Outstanding March 31, 2019 | 39 | 6.80 | ||||||
| Issued | - | - | ||||||
| Outstanding June 30, 2019 | 39 | 6.80 | ||||||
| Issued | - | - | ||||||
| Outstanding September 30, 2019 | 39 | 6.80 | ||||||
| Total | 39 | 6.80 | ||||||
Investor Warrants | Common Shares Issuable Upon Exercise of Outstanding Warrants | Weighted-Average Exercise Price $USD | ||||||
| Outstanding December 31, 2019 | 39 | 6.80 | ||||||
| Issued | - | - | ||||||
| Outstanding March 31, 2020 | 39 | 6.80 | ||||||
| Total | 39 | 6.80 | ||||||
Investor Warrants | Common Shares Issuable Upon Exercise of Outstanding Warrants | Weighted-Average Exercise Price $USD | ||||||
| Outstanding December 31, 2018 | - | - | ||||||
| Issued | 39 | 6.80 | ||||||
| Outstanding March 31, 2019 | 39 | 6.80 | ||||||
| Total | 39 | 6.80 | ||||||
The value of warrants issued was estimated using the Black-Scholes option pricing model using the following assumptions in the table below. The expected volatility was determined using historical volatility of our stock based on the contractual life of the award. The Company capitalized the non-cash expense of $255 associated with issuing the above warrants on February 1, 2019. The Company also incurred legal, professional and share registration fees totaling $71 which were also capitalized. The combined capitalized asset, deferred issuance cost, has been placed on the balance sheet. The Company recognized $17 in amortization expense for the quarter ended September 30, 2019 and a total of $46 since inception.
| Valuation Assumptions | ||||
| Black-Scholes Model Assumptions | February 1, 2019 | |||
| Expected dividend | 0.00 | % | ||
| Risk free rate | 2.70 | % | ||
| Expected volatility | 179 | % | ||
| Expected life | 10 years | |||
Fennec Pharmaceuticals Inc.
Notes to the Unaudited Interim Condensed Consolidated Financial Statements
(U.S. dollars and shares in thousands, except per share information)
Stock option plan
On June 18, 2019, shareholders of the Company approved a resolution amending the maximum duration of options granted from eight (8) years to ten (10) years. At that same time, shareholders of the Company approved a resolution to extend the life of certain allocated options to the maximum term of ten (10) years. The weighted average life of affected options was increased by 2.98 years and the extension resulted in an increase in the fair value of all affected options by $1,438. The Company recognized $1,285 in expense immediately on all fully vested options. It will recognize an additional $153 in expense over the remaining vesting terms of the affected options. During the quarter ended September 30, 2019, the Company recognized $22 in expense associated with these affected options.
The Compensation Committee of the Board of Directors administers the Company’s stock option plan. The Compensation Committee designates eligible participants to be included under the plan and approves the number of options to be granted from time to time under the plan. Currently, the maximum number of option shares issuable is twenty-five percent (25%) of the total number of issued and outstanding shares of common stock. Based upon the current shares outstanding as of March 31, 2020, a maximum of 5,0004,974 options are authorized for issuance under the plan. For all options issued under the plan, the exercise price is the fair value of the underlying shares on the date of grant. All options vest within three years or less and are exercisable for a period of ten years from the date of grant. The stock option plan allows the issuance of Canadian and U.S. dollar grants. The table below outlines recognized contractor and employee expense for the three and nine-monththree-month periods ended September 30, 2019March 31, 2020 and 2018.2019.
| Three Months Ended September 30, | Nine Months Ended September 30, | |||||||||||||||
| 2019 | 2018 | 2019 | 2018 | |||||||||||||
| Contractor options expense recognized | $ | 21 | $ | 46 | $ | 395 | $ | 243 | ||||||||
| Employee options expense recognized | 314 | 222 | 2,204 | 1,603 | ||||||||||||
| Total option expense recognized | $ | 335 | $ | 268 | $ | 2,599 | $ | 1,846 | ||||||||
| Three Months Ended March 31, | ||||||||
| 2020 | 2019 | |||||||
| Contractor options expense recognized | $ | 21 | $ | 43 | ||||
| Employee options expense recognized | 391 | 221 | ||||||
| Total option expense recognized | $ | 412 | $ | 264 | ||||
Stock option activity
The following is a summary of option activity for each of the quarterly periods in fiscal year 20192020 for stock options denominated in U.S. dollars:
| Number of | Weighted-Average | |||||||
| US Denominated Options | Options (thousands) | Exercise Price $USD | ||||||
| Outstanding December 31, 2018 | 1,850 | $ | 3.80 | |||||
| Granted | - | - | ||||||
| Exercised | - | - | ||||||
| Outstanding at March 31, 2019 | 1,850 | $ | 3.80 | |||||
| Granted | 345 | $ | 4.69 | |||||
| Outstanding at June 30, 2019 | 2,195 | $ | 3.94 | |||||
| Granted | 175 | $ | 4.74 | |||||
| Outstanding at September 30, 2019 | 2,370 | $ | 4.00 | |||||
| Number of | Weighted-Average | |||||||
| US Denominated Options | Options (thousands) | Exercise Price $USD | ||||||
| Outstanding December 31, 2019 | 2,440 | $ | 3.59 | |||||
| Granted | - | - | ||||||
| Outstanding at March 31, 2020 | 2,440 | $ | 3.59 | |||||
9 |
Fennec Pharmaceuticals Inc.
Notes to the Unaudited Interim Condensed Consolidated Financial Statements
(U.S. dollars and shares in thousands, except per share information)
During the three-month period ended September 30, 2019,March 31, 2020, there were 175was no US denominated options issued.option activity. Of the 2,370 US denominated2,440 options granted and outstanding at September 30, 2019, 1,801March 31, 2020, 1,864 are fully vested and exercisable.
The following is a summary of option activity for the quarterlythree-month periods ended September 30, 2019March 31, 2020 for stock options denominated in Canadian dollars:
| Number of | Weighted-Average | |||||||
| Canadian Denominated Options | Options (thousands) | Exercise Price $CAD | ||||||
| Outstanding December 31, 2018 | 648 | $ | 2.43 | |||||
| Outstanding at March 31, 2019 | 648 | $ | 2.43 | |||||
| Outstanding at June 30, 2019 | 648 | $ | 2.43 | |||||
| Outstanding at September 30, 2019 | 648 | $ | 2.43 | |||||
| Number of | Weighted-Average | |||||||
| Canadian Denominated Options | Options (thousands) | Exercise Price $CAD | ||||||
| Outstanding December 31, 2019 | 648 | $ | 2.43 | |||||
| Granted | - | - | ||||||
| Outstanding at March 31, 2020 | 648 | $ | 2.43 | |||||
For the three and nine-month periodsthree-month period ended September 30, 2019,March 31, 2020, there was no issuance activity related to Canadian dollar denominated options. As of September 30, 2019,March 31, 2020, all 648 outstanding options denominated in Canadian dollars were fully vested and exercisable.
Valuation assumptions
The value of options granted were estimated using the Black-Scholes option pricing model using the following assumptions in the table below. The expected volatility was determined using historical volatility of our stock based on the contractual life of the award. There were 175 options issued during the three months ended September 30, 2019 (0 for the same period in 2018). Assumptions for the valuation of the option grants are described in the table below:
6.5. Fair Value Measurements
The Company adopted the Fair Value Measurements and Disclosure Topic of the FASB in 2011. This Topic applies to certain assets and liabilities that are being measured and reported on a fair value basis. The Topic defines fair value, establishes a framework for measuring fair value in accordance with US GAAP, and expands disclosure about fair value measurements. This Topic enables the reader of the financial statements to assess the inputs used to develop those measurements by establishing a hierarchy for ranking the quality and reliability of the information used to determine fair values. The Topic requires that financial assets and liabilities carried at fair value be classified and disclosed in one of the following three categories:
Level 1: Quoted market prices in active markets for identical assets or liabilities.
Level 2: Observable market-based inputs or unobservable inputs that are corroborated by market data.
Level 3: Unobservable inputs that are not corroborated by market data.
Fair Value Measurement at September 30, 2019 and December 31, 2018 (in thousands) | ||||||||||||||||||||||||||||||||
| Quoted Price in Active Market for Identical Instruments | Significant Other Observable Inputs | Significant Unobservable Inputs | ||||||||||||||||||||||||||||||
| Level 1 | Level 2 | Level 3 | Total | |||||||||||||||||||||||||||||
| 2019 | 2018 | 2019 | 2018 | 2019 | 2018 | 2019 | 2018 | |||||||||||||||||||||||||
| Assets | ||||||||||||||||||||||||||||||||
| Cash and cash equivalents | 104 | (1) | 770 | (1) | 15,136 | 22,011 | - | - | 15,240 | 22,781 | ||||||||||||||||||||||
| Liabilities | ||||||||||||||||||||||||||||||||
| Derivative liabilities | - | - | - | - | - | - | - | - | ||||||||||||||||||||||||
| Fair Value Measurement at March 31, 2020 and December 31, 2019, (in thousands) | ||||||||||||||||||||||||||||||||
| Quoted Price in Active Market for Identical Instruments | Significant Other Observable Inputs | Significant Unobservable Inputs | ||||||||||||||||||||||||||||||
| Level 1 | Level 2 | Level 3 | Total | |||||||||||||||||||||||||||||
| 2020 | 2019 | 2020 | 2019 | 2020 | 2019 | 2020 | 2019 | |||||||||||||||||||||||||
| Assets | ||||||||||||||||||||||||||||||||
| Cash and cash equivalents | 382(1) | 347 | (1) | 9,519 | 13,303 | - | - | 9,901 | 13,650 | |||||||||||||||||||||||
| Liabilities | ||||||||||||||||||||||||||||||||
| Derivative liabilities | - | - | - | - | - | - | - | - | ||||||||||||||||||||||||
| (1) | The Company held approximately, |
Fennec Pharmaceuticals Inc.
Notes to the Unaudited Interim Condensed Consolidated Financial Statements
(U.S. dollars and shares in thousands, except per share information)
7.6. Commitments and Contingencies
Oregon Health & Science University Agreement
On February 20, 2013, Fennec entered into a new exclusive license agreement with OHSU for exclusive worldwide license rights to intellectual property directed to thiol-based compounds, including STSsodium thiosulfate and their use in oncology (the "OHSU Agreement"). OHSU will receive certain milestone payments, royalty on net sales for licensed products and a royalty on any consideration received from sublicensing of the licensed technology.
10 |
Fennec Pharmaceuticals Inc.
Notes to the Unaudited Interim Condensed Consolidated Financial Statements
(U.S. dollars and shares in thousands, except per share information)
On May 18, 2015, Fennec negotiated an amendment ("Amendment 1") to the OHSU Agreement, which expands Fennec’s exclusive license to include the use of N-acetylcysteine as a standalone therapy and/or in combination with STSsodium thiosulfate for the prevention of ototoxicity induced by chemotherapeutic agents to treat cancers. Further, Amendment 1 adjusts select milestone payments entered in the OHSU Agreement including but not limited to the royalty rate on net sales for licensed products, royalty rate from sublicensing of the licensed technology and the fee payable upon the regulatory approval of a licensed product.
The term of the OHSU Agreement as amended by Amendment 1 expires on the date of the last to expire claim(s) covered in the patents licensed to Fennec or 8 years, whichever is later. In the event a licensed product obtains regulatory approval and is covered by the Orphan Drug Designation, the parties will in good faith amend the term of the agreement. STSSodium thiosulfate is currently protected by methods of use patents that the Company exclusively licensed from OHSU that expire in Europe in 2021 and are currently pending in the United States. The OHSU Agreement is terminable by either Fennec or OHSU in the event of a material breach of the agreement by either party after 45 days prior written notice. Fennec also has the right to terminate the OHSU Agreement at any time upon 60 days prior written notice and payment of all fees due to OHSU under the OHSU Agreement.
Executive Severance
In the event of his termination with us other than for cause, we will be obligated to pay Mr. Raykov a one-time severance payment equal to twelve months of salary ($400,000)(as of May 8, 2020 $430,000). In the event of his termination with us other than for cause, we will be obligated to pay Mr. Andrade a one-time severance payment equal to six months of salary ($145,000)(as of May 8, 2020 $155,875). In the event of her termination with us other than for cause, we will be obligated to pay Ms. Goel a one-time severance payment equal to three months of salary (as of May 8, 2020 $90,000)
Leases
We have an operating lease in Research Triangle Park, North Carolina utilizing small space within a commercial building. The operating lease has payments of $200 per month with no scheduled increases. This operating lease is terminable with 30 days’ notice and has no penalties or contingent payments due.
On January 23, 2020, the Company entered into an Office Service Agreement (the “Office Service Agreement”) with Regus to lease office space at 221 River Street, Hoboken, New Jersey. Per the terms of the Office Service Agreement, the monthly rent payments are $1,150. The Company was required to pay a security deposit of $2,300, which is the equivalent to two months of rent. The Office Service Agreement commenced on January 27, 2020 and terminates on July 31, 2020, thereafter the lease may continue on a month-to-month basis with either party being able to terminate the agreement by providing one months' advance written notice of termination.
COVID-19
The Company’s operations may be affected by the recent and ongoing outbreak of the coronavirus disease 2019 (COVID-19) which was declared a pandemic by the World Health Organization in March 2020. The ultimate disruption which may be caused by the outbreak is uncertain; however, it may result in a material adverse impact on the Company’s financial position, operations and cash flows. Possible effects may include, but are not limited to, disruption to the Company’s product launch, absenteeism in the Company’s labor workforce, unavailability of products and supplies used in operations, and a decline in value of assets held by the Company, including inventories, property and equipment, and marketable securities. COVID-19 has not had a material effect on the Company’s operations.
11 |
Fennec Pharmaceuticals Inc.
Notes to the Unaudited Interim Condensed Consolidated Financial Statements
(U.S. dollars and shares in thousands, except per share information)
Loan and Security Agreement
On February 1, 2019, the Company’s wholly owned subsidiary of Fennec Pharmaceuticals Inc. entered into a Loan and Security Agreement (the “Loan and Security Agreement”) with Bridge Bank, a division of Western Alliance Bank, an Arizona corporation (the “Bank”), pursuant to which the Bank agreed to loan $12.5 million to Fennec Pharmaceuticals, Inc., to be made available upon New Drug Application (“NDA”) approval of PEDMARKTM by no later than September 30, 2020. The proceeds from the loan will be used for working capital purposes and to fund general business requirements in accordance with the terms of the Loan and Security Agreement. Interest under the Term Loans shall bear interest, on the outstanding daily balance thereof, at a floating per annum rate equal to the Effective Interest Rate (as defined in the Loan and Security Agreement) which is equal to the sum of the Prime Rate published in the Wall Street Journal (currently 5.00%3.25%) plus one percent (1.00%). The debt facility is to have interest-only monthly payments due for the first eighteen months from the funding date and then monthly principal and interest payments are due through the remainder of the term which has a maturity date of October 1, 2023. In connection with the facility, Fennec granted Bridge Bank a warrant to purchase up to 3939,130 common shares at an exercise price of $6.80 per common share, for a term of ten years from the date of issuance, subject to early termination under certain conditions.
The combined value of the granted warrants and the associated costs to secure the loan facility (approximately $326 thousand) were capitalized on the balance sheet as a long-term asset. The asset, deferred issuance cost, will be amortized evenly over the full term of the agreement (56 months). During the quarter ended September 30, 2019,March 31, 2020, the Company recorded amortizationinterest expense of roughly $17 ($46 since inception), as a result of the amortization of the asset related to deferred issuance cost. A total of $81 has been amortized as of March 31, 2020.
8.7. Subsequent Events
Management has evaluated subsequent events throughOn April 13, 2020 Fennec announced that the U.S. Food and Drug Administration (“FDA”) had accepted for filing and granted Priority Review for Fennec’s New Drug Application for PEDMARK. The FDA set a Prescription Drug Fee Act (PDUFA) target action date of this filing and concluded there are no eventsAugust 10, 2020 for the completion of significance which require disclosure.the FDA’s review.
On May 4, of 2020, the Company announced the completion of an underwritten public offering for gross proceeds of $30.0 million.
On May 7, 2020, the Company announced Cantor Fitzgerald exercised its overallotment option resulting in gross proceeds of approximately $4.2 million.
12 |
Item 2. Management's Discussion and Analysis of Financial Condition and Results of Operations
CAUTIONARY STATEMENT
The discussion below contains forward-looking statements regarding our financial condition and our results of operations that are based upon our annual consolidated financial statements, which have been prepared in accordance with generally accepted accounting principles within the United States, or U.S. GAAP, and applicable U.S. Securities and Exchange Commission, or SEC, regulations for financial information. The preparation of these financial statements requires our management to make estimates and judgments that affect the reported amounts of assets, liabilities, income and expenses, and related disclosure of contingent assets and liabilities. We evaluate our estimates on an ongoing basis. Our estimates are based on historical experience and on various other assumptions that we believe to be reasonable.
Overview
Lead Product Candidate PEDMARKTM
The following is our only lead product candidate in the clinical stage of development:
| · | PEDMARKTM (a unique formulation of sodium thiosulfate |
We continue to focus the Company’s resources on the development of PEDMARKTM.
We have licensed from OHSU intellectual property rights for the use of PEDMARKTM as a chemoprotectant, and are developing PEDMARKTM as a protectant against the hearing loss often caused by platinum-based anti-cancer agents in children. Preclinical and clinical studies conducted by OHSU and others have indicated that PEDMARKTM can effectively reduce the incidence of hearing loss caused by platinum-based anti-cancer agents.
Hearing loss among children receiving platinum-based chemotherapy is frequent, permanent and often severely disabling. The incidence of hearing loss in these children depends upon the dose and duration of chemotherapy, and many of these children require lifelong hearing aids. There is currently no established preventive agent for this hearing loss and only expensive, technically difficult and sub-optimal cochlear (inner ear) implants have been shown to provide some benefit. In addition, adults undergoing chemotherapy for several common malignancies, including ovarian cancer, testicular cancer, and particularly head and neck cancer and brain cancer, often receive intensive platinum-based therapy and may experience severe, irreversible hearing loss, particularly in the high frequencies.
The Company estimates in the U.S. and Europe that over 10,000 children with solid tumors are treated with platinum agents. The vast majority of these newly diagnosed tumors are localized and classified as low to intermediate risk in nature. These localized cancers may have overall survival rates of greater than 80%, further emphasizing the importance of quality of life after treatment. The incidence of hearing loss in these children depends upon the dose and duration of chemotherapy, and many of these children require lifelong hearing aids. There is currently no established preventive agent for this hearing loss and only expensive, technically difficult and sub-optimal cochlear (inner ear) implants have been shown to provide some benefit. Infants and young children at critical stages of development lack speech language development and literacy, and older children and adolescents lack speech language development and literacy, and older children and adolescents lack social-emotional development and educational achievement.
STS has been studied
We initiated our rolling New Drug Application (NDA) for PEDMARKTM for the prevention of ototoxicity induced by cooperative groups in two Phase 3 clinical studiescisplatin chemotherapy patients 1 month to < 18 years of survival and reduction of ototoxicity: COG ACCL0431 and SIOPEL 6. Both studies are closed to recruitment. COG ACCL0431 enrolled one of five childhood cancers typically treated with intensive cisplatin therapy for localized and disseminated disease, including newly diagnosed hepatoblastoma, germ cell tumor, osteosarcoma, neuroblastoma, and medulloblastoma. SIOPEL 6 enrolled only hepatoblastoma patientsage with localized, tumors. COG ACCL0431 final results were publishednon-metastatic, solid tumors in December 2018. Fennec announced that it has submitted full completion of the NDA in February 2020. On April 13, 2020 Fennec announced that the U.S. Food and Drug Administration (“FDA”) had accepted for filing and granted Priority Review for Fennec’s New Drug Application for PEDMARK.The FDA set a Prescription Drug Fee Act (PDUFA) target action date of August 10, 2020 for the completion of the FDA’s review. In March 2018, PEDMARKTMreceived Breakthrough Therapy and Fast Track designations from the FDA. Further, PEDMARKTM has received Orphan Drug Designation in the Lancet OncologyUS in 2016. SIOPEL 6 final results were published this setting. The Company is targeting potential commercial launch of PEDMARKTMin the New England JournalU.S. in the second half of Medicine in June 2018. 2020.
In August 2018, the Pediatric Committee (PDCO) of the European Medicines Agency (EMA) accepted our pediatric investigation plan (PIP) for PEDMARKTMsodium thiosulfate (trade name to be determined) for the condition of the prevention of platinum-induced hearing loss. An accepted PIP is a prerequisite for filing a Marketing Authorization Application (MAA) for any new medicinal product in Europe. The indication targeted by the Company’s PIP is for the prevention of platinum-induced ototoxic hearing loss for standard risk hepatoblastoma (SR-HB). Additional tumor types of the proposed indication will be subject to the Committee for Medicinal Products for Human Use (CHMP) assessment at the time of the MAA. No deferred clinical studies were required in the positive opinion given by PDCO. The Company was also advised that PEDMARKTMsodium thiosulfate (tradename to be determined) is eligible for submission of an application for a Pediatric Use Marketing Authorization (PUMA). Therefore, this decision allows Fennec to proceed with the submission of a PUMA in the European Union (EU) with incentives of automatic access to the centralized procedure and up to 10 years of data and market protection The PUMA is a dedicated marketing authorization covering the indication and appropriate formulation for medicines developed exclusively for use in the pediatric population and provides data and market protection up to 10 years.
We initiated our rolling New Drug Application (NDA) for PEDMARKTM In February 2020, Fennec announced that it has submitted a MAA for the prevention of ototoxicityotoxicity induced by cisplatin chemotherapy patients 1 month to < 18 years of age with localized, non-metastatic, solid tumors in December 2018. The Company is targeting completing the NDA submission in early 2020 and if approved a potential first commercial launch of PEDMARKTM in the second half of 2020. In March 2018, PEDMARKTM received Breakthrough Therapy and Fast Track designations from the FDA. Further, PEDMARKTM has received Orphan Drug Designation in the US in this setting.tumors.
In September 2019, the Company announced the appointment of Shubh Goel as chief commercial officer. In this newly created position, Ms. Goel will build and oversee Fennec’s commercial strategy and organization, including both the launch and commercialization of PEDMARKTM, if approved.
13 |
SIOPEL 6
In October 2007, we announced that our collaborative partner, the International Childhood Liver Tumour Strategy Group, known as SIOPEL, a multi-disciplinary group of specialists under the umbrella of the International Society of Pediatric Oncology, had launched a randomized Phase 3 clinical trial SIOPEL 6 to investigate whether STSsodium thiosulfate reduces hearing loss in standard risk hepatoblastoma (liver) cancer patients receiving cisplatin as a monotherapy.
The study was initiated in October 2007 initially in the United Kingdom and completed enrollment at the end of 2014. 52 sites from 11 countries, enrolled 109 evaluable patients. Under the terms of our agreement, SIOPEL conducts and funds all clinical activities and Fennec provides drug, drug distribution and pharmacovigilance, or safety monitoring, for the study. SIOPEL 6 was completed in December 2014 and the final results of SIOPEL 6 were published inThe New England Journal of Medicinein June 2018.
The primary objectives of SIOPEL 6 are:
| · | To assess the efficacy of |
| · | To carefully monitor any potential impact of |
SIOPEL 6 - Results
Background / Objectives:
Background: Bilateral high-frequency hearing loss is a serious permanent side-effect of cisplatin therapy; particularly debilitating when occurring in young children. STSSodium thiosulfate has been shown to reduce cisplatin induced hearing loss. SIOPEL 6 is a Phase 3 randomised trial to assess the efficacy of STSsodium thiosulfate in reducing ototoxicity in young children treated with cisplatin (Cis) for SR-HB.
Design / Methods:
Methods: Newly diagnosed patients with SR-HB, defined as tumour limited to PRETEXT I, II or III, no portal or hepatic vein involvement, no intra-abdominal extrahepatic disease, AFP >100ng/ml and no metastases, were randomized to Cis or Cis+STSSodium thiosulfate (STS) for 4 preoperative and 2 postoperative courses. Cisplatin 80mg/m2 was administered over 6 hours, STS 20g/m2 was administered intravenously over 15 minutes exactly 6 hours after stopping cisplatin. Tumour response was assessed after 2 and 4 preoperative cycles with serum AFP and liver imaging. In case of progressive disease (PD), STSsodium thiosulfate was to be stopped and doxorubicin 60mg/m2 combined with cisplatin. The primary endpoint is centrally reviewed absolute hearing threshold, at the age of ≥3.5 years by pure tone audiometry.
Results:
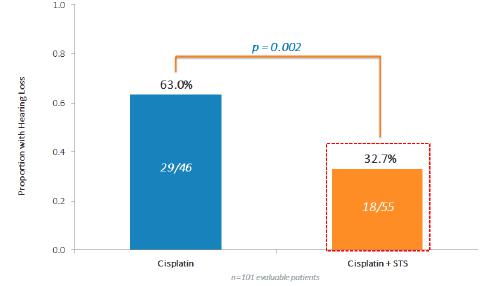
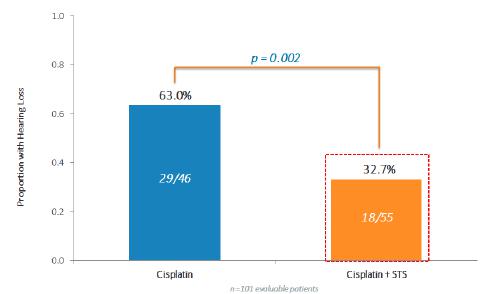
One hundred and nine randomized patients (52 Cisplatin only ("Cis") and 57 Cis+STS) are evaluable. The combination of Cis+STS was generally well tolerated. With a follow up time of 52 months for the patients the three-year Event Free Survival ("EFS") for Cis is 78.8% Cisplatin and 82.1% for the Cis + STS. The three-year Overall Survival ("OS") is 92.3% for Cis and 98.2% for Cis + STS. Treatment failure defined as Progressive Disease ("PD") at 4 cycles was equivalent in both arms. Among the first 101 evaluable patients, hearing loss occurred in 29/46=63.0% under Cis and in 18/55=33.0% under Cis +STS, corresponding to a relative risk of 0.52(P=0.002).
14 |
Conclusions:
This randomized Phase 3 trial in SR-HB of cisplatin versus cisplatin plus sodium thiosulfate shows that the addition of sodium thiosulfate significantly reduces the incidence of cisplatin-induced hearing loss without any evidence of tumor protection.
COG ACCL0431
In March 2008, we announced the activation of a Phase 3 trial with STSsodium thiosulfate to prevent hearing loss in children receiving cisplatin-based chemotherapy in collaboration with the Children’s Oncology Group (“COG ACCL0431”). The goal of this Phase 3 study was to evaluate in a multi-centered, randomized trial whether STSsodium thiosulfate is an effective and safe means of preventing hearing loss in children receiving cisplatin-based chemotherapy for newly diagnosed germ cell, liver (hepatoblastoma), brain (medulloblastoma), nerve tissue (neuroblastoma) or bone (osteosarcoma) cancers. Eligible children, one to eighteen years of age, who were to receive cisplatin according to their disease-specific regimen and, upon enrollment in this study, were randomized to receive STSsodium thiosulfate or not. Efficacy of STSsodium thiosulfate was determined through comparison of hearing sensitivity at follow-up relative to baseline measurements using standard audiometric techniques. The Children’s Oncology Group is responsible for funding the clinical activities for the study and we are responsible for providing the drug, drug distribution and pharmacovigilance, or safety monitoring, for the study. The trial completed enrollment of 131 pediatric patients in the first quarter of 2012. The final results of COG ACCL0431 were published inLancet Oncologyin December 2016.
COG ACCL0431 - Results
COG Study ACCL0431, “A Randomized Phase 3 Study of Sodium Thiosulfate for the Prevention of Cisplatin-Induced Ototoxicity in Children,” finished enrollment of 131 patients of which 126 were eligible patients in Q1 2012. The patients had been previously diagnosed with childhood cancers.
The primary endpoint was to evaluate the efficacy of STSsodium thiosulfate for prevention of hearing loss in children receiving cisplatin chemotherapy (hypothesis: 50% relative reduction in hearing loss).
Secondary endpoints included:
| · | Compare change in mean hearing thresholds |
| · | Compare incidence of other Grade 3/4 toxicities (renal and hematological) |
| · | Monitor Event Free Survival (EFS) and Overall Survival (OS) in two groups |
126 eligible subjects were enrolled with germ cell tumor (32), osteosarcoma (3029), neuroblastoma (26), medulloblastoma/pnet (26), hepatoblastoma (7) or other (5). Of these, 104 subjects (64 male and 29 <5 years old) were evaluable for the primary endpoint.
Subjects were randomized either to no treatment (control) or treatment with STSsodium thiosulfate 16 grams/m2 IV over 15 minutes, 6 hours after each cisplatin dose. Hearing was measured using standard audiometry for age and data were reviewed centrally using American Speech-Language-Hearing Association criteria.
The proportion of subjects with hearing loss assessed at 4 weeks post the final cisplatin dose (primary endpoint).
| · | The proportion of hearing loss for |
| · | In a predefined subgroup of patients less than 5 years old with 29 eligible subjects: |
17
15 |
Conclusions:
| · |
| · | Further potential clinical use will be informed by the final results of SIOPEL 6 study. |
Capital Funding
We have not received and do not expect to have significant revenues from our product candidate until we are either able to sell our product candidate after obtaining applicable regulatory approvals or we establish collaborations that provide us with up-front payments, licensing fees, milestone payments, royalties or other revenue.
We generated a net loss of approximately $9.2$3.8 million for the nine-monthsthree-months ended September 30, 2019March 31, 2020 and a net loss of $6.9$2.6 million for the nine-monthsthree-months ended September 30, 2018 (inclusive of a non-cash gain on derivatives of $0.00 million and $0.17 million for the nine-months ended September 30, 2019 and 2018, respectively).March 31, 2019. As of September 30, 2019,March 31, 2020, our accumulated deficit was approximately $140.4$147.9 million ($131.3144.0 million at December 31, 2018)2019).
We believe that our cash and cash equivalents as of September 30, 2019,March 31, 2020, which totaled $15.2$9.9 million, funds raised subsequent to March 31, 2020 in the public offering which closed in May of 2020, plus the Loan Security Agreement with Bridge Bank, will be sufficient to meet our cash requirements throughfor at least the next twelve to fifteentwenty four months including NDA approval and anticipated first commercial launch of PEDMARKTM in the second half of 2020.. Our projections of our capital requirements are subject to substantial uncertainty. More capital than we anticipated may be required thereafter. To finance our continuing operations, we may need to raise substantial additional funds through either the sale of additional equity, the issuance of debt, the establishment of collaborations that provide us with funding, the out-license or sale of certain aspects of our intellectual property portfolio or from other sources. Given current economic conditions, we might not be able to raise the necessary capital, or such funding may not be available on financially acceptable terms if at all. If we cannot obtain adequate funding in the future, we might be required to further delay, scale back or eliminate certain research and development studies, consider business combinations or even shut down some, or all, of our operations.
Our operating expenses will depend on many factors, including the progress of our drug development efforts and efficiency of our operations and current resources. Our research and development expenses, which include expenses associated with our clinical trials, drug manufacturing to support clinical programs, salaries for research and development personnel, stock-based compensation, consulting fees, sponsored research costs, toxicology studies, license fees, milestone payments, and other fees and costs related to the development of our product candidate, will depend on the availability of financial resources, the results of our clinical trials and any directives from regulatory agencies, which are difficult to predict. Our general and administration expenses include expenses associated with the compensation of employees, stock-based compensation, professional fees, consulting fees, insurance and other administrative matters associated in support of our drug development programs.
Results of Operations
Three months ended September 30, 2019March 31, 2020 versus three months ended September 30, 2018:March 31, 2019:
| Three Months | Three Months | |||||||||||||||||||
| Ended | Ended | |||||||||||||||||||
| In thousands of U.S. Dollars | September 30, 2019 | % | September 30, 2018 | % | Change | |||||||||||||||
| Operating expenses: | ||||||||||||||||||||
| Research and development | $ | 795 | 43 | % | $ | 1,798 | 63 | % | $ | (1,003 | ) | |||||||||
| General and administration | 1,068 | 57 | % | 1,050 | 37 | % | 18 | |||||||||||||
| Total operating expenses | 1,863 | 100 | % | 2,848 | 100 | % | (985 | ) | ||||||||||||
| Loss from operations | (1,863 | ) | (2,848 | ) | 985 | |||||||||||||||
| Other (loss)/gain | 1 | (2 | ) | 3 | ||||||||||||||||
| Amortization expense | (17 | ) | - | (17 | ) | |||||||||||||||
| Interest income and other | 70 | 101 | (31 | ) | ||||||||||||||||
| Net loss | $ | (1,809 | ) | $ | (2,749 | ) | $ | 940 | ||||||||||||
| Three Months | Three Months | |||||||||||||||||||
| Ended | Ended | |||||||||||||||||||
| In thousands of U.S. Dollars | March 31, 2020 | % | March 31, 2019 | % | Change | |||||||||||||||
| Revenue | $ | - | $ | - | $ | - | ||||||||||||||
| Operating expenses: | ||||||||||||||||||||
| Research and development | 1,393 | 36% | 1,671 | 62% | (278 | ) | ||||||||||||||
| General and administration | 2,442 | 64% | 1,009 | 38% | 1,433 | |||||||||||||||
| Total operating expenses | 3,835 | 100% | 2,680 | 100% | 1,155 | |||||||||||||||
| Loss from operations | (3,835 | ) | (2,680 | ) | (1,155 | ) | ||||||||||||||
| Other loss | (9 | ) | - | (9 | ) | |||||||||||||||
| Amortization expense | (17 | ) | (12 | ) | (5 | ) | ||||||||||||||
| Interest income and other | 35 | 66 | (31 | ) | ||||||||||||||||
| Net loss | $ | (3,826 | ) | $ | (2,626 | ) | $ | (1,200 | ) | |||||||||||
16 |
Research and development expenses decreased by $1,003$278 for the three months ended September 30, 2019March 31, 2020 over the same period in 20182019 as the Company completed a significant part of the activities neededfinalized preparation for regulatory approval of PEDMARKTM in. Research and development expenses are expected to decrease further as the first six monthsCompany’s begins to focus on the commercialization of 2019. The decrease in the three months ended September 30, 2019 primarily relates to a decrease in manufacturing activities necessary for regulatory submissions.PEDMARKTM. General and administrative expenses are consistent withincreased by $1,433 reflecting the prior year’s period.Company’s pre-commercial activities and readiness for PEDMARKTM over same period in 2019. Commercialization readiness efforts accounted for $830 of the increase. Payroll accounted for $300 of the increase as the Company now has five full time employees. There was an increase of $170 related to non-cash equity remuneration expense for employees related to vesting of existing grants. The remainder relates to general increases in legal, advocacy and insurance expenses.
Other (loss)/gainInterest income was driven mainly by fluctuations in foreign currency transactions and is a non-cash expense. The Company has vendors that transact in Euro, Great British Pounds and Canadian Dollars There was a gain of $1 in other (loss)/gain for the three months ended September 30, 2019 as compared to a loss of $2down significantly over the same period in 2019. Amortization expense is also a non-cash expense and relates to amortization of the deferred issuance cost of the Bridge Bank loan facility. Amortization expense was $17 and $0 for the three months ended September 30, 2019, and 2018, respectively. Interest income was $31 lower for the three months ended September 30, 2019 over the same period in 2018. Interest income was lower due to a lower balance as compared to the same period in the prior year.
| Nine Months | Nine Months | |||||||||||||||||||
| Ended | Ended | |||||||||||||||||||
| In thousands of U.S. Dollars | September 30, 2019 | % | September 30, 2018 | % | Change | |||||||||||||||
| Operating expenses: | ||||||||||||||||||||
| Research and development | $ | 4,435 | 47 | % | $ | 3,285 | 45 | % | $ | 1,150 | ||||||||||
| General and administration | 4,921 | 53 | % | 4,019 | 55 | % | 902 | |||||||||||||
| Total operating expenses | 9,356 | 100 | % | 7,304 | 100 | % | 2,052 | |||||||||||||
| Loss from operations | (9,356 | ) | (7,304 | ) | (2,052 | ) | ||||||||||||||
| Unrealized gain on derivatives | - | 167 | (167 | ) | ||||||||||||||||
| Other (loss)/gain | (9 | ) | - | (9 | ) | |||||||||||||||
| Amortization expense | (46 | ) | - | (46 | ) | |||||||||||||||
| Interest income and other | 246 | 233 | 13 | |||||||||||||||||
| Net loss | $ | (9,165 | ) | $ | (6,904 | ) | $ | (2,261 | ) | |||||||||||
Total researchcash balances and development expenses were up by $1,150 for the nine months ended September 30, 2019 over the same period in 2018. This increase relates primarily to drug manufacturing activities and preparations for registration batches necessary for regulatory approvals. General and administrative costs increased by $902 over the prior year in the same period. The largest portion of this increase relates to the additional non-cash expense resulting from the revaluing all vested options when their terms were extended in June 2019. Total option expense for the nine months ended September 30, 2019 increased by $753 over the same period in 2018. The remaining increases in general and administrative expenses is primarily associated with increases in professional fees and employee compensation.
For the nine-month period ended September 30, 2018, the Company posted an unrealized gain of $167 as the final derivative liabilities on its books were extinguished. Other (loss)/gain was down by $9 for the nine months ended September 30, 2019 over the same period in 2018. For the nine-months period ended September 30, 2019 the Company recognized $46 of amortization expense as it amortizes the deferred issuance cost associated with the loan facility arranged with Bridge Bank. Interest income was up slightly ($13) over the same period in 2018, due to higherlower interest rates on deposits.
Quarterly Information
The following table presents selected condensed financial data for each of the last eight quarters through September 30, 2019,March 31, 2020, as prepared under US GAAP (U.S. dollars in thousands, except per share information):
Period | Net (Loss)/Income for the Period | Basic Net (Loss)/Income per Common Share | Diluted Net (Loss)/Income per Common Share | Net (Loss)/Income for the Period | Basic Net (Loss)/Income per Common Share | Diluted Net (Loss)/Income per Common Share | |||||||||||||||||||
| December 31, 2017 | $ | (2,290 | ) | $ | (0.15 | ) | $ | (0.15 | ) | ||||||||||||||||
| March 31, 2018 | $ | (1,568 | ) | $ | (0.09 | ) | $ | (0.09 | ) | ||||||||||||||||
| June 30, 2018 | $ | (2,587 | ) | $ | (0.14 | ) | $ | (0.14 | ) | (2,587 | ) | (0.14 | ) | (0.14 | ) | ||||||||||
| September 30, 2018 | $ | (2,749 | ) | $ | (0.14 | ) | $ | (0.14 | ) | (2,749 | ) | (0.14 | ) | (0.14 | ) | ||||||||||
| December 31, 2018 | $ | (2,984 | ) | $ | (0.15 | ) | $ | (0.15 | ) | (2,984 | ) | (0.15 | ) | (0.15 | ) | ||||||||||
| March 31, 2019 | $ | (2,626 | ) | $ | (0.13 | ) | $ | (0.13 | ) | (2,626 | ) | (0.13 | ) | (0.13 | ) | ||||||||||
| June 30, 2019 | $ | (4,730 | ) | $ | (0.24 | ) | $ | (0.24 | ) | (4,730 | ) | (0.24 | ) | (0.24 | ) | ||||||||||
| September 30, 2019 | $ | (1,809 | ) | $ | (0.09 | ) | $ | (0.09 | ) | (1,809 | ) | (0.09 | ) | (0.09 | ) | ||||||||||
| December 31, 2019 | (3,610 | ) | (0.18 | ) | (0.18 | ) | |||||||||||||||||||
| March 31, 2020 | (3,826 | ) | (0.19 | ) | (0.19 | ) | |||||||||||||||||||
Liquidity and Capital Resources
| U.S. Dollars in thousands Selected Asset and Liability Data: | September 30, 2019 | December 31, 2018 | ||||||
| Cash and cash equivalents | $ | 15,240 | $ | 22,781 | ||||
| Other current assets | 387 | 169 | ||||||
| Current liabilities | 905 | 1,637 | ||||||
| Working capital(1) | 14,722 | 21,313 | ||||||
| (1) [Current assets – current liabilities] | ||||||||
| Selected equity: | ||||||||
| Common stock | 106,392 | 106,392 | ||||||
| Accumulated deficit | (140,421 | ) | (131,256 | ) | ||||
| Stockholders’ equity | 15,002 | 21,313 | ||||||
| U.S. Dollars in thousands | ||||||||
| Selected Asset and Liability Data: | March 31, 2020 | December 31, 2019 | ||||||
| Cash and cash equivalents | $ | 9,901 | $ | 13,650 | ||||
| Other current assets | 222 | 234 | ||||||
| Current liabilities | 1,907 | 2,271 | ||||||
| Working capital(1) | 8,216 | 11,613 | ||||||
| (1) [Current assets – current liabilities] | ||||||||
| Selected equity: | ||||||||
| Common stock and additional paid in capital | 155,075 | 154,663 | ||||||
| Accumulated deficit | (147,857 | ) | (144,031 | ) | ||||
| Stockholders’ equity | 8,461 | 11,875 | ||||||
Cash and cash equivalents were $15,240$9,901 at September 30, 2019March 31, 2020 and $22,781$13,650 at December 31, 2018.2019. The decrease in cash and cash equivalents between September 30, 2019March 31, 2020 and December 31, 2018,2019, is the result of cash spent on research and development and general and administrative activities offset by $246$35 in interest received on cash balances.
The following table illustrates a summary of cash flow data for the three and nine-monththree-month periods of September 30, 2019March 31, 2020 and 2018:2019:
Dollar and shares in thousands | Three Months Ended September 30, | Nine Months Ended September 30, | ||||||||||||||
| Selected cash flow data: | 2019 | 2018 | 2019 | 2018 | ||||||||||||
| Net cash used in operating activities | $ | (2,235 | ) | $ | (1,599 | ) | $ | (7,470 | ) | $ | (4,896 | ) | ||||
| Net cash provided by investing activities | - | - | - | - | ||||||||||||
| Net cash provided in/(used by) in financing activities | - | 483 | (71 | ) | 1,160 | |||||||||||
| Decrease in cash and cash equivalents | $ | (2,235 | ) | $ | (1,116 | ) | $ | (7,541 | ) | $ | (3,736 | ) | ||||
| Dollar and shares in thousands | Three Months Ended March 31, | |||||||
| Selected cash flow data: | 2020 | 2019 | ||||||
| Net cash used in operating activities | $ | (3,749 | ) | $ | (2,479 | ) | ||
| Net cash provided by investing activities | - | - | ||||||
| Net cash used in financing activities | - | (71 | ) | |||||
| Decrease in cash and cash equivalents | $ | (3,749 | ) | $ | (2,550 | ) | ||
Net cash used in operating activities for the three and nine-monthsthree-months ended September 30, 2019March 31, 2020 was $2,235 and $7,470 respectively.$3,749. This is compared to $1,599 and $4,896 respectfully,$2,479 during the same periodsperiod in 2018.2019. These increases in cash outlays relate to, the formulation and manufacturing of registration batches for PEDMARKTM and regulatory submission activities relating to the rolling NDA.NDA and MAA, and the execution of the Company’s pre-commercialization strategy. The Company had no cash flows from investing or financing activities for the period ended March 31, 2020. In the same period in 2019 the Company capitalized the legal and professional fees associated with securing the Bridge Bank loan facility. This resulted in a $71 cash outflow being recognized in financing activities for the nine-months ended September 30, 2019. During the same period in 2018, the Company received $932, $210 and $18 from the exercise of 571 warrants, 122 options and the short swing profit settlement with shareholder, respectively. The $483 provided by financing activities for the three-months ended September 30, 2018, derived from the exercise of 81 options and 229 warrants.activities.
We continue to pursue various strategic alternatives including collaborations with other pharmaceutical and biotechnology companies. Our projections of further capital requirements are subject to substantial uncertainty. Our working capital requirements may fluctuate in future periods depending upon numerous factors, including: our ability to obtain additional financial resources; our ability to enter into collaborations that provide us with up-front payments, milestones or other payments; results of our research and development activities; progress or lack of progress in our preclinical studies or clinical trials; unfavorable toxicology in our clinical programs, our drug substance requirements to support clinical programs; change in the focus, direction, or costs of our research and development programs; headcount expense; the costs involved in preparing, filing, prosecuting, maintaining, defending and enforcing our patent claims; competitive and technological advances; the potential need to develop, acquire or license new technologies and products; our business development activities; new regulatory requirements implemented by regulatory authorities; the timing and outcome of any regulatory review process; and commercialization activities, if any.
17 |
Outstanding Share Information
The outstanding share data for our company as of September 30, 2019March 31, 2020 and December 31, 20182019 was as follows (in thousands):
| September 30, 2019 | December 31, 2018 | Change | March 31, 2020 | December 31, 2019 | Change | |||||||||||||||||||
| Common shares | 19,896 | 19,896 | - | 19,896 | 19,896 | - | ||||||||||||||||||
| Warrants | 39 | - | 39 | 39 | 39 | - | ||||||||||||||||||
| Stock options | 3,018 | 2,498 | 520 | 3,088 | 3,088 | - | ||||||||||||||||||
| Total | 22,953 | 22,394 | 559 | 23,023 | 23,023 | - | ||||||||||||||||||
Financial Instruments
We invest excess cash and cash equivalents in high credit quality investments held by financial institutions in accordance with our investment policy designed to protect the principal investment. At September 30, 2019,March 31, 2020, we had approximately $15,240$9,901 in cash accounts ($15,1369,519 in savings and money market accounts, and $104$382 in checking accounts). We have not experienced any loss or write down of our money market investments since inception.
Our investment policy is to manage investments to achieve, in the order of importance, the financial objectives of preservation of principal, liquidity and return on investment. Investments may be made in U.S. or Canadian obligations and bank securities, commercial paper of U.S. or Canadian industrial companies, utilities, financial institutions and consumer loan companies, and securities of foreign banks provided the obligations are guaranteed or carry ratings appropriate to the policy. Securities must have a minimum Dun & Bradstreet rating of A for bonds or R1 low for commercial paper. The policy also provides for investment limits on concentrations of securities by issuer and maximum-weighted average time to maturity of twelve months. This policy applies to all of our financial resources.
The policy risks are primarily the opportunity cost of the conservative nature of the allowable investments. As our main purpose is research and development, we have chosen to avoid investments of a trading or speculative nature.
Off-Balance Sheet Arrangements
Since our inception, we have not had any material off-balance sheet arrangements. In addition, we do not engage in trading activities involving non-exchange traded contracts. As such, we are not materially exposed to any financing, liquidity, market or credit risk that could arise if we had engaged in such activities.
Research and Development
Our research and development efforts have been focused on the development of PEDMARKTM since 2013.
We have established relationships with contract research organizations, universities and other institutions, which we utilize to perform many of the day-to-day activities associated with our drug development. Where possible, we have sought to include leading scientific investigators and advisors to enhance our internal capabilities. Research and development issues are reviewed internally by our executive management and supporting scientific team.
Research and development expenses for the three-monthsthree months ended September 30,March 31, 2020 and 2019 were $1,393 and 2018 were $795 and $1,798 respectively, and for the nine-months then ended, $4,435 and $3,285,$1,671, respectively. The Company has increasedcontinued to decrease its research and development expenses related to PEDMARKTM as a result of the Company’s drug manufacturing activities related to the preparation for registration batches andit approaches potential regulatory expenses associated with the rolling NDA submissionapproval of PEDMARKTM.
Our product candidate still requires significant, time-consuming and costly research and development, testing and regulatory clearances. In developing our product candidate, we are subject to risks of failure that are inherent in the development of products based on innovative technologies. For example, it is possible that our product candidate will be ineffective or toxic or will otherwise fail to receive the necessary regulatory clearances. There is a risk that our product candidate will be uneconomical to manufacture or market or will not achieve market acceptance. There is also a risk that third parties may hold proprietary rights that preclude us from marketing our product candidate or that others will market a superior or equivalent product. As a result of these factors, we are unable to accurately estimate the nature, timing and future costs necessary to complete the development of this product candidate. In addition, we are unable to reasonably estimate the period when material net cash inflows could commence from the sale, licensing or commercialization of such product candidate, if ever.
18 |
Critical Accounting Policies and Estimates
The preparation of financial statements in conformity with US GAAP requires management to make estimates that affect the reported amounts of assets and liabilities and disclosure of contingent assets and liabilities as of the date of the financial statements and the reported amounts of revenues and expenses during the reporting period. These estimates are based on assumptions and judgments that may be affected by commercial, economic and other factors. Actual results could differ from these estimates.
Our accounting policies are consistent with those presented in our annual consolidated financial statements included in our Annual Report on Form 10-K for the year ended December 31, 2018.2019.
Item 3. Quantitative and Qualitative Disclosures about Market Risk
Money Market Investments
We maintain an investment portfolio consisting of U.S. or Canadian obligations and bank securities and money market investments in compliance with our investment policy. We do not hold any mortgaged-backed investments in our investment portfolio. Securities must have a minimum Dun & Bradstreet rating of A for bonds or R1 low for commercial paper. The policy also provides for investment limits on concentrations of securities by issuer and maximum-weighted average time to maturity of twelve months. This policy applies to all of our financial resources.
At September 30, 2019,March 31, 2020, we had $15,136$9,519 in money market investments and savingsinvestment accounts as compared to $22,012$13,303 at December 31, 2018;2019; these investments typically have minimal risk. The financial markets had been volatile resulting in concerns regarding the recoverability of money market investments, but those conditions have stabilized. We have not experienced any loss or write down of our money market investments since inception.
Our investment policy is to manage investments to achieve, in the order of importance, the financial objectives of preservation of principal, liquidity and return on investment. Investments may be made in U.S. or Canadian obligations and bank securities, commercial paper of U.S. or Canadian industrial companies, utilities, financial institutions and consumer loan companies, and securities of foreign banks provided the obligations are guaranteed or carry ratings appropriate to the policy. Securities must have a minimum Dun & Bradstreet rating of A for bonds or R1 low for commercial paper. The policy also provides for investment limits on concentrations of securities by issuer and maximum-weighted average time to maturity of twelve months. This policy applies to all of our financial resources.
Foreign Currency Exposure
We are subject to foreign currency risks as we purchase goods and services which are denominated in Canadian dollars. To date, we have not employed the use of derivative instruments; however, we do hold Canadian dollars which we use to pay vendors in Canada and other corporate obligations. At September 30, 2019,March 31, 2020, the Company held approximately $52$16 thousand Canadian dollars ($3912 thousand as presented to U.S. dollars). At December 31, 2018,2019, the Company held approximately $166$30 thousand Canadian dollars ($12124 thousand as presented into U.S. dollars).
Item 4. Controls and Procedures
(a) Evaluation of Disclosure Controls and Procedures.
We maintain "disclosure controls and procedures," as such term is defined in Rule 13a-15(e) under the Exchange Act, that are designed to ensure that information required to be disclosed by us in reports that we file or submit under the Exchange Act is recorded, processed, summarized and reported within the time periods specified in SEC rules and forms, and that such information is accumulated and communicated to our management, our Chief Executive Officer and our Chief Financial Officer, as appropriate to allow timely decisions regarding required disclosure. In designing and evaluating our disclosure controls and procedures, management recognizes that disclosure controls and procedures, no matter how well conceived and operated, can provide only reasonable, not absolute, assurance that the objectives of the disclosure controls and procedures are met. Additionally, in designing disclosure controls and procedures, our management necessarily was required to apply its judgment in evaluating the cost-benefit relationship of possible disclosure controls and procedures. Based on this evaluation at the end of the period covered by this Quarterly Report on Form 10-Q, our Chief Executive Officer and our Chief Financial Officer, have concluded that our disclosure controls and procedures were effective at the reasonable assurance level as of September 30, 2019.March 31, 2020.
(b) Changes in Internal Control over Financial Reporting
There have been no other changes in our internal control over financial reporting (as defined in Rules 13a-15(f) and 15d-15(f) under the Exchange Act) during the period covered by this Quarterly Report on Form 10-Q that has materially affected, or is reasonably likely to materially affect our internal control over financial reporting.
19 |
None
Our Annual Report on Form 10-K for the fiscal year ended December 31, 2018,2019, filed with the SEC on March 15, 2019February 14, 2020 (the “Annual Report”), includes a detailed discussion of our risk factors under the heading “PART I, Item 1A – Risk Factors.” You should carefully consider the risk factors discussed in our Annual Report, as well as other information in this quarterly report. Any of these risks could cause our business, financial condition, results of operations and future growth prospects to suffer. We are not aware of any material changes from the risk factors previously disclosed.disclosed other than the following:.
Our business and operations may be materially and adversely affected by the recent coronavirus outbreak.
In December 2019, a novel strain of coronavirus was reported to have surfaced in Wuhan, China and has since spread to other parts of the world, including the United States and Europe. In March 2020, the World Health Organization declared the outbreak a pandemic. The coronavirus pandemic is affecting the United States and global economies. If the outbreak continues to spread, it may affect our operations and those of third parties on which we rely in a number of ways, including causing disruptions in the supply of our product candidate, the pending regulatory approval process and the conduct of current and planned preclinical and clinical studies. We may need to limit operations or implement limitations and may experience limitations in employee resources. There are risks that the coronavirus may be more difficult to contain if the outbreak reaches a larger population or broader geography, in which case the risks described herein could be elevated significantly. The extent to which the coronavirus impacts our results will depend on future developments, including, without limitation, new information that may emerge concerning the severity of the coronavirus and the actions to contain the coronavirus or treat its impact, all of which are highly uncertain and cannot be predicted.
Additionally, while the duration of and the potential economic impact caused by the coronavirus pandemic are difficult to assess or predict, the impact of the coronavirus on the global financial markets may reduce our ability to access capital, which could negatively impact our short-term and long-term liquidity and our ability to complete our regulatory submissions and clinical studies on a timely basis, or at all. For instance, our regulatory submissions may be temporarily delayed or paused, and the operations of our contracted third parties may be significantly delayed as well. The ultimate impact of the coronavirus pandemic is highly uncertain and subject to change. We do not yet know the full extent of potential delays or impacts on our business, financing or preclinical and clinical trial activities or the global economy as a whole. However, these effects could have a material impact on our liquidity, capital resources, operations and business and those of the third parties on which we rely.
Natural disasters, epidemic or pandemic disease outbreaks, trade wars, political unrest or other events could disrupt our business or operations or those of our development partners, manufacturers, regulators or other third parties with whom we conduct business now or in the future.
A wide variety of events beyond our control, including natural disasters, epidemic or pandemic disease outbreaks (such as the recent novel coronavirus outbreak), trade wars, political unrest or other events, could disrupt our business or operations or those of our manufacturers, regulatory authorities, or other third parties with whom we conduct business. These events may cause businesses and government agencies to be shut down, supply chains to be interrupted, slowed, or rendered inoperable, and individuals to become ill, quarantined, or otherwise unable to work and/or travel due to health reasons or governmental restrictions. For example, many states recently ordered most businesses closed, mandating work-from-home arrangements where feasible, in response to the coronavirus pandemic. These limitations could negatively affect our business operations and continuity,and could negatively impact our development timelines and ability to timely perform basic business functions, including, without limitation, making SEC filings and preparing financial reports. If our operations or those of third parties with whom we conduct business are impaired or curtailed as a result of these events, the development and commercialization of our products and product candidate could be impaired or halted, which could have a material adverse impact on our business.
Item 2. Recent Sales of Unregistered Securities.
NoneNone.
Item 3. Default Upon Senior Securities.
None.
Item 4. Mine Safety Disclosure.
Not applicable.
None.
20 |
23
21 |
Pursuant to requirements of the Securities Exchange Act of 1934, the Registrant has duly caused this report to be signed on its behalf by the undersigned thereunto duly authorized.
| Fennec Pharmaceuticals Inc. | ||
| Date: | By: | /s/ Rostislav Raykov |
| Rostislav Raykov | ||
| Chief Executive Officer | ||
| (principal executive officer) | ||
Date: | By: | /s/ Robert Andrade |
| Robert Andrade | ||
| Chief Financial Officer | ||
| (principal financial and chief accounting officer) | ||
22 |