http://fasb.org/us-gaap/2023#AssetPledgedAsCollateralMemberhttp://fasb.org/us-gaap/2023#AssetPledgedAsCollateralMemberhttp://fasb.org/us-gaap/2023#AssetPledgedAsCollateralMemberhttp://fasb.org/us-gaap/2023#AssetPledgedAsCollateralMemberhttp://fasb.org/us-gaap/2023#LaborAndRelatedExpensehttp://fasb.org/us-gaap/2023#LaborAndRelatedExpensehttp://fasb.org/us-gaap/2023#LaborAndRelatedExpensehttp://fasb.org/us-gaap/2023#LaborAndRelatedExpensehttp://fasb.org/us-gaap/2023#LaborAndRelatedExpensehttp://fasb.org/us-gaap/2023#LaborAndRelatedExpensehttp://fasb.org/us-gaap/2023#LaborAndRelatedExpensehttp://fasb.org/us-gaap/2023#LaborAndRelatedExpensehttp://fasb.org/us-gaap/2023#LaborAndRelatedExpensehttp://fasb.org/us-gaap/2023#LaborAndRelatedExpensehttp://fasb.org/us-gaap/2023#LaborAndRelatedExpensehttp://fasb.org/us-gaap/2023#LaborAndRelatedExpensehttp://fasb.org/us-gaap/2023#LaborAndRelatedExpensehttp://fasb.org/us-gaap/2023#LaborAndRelatedExpensehttp://fasb.org/us-gaap/2023#LaborAndRelatedExpensehttp://fasb.org/us-gaap/2023#LaborAndRelatedExpensehttp://fasb.org/us-gaap/2023#GainLossOnDerivativeInstrumentsNetPretaxhttp://fasb.org/us-gaap/2023#GainLossOnDerivativeInstrumentsNetPretaxhttp://fasb.org/us-gaap/2023#GainLossOnDerivativeInstrumentsNetPretaxhttp://fasb.org/us-gaap/2023#GainLossOnDerivativeInstrumentsNetPretaxhttp://fasb.org/us-gaap/2023#GainLossOnDerivativeInstrumentsNetPretaxhttp://fasb.org/us-gaap/2023#GainLossOnDerivativeInstrumentsNetPretaxhttp://fasb.org/us-gaap/2023#GainLossOnDerivativeInstrumentsNetPretaxhttp://fasb.org/us-gaap/2023#GainLossOnDerivativeInstrumentsNetPretaxhttp://fasb.org/us-gaap/2023#GainLossOnDerivativeInstrumentsNetPretaxhttp://fasb.org/us-gaap/2023#GainLossOnDerivativeInstrumentsNetPretaxhttp://fasb.org/us-gaap/2023#GainLossOnDerivativeInstrumentsNetPretaxhttp://fasb.org/us-gaap/2023#GainLossOnDerivativeInstrumentsNetPretaxhttp://fasb.org/us-gaap/2023#GainLossOnDerivativeInstrumentsNetPretaxhttp://fasb.org/us-gaap/2023#GainLossOnDerivativeInstrumentsNetPretaxhttp://fasb.org/us-gaap/2023#GainLossOnDerivativeInstrumentsNetPretaxhttp://fasb.org/us-gaap/2023#GainLossOnDerivativeInstrumentsNetPretaxhttp://fasb.org/us-gaap/2023#DebtSecuritiesAvailableForSaleExcludingAccruedInterest http://fasb.org/us-gaap/2023#FederalHomeLoanBankAdvanceshttp://fasb.org/us-gaap/2023#FederalHomeLoanBankConsolidatedObligationsBonds http://fasb.org/us-gaap/2023#FederalHomeLoanBankConsolidatedObligationsDiscountNoteshttp://fasb.org/us-gaap/2023#DebtSecuritiesAvailableForSaleExcludingAccruedInterest http://fasb.org/us-gaap/2023#FederalHomeLoanBankAdvanceshttp://fasb.org/us-gaap/2023#FederalHomeLoanBankConsolidatedObligationsBonds http://fasb.org/us-gaap/2023#FederalHomeLoanBankConsolidatedObligationsDiscountNotesFederal Home Loan Bank of New YorkNONE000001329842--12-312023Q2false686030006860300063877000http://fasb.org/us-gaap/2023#GainLossOnDerivativeInstrumentsNetPretaxhttp://fasb.org/us-gaap/2023#GainLossOnDerivativeInstrumentsNetPretaxhttp://fasb.org/us-gaap/2023#GainLossOnDerivativeInstrumentsNetPretaxhttp://fasb.org/us-gaap/2023#GainLossOnDerivativeInstrumentsNetPretax638770000000X1http://fasb.org/us-gaap/2023#OtherComprehensiveIncomeAvailableforsaleSecuritiesAdjustmentBeforeTaxPortionAttributableToParenthttp://fasb.org/us-gaap/2023#OtherComprehensiveIncomeAvailableforsaleSecuritiesAdjustmentBeforeTaxPortionAttributableToParenthttp://fasb.org/us-gaap/2023#OtherComprehensiveIncomeAvailableforsaleSecuritiesAdjustmentBeforeTaxPortionAttributableToParenthttp://fasb.org/us-gaap/2023#OtherComprehensiveIncomeAvailableforsaleSecuritiesAdjustmentBeforeTaxPortionAttributableToParent00

Table of Contents

UNITED STATES

SECURITIES AND EXCHANGE COMMISSION

WASHINGTON, D.C. 20549

FORM 10-Q

QUARTERLY REPORT PURSUANT TO SECTION 13 OR 15(d) OF THE SECURITIES EXCHANGE ACT OF 1934

For the quarterly period ended June 30, 20222023

or

TRANSITION REPORT PURSUANT TO SECTION 13 OR 15(d) OF THE SECURITIES EXCHANGE ACT OF 1934

For the transition period from              to              

Commission file number: 000-51397

FEDERAL HOME LOAN BANK OF NEW YORK

(Exact name of registrant as specified in its charter)

Federally chartered corporation


13-6400946

(State or other jurisdiction of

(I.R.S. Employer

incorporation or organization)

Identification No.)

101 Park Avenue, New York, New York

10178

(Address of principal executive offices)

(Zip Code)

(212) 681-6000

(Registrant’s telephone number, including area code)

Securities registered pursuant to Section 12(b) of the Act:

Title of each class

Trading Symbol(s)

Name of each exchange on which registered

None

N/A

N/A

Indicate by check mark whether the registrant (1) has filed all reports required to be filed by Section 13 or 15(d) of the Securities Exchange Act of 1934 during the preceding 12 months (or for such shorter period that the registrant was required to file such reports), and (2) has been subject to such filing requirements for the past 90 days. Yes  No 

Indicate by check mark whether the registrant has submitted electronically every Interactive Data File required to be submitted pursuant to Rule 405 of Regulation S-T (§232.405 of this chapter) during the preceding 12 months (or for such shorter period that the registrant was required to submit such files). Yes  No 

Indicate by check mark whether the registrant is a large accelerated filer, an accelerated filer, a non-accelerated filer, a smaller reporting company or an emerging growth company. See the definitions of “large accelerated filer,” “accelerated filer,” “smaller reporting company” and “emerging growth company” in Rule 12b-2 of the Exchange Act.

Large accelerated filer

Accelerated filer

Non-accelerated filer

Smaller reporting company

Emerging growth company

If an emerging growth company, indicate by check mark if the registrant has elected not to use the extended transition period for complying with any new or revised financial accounting standards provided pursuant to Section 13(a) of the Exchange Act.

Indicate by check mark whether the registrant is a shell company (as defined in Rule 12b-2 of the Exchange Act). Yes  No 

The number of shares outstanding of issuer’s Class B capital stock as of July 31, 20222023 was 54,022,171.56,763,341.

Table of Contents

FEDERAL HOME LOAN BANK OF NEW YORK

FORM 10-Q FOR THE QUARTERLY PERIOD ENDED JUNE 30, 20222023

Table of Contents


Page


PART I. FINANCIAL INFORMATION

Item 1. Financial Statements (Unaudited):

Statements of Condition (Unaudited) as of June 30, 20222023 and December 31, 20212022

3

Statements of Income (Unaudited) for the Three and Six Months Ended June 30, 20222023 and 20212022

4

Statements of Comprehensive Income (Unaudited) for the Three and Six Months Ended June 30, 20222023 and 20212022

5

Statements of Capital (Unaudited) for the Three and Six Months Ended June 30, 20222023 and 20212022

6

Statements of Cash Flows (Unaudited) for the Six Months Ended June 30, 20222023 and 20212022

87

Notes to Financial Statements (Unaudited)

9

Item 2. Management’s Discussion and Analysis of Financial Condition and Results of Operations

6259

Item 3. Quantitative and Qualitative Disclosures about Market Risk

115112

Item 4. Controls and Procedures

119116

PART II. OTHER INFORMATION

120117

Item 1. Legal Proceedings

120117

Item 1A. Risk Factors

120117

Item 2. Unregistered Sales of Equity Securities and Use of Proceeds

120117

Item 3. Defaults Upon Senior Securities

120117

Item 4. Mine Safety Disclosures

120117

Item 5. Other Information

120117

Item 6. Exhibits

121118

Signatures

122119

2

Table of Contents

Federal Home Loan Bank of New York

Statements of Condition — Unaudited (In Thousands, Except Par Value of Capital Stock)

As of June 30, 20222023 and December 31, 20212022


June 30, 2022


December 31, 2021


June 30, 2023


December 31, 2022

Assets

Cash and due from banks (Note 3)

$

163,741

$

21,653

$

45,142

$

27,420

Interest-bearing deposits (Note 4)

675,000

675,000

2,950,000

1,750,000

Securities purchased under agreements to resell (Note 4)


1,200,000


16,745,000


4,245,000

Federal funds sold (Note 4)


8,650,000


7,230,000


15,560,000


9,470,000

Trading securities (Note 5)

(Includes $534,094 pledged as collateral at June 30, 2022 and $367,110 at December 31, 2021)

7,712,829

5,821,380

Trading securities (Note 5) (Includes $754,175 pledged as collateral at June 30, 2023 and $576,756 at December 31, 2022)

5,285,390

7,113,419

Equity Investments (Note 6)

80,547

96,124

87,845

81,754

Available-for-sale securities, amortized cost of $6,912,113 at June 30, 2022 and $6,391,584 at December 31, 2021 (Note 7)


6,777,748


6,547,421

Held-to-maturity securities, net of allowance for credit losses of $323 at June 30, 2022 and $340 at December 31, 2021 (Note 8) (Includes $2,431 pledged as collateral at June 30, 2022 and $2,453 at December 31, 2021)

9,104,499

9,328,665

Advances (Note 9) (Includes $0 at June 30, 2022 and December 31, 2021 at fair value under the fair value option)


80,062,142


71,536,402

Mortgage loans held-for-portfolio, net of allowance for credit losses of $1,975 at June 30, 2022 and $2,135 at December 31, 2021 (Note 10)


2,175,465


2,319,864

Available-for-sale securities, amortized cost of $8,708,108 at June 30, 2023 and $7,322,538 at December 31, 2022 (Note 7)


8,479,909


7,088,870

Held-to-maturity securities, net of allowance for credit losses of $606 at June 30, 2023 and $307 at December 31, 2022 (Note 8) (Includes $2,366 pledged as collateral at June 30, 2023 and $3,008 at December 31, 2022)

10,697,606

9,354,048

Advances (Note 9) (Includes $0 at June 30, 2023 and December 31, 2022 at fair value under the fair value option)


108,573,216


115,292,876

Mortgage loans held-for-portfolio, net of allowance for credit losses of $3,488 at June 30, 2023 and $1,911 at December 31, 2022 (Note 10)


2,138,755


2,106,969

Accrued interest receivable

172,364

123,258

595,428

437,823

Premises, software, and equipment


78,992


83,815


73,246


77,710

Operating lease right-of-use assets (Note 19)

63,003

65,624

57,625

60,338

Derivative assets (Note 17)


235,223


297,504


99,602


163,921

Other assets


11,560


11,632


18,843


121,341

Total assets

$

115,963,113

$

105,358,342

$

171,407,607

$

157,391,489

Liabilities and capital

Liabilities

Deposits (Note 11)

Interest-bearing demand

$

1,473,761

$

1,283,072

$

2,920,374

$

1,015,991

Non-interest-bearing demand


17,792


38,166


6,467


10,946

Total deposits


1,491,553


1,321,238


2,926,841


1,026,937

Consolidated obligations, net (Note 12)

Bonds (Includes $3,618,896 at June 30, 2022 and $7,386,074 at December 31, 2021 at fair value under the fair value option)


57,550,526


54,829,401

Discount notes (Includes $0 at June 30, 2022 and December 31, 2021 at fair value under the fair value option)


49,519,232


42,197,259

Bonds (Includes $4,182,576 at June 30, 2023 and $4,159,862 at December 31, 2022 at fair value under the fair value option)


101,048,634


85,497,755

Discount notes (Includes $0 at June 30, 2023 and December 31, 2022 at fair value under the fair value option)


57,911,901


61,792,989

Total consolidated obligations


107,069,758


97,026,660


158,960,535


147,290,744

Mandatorily redeemable capital stock (Note 14)


8,117


1,959


7,329


4,578

Accrued interest payable


176,866


126,990


619,683


370,456

Affordable Housing Program (Note 13)


131,783


137,638


158,749


131,394

Derivative liabilities (Note 17)


105,578


36,512


24,160


15,333

Other liabilities


140,379


182,466


122,505


131,360

Operating lease liabilities (Note 19)

76,212

79,026

70,188

73,304

Total liabilities


109,200,246


98,912,489


162,889,990


149,044,106

Commitments and Contingencies (Notes 14, 17 and 19)

Capital (Note 14)

Capital stock ($100 par value), putable, issued and outstanding shares: 49,392 at June 30, 2022 and 45,008 at December 31, 2021


4,939,244


4,500,785

Capital stock ($100 par value), putable, issued and outstanding shares: 63,616 at June 30, 2023 and 63,877 at December 31, 2022


6,361,603


6,387,701

Retained earnings

Unrestricted


1,108,765


1,103,585


1,288,745


1,185,112

Restricted (Note 14)


854,053


827,380


993,719


910,855

Total retained earnings


1,962,818


1,930,965


2,282,464


2,095,967

Total accumulated other comprehensive income (loss)


(139,195)


14,103


(126,450)


(136,285)

Total capital


6,762,867


6,445,853


8,517,617


8,347,383

Total liabilities and capital

$

115,963,113

$

105,358,342

$

171,407,607

$

157,391,489

The accompanying notes are an integral part of these financial statements.

3

Table of Contents

Federal Home Loan Bank of New York

Statements of Income — Unaudited (In Thousands, Except Per Share Data)

For the Three and Six Months Ended June 30, 20222023 and 20212022

Three months ended

Six months ended

Three months ended

Six months ended

June 30, 

June 30, 

June 30, 

June 30, 


2022


2021


2022


2021


2023


2022


2023


2022

Interest income

Advances, net (Note 9)

$

236,103

$

123,567

$

348,857

$

263,395

$

1,653,311

$

236,103

$

3,057,864

$

348,857

Interest-bearing deposits (Note 4)


3,869


264


4,357


597


53,275


3,869


99,310


4,357

Securities purchased under agreements to resell (Note 4)


11


12


21


476


123,728


11


170,917


21

Federal funds sold (Note 4)


20,385


1,852


24,079


4,164


266,324


20,385


430,758


24,079

Trading securities (Note 5)

22,419

27,748

37,753

68,378

30,679

22,419

60,705

37,753

Available-for-sale securities (Note 7)


29,586


16,987


51,190


32,165


106,674


29,586


195,384


51,190

Held-to-maturity securities (Note 8)


57,154


59,483


109,308


123,873


100,661


57,154


184,663


109,308

Mortgage loans held-for-portfolio (Note 10)


16,667


17,620


33,038


36,760


16,945


16,667


33,684


33,038

Loans to other FHLBanks (Note 20)


71


1


72


1


71


71


71


72

Total interest income


386,265


247,534


608,675


529,809


2,351,668


386,265


4,233,356


608,675

Interest expense

Consolidated obligation bonds (Note 12)


157,922


88,869


240,015


182,835


1,292,650


157,922


2,349,911


240,015

Consolidated obligation discount notes (Note 12)


79,097


15,385


97,024


44,997


751,232


79,097


1,331,838


97,024

Deposits (Note 11)


1,654


69


1,826


175


32,380


1,654


44,918


1,826

Mandatorily redeemable capital stock (Note 14)


765


28


891


62


130


765


243


891

Cash collateral held and other borrowings


116


18


118


37


553


116


1,987


118

Total interest expense


239,554


104,369


339,874


228,106


2,076,945


239,554


3,728,897


339,874

Net interest income before provision for credit losses


146,711


143,165


268,801


301,703


274,723


146,711


504,459


268,801

Provision (Reversal) for credit losses


(68)


(1,672)


(146)


(2,957)


1,783


(68)


1,876


(146)

Net interest income after provision for credit losses


146,779


144,837


268,947


304,660


272,940


146,779


502,583


268,947

Other income (loss)

Service fees and other


3,864


4,427


8,359


8,559


5,502


3,864


10,836


8,359

Instruments held under the fair value option gains (losses) (Note 18)


36,783


3,871


117,429


3,933


16,676


36,783


(22,702)


117,429

Derivative gains (losses) (Note 17)


48,229


3,918


117,245


(391)


79,897


48,229


48,091


117,245

Trading securities gains (losses) (Note 5)

(93,717)

(26,380)

(257,030)

(61,183)

(88,056)

(93,717)

13,892

(257,030)

Equity investments gains (losses) (Note 6)

(10,388)

4,539

(16,189)

6,839

2,972

(10,388)

7,223

(16,189)

Litigation settlement

2,202

930

1,620

2,202

Losses from extinguishment of debt

(99)

(99)

-

(99)

(99)

Total other income (loss)


(15,328)


(9,625)


(28,083)


(42,243)


17,921


(15,328)


58,960


(28,083)

Other expenses

Operating


17,460


18,171


31,991


32,418


19,020


17,460


36,725


31,991

Compensation and benefits


21,573


23,153


44,905


47,480


25,000


21,573


50,763


44,905

Finance Agency and Office of Finance


5,110


5,386


10,822


11,006


5,027


5,110


10,079


10,822

Other expenses

2,417

5,493

4,864

8,268

2,049

2,417

3,594

4,864

Total other expenses


46,560


52,203


92,582


99,172


51,096


46,560


101,161


92,582

Income before assessments


84,891


83,009


148,282


163,245


239,765


84,891


460,382


148,282

Affordable Housing Program Assessments (Note 13)


8,566


8,304


14,917


16,331


23,989


8,566


46,062


14,917

Net income

$

76,325

$

74,705

$

133,365

$

146,914

$

215,776

$

76,325

$

414,320

$

133,365

Basic earnings per share (Note 15)

$

1.64

$

1.44

$

2.91

$

2.80

$

3.19

$

1.64

$

6.30

$

2.91

The accompanying notes are an integral part of these financial statements.

4

Table of Contents

Federal Home Loan Bank of New York

Statements of Comprehensive Income — Unaudited (In Thousands)

For the Three and Six Months Ended June 30, 20222023 and 20212022

Three months ended June 30, 

Six months ended June 30,

Three months ended June 30, 

Six months ended June 30,


2022


2021


2022


2021


2023


2022


2023


2022

Net Income

$

76,325

$

74,705

$

133,365

$

146,914

$

215,776

$

76,325

$

414,320

$

133,365

Other Comprehensive income (loss)

Net change in unrealized gains (losses) on available-for-sale securities

(244,181)

64,454

(646,008)

(65,311)

(110,972)

(244,181)

(19,846)

(646,008)

Net change in non-credit accretion portion of held-to-maturity securities

Non-credit portion of other-than-temporary impairment gains (losses)

Reclassification of non-credit portion included in net income

Accretion of non-credit portion


173


2,062


391


2,519


53


173


132


391

Total net change in non-credit portion of other-than-temporary impairment losses on held-to-maturity securities

173

2,062

391

2,519

53

173

132

391

Net change due to hedging activities

Cash flow hedges (a)

44,134

(16,792)

135,621

66,069

31,298

44,134

4,930

135,621

Fair value hedges (b)

149,410

(34,583)

355,806

42,810

135,199

149,410

25,315

355,806

Total net change due to hedging activities


193,544


(51,375)


491,427


108,879


166,497


193,544


30,245


491,427

Net change in pension and postretirement benefits


446


1,651


892


3,303


(348)


446


(696)


892

Total other comprehensive income (loss)


(50,018)


16,792


(153,298)


49,390


55,230


(50,018)


9,835


(153,298)

Total comprehensive income (loss)

$

26,307

$

91,497

$

(19,933)

$

196,304

$

271,006

$

26,307

$

424,155

$

(19,933)

(a)

Represents changes in the fair values of derivatives in cash flow hedging programs, primarily from open contracts in the hedging of rolling issuance of CO discount notes, and any open contracts in cash flow hedges of anticipatory issuance of CO bonds. Also includes unamortized gains and losses related to closed cash flow hedges that will be amortized in future periods from AOCI to Interest expense. For more information, see table “Cash flow hedge gains and losses” in Note 17. Derivatives and Hedging Activities.

(b)

Represents cumulative hedge valuation basis adjustments on fair value hedges of Available-for-Sale (AFS)AFS securities under the partial-term hedging provisions of ASU 2017-12. Amounts represent change in the benchmark rate of the hedged securities. Changes in the benchmark rate on ASC 815 qualifying fair value hedges are recorded through earnings with an offset to the carrying values of the hedged AFS securities. Changes in marked-to-market values of AFS securities are recorded to adjust the amortized cost of AFS securities with an offset in AOCI. In AOCI, the marked-to-market gains and losses are reported separately from ASC 815 valuation changes due to changes in the benchmark rate.

The accompanying notes are an integral part of these financial statements.

5

Table of Contents

Federal Home Loan Bank of New York

Statements of Capital — Unaudited (In Thousands, Except Per Share Data)

For the Three and Six Months Ended June 30, 20222023 and 20212022

Accumulated

Accumulated

Capital Stock (a)

Other

Capital Stock (a)

Other

Class B

Retained Earnings

Comprehensive

Total

Class B

Retained Earnings

Comprehensive

Total


Shares


Par Value


Unrestricted


Restricted


Total


Income (Loss)


Capital

Balance, March 31, 2021


53,141

$

5,314,134

$

1,122,293

$

788,717

$

1,911,010

$

12,851

$

7,237,995

Proceeds from issuance of capital stock

7,397

739,655

739,655

Repurchase/redemption of capital stock


(11,865)


(1,186,457)


(1,186,457)

Shares reclassified to mandatorily redeemable capital stock

(41)

(41)

Cash dividends ($1.17 per share) on capital stock


(62,122)


(62,122)


(62,122)

Comprehensive income (loss)


59,764

14,941


74,705


16,792


91,497

Balance, June 30, 2021


48,673

$

4,867,291

$

1,119,935

$

803,658

$

1,923,593

$

29,643

$

6,820,527


Shares


Par Value


Unrestricted


Restricted


Total


Income (Loss)


Capital

Balance, March 31, 2022


44,800

$

4,480,031

$

1,100,420

$

838,788

$

1,939,208

$

(89,177)

$

6,330,062


44,800

$

4,480,031

$

1,100,420

$

838,788

$

1,939,208

$

(89,177)

$

6,330,062

Proceeds from issuance of capital stock


18,955

1,895,404


1,895,404

18,955

1,895,404

1,895,404

Repurchase/redemption of capital stock

(11,997)

(1,199,618)

(1,199,618)


(11,997)


(1,199,618)


(1,199,618)

Shares reclassified to mandatorily redeemable capital stock

(2,366)

(236,573)

(236,573)

(2,366)

(236,573)

(236,573)

Cash dividends ($1.17 per share) on capital stock


(52,715)


(52,715)


(52,715)


(52,715)


(52,715)


(52,715)

Comprehensive income (loss)


61,060


15,265


76,325


(50,018)


26,307


61,060

15,265


76,325


(50,018)


26,307

Balance, June 30, 2022


49,392

$

4,939,244

$

1,108,765

$

854,053

$

1,962,818

$

(139,195)

$

6,762,867

Balance, June 30, 2022


49,392

$

4,939,244

$

1,108,765

$

854,053

$

1,962,818

$

(139,195)

$

6,762,867

Balance, March 31, 2023


68,603

$

6,860,288

$

1,238,242

$

950,564

$

2,188,806

$

(181,680)

$

8,867,414

Proceeds from issuance of capital stock


20,094

2,009,327


2,009,327

Repurchase/redemption of capital stock

(25,049)

(2,504,823)

(2,504,823)

Shares reclassified to mandatorily redeemable capital stock

(32)

(3,189)

(3,189)

Cash dividends ($1.91 per share) on capital stock


(122,118)


(122,118)


(122,118)

Comprehensive income (loss)


172,621


43,155


215,776


55,230


271,006

Balance, June 30, 2023


63,616

$

6,361,603

$

1,288,745

$

993,719

$

2,282,464

$

(126,450)

$

8,517,617

Accumulated

Accumulated

Capital Stock (a)

Other

Capital Stock (a)

Other

Class B

Retained Earnings

Comprehensive

Total

Class B

Retained Earnings

Comprehensive

Total


Shares


Par Value


Unrestricted


Restricted


Total


Income (Loss)


Capital


Shares


Par Value


Unrestricted


Restricted


Total


Income (Loss)


Capital

Balance, December 31, 2020


53,669

$

5,366,830

$

1,135,341

$

774,275

$

1,909,616

$

(19,747)

$

7,256,699

Proceeds from issuance of capital stock


14,103


1,410,333


1,410,333

Repurchase/redemption of capital stock

(19,098)

(1,909,787)

(1,909,787)

Shares reclassified to mandatorily redeemable capital stock

(1)

(85)

(85)

Cash dividends ($2.43 per share) on capital stock


(132,937)


(132,937)


(132,937)

Comprehensive income (loss)


117,531


29,383


146,914


49,390


196,304

Balance, June 30, 2021


48,673

$

4,867,291

$

1,119,935

$

803,658

$

1,923,593

$

29,643

$

6,820,527

Balance, December 31, 2021


45,008

$

4,500,785

$

1,103,585

$

827,380

$

1,930,965

$

14,103

$

6,445,853


45,008

$

4,500,785

$

1,103,585

$

827,380

$

1,930,965

$

14,103

$

6,445,853

Proceeds from issuance of capital stock

30,128

3,012,781

3,012,781


30,128


3,012,781


3,012,781

Repurchase/redemption of capital stock


(23,159)


(2,315,855)


(2,315,855)

(23,159)

(2,315,855)

(2,315,855)

Shares reclassified to mandatorily redeemable capital stock

(2,585)

(258,467)

(258,467)

(2,585)

(258,467)

(258,467)

Cash dividends ($2.27 per share) on capital stock


(101,512)


(101,512)


(101,512)


(101,512)


(101,512)


(101,512)

Comprehensive income (loss)


106,692


26,673


133,365


(153,298)


(19,933)


106,692


26,673


133,365


(153,298)


(19,933)

Balance, June 30, 2022


49,392

$

4,939,244

$

1,108,765

$

854,053

$

1,962,818

$

(139,195)

$

6,762,867

Balance, June 30, 2022


49,392

$

4,939,244

$

1,108,765

$

854,053

$

1,962,818

$

(139,195)

$

6,762,867

Balance, December 31, 2022


63,877

$

6,387,701

$

1,185,112

$

910,855

$

2,095,967

$

(136,285)

$

8,347,383

Proceeds from issuance of capital stock

66,309

6,630,873

6,630,873

Repurchase/redemption of capital stock


(66,523)


(6,652,312)


(6,652,312)

Shares reclassified to mandatorily redeemable capital stock

(47)

(4,659)

(4,659)

Cash dividends ($3.80 per share) on capital stock


(227,823)


(227,823)


(227,823)

Comprehensive income (loss)


331,456


82,864


414,320


9,835


424,155

Balance, June 30, 2023


63,616

$

6,361,603

$

1,288,745

$

993,719

$

2,282,464

$

(126,450)

$

8,517,617

(a)Putable stock. Cash dividends paid — Dividends per share and aggregate dividends were paid on a single class of shares of capital stock. For more information, see Note 14. Capital Stock, Mandatorily Redeemable Capital Stock and Restricted Retained Earnings.

The accompanying notes are an integral part of these financial statements.

6

Table of Contents

Federal Home Loan Bank of New York

Statements of Cash Flows — Unaudited (In Thousands)

For the Six Months Ended June 30, 20222023 and 20212022

Six months ended June 30,

Six months ended June 30,


2022


2021


2023


2022

Operating activities

Net Income

$

133,365

$

146,914

$

414,320

$

133,365

Adjustments to reconcile net income to net cash provided by operating activities:

Depreciation and amortization:

Net premiums and discounts on consolidated obligations, investments, mortgage loans and other adjustments (a)


175,092


331


(9,990)


175,092

Concessions on consolidated obligations


1,284


1,601


1,724


1,284

Premises, software, and equipment


8,476


6,069


9,283


8,476

Provision (Reversal) for credit losses

(146)

(2,957)

1,876

(146)

Change in net fair value adjustments on derivatives and hedging activities (b)


1,076,796


281,500


12,930


1,076,796

Net realized and unrealized (gains) losses on trading securities

257,030

61,183

(13,892)

257,030

Change in fair value on Equity Investments

16,509

(5,366)

(6,887)

16,509

Change in fair value adjustments on financial instruments held at fair value


(117,429)


(3,933)


22,702


(117,429)

Losses from extinguishment of debt

99

99

Net change in:

Accrued interest receivable


(49,343)


44,275


(155,466)


(49,343)

Derivative assets due to accrued interest


(160,130)


10,372


(915,822)


(160,130)

Derivative liabilities due to accrued interest


110,538


(59,990)


841,007


110,538

Other assets


86


(118)


524


86

Affordable Housing Program liability


(5,855)


3,696


27,355


(5,855)

Accrued interest payable


49,876


15,227


249,227


49,876

Other liabilities


(12,995)


8,375


(11,328)


(12,995)

Total adjustments


1,349,888


360,265


53,243


1,349,888

Net cash provided by (used in) operating activities

$

1,483,253

$

507,179

$

467,563

$

1,483,253

Investing activities

Net change in:

Interest-bearing deposits

$

(645,462)

$

177,260

$

(905,230)

$

(645,462)

Securities purchased under agreements to resell


1,200,000


(4,050,000)


(12,500,000)


1,200,000

Federal funds sold


(1,420,000)


774,000


(6,090,000)


(1,420,000)

Deposits with other FHLBanks


7


(50)


(190)


7

Premises, software, and equipment


(3,652)


(7,562)


(4,819)


(3,652)

Trading securities:

Purchased

(4,099,838)

(1,940,624)

(657,793)

(4,099,838)

Repayments

1,155,000

6,530,020

2,225,000

1,155,000

Proceeds from sales

794,624

399,516

794,624

Equity Investments:

Purchased

(3,572)

(7,398)

(1,340)

(3,572)

Proceeds from sales

2,639

1,731

2,137

2,639

Available-for-sale securities:

Purchased

(1,169,366)

(330,616)

(1,469,484)

(1,169,366)

Repayments


285,620


68,117


56,794


285,620

Held-to-maturity securities:

Long-term securities

Purchased

(496,813)

(173,733)

(1,726,140)

(496,813)

Repayments

715,726

1,166,529

488,096

715,726

Advances:

Principal collected


368,491,426


214,920,661


969,850,659


368,491,426

Made


(378,382,113)


(203,391,144)


(963,111,649)


(378,382,113)

Mortgage loans held-for-portfolio:

Principal collected


173,431


465,935


80,522


173,431

Purchased


(32,997)


(96,966)


(117,203)


(32,997)

Proceeds from sales of REO


308


102


226


308

Net cash provided by (used in) investing activities

$

(13,435,032)

$

14,106,262

$

(13,480,898)

$

(13,435,032)

The accompanying notes are an integral part of these financial statements.

7

Table of Contents

Federal Home Loan Bank of New York

Statements of Cash Flows — Unaudited (In Thousands)

For the Six Months Ended June 30, 20222023 and 20212022

Six months ended June 30,

Six months ended June 30,


2022


2021


2023


2022

Financing activities

Net change in:

Deposits and other borrowings

$

142,807

$

(223,654)

$

1,922,804

$

142,807

Derivative contracts with financing element


(1,150)


(1,788)


(2,463)


(1,150)

Consolidated obligation bonds:

Proceeds from issuance


21,023,455


33,828,355


72,994,025


21,023,455

Payments for maturing and early retirement


(16,733,821)


(34,169,646)


(57,606,330)


(16,733,821)

Payments on bonds (transferred to) or assumed from other FHLBanks (c)

173,984

Consolidated obligation discount notes:

Proceeds from issuance


379,572,487


296,370,345


169,287,802


379,572,487

Payments for maturing


(372,253,016)


(311,801,520)


(179,256,561)


(372,253,016)

Proceeds on Discount Notes assumed from other FHLBanks (c)

5,942,950

Capital stock:

Proceeds from issuance of capital stock


3,012,781

1,410,333


6,630,873

3,012,781

Payments for repurchase/redemption of capital stock


(2,315,855)

(1,909,787)


(6,652,312)

(2,315,855)

Redemption of mandatorily redeemable capital stock


(252,309)

(716)


(1,908)

(252,309)

Cash dividends paid (d)


(101,512)

(132,937)


(227,823)

(101,512)

Net cash provided by (used in) financing activities

$

12,093,867

$

(16,457,031)

$

13,031,057

$

12,093,867

Net increase (decrease) in cash and due from banks


142,088

(1,843,590)


17,722

142,088

Cash and due from banks at beginning of the period (e)


21,653

1,896,155


27,420

21,653

Cash and due from banks at end of the period (e)

$

163,741

$

52,565

$

45,142

$

163,741

Supplemental disclosures:

Interest paid

$

132,983

$

301,317

$

1,337,486

$

132,983

Interest paid for Discount Notes (f)

$

35,468

$

59,793

$

1,193,573

$

35,468

Affordable Housing Program payments (g)

$

20,772

$

12,635

$

18,707

$

20,772

Transfers of mortgage loans to real estate owned

$

232

$

$

219

$

232

Capital stock subject to mandatory redemption reclassified from equity

$

258,467

$

85

$

4,659

$

258,467

Transfers of HTM securities to AFS that are not other-than-temporarily impaired (h)

$

$

1,376,212

AFS HFA bonds were tendered and re-issued from Libor to SOFR index (i)

$

$

686,340

Notes to Supplemental Disclosure:Disclosure.

(a)In the Statements of Cash Flows, we adjust discount note accretion expense within operating cash flows and an offset to financing activities in the period discount notes mature. The net adjustment to accretion expense was larger in the six months ended June 30, 2022,2023, compared to the same period of 20212022 in parallelconjunction with greater usage of discount notes in the six months ended June 30, 2022.2023. As a result, the impact on operating cash flows was also larger in the six months ended June 30, 2022.2023.
(b)Net cash provided by (used in) operating activities were also impacted by derivatives and hedging activities. In the six months ended June 30, 2023, derivatives and hedging activities provided $12.9 million in cash flows; in the six months ended June 30, 2022, derivatives and hedging activities provided $1.1 billion in cash flows; in the six months ended June 30, 2021, derivatives and hedging activities provided $281.5 million in cash flows.
(c)For information about bonds (transferred to) ordiscount notes assumed from other FHLBanks and other related party transactions, see Note 20. Related Party Transactions.
(d)Does not include payments to holders of mandatorily redeemable capital stock. Such payments are considered as interest expense and reported within operating cash flows.
(e)Cash and due from Banks includes pass-thru reserves at the Federal Reserve Bank of New York. See Note 3. Cash and Due from Banks for further information. Interest-bearing deposits are considered investments and are not included in cash or cash equivalent.
(f)Interest paid for Discount Notes is the portion of the cash payments at settlement of zero-coupon Consolidated obligation discount notes.notes.
(g)AHP payments equals (beginningbeginning accrual -minus ending accrual)accrual plus AHP assessment for the period; payments represent funds released to the Affordable Housing Program.
(h)As a one-time election in accordance with ASC 848 Reference Rate Reform, we reclassified $1.4 billion of LIBOR-indexed held-to-maturity securities to available-for-sale during the second quarter of 2021 without tainting our intent to hold other debt securities to maturity. At the date of transfer, these securities had a total amortized cost of $1.4 billion and a total net unrealized gain of $7.6 million.
(i)During the second quarter of 2021, amortized cost of $686.3 million (market value of $686.7 million) in available-for-sale debt securities were tendered and re-issued from the LIBOR to SOFR index.

The accompanying notes are an integral part of these financial statements.

8

Table of Contents

Federal Home Loan Bank of New York

Notes to Financial Statements — Unaudited

Background

The Federal Home Loan Bank of New York (FHLBNY or the Bank) is a federally chartered corporation and is one of 11 district Federal Home Loan Banks (FHLBanks). The FHLBanks are U.S. government-sponsored enterprises (GSEs), organized under the authority of the Federal Home Loan Bank Act of 1932, as amended (FHLBank Act). Each FHLBank is a cooperative owned by member institutions located within a defined geographic district. The FHLBNY’s defined geographic district is New Jersey, New York, Puerto Rico, and the U.S. Virgin Islands.

Tax Status. The FHLBanks, including the FHLBNY, are exempt from ordinary federal, state, and local taxation except for real property taxes.

Assessments. Affordable Housing Program (AHP) Assessments — Each FHLBank, including the FHLBNY, provides subsidies in the form of direct grants and below-market interest rate advances to members, who use the funds to assist in the purchase, construction or rehabilitation of housing for very low-, low- and moderate-income households. Annually, the 11 FHLBanks must allocate the greater of $100 million or 10% of their regulatory defined net income for the Affordable Housing Program.

Note 1.          CriticalSummary of Significant Accounting Policies and Estimates.Policies.

Basis of Presentation

The accompanying financial statements of the FHLBNY have been prepared in accordance with Generally Accepted Accounting Principles in the United States (GAAP) and with the instructions provided by the Securities and Exchange Commission (SEC).

The FHLBNY has identified certain accounting policies that it believes are critical because they require management to make subjective judgments about matters that are inherently uncertain and because of the likelihood that materially different amounts would be reported under different conditions or by using different assumptions. The most significant of these critical policies include derivatives and hedging relationships, estimating the fair values of assets and liabilities, estimating the allowance for credit losses on the advance,advances, mortgage loan portfolios and our portfolios of investment securities.

Financial Instruments with Legal Right of Offset

The FHLBNY has derivative instruments, and securities purchased under agreements to resell that are subject to enforceable master netting arrangements.agreements. The FHLBNY has elected to offset its derivative asset and liability positions, as well as cash collateral received or pledged, when it has the legal right of offset under these master agreements. The FHLBNY did not have any offsetting liabilities related to its securities purchased under agreements to resell for the periods presented.

The net exposure for these financial instruments can change on a daily basis; therefore, there may be a delay between the time this exposure change is identified and additional collateral is requested, and the time when this collateral is received or pledged. Likewise, there may be a delay for excess collateral to be returned. For derivative instruments, any excess cash collateral received or pledged is recognized as a derivative liability or as a derivative asset based on the terms of the individual master agreement between the FHLBNY and its derivative counterparty. For securities purchased under agreements to resell, the FHLBNY did not have any unsecured amounts based on the fair value of the related collateral held at the end of the periods presented. Additional information about the FHLBNY’s investments in securities purchased under agreements to resell is disclosed in Note 4. Interest-bearing Deposits, Federal Funds Sold and Securities Purchased Under Agreements to Resell.

Fair Value Measurements

The accounting standards on fair value measurements discuss how entities should measure fair value based on whether the inputs to those valuation techniques are observable or unobservable. Fair value is defined as the price that would be received to sell an asset or paid to transfer a liability in an orderly transaction in the principal or most advantageous market for the asset or liability between market participants at the measurement date. This definition is based on an exit price rather than transaction or entry price.

9

Table of Contents

Federal Home Loan Bank of New York

Notes to Financial Statements — Unaudited

The FHLBNY complied with the accounting guidance on fair value measurements and has established a hierarchy for inputs used in measuring fair value that maximizes the use of observable inputs and minimizes the use of unobservable inputs by requiring that the

9

Table of Contents

Federal Home Loan Bank of New York

Notes to Financial Statements — Unaudited

most observable inputs be used when available. Observable inputs are inputs that market participants would use in pricing the asset or liability and would be based on market data obtained from independent sources. Unobservable inputs are inputs that reflect our assumptions about the parameters market participants would use in pricing the asset or liability and would be based on the best information available in the circumstances. Our pricing models are subject to periodic validations, and we periodically review and refine, as appropriate, our assumptions and valuation methodologies to reflect market indications as closely as possible. We have the appropriate personnel, technology, and policies and procedures in place to value financial instruments in a reasonable and consistent manner and in accordance with established accounting policies.

For more information about methodologies used by the FHLBNY to validate vendor pricing, and fair value “Levels” associated with assets and liabilities recorded on the FHLBNY’s Statements of Condition, see financial statements, Note 18. Fair Values of Financial Instruments in this Form 10-Q and in the most recent Form 10-K for the year ended December 31, 20212022 filed on March 22, 2022.17, 2023.

Derivatives and Hedging Activities

The FHLBNY hedges the risk of changes in benchmark interest rates under the provisions of ASC 815. In years prior to 2021, the benchmark rate has been primarily LIBOR; LIBOR rates are derived from an average of submissions by panel banks. The underlying market that LIBOR seeks to reflect has become increasingly less active. The Alternative Reference Rates Committee (ARRC) in the U.S. has settled on the establishment of the Secured Overnight Financing Rate (SOFR) as its recommended alternative to U.S. dollar LIBOR. The United Kingdom’s Financial Conduct Authority (FCA), which oversees LIBOR, has announced that the FCA would no longer persuade or compel member panel banks to make LIBOR quote submissions for U.S. dollar LIBOR setting of 1-month and 3-month, two key LIBOR settings, so that submissions will permanently ceaseceased after June 30, 2023.

The FASB has issued two Accounting Standards Updates to Reference Rate Reform (Topic 848), Facilitation of the Effects of Reference Rate Reform on Financial Reporting, which have outlined permissible expedients offered under Topic 848, including a one-time election to transfer/sell LIBOR-indexed securities in our held-to-maturity portfolio. In the first quarter of 2021, we began to negotiate with derivative counterparties to transform LIBOR-indexed interest rate swaps to SOFR-OIS and have now made the transition to SOFR-OIS for a significant number of bilaterally executed derivatives. We will continue to review opportunities to execute the transition, the timing would be determined by the economic feasibility of transitioning to SOFR. In October 2020, we elected to adopt SOFR as the appropriate index to discount interest rate swaps cleared by the two major central swap clearing organizations as a start to an orderly transition to SOFR.

Generally, we enter into derivatives primarily to manage our exposure to changes in interest rates. Through the use of derivatives, we may adjust the effective maturity, repricing frequency, or option characteristics of financial instruments to achieve our risk management objectives. The accounting guidance related to derivatives and hedging activities is complex and contains prescriptive documentation requirements. At the inception of each hedge transaction, we formally document the hedge relationship, its risk management objective, and strategy for undertaking the hedge.

In compliance with accounting standards, primarily ASC 815, the accounting for derivatives requires us to: (i) assess whether the hedging relationship qualifies for hedge accounting; (ii) assess whether an embedded derivative should be bifurcated; (iii) calculate the effectiveness of the hedging relationship; (iv) evaluate exposure associated with counterparty credit risk; and (v) estimate the fair value of the derivatives. Our assumptions and judgments include subjective estimates based on information available as of the date of the financial statements and could be materially different based on different assumptions, calculations, and estimates.

To qualify as an accounting hedge under the hedge accounting rules (versus an economic hedge where hedge accounting is not sought), a derivative must be highly effective in offsetting the risk designated as being hedged. The hedge relationship must be formally documented at inception, detailing the particular risk management objective and strategy for the hedge, which includes the item and risk that is being hedged and the derivative that is being used, as well as how effectiveness will be assessed and measured. The effectiveness of these hedging relationships is evaluated on a retrospective and prospective basis, typically using quantitative measures of correlation. For hedges that are highly effective, changes in the fair values of the hedging instrument and the offsetting changes in the fair values of the hedged item are recorded in current earnings. If a hedge relationship is found to be not highly effective, it will no longer qualify as an accounting hedge and hedge accounting would be prospectively withdrawn. When hedge accounting is discontinued, the offsetting changes of fair values of the hedged item are also discontinued.no longer recorded.

10

Table of Contents

Federal Home Loan Bank of New York

Notes to Financial Statements — Unaudited

For more information about the FHLBNY’s hedging activities, see financial statements, Note 17. Derivatives and Hedging Activities in this Form 10-Q and in the most recent Form 10-K for the year ended December 31, 20212022 filed on March 22, 2022.

Credit Losses under ASU 2016-13

The FASB issued ASU 2016-13, Financial Instruments Credit Losses (Topic 326), which became effective for the Bank as of January 1, 2020. The adoption of this guidance established a single allowance framework for all financial assets carried at amortized cost, including advances, loans, held-to-maturity securities, other receivables and certain off-balance sheet credit exposures. We have elected to evaluate expected credit losses on interest receivable separately. For available-for-sale securities where fair value is less than cost, credit-related impairment, if any, will be recognized in an allowance for credit losses and adjusted each period for changes in expected credit risk. This framework requires that management’s estimate reflects credit losses over the full remaining expected life and considers expected future changes in macroeconomic conditions.

Summarized information of expected losses are provided in notes to financial statements:

Note 4.Interest-bearing Deposits, Federal Funds Sold and Securities Purchased Under Agreements to Resell.

Note 7.Available-for-Sale Securities.

Note 8.Held-to-Maturity Securities.

Note 9.Advances.

Note 10.Mortgage Loans Held-for-Portfolio.

Note 19.Commitments and Contingencies (for off-balance sheet).17, 2023.

1110

Table of Contents

Federal Home Loan Bank of New York

Notes to Financial Statements — Unaudited

Note 2.           Financial Accounting Standards Board (FASB) Standards Issued.

Recently Adopted Accounting Standards

Standard


Summary of Guidance


Effective Date


Effects on the Financial Statements

Facilitation of the Effects of Reference Rate Reform on Financial Reporting

ASU 2020-04, Reference Rate Reform (Topic 848) Issued in March 2020,, as amended in January 2021 and December 2022

This guidance provides temporary optional guidance to

ease the potential burden in accounting for reference rate reform. The new guidance provides optional expedients and exceptions for applying generally accepted accounting principles to transactions affected by reference rate reform if certain criteria are met. These transactions include:

contract modifications,
hedging relationship, and
sale or transfer of debt securities classified as HTM.

This guidance is effective for the FHLBNY beginning on March 12, 2020, and we may elect to apply the amendments prospectively through December 31, 2022.2024.

The Bank isFHLBNY has elected certain practical expedients provided and as of June 30, 2023, FHLBNY has transitioned all outstanding U.S. dollar London Interbank Offered Rate (LIBOR) settings to convert to referencing Secured Overnight Financing Rate (SOFR), either to start or to fall back, beginning in July 2023 or at the process of converting longer dated LIBOR-indexed swaps to SOFR and working with our counterparties. In the second quarter of 2022, $158 million in available-for-sale debt securities were tendered and re-issued to SOFR linked index securities. We don’t expect this guidance to have a material effect on the Bank’s financial position or results of operations.

Fair Value Hedging - Portfolio Layer Method

ASU 2022-01, Issued March 2022

This guidance expands the current last-of-layer method to apply fair value hedging by allowing multiple hedged layers of a single closed portfolio under the method. To reflect that expansion, the last-of-layer method is renamed the portfolio layer method. Additionally, among other things, this guidance:

expands the scopebeginning of the portfolio layer method to include nonprepayable assets
specifies eligible hedging instruments in a single-layer hedge

This guidance is effective for annual periods, and interim periods within those annual periods, beginning after December 15, 2022. Early adoption is permitted.

We are in the process of evaluating the guidance and its effect on the Bank’s financial condition, results of operations, and cash flows has not yet been determined.

Troubled Debt Restructurings and Vintage Disclosures

ASU 2022-02, Issued March 2022

This guidance eliminates the accounting guidance for troubled debt restructurings by creditors that have adopted the current expected credit losses methodology while enhancing disclosure requirements for certain loan refinancing and restructuring by creditors made to borrowers experiencing financial difficulty. Additionally, this guidance requires disclosure of current period gross write-offs by year of origination for financing receivables and net investment in leases.

This guidance is effective for annual periods, and interim periods within those annual periods, beginning after December 15, 2022. Early adoption is permitted.

We are in the process of evaluating the guidance and its effect on the Bank’s financial condition, results of operations, and cash flows has not yet been determined.next reset period.

Note 3.          Cash and Due from Banks.

Cash on hand, cash items in the process of collection, and amounts due from correspondent banks and the Federal Reserve Banks are recorded as cash and cash equivalent in the Statements of Cash Flows. The FHLBNY is exempt from maintaining any required clearing balance at the Federal Reserve Bank of New York.

Compensating Balances

The FHLBNY has arrangements with Citibank (a member/stockholder of the FHLBNY) to maintain compensating collected cash balances in return for certain fee-based safekeeping and back office operational services that the counterparty provides to the FHLBNY.balances. There are 0no restrictions on the withdrawal of funds in this arrangement. The compensating balances was $15.0 million at June 30, 2023. There were 0no compensating balances at June 30, 2022 and December 31, 2021.2022. There were 0no restricted cash balances at June 30, 20222023 and December 31, 2021.2022.

Pass-through Deposit Reserves

The FHLBNY acts as a pass-through correspondent for member institutions who are required by banking regulations to deposit reserves with the Federal Reserve Banks. There were 0no pass-through reserves deposited with Federal Reserve Banks on behalf of the members by the FHLBNY at June 30, 20222023 and deposits of $30.4 million at December 31, 2021.2022. The liabilities offsetting the pass-through reserves were due to member institsutionsinstitutions and were recorded in Other liabilities in the Statements of Condition.

12

Table of Contents

Federal Home Loan Bank of New York

Notes to Financial Statements — Unaudited

Note 4.          Interest-bearing Deposits, Federal Funds Sold and Securities Purchased Under Agreements to Resell.

The Bank invests in interest-bearing deposits, securities purchased under agreements to resell, and federal funds sold to provide short-term liquidity. These investments are generally transacted with counterparties that have received a credit rating of triple-B or higher (investment grade) by a nationally recognized statistical rating organization.

Interest-bearing deposits — Investments are typically short-term deposits placed with highly-rated large financial institutions and are recorded at amortized cost. Deposits placed were uncollateralized. Deposits placed were $0.7$3.0 billion at June 30, 20222023 and $1.8 billion at December 31, 2021.2022. Deposits are evaluated quarterly for expected credit losses based on the probability of default of the borrowing counterparty and the terms to maturity of the outstanding investments at the measurement dates. Based on analysis performed, 0no allowance for credit losses was recorded at June 30, 20222023 and December 31, 2021.2022. Accrued interest receivables were de minimis,$0.4 million at June 30, 2023 and 0December 31, 2022, and no allowance for credit losses was recorded as interest due was collected.

Federal funds sold — Federal funds sold are unsecured advances to highly-rated large financial institutions. Federal funds sold are unsecured loans that are generally transacted on an overnight term and recorded at amortized cost basis.cost. FHFA regulations include a limit on the amount of unsecured credit an individual Bank may extend to a counterparty. Federal funds sold were $8.7$15.6 billion at June 30, 20222023 and $7.2$9.5 billion at December 31, 20212022 and were repaid according to their contractual terms. Investments are evaluated quarterly for expected credit losses based on the probability of default of the borrowing counterparty and the terms to maturity of the outstanding investments at the measurement dates. Generally, Federal funds are short-term and typically overnight. Counterparties are highly rated. Based on analysis, 0no allowance for credit losses was recorded for Federal funds sold at June 30, 20222023 and December 31, 2021.2022. Accrued interest receivables were de minimis,$2.2 million at June 30, 2023 and 0$2.3 million at December 31, 2022, and no allowance for credit losses was recorded as interest due was collected.

11

Table of Contents

Federal Home Loan Bank of New York

Notes to Financial Statements — Unaudited

Securities purchased under agreements to resell There were 0The outstanding Securities purchased under agreements to resell at June 30, 2022. At December 31, 2021,balances of Securities purchased under agreements to resell were recorded aton an amortized cost basis of $1.2 billion.$16.7 billion at June 30, 2023 and $4.2 billion at December 31, 2022. The investments typically matured overnight, and were executed through a tri-party arrangement that involved transfer of overnight funds to a segregated safekeeping account at the Bank of New York (BONY). BONY, acting as an independent agent on behalf of the FHLBNY and the counterparty to the transactions, assumes the responsibility of receiving eligible securities as collateral and releasing funds to the counterparty. The amount of cash loaned against the collateral is a function of the liquidity and quality of the collateral. The collateral is typically in the form of securities that meet the FHLBNY’s credit quality standards, are highly rated and readily marketable. The FHLBNY has the ability to call for additional collateral if the value of the securities falls below a pre-defined haircut. The FHLBNY can terminate the transaction and liquidate the collateral if the counterparty fails to post the additional margin. Agreements generally allow the FHLBNY to repledge securities under certain conditions. NaNNo adjustments for instrument-specific credit risk were deemed necessary as market values of collateral were in excess of principal amounts loaned. Accrued interest receivables were de minimis$2.3 million at June 30, 2023 and 0$1.0 million at December 31, 2022, and no allowance for credit losses was recorded as interest due was collected.

SecuritiesU.S. Treasury securities at market values of $16.8 billion at June 30, 2023 and $4.3 billion at December 31, 2022 were received at BONY to collateralize the overnight investments. Interest income from securities purchased under agreements to resell averaged $5.5was $123.7 million and $20.4$170.9 million for the three and six months ended June 30, 2022, respectively. For2023 compared to $11 thousand and $21 thousand for the twelve months ended December 31, 2021, transaction balances averaged $0.6 billion.same periods in the prior year. Transactions recorded as Securities purchased under agreements to resell were accounted as collateralized financing transactions.

Investments are evaluated quarterly for expected credit losses based on the probability of default of the borrowing counterparty and the terms to maturity of the outstanding investments at the measurement dates. A credit loss would also be recognized if there is a collateral shortfall which the FHLBNY does not believe the counterparty will replenish in accordance with its contractual terms. The credit loss would be limited to the difference between the fair value of the collateral and the investment’s amortized cost. Repurchase agreements are short-term and generally overnight, and counterparties are highly rated. Based on analysis performed, 0 allowance for credit losses was recorded for these assets at June 30, 2022 and December 31, 2021.

13

Table of Contents

Federal Home Loan Bank of New York

Notes to Financial Statements — Unaudited

Note 5.          Trading Securities.

The carrying value of a trading security equals its fair value. The following table provides major security types at June 30, 20222023 and December 31, 20212022 (in thousands):

Fair value


June 30, 2022


December 31, 2021


June 30, 2023


December 31, 2022

U.S. Treasury notes

$

7,712,829

$

5,821,380

$

5,285,390

$

7,113,419

Total trading securities

$

7,712,829

$

5,821,380

$

5,285,390

$

7,113,419

The carrying values of trading securities included net unrealized fair value losslosses of $266.0$358.6 million at June 30, 20222023 and losslosses of $13.8$373.0 million at December 31, 2021.2022. We have classified investments acquired for purposes of meeting short-term contingency and other liquidity needs as trading securities. In accordance with Finance Agency guidance, we do not participate in speculative trading practices.

Trading Securities Pledged

The FHLBNY had pledged marketable securities at fair values of $534.1$754.2 million at June 30, 20222023 and $367.1$576.8 million at December 31, 20212022 to derivative clearing organizations to fulfill the FHLBNY’s initial margin requirements as mandated under margin rules of the Commodity Futures Trading Commission (CFTC). The clearing organizations have rights to sell or repledge the collateral securities under certain conditions.

The following tables present redemption terms of the major types of trading securities (dollars in thousands):

Redemption Terms

June 30, 2022

Due in one year or

Due after one year

Due after five years


less


through five years


through ten years


Total Fair Value

U.S. Treasury notes

$

3,742,206

$

2,212,390

$

1,758,233

$

7,712,829

Total trading securities

$

3,742,206

$

2,212,390

$

1,758,233

$

7,712,829

Yield on trading securities

1.17

%  

1.09

%  

1.15

%  

December 31, 2021

Due in one year or

Due after one year

Due after five years


less


through five years


through ten years


Total Fair Value

U.S. Treasury notes

$

2,516,659

$

1,491,893

$

1,812,828

$

5,821,380

Total trading securities

$

2,516,659

$

1,491,893

$

1,812,828

$

5,821,380

Yield on trading securities

1.27

%  

1.32

%  

1.32

%  

1412

Table of Contents

Federal Home Loan Bank of New York

Notes to Financial Statements — Unaudited

The following tables present redemption terms of the major types of trading securities (dollars in thousands):

Redemption Terms

June 30, 2023

Due in one year or

Due after one year

Due after five years


less


through five years


through ten years


Total Fair Value

U.S. Treasury notes

$

395,938

$

3,083,640

$

1,805,812

$

5,285,390

Total trading securities

$

395,938

$

3,083,640

$

1,805,812

$

5,285,390

Yield on trading securities

0.13

%  

1.51

%  

1.36

%  

December 31, 2022

Due in one year or

Due after one year

Due after five years


less


through five years


through ten years


Total Fair Value

U.S. Treasury notes

$

2,894,964

$

2,589,829

$

1,628,626

$

7,113,419

Total trading securities

$

2,894,964

$

2,589,829

$

1,628,626

$

7,113,419

Yield on trading securities

0.96

%  

1.39

%  

1.18

%  

Note 6.          Equity Investments.

The FHLBNY has classified its grantor trusttrusts as equity investments. The carrying value of equity investments in the Statements of Condition, and the types of assets in the grantor trusttrusts were as follows (in thousands):

June 30, 2022

June 30, 2023

Gross

Gross

Gross

Gross

Amortized

Unrealized

Unrealized

Fair

Amortized

Unrealized

Unrealized

Fair


Cost


Gains (b)


Losses (b)


Value (c)


Cost


Gains (b)


Losses (b)


Value (c)

Cash equivalents

$

4,322

$

$

$

4,322

$

4,300

$

$

$

4,300

Equity funds


41,041


11,375


(5,329)


47,087


39,958


18,858


(6,210)


52,606

Fixed income funds


32,761


128


(3,751)


29,138


35,645


209


(4,915)


30,939

Total Equity Investments (a)

$

78,124

$

11,503

$

(9,080)

$

80,547

$

79,903

$

19,067

$

(11,125)

$

87,845


December 31, 2021


December 31, 2022


Gross


Gross


Gross


Gross


Amortized


Unrealized


Unrealized


Fair


Amortized


Unrealized


Unrealized


Fair


Cost


Gains (b)


Losses (b)


Value (c)


Cost


Gains (b)


Losses (b)


Value (c)

Cash equivalents

$

3,261

$

$

$

3,261

$

4,308

$

$

$

4,308

Equity funds


41,228


21,342


(2,425)


60,145


43,038


12,772


(6,760)


49,050

Fixed income funds


32,703


415


(400)


32,718


33,353


167


(5,124)


28,396

Total Equity Investments (a)

$

77,192

$

21,757

$

(2,825)

$

96,124

$

80,699

$

12,939

$

(11,884)

$

81,754

(a)The intent of the grantor trust istrusts are to set aside cash to meet current and future payments for a supplemental unfunded pension plans.plan. Neither the pension plans nor employees of the FHLBNY own the trust.
(b)Changes in unrealized gains and losses are recorded through earnings, specifically in Other income in the Statements of Income.
(c)The grantor trust investstrusts invest in money market, equity and fixed income and bond funds. Daily net asset values (NAVs) are readily available and investments are redeemable at short notice. NAVs are the fair values of the funds in the grantor trust.trusts. The grantor trust istrusts are owned by the FHLBNY.

13

Table of Contents

Federal Home Loan Bank of New York

Notes to Financial Statements — Unaudited

In the Statements of Income, gains and losses related to outstanding Equity Investments were as follows (in thousands):

Three months ended June 30,

Six months ended June 30,

Three months ended June 30,

Six months ended June 30,


2022


2021


2022


2021


2023


2022


2023


2022

Unrealized gains (losses) recognized during the reporting period on equity investments still held at the reporting date

$

(10,442)

$

3,327

$

(16,509)

$

5,366

$

2,662

$

(10,442)

$

6,887

$

(16,509)

Net gains (losses) recognized during the period on equity investments sold during the period


(265)


721

(265)

721


(125)


(265)

(499)

(265)

Net dividend and other

319

491

585

752

435

319

835

585

Net gains (losses) recognized during the period

$

(10,388)

$

4,539

$

(16,189)

$

6,839

$

2,972

$

(10,388)

$

7,223

$

(16,189)

Note 7.          Available-for-Sale Securities.

No AFS security was impaired in any periods in this report and no credit loss allowance was necessary at June 30, 2023 and December 31, 2022.

The following tables provide major security types (in thousands):

June 30, 2023


Gross

Gross


Amortized

Unrealized

Unrealized

Fair


Cost


Gains


Losses


Value

GSE and U.S. Obligations

State and local housing finance agency obligations

$

1,106,740

$

1

$

(995)

$

1,105,746

Mortgage-backed securities

Floating

CMO

428,497

521

(6,031)

422,987

Pass Thru

3,765

26

(2)

3,789

Total Floating

432,262

547

(6,033)

426,776

Fixed

CMBS

7,769,525

3,328

(825,466)

6,947,387

Total Fixed

7,769,525

3,328

(825,466)

6,947,387

MBS AFS Before Hedging Adjustments

8,201,787

3,875

(a)  

(831,499)

(a)  

7,374,163

Hedging Basis Adjustments in AOCI (b)

(600,419)

600,419

Total Available-for-sale securities (MBS)

7,601,368

604,294

(831,499)

7,374,163

Total Available-for-sale securities

$

8,708,108

$

604,295

$

(832,494)

$

8,479,909

1514

Table of Contents

Federal Home Loan Bank of New York

Notes to Financial Statements — Unaudited

Note 7.          Available-for-Sale Securities.

NaN AFS security was impaired in any periods in this report and 0 credit loss allowance was necessary at June 30, 2022 and December 31, 2021.

The following tables provide major security types (in thousands):

June 30, 2022


Gross

Gross


Amortized

Unrealized

Unrealized

Fair


Cost


Gains


Losses


Value

GSE and U.S. Obligations

State and local housing finance agency obligations

$

1,112,715

$

$

(301)

$

1,112,414

Mortgage-backed securities

Floating

CMO

507,787

3,320

(99)

511,008

PASS THRU

4,353

73

(1)

4,425

Total Floating

512,140

3,393

(100)

515,433

Fixed

CMBS

5,673,731

7,921

(531,751)

5,149,901

Total Fixed

5,673,731

7,921

(531,751)

5,149,901

MBS AFS Before Hedging Adjustments

6,185,871

11,314

(a)  

(531,851)

(a)  

5,665,334

Hedging Basis Adjustments in AOCI

(386,473)

386,473

(b)  

Total Available-for-sale securities (MBS)

5,799,398

397,787

(531,851)

5,665,334

Total Available-for-sale securities

$

6,912,113

$

397,787

$

(532,152)

$

6,777,748

December 31, 2021


Gross

Gross


December 31, 2022

Amortized

Unrealized

Unrealized

Fair


Gross

Gross


Cost


Gains


Losses


Value

Amortized

Unrealized

Unrealized

Fair


Cost


Gains


Losses


Value

GSE and U.S. Obligations

State and local housing finance agency obligations

$

998,520

$

167

$

(50)

$

998,637

$

1,109,790

$

1

$

(762)

$

1,109,029

Mortgage-backed securities

Floating

CMO

575,441

8,982

584,423

462,796

557

(5,403)

457,950

PASS THRU

4,896

215

5,111

Pass Thru

4,080

24

(2)

4,102

Total Floating

580,337

9,197

589,534

466,876

581

(5,405)

462,052

Fixed

CMBS


4,843,394


171,731


(55,875)


4,959,250


6,320,976


3,875


(807,062)


5,517,789

Total Fixed

4,843,394

171,731

(55,875)

4,959,250

6,320,976

3,875

(807,062)

5,517,789

MBS AFS Before Hedging Adjustments

5,423,731

180,928

(a)  

(55,875)

(a)  

5,548,784

6,787,852

4,456

(a)  

(812,467)

(a)  

5,979,841

Hedging Basis Adjustments in AOCI


(30,667)


30,667

(b)  


Hedging Basis Adjustments in AOCI (b)


(575,104)


575,104


Total Available-for-sale securities (MBS)

5,393,064

211,595

(55,875)

5,548,784

6,212,748

579,560

(812,467)

5,979,841

Total Available-for-sale securities

$

6,391,584

$

211,762

$

(55,925)

$

6,547,421

$

7,322,538

$

579,561

$

(813,229)

$

7,088,870

(a)Amounts represent specialized third party pricing vendors’ estimates of gains/losses of AFS securities; market pricing is based on historical amortized cost adjusted for pay downs and amortization of premiums and discounts; fair value unrealized gains and losses are before adjusting book values for hedge basis adjustments and will equal market values of AFS securities recorded in AOCI. Fair value hedges were executed to mitigate the interest rate risk of the hedged fixed-rate securities due to changes in the designated benchmark rate.

16

Table of Contents

Federal Home Loan Bank of New York

Notes to Financial Statements — Unaudited

(b)Amounts represent fair value hedging basis due to changes in the benchmark rate and were recorded as an adjustment to the carrying values of hedged securities; the adjustments impacted the unrealized market value gains and losses. Securities in a fair value hedging relationship at June 30, 20222023 recorded $386.5600.4 million of hedge basis gains;losses; at December 31, 2021,2022, hedge basis gainslosses of $30.7575.1 million were recorded. In the table above, the benchmark hedging basis adjustments were reported separately from the market basedmarket-based prices of ASC 815 qualifying hedges to provide greater clarity to market basedmarket-based pricing of the securities.

Credit Loss Analysis of AFS Securities

The FHLBNY’s portfolio of MBS classified as AFS is comprised primarily of GSE-issued collateralized mortgage obligations and CMBS. A portfolio of State and local housing finance agency obligations is also classified as AFS. The FHLBNY evaluates its GSE-issued securities by considering the creditworthiness and performance of the debt securities and the strength of the government-sponsored enterprises’ guarantees of the securities.

Based on credit and performance analysis, GSE-issued securities are performing in accordance with their contractual agreements. The FHLBNY believes that it will recover its investments in GSE-issued securities given the current levels of collateral, credit enhancements and guarantees that exist to protect the investments. At June 30, 20222023 and December 31, 2021,2022, unrealized fair value losses have been aggregated in the table below by the length of time a security was in a continuous unrealized loss position based on market basedmarket-based pricing and excluding the effects of hedge basis adjustments.

The Bank evaluates its individual AFS securities for impairment by comparing the security’s fair value to its amortized cost. Impairment may exist when the fair value of the investment is less than its amortized cost (i.e. in an unrealized loss position). We have not experienced any payment defaults on the instruments. As noted previously, substantially all of these securities are GSE-issued and carry an implicit or explicit U.S. government guarantee. Based on the analysis, 0no allowance for credit losses was recorded on these AFS securities at June 30, 2023 and December 31, 2022.

The following table summarizes available-for-sale securities with estimated fair values below their amortized cost basis (in thousands):

June 30, 2022


Less than 12 months


12 months or more


Total


Estimated


Unrealized


Estimated


Unrealized


Estimated


Unrealized

Fair Value

Losses

Fair Value

Losses

Fair Value

Losses

MBS Investment Securities and State and local housing finance agency obligations

MBS-Other US Obligations

Ginnie Mae-CMOs

$

3,800

$

(3)

$

$

$

3,800

$

(3)

MBS-GSE

Fannie Mae-CMO

24,821

(73)

24,821

(73)

Fannie Mae-CMBS

458,393

(13,484)

458,393

(13,484)

Freddie Mac-CMO

20,357

(24)

20,357

(24)

Freddie Mac-CMBS

3,544,107

(401,552)

601,688

(116,715)

4,145,795

(518,267)

Total MBS-GSE

4,047,678

(415,133)

601,688

(116,715)

4,649,366

(531,848)

Total MBS Temporarily Impaired

$

4,051,478

$

(415,136)

$

601,688

$

(116,715)

$

4,653,166

$

(531,851)

State and local housing finance agency obligations

836,040

(301)

16,900

852,940

(301)

Total Temporarily Impaired

$

4,887,518

$

(415,437)

$

618,588

$

(116,715)

$

5,506,106

$

(532,152)

17

Table of Contents

Federal Home Loan Bank of New York

Notes to Financial Statements — Unaudited

December 31, 2021


Less than 12 months


12 months or more


Total


Estimated


Unrealized


Estimated


Unrealized


Estimated


Unrealized

���

Fair Value

Losses

Fair Value

Losses

Fair Value

Losses

MBS Investment Securities and State and local housing finance agency obligations

MBS-GSE

Freddie Mac-CMBS

$

1,476,219

$

(23,442)

$

641,268

$

(32,433)

$

2,117,487

$

(55,875)

Total MBS-GSE

1,476,219

(23,442)

641,268

(32,433)

2,117,487

(55,875)

Total MBS Temporarily Impaired

$

1,476,219

$

(23,442)

$

641,268

$

(32,433)

$

2,117,487

$

(55,875)

State and local housing finance agency obligations

21,130

(50)

21,130

(50)

Total Temporarily Impaired

$

1,476,219

$

(23,442)

$

662,398

$

(32,483)

$

2,138,617

$

(55,925)

Redemption Terms

Expected maturities may differ from contractual maturities because borrowers may have the right to call or prepay obligations with or without call or prepayment fees. The amortized cost and estimated fair value (a) of investments classified as AFS, by contractual maturity, were as follows (in thousands):

June 30, 2022

December 31, 2021

Amortized 

Estimated

Amortized 

Estimated


Cost (b)


Fair Value


Cost (b)


Fair Value

State and local housing finance agency obligations

Due in one year or less

$

1,475

$

1,475

$

$

Due after one year through five years

16,900

16,900

21,180

21,130

Due after ten years

1,094,340

1,094,039

977,340

977,507

State and local housing finance agency obligations

$

1,112,715

$

1,112,414

$

998,520

$

998,637

Mortgage-backed securities

Due in one year or less

$

6

$

6

$

$

Due after one year through five years

1,069,779

1,045,623

875,385

917,150

Due after five year through ten years

3,803,146

3,721,647

3,591,533

3,696,985

Due after ten years


926,467


898,058


926,146


934,649

Mortgage-backed securities

$

5,799,398

$

5,665,334

$

5,393,064

$

5,548,784

Total Available-for-Sale securities

$

6,912,113

$

6,777,748

$

6,391,584

$

6,547,421

(a)The carrying value of AFS securities equals fair value.
(b)Amortized cost is UPB after adjusting for net unamortized premiums of $55.8 million and $79.9 million at June 30, 2022 and December 31, 2021, respectively. Additionally, historical amortized cost in the table above is after adjustment for hedging basis.

18

Table of Contents

Federal Home Loan Bank of New York

Notes to Financial Statements — Unaudited

Interest Rate Payment Terms

The following table summarizes interest rate payment terms of investments in Mortgage-backed securities and State and local housing finance agency obligations classified as AFS securities (in thousands):

June 30, 2022

December 31, 2021


Amortized Cost


Fair Value


Amortized Cost


Fair Value

Mortgage-backed securities

Floating

CMO

$

507,787

$

511,008

$

575,441

$

584,423

PASS THRU

4,353

4,425

4,896

5,111

Total Floating

512,140

515,433

580,337

589,534

Fixed

CMBS

5,287,258

5,149,901

4,812,727

4,959,250

Total Fixed

5,287,258

5,149,901

4,812,727

4,959,250

Total Mortgage-backed securities

5,799,398

5,665,334

5,393,064

5,548,784

State and local housing finance agency obligations

Floating

1,112,715

1,112,414

998,520

998,637

Total Available-for-Sale securities

$

6,912,113

$

6,777,748

$

6,391,584

$

6,547,421

Note 8.          Held-to-Maturity Securities.

Major Security Types (in thousands)

June 30, 2022


Allowance

OTTI

Gross

Gross


Amortized

for Credit

Recognized

Carrying

Unrecognized

Unrecognized

Fair

Issued, guaranteed or insured:


Cost(d)


Loss (ACL)


in AOCI


Value


Holding Gains (a)


Holding Losses (a)


Value

Pools of Mortgages

Fannie Mae

$

29,000

$

$

$

29,000

$

1,420

$

$

30,420

Freddie Mac


5,002


5,002


327


5,329

Total pools of mortgages


34,002


34,002


1,747


35,749

Collateralized Mortgage Obligations/Real Estate Mortgage Investment Conduits

Fannie Mae


241,757


241,757


(2,359)


239,398

Freddie Mac


272,934


272,934


362


(1,281)


272,015

Ginnie Mae


Total CMOs/REMICs


514,691


514,691


362


(3,640)

���


511,413

Commercial Mortgage-Backed Securities (b)

Fannie Mae


1,204,832


1,204,832


48


(10,124)


1,194,756

Freddie Mac


7,114,353


7,114,353


4,918


(144,555)


6,974,716

Total commercial mortgage-backed securities


8,319,185


8,319,185


4,966


(154,679)


8,169,472

Non-GSE MBS (c)

CMOs/REMICs


2,789


(212)


(246)

2,331


(205)


2,126

Asset-Backed Securities (c)

Manufactured housing (insured)


16,006


16,006


383


16,389

Home equity loans (insured)


29,498


(341)

29,157


4,376


(261)


33,272

Home equity loans (uninsured)


8,626


(608)

8,018


805


(95)


8,728

Total asset-backed securities


54,130


(949)

53,181


5,564


(356)


58,389

Total MBS


8,924,797


(212)


(1,195)

8,923,390


12,639


(158,880)


8,777,149

Other

State and local housing finance agency obligations


181,220


(111)


181,109


3


(14,040)


167,072

Total Held-to-maturity securities

$

9,106,017

$

(323)

$

(1,195)

$

9,104,499

$

12,642

$

(172,920)

$

8,944,221

1915

Table of Contents

Federal Home Loan Bank of New York

Notes to Financial Statements — Unaudited

December 31, 2021


Allowance

OTTI


Gross

Gross


Amortized

for Credit

Recognized

Carrying

Unrecognized

Unrecognized

Fair

Issued, guaranteed or insured:


Cost(d)


Loss (ACL)


in AOCI


Value


Holding Gains (a)


Holding Losses (a)


Value

Pools of Mortgages

Fannie Mae

$

33,128

$

$

$

33,128

$

4,086

$

$

37,214

Freddie Mac


5,478


5,478


712


6,190

Total pools of mortgages


38,606


38,606


4,798


43,404

Collateralized Mortgage Obligations/Real Estate Mortgage Investment Conduits

Fannie Mae


300,442


300,442


2,338


(144)


302,636

Freddie Mac


322,186


322,186


3,066


(22)


325,230

Ginnie Mae


Total CMOs/REMICs


622,628


622,628


5,404


(166)


627,866

Commercial Mortgage-Backed Securities (b)

Fannie Mae


1,301,041


1,301,041


22,166


(159)


1,323,048

Freddie Mac


7,117,953


7,117,953


339,409


(6,461)


7,450,901

Total commercial mortgage-backed securities


8,418,994


8,418,994


361,575


(6,620)


8,773,949

Non-GSE MBS(c)

CMOs/REMICs


2,978


(226)


(261)


2,491


35


(51)


2,475

Asset-Backed Securities(c)

Manufactured housing (insured)


18,484


18,484


498


18,982

Home equity loans (insured)


32,519


(374)


32,145


6,187


38,332

Home equity loans (uninsured)


11,382


(951)


10,431


1,286


(84)


11,633

Total asset-backed securities


62,385


(1,325)


61,060


7,971


(84)


68,947

Total MBS


9,145,591


(226)


(1,586)


9,143,779


379,783


(6,921)


9,516,641

Other

State and local housing finance agency obligations


185,000


(114)


184,886


16


(17,269)


167,633

Total Held-to-maturity securities

$

9,330,591

$

(340)

$

(1,586)

$

9,328,665

$

379,799

$

(24,190)

$

9,684,274

The following table summarizes available-for-sale securities with estimated fair values below their amortized cost basis (in thousands):

June 30, 2023


Less than 12 months


12 months or more


Total


Estimated


Unrealized


Estimated


Unrealized


Estimated


Unrealized

Fair Value

Losses

Fair Value

Losses

Fair Value

Losses

MBS Investment Securities and State and local housing finance agency obligations

MBS-Other US Obligations

Ginnie Mae-CMO

$

4,272

$

(56)

$

$

$

4,272

$

(56)

MBS-GSE

Fannie Mae-CMO

238,533

(4,694)

20,666

(421)

259,199

(5,115)

Fannie Mae-CMBS

406,796

(26,807)

406,796

(26,807)

Freddie Mac-CMO

61,797

(618)

9,552

(242)

71,349

(860)

Freddie Mac-CMBS

2,775,576

(106,487)

3,631,375

(692,172)

6,406,951

(798,659)

Fannie Mae-Pass Thru

254

(2)

254

(2)

Total MBS-GSE

3,076,160

(111,801)

4,068,389

(719,642)

7,144,549

(831,443)

Total MBS Temporarily Impaired

$

3,080,432

$

(111,857)

$

4,068,389

$

(719,642)

$

7,148,821

$

(831,499)

State and local housing finance agency obligations

943,390

(950)

12,355

(45)

955,745

(995)

Total Temporarily Impaired

$

4,023,822

$

(112,807)

$

4,080,744

$

(719,687)

$

8,104,566

$

(832,494)

December 31, 2022


Less than 12 months


12 months or more


Total


Estimated


Unrealized


Estimated


Unrealized


Estimated


Unrealized

Fair Value

Losses

Fair Value

Losses

Fair Value

Losses

MBS Investment Securities and State and local housing finance agency obligations

MBS-Other US Obligations

Ginnie Mae-CMO

$

4,521

$

(51)

$

$

$

4,521

$

(51)

MBS-GSE

Fannie Mae-CMO

283,287

(4,620)

283,287

(4,620)

Fannie Mae-CMBS

424,871

(26,948)

424,871

(26,948)

Freddie Mac-CMO


76,951

(732)

76,951

(732)

Freddie Mac-CMBS

2,657,360

(202,093)

2,302,235

(578,021)

4,959,595

(780,114)

Fannie Mae-Pass Thru

368

(2)

368

(2)

Total MBS-GSE

3,442,837

(234,395)

2,302,235

(578,021)

5,745,072

(812,416)

Total MBS Temporarily Impaired

$

3,447,358

$

(234,446)

$

2,302,235

$

(578,021)

$

5,749,593

$

(812,467)

State and local housing finance agency obligations

944,406

(684)

14,622

(78)

959,028

(762)

Total Temporarily Impaired

$

4,391,764

$

(235,130)

$

2,316,857

$

(578,099)

$

6,708,621

$

(813,229)

16

Table of Contents

Federal Home Loan Bank of New York

Notes to Financial Statements — Unaudited

Redemption Terms

Expected maturities may differ from contractual maturities because borrowers may have the right to call or prepay obligations with or without call or prepayment fees. The amortized cost and estimated fair value (a) of investments classified as AFS, by contractual maturity, were as follows (in thousands):

June 30, 2023

December 31, 2022

Amortized 

Estimated

Amortized 

Estimated


Cost (b)


Fair Value


Cost (b)


Fair Value

State and local housing finance agency obligations

Due in one year or less

$

$

$

750

$

750

Due after one year through five years

12,400

12,355

14,700

14,622

Due after ten years

1,094,340

1,093,391

1,094,340

1,093,657

State and local housing finance agency obligations

$

1,106,740

$

1,105,746

$

1,109,790

$

1,109,029

Mortgage-backed securities

Due in one year or less

$

13

$

13

$

34

$

34

Due after one year through five years

1,026,818

970,958

1,046,588

991,319

Due after five year through ten years

5,609,709

5,482,892

4,169,456

4,035,246

Due after ten years


964,828


920,300


996,670


953,242

Mortgage-backed securities

$

7,601,368

$

7,374,163

$

6,212,748

$

5,979,841

Total Available-for-Sale securities

$

8,708,108

$

8,479,909

$

7,322,538

$

7,088,870

(a)The carrying value of AFS securities equals fair value.
(b)Amortized cost is UPB after adjusting for net unamortized discounts of $12.6 million at June 30, 2023 and net unamortized premiums of $4.6 million at December 31, 2022. Additionally, historical amortized cost in the table above is after adjustment for hedging basis.

Interest Rate Payment Terms

The following table summarizes interest rate payment terms of investments in Mortgage-backed securities and State and local housing finance agency obligations classified as AFS securities (in thousands):

June 30, 2023

December 31, 2022


Amortized Cost


Fair Value


Amortized Cost


Fair Value

Mortgage-backed securities

Floating

CMO

$

428,497

$

422,987

$

462,796

$

457,950

Pass Thru

3,765

3,789

4,080

4,102

Total Floating

432,262

426,776

466,876

462,052

Fixed

CMBS

7,169,106

6,947,387

5,745,872

5,517,789

Total Fixed

7,169,106

6,947,387

5,745,872

5,517,789

Total Mortgage-backed securities

7,601,368

7,374,163

6,212,748

5,979,841

State and local housing finance agency obligations

Floating

1,106,740

1,105,746

1,109,790

1,109,029

Total Available-for-Sale securities

$

8,708,108

$

8,479,909

$

7,322,538

$

7,088,870

17

Table of Contents

Federal Home Loan Bank of New York

Notes to Financial Statements — Unaudited

Note 8.          Held-to-Maturity Securities.

Major Security Types (in thousands)

June 30, 2023


Allowance

OTTI

Gross

Gross


Amortized

for Credit

Recognized

Carrying

Unrecognized

Unrecognized

Fair

Issued, guaranteed or insured:


Cost (d)


Loss (ACL)


in AOCI


Value


Holding Gains (a)


Holding Losses (a)


Value

Pools of Mortgages

Fannie Mae

$

24,303

$

$

$

24,303

$

138

$

(23)

$

24,418

Freddie Mac


4,221


4,221


41


(7)


4,255

Total pools of mortgages


28,524


28,524


179


(30)


28,673

Collateralized Mortgage Obligations/Real Estate Mortgage Investment Conduits

Fannie Mae


407,522


407,522


(9,355)


398,167

Freddie Mac


491,284


491,284


(8,728)


482,556

Ginnie Mae


Total CMOs/REMICs


898,806


898,806


(18,083)


880,723

Commercial Mortgage-Backed Securities (b)

Fannie Mae


1,005,979


1,005,979


146


(20,330)


985,795

Freddie Mac


8,552,581


8,552,581


2,477


(413,720)


8,141,338

Total commercial mortgage-backed securities


9,558,560


9,558,560


2,623


(434,050)


9,127,133

Non-GSE MBS (c)

CMOs/REMICs


2,493


(504)


(216)

1,773


(83)


1,690

Asset-Backed Securities (c)

Manufactured housing (insured)


11,750


11,750


29


11,779

Home equity loans (insured)


24,256


(288)

23,968


3,391


(803)


26,556

Home equity loans (uninsured)


5,234


(362)

4,872


454


(110)


5,216

Total asset-backed securities


41,240


(650)

40,590


3,874


(913)


43,551

Total MBS


10,529,623

��

(504)


(866)

10,528,253


6,676


(453,159)


10,081,770

Other

State and local housing finance agency obligations


169,455


(102)


169,353


(12,634)


156,719

Total Held-to-maturity securities

$

10,699,078

$

(606)

$

(866)

$

10,697,606

$

6,676

$

(465,793)

$

10,238,489

December 31, 2022


Allowance

OTTI


Gross

Gross


Amortized

for Credit

Recognized

Carrying

Unrecognized

Unrecognized

Fair

Issued, guaranteed or insured:


Cost (d)


Loss (ACL)


in AOCI


Value


Holding Gains (a)


Holding Losses (a)


Value

Pools of Mortgages

Fannie Mae

$

26,251

$

$

$

26,251

$

371

$

(6)

$

26,616

Freddie Mac


4,570


4,570


76


4,646

Total pools of mortgages


30,821


30,821


447


(6)


31,262

Collateralized Mortgage Obligations/Real Estate Mortgage Investment Conduits

Fannie Mae


210,453


210,453


(7,072)


203,381

Freddie Mac


248,687


248,687


(6,162)


242,525

Ginnie Mae


Total CMOs/REMICs


459,140


459,140


(13,234)


445,906

Commercial Mortgage-Backed Securities (b)

Fannie Mae


1,108,553


1,108,553


(21,410)


1,087,143

Freddie Mac


7,530,247


7,530,247


3,629


(394,246)


7,139,630

Total commercial mortgage-backed securities


8,638,800


8,638,800


3,629


(415,656)


8,226,773

Non-GSE MBS (c)

CMOs/REMICs


2,626


(199)


(231)


2,196


(359)


1,837

Asset-Backed Securities (c)

Manufactured housing (insured)


13,738


13,738


291


14,029

Home equity loans (insured)


26,832


(311)


26,521


3,821


(444)


29,898

Home equity loans (uninsured)


6,171


(456)


5,715


596


(59)


6,252

Total asset-backed securities


46,741


(767)


45,974


4,708


(503)


50,179

Total MBS


9,178,128


(199)


(998)


9,176,931


8,784


(429,758)


8,755,957

Other

State and local housing finance agency obligations


177,225


(108)


177,117


(13,869)


163,248

Total Held-to-maturity securities

$

9,355,353

$

(307)

$

(998)

$

9,354,048

$

8,784

$

(443,627)

$

8,919,205

(a)Unrecognized gross holding gains and losses represent the difference between fair value and carrying value.

18

Table of Contents

Federal Home Loan Bank of New York

Notes to Financial Statements — Unaudited

(b)Commercial mortgage-backed securities (CMBS) are Agency issued securities, collateralized by income-producing “multi-family properties”. Eligible property types include standard conventional multifamilymulti-family apartments, affordable multi-family housing, seniors housing, student housing, military housing, and rural rent housing.
(c)The amounts represent non-agency private-label mortgage- and asset-backed securities.
(d)Amortized cost — For securities that were deemed impaired, amortized cost represents unamortized cost less credit losses, net of credit recoveries (reversals) due to improvements in cash flows.

Securities Pledged

The FHLBNY had pledged MBS, with an amortized cost basis of $2.4 million at June 30, 20222023 and $2.5$3.0 million at December 31, 2021,2022, to the FDIC in connection with deposits maintained by the FDIC at the FHLBNY. The FDIC does not have rights to sell or repledge the collateral unless the FHLBNY defaults under the terms of its deposit arrangements with the FDIC.

Credit Loss Allowances on Held-to-Maturity Securities

GSE-issued securities — The FHLBNY evaluates its individual securities issued by Fannie Mae, Freddie Mac and U.S. government agency, (collectively GSE-issued securities), by considering the creditworthiness and performance of the debt securities and the strength of the GSEs’ guarantees of the securities. Based on analysis, GSE-issued securities are performing in accordance with their contractual agreements, and we will recover our investments in GSE-issued securities given the current levels of collateral, credit enhancements and guarantees that exist to protect the investments. The number of investment positions that were in an unrealized loss position was 147212 and 24192 at June 30, 20222023 and December 31, 2021,2022, respectively.

20

Table of Contents

Federal Home Loan Bank of New York

Notes to Financial Statements — Unaudited

Housing finance agency bonds — The FHLBNY’s investments in Held-to-Maturity (HTM) Housing finance agency bonds reported gross unrecognized losses of $14.0$12.6 million at June 30, 20222023 and $17.3$13.9 million at December 31, 2021.2022. Investments are evaluated quarterly for expected credit losses based on the probability of default of the borrowing counterparty and the terms to maturity of the outstanding investments at the measurement dates. A credit loss would also be recognized if there is a collateral shortfall if the FHLBNY believes the counterparty will not replenish in accordance with its contractual terms. The credit loss would be limited to the difference between the fair value of the collateral and the investment’s amortized cost. Our analysis identified no collateral shortfall. The number of investment positions that were in an unrealized loss position were 5was three in HTM portfolio and 4 in AFS portfolio at June 30, 2022, compared2023, compare to 5 in HTM portfolio and 2 in AFS portfoliofive at December 31, 2021.2022. Probability default analysis at June 30, 20222023 recorded allowance of credit losses of $0.1 million, unchanged fromslightly lower than the balance at December 31, 2021. NaN2022. No allowance for credit losses was recorded for accrued interest receivable as interest due is expected to be collected.

Our investments are performing to their contractual terms, and management has concluded that the gross unrealized losses on its housing finance agency bonds are temporary because the underlying collateral and credit enhancements are sufficient to protect the FHLBNY from losses based on current expectations. The credit enhancements may include additional support from monoline insurance companies, reserve and investment funds allocated to the securities that may be used to make principal and interest payments in the event that the underlying loans pledged for these securities are not sufficient to make the necessary payments and the general obligation of the State issuing the bond.

Private-label mortgage-backed securities — Management evaluates its investments in private-label MBS (PLMBS) for credit losses on a quarterly basis by performing cash flow tests on its entire portfolio of PLMBS. Allowance for credit loss of $0.2$0.5 million were recorded at June 30, 2022, slightly lower than2023 and $0.2 million were recorded at December 31, 2021.2022. Certain securities are insured by monoline insurers, and our credit specialists have analyzed associated guarantees with appropriate haircuts. The Bank’s conclusions are also based upon multiple factors, but not limited to the expected performance of the underlying collateral, and the evaluation of the fundamentals of the issuers’ financial condition. Management has not made a decision to sell such securities at June 30, 2022,2023 and has concluded that it will not be required to sell such securities before recovery of the amortized cost basis of the securities. The number of investment positions that were in an unrealized loss position was 12 at June 30, 20222023 and 811 at December 31, 2021.2022.

19

Table of Contents

Federal Home Loan Bank of New York

Notes to Financial Statements — Unaudited

Redemption Terms

Expected maturities may differ from contractual maturities because borrowers may have the right to call or prepay obligations with or without call or prepayment features. The amortized cost and estimated fair value of held-to-maturity securities, arranged by contractual maturity, were as follows (in thousands):

June 30, 2022

December 31, 2021

June 30, 2023

December 31, 2022

Amortized

Estimated

Amortized

Estimated

Amortized

Estimated

Amortized

Estimated


Cost (a)


Fair Value


Cost (a)


Fair Value


Cost (a)


Fair Value


Cost (a)


Fair Value

State and local housing finance agency obligations

Due in one year or less

$

585

$

586

$

1,085

$

1,100

Due after one year through five years

1,355

1,353

1,560

1,550

$

$

$

1,145

$

1,137

Due after five years through ten years


3,670


3,538


100


100


100


100


3,545


3,415

Due after ten years


175,610


161,595


182,255


164,883


169,355


156,619


172,535


158,696

State and local housing finance agency obligations

$

181,220

$

167,072

$

185,000

$

167,633

$

169,455

$

156,719

$

177,225

$

163,248

Mortgage-backed securities

Due in one year or less

$

754,808

$

753,508

$

622,150

$

627,027

$

142,984

$

141,797

$

375,677

$

372,953

Due after one year through five years


3,430,331


3,384,444


3,244,996


3,338,703


5,327,689


5,111,837


4,564,091


4,397,702

Due after five years through ten years


4,051,286


3,960,380


4,411,317


4,670,692


3,959,280


3,762,021


3,484,910


3,258,306

Due after ten years


688,372


678,817


867,128


880,219


1,099,670


1,066,115


753,450


726,996

Mortgage-backed securities

$

8,924,797

$

8,777,149

$

9,145,591

$

9,516,641

$

10,529,623

$

10,081,770

$

9,178,128

$

8,755,957

Total Held-to-Maturity Securities

$

9,106,017

$

8,944,221

$

9,330,591

$

9,684,274

$

10,699,078

$

10,238,489

$

9,355,353

$

8,919,205

(a)Amortized cost is UPB after adjusting for net unamortized premiumsdiscounts of $$26.930.0 million at June 30, 20222023 and $45.732.3 million at December 31, 2021 (net of unamortized discounts)2022 and before adjustments for allowance for credit losses.losses.

21

Table of Contents

Federal Home Loan Bank of New York

Notes to Financial Statements — Unaudited

Note 9.          Advances.

The FHLBNY offers to its members a wide range of fixed- and adjustable-rate advance loan products with different maturities, interest rates, payment characteristics, and optionality.

Redemption Terms

Contractual redemption terms and yields of advances were as follows (dollars in thousands):

June 30, 2022

December 31, 2021

June 30, 2023

December 31, 2022

Weighted (a)


Weighted (a)


Weighted (a)


Weighted (a)


Average

Percentage

Average

Percentage

Average

Percentage

Average

Percentage


Amount


Yield


of Total


Amount


Yield


of Total


Amount


Yield


of Total


Amount


Yield


of Total

Overdrawn demand deposit accounts

$

5

%  

%  

$

%  

%

$

%  

%  

$

4

5.36

%  

%

Due in one year or less

49,654,321

1.22

61.22

39,102,862


0.64

54.91

71,279,892

3.17

64.69

82,971,070


3.00

70.96

Due after one year through two years


8,560,539

1.60

10.55


8,417,861


1.52

11.82


14,648,472

2.25

13.29


13,739,663


1.82

11.75

Due after two years through three years


7,644,602

1.46

9.42


5,986,412


1.35

8.41


5,954,031

2.46

5.40


4,480,758


1.79

3.83

Due after three years through four years


1,861,976

1.85

2.30


3,847,497


1.49

5.40


5,134,140

2.72

4.66


2,552,886


1.55

2.18

Due after four years through five years


3,491,880

1.97

4.31


2,366,939


1.41

3.32


5,410,661

3.85

4.91


5,588,876


3.27

4.78

Thereafter


9,892,530

2.02

12.20


11,493,595


1.82

16.14


7,763,647

3.41

7.05


7,596,597


3.15

6.50

Total par value


81,105,853


1.43

%  

100.00

%  


71,215,166


1.07

%  

100.00

%


110,190,843


3.04

%  

100.00

%  


116,929,854


2.80

%  

100.00

%

Advance discounts

(127)

(160)

(1,503)

(2,083)

Hedge valuation basis adjustments (b)


(1,043,584)


321,396


(1,616,124)


(1,634,895)

Total

$

80,062,142

$

71,536,402

$

108,573,216

$

115,292,876

(a)The weighted average yield is the weighted average coupon rates for advances, unadjusted for swaps. For floating-rate advances, the weighted average rate is the rate outstanding at the reporting dates.
(b)Hedge valuation basis adjustments under ASC 815 hedges represent changes in the fair values of fixed-rate advances due to changes in designated benchmark interest rates, the remaining terms to maturity or to next call and the notional amounts of advances in a hedging relationship. The FHLBNY’s primary benchmark rates are LIBOR, Federal Funds-OIS index and SOFR-OIS index.

20

Table of Contents

Federal Home Loan Bank of New York

Notes to Financial Statements — Unaudited

Monitoring and Evaluating Credit Losses on Advances

The Bank manages its credit exposure to advances through an integrated approach that includes establishing a credit limit for each borrower. This approach includes an ongoing review of each borrower’s financial condition, in conjunction with the Bank’s collateral and lending policies to limit risk of loss, while balancing borrowers’ needs for a reliable source of funding.

In addition, the Bank lends to eligible borrowers in accordance with federal law and FHFA regulations. Specifically, the Bank is required to obtain sufficient collateral to fully secure credit products up to the counterparty’s total credit limit. Collateral eligible to secure new or renewed advances includes:

one-to-four family and multifamily mortgage loans (delinquent for no more than 90 days) and securities representing such mortgages;
securities issued, insured, or guaranteed by the U.S. government or any U.S. government agency (for example, mortgage-backed securities issued or guaranteed by Fannie Mae, Freddie Mac, or Ginnie Mae)Mae, and FHLBanks Consolidated Obligations);
cash or deposits in the Bank;
certain other collateral that is real estate-related, provided that the collateral has a readily ascertainable value, can be liquidated in due course, and that the Bank can perfect a security interest in it; and
qualifying securities.

22

Table of Contents

Federal Home Loan Bank of New York

Notes to Financial Statements — Unaudited

Residential mortgage loans are the principal form of collateral for advances. The estimated value of the collateral required to secure each member’s credit products is calculated by applying collateral discounts, or haircuts, to the market value or unpaid principal balance of the collateral, as applicable. In addition, community financial institutions are eligible to use expanded statutory collateral provisions for small business, agriculture loans, and community development loans. The Bank’s capital stock owned by each borrower is also pledged as collateral. Collateral arrangements may vary depending upon borrower credit quality, financial condition, and performance; borrowing capacity; and overall credit exposure to the borrower. The Bank can also require additional or substitute collateral to protect its security interest. The Bank also has policies and procedures for validating the reasonableness of our collateral valuations.

Summarized below are the FHLBNY’s credit loss allowance methodologies:

Adoption of the guidance under ASU 2016-13, resulted in formalizing the governance stipulated under the new guidance. Our pre-existing processes - collateral monitoring, valuation of collateral and haircuts in addition to borrower credit analysis - are extensive and remain key to our operations. We devote considerable resources towards these procedures and processes.

The FHLBNY closely monitors the creditworthiness of the institutions to which it lends. The FHLBNY also closely monitors the quality and value of the assets that are pledged as collateral by its members. The FHLBNY’s members are required to pledge collateral to secure advances. Eligible collateral includes: (1) one-to-four-family and multi-family mortgages; (2) U.S. Treasury and government-agency securities; (3) mortgage-backed securities; and (4) certain other collateral which is real estate relatedestate-related and has a readily ascertainable value, can be liquidated in due course, and in which the FHLBNY can perfect a security interest. The FHLBNY has the right to take such steps, as it deems necessary to protect its secured position on outstanding advances, including requiring additional collateral (whether or not such additional collateral would otherwise be eligible to secure a loan; and the provision would benefit the FHLBNY in a scenario when a member defaults). The FHLBNY also has a statutory lien under the FHLBank Act on members’ capital stock, which serves as further collateral for members’ indebtedness to the FHLBNY.

Allowance for Credit Risk. The FHLBNY has policies and procedures in place to manage credit risk. The FHLBNY has a continuous process of evaluating collateral supporting advances and to make changes to its collateral guidelines, as necessary, based on current market conditions. NaNNone of the FHLBNY’s advances were past due, on non-accrual status, or considered impaired as of June 30, 2022.2023. In addition, there were 0no troubled debt restructurings related to advances at the FHLBNY at any time in this report.

As of June 30, 2022,2023, the FHLBNY had collateral on a borrower-by-borrower basis with a value equal to, or greater than, its outstanding advances. Based on the collateral held as security, the FHLBNY’s management’s credit extension and collateral policies, and repayment history on advances, the FHLBNY did not expect any losses on its advances at any timepoint in the periods in 20222023 and through the filing date on this report; therefore, 0no allowance for credit losses on advances was recorded. For the same reasons, the FHLBNY did not record any allowance for credit losses on interest receivable on advances as of June 30, 2022.2023.

Concentration of Advances Outstanding. Advances to the FHLBNY’s top 10ten borrowing member institutions are reported in Note 21.21, Segment Information and Concentration. The FHLBNY held sufficient collateral to cover the advances to all institutions and it does not expect to incur any credit losses.

2321

Table of Contents

Federal Home Loan Bank of New York

Notes to Financial Statements — Unaudited

Advances borrowed by insurance companies accounted for 44.5%34.6% and 41.4%32.9% of total advances at June 30, 20222023 and December 31, 2021,2022, respectively. Lending to insurance companies poses a number of unique risks not present in lending to federally insured depository institutions. For example, there is no single federal regulator for insurance companies. They are supervised by state regulators and subject to state insurance codes and regulations. There is uncertainty about whether a state insurance commissioner would try to void the FHLBNY’s claims on collateral in the event of an insurance company failure. As with all members, insurance companies are also required to purchase the FHLBNY’s capital stock as a prerequisite to membership and borrowing activity. The FHLBNY’s management takes a number of steps to mitigate the unique risk of lending to insurance companies. At the time of membership, the FHLBNY requires an insurance company to be highly rated and to meet the FHLBNY’s credit quality standards. The FHLBNY performs quarterly credit analysis of the insurance borrower. Insurance companies are required to successfully complete an onsite review prior to pledging collateral. Additionally, in order to ensure its position as a first priority secured creditor, FHLBNY typically requires insurance companies to place physical possession of all pledged eligible collateral with FHLBNY or deposit it with a third party custodian or control agent. Such collateral must meet the FHLBNY’s credit quality standards, with appropriate minimum margins applied.

Security Terms. The FHLBNY lends to financial institutions involved in housing finance within its district. Borrowing members are required to purchase capital stock of the FHLBNY and pledge collateral for advances. During all periods in this report and as of June 30, 2022,2023, the FHLBNY had rights to collateral with an estimated value greater than outstanding advances. Based upon the financial condition of the member, the FHLBNY:

(1)Allows a member to retain possession of the mortgage collateral pledged to the FHLBNY if the member executes a written security agreement, provides periodic listings and agrees to hold such collateral for the benefit of the FHLBNY; however, securities and cash collateral are always in physical possession; or

(2)Requires the member specifically to assign or place physical possession of such mortgage collateral with the FHLBNY or its custodial agent.

Beyond these provisions, Section 10(e) of the FHLBank Act affords any security interest granted by a member to the FHLBNY’s priority over the claims or rights of any other party. The 2two exceptions are claims that would be entitled to priority under otherwise applicable law or perfected security interests. All member obligations with the FHLBNY were fully collateralized throughout their entire term. The total of collateral pledged to the FHLBNY includes excess collateral pledged above the minimum collateral requirements. However, a “Maximum Lendable Value” is established to ensure that the FHLBNY has sufficient eligible collateral securing credit extensions.

Note 10.         Mortgage Loans Held-for-Portfolio.

Mortgage Partnership Finance program loans (MPF) are the mortgage loans held-for-portfolio. The FHLBNY participates in the MPF program by purchasing and originating conventional mortgage loans from its participating members, hereafter referred to as Participating Financial Institutions (PFI). The FHLBNY manages the liquidity, interest rate and prepayment option risk of the MPF loans, while the PFIs retain servicing activities, and may credit-enhance the portion of the loans participated to the FHLBNY. No intermediary trust is involved.

In March 2021, the FHLBNY ceased to acquire loans under the MPF program. Future mortgage loan purchases will be made only through our new mortgage asset loan program the Mortgage Asset Program (MAP).MAP. Legacy loans under the MPF programs will continue to be supported and serviced under the MPF loan agreements. At June 30, 2022,2023, mortgage loans under the MAP program were at carrying value of $187.6$333.1 million compared to $161.6$226.0 million at December 31, 2021.2022.

The FHLBNY classifies mortgage loans as held for investment, and accordingly reports them at their principal amount outstanding net of unamortized premiums, discounts, and unrealized gains and losses from loans initially classified as mortgage loan commitments.

2422

Table of Contents

Federal Home Loan Bank of New York

Notes to Financial Statements — Unaudited

The following table presents information on mortgage loans held-for-portfolio (dollars in thousands):

June 30, 2022

December 31, 2021

June 30, 2023

December 31, 2022


Carrying Amount


Percentage of Total


Carrying Amount


Percentage of Total


Carrying Amount


Percentage of Total


Carrying Amount


Percentage of Total

Real Estate (a):

Fixed medium-term single-family mortgages

$

122,236


6.24

%  

$

138,831


6.52

%

$

99,011


5.56

%  

$

109,429


5.90

%

Fixed long-term single-family mortgages

1,837,950


93.76


1,988,968


93.48

1,683,333


94.44


1,745,699


94.10

Total unpaid principal balance

$

1,960,186


100.00

%  

$

2,127,799


100.00

%

$

1,782,344


100.00

%  

$

1,855,128


100.00

%

Unamortized premiums

28,436


31,351

24,962


26,448

Unamortized discounts

(765)


(857)

(649)


(693)

Basis adjustment (b)

1,831


1,966

1,593


1,703

Total MPF loans amortized cost

$

1,989,688

$

2,160,259

$

1,808,250

$

1,882,586

MPF allowance for credit losses

(1,805)

(1,956)

(2,578)

(1,665)

MPF loans held-for-portfolio

$

1,987,883

$

2,158,303

$

1,805,672

$

1,880,921

MAP loans held-for-portfolio

187,582

161,561

333,083

226,048

Total mortgage loans held-for-portfolio at carrying value

$

2,175,465

$

2,319,864

$

2,138,755

$

2,106,969

(a)Conventional mortgage loans represent the majority of mortgage loans held-for-portfolio, with the remainder invested in FHA and VA insured loans (also referred to as government loans).
(b)Balances represent unamortized fair value basis of closed delivery commitments. A basis adjustment is recorded at the settlement of the loan and it represents the difference in trade price paid for acquiring the loan and the price at the settlement date for a similar loan. The basis adjustment is amortized as a yield adjustment to Interest income.

The FHLBNY and its members share the credit risk of MPF loans by structuring potential credit losses into layers. The first layer is typically 100 bps, but this varies with the particular MPF product. The amount of the first layer, or First Loss Account (FLA), was estimated at $44.2$43.6 million at June 30, 20222023 and $44.3 million at December 31, 2021.2022. The FLA is not recorded or reported as a reserve for loan losses, as it serves as a memorandum or information account. The FHLBNY is responsible for absorbing the first layer. The second layer is that amount of credit obligations that the PFI has agreed to assume at the “Master Commitment” level. The FHLBNY pays a credit enhancement fee to the PFI for taking on this obligation. The FHLBNY assumes all residual risk. Credit enhancement fees accrued were $0.4 million and $0.9$0.8 million for the three months and six months ended June 30, 2022 and $0.62023 compared to $0.4 million and $1.2$0.9 million for the same periods in the prior year.three and six months ended June 30, 2022. These fees were reported as a reduction to mortgage loan interest income.

In terms of the credit enhancement waterfall, the MPF program structures potential credit losses on conventional MPF loans into layers on each loan pool as follows:

(1)The first layer of protection against loss is the liquidation value of the real property securing the loan.
(2)The next layer of protection comes from the primary mortgage insurance (PMI) that is required for loans with a loan-to-value ratio greater than 80% at origination.
(3)Losses that exceed the liquidation value of the real property and any PMI will be absorbed by the FHLBNY, limited to the amount of the FLA available under the Master Commitment. For certain MPF products, the FHLBNY could recover previously absorbed losses by withholding future credit enhancement fees (CE Fees) otherwise payable to the PFI, and applying the amounts to recover losses previously absorbed. In effect, the FHLBNY may recover losses allocated to the FLA from CE Fees. The amount of CE Fees depends on the MPF product and the outstanding balances of loans funded in the Master Commitment. CE Fees payable (potentially available for loss recovery) will decline as the outstanding loan balances in the Master Commitment declines.
(4)The second layer or portion of credit losses is incurred by the PFI and/or the Supplemental Mortgage Insurance (SMI) provider as follows: The PFI absorbs losses in excess of any FLA up to the amount of the PFI’s credit obligation amount and/or to the SMI provider for MPF 125 Plus products if the PFI has selected SMI coverage.
(5)The third layer of losses is absorbed by the FHLBNY.

2523

Table of Contents

Federal Home Loan Bank of New York

Notes to Financial Statements — Unaudited

The MAP program operates on the Simplified Risk-Sharing Structure. MAP credit risk sharing structure rewards PFIs for originating high quality, well-performing loans. At the time of purchase, FHLBNY will set aside a standard credit enhancement of 1.5% for every loan funded, to be retained in a Member Performance Account (MPA) for each PFI. Loans are pooled into Aggregatesingle or aggregate (multi-member) Master Commitments. Loan losses over the life of the pool are absorbed in order by borrower’s equity, mortgage insurance (if applicable), MPA, and finally by FHLBNY. If pooled losses are low, MPA funds are returned to the seller over time, based on a contractual release schedule. This liability account was $2.9$5.3 million at June 30, 20222023 and $2.4$3.5 million at December 31, 2021.2022.

Allowance Methodology for Mortgage Loan Losses under ASU 2016-13.

Effective January 1, 2020, the FHLBNY adopted ASU 2016-13, Financial Instruments Credit Losses (Topic 326). With the adoption of the CECL guidance, the estimate of expected credit losses for MPF is forward-looking. CECL requires the use of forecasts about future economic conditions to estimate the expected credit loss over the remaining life of an instrument. The estimated credit loss is recorded upon initial recognition of the asset, even if the asset is performing at the time of purchase, in anticipation of a future event that will lead to a loss being realized (including consideration of remote scenarios as required under ASC 326-20-30-10). The objective of the estimate is to record the net amount expected to be collected for the asset, while considering available relevant information about the collectability of cash flows.

Our allowance for credit losslosses of $2.0$3.5 million at June 30, 20222023 took into consideration several factors. First, the Bank’s mortgage loan portfolio has a history of incurred losses that have not been significant. Second, loss sharing and insurance would largely offset actual losses. Lastly, forbearance processes under COVID-19 are likely to be temporary for the MPF loans; amounts under forbearance agreements are not material. Loan deferrals under COVID-19 relief are not material.

Evaluation of Credit Losses under CECL — Mortgage loans are evaluated for credit losses using the practical expedient for collateral dependent assets. We consider a conventional mortgage loan as a collateral dependent loan because we expect repayment to be provided by the sale of the underlying property, that is, if it is considered likely that the borrower will default. We may estimate the applicable fair value of this collateral by applying an appropriate loss severity rate or using third party estimates or property valuation model. The expected credit loss of a collateral dependent mortgage loan is equal to the difference between the amortized cost of the loan and the estimated fair value of the collateral, less estimated selling costs. We will either reserve for these estimated losses or record a direct charge-off of the loan balance, if certain triggering criteria are exceeded. Expected recoveries of prior charge-offs would be included in the allowance for credit loss.

The Bank’s credit risk model (“Model”model”) estimates the probabilities of prepayments and defaults concurrently. Prepayments represent the probability that an individual loan will voluntarily prepay while defaults represent the probability that an individual loan will transition to involuntary payoffs. Defaults transition from one delinquency status to another (e.g., current to 30 days, 30 days to 60 days, etc.) until the loan is involuntarily paid off. The transition probabilities are a function of collateral types, borrower characteristics, and economic factors. The model utilizes economic data files that provide interest rates, the applicable house price index, and applicable foreclosure timeline, which are used in simulating transition probabilities. The Bank’s third party credit loss model provides the ability to update assumptions and calculate the probability of default of each individual mortgage loan. The model also uses loan and borrower information along with economic assumptions about applicable housing prices and interest rates as inputs to generate a distribution of projected cash flows over the life of the mortgage. The model estimates the loss given default (LGD) for each loan during the simulation based on assumptions adopted in the model by projecting loan status probabilities and aggregating projected cash flows for each loan in the portfolio. A loan in foreclosure or REO sale is considered to be a default.

Accrued interest receivable was $10.3$10.6 million at June 30, 20222023 and $11.1$10.2 million at December 31, 2021.2022. Delinquency and non-accruals are factors that are applied in estimating expected credit losses. Refer to discussions on non-accrual and delinquent loans.

Government mortgages, which carry FHA, VA or USDA guarantees present a minimal risk of loss. Additionally, as part of the service agreement between FHLBNY and the members that sold us government loans, those members will buy back delinquent government loans.

2624

Table of Contents

Federal Home Loan Bank of New York

Notes to Financial Statements — Unaudited

Credit enhancements under the MPF Program may include primary mortgage insurance, supplemental mortgage insurance, in addition to recoverable performance-based credit enhancement fees. Potential recoveries from credit enhancements for conventional loans are evaluated at the individual master commitment level to determine the credit enhancements available to recover losses on loans under each individual master commitment. However, expected recoveries from credit enhancements are not factored into the calculation of expected credit losses. The MPF program’s actual loss experience has been immaterial and inclusion of recoveries in the allowance calculations would result in an immaterial change.

There were no MAP loans in serious delinquent status (90 days or more) at June 30, 20222023 and December 31, 2021.2022.

Roll forward Analysis of Allowance for Credit Losses

The following table provides a roll forward analysis of the allowance for credit losses (in thousands):

Three months ended June 30, 

Six months ended June 30, 

Three months ended June 30, 

Six months ended June 30, 


2022


2021


2022


2021


2023


2022


2023


2022

Allowance for credit losses:

Beginning balance

$

2,034

$

5,747

$

2,135

$

7,073

$

1,776

$

2,034

$

1,911

$

2,135

Adjustment for cumulative effect of accounting change

Charge-offs


(31)

(50)

(31)

Recoveries

Provision (Reversal) for credit losses on mortgage loans


(59)


(1,644)


(129)

(2,920)

1,712

(59)

1,577

(129)

Balance, at end of period

$

1,975

$

4,103

$

1,975

$

4,103

$

3,488

$

1,975

$

3,488

$

1,975

The following table presents risk elements and credit losses (dollars in thousands):


June 30, 2022


December 31, 2021


June 30, 2023


December 31, 2022


Average loans outstanding during the period (a)

$

2,205,245


$

2,501,735

$

2,079,927


$

2,155,287

Mortgage loans held for portfolio (a)(b)

2,143,053

2,284,541

2,110,004

2,076,211

Non-accrual loans (a)(b)

9,232


12,294

6,133


7,795

Allowance for credit losses on mortgage loans held for portfolio

1,975


2,135

3,488


1,911

Net charge-offs

31


50


31

Ratio of net charge-offs to average loans outstanding during the period


0.001

%


0.002

%


%  


0.001

%

Ratio of allowance for credit losses to mortgage loans held for portfolio


0.092

%


0.093

%


0.165

%  


0.092

%

Ratio of non-accrual loans to mortgage loans held for portfolio


0.431

%


0.538

%


0.291

%  


0.375

%

Ratio of allowance for credit losses to non-accrual loans


21.394

%


17.369

%


56.875

%  


24.511

%

(a)Represents the average unpaid principal balance for the six months ended June 30, 2023 and for the twelve months ended December 31, 2022.
(b)Balances represent unpaid principal balance.

The FHLBNY’s total MPF loans and impaired MPF loans were as follows (in thousands):


June 30, 2022


December 31, 2021


June 30, 2023


December 31, 2022

Total MPF Mortgage loans, carrying values net (a)

$

1,987,883

$

2,158,303

$

1,805,672

$

1,880,921

Non-performing MPF mortgage loans - Conventional (a)(b)

$

9,232

$

12,294

$

6,133

$

7,795

Insured MPF loans past due 90 days or more and still accruing interest (a)(b)

$

4,624

$

6,612

$

3,924

$

4,632

(a)Includes loans classified as special mention, sub-standard, doubtful or loss under regulatory criteria, net of amounts charged-off if delinquent for 180 days or more.
(b)Data in this table represents unpaid principal balance and would not agree to data reported in other tables at “amortized cost”.

Under the new framework, the FHLBNY evaluates all loans, including non-performing conventional loans, on an individual basis for lifetime credit losses.

2725

Table of Contents

Federal Home Loan Bank of New York

Notes to Financial Statements — Unaudited

FHA and VA loans are considered as insured MPF loans, and while the loans are evaluated on an individual basis, we have deemed that FHA and VA loans as collectively insured. Additionally, based on the Bank’s assessment of its servicers and the collateral backing the insured loans, the risk of loss was deemed immaterial. The Bank has not recorded an allowance for credit losses for government-guaranteed or -insured mortgage loans in any periods in 20222023 or 2021.2022. Furthermore, none of these mortgage loans has been placed on non-accrual status because of the U.S. government guarantee or insurance on these loans and the contractual obligation of the loan servicer to repurchase the loans when certain criteria are met.

The following tables present unpaid principal balances with and without related loan loss allowances for conventional loans (excluding insured FHA/VA MPF loans) in the MPF program (in thousands):

Three months ended

Six months ended

Three months ended

Six months ended

June 30, 2022

June 30, 2022

June 30, 2022

June 30, 2023

June 30, 2023

June 30, 2023


Unpaid


Average


Unpaid


Average

Principal

Related

Amortized Cost

Amortized Cost

Principal

Related

Amortized Cost

Amortized Cost


Balance

Allowance


After Allowance

After Allowance (d)


Balance

Allowance


After Allowance

After Allowance (d)

Conventional Loans - MPF (a)(c)

No related allowance (b)

$

1,134,423

$

$

1,150,169

$

1,166,540

$

1,223,608

$

280,485

$

$

283,958

$

782,161

$

921,638

With a related allowance

680,662

(1,805)

690,140

690,923

668,532

1,371,283

(2,578)

1,389,002

902,996

780,119

Total measured for impairment

$

1,815,085

$

(1,805)

$

1,840,309

$

1,857,463

$

1,892,140

$

1,651,768

$

(2,578)

$

1,672,960

$

1,685,157

$

1,701,757

December 31, 2021

December 31, 2022


Unpaid


Average


Unpaid


Average

Principal

Related

Amortized Cost

Amortized Cost

Principal

Related

Amortized Cost

Amortized Cost

Balance

Allowance

After Allowance

After Allowance (d)

Balance

Allowance

After Allowance

After Allowance (d)

Conventional Loans - MPF (a)(c)

No related allowance (b)

$

1,329,019

$

$

1,348,056

$

1,506,305

$

1,053,813

$

$

1,068,388

$

1,167,490

With a related allowance


640,788


(1,956)


649,531


779,346

664,581

(1,665)

673,518

668,124

Total measured for impairment

$

1,969,807

$

(1,956)

$

1,997,587

$

2,285,651

$

1,718,394

$

(1,665)

$

1,741,906

$

1,835,614

(a)Based on analysis of the nature of risks of the FHLBNY’s investments in MPF loans, including its methodologies for identifying and measuring impairment, management has determined that presenting such loans as a single class is appropriate.
(b)Collateral values, net of estimated costs to sell, exceeded the amortized cost in impaired loans and no allowances were deemed necessary.
(c)Interest received is not recorded as Interest income if an uninsured loan is past due 90 days or more. Cash received is recorded as a liability on the assumption that cash was remitted by the servicer to the FHLBNY that could potentially be recouped by the borrower in a foreclosure.
(d)Represents the average amortized cost after allowance for the three and six months ended June 30, 20222023 and for the twelve months ended December 31, 2021.2022.

The following table summarizes MPF mortgage loans held-for-portfolio by collateral/guarantee type (in thousands):


June 30, 2022


December 31, 2021


June 30, 2023


December 31, 2022

Mortgage Loans Held for Portfolio by Collateral/Guarantee Type:

Conventional mortgage loans - MPF

$

1,815,085

$

1,969,807

$

1,651,768

$

1,718,394

MPF Government-guaranteed or -insured mortgage loans

145,101

157,992

MPF Government-guaranteed or - insured mortgage loans

130,576

136,734

Total MPF loans - unpaid principal balance

$

1,960,186

$

2,127,799

$

1,782,344

$

1,855,128

Payment Status of Mortgage Loans

Payment status is the key credit quality indicator for conventional mortgage loans and allows the Bank to monitor the migration of past due loans. Past due loans are those where the borrower has failed to make timely payments of principal and/or interest in accordance with the terms of the loan. Other delinquency statistics include non-accrual loans and loans in process of foreclosure.

2826

Table of Contents

Federal Home Loan Bank of New York

Notes to Financial Statements — Unaudited

The following tables present the payment status for conventional mortgage loans and other delinquency statistics for the Bank’s mortgage loans at June 30, 20222023 and December 31, 2021.2022.

Credit Quality Indicator for Conventional Mortgage Loans (in thousands):

June 30, 2022

June 30, 2023

Conventional Loans

Conventional Loans

Origination Year

Origination Year


Prior to 2018


2018 to 2022


Total


Prior to 2019


2019 to 2023


Total

Payment Status, at Amortized Cost:

Conventional MPF/MAP

Past due 30 - 59 days

$

5,539

$

3,006

$

8,545

$

7,341

$

2,567

$

9,908

Past due 60 - 89 days


2,122

708

2,830


1,184

402

1,586

Past due 90 days or more


7,871

1,413

9,284


5,879

269

6,148

Total past due mortgage loans


15,532

5,127

20,659


14,404

3,238

17,642

Current MPF mortgage loans

1,006,823

814,632

1,821,455

971,793

686,783

1,658,576

Current MAP mortgage loans


187,752

187,752


332,953

332,953

Total conventional mortgage loans

$

1,022,355

$

1,007,511

$

2,029,866

$

986,197

$

1,022,974

$

2,009,171

December 31, 2021

December 31, 2022

Conventional Loans

Conventional Loans

Origination Year

Origination Year


Prior to 2017


2017 to 2021


Total


Prior to 2018


2018 to 2022


Total

Payment Status, at Amortized Cost:

Conventional MPF/MAP

Past due 30 - 59 days

$

6,458

$

6,614

$

13,072

$

8,399

$

4,104

$

12,503

Past due 60 - 89 days

1,386

1,100

2,486


2,707

653

3,360

Past due 90 days or more

11,066

1,288

12,354


6,676

1,162

7,838

Total past due mortgage loans

18,910

9,002

27,912


17,782

5,919

23,701

Current MPF mortgage loans

964,314

1,007,317

1,971,631

941,098

778,871

1,719,969

Current MAP mortgage loans

161,740

161,740


225,961

225,961

Total conventional mortgage loans

$

983,224

$

1,178,059

$

2,161,283

$

958,880

$

1,010,751

$

1,969,631

Other Delinquency Statistics (dollars in thousands):

June 30, 2023

Conventional

MPF Government-Guaranteed


MPF Loans


or -Insured Loans


Total MPF Loans

Amortized Cost:

In process of foreclosure (a)

$

3,413

$

1,725

$

5,138

Serious delinquency rate (b)

0.37

%  

3.11

%  

0.57

%

Past due 90 days or more and still accruing interest

$

$

3,996

$

3,996

Loans on non-accrual status

$

6,148

$

$

6,148

Troubled debt restructurings:

Loans discharged from bankruptcy (c)

$

4,491

$

1,622

$

6,113

Modified loans under MPF program

$

$

$

Real estate owned (d)

$

219

$

$

219

2927

Table of Contents

Federal Home Loan Bank of New York

Notes to Financial Statements — Unaudited

Other Delinquency Statistics (dollars in thousands):

June 30, 2022

Conventional

MPF Government-Guaranteed


MPF Loans


or -Insured Loans


Total MPF Loans

Amortized Cost:

In process of foreclosure (a)

$

5,818

$

3,230

$

9,048

Serious delinquency rate (b)

0.60

%  

3.33

%  

0.81

%

Past due 90 days or more and still accruing interest

$

$

4,697

$

4,697

Loans on non-accrual status

$

9,284

$

$

9,284

Troubled debt restructurings:

Loans discharged from bankruptcy(c)

$

4,261

$

957

$

5,218

Modified loans under MPF program

$

315

$

$

315

Real estate owned (d)

$

295

$

$

295

December 31, 2021

December 31, 2022

Conventional

MPF Government-Guaranteed

Conventional

MPF Government-Guaranteed


MPF Loans


or -Insured Loans


Total MPF Loans


MPF Loans


or -Insured Loans


Total MPF Loans

Amortized Cost:

In process of foreclosure (a)

$

11,190

$

4,053

$

15,243

$

3,940

$

2,865

$

6,805

Serious delinquency rate (b)

0.95

%  

4.26

%  

1.19

%

0.45

%  

3.45

%  

0.68

%

Past due 90 days or more and still accruing interest

$

$

6,684

$

6,684

$

$

4,702

$

4,702

Loans on non-accrual status

$

12,354

$

$

12,354

$

7,838

$

$

7,838

Troubled debt restructurings:

Loans discharged from bankruptcy(c)

$

4,849

$

778

$

5,627

$

5,241

$

1,434

$

6,675

Modified loans under MPF program

$

421

$

$

421

$

$

$

Real estate owned (d)

$

357

$

$

357

$

$

$

(a)Includes loans where the decision of foreclosure or a similar alternative, such as pursuit of deed-in-lieu, has been reported.
(b)Represents seriously delinquent loans as a percentage of total mortgage loans in MPF program. Seriously delinquent loans are comprised of all loans past due 90 days or more delinquent or loans that are in the process of foreclosure.
(c)Loans discharged from Chapter 7 bankruptcies are considered as TDRs.
(d)REO is reported at lower of cost or market value.

Note 11.         Deposits.

The FHLBNY accepts demand, overnight and term deposits from its members.members and government instrumentalities, including the FDIC. Also, a member that services mortgage loans may deposit funds collected in connection with the mortgage loans as a pending disbursement to the owners of the mortgage loans.

Deposits represent a relatively small portion of the FHLBNY’s funding, totaling $1.5$2.9 billion at June 30, 20222023 and $1.3$1.0 billion at December 31, 2021,2022, an increase of $170.3 million,$1.9 billion, or 12.9%185.0%, from December 31, 2021.2022. All FHLBNY deposits are uninsured and the balance of deposits vary depending on market factors, such as the attractiveness of the FHLBNY’s deposit pricing relative to the rates available on alternative money market instruments, FHLBNY members’ investment preferences with respect to the maturity of their investments, and FHLBNY members’ liquidity. Interest-bearing demand and overnight deposits represented 98.8%99.8% and 97.1%98.9% of deposits at June 30, 20222023 and December 31, 2021,2022, respectively, with the remaining deposits primarily being term deposits and non-interest-bearing deposits.

Interest-bearing demand and overnight deposits pay interest based on a daily interest rate. The year-to-date average balances of demand and overnight deposits were $1.1$2.9 billion for the period ended June 30, 20222023 and $1.4$1.0 billion for the twelve months ended December 31, 2021.The2022. The annualized weighted-average interest rates paid on demand and overnight deposits were 0.32%3.15% for the six months ended June 30, 20222023 and 0.03% during1.36% for the year ended December 31, 2021.2022. Term deposits pay interest based on a fixed rate determined at the issuance of the deposit. There were 0no term deposits in the first six months of 2022.2023. The average balances of term deposits were $0.2$0.4 million and the weighted-average interest rates paid on term deposits were 0.17% during3.51% for the year ended December 31, 2021.2022.

The following table summarizes deposits (in thousands):


June 30, 2023


December 31, 2022

Interest-bearing deposits

Interest-bearing demand

$

2,920,374

$

1,015,991

Term (a)


Total interest-bearing deposits


2,920,374


1,015,991

Non-interest-bearing demand

6,467


10,946

Total deposits (b)

$

2,926,841

$

1,026,937

(a)Term deposits were for periods of one year or less.

3028

Table of Contents

Federal Home Loan Bank of New York

Notes to Financial Statements — Unaudited

The following table summarizes deposits (in thousands):


June 30, 2022


December 31, 2021

Interest-bearing deposits

Interest-bearing demand

$

1,473,761

$

1,283,072

Term (a)


Total interest-bearing deposits


1,473,761


1,283,072

Non-interest-bearing demand

17,792


38,166

Total deposits (b)

$

1,491,553

$

1,321,238

(a)Term deposits were for periods of one year or less.
(b)Specific disclosures about deposits that exceed FDIC limits have been omitted as deposits are not insured by the FDIC. Deposits are received in the ordinary course of the FHLBNY’s business. The FHLBNY has pledged securities to the FDIC to collateralize deposits maintained at the FHLBNY by the FDIC; for more information, see Securities Pledged in Note 8. Held-to-Maturity Securities.

Interest rate payment terms for deposits are summarized below (dollars in thousands):

Average

Average

Average

Average

Deposits


June 30, 2022


Interest Rate (b)


December 31, 2021


Interest Rate (b)


June 30, 2023


Interest Rate (b)


December 31, 2022


Interest Rate (b)

Term deposits

$

%  

$

0.17

%  

$

%  

$

3.51

%

Interest-bearing demand (a)

1,473,761


0.32

1,283,072


0.03

2,920,374


3.15

1,015,991


1.36

Total interest-bearing deposits

$

1,473,761

0.32

%

$

1,283,072

0.03

%

$

2,920,374

3.15

%  

$

1,015,991

1.36

%

Non-interest-bearing demand

17,792

38,166

6,467

10,946

Total deposits

$

1,491,553

$

1,321,238

$

2,926,841

$

1,026,937

(a)

Primarily adjustable rate.

(b)

The weighted average interest rate is calculated based on the average balance.

Note 12.         Consolidated Obligations.

The FHLBanks have joint and several liability for all the Consolidated obligations issued on their behalf (for more information, see Note 19. Commitments and Contingencies). Consolidated obligations consist of bonds and discount notes. The FHLBanks issue Consolidated obligations through the Office of Finance as their fiscal agent. In connection with each debt issuance, a FHLBank specifies the amount of debt it wants issued on its behalf. The Office of Finance tracks the amount of debt issued on behalf of each FHLBank. Each FHLBank separately tracks and records as a liability for its specific portion of Consolidated obligations for which it is the primary obligor. Consolidated obligation bonds (CO bonds or Consolidated bonds) are issued primarily to raise intermediate- and long-term funds for the FHLBanks and are not subject to any statutory or regulatory limits on maturity.

Consolidated obligation discount notes (CO discount notes, Discount notes, or Consolidated discount notes) are issued primarily to raise short-term funds. Discount notes sell at less than their face amount and are redeemed at par value when they mature.

The following table summarizes carrying amounts of Consolidated obligations outstanding (in thousands):


June 30, 2023


December 31, 2022

Consolidated obligation bonds-amortized cost

$

102,972,261

$

87,612,556

Hedge valuation basis adjustments


(1,842,731)


(2,015,128)

Hedge basis adjustments on de-designated hedges


110,493


114,430

FVO - valuation adjustments and accrued interest


(191,389)


(214,103)

Total Consolidated obligation bonds

$

101,048,634

$

85,497,755

Discount notes-amortized cost

$

57,947,226

$

61,832,418

Hedge value basis adjustments

(35,325)

(39,088)

Hedge basis adjustments on de-designated hedges

(341)

FVO - valuation adjustments and remaining accretion


Total Consolidated obligation discount notes

$

57,911,901

$

61,792,989

3129

Table of Contents

Federal Home Loan Bank of New York

Notes to Financial Statements — Unaudited

The following table summarizes carrying amounts of Consolidated obligations outstanding (in thousands):


June 30, 2022


December 31, 2021

Consolidated obligation bonds-amortized cost

$

58,892,424

$

54,643,748

Hedge valuation basis adjustments


(1,334,064)


77,048

Hedge basis adjustments on de-designated hedges


120,845


125,091

FVO - valuation adjustments and accrued interest


(128,679)


(16,486)

Total Consolidated obligation bonds

$

57,550,526

$

54,829,401

Discount notes-amortized cost

$

49,577,693

$

42,197,683

Hedge value basis adjustments

(58,458)

(424)

Hedge basis adjustments on de-designated hedges

(3)

FVO - valuation adjustments and remaining accretion


Total Consolidated obligation discount notes

$

49,519,232

$

42,197,259

Redemption Terms of Consolidated Obligation Bonds

The following table is a summary of carrying amounts of Consolidated obligation bonds outstanding by year of maturity (dollars in thousands):

June 30, 2022

December 31, 2021

June 30, 2023

December 31, 2022

Weighted


Weighted


Weighted


Weighted


Average

Percentage

Average

Percentage

Average

Percentage

Average

Percentage

Maturity


Amount


Rate (a)


of Total


Amount


Rate (a)


of Total


Amount


Rate (a)


of Total


Amount


Rate (a)


of Total

One year or less

$

15,968,000


1.33

%  

27.17

%  

$

19,254,345


0.59

%  

35.32

%

$

60,269,685


4.48

%  

58.58

%  

$

40,943,160


3.69

%  

46.79

%

Over one year through two years


10,947,080


1.64

18.63


7,317,160


1.20

13.42


15,098,120


2.94

14.67


16,499,805


2.56

18.85

Over two years through three years


8,410,485


1.32

14.31


5,881,385


0.85

10.79


11,115,535


1.60

10.80


7,808,115


1.65

8.92

Over three years through four years


9,359,235


0.96

15.93


4,149,215


0.97

7.61


7,771,115


2.04

7.55


10,533,905


1.09

12.04

Over four years through five years


7,154,565


1.78

12.17


10,072,905


0.95

18.48


2,965,280


3.19

2.88


4,638,435


2.35

5.30

Thereafter


6,926,445


2.72

11.79


7,839,700


2.44

14.38


5,674,960


3.01

5.52


7,092,000


2.88

8.10

Total par value


58,765,810


1.55

%  

100.00

%  


54,514,710


1.06

%  

100.00

%


102,894,695


3.64

%  

100.00

%  


87,515,420


2.85

%  

100.00

%

Bond premiums (b)


148,133


152,601


104,602


123,477

Bond discounts (b)


(21,519)


(23,563)


(27,036)


(26,341)

Hedge valuation basis adjustments (c)


(1,334,064)


77,048


(1,842,731)


(2,015,128)

Hedge basis adjustments on de-designated hedges (d)


120,845


125,091


110,493


114,430

FVO (e) - valuation adjustments and accrued interest


(128,679)


(16,486)


(191,389)


(214,103)

Total Consolidated obligation-bonds

$

57,550,526

$

54,829,401

Total Consolidated obligation bonds

$

101,048,634

$

85,497,755

(a)

Weighted average rate represents the weighted average contractual coupons of bonds, unadjusted for swaps.

(b)

Amortization of CO bond premiums and discounts are recorded in interest expense as yield adjustments.

(c)

Hedge valuation basis adjustments under ASC 815 fair value hedges represent changes in the fair values of fixed-rate CO bonds due to changes in the designated benchmark interest rate, remaining terms to maturity or next call, and the notional amounts of CO bonds designated in hedge relationship. Our primary interest rate benchmarks are LIBOR, the Federal Funds-OIS index and the SOFR-OIS index.

(d)

Hedge basis adjustments on de-designated hedges represent the unamortized balances of valuation basis of fixed-rate CO bonds that were previously in a fair value hedging relationship. Generally, when a hedging relationship is de-designated, the valuation basis is no longer adjusted for changes in the valuation of the debt for changes in the benchmark rate; instead, the basis is amortized over the debt’s remaining life, so that at maturity of the debt the unamortized basis is reversed to 0zero .at maturity of the debt.

32

Table of Contents

Federal Home Loan Bank of New York

Notes to Financial Statements — Unaudited

(e)

Valuation adjustments on FVO designated bonds represent changes in the entire fair values of CO bonds elected under the FVO plus accrued unpaid interest. Changes in the timing of coupon payments impact outstanding accrued interest. Changes in benchmark interest rates, notional amounts of CO bonds elected under FVO and remaining terms to maturity or next call will impact hedge valuation adjustments.

30

Table of Contents

Federal Home Loan Bank of New York

Notes to Financial Statements — Unaudited

Interest Rate Payment Terms

The following table summarizes par amounts of major types of Consolidated obligation bonds issued and outstanding (dollars in thousands):

June 30, 2022

December 31, 2021

June 30, 2023

December 31, 2022

Percentage

Percentage

Percentage

Percentage


Amount


of Total


Amount


of Total


Amount


of Total


Amount


of Total

Fixed-rate, non-callable

$

27,027,830


45.99

%  

$

31,907,580


58.53

%

$

32,704,705


31.79

%  

$

30,482,290


34.83

%

Fixed-rate, callable


18,094,130

30.79


12,993,130

23.84


27,833,640

27.05


18,676,130

21.34

Step Up, callable


6,507,000

11.08


4,799,000

8.80


4,026,000

3.91


5,374,000

6.14

Step Down, callable

52,000

0.05

Floating rate, callable

1,665,000

2.83

1,265,000

2.32

250,000

0.29

Single-index floating rate


5,471,850


9.31


3,550,000


6.51


38,278,350


37.20


32,733,000


37.40

Total par value

$

58,765,810


100.00

%  

$

54,514,710


100.00

%

$

102,894,695


100.00

%  

$

87,515,420


100.00

%

Discount Notes

Consolidated obligation discount notes are issued to raise short-term funds. Discount notes are Consolidated obligations with original maturities of up to one year. These notes are issued at less than their face amount and redeemed at par when they mature. The FHLBNY’s outstanding Consolidated obligation discount notes were as follows (dollars in thousands):


June 30, 2022


December 31, 2021


June 30, 2023


December 31, 2022

Par value

$

49,705,943

$

42,204,430

$

58,569,123

$

62,295,735

Amortized cost

$

49,577,693

$

42,197,683

$

57,947,226

$

61,832,418

Hedge value basis adjustments (a)

(58,458)

(424)

(35,325)

(39,088)

Hedge basis adjustments on de-designated hedges (b)

(3)

(341)

FVO (c) - valuation adjustments and remaining accretion


Total discount notes

$

49,519,232

$

42,197,259

Total CO discount notes

$

57,911,901

$

61,792,989

Weighted average interest rate


1.17

%  


0.06

%


4.92

%  


3.97

%

(a)Hedging valuation basis adjustments — The reported carrying values of hedged CO discount notes are adjusted for changes in their fair values (fair value basis adjustments or fair value) that are attributable to changes in the benchmark risk being hedged. Changes in the designated benchmark interest rate, notional amounts of CO discount notes in hedging relationships and remaining terms to maturity are factors that impact hedge valuation adjustments.
(b)Hedge basis adjustments on de-designated hedges — Represents the unamortized balances of valuation basis of CO discount notes that were previously in a fair value hedging relationship. Generally, when a hedging relationship is de-designated, the valuation basis is no longer adjusted for changes in the valuation of the debt for changes in the benchmark rate; instead, the basis is amortized over the debt’s remaining life, so that at maturity of the debt the unamortized basis is reversed to 0zero .at maturity of the debt.
(c)FVO valuation adjustments — Valuation basis adjustmentadjustments are recorded to recognize changes in the entire or full fair values including unaccreted discounts on CO discount notes elected under the FVO. Changes in benchmark interest rates, notional amounts of CO discount notes elected under FVO and remaining terms to maturity are factors that impact hedge valuation adjustments. NaNNo CO discount notes were elected under the FVO at June 30, 20222023 and December 31, 20212022.

3331

Table of Contents

Federal Home Loan Bank of New York

Notes to Financial Statements — Unaudited

Note 13.         Affordable Housing Program.

The FHLBNY charges the amount allocated for the Affordable Housing Program (AHP) to expense and recognizes it as a liability. The FHLBNY relieves the AHP liability as members use the subsidies.

The following table provides roll forward information with respect to changes in Affordable Housing Program liabilities (in thousands):

Three months ended June 30, 

Six months ended June 30, 


2022


2021


2022


2021

Three months ended June 30,

Six months ended June 30, 


2023


2022


2023


2022

Beginning balance

$

137,261

$

152,176

$

137,638

$

148,827

$

143,797

$

137,261

$

131,394

$

137,638

Additions from current period’s assessments

8,566


8,304

14,917


16,331

23,989


8,566

46,062


14,917

Net disbursements for grants and programs

(14,044)


(7,957)

(20,772)


(12,635)

(9,037)


(14,044)

(18,707)


(20,772)

Ending balance

$

131,783

$

152,523

$

131,783

$

152,523

$

158,749

$

131,783

$

158,749

$

131,783

Note 14.         Capital Stock, Mandatorily Redeemable Capital Stock and Restricted Retained Earnings.

The FHLBanks, including the FHLBNY, have a cooperative structure. To access the FHLBNY’s products and services, a financial institution must be approved for membership and purchase capital stock in the FHLBNY. A member’s stock requirement is generally based on its use of FHLBNY products, subject to a minimum membership requirement as prescribed by the FHLBank Act and the FHLBNY’s Capital Plan. FHLBNY stock can be issued, exchanged, redeemed and repurchased only at its stated par value of $100 per share. It is not publicly traded. An option to redeem capital stock that is greater than a member’s minimum requirement is held by both the member and the FHLBNY. The FHLBNY’s Capital Plan offers 2two sub-classes of Class B capital stock, membership and activity-based capital stock, and members can redeem Class B stock by giving five years notice. The FHLBNY’s Class B capital stock issued and outstanding were $4.9$6.4 billion at June 30, 20222023 and $4.5 billion at December 31, 2021.2022.

Shares of both Membership and Activity-based Class B capital stocksstock have the same voting rights and receive the same dividend rates. (See Statements of Capital):

Membership capital stock is issued to meet membership stock purchase requirements. The FHLBNY requires member institutions to maintain membership stock based on a percentage of the member’s mortgage-related assets. The current capital stock purchase requirement for membership is 12.5 basis points. In addition, notwithstanding this requirement, the FHLBNY has a $100$50 million cap on membership stock per member. Effective August 1, 2022, the maximum cap on membership capital stock purchases was reduced from $100 million to $50 million. As a result, the Bank repurchased $166 million in membership stock.
Activity basedActivity-based capital stock is issued based on a percentage of outstanding balances of advances, MPF and MAP loans and financial letters of credit. The FHLBNY’s current capital plan requires a stock purchase of 4.5% of the member’s borrowed amount. Excessamount for advances and mortgage loans, and 12.5 basis points for letters of credit. In the normal course of business, excess activity-based capital stock is repurchased daily.

The FHLBNY is subject to risk-based capital rules of the Finance Agency, the regulator of the FHLBanks. Specifically, the FHLBNY is subject to 3three capital requirements under its capital plan. First, the FHLBNY must maintain at all times permanent capital in an amount at least equal to the sum of its credit risk, market risk, and operations risk capital requirements as calculated in accordance with the FHLBNY policy, and rules and regulations of the Finance Agency. Only permanent capital, defined as Class B stock and retained earnings, satisfies this risk-based capital requirement. The FHLBNY’s capital plan does not provide for the issuance of Class A capital stock. The Finance Agency may require the FHLBNY to maintain an amount of permanent capital greater than what is required by the risk-based capital requirements. Second, the FHLBNY is required to maintain at least a 4.0% total capital-to-asset ratio; and third,ratio. Third, the FHLBNY willmust maintain at least a 5.0% leverage ratio at all times. The FHFA’s regulatory leverage ratio is defined as the sum of permanent capital weighted 1.5 times and non-permanent capital weighted 1.0 times divided by total assets.

The FHLBNY was in compliance with the aforementioned capital rules and requirements for all periods presented, and met the “adequately capitalized” classification, which is the highest rating, under the capital rule. The Director of the Finance Agency has discretion to add to or modify the corrective action requirements for each capital classification other than adequately capitalized if the Director of the Finance Agency determines that such action is necessary to ensure the safe and sound operation of the FHLBank and the FHLBank’s compliance with its risk-based and minimum capital requirements.

3432

Table of Contents

Federal Home Loan Bank of New York

Notes to Financial Statements — Unaudited

Risk-based Capital — The following table summarizes the FHLBNY’s risk-based capital ratios (dollars in thousands):

June 30, 2022

December 31, 2021

June 30, 2023

December 31, 2022


Required (d)


Actual


Required (d)


Actual


Required (d)


Actual


Required (d)


Actual

Regulatory capital requirements:

Risk-based capital (a)(e)

$

843,283

$

6,910,179

$

844,115

$

6,433,709

$

1,031,678

$

8,651,396

$

749,451

$

8,488,246

Total capital-to-asset ratio


4.00

%  


5.96

%  


4.00

%  


6.11

%

4.00

%  

5.05

%  


4.00

%  


5.39

%

Total capital (b)

$

4,638,525

$

6,910,179

$

4,214,334

$

6,433,709

$

6,856,304

$

8,651,396

$

6,295,660

$

8,488,246

Leverage ratio


5.00

%  


8.94

%  


5.00

%  


9.16

%

5.00

%  

7.57

%  


5.00

%  


8.09

%

Leverage capital (c)

$

5,798,156

$

10,365,268

$

5,267,917

$

9,650,563

$

8,570,380

$

12,977,094

$

7,869,574

$

12,732,369

(a)Actual “Risk-based capital” is capital stock and retained earnings plus mandatorily redeemable capital stock. Section 1277.3 of the Finance Agency’s regulations also refers to this amount as “Permanent Capital.”
(b)Required “Total capital” is 4.0% of total assets.
(c)The required leverage ratio of total capital to total assets should be at least 5.0%. For the purposes of determining the leverage ratio, total capital shall be computed by multiplying the Bank’s Permanent Capital by 1.5.
(d)Required minimum.
(e)Under regulatory guidelines issued by the Finance Agency in August 2011 that was consistent with guidance provided by other federal banking agencies with respect to capital rules, risk weights are maintained at AAA for U.S. Treasury securities and other securities issued or guaranteed by the U.S. Government, government agencies, and government-sponsored entities for purposes of calculating risk-based capital.

Mandatorily Redeemable Capital Stock

Generally, the FHLBNY’s capital stock is redeemable at the option of either the member or the FHLBNY subject to certain conditions, including the provisions under the accounting guidance for certain financial instruments with characteristics of both liabilities and equity. In accordance with the accounting guidance, the FHLBNY generally reclassifies the stock subject to redemption from equity to a liability once a member irrevocably exercises a written redemption right, gives notice of intent to withdraw from membership, or attains non-member status by merger or acquisition, charter termination, or involuntary termination from membership. Under such circumstances, the member shares will then meet the definition of a mandatorily redeemable financial instrument.

Estimated redemption periods were as follows (in thousands):


June 30, 2022


December 31, 2021


June 30, 2023


December 31, 2022

Redemption less than one year

$

363

$

97

$

1,359

$

93

Redemption from one year to less than three years


838


226


4,137


2,387

Redemption from three years to less than five years


905


244


782


952

Redemption from five years or greater


6,011


1,392


1,051


1,146

Total

$

8,117

$

1,959

$

7,329

$

4,578

3533

Table of Contents

Federal Home Loan Bank of New York

Notes to Financial Statements — Unaudited

The following table provides roll forward information with respect to changes in mandatorily redeemable capital stock liabilities (in thousands):

Three months ended June 30, 

Six months ended June 30, 

Three months ended June 30, 

Six months ended June 30, 


2022


2021


2022


2021


2023


2022


2023

2022

Beginning balance

$

7,565

$

2,651

$

1,959

$

2,991

$

5,640

$

7,565

$

4,578

$

1,959

Capital stock subject to mandatory redemption reclassified from equity

236,573


41

258,467


85

3,189


236,573


4,659

258,467

Redemption of mandatorily redeemable capital stock (a)

(236,021)


(332)

(252,309)


(716)

(1,500)


(236,021)


(1,908)

(252,309)

Ending balance

$

8,117

$

2,360

$

8,117

$

2,360

$

7,329

$

8,117

$

7,329

$

8,117

Accrued interest payable (b)

$

753

$

30

$

753

$

30

$

127

$

753

$

127

$

753

(a)Redemption includes repayment of excess stock.
(b)The annualized accrual rates was 4.75%7.75% for the three months ended June 30, 20222023 and4.75% in the same period in 2021.2022. Accrual rates are based on estimated dividend rates.

Restricted Retained Earnings

Under the FHLBank Joint Capital Enhancement Agreement (Capital Agreement), each FHLBank is required to set aside 20% of its Net income each quarter to a restricted retained earnings account until the balance of that account equals at least 1one percent of that FHLBank’s average balance of outstanding Consolidated obligations as calculated as of the last day of the current calendar quarter. The Capital Agreement is intended to enhance the capital position of each FHLBank. These restricted retained earnings will not be available to pay dividends. Retained earnings included $854.1$993.7 million and $827.4$910.9 million as restricted retained earnings in the FHLBNY’s Total Capital at June 30, 20222023 and December 31, 2021,2022, respectively.

Note 15.         Earnings Per Share of Capital.

The FHLBNY has a single class of capital stock, and earnings per share computation is for the Class B capital stock.

The following table sets forth the computation of earnings per share. Basic and diluted earnings per share of capital are the same. The FHLBNY has 0no dilutive potential common shares or other common stock equivalents (dollars in thousands except per share amounts):

Three months ended June 30, 

Six months ended June 30, 

Three months ended June 30, 

Six months ended June 30, 


2022


2021


2022


2021


2023


2022


2023


2022

Net income

$

76,325

$

74,705

$

133,365

$

146,914

$

215,776

$

76,325

$

414,320

$

133,365

Net income available to stockholders

$

76,325

$

74,705

$

133,365

$

146,914

$

215,776

$

76,325

$

414,320

$

133,365

Weighted average shares of capital


47,146


51,878


46,141


52,470


67,683


47,146


65,829


46,141

Less: Mandatorily redeemable capital stock


(636)


(25)


(378)


(27)


(66)


(636)


(61)


(378)

Average number of shares of capital used to calculate earnings per share


46,510


51,853


45,763


52,443


67,617


46,510


65,768


45,763

Basic earnings per share

$

1.64

$

1.44

$

2.91

$

2.80

$

3.19

$

1.64

$

6.30

$

2.91

Note 16.         Employee Retirement Plans.

The FHLBNY participates in the Pentegra Defined Benefit Plan for Financial Institutions (Pentegra DB Plan), a tax-qualified, defined-benefit multi-employermultiemployer pension plan that covers all FHLBNY officers and employees. The FHLBNY also participates in the Pentegra Defined Con- tributionContribution Plan for Financial Institutions, a tax-qualified defined contribution plan. The FHLBNY offers 2two non-qualified Benefit Equalization Plans, which are retirement plans. In July 2023, the Pentegra Defined Contribution Plan was transitioned to Vanguard. The two plans restore and enhance defined benefits for those employees who have had their qualified Defined Benefit Plan and their Defined Contribution Plan limited by IRS regulations. The two non-qualified Benefit Equalization Plans (BEP) are unfunded.

3634

Table of Contents

Federal Home Loan Bank of New York

Notes to Financial Statements — Unaudited

Retirement Plan Expenses Summary

The following table presents employee retirement plan expenses for the periods ended (in thousands):

Three months ended June 30, 

Six months ended June 30,

Three months ended June 30, 

Six months ended June 30, 


2022


2021


2022


2021


2023


2022


2023


2022

Defined Benefit Plan

$

2,350

$

2,500

$

4,700

$

5,000

$

3,100

$

2,350

$

6,200

$

4,700

Benefit Equalization Plans (defined benefit and defined contribution)


1,351


3,281


3,482


6,266


1,937


1,351


3,783


3,482

Defined Contribution Plans


713


721


1,492


1,490


747


713


1,553


1,492

Postretirement Health Benefit Plan

77


77


155


153

(253)


77


(506)


155

Total retirement plan expenses

$

4,491

$

6,579

$

9,829

$

12,909

$

5,531

$

4,491

$

11,030

$

9,829

Benefit Equalization Plan (BEP)

The BEP restores defined benefits for those employees who have had their qualified defined benefits limited by IRS regulations. The method for determining the accrual expense and liabilities of the plan is the Projected Unit Credit Accrual Method. Under this method, the liability of the plan is composed mainly of two components, Projected Benefit Obligation (PBO) and Service Cost accruals. The total liability is determined by projecting each person’s expected plan benefits. These projected benefits are then discounted to the measurement date. Finally, the liability is allocated to service already worked (PBO) and service to be worked (Service Cost). There were no plan assets, as this is an unfunded plan that havehas been designated for the BEP plan.

Components of the net periodic pension cost for the defined benefit component of the BEP were as follows (in thousands):

Three months ended June 30, 

Six months ended June 30,

Three months ended June 30, 

Six months ended June 30, 


2022


2021


2022


2021


2023


2022


2023


2022

Service cost

$

619

$

496

$

1,239

$

992

$

412

$

619

$

823

$

1,239

Interest cost


645


529


1,289


1,059


860


645


1,719


1,289

Amortization of unrecognized net loss


1,221


1,477


2,441


2,954


1,221


2,441

Amortization of unrecognized past service cost

52

174

104

348

14

52

27

104

Net periodic benefit cost - Defined Benefit BEP

2,537

2,676

5,073

5,353

1,286

2,537

2,569

5,073

Benefit Equalization plans - Thrift and Deferred incentive compensation plans

(1,186)

605

(1,591)

913

651

(1,186)

1,214

(1,591)

Total

$

1,351

$

3,281

$

3,482

$

6,266

$

1,937

$

1,351

$

3,783

$

3,482

Postretirement Health Benefit Plan

The Retiree Medical Benefit Plan (the Plan) is for retired employees and for employees who are eligible for retirement benefits. The Plan is unfunded. The Plan, as amended, is offered to active employees who have completed 10 years of employment service at the FHLBNY and attained age 55 as of January 1, 2015.

Components of the net periodic benefit cost for the postretirement health benefit plan were as follows (in thousands):

Three months ended June 30, 

Six months ended June 30,

Three months ended June 30, 

Six months ended June 30, 


2022


2021


2022


2021


2023


2022


2023


2022

Service cost (benefits attributed to service during the period)

$

11

$

16

$

23

$

32

$

6

$

11

$

13

$

23

Interest cost on accumulated postretirement health benefit obligation


66


61


132


121


102


66


204


132

Amortization of (gain)/loss


(361)


(723)


Net periodic postretirement health benefit expense/(income)

$

77

$

77

$

155

$

153

$

(253)

$

77

$

(506)

$

155

35

Table of Contents

Federal Home Loan Bank of New York

Notes to Financial Statements — Unaudited

Note 17.         Derivatives and Hedging Activities.

The FHLBNY, consistent with the Finance Agency’s regulations, may enter into interest-rate swaps, swaptions, and interest-rate cap and floor agreements to manage its interest rate exposure inherent in otherwise unhedged assets and funding positions. We are not a derivatives dealer and do not trade derivatives for short-term profit.

37

Table of Contents

Federal Home Loan Bank of New York

Notes to Financial Statements — Unaudited

The contractual or notional amount of derivatives reflects the involvement of the FHLBNY in the various classes of financial instruments, and serve as a basis for calculating periodic interest payments or cash flows. Notional amount of a derivative does not measure the credit risk exposure, and the maximum credit exposure is substantially less than the notional amount. The maximum credit risk is the estimated cost of replacing interest-rate swaps, forward agreements, mandatory delivery contracts for mortgage loans and purchased caps and floors (derivatives) in a gain position if the counterparty defaults and the related collateral, if any, is of insufficient value to the FHLBNY.

Derivatives are instruments that derive their value from underlying asset prices, indices, reference rates and other inputs, or a combination of these factors. The FHLBNY executes derivatives with swap dealers and financial institution swap counterparties as negotiated contracts, which are usually referred to as over-the-counter (OTC) derivatives.

The following table presents the FHLBNY’s derivative activities based on notional amounts (in thousands):


Hedging Instruments Under ASC 815


June 30, 2022


December 31, 2021

Interest rate contracts

Interest rate swaps

$

140,318,352

$

94,190,603

Interest rate caps


800,000


800,000

Mortgage delivery commitments


4,713


8,573

Total interest rate contracts notionals

$

141,123,065

$

94,999,176

38

Table of Contents

Federal Home Loan Bank of New York

Notes to Financial Statements — Unaudited

Derivative Notionals


Hedging Instruments Under ASC 815


June 30, 2023


December 31, 2022

Interest rate contracts

Interest rate swaps

$

198,538,372

$

173,232,721

Interest rate caps


800,000


800,000

Mortgage delivery commitments


7,616


9,837

Total interest rate contracts notionals

$

199,345,988

$

174,042,558

36

Table of Contents

Federal Home Loan Bank of New York

Notes to Financial Statements — Unaudited

Offsetting of Derivative Assets and Derivative Liabilities — Net Presentation

The table below presents the gross and net derivatives receivables by contract type and amount for those derivatives contracts for which netting is permissible under U.S. GAAP as Derivative instruments nettable. Derivatives receivables have been netted with respect to those receivables as to which the netting requirements have been met, including obtaining a legal analysis with respect to the enforceability of the netting (in thousands):

June 30, 2022

December 31, 2021

June 30, 2023

December 31, 2022

Derivative

Derivative

Derivative

Derivative

Derivative

Derivative

Derivative

Derivative


Assets


Liabilities


Assets


Liabilities


Assets


Liabilities


Assets


Liabilities

Derivative instruments - nettable

Gross recognized amount

Uncleared derivatives

$

229,939

$

1,401,601

$

203,797

$

719,892

$

1,070,722

$

2,216,679

$

683,389

$

2,110,074

Cleared derivatives


446,704


568,297


293,323


296,531


2,043,921


2,048,261


1,534,274


1,504,012

Total gross recognized amount


676,643


1,969,898


497,120


1,016,423


3,114,643


4,264,940


2,217,663


3,614,086

Gross amounts of netting adjustments and cash collateral

Uncleared derivatives


1,658


(1,392,372)


(77,045)


(683,385)


(972,075)


(2,199,415)


(550,878)


(2,095,888)

Cleared derivatives


(443,103)


(471,961)


(122,585)


(296,531)


(2,042,966)


(2,042,966)


(1,502,901)


(1,502,901)

Total gross amounts of netting adjustments and cash collateral

(441,445)

(1,864,333)

(199,630)

(979,916)

(3,015,041)

(4,242,381)

(2,053,779)

(3,598,789)

Net amounts after offsetting adjustments and cash collateral

$

235,198

$

105,565

$

297,490

$

36,507

$

99,602

$

22,559

$

163,884

$

15,297

Uncleared derivatives

$

231,597

$

9,229

$

126,752

$

36,507

$

98,647

$

17,264

$

132,511

$

14,186

Cleared derivatives


3,601


96,336


170,738


955


5,295


31,373


1,111

Total net amounts after offsetting adjustments and cash collateral

$

235,198

$

105,565

$

297,490

$

36,507

$

99,602

$

22,559

$

163,884

$

15,297

Derivative instruments - not nettable

Uncleared derivatives (a)

$

25

$

13

$

14

$

5

$

$

1,601

$

37

$

36

Total derivative assets and total derivative liabilities

Uncleared derivatives

$

231,622

$

9,242

$

126,766

$

36,512

$

98,647

$

18,865

$

132,548

$

14,222

Cleared derivatives


3,601


96,336


170,738


955


5,295


31,373


1,111

Total derivative assets and total derivative liabilities presented in the Statements of Condition (b)

$

235,223

$

105,578

$

297,504

$

36,512

$

99,602

$

24,160

$

163,921

$

15,333

Non-cash collateral received or pledged (c)

Can be sold or repledged

Security pledged as initial margin to Derivative Clearing Organization (d)

$

534,094

$

$

367,110

$

Security collateral pledged as initial margin to Derivative Clearing Organization (d)

$

754,175

$

$

576,756

$

Cannot be sold or repledged

Uncleared derivatives securities received

(110,587)

(115,833)

Uncleared derivatives securities received as Variation Margin

(84,198)

(108,761)

Total net amount of non-cash collateral received or repledged

$

423,507

$

$

251,277

$

$

669,977

$

$

467,995

$

Total net exposure cash and non-cash (e)

$

658,730

$

105,578

$

548,781

$

36,512

$

769,579

$

24,160

$

631,916

$

15,333

Net unsecured amount - Represented by:

Uncleared derivatives

$

121,035

$

9,242

$

10,933

$

36,512

$

14,449

$

18,865

$

23,787

$

14,222

Cleared derivatives


537,695


96,336


537,848


755,130


5,295


608,129


1,111

Total net exposure cash and non-cash (e)

$

658,730

$

105,578

$

548,781

$

36,512

$

769,579

$

24,160

$

631,916

$

15,333

(a)Not nettable derivative instruments are without legal right of offset, and were synthetic derivatives representing forward mortgage delivery commitments of 4560 businesscalendar days or less. Amounts were not material, and it was operationally not practical to separate receivables from payables; net presentation was adopted. NaNNo cash collateral was involved with the mortgage delivery commitments.
(b)Amounts represented Derivative assets and liabilities that were recorded in the Statements of Condition. Derivative cash balances were not netted with non-cash collateral received or pledged, since legal ownership of the non-cash collateral remains with the pledging counterparty (see footnote (c) below).

37

Table of Contents

Federal Home Loan Bank of New York

Notes to Financial Statements — Unaudited

(c)Non-cash collateral received or pledged – For certain uncleared derivatives, from time to time counterparties have pledged U.S. Treasury securities to the FHLBNY as collateral. Amounts also included non-cash mortgage collateral on derivative positions with member counterparties where we acted as an intermediary. For certain cleared derivatives, we have pledged marketable securities to satisfy initial margin or collateral requirements.
(d)Amounts represented securities collateral pledged to Derivative Clearing Organization (DCO) to fulfill our initial margin obligations on cleared derivatives. Securities pledged may be sold or repledged if the FHLBNY defaults on its obligations under rules established by the CFTC.
(e)Amounts represented net exposure after applying non-cash collateral pledged to and by the FHLBNY. Since legal ownership and control over the securities are not transferred, the net exposure represented in the table above is for information only and is not reported as such in the Statements of Condition.

39

Table of Contents

Federal Home Loan Bank of New York

Notes to Financial Statements — Unaudited

Note on variation margin — For all cleared derivative contracts that have not matured, “Variation margin” is exchanged between the FHLBNY and the Futures Commission Merchant (FCM), acting as agents on behalf of DCOs. Variation margin is determined by the DCO and fluctuates with the fair values of the open contracts. When the aggregate contract value of open derivatives is “in-the-money” for the FHLBNY (gain position), the FHLBNY would receive variation margin from the DCO. If the value of the open contracts is “out-of-the-money” (liability position), the FHLBNY would post variation margin to the DCO. At June 30, 2023 and December 31, 2022, 0no net of cash as settlement variation margin was posted to FCMs. At December 31, 2021, the FHLBNY posted $7.8 million in cash as settlement variation margin to FCMs. As noted, variation margin is not considered as collateral, rather as the daily settlement amounts of outstanding derivative contracts.

Fair Value of Derivative Instruments

The following tables represent outstanding notional balances and estimated fair values of the derivatives outstanding (in thousands):

June 30, 2022

June 30, 2023

Notional Amount

Derivative

Derivative

Notional Amount

Derivative

Derivative


of Derivatives


Assets


 Liabilities


of Derivatives


Assets


 Liabilities

Fair value of derivative instruments (a)

Derivatives designated as hedging instruments under ASC 815 interest rate swaps

$

119,541,121

$

515,577

$

1,792,366

Derivatives designated as hedging instruments under ASC 815

Interest rate swaps

$

163,225,031

$

1,383,065

$

2,925,386

Total derivatives in hedging relationships under ASC 815


119,541,121

515,577


1,792,366


163,225,031

1,383,065


2,925,386

Derivatives not designated as hedging instruments

Interest rate swaps


20,654,231


160,442


175,958

Interest rate swaps (b)


35,313,341


1,731,578


1,339,554

Interest rate caps


800,000


585


800,000


Mortgage delivery commitments


4,713


25


13


7,616


1,601

Other (b)


123,000


39


1,574

Other


Total derivatives not designated as hedging instruments


21,581,944


161,091


177,545


36,120,957


1,731,578


1,341,155

Total derivatives before netting and collateral adjustments

$

141,123,065

$

676,668

$

1,969,911

$

199,345,988

$

3,114,643

$

4,266,541

Netting adjustments

$

(431,285)

$

(431,285)

$

(2,978,121)

$

(2,978,121)

Cash collateral and related accrued interest

(10,160)

(1,433,048)

(36,920)

(1,264,260)

Total netting adjustments and cash collateral


(441,445)


(1,864,333)


(3,015,041)


(4,242,381)

Total derivative assets and total derivative liabilities

$

235,223

$

105,578

$

99,602

$

24,160

Security collateral pledged as initial margin to Derivative Clearing Organization (c)

$

534,094

$

754,175

Security collateral received from counterparty(c)

(110,587)

(84,198)

Net security

423,507

669,977

Net exposure

$

658,730

$

769,579

4038

Table of Contents

Federal Home Loan Bank of New York

Notes to Financial Statements — Unaudited

December 31, 2021

Notional Amount

Derivative

Derivative


of Derivatives


Assets


 Liabilities

Fair value of derivative instruments (a)

Derivatives designated as hedging instruments under ASC 815 interest rate swaps

$

77,159,117

$

469,953

$

990,925

Total derivatives in hedging relationships under ASC 815


77,159,117

469,953


990,925

Derivatives not designated as hedging instruments

Interest rate swaps


16,873,486


23,014


24,627

Interest rate caps


800,000


136


Mortgage delivery commitments


8,573


14


5

Other (b)


158,000


4,017


871

Total derivatives not designated as hedging instruments


17,840,059


27,181


25,503

Total derivatives before netting and collateral adjustments

$

94,999,176

$

497,134

$

1,016,428

Netting adjustments

$

(192,330)

$

(192,330)

Cash collateral and related accrued interest

(7,300)

(787,586)

Total netting adjustments and cash collateral


(199,630)


(979,916)

Total derivative assets and total derivative liabilities

$

297,504

$

36,512

Security collateral pledged as initial margin to Derivative Clearing Organization (c)

$

367,110

Security collateral received from counterparty(c)

(115,833)

Net security

251,277

Net exposure

$

548,781

December 31, 2022

Notional Amount

Derivative

Derivative


of Derivatives


Assets


 Liabilities

Fair value of derivative instruments (a)

Derivatives designated as hedging instruments under ASC 815 Interest rate swaps

$

123,913,433

$

1,090,359

$

2,745,983

Total derivatives in hedging relationships under ASC 815


123,913,433

1,090,359


2,745,983

Derivatives not designated as hedging instruments

Interest rate swaps (b)


49,319,288


1,126,873


868,103

Interest rate caps


800,000


431


Mortgage delivery commitments


9,837


37


36

Other


Total derivatives not designated as hedging instruments


50,129,125


1,127,341


868,139

Total derivatives before netting and collateral adjustments

$

174,042,558

$

2,217,700

$

3,614,122

Netting adjustments

$

(2,039,759)

$

(2,039,759)

Cash collateral and related accrued interest

(14,020)

(1,559,030)

Total netting adjustments and cash collateral


(2,053,779)


(3,598,789)

Total derivative assets and total derivative liabilities

$

163,921

$

15,333

Security collateral pledged as initial margin to Derivative Clearing Organization (c)

$

576,756

Security collateral received from counterparty (c)

(108,761)

Net security

467,995

Net exposure

$

631,916

(a)All derivative assets and liabilities with swap dealers and counterparties are executed under collateral agreements; derivative instruments executed bilaterally are subject to legal right of offset under master netting agreements.
(b)TheInterest rate swaps also includes the Other category comprised of interest rate swaps intermediated for members, and notional amounts represent purchases by the FHLBNY from dealers and an offsetting purchase from us by the members.
(c)Non-cash security collateral is not permitted to be offset on the balance sheet but would be eligible for offsetting in an event of default. Amounts represent non-cash collateral and or U.S. Treasury securities pledged to and received from counterparties as collateral at June 30, 20222023 and December 31, 2021.2022.

Accounting for Derivative Hedging

The FHLBNY accounts for its hedging activities in accordance with ASC 815, Derivatives and Hedging. As a general rule, hedge accounting is permitted where the FHLBNY is exposed to a particular risk, typically interest-rate risk that causes changes in the fair value of an asset or liability or variability in the expected future cash flows of an existing asset, liability or a forecasted transaction that may affect earnings. Derivative contracts hedging the risks associated with the changes in fair value are referred to as Fair value hedges, while contracts hedging the risks affecting the expected future cash flows are called Cash flow hedges. Derivatives not designated under a qualifying ASC 815 hedge relationship and designated as an asset/liability management hedge are classified as an economic hedge. For more information, see financial statements, Note 1. CriticalSummary of Significant Accounting Policies and Estimates in the most recent Form 10-K for the year ended December 31, 20212022 filed on March 22, 2022.17, 2023.

Fair value hedge gains and losses

Gains and Losses on Fair value hedges under ASC 815 are summarized below (in thousands):

Gains (Losses) on Fair Value Hedges

Recorded in Interest Income/Expense

Three months ended June 30, 

Six months ended June 30, 


2023


2022


2023


2022

Gains (losses) on derivatives in designated and qualifying fair value hedges:

Interest rate hedges

$

271,045

$

93,332

$

189,285

$

275,264

Gains (losses) on hedged item in designated and qualifying fair value hedges:


Interest rate hedges

$

(263,807)

$

(75,666)

$

(182,308)

$

(250,166)

4139

Table of Contents

Federal Home Loan Bank of New York

Notes to Financial Statements — Unaudited

Fair value hedge gains and losses

Gains and Losses on Fair value hedges under ASC 815 are summarized below (in thousands):

Gains (Losses) on Fair Value Hedges

Recorded in Interest Income/Expense

Three months ended June 30,

Six months ended June 30,


2022


2021


2022


2021

Gains (losses) on derivatives in designated and qualifying fair value hedges:

Interest rate hedges

$

93,332

$

838

$

275,264

$

401,791

Gains (losses) on hedged item in designated and qualifying fair value hedges:


Interest rate hedges

$

(75,666)

$

(1,289)

$

(250,166)

$

(397,591)

Gains (losses) represent changes in fair values of derivatives and changes in the fair value of hedged items due to changes in the designated benchmark interest rates, the risk being hedged. Gains and losses on ASC 815 hedges are recorded in the same line in the Statements of Income as the hedged assets and hedged liabilities.

Cumulative Basis Adjustment

Upon electing to apply ASC 815 fair value hedge accounting, the carrying value of the hedged item is adjusted to reflect the cumulative impact of changes in the hedged risk. The hedge basis adjustment, whether arising from an active or de-designated hedge relationship, remains with the hedged item until the hedged item is derecognized from the balance sheet.

The tables below present the carrying amount of FHLBNY’s assets and liabilities under active ASC 815 qualifying fair value hedges at June 30, 20222023 and December 31, 2021,2022, as well as the hedged item’s cumulative hedge basis adjustments, which were included in the carrying value of assets and liabilities in active hedges. The tables also present unamortized cumulative basis adjustments from discontinued hedges where the previously hedged item remains on the FHLBNY’s Statements of Condition (in thousands):


June 30, 2022


June 30, 2023


Cumulative Fair Value Hedging Adjustment


Cumulative Fair Value Hedging Adjustment

 Included in the Carrying Amount of Hedged

 Included in the Carrying Amount of Hedged


Items Gains (Losses)


Items Gains (Losses)

Carrying Amount of

Discontinued

Carrying Amount of

Discontinued

 Hedged

Active Hedging


Hedging

 Hedged

Active Hedging


Hedging


Assets/Liabilities (a)


Relationship


Relationship


Assets/Liabilities (a)


Relationship


Relationship

Assets:


Hedged advances

$

45,017,205

$

(1,043,851)

$

$

60,101,962

$

(1,616,124)

$

Hedged AFS debt securities (a)

3,286,983

(386,473)

5,021,111

(600,419)

De-designated advances (b)

267

$

48,304,188

$

(1,430,324)

$

267

$

65,123,073

$

(2,216,543)

$

Liabilities:


Hedged consolidated obligation bonds

$

35,635,325

$

1,334,064

$

$

46,670,119

$

1,842,731

$

Hedged consolidated obligation discount notes

31,037,555

58,458

47,065,386

35,325

De-designated consolidated obligation bonds (b)

(120,845)

(110,493)

De-designated consolidated obligation discount notes (b)

3

$

66,672,880

$

1,392,522

$

(120,842)

$

93,735,505

$

1,878,056

$

(110,493)

4240

Table of Contents

Federal Home Loan Bank of New York

Notes to Financial Statements — Unaudited


December 31, 2021


Cumulative Fair Value Hedging Adjustment

 Included in the Carrying Amount of Hedged


Items Gains (Losses)

Carrying Amount of

Discontinued

 Hedged

Active Hedging


Hedging


Assets/Liabilities (a)


Relationship


Relationship

Assets:


Hedged advances

$

37,731,410

$

321,057

$

Hedged AFS debt securities (a)

2,892,784

(30,667)

De-designated advances (b)

339

$

40,624,194

$

290,390

$

339

Liabilities:


Hedged consolidated obligation bonds

$

30,158,015

$

(77,048)

$

Hedged consolidated obligation discount notes

3,325,017

424

De-designated consolidated obligation bonds (b)

(125,091)

$

33,483,032

$

(76,624)

$

(125,091)


December 31, 2022


Cumulative Fair Value Hedging Adjustment

 Included in the Carrying Amount of Hedged


Items Gains (Losses)

Carrying Amount of

Discontinued

 Hedged

Active Hedging


Hedging


Assets/Liabilities (a)


Relationship


Relationship

Assets:


Hedged advances

$

42,378,681

$

(1,634,913)

$

Hedged AFS debt securities (a)

3,691,391

(575,104)

De-designated advances (b)

18

$

46,070,072

$

(2,210,017)

$

18

Liabilities:


Hedged consolidated obligation bonds

$

36,962,293

$

2,015,128

$

Hedged consolidated obligation discount notes

47,594,103

39,088

De-designated consolidated obligation bonds (b)

(114,430)

De-designated consolidated obligation discount notes (b)

341

$

84,556,396

$

2,054,216

$

(114,089)

(a)

Carrying amounts represent amortized cost adjusted for cumulative fair value hedging basis. For AFS securities in a fair value partial-term hedge, changes in the fair values due to changes in the benchmark rate were recorded as an adjustment to amortized cost and an offset to interest income from the hedged AFS securities.

(b)

At June 30, 2023, par amounts of de-designated CO bonds were $2.6 billion. AtDecember 31, 2022, par amounts of de-designated advances were $25.80.5 million;billion; par amounts of de-designation CO bonds were $1.31.7 billion; par amounts of de-designated CO discount notes were $8.8 billion. At December 31, 2021, par amounts of de-designated advances were $0.1 billion, and par amount of de-designated CO bonds were $1.41.5 billion. Cumulative fair value hedging adjustments for active and discontinued hedging relationships will remain on the balance sheet until the items are derecognized.derecognized.

Cash flow hedge gains and losses

The following tables present derivative instruments used in cash flow hedge accounting relationships and the gains and losses recorded on such derivatives (in thousands):

Derivative Gains (Losses) Recorded in Income and Other Comprehensive Income/Loss

Derivative Gains (Losses) Recorded in Income and Other Comprehensive Income/Loss

Three months ended June 30,

Three months ended June 30,

2022

2021

2023

2022

Amounts

Amounts

Total

Amounts

Amounts

Total

Amounts

Amounts

Total

Amounts

Amounts

Total

Reclassified from

Reclassified from

Amounts

Change in

Reclassified from

Reclassified from

Amounts

Change in

Reclassified from

Reclassified from

Amounts

Change in

Reclassified from

Reclassified from

Amounts

Change in

AOCI to

AOCI to Other


Recorded in

OCI for

AOCI to

AOCI to Other

Recorded

OCI for

AOCI to

AOCI to Other


Recorded

OCI for

AOCI to

AOCI to Other

Recorded

OCI for


Interest Expense (b)


Income (Loss) (c)

OCI (d)


Period


Interest Expense (b)


Income (Loss) (c)


in OCI (d)


Period


Interest Expense (b)


Income (Loss) (c)

in OCI (d)


Period


Interest Expense (b)


Income (Loss) (c)


in OCI (d)


Period

Interest rate contracts (a)

$

(335)

$

$

43,799

$

44,134

$

(374)

$

$

(17,166)

$

(16,792)

$

(379)

$

$

30,919

$

31,298

$

(335)

$

$

43,799

$

44,134

Derivative Gains (Losses) Recorded in Income and Other Comprehensive Income/Loss

Derivative Gains (Losses) Recorded in Income and Other Comprehensive Income/Loss

Six months ended June 30,

Six months ended June 30,

2022

2021

2023

2022

Amounts

Amounts

Total

Amounts

Amounts

Total

Amounts

Amounts

Total

Amounts

Amounts

Total

Reclassified from

Reclassified from

Amounts

Change in

Reclassified from

Reclassified from

Amounts

Change in

Reclassified from

Reclassified from

Amounts

Change in

Reclassified from

Reclassified from

Amounts

Change in

AOCI to

AOCI to Other

Recorded

OCI for

AOCI to

AOCI to Other

Recorded in

OCI for

AOCI to

AOCI to Other

Recorded

OCI for

AOCI to

AOCI to Other

Recorded

OCI for


Interest Expense (b)


Income (Loss) (c)


in OCI (d)


Period


Interest Expense (b)


Income (Loss) (c)


OCI (d)


Period


Interest Expense (b)


Income (Loss) (c)


in OCI (d)


Period


Interest Expense (b)


Income (Loss) (c)


in OCI (d)


Period

Interest rate contracts (a)

$

(686)

$

$

134,935

$

135,621

$

(741)

$

$

65,328

$

66,069

$

(598)

$

$

4,332

$

4,930

$

(686)

$

$

134,935

$

135,621

(a)Amounts represent cash flow hedges of CO debt hedged with benchmark interest rate swaps indexed to a benchmark rate. Under guidance provided by ASU 2017-12, the FHLBNY includes the gain and loss on the hedging derivatives in the same line in the Statements of Income as the change in cash flows on the hedged item.
(b)Amounts represent amortization of gains (losses) related to closed cash flow hedges of anticipated issuance of CO bonds that were reclassified during the period to interest expense as a yield adjustment. Losses reclassified represent losses in AOCI that

4341

Table of Contents

Federal Home Loan Bank of New York

Notes to Financial Statements — Unaudited

(b)Amounts represent amortization of gains (losses) related to closed cash flow hedges of anticipated issuance of CO bonds that were reclassified during the period to interest expense as a yield adjustment. Losses reclassified represent losses in AOCI that were amortized as an expense to debt interest expense. If debt is held to maturity, losses in AOCI will be relieved through amortization. It is expected that over the next 12 months, $1.21.3 million of the unrecognized losses in AOCI will be recognized as yield adjustments to debt interest expense.
(c)Under guidance provided by ASU 2017-12, hedge ineffectiveness (as defined under ASC 815) is reclassified only if the original transaction would not occur by the end of the specified time period or within a two-month period thereafter. There were 0no amounts that were reclassified into earnings due to discontinuation of cash flow hedges. Reclassification would occur if it became probable that the original forecasted transactions would not occur by the end of the originally specified time period or within a two-month period thereafter.
(d)Amounts represent changes in the fair values of open interest rate swap contracts in cash flow hedges of CO debt, primarily those hedging the rolling issuance of CO discount notes.

Economic Hedges

FHLBNY often uses economic hedges when hedge accounting would be too complex or operationally burdensome. Derivatives that are economic hedges are carried at fair value, with changes in value included in Other income (loss), a line item which is below Net interest income. For hedges that either do not meet the ASC 815 hedging criteria or for which management decides not to apply ASC 815 hedge accounting, the derivative is recorded at fair value on the balance sheet with the associated changes in fair value recorded in earnings, while the “hedged” instrument continues to be carried at amortized cost. Therefore, current earnings are affected by the interest rate shifts and other factors that cause a change in the swap’s value, but for which no offsetting change in value is recorded on the hedged instrument. Economic hedges are an acceptable hedging strategy under the FHLBNY’s risk management program, and the strategies comply with the Finance Agency’s regulatory requirements prohibiting speculative use of derivatives.

Gains and losses on economic hedges are presented below (in thousands):


Gains (Losses) on Economic Hedges


Gains (Losses) on Economic Hedges


Recorded in Other Income (Loss)


Recorded in Other Income (Loss)


Three months ended June 30,

Six months ended June 30,


Three months ended June 30,

Six months ended June 30,


2022


2021


2022


2021


2023

2022


2023


2022

Gains (losses) on derivatives designated in economic hedges

Interest rate hedges

$

48,393

$

3,723

$

117,466

$

(200)

$

83,002

$

48,393

$

51,408

$

117,466

Caps

53

(2)

448

25

(191)

53

(430)

448

Mortgage delivery commitments

(217)

197

(669)

(216)

(2,914)

(217)

(2,887)

(669)

Total gains (losses) on derivatives in economic hedges

$

48,229

$

3,918

$

117,245

$

(391)

$

79,897

$

48,229

$

48,091

$

117,245

4442

Table of Contents

Federal Home Loan Bank of New York

Notes to Financial Statements — Unaudited

Note 18.         Fair Values of Financial Instruments.

Estimated Fair Values — Summary Tables – Carrying values, the estimated fair values and the levels within the fair value hierarchy were as follows (in thousands):

June 30, 2022

June 30, 2023

Estimated Fair Value

Estimated Fair Value

Netting

Netting

Carrying

Adjustment and

Carrying

Adjustment and

Financial Instruments


Value


Total


Level 1


Level 2


Level 3 (a)


Cash Collateral


Value


Total


Level 1


Level 2


Level 3 (a)


Cash Collateral

Assets

Cash and due from banks

$

163,741

$

163,741

$

163,741

$

$

$

$

45,142

$

45,142

$

45,142

$

$

$

Interest-bearing deposits

675,000

674,998

674,998

2,950,000

2,950,042

2,950,042

Securities purchased under agreements to resell


16,745,000


16,745,178


16,745,178


Federal funds sold


8,650,000


8,649,977


8,649,977


15,560,000


15,560,202


15,560,202


Trading securities

7,712,829

7,712,829

7,712,829

5,285,390

5,285,390

5,285,390

Equity Investments

80,547

80,547

80,547

87,845

87,845

87,845

Available-for-sale securities


6,777,748


6,777,748


5,665,334


1,112,414


8,479,909


8,479,909


7,374,163


1,105,746


Held-to-maturity securities


9,104,499


8,944,221


8,716,634


227,587


10,697,606


10,238,489


10,036,529


201,960


Advances


80,062,142


79,982,580


79,982,580


108,573,216


108,687,849


108,687,849


Mortgage loans held-for-portfolio, net


2,175,465


1,999,928


1,999,928


2,138,755


1,875,978


1,875,978


Accrued interest receivable


172,364


172,364


172,364


595,428


595,428


595,428


Derivative assets


235,223


235,223


676,668


(441,445)


99,602


99,602


3,114,643


(3,015,041)

Other financial assets


295


295


295


219


219


219


Liabilities

Deposits


1,491,553


1,491,532


1,491,532


2,926,841


2,925,960


2,925,960


Consolidated obligations

Bonds


57,550,526


56,961,663


56,961,663


101,048,634


100,127,948


100,127,948


Discount notes


49,519,232


49,507,104


49,507,104


57,911,901


57,923,335


57,923,335


Mandatorily redeemable capital stock


8,117


8,117


8,117


7,329


7,329


7,329


Accrued interest payable


176,866


176,866


176,866


619,683


619,683


619,683


Derivative liabilities


105,578


105,578


1,969,911


(1,864,333)


24,160


24,160


4,266,541


(4,242,381)

Other financial liabilities


4543

Table of Contents

Federal Home Loan Bank of New York

Notes to Financial Statements — Unaudited

December 31, 2021

Estimated Fair Value

Netting

Carrying

Adjustment and

Financial Instruments


Value


Total


Level 1


Level 2


Level 3 (a)


Cash Collateral

Assets

Cash and due from banks

$

21,653

$

21,653

$

21,653

$

$

$

Interest-bearing deposits

675,000

675,003

675,003

Securities purchased under agreements to resell


1,200,000


1,200,000


1,200,000


Federal funds sold


7,230,000


7,230,014


7,230,014


Trading securities

5,821,380

5,821,380

5,821,380

Equity Investments


96,124

96,124

96,124

Available-for-sale securities


6,547,421


6,547,421


5,548,784


998,637


Held-to-maturity securities

9,328,665


9,684,274


9,445,219


239,055


Advances

71,536,402


71,595,785


71,595,785


Mortgage loans held-for-portfolio, net

2,319,864


2,369,769


2,369,769


Accrued interest receivable


123,258


123,258


123,258


Derivative assets


297,504


297,504


497,134


(199,630)

Other financial assets


357


357


357


Liabilities

Deposits


1,321,238


1,321,241


1,321,241


Consolidated obligations

Bonds


54,829,401


55,104,747


55,104,747


Discount notes


42,197,259


42,196,648


42,196,648


Mandatorily redeemable capital stock


1,959


1,959


1,959


Accrued interest payable


126,990


126,990


126,990


Derivative liabilities


36,512


36,512


1,016,428


(979,916)

Other financial liabilities


30,368


30,368


30,368


December 31, 2022

Estimated Fair Value

Netting

Carrying

Adjustment and

Financial Instruments


Value


Total


Level 1


Level 2


Level 3 (a)


Cash Collateral

Assets

Cash and due from banks

$

27,420

$

27,420

$

27,420

$

$

$

Interest-bearing deposits

1,750,000

1,750,017

1,750,017

Securities purchased under agreements to resell


4,245,000


4,245,019


4,245,019


Federal funds sold


9,470,000


9,470,068


9,470,068


Trading securities

7,113,419

7,113,419

7,113,419

Equity Investments

81,754

81,754

81,754

Available-for-sale securities


7,088,870


7,088,870


5,979,841


1,109,029


Held-to-maturity securities


9,354,048


8,919,205


8,703,941


215,264


Advances


115,292,876


115,195,748


115,195,748


Mortgage loans held-for-portfolio, net


2,106,969


1,836,785


1,836,785


Accrued interest receivable


437,823


437,823


437,823


Derivative assets


163,921


163,921


2,217,700


(2,053,779)

Other financial assets


Liabilities

Deposits


1,026,937


1,026,925


1,026,925


Consolidated obligations

Bonds


85,497,755


84,409,975


84,409,975


Discount notes


61,792,989


61,799,962


61,799,962


Mandatorily redeemable capital stock


4,578


4,578


4,578


Accrued interest payable


370,456


370,456


370,456


Derivative liabilities


15,333


15,333


3,614,122


(3,598,789)

Other financial liabilities


The fair value amounts recorded on the Statements of Condition or presented in the table above have been determined by the FHLBNY using available market information and our reasonable judgment of appropriate valuation methods.

(a)Level 3 Instruments — The fair values of non-Agency private-label MBS and housing finance agency bonds were estimated by management based on pricing services. Valuations may have required pricing services to use significant inputs that were subjective because of the current lack of significant market activity; the inputs may not be market based and observable.

Fair Value Hierarchy

The FHLBNY records trading securities, equity investments, available-for-sale securities, derivative instruments, and Consolidated obligations and advances elected under the FVO at fair values on a recurring basis. On a non-recurring basis for the FHLBNY, when mortgage loans held-for-portfolio are written down or are foreclosed as Other Real Estate Owned (REO or OREO), they are recorded at the fair values of the real estate collateral supporting the mortgage loans.

The accounting standards under Fair Value Measurement defines fair value, establishes a consistent framework for measuring fair value and requires disclosures about fair value measurements. Fair value is defined as the price that would be received to sell an asset or paid to transfer a liability in an orderly transaction between market participants at the measurement date. Among other things, the standard requires the FHLBNY to maximize the use of observable inputs and minimize the use of unobservable inputs when measuring fair value. The standard specifies a hierarchy of inputs based on whether the inputs are observable or unobservable. Observable inputs reflect market data obtained from independent sources, while unobservable inputs reflect the FHLBNY’s market assumptions.

46

Table of Contents

Federal Home Loan Bank of New York

Notes to Financial Statements — Unaudited

These two types of inputs have created the following fair value hierarchy, and an entity must disclose the level within the fair value hierarchy in which the measurements are classified for all assets and liabilities measured on a recurring or non-recurring basis:

Level 1 Inputs — Quoted prices (unadjusted) for identical assets or liabilities in an active market that the reporting entity can access on the measurement date.
Level 2 Inputs — Inputs other than quoted prices within Level 1 that are observable inputs for the asset or liability, either directly or indirectly. If the asset or liability has a specified (contractual) term, a Level 2 input must be observable for substantially the full term of the asset or liability. Level 2 inputs include the following: (1) quoted prices for similar assets or

44

Table of Contents

Federal Home Loan Bank of New York

Notes to Financial Statements — Unaudited

liabilities in active markets; (2) quoted prices for identical or similar assets or liabilities in markets that are not active; (3) inputs other than quoted prices that are observable for the asset or liability (e.g., interest rates and yield curves that are observable at commonly quoted intervals, and volatilities).
Level 3 Inputs — Inputs that are unobservable and significant to the valuation of the asset or liability.

The inputs are evaluated on an overall level for the fair value measurement to be determined. This overall level is an indication of market observability of the fair value measurement for the asset or liability. Changes in the observability of the valuation inputs may result in a reclassification of certain assets or liabilities. These reclassifications are reported as transfers in/out as of the beginning of the quarter in which the changes occur. There were 0no such transfers in any periods in this report.

The availability of observable inputs can vary from product to product and is affected by a wide variety of factors including, for example, the characteristics peculiar to the transaction. To the extent that valuation is based on models or inputs that are less observable or unobservable in the market, the determination of fair value requires more judgment. Accordingly, the degree of judgment exercised by the FHLBNY in determining fair value is greatest for instruments categorized as Level 3. In certain cases, the inputs used to measure fair value may fall into different levels of the fair value hierarchy. In such cases, for disclosure purposes the level in the fair value hierarchy within which the fair value measurement falls is determined based on the lowest level input that is significant to the fair value measurement in its entirety.

Summary of Valuation Techniques and Primary Inputs

The fair value of a financial instrument that is an asset is defined as the price the FHLBNY would receive to sell the asset in an orderly transaction with market participants. A financial liability’s fair value is defined as the amount that would be paid to transfer the liability to a new obligor, not the amount that would be paid to settle the liability with the creditor. Where available, fair values were based on observable market prices or parameters or derived from such prices or parameters. Where observable prices are not available, valuation models and inputs are utilized. These valuation techniques involve some level of management estimation and judgment, the degree of which is dependent on the price transparency for the instruments or markets and the instruments’ complexity. Because an active secondary market does not exist for a portion of the FHLBNY’s financial instruments, in certain cases, fair values are not subject to precise quantification or verification and may change as economic and market factors and evaluation of those factors change.

For assets and liabilities carried at fair value, the FHLBNY measures fair value using the procedures set out below:

Mortgage-backed securities, including housing finance obligations, classified as available-for-sale — The fair value of such securities is estimated by the FHLBNY using pricing primarily from specialized pricing services. The pricing vendors typically use market multiples derived from a set of comparables, including matrix pricing, and other techniques. The FHLBNY’s valuation technique incorporates prices from up to 3three designated third-party pricing services at June 30, 20222023 and December 31, 2021.2022. The FHLBNY’s base investment pricing methodology establishes a median price for each security using a formula that is based on the number of prices received. If 3three prices are received, the middle price is used; if 2two prices are received, the average of the 2two prices is used; and if 1one price is received, it is used, typically subject to further validation. Vendor prices that are outside of a defined tolerance threshold of the median price are identified as outliers and subject to additional review, including, but not limited to, comparison to prices provided by an additional third-party valuation service, prices for similar securities, and/or non-binding dealer estimates, which are deemed to be reflective of all relevant facts and circumstances that a market participant would consider. Such analysis is also applied in those limited instances where 0no third-party vendor price or only 1one third-party vendor price is available in order to arrive at an estimated fair value.

47

Table of Contents

Federal Home Loan Bank of New York

Notes to Financial Statements — Unaudited

The FHLBNY has also concluded that the pricing vendors use methods that generally employ, but are not limited to benchmark yields, recent trades, dealer estimates, valuation models, benchmarking of like securities, sector groupings, and/or matrix pricing.

Based on the FHLBNY’s review processes, management has concluded that inputs into the pricing models employed by pricing services for the FHLBNY’s investments in GSE securities classified as available-for-sale are market based and observable and are considered to be within Level 2 of the fair value hierarchy.

45

Table of Contents

Federal Home Loan Bank of New York

Notes to Financial Statements — Unaudited

Housing finance agency bonds —The— The fair value of housing finance agency bonds is estimated by management using information primarily from pricing services. Because of the current lack of significant market activity, their fair values were categorized within Level 3 of the fair value hierarchy as inputs into vendor pricing models may not be market based and observable.

Fair values of Mortgage-backed securities deemed impaired — When a PLMBS is deemed to be impaired, it is recorded at fair value. The valuation of PLMBS may require pricing services to use significant inputs that are subjective and are considered by management to be within Level 3 of the fair value hierarchy. This determination was made based on management’s view that the private-label instruments may not have an active market because of the specific vintage of the securities as well as inherent conditions surrounding the trading of private-label MBS, so that the inputs may not be market based and observable. Historically, impairments have been de minimis. The portfolio of PLMBS has declined as the FHLBNY has ceased acquiring PLMBS.

Trading Securities — The FHLBNY classifies trading securities as Level 1 of the fair value hierarchy when we use quoted market prices in active markets to determine the fair value of trading securities, such as U.S. government securities. We classify trading securities as Level 2 of the fair value hierarchy when we use quoted market prices in less active markets to determine the fair value of trading securities.

Equity Investments — The FHLBNY has a grantor trust,trusts, which investsinvest in money market, equity and fixed income and bond funds. Daily net asset values (NAVs) are readily available and investments are redeemable at short notice. NAVs are the fair values of the funds in the grantor trust.trusts. Because of the highly liquid nature of the investments at their NAVs, they are categorized as Level 1 financial instruments under the valuation hierarchy.

Advances elected under the FVO — When the FHLBNY elects the FVO designation for certain advances, the advances are recorded at their fair values in the Statements of Condition. The fair values are computed using standard option valuation models. The most significant inputs to the valuation model are (1) Consolidated obligation debt curve (CO Curve), published by the Office of Finance and available to the public, and (2) Benchmark swap curves and volatilities. Both these inputs are considered to be market based and observable as they can be directly corroborated by market participants.

The CO Curve is the primary input, which is market based and observable. Inputs to apply spreads, which are FHLBNY specific, were not material. Fair values were classified within Level 2 of the valuation hierarchy.

The FHLBNY determines the fair values of advances elected under the FVO by calculating the present value of expected future cash flows from the advances, a methodology also referred to as the Income approach under the Fair Value Measurement standards. The discount rates used in these calculations are equivalent to the replacement advance rates for advances with similar terms. In accordance with the Finance Agency’s “Advances” regulations, an advance with a maturity or repricing period greater than six months requires a prepayment fee sufficient to make a FHLBank financially indifferent to the borrower’s decision to prepay the advance. Therefore, the fair value of an advance does not assume prepayment risk.

The inputs used to determine fair value of advances elected under the FVO are as follows:

CO Curve. The FHLBNY uses the CO Curve, which represents its cost of funds, as an input to estimate the fair value of advances, and to determine current advance rates. This input is considered market observable and therefore a Level 2 input.
Volatility assumption. To estimate the fair value of advances with optionality, the FHLBNY uses market-based expectations of future interest rate volatility implied from current market prices for similar options. This input is considered a Level 2 input as it is market based and market observable.
Spread adjustment. Adjustments represent the FHLBNY’s mark-up based on its pricing strategy. The input is considered as unobservable and is classified as a Level 3 input. The spread adjustment is not a significant input to the overall fair value of an advance.

48

Table of Contents

Federal Home Loan Bank of New York

Notes to Financial Statements — Unaudited

Consolidated Obligations elected under the FVO — The FHLBNY estimates the fair values of Consolidated obligations elected under the FVO based on the present values of expected future cash flows due on the debt obligations. Calculations are performed by using the FHLBNY’s industry standard option adjusted valuation models. The FHLBNY’s internal valuation models use the following inputs:

CO Curve and Benchmark Swap Curves. The Office of Finance constructs an internal curve, referred to as the CO Curve, using the U.S. Treasury Curve as a base curve that is then adjusted by adding indicative spreads obtained from market

46

Table of Contents

Federal Home Loan Bank of New York

Notes to Financial Statements — Unaudited

observable sources. These market indications are generally derived from pricing indications from dealers, historical pricing relationships, recent GSE trades and secondary market activity. The FHLBNY considers the inputs as Level 2 inputs as they are market observable.
Volatility assumptions. To estimate the fair values of Consolidated obligations with optionality, the FHLBNY uses market-based expectations of future interest rate volatility implied from current market prices for similar options. These inputs are also considered Level 2 as they are market based and observable. No CO debt elected under the FVO were structured with options in any periods in this report.

Derivative Assets and Liabilities — The FHLBNY’s derivatives (cleared derivatives and bilaterally executed derivatives) are executed in the over-the-counter market and are valued using internal valuation techniques as no quoted market prices exist for such instruments. Discounted cash flow analysis is the primary methodology employed by the FHLBNY’s valuation models to measure the fair values of interest rate swaps. The valuation technique is considered as an “Income approach”. Interest rate caps and floors are valued under the “Market approach”. Interest rate swaps and interest rate caps and floors, collectively “derivatives”, were valued in industry-standard option adjusted valuation models, which generated fair values. The valuation models employed multiple market inputs including interest rates, prices, and indices to create continuous yield or pricing curves and volatility factors. These multiple market inputs were corroborated by management to independent market data, and to relevant benchmark indices. In addition, derivative valuations were compared by management to counterparty valuations received as part of the collateral exchange process. These derivative positions were classified within Level 2 of the valuation hierarchy at June 30, 20222023 and December 31, 2021.2022.

Starting in mid-October 2020, interest rate swaps cleared by Central Clearing Houses, LCH and the CME, are valued by discounting forward cash flows by the SOFR index, consistent with the change to SOFR in the interest accrual calculation of margins.

The FHLBNY’s valuation model utilizes a modified Black-Karasinski methodology. Significant market based and observable inputs into the valuation model include volatilities and interest rates. The Bank’s valuation model employs industry standard market-observable inputs (inputs that are actively quoted and can be validated to external sources). Inputs by class of derivative were as follows:

Interest-rate related:

SOFR curve (SOFR/OIS).
Federal funds curve (FF/OIS curve).
LIBOR Swap Curve.
Volatility assumption. Market-based expectations of future interest rate volatility implied from current market prices for similar options.
Prepayment assumption (if applicable).
Federal funds curve (FF/OIS curve).
SOFR curve (SOFR/OIS).

Mortgage delivery commitments (considered a derivative) — TBA security prices are adjusted for differences in coupon, average loan rate and seasoning. To be announced (TBA) is the term describing forward-settling MBS trades issued by Freddie Mac, Fannie Mae, and Ginnie Mae trade in the TBA market. The FHLBNY incorporates SOFR and the overnight indexed swap (FF/OIS) curves as fair value measurement inputs for the valuation of its derivatives as the curves reflect the interest rates paid on cash collateral provided against the fair value of these derivatives. The FHLBNY believes using relevant SOFR and the FF/OIS curves as inputs to determine fair value measurements provides a more representative reflection of the fair values of these collateralized interest-rate related derivatives. SOFR and the FF/OIS curves are inputs to the valuation model and are obtained from industry standard pricing vendors; the inputs are available and observable over the entire terms of the interest rate swaps.

49

Table of Contents

Federal Home Loan Bank of New York

Notes to Financial Statements — Unaudited

Management considers the SOFR and the federalFederal funds curve to be Level 2 inputs. The FHLBNY’s valuation model utilizes industry standard OIS methodology. The model generates forecasted cash flows using the contractual cash flows, then discounts the cash flows by SOFR and FF/OIS curve to generate fair values.

Credit risk and credit valuation adjustments

The FHLBNY is subject to credit risk in derivatives transactions due to the potential non-performance of its derivatives counterparties or a Derivatives Clearing Organizations (DCO). To mitigate this risk, the FHLBNY has entered into master netting agreements and

47

Table of Contents

Federal Home Loan Bank of New York

Notes to Financial Statements — Unaudited

credit support agreements with its derivative counterparties for its bilaterally executed derivative contracts that provide for the delivery of collateral at specified levels at least weekly. The computed fair values of the derivatives took into consideration the effects of legally enforceable master netting agreements that allow the FHLBNY to settle positive and negative positions and offset cash collateral with the same counterparty on a net basis. For derivative transactions executed as a cleared derivative, the transactions are fully collateralized in cash and for the most part exchanged and settled daily with the DCO. The FHLBNY has also established the enforceability of offsetting rights incorporated in the agreements for the cleared derivative transactions.

As a result of these practices and agreements and the FHLBNY’s assessment of any change in its own credit spread, the FHLBNY has concluded that the impact of the credit differential between the FHLBNY and its derivative counterparties and DCO was sufficiently mitigated to an immaterial level that 0no credit adjustments were deemed necessary to the recorded fair value of Derivative assets and Derivative liabilities in the Statements of Condition at June 30, 20222023 and December 31, 2021.2022.

For uncleared derivatives transactions executed on or after September 1, 2022, we are subject to two-way initial margin obligations as required by the Wall Street Reform and Consumer Protection Act. For such uncleared derivatives transactions, a party whose initial margin requirement exceeds the $50 million threshold would be required to deliver collateral in the amount by which the initial margin requirement exceeds such specified threshold. Initial margin is required to be held at a third-party custodian for the benefit of the secured party, which can only assert ownership of such collateral upon the occurrence of certain events, which may include an event of default due to bankruptcy, insolvency, or similar proceeding. As of June 30, 2023, the Bank did not exceed the threshold with any of the uncleared derivatives counterparty and did not have to post initial margin or have the counterparty post initial margin to the Bank.

Fair Value Measurement

The tables below present the fair value of those assets and liabilities that are recorded at fair value on a recurring or non-recurring basis at June 30, 20222023 and December 31, 2021,2022, by level within the fair value hierarchy. Certain mortgage loans that were partially charged-off were recorded at their collateral values on a non-recurring basis. OREOREO is measured at fair value when the asset’s fair value less costs to sell is lower than its carrying amount.

5048

Table of Contents

Federal Home Loan Bank of New York

Notes to Financial Statements — Unaudited

Items Measured at Fair Value on a Recurring Basis (in thousands):

June 30, 2022

June 30, 2023

Netting

Netting

Adjustment and

Adjustment and


Total


Level 1


Level 2


Level 3


Cash Collateral


Total


Level 1


Level 2


Level 3


Cash Collateral

Assets

Trading securities

U.S. Treasury securities

$

7,712,829

$

7,712,829

$

$

$

$

5,285,390

$

5,285,390

$

$

$

Equity Investments

80,547

80,547

87,845

87,845

Available-for-sale securities

GSE/U.S. agency issued MBS

5,665,334

5,665,334

7,374,163

7,374,163

State and local housing finance agency obligations

1,112,414

1,112,414

1,105,746

1,105,746

Derivative assets (a)

Interest-rate derivatives

235,198

676,643

(441,445)

99,602

3,114,643

(3,015,041)

Mortgage delivery commitments

25

25

Total recurring fair value measurement - Assets

$

14,806,347

$

7,793,376

$

6,342,002

$

1,112,414

$

(441,445)

$

13,952,746

$

5,373,235

$

10,488,806

$

1,105,746

$

(3,015,041)

Liabilities

Consolidated obligation:

Bonds (to the extent FVO is elected) (b)

$

(3,618,896)

$

$

(3,618,896)

$

$

$

(4,182,576)

$

$

(4,182,576)

$

$

Derivative liabilities (a)

Interest-rate derivatives

(105,565)

(1,969,898)

1,864,333

(22,559)

(4,264,940)

4,242,381

Mortgage delivery commitments

(13)

(13)

(1,601)

(1,601)

Total recurring fair value measurement - Liabilities

$

(3,724,474)

$

$

(5,588,807)

$

$

1,864,333

$

(4,206,736)

$

$

(8,449,117)

$

$

4,242,381

December 31, 2021

December 31, 2022

Netting

Netting

Adjustment and

Adjustment and


Total


Level 1


Level 2


Level 3


Cash Collateral


Total


Level 1


Level 2


Level 3


Cash Collateral

Assets

Trading securities

U.S. Treasury securities

$

5,821,380

$

5,821,380

$

$

$

$

7,113,419

$

7,113,419

$

$

$

Equity Investments

96,124

96,124

81,754

81,754

Available-for-sale securities

GSE/U.S. agency issued MBS

5,548,784

5,548,784

5,979,841

5,979,841

State and local housing finance agency obligations

998,637

998,637

1,109,029

1,109,029

Derivative assets(a)

Interest-rate derivatives

297,490

497,120

(199,630)

163,884

2,217,663

(2,053,779)

Mortgage delivery commitments

14

14

37

37

Total recurring fair value measurement - Assets

$

12,762,429

$

5,917,504

$

6,045,918

$

998,637

$

(199,630)

$

14,447,964

$

7,195,173

$

8,197,541

$

1,109,029

$

(2,053,779)

Liabilities

Consolidated obligation:

Bonds (to the extent FVO is elected) (b)

$

(7,386,074)

$

$

(7,386,074)

$

$

$

(4,159,862)

$

$

(4,159,862)

$

$

Derivative liabilities (a)

Interest-rate derivatives

(36,507)

(1,016,423)

979,916

(15,297)

(3,614,086)

3,598,789

Mortgage delivery commitments

(5)

(5)

(36)

(36)

Total recurring fair value measurement - Liabilities

$

(7,422,586)

$

$

(8,402,502)

$

$

979,916

$

(4,175,195)

$

$

(7,773,984)

$

$

3,598,789

(a)Based on analysis of the nature of the risk, the presentation of derivatives as a single class is appropriate.
(b)Based on analysis of the nature of risks of Consolidated obligation bonds measured at fair value, the FHLBNY has determined that presenting the bonds as a single class is appropriate.

5149

Table of Contents

Federal Home Loan Bank of New York

Notes to Financial Statements — Unaudited

(a)Based on analysis of the nature of the risk, the presentation of derivatives as a single class is appropriate.
(b)Based on analysis of the nature of risks of Consolidated obligation bonds measured at fair value, the FHLBNY has determined that presenting the bonds as a single class is appropriate.

Roll Forward of Level 3 Available-for-Sale Securities (in thousands):

State and Local Housing Finance Agency Obligations

State and Local Housing Finance Agency Obligations

Three Months ended June 30,

Six months ended June 30,

Three months ended June 30,

Six months ended June 30, 


2022

2021


2022


2021


2023


2022


2023


2022

Balance, beginning of the period

$

998,578

$

0

$

998,637

$

0

$

1,109,509

$

998,578

$

1,109,029

$

998,637

Transfer of securities from held-to-maturity to available-for-sale


900,719


900,719


Provision for credit losses

Total gains (losses) included in other comprehensive income

Net unrealized gains (losses)


(359)


(58)


(418)


(58)


(713)


(359)


(233)


(418)

Purchases

308,000

308,000

308,000

308,000

Settlements

(193,805)

(193,805)

(3,050)

(193,805)

(3,050)

(193,805)

Balance, end of the period

$

1,112,414

$

900,661

$

1,112,414

$

900,661

$

1,105,746

$

1,112,414

$

1,105,746

$

1,112,414

Items Measured at Fair Value on a Non-recurring Basis (in(a)(in thousands):

During the period ended June 30, 2022

During the period ended June 30, 2023


Fair Value


Level 1


Level 2


Level 3


Fair Value


Level 1


Level 2


Level 3

Mortgage loans held-for-portfolio

$

189

$

$

189

$

$

$

$

$

Real estate owned

181

181

219

219

Total non-recurring assets at fair value

$

370

$

$

189

$

181

$

219

$

$

$

219

During the period ended December 31, 2021


Fair Value


Level 1


Level 2


Level 3

Mortgage loans held-for-portfolio

$

657

$

$

657

$

Real estate owned


315


315

Total non-recurring assets at fair value


$

972


$


$

657


$

315

(a)

No items at fair value on a non-recurring basis was outstanding during the period ended December 31, 2022.

Mortgage loans and REO — The FHLBNY measuredmeasures and recordedrecords certain impaired mortgage loans and REO (foreclosed properties) on a non-recurring basis. These assets wereare subject to fair value adjustments in certain circumstances at the occurrence of the events during the periods in this report. Impaired loans wereare primarily loans that wereare delinquent for 180 days or more, partially charged-off, with the remaining loans recorded at their collateral values at the dates the loans wereare charged off. Fair value adjustments on the impaired loans and real estate owned assets wereare based primarily on broker price opinions.

In accordance with disclosure provisions, we have reported changes in fair values of such assets as ofvalue are reported the date the fair value adjustments wereare recorded, which is during the period ended June 30, 2022 and December 31, 2021, and reported fair values were not as of the period end dates.date. There were no non-recurring basis at fair value recorded during the period ended December 31, 2022.

Fair Value Option Disclosures

From time to time, the FHLBNY will elect the FVO for advances and Consolidated obligations on an instrument-by-instrument basis with changes in fair value reported in earnings. Customarily, the election is made when either the instruments do not qualify for hedge accounting or may be at risk for not meeting hedge effectiveness requirements; the objective is primarily to mitigate the potential income statement volatility that can arise from economic hedging relationships in which the carrying value of the hedged item is not adjusted for changes in fair value. We may also elect advances under the FVO when analysis indicates that changes in the fair values of the advance would be an offset to fair value volatility of debt elected under the FVO. We may also elect CO bonds under the FVO to achieve asset liability objectives. The FVO election is made at inception of the contracts for advances and debt obligations.

52

Table of Contents

Federal Home Loan Bank of New York

Notes to Financial Statements — Unaudited

For instruments for which the fair value option has been elected, the related contractual interest income, contractual interest expense, the discount amortization on fair value option consolidated obligation discount notes and the premium/discount amortization on fair value option consolidated obligation bonds are recorded as part of net interest income in the Statements of Income. The remaining changes in fair value for instruments for which the fair value option has been elected are recorded as net gains (losses) on financial instruments held under fair value option in the Statements of Income. The change in fair value does not include changes in instrument-specific credit risk. The FHLBNY has determined that 0no adjustments to the fair values of its instruments recorded under the fair value option for instrument-specific credit risk were necessary at June 30, 20222023 and December 31, 2021.2022.

50

Table of Contents

Federal Home Loan Bank of New York

Notes to Financial Statements — Unaudited

As with all advances, when advances are elected under the FVO, they are also fully collateralized through their terms to maturity. We consider our Consolidated obligation debt as high credit-quality, highly rated instruments, and changes in fair values are generally related to changes in interest rates and investor preference, including investor asset allocation strategies. The FHLBNY believes the credit-quality of Consolidated obligation debt has remained stable, and changes in fair value attributable to instrument-specific credit risk, if any, were not material given that the debt elected under the FVO had been issued within the recent past periods, and no adverse changes have been observed in their credit characteristics.

The following tables summarize the activity related to financial instruments for which the FHLBNY elected the fair value option (a)(b) (in thousands):

Three months ended June 30,

Three months ended June 30,


2022


2021


2022


2021


2023


2022


Bonds

Discount Notes


Bonds

Balance, beginning of the period

$

(1,901,147)

$

(15,857,603)

$

$

(2,449,831)

$

(4,206,355)

$

(1,901,147)

New transactions elected for fair value option


(1,750,000)

(6,395,925)


(1,750,000)

Maturities and terminations


8,900,000


1,199,319


Net gains (losses) on financial instruments held under fair value option


36,783

3,536


335


16,676

36,783

Change in accrued interest/unaccreted balance


(4,532)

2,233


214


7,103

(4,532)

Balance, end of the period

$

(3,618,896)

$

(13,347,759)

$

$

(1,249,963)

$

(4,182,576)

$

(3,618,896)

Six months ended June 30,

Six months ended June 30, 

2022


2021

2022


2021

2023


2022


Bonds


Discount Notes


Bonds

Balance, beginning of the period

$

(7,386,074)

$

(16,580,464)

$

$

(7,133,755)

$

(4,159,862)

$

(7,386,074)

New transactions elected for fair value option


(2,010,015)


(11,345,925)


(1,249,392)


(2,010,015)

Maturities and terminations


5,665,000


14,575,000


7,118,211


5,665,000

Net gains (losses) on financial instruments held under fair value option


117,429


1,939


1,994


(22,702)


117,429

Change in accrued interest/unaccreted balance


(5,236)


1,691


12,979


(12)


(5,236)

Balance, end of the period

$

(3,618,896)

$

(13,347,759)

$

$

(1,249,963)

$

(4,182,576)

$

(3,618,896)

(a)No advances elected under the FVO were outstanding at June 30, 2023 and June 30, 2022.

(b)

No discount notes elected under the FVO waswere outstanding at June 30, 2023 and June 30, 2022.

The following tables present the change in fair value included in the Statements of Income for financial instruments for which the fair value option has been elected (a)(b) (in thousands):

Three months ended June 30,

2023

2022

Net Gains

Total Change in Fair

Net Gains

Total Change in Fair

(Losses) Due to

Value Included in

(Losses) Due to

Value Included in

Interest

Changes in Fair

Current Period

Interest

Changes in Fair

Current Period


Expense


Value


Earnings


Expense


Value


Earnings

Consolidated obligation bonds

$

(22,672)

$

16,676

$

(5,996)

$

(11,515)

$

36,783

$

25,268

Six months ended June 30, 

2023

2022

Net Gains

Total Change in Fair

Net Gains

Total Change in Fair

(Losses) Due to

Value Included in

(Losses) Due to

Value Included in

Interest

Changes in Fair

Current Period

Interest

Changes in Fair

Current Period


Expense


Value


Earnings


Expense


Value


Earnings

Consolidated obligation bonds

$

(45,343)

$

(22,702)

$

(68,045)

$

(16,125)

$

117,429

$

101,304

(a)No advances elected under the FVO were outstanding at June 30, 2023 and June 30, 2022.

(b)No discount notes elected under the FVO were outstanding at June 30, 2023 and June 30, 2022.

5351

Table of Contents

Federal Home Loan Bank of New York

Notes to Financial Statements — Unaudited

The following tables present the change in fair value included in the Statements of Income for financial instruments for which the fair value option has been elected (a) (in thousands):

Three months ended June 30,

2022

2021


Net Gains

Total Change in Fair

Net Gains

Total Change in Fair

(Losses) Due to

Value Included in

(Losses) Due to

Value Included in

Changes in Fair

Current Period

Interest

Changes in Fair

Current Period


Interest Expense


Value


Earnings


Expense


Value


Earnings

Consolidated obligation bonds

$

(11,515)

$

36,783

$

25,268

$

(4,353)

$

3,536

$

(817)

Consolidated obligation discount notes

(465)

335

(130)

$

(11,515)

$

36,783

$

25,268

$

(4,818)

$

3,871

$

(947)

Six months ended June 30,

2022

2021


Net Gains

Total Change in Fair

Net Gains

Total Change in Fair

(Losses) Due to

Value Included in

(Losses) Due to

Value Included in

Changes in Fair

Current Period

Interest

Changes in Fair

Current Period


Interest Expense


Value


Earnings


Expense


Value


Earnings

Consolidated obligation bonds

$

(16,125)

$

117,429

$

101,304

$

(9,906)

$

1,939

$

(7,967)

Consolidated obligation discount notes

(3,768)

1,994

(1,774)

$

(16,125)

$

117,429

$

101,304

$

(13,674)

$

3,933

$

(9,741)

(a)No discount notes elected under the FVO was outstanding at June 30, 2022.

The following tables compare the aggregate fair value and aggregate remaining contractual principal balance outstanding of financial instruments for which the fair value option has been elected (a)(c) (in thousands):

June 30, 2023

June 30, 2022


Fair Value

Fair Value Over/(Under)

 Over/(Under)

Aggregate Unpaid

Aggregate Fair

Aggregate Unpaid

Aggregate Unpaid

Aggregate Fair

Aggregate Unpaid

Principal Balance

Value

Principal Balance

Principal Balance

Value

Principal Balance

Consolidated obligation bonds (b)

$

3,747,575

$

3,618,896

$

(128,679)

$

4,373,965

$

4,182,576

$

(191,389)

December 31, 2022

December 31, 2021

Fair Value


Fair Value Over/(Under)


Over/(Under)

Aggregate Unpaid

Aggregate Fair

Aggregate Unpaid

Aggregate Unpaid

Aggregate Fair

Aggregate Unpaid

Principal Balance

Value

Principal Balance

Principal Balance

Value

Principal Balance

Consolidated obligation bonds (b)

$

7,402,560

$

7,386,074

$

(16,486)

$

4,373,965

$

4,159,862

$

(214,103)

June 30, 2022

June 30, 2021

Fair Value


Fair Value Over/(Under)


Over/(Under)

Aggregate Unpaid

Aggregate Fair

Aggregate Unpaid

Aggregate Unpaid

Aggregate Fair

Aggregate Unpaid

Principal Balance

Value

Principal Balance

Principal Balance

Value

Principal Balance

Consolidated obligation bonds (b)

$

13,345,925

$

13,347,759

$

1,834

$

3,747,575

$

3,618,896

$

(128,679)

Consolidated obligation discount notes (c)


1,249,392


1,249,963


571

$

14,595,317

$

14,597,722

$

2,405

(a)Advances – NaNNo advances elected under the FVO were outstanding at June 30, 2022,2023, December 31, 20212022 and June 30, 2021.2022. From time to time, the FHLBNY has elected the FVO for advances on an instrument by instrumentinstrument-by-instrument basis with terms that were primarily short-and intermediate-term.
(b)CO bonds – The FHLBNY has elected the FVO on an instrument-by-instrument basis for CO bonds, primarily fixed-rate, intermediate- and short-term debt; management elects the FVO for such CO bonds when management is not able to assert with

54

Table of Contents

Federal Home Loan Bank of New York

Notes to Financial Statements — Unaudited

confidence that the debt would qualify for hedge accounting as such short-term debt may not remain highly effective hedges through the maturity of the bonds. Management may also elect the FVO of certain other CO bonds to achieve asset liability objectives.
(c)Discount notes - NaNNo discount notes elected under the FVO were outstanding at June 30, 2023, December 31, 2022 and December 31, 2021. DiscountJune 30, 2022. From time to time, discount notes were elected under the FVO because management was not able to assert with confidence that the debt would qualify for hedge accounting as the short-term discount note debt may not remain highly effective hedges through maturity.

Note 19.         Commitments and Contingencies.

Consolidated obligations — The FHLBanks have joint and several liability for all the Consolidated obligations issued on their behalf. Accordingly, should 1one or more of the FHLBanks be unable to repay their participation in the Consolidated obligations, each of the other FHLBanks could be called upon to repay all or part of such obligations, as determined or approved by the Finance Agency. Neither the FHLBNY nor any other FHLBank has ever had to assume or pay the Consolidated obligations of another FHLBank. The FHLBNY does not believe that it will be called upon to pay the Consolidated obligations of another FHLBank in the future. Under the provisions of accounting standards for guarantees, the FHLBNY would have been required to recognize the fair value of the FHLBNY’s joint and several liability for all the Consolidated obligations, as discussed above. However, the FHLBNY considers the joint and several liabilities as similar to a related party guarantee, which meets the scope exception under the accounting standard for guarantees. Accordingly, the FHLBNY has not recognized the fair value of a liability for its joint and several obligations related to other FHLBanks’ Consolidated obligations, which in aggregate were par amounts of $0.9$1.3 trillion as of June 30, 20222023 and $0.7$1.2 trillion as of December 31, 2021.2022.

Affordable Housing Program — The 11 FHLBanks are expected to contribute $100 million in aggregate annually to the AHP. If the aggregate assessment is less than $100 million for all the FHLBanks, each FHLBank would be required to assure that the aggregate contributions of the FHLBanks equal $100 million. The proration would be made on the basis of the FHLBank’s income in relation to the income of all FHLBanks for the previous year. There have been 0no shortfalls in any periods in this report.

52

Table of Contents

Federal Home Loan Bank of New York

Notes to Financial Statements — Unaudited

The following table summarizes contractual obligations and contingencies (in thousands):


June 30, 2022


June 30, 2023

Contractual Obligations

Consolidated obligation bonds at par (a)

$

58,765,810

$

102,894,695

Consolidated obligation discount notes at par

49,705,943

58,569,123

Mandatorily redeemable capital stock (a)


8,117


7,329

Premises (lease obligations) (b)

89,537

81,648

Remote backup site

1,282

562

Other liabilities (c)


140,379


122,505

Total contractual obligations

$

108,711,068

$

161,675,862

Other commitments

Standby letters of credit (d)

$

14,870,138

$

20,615,588

Consolidated obligation bonds/discount notes traded not settled


20,000

Commitments to fund additional advances

343,000

1,185,000

Commitments to fund pension

9,400

12,400

Open delivery commitments (MAP)


4,713


7,616

Total other commitments

$

15,227,251

$

21,840,604

Total obligations and commitments

$

123,938,319

$

183,516,466

(a)Callable bonds contain an exercise date or a series of exercise dates that may result in a shorter redemption period. Redemption dates of mandatorily redeemable capital stock are assumed to correspond to maturity dates of member advances. Excess capital stock is redeemed at that time, and hence, these dates better represent the related commitments than the put dates associated with capital stock. While interest payments on CO bonds and discount notes are contractual obligations, they are deemed to be not material and, therefore, amounts were omitted from the table.

55

Table of Contents

Federal Home Loan Bank of New York

Notes to Financial Statements — Unaudited

(b)Amounts represent undiscounted obligations. Lease obligations are recorded in the Statements of Condition as a Right-of-use (ROU) asset and a corresponding lease liability. Immaterial amounts of equipment and other leases have been excluded in the table above.
(c)Includes accounts payable and accrued expenses, liabilities recorded for future settlements of investments, Pass-through reserves due to member institutions held at the FRB, and projected payment obligations for pension plans. Where it was not possible to estimate the exact timing of payment obligations, they were assumed to be due within one year; amounts were not material. For more information about employee retirement plans in general, see Note 16. Employee Retirement Plans.
(d)Financial letters of credit - Standby letters of credit are executed for a fee on behalf of members to facilitate residential housing, community lending, and members’ asset/liability management or to provide liquidity. A standby letter of credit is a financing arrangement between the FHLBNY and its member. Members assume an unconditional obligation to reimburse the FHLBNY for value given by the FHLBNY to the beneficiary under the terms of the standby letter of credit. The FHLBNY may, in its discretion, permit the member to finance repayment of their obligation by receiving a collateralized advance.

The Bank did not record credit losses on off-balance sheet arrangements for any periods in this report.

Operating Lease Commitments

In compliance with the guidance under ASU 2016-02, Leases (Topic 842), we recognize in our Statements of Condition all leases with lease terms greater than twelve months as a lease liability with a corresponding right-of-use (ROU) asset.

At June 30, 20222023 and December 31, 2021,2022, the FHLBNY was obligated under a number of noncancelable leases, predominantly operating leases for premises. These leases generally have terms of 15 years or less that contain escalation clauses that will increase rental payments. Operating leases also include backup datacenters and certain office equipment. Operating lease liabilities and ROU are recognized at the lease commencement date based on the present value of the future minimum lease payments over the lease term. The future lease payments are discounted at a rate that represents the FHLBNY’s borrowing rate for its own debt (Consolidated obligation bonds) of a similar term. ROU includes any lease prepayments made, plus any initial direct costs incurred, less any lease incentives received. Rental expense associated with operating leases is recognized on a straight-line basis over the lease term. Premise rental expense is included in occupancy expense, and datacenter and other lease expenses are included in other operating expense in the Statements of Income. ROU and lease liabilities are reported in the Statements of Condition.

The following tables provide summarized information on our leases (dollars in thousands):


June 30, 2022


December 31, 2021

Operating Leases (a)

Right-of-use assets

$

63,003

$

65,624

Lease Liabilities

$

76,212

$

79,026


Three months ended June 30,

Six months ended June 30,


2022

2021


2022


2021

Operating Lease Expense

$

1,952


$

1,952

$

3,904

$

3,904

Operating cash flows - Cash Paid

$

2,049

$

2,037

$

4,098

$

4,073


June 30, 2022


December 31, 2021


Weighted Average Discount Rate

3.31

%

3.30

%


Weighted Average Remaining Lease Term

10.60

Years

11.06

Years


5653

Table of Contents

Federal Home Loan Bank of New York

Notes to Financial Statements — Unaudited

Remaining maturities through

Operating lease liabilities


June 30, 2022


December 31, 2021

Remainder of 2022

$

4,148

$

8,246

2023

8,615

8,615

2024

8,297

8,297

2025

8,088

8,088

2026

8,142

8,142

Thereafter

53,656

53,656

Total undiscounted lease payments

90,946

95,044

Imputed interest

(14,734)

(16,018)

Total operating lease liabilities

$

76,212

$

79,026

The following tables provide summarized information on our leases (dollars in thousands):


June 30, 2023


December 31, 2022

Operating Leases (a)

Right-of-use assets

$

57,625

$

60,338

Lease Liabilities

$

70,188

$

73,304


Three months ended June 30,

Six months ended June 30, 


2023

2022


2023


2022

Operating Lease Expense

$

1,952


$

1,952

$

3,904

$

3,904

Operating cash flows - Cash Paid

$

2,153

$

2,049

$

4,307

$

4,098


June 30, 2023


December 31, 2022


Weighted Average Discount Rate

3.31

%  

3.31

%


Weighted Average Remaining Lease Term

9.67

Years

10.13

Years


(a)We have elected to exclude immaterial amounts of short-term operating lease liabilities in the Right-of-use assets and lease liabilities.

Remaining maturities through

Operating lease liabilities


June 30, 2023


December 31, 2022

Remainder of 2023

$

4,309

$

8,615

2024

8,297

8,297

2025

8,088

8,088

2026

8,142

8,142

2027

8,246

8,246

Thereafter

45,410

45,410

Total undiscounted lease payments

82,492

86,798

Imputed interest

(12,304)

(13,494)

Total operating lease liabilities

$

70,188

$

73,304

Note 20.         Related Party Transactions.

The FHLBNY is a cooperative and the members own almost all of the stock of the FHLBNY. Stock issued and outstanding that is not owned by members is held by former members. The majority of the members of the Board of Directors of the FHLBNY are elected by and from the membership. The FHLBNY conducts its advances business almost exclusively with members, and considers its transactions with its members and non-member stockholders as related party transactions in addition to transactions with other FHLBanks, the Office of Finance, and the Finance Agency. The FHLBNY conducts all transactions with members and non-members in the ordinary course of business. All transactions with all members, including those whose officers may serve as directors of the FHLBNY, are at terms that are no more favorable than comparable transactions with other members. The FHLBNY may from time to time borrow or sell overnight and term federal funds at market rates to members.

Debt Assumptions and Transfers. When debt is transferred or assumed, the transactions would be executed in the ordinary course of the FHLBNY’s business and at negotiated market pricing.

Debt assumptionsNaN debt wasIn June 2023, the FHLBNY assumed discount notes in par amount of $6.1 billion from another FHLBank. No discount notes were assumed from another FHLBank in the six months ended June 30, 2022. In February 2021, the FHLBNYNo CO Bonds were assumed $171.2 million of debt (par amounts) from another FHLBank.FHLBank in the six month ended June 30, 2023 and in the same period in the prior year.

Debt transfersNaNNo debt was transferred to another FHLBank in the six months ended June 30, 20222023 and in the same period in 2021.June 30, 2022.

54

Table of Contents

Federal Home Loan Bank of New York

Notes to Financial Statements — Unaudited

Advances Sold or Transferred

NaNNo advances were transferred or sold to the FHLBNY or from the FHLBNY to another FHLBank in any periods in this report. When an advance is transferred or assumed, the transactions would be executed in the ordinary course of the FHLBNY’s business and at negotiated market pricing.

MPF Program

In the MPF program, the FHLBNY may participate to the FHLBank of Chicago portions of its purchases of mortgage loans from its members. Transactions are participated at market rates. Since 2004, the FHLBNY has not shared its purchases with the FHLBank of Chicago. From the inception of the program through 2004, the cumulative share of MPF Chicago’s participation in the FHLBNY’s MPF loans that has remained outstanding was $4.2$3.4 million at June 30, 20222023 and $4.6$3.8 million at December 31, 2021.2022.

Fees paid to the FHLBank of Chicago for providing MPF program services were approximately $0.3 million and $0.7$0.6 million for the three and six months ended June 30, 2022,2023, compared to $0.4$0.3 million and $1.0$0.7 million for the same periods in the prior year.

Mortgage-backed Securities

NaNNo mortgage-backed securities were acquired from other FHLBanks during the periods in this report.

57

Table of Contents

Federal Home Loan Bank of New York

Notes to Financial Statements — Unaudited

Intermediation

From time to time, the FHLBNY acts as an intermediary to purchase derivatives to accommodate its smaller members. At June 30, 20222023 and December 31, 2021,2022, outstanding notional amounts were $61.5$20.5 million and $79.0$33.0 million, representing derivative contracts in which the FHLBNY acted as an intermediary to execute derivative contracts with members. Separately, the contracts were offset with contracts purchased from unrelated derivatives dealers. Net fair value exposures of these transactions were not significant. The intermediated derivative transactions with members and derivative counterparties were collateralized.

Loans to Other Federal Home Loan Banks

There were $1.8 billion and $2.0$0.5 billion overnight loans extended to other FHLBanks in the three and six months ended June 30, 20222023 compared to $0.3 billion and $0.3$2.0 billion in the same periods in the prior year. In the three and six months ended June 30, 2022, overnight loans extended to other FHLBanks averaged $27.5 million and $15.2 million compared to $3.3 million and $1.7 million in the same periodsperiod in the prior year. Generally, loans made to other FHLBanks are uncollateralized. Interest income from such loans was immaterial in the periods in this report.

Borrowings from Other Federal Home Loan Banks

The FHLBNY borrows from other FHLBanks, generally for a period of one day. In the six months ended June 30, 2023, the FHLBNY borrowed a total of $5.3 billion in overnight loans from other FHLBanks. There were 0no borrowings from other FHLBanks in the three and six months ended June 30, 2022 and June 30, 2021.2022. Interest expense was immaterial.

Sub-lease of Office Space to Another Federal Home Loan Bank

The FHLBNY is a lessor of shared office space to another FHLBank for a term through August 2028 at an estimated $0.1 million in annual lease receipts.

Cash and Due from Banks

At June 30, 2022 and December 31, 2021, there was 0The compensating cash balances held at Citibank.Citibank was $15.0 million at June 30, 2023. There was no compensating cash balances at December 31, 2022. Citibank is a member and stockholder of the FHLBNY. For more information, see Note 3. Cash and Due from Banks.

The following tables summarize significant balances and transactions with related parties and transactions (in thousands):

Related Party: Outstanding Assets, Liabilities and Capital

June 30, 2022

December 31, 2021


Related


Related

Assets

Advances

$

80,062,142

$

71,536,402

Accrued interest receivable


103,869


69,852

Liabilities and capital

Deposits

$

1,491,553

$

1,321,238

Mandatorily redeemable capital stock


8,117


1,959

Accrued interest payable


753


23

Affordable Housing Program (a)

131,783

137,638

Other liabilities (b)


30,368

Capital

$

6,762,867

$

6,445,853

(a)Represents funds not yet allocated or disbursed to AHP programs.
(b)Includes member pass-through reserves at the Federal Reserve Bank of New York.

5855

Table of Contents

Federal Home Loan Bank of New York

Notes to Financial Statements — Unaudited

The following tables summarize significant balances and transactions with related parties and transactions (in thousands):

Related Party: Outstanding Assets, Liabilities and Capital

June 30, 2023

December 31, 2022


Related


Related

Assets

Advances

$

108,573,216

$

115,292,876

Accrued interest receivable


503,257


352,578

Liabilities and capital

Deposits

$

2,926,841

$

1,026,937

Mandatorily redeemable capital stock


7,329


4,578

Accrued interest payable


127


82

Affordable Housing Program (a)

158,749

131,394

Capital

$

8,517,617

$

8,347,383

(a)Represents funds not yet allocated or disbursed to AHP programs.

Related Party: Income and Expense Transactions

Three months ended June 30, 

Six months ended June 30,

Three months ended June 30,

Six months ended June 30,

2022

2021

2022

2021

2023

2022

2023

2022


Related


Related


Related


Related


Related


Related


Related


Related

Interest income

Advances

$

236,103

$

123,567

$

348,857

$

263,395

$

1,653,311

$

236,103

$

3,057,864

$

348,857

Interest-bearing deposits

1

1

3

1

7

1

Loans to other FHLBanks

71

1

72


1

71

71

71


72

Interest expense

Deposits

$

1,654

$

69

$

1,826

$

175

$

32,380

$

1,654

$

44,918

$

1,826

Mandatorily redeemable capital stock

765

28

891


62

130

765

243


891

Cash collateral held and other borrowings

282

1,521

Service fees and other

$

3,667

$

4,539

$

8,140

$

8,737

$

5,421

$

3,667

$

10,444

$

8,140

Note 21.         Segment Information and Concentration.

The FHLBNY manages its operations as a single business segment. Management and the FHLBNY’s Board of Directors review enterprise-wide financial information in order to make operating decisions and assess performance. Advances to large members constitute a significant percentage of the FHLBNY’s advance portfolio and its source of revenues.

The FHLBNY’s total assets and capital could significantly decrease if 1one or more large members were to withdraw from membership or decrease business with the FHLBNY. Members might withdraw or reduce their business as a result of consolidating with an institution that was a member of another FHLBank, or for other reasons. The FHLBNY has considered the impact of losing one or more large members. In general, a withdrawing member would be required to repay all indebtedness prior to the redemption of its capital stock. Under current conditions, the FHLBNY does not expect the loss of a large member to impair its operations, since the FHLBank Act, as amended, does not allow the FHLBNY to redeem the capital of an existing member if the redemption would cause the FHLBNY to fall below its capital requirements. Consequently, the loss of a large member should not result in an inadequate capital position for the FHLBNY. However, such an event could reduce the amount of capital that the FHLBNY has available for continued growth. This could have various ramifications for the FHLBNY, including a possible reduction in net income and dividends, and a lower return on capital stock for remaining members.

5956

Table of Contents

Federal Home Loan Bank of New York

Notes to Financial Statements — Unaudited

The top 10ten advance holders and associated interest income for the periods then ended are summarized as follows (dollars in thousands):

June 30, 2022

June 30, 2023

Percentage of

Percentage of

Par

Total Par Value

Three Months

Six Months

Par

Total Par Value

Three Months

Six Months


City


State


Advances


of Advances


Interest Income


Percentage (a)


Interest Income


Percentage (a)


City


State


Advances


of Advances


Interest Income


Percentage (a)


Interest Income


Percentage (a)

Citibank, N.A.

New York

NY

$

17,500,000

15.88

%  

$

239,822

24.37

%  

$

445,031

24.58

%

MetLife, Inc.:

Metropolitan Life Insurance Company


New York


NY

$

14,595,000

18.00

%  

$

46,828

22.51

%

 $

86,684

24.21

%


New York


NY

13,735,000

12.46

117,113

11.90

220,984

12.21

Metropolitan Tower Life Insurance Company

New York

NY

1,405,000

1.73

4,217

2.03

6,457

1.80

New York

NY

1,555,000

1.41

13,522

1.38

25,304

1.40

Subtotal MetLife, Inc.

16,000,000

19.73

51,045

24.54

93,141

26.01

15,290,000

13.87

130,635

13.28

246,288

13.61

New York Community Bank (b)


Hicksville


NY

12,850,000

15.84

51,864

24.94

102,808

28.71

Citibank, N.A.

New York

NY

9,250,000

11.40

16,575

7.97

25,635

7.16

Teachers Ins. & Annuity Assoc. of America

New York

NY

7,781,383

9.59

28,023

13.47

34,737

9.70

Flagstar Bank, N.A. (b)

Hicksville

NY

12,250,000

11.12

130,734

13.28

282,638

15.61

Equitable Financial Life Insurance Company

New York

NY

7,282,563

8.98

22,461

10.80

35,378

9.88

New York

NY

8,875,263

8.05

104,292

10.60

194,818

10.76

ESL Federal Credit Union

Rochester

NY

2,514,166

3.10

5,100

2.45

7,371

2.06

Goldman Sachs Bank USA

New York

NY

2,500,000

3.08

6,446

3.10

7,876

2.20

Manufacturers and Traders Trust Company


Buffalo


NY


7,500,164

6.81

92,408

9.39


148,752

8.22

Teachers Ins. & Annuity Assoc of America

New York

NY

6,344,800

5.76

57,509

5.84

120,671

6.67

Signature Bridge Bank, N.A.

New York

NY

4,683,738

4.25

121,131

12.31

180,718

9.98

New York Life Insurance Company


New York


NY


2,430,000

3.00

13,930

6.70


27,564

7.70

New York

NY

2,875,500

2.61

24,626

2.50

49,865

2.75

Valley National Bank(b)

Wayne

NJ

2,168,014

2.67

6,190

2.98

10,702

2.99

Wayne

NJ

2,688,000

2.44

62,214

6.32

100,214

5.54

Signature Bank

New York

NY

1,574,517

1.94

6,339

3.05

12,840

3.59

Prudential Insurance Company of America


Newark


NJ


2,619,250

2.38


20,792

2.11


41,355

2.28

Total

$

64,350,643

79.33

%

$

207,973

100.00

%

$

358,052

100.00

%

$

80,626,715

73.17

%  

$

984,163

100.00

%  

$

1,810,350

100.00

%

(a)Interest income percentage is the member’s interest income from advances as a percentage of the top 10 members.
(b)An officer of this member bank joinedthese members served on the Board of Directors of the FHLBNY as a Member Director on January 1, 2022.Director.

December 31, 2021

December 31, 2022

Percentage of

Percentage of

Par

Total Par Value

Twelve Months

Par

Total Par Value

Twelve Months


City


State


Advances


of Advances


Interest Income


Percentage (a)


City


State


Advances


of Advances


Interest Income


Percentage (a)

Citibank, N.A.

New York

NY

$

19,250,000

16.46

%

$

332,309

24.51

%

Flagstar Bank, N.A. (b)(c)

Hicksville

NY

15,775,000

13.49

244,568

18.04

MetLife, Inc.:

Metropolitan Life Insurance Company

New York

NY

$

14,745,000

20.70

%  

$

156,632

24.03

%

New York

NY

13,535,000

11.58

253,973

18.73

Metropolitan Tower Life Insurance Company

New York

NY

1,005,000

1.41

5,374

0.83

New York

NY

1,405,000

1.20

21,673

1.60

Subtotal MetLife, Inc.

15,750,000

22.11

162,006

24.86

14,940,000

12.78

275,646

20.33

New York Community Bank


Hicksville


NY


15,105,000

21.21

207,738


31.87

Signature Bank


New York


NY


11,283,738

9.65

61,762


4.56

Equitable Financial Life Insurance Company

New York

NY

6,642,717

9.33

59,209

9.08

New York

NY

8,501,263

7.27

155,524

11.47

Citibank, N.A.


New York


NY

5,250,000

7.37

71,312

10.94

Investors Bank (b)

Short Hills

NJ

3,075,000

4.32

30,135

4.62

Signature Bank

New York

NY

2,639,245

3.71

28,419

4.36

Teachers Ins. & Annuity Assoc. of America


New York


NY

7,084,800

6.06

127,885

9.43

New York Life Insurance Company


New York


NY


2,455,000

3.45

54,063


8.30

New York

NY

3,638,000

3.11

64,737

4.78

Manufacturers and Traders Trust Company

Buffalo

NY

3,200,169

2.74

12,657

0.93

Prudential Insurance Company of America

Newark

NJ

2,619,250

2.24

36,766

2.71

ESL Federal Credit Union


Rochester


NY


2,189,398

3.07

7,890


1.21


Rochester


NY


2,561,931

2.19

43,941


3.24

Teachers Ins. & Annuity Assoc. of America

New York

NY

2,155,300

3.03

5,973

0.92

Valley National Bank (b)


Wayne


NJ


1,288,000

1.81

25,028


3.84

Total

$

56,549,660


79.41

%  

$

651,773


100.00

%

$

88,854,151


75.99

%  

$

1,355,795


100.00

%

(a)

Interest income percentage is the member’s interest income from advances as a percentage of the top 10 members.

(b)

At December 31, 2021, anAn officer of this member bank also served on the Board of Directors of the FHLBNY as a Member Director.

(c)

Non-Member institution Flagstar Bank, FSB merged into FHLBNY member New York Community Bank, on December 1, 2022. Surviving entity renamed Flagstar Bank, N.A. as a member of the FHLBNY.

6057

Table of Contents

Federal Home Loan Bank of New York

Notes to Financial Statements — Unaudited

June 30, 2021

June 30, 2022

Percentage of

Percentage of

Par

Total Par Value

Three Months

Six Months

Par

Total Par Value

Three Months

Six Months


City


State


Advances


of Advances


Interest Income


Percentage (a)


Interest Income


Percentage (a)


City


State


Advances


of Advances


Interest Income


Percentage (a)


Interest Income


Percentage (a)

MetLife, Inc.:

Metropolitan Life Insurance Company


New York


NY

$

15,245,000

19.25

%  

$

38,698

22.45

%

$

77,950

22.11

%


New York


NY

$

14,595,000

18.00

%  

$

46,828

22.51

%  

$

86,684

24.21

%

Metropolitan Tower Life Insurance Company

New York

NY

955,000

1.21

1,214

0.70

2,452

0.70

New York

NY

1,405,000

1.73

4,217

2.03

6,457

1.80

Subtotal MetLife, Inc.

16,200,000

20.46

39,912

23.15

80,402

22.81

16,000,000

19.73

51,045

24.54

93,141

26.01

New York Community Bank(b)


Westbury


NY

14,002,661

17.68

51,949

30.13

104,744

29.71


Hicksville


NY

12,850,000

15.84

51,864

24.94

102,808

28.71

Citibank, N.A.

New York

NY

11,500,000

14.52

21,147

12.27

45,313

12.86


New York


NY

9,250,000

11.40

16,575

7.97

25,635

7.16

Teachers Ins. & Annuity Assoc. of America

New York

NY

7,781,383

9.59

28,023

13.47

34,737

9.70

Equitable Financial Life Insurance Company

New York

NY

8,218,115

10.37

16,455

9.54

32,246

9.15

New York

NY

7,282,563

8.98

22,461

10.80

35,378

9.88

Investors Bank (b)

Short Hills

NJ

3,575,000

4.51

8,631

5.01

16,789

4.76

ESL Federal Credit Union

Rochester

NY

2,514,166

3.10

5,100

2.45

7,371

2.06

Goldman Sachs Bank USA

New York

NY

2,500,000

3.08

6,446

3.10

7,876

2.20

New York Life Insurance Company

New York

NY

2,430,000

3.00

13,930

6.70

27,564

7.70

Valley National Bank (b)

Wayne

NJ

2,168,014

2.67

6,190

2.98

10,702

2.99

Signature Bank

New York

NY

2,764,245

3.49

7,316

4.24

14,878

4.22

New York

NY

1,574,517

1.94

6,339

3.05

12,840

3.59

New York Life Insurance Company

New York

NY

2,325,000

2.94

13,464

7.81

27,545

7.81

HSBC Bank USA, National Association

New York

NY


2,000,000

2.52


4,642

2.69


12,388

3.51

Valley National Bank (b)

Wayne


NJ

1,645,870

2.08

7,563

4.39

16,376

4.65

Goldman Sachs Bank USA

New York

NY

1,600,000

2.02

1,321

0.77

1,839

0.52

Total

$

63,830,891


80.59

%  

$

172,400

100.00

%

$

352,520

100.00

%

$

64,350,643


79.33

%  

$

207,973

100.00

%  

$

358,052

100.00

%

(a)Interest income percentage is the member’s interest income from advances as a percentage of the top 10 members.
(b)At June 30, 2021, anAn officer of this member bank also served onjoined the Board of Directors of the FHLBNY.FHLBNY as a Member Director.

6158

Table of Contents

Item 2.    Management’s Discussion and Analysis of Financial Condition and Results of Operations.

Forward-Looking Statements

Statements contained in this Quarterly Report on Form 10-Q, including statements describing the objectives, projections, estimates, or predictions of the Federal Home Loan Bank of New York (“we” “us,” “our,” “the Bank” or the “FHLBNY”) may be “forward-looking statements” within the meaning of Section 27A of the Securities Act of 1933 and Section 21E of the Securities Exchange Act of 1934. These statements may use forward-looking terminology, such as “anticipates,” “believes,” “could,” “estimates,” “may,” “should,” “will,” or other variations on these terms or their negatives. The Bank cautions that, by their nature, forward-looking statements are subject to a number of risks or uncertainties, including the Risk Factors set forth in Part 1, Item 1A of our Annual Report on Form 10-K for the fiscal year ended December 31, 2021,2022, filed with the SEC on March 22, 202217, 2023 (the “2021“2022 Annual Report”), and the risks set forth below, and that actual results could differ materially from those expressed or implied in these forward-looking statements. As a result, you are cautioned not to place undue reliance on such statements. These forward-looking statements speak only as of the date they were made, and the Bank does not undertake to update any forward-looking statement herein. Forward-looking statements include, among others, the following:

the Bank’s projections regarding income, retained earnings, dividend payouts, and the repurchase of excess capital stock;
the Bank’s statements related to gains and losses on derivatives, future credit and impairment charges, and future classification of securities;
the Bank’s expectations relating to future balance sheet growth;
the LIBOR interest rate transition to other alternatives;
the Bank’s targets under the Bank’s retained earnings plan;
the Bank’s expectations regarding the size of its mortgage loan portfolio, particularly as compared to prior periods; and
the Bank’s statements related to reform legislation, including, without limitation, housing or government-sponsored enterprise or COVID-19 pandemic legislation.

Actual results may differ from forward-looking statements for many reasons, including, but not limited to, the risk factors set forth in Part I, Item 1A – Risk Factors of our 20212022 Annual Report, and the risks set forth below:

changes in economic and market conditions, including the evolving risks relating to the current coronavirus pandemic;March 2023 U.S. banking sector liquidity crisis;
changes in demand for Bank advances and other products resulting from changes in members’ and FDIC deposit flows and members’ credit demands or otherwise;
an increase in advance prepayments as a result of changes in interest rates (including negative interest rates) or other factors;
the volatility of market prices, rates, and indices that could affect the value of collateral held by the Bank as security for obligations of Bank members and counterparties to interest rate exchange agreements and similar agreements;
political events, including legislative developments that affect the Bank, its members, counterparties, and/or investors in the Consolidated obligations (“COs”) of the FHLBanks;
competitive forces including, without limitation, other sources of funding available to Bank members, other entities borrowing funds in the capital markets, and the ability to attract and retain skilled employees;
the pace of technological change and the ability of the Bank to develop and support technology and information systems, including the internet, sufficient to manage the risks of the Bank’s business effectively;
changes in investor demand for COs and/or the terms of interest rate exchange agreements and similar agreements;
timing and volume of market activity;
ability to introduce new or adequately adapt current Bank products and services and successfully manage the risks associated with those products and services, including new types of collateral used to secure advances;
risk of loss arising from litigation filed against one or more of the FHLBanks;
realization of losses arising from the Bank’s joint and several liability on COs;
risk of loss due to fluctuations in the housing market;
inflation or deflation;
issues and events within the FHLBank System and in the political arena that may lead to legislative, regulatory, judicial, or other developments that may affect the marketability of the COs, the Bank’s financial obligations with respect to COs, and the Bank’s ability to access the capital markets;
the availability of derivative financial instruments of the types and in the quantities needed for risk management purposes from acceptable counterparties;

6259

Table of Contents

significant business disruptions resulting from natural or other disasters (including, but not limited to, health emergencies such as pandemics or epidemics, including the current coronavirus pandemic)epidemics), acts of war (including, but not limited to, the war between Ukraine and Russia) or terrorism;
the effect of new accounting standards, including the development of supporting systems;
membership changes, including changes resulting from mergers or changes in the principal place of business of Bank members;
the soundness of other financial institutions, including Bank members, nonmember borrowers, other counterparties, and the other FHLBanks; and
the willingness of the Bank’s members to do business with the Bank whether or not the Bank is paying dividends or repurchasing excess capital stock.

Risks and other factors could cause actual results of the Bank to differ materially from those implied by any forward-looking statements. These risk factors are not exhaustive. The Bank operates in changing economic, legislative and regulatory environments, and new risk factors will emerge from time to time. Management cannot predict such new risk factors nor can it assess the impact, if any, of such new risk factors on the business of the Bank or the extent to which any factor, or combination of factors, may cause actual results to differ materially from those implied by any forward-looking statements.

6360

Table of Contents

Organization of Management’s Discussion and Analysis (MD&A).

This MD&A is designed to provide information that will assist the readers in better understanding the FHLBNY’s financial statements, the changes in key items in the Bank’s financial statements from period to period and the primary factors driving those changes as well as how accounting principles affect the FHLBNY’s financial statements. The MD&A is organized as follows:


Page

Executive Overview

6562

Second Quarter 20222023 Financial Results

6562

Financial Condition

66

Other Developments

6863

Financial Condition

7168

Advances

7471

Investments

7976

Mortgage Loans Held-for-Portfolio, Net

8481

Debt Financing Activity and Consolidated Obligations

8683

Stockholders’ Capital

9188

Derivative Instruments and Hedging Activities

9390

Liquidity, Cash Flows, Short-Term Borrowings and Short-Term Debt

9592

Results of Operations

9896

Net Income

9996

Net Interest Income, Interest Rate Margin and Interest Rate Spreads

10098

Interest Income

106103

Interest Expense

109106

Analysis of Non-Interest Income (Loss)

110107

Operating Expenses, Compensation and Benefits, and Other Expenses

112109

Assessments

112110

Legislative and Regulatory Developments

114111

6461

Table of Contents

Executive Overview

This overview of management’s discussion and analysis highlights selected information and may not contain all of the information that is important to readers of this Form 10-Q. For a more complete understanding of events, trends and uncertainties, as well as the liquidity, capital, credit and market risks, and critical accounting estimates, affecting the Federal Home Loan Bank of New York (FHLBNY or Bank), this Form 10-Q should be read in its entirety and in conjunction with the Bank’s most recent 20212022 Form 10-K filed on March 22, 2022.17, 2023.

Cooperative business model. As a cooperative, we seek to maintain a balance between our public policy mission and our ability to provide adequate returns on the capital supplied by our members. We achieve this balance by delivering low-cost financing to members to help them meet the credit needs of their communities and by paying a dividend on members’ capital stock. Our financial strategies are designed to enable us to expand and contract in response to member credit needs. By investing capital in high-quality, short- and medium-term financial instruments, we maintain sufficient liquidity to satisfy member demand for short- and long-term funds, repay maturing Consolidated obligations (CO bonds and CO discount notes), and meet other obligations. The dividends we pay are largely the result of earnings on invested member capital, net earnings on advances to members, mortgage loans and investments, offset in part by operating expenses and assessments. Our Board of Directors and Management determine the pricing of member credit and dividend policies based on the needs of our members and the cooperative as well as current and forecasted conditions in the marketplace.

Business segment. We manage our operations as a single business segment. Advances to members are our primary focus and the principal factor that impacts our operating results.

During theThe second quarter of 2022,2023 featured a recovery from the Federal Reserve continuestemporary but widespread liquidity crisis within the U.S. banking sector that occurred in the first quarter of 2023. The Bank was able to raise interest rates in an effortsuccessfully manage the reduced advances demand as our members’ liquidity positions stabilized. The Bank’s advances position decreased to combat inflation. In addition, markets are experiencing increased volatility due to$110.2 billion at June 30, 2023 from $127.4 billion at March 31, 2023. Through the war between Ukrainefirst half of 2023, the Bank has met the liquidity demands of our members through reliable and Russia, which has resulted in increased energy prices and the level and volatility of interest rates and credit spreads may continue to be affected by the geopolitical conflict, government actions (including sanctions) taken in response to the war and resulting economic and market uncertainties.uninterrupted funding.

COVID-19On March 12, 2023, Bank member Signature Bank was closed by the New York State Department of Financial Services, which appointed the Federal Deposit Insurance Corporation (“FDIC”) as receiver. The FDIC transferred all the deposits and Business Continuity. We have continually monitored the key metrics with regards to the ongoing COVID-19 pandemic. These metrics, which include positive test percentages, overall new case numbers and hospital capacity, have helped guide our decision-making since the onsetsubstantially all of the pandemicassets of Signature Bank to Signature Bridge Bank, N.A., an entity that was operated and managed by the FDIC. As of March 10, 2023, the last business day before the receivership, Signature Bank held $11.2 billion in March 2020. The trend continues to moveadvances and $2.0 billion in a positive direction,undrawn letters of credit. As of June 30, 2023 Signature Bridge Bank, N.A had $4.7 billion in advances outstanding and we returned to the office on February 28, 2022 on a hybrid basis.no letters of credit outstanding. As of July 20, 2023, all remaining advances balances were fully paid.

Second Quarter 20222023 Financial Results

Net incomeNet income for 2022the second quarter of 2023 was $76.3$215.8 million, an increase of $1.6$139.5 million, or 2.2 percent, compared to182.7%, from net income of $76.3 million for the same period in the prior year.2022. Our Net income is primarily driven by Net interest income, which is the spread between yields earned on advances, mortgage-backed securities, and other investments and the costing yields oncost of debt. Advance balances have increased steadily during the second quarter despite the increase in volatility. Members’ demand for advances have increased driven by less available liquidity as a result of monetary policy actions. Non-interest income decreased by $5.7 million compared with same period in 2021, driven primarily by a decrease in the value of equity investments held to finance payments to retirees in the non-qualified pension plan in line with declines in equity markets. Other expenses were lower by $5.6 million, at $46.6 million.

Net Interest IncomeOur 2022Net interest income for the second quarter net interest incomeof 2023 was $274.7 million, an increase of $128.0 million, or 87.3%, from $146.7 million compared to $143.2 millionfor the same period in prior year second quarter. The slight2022. This increase was dueprimarily attributed to an increase in interest rates as average earning assets balances increased by $70.0 billion in the second quarter of net2023 compared with the same period in 2022, including an increase of $47.7 billion in average advances balances to $122.5 billion in the second quarter of 2023, up from $74.8 billion in the same period in 2022. In the second quarter of 2023, overnight and short-term investments in the federal funds and the overnight repurchase agreements benefited from rising yields for money market investments. While funding costs were also higher in line with the rising rate environment, cost of funding continued to benefit from favorable investor demand for Consolidated obligation short-term and floating-rate bonds. Net interest spread decreased to 4533 basis points in the second quarter of 20222023 compared to 4445 basis points in the same period in the prior year, offset by a decline of $11.1 billion in average earning assets balances for the second quarter of 2022 compared with second quarter of 2021. Average advances balances decreased by $12.2 billion to $74.8 billion for the second quarter 2022 from $87.0 billion for the second quarter 2021. Net interest income also increased as yield on assets was 56 basis points higher in the current year quarter to 136 basis points, as compared to 80 basis points in the prior year quarter.2022.

Return on average equity (ROE) for 2022the second quarter of 2023 was 4.71%9.84%, compared to ROE of 4.21%4.71% for the second quarter of 2021.same period in 2022.

62

Table of Contents

Other income (loss) — Other income (loss) reportedincreased by $33.2 million, resulting from a gain of $17.9 million in the second quarter of 2023 compared to a loss of $15.3 million in the second quarter of 2022 compared to a loss of $9.6 millionsame period in the second quarter of 2021.2022. Primary driverscomponents are summarized below:

Financial instruments carried at fair values — In 20222023 second quarter, FVO instruments reported valuation gains of $36.8$16.7 million. In 20212022 second quarter, FVO instruments reported valuationfair value gains of $3.9$36.8 million.

65

Table of Contents

Derivative activitiesreported overall incomegains in Other income of $79.9 million in the second quarter of 2023, compared to gains of $48.2 million in the second quarter of 2022, compared to a net income2022. These gains were primarily from Interest rate swaps designated as economic hedges of $3.9 million in the second quarter of 2021.fixed-rate treasury securities. The fair value gains on Interest rate swaps in economic hedges (standalone derivatives) recorded net fair value gains of $84.5 million in the second quarter of 2022, compared to net fair value gains of $22.9 million in the second quarter of 2021. These fair value gains largely offset the marked-to-market valuation of the portfolio of U.S. Treasury securities held for liquidity and classified as trading. In 2022 second quarter, swap interest accruals on standalone swaps reported net income of $1.8 million and net charge of $18.9 million in the second quarter of 2021 to Other income.liquidity.
U.S. Treasury Securities held for liquidity (classified as trading) reported marked-to-market losses of $93.7$88.1 million and $26.4$93.7 million in the second quarter of 20222023 and 2021,2022, respectively. The marked-to-market volatility was largely offset by fair value changes on the standalone interest rate swaps in economic hedges of the fixed-rate treasury securities.
Equity Investmentsheld to finance payments to retirees in a non-qualified pension plans,plan, reported net gains of $3.0 million in the second quarter of 2023, compared to net losses of $10.4 million in current year period, compared to net gains of $4.5 million in the prior year period commensurate with declines in the equity markets.period.

Other expenseswere $46.6$51.1 million infor the second quarter of the current year, compared to $52.2$46.6 million infor the same period in the prior year. Other expenses are primarily Operating expenses, Compensation and benefits, and our share of expenses of the Office of Finance and the Federal Housing Finance Agency.

Affordable Housing Program Assessments (AHP)allocated from Net income were $8.6$24.0 million infor the second quarter of the current year, compared to $8.3$8.6 million infor the same period in the prior year. Assessments are calculated as a percentage of Net income, and changes in allocations were parallel with changes in Net income.

Dividend payments — A quarterly cash dividend of $1.17$1.91 per share (4.75%(7.75% annualized) was paid in the second quarter of the current year, , unchanged fromcompared to $1.17 per share (4.75% annualized) in the same period of the prior year.

Financial Condition — June 30, 20222023 compared to December 31, 20212022

Our financial condition is characterized by a solid balance sheet and ample liquidity readily available for our member institutions.

Total assets increased to $116.0$171.4 billion at June 30, 20222023 from $105.4$157.4 billion at December 31, 2021,2022, an increase of $10.6$14.0 billion, or 10.1%8.9%. As of June 30, 2022,2023, advances were $80.1$108.6 billion, an increasea decrease of $8.5$6.7 billion, or 11.9%5.8%, from $71.5$115.3 billion at December 31, 2021.2022.

Cash at banks was $163.7$45.1 million at June 30, 2022,2023, compared to $21.7$27.4 million at December 31, 2021.2022.

Liquidity investments Money market investments at June 30, 20212023 were $8.7 billion in federal funds sold. At December 31, 2021, money market investments were $7.2$15.6 billion in federal funds sold and $1.2$16.7 billion in overnight resale agreements. At December 31, 2022, money market investments were $9.5 billion in federal funds sold and $4.2 billion in overnight resale agreements. Balances increased as we sought to ensure an ample supply of funds to meet liquidity demands from members in the aftermath of the banking crisis in mid-March. Money market investments also included interest-bearing deposits at highly rated financial institutions. Balances were $675.0 million$3.0 billion and $1.8 billion at June 30, 20222023 and December 31, 2021.2022, respectively.

For liquidity, we maintain a portfolio of U.S. Treasury securities designated as trading to meet short-term contingency liquidity needs. Balances were $7.7$5.3 billion and $5.8$7.1 billion at June 30, 20222023 and December 31, 2021,2022, respectively.

Our liquidity position remains strong, and in compliance with all regulatory requirements, and we do not foresee any changes to that position. In addition to the liquidity trading portfolio and assets discussed above, liquid assets included $5.7$7.4 billion at June 30, 20222023 and $5.5$6.0 billion at December 31, 20212022 of high credit quality GSE-issued available-for-sale securities that are investment quality and readily marketable. The Finance Agency issued a Liquidity Advisory Bulletin in 2018 that defined liquidity levels to be maintained within certain ranges. We also have other liquidity measures in place such as deposit liquidity and operational liquidity, and other liquidity buffers. We remain in compliance with the Advisory Bulletin and all liquidity regulations.

For more information about the Advisory Bulletin and our liquidity measures, see section Liquidity, Cash Flows, Short-Term Borrowings and Short-Term Debt, and Table 8.1 through Table 8.3 in this MD&A.

Advances — Par balances increased steadily during the year to $81.1 billion at June 30, 2022, compared to $71.2 billion at December 31, 2021. Short-term fixed-rate advances decreased by 31.9% to $7.8 billion at June 30, 2022, down from $11.5 billion at December 31, 2021. ARC advances, which are adjustable-rate borrowings, increased by 118.9% to $16.3 billion at June 30, 2022, compared to

6663

Table of Contents

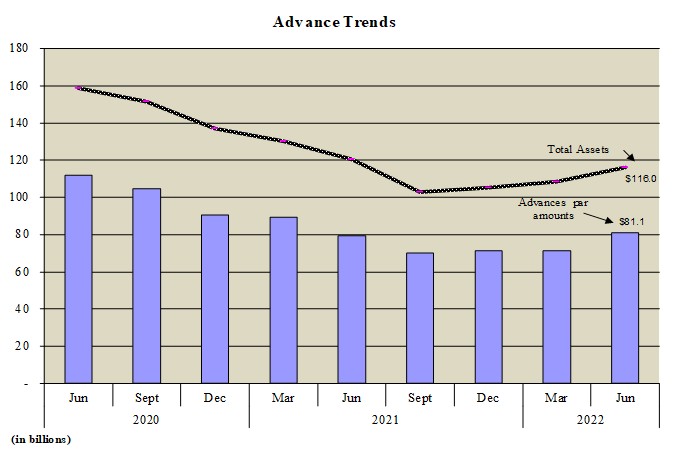
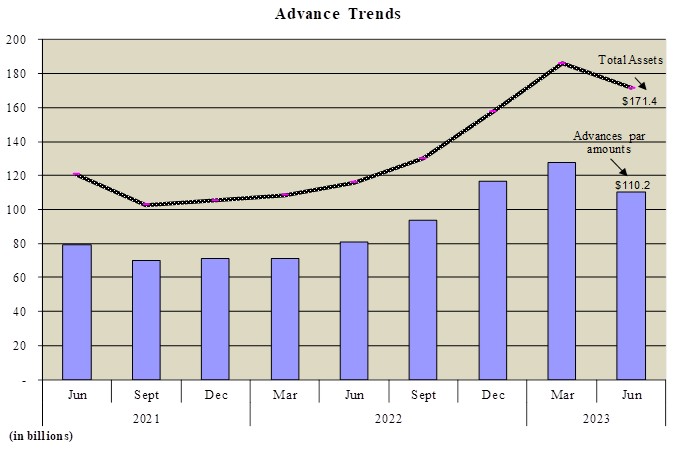
$7.5Advances — Par balances decreased at June 30, 2023 to $110.2 billion, compared to $116.9 billion at December 31, 2021.2022.Short-term fixed-rate advances decreased by 16.6% to $20.6 billion at June 30, 2023, down from $24.7 billion at December 31, 2022. ARC advances, which are adjustable-rate borrowings, increased by 7.2% to $26.9 billion at June 30, 2023, compared to $25.1 billion at December 31, 2022. Given that advances are always well collateralized, a provision for credit losslosses was not necessary. We have no history of credit losses on advances.

Long-term investment debt securities — Long-term investment debt securities are designated as available-for-sale (AFS) or held-to-maturity (HTM). Our investment profile consists almost exclusively of GSE and Agency-issued (GSE-issued) securities.

In the AFS portfolio, long-term investments of floating-rate GSE-issued mortgage-backed securities were carried on the balance sheet at fair values of $515.4$426.8 million and $589.5$462.1 million at June 30, 20222023 and December 31, 2021,2022, respectively. Fixed-rate long-term investments in the AFS portfolio, comprised of fixed-rate GSE-issued mortgage-backed securities, were carried on the balance sheet at fair values of $5.1$6.9 billion and $5.0$5.5 billion at June 30, 20222023 and December 31, 2021,2022, respectively.

State and local housing finance agency obligations, primarily New York and New Jersey, were carried as AFS securities at $1.1 billion at June 30, 2022 and $1.0 billion2023, slightly lower than the balance at December 31, 2021.2022.

In the HTM portfolio, long-term investments were predominantly GSE-issued fixed- and floating-rate mortgage-backed securities and a portfolio of housing finance agency bonds. Securities in the HTM portfolio are recorded at amortized cost, adjusted for credit and non-credit losses from the application of pre-ASU 2016-13 credit loss standards (formerly referred to as OTTI), and, beginning January 1, 2020, adjusted for allowances for credit losses under the new framework. Fixed- and floating-rate mortgage-backed securities in the HTM portfolio were $8.9$10.5 billion and $9.1$9.2 billion at June 30, 20222023 and December 31, 2021,2022, respectively. No allowance for credit losses were deemed necessary for GSE-issued investments. Allowance for credit losses was $0.2$0.5 million on private-label MBS at June 30, 2022, slightly lower than2023 versus $0.2 million at December 31, 2021.2022.

In the HTM portfolio, State and local housing finance agency obligations were $0.2 billion at June 30, 20222023 and at December 31, 2021.2022. Allowance for credit losses on State and local housing finance agency obligations in HTM portfolio was $0.1 million at June 30, 2022, unchanged from2023, slightly lower than the balance at December 31, 2021.2022.

Equity Investments — We own a grantor trusttrusts that investsinvest in highly-liquid registered mutual funds. Funds are classified as Equity Investments and were carried on the balance sheet at fair values of $80.5 million and $96.1$87.8 million at June 30, 20222023 and $81.8 million at December 31, 2021, respectively.2022.

Mortgage loans held-for-portfolio — Mortgage loans wereare investments in Mortgage Partnership Finance (MPF) loans and Mortgage Asset Program (MAP) loans. As of March 31, 2021, the MAP mortgage loan program became our only active mortgage loan purchase program as we ceased to acquire mortgage loans through MPF.

Unpaid principal balance of MPF loans stood at $2.0$1.8 billion at June 30, 2022,2023, a decrease of $0.2 billion$72.8 million from the balance at December 31, 2021.2022. Unpaid principal balance of MAP loans stood at $182.9$327.7 million at June 30, 20222023 compared to $156.7$221.1 million at December 31, 2021.2022.

Historically, credit performance has been strong in the MPF and MAP portfolio and delinquencydelinquencies have been low. Residential collateral values have remained stable in the New York and New Jersey sectors, the primary geographic concentration for our MPF and MAP portfolio, and historical loss experience remains very low. Serious delinquencies (typically 90 days or more) at June 30, 2022,2023, were lower than December 31, 2021.2022. Allowance for credit losses decreasedincreased to $2.0$3.5 million at June 30, 20222023 compared to $2.1$1.9 million at December 31, 2021.2022. The Bank transitioned models in June of 2023 and the newly adopted model assumptions are different than the prior model.

Capital ratios — Our capital position remains strong. At June 30, 2022,2023, actual risk-based capital was $6.9$8.7 billion compared to required$8.5 billion at December 31, 2022. Required risk-based capital of $843.3 million.was $1.0 billion at June 30, 2023 compared to $749.5 million at December 31, 2022. To support $116.0$171.4 billion of total assets at June 30, 2022,2023, the minimum required total capital was $4.6$6.9 billion or 4.0% of assets. Our actual regulatory risk-based capital was $6.9$8.7 billion, exceeding required total capital by $2.3$1.8 billion. These ratios have remained consistently above the required regulatory ratios through all periods in this report.

64

Table of Contents

Leverage — At June 30, 20222023 balance sheet leverage (based on U.S. GAAP) was 17.120.1 times shareholders’ equity.equity compared to 18.9 times at December 31, 2022. Balance sheet leverage has generally remained steady over the last several years, although from time to time we have maintained excess liquidity in highly liquid investments, or cash balances at the Federal Reserve Bank of New York (FRBNY) to meet unexpected member demand for funds.

67

Table of Contents

Other Developments

Replacement of London Interbank Offered Rates (LIBOR) — The Alternative Reference Rates Committee (ARRC) in the U.S. has settled on the establishment of the Secured Overnight Financing Rate (SOFR) as its recommended alternative to U.S. dollar LIBOR. As noted throughout this report, much of the FHLBNY’s assets, liabilities and derivatives are indexed to LIBOR.

On March 5, 2021, the U.K. Financial Conduct Authority (FCA) confirmed that the publication of the principal tenors of U.S. dollar LIBOR (i.e., overnight, one-month, three-month, six-month and 12-month LIBOR) will cease immediately following a final publication on June 30, 2023. As of January 1, 2022, the one-week and two-month U.S. dollar LIBOR settings and all non-U.S. dollar LIBOR settings ceased to be provided by any administrator. Although the FCA has indicated that it does not expect the remaining U.S. dollar LIBOR settings to become unrepresentative before the cessation date, there is no assurance that any of them will continue to be published or be representative through any particular date.

Recently Issued Accounting Standards and Interpretations and Critical Accounting Policies and Estimates

For a discussion of recently issued accounting standards and interpretations, see financial statements, Note 2. Financial Accounting Standards Board (FASB) Standards Issued.

Critical Accounting Policies and Estimates

We have identified certain accounting policies that we believe are critical because they require management to make subjective judgments about matters that are inherently uncertain and because of the likelihood that materially different amounts would be reported under different conditions or by using different assumptions. These policies include estimating fair values of certain assets and liabilities, evaluating the impairment of our securities portfolios, estimating the allowance for credit losses on the advance and mortgage loan portfolios, and accounting for derivatives and hedging activities. We have discussed each of these critical accounting policies, the related estimates, and its judgment with the Audit Committee of the Board of Directors. Refer to Note 1. CriticalSummary of Significant Accounting Policies and Estimates in this Form 10-Q and in the 20212022 Form 10-K filed on March 22, 2022.17, 2023.

6865

Table of Contents

Selected Financial Data (Unaudited).

Statements of Condition


June 30, 


March 31, 


December 31, 


September 30, 


June 30, 


June 30,


March 31,


December 31,


September 30,


June 30,

(dollars in millions)


2022


2022


2021


2021


2021


2023


2023


2022


2022


2022

Investments (a)

$

33,001

$

35,088

$

30,898

$

29,076

$

37,553

$

59,806

$

56,765

$

39,103

$

35,514

$

33,001

Advances


80,062


70,629


71,536


70,548


79,985


108,573


126,251


115,293


91,871


80,062

Mortgage loans held-for-portfolio, net (b)


2,175


2,233


2,320


2,418


2,526


2,139


2,094


2,107


2,136


2,175

Total assets


115,963


108,598


105,358


102,677


120,449


171,408


185,937


157,391


130,130


115,963

Deposits and borrowings


1,492


1,181


1,321


1,466


1,531


2,927


3,782


1,027


1,115


1,492

Consolidated obligations, net


Bonds


57,551


57,376


54,829


61,454


69,313


101,049


112,475


85,498


72,174


57,551

Discount notes


49,519


43,177


42,197


32,769


42,173


57,912


59,922


61,793


49,030


49,519

Total consolidated obligations


107,070


100,553


97,026


94,223


111,486


158,961


172,397


147,291


121,204


107,070

Mandatorily redeemable capital stock


8


8


2


2


2


7


6


5


11


8

AHP liability


132


137


138


145


153


159


144


131


125


132

Capital


Capital stock


4,939


4,480


4,501


4,447


4,867


6,362


6,860


6,387


5,331


4,939

Retained earnings


Unrestricted


1,109


1,100


1,104


1,113


1,120


1,288


1,238


1,185


1,149


1,109

Restricted


854


839


827


817


803


994


951


911


880


854

Total retained earnings


1,963


1,939


1,931


1,930


1,923


2,282


2,189


2,096


2,029


1,963

Accumulated other comprehensive income (loss)


(139)


(89)


14


34


30


(126)


(182)


(136)


(177)


(139)

Total capital


6,763


6,330


6,446


6,411


6,820


8,518


8,867


8,347


7,183


6,763

Equity to asset ratio (c)(j)


5.83

%  


5.83

%  


6.12

%  


6.24

%  


5.66

%


4.97

%  


4.77

%  


5.30

%  


5.52

%  


5.83

%

Three months ended

Six months ended

Three months ended

Six months ended

Statements of Condition


June 30, 


March 31, 


December 31, 


September 30, 


June 30, 


June 30, 


June 30, 


June 30, 


March 31, 


December 31, 


September 30, 

June 30, 


June 30, 


June 30, 

Averages (See note below; dollars in millions)


2022


2022


2021


2021


2021


2022


2021


2023


2023


2022


2022

2022


2023


2022

Investments (a)

$

35,426

$

35,609

$

32,227

$

34,733

$

34,952

$

35,517

$

38,478

$

57,880

$

44,793

$

37,624

$

37,433

$

35,426

$

51,373

$

35,517

Advances


74,823


71,636


70,326


75,642


87,031


73,238


88,735


122,518


115,452


97,606


86,597

74,823


119,004


73,238

Mortgage loans held-for-portfolio, net


2,204


2,275


2,372


2,468


2,608


2,239


2,707


2,122


2,099


2,121


2,154

2,204


2,111


2,239

Total assets


114,109


110,951


106,215


114,074


125,605


112,539


131,004


184,653


166,562


139,664


127,737

114,109


175,657


112,539

Interest-bearing deposits and other borrowings


1,102


1,166


1,256


1,391


1,461


1,134


1,532


2,825


3,060


966


920

1,102


2,942


1,134

Consolidated obligations, net


Bonds


58,906


56,449


58,852


65,335


68,927


57,685


68,765


108,638


98,634


76,116


67,336

58,906


103,664


57,685

Discount notes


45,733


45,323


38,188


39,375


46,796


45,529


52,179


62,001


53,910


52,814


50,766

45,733


57,977


45,529

Total consolidated obligations


104,639


101,772


97,040


104,710


115,723


103,214


120,944


170,639


152,544


128,930


118,102

104,639


161,641


103,214

Mandatorily redeemable capital stock


64


12


2


2


3


38


3


7


6


5


11

64


6


38

AHP liability


136


137


142


147


152


136


151


146


136


126


125

136


141


136

Capital


Capital stock


4,651


4,501


4,440


4,668


5,185


4,576


5,244


6,762


6,390


5,592


5,119

4,651


6,577


4,576

Retained earnings


Unrestricted


1,098


1,094


1,103


1,112


1,120


1,097


1,121


1,235


1,185


1,149


1,111

1,098


1,210


1,097

Restricted


846


830


820


808


794


838


787


965


924


891


862

846


945


838

Total retained earnings


1,944


1,924


1,923


1,920


1,914


1,935


1,908


2,200


2,109


2,040


1,973

1,944


2,155


1,935

Accumulated other comprehensive income (loss)


(101)


(21)


28


29


25


(61)


12


(167)


(119)


(204)


(141)

(101)


(143)


(61)

Total capital


6,494


6,404


6,391


6,617


7,124


6,450


7,164


8,795


8,380


7,428


6,951

6,494


8,589


6,450

Note — Average balance calculation. For most components of the average balances, a daily weighted average balance is calculated for the period. When daily weighted average balance information is not available, a simple monthly average balance is calculated.

6966

Table of Contents

Operating Results and Other Data

Three months ended

Six months ended

(dollars in millions)


June 30, 


March 31, 


December 31, 


September 30, 


June 30, 


June 30, 


June 30, 


(except earnings and dividends per share, and headcount)


2022


2022


2021


2021


2021


2022


2021

Operating Results and Other Data

Three months ended

Six months ended

(dollars in millions,


June 30, 


March 31, 


December 31, 


September 30, 


June 30, 


June 30, 


June 30, 

except earnings and dividends per share, and headcount)


2023


2023


2022


2022


2022


2023


2022

Net income

$

76

$

57

$

53

$

66

$

75

$

133

$

147

$

215

$

199

$

154

$

130

$

76

$

414

$

133

Net interest income (d)

147


122


111


128


143


269


302

275


230


196


169


147


505


269

Dividends paid in cash (e)

52


49


52


59


63


101


133

122


106


87


64


52


228


101

AHP expense

9


6


6


7


8


15


16

24


22


17


14


9


46


15

Return on average equity (f)(g)(j)

4.71

%  


3.61

%


3.28

%  


3.95

%


4.21

%  


4.17

%  


4.14

%

9.84

%  


9.61

%


8.25

%  


7.39

%


4.71

%  


9.73

%  


4.17

%

Return on average assets (g)(j)

0.27

%  


0.21

%


0.20

%  


0.23

%


0.24

%  


0.24

%  


0.23

%

0.47

%  


0.48

%


0.44

%  


0.40

%


0.27

%  


0.48

%  


0.24

%

Other non-interest income (loss)

(15)


(13)


3


(8)


(10)


(28)


(43)

18


41


33


24


(15)


59


(28)

Operating expenses (h)

39


38


46


41


41


77


79

44


44


50


42


39


88


77

Finance Agency and


Office of Finance expenses

5


6


5


6


5


11


11

Finance Agency and Office of Finance expenses

5


5


5


5


5


10


11

Total other expenses (k)

47


46


56


49


52


93


99

52


50


58


49


47


102


93

Operating expenses ratio (g)(i)(j)

0.14

%  


0.14

%  


0.17

%  


0.14

%  


0.13

%  


0.14

%  


0.12

%

0.10

%  


0.11

%  


0.14

%  


0.13

%  


0.14

%  


0.10

%  


0.14

%

Earnings per share

$

1.64

$

1.27

$

1.21

$

1.41

$

1.44

$

2.91

$

2.80

$

3.19

$

3.11

$

2.88

$

2.61

$

1.64

$

6.30

$

2.91

Dividends per share

$

1.17

$

1.10

$

1.12

$

1.14

$

1.17

$

2.27

$

2.43

$

1.91

$

1.89

$

1.70

$

1.37

$

1.17

$

3.80

$

2.27

Headcount (Full/part time)

333


338


340


344


353


333


353

335


333


327


333


333


335


333

(a)

Investments include trading securities, available-for-sale securities, held-to-maturity securities, equity investments in grantor trusts owned by the FHLBNY, securities purchased under agreements to resell, federal funds, loans to other FHLBanks, and other interest-bearing deposits.

(b)

Allowances for credit losses on mortgage loans were $2.0$3.5 million, $2.0$1.8 million, $2.1$1.9 million, $3.0$1.7 million and $4.1$2.0 million for the periods ended June 30, 2022,2023, March 31, 2022,2023, December 31, 2021,2022, September 30, 20212022 and June 30, 2021 respectively.2022, respectively.

(c)

Equity to asset ratio is Capital stock plus Retained earnings and Accumulated other comprehensive income (loss) as a percentage of Total assets.

(d)

Net interest income is net interest income before the provision for credit losses on mortgage loans.

(e)

Excludes dividends accrued to non-members classified as interest expense under the accounting standards for certain financial instruments with characteristics of both liabilities and equity.

(f)

Return on average equity is Net income as a percentage of average Capital Stock plus average retained earnings and average Accumulated other comprehensive income (loss).

(g)

Annualized.

(h)

Operating expenses include Compensation and Benefits.

(i)

Operating expenses as a percentage of Total average assets.

(j)

All percentage calculations are performed using amounts in thousands and may not agree if calculations are performed using amounts in millions.

(k)

Includes Operating expenses, Compensation and benefits, Finance Agency and Office of Finance expenses and Other expenses.

7067

Table of Contents

Financial Condition

Table 1.1   Statements of Condition — Period-Over-Period Comparison


Net change in


Net change in


Net change in


Net change in

(Dollars in thousands)


June 30, 2022


December 31, 2021


dollar amount


percentage


June 30, 2023


December 31, 2022


dollar amount


percentage

Assets

Cash and due from banks

$

163,741

$

21,653

$

142,088


NM

%

$

45,142

$

27,420

$

17,722


64.63

%

Interest-bearing deposits


675,000


675,000


2,950,000


1,750,000

1,200,000


68.57

Securities purchased under agreements to resell


1,200,000

(1,200,000)


(100.00)


16,745,000


4,245,000

12,500,000


294.46

Federal funds sold


8,650,000


7,230,000

1,420,000


19.64


15,560,000


9,470,000

6,090,000


64.31

Trading securities


7,712,829


5,821,380

1,891,449


32.49


5,285,390


7,113,419

(1,828,029)


(25.70)

Equity Investments


80,547


96,124

(15,577)


(16.21)


87,845


81,754

6,091


7.45

Available-for-sale securities


6,777,748


6,547,421

230,327


3.52


8,479,909


7,088,870

1,391,039


19.62

Held-to-maturity securities


9,104,499


9,328,665

(224,166)


(2.40)


10,697,606


9,354,048

1,343,558


14.36

Advances


80,062,142


71,536,402

8,525,740


11.92


108,573,216


115,292,876

(6,719,660)


(5.83)

Mortgage loans held-for-portfolio


2,175,465


2,319,864

(144,399)


(6.22)


2,138,755


2,106,969

31,786


1.51

Accrued interest receivable


172,364


123,258

49,106


39.84


595,428


437,823

157,605


36.00

Premises, software, and equipment


78,992


83,815

(4,823)


(5.75)


73,246


77,710

(4,464)


(5.74)

Operating lease right-of-use assets


63,003


65,624

(2,621)


(3.99)


57,625


60,338

(2,713)


(4.50)

Derivative assets


235,223


297,504

(62,281)


(20.93)


99,602


163,921

(64,319)


(39.24)

Other assets


11,560


11,632

(72)


(0.62)


18,843


121,341

(102,498)


(84.47)

Total assets

$

115,963,113

$

105,358,342

$

10,604,771


10.07

%

$

171,407,607

$

157,391,489

$

14,016,118


8.91

%

Liabilities


Deposits


Interest-bearing demand

$

1,473,761

$

1,283,072

$

190,689


14.86

%

$

2,920,374

$

1,015,991

$

1,904,383


187.44

%

Non-interest-bearing demand


17,792


38,166

(20,374)


(53.38)


6,467


10,946

(4,479)


(40.92)

Total deposits


1,491,553


1,321,238

170,315


12.89


2,926,841


1,026,937

1,899,904


185.01

Consolidated obligations


Bonds


57,550,526


54,829,401

2,721,125


4.96


101,048,634


85,497,755

15,550,879


18.19

Discount notes


49,519,232


42,197,259

7,321,973


17.35


57,911,901


61,792,989

(3,881,088)


(6.28)

Total consolidated obligations


107,069,758


97,026,660

10,043,098


10.35


158,960,535


147,290,744

11,669,791


7.92

Mandatorily redeemable capital stock


8,117


1,959

6,158


NM


7,329


4,578

2,751


60.09

Accrued interest payable


176,866


126,990

49,876


39.28


619,683


370,456

249,227


67.28

Affordable Housing Program


131,783


137,638

(5,855)


(4.25)


158,749


131,394

27,355


20.82

Derivative liabilities


105,578


36,512

69,066


NM


24,160


15,333

8,827


57.57

Other liabilities


140,379


182,466

(42,087)


(23.07)


122,505


131,360

(8,855)


(6.74)

Operating lease liabilities


76,212


79,026

(2,814)


(3.56)


70,188


73,304

(3,116)


(4.25)

Total liabilities


109,200,246


98,912,489

10,287,757


10.40


162,889,990


149,044,106

13,845,884


9.29

Capital


6,762,867


6,445,853

317,014


4.92


8,517,617


8,347,383

170,234


2.04

Total liabilities and capital

$

115,963,113

$

105,358,342

$

10,604,771


10.07

%

$

171,407,607

$

157,391,489

$

14,016,118


8.91

%

NM Not meaningful.

Balance Sheet overview June 30, 20222023 and December 31, 20212022

Total assets increased to $116.0$171.4 billion at June 30, 20222023 from $105.4$157.4 billion at December 31, 2021,2022, an increase of $10.6$14.0 billion, or 10.1%8.9%.

Cash at banks was $163.7$45.1 million at June 30, 2022,2023, compared to $21.7$27.4 million at December 31, 2021.2022.

Money market investments at June 30, 20222023 were $8.7 billion in federal funds sold. At December 31, 2021, money market investments were $7.2$15.6 billion in federal funds sold and $1.2$16.7 billion in overnight resale agreements. At December 31, 2022, money market investments were $9.5 billion in federal funds sold and $4.2 billion in overnight resale agreements. Balances increased as we sought to ensure an ample supply of funds to meet liquidity demands. Federal funds sold averaged $10.7$21.1 billion, $11.5 billion and $10.8$10.7 billion in the second quarter of 2022 and2023, the fourth quarter of 2021,2022 and the second quarter of 2022, respectively. Resale agreements averaged $5.5 million, $13.0$9.9 billion, $225.2 million and $95.6$5.5 million in the second quarter of 2022,2023, the fourth quarter of 20212022 and the second quarter of 2021,2022, respectively. Money market investments also included interest-bearing deposits at highly rated financial institutions. Balances were $675.0 million$3.0 billion and $1.8 billion at June 30, 2022, unchanged from2023 and December 31, 2021.2022, respectively.

Advances — Par balances increased steadily during the year to $81.1 billiondecreased at June 30, 2022,2023 to $110.2 billion, compared to $71.2$116.9 billion at December 31, 2021.2022. Short-term fixed-rate advances decreased by 31.9%16.6% to $7.8$20.6 billion at June 30, 2022,2023, down from $11.5$24.7 billion at December 31, 2021.2022. ARC advances, which are adjustable-rate borrowings, increased by 118.9%7.2% to $16.3$26.9 billion at June 30, 2022,2023, compared to $7.5$25.1 billion at December 31, 2021.2022.

7168

Table of Contents

Long-term investment debt securities — Long-term investment debt securities are designated as available-for-sale (AFS) or held-to-maturity (HTM). Our investment profile consists almost exclusively of GSE and Agency issued (GSE-issued) securities.

In the AFS portfolio, long-term investments of floating-rate GSE-issued mortgage-backed securities were carried on the balance sheet at fair values of $515.4$426.8 million at June 30, 20222023 and $589.5$462.1 million at December 31, 2021.2022. Fixed-rate long-term investments in the AFS portfolio, comprised of fixed-rate GSE-issued mortgage-backed securities, were carried on the balance sheet at fair values of $5.1$6.9 billion at June 30, 20222023 and $5.0$5.5 billion at December 31, 2021.2022. We acquired $0.9$1.5 billion (par) of fixed-rate GSE-issued MBS in the first half of 2022.2023.

State and local housing finance agency obligations, primarily New York and New Jersey, were carried as AFS securities at $1.1 billion at June 30, 2022 and $1.0 billion2023, slightly lower than the balance at December 31, 2021.2022.

In the HTM portfolio, long-term investments were predominantly GSE-issued fixed- and floating-rate mortgage-backed securities and a small portfolio of housing finance agency bonds. Securities in the HTM portfolio are recorded at amortized cost, adjusted for credit and non-credit losses from the application of pre-ASU 2016-13 credit loss standards (formerly referred to as OTTI), and, beginning January 1, 2020, adjusted for allowances for credit losses under the new framework. Fixed- and floating-rate mortgage-backed securities in the HTM portfolio were $8.9$10.5 billion at June 30, 20222023 and $9.1$9.2 billion at December 31, 2021.2022. We acquired $509.1 million$1.7 billion (par) of floated-rate and $0.1 billion (par) of fixed-rate GSE-issued MBS in the first half of 2022.2023.

State and local housing finance agency obligations, primarily New York and New Jersey, were carried as HTM securities at $0.2 billion at June 30, 20222023 and December 31, 2021.2022.

Trading securities (liquidity portfolio) — The objective of the trading portfolio is to meet short-term contingency liquidity needs. During the current year period, we continued to invest in highly liquid U.S. Treasury securities. Trading investments are carried at fair value, with changes recorded through earnings. At June 30, 2022,2023, trading investments were $7.7$5.3 billion in U.S. Treasury securities. At June 30, 2021,December 31, 2022, trading investments were $7.1 billion in U.S. Treasury securities and $2.1 million in Ambac corporate notes. At December 31, 2021, trading investments were $5.8 billion in U.S. Treasury securities.

We will periodically evaluate our liquidity needs and may add to or dispose these liquidity investments as deemed prudent based on liquidity and market conditions. The Finance Agency prohibits speculative trading practices but allows permitted securities to be deemed held for liquidity if invested in a trading portfolio.

Equity Investments — We own a grantor trusttrusts that investsinvest in highly-liquid registered mutual funds. Funds are classified as Equity Investments and were carried on the balance sheet at fair values of $80.5 million and $96.1$87.8 million at June 30, 20222023 and $81.8 million at December 31, 2021, respectively.2022.

Mortgage loans held-for-portfolio — Mortgage loans wereare investments in Mortgage Partnership Finance loans (MPF or MPF Program) and Mortgage Asset Program (MAP). Unpaid principal balance of MPF loans stood at $2.0$1.8 billion at June 30, 2022,2023, a decrease of $0.2 billion$72.8 million from the balance at December 31, 2021.2022. Loans are primarily fixed-rate, single-family mortgages acquired through the MPF Program. Unpaid principal balance of MAP loans stood at $182.9$327.7 million at June 30, 2022,2023, an increase of $26.1$106.6 million from the balance at December 31, 2021.2022. Paydowns for the total portfolio for six months ended June 30, 20222023 were $173.4$80.5 million compared to $465.9$173.4 million for the same period in 2021.2022. Acquisitions for the six months ended June 30, 20222023 were $33.0$117.2 million compared to $97.0$33.0 million for the same period in 2021.2022. Historically, credit performance has been strong and delinquency low. Loan origination by members and acceptable pricing are key factors that drive acquisitions. With increasing interest rates, refinancing and home sales are declining, fewer MAP eligible loans are available for purchases from the members. Residential collateral values have remained stable in the New York and New Jersey sectors, the primary geographic concentration for our MPF portfolio, and historical loss experience remains very low. Serious delinquencies (typically 90 days or more) at June 30, 20222023 were lower than December 31, 2021.2022. Allowance for credit losses decreasedincreased to $2.0$3.5 million at June 30, 20222023 compared to $2.1$1.9 million at December 31, 2021.2022.

Capital ratios — Our capital position remains strong. At June 30, 2022,2023, actual risk-based capital was $6.9$8.7 billion compared to required$8.5 billion at December 31, 2022. Required risk-based capital of $843.3 million.was $1.0 billion at June 30, 2023 compared to $749.5 million at December 31, 2022. To support $116.0$171.4 billion of total assets at June 30, 2022,2023, the minimum required total capital was $4.6$6.9 billion or 4.0% of assets. Our actual regulatory risk-based capital was $6.9$8.7 billion, exceeding required total capital by $2.3$1.8 billion. These ratios have remained consistently above the required regulatory ratios through all periods in this report. For more information, see financial statements, Note 14. Capital Stock, Mandatorily Redeemable Capital Stock and Restricted Retained Earnings.

7269

Table of Contents

Leverage — At June 30, 2022,2023, balance sheet leverage (based on U.S. GAAP) was 17.120.1 times shareholders’ equity.equity compared to 18.9 times at December 31, 2022. Balance sheet leverage has generally remained steady over the last several years, although from time to time we have maintained excess liquidity in highly liquid investments, or cash balances at the Federal Reserve Bank of New York (FRBNY) to meet unexpected member demand for funds. Increases or decreases in investments have a direct impact on leverage, but generally growth in or shrinkage of advances does not significantly impact balance sheet leverage under existing capital stock management practices. Members are required to purchase activity-based capital stock to support their borrowings from us, and when activity-based capital stock is in excess of the amount that is required to support advance borrowings, we redeem the excess capital stock immediately. Therefore, stockholders’ capital increases and decreases with members’ advance borrowings, and the capital to asset ratio remains relatively unchanged.

Liquidity — Our liquidity position remains strong, and in compliance with all regulatory requirements, and we do not foresee any changes to that position. In addition to the liquidity trading portfolio discussed previously, liquid assets at June 30, 20222023 included $157.9$29.6 million as demand cash balances at the FRBNY, $8.7$32.3 billion in short-term and overnight investments in the federal funds and resale agreements, and $5.7$7.4 billion of high credit quality GSE-issued available-for-sale securities that are investment quality and readily marketable.

We also have other regulatory liquidity measures in place, deposit liquidity and operational liquidity, and other liquidity buffers. We remain in compliance with the Advisory Bulletin and all liquidity regulations.

For more information about the Advisory Bulletin and our liquidity measures, see section Liquidity, Cash Flows, Short-Term Borrowings and Short-Term Debt, and Table 8.1 through Table 8.3 in this MD&A.

Replacement of London Interbank Offered Rates (LIBOR)We are actively engaged in transitioning our LIBOR-indexed swaps and cash instruments to SOFR. We have successfully transitioned $9.3 billion of advance derivative hedges from 2020 to June 30, 2022. We have successfully transitioned $0.7 billion of securities from LIBOR to SOFR

in 2021.

The Alternative Reference Rates Committee (ARRC) in the U.S. has settled on the establishment of the Secured Overnight Financing Rate (SOFR) as its recommended alternative to U.S. dollar LIBOR. As noted throughout this report, muchSome of the FHLBNY’s assets, liabilities and derivatives are still indexed to LIBOR. AsOn March 5, 2021, the U.K. Financial Conduct Authority (FCA) confirmed that the publication of January 1, 2022, the one-week and two-monthprincipal tenors of U.S. dollar LIBOR settings(i.e., overnight, one-month, three-month, six-month and all non-U.S. dollar12-month LIBOR) ceased following a final publication on June 30, 2023.

During the second quarter of 2023, the Bank had variable rate LIBOR settings ceasedexposure related to be provided by any administrator.  Althoughoutstanding advances, investment securities, consolidated bonds, and derivatives with interest rates indexed to LIBOR. However, immediately after June 30, 2023, the FCAvariable LIBOR rate referenced in these outstanding instruments either converted to SOFR or became static until the instruments’ next applicable reset period. As a result, the Bank has indicated that it does not expect the remaining U.S. dollarno further variable-rate LIBOR settings to become unrepresentative before the cessation date, there is no assurance that any of them will continue to be published or be representative through any particular date.exposure after June 30, 2023.

The following data provides an overview of LIBOR-indexed instruments outstanding at June 30, 20222023 with maturities beyond June 30, 2023, which is the relevant LIBOR cessation date for the FHLBNY (in thousands):

Table 1.2Overview of LIBOR-indexed Instruments Outstanding


Outstanding at

Maturing after June 30, 2023

June 30, 2022

LIBOR indexed Derivatives (notionals)

$

4,086,197

LIBOR indexed Variable-rate mortgage-backed securities (UPB)

$

2,500,341

LIBOR indexed Variable-rate housing finance agency bonds (UPB)

$

16,900

LIBOR indexed Variable-rate Other securities (UPB)

$

LIBOR indexed Variable-rate Advances (UPB)

$

1,165,000

LIBOR indexed Variable-rate CO bonds (UPB)

$


Outstanding at

June 30, 2023

LIBOR indexed Derivatives (notionals)

$

1,315,462

LIBOR indexed Variable-rate mortgage-backed securities (UPB)

$

2,138,465

LIBOR indexed Variable-rate housing finance agency bonds (UPB)

$

12,400

LIBOR indexed Variable-rate Other securities (UPB)

$

LIBOR indexed Variable-rate Advances (UPB)

$

1,155,000

LIBOR indexed Variable-rate CO bonds (UPB)

$

7370

Table of Contents

Advances

Our primary business is making collateralized loans to members, referred to as advances. Generally, the growth or decline in advances is reflective of demand by members for both short-term liquidity and term funding. This demand is driven by economic factors such as availability of alternative funding sources that are more attractive, or by the interest rate environment and the outlook for the economy. Members may choose to prepay advances (which may generate prepayment penalty fees) based on their expectations of interest rate changes and demand for liquidity.

Advance volume is also influenced by merger activity, where members are either acquired by non-members or acquired by members of another FHLBank. When our members are acquired by members of another FHLBank or by non-members, these former members no longer qualify for membership, and we may not offer renewals or additional advances to the former members. If maturing advances are not replaced, it may have an impact on business volume.

Interest rate hedging and basis adjustments — A significant percentage of fixed-rate, longer-term advances and all putable advances were designated under an ASC 815 fair value accounting hedge. Also, certain advances were hedged by interest rate swaps in economic hedges. From time to time, we have also elected the fair value option (FVO) on an instrument by instrumentinstrument-by-instrument basis for advances.

Carrying values of advances outstanding were $80.1$108.6 billion at June 30, 20222023 and $71.5$115.3 billion at December 31, 2021.2022. Carrying values included cumulative hedging basis adjustment losses of $1.0$1.6 billion at June 30, 2022 and gains of $0.3 billion2023 that were slightly lower than the hedging basis adjustment losses at December 31, 2021.2022.

Table 2.1    Advance Trends

GraphicGraphic

7471

Table of Contents

Member demand for advance products

Future demand from our members for advances is difficult to forecast as it is uncertain what the impact will be on our members’ businesses from multiple uncertainties, including supply of deposits and other funding to members’ businesses, risk of credit losses, and other potential disruptions to our members’ businesses. For more information

Our regulator, the Federal Housing Finance Agency (FHFA), has a tangible capital requirement for members that differs from their primary regulators’ definition. If a member has negative tangible capital, primarily as a result of negative fair value marks on howinvestment securities held as ‘Available for Sale’ due to a rise in interest rates, the risks relatedBank is not permitted to COVID-19extend a new advance, unless the member’s appropriate federal banking agency or state insurance regulator requests in writing that the Bank make such advance. Further, advance renewals to this member would be limited to a maximum term of 30 days; the 30 day renewals may adversely affectcontinue unless we are directed in writing by the member’s primary regulator to stop. At this time, only a few of our members may not be meeting the FHFA’s tangible capital requirements. While this issue is not viewed as a material risk to the Bank, it is possible that the Bank may lose some advance business resultsto other liquidity providers in cases where FHFA tangible capital violations occur or appear imminent. The Bank’s business reputation with its members and our reputation as a reliable provider of operationsliquidity with our members’ primary regulators may also be harmed. The Bank continues to monitor this situation, including the impact of rising interest rates on our members’ tangible capital and financial condition, see Part I, Item 1A. Risk Factors inany future actions that the most recent 10-K filed on March 22, 2022.regulators may take.

Advances — Product Types

The following table summarizes par values of advances by product type (dollars in thousands):

Table 2.2    Advances by Product Type

June 30, 2022

December 31, 2021


June 30, 2023

December 31, 2022


Percentage


Percentage


Percentage


Percentage


Amounts


of Total


Amounts


of Total


Amounts


of Total


Amounts


of Total

Adjustable Rate Credit - ARCs

$

16,346,390


20.15

%  

$

7,468,000


10.49

%

$

26,858,390


24.37

%  

$

25,063,390


21.43

%

Fixed Rate Advances


49,041,583


60.47


47,466,196


66.65


55,418,061


50.29


54,523,869


46.64

Short-Term Advances


7,810,602


9.63


11,468,580


16.10


20,581,062


18.68


24,674,722


21.10

Mortgage Matched Advances


89,774


0.11


112,215


0.16


89,658


0.08


78,639


0.07

Overnight & Line of Credit (OLOC) Advances


4,413,210


5.44


959,752


1.35


3,985,885


3.62


9,231,475


7.89

All other categories


3,404,294


4.20


3,740,423


5.25


3,257,787


2.96


3,357,759


2.87

Total par value


81,105,853


100.00

%  


71,215,166


100.00

%


110,190,843


100.00

%  


116,929,854


100.00

%

Advance discounts

(127)

(160)

(1,503)

(2,083)

Hedge valuation basis adjustments


(1,043,584)


321,396


(1,616,124)


(1,634,895)


Total

$

80,062,142

$

71,536,402


$

108,573,216

$

115,292,876


72

Table of Contents

Member Pledged Collateral

Member borrowers are required to maintain an amount of eligible collateral that adequately secures their outstanding obligations with the FHLBNY. Eligible collateral includes: (1) one-to-four-family mortgages; (2) multi-family & commercial real estate mortgages; (3) Treasury and U.S. government agency securities; (4) private label commercial mortgage-backed securities; and (5) certain other collateral that is real estate-related, provided that such collateral has a readily ascertainable value, can be liquidated in due course, and the Bank has the ability to perfect its security interest. The FHLBNY also havehas a statutory lien priority with respect to certain member assets under the FHLBank Act as well as a claim on FHLBNY capital stock held by our members. The FHLBNY’s loan and collateral agreements give the Bank security interest in assets held by borrowers that is sufficient to cover their obligations to the FHLBNY. FHLBNY may supplement this security interest by imposing additional collateral delivery requirements on our member borrowers based on the overall financial strength of the member.

To ensure that the FHLBNY has sufficient collateral to cover credit extensions, the FHLBNY has established a Collateral Lendable Value methodology. This methodology ensures that the FHLBNY remains fully collateralized by establishing risk based lendable

75

Table of Contents

values for each pledged collateral type. These lendable values are periodically reassessed to ensure that they are reflective of current market conditions.

The following table summarizes pledged collateral (in thousands):

Table 2.3    Collateral Supporting Indebtedness to Members

Indebtedness

Collateral (a)

Indebtedness

Collateral (a)


Other


Total


Securities and


Other


Total


Securities and


Advances (b)


Obligations (c)


Indebtedness


Loans (d)


Deposits (d)


Total (d)


Advances (b)


Obligations (c)


Indebtedness


Loans (d)


Deposits (d)


Total (d)

June 30, 2022

$

81,105,853

$

14,982,207

$

96,088,060

$

318,828,869

$

76,843,207

$

395,672,076

December 31, 2021

$

71,215,166

$

20,606,819

$

91,821,985

$

320,683,186

$

63,956,008

$

384,639,194

June 30, 2023

$

110,190,843

$

20,719,095

$

130,909,938

$

373,021,759

$

72,326,110

$

445,347,869

December 31, 2022

$

116,929,854

$

22,790,754

$

139,720,608

$

338,641,587

$

81,962,704

$

420,604,291

(a)

The level of over-collateralization is on an aggregate basis and may not necessarily be indicative of a similar level of over-collateralization on an individual member basis. At a minimum, each member pledged sufficient collateral to adequately secure the member’s outstanding obligation with the FHLBNY. In addition, most members maintain an excess amount of pledged collateral with the FHLBNY to secure future liquidity needs.

(b)

Par value.

(c)

Standby financial letters of credit, derivatives, and members’ credit enhancement guarantee amount (MPFCE).

(d)

Estimated market value.

The following table shows the breakdown of collateral pledged by members between those in the physical possession of the FHLBNY or its safekeeping agent, and those that were specifically listed (in thousands):

Table 2.4    Location of Collateral Held

Estimated Market Values

Estimated Market Values


Collateral in


Total


Collateral in


Total


Physical


Collateral


Collateral


Physical


Collateral


Collateral


Possession


Specifically Listed


Received


Possession


Specifically Listed


Received

June 30, 2022

$

77,572,686

$

318,099,390

$

395,672,076

December 31, 2021

$

64,690,246

$

319,948,948

$

384,639,194

June 30, 2023

$

73,354,359

$

371,993,510

$

445,347,869

December 31, 2022

$

82,658,830

$

337,945,461

$

420,604,291

73

Table of Contents

Advances — Interest Rate Terms

The following table summarizes interest-rate payment terms for advances (dollars in thousands):

Table 2.5    Advances by Interest-Rate Payment Terms

June 30, 2022

December 31, 2021


June 30, 2023

December 31, 2022


Percentage


Percentage


Percentage


Percentage


Amount


of Total


Amount


of Total


Amount


of Total


Amount


of Total

Fixed-rate (a)

$

64,685,458


79.75

%  

$

63,744,666


89.51

%

$

81,680,453


74.13

%  

$

90,424,460


77.33

%

Variable-rate (b)


16,420,390


20.25


7,470,500


10.49


28,510,390


25.87


26,505,390


22.67

Variable-rate capped or floored (c)


Overdrawn demand deposit accounts


5


4


Total par value


81,105,853


100.00

%  


71,215,166


100.00

%


110,190,843


100.00

%  


116,929,854


100.00

%

Advance discounts

(127)

(160)

(1,503)

(2,083)

Hedge valuation basis adjustments


(1,043,584)


321,396


(1,616,124)


(1,634,895)


Total

$

80,062,142

$

71,536,402


$

108,573,216

$

115,292,876


(a)Fixed-rate borrowings remained the largest category of advances borrowed by members and includes long-term and short-term fixed-rate advances. Long-term advances remain a small segment of the portfolio at June 30, 2023, with only 7.1% of advances in the remaining maturity bucket of greater than 5 years (6.5% at December 31, 2022). For more information, see financial statements Note 9. Advances.
(b)Variable-rate advances are ARC advances, which historically have been indexed to LIBOR and now are indexed to SOFR-OIS, Federal Funds-OIS or other benchmark indices. The FHLBNY’s larger members are generally borrowers of variable-rate advances.
(c)Category represents ARCs with options that “cap” increase or “floor” decrease in the benchmark index at predetermined strikes (We have also purchased cap/floor options that mirror the terms of the options embedded in the advances sold to members, offsetting our exposure on the advance).
(a)Fixed-rate borrowings remained the largest category of advances borrowed by members and includes long-term and short- term fixed-rate advances. Long-term advances remain a small segment of the portfolio at June 30, 2022, with only 12.2% of advances in the remaining maturity bucket of greater than 5 years (16.1% at December 31, 2021). For more information, see financial statements Note 9. Advances.

(b)Variable-rate advances are ARC advances, which historically have been indexed to LIBOR and now are indexed to SOFR-OIS, Federal Funds-OIS or other benchmark indices. The FHLBNY’s larger members are generally borrowers of variable-rate advances.

76

Table of Contents

(c)Category represents ARCs with options that “cap” increase or “floor” decrease in the benchmark index at predetermined strikes (We have also purchased cap/floor options that mirror the terms of the options embedded in the advances sold to members, offsetting our exposure on the advance).

7774

Table of Contents

The following table summarizes Redemption Term of advances (dollars in thousands):

Table 2.6    Advances by Redemption Term

June 30, 2022

December 31, 2021


Change

June 30, 2023

December 31, 2022


Change

Redemption Term (dollars in thousands)


Amount


Percentage


Amount


Percentage

Amount


Percentage


Amount


Percentage


Amount


Percentage


Amount


Percentage

Fixed-rate

Due in 1 year or less

$

35,277,414


43.50

%  

$

33,315,184


46.78

%

$

1,962,230


5.89

%

$

48,069,491


43.62

%  

$

61,444,708


52.55

%  

$

(13,375,217)


(21.77)

%

Due after 1 year through 3 years


15,161,230


18.69


13,672,643


19.20


1,488,587


10.89


16,411,727


14.89


14,399,676


12.31


2,012,051


13.97

Due after 3 years through 5 years

5,112,539

6.30

5,981,524

8.40

(868,985)

(14.53)

8,805,189

7.99

6,405,303

5.48

2,399,886

37.47

Due after 5 years through 15 years

2,256,517

2.78

2,892,046

4.06

(635,529)

(21.98)

4,468,851

4.06

4,085,973

3.49

382,878

9.37

Thereafter

233

303

(70)

(23.05)

88

161

(73)

(45.34)

Total principal amount

57,807,933

71.27

55,861,700

78.44

1,946,233

3.48

77,755,346

70.56

86,335,821

73.83

(8,580,475)

(9.94)

Fixed-rate, putable


Due in 1 year or less


146,000


0.18


1,000


145,000


NM


NM

Due after 1 year through 3 years


158,000


0.22


(158,000)


(100.00)


45,450


0.04


45,450


NM

Due after 3 years through 5 years


9,250


0.01


14,250


0.02


(5,000)


(35.09)


1,500,000


1.36


1,505,000


1.29


(5,000)


(0.33)

Due after 5 years through 15 years


6,632,500


8.18


7,597,500


10.67


(965,000)


(12.70)


2,290,000


2.08


2,505,000


2.14


(215,000)


(8.58)

Thereafter


NM


NM

Total principal amount


6,787,750


8.37


7,770,750


10.91


(983,000)


(12.65)


3,835,450


3.48


4,010,000


3.43


(174,550)


(4.35)

Variable-rate

Due in 1 year or less

14,193,000

17.50

5,639,500

7.92

8,553,500

151.67

23,181,390

21.03

21,493,000

18.38

1,688,390

7.86

Due after 1 year through 3 years

1,007,390

1.24

524,000

0.74

483,390

92.25

4,109,000

3.73

3,792,390

3.24

316,610

8.35

Due after 3 years through 5 years

220,000

0.27

207,000

0.29

13,000

6.28

220,000

0.20

220,000

0.19

Due after 5 years through 15 years

1,000,000

1.24

1,000,000

1.40

1,000,000

0.91

1,000,000

0.86

Thereafter

NM

NM

Total principal amount

16,420,390

20.25

7,370,500

10.35

9,049,890

122.79

28,510,390

25.87

26,505,390

22.67

2,005,000

7.56

Variable-rate, callable or prepayable (a)

Due in 1 year or less

100,000

0.14

(100,000)

(100.00)

NM

Due after 1 year through 3 years

NM

NM

Due after 3 years through 5 years

NM

NM

Due after 5 years through 15 years

NM

NM

Thereafter

NM

NM

Total principal amount

100,000

0.14

(100,000)

(100.00)

NM

Other (b)

Due in 1 year or less

37,906

0.05

47,177

0.07

(9,271)

(19.65)

29,011

0.03

33,362

0.03

(4,351)

(13.04)

Due after 1 year through 3 years

36,522

0.05

49,630

0.07

(13,108)

(26.41)

36,326

0.04

28,356

0.02

7,970

28.11

Due after 3 years through 5 years

12,067

0.01

11,663

0.02

404

3.47

19,612

0.02

11,459

0.01

8,153

71.15

Due after 5 years through 15 years

2,673

3,014

(341)

(11.32)

4,364

4,985

0.01

(621)

(12.46)

Thereafter

607

732

(125)

(17.11)

344

477

(133)

(27.88)

Total principal amount

89,775

0.11

112,216

0.16

(22,441)

(20.00)

89,657

0.09

78,639

0.07

11,018

14.01

Overdrawn and overnight deposit accounts

5

5

NM

4

(4)

(100.00)

Total principal amount advances

81,105,853

100.00

%

71,215,166

100.00

%

9,890,687

13.89

%

110,190,843

100.00

%

116,929,854

100.00

%

(6,739,011)

(5.76)

%

Other adjustments, net (c)

(1,043,711)

321,236

(1,364,947)

(1,617,627)

(1,636,978)

19,351

Total advances

$

80,062,142

$

71,536,402


$

8,525,740


$

108,573,216

$

115,292,876


$

(6,719,660)


(a)Prepayable advances are those advances that may be contractually prepaid by the borrower on specified dates without incurring prepayment or termination fees.

78

Table of Contents

(b)Includes hybrid, fixed-rate amortizing/mortgage matched, convertible, fixed-rate callable or prepayable, and other advances.

75

Table of Contents

(c)Consists of hedging and fair value option valuation adjustments and unamortized premiums, discounts, and commitment fees.

NM — Not meaningful.

Hedge volume — We hedge putable advances and certain “vanilla” fixed-rate advances under the hedge accounting provisions when they qualify under those standards and as economic hedges when hedge effectiveness accounting provisions cannot be established.

The following table summarizes advances hedged under ASC 815 qualifying hedge by type of structure (in thousands):

Table 2.7    Hedged Advances by Type

Par Amount


June 30, 2022


December 31, 2021


June 30, 2023


December 31, 2022

Qualifying hedges

Fixed-rate bullets (a)

$

39,120,205

$

29,279,507

$

57,118,793

$

39,392,241

Fixed-rate putable (b)


6,787,750


7,770,750


3,835,450


4,010,000

Fixed-rate with embedded cap


360,000


360,000


350,000

Total qualifying hedges

$

46,267,955

$

37,410,257

$

60,954,243

$

43,752,241

Aggregate par amount of advances hedged (c)

$

46,293,801

$

40,560,257

$

61,717,978

$

44,070,441

Fair value basis (hedging adjustments)

$

(1,043,584)

$

321,396

$

(1,616,124)

$

(1,634,895)

(a)

Generally, fixed-rate medium- and longer-term advances are hedged to mitigate the risk in fixed-rate lending.

(b)

Putable advances are hedged by cancellable swaps, and the paired long put option mitigate the put option risks; in the hedge, fixed-rate cash flows are also synthetically converted to benchmark floating-rate.

(c)

Represents par values of advances in ASC 815 hedge relationships. Amounts do not include advances that were in ASC 815 hedges but have since been de-designated or advances that are in economic hedges (not qualifying as ASC 815 accounting hedge).

Economic hedges of floating-rate advances We issue floating-rate advances indexed to one or more benchmark rates (historically LIBOR, and now Federal Funds-OIS and SOFR-OIS) and may then execute interest rate basis swaps that would synthetically convert the cash flows to the desired floating-rate cash flows indexed to another benchmark to meet our asset/liability funding strategies. At June 30, 2023 and December 31, 2022 there was no basis swaps. At December 31, 2021, notional amounts of basis swaps was $3.1 billion.outstanding. The carrying value of the advances in the economic hedge would not include fair value basis since the advance is recorded at amortized cost.

Putable Advances The following table summarizes par amounts of advances that were still putable or callable, with one or more pre-determined option exercise dates remaining (in thousands):

Table 2.8    Putable and Callable Advances

Advances

Advances

Par Amount


June 30, 2022


December 31, 2021


June 30, 2023


December 31, 2022

Putable (a)

$

6,787,750

$

7,770,750

$

3,835,450

$

4,010,000

No-longer putable/callable

$

$

(a)

Putable advances were typically long-term advances with one or more put options exercisable by the FHLBNY. Putable advances are hedged in an ASC 815 qualifying fair value hedge with mirror image terms, including mirror image put option terms.

Investments

We maintain long-term investment portfolios of debt securities, which are principally mortgage-backed securities issued by GSEs and U.S. Agency (GSE-issued). Investments include a small portfolio of MBS issued by private enterprises, and bonds issued by state or local housing finance agencies. We also maintain short-term investments for our liquidity resources, for funding daily stock repurchases and redemptions, for ensuring the availability of funds to meet the credit needs of our members, and to provide additional earnings. We also invest in a liquidity trading portfolio, the purpose of which is to augment our liquidity needs. Investments in the trading portfolio are typically U.S. Treasury securities, and from time to time we have also invested in GSE-issued securities, all carried at their fair values. The Finance Agency prohibits speculative investments but allows the designation of a trading portfolio for liquidity purposes. We may dispose such investments if liquidity needs are met and market conditions deem the sale as advantageous.

7976

Table of Contents

We are subject to credit risk on our investments, generally transacted with GSEs and large financial institutions that are considered to be investment quality. The Finance Agency defines investment quality as a security with adequate financial backing so that full and timely payment of principal and interest on such security is expected and there is minimal risk that the timely payment of principal and interest would not occur because of adverse changes in economic and financial conditions during the projected life of the security.

The following table summarizes changes in investments by categories: Interest-bearing deposits, Money market investments, Trading securities, Equity investments in Grantor trust,trusts, Available-for-sale securities, and Held-to-maturity securities (Carrying values, dollars in thousands):

Table 3.1    Investments by Categories


June 30, 


December 31, 


Dollar


Percentage


June 30, 


December 31, 


Dollar


Percentage


2022

2021

Variance

Variance


2023

2022

Variance

Variance


State and local housing finance agency obligations, net (a)

Available-for-sale securities, at fair value

$

1,112,414

$

998,637

$

113,777


11.39

%

$

1,105,746

$

1,109,029

$

(3,283)


(0.30)

%

Held-to-maturity securities, at carrying value, net

181,109

184,886

(3,777)

(2.04)

169,353

177,117

(7,764)

(4.38)

Total HFA securities

1,293,523

1,183,523

110,000

9.29

1,275,099

1,286,146

(11,047)

(0.86)

Trading securities (b)


7,712,829


5,821,380


1,891,449


32.49


5,285,390


7,113,419


(1,828,029)


(25.70)

Mortgage-backed securities


Available-for-sale securities, at fair value (c)


5,665,334


5,548,784


116,550


2.10


7,374,163


5,979,841


1,394,322


23.32

Held-to-maturity securities, at carrying value, net (c)


8,923,390


9,143,779


(220,389)


(2.41)


10,528,253


9,176,931


1,351,322


14.73

Total MBS securities


14,588,724


14,692,563


(103,839)


(0.71)


17,902,416


15,156,772


2,745,644


18.11

Equity investments in Grantor trust (d)


80,547


96,124


(15,577)


(16.21)


87,845


81,754


6,091


7.45

Interest-bearing deposits


675,000


675,000


0.00


2,950,000


1,750,000


1,200,000


68.57

Securities purchased under agreements to resell


1,200,000


(1,200,000)


(100.00)


16,745,000


4,245,000


12,500,000


294.46

Federal funds sold


8,650,000


7,230,000


1,420,000


19.64


15,560,000


9,470,000


6,090,000


64.31

Total Investments

$

33,000,623

$

30,898,590

$

2,102,033


6.80

%

$

59,805,750

$

39,103,091

$

20,702,659


52.94

%

(a)

State and local housing finance agency bonds are designated as both AFS, carried at fair values and HTM, carried at carrying value. There were acquisitionno acquisitions of $308.0 million of AFS State and local housing finance agency bonds for the six months endingended June 30, 20222023. Payments from HTM portfolio were $7.8 million and paydowns were $0.2 billion inpayments from the AFS portfolio and $3.8 million in the HTM portfolio for the same period. During the second quarter of 2021, we reclassified $0.9 billion of LIBOR-indexed held-to-maturity securities to available-for-sale as a one-time election in accordance with ASC 848 Reference Rate Reform.were $3.1 million.

(b)

Trading securities comprised of U.S. Treasury securities at June 30, 20222023 and are carried at fair value. Trading portfolio is for liquidity and not for speculative purposes. We acquired $4.2 billion$700.0 million par of U.S. Treasury notes in the first six monthstwo quarters of 2022.2023.

(c)

AFS securities outstanding were GSE and U.S. Agency issued MBS and carried at fair values. MBS in the HTM portfolio were predominantly GSE-issued.

(d)

Funds in the grantor trusttrusts are designated as equity investments and are carried at fair value. Trust fund balances represent investments in registered fixed-income and equity mutual funds and money market funds. Funds are highly liquid and readily redeemable at their NAVs, which are the fair values of the investments. The funds are owned by the FHLBNY, and the intent is to utilize investments to fund current and potential future payment obligations of the non-qualified employee retirement plans.

8077

Table of Contents

The following table summarizes our investment debt securities issuer concentration (dollars in thousands):

Table 3.2    Investment Debt Securities Issuer Concentration

June 30, 2022

December 31, 2021


June 30, 2023

December 31, 2022


Carrying value as

Carrying value as

Carrying value as

Carrying value as

Carrying (a)

a Percentage

Carrying (a)

a Percentage


Carrying (a)

a Percentage

Carrying (a)

a Percentage


Long Term Investment (c)


Value


Fair Value


of Capital


Value


Fair Value


of Capital


Value


Fair Value


of Capital


Value


Fair Value


of Capital


MBS


Fannie Mae

$

2,302,248

$

2,291,233


34.04

%  

$

2,565,768

$

2,594,055


39.80

%

$

2,149,385

$

2,119,961


25.23

%  

$

2,099,507

$

2,071,390


25.15

%

Freddie Mac


12,222,748


12,082,519


180.73


12,053,895


12,390,599


187.00


15,703,658


15,283,721


184.37


13,001,618


12,604,915


155.76

Ginnie Mae


8,216


8,216


0.12


9,349


9,349


0.15


7,010


7,010


0.08


7,477


7,477


0.09

All Others - PLMBS


55,512


60,515


0.82


63,551


71,422


0.99


42,363


45,241


0.50


48,170


52,016


0.58

Non-MBS, net (b)


1,293,523


1,279,486


19.13


1,183,523


1,166,270


18.36


1,275,099


1,262,465


14.97


1,286,146


1,272,277


15.41

Total Investment Debt Securities

$

15,882,247

$

15,721,969


234.84

%  

$

15,876,086

$

16,231,695


246.30

%

$

19,177,515

$

18,718,398


225.15

%  

$

16,442,918

$

16,008,075


196.98

%

Categorized as:


Available-for-Sale Securities

$

6,777,748

$

6,777,748

$

6,547,421

$

6,547,421


$

8,479,909

$

8,479,909

$

7,088,870

$

7,088,870


Held-to-Maturity Securities, net

$

9,104,499

$

8,944,221

$

9,328,665

$

9,684,274


$

10,697,606

$

10,238,489

$

9,354,048

$

8,919,205


(a)

Carrying values include fair values for AFS securities.

(b)

Non-MBS Includes Housing finance agency bonds.

(c)

Excludes Trading portfolio.

The following tables summarize external rating information of the held-to-maturity portfolio (carrying values in thousands):

Table 3.3    External Rating of the Held-to-Maturity Portfolio

June 30, 2022

June 30, 2023

Below 

Below 

Investment 

Investment 


AAA-rated (a)


AA-rated (b)


A-rated


BBB-rated


Grade


Total


AAA-rated (a)


AA-rated (b)


A-rated


BBB-rated


Grade


Total

Mortgage-backed securities

$

170

$

8,869,073

$

41,922

$

492

$

11,733

$

8,923,390

$

121

$

10,486,080

$

31,259

$

295

$

10,498

$

10,528,253

State and local housing finance agency obligations


179,757


1,352


181,109


169,353


169,353

Total Long-term securities

$

170

$

9,048,830

$

43,274

$

492

$

11,733

$

9,104,499

$

121

$

10,655,433

$

31,259

$

295

$

10,498

$

10,697,606

December 31, 2021

December 31, 2022

Below 

Below 

Investment 

Investment 


AAA-rated (a)


AA-rated (b)


A-rated


BBB-rated


Grade


Total


AAA-rated (a)


AA-rated (b)


A-rated


BBB-rated


Grade


Total

Mortgage-backed securities

$

229

$

9,082,287

$

48,055

$

616

$

12,592

$

9,143,779

$

140

$

9,128,951

$

35,898

$

382

$

11,560

$

9,176,931

State and local housing finance agency obligations


183,330


1,556


184,886


175,974


1,143


177,117

Total Long-term securities

$

229

$

9,265,617

$

49,611

$

616

$

12,592

$

9,328,665

$

140

$

9,304,925

$

37,041

$

382

$

11,560

$

9,354,048

See footnotes (a) and (b) under Table 3.4.

8178

Table of Contents

The following tables summarize external rating information of the AFS portfolio (the carrying values of AFS investments are at fair values; in thousands):

Table 3.4    External Rating of the Available-for-Sale Portfolio


June 30, 2022


June 30, 2023

Below 

Below 

Investment

Investment


AAA-rated(a)


AA-rated(b)


A-rated


BBB-rated


Grade


Total


AAA-rated(a)


AA-rated(b)


A-rated


BBB-rated


Grade


Total

Mortgage-backed securities

$

$

5,665,334

$

$

$

$

5,665,334

$

$

7,374,163

$

$

$

$

7,374,163

State and local housing finance agency obligations


16,900


1,094,039


1,475


1,112,414


12,355

1,093,391

1,105,746

Total Long-term securities

$

16,900

$

6,759,373

$

$

1,475

$

$

6,777,748

$

12,355

$

8,467,554

$

$

$

$

8,479,909

December 31, 2021

December 31, 2022

Below

Below

Investment

Investment


AAA-rated(a)


AA-rated(b)


A-rated


BBB-rated


Grade


Total


AAA-rated(a)


AA-rated(b)


A-rated


BBB-rated


Grade


Total

Mortgage-backed securities

$

$

5,548,784

$

$

$

$

5,548,784

$

$

5,979,841

$

$

$

$

5,979,841

State and local housing finance agency obligations

18,951

977,507

2,179

998,637

14,622

1,093,657

750

1,109,029

Total Long-term securities

$

18,951

$

6,526,291

$

$

2,179

$

$

6,547,421

$

14,622

$

7,073,498

$

$

750

$

$

7,088,870

Footnotes to Table 3.3 and Table 3.4.

(a)

Certain PLMBS and housing finance bonds have been assigned AAA, based on the ratings by S&P and Moody’s.

(b)

We have assigned GSE-issued MBS a rating of AA+ based on the credit rating assigned to long-term senior debt issued by Fannie Mae, Freddie Mac, and U.S. Agency. The debt ratings are based on S&P’s rating of AA+ for the GSE Senior long-term debt and AA+ for the debt issued by the U.S. government; Moody’s debt rating is Aaa for the GSE Senior long-term debt and the U.S. government.

External credit rating information has been provided in Table 3.3 and Table 3.4 as the information is used as another data point to supplement our credit quality indicators, and they serve as a useful indicator when analyzing the degree of credit risk to which we are exposed. Significant changes in credit ratings classifications of our investment debt securities portfolio could indicate increased credit risk for us that could be accompanied by a reduction in the fair values of our investment debt securities portfolio.

Fair Value Levels of Investment Debt Securities

To compute fair values, multiple vendor prices were received for substantially all of our MBS holdings, and substantially all of those prices fell within specified thresholds. The relative proximity of the prices received from the multiple vendors supported our conclusion that the final computed prices were reasonable estimates of fair values. GSE securities priced under such a valuation technique using the market approach are typically classified within Level 2 of the valuation hierarchy.

The fair value of State and local housing finance agency obligations is estimated by management using information primarily from pricing services. Due to the current lack of significant market activity, their fair values were categorized as Level 3 of the valuation hierarchy. For a comparison of carrying values and fair values of investment debt securities, see financial statements, Note 5. Trading securities, Note 7. Available-for-Sale Securities and Note 8. Held-to-Maturity Securities. For more information about the corroboration and other analytical procedures performed, see Note 18. Fair Values of Financial Instruments. Also see Note 7. Available-for-sale securities for an explanation of amortized cost for securities hedged under ASC 815 fair value hedges.

8279

Table of Contents

Weighted average rates — Mortgage-backed securities (HTM and AFS) — The following table summarizes weighted average rates (yields) and amortized cost by contractual maturities (dollars in thousands):

Table 3.5    Mortgage-Backed Securities Weighted Average Rates by Contractual Maturities

June 30, 2022

December 31, 2021


June 30, 2023

December 31, 2022


Amortized

Weighted

Amortized

Weighted


Amortized

Weighted

Amortized

Weighted


Cost


Average Rate


Cost


Average Rate


Cost


Average Rate (a)


Cost


Average Rate (a)


Mortgage-backed securities


Due in one year or less

$

754,814


2.75

%  

$

622,150


2.63

%

$

142,997


3.68

%  

$

375,711


3.04

%

Due after one year through five years


4,500,110


2.61


4,120,381


2.47


6,354,507


3.60


5,610,679


3.36

Due after five years through ten years


7,854,432


2.70


8,002,850


2.51


9,568,989


3.33


7,654,366


2.83

Due after ten years


1,614,839


2.26


1,793,274


1.46


2,064,498


4.50


1,750,120


3.80

Total Mortgage-backed securities

$

14,724,195


2.63

%  

$

14,538,655


2.37

%

$

18,130,991


3.56

%  

$

15,390,876


3.14

%

(a)Average yields are derived by dividing interest income by the average amortized cost balances of the related maturity bucket.

A significant portion of the MBS portfolio consists of floating-rate securities and the weighted average rates will change in parallel with changes in the LIBORSOFR-OIS or now other benchmarked rates where applicable.

Fair Value Hedges of Fixed-rate Available-for-sale Mortgage-backed Securities

The adoption of ASU 2017-12 provided an alternative guidance in the application of partial-term hedging. The ASU also provided a new approach that allows entities to hedge only the benchmark rate instead of the entire coupon of a fixed-rate instrument in a fair value hedge. We have adopted the guidance in the ASU to hedge designated available-for-sale fixed-rate CMBS. The following table summarizes key data (in thousands):

Table 3.6    Fair Value Hedges of Fixed-Rate Prepayable CMBS

Fair Value Hedges of Fixed-Rate Prepayable CMBS

Fair Value Hedges of Fixed-Rate Prepayable CMBS


June 30, 2022


December 31, 2021


June 30, 2023


December 31, 2022

Current face value of hedged CMBS

$

4,068,361

$

3,190,361

$

6,272,604

$

4,787,741

Partial-term hedge face value of hedged CMBS

$

3,626,000

$

2,859,000

$

5,633,000

$

4,263,000

Cumulative basis adjustment gains (losses)

$

(386,473)

$

(30,667)

$

(600,419)

$

(575,104)

Interest rate swap contracts (par)

$

3,626,000

$

2,859,000

$

5,633,000

$

4,263,000

Short-term investments

We typically maintain substantial investments in high quality short- and intermediate-term financial instruments such as secured overnight transactions collateralized by securities, including unsecured overnight and term deposits and federal funds sold to highly-rated financial institutions who also satisfy other credit quality factors. These investments provide the liquidity necessary to meet members’ credit needs. Short-term investments also provide a flexible means of implementing the asset/liability management decisions to adjust liquidity. We also invest in a liquidity trading portfolio, consisting of U.S. treasury securities, with the objective of satisfying our liquidity requirements and expanding our choice of investing for liquidity.

Monitoring — We actively monitor our credit exposures and the credit quality of our counterparties, including an assessment of each counterparty’s financial performance, capital adequacy, and sovereign support as well as related market signals, and actively limit or suspend existing exposures, as appropriate. In addition, we are required to manage our unsecured portfolio subject to regulatory limits prescribed by our regulator, the Finance Agency. The Finance Agency regulations include limits on the amount of unsecured credit that may be extended to a counterparty or a group of affiliated counterparties, based upon a percentage of eligible regulatory capital and the counterparty’s overall credit rating. Under these regulations, the level of eligible regulatory capital is determined as the lesser of our regulatory capital or the eligible amount of regulatory capital of the counterparty determined in accordance with Finance Agency regulations.

8380

Table of Contents

The Finance Agency regulations also permit us to extend additional unsecured credit, which could be comprised of overnight extensions and sales of federal funds subject to continuing contract. Our total unsecured overnight exposure to a single counterparty may not exceed twice the regulatory limit for term exposures. We are prohibited by Finance Agency regulation from investing in financial instruments issued by non-U.S. entities other than those issued by U.S. branches and agency offices of foreign commercial banks, and we did not own any financial instruments issued by foreign sovereign governments, including those countries that are members of the European Union in any periods in this report.

Securities purchased under agreements to resell — As part of our banking activities with counterparties, we have entered into secured financing transactions that mature overnight and can be extended only at our discretion. These transactions involve the lending of cash against securities, which are accepted as collateral. ThereThe balance outstanding under such agreements were no outstanding balance$16.7 billion at June 30, 2022. At2023 and $4.2 billion at December 31, 2021, outstanding balance were $1.2 billion.2022. Resale agreements averaged $5.5$9.9 billion and $225.2 million in the second quarter of 20222023 and $13.0 million in the fourth quarter of 2021.2022, respectively. For more information, see financial statements, Note 4. Interest-bearing Deposits, Federal Funds Sold and Securities Purchased under Agreements to Resell.

Federal funds sold — Federal funds sold was $8.7$15.6 billion at June 30, 2022,2023, and $7.2$9.5 billion at December 31, 2021,2022, and averaged $10.7$21.1 billion and $11.5 billion in the second quarter of 20222023 and $10.8 billion in the fourth quarter of 2021.2022, respectively. Investments represent unsecured lending to major banks and financial institutions. We are a major lender in this market, particularly in the overnight market. The amount of unsecured credit risk that may be extended to individual counterparties is commensurate with the counterparty’s credit quality as assessed by our management, and the assessment would include reviews of credit ratings of counterparty’s debt securities or deposits as reported by NRSROs. Overnight and short-term federal funds allow us to warehouse funds and provide balance sheet liquidity to meet unexpected member borrowing demands.

The following table summarizes par value, amortized cost and the carrying value (fair value) of the trading portfolio (in thousands):

Table 3.7    Trading Securities

Trading Securities

Trading Securities


June 30, 2022


December 31, 2021


June 30, 2023


December 31, 2022

Par value

$

8,100,925


$

5,850,925

$

5,850,925


$

7,675,925

Amortized cost

$

7,978,864

$

5,835,212

$

5,644,003

$

7,486,397

Carrying/Fair value

$

7,712,829

$

5,821,380

$

5,285,390

$

7,113,419

The Finance Agency prohibits speculative investments but allows permitted securities to be deemed held for liquidity if invested in a trading portfolio. We may dispose of such investments if liquidity needs are met and market conditions deem the sale as advantageous. For more information about fair values of securities in the trading portfolio, see Note 5. Trading Securities in the Notes to the Financial Statements.

The following table summarizes economic hedges of fixed-rate trading securities held for liquidity (in thousands):

Table 3.8    Economic Hedges of Fixed-rate Liquidity Trading Securities

Economic Hedges of Fixed-Rate Trading

Economic Hedges of Fixed-Rate Trading

Securities

Securities


June 30, 2022


December 31, 2021


June 30, 2023


December 31, 2022

Par/Face amounts of portfolio of U.S. Treasury fixed-rate securities (a)

$

8,100,925

$

5,850,925

$

5,850,925

$

7,675,925

Par amounts of interest rate swaps

$

8,100,925

$

5,850,925

$

5,850,925

$

7,775,925

(a)

Balances represent outstanding amounts of U.S. Treasury securities.

Mortgage Loans Held-for-Portfolio, Net

Mortgage loans are carried in the Statements of Condition at amortized cost, less allowance for credit losses. The outstanding unpaid principal balance was $2.1 billion at June 30, 2022, a decrease2023, an increase of $0.1 billion$33.8 million (net of acquisitions and paydowns) from the balance at December 31, 2021.2022. Mortgage loan balances declinedincreased due to loan prepayments as a resultincrease in acquisitions. During 2023, the Bank purchased $117.2 million of the low interest rate environment.mortgage loans from members and paydowns were $80.5 million. Mortgage loans were investments in Mortgage Partnership Finance loans (MPF or MPF Program) and Mortgage Asset Program (MAP). Serious delinquencies at June 30, 20222023 were lower than December 31, 2021. Allowance for credit losses was $2.0 million at June 30, 2022, compared to $2.1 million at December 31, 2021.

8481

Table of Contents

lower than December 31, 2022. Allowance for credit losses was $3.5 million at June 30, 2023, and $1.9 million at December 31, 2022. This increase was primarily due to the implementation of a new vendor model as our existing vendor exiting this service.

Mortgage Partnership Finance Program — We investinvested in mortgage loans through the MPF Program, which is a secondary mortgage market structure under which eligible mortgage loans are purchased or funded from or through members who are Participating Financial Institution (PFI). We may also acquire MPF loans through participations with other FHLBanks, although our current acquisition strategy is to limit acquisitions through our PFIs.FHLBanks. MPF loans are conforming conventional and Governmentgovernment i.e., insured or guaranteed by the Federal Housing Administration (FHA), the Department of Veterans Affairs (VA) or the Rural Housing Service of the Department of Agriculture (RHS), fixed-rate mortgage loans secured primarily by single-family residential properties with maturities ranging from five to 30 years or participations in such mortgage loans. The FHLBank of Chicago (MPF Provider) developed the MPF Program in order to help fulfill the housing mission and to provide an additional source of liquidity to FHLBank members that choose to sell mortgage loans into the secondary market rather than holding them in their own portfolios. Finance Agency regulations define the acquisition of Acquired Member Assets (AMA) as a core mission activity of the FHLBanks. In order for MPF loans to meet the AMA requirements, the purchase and funding are structured so that the credit risk associated with MPF loans is shared with PFIs.

Mortgage Asset Program — The MAP program is a residential housing finance program in which the FHLBNY funds or purchases loans originated by members or affiliates. The FHLBNY offers the Mortgage Asset ProgramMAP as a secondary market outlet for PFI members to fund mortgages and be competitive in offering fixed-rate mortgage loan products.

In response to the COVID-19 pandemic, the Federal Government and various states have taken certain actions to allow the Federal Home Loans Banks to provide various forms of relief in response to the effects of the pandemic. These measures include forbearance and modification for MPF program loans. Loans under these agreements were not material at June 30, 2022. We are continuing to apply our policies, and not delaying the recognition of charge-offs, delinquencies, and nonaccruals status for the borrowers who would have otherwise moved into past due or nonaccruals status.

Mortgage loans — Conventional and Insured Loans — The following table classifies mortgage loans between conventional loans and loans insured by FHA/VA (in thousands):

Table 4.1    MPF by Conventional and Insured Loans


June 30, 2022


December 31, 2021


June 30, 2023


December 31, 2022

Federal Housing Administration and Veteran Administration insured loans

$

147,574

$

160,716

$

132,712

$

139,015

Conventional loans

1,842,114


1,999,543


1,675,538


1,743,571

Allowance for credit losses on mortgage loans

(1,805)


(1,956)


(2,578)


(1,665)

MPF loans held-for-portfolio, net (a)

$

1,987,883

$

2,158,303

$

1,805,672

$

1,880,921

(a)Balances represent MPF portfolio; MAP portfolio balance of $187.6$333.1 million as of June 30, 20222023 and $161.6$226.0 million as of December 31, 20212022 were not included.

Mortgage Loans — Loss Sharing and the Credit Enhancement Waterfall — For all loans acquired prior to June 1, 2017, the credit enhancement was computed as the amount that would bring an uninsured loan to “Double A” credit risk. For loans acquired after June 1, 2017, the credit enhancement is computed to a “Single A” credit risk. In the credit enhancement waterfall, we are responsible for the first loss layer. The second loss layer is the credit obligation of the PFI. We assume all residual risk. Also, see financial statements, Note 10. Mortgage Loans Held-for-Portfolio.

Loan and PFI Concentration — Loan concentration was in New York State, which is to be expected since many of the largest PFIs are located in New York. The tables below summarize concentrations — Geographic and PFI.

Table 4.2    Geographic Concentration of MPF Loans

June 30, 2022

December 31, 2021


June 30, 2023

December 31, 2022


Number of loans %


Amounts outstanding %


Number of loans %


Amounts outstanding %


Number of loans %


Amounts outstanding %


Number of loans %


Amounts outstanding %


New York State (a)


73.6

%  

68.7

%  

73.2

%  

68.0

%


73.6

%  

69.0

%  

73.6

%  

68.9

%

(a)MAP loans were not included in the above calculation.

8582

Table of Contents

Table4.3    Top Five Participating Financial Institutions — Concentration (par value, dollars in thousands):

June 30, 2022


June 30, 2023


Mortgage

Percent of Total


Mortgage

Percent of Total


Loans


Mortgage Loans


Loans


Mortgage Loans


Teachers Federal Credit Union

$

186,935

9.54

%

$

174,514

9.79

%

Bethpage Federal Credit Union

152,645

7.79

142,114

7.97

Citizens Bank, N.A. (a)


140,846


7.18

126,825


7.12

Webster Bank, N.A. (b)


133,028


6.79

119,426


6.70

Manasquan Bank


107,212


5.47

98,981


5.55

All Others


1,239,520


63.23

1,120,484


62.87

Total (c)

$

1,960,186


100.00

%

$

1,782,344


100.00

%

December 31, 2021


December 31, 2022


Mortgage

Percent of Total


Mortgage

Percent of Total


Loans


Mortgage Loans


Loans


Mortgage Loans


Teachers Federal Credit Union

$

195,737

9.20

%

$

179,424

9.67

%

Bethpage Federal Credit Union


164,021


7.71


146,068


7.87

Investors Bank


157,304


7.39

Sterling National Bank


143,790


6.76

Citizens Bank, N.A. (a)


132,105


7.12

Webster Bank, N.A. (b)


124,915


6.73

Manasquan Bank


116,256


5.46


102,641


5.54

All Others


1,350,691


63.48


1,169,975


63.07

Total (c)

$

2,127,799


100.00

%

$

1,855,128


100.00

%

(a)FHLBNY member Investors Bank merged into a non-member institution, Citizens Bank, N.A., on April 7, 2022. As a result, Investors Bank is no longer a member of the FHLBNY.
(b)FHLBNY member Sterling National Bank merged into a non-member institution, Webster Bank, N.A., on February 1, 2022. As a result, Sterling National Bank is no longer a member of the FHLBNY.
(c)MAP unpaid principal balances of $182.9$327.7 million as of June 30, 20222023 and $156.7$221.1 million as of December 31, 20212022 were not included.

Debt Financing Activity and Consolidated Obligations

Our primary source of funds continues to be the issuance of Consolidated obligation bonds and discount notes. In aggregate, carrying balances of CO bonds and CO discount notes were $107.1$159.0 billion and $97.0$147.3 billion at June 30, 20222023 and December 31, 2021.2022, respectively.

CO bonds and CO discount notes The carrying value of Consolidated obligation bonds (CO bonds or Consolidated obligation bonds) was $57.6$101.0 billion (par, $58.8$102.9 billion) at June 30, 2022,2023, compared to $54.8$85.5 billion (par, $54.5$87.5 billion) at December 31, 2021.2022. The carrying value of Consolidated obligation discount notes outstanding was $49.5$57.9 billion at June 30, 20222023 and $42.2$61.8 billion at December 31, 2021.2022.

Interest rate hedging Significant amounts of CO bonds have been designated under an ASC 815 fair value accounting hedge. Also, certain CO bonds were hedged by interest rate swaps in economic hedges. From time to time, we have also hedged the anticipatory issuance of fixed-rate CO bonds in a cash flow hedge under ASC 815. Certain CO bonds were elected under the FVO. As a result of hedging elections under ASC 815 and the elections under the FVO, carrying values of CO bonds included valuation basis adjustments. For more information about valuation basis adjustments on CO bonds, see Table 5.1 CO Bonds by Type.

From time to time, we hedge CO discount notes (discount notes) under ASC 815 fair value accounting; additionally, certain discount notes are also hedged under ASC 815 cash flow accounting hedge. Certain discount notes were elected under the FVO. As a result of accounting elections, carrying values of discount notes may include valuation basis adjustments. For more information about valuation basis adjustments on discount notes, see Table 5.7 Discount Notes Outstanding. Also, see financial statements, Note 17. Derivatives and Hedging Activities.

83

Table of Contents

Debt Ratings A FHLBank’s ability to access the capital markets to issue debt, as well as our cost of funds, is dependent on credit ratings from Nationally Recognized Statistical Rating Organizations. Consolidated obligations of FHLBanks are rated Aaa/P-1 by

86

Table of Contents

Moody’s, and AA+/A-1+ by S&P. Any rating actions on the U.S. Government would likely result in all individual FHLBanks’ long-term deposit ratings and the FHLBank System long-term bond rating moving in lock step with any U.S. sovereign rating action.

Joint and Several Liability Although we are primarily liable for our portion of Consolidated obligations (i.e. those issued on our behalf), we are also jointly and severally liable with the other FHLBanks for the payment of principal and interest on the Consolidated obligations of all the FHLBanks. For more information, see financial statements, Note 19. Commitments and Contingencies.

SOFR CO Bonds —The SOFR market continues to develop, and successful issuances of FHLBank System SOFR-linked floaters (Floating-rate notes or FRNs) have been an important development for the FHLBank debt and its support for SOFR.

The FHLBNY is an active participant in the issuance of SOFR-linked CO bonds. Outstanding balances were $7.1$38.3 billion at June 30, 20222023 and $4.8$33.0 billion at December 31, 2021.2022.

Consolidated obligation bonds

The following table summarizes types of Consolidated obligation bonds (CO Bonds) issued and outstanding (dollars in thousands):

Table 5.1    CO Bonds by Type

June 30, 2022

December 31, 2021


June 30, 2023

December 31, 2022


Percentage

Percentage

Percentage

Percentage


Amount


 of Total


Amount


 of Total


Amount


 of Total


Amount


 of Total


Fixed-rate, non-callable

$

27,027,830

45.99

%  

$

31,907,580

58.53

%

$

32,704,705

31.79

%  

$

30,482,290

34.83

%

Fixed-rate, callable


18,094,130


30.79


12,993,130


23.84


27,833,640


27.05


18,676,130


21.34

Step Up, callable


6,507,000


11.08


4,799,000


8.80


4,026,000


3.91


5,374,000


6.14

Step Down, callable

52,000

0.05

Floating rate, callable

1,665,000

2.83

1,265,000

2.32

250,000

0.29

Single-index floating rate


5,471,850


9.31


3,550,000


6.51


38,278,350


37.20


32,733,000


37.40

Total par value


58,765,810


100.00

%  


54,514,710


100.00

%


102,894,695


100.00

%  


87,515,420


100.00

%

Bond premiums


148,133


152,601


104,602


123,477


Bond discounts


(21,519)


(23,563)


(27,036)


(26,341)


Hedge valuation basis adjustments (a)


(1,334,064)


77,048


(1,842,731)


(2,015,128)


Hedge basis adjustments on de-designated hedges (b)


120,845


125,091


110,493


114,430


FVO (c) - valuation adjustments and accrued interest


(128,679)


(16,486)


(191,389)


(214,103)


Total Consolidated obligation-bonds

$

57,550,526


$

54,829,401

$

101,048,634


$

85,497,755

Fair value basis and valuation adjustments — Key determinants are factors such as run-offs and new transactions designated under an ASC 815 hedge or elected under the FVO, the forward swap curve, the volatility of the swap rates, the remaining duration to maturity, and for bonds elected under the FVO, the changes in the spread between the swap rate and the Consolidated obligation debt yields, and changes in interest payable, which is a component of the entire fair value of FVO bonds.

(a)Hedging valuation basis adjustmentsThe reported carrying values of hedged CO bonds are adjusted for changes in their fair values (fair value basis adjustments or fair value) that are attributable to changes in the benchmark risk being hedged. Our primary benchmarks are LIBOR, SOFR-OIS and Federal Funds-OIS, although we are actively transitioning away from LIBOR.Funds-OIS. In the hedging relationships, a benchmark is elected on an instrument-by-instrument basis and becomes the discounting basis under ASC 815 for computing changes in fair values for hedged CO bonds. Table 5.2 CO Bonds Hedged under Qualifying Fair Value Hedges discloses notional amounts of CO bonds hedged. The application of ASC 815 accounting methodology resulted in the recognition of net cumulative hedge valuation basis gains of $1.3$1.8 billion at June 30, 20222023 and losses of $77.0 million$2.0 billion at December 31, 2021.2022. Generally, hedge valuation basis gains and losses are unrealized and are expected to reverse to zero if the CO bonds are held to maturity or are called on the early option exercise dates.

8784

Table of Contents

(b)Valuation basis of terminated hedgesRepresents unamortized cumulative valuation basis of certain CO bonds that were no longer in fair value hedge relationships. When hedging relationships for the debt were de-designated, the net unrealized cumulative losses at the hedge termination dates were no longer adjusted for changes in the benchmark rate. Instead, the valuation basis is being amortized on a level yield method, and the net amortization is recorded as a reduction of Interest expense. If the CO bonds are held to maturity, the basis losses will be fully amortized as interest expense.

(c)FVO valuation adjustments Valuation basis adjustments and accrued interest payable are recorded to recognize changes in the entire fair value (the full fair value) of CO bonds elected under the FVO. Table 5.3 CO Bonds Elected under the Fair Value Option (FVO) discloses par amounts of CO bonds elected under the FVO.

We have elected the FVO on an instrument-by-instrument basis. For bonds elected under the FVO, it was not necessary to estimate changes attributable to instrument-specific credit risk, as we consider the credit worthiness of the FHLBanks to be secure and credit related adjustments unnecessary. More information about debt elected under the FVO is provided in financial statements, Note 18. Fair Values of Financial Instruments (See Fair Value Option Disclosures).

Hedge volume Tables 5.2 – 5.4 provide information with respect to par amounts of CO bonds based on accounting designation: (1) under hedge qualifying rules, (2) under the FVO, and (3) as an economic hedge.

Qualifying hedges Generally, fixed-rate (bullet and callable) medium and long-term Consolidated obligation bonds are hedged in a Fair value ASC 815 qualifying hedge.

The following table provides information on CO bonds in an ASC 815 qualifying hedge relationship (in thousands):

Table 5.2    CO Bonds Hedged under Qualifying Fair Value Hedges

Consolidated Obligation Bonds

Consolidated Obligation Bonds

Par Amount


June 30, 2022


December 31, 2021


June 30, 2023


December 31, 2022

Qualifying hedges


Fixed-rate bullet bonds

$

13,483,010

$

15,333,890

$

18,614,245

$

16,995,505

Fixed-rate callable bonds


23,390,130


16,488,130


30,119,640


22,614,130

$

36,873,140

$

31,822,020

$

48,733,885

$

39,609,635

CO bonds elected under the FVO If at inception of a hedge we do not believe that a hedge would be highly effective in offsetting fair value changes between the derivative and the debt (hedged item), we may designate the debt under the FVO. We would record fair value changes of the FVO debt through earnings, and to the extent the debt is economically hedged, record changes in the fair values of the interest rate swap through earnings. The recorded balance sheet value of debt under the FVO would include the fair value basis adjustments, so that the debt’s balance sheet carrying values would be its full fair value.

The following table provides information on CO bonds elected under the fair value option (in thousands):

Table 5.3    CO Bonds Elected under the Fair Value Option (FVO)

Consolidated Obligation Bonds

Consolidated Obligation Bonds

Par Amount


June 30, 2022


December 31, 2021


June 30, 2023


December 31, 2022

Bonds designated under FVO

$

3,747,575

$

7,402,560

$

4,373,965

$

4,373,965

CO bonds elected under the FVO were generally in economic hedges by the execution of interest rate swaps that converted the fixed-rate bonds to a variable-rate instrument. We elected to account for the bonds under the FVO when we were generally unable to assert with confidence that the short- and intermediate-term bonds, or callable bonds, with short lock-out periods to the exercise of call options, would remain effective hedges as required under hedge accounting rules. We may also elect the FVO to achieve asset liability objectives. Designation of CO bonds under the FVO is an asset-liability management decision. For more information, see financial statements, Fair Value Option Disclosures in Note 18. Fair Values of Financial Instruments.

Economic hedges of CO bonds We issue floating-rate debt indexed to a benchmark rate (LIBOR, Federal(Federal Funds-OIS or SOFR-OIS)SOFR-OIS and LIBOR previously) and may then execute interest rate swaps that would synthetically convert the cash flows to the desired floating-rate funding indexed to another benchmark to meet our asset/liability funding strategies. The carrying value of the debt would not include fair value basis since the debt is recorded at amortized cost.

8885

Table of Contents

The following table provides information on CO bonds in an economic hedge relationship (in thousands):

Table 5.4    Economic Hedges of CO Bonds (data in table excludes CO bonds elected under the FVO)

Consolidated Obligation Bonds

Consolidated Obligation Bonds

Par Amount


December 31, 2021


June 30, 2023


December 31, 2022

Bonds designated as economically hedged


Floating-rate bonds (a)

$

250,000

$

$

Fixed-rate bonds (b)


220,000


1,100,000


15,000

$

470,000

$

1,100,000

$

15,000

(a)

Floating-rate debt Floating-rate bonds were typically indexed to 1-month LIBOR and SOFR-OIS. With the execution of basis hedges, certain floating-rate bonds were swapped in economic hedges to indices (SOFR-OIS and Federal Funds-OIS) that met our asset/liability interest rate risk management objectives, mitigating the basis risk between the index attached to the debt and the target benchmark.

(b)

Fixed-rate debt Bonds that were previously hedged and have fallen out of effectiveness.

CO Bonds — Maturity or Next Call Date (a)

Callable bonds contain an exercise date or a series of exercise dates that may result in a shorter redemption period. The following table summarizes par amounts of Consolidated bonds outstanding by years to maturity or next call date (dollars in thousands):

Table 5.5    CO Bonds — Maturity or Next Call Date(a)

June 30, 2022

December 31, 2021


June 30, 2023

December 31, 2022


Percentage 

Percentage  


Percentage 

Percentage  


Amount


of Total


Amount


of Total


Amount


of Total


Amount


of Total


Year of maturity or next call date


Due or callable in one year or less

$

38,700,130


65.86

%  

$

37,107,475


68.07

%

$

82,173,815


79.86

%  

$

63,600,290


72.67

%

Due or callable after one year through two years


8,764,080


14.91


6,990,160


12.82


8,043,120


7.82


11,586,805


13.24

Due or callable after two years through three years


2,183,485


3.72


2,331,385


4.28


4,901,405


4.76


3,061,985


3.50

Due or callable after three years through four years


3,097,105


5.27


2,013,085


3.69


2,489,115


2.42


3,164,905


3.62

Due or callable after four years through five years


1,817,565


3.09


1,825,905


3.35


1,771,280


1.72


1,487,435


1.70

Thereafter


4,203,445


7.15


4,246,700


7.79


3,515,960


3.42


4,614,000


5.27

Total par value

$

58,765,810


100.00

%  

$

54,514,710


100.00

%

$

102,894,695


100.00

%  

$

87,515,420


100.00

%

(a)Contrasting Consolidated obligation bonds by contractual maturity dates (see financial statements, Note 12. Consolidated Obligations — Redemption Terms of Consolidated Obligation Bonds) with potential call dates (as reported in table above) illustrates the impact of hedging on the effective duration of the bond. With a callable bond, we have purchased the option to terminate debt at agreed upon dates from investors. The call options are exercisable as either a one-time option or quarterly. Our current practice is to exercise our option to call a bond when the swap counterparty exercises its option to call the cancellable swap hedging the callable bond. Thus, issuance of a callable bond with an associated callable swap significantly alters the contractual maturity characteristics of the original bond and introduces the possibility of an exercise call date that is significantly shorter than the contractual maturity.

The following table summarizes callable bonds versus non-callable CO bonds outstanding (par amounts, in thousands):

Table 5.6    Outstanding Callable CO Bonds versus Non-callable CO bonds


June 30, 2022


December 31, 2021


June 30, 2023


December 31, 2022

Callable

$

26,266,130

$

19,057,130

$

31,911,640

$

24,300,130

Non-Callable

$

32,499,680

$

35,457,580

$

70,983,055

$

63,215,290

8986

Table of Contents

CO Discount Notes

The following table summarizes discount notes issued and outstanding (dollars in thousands):

Table 5.7    Discount Notes Outstanding


June 30, 2022


December 31, 2021


June 30, 2023


December 31, 2022


Par value

$

49,705,943

$

42,204,430

$

58,569,123

$

62,295,735

Amortized cost

$

49,577,693

$

42,197,683

$

57,947,226

$

61,832,418

Hedge value basis adjustments (a)


(58,458)

(424)


(35,325)

(39,088)

Hedge basis adjustments on de-designated hedges (b)

(3)

(341)

FVO (c) - valuation adjustments and remaining accretion


Total discount notes

$

49,519,232

$

42,197,259

$

57,911,901

$

61,792,989

Weighted average interest rate


1.60

%  


0.06

%


4.92

%  


3.97

%

(a)Hedging valuationHedge value basis adjustments The reported carrying values of hedged CO discount notes are adjusted for changes in their fair values (fair value basis adjustments or fair value) that are attributable to changes in the benchmark risk being hedged. In the hedging relationships, a specific benchmark is elected on an instrument-by-instrument basis and becomes the discounting basis under ASC 815 for computing changes in fair values for the hedged CO discount notes. Notional amounts of $31.1$46.3 billion and $3.4$34.6 billion were hedged under ASC 815 qualifying fair value hedges at June 30, 20222023 and December 31, 2021,2022, respectively. The application of ASC 815 accounting methodology resulted in immaterial amounts of net cumulative hedge valuation adjustments as noted in the table above. Generally, hedge valuation basis gains and losses are unrealized and are expected to reverse to zero if the CO discount notes are held to maturity.

(b)Hedge basis adjustments on de-designated hedges — Represents the unamortized balances of valuation basis of CO discount notes that were previously in a fair value hedging relationship. Generally, when a hedging relationship is de-designated, the valuation basis is no longer adjusted for changes in the valuation of the debt for changes in the benchmark rate; instead, the basis is amortized over the debt’s remaining life, so that at maturity of the debt the unamortized basis is reversed to zero.

(c)FVO valuation adjustments — Valuation basis adjustmentadjustments are recorded to recognize changes in the entire or full fair values including unaccreted discounts on CO discount notes elected under the FVO. Changes in benchmark interest rates, notional amounts of CO discount notes elected under FVO and remaining terms to maturity are factors that impact hedge valuation adjustments. No CO discount notes were elected under the FVO at June 30, 20222023 and December 31, 2021.2022.

The following table summarizes Fair Value hedges of discount notes (in thousands):

Table 5.8    Fair Value Hedges of Discount Notes

Consolidated Obligation Discount Notes

Consolidated Obligation Discount Notes

Principal Amount


June 30, 2022

December 31, 2021


June 30, 2023


December 31, 2022

Discount notes hedged under qualifying hedge

$

31,051,026


$

3,374,841

$

46,292,903

$

34,626,552

The following table summarizes economic hedges of discount notes (in thousands):

Table 5.9    Economic Hedges of Discount Notes

Consolidated Obligation Discount Notes

Consolidated Obligation Discount Notes

Par Amount


June 30, 2022


June 30, 2023

December 31, 2022

Discount notes designated as economic hedges (a)

$

8,779,885

$

353,716


$

13,940,198

(a)

Represents CO discount notes that were de-designated; unamortized hedge basis adjustments were not material. No CO discount notes were outstanding at December 31, 2021 for economic hedges.adjustments.

9087

Table of Contents

The following table summarizes Cash flow hedges of discount notes (in thousands):

Table 5.10    Cash Flow Hedges of Discount Notes

Consolidated Obligation Discount Notes

Consolidated Obligation Discount Notes

Principal Amount


June 30, 2022


December 31, 2021


June 30, 2023


December 31, 2022

Discount notes hedged under qualifying hedge (a)

$

1,608,000


$

1,693,000

$

1,608,000


$

1,608,000

(a)

Amounts represent discounts notes issued in cash flow “rollover” hedge strategies that hedged the variability of 91-day discount notes issued in sequence. The original maturities of the interest rate swaps typically ranged from 10-15 years. In this strategy, the discount note expense, which resets every 91 days, is synthetically converted to fixed cash flows over the hedge periods, thereby achieving hedge objectives. For more information, see financial statements, Cash flow hedge gains and losses in Note 17. Derivatives and Hedging Activities.

Discount Notes under the Fair Value Option (FVO)

CO discount notes elected under the FVO were generally in economic hedges with the execution of interest rate swaps that converted the fixed-rate notes to a variable-rate instrument.instruments. We elected to account for the discount notes under the FVO when we were generally unable to assert with confidence that the discount notes would remain effective hedges as required under hedge accounting rules. See Fair Value Option Disclosures in Note 18. Fair Values of Financial Instruments. No CO discount notes were elected under the FVO at June 30, 20222023 and December 31, 2021.2022.

Accrued interest payable

Accrued interest payable Amounts outstanding were $176.9$619.7 million at June 30, 20222023 and $127.0$370.5 million at December 31, 2021.2022. Accrued interest payable was comprised primarily of interest due and unpaid on CO bonds, which are generally payable on a semi-annual basis. Fluctuations in unpaid interest balances on bonds are due to the timing of semi-annual coupon accruals and payments at the balance sheet dates.

Other Liabilities

Other liabilities — Amounts outstanding were $140.4$122.5 million at June 30, 20222023 and $182.5$131.4 million at December 31, 2021.2022. Other liabilities comprised of unfunded pension liabilities, Federal Reserve pass-through reserves held on behalf of members, and miscellaneous payables.

Stockholders’ Capital

The following table summarizes the components of Stockholders’ capital (in thousands):

Table6.1    Stockholders’ Capital


June 30, 2022


December 31, 2021


June 30, 2023


December 31, 2022

Capital Stock (a)

$

4,939,244

$

4,500,785

$

6,361,603

$

6,387,701

Unrestricted retained earnings (b)


1,108,765


1,103,585


1,288,745


1,185,112

Restricted retained earnings (c)


854,053


827,380


993,719


910,855

Accumulated Other Comprehensive Income (Loss)


(139,195)


14,103


(126,450)


(136,285)

Total Capital

$

6,762,867

$

6,445,853

$

8,517,617

$

8,347,383

(a)

Stockholders’ Capital — Capital stock decreasedincreased in line with the decreaseincrease in advances borrowed. When an advance matures or is prepaid, the excess capital stock is repurchased by the FHLBNY. When an advance is borrowed or a member joins the FHLBNY’s membership, the member is required to purchase capital stock.

(b)

Unrestricted retained earnings Net income is added to this balance. Dividends are paid out of this balance. Funds are transferred to Restricted retained earnings balances as mandated by the FHLBank Joint Capital Enhancement Agreement (Capital Agreement).

9188

Table of Contents

(c)

Restricted retained earnings Restricted retained earnings balance at June 30, 20222023 has grown to $854.1$993.7 million from the time the provisions were implemented in 2011 when the FHLBanks, including the FHLBNY, agreed to set up a restricted retained earnings account. The FHLBNY will allocate at least 20% of its net income to the FHLBNY’s Restricted retained earnings account until the balance of the account equals at least 1% of FHLBNY’s average balance of outstanding Consolidated obligations for the current calendar quarter. By way of reference, the Restricted retained earnings target calculated at June 30, 20222023 was $1.0$1.7 billion based on the FHLBNY’s average consolidated obligations outstanding during the current calendar quarter, as compared to actual Restricted retained earnings of $854.1$993.7 million at June 30, 2022.2023. Also see Note 14. Capital Stock, Mandatorily Redeemable Capital Stock and Restricted Retained Earnings.

The following table summarizes the components of AOCI (in thousands):

Table 6.2    Accumulated Other Comprehensive Income (Loss) (AOCI)


June 30, 2022


December 31, 2021


June 30, 2023


December 31, 2022

Accumulated other comprehensive income (loss)


Non-credit portion on held-to-maturity securities, net (a)

$

(1,195)

$

(1,586)

$

(866)

$

(998)

Net market value unrealized gains (losses) on available-for-sale securities (b)


(520,838)


125,170


(828,618)


(808,772)

Net Fair value hedging gains (losses) on available-for-sale securities (b)


386,473


30,667


600,419


575,104

Net Cash flow hedging gains (losses) (c)


34,122


(101,499)


107,130


102,200

Employee supplemental retirement plans (d)


(37,757)


(38,649)


(4,515)


(3,819)

Total Accumulated other comprehensive income (loss)

$

(139,195)

$

14,103

$

(126,450)

$

(136,285)

(a)

Represents cumulative unamortized non-credit losses (also referred to as non-credit OTTI) recorded prior to the application of the framework under ASU 2016-13.losses. Balances in AOCI have declined due to accretion recorded as a reduction in AOCI and a corresponding increase in the balance sheet carrying values of the impaired securities.

(b)

Net market values unrealized gains (losses) on available-for-sale securities were losses of $520.8 million and gains of $125.2$828.6 million at June 30, 20222023 and net unrealized losses of $808.8 million at December 31, 2021, respectively, represent2022, represented third-party pricing vendors’ market-based unrealized gains/losses of securities designated as AFS. Net unrealized gains of $386.5$600.4 million and $30.7$575.1 million at June 30, 20222023 and December 31, 2021, respectively,2022, represent changes in the benchmark rate (the risk being hedged) calculated by the Bank’s internal models for AFS designated in ASC 815 hedging relationships. Hedging gains and losses are recorded through earnings with an offset to the carrying values of hedged AFS securities. Hedging basis will reverse to zero ifas hedges are allowed to mature.

(c)

Cash flow hedging gains (losses) recorded in AOCI were primarily the result of cash flow hedges of sequential issuance of discount notes; also included immaterial valuation basis of cash flow hedges of anticipatory issuance of CO bonds. See Table 6.3 AOCI Roll forward due to ASC 815 Hedging Programs.

(d)

Employee supplemental plans — Balances represent actuarially determined supplemental pension and postretirement health benefit liabilities that were not recognized through earnings.

The following table presents amounts recognized in and reclassified out of AOCI due to cash flow and fair value hedges (in thousands): Gains/(losses) are recorded in AOCI.

Table 6.3    AOCI Roll forward due to ASC 815 Hedging Programs

June 30, 2022

June 30, 2023

Cash Flow Hedges

Fair Value Hedges

Cash Flow Hedges

Fair Value Hedges

Rollover Hedge

Anticipatory

Rollover Hedge

Anticipatory


Program


Hedge Program


AFS Securities


Program


Hedge Program


AFS Securities

Beginning balance

$

(94,601)

$

(6,898)

$

30,667

$

103,468

$

(1,268)

$

575,104

Changes in fair values (a)


134,698


(301)


355,806


5,998


844


25,315

Amount reclassified


686


598


Fair Value - closed contract

538

(2,510)

Ending balance

$

40,097

$

(5,975)

$

386,473

$

109,466

$

(2,336)

$

600,419

Notional amount of swaps outstanding

$

1,608,000

$

115,000

$

3,626,000

$

1,608,000

$

3,000

$

5,633,000

9289

Table of Contents

December 31, 2021

Cash Flow Hedges

Fair Value Hedges

Rollover Hedge

Anticipatory


Program


Hedge Program


AFS Securities

Beginning balance

$

(198,494)

$

(8,710)

$

(44,052)

Changes in fair values (a)


103,893


74,719

Amount reclassified


1,511


Fair Value - closed contract


301


Ending balance

$

(94,601)

$

(6,898)

$

30,667

Notional amount of swaps outstanding

$

1,693,000

$

$

2,859,000

June 30, 2021

December 31, 2022

Cash Flow Hedges

Fair Value Hedges

Cash Flow Hedges

Fair Value Hedges

Rollover Hedge

Anticipatory

Rollover Hedge

Anticipatory


Program


Hedge Program


AFS Securities


Program


Hedge Program


AFS Securities

Beginning balance

$

(198,494)

$

(8,710)

$

(44,052)

$

(94,601)

$

(6,898)

$

30,667

Changes in fair values (a)


65,328


42,810


198,069


(805)


544,437

Amount reclassified


741


1,190


Fair Value - closed contract


5,245

Ending balance

$

(133,166)

$

(7,969)

$

(1,242)

$

103,468

$

(1,268)

$

575,104

Notional amount of swaps outstanding

$

1,806,000

$

$

1,432,000

$

1,608,000

$

54,005

$

4,263,000

June 30, 2022

Cash Flow Hedges

Fair Value Hedges

Rollover Hedge

Anticipatory


Program


Hedge Program


AFS Securities

Beginning balance

$

(94,601)

$

(6,898)

$

30,667

Changes in fair values (a)


134,698


(301)


355,806

Amount reclassified


686


Fair Value - closed contract


538

Ending balance

$

40,097

$

(5,975)

$

386,473

Notional amount of swaps outstanding

$

1,608,000

$

115,000

$

3,626,000

(a)

Represents fair value changes of open swap contracts in cash flow hedges. For more information, see Financial Statements, Note 17. Derivatives and Hedging Activities.

Dividends — By Finance Agency regulation, dividends may be paid out of current earnings or if certain conditions are met, may be paid out of previouslyprevious retained earnings. We may be restricted from paying dividends if we do not comply with any of the Finance Agency’s minimum capital requirements or if payment would cause us to fail to meet any of the minimum capital requirements, including our Retained earnings target as established by the Board of Directors of the FHLBNY. In addition, we may not pay dividends if any principal or interest due on any Consolidated obligations has not been paid in full, or if we fail to satisfy certain liquidity requirements under applicable Finance Agency regulations. None of these restrictions applied for any period presented.

The following table summarizes dividends paid and payout ratios:

Table 6.4    Dividends Paid and Payout Ratios

Six months ended


Six months ended


June 30, 2022


June 30, 2021


June 30, 2023


June 30, 2022


Cash dividends paid per share

$

2.27

$

2.43

$

3.80

$

2.27

Dividends paid (a) (c)

$

101,512

$

132,937

Dividends paid (a)(c)

$

227,823

$

101,512

Pay-out ratio (b)


76.12

%  


90.49

%


54.99

%  


76.12

%

(a)In thousands.
(b)Dividend paid during the period divided by net income for the period.
(c)Does not include dividends paid to non-members; for accounting purposes, such dividends are recorded as interest expense.

Derivative Instruments and Hedging Activities

Interest rate swaps, swaptions, cap and floor agreements (collectively, derivatives) enable us to manage our exposure to changes in interest rates by adjusting the effective maturity, repricing frequency, or option characteristics of financial instruments. To a limited extent, we also use interest rate swaps to hedge changes in interest rates prior to debt issuance and essentially lock in funding costs. Finance Agency regulations prohibit the speculative use of derivatives. For additional information about the methodologies adopted for the fair value measurement of derivatives, see financial statements, Note 18. Fair Values of Financial Instruments.

9390

Table of Contents

Derivatives Counterparty Credit Ratings

For information, and an analysis of our exposure due to non-performance of swap counterparties, see Table “Offsetting of Derivative Assets and Derivative Liabilities — Net Presentation” in Note 17. Derivatives and Hedging Activities to financial statements. For information about the methodologies adopted for the fair value measurement of derivatives, see financial statements, Note 18. Fair Values of Financial Instruments.

The following tables summarize notional amounts and fair values for the FHLBNY’s derivative exposures as represented by derivatives in fair value gain positions (in thousands):

Table 7.1    Derivatives Counterparty Credit Ratings

June 30, 2022

June 30, 2023

Net Derivatives

Cash Collateral

Non-Cash Collateral

Net Credit

Net Derivatives

Cash Collateral

Non-Cash Collateral

Net Credit

Fair Value

Pledged To (From)

Balance Sheet Net

Pledged To (From)

Exposure to

Fair Value

Pledged To (From)

Balance Sheet Net

Pledged To (From)

Exposure to

Credit Rating


Notional Amount


Before Collateral


Counterparties (a)


Credit Exposure


Counterparties (b)


Counterparties


Notional Amount


Before Collateral


Counterparties (a)


Credit Exposure


Counterparties (b)


Counterparties

Non-member counterparties

Asset positions with credit exposure

Uncleared derivatives

Single A asset (c)

$

697,033

$

10,994

$

(10,920)

$

74

$

$

74

Cleared derivatives assets (d)

$

858,112

$

3,601

$

$

3,601

$

19,371

$

22,972

822,476

955

955

21,994

22,949


858,112


3,601


3,601


19,371


22,972


1,519,509


11,949


(10,920)


1,029


21,994


23,023

Liability positions with credit exposure


Uncleared derivatives


Single A liability (c)


25,973,709


(935,511)


1,152,720


217,209


(110,575)


106,634


11,264,260


(261,775)


356,200


94,425


(84,198)


10,227

Triple B liability (c)


3,210,000


(166,419)


180,820


14,401


14,401


5,985,000


(139,092)


143,240


4,148


4,148

Cleared derivatives liability (d)


105,452,461


514,723


514,723


145,410,273


732,181


732,181


134,636,170


(1,101,930)


1,333,540


231,610


404,148


635,758


162,659,533


(400,867)


499,440


98,573


647,983


746,556

Total derivative positions with non-member counterparties to which the Bank had credit exposure


135,494,282


(1,098,329)


1,333,540


235,211


423,519


658,730


164,179,042


(388,918)


488,520


99,602


669,977


769,579

Delivery commitments


Derivative position with delivery commitments


4,713


12


12


(12)


7,616


Total derivative position with members


4,713


12


12


(12)


7,616


Total

$

135,498,995

$

(1,098,317)

$

1,333,540

$

235,223

$

423,507

$

658,730

$

164,186,658

$

(388,918)

$

488,520

$

99,602

$

669,977

$

769,579

Derivative positions without credit exposure


5,624,070


35,159,330


Total notional

$

141,123,065


$

199,345,988


9491

Table of Contents

December 31, 2021

Net Derivatives

Cash Collateral

Non-Cash Collateral

Net Credit

Fair Value

Pledged To (From)

Balance Sheet Net

Pledged To (From)

Exposure to

Credit Rating


Notional Amount


Before Collateral


Counterparties (a)


Credit Exposure


Counterparties (b)


Counterparties

Non-member counterparties

Asset positions with credit exposure

Uncleared derivatives

Single A asset (c)

$

4,182,000

$

50,094

$

73,000

$

123,094

$

(112,659)

$

10,435

Cleared derivatives assets (d)


4,191,067


743


743


33,859


34,602


8,373,067


50,837


73,000


123,837


(78,800)


45,037

Liability positions with credit exposure


Uncleared derivatives


Single A liability (c)


699,000


(6,478)


6,540


62


62

Triple B liability (c)

3,203,000

(167,564)

168,000

436

436

Cleared derivatives liability (d)


62,389,522


(3,951)


173,946


169,995


333,251


503,246


66,291,522


(177,993)


348,486


170,493


333,251


503,744

Total derivative positions with non-member counterparties to which the Bank had credit exposure


74,664,589


(127,156)


421,486


294,330


254,451


548,781

Member institutions


Derivative positions with member counterparties to which the Bank had credit exposure


79,000


3,165


3,165


(3,165)


Delivery commitments


Derivative position with delivery commitments


8,573


9


9


(9)


Total derivative position with members


87,573


3,174


3,174


(3,174)


Total

$

74,752,162

$

(123,982)

$

421,486

$

297,504

$

251,277

$

548,781

Derivative positions without credit exposure


20,247,014


Total notional

$

94,999,176


December 31, 2022

Net Derivatives

Cash Collateral

Non-Cash Collateral

Net Credit

Fair Value

Pledged To (From)

Balance Sheet Net

Pledged To (From)

Exposure to

Credit Rating


Notional Amount


Before Collateral


Counterparties (a)


Credit Exposure


Counterparties (b)


Counterparties

Non-member counterparties

Asset positions with credit exposure

Uncleared derivatives

Single A asset (c)

$

699,583

$

10,718

$

(10,120)

$

598

$

$

598

Cleared derivatives assets (d)


129,067,443

31,373

31,373

549,089

580,462


129,767,026


42,091


(10,120)


31,971


549,089


581,060

Liability positions with credit exposure


Uncleared derivatives


Single A liability (c)


9,654,020


(246,420)


376,180


129,760


(108,760)


21,000

Triple B liability (c)

6,035,000


(187,781)


189,970


2,189


2,189

Cleared derivatives liability (d)


839,545


27,667


27,667


16,528,565


(434,201)


566,150


131,949


(81,093)


50,856

Total derivative positions with non-member counterparties to which the Bank had credit exposure


146,295,591


(392,110)


556,030


163,920


467,996


631,916

Delivery commitments


Derivative position with delivery commitments


9,837


1


1


(1)


Total derivative position with members


9,837


1


1


(1)


Total

$

146,305,428

$

(392,109)

$

556,030

$

163,921

$

467,995

$

631,916

Derivative positions without credit exposure


27,737,130


Total notional

$

174,042,558


(a)

When collateral is posted to counterparties in excess of fair value liabilities that are due to counterparties, the excess collateral is classified as a component of derivative assets, as the excess represents a receivable and an exposure for the FHLBNY.

(b)

Non-cash collateral securities. Non-cash collateral was not deducted from net derivative assets on the balance sheet as control over the securities was not transferred.

(c)

NRSRO Ratings.

(d)

On cleared derivatives, we are required to pledge initial margin (considered as collateral) to Derivative Clearing Organizations (DCOs) in cash or securities. We had pledged $534.1$754.2 million and $367.1$576.8 million in marketable securities as collateral at June 30, 20222023 and December 31, 2021,2022, respectively. At June 30, 20222023 and December 31, 2021,2022 we had pledged $28.9 million and $173.9 million indid not pledge cash as collateralcollateral., respectively.

Liquidity, Cash Flows, Short-Term Borrowings and Short-Term Debt

Our primary source of liquidity is the issuance of Consolidated obligation bonds and discount notes. To refinance maturing Consolidated obligations, we rely on the willingness of our investors to purchase new issuances. We have access to the discount note market, and the efficiency of issuing discount notes is an important source of liquidity, since discount notes can be issued any time and in a variety of amounts and maturities. Member deposits and capital stock purchased by members are also sources of funds. Short-term unsecured borrowings from other FHLBanks and in the federal funds market, as well as secured borrowings in the repo market provide additional sources of liquidity. In addition, the Secretary of the Treasury is authorized to purchase up to $4.0 billion of Consolidated obligations from the FHLBanks. Our liquidity position remains in compliance with all regulatory requirements and management does not foresee any changes to that position.

9592

Table of Contents

Finance Agency Regulations — Liquidity

Regulatory requirements are specified in Parts 1239, 1270 and 1277 of the Finance Agency regulations and Advisory Bulletin 2018-07. Each FHLBank shall at all times have at least an amount of liquidity equal to the current deposits received from its members that may be invested in: (1) Obligations of the United States; (2) Deposits in banks or trust companies; and (3) Advances with a remaining maturity not to exceed five years that are made to members in conformity with part 1266. We are required to hold positive cash flow assuming no access to capital markets and assuming renewal of all maturing advances for a period of between ten to thirty calendar days and to maintain liquidity limits to reduce the risks associated with a mismatch in asset and liability maturities, including an undue reliance on short-term debt funding.

In addition, the Bank provides for Contingency Liquidity, which is defined as the sources of cash the Bank may use to meet its operational requirements when its access to the capital markets is impeded. We met our Contingency Liquidity requirements during all periods in this report. Liquidity in excess of requirements is summarized in the table titled Contingency Liquidity. Advisory Bulletin 2018-07 concerning liquidity was by policy fully implemented on December 31, 2019.

Liquidity Management

We actively manage our liquidity position to maintain stable, reliable, and cost-effective sources of funds while taking into account market conditions, member demand and the maturity profile of our assets and liabilities. We recognize that managing liquidity is critical to achieving our statutory mission of providing low-cost ready liquidity to our members. In managing liquidity risk, we are required to maintain certain liquidity measures in accordance with the FHLBank Act, an Advisory Bulletin and policies developed by management and approved by our Board of Directors. The applicable liquidity requirements are described in the next four sections.

Deposit Liquidity. We are required to invest an aggregate amount at least equal to the amount of current deposits received from members in: (1) Obligations of the United States; (2) Deposits in banks or trust companies; or (3) Advances with a remaining maturity not to exceed five years that are made to members in conformity with 12 CFR part 1266. In addition to accepting deposits from our members, we may accept deposits from other FHLBanks or from any other governmental instrumentality. We met these requirements at all times. Quarterly average reserves and actual reserves are summarized below (in millions):

Table 8.1    Deposit Liquidity


Average Deposit


Average Actual


Average Deposit


Average Actual


For the Quarters Ended

Reserve Required

Deposit Liquidity

Excess

Reserve Required

Deposit Liquidity

Excess

June 30, 2022

$

1,125

$

65,038

$

63,913

March 31, 2022

1,199

60,522

59,323

December 31, 2021


1,301


58,192


56,891

June 30, 2023

$

2,821

$

115,971

$

113,150

March 31, 2023

2,899

109,181

106,282

December 31, 2022


887


90,794


89,907

Operational Liquidity. We must be able to fund our activities as our balance sheet changes from day-to-day. We maintain the capacity to fund balance sheet growth through regular money market and capital market funding and investment activities. We monitor our operational liquidity needs by regularly comparing our demonstrated funding capacity with potential balance sheet growth. We take such actions as may be necessary to maintain adequate sources of funding for such growth. Operational liquidity is measured daily. We met these requirements at all times.

The following table summarizes excess operational liquidity (in millions):

Table 8.2    Operational Liquidity


Average Balance Sheet


Average Actual


Average Balance Sheet


Average Actual


For the Quarters Ended

Liquidity Requirement

Operational Liquidity

Excess

Liquidity Requirement

Operational Liquidity

Excess

June 30, 2022

$

3,711

$

27,171

$

23,460

March 31, 2022

2,944

27,048

24,104

December 31, 2021


4,174


23,534


19,360

June 30, 2023

$

31,863

$

53,127

$

21,264

March 31, 2023

19,411

44,351

24,940

December 31, 2022


6,990


32,666


25,676

9693

Table of Contents

Contingency Liquidity. The Bank holds “contingency liquidity” in an amount sufficient to meet our liquidity needs if we are unable to access the Consolidated obligation debt markets for at least five business days. Contingency liquidity includes (1) marketable assets with a maturity of one year or less; (2) self-liquidating assets with a maturity of one year or less; (3) assets that are generally acceptable as collateral in the repurchase market; and (4) irrevocable lines of credit from financial institutions receiving not less than the second-highest credit rating from a NRSRO. We consistently exceed the minimum requirements for contingency liquidity. Contingency liquidity is measured daily. We met these requirements at all times.

The following table summarizes excess contingency liquidity (in millions):

Table 8.3    Contingency Liquidity


Average Five Day


Average Actual


Average Five Day


Average Actual


For the Quarters Ended

Requirement

Contingency Liquidity

Excess

Requirement

Contingency Liquidity

Excess

June 30, 2022

$

2,309

$

24,717

$

22,408

March 31, 2022

1,881

24,382

22,501

December 31, 2021


1,115


21,023


19,908

June 30, 2023

$

4,127

$

51,590

$

47,463

March 31, 2023

3,137

42,038

38,901

December 31, 2022


2,269


29,280


27,011

The Liquidity standards in our risk management policy address our day-to-day operational and contingency liquidity needs. These standards enumerate the specific types of investments to be held to satisfy such liquidity needs and are outlined above. These standards also establish the methodology to be used in determining our operational and contingency needs. We continually monitor and project our cash needs, daily debt issuance capacity, and the amount and value of investments available for use in the market for repurchase agreements. We use this information to determine our liquidity needs and to develop appropriate liquidity plans.

The Finance Agency’s Liquidity Advisory Bulletin 2018-07 requires the Bank to maintain between 10 and 30 businesscalendar days (“the Range”) of positive cash flow assuming all advances renew. The Advisory Bulletin also requires usrenew and to hold liquidity in a specified range of the notional of our outstanding standby financial letters of credit andcredit. The FHFA has periodically issued non-public supervisory letters that establish base case guidance within the Range. For three days during March 2023, we were in the lower part of the Range, temporarily below the FHFA’s base case guidance, in order to meet significant member demand for advances resulting from the banking crisis, as permitted by the Advisory Bulletin. The Advisory Bulletin also provides guidance on maintaining appropriate funding gaps for three-month and one-year maturity horizons. The FHFA has periodically issued updated guidance in supervisory letters. We remainremained in compliance with the Advisory Bulletinfunding gaps provision and all Liquidity regulations.

Other Liquidity Contingencies. As discussed more fully under the section Debt Financing Activity and Consolidated Obligations, we are primarily liable for Consolidated obligations issued on our behalf. We are also jointly and severally liable with the other FHLBanks for the payment of principal and interest on the Consolidated obligations of all the FHLBanks. If the principal or interest on any Consolidated obligation issued on our behalf is not paid in full when due, we may not pay dividends, redeem or repurchase shares of stock of any member or non-member stockholder until the Finance Agency approves our Consolidated obligation payment plan or other remedy and until we pay all the interest or principal currently due on all our Consolidated obligations. The Finance Agency, at its discretion, may require any FHLBank to make principal or interest payments due on any Consolidated obligations.

Finance Agency regulations also state that the FHLBanks must maintain, free from any lien or pledge, the following types of assets in an amount at least equal to the amount of Consolidated obligations outstanding: Cash; Obligations of, or fully guaranteed by, the United States; Secured advances; Mortgages that have any guaranty, insurance, or commitment from the United States or any agency of the United States; and investments described in section 16(a) of the FHLBank Act, including securities that a fiduciary or trust fund may purchase under the laws of the state in which the FHLBank is located.

Cash flows

Cash and due from Banks was $45.1 million at June 30, 2023 and $163.7 million at June 30, 2022 and $52.6 million at June 30, 2021.2022. Cash and cash equivalents exclude short-term interest-bearing deposits, federal funds sold, and securities purchased under agreements to resell. The following discussion highlights the major activities and transactions that affected our cash flows.

Cash flows provided by/(used in) operating activities — Operating assets and liabilities support our lending activities to members, and can vary significantly in the normal course of business due to the amount and timing of cash flows, which are affected by member-driven borrowing, our investment strategies, and market conditions. Management believes cash flows from operations, available cash balances and our ability to generate cash through the issuance of Consolidated obligation bonds and discount notes are sufficient to fund our operating liquidity needs.

9794

Table of Contents

Operating activities resulted in $1.5 billion$467.6 million in net cash inflows in the six months ended June 30, 2022,2023, compared to net cash inflows of $0.5$1.5 billion in the same period in the prior year. Period changes in cash flows provided by or used in operating activities were largely driven by: (a) Net income was $133.4$414.3 million in the six months ended June 30, 20222023 and $146.9$133.4 million in the same period in the prior year; (b) Net cash inflows from Derivatives and hedging activities provided $1.1 billion in cash flowswere $12.9 million in the six months ended June 30, 2022,2023, compared to $0.3net cash inflows of $1.1 billion in cash flows in the same period in the prior year; and (c) PositiveNegative adjustments to operating cash flows of $13.9 million to recognize unrealized valuation gains on U.S. Treasury securities at June 30, 2023, compared to positive adjustments of $257.0 million to recognize unrealized valuation losses on U.S. Treasury securities at June 30, 2022, compared to $61.2 million in the same period in the prior year.

Cash flows provided by/(used in) investing activities— Investing activities resulted in $13.4$13.5 billion in net cash outflows in the six months ended June 30, 2022,2023 compared to $14.1$13.4 billion in net cash inflowsoutflows in the same period in the prior year. In the six months ended June 30, 2022,2023, we acquired $4.1 billion$657.8 million of Treasury securities compared to $1.9$4.1 billion in the same period of the prior year. Repayments from Treasury securities were $1.2$2.2 billion in the six months ended June 30, 20222023 compared to $6.5$1.2 billion in the same period in the prior year. Net cash inflowsoutflows from Securities purchased under agreements to resell were $1.2$12.5 billion in the six months ended June 30, 20222023 compared to net cash outflowsinflows of $4.1$1.2 billion in the same period in the prior year.

Cash flows provided by/(used in) financing activities — Our primary source of funding is the issuance of Consolidated obligation debt. Issuance of capital stock is another source. Financing activities reported net cash inflows of $12.1$13.0 billion in the six months ended June 30, 20222023 compared to net outflowscash inflows of $16.5$12.1 billion in the same period in the prior year.

For more information, see Statements of Cash Flows in the financial statements.

Short-term Borrowings and Short-term Debt

Our primary source of funds is the issuance of FHLBank debt. Consolidated obligation discount notes are issued with maturities up to one year and provide us with short-term funds. Discount notes are principally used in funding short-term advances, some long-term advances, as well as money market instruments. We also issue short-term Consolidated obligation bonds as part of our asset-liability management strategy. We may also borrow from another FHLBank, generally for a period of one day. Such borrowings have been historically insignificant.

Off-Balance Sheet Arrangements, Guarantees, and Other Commitments In accordance with regulations governing the operations of the FHLBanks, each FHLBank, including the FHLBNY, is jointly and severally liable for the FHLBank System’s Consolidated obligations issued under sections 11(a) and 11(c) of the FHLBank Act. The joint and several liability regulations authorizes the Finance Agency to require any FHLBank to repay all or a portion of the principal or interest on Consolidated obligations for which another FHLBank is the primary obligor.

In addition, in the ordinary course of business, the FHLBNY engages in financial transactions that, in accordance with U.S. GAAP, are not recorded on the FHLBNY’s balance sheet or may be recorded on the FHLBNY’s balance sheet in amounts that are different from the full contract or notional amount of the transactions. For example, the Bank routinely enters into commitments to purchase mortgage loans from PFIs, and issues standby letters of credit.

These commitments may represent future cash requirements of the Bank, although the standby letters of credit usually expire without being drawn upon. For more information about contractual obligations and commitments, see financial statements, Note 19. Commitments and Contingencies.

95

Table of Contents

Results of Operations

The following section provides a comparative discussion of the FHLBNY’s results of operations for the three and six months ended June 30, 20222023 and June 30, 2021.2022. For a discussion of the critical accounting estimates used by the FHLBNY that affect the results of operations, see financial statements, Note 1. CriticalSummary of Significant Accounting Policies and Estimates in the Bank’s most recent Form 10-K filed on March 22, 2022.Policies.

98

Table of Contents

Net Income

Interest income from advances is the principal source of revenue. Other sources of revenue are interest income from investment debt securities, liquidity trading securities, mortgage loans in the MPF and MAP portfolio, securities purchased under agreements to resell and federal funds sold. Fair value gains and losses on liquidity trading securities and equity investments also impact Net income. The primary expense is interest paid on Consolidated obligation debt. Other expenses are Compensation and benefits, Operating expenses, our share of operating expenses of the Office of Finance and the FHFA, and affordable housing program assessments on Net income. Other significant factors affecting our Net income include the volume and timing of investments in mortgage-backed securities, prepayments of advances, charges due to debt repurchased, gains and losses from derivatives and hedging activities, and earnings from investing our shareholders’ capital.

Summarized below are the principal components of Net income (in thousands):

Table 9.1    Principal Components of Net Income

Three months ended June 30, 

Six months ended June 30, 

Three months ended June 30, 

Six months ended June 30, 


2022


2021


2022


2021


2023


2022


2023


2022

Total interest income

$

386,265

$

247,534

$

608,675

$

529,809

$

2,351,668

$

386,265

$

4,233,356

$

608,675

Total interest expense


239,554


104,369


339,874


228,106


2,076,945


239,554


3,728,897


339,874

Net interest income before provision for credit losses


146,711


143,165


268,801


301,703


274,723


146,711


504,459


268,801

Provision (Reversal) for credit losses


(68)


(1,672)


(146)


(2,957)


1,783


(68)


1,876


(146)

Net interest income after provision for credit losses


146,779


144,837


268,947


304,660


272,940


146,779


502,583


268,947

Total other income (loss)


(15,328)


(9,625)


(28,083)


(42,243)


17,921


(15,328)


58,960


(28,083)

Total other expenses


46,560


52,203


92,582


99,172


51,096


46,560


101,161


92,582

Income before assessments


84,891


83,009


148,282


163,245


239,765


84,891


460,382


148,282

Affordable Housing Program Assessments


8,566


8,304


14,917


16,331


23,989


8,566


46,062


14,917

Net income

$

76,325

$

74,705

$

133,365

$

146,914

$

215,776

$

76,325

$

414,320

$

133,365

Net Income20222023 Second Quarter Compared to 20212022 Second Quarter

Net income — For the FHLBNY, Net income is Net interest income, minus Provision (Reversal) for credit losses, plus Other income (loss), less Other expenses and Assessments set aside for the FHLBNY’s Affordable Housing Program.

Net income for the 20222023 second quarter was $76.3$215.8 million, an increase of $1.6$139.5 million, or 2.2%182.7% compared to the same period in the prior year. Summarized below are the primary components of our Net income:

Net interest income — The 20222023 second quarter Net interest income was $146.7$274.7 million, an increase of $3.5$128.0 million, or 2.5%87.3% compared to the same period in the prior year. Net interest spread was 4533 basis points infor the 20222023 second quarter compared to 4445 basis points in the same period in the prior year. For more information, see Table 9.2 Net Interest Income and accompanying discussions in this MD&A.

Provision (Reversal) for credit losses for the quarter was a charge of $1.8 million compared to a recovery of $68 thousand for the same period in the prior year. The Bank transitioned models in June of 2023 and the newly adopted model assumptions are different than the prior model.

Other income (loss) — Other income (loss) reported a lossgain of $15.3$17.9 million in 2022the 2023 second quarter compared to a loss of $9.6$15.3 million in the same period in the prior year.

Service fees and other were $3.9$5.5 million in the 20222023 second quarter compared to $4.4$3.9 million reported in the same period in the prior year. Service fees and other are primarily fee revenues from financial letters of credit.

96

Table of Contents

Financial instruments carried at fair values reported net valuation gaingains of $36.8$16.7 million in the 20222023 second quarter compared to net gaingains of $3.9$36.8 million in the same period in the prior year. For more information, see financial statements, Fair Value Option Disclosures in Note 18. Fair Values of Financial Instruments. Also see Table 9.8 Other Income (Loss) and accompanying discussions in this MD&A.

Derivative activities reported net gains of $48.2$79.9 million in Other income in the 20222023 second quarter compared to net gains of $3.9$48.2 million in the same period in the prior year. For more information, see Table 9.10 Other Income (Loss) — Impact of Derivative Gains and Losses and accompanying discussions in this MD&A.

99

Table of Contents

U.S. Treasury Securities held for liquidity (classified as trading) reported net fair value losses of $93.7$88.1 million in the 20222023 second quarter compared to net fair value losses of $26.4$93.7 million in the same period in the prior year.

Equity Investments, held to finance payments to retirees in a non-qualified pension plans,plan, reported net fair value gains of $3.0 million in the 2023 second quarter compared to net losses of $10.4 million in the 2022same period in the prior year.

Litigation Settlement — For net settlement related to investments in LIBOR based financial instruments, the Bank received $0.9 million in the 2023 second quarter compared to net gains of $4.5 millionquarter. There were no settlement funds received in the same period in the prior year.

Other expenses were $46.6$51.1 million in the 20222023 second quarter compared to $52.2$46.6 million in the same period in the prior year. Other expenses are primarily Operating expenses, Compensation and benefits, and our share of expenses of the Office of Finance and the Federal Housing Finance Agency.

Operating expenses were $17.5$19.0 million in the 20222023 second quarter, downup from $18.2$17.5 million in the same period in the prior year.

Compensation and benefits expenses were $21.6$25.0 million in the 20222023 second quarter compared to $23.2$21.6 million in the same period in the prior year due to a decrease in headcount.year.

The expenses allocated for our share of the costs to operate the Office of Finance and the Federal Housing Finance Agency were $5.1$5.0 million in the 20222023 second quarter compared to $5.4$5.1 million in the same period in the prior year.

Other expenses were $2.4$2.0 million in the 20222023 second quarter compared to $5.5$2.4 million in the same period in the prior year.

Affordable Housing Program Assessments (AHP) allocated from Net income were $8.6$24.0 million in the 20222023 second quarter compared to $8.3$8.6 million in the same period in the prior year. Assessments are calculated as a percentage of Net income, and changes in allocations were in tandem with changes in Net income.

Net Income - Year-to-Date Period Ended June 30, 20222023 Compared to Year-to-Date Period Ended June 30, 20212022

Net income in the year-to-date period in the current year was $133.4$414.3 million, a decreasean increase of $13.5$281.0 million, or 9.2%210.7% compared to the same period in the prior year.

Net interest income in the year-to-date period in the current year was $268.8$504.5 million, a decreasean increase of $32.9$235.7 million, or 10.9%87.7%. Net interest spread was 4434 basis points in the current year-to-date period unchanged fromand 44 basis points in the same period in the prior year. For more information, see Table 9.2 Net Interest Income and accompanying discussions in this MD&A.

Other income (loss) — Other income (loss) in the year-to-date period ended June 30, the aggregate impact was a lossgain of $28.1$59.0 million in the 20222023 period compared to a loss of $42.2$28.1 million in the same period in the prior year.

97

Table of Contents

Other expenses were $92.6$101.2 million in the year-to-date period in the current year, compared to $99.2$92.6 million in the same period in the prior year. Operating expenses were $32.0$36.7 million in the year-to-date period in the current year slightly lower thanand $32.0 million in the prior year period. Compensation and benefits were $44.9$50.8 million in the year-to-date period in the current year, downup from $47.5$44.9 million in the prior year period due to a decreasean increase in headcount. The expenses allocated for our share of the costs to operate the Office of Finance and the Federal Housing Finance Agency were $10.8$10.1 million in the year-to-date period in the current year, compared to $11.0$10.8 million in the prior year period. Other expenses were $4.9$3.6 million in the year-to-date period in the current year and $8.3$4.9 million in the prior year period. Other expenses included contributions to homeowners and small businesses, the non-service elements of Net periodic pension benefit costs, and derivative clearing fees.

AHP assessmentsallocated from Net income were $14.9$46.1 million in the year-to-date period in the current year, compared to $16.3$14.9 million in the same period in the prior year.

Net Interest Income, Interest Rate Margins and Interest Rate Spreads

Net interest income is our principal source of Net income. It represents the difference between income on interest-earning assets and expense on interest-bearing liabilities.

100

Table of Contents

Changes in Net interest income are typically driven by changes in the volume of earning assets, as measured by average balances of earning assets, and the impact of market interest rates on earnings assets and funding costs. Interest income and expense accruals on interest rate swaps that qualified under the ASC 815 hedge accounting rules may impact year-over-year changes. Shareholders’ capital stock and retained earnings are also factors that impact net interest income as they provide interest free funding. Earnings on capital typically move directly with changes in short-term market interest rates. In a period when members prepay advances, the prepayment fees, which we receive may cause fluctuations in net interest income. For more information about factors that impact Interest income and Interest expense, see Table 9.3 Net Interest Adjustments from Qualifying Hedge Qualifying Interest Rate Swaps and discussions thereto. Also, see Table 9.4 Spread and Yield Analysis, and Table 9.5 Rate and Volume Analysis.

The following table summarizes Net interest income (dollars in thousands):

Table 9.2    Net Interest Income

Three months ended June 30, 

Six months ended June 30, 


Three months ended June 30, 

Six months ended June 30, 


Percentage

Percentage


Percentage

Percentage


2022


2021


Change


2022


2021


Change


2023


2022


Change


2023


2022


Change


Total interest income (a)

$

386,265

$

247,534

56.05

%  

$

608,675

$

529,809

14.89

%

$

2,351,668

$

386,265

508.82

%  

$

4,233,356

$

608,675

595.50

%

Total interest expense (a)


239,554


104,369


129.53


339,874


228,106


49.00


2,076,945


239,554


767.00


3,728,897


339,874


997.14

Net interest income before provision for credit losses

$

146,711

$

143,165


2.48

%  

$

268,801

$

301,703


(10.91)

%

$

274,723

$

146,711


87.25

%  

$

504,459

$

268,801


87.67

%

(a)

Total Interest Income and Total Interest Expense — See Tables 9.6 and 9.7 and accompanying discussions

In the 2022 second quarter of the current year, net interest income, before loan loss provisions, was $146.7$274.7 million, an increase of $3.5$128.0 million, or 2.5%87.3% from the second quarter of 2021.2022. Primary driver was a decreasean increase in the average balances of interest earning assets, principally advances. Additionally, $1.7$0.5 million of prepayment fees from Advances and Mortgage-backed securities were recorded in Net interest income in 2022the second quarter of 2023 compared to $4.5$1.7 million in 2021the second quarter. Financial marketsquarter of 2022. Interest rates continued to increase during the quarter started to exhibit rising levels of interest rates, but continued high levels of liquidity,year, impacting our interest revenues and opportunities for acquiring investments during most of the quarter.year.

In the 2022 second quarter of the current year, margins between yields on assets, specifically overnight, short-term, and floating-rate investments and short-term and floating-rate advances, and the corresponding yields paid on funding those assets were higher than 2021the second quarter.quarter of the prior year. Net interest margin, a measure of margin efficiency, which is calculated as Net interest income divided by average earning assets, was 5260 basis points in the second quarter of 2022,2023, compared to 4652 basis points in the prior year same period. Net interest spread in the second quarter of 20222023 was 4533 basis points, representing the yield from earning assets minus interest paid on costing liabilities, compared to 4445 basis points in the prior year same period.

Stockholders’ capital, which is typically deployed to fund short-term interest-earning assets, decreasedincreased to $6.6$9.0 billion in the second quarter of 2022, down2023, up from $7.1$6.6 billion in the same period in the prior year (as measured by average outstanding balance in the period). DecreaseIncrease in Capital stock was in line with decreaseincrease in advances in the second quarter of 20222023 as borrowing members are required to purchase capital stock in proportion to amounts borrowed.

98

Table of Contents

In the 20222023 year-to-date period, Net interest margin was 4859 basis points slightly higher compared to 4748 basis points from the same period in the prior year. Net interest spread in the 20222023 year-to-date period was 34 basis points compared to 44 basis points unchanged fromin the same period in the prior year.

Stockholders’ capital stock, which is typically deployed to fund short-term interest-earning assets, decreasedincreased to $6.5$8.7 billion in 20222023 year-to-date period from $7.2$6.5 billion in the same period in the prior year.

Swap interest settlement on swaps designated in ASC 815 hedging of assets and liabilities recorded a net expenseincome of $23.7 million to interest margin in the second quarter of 2022, compared to a net expense of $81.1$25.8 million in the second quarter of 2021.2023, compared to net expense of $23.7 million in the second quarter of 2022. In the year-to-date period ended June 30, 2022,2023, we recorded a net expenseincome of $78.7$20.6 million to interest margin, compared to a net expense of $176.1$78.7 million in the same period in the prior year. Interest settlements are impacted by the net differential between fixed-rates associated with hedging swaps and the benchmark variable-rates associated with the swap’s floating-leg. Net interest settlements on swaps hedging assets and liabilities under ASC 815 fluctuated as expected in line with changes in the benchmark rates; the hedging transactions achieved our interest rate risk management objectives. The impact of hedge ineffectiveness in the comparable quarters were immaterial.

101

Table of Contents

Impact of Qualifying Hedges on Net Interest Income

The following table summarizes the impact of net interest adjustments from qualifying hedge qualifying interest-rate swaps (in thousands):

Table 9.3    Net Interest Adjustments from Qualifying Hedge Qualifying Interest Rate Swaps

Three months ended June 30, 

Six months ended June 30, 

Three months ended June 30, 

Six months ended June 30, 


2022


2021


2022


2021


2023


2022


2023


2022

Interest income

$

420,219


$

358,368


$

737,559


$

750,392

$

2,029,475


$

420,219


$

3,655,996


$

737,559

Fair value hedging effects


13,641


(543)


16,809


1,451


2,927


13,641


(561)


16,809

Amortization of basis


(36)


(78)


(72)


(26)

Amortization of basis adjustment


(4)


(36)


(10)


(72)

Interest rate swap accruals


(47,559)


(110,213)


(145,621)


(222,008)


319,270


(47,559)


577,931


(145,621)

Reported interest income


386,265


247,534


608,675


529,809


2,351,668


386,265


4,233,356


608,675

Interest expense


269,318


134,902


419,159


279,483


1,787,569


269,318


3,179,604


419,159

Fair value hedging effects


(4,024)


(93)


(8,288)


(2,750)


(4,311)


(4,024)


(7,538)


(8,288)

Amortization of basis


(1,912)


(1,322)


(4,099)


(2,703)

Amortization of basis adjustment


168


(1,912)


(479)


(4,099)

Interest rate swap accruals


(23,828)


(29,118)


(66,898)


(45,924)


293,519


(23,828)


557,310


(66,898)

Reported interest expense


239,554


104,369


339,874


228,106


2,076,945


239,554


3,728,897


339,874

Net interest income

$

146,711

$

143,165

$

268,801

$

301,703

$

274,723

$

146,711

$

504,459

$

268,801

Net interest adjustment - interest rate swaps

$

(4,190)

$

(80,301)

$

(49,599)

$

(169,206)

$

32,817

$

(4,190)

$

28,067

$

(49,599)

10299

Table of Contents

Spread and Yield Analysis — 20222023 Periods Compared to 20212022 Periods

Table 9.4    Spread and Yield Analysis

Three months ended June 30, 


Three months ended June 30, 


2022

2021


2023

2022


Interest

Interest


Interest

Interest


Average

Income/

Average

Income/


Average

Income/

Average

Income/


(Dollars in thousands)


Balance


Expense


Rate (a)


Balance


Expense


Rate (a)


Balance


Expense


Yield/Rate (a)


Balance


Expense


Yield/Rate (a)


Earning Assets:


Advances

$

74,822,736

$

236,103


1.27

%  

$

87,031,029

$

123,567


0.57

%

$

122,517,529

$

1,653,311


5.41

%  

$

74,822,736

$

236,103


1.27

%

Interest bearing deposits and others

1,987,671


3,869


0.78


1,272,720


264


0.08

4,166,879


53,275


5.13


1,987,671


3,869


0.78

Federal funds sold and other overnight funds

10,717,506


20,396


0.76


10,150,451


1,864


0.07

30,945,330


390,052


5.06


10,717,506


20,396


0.76

Investments


Trading securities

8,010,075


22,419


1.12


8,222,005


27,748


1.35

5,236,642


30,679


2.35


8,010,075


22,419


1.12

Mortgage-backed securities


Fixed

12,174,025


75,026


2.47


10,772,154


69,203


2.58

14,022,001


141,759


4.06


12,174,025


75,026


2.47

Floating

2,602,891


7,800


1.20


3,724,474


5,405


0.58

3,466,892


47,346


5.48


2,602,891


7,800


1.20

State and local housing finance agency obligations

1,173,665


3,914


1.34


1,083,402


1,862


0.69

1,281,781


18,230


5.70


1,173,665


3,914


1.34

Mortgage loans held-for-portfolio

2,203,678


16,667


3.03


2,608,026


17,620


2.71

2,121,971


16,945


3.20


2,203,678


16,667


3.03

Loans to other FHLBanks

27,473


71


1.05


3,297


1


0.12

5,495


71


5.15


27,473


71


1.05

Total interest-earning assets

$

113,719,720

$

386,265


1.36

%  

$

124,867,558

$

247,534


0.80

%

$

183,764,520

$

2,351,668


5.13

%  

$

113,719,720

$

386,265


1.36

%

Funded By:


Consolidated obligation bonds


Fixed

$

50,991,316

$

144,130


1.13

%  

$

63,984,182

$

87,171


0.55

%

$

59,232,933

$

665,433


4.51

%  

$

50,991,316

$

144,130


1.13

%

Floating

7,915,075


13,792


0.70


4,943,158


1,698


0.14

49,405,447


627,217


5.09


7,915,075


13,792


0.70

Consolidated obligation discount notes

45,732,947


79,097


0.69


46,796,019


15,385


0.13

62,000,494


751,232


4.86


45,732,947


79,097


0.69

Interest-bearing deposits and other borrowings

1,086,291


1,770


0.65


1,458,449


87


0.02

2,819,686


32,933


4.68


1,086,291


1,770


0.65

Mandatorily redeemable capital stock

63,612


765


4.82


2,518


28


4.46

6,596


130


7.96


63,612


765


4.82

Total interest-bearing liabilities

105,789,241


239,554


0.91

%  


117,184,326


104,369


0.36

%

173,465,156


2,076,945


4.80

%  


105,789,241


239,554


0.91

%

Other non-interest-bearing funds

1,335,121


584,272


1,336,882


1,335,121


Capital

6,595,358


7,098,960


8,962,482


6,595,358


Total Funding

$

113,719,720

$

239,554

$

124,867,558

$

104,369


$

183,764,520

$

2,076,945

$

113,719,720

$

239,554


Net Interest Income/Spread

$

146,711

0.45

%  


$

143,165


0.44

%

$

274,723

0.33

%  


$

146,711


0.45

%

Net Interest Margin


(Net interest income/Earning Assets)


0.52

%  


0.46

%


0.60

%  


0.52

%

103100

Table of Contents

Six months ended June 30, 


Six months ended June 30, 


2022

2021


2023

2022


Interest

Interest


Interest

Interest


Average

Income/

Average

Income/


Average

Income/

Average

Income/


(Dollars in thousands)


Balance


Expense


Rate (a)


Balance


Expense


Rate (a)


Balance


Expense


Yield/Rate (a)


Balance


Expense


Yield/Rate (a)

Earning Assets:


Advances

$

73,238,033

$

348,857

0.96

%  

$

88,735,183

$

263,395


0.60

%

$

119,004,236

$

3,057,864

5.18

%  

$

73,238,033

$

348,857


0.96

%

Interest bearing deposits and others

1,800,617

4,357

0.49


1,386,159


597


0.09

4,092,875

99,310

4.89


1,800,617


4,357


0.49

Federal funds sold and other overnight funds

11,402,470

24,100

0.43


12,033,878


4,640


0.08

24,855,398

601,675

4.88


11,402,470


24,100


0.43

Investments


Trading securities

7,354,722

37,753

1.04


9,605,690


68,378


1.44

5,827,582

60,705

2.10


7,354,722


37,753


1.04

Mortgage-backed securities


Fixed

12,040,817

142,152

2.38


10,774,155


140,802


2.64

13,639,848

266,577

3.94


12,040,817


142,152


2.38

Floating

2,686,242

12,110

0.91


3,876,105


11,462


0.60

2,995,116

78,688

5.30


2,686,242


12,110


0.91

State and local housing finance agency obligations

1,178,375

6,236

1.07


1,090,407


3,774


0.70

1,284,186

34,782

5.46


1,178,375


6,236


1.07

Mortgage loans held-for-portfolio

2,238,980

33,038

2.98


2,706,708


36,760


2.74

2,110,735

33,684

3.22


2,238,980


33,038


2.98

Loans to other FHLBanks

15,193

72

0.96


1,657


1


0.12

2,762

71

5.15


15,193


72


0.96

Total interest-earning assets

$

111,955,449

$

608,675

1.10

%  

$

130,209,942

$

529,809


0.82

%

$

173,812,738

$

4,233,356

4.91

%  

$

111,955,449

$

608,675


1.10

%

Funded By:


Consolidated obligation bonds


Fixed

$

50,475,624

$

223,687

0.89

%  

$

60,017,354

$

176,468


0.59

%

$

56,726,142

$

1,216,516

4.32

%  

$

50,475,624

$

223,687


0.89

%

Floating

7,208,994

16,328

0.46


8,747,586


6,367


0.15

46,937,821

1,133,395

4.87


7,208,994


16,328


0.46

Consolidated obligation discount notes

45,529,253

97,024

0.43


52,178,842


44,997


0.17

57,977,376

1,331,838

4.63


45,529,253


97,024


0.43

Interest-bearing deposits and other borrowings

1,125,033

1,944

0.35


1,531,577


212


0.03

2,938,640

46,905

3.22


1,125,033


1,944


0.35

Mandatorily redeemable capital stock

37,843

891

4.75


2,667


62


4.69

6,100

243

8.05


37,843


891


4.75

Total interest-bearing liabilities

104,376,747

339,874

0.66

%  


122,478,026


228,106


0.38

%

164,586,079

3,728,897

4.57

%  


104,376,747


339,874


0.66

%

Other non-interest-bearing funds

1,067,937


579,881


494,398


1,067,937


Capital

6,510,765


7,152,035


8,732,261


6,510,765


Total Funding

$

111,955,449

$

339,874

$

130,209,942

$

228,106


$

173,812,738

$

3,728,897

$

111,955,449

$

339,874


Net Interest Income/Spread

$

268,801

0.44

%  


$

301,703


0.44

%

$

504,459

0.34

%  


$

268,801


0.44

%

Net Interest Margin


(Net interest income/Earning Assets)

0.48

%  


0.47

%

0.59

%  


0.48

%

(a)Reported yields with respect to advances and Consolidated obligations may not necessarily equal the coupons on the instruments as derivatives are extensively used to change the yield and optionality characteristics of the underlying hedged items. When we issue fixed-rate debt that is hedged with an interest rate swap, the hedge effectively converts the debt into a simple floating-rate bond. Similarly, we make fixed-rate advances to members and hedge the advances with a pay-fixed and receive-variable interest rate swap that effectively converts the fixed-rate asset to one that floats with the designated benchmark rate (LIBOR, Federal(Federal Funds-OIS or SOFR-OIS) in the hedging relationship. Average balance sheet information is presented, as it is more representative of activity throughout the periods presented. For most components of the average balances, a daily weighted average balance is calculated for the period. When daily weighted average balance information is not available, a simple monthly average balance is calculated. Average yields are derived by dividing income by the average balances of the related assets, and average costs are derived by dividing expenses by the average balances of the related liabilities. Yields and spreads are annualized.

104101

Table of Contents

Rate and Volume Analysis — 2022 2023 Periods Compared to 2021 2022 Periods

The Rate and Volume Analysis presents changes in interest income, interest expense and net interest income that are due to changes in both interest rates and the volume of interest-earning assets and interest-bearing liabilities, and their impact on interest income and interest expense (in thousands):

Table 9.5    Rate and Volume Analysis

For the three months ended

For the three months ended

June 30, 2022 vs. June 30, 2021

June 30, 2023 vs. June 30, 2022

Increase (Decrease)

Increase (Decrease)


Volume


Rate


Total


Volume


Rate


Total

Interest Income


Advances

$

(19,515)

$

132,051

$

112,536

$

230,812

$

1,186,396

$

1,417,208

Interest bearing deposits and others


226


3,379


3,605


8,128


41,278


49,406

Federal funds sold and other overnight funds


110


18,422


18,532


92,889


276,767


369,656

Investments


Trading securities


(699)


(4,630)


(5,329)


(9,803)


18,063


8,260

Mortgage-backed securities


Fixed


8,727


(2,904)


5,823


12,786


53,947


66,733

Floating


(2,010)


4,405


2,395


3,376


36,170


39,546

State and local housing finance agency obligations


167


1,885


2,052


393


13,923


14,316

Mortgage loans held-for-portfolio


(2,916)


1,963


(953)


(632)


910


278

Loans to other FHLBanks


35


35


70


(95)


95


Total interest income


(15,875)


154,606


138,731


337,854


1,627,549


1,965,403

Interest Expense


Consolidated obligation bonds


Fixed


(20,724)


77,683


56,959


26,867


494,436


521,303

Floating


1,556


10,538


12,094


278,940


334,485


613,425

Consolidated obligation discount notes


(357)


64,069


63,712


37,584


634,551


672,135

Deposits and borrowings


(28)


1,711


1,683


6,407


24,756


31,163

Mandatorily redeemable capital stock


735


2


737


(944)


309


(635)

Total interest expense


(18,818)


154,003


135,185


348,854


1,488,537


1,837,391

Changes in Net Interest Income

$

2,943

$

603

$

3,546

$

(11,000)

$

139,012

$

128,012

105102

Table of Contents

For the six months ended

For the six months ended

June 30, 2022 vs. June 30, 2021

June 30, 2023 vs. June 30, 2022

Increase (Decrease)

Increase (Decrease)


Volume


Rate


Total


Volume


Rate


Total

Interest Income


Advances

$

(52,234)

$

137,696

$

85,462

$

337,267

$

2,371,740

$

2,709,007

Interest bearing deposits and others


229


3,531


3,760


11,738


83,215


94,953

Federal funds sold and other overnight funds


(256)


19,716


19,460


58,578


518,997


577,575

Investments


Trading securities


(13,983)


(16,642)


(30,625)


(9,193)


32,145


22,952

Mortgage-backed securities


Fixed


15,676


(14,326)


1,350


20,963


103,462


124,425

Floating


(4,200)


4,848


648


1,549


65,029


66,578

State and local housing finance agency obligations


326


2,136


2,462


609


27,937


28,546

Mortgage loans held-for-portfolio


(6,718)


2,996


(3,722)


(1,956)


2,602


646

Loans to other FHLBanks


39


32


71


(100)


99


(1)

Total interest income


(61,121)


139,987


78,866


419,455


3,205,226


3,624,681

Interest Expense


Consolidated obligation bonds


Fixed


(31,451)


78,670


47,219


31,023


961,806


992,829

Floating


(1,302)


11,263


9,961


405,749


711,318


1,117,067

Consolidated obligation discount notes


(6,407)


58,434


52,027


33,583


1,201,231


1,234,814

Deposits and borrowings


(71)


1,803


1,732


7,359


37,602


44,961

Mandatorily redeemable capital stock


828


1


829


(1,032)


384


(648)

Total interest expense


(38,403)


150,171


111,768


476,682


2,912,341


3,389,023

Changes in Net Interest Income

$

(22,718)

$

(10,184)

$

(32,902)

$

(57,227)

$

292,885

$

235,658

Interest Income

Interest income from advances is our principal source of interest income. We also earn interest income from an asset mix of long-term assets, such as fixed-rate advances, long-term fixed- and floating-rate investments, long-term 15-year and 30-year mortgage loans, and revenues generated from portfolios of overnight and short-term assets and U.S. Treasury securities held for liquidity.

Reported interest income also includes prepayments fees, primarily fees recorded when advances are prepaid ahead of their contractual maturities.

106103

Table of Contents

The principal categories of Interest Income are summarized below (dollars in thousands):

Table 9.6    Interest Income — Principal Sources

Three months ended June 30, 

Six months ended June 30, 


Three months ended June 30, 

Six months ended June 30, 


Percentage

Percentage


Percentage

Percentage


2022


2021


Change


2022


2021


Change


2023


2022


Change


2023


2022


Change


Interest Income


Advances

$

236,103

$

123,567


91.07

%  

$

348,857

$

263,395


32.45

%

$

1,653,311

$

236,103


600.25

%  

$

3,057,864

$

348,857


776.54

%

Interest-bearing deposits


3,869


264


NM


4,357


597


NM


53,275


3,869


NM


99,310


4,357


NM

Securities purchased under agreements to resell


11


12


(8.33)


21


476


(95.59)


123,728


11


NM


170,917


21


NM

Federal funds sold


20,385


1,852


NM


24,079


4,164


NM


266,324


20,385


NM


430,758


24,079


NM

Trading securities


22,419


27,748


(19.20)


37,753


68,378


(44.79)


30,679


22,419


36.84


60,705


37,753


60.80

Mortgage-backed securities


Fixed


75,026


69,203


8.41


142,152


140,802


0.96


141,759


75,026


88.95


266,577


142,152


87.53

Floating


7,800


5,405


44.31


12,110


11,462


5.65


47,346


7,800


507.00


78,688


12,110


549.78

State and local housing finance agency obligations


3,914


1,862


NM


6,236


3,774


65.24


18,230


3,914


365.76


34,782


6,236


457.76

Mortgage loans held-for-portfolio


16,667


17,620


(5.41)


33,038


36,760


(10.13)


16,945


16,667


1.67


33,684


33,038


1.96

Loans to other FHLBanks


71


1


NM


72


1


NM


71


71


71


72


(1.39)

Total interest income

$

386,265

$

247,534


56.05

%  

$

608,675

$

529,809


14.89

%

$

2,351,668

$

386,265


508.82

%  

$

4,233,356

$

608,675


595.50

%

NM — Not meaningful.

Interest Income

Interest income for 2022the 2023 second quarter was $386.3 million,$2.4 billion, an increase of $138.7 million,$2.0 billion, or 56.1%508.8% compared to the same period in the prior year.2022. To provide context, interest expense for 2022the 2023 second quarter increased by 129.5%767.0% compared to the same period in the prior year.

For 2022the 2023 second quarter compared to 2021the 2022 second quarter, increase in interest revenues increased $154.6 million from yield (rate)revenue was contributed by rate-related increase of $1.6 billion and while decreasing $15.9 million due to lower balance sheet earning assets (primarily the decrease in volumevolume-related increase of advance business).$337.9 million.

Aggregate yield earned on earning assets in 20222023 second quarter was 136513 basis points, compared to 80136 basis points in 20212022 second quarter.

Interest income in the 20222023 year-to-date period was $608.7 million,$4.2 billion, an increase of $78.9 million,$3.6 billion, or 14.9%595.5% compared to the same period in the prior year. To provide context, interest expense increased by 49.0%997.1% compared to the year-to-date period in the prior year.

Aggregate yield earned on earning assets in 20222023 year-to-date period was 110491 basis points, compared to 82110 basis points in the same period in the prior year.

The more significant revenue categories are discussed below. For information about the effects of changes in rates and business volume, see Table 9.4 Spread and Yield Analysis and Table 9.5 Rate and Volume analysis.

Advance — Interest income from advances increased by 91.1%$1.4 billion in 2022the 2023 second quarter, compared to the same period in the prior year.

Advances average Average advances balances were $74.8$122.5 billion in 2022the 2023 second quarter, compared to $87.0$74.8 billion in 2021the 2022 second quarter.

As comparedCompared to 2021 second quarter,the same period in prior year, higher market rates resulted in a favorable impact of $132.1 million$1.2 billion and lowerhigher advances balances in 2022the 2023 second quarter resulted in an unfavorablea favorable impact of $19.5$230.8 million onin interest income from advances, for a net increase of $112.5 million$1.4 billion in advances interest income. In summary, higher market interest rates positively impacted yields earned from advances, primarily on overnight and short-term advances and variable-rate advances that reset to higher rates. Advances yielded 541 basis points in the 2023 second quarter, up from 127 basis points in the 2022 second quarter, increased from 57 basis points in 2021 second quarter. Prepayment fee recorded in Interest income from advances was $0.5 million in the 2023 second quarter and $1.2 million in 2022 second quarter, down from $4.0 millionthe same period in 2021 second quarter.the prior year.

104

Table of Contents

On a year-to-date basis, interest income from advances increased by 32.5%$2.7 billion or 776.5%. Volume, as measured by average balances, was downand interest rates both increased in the current year period. Volume related decrease in interest revenues was offset by rate related increases in interest revenues. Average transaction volume of advance business was $119.0 billion at an aggregate yield of 518 basis points in the 2023 period, compared to an average transaction volume of $73.2 billion at an aggregate yield of 96 basis points in the 2022 period, compared to an average transaction volume of $88.7 billion at an aggregate yield of 60 basis points in the 2021 period.

107

Table of Contents

Liquidity Investments Money Market Investments and U.S. Treasury Securities We derive interest income from investing ininventorying highly-liquid portfolios of investments to meet liquidity regulatory requirements. InterestHigher interest income from overnight invested funds, specifically federal funds sold and repurchase agreements increased mainlywas due to higher average ratesincrease in market yields in the second quarter of 20222023 compared to the same period in 2021.2022. Investments in federal funds and repurchase agreements yielded 76506 basis points in aggregate in the second quarter of 2022,2023, compared to 776 basis points in the same period in 2021.2022. Interest income from fixed-rate U.S. Treasury securities was $22.4$30.7 million in the second quarter of 2022, down2023, up from $27.7$22.4 million in the same period in 2021 due2022 stemming from higher interest rates; yields increased to lower average invested balances; yields declined to 112235 basis points, compared to 135112 basis points in the second quarter of 2021. The lower yields on the fixed-rate securities reflected lower yields on new acquisitions.2022. The liquidity trading portfolio is comprised primarily of medium-term, highly liquid fixed-rate U.S. Treasury securities that are available to enhance and meet our liquidity objectives. Securities are not acquired for speculative purpose.

On a year-to-date basis, interest income from overnight invested funds, specifically federal funds sold and repurchase agreements increased mainly due to higher averageinterest rates. Investments in federal funds and repurchase agreements yielded 43488 basis points in aggregate in the year-to-date period of 2022,2023, compared to 843 basis points in the same period in 2021.2022. Interest income from fixed-rate U.S. Treasury securities was $37.8$60.7 million in the year-to-date period of 2022, down2023, up from $68.4$37.8 million in the same period in 20212022 due to lowerhigher average invested balances; yields declinedincreased to 104210 basis points, compared to 144104 basis points in the year-to-date period of 2021.2022.

The earnings impact due to changes in market values of the securities outstanding (unrealized gains and losses) and realized gains and losses on securities sold are recorded in Other income (below the margin) and are noted in Table 9.9 Net Gains (Losses) on Trading Securities Recorded in the Statements of Income, and discussions thereto. Fixed-rate treasury securities are hedged under economic hedges utilizing swap contracts to synthetically convert fixed cash flows to variable cash flows. The interest settlements on the swaps and changes in the fair values of the swap contracts are recorded in Other income (below the margin); our accounting policies require us to record in Other income the cash flows and fair values on hedging that do not qualify under ASC 815 hedging (economic hedges).

Mortgage-backed-securities

Interest income from floating-rate MBS increased by 44.3%$39.5 million or 507.0% in the second quarter of 20222023 compared to the same period in the prior year. By policy, noOn a year-to-date basis, interest income from floating-rate LIBOR-indexed MBS were acquired, a decision drivenincreased by our goal$66.6 million or 549.8% in the current year compared to reduce our holdings of LIBOR-indexed instruments. Until GSE-issued floating-rate SOFR-indexed MBS become widely traded, we will likely continue to see declining balances of variable-rate MBS.same period in the prior year.

Interest income from fixed-rate MBS increased by $66.7 million or 88.9% in the second quarter of 20222023 compared to the same period in the prior year due to an increase of average outstanding balance to $12.2$14.0 billion in the second quarter of 2022,2023, compared to $10.8$12.2 billion in the same period in the prior year. This was offset by loweryear and higher aggregate yield, which was 247406 basis points in the second quarter of 2022, down2023, up from 258247 basis points in the same period in the prior year. On a year-to-date basis, interest income from fixed-rate MBS increased by $124.4 million or 87.5% in the current year compared to the same period in the prior year.

In the second quarter of 2022,2023, our acquisitions were primarily fixed-rate commercial-mortgage backed securities (CMBS). We utilized the swap market to synthetically create variable-rate cash flows indexed to SOFR and Federal funds applying ASC 815 fair value accounting hedge treatment. The impact to interest income from changes in the ASC 815 hedging recorded a net gain of $34.8 million in the second quarter of 2023, compared to a net loss of $5.6 million in the second quarter of 2022,2022. On a year-to-date basis, interest income from changes in the ASC 815 hedging recorded a net gain of $60.9 million in the current year, compared to a net loss of $3.8$14.6 million in the same period in the prior year.

Mortgage loans held-for-portfolio Interest income from mortgage loans was $16.7$16.9 million and $33.7 million for the three and six months ended June 30, 2022,2023, compared to $17.6$16.7 million and $33.0 million in the same periodperiods in the prior year. Investment volume has declined, with paydowns exceeding acquisitions. MPF loans are primarily 1515-year and 30-year conventional loans. The portfolio averaged $2.2$2.1 billion, yielding 303320 basis points in the three months ended June 30, 2022,2023, compared to 271303 basis points in the same period last year. On a year-to-date basis, the portfolio averaged $2.1 billion, yielding 322 basis points in the current year, compared to 298 basis points in the same period last year. In the rising interest rate environment, we are observing lower levels of prepayments, causing slower amortization of premiums, specifically on 20-year and 30-year high-balance mortgage loans. Net amortization expense was $1.3$1.0 million and $1.8 million in the three and six months ended June 30, 2022,2023, compared to net amortization of $3.4$1.3 million and $3.1 million in the same period in the prior year. The Bank’s portfolio is largely at a premium price and amortization is sensitive to changes in prepayment speeds particularly in a volatile interest rate environment. The Bank does not hedge mortgage loans in an ASC 815 hedge or an economic hedge.

Interest income from mortgage loans was $33.0 million for the six months ended June 30, 2022, compared to $36.8 million in the same period in the prior year. Investment volume has declined, with paydowns exceeding acquisitions. MPF loans are primarily 15 and 30-year conventional loans. The portfolio averaged $2.2 billion, yielding 298 basis points in the six months ended June 30, 2022, compared to 274 basis points in the same period last year. While we continue to observe mortgage loans prepaying, this trend is

108105

Table of Contents

abating as interest rates are rising. Net amortization expense was $3.1 million in the six months ended June 30, 2022, compared to net amortization of $7.1 million in the same period in the prior year. The Bank’s portfolio is largely at a premium price and amortization is sensitive to changes in prepayment speeds particularly in a volatile interest rate environment

As noted in the audited financial statements under Note 1. CriticalSummary of Significant Accounting Policies and Estimates,in the most recent Form 10-K for the year ended December 31, 2022, we implemented a new mortgage program, the Mortgage Asset Program (MAP) in late March 2021. At June 30, 2022,2023, mortgage loans under MAP were $182.9$327.7 million (par amounts). Effective March 31, 2021, we ceased to accept mortgage commitments to purchase loans under the MPF program; the MAP became our alternative to MPF. The outstanding MPF portfolio will continue to be serviced and managed under its existing contractual agreements.

Interest Expense

Our primary source of funding is the issuance of Consolidated obligation bonds and discount notes to investors in the global debt markets issued through the Office of Finance, the FHLBank’s fiscal agent. Consolidated obligation bonds are generally medium- and long-term bonds, while Consolidated obligation discount notes are short-term instruments. To fund our assets, our management considers our interest rate risk and liquidity requirements in conjunction with consolidated obligation buyers’ preferences and capital market conditions when determining the characteristics of debt to be issued. Typically, we have used fixed-rate callable and non-callable CO bonds to fund mortgage-related assets and advances. CO discount notes are generally issued to fund advances and investments with shorter interest rate reset characteristics.

Changes in bond market rates, changes in intermediation volume (average interest-costing liabilities and interest-earning assets), the mix of debt issuances between CO bonds and CO discount notes, and the impact of hedging strategies are the primary factors that drive period-over-period changes in interest expense.

Derivative strategies are used to manage the interest rate risk inherent in fixed-rate debt. We execute our strategies by converting the fixed-rate funding to floating-rate debt using swap contracts indexed to a risk-free benchmark interest rate. Our adopted hedging benchmarks are SOFR-OIS LIBOR and Federal Funds-OIS. We are transitioning away from LIBOR to SOFR-OIS benchmark in line with an industry-wide transition effort. For ASC 815 qualifying hedges of debt, swap interest settlements and fair value gains and losses are recorded in interest expense together with the interest expense accrued on the hedged CO debt.

The principal categories of Interest expense are summarized below (dollars in thousands):

Table 9.7    Interest Expenses — Principal Categories

Three months ended June 30, 

Six months ended June 30, 


Three months ended June 30, 

Six months ended June 30, 


Percentage

Percentage


Percentage

Percentage


2022


2021


Change


2022


2021


Change


2023


2022


Change


2023


2022


Change


Interest Expense


Consolidated obligations bonds


Fixed

$

144,130

$

87,171


65.34

%  

$

223,687

$

176,468


26.76

%

$

665,433

$

144,130


361.69

%  

$

1,216,516

$

223,687


443.85

%

Floating


13,792


1,698


NM


16,328


6,367


NM


627,217


13,792


NM


1,133,395


16,328


NM

Consolidated obligations discount notes


79,097


15,385


NM


97,024


44,997


NM


751,232


79,097


849.76


1,331,838


97,024


NM

Deposits


1,654


69


NM


1,826


175


NM


32,380


1,654


NM


44,918


1,826


NM

Mandatorily redeemable capital stock


765


28


NM


891


62


NM


130


765


(83.01)


243


891


(72.73)

Cash collateral held and other borrowings


116


18


NM


118


37


NM


553


116


376.72


1,987


118


NM

Total interest expense

$

239,554

$

104,369


129.53

%  

$

339,874

$

228,106


49.00

%

$

2,076,945

$

239,554


767.00

%  

$

3,728,897

$

339,874


997.14

%

NM - Not meaningful.

Interest expense in 2022for the 2023 second quarter was $239.6 million,$2.1 billion, an increase of 129.5% from 2021$1.8 billion or 767.0% compared to the 2022 second quarter, comparatively,quarter. To provide context, interest income in 2022the 2023 second quarter increased by 56.1% from 2021$2.0 billion or 508.8% compared to the 2022 second quarter.

109

Table of Contents

The increase in interest expense was primarily driven by higher yields. Rate-related increase in funding expense was $154.0 million, due to volatility$1.5 billion in line with the increase in interest rates in the bond markets; volume-related declineincrease in funding expense was $18.8$348.9 million in 2022the 2023 second quarter compared to 2021the 2022 second quarter. Aggregate yield paid on total funding in 2022the 2023 second quarter was 91480 basis points, compared to 3691 basis points in the same period of the prior year. Interest expense increases were partially offset by volume-related declines in funding expense of $18.8 million in parallel with funding a lower balance sheet.

Interest expense in the 20222023 year-to-date period was $339.9 million,$3.7 billion, an increase of 49.0%$3.4 billion or 997.1% compared to the same period in the prior year. To provide context, interest income increased by 14.9%$3.6 billion or 595.5% compared to the year-to-date period in the prior year.

106

Rate-related increase in funding expense was $150.2 million in line with the increase in interest rates in the bond markets; volume-related decline in funding expense was $38.4 million in parallel with the fundingTable of a lower balance sheet in the 2022 year-to-date period compared to the same period in 2021.Contents

We have maintained the same strategic approachcontinue to make changes to our liability mix whencomposition as compared to the year-to-date period in the prior year.2022. In the 2022 year-to-date period, 45.1%second quarter of 2023, 32.2% of average earning assets were funded by fixed-rate CO bonds and 6.4%26.9% were funded by floating-rate CO bonds. In the second quarter of 2022, fixed-rate CO bonds funded 44.8% of earning assets and floating-rate CO bonds funded 7.0% of earning assets. The usage of CO discount notes has decreased significantly to 33.7% in the 2023 second quarter from 40.2% in the 2022 second quarter. In the 2023 year-to-date period, 32.6% of average earning assets were funded by fixed-rate CO bonds and 27.0% were funded by floating-rate CO bonds. In the same period in the prior year, fixed-rate CO bonds funded 46.1%45.1% of earning assets and floating-rate CO bonds funded 6.7%6.4% of earning assets.

Hedging strategies under ASC 815 have remained effective and are operating as designed, although in preparation for the market transition away from LIBOR, we have increased the use of SOFR-OIS as the alternative hedging benchmarks. For more information, see Table 9.3 Net Interest Adjustments from Qualifying Hedge Qualifying Interest Rate Swaps.

Allowance for Credit Losses — 20222023 Periods Compared to 20212022 Periods

We recorded net reversalprovisions of $58.8 thousand$1.7 million and $129.1 thousand$1.6 million in the three and six months ended June 30, 20222023 compared to net reversalreversals of $1.6 million$58.8 thousand and $2.9 million$129.1 thousand in the same periods in the prior year against our mortgage loan portfolio. The Bank transitioned models in June of 2023 and the newly adopted model assumptions are different than the prior model. We also recorded de minimis amountnet provisions of net reversal against our investment portfolio$70.2 thousand and $298.3 thousand in the three and six months ended June 30, 20222023 compared to net reversals of $8.8 thousand and $16.8 thousand in the same periods in the prior year.year against our investment portfolio. No allowance was necessary on advances, other assets, and commitments.

Analysis of Non-Interest Income (Loss) — 20222023 Periods Compared to 2021 2022 Periods

The principal components of Non-interest income (loss) are summarized below (in thousands):

Table 9.8    Other Income (Loss)

Three months ended June 30, 

Six months ended June 30, 

Three months ended June 30, 

Six months ended June 30, 


2022


2021


2022


2021


2023


2022


2023


2022

Other income (loss):


Service fees and other (a)

$

3,864

$

4,427

$

8,359

$

8,559

$

5,502

$

3,864

$

10,836

$

8,359

Instruments held under the fair value option gains (losses) (b)


36,783


3,871


117,429


3,933


16,676


36,783


(22,702)


117,429

Derivative gains (losses) (c)


48,229


3,918


117,245


(391)


79,897


48,229


48,091


117,245

Trading securities gains (losses) (d)


(93,717)


(26,380)


(257,030)


(61,183)


(88,056)


(93,717)


13,892


(257,030)

Equity investments gains (losses) (e)


(10,388)


4,539


(16,189)


6,839


2,972


(10,388)


7,223


(16,189)

Litigation settlement


2,202


930


1,620


2,202

Losses from extinguishment of debt

(99)

(99)

(99)

(99)

Total other income (loss)

$

(15,328)

$

(9,625)

$

(28,083)

$

(42,243)

$

17,921

$

(15,328)

$

58,960

$

(28,083)

(a)

Service fees and other, net Service fees are from providing correspondent banking services to members, primarily fees earned on standby financial letters of credit. Letters of credit are generally issued on behalf of members to units of state and local governments to collateralize their deposits at member banks. Fee income earned on financial letters of credit was $3.4were $4.6 million in the second quarter of the current year compared to $4.6$3.4 million in the same period in the prior year. On a year-to-date basis through June 30, Service fees earned on financial letters of credit were $7.7$8.7 million in the current year, compared to $9.0$7.7 million in the same period in the prior year. Immaterial amounts of fees paid, and other expenses were included in reported revenues.

(b)

FVO Instruments — Net fair value gains and losses represented changes in fair values of CO bonds and discount notes elected under the FVO. For more information, see Fair Value Option Disclosures in Note 18. Fair Values of Financial Instruments in this Form 10-Q.

(c)

See Table 9.10 Other Income (Loss) — Impact of Derivative Gains and Losses.

110

Table of Contents

(d)

See Table 9.9 Net Gains (Losses) on Trading Securities Recorded in the Statements of Income.

(e)

Fair value gains (losses) on Equity investments — The grantor trust investstrusts invest in money market, equity and fixed income and bond funds, and funds are classified as equity investments. Daily net asset values (NAVs) are readily available and investments are redeemable at short notice. NAVs are the fair values of the funds in the grantor trust.trusts. Gains and losses are typically unrealized, and primarily represent changes in portfolio valuations. The grantor trust istrusts are owned by the FHLBNY with the objective of providing liquidity to pay for pension benefits to retirees vested in retirement plans.

107

Table of Contents

The following table summarizes unrealized and realized gains (losses) in the trading portfolio (in thousands):

Table 9.9Net Gains (Losses) on Trading Securities Recorded in the Statements of Income

Three months ended June 30, 

Six months ended June 30, 

Three months ended June 30, 

Six months ended June 30, 


2022


2021


2022


2021


2023


2022


2023


2022

Net unrealized gains (losses) on trading securities held at period-end

$

(88,890)

$

(26,380)

$

(252,203)

$

(61,183)

$

(88,056)

$

(88,890)

$

14,365

$

(252,203)

Net realized gains (losses) on trading securities sold/matured during the period


(4,827)


(4,827)


Net gains (losses) on trading securities sold/matured during the period


(4,827)


(473)


(4,827)

Net gains (losses) on trading securities

$

(93,717)

$

(26,380)

$

(257,030)

$

(61,183)

$

(88,056)

$

(93,717)

$

13,892

$

(257,030)

We have invested in short- and medium-term fixed-rate U.S. Treasury securities. The securities are not held for speculative trading, rather held to satisfy liquidity requirements. Fluctuations in valuations are a factor of market demand and market yields of fixed-rate U.S. Treasury securities.securities. Securities classified as trading are carried at fair values. Changes in unrealized fair values and realized gains (losses) are recorded in the Statements of Income as Other income. FHFA regulations prohibit trading in or the speculative use of financial instruments. NotionalPar amounts of securities outstanding were higher in the current year period, $8.1$5.9 billion at June 30, 2022, compared to $5.92023 and $7.7 billion at December 31, 2021.2022.

Other income (loss) — Derivatives and Hedging Activities — 20222023 Periods Compared to 20212022 Periods

For derivatives that are not designated in qualifying hedge qualifying relationship (i.e. in an economic hedge), the derivatives are considered as a “standalone” instrument and fair value changes are recorded in Other income (loss), without the offset of valuation of a hedged item. Gains and losses recorded in Other income (loss) on standalone derivatives include net interest accruals.

The table presents fair value changes of derivatives in economic hedges (i.e. not in an ASC 815 qualifying hedge) in Other income (loss):

Table 9.10    Other Income (Loss) — Impact of Derivative Gains and Losses (in thousands)

Impact on Other Income (Loss)

Impact on Other Income (Loss)

Three months ended June 30, 

Six months ended June 30, 

Three months ended June 30, 

Six months ended June 30, 


2022


2021


2022


2021


2023


2022


2023


2022

Derivatives not designated as hedging instruments


Interest rate swaps (a)

$

84,471

$

22,876

$

235,230

$

50,286

$

93,442

$

84,471

$

1,538

$

235,230

Caps or floors


53


(2)


448


25


(191)


53


(430)


448

Mortgage delivery commitments


(217)


197


(669)


(216)


(2,914)


(217)


(2,887)


(669)

Swaps economically hedging instruments designated under FVO (b)


(37,685)


(237)


(112,786)


(2,975)


(21,791)


(37,685)


18,292


(112,786)

Accrued interest on derivatives in economic hedging relationships (c)


1,830


(18,919)


(4,748)


(47,529)


10,057


1,830


29,360


(4,748)

Net gains (losses) related to derivatives not designated as hedging instruments

$

48,452

$

3,915

$

117,475

$

(409)

$

78,603

$

48,452

$

45,873

$

117,475

Price alignment interest paid on variation margin


(223)


3


(230)


18


1,294


(223)


2,218


(230)

Net gains (losses) on derivatives and hedging activities

$

48,229

$

3,918

$

117,245

$

(391)

$

79,897

$

48,229

$

48,091

$

117,245

Derivative gains and losses in the table above include both realized and unrealized fair value net gains and losses. Also includes swap interest settlements on derivatives designated as standalone hedging instruments.

111

Table of Contents

(a)Represents fair value changes recorded in Other income, primarily interest rate swaps in economic hedges of U.S. Treasury fixed-rate securities, recorded fair value gains of $93.1 million in the second quarter of 2023, compared to fair value gains of $92.9 million in the second quarter of 2022, compared to fair value gains of $23.5 million in the second quarter of 2021.2022. In the year-to-date period ended June 30, 20222023, fair value gainslosses of $247.9$3.1 million were recorded compared to fair value gains of $56.8$247.9 million in the same period in the prior year. The swaps are structured to mitigate the volatility of price changes of the liquidity portfolio of fixed-rate U.S. Treasury notes.

(b)

Represents fair value changes recorded in Other income on interest rate swaps hedging CO debt elected under the FVO.

(c)

Represents impact to Other income due to net interest settlements on standalone swap contracts. Net interest settlements are the interest accruals on swaps primarily in economic hedges of U.S. Treasury securities, debt and advances, and economic hedges of instruments elected under the FVO.

108

Table of Contents

Operating Expenses, Compensation and Benefits, and Other Expenses — 20222023 Periods Compared to 2021 2022 Periods

The following table sets forth the major categories of operating expenses (dollars in thousands):

Table 9.11    Operating Expenses, and Compensation and Benefits

Three months ended June 30, 


Three months ended June 30, 


Percentage of

Percentage


Percentage of

Percentage


2022


Total


2021


of Total


2023


Total


2022


of Total

Operating Expenses (a)


Occupancy

$

2,017


11.55

%  

$

2,290


12.60

%

$

2,295


12.07

%  

$

2,017


11.55

%

Depreciation and leasehold amortization


4,304


24.65


3,035


16.70


4,657


24.48


4,304


24.65

All others (b)


11,139


63.80


12,846


70.70


12,068


63.45


11,139


63.80

Total Operating Expenses

$

17,460


100.00

%  

$

18,171


100.00

%

$

19,020


100.00

%  

$

17,460


100.00

%

Total Compensation and Benefits

$

21,573


$

23,153


$

25,000


$

21,573


Finance Agency and Office of Finance (c)

$

5,110


$

5,386


$

5,027


$

5,110


Other expenses (d)

$

2,417


$

5,493


$

2,049


$

2,417


Six months ended June 30, 


Six months ended June 30, 


Percentage of

Percentage of


Percentage of

Percentage of


2022


Total


2021


Total


2023


Total


2022


Total

Operating Expenses (a)


Occupancy

$

4,165


13.02

%  

$

4,492


13.86

%

$

4,637


12.63

%  

$

4,165


13.02

%

Depreciation and leasehold amortization


8,476


26.49


6,069


18.72


9,283


25.28


8,476


26.49

All others (b)


19,350


60.49


21,857


67.42


22,805


62.09


19,350


60.49

Total Operating Expenses

$

31,991


100.00

%  

$

32,418


100.00

%

$

36,725


100.00

%  

$

31,991


100.00

%

Total Compensation and Benefits

$

44,905


$

47,480


$

50,763


$

44,905


Finance Agency and Office of Finance (c)

$

10,822


$

11,006


$

10,079


$

10,822


Other expenses (d)

$

4,864


$

8,268


$

3,594


$

4,864


(a)Operating expenses included the administrative and overhead costs of operating the FHLBNY, as well as the operating costs of providing advances and managing collateral associated with the advances, managing the investment portfolios, and providing correspondent banking services to members.
(b)The category “All others” included temporary workers, computer service agreements, contractual services, professional and legal fees, audit fees, director fees and expenses, insurance, and telecommunications.
(c)We are also assessed for our share of the operating expenses for the Finance Agency and the Office of Finance. The FHLBanks and two other GSEs share the entire cost of the Finance Agency. Expenses are allocated by the Finance Agency and the Office of Finance.
(d)The category Other expenses included the non-service elements of Net periodic pension benefit costs, and derivative clearing fees.

109

Table of Contents

Assessments — 20222023 Periods Compared to 2021 2022 Periods

For more information about assessments, see Affordable Housing Program and Other Mission Related Programs and Assessments under Part I Item 1 Business in the most recent Form 10-K for the year ended December 31, 20212022 filed on March 22, 2022.17, 2023.

112

Table of Contents

The following table provides roll forward information with respect to changes in Affordable Housing Program liabilities (in thousands):

Table 10.1    Affordable Housing Program Liabilities

Three months ended June 30, 

Six months ended June 30, 

Three months ended June 30,


Six months ended June 30, 


2022


2021


2022


2021


2023


2022

2023


2022

Beginning balance

$

137,261

$

152,176

$

137,638

$

148,827

$

143,797

$

137,261

$

131,394

$

137,638

Additions from current period's assessments


8,566


8,304


14,917


16,331

Additions from current period’s assessments


23,989


8,566


46,062


14,917

Net disbursements for grants and programs


(14,044)


(7,957)


(20,772)


(12,635)


(9,037)


(14,044)


(18,707)


(20,772)

Ending balance

$

131,783

$

152,523

$

131,783

$

152,523

$

158,749

$

131,783

$

158,749

$

131,783

AHP assessments allocated from net income totaled $8.6$24.0 million in the second quarter of the current year, compared to $8.3$8.6 million for same period in the prior year. On a year-to-date basis, AHP assessments allocated from net income totaled $14.9$46.1 million for the current period and $16.3$14.9 million for the prior year period. Assessments are calculated as a percentage of Net income, and the changes in allocations were in tandem with changes in Net income.

113110

Table of Contents

Legislative and Regulatory Developments

Certain legislativeFHFA’s Review and regulatory actions and developments are summarized in this section.

Amendment to FINRA Rule 4210: MarginingAnalysis of Covered Agency Transactions. On July 29, 2022, the Financial Industries Regulatory Authority (FINRA) filed a proposed rule with the SEC that will further extend the implementation date of its amendments to FINRA Rule 4210 delaying the effectiveness of margining requirements for covered agency transactions from October 26, 2022 until at least April 24, 2023. Once the margining requirements are effective, the Bank may be required to collateralize our transactions that are covered agency transactions, which include to be announced transactions (TBAs). These collateralization requirements could have the effect of reducing the overall profitability of engaging in covered agency transactions, including TBAs. Further, any collateralization requirements would expose the Bank to credit risk from its counterparties to such transactions.

Proposed Rule Implementing the Adjustable Interest Rate (LIBOR) Act.On July 28, 2022, the Board of Governors of the Federal Reserve System (FRB) published in the Federal Register a proposed rule with a comment deadline of August 29, 2022, intended to implement the Adjustable Interest Rate (LIBOR) Act. The rule if adopted in its proposed form would provide default rules for certain contracts (covered contracts) that reference LIBOR, are governed by U.S. law, do not mature on or before the LIBOR replacement date, and lack adequate provisions to identify a replacement rate for LIBOR. The proposed rule identifies separate FRB-selected replacement rates for derivative transactions, covered GSE contracts, and all other covered contracts. The proposed rule defines covered GSE contracts to include FHLBank advances. We are studying the proposed rule to determine if it will, once finalized, have a material impact on our financial condition or results of operations.

FHFA Director’s Testimony to the House Financial Services Committee on a Planned Review of the FHLBank System. On July 20, 2022, FHFA Director Sandra L. Thompson provided testimony to the U.S. House Committee on Financial Services indicating that the FHFA intends to conduct a public policy review of the FHLBank System. Director Thompson’s testimony indicated that the FHFA plans to engage a variety of stakeholders, in addition to holding public listening sessions throughout the country, as part of the review. The Director’s testimony also indicated that the review would examine a wide breadth of matters.  We are unable to determine at this time what actions, if any, may be implemented as a result of the FHFA’s review, or the potential impact of any such actions on the Bank or the FHLBank System.

In the fall of 2022, and over a period of several months, the FHFA undertook a review and analysis of the FHLBank System, in part through a series of public listening sessions, regional roundtable discussions, and receipt of comments from stakeholders. This review covered such areas as the FHLBanks’ mission and purpose in a changing marketplace; their organization, operational efficiency, and effectiveness; their role in promoting affordable, sustainable, equitable, and resilient housing and community investment; their role in addressing the unique needs of rural and financially vulnerable communities; member products, services, collateral requirements; and membership eligibility and requirements. The FHFA has stated that its review and analysis will culminate in a written report issued no later than September 30, 2023. The report is expected to (i) summarize the feedback received; (ii) identify actions the Finance Agency plans to take; and (iii) outline any recommendations for consideration by Congress.

114111

Table of Contents

Item 3.3    Quantitative and Qualitative Disclosures about Market Risk.

Market Risk Management. Market risk or interest rate risk (IRR) is the risk of change to market value or future earnings due to a change in the interest rate environment. IRR arises from the Banks operation due to maturity mismatches between interest rate sensitive cash-flows of assets and liabilities. As the maturity mismatch increases so does the level of IRR. The Bank has opted to retain a modest level of IRR which allows for the preservation of capital value while generating steady and predictable income. Accordingly, the balance sheet consists of predominantly short-term instruments and assets and liabilities synthetically swapped to floating-rate indices. A conservative and limited maturity gap profile of asset and liability positions protect our capital from changes in value arising from a volatile interest rate environment.

The desired risk profile is primarily affected by the use of interest rate exchange agreements (Swaps) which the Bank uses to match asset and liability index exposure. Historically the index concentration was 1- or 3-month LIBOR driven; however, as the Bank strategizes to addresswith LIBOR cessation, SOFR has become the dominant index utilized by the Bank. Index matching allows for a relatively steady income that changes in concert with prevailing interest rate changes to maintain a spread to short-term rates.

Although the Bank maintains a conservative IRR profile, income variability does arise from structural aspects in our portfolio including: embedded prepayment rights, basis risk on asset and liability positions, yield curve risk, liquidity risk and funding risk. These varied risks are controlled by monitoring IRR measures including re-pricing gaps, duration of equity (DOE), value at risk (VaR), net interest income (NII) at risk, key rate durations (KRD) and forecasted dividend rate sensitivities.

Risk Measurements. Our Risk Management Policy assigns comprehensive risk limits which we calculate on a regular basis. The below limits were established in 20212022 based on an anticipated market conditionconditions and business strategy for 2022. Management believes that the reported metrics below (except for income simulation) in the near term are limited because the model establishes a hard floor for the rate at near zero and the model therefore does not fully capture the resulting downward shocks in rates. The Bank is including these metrics as of June 30, 2022 for completeness and comparative purposes.2023. The current risk limits are as follows:

The option-adjusted DOE is limited to a range of +4.0 years to -5.0 years in the rates unchanged case, and to a range of +/-5.0 years in the +/-200bps shock cases.
The one-year cumulative re-pricing gap is limited to 10 percent of total assets.
The sensitivity of expected net interest income over a one-year period is limited to a -17.5 percent change under the +200bps shock compared to the rates in the unchanged case.forward rate scenario. The sensitivity of expected net interest income over a one-year period is limited to a -30 percent change under the -50bps-200bps shock compared to the rates in the unchanged case.forward rate scenario. This metric measures the Bank’s sensitivity of earnings to changes in the level of rates along the yield curve and allowed for negative rates. Given the rising rate environment, the Bank will be generating income sensitivity to larger down rate scenarios in the future.
The potential decline in the market value of equity (MVE) is limited to a 10 percent change under the +/-200bps shocks.
KRD exposure at any of nine term points (3-month, 1-year, 2-year, 3-year, 5-year, 7-year, 10-year, 15-year, and 30-year) is limited to between +/-20 months through the 3-year term point and a cumulative limit of +/-30 months from the 5-year through 30-year term points specific to the investment portfolio. Both of these quarterly observations are well within their limits.

Our portfolio, including derivatives, is tracked and the overall mismatch net of derivatives between assets and liabilities is summarized by using a DOE measure. The base case DOE takes into account the current low level of rates. Our last five quarterly DOE results are shown in years in the table below:


Base Case DOE


-200bps DOE


-100bps DOE


+200bps DOE

June 30, 2022

-0.43

-1.18

-1.02

0.41

March 31, 2022

-0.62

-0.38

-1.31

0.52

December 31, 2021

-1.58

1.94

-1.50

0.09

September 30, 2021


-1.33


1.84


-0.70


0.34

June 30, 2021


-1.69


1.36


-0.91


-0.22


Base Case DOE


-200bps DOE


-100bps DOE


+200bps DOE

June 30, 2023

0.08

(0.27)

(0.15)

0.57

March 31, 2023

(0.47)

(0.89)

(0.73)

0.20

December 31, 2022

(0.20)

(0.77)

(0.49)

0.35

September 30, 2022

(0.04)

(0.78)

(0.45)

0.56

June 30, 2022

(0.43)

(1.18)

(1.02)

0.41

The DOE has remained within policy limits. When market interest rates were very low, the -100/200bps scenarios imposed a near zero rate condition and produced results that Bank management did not consider meaningful given the current low-rate market environment.

115

Table of Contents

Duration indicates any cumulative re-pricing/maturity imbalance in the portfolio’s financial assets and liabilities. Duration of Equity (DOE) is the Market Value of Equity’s (MVE) sensitivity to a change in the level of interest rates expressed in years. MVE is calculated as market value of assets minus market value of liabilities. A positive DOE indicates a decrease to MVE if interest rates go higher, a negative DOE indicates a decrease to MVE if interest rates go lower. We measure DOE using software that generates a full revaluation incorporating optionality within our portfolio using well-known and tested financial pricing theoretical models. The DOE calculation also incorporates non-interest-bearing financial assets and liabilities.

112

Table of Contents

We do not solely rely on the DOE measure as a mismatch measure between assets and liabilities. We analyze open key rate duration exposure across maturity buckets while also performing a more traditional gap measure that subtracts re-pricing/maturing liabilities from re-pricing/maturing assets over time. We observe the differences over various horizons and have set a 10 percent limit on asset on cumulative re-pricings at the one-year point. This quarterly observation of the one-year cumulative re-pricing gap is provided in the table below and all values are below 10 percent of assets, well within the limit:

One Year Re-pricing Gap

June 30, 2023

$

Re-pricing Gap7.280 Billion

March 31, 2023

$

7.597 Billion

December 31, 2022

$

7.026 Billion

September 30, 2022

$

5.987 Billion

June 30, 2022

$

5.435 Billion

March 31, 2022

$

4.858 Billion

December 31, 2021

$

4.563 Billion

September 30, 2021

$

4.812 Billion

June 30, 2021

$

5.128 Billion

Our review of potential interest rate risk issues also includes the effect of changes in interest rates on expected net income. We project asset and liability volumes and spreads over a one-year horizon and then simulate expected income and expenses from those volumes and other inputs. The effects of changes in interest rates are generated to measure the Bank’s net interest income sensitivity over the coming 12-month period. To measure the effect, a parallel shift of +200bps is calculated and compared against the forward rate scenario and subjected to a -17.5 percent limit. The sensitivity of expected net interest income over a one-year period is limited to a -30 percent change under the -50bps-200bps shock compared to the rates in the forward rate scenario. Given the rising rate environment, the Bank will be generating income sensitivity to larger down rate scenarios in the future.scenarios.

Sensitivity in 

Sensitivity in 

Sensitivity in 

the -200bps 

the -100bps 

the +200bps 

Shock

Shock

Shock

June 30, 2022

N/A

N/A

-3.96

%  

March 31, 2022

N/A

N/A

-6.39

%

December 31, 2021

N/A

N/A

10.07

%  

September 30, 2021

N/A

N/A

5.39

%

June 30, 2021

N/A

N/A

14.80

%


Sensitivity in 


Sensitivity in 


Sensitivity in 


the -200bps Shock

the -100bps Shock

the +200bps Shock


June 30, 2023

(0.88)

%  

(1.10)

%  

(2.63)

%  

March 31, 2023

(1.22)

%

(0.37)

%

(0.82)

%

December 31, 2022


0.25

%

0.36

%

(1.81)

%

September 30, 2022


(0.52)

%

0.17

%

0.59

%

June 30, 2022

N/A

N/A

(3.96)

%

Aside from net interest income, the other significant impact on changes in the interest rate environment is the potential impact on the value of the portfolio. These calculated and quoted market values are estimated based upon their financial attributes (including optionality) and then re-estimated under the assumption that interest rates suddenly rise or fall by 200bps. The worst effect, whether it is the up or the down shock, is compared to the internal limit of 10 percent. In low rate environments, management believes that the reported metrics below are less meaningful because the model establishes a hard floor for the rate at near zero. As of June 30, 2022, the model limitation is only applicable for the -200bps shock, given the recent rise in rates. The Bank is including these metrics as of June 30, 2022 for completeness and comparative purposes. The quarterly potential maximum decline in the MVE under these 200bps shocks is provided below:


-200bps Change 


-100bps Change 


+200bps Change 


-200bps Change 


-100bps Change 


+200bps Change 


in MVE

in MVE

in MVE


in MVE

in MVE

in MVE


June 30, 2023

(0.30)

%  

(0.07)

%  

(0.63)

%  

March 31, 2023

(1.54)

%  

(0.67)

%  

0.39

%  

December 31, 2022


(1.18)

%  

(0.45)

%  

0.01

%

September 30, 2022


(0.93)

%  

(0.26)

%  

(0.54)

%

June 30, 2022

-1.85

%  

-0.74

%  

-0.12

%  

(1.85)

%  

(0.74)

%  

(0.12)

%  

March 31, 2022


-1.48

%  

-0.84

%  

0.03

%

December 31, 2021

1.48

%  

-1.49

%  

1.19

%  

September 30, 2021

0.34

%  

-1.04

%  

0.75

%

June 30, 2021


0.15

%  

-0.99

%  

1.88

%

As noted, the potential declines under these shocks are within our limits of a maximum 10 percent.

116113

Table of Contents

The following tables display the portfolio’s maturity/re-pricing gaps (in millions):

Interest Rate Sensitivity

Interest Rate Sensitivity

June 30, 2022

June 30, 2023

More Than

More Than

More Than

More Than

More Than

More Than

Six Months

Six Months to

One Year to

Three Years to

More Than

Six Months

Six Months to

One Year to

Three Years to

More Than


or Less


One Year


Three Years


Five Years


Five Years


or Less


One Year


Three Years


Five Years


Five Years

Interest-earning assets:


Non-MBS investments

$

10,897

$

107

$

421

$

330

$

1,199

$

36,669

$

102

$

401

$

318

$

1,214

MBS investments


3,099


377


1,494


2,341


7,806


4,102

254

2,007

3,274

9,101

Swaps hedging MBS


3,626


(50)


(3,576)


5,633


(50)


(136)


(5,447)

Adjustable-rate loans and advances


16,420


28,510


Net investments, adjustable rate loans and advances


34,042


484


1,915


2,621


5,429


74,914


356


2,358


3,456


4,868

Liquidity trading portfolio


1,254


2,531


399


1,850


1,946


400

1,755


1,466


2,023

Swaps hedging investments


6,851


(2,525)


(400)


(1,955)


(1,971)


5,451

(1,825)


(1,551)


(2,075)

Net liquidity trading portfolio


8,105


6


(1)


(105)


(25)


5,851


(70)


(85)


(52)

Fixed-rate loans and advances


29,546


5,900


15,182


5,112


8,945


40,455

7,628

16,477

10,356

6,764

Swaps hedging fixed-rate advances


33,337


(5,408)


(14,035)


(4,968)


(8,926)


40,169

(7,665)

(15,543)

(10,216)

(6,745)

Net fixed-rate loans and advances


62,883


492


1,147


144


19


80,624


(37)


934


140


19

Total interest-earning assets

$

105,030

$

982

$

3,061

$

2,660

$

5,423

$

161,389

$

319

$

3,222

$

3,511

$

4,835

Interest-bearing liabilities:


Deposits

$

1,474

$

$

$

$

$

2,920

$

$

$

$

Discount notes


47,582


1,996


50,292


7,655


Swaps hedging discount notes


168


(1,776)


209


572

827


5,277


(6,885)


241


945

422

Net discount notes


47,750


220


209


572


827


55,569


770


241


945


422

Consolidated Obligation Bonds


FHLBank bonds


12,950


5,185


18,543


16,292


6,046


46,016

17,284

24,508

10,458

4,824

Swaps hedging bonds


36,842


(3,844)


(15,900)


(14,545)


(2,553)


48,612

(16,743)

(22,413)

(7,489)

(1,967)

Net FHLBank bonds


49,792


1,341


2,643


1,747


3,493


94,628


541


2,095


2,969


2,857

Total interest-bearing liabilities

$

99,016

$

1,561

$

2,852

$

2,319

$

4,320

$

153,117

$

1,311

$

2,336

$

3,914

$

3,279

Post hedge gaps (a):


Periodic gap

$

6,014

$

(579)

$

209

$

341

$

1,103

$

8,272

$

(992)

$

886

$

(403)

$

1,556

Cumulative gaps

$

6,014

$

5,435

$

5,644

$

5,985

$

7,088

$

8,272

$

7,280

$

8,166

$

7,763

$

9,319

117114

Table of Contents

Interest Rate Sensitivity

Interest Rate Sensitivity

December 31, 2021

December 31, 2022

More Than

More Than

More Than

More Than

More Than

More Than

Six Months

Six Months to

One Year to

Three Years to

More Than

Six Months

Six Months to

One Year to

Three Years to

More Than


or Less


One Year


Three Years


Five Years


Five Years


or Less


One Year


Three Years


Five Years


Five Years

Interest-earning assets:


Non-MBS investments

$

10,525

$

192

$

518

$

351

$

1,042

$

16,871

$

104

$

377

$

305

$

1,227

MBS investments


3,283


602


1,609


2,107


6,977


2,697


261


1,867


2,775


8,374

Swaps hedging MBS


2,859


(50)


(2,809)


4,263


(50)


(4,213)

Adjustable-rate loans and advances


7,470


26,505


Net investments, adjustable rate loans and advances


24,137


794


2,127


2,408


5,210


50,336


365


2,244


3,030


5,388

Liquidity trading portfolio


1,154


1,358


1,499


1,824


2,526


400


495


2,189


1,877

Swaps hedging investments


4,696


(1,350)


(1,500)


(1,846)


5,151


(400)


(500)


(2,351)


(1,900)

Net liquidity trading portfolio


5,850


8


(1)


(22)


7,677


(5)


(162)


(23)

Fixed-rate loans and advances


30,222


3,126


13,850


6,001


10,546


56,062


5,400


14,411


7,954


6,597

Swaps hedging fixed-rate advances


31,323


(2,732)


(12,333)


(5,733)


(10,525)


32,878


(4,662)


(13,797)


(7,842)


(6,577)

Net fixed-rate loans and advances


61,545


394


1,517


268


21


88,940


738


614


112


20

Total interest-earning assets

$

91,532

$

1,196

$

3,643

$

2,676

$

5,209

$

146,953

$

1,103

$

2,853

$

2,980

$

5,385

Interest-bearing liabilities:


Deposits

$

1,283

$

$

$

$

$

1,016

$

$

$

$

Discount notes


39,887


2,310


58,832


3,000


Swaps hedging discount notes


702


(2,310)


90


550


968


785


(2,393)


241


782


585

Net discount notes


40,589


90


550


968


59,617


607


241


782


585

Consolidated Obligation Bonds


FHLBank bonds


16,390


5,115


12,364


13,978


6,926


38,992


5,987


21,578


14,896


6,282

Swaps hedging bonds


28,360


(3,572)


(9,179)


(12,287)


(3,322)


39,779


(4,968)


(19,426)


(13,000)


(2,385)

Net FHLBank bonds


44,750


1,543


3,185


1,691


3,604


78,771


1,019


2,152


1,896


3,897

Total interest-bearing liabilities

$

86,622

$

1,543

$

3,275

$

2,241

$

4,572

$

139,404

$

1,626

$

2,393

$

2,678

$

4,482

Post hedge gaps (a):


�� 


Periodic gap

$

4,910

$

(347)

$

368

$

435

$

637

$

7,549

$

(523)

$

460

$

302

$

903

Cumulative gaps

$

4,910

$

4,563

$

4,931

$

5,366

$

6,003

$

7,549

$

7,026

$

7,486

$

7,788

$

8,691

(a)

Re-pricing gaps are estimated at the scheduled rate reset dates for floating rate instruments, and at maturity for fixed rate instruments. For callable instruments, the re-pricing period is estimated by the earlier of the estimated call date under the current interest rate environment or the instrument’s contractual maturity.

118115

Table of Contents

Item 4.    Controls and Procedures.

Disclosure Controls and Procedures

Evaluation of Disclosure Controls and Procedures: An evaluation of the Bank’s disclosure controls and procedures (as defined in Rules 13a-15(e) and 15d-15(e) under the Securities Exchange Act of 1934, as amended (the “Act”)) was carried out under the supervision and with the participation of the Bank’s President and Chief Executive Officer, José R. González, and Senior Vice President and Chief Financial Officer, Kevin M. Neylan, as of June 30, 2022.2023. Based on this evaluation, they concluded that as of June 30, 2022,2023, the Bank’s disclosure controls and procedures were effective, at a reasonable level of assurance, in ensuring that the information required to be disclosed by the Bank in the reports it files or submits under the Act is (i) accumulated and communicated to the Bank’s management (including the President and Chief Executive Officer and Senior Vice President and Chief Financial Officer) in a timely manner, and (ii) recorded, processed, summarized and reported within the time periods specified in the Securities and Exchange Commission’s rules and forms.

Changes in Internal Control Over Financial Reporting

Changes in Internal Control Over Financial Reporting: There were no changes in the Bank’s internal control over financial reporting (as defined in Rules 13a-15(f) and 15d-15(f) under the Act) during the Bank’s last fiscal quarter that have materially affected, or are reasonably likely to materially affect, the Bank’s internal control over financial reporting.

119116

Table of Contents

PART II.    OTHER INFORMATION.

Item 1.    Legal Proceedings

The Bank is not aware of any legal proceedings that are expected to have a material effect on its financial condition or results of operations or that are otherwise material to the Bank.

Item 1A.    Risk Factors

There have been no material changes from the risk factors previously disclosed in Part I, Item 1A of the FHLBNY’s Annual Report on Form 10-K for the fiscal year ended December 31, 2021.2022.

Item 2.    Unregistered Sales of Equity Securities and Use of Proceeds

Not applicable.

Item 3.    Defaults upon Senior Securities

None.

Item 4.    Mine Safety Disclosures

Not applicable.

Item 5.    Other Information

None.

120117

Table of Contents

Item 6.    Exhibits

No. 


Exhibit Description


Filed with
this Form 
10-Q


Form*


Date Filed

3.01


Restated Organization Certificate of the Federal Home Loan Bank of New York (“Bank”)


8-K


12/1/2005

3.02


Amended and Restated Bylaws of the Bank


8-K


3/21/2019

4.01


Amended and Restated Capital Plan of the Bank


8-K


6/24/2022

31.01


Certification of Registrant’s Chief Executive Officer, as required by Section 302 of the Sarbanes-Oxley Act of 2002


X


31.02


Certification of the Registrant’s Chief Financial Officer, as required by Section 302 of the Sarbanes-Oxley Act of 2002


X


32.01


Certification of Registrant’s Chief Executive Officer, as required by Section 906 of the Sarbanes-Oxley Act of 2002


X


32.02


Certification of Registrant’s Chief Financial Officer, as required by Section 906 of the Sarbanes-Oxley Act of 2002


X


101.INS


Inline XBRL Instance Document – The instance document does not appear in the interactive data file because its XBRL tags are embedded within the inline XBRL document.


X


101.SCH


Inline XBRL Taxonomy Extension Schema Document


X


101.CAL


Inline XBRL Taxonomy Extension Calculation Linkbase Document


X


101.DEF

Inline XBRL Taxonomy Extension Definition Linkbase Document

X

101.LAB


Inline XBRL Taxonomy Extension Label Linkbase Document


X


101.PRE


Inline XBRL Taxonomy Extension Presentation Linkbase Document


X


104


Cover Page Interactive Data File (formatted as Inline XBRL and contained in Exhibit 101)


X


Notes:

*     Means that this exhibit is incorporated by reference from the named Form; the filing date of such named Form is listed in the next column.

121118

Table of Contents

SIGNATURES

Pursuant to the requirements of the Securities Exchange Act of 1934, the registrant has duly caused this report to be signed on its behalf by the undersigned thereunto duly authorized.


Federal Home Loan Bank of New York


(Registrant)


/s/ Kevin M. Neylan


Kevin M. Neylan


Senior Vice President and Chief Financial Officer


Federal Home Loan Bank of New York (on behalf of the Registrant and as the Principal Financial Officer)


Date: August 11, 202210, 2023


122119